Performance of Various Forms of the Palmer Drought Severity Index in China from 1961 to 2013 ZIQIAN ZHONG AND BIN HE College of Global Change and Earth System Science, Beijing Normal University, Beijing, China LANLAN GUO School of Geography, Beijing Normal University, Beijing, China YAFENG ZHANG College of Global Change and Earth System Science, Beijing Normal University, Beijing, China (Manuscript received 26 November 2018, in final form 3 July 2019) ABSTRACT A topic of ongoing debate on the application of PDSI is whether to use the original version of the PDSI or a self-calibrating form, as well as which method to use for calculating potential evapotranspiration (PET). In this study, the performances of four forms of the PDSI, including the original PDSI based on the Penman– Monteith method for calculating PET (ET p ), the PDSI based on the crop reference evapotranspiration method for calculating PET (ET 0 ), the self-calibrating PDSI (scPDSI) based on ET p , and the scPDSI based on ET 0 , were evaluated in China using the normalized difference vegetation index (NDVI), modeled soil moisture anomalies (SMA), and the terrestrial water storage deficit index (WSDI). The interannual variations of all forms of PDSI agreed well with each other and presented a weak increasing trend, suggesting a climate wetting in China from 1961 to 2013. PDSI-ET 0 correlated more closely with NDVI anomalies, SMA, and WSDI than did PDSI-ET p in northern China, especially in northeastern China, while PDSI-ET p correlated more closely with SMA and WSDI in southern China. PDSI-ET 0 performed better than PDSI-ET p in regions where the annual average rainfall is between 350 and 750 mm yr 21 . The spatial comparability of scPDSI was better than that of PDSI, while the PDSI correlated more closely with NDVI anomalies, SMA, and WSDI than did scPDSI in most regions of China. Knowledge from this study provides important information for the choice of PDSI forms when it is applied for different practices. 1. Introduction Drought is a recurring extreme climate event that has devastating effects on regional agriculture, water re- sources, and the environment (Sheffield et al. 2012). Many types of indices have been developed to evaluate meteorological drought, including the Palmer drought severity index (PDSI; Dai et al. 2004), the standardized precipitation index (SPI), and the standardized precip- itation evapotranspiration index (SPEI), etc. PDSI is one of the most commonly used indices to assess drought conditions (Dai 2011a; Hao et al. 2015). The PDSI is first introduced by Palmer (1965) as an agricultural drought monitoring tool in the United States and uses historical records of precipitation and temperature to calculate surface water balance (Alley 1984). Compared with other popular drought indices (e.g., SPEI), PDSI has a more comprehensive physical mechanism consid- ering the balance of precipitation, evapotranspiration, and runoff and has the ability to assess local soil water and possibly vegetation properties (Trenberth et al. 2014). This can be supported by strong correlations between PDSI and observed streamflow and measured soil reported in the previous study (Dai et al. 2004; Dai 2011a). The PDSI has gained wide acceptance but has also received criticisms over the years. One primary deficit is that the climatic characteristic (K) and the duration factors (p and q) were empirically derived in the United States and may not apply to other regions (Akinremi et al. 1996; Vicenteserrano et al. 2014). This shortcoming is partly resolved by devising the self-calibrating Palmer Corresponding author: Bin He, [email protected] SEPTEMBER 2019 ZHONG ET AL. 1867 DOI: 10.1175/JHM-D-18-0247.1 Ó 2019 American Meteorological Society. For information regarding reuse of this content and general copyright information, consult the AMS Copyright Policy (www.ametsoc.org/PUBSReuseLicenses). Unauthenticated | Downloaded 12/19/21 02:15 PM UTC

Welcome message from author
This document is posted to help you gain knowledge. Please leave a comment to let me know what you think about it! Share it to your friends and learn new things together.
Transcript

Performance of Various Forms of the Palmer Drought Severity Indexin China from 1961 to 2013
ZIQIAN ZHONG AND BIN HE
College of Global Change and Earth System Science, Beijing Normal University, Beijing, China
LANLAN GUO
School of Geography, Beijing Normal University, Beijing, China
YAFENG ZHANG
College of Global Change and Earth System Science, Beijing Normal University, Beijing, China
(Manuscript received 26 November 2018, in final form 3 July 2019)
ABSTRACT
A topic of ongoing debate on the application of PDSI is whether to use the original version of the PDSI or a
self-calibrating form, as well as which method to use for calculating potential evapotranspiration (PET). In
this study, the performances of four forms of the PDSI, including the original PDSI based on the Penman–
Monteith method for calculating PET (ETp), the PDSI based on the crop reference evapotranspiration
method for calculating PET (ET0), the self-calibrating PDSI (scPDSI) based onETp, and the scPDSI based on
ET0, were evaluated in China using the normalized difference vegetation index (NDVI), modeled soil
moisture anomalies (SMA), and the terrestrial water storage deficit index (WSDI). The interannual variations
of all forms of PDSI agreed well with each other and presented a weak increasing trend, suggesting a climate
wetting in China from 1961 to 2013. PDSI-ET0 correlated more closely with NDVI anomalies, SMA, and
WSDI than did PDSI-ETp in northern China, especially in northeastern China, while PDSI-ETp correlated
more closely with SMA andWSDI in southern China. PDSI-ET0 performed better than PDSI-ETp in regions
where the annual average rainfall is between 350 and 750mmyr21. The spatial comparability of scPDSI was
better than that of PDSI, while the PDSI correlated more closely with NDVI anomalies, SMA, and WSDI
than did scPDSI in most regions of China. Knowledge from this study provides important information for the
choice of PDSI forms when it is applied for different practices.
1. Introduction
Drought is a recurring extreme climate event that has
devastating effects on regional agriculture, water re-
sources, and the environment (Sheffield et al. 2012).
Many types of indices have been developed to evaluate
meteorological drought, including the Palmer drought
severity index (PDSI; Dai et al. 2004), the standardized
precipitation index (SPI), and the standardized precip-
itation evapotranspiration index (SPEI), etc. PDSI is
one of themost commonly used indices to assess drought
conditions (Dai 2011a; Hao et al. 2015). The PDSI is first
introduced by Palmer (1965) as an agricultural drought
monitoring tool in the United States and uses historical
records of precipitation and temperature to calculate
surface water balance (Alley 1984). Compared with
other popular drought indices (e.g., SPEI), PDSI has
a more comprehensive physical mechanism consid-
ering the balance of precipitation, evapotranspiration,
and runoff and has the ability to assess local soil water
and possibly vegetation properties (Trenberth et al.
2014). This can be supported by strong correlations
between PDSI and observed streamflow and measured
soil reported in the previous study (Dai et al. 2004;
Dai 2011a).
The PDSI has gained wide acceptance but has also
received criticisms over the years. One primary deficit
is that the climatic characteristic (K) and the duration
factors (p and q) were empirically derived in the United
States and may not apply to other regions (Akinremi
et al. 1996; Vicenteserrano et al. 2014). This shortcoming
is partly resolved by devising the self-calibrating PalmerCorresponding author: Bin He, [email protected]
SEPTEMBER 2019 ZHONG ET AL . 1867
DOI: 10.1175/JHM-D-18-0247.1
� 2019 American Meteorological Society. For information regarding reuse of this content and general copyright information, consult the AMS CopyrightPolicy (www.ametsoc.org/PUBSReuseLicenses).
Unauthenticated | Downloaded 12/19/21 02:15 PM UTC
drought severity index (scPDSI;Wells et al. 2004). In the
scPDSI, the fixed coefficient is replaced by local condi-
tions in order to calibrate the PDSI. The scPDSI has
performed better than the PDSI in study areas in Europe
and North America (Schrier et al. 2006; van der Schrier
et al. 2006). Another important shortcoming is that the
PDSI and scPDSI have fixed temporal scales, whereas
drought may occur simultaneously across multiple tem-
poral scales (McKee et al. 1993). As a result, the PDSI
cannot identify droughts on time scales shorter than
12months (Vicenteserrano et al. 2010). For example,
scPDSI is found to be only suitable for evaluating mid-
term and long-term term droughts in China, because it is
insensitive to short-term drought (H. Zhao et al. 2017). A
systematic comparison between PDSI and scPDSI at a
national scale is needed before these indices can be ap-
plied as detectors of drought in China.
Another main concern with PDSI is the choice of
method used to estimate potential evapotranspiration
(PET), which is a key variable in PDSI’s water balance
model. The Thornthwaite PETmethod (PET_th), which
is driven by temperature and latitude (Thornthwaite
1948), is used to simulate PET in the original PDSI
model. However, it has been suggested to produce
errors in energy-limited regions and overestimate the
impact of surface temperature on PET (Hobbins et al.
2008; Sheffield et al. 2012), thereby overestimating
drought conditions. Therefore, a fully physically based
Penman–Monteith equation PET method (defined as
ETp here), which incorporates the radiative and aero-
dynamic components that govern the evaporation pro-
cess, has been recommended to replace the original
Thornthwaite method to estimate PET (PET_th) in the
PDSI (Sheffield et al. 2012). In recent years, a modi-
fied Penman–Monteith equation, the so-called FAO
Penman–Monteith equation, which estimates crop ref-
erence evapotranspiration (ET0; Allen et al. 1998), is
also frequently used to estimate PET in the PDSI. The
main difference between ETp and ET0 is that they use
different hypothetical reference surfaces and there-
fore have different aerodynamic and surface resistances
(McVicar et al. 2005). Previous investigations have
suggested that PDSI varies greatly depending on the
PET method used. For example, Sheffield et al. (2012)
found that the PET_th method overestimated global
drought conditions since 1950. Dai (2011a) used both
PET_th and ETp to calculate global PET and suggested
that the different PET methods exerted only small ef-
fects on both the PDSI and scPDSI. Van der Schrier
et al. (2011) also assessed the differences in global PDSI
maps using the PET_th or the ET0, and found that, al-
though PET_th and ET0 have very different ampli-
tudes, the PDSI values based on the two PET methods
were very similar. Many existing studies have assessed
differences between the PDSI and scPDSI indices using
the PET_th and ETp methods or the PET_th and ET0
methods, few of them focused on the differences be-
tween the ETp and ET0 methods when they are used to
calculate PDSI, despite the fact that the two methods
have large differences in mean value, magnitude, and
long-term trends (McVicar et al. 2005).
Using PDSI or scPDSI, drought conditions in China
have been extensively studied. Liu et al. (2017) de-
veloped a multiscale scPDSI that can monitor droughts
along different time scales. Wang et al. (2017) used
the scPDSI to investigate changes in drought in China
between 1961 and 2009. J. Zhang et al. (2016) assessed
drought fluctuations in China (1961–2013) using PDSI
based on the PET_th and ET0 methods in order to
determine any differences in the responses of these two
approaches to global warming. However, few studies
have evaluated differences between PDSI and scPDSI
when these indices use different PET estimation
methods. It is essential to test the performance of a
drought index before it is used in a specific region. In
this paper, we compared drought estimates in China
for the period 1961–2013 given by either the PDSI or
the scPDSI with PET estimates based on two different
methods. The different drought indicators that were
compared included: the original PDSI based on the
ET0 method (PDSI-ET0), the original PDSI based
on ETp (PDSI-ETp), the scPDSI based on ET0
(scPDSI-ET0), and the scPDSI based on ETp (scPDSI-
ETp). The performances of various forms of PDSI
were evaluated using the normalized difference vege-
tation index (NDVI) from the Global Inventory Mod-
eling and Mapping Studies (GIMMS) NDVI3g data,
the modeled soil moisture anomalies (SMA) from
the Global Land Evaporation Amsterdam Model
(GLEAM), and the water storage deficit index (WSDI)
based on Gravity Recovery and Climate Experiment
(GRACE) data.
2. Study area, data, and methods
a. Study area and data
To investigate spatial differences in performance
of various forms of the PDSI, China was divided into
seven climatic regions based on physical and geographic
features (Zhao 1983): the northeast humid/semihumid
warm region (NE), the north China humid/semihumid
temperate zone (NC), the central and southern China
humid subtropical zone (CSC), the south China hu-
mid tropical zone (SC), the Inner Mongolia steppe
zone (IM), the northwest desert area (NW), and the
Qinghai–Tibetan Plateau (QT), as shown in Fig. 1.
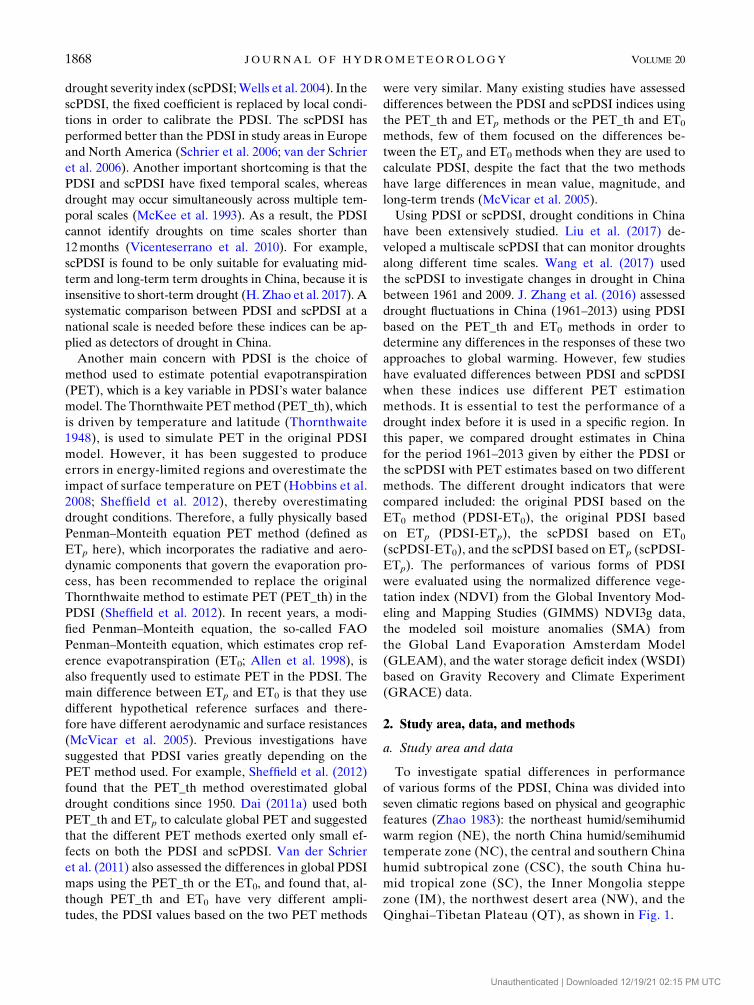
1868 JOURNAL OF HYDROMETEOROLOGY VOLUME 20
Unauthenticated | Downloaded 12/19/21 02:15 PM UTC

Daily meteorological data from 824 stations was
provided by the National Meteorological Information
Center of the China Meteorological Administration
(CMA) (http://data.cma.cn/site/). This dataset includes
records of daily precipitation (P), maximum tempera-
ture (Tmax), minimum temperature (Tmin), wind speed
(U), relative humidity (RH), and sunlight duration
(SD). The reliability of the daily meteorological data
had been confirmed by the CMA before it was released.
Stations with data missing more than 5% were excluded
from this analysis. Finally, a total of 755 stations with
relatively complete records from 1961 to 2013 were se-
lected for analysis. To calculate monthly values for the
PDSI and scPDSI, the daily meteorological data were
aggregated into monthly values.
Datasets of surface vegetation, SMA and total ter-
restrial water storage were collected to assess the per-
formance of the various forms of PDSI. Satellite-based
NDVI was used to indicate vegetation condition. Bi-
weekly GIMMS NDVI3g data (0.0838 latitude 3 0.0838longitude grid monthly data) from 1982 to 2013 were ob-
tained from https://ecocast.arc.nasa.gov/data/pub/gimms/
3g.v1/. Daily root-zone soil moisture (SM) data with a
spatial resolution of 0.258 latitude 3 0.258 longitude be-
tween 1981 and 2013 were obtained from theGlobal Land
Evaporation Amsterdam Model (GLEAM) Version 3.2
product (https://www.gleam.eu/). The NDVI and SM of
each station were extracted from the grid data within the
same location. Monthly total terrestrial water storage
(TWS) derived from GRACE (RL05) between 2003 and
2013 was provided by the Center for Space Research
(CSR) at the University of Texas at Austin, which is
presented as 18 latitude3 18 longitude grid monthly data.
The soil properties data were extracted from Harmo-
nized World Soil Database (Nachtergaele et al. 2010)
published by the Food and Agriculture Organization of
the United Nations (FAO) and the International In-
stitute for Applied Systems Analysis (IIASA). Land
cover with 30-m resolution of China was extracted from
the Finer Resolution Observation and Monitoring of
Global Land Cover (FROM-GLC) issued by De-
partment of Earth System Science, Tsinghua University
(http://data.ess.tsinghua.edu.cn/).
b. Methods
1) A BRIEF OVERVIEW OF PDSI AND SCPDSICALCULATIONS
PDSI is one of the indices to quantify the sverity of
droughts across different climates, which is based on a
water balance model instead of purely precipitation or
evaporation. Palmer (1965) describes how to calculate
FIG. 1. Locations of the meteorological stations (white dots) included in this study and the
seven climatic regions: the northeast humid/semihumid warm region (NE), the north China
humid/semihumid temperate zone (NC), the central and southern China humid subtropical
zones (CSC), the south China humid tropical zone (SC), the Inner Mongolia steppe zone (IM),
the northwest desert area (NW), and the Qinghai–Tibetan Plateau (QT).
SEPTEMBER 2019 ZHONG ET AL . 1869
Unauthenticated | Downloaded 12/19/21 02:15 PM UTC

the PDSI using monthly data. Eight variables including
evapotranspiration (E), recharge to soils (R), runoff
(RO), water loss to the soil layers (L), potential
evapotranspiration (PE), potential recharge (PR), po-
tential runoff (PRO), and potential loss (PL) during
each month were considered. Because the weighting
calibration parameter of the original PDSI was empiri-
cally derived from limited data from the United States
(Palmer 1965), it may not be applicable to other climatic
regions. To improve the poor spatial comparability of
the original PDSI, Wells et al. (2004) modify the self-
calibration duration factors (p and q) and the climatic
characteristics (K) based solely on how the climate of
the location. Compared with the PDSI, the scPDSI has
more comparable frequency distribution across differ-
ent locations (Dai 2011a). The calculations of PDSI and
scPDSI followed the studies of Jacobi et al. (2013) and
Wells et al. (2004), respectively.
2) CALCULATION OF PET
Potential evapotranspiration is the key variable needed
to estimate the amount of ‘‘climatically appropriate
for existing conditions’’ (CAFEC) precipitation. Dif-
ferences in how PET_th and ETp drive PDSI have
been extensively examined. Therefore, this study fo-
cused on comparisons of PDSI and scPDSI based on
ET0 and ETp.
Following Allen et al. (1998), the ET0 model is
given by
ET05
0:408D(Rn2G)1 g900
T1 273:3U
2D
D1g(11 0:34U2)
, (1)
where D (kPa 8C21) is the slope of the saturation
vapor pressure; Rn (MJm22 day21) is net radiation
at the ground surface (Yin et al. 2008); G
(MJm22 day21) is the ground heat flux; T 5 (Tmax 1Tmin)/2 is the mean of the daily maximum and minimum
air temperatures; g (kPa 8C21) is the psychrometric
constant; U2 (m s21) is the average wind speed at 2 m
above the ground surface, and D (5 es 2 ea) is the
saturation vapor pressure deficit, where es (kPa) is the
saturation vapor pressure and ea (kPa) is the actual
vapor pressure.
FIG. 2. Interannual variations for different forms of PDSI in (a) thewhole of China, (b) NE, (c)NC, (d) CSC, (e) SC,
(f) IM, (g) NW, and (h) QT from 1961 to 2013.
1870 JOURNAL OF HYDROMETEOROLOGY VOLUME 20
Unauthenticated | Downloaded 12/19/21 02:15 PM UTC

Following (Penman 1948; Shuttleworth 1993;Valiantzas
2013), ETp was calculated as
ETp5
D
D1 gRn1
g
D1g
6:43(11 0:536U2)D
l, (2)
where l is the latent heat of vaporization of water
2.45 (MJ kg21) and other climatic factors and other
parameters are the same as those in Eq. (1).
3) CALCULATION OF WSDI
WSDI is a GRACE TWS-based drought indicator.
Following Sinha et al. (2017), the WSDI was given by
WSDIi5Tres
i 2mresT
sresT
, (3)
Tresi 5TWSA
i2TWSAclim
j , (4)
where T is the residual time series and m and s are the
mean and standard deviation of the time series, re-
spectively. The superscripts ‘‘res’’ and ‘‘clim’’ denote
residual and mean monthly climatology of the terres-
trial water storage anomaly (TWSA). Here, negative
residuals indicate deficits in TWS compared to its cli-
matologic mean, whereas positive residuals signify sur-
plus water storage. Variable i is the total number of
months in the study period and j varies from 1 to 12,
representing the corresponding calendar month.
4) TREND ANALYSIS
The Mann–Kendall trend test (Mann 1945; Kendall
1948) was used to determine trends in PDSI and
scPDSI in this study. It is a frequently used method for
testing trends in climatic and hydrological series
without requiring normality or linearity and is also
highly recommended by the World Meteorological
Organization.
3. Results
a. Drought in China
1) PDSI AND SCPDSI TREND IN CHINA
We first examined the trends of PDSI-ETp, PDSI-
ET0, scPDSI-ETp, and scPDSI-ET0 at both national
and regional scales. Figure 2a shows interannual vari-
ations in mean PDSI-ETp, PDSI-ET0, scPDSI-ETp,
and scPDSI-ET0 in China from 1961 to 2013. The four
indices all demonstrated a weak increasing trend, in-
dicating a wetting condition over China. The inter-
annual changes identified by the four forms of the
PDSI were similar, although with different trend
line slopes (Fig. 3). The largest increase was observed
for PDSI-ETp (0.034decade21), followed by PDSI-ET0
(0.026decade21), scPDSI-ETp (0.026 decade21), and
scPDSI-ET0 (0.022 decade21). At the regional scale,
increasing trends of the various forms of PDSI were
FIG. 3. The slopes (per decade) of trend lines of various forms of PDSI (Fig. 2) in seven regions
in China for the period 1961–2013. Bars with an asterisk indicate p , 0.05.
SEPTEMBER 2019 ZHONG ET AL . 1871
Unauthenticated | Downloaded 12/19/21 02:15 PM UTC

observed in NE, NW, SC, QT, and IM, suggesting a cli-
mate wetting in these regions. In NW, all forms of PDSI
increased significantly (p , 0.05) while the ascending
trends of PDSI were greater than those for scPDSI.
All four PDSI forms showed a decreasing trend in the
NC and CSC regions, indicating a drying climate. PDSI
or scPDSI based on ET0 produced larger decreases than
those based on ETp. This highlights the influence of
PDSI form on determinations of drought conditions.
A relatively uniform spatial pattern (Fig. 4) is ob-
served in the annual trends of all four PDSI forms. At
station scale, the majority of the meteorological stations
in northwestern China experienced significant increas-
ing PDSI trends, suggesting climate wetting. In contrast,
stations in central and south-central China showed sig-
nificant decreasing trends, indicating drying conditions.
The PDSI-ETp produced a greater number of statisti-
cally significant positive trends than the other three
forms, and a total of 139 stations were identified as
having significant trends. PDSI-ET0 suggested a total
of 120 stations that experienced significant wetting,
followed by scPDSI-ETp (102 stations) and scPDSI-
ETp (98 stations). PDSI-ET0 indicated a total of 92
stations that experienced significant drying, followed
by PDSI-ETp (88 stations), scPDSI-ETp (84 stations),
and scPDSI-ET0 (80 stations).
To reveal the potential reasons for the different trends
of four forms of PDSI, we evaluated the trends of two
major components of PDSI: precipitation P and actual
evapotranspiration E estimated by the Palmer model.
Here, E was evaluated because it has a greater effect on
the PDSI model than PET (Dai 2011a). As shown in
Fig. 5, the average annual P did not change significantly
over the whole of China during 1961–2013. However,
two forms of actual evapotranspiration, namely evapo-
transpiration estimated by the Palmer model based on
ET0 (E0) and ETp (Ep), respectively, decreased signifi-
cantly (P 5 0.1) between 1961 and 2013. The annual
mean Ep (20.31 yr21) decreased faster than annual
mean E0 (20.29 yr21) in China. This may explain why
PDSI or scPDSI based on ETp produce more significant
wetting trends or less significant drying trends than those
based on ET0 in China. In the NW of China, the story
was different. Both ofE0 andEp in this region showed an
insignificant increasing trend (p5 0.31 of the trend ofE0
and p 5 0.36 of the trend of Ep), while the increasing
trend ofPwas relatively striking (p5 0.13), which finally
caused a climate wetting in this region.
FIG. 4. The slopes of trend lines (per decade) for (a) annual PDSI-ET0, (b) annual scPDSI-ET0, (c) annual PDSI-
ETp, and (d) annual scPDSI-ETp at 755 stations during the period 1961–2013.
1872 JOURNAL OF HYDROMETEOROLOGY VOLUME 20
Unauthenticated | Downloaded 12/19/21 02:15 PM UTC

The above analysis suggested that the choice of PDSI
form had only a small influence on the identification of
long-term trend for the whole of China. However, dif-
ferent PDSI forms could produce different trend slopes
at regional and station scales. The PDSI tended to
generate larger trend line slopes than scPDSI, and PDSI
and scPDSI based on ET0 produced larger ‘‘drying’’
trend than that based on ETp because the decrease ofEp
was faster than that of E0 in China.
2) SEVERE DROUGHT FREQUENCY IN CHINA
To better understand drought conditions in China and
further distinguish the performance of different forms of
PDSI, the frequency of severe drought in China during
1961–2013 was investigated. The frequency of severe
drought is defined as the percentage of months when the
PDSI is less than 23. Figure 6 shows the difference be-
tween the severe drought events produced by PDSI and
scPDSI based on ET0 and ETp. Assessing by PDSI-ET0
or PDSI-ETp, high frequency of severe drought oc-
curred in stations in northeastern, northwestern and
southwestern China, while scPDSI seems to produce
less severe droughts in above regions. A distinction is
made according the difference between severe drought
frequency identified by PDSI-ET0 and PDSI-ETp, re-
spectively, as shown in Fig. 7. Interestingly, during 1961–
2013, PDSI-ET0 produced more severe drought events
in north China, especially in northeastern China and
North China Plain, while PDSI-ETp produced more
severe drought events in southern China, especially in
southwestern China. The above analysis suggests that
the choice of PDSI form has great influence on the
identification of severe drought events.
b. Evaluation of PDSI and scPDSI
1) CORRELATION ANALYSIS BETWEEN MONTHLY
NDVI AND PDSI
Droughts are usually associated with depressions of
vegetation growth state. A recent study also suggested
that vegetation activity is sensitive to drought in north-
ern China, especially in its eastern part (Hua et al. 2017).
To further evaluate the PDSI forms via vegetation be-
haviors in northeastern China, stations in NE, the east-
ern part of IM, the northern part of NC were selected
to examine the response of NDVI during the growing
season (from May to September) to the four forms of
PDSI. Owing to the differences in grid size between
NDVI and PDSI datasets, for each station the NDVI
time series were extracted from the nearest grid. Con-
sidering the potential delayed response of vegetation
growth to drought (Vicenteserrano et al. 2013), for each
form of PDSI, the Pearson correlation coefficients were
calculated between the growing season monthly NDVI
anomalies series and five group of PDSI series, namely,
PDSI series from January to May, from February to
FIG. 5. Interannual variations of (a) annual P, (b) annualE0, and (c) annualEp in the whole of China and (d) annual P, (e) annualE0, and
(f) annual Ep in the NW from 1961 to 2013.
SEPTEMBER 2019 ZHONG ET AL . 1873
Unauthenticated | Downloaded 12/19/21 02:15 PM UTC

June, fromMarch to July, fromApril toAugust, and from
May to September, respectively. Then the maximum of
these five correlation coefficient (Max CorrelCoeff) was
determined to represent the strongest relationship be-
tween vegetation activity and this form of PDSI. Total
103 stations with significant correlations (p , 0.05) be-
tween NDVI and PDSI were remained for the following
evaluation.
The correlation coefficients between PDSI and NDVI
anomalies at different time lags (0–4 months; Fig. 8)
suggested that positive correlation was mostly strong
when PDSI preceded NDVI by 1-month in most of re-
gion. Figure 9a shows the Max CorrelCoeffs of different
forms of PDSI at all 103 stations during the period 1982–
2013. The minimum, first quartile, third quartile, and
maximum of the Max CorrelCoeffs group of PDSI-ET0
were all largest among four forms of the PDSI, sug-
gesting that the PDSI-ET0 correlated more closely with
the NDVI anomalies than other forms of PDSI in this
region. The Max CorrelCoeffs of PDSI or scPDSI with
ET0 were larger than those with ETp. Additionally, the
Max CorrelCoeffs of PDSI were larger than those of
scPDSI during studied period. The spatial pattern of the
PDSI forms (Fig. 9b) showed the highest correlations
with the NDVI anomalies in the east part of northern
China during 1982–2013. Among which, 41 stations
showed the largest correlations between NDVI and
PDSI-ET0, followed by 27 stations for scPDSI-ET0,
FIG. 6. The frequency of severe droughts (the percentage of months when PDSI,23) at 755 stations for the period
1961–2013.
FIG. 7. Differences between frequencies of severe drought
identified by PDSI-ET0 and PDSI-ETp, respectively (the frequency
of severe drought suggested by PDSI-ET0 minus that suggested by
PDSI-ETp), at 755 stations in China for the period 1961–2013.
1874 JOURNAL OF HYDROMETEOROLOGY VOLUME 20
Unauthenticated | Downloaded 12/19/21 02:15 PM UTC

21 stations for PDSI-ETp, and 14 stations for scPDSI-
ETp. Overall, the PDSI exhibits more closely with
NDVI anomalies than scPDSI, whether it was calculated
via ET0 or ETp. However, the PDSI or scPDSI based on
ET0 showed a higher correlation with NDVI anomalies
than did PDSI or scPDSI with ETp.
2) CORRELATION ANALYSIS BETWEEN MONTHLY
SMA AND PDSI
PDSI is typically used as a proxy of SM (Dai 2011b).
Hence, SM data from GLEAM was used here to eval-
uate the performances of the different PDSI forms. For
each station, the SM series was extracted from the
nearest grid to calculate the monthly anomalies of SM
(SMA). The monthly SMAwas correlated to four forms
of PDSI with 0–3-months lags. The maximum correla-
tions were observed between SMA and all four forms of
PDSI at 0-months lag (Fig. 10), indicating a prompt re-
sponse of SMA to PDSI. Figure 11 shows the spatial
patterns of correlations between monthly SMA and the
different forms of PDSI in China from 1981 to 2013. The
significant relationships (p , 0.05) between SMA and
all forms of PDSI could be observed for all stations.
Relatively weak relationships were scattered in the
northwest of China. Compared with scPDSI, the PDSI
generally correlated more closely with SMA. To further
evaluate the influence of self-calculation process (PDSI-
ET0 vs scPDSI-ET0) and different PET models (PDSI-
ET0 vs PDSI-ETp), we respectively calculated their
correlation coefficient differences with SMA and shown
FIG. 8. The boxplot of correlation coefficients between monthly NDVI abnormities and
(a) PDSI-ET0, (b) scPDSI-ET0, (c) PDSI-ETp, and (d) scPDSI-ETp at different time lags for all
103 stations during 1982–2013.
SEPTEMBER 2019 ZHONG ET AL . 1875
Unauthenticated | Downloaded 12/19/21 02:15 PM UTC

in Fig. 12. Overall, PDSI-ET0 captured SMA signals
better than PDSI-ETp in northern China, especially in
northeastern China, the North China Plain, and the east
part of Qinghai–Tibetan Plateau, but lost its advantage
in southern China, especially in southwestern China.
PDSI-ET0 also performed better than scPDSI-ET0 in
most regions, except for limited stations in northwestern
China and the lower reaches of the Yangtze River.
Our results suggested that PDSI-ETp performed bet-
ter than PDSI-ET0 in capturing SMA signals in re-
gions with abundant rainfall. For further inspection, we
adopted multiyear average precipitation as an index
to testify the performances of PDSI-ET0 and PDSI-ETp.
Figure 13a shows the relationship between annual mean
precipitation and the difference between PDSI-ET0
versus SMA correlation and PDSI-ETp versus SMA
correlation at all 755 stations during 1961–2013. We
further counted the number of stations in Fig. 13a with
an interval of 100mmyr21, as shown in Fig. 13b. Gen-
erally, in regions where average rainfall was less than
about 300mmyr21 ormore than 800mmyr21, the PDSI-
ETp correlated more closely with SMA than PDSI-ET0.
However, a better performance of PDSI-ET0 than PDSI-
ETp in capturing SMA was observed in regions with av-
erage precipitation between about 350–750mmyr21.
Above phenomenon was also supported by the spatial
patterns of multiyear mean rainfall and differences be-
tween correlation coefficients between SMA and PDSI-
ET0 and PDSI-ETp, respectively, as shown in Fig. 14a. In
general, the correlation coefficients between SMA and
PDSI-ET0 were larger than those between SMA and
PDSI-ETp in stations where average rainfall is between
400 and 800mmyr21 and the land cover is grassland or
cropland (Fig. 14b), while the PDSI-ETp correlated
more closely with SMA than PDSI-ET0 in southern
China where average rainfall is more than 800mmyr21
and is covered by forests, or in bare land in north-
western China where average rainfall is less than
100mmyr21. Above analysis suggested that the per-
formances of PDSI-ET0 and PDSI-ETp are related to
local land cover conditions, which are mainly deter-
mined by average rainfall.
3) CORRELATION ANALYSIS BETWEEN MONTHLY
WSDI AND PDSI
The TWS-based drought index, WSDI, has been used
to compare with commonly used drought indices (Long
et al. 2013; D. Zhang et al. 2016). Due to the relative
coarse resolution GRACE, the grid WSDI cannot be
compared directly with the station PDSI. Therefore, we
calculated the correlation between regional mean PDSI
across all station in a region and regional mean TWS
over all grids of the defined region during 2003–13. The
correlation coefficients between PDSI and WSDI at
different time lags (0–3 months) (Fig. 15) suggested that
positive correlation was mostly strong when PDSI pre-
cededWSDI by 0–1 months in most of region. Figure 16
exhibits the maximum of correlation coefficients be-
tween WSDI and four forms of PDSI in seven regions
when time lags were considered. All forms of PDSI
showed significant correlation (p , 0.05) with WSDI in
most regions, except for the PDSI in NC. Relatively
large correlations between the different forms of PDSI
and the WSDI were found in SC and NE, while rela-
tively small correlations were found in NC and IM. The
PDSI-ET0 correlated more closely with WSDI than did
FIG. 9. The maximum correlation coefficients between NDVI abnormities and four forms of PDSI. (a) The
boxplot of the maximum correlation coefficients between NDVI and four forms of PDSI for all 103 stations during
1982–2013. The correlation coefficient is higher than 0.15 when p, 0.05. (b) The spatial pattern of PDSI forms that
presented the maximum correlation with NDVI for 103 stations in northeastern China for the period of 1982–2013.
1876 JOURNAL OF HYDROMETEOROLOGY VOLUME 20
Unauthenticated | Downloaded 12/19/21 02:15 PM UTC

PDSI-ETp in most regions of northern China, espe-
cially in NE, where correlation coefficient between
PDSI-ET0 and WSDI was 0.83 while that between
PDSI-ETp and WSDI was 0.8. The correlation be-
tween PDSI-ETp and WSDI was higher than that be-
tween PDSI-ET0 and WSDI in southern China such
as CSC. In addition, the correlations between PDSI
and WSDI were higher than those between scPDSI
and WSDI in most regions except for the NW and
NC, where the scPDSI with ET0 or ETp correlated
more closely with WSDI than did the PDSI with ET0
or ETp.
4) THE SPATIAL COMPARABILITY OF PDSI AND
SCPDSI
Previous study suggested that the scPDSI identified
far fewer months with extreme drought or wet spells
than did by PDSI for same regions (Schrier et al. 2006).
Here, the probability distributions of themonthly PDSI-
ET0, scPDSI-ET0, PDSI-ETp, and scPDSI-ETp for all
stations in China from 1961 to 2013 were calculated
(Fig. 17). Compared with the PDSI calculated by ET0 or
ETp, the scPDSI calculated by ET0 or ETp presented
a better near-normal pattern, and the variations in ex-
treme drought or extreme wet spells were controlled at
a relative lower level. Figure 18 shows the frequency of
extreme wet or dry conditions (the percentage of times
that the PDSI was at above 4 or below24, respectively)
reported by the different forms of PDSI at each station
from 1961 to 2013. In short, the scPDSI with ET0 or ETp
producted less extremes than did by PDSI with ET0 or
ETp, particularly in NE, NC, IM, and NW of China,
suggesting a better spatial comparability of scPDSI than
that of PDSI in China.
4. Discussion
a. Drought fluctuations in China
This study compared four forms of PDSI by deter-
mining their trends and examining their capacities to
FIG. 10. The boxplot of correlation coefficients between monthly SMA and (a) PDSI-ET0, (b) scPDSI-ET0,
(c) PDSI-ETp, and (d) scPDSI-ETp at different time lags for all 755 stations in China for the period 1981–2013.
SEPTEMBER 2019 ZHONG ET AL . 1877
Unauthenticated | Downloaded 12/19/21 02:15 PM UTC

capture vegetation anomalies, SMA, and TWSA. For
China as a whole, all forms of PDSI demonstrated weak
increasing trends, suggesting a wetting climate, which is
consistent with previous investigations using drought
indices (PDSI, SPEI) based on ET0 or ETp, but is in-
consistent with studies using drought indices based on
PET_th. It has been suggested that the PET_th method
overestimates the impact of temperature on PET
FIG. 11. Spatial distributions of correlation coefficients between monthly SMA and (a) PDSI-ET0, (b) scPDSI-
ET0, (c) PDSI-ETp, and (d) scPDSI-ETp at 755 stations for the period of 1981–2013. The correlation coefficient is
higher than 0.1 when p , 0.05.
FIG. 12. Differences in the correlation coefficients (a) between SMAandPDSI-ET0/PDSI-ETp (coefficient between
SMA and PDSI-ET02 coefficient between SMA and PDSI-ETp) and (b) between SMA and PDSI-ET0/scPDSI-ET0
(coefficient between SMA and PDSI-ET0 2 coefficient between SMA and scPDSI-ET0) at 755 stations in China for
the period of 1981–2013.
1878 JOURNAL OF HYDROMETEOROLOGY VOLUME 20
Unauthenticated | Downloaded 12/19/21 02:15 PM UTC

(Hobbins et al. 2008) and therefore overestimates drought
conditions in the context of global warming. PET cal-
culations that use the Penmen-type equation, however,
are less affected by temperature, and consider influences
from other climatic factors such as surface radiation
(Roderick et al. 2007), wind speed (McVicar et al. 2012),
and humidity deficit (Zhang et al. 2015). J. Zhang et al.
(2016) compared the sensitivity of PDSI to ET0 and
PET_th and found that the PET_th-based PDSI over-
estimated drought conditions due to its high sensitivity
to warming and thereby suggested a drying trend over
China from 1961 to 2013, while PDSI-ET0 indicated
a weak wetting trend over China. These contradictory
conclusions were also reflected in studies by Yu et al.
(2014) and Wang et al. (2017), who both used the SPEI
to study drought conditions in China, but used differ-
ent PET forms: the former was based on PET_th and the
latter was based on ETp. Chen and Sun (2015) also
suggested that the SPEI based on PET_th overestimates
drought conditions in China, especially in the north and
northwest. Our study found that the northwest and the
Qinghai–Tibetan Plateau regions of China experienced
significant wetting trends, which was also reported by
previous studies (Chen and Sun 2015; Wang et al. 2015;
Wang et al. 2017). In our study, the nationally insignifi-
cant wetting trend can be largely explained by the de-
cline of evaporation in most regions as the small change
of precipitation, which could be proved indirectly by the
decreased pan evaporation in China over the past de-
cades (Liu et al. 2010; Liu et al. 2011). However, the
significant wetting trend in NW is mainly caused by
the increased precipitation, which has been reported by
previous studies (Li et al. 2012, 2013). In addition,
we identified a dry trend in central and south-central
China, which was also roughly consistent with previous
studies (Chen and Sun 2015;Wang et al. 2017). Themain
cause may be the decreased precipitation (Wu et al.
2016) and warming associated increase of evaporation
(Chu et al. 2015).
b. Influence of different PET calculation methodson PDSI
Potential evapotranspiration is an important forcing
factor needed to estimate the amount of precipitation
required under CAFEC. In this study, we used two dif-
ferent methods to calculate PET: ET0 and ETp, which
have been widely used in previous studies (Dai 2011a;
van der Schrier et al. 2011; J. Zhang et al. 2016). Al-
though both the ET0 and ETp methods can evaluate
evaporative processes in terms of atmospheric water
demand, they are not equivalent terms. Differences in
ET0 and ETp have been described by (Dodds et al. 2005;
McVicar et al. 2005; McVicar et al. 2012) in detail. In
short, the differences include 1) The surface resistance
(rs) of ET0 has a prescribed value of 70 sm21 (Allen
et al. 1998), while rs of ETp is 0 sm21, and 2) different
assumptions of underlying surface conditions. The as-
sumptions of underlying surface condition of ET0 is
‘‘grass with an assumed crop height of 0.12m, a fixed
surface resistance of 70 sm21, and an albedo of 0.23’’
(Allen et al. 1998), while the surface condition of ETp is
‘‘a short green crop, completely shading the ground, of
uniform height andwith adequate water status in the soil
profile’’ (Penman 1948, 1963), which is wider than that
of ET0 because there are more types of horticultural and
agronomic crops that fit into the description of Xu et al.
(2006). The differences between ETp and ET0 are di-
rectly reflected in their mean values and ultimate PDSI
values and trends, as observed in this study. Moreover,
the choice of PET has great influence on the identifica-
tion of severely drought events. PDSI-ET0 reported
more severe drought events in north China while PDSI-
ETp identified more severe drought events in south
FIG. 13. The relationship between multiyear average precipita-
tion and the performances of PDSI-ET0 or PDSI-ETp. (a) The
relationship between annual mean precipitation and the difference
between PDSI-ET0 vs SMA correlation coefficient and PDSI-ETp
vs SMA correlation coefficient (PDSI-ET0 vs SMA correlation 2PDSI-ETp vs SMA correlation) for all 755 stations in China, and
(b) the relationship between annual mean precipitation and the
number of stations with a better performance of PDSI-ET0 than
PDSI-ETp (PDSI-ET0 vs SMA correlation . PDSI-ETp vs SMA
correlation) or the opposite condition.
SEPTEMBER 2019 ZHONG ET AL . 1879
Unauthenticated | Downloaded 12/19/21 02:15 PM UTC

China. In addition, the evaluation of different PDSI
suggested that PDSI-ET0 performed well in northern
China, especially in northeastern China, while PDSI-
ETp performed well in southern China. Above results
indicated the differences between PDSI-ET0 and PDSI-
ETp in many respects. Therefore, which form of PDSI
should be chosen is crucial for drought quantification
for a specific region. In this study, we found that the
FIG. 14. As in Fig. 12a, but with a (a) mutiyear mean rainfall map and (b) land cover map as an external reference.
FIG. 15. Correlation coefficients between monthly (a) PDSI-ET0, (b) scPDSI-ET0, (c) PDSI-ETp, and (d) scPDSI-
ETp and WSDI at different time lags in seven regions in China for the period 2003–13.
1880 JOURNAL OF HYDROMETEOROLOGY VOLUME 20
Unauthenticated | Downloaded 12/19/21 02:15 PM UTC

PDSI-ET0 performed well in the condition where the
average rainfall is between about 350 and 750mmyr21.
The reason may be that the vegetation in these regions,
namely the crop and grass (Fig. 14b), is close to the
reference crop defined by ET0. The PDSI-ETp has a
good performance in a larger scale because ‘‘a short
green crop’’ defined by ETp is more widely distributed
than that defined by ET0.
In short, both the ET0 and ETp equations have the
merits and limitations. The above analysis highlights the
necessity of a full consideration of the assumptions and
ideal conditions included in different PET calculation
methods before they are used to estimate atmospheric
water demand.
c. Comparison of PDSI and scPDSI
In this study, we found the spatial comparability of
scPDSI is better than that of PDSI, which is also re-
ported by previous studies. For example, the modified
scPDSI performed more consistently and allowed for
more accurate determinations of drought conditions
than the original PDSI at different locations in all cli-
mate zones in the conterminous United States (Wells
et al. 2004). However, according to the evaluations of
PDSI and scPDSI in this study, the original PDSI cor-
related more closely with NDVI anomalies, SMA and
WSDI than did by scPDSI inmost regions of China. One
of the major reason is that scPDSI captured less severe
meteorological droughts than PDSI. This may be due
to 1) themodifications to the scPDSI reduced the impact
of using different PET methods (van der Schrier et al.
2011), which led to an insensitivity of scPDSI to changes
in wet or dry conditions, and 2) the modifications to
the self-calibration duration factors (p and q) and the
climatic characteristics (K) potentially make the scPDSI
more sensitive to the characteristics of datasets. Ac-
cording to a previous study in the Yellow River basin in
northern China (Liu et al. 2016), the self-calibrating
process further destabilized the drought identification
performance of scPDSI among different datasets. This
is not to deny the contributions of the self-calibrating
procedure, which improves the spatial consistency of
PDSI and controls the frequency of extreme events (Dai
2011b; Trenberth et al. 2014).
d. The evaluation of PDSI
In this study, the NDVI anomalies in northeastern
China were not all well correlated to PDSI even though
most of correlations are significant (if R . 0.2 then p ,0.01), which indicated that PDSI could not capture all
the vegetative droughts. Meanwhile, all forms of PDSI
did not show significant correlation with WSDI in NC,
which is in line with the finding of M. Zhao et al. (2017)
that suggested a drying trend indicated by GRACE-
based terrestrial water storage while a wetting trend indi-
cated byPDSI in this region. In addition,Qin et al.’s (2015)
FIG. 16. Correlation coefficients betweenWSDI and different forms of PDSI in seven regions in
China for the period 2003–13. Bars with an asterisk indicate p , 0.05.
SEPTEMBER 2019 ZHONG ET AL . 1881
Unauthenticated | Downloaded 12/19/21 02:15 PM UTC

study in the same area found that NDVI and SMA in-
creased during 2002–14 despite significantly decrease of
annual precipitation. The agricultural irrigation associ-
ated groundwater pumping should be responsible for the
low correlation between WSDI and PDSI in NC (Dai
2011a). In addition, the correlation coefficients between
PDSI and SMA in some stations in NW and QT were
relative low, because that not only the P or evapo-
transpiration but also the glacial and snowmelt from
mountains (Barnett et al. 2005) participate in local water
balance. The above analysis suggested that despite the
PDSI is a good meteorological drought index, while it
could not fully represent the changes of land water
conditions.
5. Conclusions
In this study, the performances of four forms of PDSI,
including the original PDSI based on either ET0 or ETp,
the scPDSI based on either ET0 or ETp, respectively,
were compared in China from 1961 to 2013. The primary
conclusions are:
d For China as a whole, all four forms of PDSI
suggested a wetting trend during the studied pe-
riods, with a relatively larger increasing trend sug-
gested by PDSI-ETp due to the faster decreasing
rate of Ep. Regionally, widely distributed wetting
trends were observed in Northwestern China due to
the increasing precipitation, while the central and
south-central China underwent drying trends from
1961 to 2013.d Vegetation changes were more closely correlated with
PDSI-ET0 than other forms of PDSI in the east of
northern China. PDSI or scPDSI with ET0 had rela-
tive better performance in capturing changes in SMA
and WSDI in northern China, especially in north-
eastern China, while PDSI or scPDSI with ETp per-
formed well in southern China.d PDSI-ET0 performed better than PDSI-ETp over
regions covered by grass and agricultural crops, where
the annual mean precipitation is between about 350
and about 750mmyr21. However, for those regions
out of this precipitation scope, PDSI- ETp had a better
performance than PDSI-ET0.
FIG. 17. Frequency distribution of monthly value of (a) PDSI-ET0, (b) scPDSI-ET0, (c) PDSI-ETp, and (d) scPDSI-
ETp at all of the 755 stations in China for the period 1961–2013.
1882 JOURNAL OF HYDROMETEOROLOGY VOLUME 20
Unauthenticated | Downloaded 12/19/21 02:15 PM UTC

d The spatial comparability of scPDSI was better than
that of PDSI, while the PDSI correlated more closely
with NDVI anomalies, SMA, and WSDI than did
scPDSI in most regions of China.
Acknowledgments. This work is financially supported
by the National Key Research and Development
Program of China (Grants 2017YFA0603601 and
2016YFC0500805), the Strategic Priority Research
Program of Chinese Academy of Sciences (Grant
XDA20060402) and the National Natural Science
Foundation of China (Grants 41101074 and 41671083).
REFERENCES
Akinremi, O. O., S.M.Mcginn, andA.G. Barr, 1996: Evaluation of
the Palmer drought index on the Canadian Prairies. J. Climate,
9, 897–905, https://doi.org/10.1175/1520-0442(1996)009,0897:
EOTPDI.2.0.CO;2.
Allen, R. G., L. S. Pereira, D. Raes, and M. Smith, 1998: Crop
evapotranspiration: Guidelines for computing crop water re-
quirements. FAO Irrigation and Drainage Paper 56, 300 pp.,
http://www.fao.org/3/X0490E/X0490E00.htm.
Alley,W.M., 1984: The Palmer drought severity index: Limitations
and assumptions. J. Climate Appl. Meteor., 23, 1100–1109,https://doi.org/10.1175/1520-0450(1984)023,1100:TPDSIL.2.0.CO;2.
Barnett, T. P., J. C. Adam, and D. P. Lettenmaier, 2005: Potential
impacts of a warming climate on water availability in snow-
dominated regions. Nature, 438, 303–309, https://doi.org/
10.1038/nature04141.
Chen, H., and J. Sun, 2015: Changes in drought characteristics over
China using the standardized precipitation evapotranspira-
tion index. J. Climate, 28, 5430–5447, https://doi.org/10.1175/
JCLI-D-14-00707.1.
Chu, C., J. Zhao, and C. An, 2015: Climate changes in different
climate zones in central China and their relationship with
ENSO from 1957 to 2011 (in Chinese).Areal Res. Dev., 34 (5),
121–127.
Dai, A., 2011a: Characteristics and trends in various forms of the
PalmerDrought Severity Index during 1900–2008. J. Geophys.
Res., 116, D12115, https://doi.org/10.1029/2010JD015541.
FIG. 18. The frequency of wet extremes (PDSI. 4) identified by (a) PDSI-ET0, (b)PDSI-ETp, (c) scPDSI-ET0, and (d) scPDSI-ETp and
dry extremes (PDSI , 24) identified by (e) PDSI-ET0, (f)PDSI-ETp, (g) scPDSI-ET0, and (h) scPDSI-ETp.
SEPTEMBER 2019 ZHONG ET AL . 1883
Unauthenticated | Downloaded 12/19/21 02:15 PM UTC

——, 2011b: Erratum: Drought under global warming: A review.
Wiley Interdiscip. Rev.: Climate Change, 2, 45–65, https://
doi.org/10.1002/wcc.81.
——,K. E. Trenberth, and T.Qian, 2004: A global dataset of Palmer
drought severity index for 1870–2002: Relationship with soil
moisture and effects of surface warming. J. Hydrometeor., 5,
1117–1130, https://doi.org/10.1175/JHM-386.1.
Dodds, P. E., W. S. Meyer, and A. Barton, 2005: Review of
methods to estimate irrigated reference crop evapotranspi-
ration across Australia. CRC for Irrigation Futures Tech.
Rep. No 04/05, 48 pp., https://publications.csiro.au/rpr/pub?
list5BRO&pid5procite:8177b7f4-9950-4e57-8458-f338d0e5c047.
Hao, Y., S. Q. Wang, H. Q. Lu, Q. Yu, Z. C. Zhu, R. B. Myneni,
L. Qiang, andH.H. Shugart, 2015:Development of a remotely
sensing seasonal vegetation-based Palmer Drought Severity
Index and its application of global drought monitoring over
1982-2011. J. Geophys. Res. Atmos., 119, 9419–9440, https://
doi.org/10.1002/2014JD021673.
Hobbins, M., A. Dai, M. Roderick, and G. Farquhar, 2008: Re-
visiting potential evapotranspiration parameterizations as
drivers of long-termwater balance trends.Geophys. Res. Lett.,
35, L12403, https://doi.org/10.1029/2008GL033840.
Hua, T., X.Wang, C. Zhang, L. Lang, andH. Li, 2017: Responses of
vegetation activity to drought in northern China. Land De-
grad. Dev., 28, 1913– 1921, https://doi.org/10.1002/ldr.2709.
Jacobi, J., D. Perrone, L. L. Duncan, and G. Hornberger, 2013: A
tool for calculating the Palmer drought indices.Water Resour.
Res., 49, 6086–6089, https://doi.org/10.1002/wrcr.20342.
Kendall, M. G., 1948: Rank Correlation Methods. Charles Griffin,
160 pp.
Li, B., Y. Chen, Z. Chen, and W. Li, 2012: Trends in runoff versus
climate change in typical rivers in the arid region of north-
west China. Quat. Int., 282, 87–95, https://doi.org/10.1016/
j.quaint.2012.06.005.
——, ——, X. Shi, Z. Chen, and W. Li, 2013: Temperature and
precipitation changes in different environments in the arid
region of northwest China. Theor. Appl. Climatol., 112,
589–596, https://doi.org/10.1007/s00704-012-0753-4.
Liu, M., Y. Shen, Y. Zeng, and C. Liu, 2010: Trend in pan evapo-
ration and its attribution over the past 50 years in China.
J. Geogr. Sci., 20, 557–568, https://doi.org/10.1007/s11442-010-
0557-3.
Liu, X., Y. Luo, D. Zhang, M. Zhang, and C. Liu, 2011: Recent
changes in pan-evaporation dynamics in China.Geophys. Res.
Lett., 38, L13404, https://doi.org/10.1029/2011GL047929.
Liu, Y., L. Ren, Y. Hong, Y. Zhu, X. Yang, F. Yuan, and S. Jiang,
2016: Sensitivity analysis of standardization procedures in
drought indices to varied input data selections. J. Hydrol., 538,
817–830, https://doi.org/10.1016/j.jhydrol.2016.04.073.
——, Y. Zhu, L. Ren, V. P. Singh, X. Yang, and F. Yuan, 2017: A
multiscalar Palmer drought severity index. Geophys. Res.
Lett., 44, 6850–6858, https://doi.org/10.1002/2017GL073871.
Long, D., B. R. Scanlon, L. Longuevergne, A. Y. Sun, D. N.
Fernando, and H. Save, 2013: GRACE satellite monitoring of
large depletion in water storage in response to the 2011
drought in Texas. Geophys. Res. Lett., 40, 3395–3401, https://
doi.org/10.1002/grl.50655.
Mann, H. B., 1945: Nonparametric tests against trend. Econo-
metrica, 13, 245–259, https://doi.org/10.2307/1907187.
McKee, T. B., N. J. Doesken, and J. Kleist, 1993: The relationship
of drought frequency and duration to time scales. 8th Conf. on
Applied Climatology, Anaheim, CA, Amer. Meteor. Soc.,
179–184.
McVicar, T., L. Li, T. Van Niel, M. Hutchinson, X. Mu, and Z. Liu,
2005: Spatially distributing 21 years of monthly hydrometeo-
rological data in China: Spatio-temporal analysis of FAO-56
crop reference evapotranspiration and pan evaporation in
the context of climate change. CSIRO Land and Water
Technical Report 8/05, 316 pp., https://doi.org/10.4225/08/
585ac38172fb7.
——, and Coauthors, 2012: Global review and synthesis of trends
in observed terrestrial near-surface wind speeds: Implications
for evaporation. J. Hydrol., 416-417, 182–205, https://doi.org/
10.1016/j.jhydrol.2011.10.024.
Nachtergaele, F., and Coauthors, 2010: The HarmonizedWorld Soil
Database. Proc. 19th World Congress of Soil Science, Brisbane,
Australia, International Union of Soil Sciences, 34–37, https://
www.iuss.org/19th%20WCSS/Symposium/pdf/2330.pdf.
Palmer, W. C., 1965: Meteorological drought. U.S. Weather Bu-
reau Research Paper 45, 58 pp., http://www.ncdc.noaa.gov/
temp-and-precip/drought/docs/palmer.pdf.
Penman, H. L., 1948: Natural evaporation from open water, bare
soil and grass. Proc. Roy. Soc. London, 193A, 120–145, https://
doi.org/10.1098/rspa.1948.0037.
——, 1963: Vegetation and hydrology. Commonwealth Bureau of
Soils Tech. Comm. 53, Commonwealth Agricultural Bureaux,
124 pp.
Qin, Y., D. Yang, H. Lei, X. Kai, and X. Xu, 2015: Comparative
analysis of drought based on precipitation and soil moisture
indices in Haihe basin of North China during the period of
1960–2010. J. Hydrol., 526, 55–67, https://doi.org/10.1016/
j.jhydrol.2014.09.068.
Roderick, M. L., L. D. Rotstayn, G. D. Farquhar, and M. T.
Hobbins, 2007: On the attribution of changing pan evapora-
tion. Geophys. Res. Lett., 34, L17403, https://doi.org/10.1029/
2007GL031166.
Schrier, G. V. D., K. R. Briffa, P. D. Jones, and T. J. Osborn, 2006:
Summer moisture variability across Europe. J. Climate, 19,
1013–1017, https://doi.org/10.1175/JCLI3734.1.
Sheffield, J., E. F.Wood, andM. L. Roderick, 2012: Little change in
global drought over the past 60 years. Nature, 491, 435–438,
https://doi.org/10.1038/nature11575.
Shuttleworth, W., 1993: Evaporation.Handbook of Hydrology, D.
R. Maidment, Ed. McGraw-Hill, 4.1–4.53.
Sinha, D., T. H. Syed, J. S. Famiglietti, J. T. Reager, and R. C.
Thomas, 2017: Characterizing drought in India using
GRACE observations of terrestrial water storage deficit.
J. Hydrometeor., 18, 381–396, https://doi.org/10.1175/
JHM-D-16-0047.1.
Thornthwaite, C. W., 1948: An approach toward a rational classi-
fication of climate. Geogr. Rev., 38, 55–94, https://doi.org/
10.2307/210739.
Trenberth, K. E., A. Dai, G. V. D. Schrier, P. D. Jones,
J. Barichivich, K. R. Briffa, and J. Sheffield, 2014: Global
warming and changes in drought. Nat. Climate Change, 4,
17–22, https://doi.org/10.1038/nclimate2067.
Valiantzas, J. D., 2013: Simplified forms for the standardized
FAO-56 Penman–Monteith reference evapotranspiration
using limited weather data. J. Hydrol., 505, 13–23, https://
doi.org/10.1016/j.jhydrol.2013.09.005.
van der Schrier, G., K. R. Briffa, T. J. Osborn, and E. R. Cook,
2006: Summer moisture availability across North America.
J. Geophys. Res., 111, D11102, https://doi.org/10.1029/
2005JD006745.
——, P. Jones, and K. Briffa, 2011: The sensitivity of the PDSI to
the Thornthwaite and Penman-Monteith parameterizations
1884 JOURNAL OF HYDROMETEOROLOGY VOLUME 20
Unauthenticated | Downloaded 12/19/21 02:15 PM UTC

for potential evapotranspiration. J. Geophys. Res., 116,
D03106, https://doi.org/10.1029/2010JD015001.
Vicenteserrano, S. M., S. Beguería, J. I. Lópezmoreno, M. Angulo,
and A. E. Kenawy, 2010: A new global 0.58 gridded dataset
(1901–2006) of a multiscalar drought index: Comparison with
current drought index datasets based on the Palmer drought
severity index. J. Hydrometeor., 11, 1033–1043, https://doi.org/
10.1175/2010JHM1224.1.
——, and Coauthors, 2013: Response of vegetation to drought
time-scales across global land biomes. Proc. Natl. Acad. Sci.
USA, 110, 52–57, https://doi.org/10.1073/pnas.1207068110.
——, andCoauthors, 2014: Evidence of increasing drought severity
caused by temperature rise in southern Europe. Environ. Res.
Lett., 9, 044001, https://doi.org/10.1088/1748-9326/9/4/044001.
Wang,W.,Y.Zhu,R.Xu, and J. Liu, 2015:Drought severity change in
China during 1961–2012 indicated by SPI and SPEI. Nat. Haz-
ards, 75, 2437–2451, https://doi.org/10.1007/s11069-014-1436-5.
Wang, Z., J. Li, C. Lai, Z. Zeng, R. Zhong, X. Chen, X. Zhou, and
M. Wang, 2017: Does drought in China show a significant
decreasing trend from 1961 to 2009? Sci. Total Environ., 579,
314–324, https://doi.org/10.1016/j.scitotenv.2016.11.098.
Wells,N., S.Goddard, andM. J.Hayes, 2004:A self-calibratingPalmer
drought severity index. J. Climate, 17, 2335–2351, https://doi.org/10.1175/1520-0442(2004)017,2335:ASPDSI.2.0.CO;2.
Wu, X., Z. Wang, X. Zhou, C. Lai, W. Lin, and X. Chen, 2016:
Observed changes in precipitation extremes across 11 basins in
China during 1961–2013. Int. J. Climatol., 36, 2866–2885,
https://doi.org/10.1002/joc.4524.
Xu, C.-Y., L. Gong, T. Jiang, D. Chen, andV. Singh, 2006: Analysis
of spatial distribution and temporal trend of reference
evapotranspiration and pan evaporation in Changjiang
(Yangtze River) catchment. J. Hydrol., 327, 81–93, https://
doi.org/10.1016/j.jhydrol.2005.11.029.
Yin, Y., S.Wu,D. Zheng, andQ. Yang, 2008: Radiation calibration
of FAO56 Penman–Monteith model to estimate reference
crop evapotranspiration in China. Agric. Water Manage., 95,
77–84, https://doi.org/10.1016/j.agwat.2007.09.002.
Yu, M., Q. Li, M. J. Hayes, M. D. Svoboda, and R. R. Heim, 2014:
Are droughts becoming more frequent or severe in China
based on the Standardized Precipitation Evapotranspiration
Index: 1951–2010? Int. J. Climatol., 34, 545–558, https://
doi.org/10.1002/joc.3701.
Zhang, D., Q. Zhang, A. D. Werner, and X. Liu, 2016: GRACE-
based hydrological drought evaluation of the Yangtze River
basin, China. J. Hydrometeor., 17, 811–828, https://doi.org/10.1175/JHM-D-15-0084.1.
Zhang, J., F. Sun, J. Xu, Y. Chen, Y. F. Sang, and C. Liu, 2016:
Dependence of trends in and sensitivity of drought over China
(1961–2013) on potential evaporation model. Geophys. Res.
Lett., 43, 206–213, https://doi.org/10.1002/2015GL067473.
Zhang, Q., T. Qi, J. Li, V. P. Singh, and Z. Wang, 2015: Spatio-
temporal variations of pan evaporation in China during
1960–2005: Changing patterns and causes. Int. J. Climatol.,
35, 903–912, https://doi.org/10.1002/joc.4025.
Zhao, H., G. Gao, W. An, X. Zou, H. Li, and M. Hou, 2017:
Timescale differences between SC-PDSI and SPEI for
drought monitoring in China. Phys. Chem. Earth, 102, 48–58,
https://doi.org/10.1016/j.pce.2015.10.022.
Zhao, M., G. A, I. Velicogna, and J. S. Kimball, 2017: A global
gridded dataset of GRACE drought severity index for
2002–14: Comparison with PDSI and SPEI and a case study
of the Australia Millennium Drought. J. Hydrometeor., 18,
2117–2129, https://doi.org/10.1175/JHM-D-16-0182.1.
Zhao, S. Q., 1983: A new scheme for comprehensive physical re-
gionalization in China. Acta Geogr. Sin., 50, 1–10, https://
doi.org/10.11821/xb198301001.
SEPTEMBER 2019 ZHONG ET AL . 1885
Unauthenticated | Downloaded 12/19/21 02:15 PM UTC
Related Documents


![Characteristics and trends in various forms of the Palmer ...2011]. Among them, the Palmer Drought Severity Index (PDSI) is the most prominent index of meteorological drought used](https://static.cupdf.com/doc/110x72/6115c169c40f1319dc3af504/characteristics-and-trends-in-various-forms-of-the-palmer-2011-among-them.jpg)