Performance of seawater-mixed concrete in the tidal environment Tarek Uddin Mohammed * , Hidenori Hamada, Toru Yamaji Materials Division, Independent Administrative Institution, Port and Airport Research Institute, 3-1-1 Nagase, Yokosuka 239-0826, Japan Received 18 September 2001; accepted 22 September 2003 Abstract Compressive strength, mineralogy, chloride ingress, and corrosion of steel bars embedded in concrete made with seawater and tap water are summarized here based on the several long-term exposure investigations under tidal environment. Seawater-mixed concrete shows earlier strength gain. After 20 years of exposure, no significant difference in the compressive strength of concrete is observed for concrete mixed with seawater and tap water. The initial amount of chloride (due to the use of seawater) may cause the initiation of corrosion at the locations of the steel bars having voids/gaps at the steel – concrete interface immediately after casting concrete. The use of seawater results in the formation of deeper corrosion pits compared to the same with tap water. D 2004 Elsevier Ltd. All rights reserved. Keywords: Compressive strength; Concrete; Corrosion; Seawater 1. Introduction The discussions on the performance of seawater-mixed concrete are still reported in the recent technical literatures [1]. Generally, it is said that seawater-mixed concrete should be avoided to use in reinforced-concrete structures. In the case of unavoidable situation, the use of seawater is recom- mended for plain concrete [2]. We also performed several investigations on concrete mixed with seawater, tap water, and salt water. Various cements were used in these inves- tigations, such as ordinary portland cement, blended slag and fly ash cements, moderate-heat portland cement, and high early-strength portland cement. The specimens were exposed to a tidal pool utilizing seawater directly from the sea. A summary of these investigations is reported here. The results will be very useful to understand the long-term performance of concrete mixed with tap water and seawater under the tidal environment. 2. Experimental methods Two series of investigations were carried out. The concrete specimens were mixed with tap water and seawa- ter. The physical properties and chemical compositions of seawater are shown in Table 1. In the first series (denoted as Series 1), the cement types were ordinary portland cement, slag cement, and fly ash cements. In this series, both uncracked (cylinder specimens with a diameter of 150 mm and height of 300 mm) and cracked (prism specimens of size 100100600 mm) concrete specimens were investi- gated. Three round steel bars of diameter 9 mm were embedded at 20, 40, and 70 mm of cover depths in cylindrical specimens. Plain cylindrical concrete specimens were also made. In prism specimens, a round steel bar, 9 mm in diameter and 500 mm in length, was embedded at the middle of the section. Before exposure, a bending crack was made at the center of the prism specimen. The investigations on this series were carried out at the age of 28 days and 15 years. In the second series (denoted as Series 2), the cement types were ordinary portland cement, high early-strength portland cement, moderate-heat portland cement, and blast furnace slag cement. In this series, plain and reinforced cylindrical specimens, 150 mm in diameter and 300 mm in height, were investigated. Reinforcements were embedded at 20, 40, and 70 mm of cover depths. The investigations were carried out at 28 days at 1, 5, and 20 years of exposure. The specimens were exposed in a tidal pool created by automatic pumping into and draining out of seawater directly from the sea. Compressive strength of concrete, chloride contents, and corrosion of steel bars in cracked and uncracked concrete 0008-8846/$ – see front matter D 2004 Elsevier Ltd. All rights reserved. doi:10.1016/j.cemconres.2003.09.020 * Corresponding author. Tel.: +81-468-44-5061; fax: +81-468-44- 0255. E-mail address: [email protected] (T.U. Mohammed). Cement and Concrete Research 34 (2004) 593 – 601

Welcome message from author
This document is posted to help you gain knowledge. Please leave a comment to let me know what you think about it! Share it to your friends and learn new things together.
Transcript

Cement and Concrete Research 34 (2004) 593–601
Performance of seawater-mixed concrete in the tidal environment
Tarek Uddin Mohammed*, Hidenori Hamada, Toru Yamaji
Materials Division, Independent Administrative Institution, Port and Airport Research Institute, 3-1-1 Nagase, Yokosuka 239-0826, Japan
Received 18 September 2001; accepted 22 September 2003
Abstract
Compressive strength, mineralogy, chloride ingress, and corrosion of steel bars embedded in concrete made with seawater and tap water
are summarized here based on the several long-term exposure investigations under tidal environment. Seawater-mixed concrete shows earlier
strength gain. After 20 years of exposure, no significant difference in the compressive strength of concrete is observed for concrete mixed
with seawater and tap water. The initial amount of chloride (due to the use of seawater) may cause the initiation of corrosion at the locations
of the steel bars having voids/gaps at the steel–concrete interface immediately after casting concrete. The use of seawater results in the
formation of deeper corrosion pits compared to the same with tap water.
D 2004 Elsevier Ltd. All rights reserved.
Keywords: Compressive strength; Concrete; Corrosion; Seawater
1. Introduction
The discussions on the performance of seawater-mixed
concrete are still reported in the recent technical literatures
[1]. Generally, it is said that seawater-mixed concrete should
be avoided to use in reinforced-concrete structures. In the
case of unavoidable situation, the use of seawater is recom-
mended for plain concrete [2]. We also performed several
investigations on concrete mixed with seawater, tap water,
and salt water. Various cements were used in these inves-
tigations, such as ordinary portland cement, blended slag
and fly ash cements, moderate-heat portland cement, and
high early-strength portland cement. The specimens were
exposed to a tidal pool utilizing seawater directly from the
sea. A summary of these investigations is reported here. The
results will be very useful to understand the long-term
performance of concrete mixed with tap water and seawater
under the tidal environment.
2. Experimental methods
Two series of investigations were carried out. The
concrete specimens were mixed with tap water and seawa-
0008-8846/$ – see front matter D 2004 Elsevier Ltd. All rights reserved.
doi:10.1016/j.cemconres.2003.09.020
* Corresponding author. Tel.: +81-468-44-5061; fax: +81-468-44-
0255.
E-mail address: [email protected] (T.U. Mohammed).
ter. The physical properties and chemical compositions of
seawater are shown in Table 1. In the first series (denoted as
Series 1), the cement types were ordinary portland cement,
slag cement, and fly ash cements. In this series, both
uncracked (cylinder specimens with a diameter of 150 mm
and height of 300 mm) and cracked (prism specimens of
size 100�100�600 mm) concrete specimens were investi-
gated. Three round steel bars of diameter 9 mm were
embedded at 20, 40, and 70 mm of cover depths in
cylindrical specimens. Plain cylindrical concrete specimens
were also made. In prism specimens, a round steel bar, 9
mm in diameter and 500 mm in length, was embedded at the
middle of the section. Before exposure, a bending crack was
made at the center of the prism specimen. The investigations
on this series were carried out at the age of 28 days and 15
years. In the second series (denoted as Series 2), the cement
types were ordinary portland cement, high early-strength
portland cement, moderate-heat portland cement, and blast
furnace slag cement. In this series, plain and reinforced
cylindrical specimens, 150 mm in diameter and 300 mm in
height, were investigated. Reinforcements were embedded
at 20, 40, and 70 mm of cover depths. The investigations
were carried out at 28 days at 1, 5, and 20 years of exposure.
The specimens were exposed in a tidal pool created by
automatic pumping into and draining out of seawater
directly from the sea.
Compressive strength of concrete, chloride contents, and
corrosion of steel bars in cracked and uncracked concrete

Table 1
Physical properties and chemical composition of seawater
Specific gravity pH Na (ppm) K (ppm) Ca (ppm) Mg (ppm) Cl (ppm) SO4 (ppm) CO3 (ppm)
1.022 7.77 9290 346 356 1167 17087 2378 110
T.U. Mohammed et al. / Cement and Concrete Research 34 (2004) 593–601594
were evaluated. In some cases, the mineralogy of the
concrete samples was also evaluated by X-ray diffraction
(XRD). Further detail of the experimental setup of these
investigations can be obtained in Refs. [3–5].
A detailed experimental investigation was also carried
out in the laboratory to clarify the formation of corrosion
cells over the steel bars in concrete due to the presence of
gap/void at the steel–concrete interface. In this case, the
specimens (length 100 mm, width 230 mm, and height 290
mm) were made with 10 kg/m3 NaCl in concrete to
accelerate the corrosion process. Macrocell corrosion pro-
cess as well as the degree of microcell corrosion of steel bars
depending on their orientation in concrete was examined.
For this, a specially fabricated steel bar was embedded in
concrete, separating horizontal and vertical steel bars. Also,
each horizontal steel bars was divided into top and bottom
halves. Electrical connections among the steel bars were
provided from outside of the specimens. After casting, the
specimens were exposed in a closed container with constant
humidity and temperature. Further detail of this experimen-
tal setup is provided later. More detail experimental setup
and the process of evaluation of macro- and microcell
corrosion can be obtained in Ref. [6].
3. Experimental results and discussion
The results are reported in two separate sections entitled
as ‘‘Concrete Mixed with Seawater and Tap Water’’ (Section
3.1) and ‘‘Concrete Mixed with Salt Water’’ (Section 3.2).
In Section 3.1, the results related to the 15- and 20-year-old
specimens (Series 1 and 2, respectively) are discussed. In
Section 3.2, the corrosion of steel bars in concrete with the
presence of void at the steel–concrete interface is summa-
rized and correlated with the corrosion of steel bars in
seawater-mixed concrete.
3.1. Concrete mixed with seawater and tap water
3.1.1. Compressive strength—Series 1
Compressive strengths of cylinder specimens at the age
of 28 days and 15 years of exposure to the tidal environment
are shown in Fig. 1. Here OPC, SCA, SCB, SCC, and
FACB mean ordinary portland cement, slag cement of Type
A, slag cement of Type B, slag cement of Type C, and fly
ash cement of Type B, respectively. In SCA, SCB, and SCC,
the slag contents are 5–30%, 30–60%, and 60–70% of the
cement mass, respectively. In FACB, the fly ash content is
10–20% of cement mass. Further specifications on the
blended cements can be obtained in JIS R5211-1992 and
JIS R5213-1992. The symbols T, S, and numbers (Fig. 1)
represent tap water, seawater, and water-to-cement ratio,
respectively. The mixture proportions and cement composi-
tions can be obtained in Ref. [3]. The use of seawater causes
an earlier strength gain compared to the same with tap water.
It is understood that at the early age, the microstructure of
concrete improved due to the use of seawater. It is expected
due to the acceleration of hydration process with the
presence of chloride. The use of seawater does not cause
the deterioration of concrete strength after 15 years of
exposure in a tidal pool. The interim strength of concrete
between 28 days and 15 years of exposure cannot be judged
from this experimental series.
3.1.2. Compressive strength and mineralogy—Series 2
Compressive strength of cylinder specimens at the age
of 28 days and 1, 5, and 20 years of exposure in a tidal
pool are shown in Fig. 2 for Series 2. In this series,
ordinary portland cement (OPC1 and OPC2), high early-
strength portland cement (HESPC), moderate-heat portland
cement (MHPC), and slag cement of Type B (SCB1 and
SCB2) were investigated. In OPC1 and OPC2, the sulfate
contents are 2.0% and 3.9%, respectively. In SCB1 and
SCB2, the sulfate contents are 2.4% and 4.3%, respectively.
The detail of mixture proportions and cement compositions
of this series can be obtained in Ref. [5]. A gain in
compressive strength of concrete is observed until the age
of 5 years. Then it reduces gradually until the age of 10
years, and at the age of 20 years, becomes the same or less
than the 28-day strength of concrete. The same variation in
strength with the exposure age was also observed for
concrete mixed with tap water. The exact reason for this
strength variation cannot be explained as the detail analysis
on the gradual change in the microstructure and mineralogy
of concrete was not carried out. Probable reasons of
strength gain at the early stage (28 days to 5 years) of
exposure are the ongoing hydration of cement in concrete,
and the deposition of ettringite and Friedel’s salt in the air
voids in concrete caused by the diffused sulfate and
chloride. From 10 to 20 years, no significant reduction in
strength is observed. The stability in strength after 10 years
is expected due to the improvement of the microstructures
at the outer region of the specimens caused by the depo-
sition of ettringite as well as Friedel’s salt. The improve-
ment of microstructure at the outer region of the specimens
after 15 years of exposure is reported in Ref. [7]. The
improved microstructure at the outer region causes to
screen the diffused ions from seawater into concrete at
the outer region. Further research on the gradual change in
microstructure of concrete is still necessary to confirm the

Fig. 1. Compressive strength of concrete mixed with seawater and tap
water.
Fig. 2. Compressive strength of concrete mixed with seawater at the
different ages of exposure.
Fig. 3. Compressive strength ratio at the different ages of exposure
(seawater case/tap water case).
T.U. Mohammed et al. / Cement and Concrete Research 34 (2004) 593–601 595
exact mechanism related to the strength gain at the early
stage, strength reduction at the intermediate stage, and the
stability of strength at the later stage of exposure as
observed in Fig. 2. The mineralogical composition of
concrete after 20 years of exposure is explained later. It
is worth to mention that in Series 1, the tests was conducted
at the age of 28 days and 15 years of exposure, therefore,
the strength at the interim period between 28 days and 15
years cannot be judged as in Series 2.
Compressive strength ratios (seawater-mixed concrete
divided by tap water-mixed concrete) are shown in Fig. 3
for Series 2. It is clear that the use of seawater causes an
earlier strength gain. However, after a long exposure period,
no significant variation is observed. It is understood that
after a long-term of exposure, the compressive strength of
concrete is independent of the type of mixing water, such as
tap water and seawater.
The results of XRD analysis of concrete after 20 years of
exposure are listed in Table 2. The type of cement and
mixing water do not influence the contents of ettringite in
concrete. Friedel’s salt is observed in all samples. However,
it is not observed at the center of the specimens, especially
for slag cements. Calcium carbonate (generated from the
reaction of calcium hydroxide with dissolved carbon diox-
ide in seawater) is recognized in all cases. There is no sign
of indication that the seawater-mixed concrete is less dura-
ble than the tap water-mixed concrete.
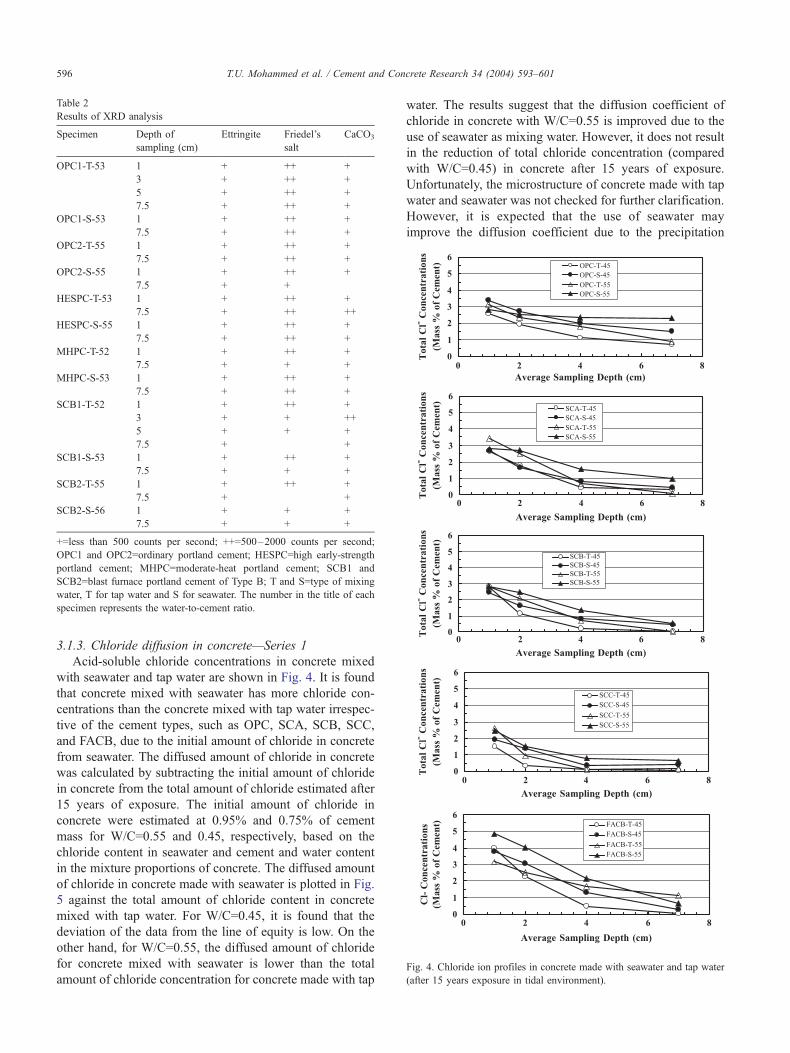
Fig. 4. Chloride ion profiles in concrete made with seawater and tap water
(after 15 years exposure in tidal environment).
Table 2
Results of XRD analysis
Specimen Depth of
sampling (cm)
Ettringite Friedel’s
salt
CaCO3
OPC1-T-53 1 + ++ +
3 + ++ +
5 + ++ +
7.5 + ++ +
OPC1-S-53 1 + ++ +
7.5 + ++ +
OPC2-T-55 1 + ++ +
7.5 + ++ +
OPC2-S-55 1 + ++ +
7.5 + +
HESPC-T-53 1 + ++ +
7.5 + ++ ++
HESPC-S-55 1 + ++ +
7.5 + ++ +
MHPC-T-52 1 + ++ +
7.5 + + +
MHPC-S-53 1 + ++ +
7.5 + ++ +
SCB1-T-52 1 + ++ +
3 + + ++
5 + + +
7.5 + +
SCB1-S-53 1 + ++ +
7.5 + + +
SCB2-T-55 1 + ++ +
7.5 + +
SCB2-S-56 1 + + +
7.5 + + +
+=less than 500 counts per second; ++=500–2000 counts per second;
OPC1 and OPC2=ordinary portland cement; HESPC=high early-strength
portland cement; MHPC=moderate-heat portland cement; SCB1 and
SCB2=blast furnace portland cement of Type B; T and S=type of mixing
water, T for tap water and S for seawater. The number in the title of each
specimen represents the water-to-cement ratio.
T.U. Mohammed et al. / Cement and Concrete Research 34 (2004) 593–601596
3.1.3. Chloride diffusion in concrete—Series 1
Acid-soluble chloride concentrations in concrete mixed
with seawater and tap water are shown in Fig. 4. It is found
that concrete mixed with seawater has more chloride con-
centrations than the concrete mixed with tap water irrespec-
tive of the cement types, such as OPC, SCA, SCB, SCC,
and FACB, due to the initial amount of chloride in concrete
from seawater. The diffused amount of chloride in concrete
was calculated by subtracting the initial amount of chloride
in concrete from the total amount of chloride estimated after
15 years of exposure. The initial amount of chloride in
concrete were estimated at 0.95% and 0.75% of cement
mass for W/C=0.55 and 0.45, respectively, based on the
chloride content in seawater and cement and water content
in the mixture proportions of concrete. The diffused amount
of chloride in concrete made with seawater is plotted in Fig.
5 against the total amount of chloride content in concrete
mixed with tap water. For W/C=0.45, it is found that the
deviation of the data from the line of equity is low. On the
other hand, for W/C=0.55, the diffused amount of chloride
for concrete mixed with seawater is lower than the total
amount of chloride concentration for concrete made with tap
water. The results suggest that the diffusion coefficient of
chloride in concrete with W/C=0.55 is improved due to the
use of seawater as mixing water. However, it does not result
in the reduction of total chloride concentration (compared
with W/C=0.45) in concrete after 15 years of exposure.
Unfortunately, the microstructure of concrete made with tap
water and seawater was not checked for further clarification.
However, it is expected that the use of seawater may
improve the diffusion coefficient due to the precipitation

Fig. 6. Schematic diagrams—initiation of corrosion (top) and progress of
corrosion (bottom).
Fig. 5. Chloride diffusion in concrete mixed with seawater and tap water
(after 15 years of exposure in the tidal environment).
T.U. Mohammed et al. / Cement and Concrete Research 34 (2004) 593–601 597
of calcium chloroaluminate compound (Friedel’s salt) as
well as the more ettringite in the pore system. The influence
is found to be significant for higher W/C.
Based on the abovementioned results, the total amount of
chloride concentrations, and the progress of corrosion of
steel bars in concrete with time are schematically represented
in Fig. 6 for concrete mixed with tap water and seawater
(especially for concrete with low water-to-cement ratio, such
as W/C=0.45, i.e., assuming the same diffusion coefficient
for tap water- and seawater-mixed concrete). It is assumed
that corrosion of steel bars in concrete will be started at a
particular time when the amount of chloride concentration
over the steel bar reaches or exceeds the chloride threshold
level. For tap water case, the time to initiate corrosion is
defined as tt-tw. The same for concrete mixed with seawater is
tt-sw without any consideration of voids at the steel–concrete
interface. Therefore, the initiation time of corrosion due to
the use of seawater will be earlier by a time period Dt=(tt-
tw�tt-sw) compared with the same in concrete made with tap
water. Based on the observations on the corrosion of steel
bars in concrete, it was observed that the presence of voids/
gaps at the steel concrete interface causes the formation of
corrosion pits. The size of voids can be varied from 100 Amto several millimeters. If there is a void at the steel–concrete
interface, the corrosion process may continue immediately
after placing concrete mixed with seawater or brackish water.
In such a situation, it can be judged that the initiation of
corrosion will be started at time t=0 (realistic consideration
or consideration of voids at the steel–concrete interface).
Therefore, the term tt-sw will become zero and finally Dt=tt-tw.
The value of tt-tw can be considered as a two-digit figure in
years based on the properties of concrete and the location of
steel bars in concrete. Of course, this figure will influence the
long-term durability of concrete structures. After initiation of
corrosion, the higher amount of chloride in concrete mixed
with seawater will also accelerate the corrosion rate and
finally will create deep corrosion pits earlier. It will result in
earlier repair works as schematically explained in Fig. 6.
In addition to the uncracked concrete, cracked concrete
specimens of size 100�100�600 mm made with seawater
and tap water were also investigated. Water soluble chloride
concentration in concrete at the cracked region for concrete
mixed with seawater and tap water are summarized in Table
3. A tendency of having more chloride at the cracked region
is observed for concrete mixed with seawater than the same
with tap water. It is important to note that in this investiga-

Table 3
Water soluble chloride concentrations in concrete at the cracked region
Specimens Crack widths (mm) Chloride concentrations
(mass% of cement)
(1) (2) (3) (1) (2) (3)
OPC-T-45 0.2 0.1 0.1 1.28 1.14 1.38
OPC-T-55 0.1 0.1 0.1 1.48 1.78 1.58
OPC-S-45 0.1 2.0 0.1 1.35 2.24 1.85
OPC-S-55 0.1 0.1 0.1 1.90 2.0 1.70
SCB-T-45 0.3 0.1 5.0 0.45 0.41 3.20
SCB-S-45 0.3 0.2 0.1 1.26 0.88 0.70
FACB-T-45 0.1 0.3 0.5 0.90 0.82 1.42
FACB-S-45 0.2 0.2 0.2 1.76 1.03 0.86
OPC=ordinary portland cement; SCA=slag cement of Type A; SCB=slag
cement of Type B; SCC=slag cement of Type C; FACB=ordinary portland
cement. T and S=type of mixing water, T for tap water and S for seawater.
The number in the title of each specimen represents the water-to-cement
ratio. (1), (2), and (3) are the individual specimens of each group.
T.U. Mohammed et al. / Cement and Concrete Research 34 (2004) 593–601598
tion, most of the cracks (crack widthsV0.5 mm) were healed
during the exposure in the tidal environment for 15 years.
These results are expected to explain separately in future.
More results on this investigation can be obtained in Ref. [4].
3.1.4. Physical evaluation of corrosion (pit numbers and
depths)—Series 1
After exposure in the tidal environment for 15 years
(Series 1), reinforced cylindrical concrete specimens were
split opened to check the steel bars (the length of the bar was
180 mm) located at 20, 40, and 70 mm of covered concrete
depths. The number of pits and pit depths over the steel bars
at the different cover depths are listed in Table 4 for different
Table 4
Pit numbers and depths over the steel bar at different concrete covers
Specimen Number of pits at
different cover depths
Pit depth (mm) at
different depths
20 mm 40 mm 70 mm 20 mm 40 mm 70 mm
OPC-T-45 6 2 0 1.5 1 –
OPC-T-55 10 5 0 1.5 1 –
OPC-S-45 15 4 0 2 1.5 –
OPC-S-55 15 3 3 1 1 1
SCA-T-45 3 0 0 1 – –
SCA-T-55 2 0 0 1 – –
SCA-S-45 10 0 0 1.5 – –
SCA-S-55 12 4 0 2 1.5 –
SCB-T-45 0 0 0 – – –
SCB-T-55 12 0 0 1 – –
SCB-S-45 5 1 0 1 1 –
SCB-S-55 1 2 0 1 1 –
SCC-T-45 0 0 0 – – –
SCC-T-55 7 0 0 1 – –
SCC-S-45 3 0 0 1.5 – –
SCC-S-55 5 0 0 1 – –
FACB-T-45 5 0 0 0.5 – –
FACB-T-55 16 6 0 1.5 1 –
FACB-S-45 11 4 0 1 1.5 –
FACB-S-55 11 6 0 1 1 –
The symbols are explained in Table 3. Pit depths less than 0.5 mm are not
counted.
mixing water and different types of cement. It is seen that the
use of seawater results in higher pit numbers and deeper pit
depths compared to the same with tap water. The voids at the
steel–concrete interface and the presence of chloride seem to
be the main reasons against the formation of corrosion pits.
If concrete is mixed with seawater, the corrosion process
may continue just after placing concrete. However, in the
case of tap water-mixed concrete, sometime will need to
penetrate the required chloride in concrete as explained with
some schematic diagram before. A typical case of corrosion
pit over the steel bars made with seawater is shown in Fig. 7.
Formation of deeper corrosion pit is commonly observed
over the steel bars in seawater-mixed concrete due to the
presence of void at the steel–concrete interface.
Lee et al. [8], based on the investigation of concrete
specimens after 35 years exposure in the marine environ-
ment, found that the top layer horizontal bars are more
corroded due to the blocking of bleeding water under the bar
after casting concrete. Yonezawa et al. [9] also concluded
that the formation of voids at the steel–concrete interface is
a necessary condition for active corrosion in concrete with
moderate chloride content. Similar observation was also
reported by Castel et al. [10] and Ohno et al. [11].
The depth of corrosion over the steel bars in cracked
concrete mixed with seawater and tap water is listed in Table
5. It is already noted that during the exposure for 15 years,
most of the cracks (crack width V0.5 mm) were healed
irrespective of the mixing water and cement types. The
healing is expected to cease or reduce the corrosion rate
significantly. The depth of corrosion at the uncracked
regions indicates that the use of seawater results in deeper
corrosion pits.
3.2. Concrete mixed with salt water
To explain the corrosion process of steel bars in concrete
mixed with seawater, the results of another investigation are
Fig. 7. Pit over the steel bar (concrete mixed with seawater).

Table 5
Maximum pit depths at cracked and uncracked regions
Specimens Crack width (mm) Maximum pit depths at cracked regions (mm) Maximum pit depths at uncracked regions (mm)
(1) (2) (3) (1) (2) (3) (1) (2) (3)
OPC-T-45 0.2 0.1 0.1 0.5 nil 0.5 1.0 0.5 1.5
OPC-T-55 0.1 0.1 0.1 0.5 nil nil 2.0 1.0 1.0
OPC-S-45 0.1 2 0.1 1.0 1.0 0.5 1.0 1.5 1.5
OPC-S-55 0.1 0.1 0.1 nil 1.5 nil 0.5 1.5 1.5
SCA-T-45 0.1 0.3 0.2 nil 0.5 nil nil 1.0 nil
SCB-T-45 0.3 0.1 5 0.5 nil 3.5a nil nil nil
SCB-S-45 0.3 0.2 0.1 nil nil nil nil nil 0.5
FACB-T-45 0.1 0.3 0.5 0.5 1.0 1.5 0.5 0.5 0.5
FACB-S-45 0.2 0.2 0.2 nil nil 0.5 0.5 nil 0.5
The symbols and names of specimens are explained in Table 3. The specimens of each case are defined as (1), (2), and (3).a Significant loss of area.
T.U. Mohammed et al. / Cement and Concrete Research 34 (2004) 593–601 599
quoted here. In this case, 10 kg/m3 of sodium chloride salt
was added with the mixing water to accelerate the process of
corrosion. Water-to-cement ratios were 0.5 and 0.7. Ordi-
Fig. 8. Macrocell formation amon
nary portland cement was used. Initial chloride contents
(total) in the mixture were estimated at 1.85% and 2.6% of
cement mass for W/C=0.5 and 0.7, respectively. Detail
g the steel bars in concrete.

Fig. 9. Photographs of top horizontal steel portions (top pair: W/C=0.5,
bottom pair: W/C=0.7).
T.U. Mohammed et al. / Cement and Concrete Research 34 (2004) 593–601600
mixture proportion and layout of the specimens can be
obtained in Ref. [6]. Based on the experimental results
explained in Ref. [6], the typical process of macro corrosion
cell formation is shown in Fig. 8. In this experimental setup,
the horizontal steel elements divided into top and bottom
halves and connected with epoxy like a sandwich. In
addition, the vertical steel elements were separated from
the horizontal steel bars. All steel elements were connected
electrically outside the specimens to measure the flow of
electrons generated by the corrosion reaction (macrocell
corrosion). Based on this experimental layout, it was also
able to measure polarization resistance over a specified steel
element (such as top or bottom halves) by isolating it from
other steel elements. The AC impedance method was
applied to measure polarization resistance. Microcell corro-
sion current density was calculated from the polarization
resistance data. Detailed experimental method can be
obtained in Ref. [6].
Differential plastic settlement of concrete against the
steel bars and blocking of bleeding water cause the
formation of gap under the horizontal steel bar. As a
result, from the viewpoint of macrocell corrosion, these
portions (with gap) act as anode (denoted as A in Fig. 8)
and coupled with the other steel portions (good interfacial
condition with concrete), i.e., the cathodes (denoted as C).
In addition, the microcell corrosion current density of the
location with gap at the steel–concrete interface was also
higher (such as the bottom part of the top horizontal steel
bar). These locations are subjected to a significant amount
of corrosion caused by the combination of macro- and
microcell corrosions. The vertical steel bars and top half
of horizontally oriented steel bars were not corroded at
all [6].
The condition of the horizontal steel bars (top and bottom
parts of the top-level horizontal steel bars) after 60 days of
casting concrete is shown in Fig. 9 for W/C=0.5 and 0.7.
The bottom half of the bar (HTB) is totally corroded due to
the presence of gap under bottom half, however the top half
(HTT) of the bar is not corroded at all. The macrocell
corrosion process can be explained as a DC battery cell with
anode (bottom part) and cathode (top part) electrically
connected in an electrolytic media of concrete.
Unfortunately, the same investigation on the specimens
mixed with seawater was not carried out. However, the same
process of corrosion as mentioned above can be expected for
the steel bars embedded in concrete mixed with seawater.
Immediately after casting concrete, the corrosion process is
expected to continue due to the presence of voids/gaps at the
steel–concrete interface. In Ref. [12], corrosion of steel bars
of 23-year-old concrete specimens exposed to tidal and
atmospheric environments was reported. It was noted that
the presence of gap under the steel bars caused the corrosion
of steel bar although the chloride concentration was negli-
gible (less than 0.1% of cement mass) for the atmospheric
exposure environment. Further investigation on the macro-
cell and microcell corrosion was conducted under 3.5%

T.U. Mohammed et al. / Cement and Concrete Research 34 (2004) 593–601 601
saltwater spray environment. The results were reported in
Ref. [13].
4. Conclusions
The following conclusions are drawn based on the scope
of this article:
� Seawater-mixed concrete shows earlier strength gain
compared to the tap water-mixed concrete. However,
after a long-term of exposure, no significant difference in
compressive strength is observed.� The initial amount of chloride (due to the use of
seawater) may cause the initiation of corrosion at the
locations of the steel bars having voids/gaps at the steel–
concrete interface immediately after casting concrete.� The use of seawater results in the formation of deeper
corrosion pits compared to the same with tap water.
References
[1] A. Neville, Seawater in the mixture, Concr. Int., (January 2001)
48–51.
[2] Standard Specification for Design and Construction of Concrete Struc-
tures, Part 2 (Construction), 1st ed., Japan Society of Civil Engineers,
Tokyo, Japan, 1986 (SP-2).
[3] T.U. Mohammed, T. Yamaji, A. Toshiyuki, H. Hamada, Marine
durability of 15-year old concrete specimens made with ordinary
Portland, slag and fly ash cement, ACI Spec. Publ. 199-30 2
(2001) 541–560.
[4] T.U. Mohammed, T. Yamaji, A. Toshiyuki, H. Hamada, Corrosion of
steel bars in cracked concrete made with ordinary Portland, slag and
fly ash cements, ACI Spec. Publ. 199-40 2 (2001) 699–718.
[5] T. Fukute, H. Hamada, A study on the durability of concrete exposed
in the marine environment for 20 years, Rep. Port Harb. Res. Inst. 31
(5) (1993) 251–272.
[6] T.U. Mohammed, N. Otsuki, M. Hisada, Corrosion of steel bars
with respect to orientation in concrete, ACI Mater. J. 96 (2) (1999)
154–159.
[7] T.U. Mohammed, T. Yamaji, H. Hamada, Chloride diffusion, micro-
structures and mineralogy of concrete after 15 years of exposure in the
tidal environment, ACI Mater. J. 99 (3) (2002) 256–263.
[8] S.K. Lee, D.V. Reddy, W.H. Hartt, M. Arockiasamy, E.F. O’Neil,
Marine concrete durability—condition survey of certain tensile crack
exposure beams at treat island, Maine, USA, ACI Spec. Publ. 145,
(1994) 371–388.
[9] T. Yonezawa, V. Ashworth, R.P.M. Procter, Pore solution composition
and chloride effects on the corrosion of steel in concrete, Corros. Eng.
44 (7) (July 1988) 489–499.
[10] A. Castel, R. Francois, G. Arliguie, Factors other than chloride level
influencing corrosion rate of reinforcement, ACI Spec. Publ. 192,
(2000) 629–644.
[11] Y. Ohno, K. Suzuki, S. Praparntanatorn, Macrocell corrosion of steel
in uncracked concrete, in: R.N. Swamy (Ed.), Corrosion and Corro-
sion Protection of Steel in Concrete, International Conference, July
24–29. Sheffield Academic Press, Sheffield, UK, 1994, pp. 224–235.
[12] T.U. Mohammed, N. Otsuki, M. Hisada, H. Hamada, Marine durabil-
ity of 23-year old reinforced concrete beams, ACI Spec. Publ. 192-65,
(2000) 1071–1088.
[13] T.U. Mohammed, N. Otsuki, H. Hamada, Y. Toru, Chloride-induced
corrosion of steel bars in concrete with the presence of gap at the
steel–concrete interface, ACI Mater. J. 99 (2) (2002) 149–156.
Related Documents