Performance of North American Bioreactor Landfills. II: Chemical and Biological Characteristics Morton A. Barlaz 1 ; Christopher A. Bareither 2 ; Azam Hossain 3 ; Jovita Saquing 4 ; Isabella Mezzari 5 ; Craig H. Benson 6 ; Thabet M. Tolaymat 7 ; and Ramin Yazdani 8 Abstract: The objective of this research was to examine the performance of five North American bioreactor landfills. This paper represents the second of a two-part series and addresses biological and chemical aspects of bioreactor performance including gas production and management, and leachate chemistry. The data support accelerated methane generation at several landfills k =0.08–0.21 1 / year relative to the AP-42 default decay rate k =0.04 1 / year. While the data indicate that gas collection increases at bioreactor landfills, a general relationship between decay rate and moisture added or wet weight water content could not be identified. There was no indication that gas collection increases appreciably when the water content reaches 40%. Most of the leachates at the landfills in this study were commingled from cells operating as a bioreactor and conventionally. Nevertheless, trends in pH and BOD:COD in the bioreactor leachates were consistent with the impacts of enhanced biological activity. Ammonia concentrations also increased over time but remained below levels reported to be inhibitory. For both heavy metals and speciated organic chemicals, there was no indication that bioreactor landfill leachate is significantly different from leachate generated at conventional landfills. DOI: 10.1061/ASCEEE.1943-7870.0000220 CE Database subject headings: Landfills; Reactors; Solid wastes; Methane; Chemical treatment; Biological processes. Author keywords: Landfills; Bioreactor; Solid waste; Leachate quality; Methane. Introduction This paper represents the second of a two part series to examine the performance of bioreactor landfills in North America. Numer- ous advantages are attributed to the operation of a landfill as a bioreactor including accelerated biological decomposition that leads to 1 more rapid settlement that ultimately reduces land requirements for waste disposal and 2 higher rates of gas pro- duction that improve the feasibility of recovering the gas for ben- eficial use. Bioreactor landfills also provide for in situ leachate treatment as degradable organic matter in the leachate is con- sumed within the waste mass. Finally, the enhanced rate of de- composition may reduce the time and intensity of postclosure monitoring and maintenance. The objective of this research was to evaluate monitoring data from five North American landfills that are operated as bioreac- tors to determine the extent to which the data support the advan- tages described above. For this study, a landfill was considered to be operated as a bioreactor if specific design features had been incorporated to facilitate leachate recirculation, and there was a concerted effort to operate the landfill to accelerate decomposi- tion. The companion paper Bareither et al. 2010 focuses on physi- cal characteristics including landfill hydrology and settlement. This paper addresses biological and chemical aspects of bioreac- tor performance, including the collection and management of landfill gas LFG, as well as leachate chemistry. Following a brief description of the study sites, this paper examines methane recovery data, followed by an analysis of leachate chemistry in- cluding the biological oxygen demand BOD, chemical oxygen demand COD, pH, and ammonia as well as metals and speciated organic compounds. Site Descriptions The five landfills studied and the criteria by which they were selected are described in the accompanying manuscript Bareither 1 Professor, Dept. of Civil, Construction, and Environmental Engineer- ing, North Carolina State Univ., Raleigh, NC 27695. E-mail: barlaz@eos. ncsu.edu 2 Graduate Research Assistant, Geological Engineering, Univ. of Wisconsin–Madison, Madison, WI 53706 corresponding author. E-mail: [email protected] 3 Graduate Research Assistant, Dept. of Civil and Environmental En- gineering, North Carolina State Univ., Raleigh, NC 27695. E-mail: [email protected] 4 Graduate Research Assistant, Dept. of Civil and Environmental En- gineering, North Carolina State Univ., Raleigh, NC 27695. E-mail: [email protected] 5 Graduate Research Assistant, Dept. of Civil and Environmental En- gineering, North Carolina State Univ., Raleigh, NC 27695. E-mail: [email protected] 6 Wisconsin Distinguished Professor and Chair of Geological Engi- neering, Univ. of Wisconsin–Madison, Madison, WI 53706. E-mail: [email protected] 7 Engineer, Office of Research and Development, National Risk Man- agement Laboratory, U.S. Environmental Protection Agency, Cincinnati, OH 45268. E-mail: [email protected] 8 Senior Civil Engineer, Yolo County Planning and Dept. of Public Works, Div. of Integrated Waste Management, Woodland, CA, 95776. E-mail: [email protected] Note. This manuscript was submitted on March 9, 2009; approved on December 29, 2009; published online on July 15, 2010. Discussion period open until January 1, 2011; separate discussions must be submitted for individual papers. This paper is part of the Journal of Environmental Engineering, Vol. 136, No. 8, August 1, 2010. ©ASCE, ISSN 0733- 9372/2010/8-839–853/$25.00. JOURNAL OF ENVIRONMENTAL ENGINEERING © ASCE / AUGUST 2010 / 839 Downloaded 11 Jul 2011 to 193.146.160.101. Redistribution subject to ASCE license or copyright. Visit http://www.ascelibrary.org

Welcome message from author
This document is posted to help you gain knowledge. Please leave a comment to let me know what you think about it! Share it to your friends and learn new things together.
Transcript
Performance of North American Bioreactor Landfills.II: Chemical and Biological Characteristics
Morton A. Barlaz1; Christopher A. Bareither2; Azam Hossain3; Jovita Saquing4; Isabella Mezzari5;Craig H. Benson6; Thabet M. Tolaymat7; and Ramin Yazdani8
Abstract: The objective of this research was to examine the performance of five North American bioreactor landfills. This paperrepresents the second of a two-part series and addresses biological and chemical aspects of bioreactor performance including gasproduction and management, and leachate chemistry. The data support accelerated methane generation at several landfills �k=0.08–0.21 1 /year� relative to the AP-42 default decay rate �k=0.04 1 /year�. While the data indicate that gas collection increases atbioreactor landfills, a general relationship between decay rate and moisture added or wet weight water content could not be identified.There was no indication that gas collection increases appreciably when the water content reaches 40%. Most of the leachates at thelandfills in this study were commingled from cells operating as a bioreactor and conventionally. Nevertheless, trends in pH and BOD:CODin the bioreactor leachates were consistent with the impacts of enhanced biological activity. Ammonia concentrations also increased overtime but remained below levels reported to be inhibitory. For both heavy metals and speciated organic chemicals, there was no indicationthat bioreactor landfill leachate is significantly different from leachate generated at conventional landfills.
DOI: 10.1061/�ASCE�EE.1943-7870.0000220
CE Database subject headings: Landfills; Reactors; Solid wastes; Methane; Chemical treatment; Biological processes.
Author keywords: Landfills; Bioreactor; Solid waste; Leachate quality; Methane.
Introduction
This paper represents the second of a two part series to examinethe performance of bioreactor landfills in North America. Numer-ous advantages are attributed to the operation of a landfill as a
1Professor, Dept. of Civil, Construction, and Environmental Engineer-ing, North Carolina State Univ., Raleigh, NC 27695. E-mail: [email protected]
2Graduate Research Assistant, Geological Engineering, Univ. ofWisconsin–Madison, Madison, WI 53706 �corresponding author�. E-mail:[email protected]
3Graduate Research Assistant, Dept. of Civil and Environmental En-gineering, North Carolina State Univ., Raleigh, NC 27695. E-mail:[email protected]
4Graduate Research Assistant, Dept. of Civil and Environmental En-gineering, North Carolina State Univ., Raleigh, NC 27695. E-mail:[email protected]
5Graduate Research Assistant, Dept. of Civil and Environmental En-gineering, North Carolina State Univ., Raleigh, NC 27695. E-mail:[email protected]
6Wisconsin Distinguished Professor and Chair of Geological Engi-neering, Univ. of Wisconsin–Madison, Madison, WI 53706. E-mail:[email protected]
7Engineer, Office of Research and Development, National Risk Man-agement Laboratory, U.S. Environmental Protection Agency, Cincinnati,OH 45268. E-mail: [email protected]
8Senior Civil Engineer, Yolo County Planning and Dept. of PublicWorks, Div. of Integrated Waste Management, Woodland, CA, 95776.E-mail: [email protected]
Note. This manuscript was submitted on March 9, 2009; approved onDecember 29, 2009; published online on July 15, 2010. Discussion periodopen until January 1, 2011; separate discussions must be submitted forindividual papers. This paper is part of the Journal of EnvironmentalEngineering, Vol. 136, No. 8, August 1, 2010. ©ASCE, ISSN 0733-
9372/2010/8-839–853/$25.00.JOURNAL O
Downloaded 11 Jul 2011 to 193.146.160.101. Redistrib
bioreactor including accelerated biological decomposition thatleads to �1� more rapid settlement that ultimately reduces landrequirements for waste disposal and �2� higher rates of gas pro-duction that improve the feasibility of recovering the gas for ben-eficial use. Bioreactor landfills also provide for in situ leachatetreatment as degradable organic matter in the leachate is con-sumed within the waste mass. Finally, the enhanced rate of de-composition may reduce the time and intensity of postclosuremonitoring and maintenance.
The objective of this research was to evaluate monitoring datafrom five North American landfills that are operated as bioreac-tors to determine the extent to which the data support the advan-tages described above. For this study, a landfill was considered tobe operated as a bioreactor if specific design features had beenincorporated to facilitate leachate recirculation, and there was aconcerted effort to operate the landfill to accelerate decomposi-tion.
The companion paper �Bareither et al. 2010� focuses on physi-cal characteristics including landfill hydrology and settlement.This paper addresses biological and chemical aspects of bioreac-tor performance, including the collection and management oflandfill gas �LFG�, as well as leachate chemistry. Following abrief description of the study sites, this paper examines methanerecovery data, followed by an analysis of leachate chemistry in-cluding the biological oxygen demand �BOD�, chemical oxygendemand �COD�, pH, and ammonia as well as metals and speciatedorganic compounds.
Site Descriptions
The five landfills studied and the criteria by which they were
selected are described in the accompanying manuscript �BareitherF ENVIRONMENTAL ENGINEERING © ASCE / AUGUST 2010 / 839
ution subject to ASCE license or copyright. Visithttp://www.ascelibrary.org
et al. 2010�. Briefly, the landfills include two in the mid-Atlanticregion �M and D�, one each in central and western Pennsylvania�G and L� and one in the west �Y�. The five include three publicentities and two private sector landfills. The area of each landfillthat was operated as a bioreactor varied from 1.4 to 40 ha.
Methane Generation
Data Analysis
Gas collection data from each landfill were analyzed to evaluatewhether there is evidence to quantify the extent to which methanegeneration is accelerated in bioreactor landfills relative to conven-tional landfills. Methane recovery is typically modeled using theU.S. EPA’s LandGem model �U.S. EPA 2005�
Qn = kLo�i=0
n
�j=0.0
0.9Mi
10e−k·ti,j �1�
where Qn=CH4 collection rate �m3-CH4 /year� in year n; Mi
=mass of waste accepted �Mg� in year i; L0=ultimate methaneyield �m3-CH4 /Mg�; k=decay rate �1/year�; j=deci-year time in-crement; and t=time �year�. AP-42 default values for k and L0 forconventional landfills are 0.04 1/year and 100 m3-CH4 /year�U.S. EPA 1998�.
Data Analysis Methodology
The decay rate in Eq. �1� was estimated from gas collection datafor Landfills D, G, and Y but not for Landfills L and M, where gascollection data were not measured separately in sections of thelandfill operated as a bioreactor. Decay rate optimizations forLandfills D and G were executed in EXCEL using the Solverfunction. Historic waste filling data were input into the LandGEMmodel for individual cells at D and G. LandGEM was modified topredict methane recovery rates that corresponded to the identicalelapsed times as were recorded for the physical methane collec-tion measurements. All recorded methane collection data wereused in the optimization procedures, except in the expansion cellat G. In this case, the decay rate was optimized for the datarecorded following installation of 14 additional gas wells as dis-cussed below. Two constraints were used in the optimization pro-cedure, both incorporating the residuals of the methane recoverydata �i.e., predicted less measured�. The primary constraint in-volved varying the decay rate for a given L0, such that the sum ofsquared residuals was minimized. The secondary constraintforced the sum of residuals to zero so to limit bias in the optimi-zation procedure.
The gas data for landfill Y were unique as the cells were filledand covered quickly so that most of the gas produced was col-lected and the mass of refuse did not change once gas collectionbegan. This allowed for a more thorough analysis of decay rate.Cumulative collectable methane can be calculated from Eq. �2�which is the integrated form of Eq. �1�
V = LoM�1 − e−kt� �2�
where V=cumulative CH4 collected from beginning of life totime t �m3�; M =initial mass of refuse �Mg�; and other terms areas in Eq. �1�. Eq. �2� can be arranged as in Eq. �3�, where thenumerator on the right side is the remaining methane potential at
time t840 / JOURNAL OF ENVIRONMENTAL ENGINEERING © ASCE / AUGUST
Downloaded 11 Jul 2011 to 193.146.160.101. Redistrib
− kt = ln�Lo − V/MLo
� �3�
The decay rate is then calculated by linear regression at an as-sumed L0 and the measured V.
To estimate k based on methane collection that occurred afterthe onset of recirculation, some adjustments to the data fromLandfill Y were required. L0 was reduced by the volume of gasestimated to have been produced prior to initiation of gas collec-tion �Vuc� and for the volume of gas produced prior to the initia-tion of recirculation �Vdry�. Vuc was estimated using Eq. �1� withk=0.04 1 /year and several different values of L0 as presentedwith the results, while Vdry was measured. All decay rate optimi-zations were performed at the AP-42 default of 100 m3-CH4 /Mgto reflect regulatory considerations, as well as at 59 m3-CH4 /Mgwhich was estimated from published data on the composition ofwaste discarded in landfills �Staley and Barlaz 2009�.
Results of Decay Rate Analysis
Landfill DThe LFG extraction system at Landfill D consisted of either per-forated vertical wells �Areas C, D� or combined horizontal gascollection/leachate injection trenches �Areas C/D valley, E�. Gasextraction flows were recorded daily using meters at each cell, aswell as with a flow meter located at the flare station. The gas flowfrom each cell was scaled to match the total flow at the flare,which resulted in an average correction of 16.6%. The final coverconsisted of either clay or an exposed geomembrane, except forCell E, which was still active and did not have a final cover.
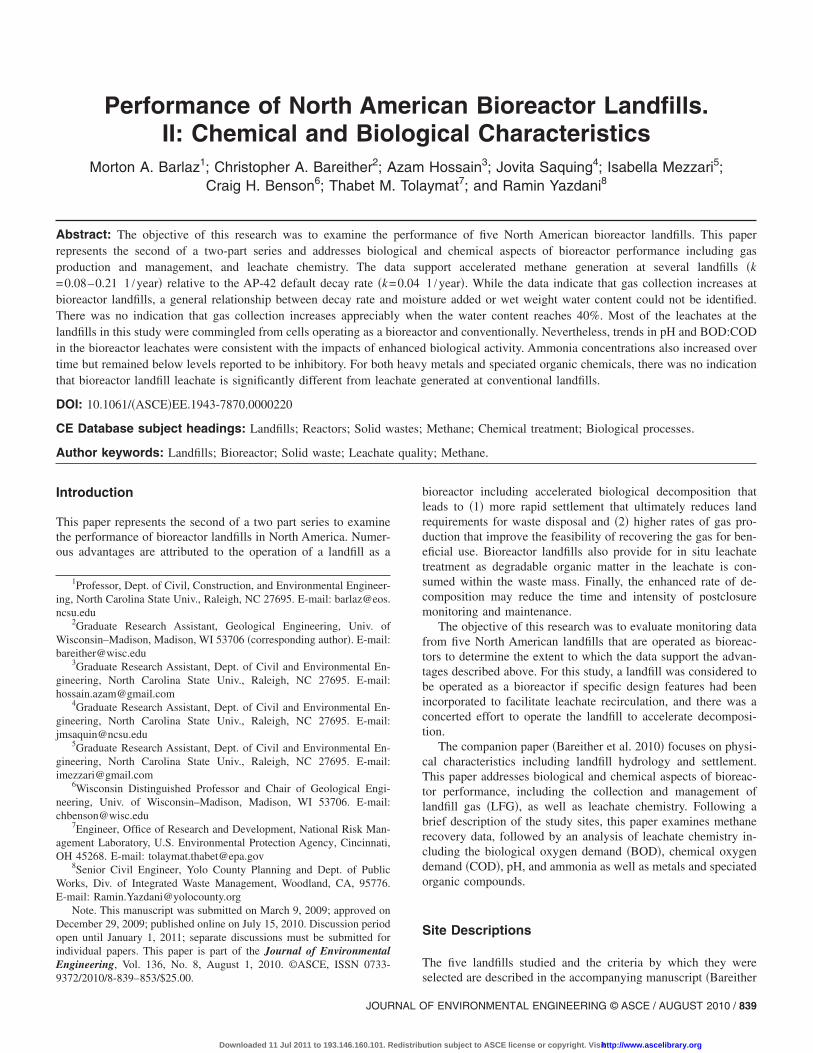
Although active gas extraction began at Landfill D in August1996, LFG collection rates were only measured from individualcells after November 2003. Measured methane collection rates forall cells are presented in Fig. 1. Data are presented as a functionof elapsed time after first waste placement to provide a parameterthat is more specific than the calendar year, but does not requireestimates of waste age as such estimates would increase uncer-tainty in subsequent interpretation. The performance of Cell A/Bhas been described elsewhere �Morris et al. 2003� and was in-cluded in Fig. 1 to illustrate gas generation from relatively old
0
5
10
15
20
25
30
35
0 5 10 15 20 25 30
A/BCDC/DE
MethaneFlow
Rate(m
3 -CH4/Mg/yr)
Elapsed Time (yr)
Fig. 1. Methane flow rate for the five cells at Landfill D
refuse.
2010
ution subject to ASCE license or copyright. Visithttp://www.ascelibrary.org

and d
Estimates of decay rate for each cell are summarized in Table1. In all cases, the estimated decay rate at L0 of 100 m3-CH4 /Mgexceeds the AP-42 default value of 0.04 1/year. The decay rate forArea E is lowest, possibly because this is an active cell and thegas collection efficiency varied with time as new collectiontrenches were activated. In addition, Area E has received lessliquid than the other cells �Table 1�. Relationships between decayrate, L0, and liquid addition are discussed below.
Landfill YThe gas collection system at Landfill Y included both horizontaltrenches and vertical wells. For the NE cell, horizontal collectionlines were installed between each of the four waste lifts and di-rectly under the reinforced polypropylene geomembrane cover.For the W cell, horizontal collection lines were installed betweenLifts 2 and 3, Lifts 3 and 4, and on top of Lift 4. There has beensome flooding of the horizontal trenches, and most of the gas hasbeen collected from vertical wells and the permeable layer at thetop.
Methane collection rates for Landfill Y are presented in Fig. 2and decay rates are summarized in Tables 1 and 2. As for LandfillD, decay rates for Landfill Y are greater than the AP-42 default. Inall cases, Vuc+Vdry was less than 5% of the assumed L0, suggest-ing that the analysis was not highly sensitive to the estimate ofVuc. The higher decay rate in the NE cell is consistent with thehigher normalized liquid addition relative to the W cell.
Landfill GSeparate gas collection data were available for the original andexpansion cells that were operated from 1986 to 2003 and 2000 tothe present, respectively �Fig. 3�. Gas was collected from verticalwells only in the original cell and from both horizontal trenchesand vertical wells in the expansion cell. The same trenches areused for leachate injection, and gas is only collected after thetrenches have drained. The sharp increase in gas collection fol-lowing Year 6 in the expansion landfill �Fig. 3� is concurrent withthe installation of 14 additional gas wells and the decay rate wasestimated based on the data after installation of these wells. In theoriginal landfill, the methane collection rate began to decrease
Table 1. First-Order Decay Rates, Area of Individual Cells, and Liquid
Landfill Cell
First-orderdecay rate�1/year�a
Area ofcell�m2�
Total liquadded t
waste�L�b
D A/B 0.14 �0.09� 110,100 81,804,0
C 0.17 �0.08� 78,500 15,645,7
D 0.12 �0.12� 91,100 15,430,6
C/D 0.15 �0.15� —e 7,897,4
E 0.08 �0.17� 131,600 13,803,4
G Original 0.05 �0.11� 306,556 19,080,7
Expansion 0.09 �0.22� 306,758 505,220,5
Y NE 0.15 �0.35� 14,200 26,987,0
W 0.09 �0.17� 24,300 26,527,8aFirst value was calculated at L0=100 m3-CH4 /Mg and the value at L0=bTotal liquid added includes all methods of recirculated leachate �i.e., wLandfill Y.cLiquid added per mass of waste affected for recirculation in horizontal tdComputations based on water balance for Landfills D and Y; physical weArea of Cell C/D could not be determined since this cell sits in a valley
approximately 6 months after the cessation of refuse burial. As
JOURNAL O
Downloaded 11 Jul 2011 to 193.146.160.101. Redistrib
presented in Table 1, the estimated decay rates for the original andexpansion areas are above 0.04 1/year. The higher decay rate inthe expansion area is consistent with the higher recirculation rate.
Summary of Methane Generation Rate Data
A summary of the estimated decay rates for each landfill as wellas information on the cell area and quantity of liquid added to therefuse are presented in Table 1. The results support the supposi-tion that refuse decomposition can be accelerated at full-scalelandfills that are operated as bioreactors, as the estimated first-order decay rates are all greater than the AP-42 default of 0.041/year. This contrasts with an earlier study in which the gas datawere not sufficient to document enhanced decomposition at fourof five bioreactor landfills �Benson et al. 2007�.
Decay rates were calculated at multiple L0s to emphasize thesensitivity of the estimated decay rate to the assumed L0 as well
n for the Study Sites
Mass ofwaste�Mg�
Liquidadded/landfill
area�L /m2 or mm�
Liquidadded/Mg-MSW
�L/Mg�c
Watercontent�%�d
642,050 743 127 61
15,645,735 199 28 33
515,193 169 30 44
109,769 — 72 �204� 44
1,001,455 105 14 �76� 51
5,302,531 62 4 42
6,970,213 1,647 72 �195� 49
69,240 1,900 383 �419� 31
176,240 1,092 151 �264� 27
-CH4 /Mg is given parenthetically.
nch, pond, and surface application�, as well as supplemental liquids for
s is given parenthetically �see companion paper�.
ntent analysis for Landfill G.
oes not have a defined base area.
0
5
10
15
20
0 1 2 3 4 5 6
NEW
MethaneFlow
Rate(m
3 -CH4/Mg/yr)
Elapsed Time (yr)
Fig. 2. Methane flow rate for the NE and W cells at Landfill Y
Additio
ido
72
35
01
61
45
32
20
75
10
59 m3
ell, tre
renche
ater co
F ENVIRONMENTAL ENGINEERING © ASCE / AUGUST 2010 / 841
ution subject to ASCE license or copyright. Visithttp://www.ascelibrary.org

ilar to
as the uncertainty in L0 �Tables 1 and 2�. The decay rate calcu-lated at L0=100 m3-CH4 /Mg is significant from a regulatory per-spective as this is the AP-42 default. Recognizing that most field-scale gas collection data are confounded by temporally varyinggas collection efficiency is important. This alone adds some un-certainty to the estimated decay rate. The AP-42 defaults to whichthe results in this study were compared were developed from gascollection data at landfills that were believed to have high collec-tion efficiencies. Nonetheless, the actual gas collection efficiencyis unknown and likely varied between the landfills used to con-struct the AP-42 database and the landfills evaluated in this study.Given the inherent uncertainties in gas modeling, small differ-ences in k between landfills probably are not significant.
Relationships between k and the ratio of liquid added per massof waste, ratio of liquid added per landfill area, and the averagewet weight moisture content at Landfills D, G, and Y are pre-sented in Fig. 4. The data show a modest trend of increasing kwith increasing liquid addition on a gross waste mass �Fig. 4�a��and gross area �Fig. 4�b�� basis. In both Figs. 4�a and b�, the slopeis only significantly different from zero �p�0.05� for the decayrates calculated at L0=59 m3-CH4 /Mg. Even so, the coefficientsof determination �R2� are low, and the data are insufficient topropose a general trend. There is no apparent relationship be-tween k and wet weight water content �Fig. 4�c��.
The absence of a trend between k and water content is likelydue to the difficultly in estimating the water content via waterbalance computations, and the variability in physical water con-tent measurements from excavated solids. In water balance com-
Table 2. Estimates of Decay Rate �k� for Different Values of Lo at Land
L0 descriptionAssumed
L0 �m3-CH4 /M
AP-42 default 100
120% of AP-42 default 120
80% of AP-42 default 80
Measured from Landfill Y pilot bioreactor cella 88aPilot cell was operated in the mid-1990s and the waste received was sim
0
2
4
6
8
10
0 5 10 15 20 25
OriginalExpansion
MethaneFlow
Rate(m
3 -CH4/Mg/yr)
Elapsed Time (yr)
New gas wellinstallation
Cessation ofrefuse burial
Fig. 3. Methane flow rate for the original and expansion cells atLandfill G
842 / JOURNAL OF ENVIRONMENTAL ENGINEERING © ASCE / AUGUST
Downloaded 11 Jul 2011 to 193.146.160.101. Redistrib
putations, assumptions of initial water content, runoff versusinfiltration, and infiltration from precipitation after capping can alllead to errors in the estimated water content. When the watercontent is measured from refuse samples, the heterogeneity ofwater content in the varying material fractions of waste �Hull etal. 2005�, as well as uneven wetting due to channelized flow, canlead to a wide range of water contents over the lateral and verticaldimensions of a landfill �see companion paper�. Moreover, whenwater is added via trenches or wells, the moisture content of therefuse varies with distance from the point of application, whereas
NE cell W cell
Vuc /M�m3 /Mg�
k�1/year�
Vuc /M�m3 /Mg�
k�1/year�
2.8 0.15 1.9 0.09
3.4 0.12 2.3 0.07
2.2 0.21 1.5 0.12
2.5 0.18 1.7 0.11
that in the W and NE cells �Yazdani et al. 2006�.
Landfill D Landfill G Landfill Y
0.0
0.1
0.2
0.3
0.4
0 50 100 150 200 250 300 350 400First-OrderDecayRate-k(1/yr)
Liquid Added/Waste Mass (L/Mg)
L0= 59 m3-CH
4/Mg
R2 = 0.65
L0= 100 m3-CH
4/Mg
R2 = 0.13 (a)
0.0
0.1
0.2
0.3
0.4
0 500 1000 1500 2000First-OrderDecayRate-k(1/yr)
Liquid Added/Landfill Area (L/m2 or mm)
L0= 59 m3-CH
4/Mg
R2 = 0.66L0= 100 m3-CH
4/Mg
R2 = 0.04
(b)
0.0
0.1
0.2
0.3
0.4
20 30 40 50 60 70First-OrderDecayRate-k(1/yr)
Wet Weight Water Content (%)
L0= 59 m3-CH
4/Mg
R2 = 0.11L0= 100 m3-CH
4/Mg
R2 = 0.002
(c)
Fig. 4. Relationship between first-order decay rate and �a� liquidadded per mass of waste; �b� liquid added per landfill area; and �c�wet weight water content for individual cells at Landfills D, G, and Y.Data points represent individual cells at each landfill. The open andclosed symbols represent L0=100 and L0=59 m3-CH4 /Mg, respec-tively. The slope is only significantly different from zero for L0=59 in�a� and �b�.
fill Y
g�
2010
ution subject to ASCE license or copyright. Visithttp://www.ascelibrary.org
the calculated moisture content used in Fig. 4�c� represents evendistribution. As demonstrated in the companion manuscript, evena bioreactor cell likely has refuse at varying moisture contents.Interestingly, U.S. regulations impose gas collection requirementsbased on the time at which a bioreactor landfill reaches a watercontent of 40% �U.S. EPA 2003�. Given that the trends in Fig. 4are modest to nonexistent, other metrics might be more appropri-ate.
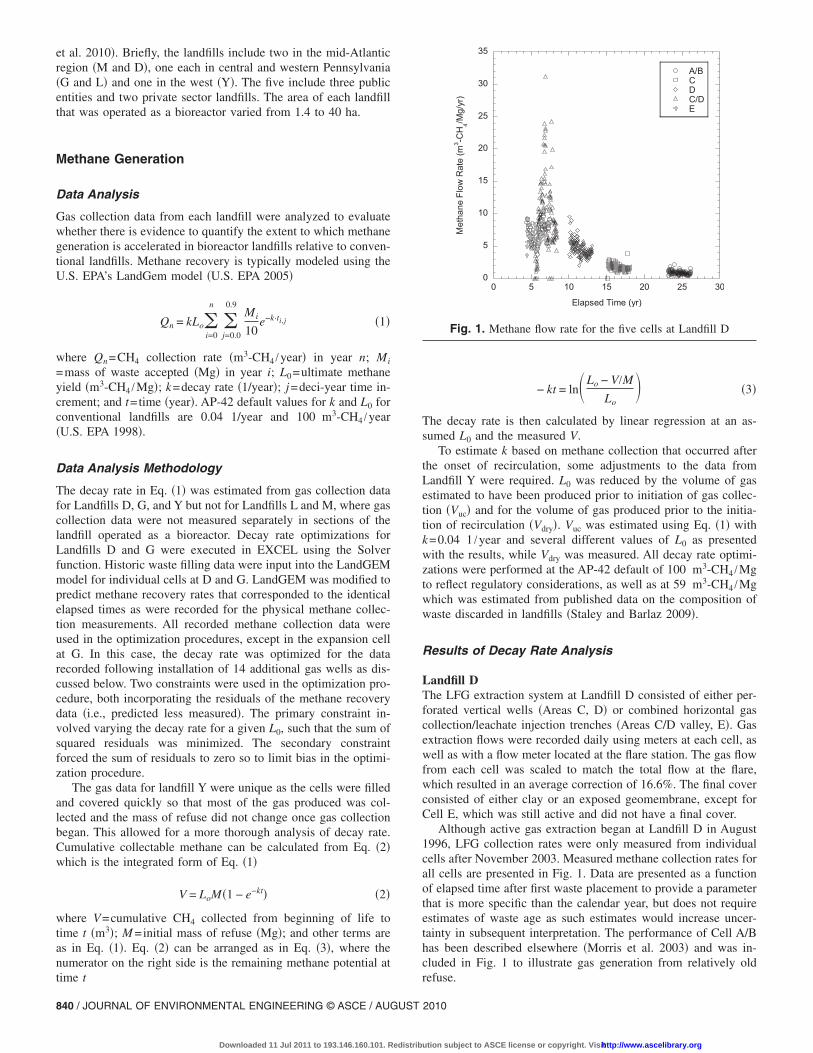
An additional analysis was conducted for landfills whereleachate was recirculated in horizontal trenches. For this analysis,the liquid added per unit mass of waste was computed as de-scribed in the companion paper using the wetted areas in Haydarand Khire �2005�. These wetted areas represent the cross-sectional area of waste that is wetted during leachate injection inhorizontal trenches, and were derived from numerical simulationsin HYDRUS-2D. The relationships in Fig. 5 have a more well-defined trend and less scatter than those in Fig. 4. This is mostlikely due to more accurate estimates of the waste wetted by thetrench and the more uniform application of moisture in a landfilldeliberately constructed for leachate recirculation. However, theslope at L0=59 m3-CH4 /Mg in Fig. 5 is only significant at p=0.11, which is due in part to the small number of data points.Interestingly, in no case was a relationship significant at L0
=100 m3-CH4 /Mg.The range of decay rates estimated in this study is lower than
the rate of 0.3 1/year suggested in Faour et al. �2007�, which isapplicable only to optimum conditions in cells operated as biore-actors from the start. However, there are numerous differencesbetween this study and Faour et al. �2007�, including the range ofdata sets used, the aggregation of data from multiple landfills, theallowance of a lag phase, and model fits in which both k and L0
were allowed to vary in Faour et al. �2007�. For full-scale landfillsthat received waste over many years, a condition present at Land-fills D and G, Faour et al. �2007� estimated decay rates between0.11 and 0.21 1/year, which is comparable to, but somewhathigher than the k estimated for Landfills D �0.08–0.17� and G�0.05–0.09� using L0=100 m3-CH4 /Mg. Recently, Tolaymat et
0.00
0.05
0.10
0.15
0.20
0.25
0.30
0.35
0.40
50 100 150 200 250 300 350 400 450
Landfill DLandfill GLandfill Y
First-OrderDecayRate-k(1/yr)
Liquid Added/Waste Mass Affected (L/Mg)
L0= 59 m3-CH
4/Mg
R2 = 0.63
L0= 100 m3-CH
4/Mg
R2 = 0.38
Open - L0= 100 m3-CH
4/Mg
Closed - L0= 59 m3-CH
4/Mg
Fig. 5. Relationship between first-order decay rate and liquid addedper mass of waste affected in horizontal recirculation trenches forthose landfill cells with horizontal trenches installed during wastefilling. Data points represent individual cells at each landfill. Theregression at L0=59 is only significant at the 89% confidence level.
al. �2010� estimated decay rates for the Outer Loop, Kentucky
JOURNAL O
Downloaded 11 Jul 2011 to 193.146.160.101. Redistrib
bioreactor of 0.11 1/year for a site specific L0
=54.8 m3-CH4 /Mg. Given the numerous variables affecting gascollection, such variation between studies is expected.
Leachate Quality
Leachate composition is the most common mechanism for moni-toring a landfill. The analysis presented here includes bulk param-eters �pH, COD, BOD, NH3–N�, selected heavy metals, andselected trace organic chemicals. The bulk parameters are ana-lyzed first, followed by analysis of heavy metals and speciatedorganics.
Landfill M
Leachate from the bioreactor and control areas at Landfill M wascollected separately. Nonetheless, direct comparisons of leachatequality are inappropriate because �1� the waste ages are differentas refuse burial in the bioreactor cell was completed in August1995, 42 months before the control cell and �2� leachate from theentire landfill was stored in a leachate tank and then recirculatedto the bioreactor. Thus, the 10.7-ha bioreactor received an inputstream that reflects leachate quality from the 164-ha landfill.
There were no apparent trends with time for BOD:COD, pH,and NH3–N concentrations and averages are presented in Table 3.The average BOD:COD in the bioreactor cell was less than in thecontrol cell �p�0.05�, and the leachate tank also exhibited a rela-tively low BOD:COD even though leachate collected from newercells, where higher BOD:COD would be expected, was includedin the tank. The pH was above 6.7 in both cells and the leachatetank throughout the monitoring period. pH in the control cell wassignificantly higher �p�0.05� than in the bioreactor cell, whichmay be a result of the significantly higher NH3–N concentrationin the control cell leachate relative to the bioreactor cell.
Although the data neither support nor refute the hypothesisthat BOD:COD stabilizes more rapidly in bioreactor cells, thedata do support the hypothesis that biodegradable organic mattercan be degraded in situ in a bioreactor landfill. A low BOD:CODwas maintained in the bioreactor leachate despite the dosing withleachate from the entire landfill.
Landfill L
Leachate from the entire landfill �18.6 ha� is collected in a tank atLandfill L and then recirculated in Area C �8.1 ha�, which hasreceived leachate via trenches and surface application since 2001.Leachate data are available for two cells in Area C and a tank thatreceives leachate from the entire landfill. Leachate recirculationwas interrupted from April 2004 to January 2005 to facilitateinstallation of a final cover on some slopes in Area C.
The pH in Area C increased from about 6 in 1996 to about 7prior to the initiation of recirculation in 2001, and varied between6.5 and 7.8 with no apparent trend until 2005, when the pH beganto decrease �Fig. 6�a��. The leachate tank pH has been consis-tently higher than the bioreactor cell leachate, suggesting the con-tributions of more basic pH from older parts of the landfill. Thecloser agreement of the tank and bioreactor leachate pH since2003 likely reflects the reduced leachate contributions from otherparts of the landfill. BOD was not measured so BOD:COD cannotbe considered. Average COD concentrations for the leachate tankand Area C are presented in Table 3.
Ammonia concentrations �Fig. 6�b�� appear to be increasing,
F ENVIRONMENTAL ENGINEERING © ASCE / AUGUST 2010 / 843
ution subject to ASCE license or copyright. Visithttp://www.ascelibrary.org
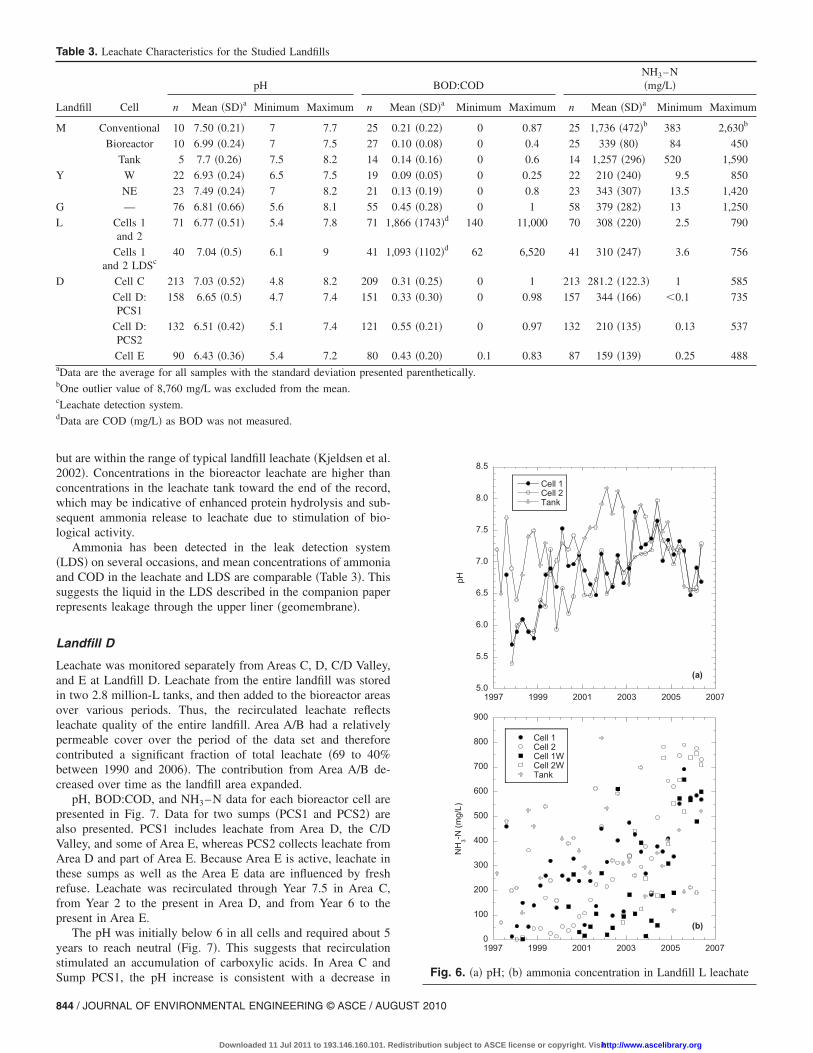
but are within the range of typical landfill leachate �Kjeldsen et al.2002�. Concentrations in the bioreactor leachate are higher thanconcentrations in the leachate tank toward the end of the record,which may be indicative of enhanced protein hydrolysis and sub-sequent ammonia release to leachate due to stimulation of bio-logical activity.
Ammonia has been detected in the leak detection system�LDS� on several occasions, and mean concentrations of ammoniaand COD in the leachate and LDS are comparable �Table 3�. Thissuggests the liquid in the LDS described in the companion paperrepresents leakage through the upper liner �geomembrane�.
Landfill D
Leachate was monitored separately from Areas C, D, C/D Valley,and E at Landfill D. Leachate from the entire landfill was storedin two 2.8 million-L tanks, and then added to the bioreactor areasover various periods. Thus, the recirculated leachate reflectsleachate quality of the entire landfill. Area A/B had a relativelypermeable cover over the period of the data set and thereforecontributed a significant fraction of total leachate �69 to 40%between 1990 and 2006�. The contribution from Area A/B de-creased over time as the landfill area expanded.
pH, BOD:COD, and NH3–N data for each bioreactor cell arepresented in Fig. 7. Data for two sumps �PCS1 and PCS2� arealso presented. PCS1 includes leachate from Area D, the C/DValley, and some of Area E, whereas PCS2 collects leachate fromArea D and part of Area E. Because Area E is active, leachate inthese sumps as well as the Area E data are influenced by freshrefuse. Leachate was recirculated through Year 7.5 in Area C,from Year 2 to the present in Area D, and from Year 6 to thepresent in Area E.
The pH was initially below 6 in all cells and required about 5years to reach neutral �Fig. 7�. This suggests that recirculationstimulated an accumulation of carboxylic acids. In Area C and
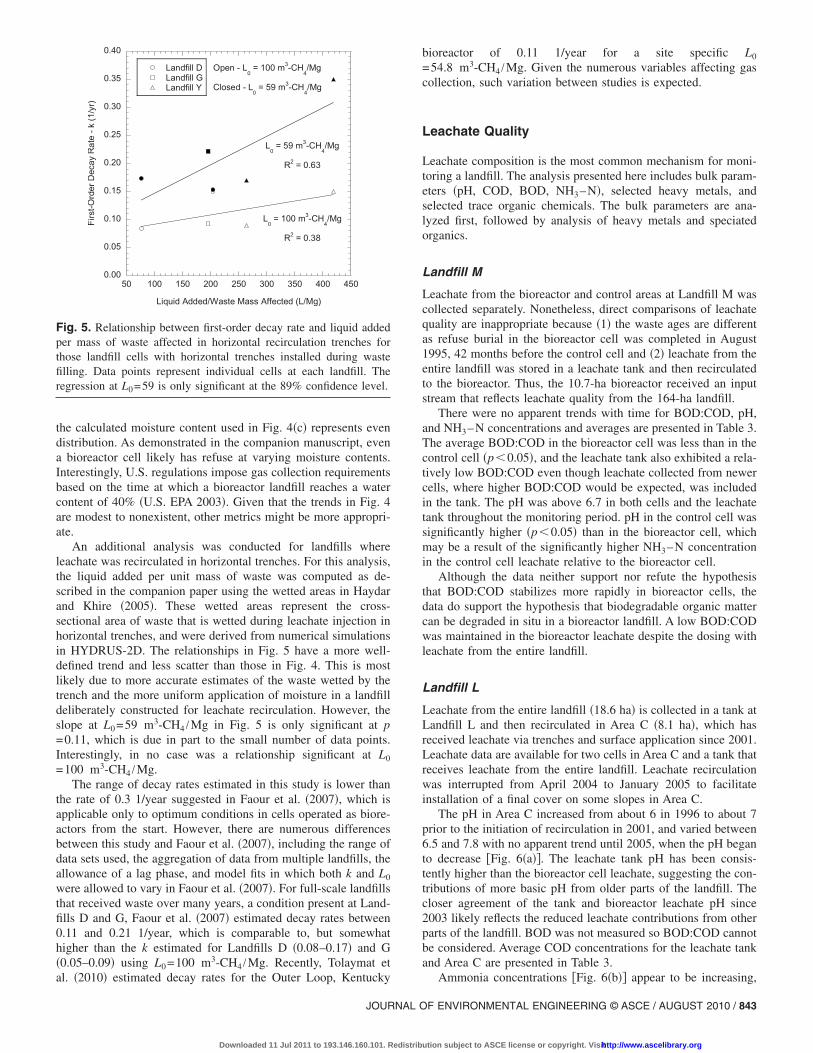
Table 3. Leachate Characteristics for the Studied Landfills
Landfill Cell
pH
n Mean �SD�a Minimum Maximum n M
M Conventional 10 7.50 �0.21� 7 7.7 25
Bioreactor 10 6.99 �0.24� 7 7.5 27
Tank 5 7.7 �0.26� 7.5 8.2 14
Y W 22 6.93 �0.24� 6.5 7.5 19
NE 23 7.49 �0.24� 7 8.2 21
G — 76 6.81 �0.66� 5.6 8.1 55
L Cells 1and 2
71 6.77 �0.51� 5.4 7.8 71 1
Cells 1and 2 LDSc
40 7.04 �0.5� 6.1 9 41 1
D Cell C 213 7.03 �0.52� 4.8 8.2 209
Cell D:PCS1
158 6.65 �0.5� 4.7 7.4 151
Cell D:PCS2
132 6.51 �0.42� 5.1 7.4 121
Cell E 90 6.43 �0.36� 5.4 7.2 80aData are the average for all samples with the standard deviation presentbOne outlier value of 8,760 mg/L was excluded from the mean.cLeachate detection system.dData are COD �mg/L� as BOD was not measured.
BOD:CODNH3–N�mg/L�
ean �SD�a Minimum Maximum n Mean �SD�a Minimum Maximum
0.21 �0.22� 0 0.87 25 1,736 �472�b 383 2,630b
0.10 �0.08� 0 0.4 25 339 �80� 84 450
0.14 �0.16� 0 0.6 14 1,257 �296� 520 1,590
0.09 �0.05� 0 0.25 22 210 �240� 9.5 850
0.13 �0.19� 0 0.8 23 343 �307� 13.5 1,420
0.45 �0.28� 0 1 58 379 �282� 13 1,250
,866 �1743�d 140 11,000 70 308 �220� 2.5 790
,093 �1102�d 62 6,520 41 310 �247� 3.6 756
0.31 �0.25� 0 1 213 281.2 �122.3� 1 585
0.33 �0.30� 0 0.98 157 344 �166� �0.1 735
0.55 �0.21� 0 0.97 132 210 �135� 0.13 537
0.43 �0.20� 0.1 0.83 87 159 �139� 0.25 488
ed parenthetically.
Sump PCS1, the pH increase is consistent with a decrease in
844 / JOURNAL OF ENVIRONMENTAL ENGINEERING © ASCE / AUGUST
Downloaded 11 Jul 2011 to 193.146.160.101. Redistrib
5.0
5.5
6.0
6.5
7.0
7.5
8.0
8.5
1997 1999 2001 2003 2005 2007
Cell 1Cell 2Tank
pH
(a)
0
100
200
300
400
500
600
700
800
900
1997 1999 2001 2003 2005 2007
Cell 1Cell 2Cell 1WCell 2WTank
NH3-N(mg/L)
(b)
Fig. 6. �a� pH; �b� ammonia concentration in Landfill L leachate
2010
ution subject to ASCE license or copyright. Visithttp://www.ascelibrary.org
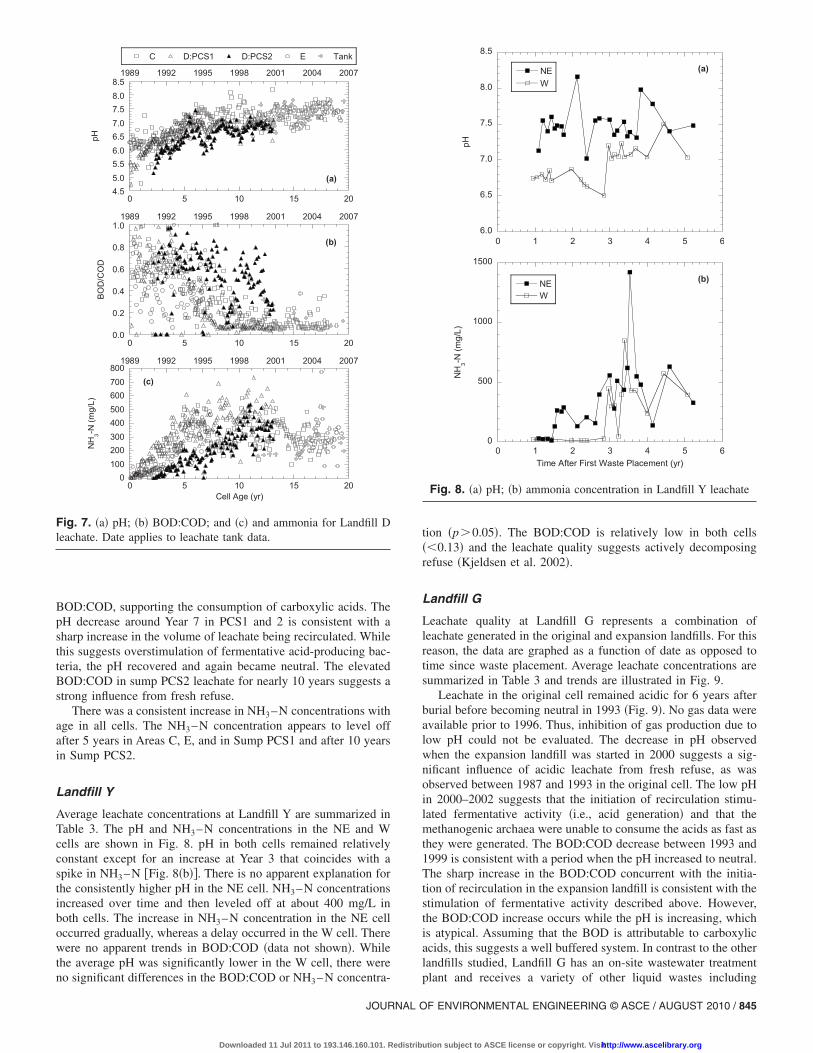
BOD:COD, supporting the consumption of carboxylic acids. ThepH decrease around Year 7 in PCS1 and 2 is consistent with asharp increase in the volume of leachate being recirculated. Whilethis suggests overstimulation of fermentative acid-producing bac-teria, the pH recovered and again became neutral. The elevatedBOD:COD in sump PCS2 leachate for nearly 10 years suggests astrong influence from fresh refuse.
There was a consistent increase in NH3–N concentrations withage in all cells. The NH3–N concentration appears to level offafter 5 years in Areas C, E, and in Sump PCS1 and after 10 yearsin Sump PCS2.
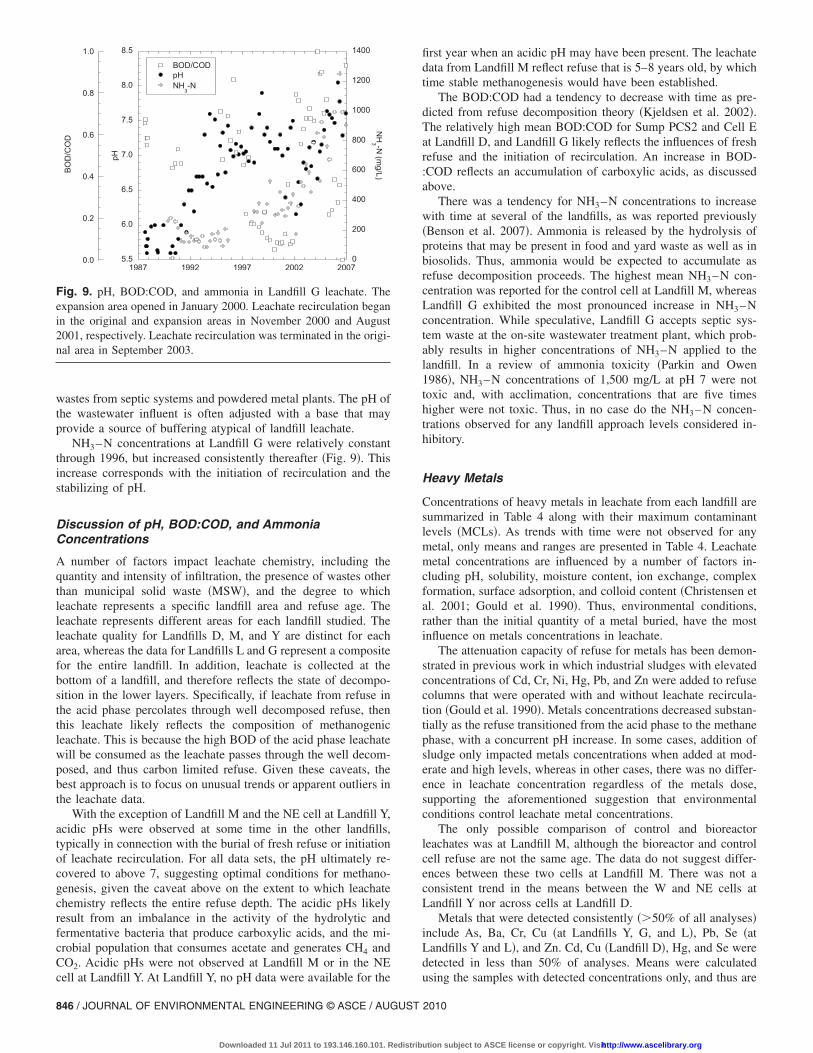
Landfill Y
Average leachate concentrations at Landfill Y are summarized inTable 3. The pH and NH3–N concentrations in the NE and Wcells are shown in Fig. 8. pH in both cells remained relativelyconstant except for an increase at Year 3 that coincides with aspike in NH3–N �Fig. 8�b��. There is no apparent explanation forthe consistently higher pH in the NE cell. NH3–N concentrationsincreased over time and then leveled off at about 400 mg/L inboth cells. The increase in NH3–N concentration in the NE celloccurred gradually, whereas a delay occurred in the W cell. Therewere no apparent trends in BOD:COD �data not shown�. Whilethe average pH was significantly lower in the W cell, there were
4.55.05.56.06.57.07.58.08.5
0 5 10 15 20
1989 1992 1995 1998 2001 2004 2007
C D:PCS1 D:PCS2 E Tank
pH
(a)
0.0
0.2
0.4
0.6
0.8
1.0
0 5 10 15 20
1989 1992 1995 1998 2001 2004 2007
BOD/COD
(b)
0100200300400500600700800
0 5 10 15 20
1989 1992 1995 1998 2001 2004 2007
NH3-N(mg/L)
Cell Age (yr)
(c)
Fig. 7. �a� pH; �b� BOD:COD; and �c� and ammonia for Landfill Dleachate. Date applies to leachate tank data.
no significant differences in the BOD:COD or NH3–N concentra-
JOURNAL O
Downloaded 11 Jul 2011 to 193.146.160.101. Redistrib
tion �p�0.05�. The BOD:COD is relatively low in both cells��0.13� and the leachate quality suggests actively decomposingrefuse �Kjeldsen et al. 2002�.
Landfill G
Leachate quality at Landfill G represents a combination ofleachate generated in the original and expansion landfills. For thisreason, the data are graphed as a function of date as opposed totime since waste placement. Average leachate concentrations aresummarized in Table 3 and trends are illustrated in Fig. 9.
Leachate in the original cell remained acidic for 6 years afterburial before becoming neutral in 1993 �Fig. 9�. No gas data wereavailable prior to 1996. Thus, inhibition of gas production due tolow pH could not be evaluated. The decrease in pH observedwhen the expansion landfill was started in 2000 suggests a sig-nificant influence of acidic leachate from fresh refuse, as wasobserved between 1987 and 1993 in the original cell. The low pHin 2000–2002 suggests that the initiation of recirculation stimu-lated fermentative activity �i.e., acid generation� and that themethanogenic archaea were unable to consume the acids as fast asthey were generated. The BOD:COD decrease between 1993 and1999 is consistent with a period when the pH increased to neutral.The sharp increase in the BOD:COD concurrent with the initia-tion of recirculation in the expansion landfill is consistent with thestimulation of fermentative activity described above. However,the BOD:COD increase occurs while the pH is increasing, whichis atypical. Assuming that the BOD is attributable to carboxylicacids, this suggests a well buffered system. In contrast to the otherlandfills studied, Landfill G has an on-site wastewater treatment
6.0
6.5
7.0
7.5
8.0
8.5
0 1 2 3 4 5 6
NEW
pH
(a)
0
500
1000
1500
0 1 2 3 4 5 6
NEW
NH3-N(mg/L)
Time After First Waste Placement (yr)
(b)
Fig. 8. �a� pH; �b� ammonia concentration in Landfill Y leachate
plant and receives a variety of other liquid wastes including
F ENVIRONMENTAL ENGINEERING © ASCE / AUGUST 2010 / 845
ution subject to ASCE license or copyright. Visithttp://www.ascelibrary.org
wastes from septic systems and powdered metal plants. The pH ofthe wastewater influent is often adjusted with a base that mayprovide a source of buffering atypical of landfill leachate.
NH3–N concentrations at Landfill G were relatively constantthrough 1996, but increased consistently thereafter �Fig. 9�. Thisincrease corresponds with the initiation of recirculation and thestabilizing of pH.
Discussion of pH, BOD:COD, and AmmoniaConcentrations
A number of factors impact leachate chemistry, including thequantity and intensity of infiltration, the presence of wastes otherthan municipal solid waste �MSW�, and the degree to whichleachate represents a specific landfill area and refuse age. Theleachate represents different areas for each landfill studied. Theleachate quality for Landfills D, M, and Y are distinct for eacharea, whereas the data for Landfills L and G represent a compositefor the entire landfill. In addition, leachate is collected at thebottom of a landfill, and therefore reflects the state of decompo-sition in the lower layers. Specifically, if leachate from refuse inthe acid phase percolates through well decomposed refuse, thenthis leachate likely reflects the composition of methanogenicleachate. This is because the high BOD of the acid phase leachatewill be consumed as the leachate passes through the well decom-posed, and thus carbon limited refuse. Given these caveats, thebest approach is to focus on unusual trends or apparent outliers inthe leachate data.
With the exception of Landfill M and the NE cell at Landfill Y,acidic pHs were observed at some time in the other landfills,typically in connection with the burial of fresh refuse or initiationof leachate recirculation. For all data sets, the pH ultimately re-covered to above 7, suggesting optimal conditions for methano-genesis, given the caveat above on the extent to which leachatechemistry reflects the entire refuse depth. The acidic pHs likelyresult from an imbalance in the activity of the hydrolytic andfermentative bacteria that produce carboxylic acids, and the mi-crobial population that consumes acetate and generates CH4 andCO2. Acidic pHs were not observed at Landfill M or in the NE
BOD/COD
5.5
6.0
6.5
7.0
7.5
8.0
8.5
0
200
400
600
800
1000
1200
1400
1987 1992 1997 2002 2007
pHNH
3-N
pH
NH3 -N
(mg/L)
0.0
0.2
0.4
0.6
0.8
1.0
BOD/COD
Fig. 9. pH, BOD:COD, and ammonia in Landfill G leachate. Theexpansion area opened in January 2000. Leachate recirculation beganin the original and expansion areas in November 2000 and August2001, respectively. Leachate recirculation was terminated in the origi-nal area in September 2003.
cell at Landfill Y. At Landfill Y, no pH data were available for the
846 / JOURNAL OF ENVIRONMENTAL ENGINEERING © ASCE / AUGUST
Downloaded 11 Jul 2011 to 193.146.160.101. Redistrib
first year when an acidic pH may have been present. The leachatedata from Landfill M reflect refuse that is 5–8 years old, by whichtime stable methanogenesis would have been established.
The BOD:COD had a tendency to decrease with time as pre-dicted from refuse decomposition theory �Kjeldsen et al. 2002�.The relatively high mean BOD:COD for Sump PCS2 and Cell Eat Landfill D, and Landfill G likely reflects the influences of freshrefuse and the initiation of recirculation. An increase in BOD-:COD reflects an accumulation of carboxylic acids, as discussedabove.
There was a tendency for NH3–N concentrations to increasewith time at several of the landfills, as was reported previously�Benson et al. 2007�. Ammonia is released by the hydrolysis ofproteins that may be present in food and yard waste as well as inbiosolids. Thus, ammonia would be expected to accumulate asrefuse decomposition proceeds. The highest mean NH3–N con-centration was reported for the control cell at Landfill M, whereasLandfill G exhibited the most pronounced increase in NH3–Nconcentration. While speculative, Landfill G accepts septic sys-tem waste at the on-site wastewater treatment plant, which prob-ably results in higher concentrations of NH3–N applied to thelandfill. In a review of ammonia toxicity �Parkin and Owen1986�, NH3–N concentrations of 1,500 mg/L at pH 7 were nottoxic and, with acclimation, concentrations that are five timeshigher were not toxic. Thus, in no case do the NH3–N concen-trations observed for any landfill approach levels considered in-hibitory.
Heavy Metals
Concentrations of heavy metals in leachate from each landfill aresummarized in Table 4 along with their maximum contaminantlevels �MCLs�. As trends with time were not observed for anymetal, only means and ranges are presented in Table 4. Leachatemetal concentrations are influenced by a number of factors in-cluding pH, solubility, moisture content, ion exchange, complexformation, surface adsorption, and colloid content �Christensen etal. 2001; Gould et al. 1990�. Thus, environmental conditions,rather than the initial quantity of a metal buried, have the mostinfluence on metals concentrations in leachate.
The attenuation capacity of refuse for metals has been demon-strated in previous work in which industrial sludges with elevatedconcentrations of Cd, Cr, Ni, Hg, Pb, and Zn were added to refusecolumns that were operated with and without leachate recircula-tion �Gould et al. 1990�. Metals concentrations decreased substan-tially as the refuse transitioned from the acid phase to the methanephase, with a concurrent pH increase. In some cases, addition ofsludge only impacted metals concentrations when added at mod-erate and high levels, whereas in other cases, there was no differ-ence in leachate concentration regardless of the metals dose,supporting the aforementioned suggestion that environmentalconditions control leachate metal concentrations.
The only possible comparison of control and bioreactorleachates was at Landfill M, although the bioreactor and controlcell refuse are not the same age. The data do not suggest differ-ences between these two cells at Landfill M. There was not aconsistent trend in the means between the W and NE cells atLandfill Y nor across cells at Landfill D.
Metals that were detected consistently ��50% of all analyses�include As, Ba, Cr, Cu �at Landfills Y, G, and L�, Pb, Se �atLandfills Y and L�, and Zn. Cd, Cu �Landfill D�, Hg, and Se weredetected in less than 50% of analyses. Means were calculated
using the samples with detected concentrations only, and thus are2010
ution subject to ASCE license or copyright. Visithttp://www.ascelibrary.org
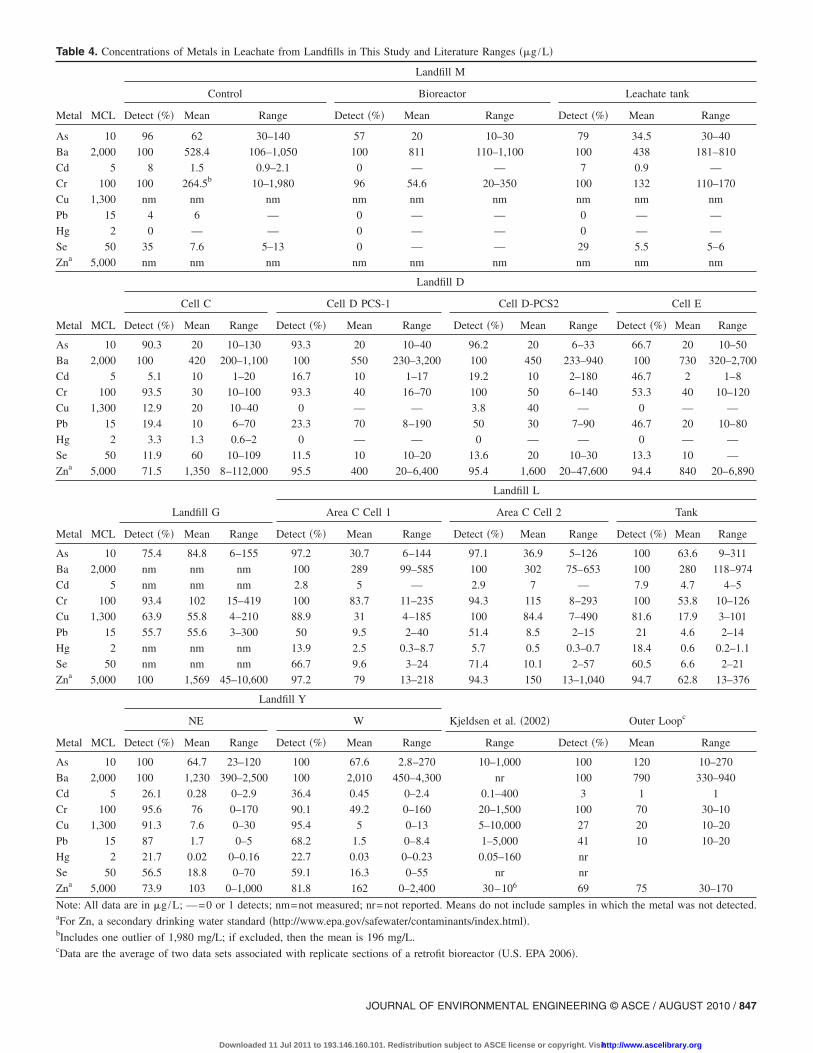
Table 4. Concentrations of Metals in Leachate from Landfills in This Study and Literature Ranges ��g /L�
Metal MCL
Landfill M
Control Bioreactor Leachate tank
Detect �%� Mean Range Detect �%� Mean Range Detect �%� Mean Range
As 10 96 62 30–140 57 20 10–30 79 34.5 30–40
Ba 2,000 100 528.4 106–1,050 100 811 110–1,100 100 438 181–810
Cd 5 8 1.5 0.9–2.1 0 — — 7 0.9 —
Cr 100 100 264.5b 10–1,980 96 54.6 20–350 100 132 110–170
Cu 1,300 nm nm nm nm nm nm nm nm nm
Pb 15 4 6 — 0 — — 0 — —
Hg 2 0 — — 0 — — 0 — —
Se 50 35 7.6 5–13 0 — — 29 5.5 5–6
Zna 5,000 nm nm nm nm nm nm nm nm nm
Metal MCL
Landfill D
Cell C Cell D PCS-1 Cell D-PCS2 Cell E
Detect �%� Mean Range Detect �%� Mean Range Detect �%� Mean Range Detect �%� Mean Range
As 10 90.3 20 10–130 93.3 20 10–40 96.2 20 6–33 66.7 20 10–50
Ba 2,000 100 420 200–1,100 100 550 230–3,200 100 450 233–940 100 730 320–2,700
Cd 5 5.1 10 1–20 16.7 10 1–17 19.2 10 2–180 46.7 2 1–8
Cr 100 93.5 30 10–100 93.3 40 16–70 100 50 6–140 53.3 40 10–120
Cu 1,300 12.9 20 10–40 0 — — 3.8 40 — 0 — —
Pb 15 19.4 10 6–70 23.3 70 8–190 50 30 7–90 46.7 20 10–80
Hg 2 3.3 1.3 0.6–2 0 — — 0 — — 0 — —
Se 50 11.9 60 10–109 11.5 10 10–20 13.6 20 10–30 13.3 10 —
Zna 5,000 71.5 1,350 8–112,000 95.5 400 20–6,400 95.4 1,600 20–47,600 94.4 840 20–6,890
Metal MCL
Landfill G
Landfill L
Area C Cell 1 Area C Cell 2 Tank
Detect �%� Mean Range Detect �%� Mean Range Detect �%� Mean Range Detect �%� Mean Range
As 10 75.4 84.8 6–155 97.2 30.7 6–144 97.1 36.9 5–126 100 63.6 9–311
Ba 2,000 nm nm nm 100 289 99–585 100 302 75–653 100 280 118–974
Cd 5 nm nm nm 2.8 5 — 2.9 7 — 7.9 4.7 4–5
Cr 100 93.4 102 15–419 100 83.7 11–235 94.3 115 8–293 100 53.8 10–126
Cu 1,300 63.9 55.8 4–210 88.9 31 4–185 100 84.4 7–490 81.6 17.9 3–101
Pb 15 55.7 55.6 3–300 50 9.5 2–40 51.4 8.5 2–15 21 4.6 2–14
Hg 2 nm nm nm 13.9 2.5 0.3–8.7 5.7 0.5 0.3–0.7 18.4 0.6 0.2–1.1
Se 50 nm nm nm 66.7 9.6 3–24 71.4 10.1 2–57 60.5 6.6 2–21
Zna 5,000 100 1,569 45–10,600 97.2 79 13–218 94.3 150 13–1,040 94.7 62.8 13–376
Metal MCL
Landfill Y
Kjeldsen et al. �2002� Outer LoopcNE W
Detect �%� Mean Range Detect �%� Mean Range Range Detect �%� Mean Range
As 10 100 64.7 23–120 100 67.6 2.8–270 10–1,000 100 120 10–270
Ba 2,000 100 1,230 390–2,500 100 2,010 450–4,300 nr 100 790 330–940
Cd 5 26.1 0.28 0–2.9 36.4 0.45 0–2.4 0.1–400 3 1 1
Cr 100 95.6 76 0–170 90.1 49.2 0–160 20–1,500 100 70 30–10
Cu 1,300 91.3 7.6 0–30 95.4 5 0–13 5–10,000 27 20 10–20
Pb 15 87 1.7 0–5 68.2 1.5 0–8.4 1–5,000 41 10 10–20
Hg 2 21.7 0.02 0–0.16 22.7 0.03 0–0.23 0.05–160 nr
Se 50 56.5 18.8 0–70 59.1 16.3 0–55 nr nr
Zna 5,000 73.9 103 0–1,000 81.8 162 0–2,400 30–106 69 75 30–170
Note: All data are in �g /L; —=0 or 1 detects; nm=not measured; nr=not reported. Means do not include samples in which the metal was not detected.aFor Zn, a secondary drinking water standard �http://www.epa.gov/safewater/contaminants/index.html�.bIncludes one outlier of 1,980 mg/L; if excluded, then the mean is 196 mg/L.cData are the average of two data sets associated with replicate sections of a retrofit bioreactor �U.S. EPA 2006�.
JOURNAL OF ENVIRONMENTAL ENGINEERING © ASCE / AUGUST 2010 / 847
Downloaded 11 Jul 2011 to 193.146.160.101. Redistribution subject to ASCE license or copyright. Visithttp://www.ascelibrary.org

biased upward. The ranges and detection frequencies summarizedin Table 4 are consistent with data from bioreactor cells at theOuter Loop Landfill in Louisville, Kentucky �U.S. EPA 2006� andwere within the ranges reported by Kjeldsen et al. �2002� �Table4�. Given the age of the data in Kjeldsen et al. �2002�, the dataalmost certainly do not include bioreactor landfills. Thus, thiscomparison suggests that metals concentrations in bioreactorleachates are no different from conventional leachates. Zn waspresent in the highest concentrations in the data from this studyand in previous studies �Gould et al. 1990; Kjeldsen et al. 2002�.Metals concentrations typically were below their MCL, althoughthe MCL is an unrealistically stringent benchmark as leachate istreated and diluted at modern landfills before it is released to theenvironment.
The only metal that was consistently above the MCL was As.The ranges for As from this study are consistent with ranges inthe literature �Baun and Christensen 2004�. Sources of As in land-fills include glass, soil, metal alloys, and agricultural products�Pinel-Raffaitin et al. 2007�. Although sufficient data are notavailable to indicate whether As concentrations have increased inlandfill leachate with time, the mass of As entering landfills isanticipated to increase as more As is removed from drinkingwater and the treatment residuals are disposed in landfills. Re-cently, Ponthieu et al. �2007� reported speciated As concentrationsin leachate from several French landfills cells that received pri-marily MSW. Total As ranged from 17 to 77 �g /L which issimilar to the range in Table 4. Comparing leachate As in tradi-tional and bioreactor leachate, more of the As in the bioreactorleachate was in the nontoxic arsenobetaine form. The writers sug-gested that enhanced biological activity in the bioreactor mayhave converted more toxic forms of organic As to arsenobetaine.
In summary, there is no evidence that bioreactor landfillleachate contains higher metals concentrations than conventionallandfills. Rather, the neutral pH associated with the onset of meth-ane production is likely the critical factor controlling metals con-centrations. As bioreactor landfills are operated to enhancemethanogenic conditions, bioreactor landfill leachate will haveless time in the acid phase when metals concentrations will behighest.
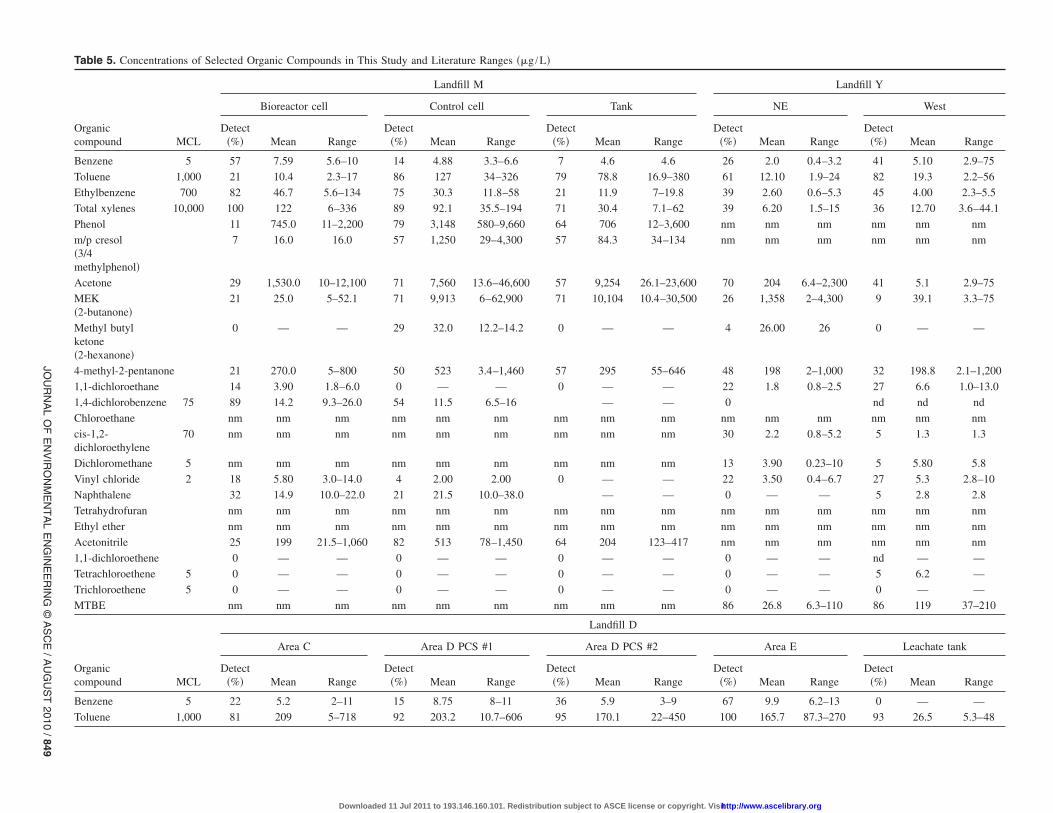
Speciated Organic Chemicals
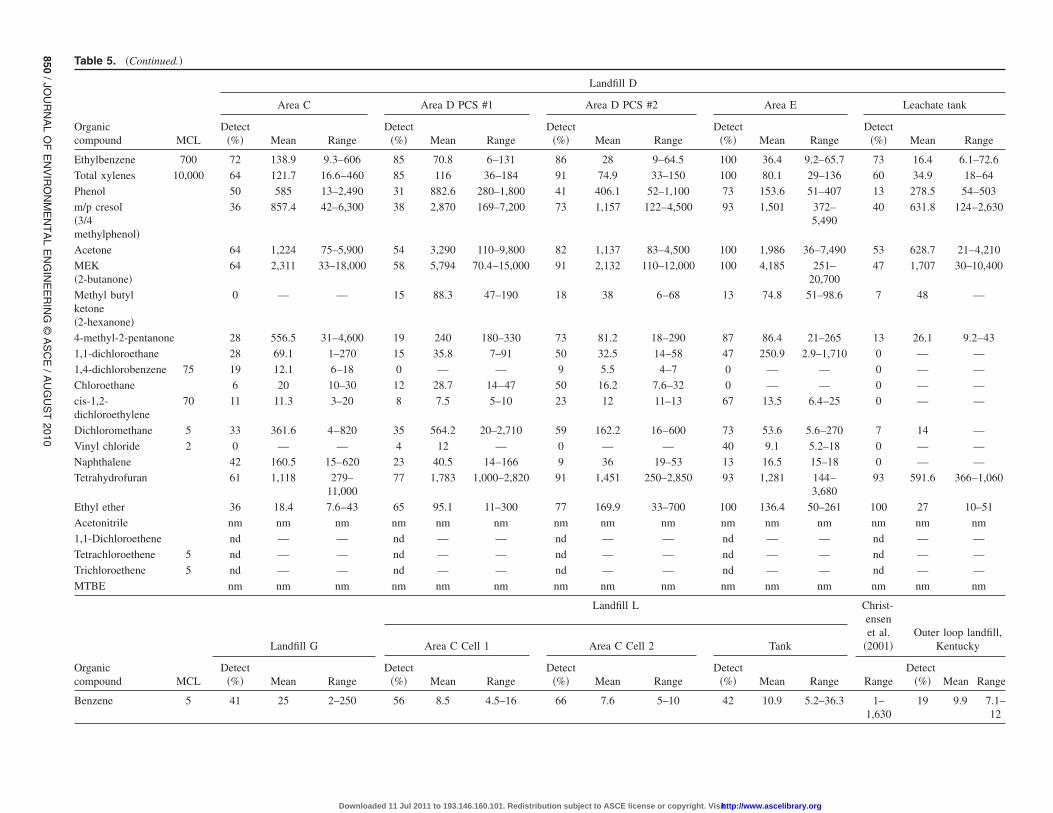
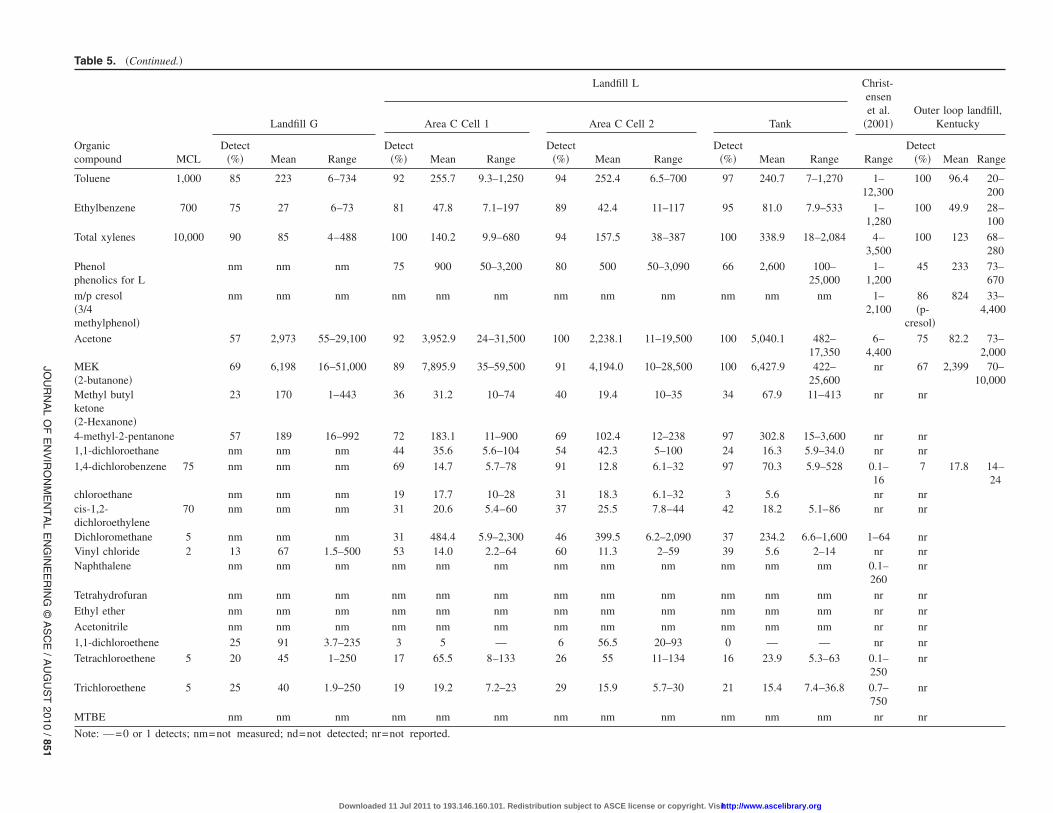
Speciated organic chemical concentrations in leachate from eachlandfill are summarized in Table 5. Only data for compounds thatwere detected in greater than 50% of samples at any one landfillare presented. Means were calculated based only on detectedsamples and thus represent an upper limit. Leachate concentra-tions are influenced by a number of factors including sorption,volatilization, biodegradation, refuse moisture content, the initialmass input �which is unknown�, and dilution from infiltration.Thus, mechanistic interpretation of the reported data are difficult.
At Landfill D, the following chemicals exhibited a decreasingtrend with time: acetone, m/p-cresol, ethyl ether, ethylbenzene,2-butanone, 4-methyl-2-pentanone, methylene chloride, naphtha-lene, phenol, total phenolics, and toluene; whereas no trends wereapparent for tetrahydrofuran �THF�, m/p-xylene, and o-xylene.Toluene concentrations at Landfill D are presented in Fig. 10 asan example of a decreasing trend. With the exception of decreas-ing toluene concentrations at Landfill L, no other trends wereapparent at any landfill.
The lower toluene concentrations in Cell E at Landfill D be-tween Years 1 and 3 �Fig. 10� roughly correspond to a period of
high rainfall. As Cell E was active during this period, higher848 / JOURNAL OF ENVIRONMENTAL ENGINEERING © ASCE / AUGUST
Downloaded 11 Jul 2011 to 193.146.160.101. Redistrib
infiltration would be expected relative to the other cells. However,counteracting dilution, high rainfall would also increase the de-gree of saturation in the cover soils, thereby decreasing diffusivelosses. Also in Cell E, the concentrations of acetone, m/p cresol,ethyl ether, MEK �2-butanone�, 4-methyl-2-pentanone, THF, andtoluene increased starting around Year 6 �data not shown�. Thisincrease corresponds approximately to the onset of leachate recir-culation in Cell E. These contaminants have high water solubili-ties �exception toluene�, and they may have dissolved intoleachate as it percolated through the landfill.
Separate concentration data were available for the bioreactorand control cells and the leachate tank at Landfill M. Where thesame compound was detected in both the bioreactor and controlcells, there was no trend in mean concentrations between the two.Because there was no overlap of waste ages between the twocells, a direct comparison of the leachate concentrations is imper-fect. The mean vinyl chloride concentration exceeded the MCL inseveral samples in the bioreactor cell, but was never detected inthe leachate tank. The mean benzene concentration was above theMCL in the bioreactor leachate and close to the MCL in thecontrol and tank leachate. While benzene was detected at greaterfrequency in the bioreactor cell, other aromatics were detected atgreater frequency in the control cell. Thus, the data do not supportincreased dissolution in the wetter bioreactor. In no case did theconcentrations of a contaminant in the leachate tank exceed theMCL.
In general the same compounds were detected at comparablefrequencies in the NE and W cells at Landfill Y. As for LandfillM, benzene and vinyl chloride were detected above their MCL inselected samples. Other compounds present above their MCL in-cluded dichloromethane and tetrachloroethene, at maximum con-centrations of 10 and 6.2 �g /L, respectively. However, detectionfrequencies for these chemicals were less than 10%.
Benzene and vinyl chloride were present at mean concentra-tions above their MCLs in leachate from Landfills G and L, aswell as in the leachate tank at Landfill L. This tank receivesleachate from the entire landfill as opposed to the bioreactor areaonly. Contaminants in Landfill L leachate were generally detectedat similar frequencies from the two leachate sample locations andthe leachate tank.
Ranges of trace organics concentrations measured in landfillleachate at other landfills are also summarized in Table 5. As formetals, the literature data almost certainly do not include biore-actor landfills. In no case are the concentrations for any of thelandfills evaluated in this study above the literature values.
Alkylbenzenes, phenolic compounds, and ketones were mostconsistently detected across the five study landfills. THF and ethylether, which were only analyzed at Landfill D, and methyl tert-butyl ether �MTBE�, which was only analyzed at Landfill Y, werealso detected frequently. Alkylbenzenes and ketones are present ina wide variety of household products so their presence in leachateis expected. Aromatic hydrocarbons are routinely present in LFG�Allen et al. 1997; Eklund et al. 1998�. In addition, ketones can beproduced under anaerobic conditions �Woods 1995�. In previousresearch, acetone and 2-butanone were released during anaerobicdecomposition, suggesting their continuous production �Staley etal. 2006�. This would explain the relatively high concentrationsreported here and the consistency across landfills.
The concentration of volatile organic chemicals �VOCs� canbe expected to decrease with time based on gas stripping, aneffect that has been quantified using an equilibrium model �Kjeld-sen and Christensen 2001�. In some cases, biodegradation prob-
ably contributed to the decreases in VOC concentrations.2010
ution subject to ASCE license or copyright. Visithttp://www.ascelibrary.org
Landfill Y
NE West
Mean RangeDetect�%� Mean Range
2.0 0.4–3.2 41 5.10 2.9–75
12.10 1.9–24 82 19.3 2.2–56
2.60 0.6–5.3 45 4.00 2.3–5.5
6.20 1.5–15 36 12.70 3.6–44.1
nm nm nm nm nm
nm nm nm nm nm
204 6.4–2,300 41 5.1 2.9–75
1,358 2–4,300 9 39.1 3.3–75
26.00 26 0 — —
198 2–1,000 32 198.8 2.1–1,200
1.8 0.8–2.5 27 6.6 1.0–13.0
nd nd nd
nm nm nm nm nm
2.2 0.8–5.2 5 1.3 1.3
3.90 0.23–10 5 5.80 5.8
3.50 0.4–6.7 27 5.3 2.8–10
— — 5 2.8 2.8
nm nm nm nm nm
nm nm nm nm nm
nm nm nm nm nm
— — nd — —
— — 5 6.2 —
— — 0 — —
26.8 6.3–110 86 119 37–210
Area E Leachate tank
Mean RangeDetect�%� Mean Range
9.9 6.2–13 0 — —
165.7 87.3–270 93 26.5 5.3–48
JOU
RN
AL
OF
EN
VIR
ON
ME
NT
AL
EN
GIN
EE
RIN
G©
AS
CE
/AU
GU
ST
2010/849
.ascelibrary.org
Table 5. Concentrations of Selected Organic Compounds in This Study and Literature Ranges ��g /L�
Organiccompound MCL
Landfill M
Bioreactor cell Control cell Tank
Detect�%� Mean Range
Detect�%� Mean Range
Detect�%� Mean Range
Detect�%�
Benzene 5 57 7.59 5.6–10 14 4.88 3.3–6.6 7 4.6 4.6 26
Toluene 1,000 21 10.4 2.3–17 86 127 34–326 79 78.8 16.9–380 61
Ethylbenzene 700 82 46.7 5.6–134 75 30.3 11.8–58 21 11.9 7–19.8 39
Total xylenes 10,000 100 122 6–336 89 92.1 35.5–194 71 30.4 7.1–62 39
Phenol 11 745.0 11–2,200 79 3,148 580–9,660 64 706 12–3,600 nm
m/p cresol�3/4methylphenol�
7 16.0 16.0 57 1,250 29–4,300 57 84.3 34–134 nm
Acetone 29 1,530.0 10–12,100 71 7,560 13.6–46,600 57 9,254 26.1–23,600 70
MEK�2-butanone�
21 25.0 5–52.1 71 9,913 6–62,900 71 10,104 10.4–30,500 26
Methyl butylketone�2-hexanone�
0 — — 29 32.0 12.2–14.2 0 — — 4
4-methyl-2-pentanone 21 270.0 5–800 50 523 3.4–1,460 57 295 55–646 48
1,1-dichloroethane 14 3.90 1.8–6.0 0 — — 0 — — 22
1,4-dichlorobenzene 75 89 14.2 9.3–26.0 54 11.5 6.5–16 — — 0
Chloroethane nm nm nm nm nm nm nm nm nm nm
cis-1,2-dichloroethylene
70 nm nm nm nm nm nm nm nm nm 30
Dichloromethane 5 nm nm nm nm nm nm nm nm nm 13
Vinyl chloride 2 18 5.80 3.0–14.0 4 2.00 2.00 0 — — 22
Naphthalene 32 14.9 10.0–22.0 21 21.5 10.0–38.0 — — 0
Tetrahydrofuran nm nm nm nm nm nm nm nm nm nm
Ethyl ether nm nm nm nm nm nm nm nm nm nm
Acetonitrile 25 199 21.5–1,060 82 513 78–1,450 64 204 123–417 nm
1,1-dichloroethene 0 — — 0 — — 0 — — 0
Tetrachloroethene 5 0 — — 0 — — 0 — — 0
Trichloroethene 5 0 — — 0 — — 0 — — 0
MTBE nm nm nm nm nm nm nm nm nm 86
Organiccompound MCL
Landfill D
Area C Area D PCS #1 Area D PCS #2
Detect�%� Mean Range
Detect�%� Mean Range
Detect�%� Mean Range
Detect�%�
Benzene 5 22 5.2 2–11 15 8.75 8–11 36 5.9 3–9 67
Toluene 1,000 81 209 5–718 92 203.2 10.7–606 95 170.1 22–450 100
Downloaded 11 Jul 2011 to 193.146.160.101. Redistribution subject to ASCE license or copyright. Visithttp://www
Area E Leachate tank
Mean RangeDetect�%� Mean Range
36.4 9.2–65.7 73 16.4 6.1–72.6
80.1 29–136 60 34.9 18–64
153.6 51–407 13 278.5 54–503
1,501 372–5,490
40 631.8 124–2,630
1,986 36–7,490 53 628.7 21–4,210
4,185 251–20,700
47 1,707 30–10,400
74.8 51–98.6 7 48 —
86.4 21–265 13 26.1 9.2–43
250.9 2.9–1,710 0 — —
— — 0 — —
— — 0 — —
13.5 6.4–25 0 — —
53.6 5.6–270 7 14 —
9.1 5.2–18 0 — —
16.5 15–18 0 — —
1,281 144–3,680
93 591.6 366–1,060
136.4 50–261 100 27 10–51
nm nm nm nm nm
— — nd — —
— — nd — —
— — nd — —
nm nm nm nm nm
Christ-ensenet al.
�2001�Outer loop landfill,
KentuckyTank
Mean Range RangeDetect
�%� Mean Range
10.9 5.2–36.3 1–1,630
19 9.9 7.1–12
850/JO
UR
NA
LO
FE
NV
IRO
NM
EN
TA
LE
NG
INE
ER
ING
©A
SC
E/A
UG
US
T2010
.ascelibrary.org
Table 5. �Continued.�
Organiccompound MCL
Landfill D
Area C Area D PCS #1 Area D PCS #2
Detect�%� Mean Range
Detect�%� Mean Range
Detect�%� Mean Range
Detect�%�
Ethylbenzene 700 72 138.9 9.3–606 85 70.8 6–131 86 28 9–64.5 100
Total xylenes 10,000 64 121.7 16.6–460 85 116 36–184 91 74.9 33–150 100
Phenol 50 585 13–2,490 31 882.6 280–1,800 41 406.1 52–1,100 73
m/p cresol�3/4methylphenol�
36 857.4 42–6,300 38 2,870 169–7,200 73 1,157 122–4,500 93
Acetone 64 1,224 75–5,900 54 3,290 110–9,800 82 1,137 83–4,500 100
MEK�2-butanone�
64 2,311 33–18,000 58 5,794 70.4–15,000 91 2,132 110–12,000 100
Methyl butylketone�2-hexanone�
0 — — 15 88.3 47–190 18 38 6–68 13
4-methyl-2-pentanone 28 556.5 31–4,600 19 240 180–330 73 81.2 18–290 87
1,1-dichloroethane 28 69.1 1–270 15 35.8 7–91 50 32.5 14–58 47
1,4-dichlorobenzene 75 19 12.1 6–18 0 — — 9 5.5 4–7 0
Chloroethane 6 20 10–30 12 28.7 14–47 50 16.2 7.6–32 0
cis-1,2-dichloroethylene
70 11 11.3 3–20 8 7.5 5–10 23 12 11–13 67
Dichloromethane 5 33 361.6 4–820 35 564.2 20–2,710 59 162.2 16–600 73
Vinyl chloride 2 0 — — 4 12 — 0 — — 40
Naphthalene 42 160.5 15–620 23 40.5 14–166 9 36 19–53 13
Tetrahydrofuran 61 1,118 279–11,000
77 1,783 1,000–2,820 91 1,451 250–2,850 93
Ethyl ether 36 18.4 7.6–43 65 95.1 11–300 77 169.9 33–700 100
Acetonitrile nm nm nm nm nm nm nm nm nm nm
1,1-Dichloroethene nd — — nd — — nd — — nd
Tetrachloroethene 5 nd — — nd — — nd — — nd
Trichloroethene 5 nd — — nd — — nd — — nd
MTBE nm nm nm nm nm nm nm nm nm nm
Organiccompound MCL
Landfill G
Landfill L
Area C Cell 1 Area C Cell 2
Detect�%� Mean Range
Detect�%� Mean Range
Detect�%� Mean Range
Detect�%�
Benzene 5 41 25 2–250 56 8.5 4.5–16 66 7.6 5–10 42
Downloaded 11 Jul 2011 to 193.146.160.101. Redistribution subject to ASCE license or copyright. Visithttp://www
Christ-ensenet al.
�2001�Outer loop landfill,
KentuckyTank
Mean Range RangeDetect
�%� Mean Range
240.7 7–1,270 1–12,300
100 96.4 20–200
81.0 7.9–533 1–1,280
100 49.9 28–100
338.9 18–2,084 4–3,500
100 123 68–280
2,600 100–25,000
1–1,200
45 233 73–670
nm nm 1–2,100
86�p-
cresol�
824 33–4,400
,040.1 482–17,350
6–4,400
75 82.2 73–2,000
,427.9 422–25,600
nr 67 2,399 70–10,000
67.9 11–413 nr nr
302.8 15–3,600 nr nr16.3 5.9–34.0 nr nr
70.3 5.9–528 0.1–16
7 17.8 14–24
5.6 nr nr18.2 5.1–86 nr nr
234.2 6.6–1,600 1–64 nr5.6 2–14 nr nrnm nm 0.1–
260nr
nm nm nr nr
nm nm nr nr
nm nm nr nr
— — nr nr
23.9 5.3–63 0.1–250
nr
15.4 7.4–36.8 0.7–750
nr
nm nm nr nr
JOU
RN
AL
OF
EN
VIR
ON
ME
NT
AL
EN
GIN
EE
RIN
G©
AS
CE
/AU
GU
ST
2010/851
.ascelibrary.org
Table 5. �Continued.�
Organiccompound MCL
Landfill G
Landfill L
Area C Cell 1 Area C Cell 2
Detect�%� Mean Range
Detect�%� Mean Range
Detect�%� Mean Range
Detect�%�
Toluene 1,000 85 223 6–734 92 255.7 9.3–1,250 94 252.4 6.5–700 97
Ethylbenzene 700 75 27 6–73 81 47.8 7.1–197 89 42.4 11–117 95
Total xylenes 10,000 90 85 4–488 100 140.2 9.9–680 94 157.5 38–387 100
Phenolphenolics for L
nm nm nm 75 900 50–3,200 80 500 50–3,090 66
m/p cresol�3/4methylphenol�
nm nm nm nm nm nm nm nm nm nm
Acetone 57 2,973 55–29,100 92 3,952.9 24–31,500 100 2,238.1 11–19,500 100 5
MEK�2-butanone�
69 6,198 16–51,000 89 7,895.9 35–59,500 91 4,194.0 10–28,500 100 6
Methyl butylketone�2-Hexanone�
23 170 1–443 36 31.2 10–74 40 19.4 10–35 34
4-methyl-2-pentanone 57 189 16–992 72 183.1 11–900 69 102.4 12–238 971,1-dichloroethane nm nm nm 44 35.6 5.6–104 54 42.3 5–100 24
1,4-dichlorobenzene 75 nm nm nm 69 14.7 5.7–78 91 12.8 6.1–32 97
chloroethane nm nm nm 19 17.7 10–28 31 18.3 6.1–32 3cis-1,2-dichloroethylene
70 nm nm nm 31 20.6 5.4–60 37 25.5 7.8–44 42
Dichloromethane 5 nm nm nm 31 484.4 5.9–2,300 46 399.5 6.2–2,090 37Vinyl chloride 2 13 67 1.5–500 53 14.0 2.2–64 60 11.3 2–59 39Naphthalene nm nm nm nm nm nm nm nm nm nm
Tetrahydrofuran nm nm nm nm nm nm nm nm nm nm
Ethyl ether nm nm nm nm nm nm nm nm nm nm
Acetonitrile nm nm nm nm nm nm nm nm nm nm
1,1-dichloroethene 25 91 3.7–235 3 5 — 6 56.5 20–93 0
Tetrachloroethene 5 20 45 1–250 17 65.5 8–133 26 55 11–134 16
Trichloroethene 5 25 40 1.9–250 19 19.2 7.2–23 29 15.9 5.7–30 21
MTBE nm nm nm nm nm nm nm nm nm nm
Note: —=0 or 1 detects; nm=not measured; nd=not detected; nr=not reported.
Downloaded 11 Jul 2011 to 193.146.160.101. Redistribution subject to ASCE license or copyright. Visithttp://www
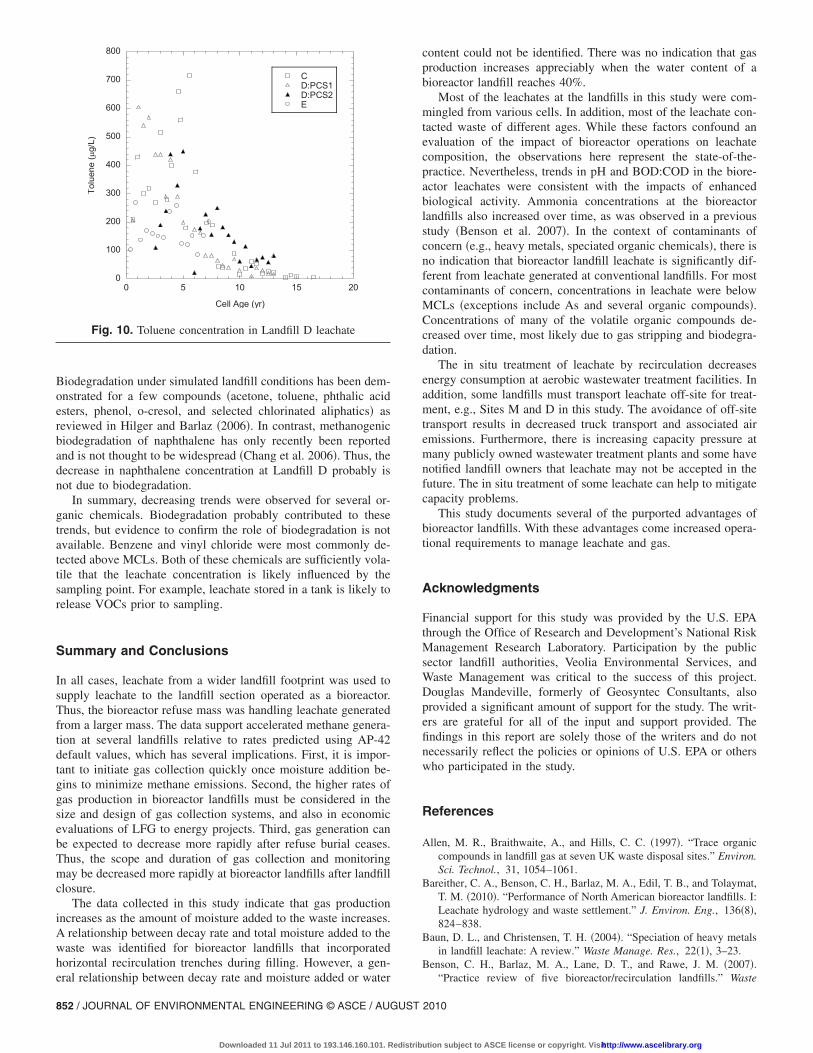
Biodegradation under simulated landfill conditions has been dem-onstrated for a few compounds �acetone, toluene, phthalic acidesters, phenol, o-cresol, and selected chlorinated aliphatics� asreviewed in Hilger and Barlaz �2006�. In contrast, methanogenicbiodegradation of naphthalene has only recently been reportedand is not thought to be widespread �Chang et al. 2006�. Thus, thedecrease in naphthalene concentration at Landfill D probably isnot due to biodegradation.
In summary, decreasing trends were observed for several or-ganic chemicals. Biodegradation probably contributed to thesetrends, but evidence to confirm the role of biodegradation is notavailable. Benzene and vinyl chloride were most commonly de-tected above MCLs. Both of these chemicals are sufficiently vola-tile that the leachate concentration is likely influenced by thesampling point. For example, leachate stored in a tank is likely torelease VOCs prior to sampling.
Summary and Conclusions
In all cases, leachate from a wider landfill footprint was used tosupply leachate to the landfill section operated as a bioreactor.Thus, the bioreactor refuse mass was handling leachate generatedfrom a larger mass. The data support accelerated methane genera-tion at several landfills relative to rates predicted using AP-42default values, which has several implications. First, it is impor-tant to initiate gas collection quickly once moisture addition be-gins to minimize methane emissions. Second, the higher rates ofgas production in bioreactor landfills must be considered in thesize and design of gas collection systems, and also in economicevaluations of LFG to energy projects. Third, gas generation canbe expected to decrease more rapidly after refuse burial ceases.Thus, the scope and duration of gas collection and monitoringmay be decreased more rapidly at bioreactor landfills after landfillclosure.
The data collected in this study indicate that gas productionincreases as the amount of moisture added to the waste increases.A relationship between decay rate and total moisture added to thewaste was identified for bioreactor landfills that incorporatedhorizontal recirculation trenches during filling. However, a gen-
0
100
200
300
400
500
600
700
800
0 5 10 15 20
CD:PCS1D:PCS2E
Toluene(g/L)
Cell Age (yr)
Fig. 10. Toluene concentration in Landfill D leachate
eral relationship between decay rate and moisture added or water
852 / JOURNAL OF ENVIRONMENTAL ENGINEERING © ASCE / AUGUST
Downloaded 11 Jul 2011 to 193.146.160.101. Redistrib
content could not be identified. There was no indication that gasproduction increases appreciably when the water content of abioreactor landfill reaches 40%.
Most of the leachates at the landfills in this study were com-mingled from various cells. In addition, most of the leachate con-tacted waste of different ages. While these factors confound anevaluation of the impact of bioreactor operations on leachatecomposition, the observations here represent the state-of-the-practice. Nevertheless, trends in pH and BOD:COD in the biore-actor leachates were consistent with the impacts of enhancedbiological activity. Ammonia concentrations at the bioreactorlandfills also increased over time, as was observed in a previousstudy �Benson et al. 2007�. In the context of contaminants ofconcern �e.g., heavy metals, speciated organic chemicals�, there isno indication that bioreactor landfill leachate is significantly dif-ferent from leachate generated at conventional landfills. For mostcontaminants of concern, concentrations in leachate were belowMCLs �exceptions include As and several organic compounds�.Concentrations of many of the volatile organic compounds de-creased over time, most likely due to gas stripping and biodegra-dation.
The in situ treatment of leachate by recirculation decreasesenergy consumption at aerobic wastewater treatment facilities. Inaddition, some landfills must transport leachate off-site for treat-ment, e.g., Sites M and D in this study. The avoidance of off-sitetransport results in decreased truck transport and associated airemissions. Furthermore, there is increasing capacity pressure atmany publicly owned wastewater treatment plants and some havenotified landfill owners that leachate may not be accepted in thefuture. The in situ treatment of some leachate can help to mitigatecapacity problems.
This study documents several of the purported advantages ofbioreactor landfills. With these advantages come increased opera-tional requirements to manage leachate and gas.
Acknowledgments
Financial support for this study was provided by the U.S. EPAthrough the Office of Research and Development’s National RiskManagement Research Laboratory. Participation by the publicsector landfill authorities, Veolia Environmental Services, andWaste Management was critical to the success of this project.Douglas Mandeville, formerly of Geosyntec Consultants, alsoprovided a significant amount of support for the study. The writ-ers are grateful for all of the input and support provided. Thefindings in this report are solely those of the writers and do notnecessarily reflect the policies or opinions of U.S. EPA or otherswho participated in the study.
References
Allen, M. R., Braithwaite, A., and Hills, C. C. �1997�. “Trace organiccompounds in landfill gas at seven UK waste disposal sites.” Environ.Sci. Technol., 31, 1054–1061.
Bareither, C. A., Benson, C. H., Barlaz, M. A., Edil, T. B., and Tolaymat,T. M. �2010�. “Performance of North American bioreactor landfills. I:Leachate hydrology and waste settlement.” J. Environ. Eng., 136�8�,824–838.
Baun, D. L., and Christensen, T. H. �2004�. “Speciation of heavy metalsin landfill leachate: A review.” Waste Manage. Res., 22�1�, 3–23.
Benson, C. H., Barlaz, M. A., Lane, D. T., and Rawe, J. M. �2007�.
“Practice review of five bioreactor/recirculation landfills.” Waste2010
ution subject to ASCE license or copyright. Visithttp://www.ascelibrary.org

Manage., 27�1�, 13–29.Chang, W., Um, Y., and Holoman, T. R. P. �2006�. “Polycyclic aromatic
hydrocarbon �PAH� degradation coupled to methanogenesis.” Bio-technol. Lett., 28�6�, 425–430.
Christensen, T. H., et al. �2001�. “Biogeochemistry of landfill leachateplumes.” Appl. Geochem., 16�7–8�, 659–718.
Eklund, B., Anderson, E. P., Walker, B. L., and Burrows, D. B. �1998�.“Characterization of landfill gas composition at the fresh kills munici-pal solid-waste landfill.” Environ. Sci. Technol., 32, 2233–2237.
Faour, A., Reinhart, D. R., and You, H. �2007�. “First-order kinetic gasgeneration model parameters for wet landfills.” Waste Manage.,27�7�, 946–953.
Gould, J. P., Cross, W. H., and Pohland, F. G. �1990�. “Factors influenc-ing mobility of toxic metals in landfills operated with leachate re-cycle.” Amer. Chem. Soc. Symp. Series, 422, 267–291.
Haydar, M. M., and Khire, M. V. �2005�. “Recirculation using horizontaltrenches in bioreactor landfills.” J. Geotech. Geoenviron. Eng.,131�7�, 837–847.
Hilger, H. H., and Barlaz, M. A. �2006�. “Anaerobic decomposition ofrefuse in landfills and methane oxidation in landfill cover soils.”Manual of environmental microbiology, 3rd Ed., Am. Soc. Microbiol.,Washington, D.C.
Hull, M. R., Krogmann, U., and Strom, P. F. �2005�. “Composition andcharacteristics of excavated materials from a New Jersey landfill.” J.Environ. Eng., 131�3�, 478–490.
Kjeldsen, P., Barlaz, M. A., Rooker, A. P., Baun, A., Ledin, A., andChristensen, T. H. �2002�. “Present and long term composition ofMSW landfill leachate—A review.” Crit. Rev. Environ. Sci. Technol.,32�4�, 297–336.
Kjeldsen, P., and Christensen, T. H. �2001�. “A simple model for thedistribution and fate of organic chemicals in a landfill: MOCLA.”Waste Manage. Res., 19, 201–216.
Morris, J. W. F., Vasuki, N. C., Baker, J. A., and Pendleton, C. H. �2003�.“Findings from long-term monitoring studies at MSW landfill facili-ties with leachate recirculation.” Waste Manage., 23, 653–666.
Parkin, G. G., and Owen, W. F. �1986�. “Fundamentals of anaerobic di-
JOURNAL O
Downloaded 11 Jul 2011 to 193.146.160.101. Redistrib
gestion of waste sludges.” J. Environ. Eng., 112�5�, 867–921.Pinel-Raffaitin, P., Le Hecho, I., Amouroux, D., and PotinGautier, M.
�2007�. “Distribution and fate of inorganic and organic arsenic speciesin landfill leachates and biogases.” Environ. Sci. Technol., 41�13�,4536–4541.
Ponthieu, M., et al. �2007�. “Speciation analysis of arsenic in landfillleachate.” Water Res., 41�14�, 3177–3185.
Staley, B. F., and Barlaz, M. A. �2009�. “Composition of municipal solidwaste in the U.S. and implications for carbon sequestration and meth-ane yield.” J. Environ. Eng., 135�10�, 901–909.
Staley, B. F., Xu, F., Cowie, S. J., Barlaz, M. A., and Hater, G. R. �2006�.“Release of trace organic compounds during the decomposition ofmunicipal solid waste compounds.” Environ. Sci. Technol., 40�19�,5984–5991.
Tolaymat, T. M., et al. �2010�. “Evaluation of landfill gas decay constantfor municipal solid waste landfills operated as bioreactors.” J. AirWaste Manage. Assoc., 60, 91–97.
U.S. EPA. �1998�. “AP-42 emission factors for municipal solid wastelandfills—Supplement E, November 1998.” �http://www.epa.gov/ttn/chief/ap42/ch02/final/c02s04.pdf� �February 2007�.
U.S. EPA. �2003�. “National emission standards for hazardous air pollut-ants: Municipal solid waste landfills.” 40 CFR Part 63, Washington,D.C., 2227.
U.S. EPA. �2005�. “Landfill gas emissions model �LandGEM� version3.02 user’s guide.” Rep. No. EPA/600/R-05/047, Research TrianglePark, N.C.
U.S. EPA. �2006�. “Landfill bioreactor performance: Second interimreport-outer loop recycling & disposal facility, Louisville, Kentucky.”Rep. No. EPA/600/R-07/060, Cincinnati.
Woods, D. R. �1995�. “Genetic-engineering of microbial solvent produc-tion.” Trends Biotechnol., 13, 259–264.
Yazdani, R., Kieffer, J., Sananikone, K., and Augenstein, D. �2006�. “Fullscale bioreactor landfill for carbon sequestration and greenhouseemission control.” Final Technical Progress Rep., DOE Award # DE-FC26-01NT41152, �http://www.yolocounty.org/Index.aspx?page�438� �February 2007�.
F ENVIRONMENTAL ENGINEERING © ASCE / AUGUST 2010 / 853
ution subject to ASCE license or copyright. Visithttp://www.ascelibrary.org
Related Documents


![Study of Biological Methods in Landfill Leachate Treatment · membrane bioreactor are effective alternative methods in leachate systems treatment [19]. The combination of nanofiltration](https://static.cupdf.com/doc/110x72/5f051b007e708231d4114a55/study-of-biological-methods-in-landfill-leachate-treatment-membrane-bioreactor-are.jpg)


