Performance of high resolution Performance of high resolution global model over La Plata Basin global model over La Plata Basin Mario N. Nuñez Mario N. Nuñez CIMA-DCAO CIMA-DCAO CONICET / UBA CONICET / UBA UMI IFAECI 2nd Meeting Buenos Aires, Argentina April 25-27, 2011

Performance of high resolution global model over La Plata Basin Mario N. Nuñez CIMA-DCAO CONICET / UBA UMI IFAECI 2nd Meeting Buenos Aires, Argentina April.
Dec 20, 2015
Welcome message from author
This document is posted to help you gain knowledge. Please leave a comment to let me know what you think about it! Share it to your friends and learn new things together.
Transcript

Performance of high resolution Performance of high resolution global model over La Plata Basinglobal model over La Plata Basin
Mario N. NuñezMario N. NuñezCIMA-DCAOCIMA-DCAO
CONICET / UBACONICET / UBA
UMI IFAECI 2nd Meeting
Buenos Aires, Argentina April 25-27, 2011

Ongoing research in the Ongoing research in the climate of Southern climate of Southern
South AmericaSouth America Mario N. NuñezMario N. Nuñez
CIMA-DCAOCIMA-DCAOCONICET / UBACONICET / UBA
UMI IFAECI 2nd MeetingBuenos Aires, Argentina April 25-27, 2011

Performance of high resolution global Performance of high resolution global model over La Plata Basinmodel over La Plata Basin
Objective:Objective: To provide an To provide an evaluation of a present evaluation of a present climate simulation over La climate simulation over La Plata Basin and to understand Plata Basin and to understand the futures climate changes. the futures climate changes.
Josefina Blazquez and Mario Nuñez

Global Model: Global Model: MRI/JMAMRI/JMA
ResolutionResolution: 20 km and 60 km (3 : 20 km and 60 km (3 members)members)
Period: Period: 1979-20031979-2003
Initial conditionInitial condition: Observed SST : Observed SST (Rayner et al. 2003)(Rayner et al. 2003)

PRELIMINARY RESULTS
-80 -70 -60 -50 -40
-50
-40
-30
-20
-10
0
O bserv ed p recip itation D JF . (1979-2003).
0 to 1 1 to 2 2 to 3 3 to 4 4 to 5 5 to 6 6 to 7 7 to 8 8 to 9 9 to 60
-80 -70 -60 -50 -40
-50
-40
-30
-20
-10
0
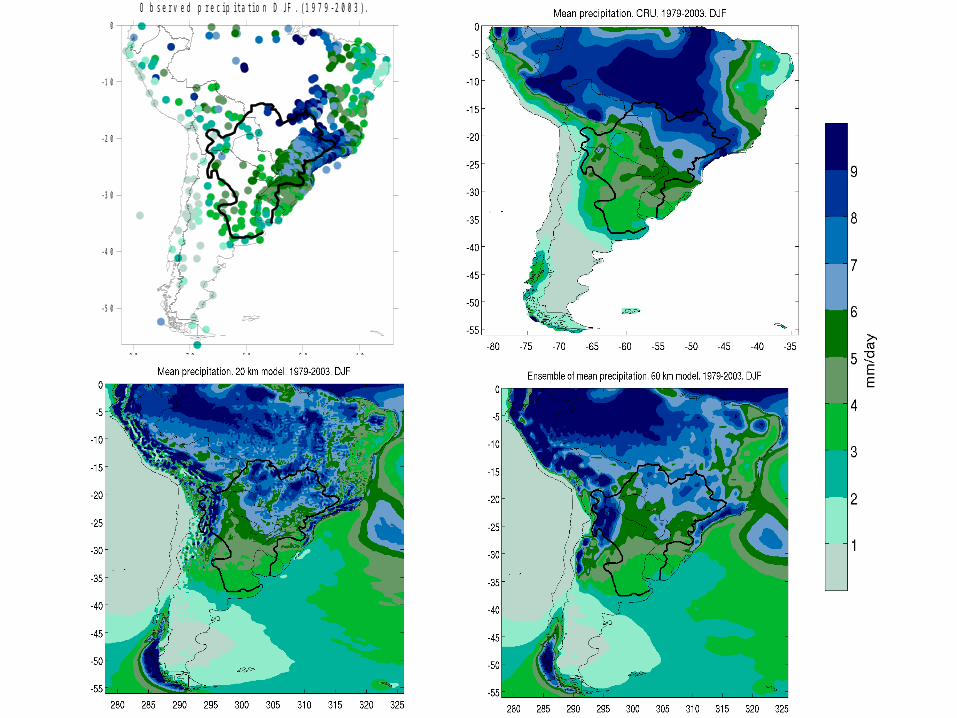
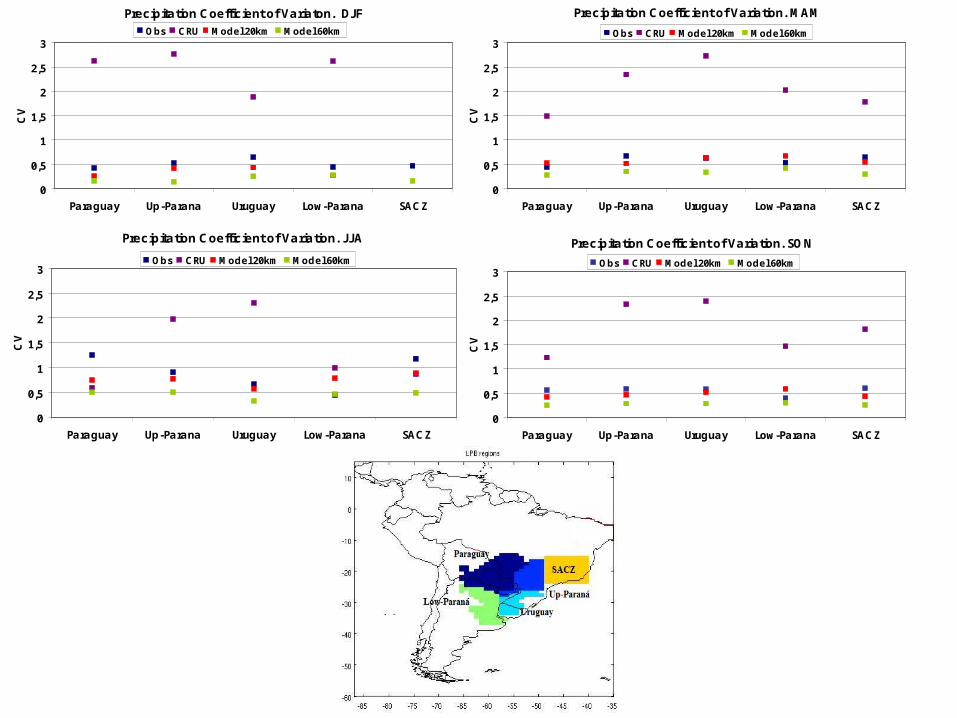
O bserv ed p recip itation J JA . (1979-2003).
0 to 1 1 to 2 2 to 3 3 to 4 4 to 5 5 to 6 6 to 7 7 to 8 8 to 9 9 to 60

Precipitación (mm/day)Paraguay
0123456789
1 2 3 4 5 6 7 8 9 10 11 12
Month
Precip
itatio
n (m
m/d
ay)
Obs CRU Model 20km Model 60km
Up-Parana
0123456789
1 2 3 4 5 6 7 8 9 10 11 12
Month
Precip
itatio
n (m
m/d
ay)
Obs CRU Model 20km Model 60km
Low-Parana
0123456789
1 2 3 4 5 6 7 8 9 10 11 12
Month
Precip
itatio
n (m
m/d
ay)
Obs CRU Model 20km Model 60km
Uruguay
0123456789
1 2 3 4 5 6 7 8 9 10 11 12
Month
Precip
itatio
n (m
m/d
ay)
Obs CRU Model 20km Model 60km
SACZ
0123456789
1 2 3 4 5 6 7 8 9 10 11 12
Month
Precip
itatio
n (m
m/d
ay)
Obs CRU Model 20km Model 60km
WinuE
In general, 60 km and 20 km resolution ex periments match quiet well with observations, except in Paraguay area were the 60 km resolution overestimate precipitation along the whole year.
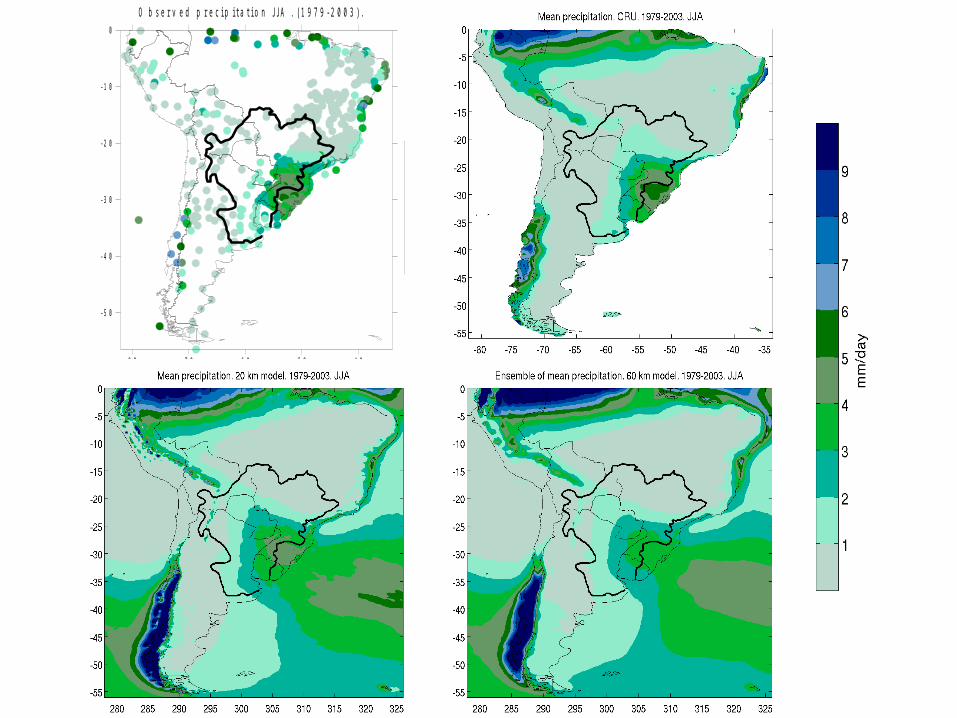
Precipitation Coefficient of Variaton. DJF
0
0,5
1
1,5
2
2,5
3
Paraguay Up-Parana Uruguay Low-Parana SACZ
CV
Obs CRU Model 20km Model 60km
Precipitation Coefficient of Variation. MAM
0
0,5
1
1,5
2
2,5
3
Paraguay Up-Parana Uruguay Low-Parana SACZ
CV
Obs CRU Model 20km Model 60km
Precipitation Coefficient of Variation. JJA
0
0,5
1
1,5
2
2,5
3
Paraguay Up-Parana Uruguay Low-Parana SACZ
CV
Obs CRU Model 20km Model 60km
Precipitation Coefficient of Variation. SON
0
0,5
1
1,5
2
2,5
3
Paraguay Up-Parana Uruguay Low-Parana SACZ
CV
Obs CRU Model 20km Model 60km
WinuE
Interanual variability in the CRU data is larger than model outputs and in the observations. This is for the four season: Summer, Fall, Winter and Spring.
Regional Climate Change Simulations over Regional Climate Change Simulations over Southern South AmericaSouthern South America with the with the
MM5/CIMA model forced by the global MM5/CIMA model forced by the global HadAM3H modelHadAM3H model
María Fernanda Cabré, Mario Nuñez and Silvina Solman

We present an analysis of a regional climate change simulation over southern South America. The MM5/CIMA model was forced by the global atmospheric model HadAM3H.
20 years for the present climate(1970-1999).
20 years for the future climate(2080-2099).

PRELIMINARY RESULTS
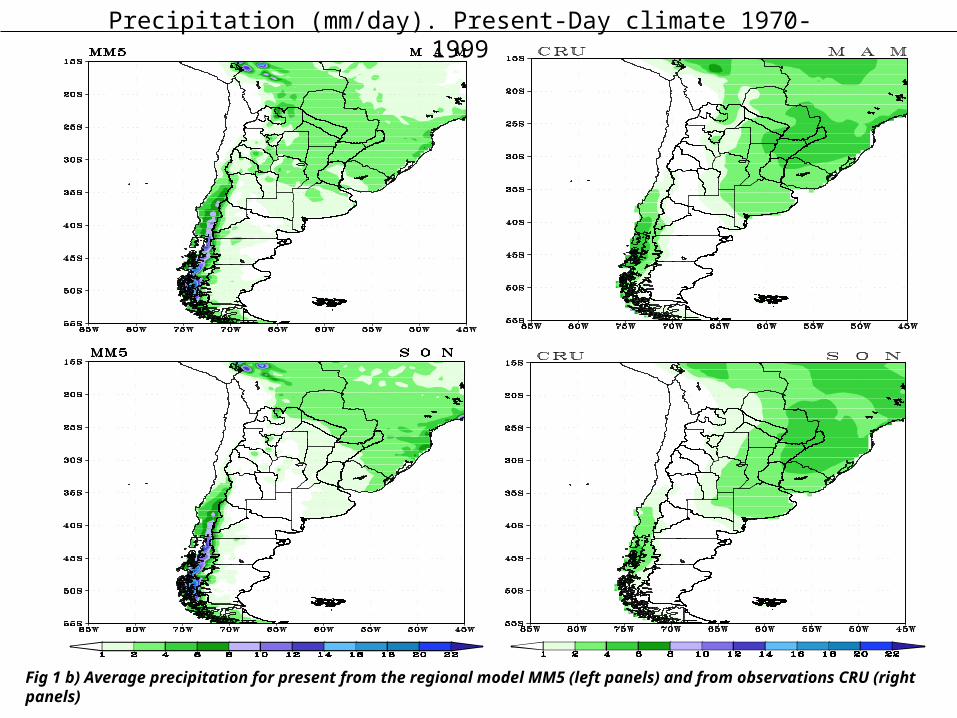
Precipitation (mm/day). Present-Day climate 1970-1999
Fig 1 b) Average precipitation for present from the regional model MM5 (left panels) and from observations CRU (right panels)
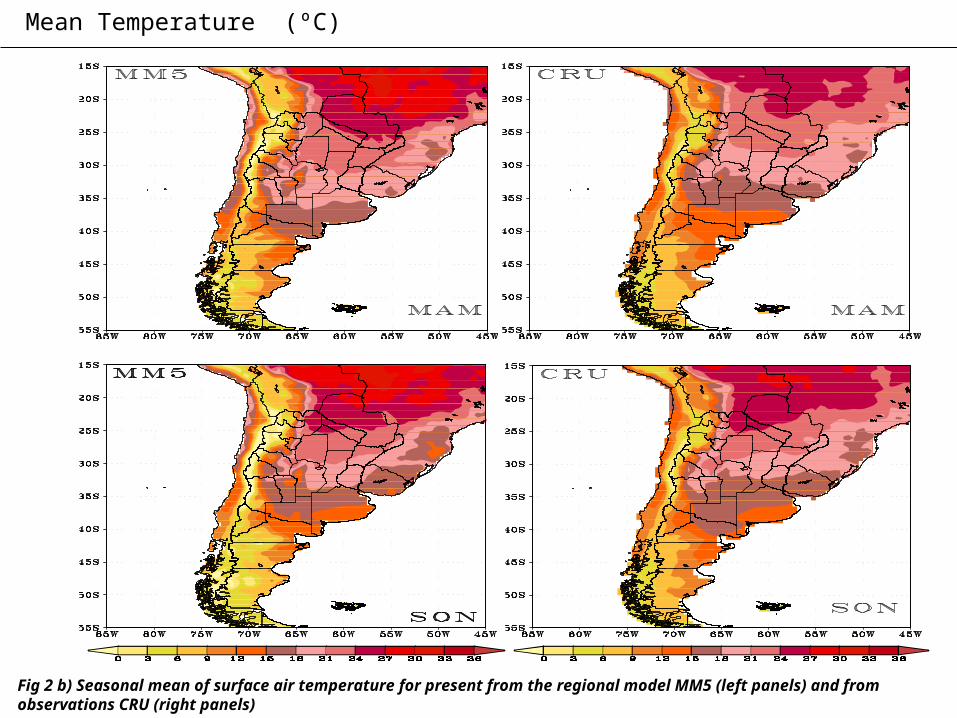
Mean Temperature (ºC)
Fig 2 b) Seasonal mean of surface air temperature for present from the regional model MM5 (left panels) and from observations CRU (right panels)
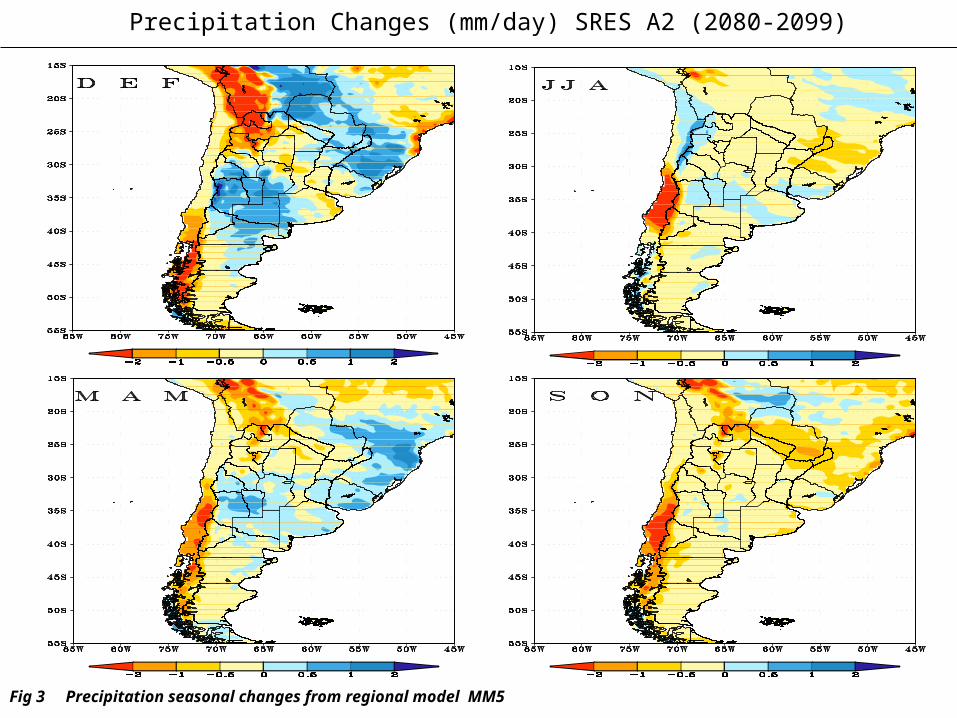
Precipitation Changes (mm/day) SRES A2 (2080-2099)
Fig 3 Precipitation seasonal changes from regional model MM5
WinuE
In central and Northeast of Argentina precipitation is increasing during summer and fall. Strong decrease during spring.

Mean Temperature Changes (ºC) SRES A2 (2080-2099)
Fig 4 Mean Temperature seasonal changes from regional model MM5
WinuE
Larger increase in temperature during spring. More than 5 degree in the north of the region.
The regional water cycle and surface energy The regional water cycle and surface energy processes of the La Plata basinprocesses of the La Plata basin H. Berbery, A. Rolla and M. NuñezH. Berbery, A. Rolla and M. Nuñez
Our particular interest is the evaluation of Our particular interest is the evaluation of the annual cycle of the hydrological cycle the annual cycle of the hydrological cycle components.components.
We performed numerical experiments using We performed numerical experiments using the HRLDAS (High Resolution Land Data the HRLDAS (High Resolution Land Data Assimilation System) 3.2 model.Assimilation System) 3.2 model.
The terrestrial water cycle and all energy The terrestrial water cycle and all energy related computations were analyzed here related computations were analyzed here using a 26-year long (1980 to 2006) data using a 26-year long (1980 to 2006) data set.set.

PRELIMINARY RESULTS


ENERGY BALANCEHRLDAS 3.2
UP PY LP UY LPBsw (short wave) 195,56 199,30 193,10 184,78 195,15
lw (long wave) 380,33 380,07 351,15 358,80 371,82
hfx (latent heat flux) 18,23 31,07 26,99 5,88 23,27
qfx (sensible heat flux) 87,33 71,33 67,90 89,76 77,77
grdflx (soil heat flux) -0,34 -0,48 -0,36 -0,37 -0,40
fdown (radiation forcing) 520,16 514,37 488,26 490,93 508,07
skintemp (skin temperature) 296,25 296,84 291,93 292,54 295,16
albedx (Albedo) 0,28 0,33 0,29 0,28 0,30
embrd (emiss) 0,95 0,93 0,95 0,95 0,94
fdown=sw*(1-albed)+lw 520,16 514,37 488,26 490,93 508,07
solnet=SW*(1.-ALBEDX) 139,824 134,298 137,108 132,129 136,249
v1:5.67051E-08*embrd*skintemp^4 413,42 410,00 391,01 393,80 405,23
Res1=fdown-hfx-qfx+grdflx-v1 0,84 1,48 2,00 1,11 1,40
Res2=( solnet + lwdn ) - sheat + ssoil - eta - ( emissi * STBOLT * (t1x**4) ) 0,84 1,48 2,00 1,11 1,40NOAHRES=( solnet + lwdn ) - sheat + ssoil - eta - ( emissi * STBOLT * (t1x**4) ) - flx1 - flx2 - flx3 -0,20 -0,27 -0,21 -0,14 -0,22

WATER BALANCE UP PY LP UY LPB
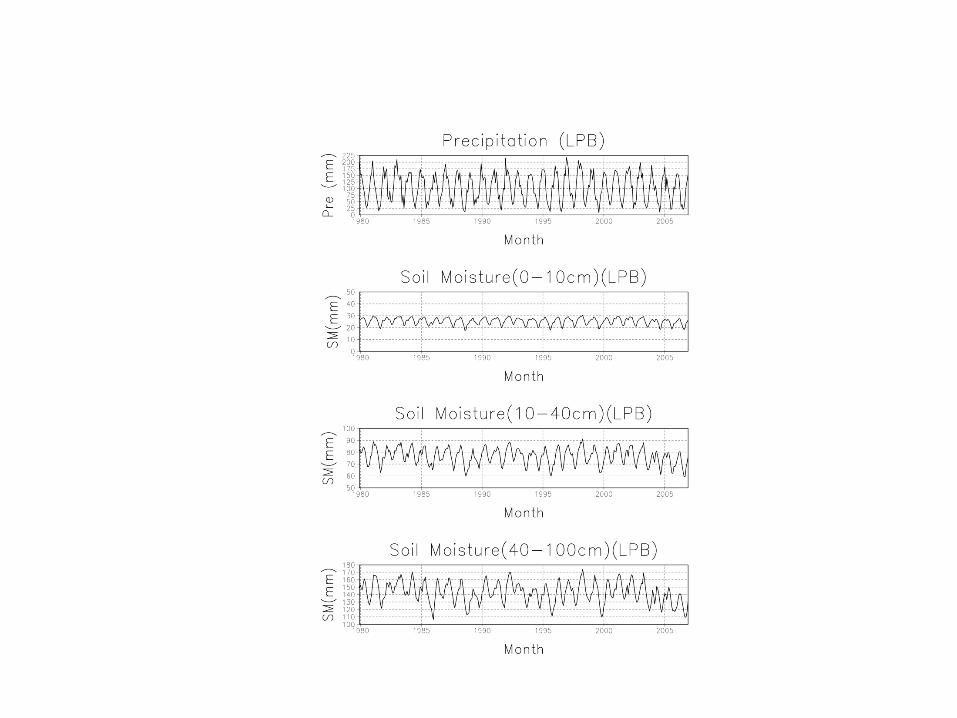
precipitation 129,33 86,44 75,56 131,97 102,87
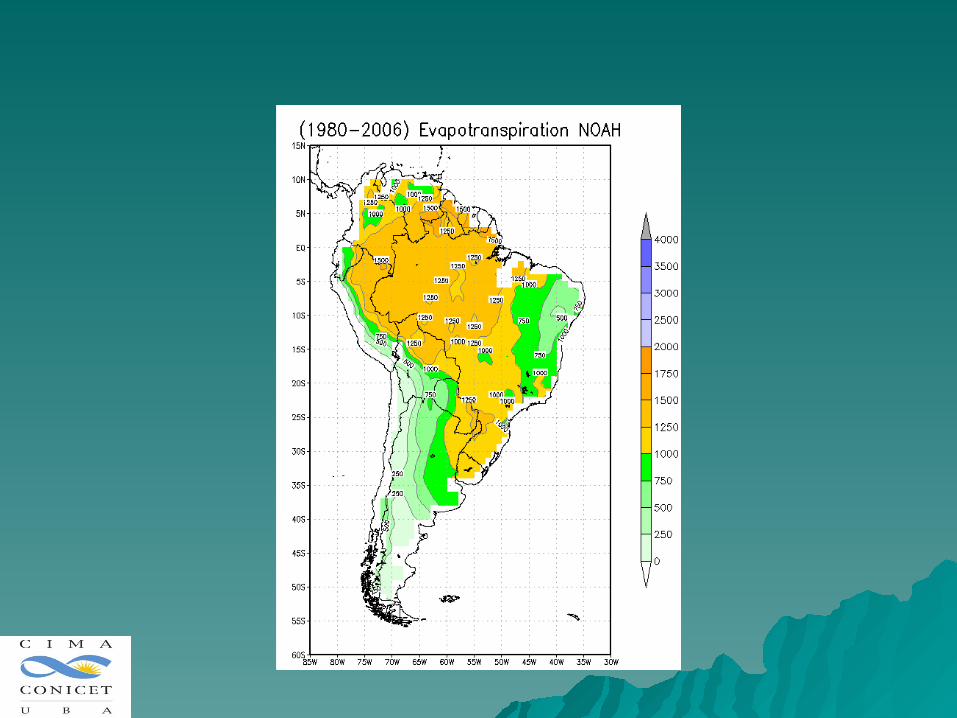
evapotranspiration 91,77 74,94 71,38 94,33 81,72
runoff 37,71 11,75 4,37 37,79 21,35
dSM/dt -0,06 -0,18 -0,15 -0,05 -0,12
Res=pp-evt-rnoff-(dSM/dt) -0,09 -0,07 -0,04 -0,11 -0,08
WinuE
The energy and water balances are close to cero, then the model is working properly. No coments about the validity of the products since we still are not validated the results with field observations.

Some applications…
Drought Indexes Period 1980-2006. Meteorological (top), hydrological (center) and agricultural drought (botton).
WinuE
We can note a meteorological, hydrological and agricultural drought from 2004-2006.

We are now searching for observations, mainly, of soil moisture, to validate the model results

Observational and Regional Modeling in the Central Andes region
Maximiliano1 Viale and Mario Nuñez
1 IANIGLA, CONICET


Precipitation forecasts using ETA model over the Andes
WinuE
We can see that the model outputs are concidents with observations (black circles), mainly in the central Andes.

WRF forced by ERA Interim (CLARIS Project)C. Zotelo, H. Berbery, A. Rolla and M. Nuñez

Comparación Precipitación
NCEP
WRFCRU
REAL GRILLADO 1X1

Thank you
Related Documents