t NASA Technical Memorandum 103105 Performance of a Supercharged Direct- Injection Stratified-Charge Rotary Combustion Engine Timothy A. Bartrand Sverdrup Technology, Inc. Lewis Research Center Group Brook Park, Ohio and Edward A. Willis National Aeronautics and Space Administration Lewis Research Center Cleveland, Ohio Prepared for the Joint Symposium on General Aviation Systems cosponsored by the AIAA and FAA Ocean City, New Jersey, April 11-12, 1990 s c.s!c;-r https://ntrs.nasa.gov/search.jsp?R=19900016666 2019-07-23T11:51:01+00:00Z

Welcome message from author
This document is posted to help you gain knowledge. Please leave a comment to let me know what you think about it! Share it to your friends and learn new things together.
Transcript
t
NASA Technical Memorandum 103105
Performance of a Supercharged Direct-
Injection Stratified-Charge RotaryCombustion Engine
Timothy A. Bartrand
Sverdrup Technology, Inc.
Lewis Research Center Group
Brook Park, Ohio
and
Edward A. Willis
National Aeronautics and Space Administration
Lewis Research Center
Cleveland, Ohio
Prepared for the
Joint Symposium on General Aviation Systems
cosponsored by the AIAA and FAA
Ocean City, New Jersey, April 11-12, 1990s
c.s!c;-r
https://ntrs.nasa.gov/search.jsp?R=19900016666 2019-07-23T11:51:01+00:00Z

PERFORMANCE OF A SUPERCHARGED DIRECT-INJECTION
STRATIFIED-CHARGE ROTARY COMBUSTION ENGINE
Timothy A. Bartrand
Sverdrup Tech. Inc., LeRC Group
2001 Aerospace Parkway
Brook Park, Ohio 44142
Edward A. Willis
Propulsion Systems DivisionNASA Lewis Research Center
Cleveland, Ohio 44135
ABSTRACT
A zero-dimensional thermodynamic performance computer model for direct-injection stratified-
charge rotary combustion engines was modified and run for a single rotor supercharged engine.
Operating conditions for the computer runs were a single boost pressure and a matrix of speeds,
loads and engine materials. A representative engine map is presented showing the predicted range
of efficient operation. After discussion of the engine map, a number of engine features are analyzed
individually. These features are: heat transfer and the influence insulating materials have on engine
performance and exhaust energy; intake manifold pressure oscillations and interactions with thecombustion chamber; and performance losses and seal friction. Finally, code running times and
convergence data are presented.
INTRODUCTION
A brief list of the features that make a rotary combustion engine (RCE) a strong candidate as
a small aircraft engine would include its large power-to-weight ratio, its ability to be configured
into an engine package of small frontal area, its porting simplicity and its inherent balance (1)*.
In addition, a direct-injection stratified-charge (DISC) RCE offers the advantages of greater fuelflexibility and improved fuel economy (2). Because of these advantages, research on DISC RCE
improvement is ongoing at NASA, in industry and at the university level. As reported in the
literature, a DISC RCE has run effectively on gasoline, jet fuel, diesel fuel and methanol (3).
Currently, brake specific fuel consumptions (bsfcs) of 243-255 g/kW-hr (0.40-0.42 lb/hp-hr) at
take-off and 231-249 g/kW-hr (0.38-0.41 lb/hp-hr) at cruise are indicated for an engine with a
cruise power of 225 kW (300 hp) (4). These values for bsfc place the DISC RCE well within or
under the fuel consumption of horizontally opposed, air cooled conventional piston aircraft engines
in a similar power class (5).
In early carbureted RCEs, the positive features mentioned above were offset partially by a number
of performance-degrading engine features. Gas seal leakage contributed to reductions in maxi-
mum torque, increases in bsfc and increases in hydrocarbon emissions (6). Flame quenching andcrevice flows resulted in lost fuel energy and also contributed to bsfc and hydrocarbon emissions
increases (7). Finally, slow combustion in the lagging part of the combustion chamber resulted in
performance loss and higher emissions (8).
Harder, multi-section apex seals are considered by many to have solved engine sealing problems
* Numbers in parentheses designate references at the end of the paper.
(3). Because the performance of Wankel engines has been improved, it is reasonable to assume
the sealing problem has been diminished, although direct measurements of leakage flows in firing
engines are difficult to perform. Combustion-related problems have been addressed through the
use of dual spark plugs and fuel injection. Suggestions for further improvement of rotary engine
performance include insulation of engine components (9), use of improved fuel injection patterns
and optimization of rotor pocket and port designs. Fuel injector improvements have been made
possible to a large extent through the use of multi-dimensional engine modelling of flow in the
combustion chamber (10).
PURPOSE
This report summarizes the results of a computer program written to analyze the performance
of a state-of-the-art DISC RCE. A zero-dimensional thermodynamic engine cycle computer model
has generated performance data for a single rotor DISC RCE. This satisfied two goals: to map
the performance of a hypothetical state-of-the-art RCE and to exercise a modified engine analysis
program. In the current study, the intent was not to predict the performance of a specific engine,
but to show the general features of DISC RCE performance and to demonstrate the capabilities of
an updated computer program.
BACKGROUND
The computer code used in this study (referred to as the MIT code) was initially developed at
MIT under the direction of Dr. John Iteywood. The first rotary engine code was derived from an
existing crank-piston engine thermodynamic model. It predicted the performance of a carbureted
RCE (11). The carbureted Wankel model employed a Wiebe function for estimation of burning
rate and included crevice/leakage effectsT Constant wall temperatures were used and manifold
thermodynamic properties were fixed. In its next stage of development at MIT, a DISC combustion
heat release model was added. The heat release rate model is described in reference (12). The most
complete reference describing the DISC MIT code is the masters thesis presented by Roberts (13).
Nguyen et al. applied Roberts' version of the MIT code to a DISC RCE designed by the Outboard
Marine Corporation and run at NASA Lewis Research Center (14). Results of a comparable
thermodynamic computer model were published by Dimplefeld (15), along with comparisons with
engine data. The final development of the MIT code at MIT was performed by Stanten (16), who
added the provision for user-defined trochoid housing surface temperatures.
At NASA Lewis Research Center, in addition to funding experimental and industry development
of the DISC RCE, computer programs are being written and modified to gain insights into engine
performance and in-cylinder processes. Multi-dimensional computer programs under development
include those of Raju (17) an,] Shih et al. (18). In thermodynamic modelling, the MIT DISC
engine code has been modified; the modified version was used to produce the results in this paper.
A number of major changes have been made to the MIT code at NASA. First, steady state heat
transfer models for the rotor face, side housings, trochoid housing and exhaust pipe were added.
Also, intake manifold pressure, temperature and mass are now allowed to vary during the intake
process. Accounting of crevice mass accumulation was changed, as well as the convergence process
and the selection of cycle initial conditions. Finally, kinematic models for seal and bearing friction
were added, along with an ad hoc model for estimating losses associated with ancillary components.
In the following section of this paper, the basic governing equations of the MIT code will be reviewed
briefly and the additions will be described in greater detail.
Due to the MIT code's much shorter computational time, it has many capabilities and can address
engine development questions that are not addressed by the multi-dimensional codes mentioned
above. On the negative side, the code relies on empirical constants. If experimental data are not
first obtained for an engine, the MIT code can only demonstrate trends. Nonetheless, such a model
as the MIT code is useful in preliminary investigations of engine configurations and may be used
as part of a larger turbocharged/turbocompounded engine simulation.
MODEL FORMULATION AND CALIBRATION
A brief overview of the original DISC MIT code governing equations is presented in this section,
along with a more detailed treatment of the additions made to the code at NASA. For more detailed
information, the reader is directed to references (11), (13) and (16).
The MIT code follows the progress of one of the three RCE combustion chambers through a number
of engine cycles until steady operation is achieved. The gas in the combustion chamber and in the
manifolds is considered well mixed.
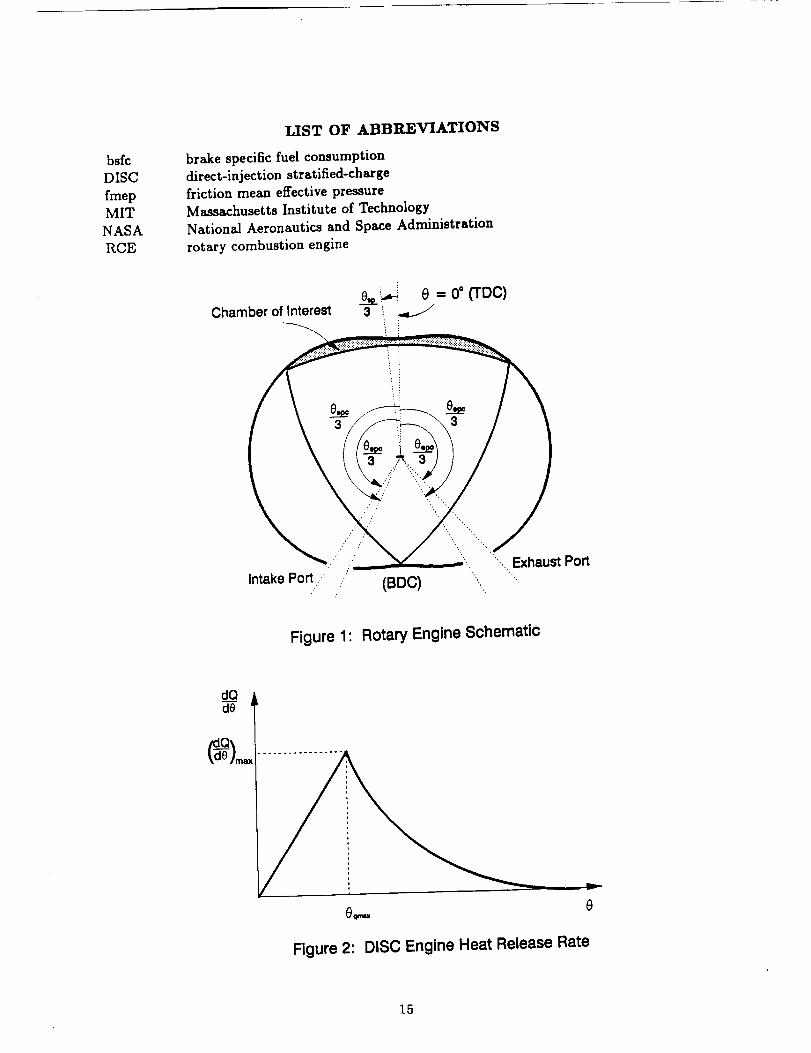
Figure 1 is a schematic of a RCE. The indicated chamber is in the minimum volume, top dead
center (TDC) position. In the MIT code, this position is designated as crank angle, 8, equal to
0 ° . The engine cycle begins as the intake port opens (when the lead apex seal begins to uncover
the intake port) at crank angle O_po and lasts for one rotor revolution. Since the rotor rotates
at 1/3 the rate of the crankshaft, one cycle lasts 3 x 360 ° -- 1080 °. O_pc, 0o_, O.po and Oepc arecrank angles for intake port closing, spark firing, exhaust port opening and exhaust port closing,
respectively. For the above definition of crank angle, 0_po, 0_pc and 0e_ are negative while 0epo
and 0c_c are positive. The MIT code is considered converged when the chamber pressure, Pc, thechamber temperature, T¢, the chamber mass, me, the intake manifold pressure, P_,_ and the rotor
and housing temperatures vary less than a user-input tolerance between engine cycles.
As the code marches in crank angle, the derivatives of chamber temperature, pressure, mass and
composition are calculated and integrated. In addition, leakage flow rates, heat transfer rates
and rate of change of manifold properties are calculated on a crank angle by crank angle basis.
Chamber pressure, temperature, mass and composition are governed by the conservation of mass,
species and energy and the ideal gas relation. Thermodynamic properties are calculated using
approximate, empirical relations for hydrocarbon-air combustion products (19). Flow rates intoand out of the chamber, including intake, exhaust and leakage through gas seals, are quasi-steady,
1-D compressible; the mass flow rate is uniquely determined by upstream temperature, pressureand composition, downstream pressure and user-input discharge coefficient. Port areas and leakage
area per chamber are also input. Backflow of chamber contents into the intake manifold is allowed.
Combustion proceeds according to an input empirical heat release rate. As shown in Figure 2, heat
release takes place in two phases. First, there is a linear rise to the maximum heat release rate:
(0 ,,,where _ is the rate of fuel energy heat release per crank angle degree, (_),,a= is the maximumheat release rate encountered and Oq,,.,a._ is the crank angle for the maximum heat release rate.
After the linear rise, the heat release rate falls exponentially according to
exp{'00.o°-'}--_- : ¢n.az T
Inputs to the MIT code combustion model are (de),,_oz and 0,,,_. r is calculated assuming
complete combustion of fuel. Ideally, a set of combustion model inputs would be provided to the
code for various engine speeds and loads, depending on the variation of the combustion process
with speed and load. In the absence of engine pressure data to derive these combustion model
inputs, the same values were used for all operating conditions in this study. The values used for
these constants were chosen based on the authors' experience and the work of Nguyen (14). Using
the same combustion model inputs for all engine operating conditions is expected to result in error,
especially at high engine speeds when the time for all the fuel to burn becomes a greater fractionof the time to complete one engine cycle for an actual engine.
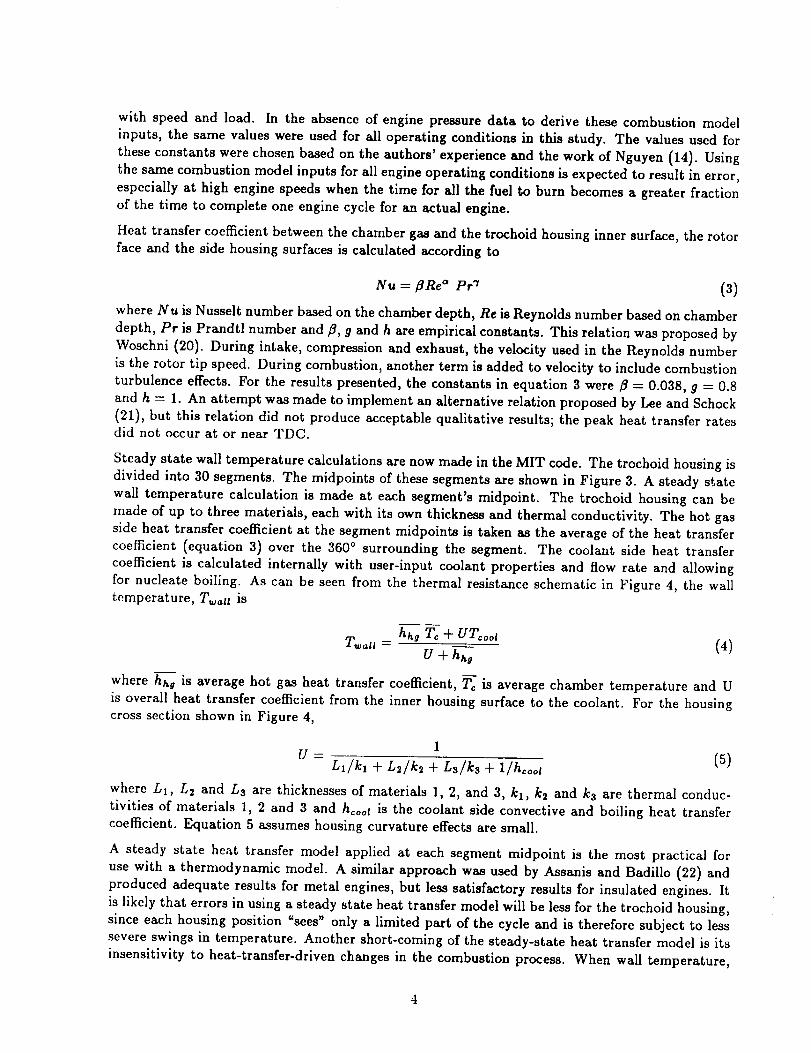
Heat transfer coefficient between the chamber gas and the trochoid housing inner surface, the rotorface and the side housing surfaces is calculated according to
Nu = _Re" Pr "7 (3)
where Nu is Nusselt number based on the chamber depth, Re is Reynolds number based on chamber
depth, Pr is Prandtl number and fl, g and h are empirical constants. This relation was proposed by
Woschni (20). During intake, compression and exhaust, the velocity used in the Reynolds numberis the rotor tip speed. During combustion, another term is added to velocity to include combustion
turbulence effects. For the results presented, the constants in equation 3 were/_ -- 0.038, g = 0.8
and h = 1. An attempt was made to implement an alternative relation proposed by Lee and Schock
(21), but this relation did not produce acceptable qualitative results; the peak heat transfer ratesdid not occur at or near TDC.
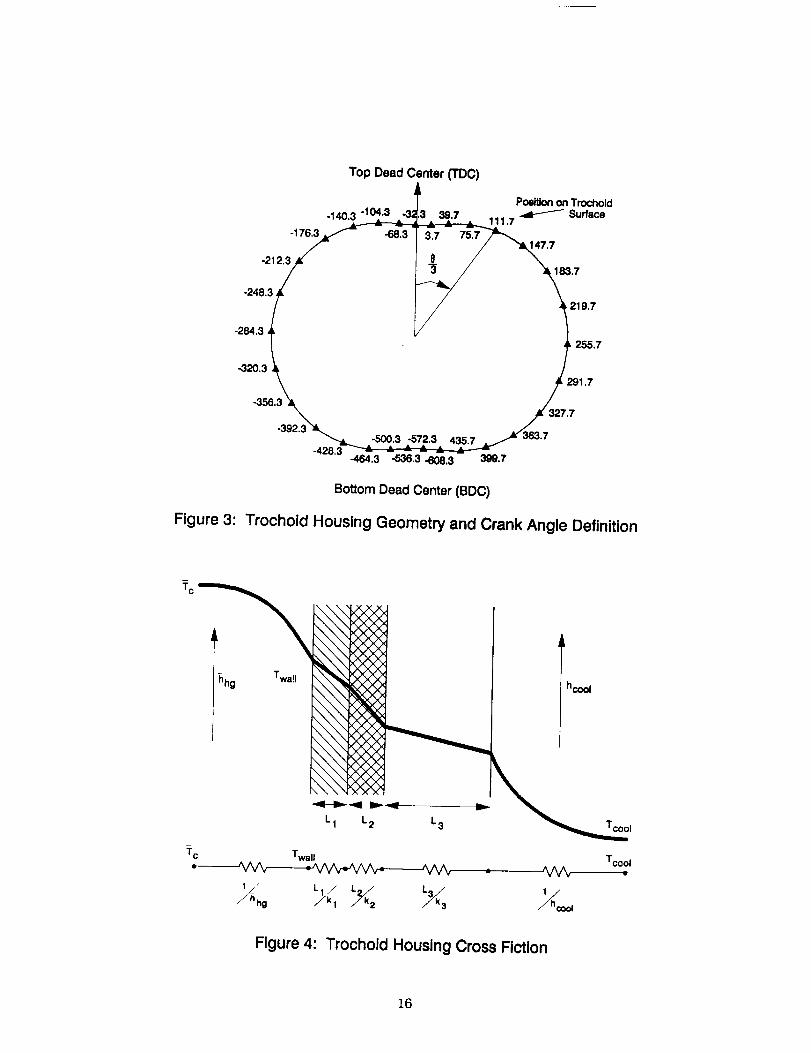
Steady state wall temperature calculations are now made in the MIT code. The trochoid housing is
divided into 30 segments. The midpoints of these segments are shown in Figure 3. A steady st.ate
wall temperature calculation is made at each segment's midpoint. The trochoid housing can be
made of up to three materials, each with its own thickness and thermal conductivity. The hot gas
side heat transfer coefficient at the segment midpoints is taken as the average of the heat transfercoefficient (equation 3) over the 360 ° surrounding the segment. The coolant side heat transfer
coefficient is calculated internally with user-input coolant properties and flow rate and allowing
for nucleate boiling. As can be seen from the thermal resistance schematic in Figure 4, the walltemperature, T_a_ is
T,,,=l_ = hhg T¢ + UT¢oo_U + hh---_ (4)
where hhg is average hot gas heat transfer coefficient, _ is average chamber temperature and U
is overall heat transfer coefficient from the inner housing surface to the coolant. For the housingcross section shown in Figure 4,
1
U = L,/k, + L_/k_ + Ls/ks + 1/hcoo, (5)
where La, L2 and Ls are thicknesses of materials 1, 2, and 3, kl, k2 and ks are thermal conduc-
tivities of materials 1, 2 and 3 and hcoot is the coolant side convective and boiling heat transfercoefficient. Equation 5 assumes housing curvature effects are small.
A steady state heat transfer model applied at each segment midpoint is the most practical for
use with a thermodynamic model. A similar approach was used by Assanis and Badillo (22) andproduced adequate results for metal engines, but less satisfactory results for insulated engines. It
is likely that errors in using a steady state heat transfer model will be less for the trochoid housing,since each housing position "sees" only a limited part of the cycle and is therefore subject to less
severe swings in temperature. Another short-coming of the steady-state heat transfer model is its
insensitivity to heat-transfer-driven changes in the combustion process. When wall temperature,
porosityand radiationcharacteristicsarechanged, the combustion processmay alsochange. Unless
the MIT code combustion model isrecalibratedforeach setofhousing and rotormaterials,changes
in the combustion processwillnot be reflectedin predictedperformance.
Side.platetemperatures arecalculatedsimilarlytotrochoidhousing temperatures,with the excep-
tionthat the coolantsideheat transfercoefficientisinput and does not includenucleateboiling.
The rotor face temperature also is calculated assuming one dimensional steady state heat transfer.
The hot gas side heat transfer coefficient and gas temperature are set equal to the cycle averagesand the heat transfer coefficient is a user-input value. The value used for rotor coolant heat transfer
coefficient was estimated reflecting a "cocktail shaker" type oil flow in the rotor cavity.
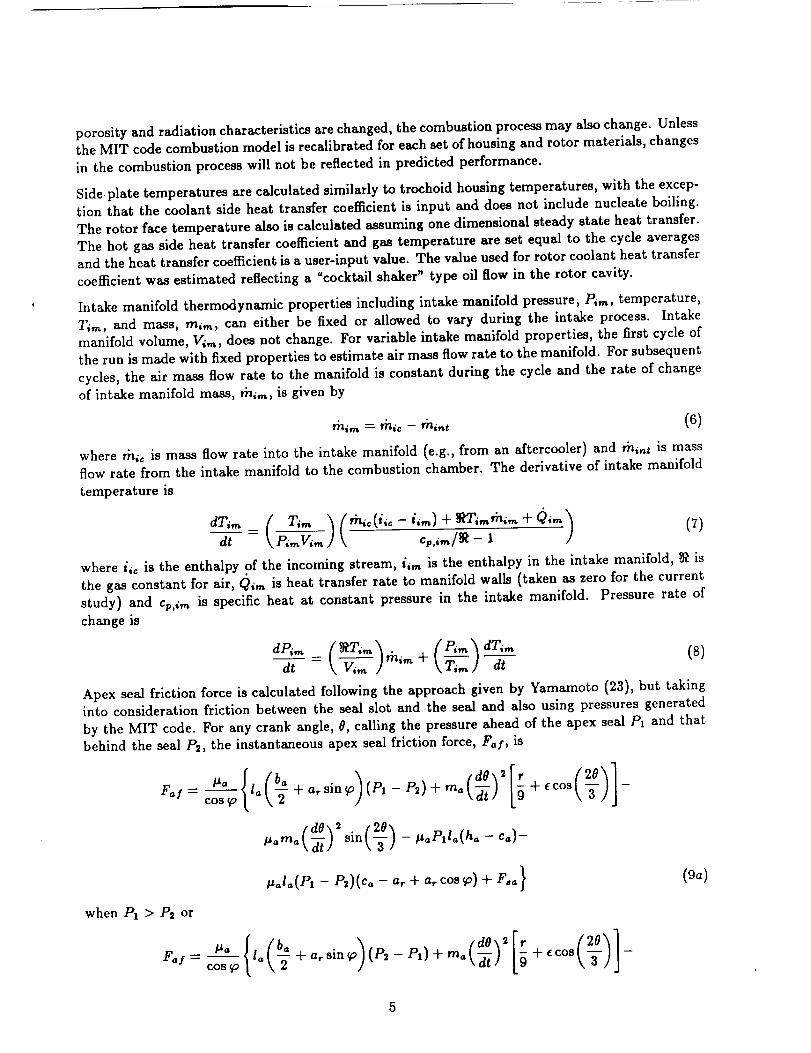
Intake manifold thermodynamic properties including intake manifold pressure, P_, temperature,
Ti,_, and mass, rni,_, can either be fixed or allowed to vary during the intake process. Intake
manifold volume, V_, does not change. For variable intake manifold properties, the first cycle ofthe run is made with fixed properties to estimate air mass flow rate to the manifold. For subsequent
cycles, the air mass flow rate to the manifold is constant during the cycle and the rate of change
of intake manifold mass, rh_,_, is given by
= - rh .t (6)
where rhic is mass flow rate into the intake manifold (e.g., from an aftercooler) and rh_.t is mass
flow rate from the intake manifold to the combustion chamber. The derivative of intake manifold
temperature is
dt \ P_,_V_,_ ] \ /c_,i,,_/_- 1
where iic is the enthalpy of the incoming stream, i_., is the enthalpy in the intake manifold, _ is
the gas constant for air, (_,_ is heat transfer rate to manifold walls (taken as zero for the current
study) and %,_._ is specific heat at constant pressure in the intake manifold. Pressure rate of
change is
at \ _ } rn_,,_ + \ T,,,, ] - dt
Apex seal friction force is calculated following the approach given by Yamamoto (23), but takinginto consideration friction between the seal slot and the seal and also using pressures generated
by the MIT code. For any crank angle, 0, calling the pressure ahead of the apex seal P1 and thatbehind the seal P2, the instantaneous apex seal friction force, F_/, is
)Fay- p° l,, +a. sin_ (Px-P2)+m. _ +ecos -cos_o
m (dO 2U- -\-_] sin(_)- laoPll.(h.-c.)-
ud°(P, - P2)(co - + cos + (9a)
when P1 > P2 or
r./_ la. 1. +a. sin_o (P2-Px)+m. -_ +ecos -cos
IJ. ma \ dt /
- - ¢,,+ a,co o)+ Fo.1 (gb)
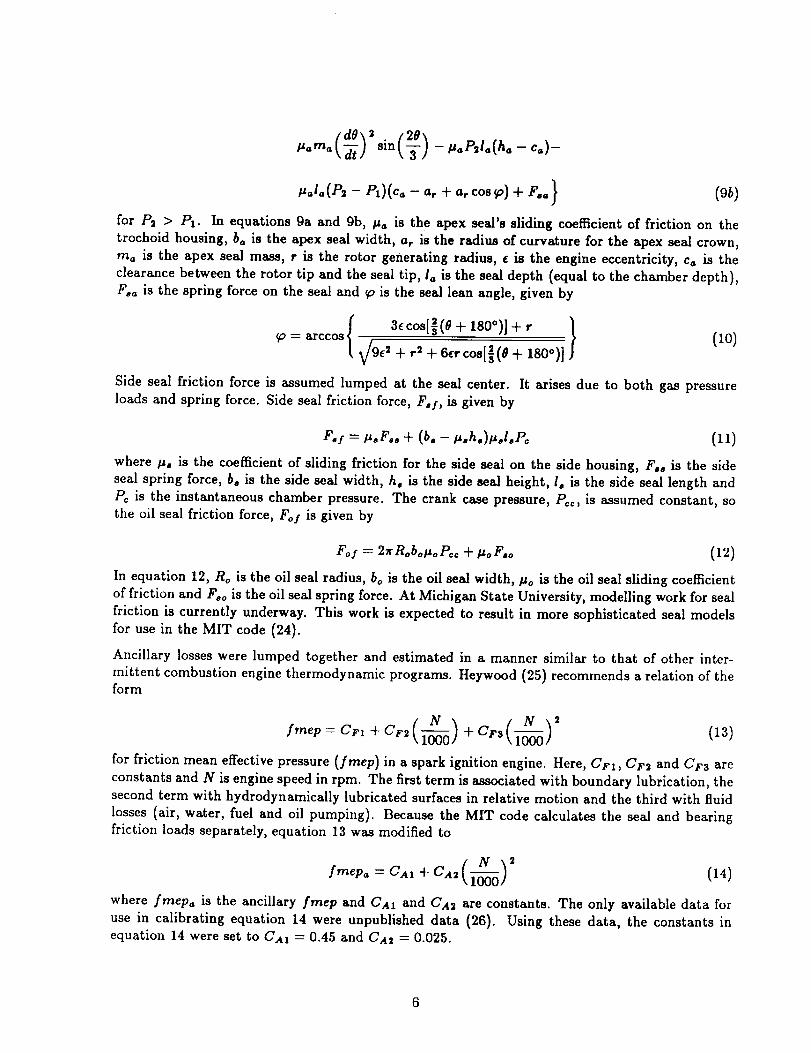
for P2 > PI. In equations9a and 9b, /J_isthe apex seal'sslidingcoefficientof frictionon the
trochoidhousing,bo isthe apex sealwidth,ar isthe radiusof curvatureforthe apex sealcrown,
m_ isthe apex sealmass, r isthe rotorgeneratingradius,_ isthe engine eccentricity,ca isthe
clearancebetween the rotortipand the sealtip,l,isthe sealdepth (equalto the chamber depth),
F_ isthe springforceon the sealand _oisthe sealleanangle,given by
{ 3ec°s[_(O + 1800)] + r } (10)= arccos _/9e' + r' + 6,r cos[](O+ 180°)]
Side seal friction force is assumed lumped at the seal center. It arises due to both gas pressure
loads and spring force. Side seal friction force, FoI, is given by
Fsf = I_.Fss J- (b. - fgshs)_slsPe (11)
where po is the coefficient of sliding friction for the side seal on the side housing, Fss is the side
seal spring force, bo is the side seal width, ho is the side seal height, lo is the side seal length and
Pc is the instantaneous chamber pressure. The crank case pressure, Pcc, is assumed constant, sothe oil seal friction force, Fo/is given by
For = 27rRobolaoPcc + I_oF, o (12)
In equation 12, Ro is the oil seal radius, bo is the oil seal width,/_o is the oil seal sliding coefficient
of friction and Foo is the oil seal spring force. At Michigan State University, modelling work for seal
friction is currently underway. This work is expected to result in more sophisticated seal models
for use in the MIT code (24).
Ancillary losses were lumped together and estimated in a manner similar to that of other inter-
mittent combustion engine thermodynamic programs. Heywood (25) recommends a relation of theform
/ \N N 2fmep = CF, + C.,tl--_) + CF,(_-O) (13)
for friction mean effective pressure (fmep) in a spark ignition engine. Here, CF1, CF2 and CF3 are
constants and N is engine speed in rpm. The first term is associated with boundary lubrication, thesecond term with hydrodynamically lubricated surfaces in relative motion and the third with fluid
losses (air, water, fuel and oil pumping). Because the MIT code calculates the seal and bearingfriction loads separately, equation 13 was modified to
N 2
fmep. = Cal +Ca,(i--_) (14)
where fmep_, is the ancillary fmep and CA1 and CA2 are constants. The only available data for
use in calibrating equation 14 were unpublished data (26). Using these data, the constants inequation 14 were set to CA1 = 0.45 and CA2 = 0.025.
6
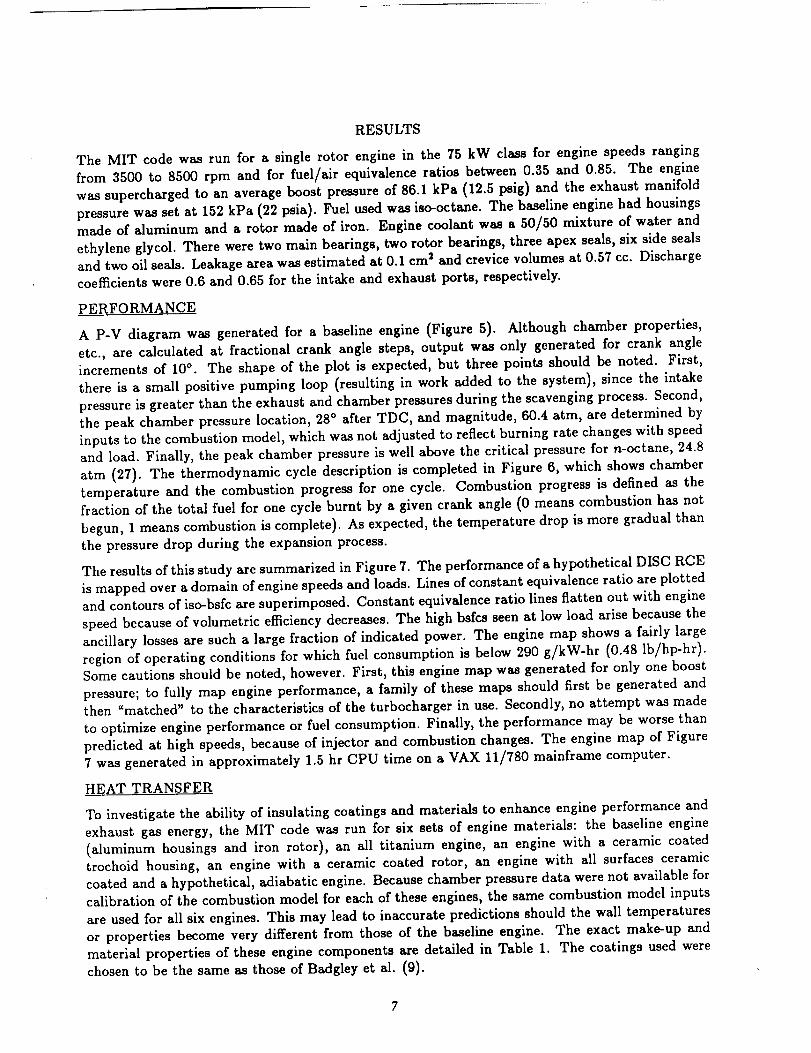
RESULTS
The MIT codewas run for a single rotor engine in the 75 kW class for engine speeds ranging
from 3500 to 8500 rpm and for fuel/air equivalence ratios between 0.35 and 0.85. The engine
was supercharged to an average boost pressure of 86.1 kPa (12.5 psig) and the exhaust manifold
pressure was set at 152 kPa (22 psia). Fuel used was isa-octane. The baseline engine had housingsmade of aluminum and a rotor made of iron. Engine coolant was a 50/50 mixture of water and
ethylene glycol. There were two main bearings, two rotor bearings, three apex seals, six side sealsand two oil seals. Leakage area was estimated at 0.1 cm _ and crevice volumes at 0.57 cc. Discharge
coefficients were 0.6 and 0.65 for the intake and exhaust ports, respectively.
PERFORMANCE
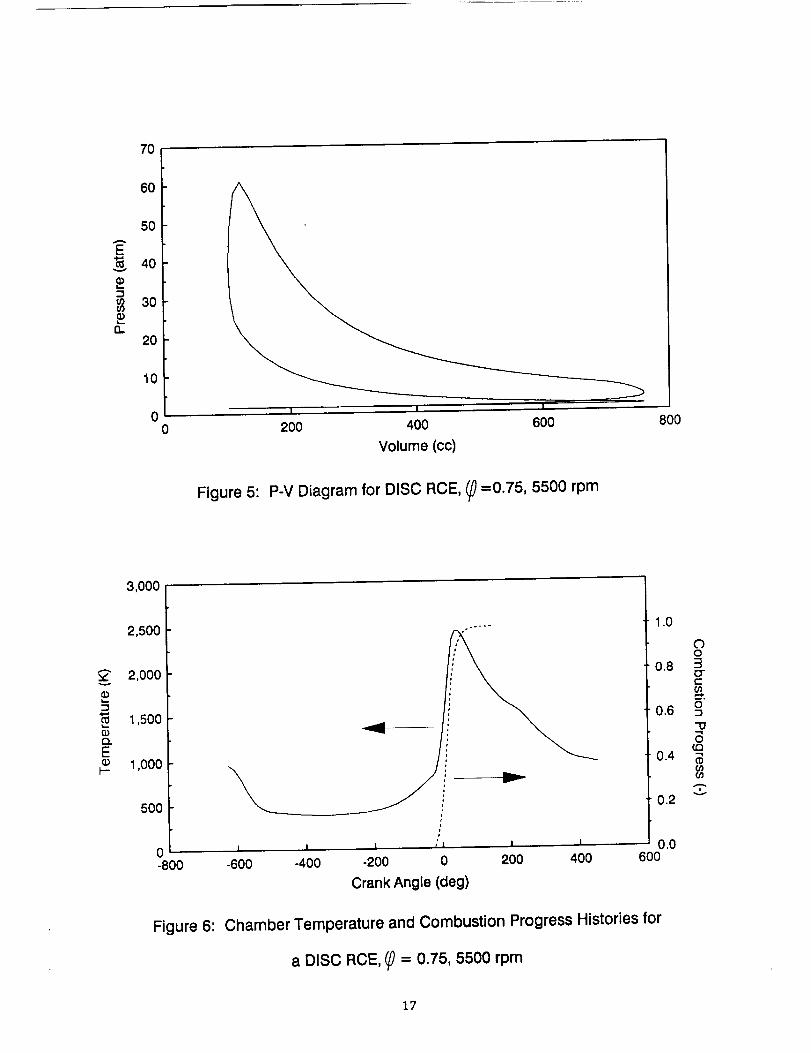
A P-V diagram was generated for a baseline engine (Figure 5). Although chamber properties,
etc., are calculated at fractional crank angle steps, output was only generated for crank angleincrements of 10°. The shape of the plot is expected, but three points should be noted. First,
there is a small positive pumping loop (resulting in work added to the system), since the intake
pressure is greater than the exhaust and chamber pressures during the scavenging process. Second,
the peak chamber pressure location, 28 ° after TDC, and magnitude, 60.4 atm, are determined by
inputs to the combustion model, which was not adjusted to reflect burning rate changes with speedand load. Finally, the peak chamber pressure is well above the critical pressure for n-octane, 24.8
atm (27). The thermodynamic cycle description is completed in Figure 6, which shows chamber
temperature and the combustion progress for one cycle. Combustion progress is defined as thefraction of the total fuel for one cycle burnt by a given crank angle (0 means combustion has not
begun, 1 means combustion is complete). As expected, the temperature drop is more gradual than
the pressure drop during the expansion process.
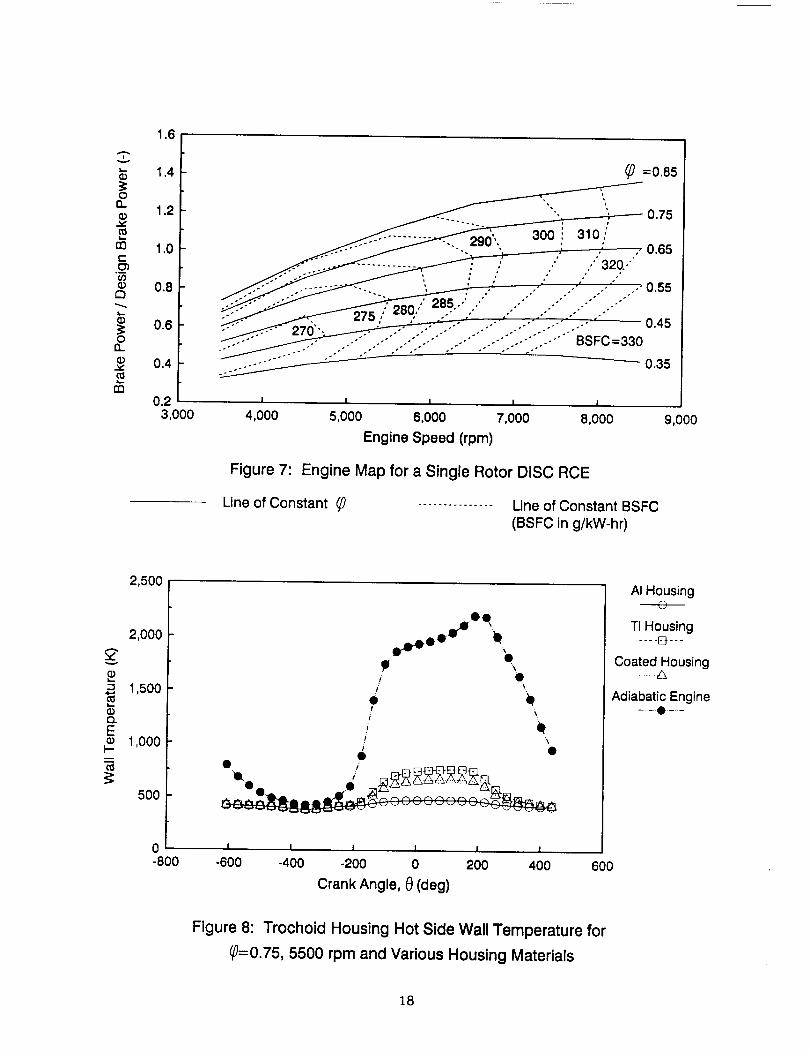
The results of this study are summarized in Figure 7. The performance of a hypothetical DISC RCE
is mapped over a domain of engine speeds and loads. Lines of constant equivalence ratio are plottedand contours of iso-bsfc are superimposed. Constant equivalence ratio lines flatten out with engine
speed because of volumetric efficiency decreases. The high bsfcs seen at low load arise because the
ancillary losses are such a large fraction of indicated power. The engine map shows a fairly large
region of operating conditions for which fuel consumption is below 290 g/kW-hr (0.48 lb/hp-hr).Some cautions should be noted, however. First, this engine map was generated for only one boost
pressure; to fully map engine performance, a family of these maps should first be generated andthen "matched" to the characteristics of the turbocharger in use. Secondly, no attempt was made
to optimize engine performance or fuel consumption. Finally, the performance may be worse than
predicted at high speeds, because of injector and combustion changes. The engine map of Figure
7 was generated in approximately 1.5 hr CPU time on a VAX 11/780 mainframe computer.
HEAT TRANSFER
To investigate the ability of insulating coatings and materials to enhance engine performance and
exhaust gas energy, the MIT code was run for six sets of engine materials: the baseline engine
(aluminum housings and iron rotor), an all titanium engine, an engine with a ceramic coatedtrochoid housing, an engine with a ceramic coated rotor, an engine with all surfaces ceramic
coated and a hypothetical, adiabatic engine. Because chamber pressure data were not available for
calibration of the combustion model for each of these engines, the same combustion model inputs
are used for all six engines. This may lead to inaccurate predictions should the wall temperatures
or properties become very different from those of the baseline engine. The exact make-up and
material properties of these engine components are detailed in Table 1. The coatings used werechosen to be the same as those of Badgley et al. (9).
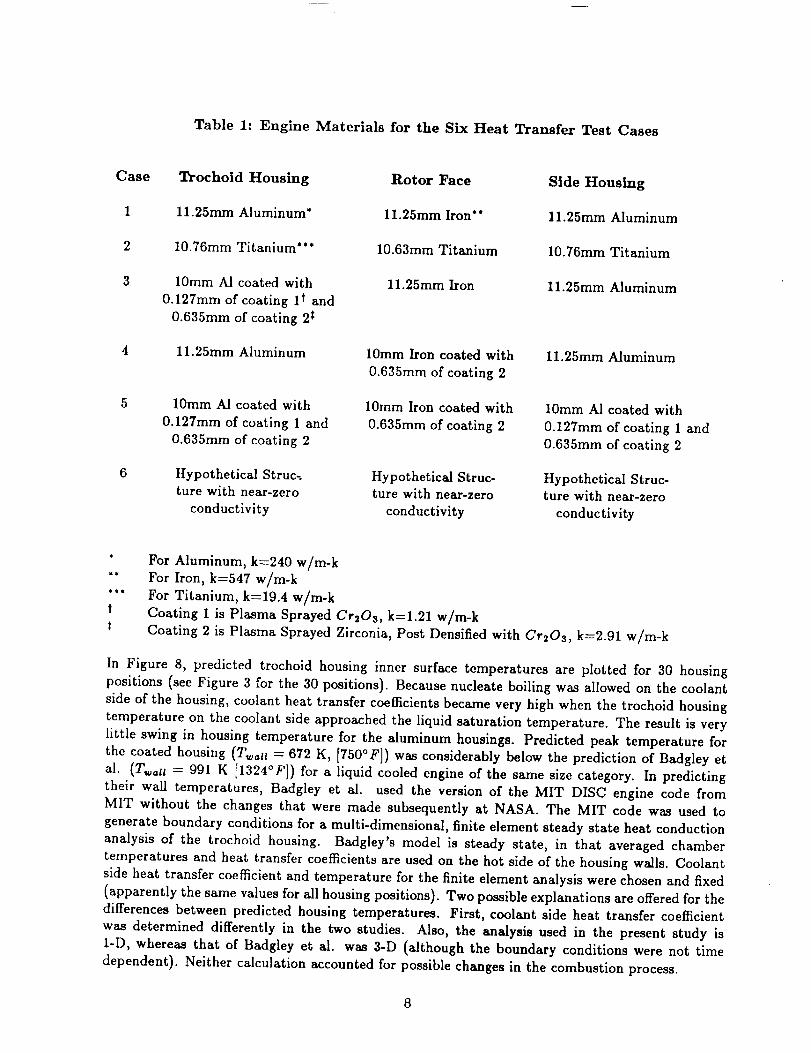
Table 1: Englne Materials for the Six Heat Transfer Test Cases
Case
1
2
3
4
Trochoid Housing
11.25mm Aluminum*
10.76mm Titanium***
10mm Al coated with
0.127mm of coating 1 t and
0.635mm of coating 2t
11.25mm Aluminum
10mm A1 coated with
0.127mm of coating 1 and
0.635mm of coating 2
Hypothetical Struc_ture with near-zero
conductivity
Rotor Face
ll.25mm Iron**
10.63mm Titanium
ll.25mm Iron
10mm Iron coated with
0.635mm of coating 2
10mm Iron coated with
0.635mm of coating 2
Hypothetical Struc-ture with near-zero
conductivity
Side Housing
11.25mm Aluminum
10.76mm Titanium
11.25mm Aluminum
11.25mm Aluminum
10mm A1 coated with
0.127mm of coating 1 and
0.635mm of coating 2
Hypothetical Struc-ture with near-zero
conductivity
* For Aluminum, k=240 w/m-k
*" For Iron, k=547 w/m-k
*** For Titanium, k=19.4 w/m-k
t Coating 1 is Plasma Sprayed Cr2Os, k=l.21 w/m-k
t Coating 2 is Plasma Sprayed Zirconia, Post Densified with Cr203, k=2.91 w/m-k
In Figure 8, predicted trochoid housing inner surface temperatures are plotted for 30 housingpositions (see Figure 3 for the 30 positions). Because nucleate boiling was allowed on the coolant
side of the housing, coolant heat transfer coefficients became very high when the trochoid housing
temperature on the coolant side approached the liquid saturation temperature. The result is very
little swing in housing temperature for the aluminum housings. Predicted peak temperature for
the coated housing (T,_, = 672 K, [750°F]) was considerably below the prediction of Badgley et
al. (T_, = 991 K [1324°F]) for a liquid cooled engine of the same size category. In predicting
their wall temperatures, Badgley et al. used the version of the MIT DISC engine code fromMIT without the changes that were made subsequently at NASA. The MIT code was used to
generate boundary conditions for a multi-dimensional, finite element steady state heat conduction
analysis of the trochoid housing. Badgley's model is steady state, in that averaged chamber
temperatures and heat transfer coefficients are used on the hot side of the housing walls. Coolantside heat transfer coefficient and temperature for the finite element analysis were chosen and fixed
(apparently the same values for all housing positions). Two possible explanations are offered for the
differences between predicted housing temperatures. First, coolant side heat transfer coefficient
was determined differently in the two studies. Also, the analysis used in the present study is
I-D, whereas that of Badgley et al. was 3-D (although the boundary conditions were not time
dependent). Neither calculation accounted for possible changes in the combustion process.

Alsofound on Figure 8 are predicted housing temperatures for an all-titanium engine and a hypo-
thetical adiabatic engine. The predicted housing temperatures for all the engines shown in Figure
8 are well below those of a truly adiabatic engine.
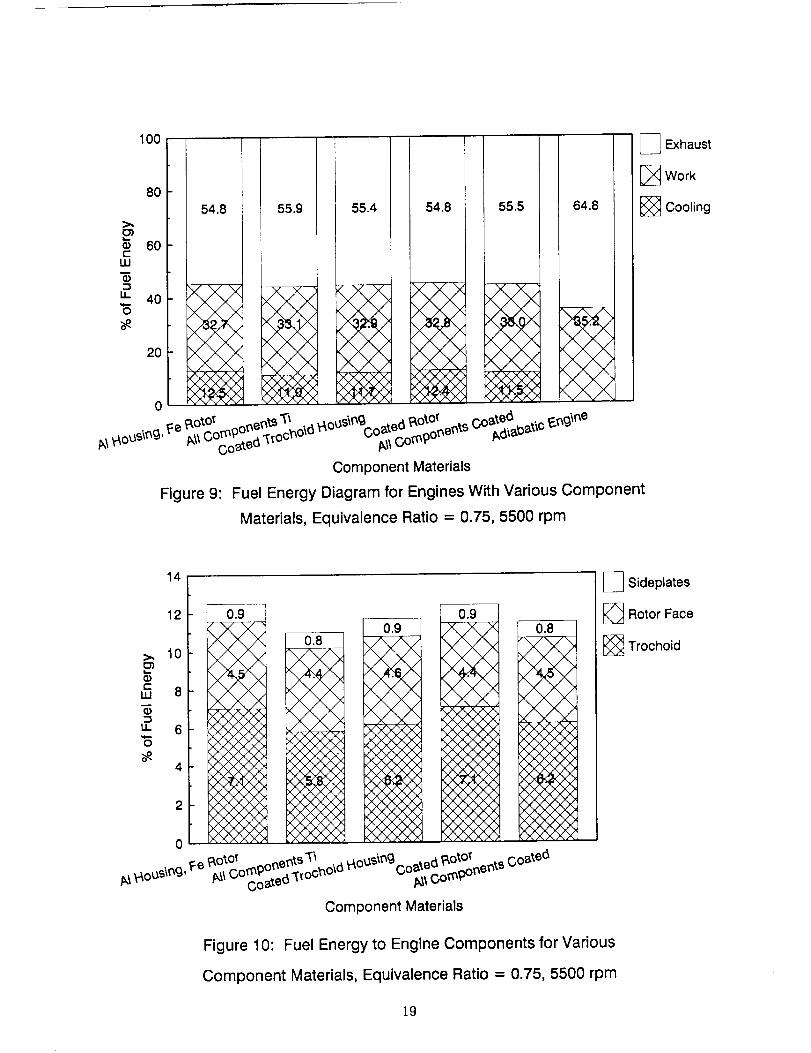
Figure 9 illustrates the redistribution of fuel energy from the coolant to work and exhaust whenthe engine is insulated. In all cases but the adiabatic engine, only modest decreases in coolant load
are realized. In general, most of the fuel energy diverted from the coolant appears in the exhaust
stream, as demonstrated in the adiabatic engine case. Note that this analysis was performed at
only one engine speed, 5500 rpm. At lower engine speeds, since heat transfer is time (and not crank
angle) dependent, the fraction of the fuel energy lost to the coolant will be higher and the influenceof insulating materials more pronounced. The effect insulating materials have on mean exhaust
gas temperature, brake power and bsfc is shown in Table 2. Volumetric efficiency for the coatedand titanium engines was nearly the same as that of the baseline engine (93 %). The volumetric
efficiency of the hypothetical adiabatic engine was 91%.
Table 2: Influence of Engine Materials on Performance
% of Fuel Energy
Case to Cooling (%) T_xu (K)
Normalized Brake
Power (-) BSFC (g/kW-hr)
1 12.5 964.5 1.0 281
2 11.0 975.5 1.012 278
3 11.7 969.7 1.008 279
4 12.4 965.7 1.002 281
5 11.5 971.3 1.008 279
6 0 1064.6 1.06 260
In Figure 10, the breakdown of coolant heat transfer to the trochoid housing, the rotor face and
the sideplates is shown. Since the percentage of heat transfer through the rotor and sideplates
is small (in terms of fuel energy), it appears that insulating the trochoid housing would have agreater impact on exhaust gas energy. Because the apex seals scrape the trochoid surface, though,care must be taken in choosing a housing coating and applying it to the surface. Although weight
was not analyzed in this study, it is suggested an added benefit of an insulated aircraft engine is
its lower cooling system weight.
MANIFOLD PROPERTIES
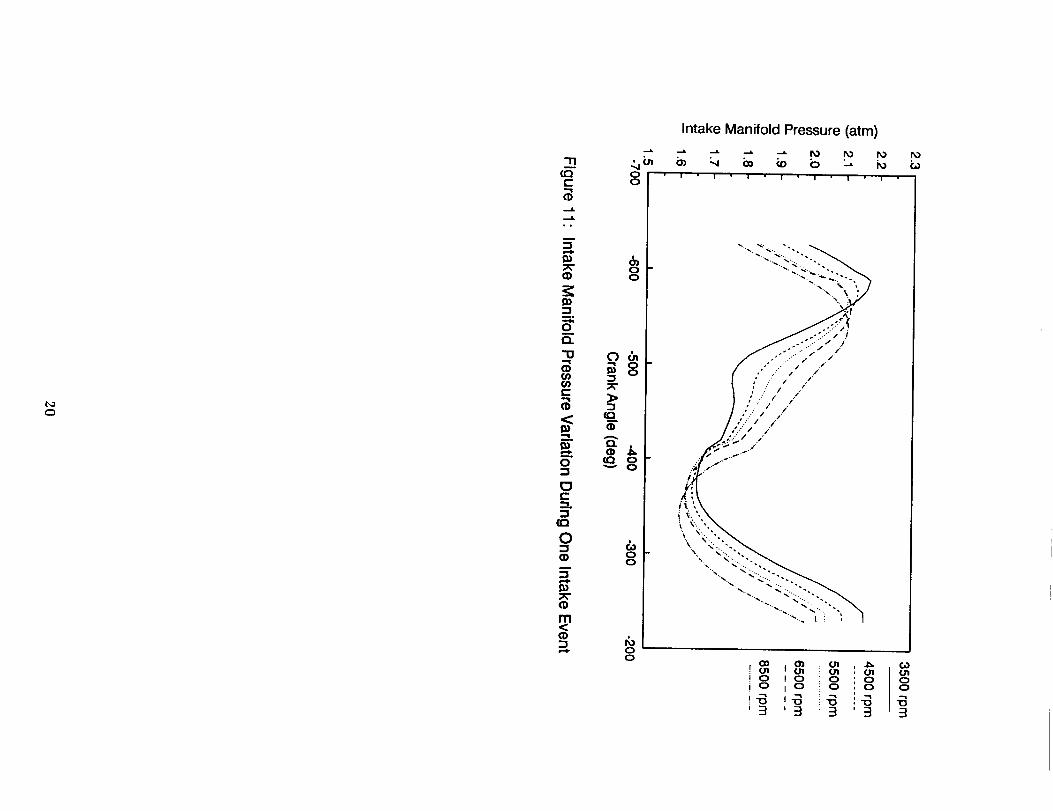
Since MIT code results were last published, provisions for variable intake manifold pressure, tem-
perature and mass have been added. The formulation is described in this report's Model Formula-tion and Calibration section. The instantaneous intake manifold pressures for an engine run with
an equivalence ratio of 0.75 and engine speeds ranging from 3500 to 8500 rpm are shown in Figure
11. Although a relatively large manifold volume was used (equal to the engine displacement vol-
ume), the intake manifold pressure variation during one intake event is large, --, 30% of the average
intake manifold pressure at 3500 rpm. The peak pressure decreases and shifts to later crank angles
as engine speed is increased. Since peak pressures are high and early in the intake process (before
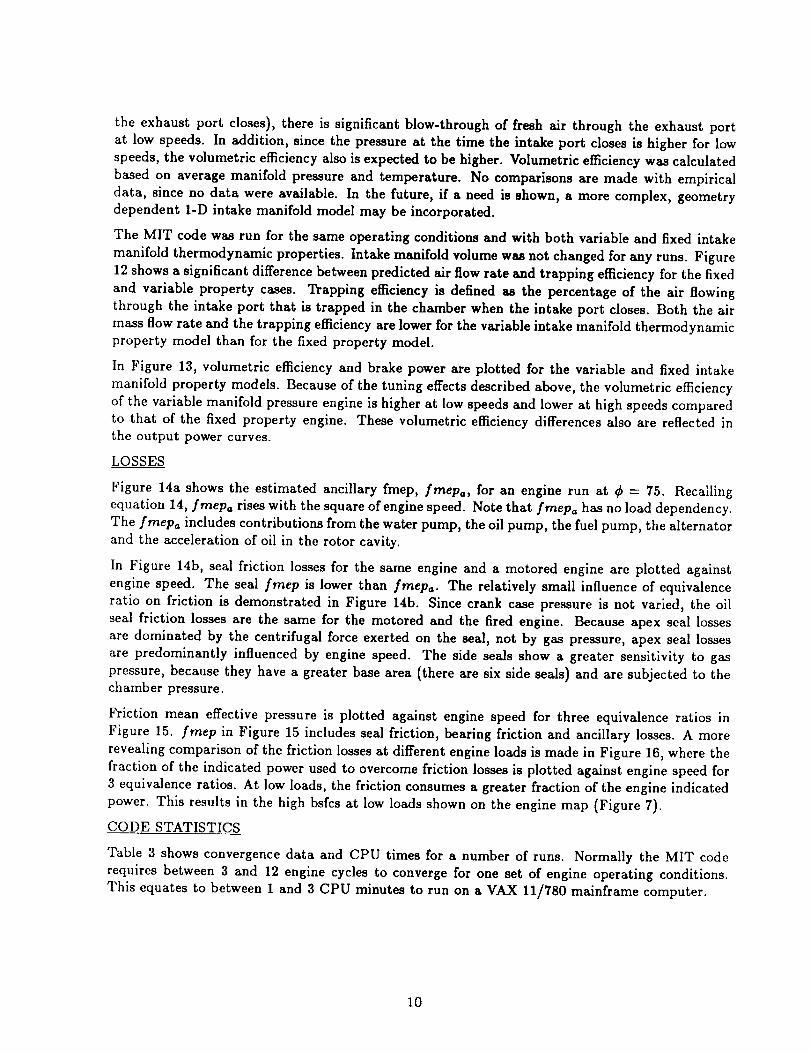
the exhaustport closes), there is significant blow-through of fresh air through the exhaust port
at low speeds. In addition, since the pressure at the time the intake port closes is higher for low
speeds, the volumetric efficiency also is expected to be higher. Volumetric efficiency was calculated
based on average manifold pressure and temperature. No comparisons are made with empirical
data, since no data were available. In the future, if a need is shown, a more complex, geometrydependent 1-D intake manifold model may be incorporated.
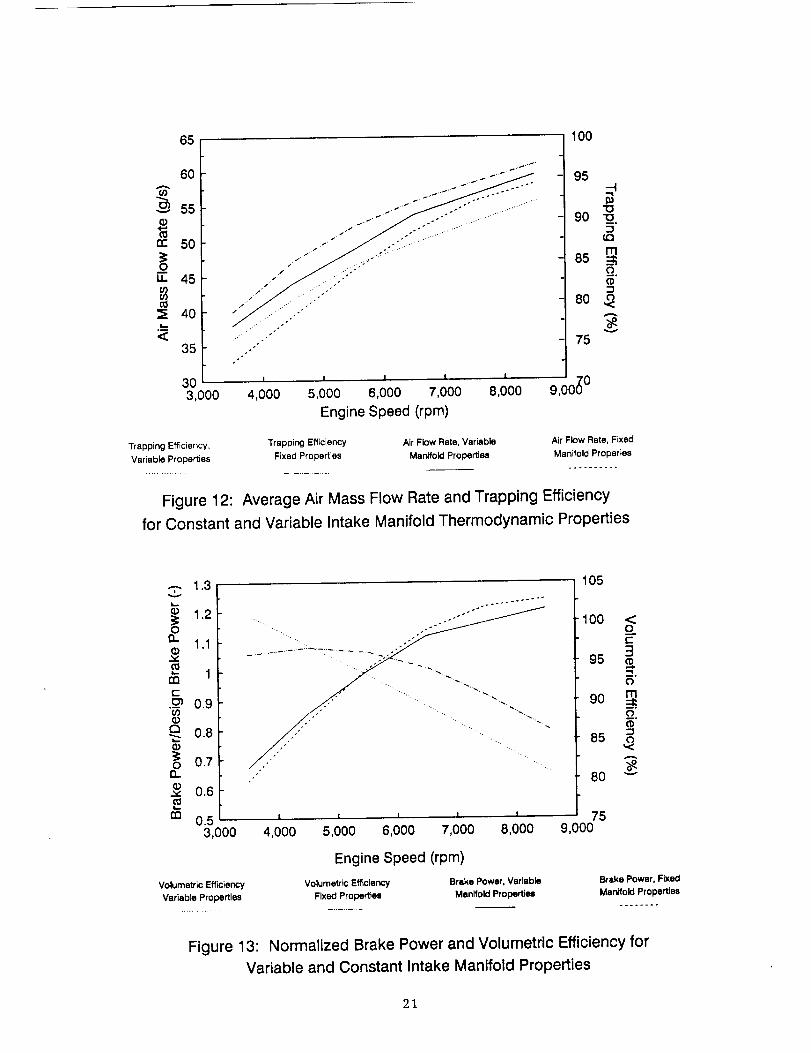
The MIT code was run for the same operating conditions and with both variable and fixed intake
manifold thermodynamic properties. Intake manifold volume was not changed for any runs. Figure
12 shows a significant difference between predicted air flow rate and trapping efficiency for the fixed
and variable property cases. Trapping efficiency is defined as the percentage of the air flowing
through the intake port that is trapped in the chamber when the intake port closes. Both the air
mass flow rate and the trapping efficiency are lower for the variable intake manifold thermodynamicproperty model than for the fixed property model.
In Figure 13, volumetric efficiency and brake power are plotted for the variable and fixed intake
manifold property models. Because of the tuning effects described above, the volumetric efficiency
of the variable manifold pressure engine is higher at low speeds and lower at high speeds comparedto that of the fixed property engine. These volumetric efficiency differences also are reflected inthe output power curves.
LOSSES
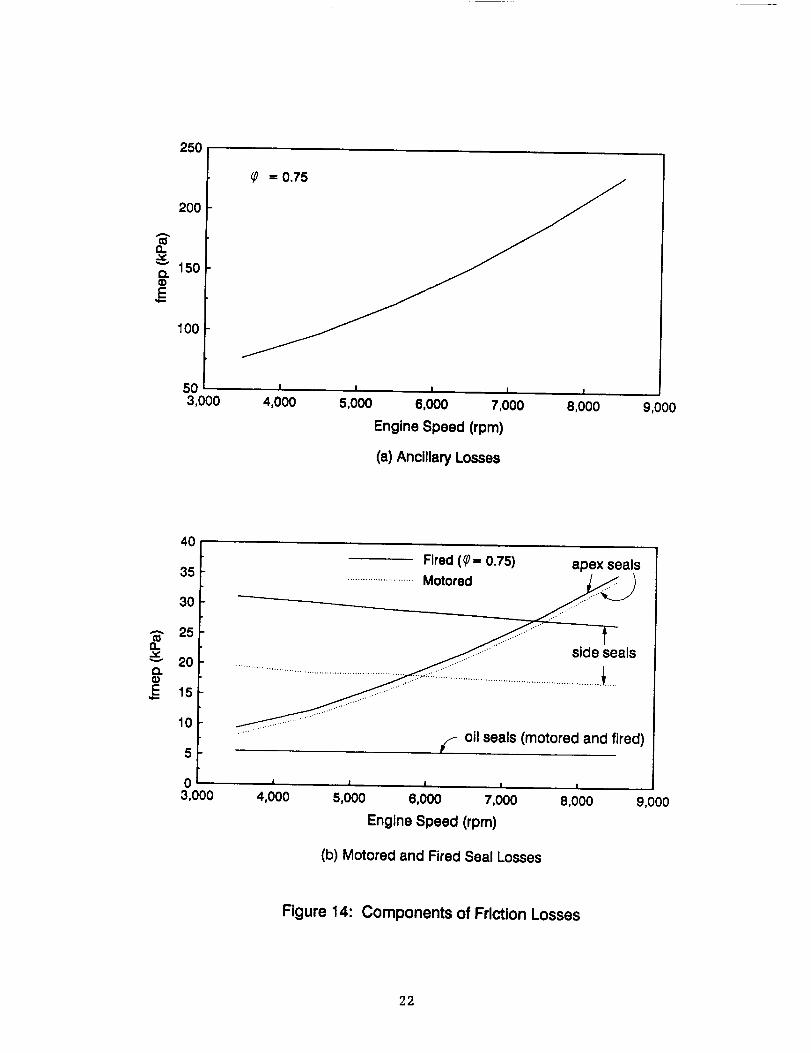
Figure 14a shows the estimated ancillary fmep, frnep_,, for an engine run at ¢ -- 75. Recallingequation 14, .frnep_, rises with the square of engine speed. Note that frnep,, has no load dependency.
The fmep_, includes contributions from the water pump, the oil pump, the fuel pump, the alternator
and the acceleration of oil in the rotor cavity.
In Figure 14b, seal friction losses for the same engine and a motored engine are plotted against
engine speed. The seal fmep is lower than fmepa. The relatively small influence of equivalence
ratio on friction is demonstrated in Figure 14b. Since crank case pressure is not varied, the oil
seal friction losses are the same for the motored and the fired engine. Because apex seal losses
are dominated by the centrifugal force exerted on the seal, not by gas pressure, apex seal losses
are predominantly influenced by engine speed. The side seals show a greater sensitivity to gas
pressure, because they have a greater base area (there are six side seals) and are subjected to thechamber pressure.
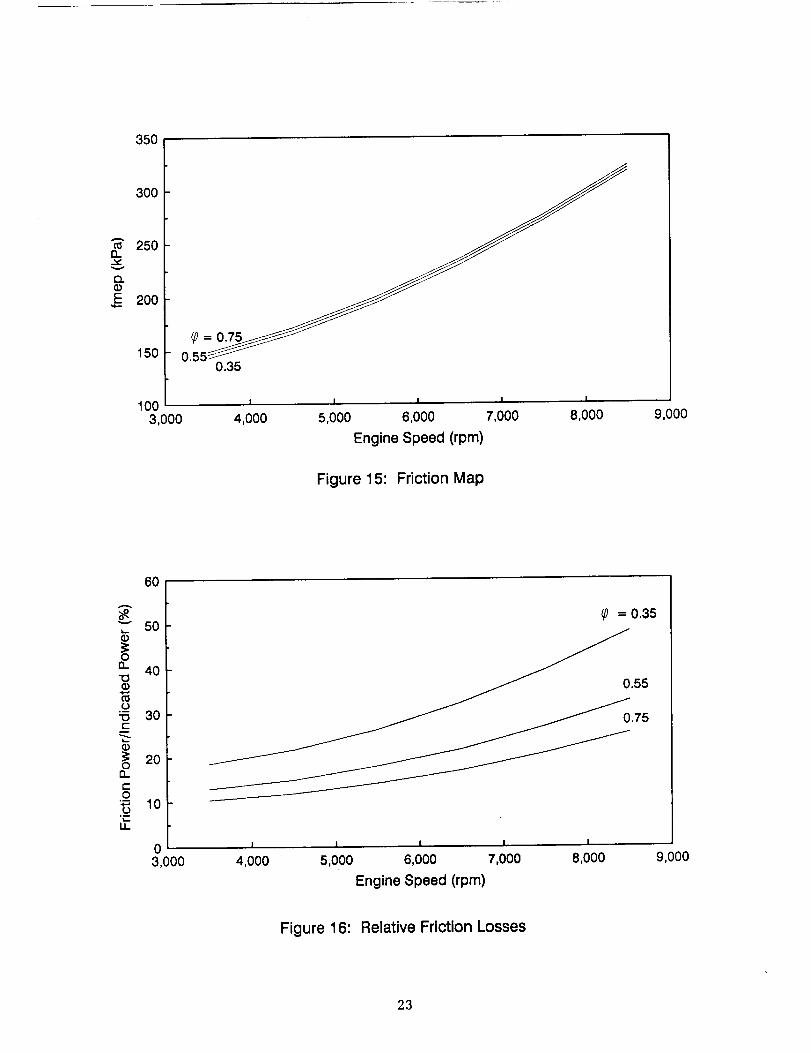
Friction mean effective pressure is plotted against engine speed for three equivalence ratios in
Figure 15. frnep in Figure 15 includes seal friction, bearing friction and ancillary losses. A more
revealing comparison of the friction losses at different engine loads is made in Figure 16, where the
fraction of the indicated power used to overcome friction losses is plotted against engine speed for
3 equivalence ratios. At low loads, the friction consumes a greater fraction of the engine indicated
power. This results in the high bsfcs at low loads shown on the engine map (Figure 7).
CODE STATISTICS
Table 3 shows convergence data and CPU times for a number of runs. Normally the MIT code
requires between 3 and 12 engine cycles to converge for one set of engine operating conditions.This equates to between 1 and 3 CPU minutes to run on a VAX 11/780 mainframe computer.
10
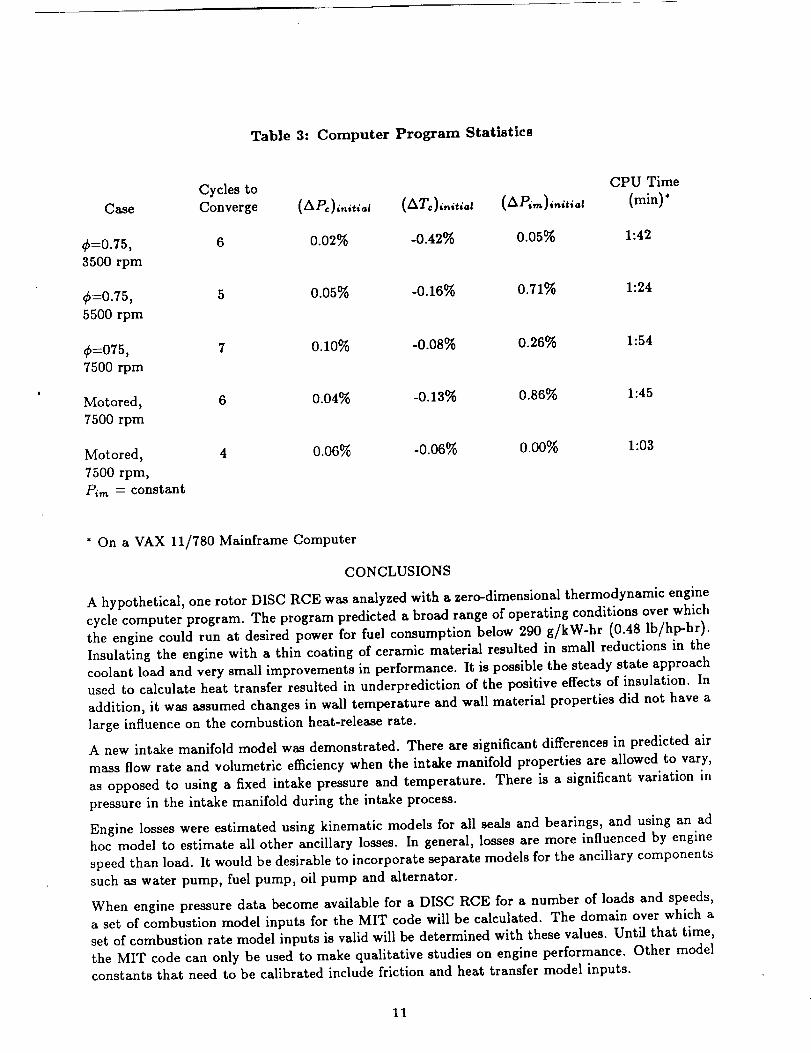
Table 3: Computer Program Statistics
Case
¢=0.75,
3500 rpm
¢=0.75,
5500 rpm
¢:075,
7500 rpm
Motored,
7500 rpm
Motored,
7500 rpm,
Pi,_ -- constant
Cycles to CPU Time
Converge (APc)_,_t_a_ (ATc)_n,t_a_ (AP_m)_'*_t_a_ (rain)*
6 0.02% -0.42% 0.05% 1:42
5 0.05% -0.16% 0.71% 1:24
7 0.10% -0.08% 0.26% 1:54
6 0.04% -0.13% 0.86% 1:45
4 0.06% -0.06% 0.00% 1:03
* On a VAX 11/780 Mainframe Computer
CONCLUSIONS
A hypothetical,one rotorDISC RCE was analyzedwith a zero-dimensionalthermodynamic engine
cycle computer program. The program predicted a broad range of operating conditions over which
the engine could run at desired power for fuel consumption below 290 g/kW-hr (0.48 lb/hl>-hr).
Insulating the engine with a thin coating of ceramic material resulted in small reductions in the
coolant load and very small improvements in performance. It is possible the steady state approachused to calculate heat transfer resulted in underprediction of the positive effects of insulation. In
addition, it was assumed changes in wall temperature and wall material properties did not have a
large influence on the combustion heat-release rate.
A new intake manifold model was demonstrated. There are significant differences in predicted air
mass flow rate and volumetric efficiency when the intake manifold properties are allowed to vary,
as opposed to using a fixed intake pressure and temperature. There is a significant variation in
pressure in the intake manifold during the intake process.
Engine losses were estimated using kinematic models for all seals and bearings, and using an adhoc model to estimate all other ancillary losses. In general, losses are more influenced by engine
speed than load. It would be desirable to incorporate separate models for the ancillary components
such as water pump, fuel pump, oil pump and alternator.
When engine pressure data become available for a DISC RCE for a number of loads and speeds,a set of combustion model inputs for the MIT code will be calculated. The domain over which aset of combustion rate model inputs is valid will be determined with these values. Until that time,
the MIT code can only be used to make qualitative studies on engine performance. Other model
constants that need to be calibrated include friction and heat transfer model inputs.
11

The MIT codeis an inexpensivetool for analyzing DISC Wankel engines. It normally runs in less
than 3 min on a VAX 11/780 computer and produces information for a wide range of engine per-formance indicators. It has been shown to be flexible enough to incorporate submodels for friction
and other engine processes and it appears compatible for use in a turbocharged/turbocompondedengine system analysis.
REFERENCES
(1) Jones, C.,"The Curtiss-Wright Rotating Combustion Engines Today," Paper 886D, SAETransactions, pp. 127-147, 1965.
(2) Willis, E. A. and Wintucky, W. T.,"An Overview of NASA Intermittent Combustion Engine
Research," Paper AIAA-84-1393, AIAA/SAE/ASME Joint Propulsion Conference, Cincin-nati, Ohio, 1984.
(3) Jones, C., "An Update of Applicable Automotive Engine Rotary Stratified Charge Develop-
ments," SAE Paper 820347, International Congress and Exposition, Detroit, Michigan, 1982.
(4) Mount, R. E. and LaBouff, G. A., "Advanced Stratified Charge Rotary Engine Design," SAEPaper 890324, International Congress and Exposition, Detroit, Michigan, 1989.
(5) McCormick, B. W., Aerodynamics, Aeronautics and Flight Mechanics, p. 338, John Wiley &Sons, New York, 1979.
(6) Eberle, M. K. and Klomp, E. D., "An Evaluation of Potential Performance Gain from Leakage
Reduction in Rotary Engines," SAE Paper 730117, International Automotive EngineeringCongress, Detroit, Michigan, 1973.
(7) Danieli, G. A., Ferguson, C. R., Heywood, J. B. and Keck, J. C., "Predicting the Emis-
sions and Performance Characteristics of a Wankel Engine," SAE Paper 740186, InternationalAutomotive Engineering Congress, Detroit, MI, 1974.
(8) Ferguson, C. R., Danieli, G. A., Heywood, J. B. and Keck, J. C., "Time Resolved Measure-
ments of Exhaust Composition and Flow Rate in a Wankel Engine," SAE Paper 750024,
International Automotive Engineering Congress and Exposition, Detroit, MI, 1975.
(9) Badgley, P. R., Doup, D. and Kamo, R., "Analysis and Test of Insulating Components for
Rotary Engine," SAE paper 890326, International Automotive Engineering Congress and Ex-position, Detroit, Michigan, 1989.
(10) Abraham, J., Wey, M.-J. and Bracco, F. V., "Pressure Non-Uniformity and Mixing Charac-
teristics in Stratified-Charge Rotary Engine Combustion," SAE paper 880624, InternationalAutomotive Engineering Congress and Exposition, Detroit, Michigan, 1988.
(11) Norman, T. J., A Performance Model of a Spark Ignition Wankel Engine: Including the
Effects of Crevice Volumes, Gas Leakage and Heat Transfer, Masters Thesis, MassachusettsInstitute of Technology, June, 1983.
(12) Gatowski, J. A., Balles, E. N., Chun, K. M., Nelson, F. E., Ekchian, J. A. and Heywood, J. B.,"Heat Release Analysis of Engine Pressure Data," SAE paper 841359, Fuels and LubricantsMeeting and Exposition, Baltimore, Maryland, 1984.
(13) Roberts, J. M., Heat Release Estimation and Prediction of Wankel Stratified-Chargc
Combustion Engin__e Masters thesis, Massachusetts Institute of Technology, September, 1985.
(14) Nguyen, H. L., Addy, H. E., Bond, T. H., Lee, C. L. and Chun, K. S.,"Performance and
Efficiency Evaluation and Heat Release Study of a Direct-Injection Stratified-Charge Rotary
Engine," SAE paper 870445, International Automotive Engineering Congress and Exposition,Detroit, Michigan, 1987.
12
(23)
(24)
(25)
(26)
(27)
(15) Dimplefeld, P. and Humke, A.,"Heat Release Characteristics of Stratified-Charge Rotary En-
gines," SAE paper 870443, International Automotive Engineering Congress and Exposition,
Detroit, Michigan, 1987.
(16) Stanten, R. A., Heat Transfer and Performance Calculations in a Rotary Enz_n___ Masters
thesis, Massachusetts Institute of Technology, August, 1987.
(17) Raju, M. S.,"Analysis of Rotary Engine Combustion Processes Based on Unsteady, Three-Dimensional Computations," paper AIAA-90-0643, AIAA 28th Aerospace Sciences Meeting,
Reno, Nevada, 1990.
(18) Li, Z., Shih, T. I-P. and Nguyen, H. L., "Modelling and Simulation of Wankel Engine FlowFields," SAE paper 900029, International Automotive Engineering Congress and Exposition,
Detroit, Michigan, 1990.
(19) Martin, M. K. and Heywood, J. B,"Approximate Relationships for the Thermodynamic Prop-
erties of Hydrocarbon-Air Combustion Products," Vol. 15, pp. 1-10, Combustion Science and
Technology, Gordon and Breach Science Publishers Ltd., Gr. Britain, 1977.
(20) Woschni, G.,"A Universally Applicable Equation for the Instantaneous Heat Transfer Coeffi-cient in the Inter,lal Combustion Engine," SAE paper 670931, 1967.
(21) Lee, C. M. and Schock, 1t. J.,"Regressed Relations for Forced Convection Heat Transfer in a
Direct Injection Stratified Charge Rotary Combustion Engine," NASA Technical Memoran-
dum 100124, 1988.
(22) Assanis, D. N. and Badillo, E.,"Transient Conduction in Low-Heat-Rejection Engine Com-bustion Chambers," SAE paper 870156, Automotive Engineering International Congress and
Exposition, Detroit, Michigan, 1987.
Yamamoto, K., __, Toyo Kogyo Co., Ltd., Hiroshima, Japan, 1969.
Rachel, T. and Schock, H. J., Personal communication, Michigan St. Univ., Dept. of Mech.
Engr., December, 1989.
Heywood, J. B., Internal Combustion Engine Fundamentals, p. 722, McGraw-Hill Book Co.,
New York, 1988.
Dimplefeld, P., Personal Communication, John Deere and Company, Rotary Engine Division,
Woodridge, N J, December, 1989.
Bolz, R. E. and Tuve, G. L.,CRC Handbook of Tables for Applied Engineering Science, 2cnd
Edition, CRC Press Inc., Boca Raton, Florida, 1970.
LIST OF SYMBOLS
Symbol
ar
b
CAI,CA2
CFI, CF2, CF3
Ca
Cp
Fol, Fol, F_SF_,F,o,F_,
f mep
ha,h,
hhg
Description
apex seal crown radius
seal base width
ancillary loss constants
friction loss constants
apex seal clearance above the rotor
specific heat at constant pressure
apex , oil and side seal friction forces
apex, oil and side seal spring forces
friction mean effective pressure
apex seal and side seal height
average hot gas side heat transfer coefficient
13
i
kj
Ljl
m
rh
N
Nu
P
Pr
O i,,_
dO
RoRe
r
T
t
U
V
f.
0
T
Subscript
c
CC
cool
epc
epoic
im
ipc
ipomax,
o
qmazs
spwall
1
2
enthalpy
thermal conductivityformaterialj
depth ofmaterialj
seallength
ma_8
mass flowrate
enginespeed (rpm)Nusseltnumber
Pressure
Prandtl number
heat lossratethrough intakemanifold walls
rateofreleaseoffuelenergy
gas constantforair
oilsealradius
Reynolds number
trochoidgeneratingradius
temperaturetime
overallheat transfercoefficient
volume
exponent in heat transferexpression
coefficientin heat transferexpression
exponent in heat transferexpression
eccentricity
crank angle
slidingcoefficientoffriction
apex sealleanangle
fuelheat releaseratedecay constant
Description
apex seal
combustion chamber
crank case
coolant
exhaust port closing
exhaust port opening
to the intakemanifold (from the intercooler)intakemanifold
intakeport closing
intakeport openingmaximum
oil seal
at the time of maximum heat release rateside seal
at the time the spark fires
at the trochoid housing wallupstreamdownstream
14
bsfcDISCfmepMITNASARCE
LIST OF ABBREVIATIONS
brake specific fuel consumption
direct-injection stratified-chargefriction mean effective pressure
Massachusetts Institute of Technology
National Aeronautics and Space Administration
rotary combustion engine
'_ e = o' (TDC)Chamber of Interest 3 i
Port
Intake Port (BDC)
Figure 1: Rotary Engine Schematic
EG
e
Figure 2: DISC Engine Heat Release Rate
15
Top Dead Center (TDC)
_ Positionon Trochoid
-1403 -10_1.3 -3,1,3 38.7 .... _ Surface• _=_,dv---=_ _ 1.i
-176._'-- "68.3 3.7 75.7,//_ 47 7-2123._ 8 / -_-"
• -3 183.7
-392.3 _363.7-464.3 -536.3 -608.3 399.7
Bottom Dead Center (BDC)
Figure 3: Trochoid Housing Geometry and Crank Angle Definition
Tc
hhg Twaq
\,
\\\\
L1 L2 L3
Tc Twall
if L/hhg _kl _kk 2 L3
hcool
Tcool= _ •
Figure 4: Trochoid Housing Cross Fiction
16
70
E
O.
60
50
40
3O
2O
10
00
-1-- i
200 400
Volume (cc)
600 800
Figure 5: P-V Diagram for DISC RCE, (_ =0.75, 5500 rpm
tnEa)
3,000
2,500
2,000
1,500
1,000
500
i
e
I I I fl
-600 -400 -200 0
Crank Angle (deg)
°_-°°
Ib.,._
V
1.0
0.8
0.6
0.4
0.2
= i 0.00-800 200 400 600
Figure 6: Chamber Temperature and Combustion Progress Histories for
a DISC RCE, _ = 0.75, 5500 rpm
(3O3O"¢-
0
"13
_3
v
17
1.6
v
0n
(1)
me"
,B
00..
m
1.4
1.2
1.0
0.8
0.6
0.4
0.23,000
=0.85
.... "'". °"' 0.75
............ "; ,' / .,"'320/"0.65
._ 0.35
I I I I 1
4,000 5,000 6,000 7,000 8,000
Engine Speed (rpm)
9,000
Figure 7: Engine Map for a Single Rotor DISC RCE
Line of Constant ............... Line of Constant BSFC
(BSFC in g/kW-hr)
A
v
Q.
E
2,500
2,000
1,500
1,000
5OO
0-800
-o
! •I %:
•I
i '%.
i •• i
• " z_"
I 1 I l I I
-600 -400 -200 0 200 400 600
Crank Angle, e (deg)
AI Housing
Ti Housing.... [____
Coated Housing
Adiabatic Engine
Figure 8: Trochoid Housing Hot Side Wall Temperature for
_=0.75, 5500 rpm and Various Housing Materials
18
100
8054.8
>,
_ 60e-
W
u_
o
55.9 55.4 54.8 55.5 64.8
0
N _40Us'_ng'Fe _,otO__ en_ T! _, oOS'_o__..,eap, otOt _.,= Oo_,teO,-,-,,_cEng'_ne_._Coo _po_ ._tocr_o_d_ L,uo_....^maonB_,,_ ,kd_Uo-.r,, Co_BL_- /k__u ,-
Component Materials
Figure 9:
[_ Exhaust
[_ Work
_ Cooling
Fuel Energy Diagram for Engines With Various Component
Materials, Equivalence Ratio = 0.75, 5500 rpm
14
12 . 0.90.9
0.8>, 10==t-LU 8
LL 60
o_ 4
2
0
Fe nel'_ts
COYPU /_t
Component Materials
0.8
Oo_te6
E_ Sideplates
_ Rotor Face
_ Trochoid
Figure 10: Fuel Energy to Engine Components for Various
Component Materials, Equivalence Ratio = 0.75, 5500 rpm
19
o
"13mo
t-
m
(1)
{3L
"13
(/}
t'-
O
OC
E_
O
(!)
I,-,I.
(1)
rn
&oo
),(Q
ACL
©8v
oo
oO
Intake Manifold Pressure (atm)
0 " I ' I " I I " I " I " I "o
I oo° ,o_3 J_33 '3
O_
oo_3 -,33
C)
O
-63
(n
v
n"
.9OLI.
<
65
60
55
5O
45
40
35
303,000
/" .'..."
/ ..","
i ." ,"
i" .- o"
4,000
100
95
' "O90 _.
(C]
m85
o_.¢P
8O _
75
i | , ' 0 _05,000 6,000 7,000 8,000 9, 0
Engine Speed (rpm)
Trapping Efficiency, Trapping Efficiency Air Flow Rate, Variable Air Flow Rate, Fixed
Variable Properties Fixed Properties Manifold Properties Manifold Properies
Figure 12: Average Air Mass Flow Rate and Trapping Efficiency
for Constant and Variable Intake Manifold Thermodynamic Properties
,.-;-. 1.3
1.2O
n 1.1
t'-
.-_ 0.9
a 0.8$_ O.70_
._ 0.6
m 0.53,000
Volumetric Efficiency
Variable Properties
105°..o°--
100 <o_..¢-.3
95"-I_o
O
m9O
__.
85
80
4,000 9,000, = i I , 75
5,000 6,000 7,000 8,000
Engine Speed (rpm)
Volumetric Efficiency Breke Power, Variable
Fixed Properties Manifold Properties
Brake Power, Fixed
Manifold Properties
Figure 13: Normalized Brake Power and Volumetric Efficiency for
Variable and Constant Intake Manifold Properties
21
250
Q.v
CL¢D
200
150
100
5O3,000
I I I I I
4,000 5,000 6,000 7,000 8,000
Engine Speed (rpm)
(a) Ancillary Losses
9,000
40
m0.v
Q)E
N.--
35
30
25
20
15
10
5
03,000
Fired (_;= 0.75) apex seals
..........................Motored __
.............. side _eals
f_ oil seals (motored and fired)
I I I I I
4,000 5,000 6,000 7,000 8,000
Engine Speed (rpm)
(b) Motored and Fired Seal Losses
9,000
Figure 14: Components of Friction Losses
22
350
13-
v
E
300
250
200
150
1003,000
0.35
I I I I I
4,000 5,000 6,000 7,000 8,000
Engine Speed (rpm)
9,000
Figure 15: Friction Map
60
"" 50
0
n 40"10
o'6 30c-
_ 200
t-O
o--
U.
03,000
!
4,000
_0 = 0.35
0.55
.75
I I I I
5,000 6,000 7,000 8,000
Engine Speed (rpm)
9,000
Figure 16: Relative Friction Losses
23
Report Documentation PageNallonal Aeronautics andSpace Admln_stral_on
t. Report No. 2. Government Accession No. 3. Recipient's Catalog No.
NASA TM-103105
5. Report Date4. Title and Subtitle
Performance of a Supercharged Direct-Injection Stratified-
Charge Rotary Combustion Engine
7. Author(s)
Timothy A. Bartrand and Edward A. Willis
9. Performing Organization Name and Address
National Aeronautics and Space Administration
Lewis Research Center
Cleveland, Ohio 44135-3191
12. Sponsoring Agency Name and Address
National Aeronautics and Space Administration
Washington. D.C. 20546-0001
6. Performing Organization Code
8. Performing Organization Report No.
E-5430
10. Work Unit No.
505-62- I 1
11. Contract or Grant No.
13. Type of Report and Period Covered
Technical Memorandum
14. Sponsoring Agency Code
15. Supplementary Notes
Prepared for the Joint Symposium on General Aviation Systems cosponsored by the A1AA and FAA, Ocean City,
New Jersey April 11-12, 1990. Timothy A. Bartrand, Sverdrup Technology, Inc., Lewis Research Center Group,
2001 Aerospace Parkway, Brook Park, Ohio 44142. Edward A. Willis, NASA Lewis Research Center.
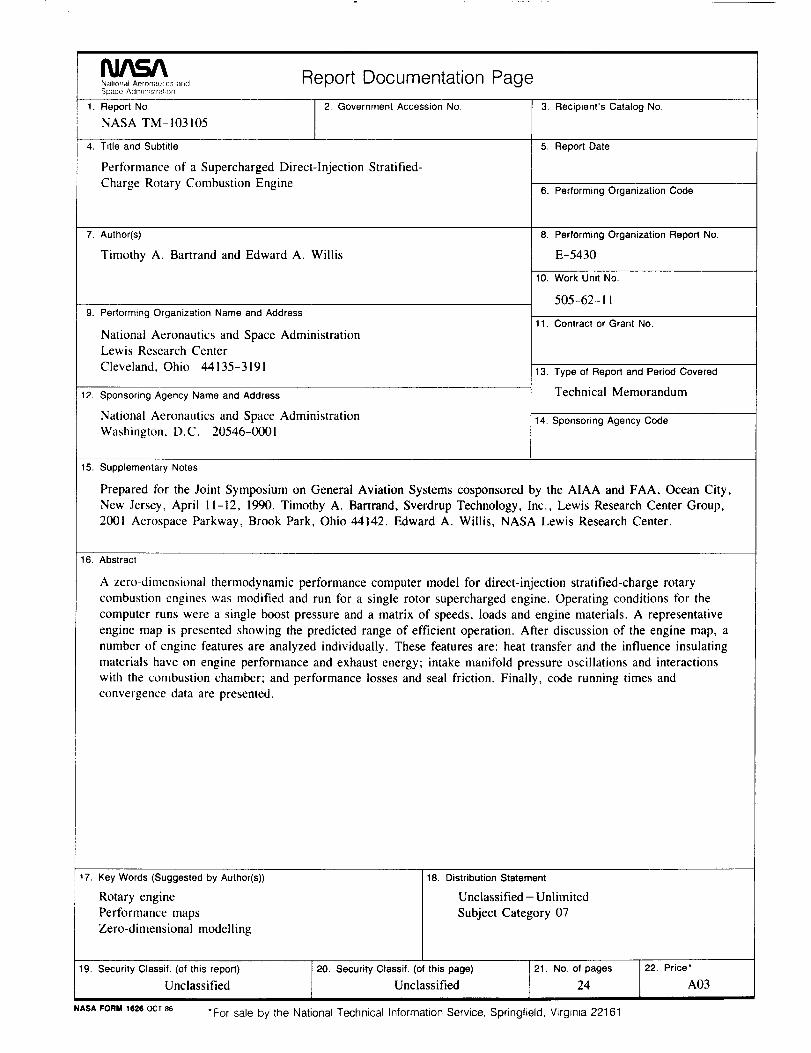
16. Abstract
A zero-dimensional thermodynamic performance computer model for direct-injection stratified-charge rotary
combustion engines was modified and run for a single rotor supercharged engine. Operating conditions for the
computer runs were a single boost pressure and a matrix of speeds, loads and engine materials. A representative
engine map is presented showing the predicted range of efficient operation. After discussion of the engine map, a
number of engine features are analyzed individually. These features are: heat transfer and the influence insulating
materials have on engine performance and exhaust energy; intake manifold pressure oscillations and interactions
with the combustion chamber; and performance losses and seal friction. Finally, code running times and
convergence data are presented.
17. Key Words (Suggested by Author(s))
Rotary engine
Performance maps
Zero-dimensional modelling
18. Distribution Statement
Unclassified- Unlimited
Subject Category 07
19, Security Classif. (of this report) 20. Security Classif. (of this page) 21. No. of pages
Unclassified Unclassified 24
NASAFORM162eOCTe6 *For sale by the National Technical Information Service, Springfield, Virginia 22161
22. Price*
A03
Related Documents