Performance Models for Virtualized Applications Fabr´ ıcio Benevenuto 1 , C´ esar Fernandes 1 , Matheus Santos 1 , Virg´ ılio Almeida 1 , Jussara Almeida 1 , G.(John) Janakiraman 2 , and Jos´ e Renato Santos 2 1 Computer Science Department Federal University of Minas Gerais - Brazil {fabricio, cesar, mtcs, virgilio, jussara}@dcc.ufmg.br 2 HP Labs Palo Alto - USA {john.janakiraman, joserenato.santos}@hp.com Abstract. This paper develops a series of performance models for pre- dicting performance of applications on virtualized systems. It introduces the main ideas of performance modeling and presents a complete case study of an application running on Linux that is migrated to a virtual- ized environment consisting of Linux and Xen. The paper describes the models, the process of obtaining measurements for the models and cal- culates performance metrics for the two environments. A validation of the results is also discussed in the paper. 1 Introduction Virtualization can be understood as a technique to partition resources of a ma- chine in multiple environments, creating a new level of indirection between phys- ical resources and applications. Recently, virtualization technologies are experi- encing a renewed interest as a way to improve system security, reliability, and availability, reduce costs, and provide flexibility. Particularly, such benefits are gaining popularity with Virtual Machines Monitors (VMM), providing software- based solutions for building shared hardware infrastructures. Virtual machines provide a suitable environment to consolidate multiple ser- vices into few physical machines. Nevertheless, in order to migrate applications from physical machines to virtualized consolidated platforms, one needs to be able to estimate the performance these applications will achieve on the new en- vironment. Will migrated applications run with competitive performance as they run on their current environment? How many servers will be needed to create a virtual environment able to support the execution of the services provided, with acceptable performance? What is the best configuration of resources on the vir- tual environment for a certain application? Therefore, there is a current need for new tools for predicting performance, providing information for resource alloca- tion, and determining optimal system configuration. This work gives the first This work was developed in collaboration with HP Brazil P&D. G. Min et al. (Eds.): ISPA 2006 Ws, LNCS 4331, pp. 427–439, 2006. c Springer-Verlag Berlin Heidelberg 2006

Welcome message from author
This document is posted to help you gain knowledge. Please leave a comment to let me know what you think about it! Share it to your friends and learn new things together.
Transcript
Performance Models for VirtualizedApplications�
Fabrıcio Benevenuto1, Cesar Fernandes1, Matheus Santos1, Virgılio Almeida1,Jussara Almeida1, G.(John) Janakiraman2, and Jose Renato Santos2
1 Computer Science DepartmentFederal University of Minas Gerais - Brazil
{fabricio, cesar, mtcs, virgilio, jussara}@dcc.ufmg.br2 HP Labs
Palo Alto - USA{john.janakiraman, joserenato.santos}@hp.com
Abstract. This paper develops a series of performance models for pre-dicting performance of applications on virtualized systems. It introducesthe main ideas of performance modeling and presents a complete casestudy of an application running on Linux that is migrated to a virtual-ized environment consisting of Linux and Xen. The paper describes themodels, the process of obtaining measurements for the models and cal-culates performance metrics for the two environments. A validation ofthe results is also discussed in the paper.
1 Introduction
Virtualization can be understood as a technique to partition resources of a ma-chine in multiple environments, creating a new level of indirection between phys-ical resources and applications. Recently, virtualization technologies are experi-encing a renewed interest as a way to improve system security, reliability, andavailability, reduce costs, and provide flexibility. Particularly, such benefits aregaining popularity with Virtual Machines Monitors (VMM), providing software-based solutions for building shared hardware infrastructures.
Virtual machines provide a suitable environment to consolidate multiple ser-vices into few physical machines. Nevertheless, in order to migrate applicationsfrom physical machines to virtualized consolidated platforms, one needs to beable to estimate the performance these applications will achieve on the new en-vironment. Will migrated applications run with competitive performance as theyrun on their current environment? How many servers will be needed to create avirtual environment able to support the execution of the services provided, withacceptable performance? What is the best configuration of resources on the vir-tual environment for a certain application? Therefore, there is a current need fornew tools for predicting performance, providing information for resource alloca-tion, and determining optimal system configuration. This work gives the first� This work was developed in collaboration with HP Brazil P&D.
G. Min et al. (Eds.): ISPA 2006 Ws, LNCS 4331, pp. 427–439, 2006.c© Springer-Verlag Berlin Heidelberg 2006
428 F. Benevenuto et al.
step in this direction. We propose simple queuing models for predicting the per-formance that applications, currently running on Linux system, will achieve ifmigrated to a Xen virtual system, with same hardware configuration. We furthervalidate these models with experimental results.
The rest of the paper is organized as follows. The next Section presents relatedwork. Section 3 discuss background on performance modeling. Section 4 reviewsthe main architectural aspects of Xen, describes the tools and the experimentalenvironment used for the performance evaluation. Section 5 discuss experimentalresults, whereas Section 6 presents analytic equations for virtual systems andcompares analytical and experimental results. Finally, Section 7 concludes thepaper and presents directions for future works.
2 Related Work
Three popular virtual systems are VMware [11], Denali [12], and Xen [1].VMware is responsible for several products using different virtualization strate-gies. Denali was projected to support a large number of VMs, where each VM isable to execute only one application. Unlike Denali, Xen was designed to supportVMs able to execute an entire operating system and thus, more than one appli-cation. The focus of our model and analysis is the Xen VMM, which is brieflydescribed in Section 4.1.
The first studies and applications of virtualization emerged in 1960, whenvirtualization was described as an evolution of the study of time sharing andmultiprogramming [13]. One of the most popular virtual environments at thattime was the IBM VM/370. Bard et. al proposed analytical models for VM/370to estimate performance metrics such as CPU utilization, and developed a per-formance predictor tool for this environment [14].
More recently, queuing network models for performance prediction of virtualenvironments were proposed in [7,3]. However, the proposed models were notvalidated for any specific virtual architecture. In this work, we propose specificanalytic models for the Xen architecture, validating these models with experi-mental results.
Recently, Cherkasova et al. [2] proposed a methodology to measure separatelythe CPU overhead on the IDD due to I/O operations of a guest VM. The ideais to count the cost and the number of page exchanges between a certain guestvirtual machine and the IDD to estimate the amount of CPU usage of the IDDconsumed in behalf of a certain virtual machine. Other studies also provided per-formance evaluation of applications running on Xen [8,4]. In common, all theseefforts are based solely on experimental evaluation of Xen and its applications.
3 Performance Models
A model is a representation of a system. Performance models [7] are useful forpredicting the values of performance measures of a system from a set of values ofworkload, operating system, and hardware parameters. Performance prediction
Performance Models for Virtualized Applications 429
is the process of estimating performance measures of a computer system for agiven set of parameters. Typical performance measures include response time,throughput, resource utilization, and resource queue length. The input parame-ters to such a model fall into one of three categories: workload, basic software,and hardware parameters. The workload parameters describe the load imposedon the system of interest by the applications, i.e., the transactions submittedto it. The software parameters describe features of the basic software, such asthe Xen virtual machine monitor overhead. Examples of such parameters arevirtualization overhead, CPU dispatching priority, etc. Examples of hardwareperformance parameters include the components of the servers that supports aXen system, such as processor speeds, disk latencies and transfer rates, and localarea network speed. The output of a performance model is a set of performancemeasures, such as response times, throughput, and resource utilizations.
The emphasis of this paper is on how to build performance models for vir-tualized applications. We start out with simple models that provide bounds onsome performance metrics. For example, one common question in the analysisof virtualized systems is “what is the maximum theoretical value of the arrivalrate λ for a given virtualized system?” This question has an easy answer thatdepends solely on the service demands of all resources. Note that the servicedemand Di, the utilization Ui, and the arrival rate λ are related by λ = Ui/Di
for all resources i. Because the utilization of any resource cannot exceed 100%,we have that λ ≤ 1/Di for all i’s. The maximum value of λ is limited by theresource with the highest value of the service demand, called the bottleneckresource. Thus,
λ ≤ 1maxK
i=1 Di(1)
In order to estimate more accurate performance metrics, models have to considercontention for resources and the queues that arise at each system resource—CPUs, disks, memory and communication devices. Queues also arise for soft-ware resources, such as threads, database locks, and protocol ports. The variousqueues that represent a virtualized system are interconnected, giving rise to anetwork of queues, called a queuing network (QN). A common question thatcould be answered by a queuing network model of a virtualized system is: “whatwill the average response time of application Y be when it is migrated from a pureLinux to a Linux/Xen environment that has the same system configuration?”To answer this question, we need models that present details of the system. Thelevel of detail at which resources are depicted in a QN model of a virtualizedsystem depends on the reasons to build the model and the availability of detailedinformation about the operation and availability of detailed parameters of spe-cific resources. In other words, models depend on data collected by measurementtools in virtualized systems. The basic input parameters that we use in our per-formance models are service demands and arrival rates. Service demand is thesum of the service time at a resource (e.g. processor, disk, network) over all visitsto that resource during the execution of a transaction or request. In a queuingnetwork model, not all requests that flow through the resources of a system are
430 F. Benevenuto et al.
similar in terms of the resources used and the time spent at each resource. There-fore, Workload may be broken down into several workload components, whichare represented in a QN model by a class of requests. Different classes may havedifferent service demand parameters and different workload intensity parameters.Classes of requests may be classified as open or closed depending on whether thenumber of requests in the QN is unbounded or fixed, respectively. Open classesallow requests to arrive, go through the various resources, and leave the system.In this paper we initially present a simple model that estimates bounds on theperformance of a virtualized system and then we develop an open-class queuingnetwork model that represents applications running on Linux and Xen.
4 Case Study
In order to demonstrate the causes of virtualization overhead on the Xen VMM,we provide a performance evaluation of three benchmarks running on Xen andLinux. Then, we use a simple case study of a Web server to validate the perfor-mance models. The goal is to predict the performance a Web server application,currently running on a non-virtual system, will achieve if migrated to a Xen vir-tual machine. Our research strategy consists of a performance study of a simpleWeb server which provides only static content. In addition to this case study,we presented some results to discuss which components of the Xen environmentneed to be considered in a model. Next, we briefly describe the Xen virtual ma-chine monitor and Xen I/O model. Our discussion focuses on aspects which aremore relevant for the performance evaluation presented. Then, we present thetools and the hardware platform used.
4.1 Xen Architecture
Xen is a free and open-source virtual machine monitor (VMM) which allowsmultiple (guest) operating system (OS) instances to run concurrently on a sin-gle physical machine. It uses paravirtualization, where the VMM exposes a vir-tual machine abstraction slightly different from the underlying hardware. TheXen system has multiple layers. The lowest and most privileged is called VMM.Each guest OS runs on a separate virtual machine called domain. The domainsare scheduled by the VMM to make effective use of the available physical CPUs.Each application, running on a guest OS, accesses hardware devices via a specialprivileged virtual machine called isolated driver domain (IDD), which owns spe-cific hardware devices and run their I/O device drivers. All other domains (guestdomains in Xen terminology) run a simple device driver which communicateswith the driver domain to access the real hardware devices. Figure 1 provides anoverview of Xen I/O model. The IDD can access directly the hardware devices itowns. However, a guest domain accesses the hardware devices indirectly througha virtual device connected to the IDD. The IDD maps through bridges or routingthe physical interface to its virtual interface which communicates with the guestvirtual interface. The guest domain exchanges requests and responses with the

Performance Models for Virtualized Applications 431
ChannelI/O
DomainGuestI/O Driver Domain
Bridge
Peth0 BackendFrontendVifVif
Hardware
Virtual Machine Monitor
NIC
Fig. 1. Overview of Xen I/O model
IDD over an I/O channel. In order to avoid copying, references to page-sizedbuffers are transferred over the I/O channel instead of the actual I/O data.
4.2 Monitoring Framework
In order to develop performance models, we need to be able to measure thevirtualized system. We developed an application called Xencpu to measure CPUbusy time on Xen. This tool is based on the source code of xm top tool, providedwith Xen, and was designed aiming at the automatic execution of our scripts.The CPU busy time on the Linux system is obtained based on information from/proc directory. Disk busy time, on both Xen and Linux, was also obtained fromthe /proc directory. Other parameters such as experiment duration and numberof processed requests are obtained with scripts or from the benchmarks used.
4.3 Workload
The workload used is generated by the following benchmarks:
- Web server: we used httperf [9] as clients and Apache [10] version 2.0.55as the Web server. The httperf is a tool which allows generating several HTTPworkloads and measuring the performance of the Web server from the point ofview of the clients. We run httperf on a client machine, sending requests with rateλ to the server, measuring throughput and server response time of the requests.The workload used is part of a set of workloads from SPECWeb99 [7] and itdoes not contain dynamic content.- Disk intensive application: This benchmark consists of copying a 2 GB filefrom a directory to another, on the same partition. We use this benchmark toanalyze the impact of disk activity on the virtual environment overhead.- CPU intensive application: It consists on a kernel compilation, which evo-cates several functions, stressing system CPU.
4.4 Experimental Setup
For all experiments, we use a two 64-bit CPU 3.2 GHz Intel Xeon server, with2 GB of RAM, one disk with 7200 RPM and 8 MB of cache, and two Broadcom
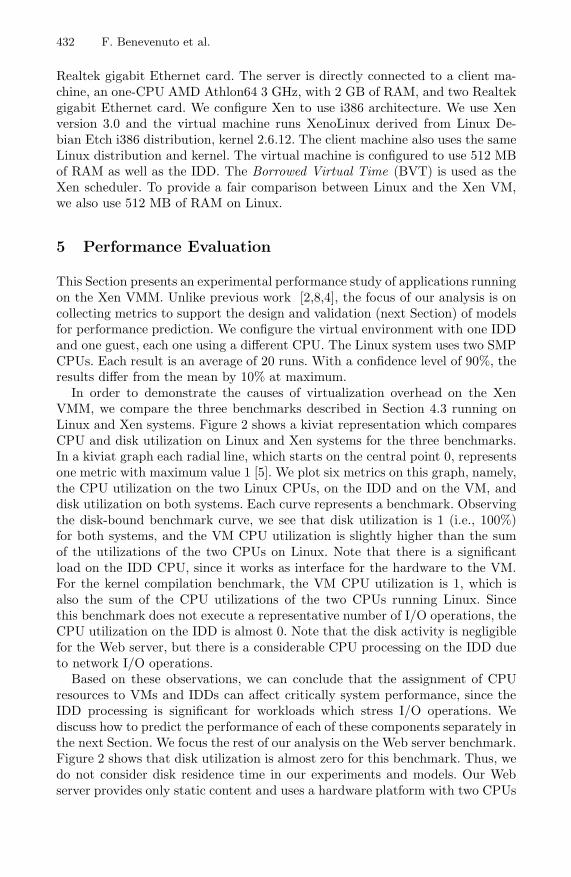
432 F. Benevenuto et al.
Realtek gigabit Ethernet card. The server is directly connected to a client ma-chine, an one-CPU AMD Athlon64 3 GHz, with 2 GB of RAM, and two Realtekgigabit Ethernet card. We configure Xen to use i386 architecture. We use Xenversion 3.0 and the virtual machine runs XenoLinux derived from Linux De-bian Etch i386 distribution, kernel 2.6.12. The client machine also uses the sameLinux distribution and kernel. The virtual machine is configured to use 512 MBof RAM as well as the IDD. The Borrowed Virtual Time (BVT) is used as theXen scheduler. To provide a fair comparison between Linux and the Xen VM,we also use 512 MB of RAM on Linux.
5 Performance Evaluation
This Section presents an experimental performance study of applications runningon the Xen VMM. Unlike previous work [2,8,4], the focus of our analysis is oncollecting metrics to support the design and validation (next Section) of modelsfor performance prediction. We configure the virtual environment with one IDDand one guest, each one using a different CPU. The Linux system uses two SMPCPUs. Each result is an average of 20 runs. With a confidence level of 90%, theresults differ from the mean by 10% at maximum.
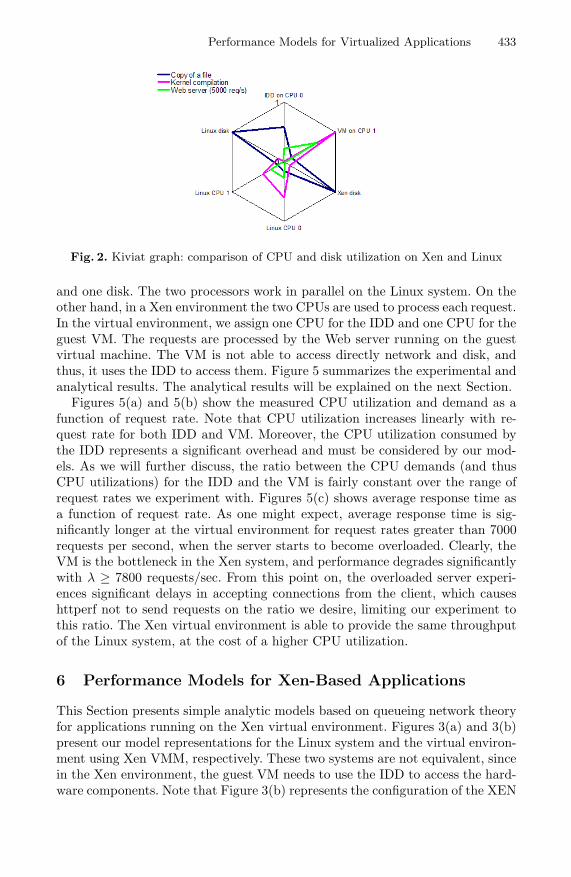
In order to demonstrate the causes of virtualization overhead on the XenVMM, we compare the three benchmarks described in Section 4.3 running onLinux and Xen systems. Figure 2 shows a kiviat representation which comparesCPU and disk utilization on Linux and Xen systems for the three benchmarks.In a kiviat graph each radial line, which starts on the central point 0, representsone metric with maximum value 1 [5]. We plot six metrics on this graph, namely,the CPU utilization on the two Linux CPUs, on the IDD and on the VM, anddisk utilization on both systems. Each curve represents a benchmark. Observingthe disk-bound benchmark curve, we see that disk utilization is 1 (i.e., 100%)for both systems, and the VM CPU utilization is slightly higher than the sumof the utilizations of the two CPUs on Linux. Note that there is a significantload on the IDD CPU, since it works as interface for the hardware to the VM.For the kernel compilation benchmark, the VM CPU utilization is 1, which isalso the sum of the CPU utilizations of the two CPUs running Linux. Sincethis benchmark does not execute a representative number of I/O operations, theCPU utilization on the IDD is almost 0. Note that the disk activity is negligiblefor the Web server, but there is a considerable CPU processing on the IDD dueto network I/O operations.
Based on these observations, we can conclude that the assignment of CPUresources to VMs and IDDs can affect critically system performance, since theIDD processing is significant for workloads which stress I/O operations. Wediscuss how to predict the performance of each of these components separately inthe next Section. We focus the rest of our analysis on the Web server benchmark.Figure 2 shows that disk utilization is almost zero for this benchmark. Thus, wedo not consider disk residence time in our experiments and models. Our Webserver provides only static content and uses a hardware platform with two CPUs
Performance Models for Virtualized Applications 433
Fig. 2. Kiviat graph: comparison of CPU and disk utilization on Xen and Linux
and one disk. The two processors work in parallel on the Linux system. On theother hand, in a Xen environment the two CPUs are used to process each request.In the virtual environment, we assign one CPU for the IDD and one CPU for theguest VM. The requests are processed by the Web server running on the guestvirtual machine. The VM is not able to access directly network and disk, andthus, it uses the IDD to access them. Figure 5 summarizes the experimental andanalytical results. The analytical results will be explained on the next Section.
Figures 5(a) and 5(b) show the measured CPU utilization and demand as afunction of request rate. Note that CPU utilization increases linearly with re-quest rate for both IDD and VM. Moreover, the CPU utilization consumed bythe IDD represents a significant overhead and must be considered by our mod-els. As we will further discuss, the ratio between the CPU demands (and thusCPU utilizations) for the IDD and the VM is fairly constant over the range ofrequest rates we experiment with. Figures 5(c) shows average response time asa function of request rate. As one might expect, average response time is sig-nificantly longer at the virtual environment for request rates greater than 7000requests per second, when the server starts to become overloaded. Clearly, theVM is the bottleneck in the Xen system, and performance degrades significantlywith λ ≥ 7800 requests/sec. From this point on, the overloaded server experi-ences significant delays in accepting connections from the client, which causeshttperf not to send requests on the ratio we desire, limiting our experiment tothis ratio. The Xen virtual environment is able to provide the same throughputof the Linux system, at the cost of a higher CPU utilization.
6 Performance Models for Xen-Based Applications
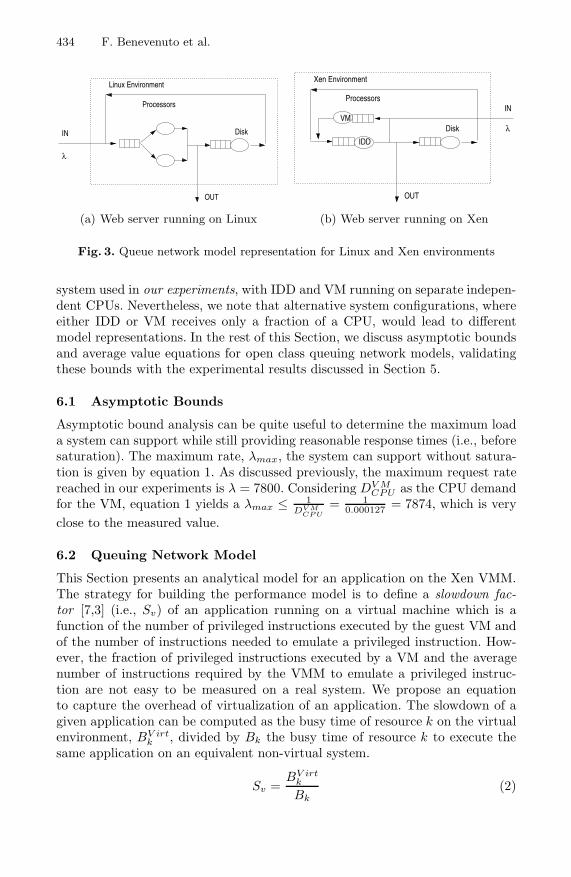
This Section presents simple analytic models based on queueing network theoryfor applications running on the Xen virtual environment. Figures 3(a) and 3(b)present our model representations for the Linux system and the virtual environ-ment using Xen VMM, respectively. These two systems are not equivalent, sincein the Xen environment, the guest VM needs to use the IDD to access the hard-ware components. Note that Figure 3(b) represents the configuration of the XEN
434 F. Benevenuto et al.
λ
OUT
Disk
Linux Environment
Processors
IN
(a) Web server running on Linux
IDD
VMλDisk
Processors
OUT
Xen Environment
IN
(b) Web server running on Xen
Fig. 3. Queue network model representation for Linux and Xen environments
system used in our experiments, with IDD and VM running on separate indepen-dent CPUs. Nevertheless, we note that alternative system configurations, whereeither IDD or VM receives only a fraction of a CPU, would lead to differentmodel representations. In the rest of this Section, we discuss asymptotic boundsand average value equations for open class queuing network models, validatingthese bounds with the experimental results discussed in Section 5.
6.1 Asymptotic Bounds
Asymptotic bound analysis can be quite useful to determine the maximum loada system can support while still providing reasonable response times (i.e., beforesaturation). The maximum rate, λmax, the system can support without satura-tion is given by equation 1. As discussed previously, the maximum request ratereached in our experiments is λ = 7800. Considering DV M
CPU as the CPU demandfor the VM, equation 1 yields a λmax ≤ 1
DV MCP U
= 10.000127 = 7874, which is very
close to the measured value.
6.2 Queuing Network Model
This Section presents an analytical model for an application on the Xen VMM.The strategy for building the performance model is to define a slowdown fac-tor [7,3] (i.e., Sv) of an application running on a virtual machine which is afunction of the number of privileged instructions executed by the guest VM andof the number of instructions needed to emulate a privileged instruction. How-ever, the fraction of privileged instructions executed by a VM and the averagenumber of instructions required by the VMM to emulate a privileged instruc-tion are not easy to be measured on a real system. We propose an equationto capture the overhead of virtualization of an application. The slowdown of agiven application can be computed as the busy time of resource k on the virtualenvironment, BV irt
k , divided by Bk the busy time of resource k to execute thesame application on an equivalent non-virtual system.
Sv =BV irt
k
Bk(2)
Performance Models for Virtualized Applications 435
0
0.5
1
1.5
2
2.5
3
3.5
4
1000 2000 3000 4000 5000 6000 7000 8000
ratio
Rate (req/sec)
CPU SlowdownIDD/VM CPU ratio
Fig. 4. Slowdown and CostIDDV Mi
for the Web server benchmark
The slowdown can be interpreted as the overhead introduced by virtualizationto execute a certain application. It means that applications running on virtualmachines will see their CPU time increased Sv times. Sv will be used to calculatethe input parameters (i.e., service demands) for the virtualized performancemodel. Queuing models will be used to predict the performance of applicationsmigrating from non-virtual environments to virtualized environments.
As described in Section 4.1, the Xen architecture is divided in two differentkinds of components: the IDD and the VMs. The Xen I/O model, also used byother virtual systems [12], use a page exchange mechanism between the IDD andthe guest VM. In this context, the CPU time required by the IDD to processa package of 36 and 1448 bytes is the same if the number of page exchangesto deliver these packages are the same [2]. In order to compute the IDD CPUoverhead (i.e., the CPU time demanded by the IDD) due to an applicationrunning on a guest VM we define CostIDD
V Mias:
CostIDDV Mi
=BIDD
CPU
BV Mi
CPU
(3)
where BIDDCPU is the portion of CPU time consumed on the IDD on behalf of the
application running on the guest V Mi and BV Mi
CPU is the CPU time consumedby the guest V Mi. In [2], it is discussed how to isolate the CPU cost of theIDD of a certain VM, even when running multiple VMs simultaneously. Sincethe virtualization overhead is divided in these two kinds of components (IDDand VMs), we consider Sv as the overhead factor relative to the VM part ofthe virtualization slowdown. We estimate the IDD CPU utilization due to I/Ooperations of a certain VM, considering that CostIDD
V Miis constant relative to
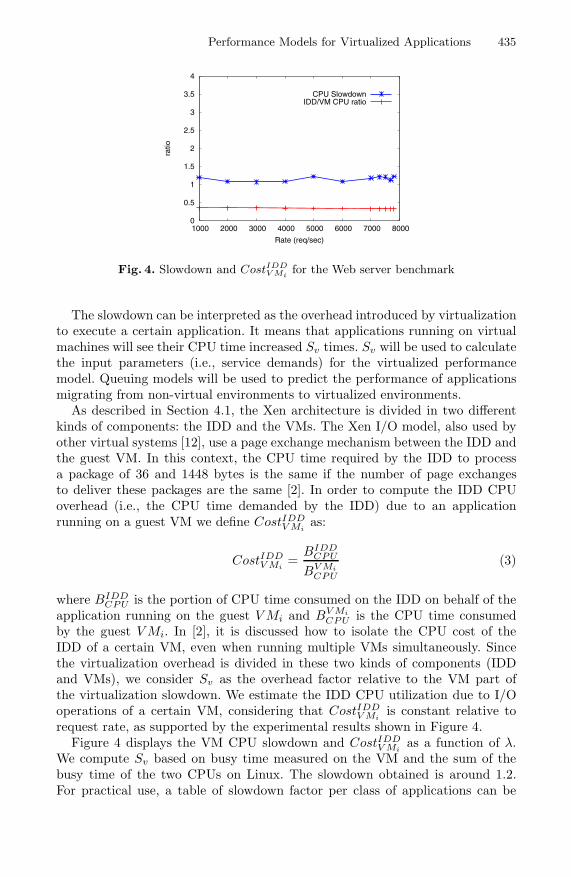
request rate, as supported by the experimental results shown in Figure 4.Figure 4 displays the VM CPU slowdown and CostIDD
V Mias a function of λ.
We compute Sv based on busy time measured on the VM and the sum of thebusy time of the two CPUs on Linux. The slowdown obtained is around 1.2.For practical use, a table of slowdown factor per class of applications can be
436 F. Benevenuto et al.
built from experimental measurements. Note that we are comparing the sumof busy time of the two CPUs on Linux with only one CPU on the VM, andthe slowdown factor does not consider the IDD CPU cost. The slowdown factorstems from several factors such as the emulation of TCP checksum, which isdone by hardware on Linux. Note that the CostIDD
V Mifor the system under study
is also constant and around 0.34. Considering this evidence, we assume CostIDDV Mi
is also a constant in our analysis. In Section 7, we discuss how to generalize themodel to represent this part of the overhead for any type of application.
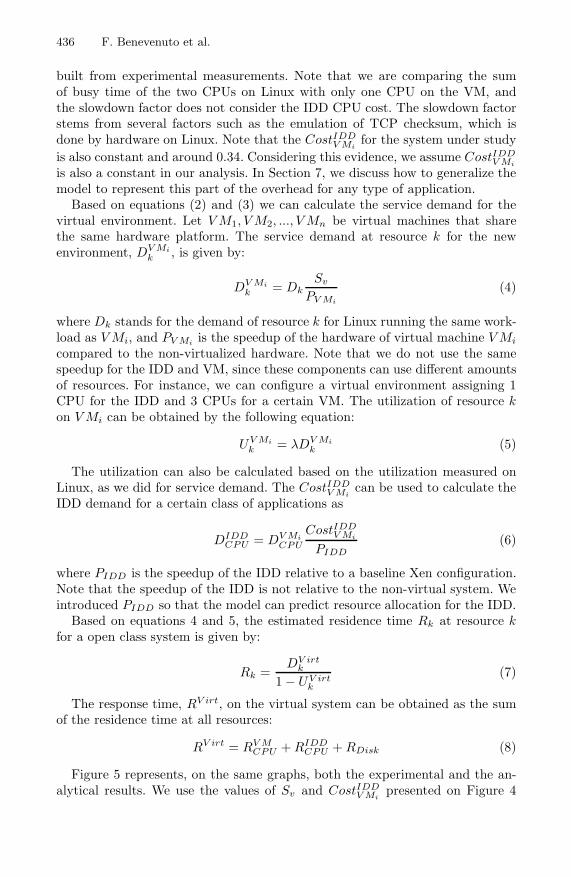
Based on equations (2) and (3) we can calculate the service demand for thevirtual environment. Let V M1, V M2, ..., V Mn be virtual machines that sharethe same hardware platform. The service demand at resource k for the newenvironment, DV Mi
k , is given by:
DV Mi
k = DkSv
PV Mi
(4)
where Dk stands for the demand of resource k for Linux running the same work-load as V Mi, and PV Mi is the speedup of the hardware of virtual machine V Mi
compared to the non-virtualized hardware. Note that we do not use the samespeedup for the IDD and VM, since these components can use different amountsof resources. For instance, we can configure a virtual environment assigning 1CPU for the IDD and 3 CPUs for a certain VM. The utilization of resource kon V Mi can be obtained by the following equation:
UV Mi
k = λDV Mi
k (5)
The utilization can also be calculated based on the utilization measured onLinux, as we did for service demand. The CostIDD
V Mican be used to calculate the
IDD demand for a certain class of applications as
DIDDCPU = DV Mi
CPU
CostIDDV Mi
PIDD(6)
where PIDD is the speedup of the IDD relative to a baseline Xen configuration.Note that the speedup of the IDD is not relative to the non-virtual system. Weintroduced PIDD so that the model can predict resource allocation for the IDD.
Based on equations 4 and 5, the estimated residence time Rk at resource kfor a open class system is given by:
Rk =DV irt
k
1 − UV irtk
(7)
The response time, RV irt, on the virtual system can be obtained as the sumof the residence time at all resources:
RV irt = RV MCPU + RIDD
CPU + RDisk (8)
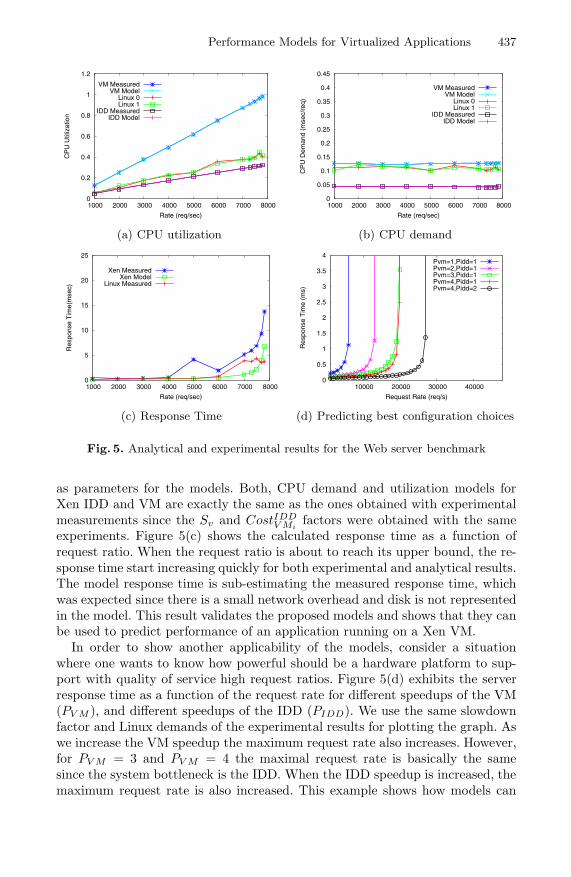
Figure 5 represents, on the same graphs, both the experimental and the an-alytical results. We use the values of Sv and CostIDD
V Mipresented on Figure 4
Performance Models for Virtualized Applications 437
0
0.2
0.4
0.6
0.8
1
1.2
1000 2000 3000 4000 5000 6000 7000 8000
CP
U U
tiliz
atio
n
Rate (req/sec)
VM MeasuredVM Model
Linux 0Linux 1
IDD MeasuredIDD Model
(a) CPU utilization
0
0.05
0.1
0.15
0.2
0.25
0.3
0.35
0.4
0.45
1000 2000 3000 4000 5000 6000 7000 8000
CP
U D
eman
d (m
sec/
req)
Rate (req/sec)
VM MeasuredVM Model
Linux 0Linux 1
IDD MeasuredIDD Model
(b) CPU demand
0
5
10
15
20
25
1000 2000 3000 4000 5000 6000 7000 8000
Res
pons
e T
ime(
mse
c)
Rate (req/sec)
Xen MeasuredXen Model
Linux Measured
(c) Response Time
0
0.5
1
1.5
2
2.5
3
3.5
4
10000 20000 30000 40000
Res
pons
e T
ime
(ms)
Request Rate (req/s)
Pvm=1,Pidd=1Pvm=2,Pidd=1Pvm=3,Pidd=1Pvm=4,Pidd=1Pvm=4,Pidd=2
(d) Predicting best configuration choices
Fig. 5. Analytical and experimental results for the Web server benchmark
as parameters for the models. Both, CPU demand and utilization models forXen IDD and VM are exactly the same as the ones obtained with experimentalmeasurements since the Sv and CostIDD
V Mifactors were obtained with the same
experiments. Figure 5(c) shows the calculated response time as a function ofrequest ratio. When the request ratio is about to reach its upper bound, the re-sponse time start increasing quickly for both experimental and analytical results.The model response time is sub-estimating the measured response time, whichwas expected since there is a small network overhead and disk is not representedin the model. This result validates the proposed models and shows that they canbe used to predict performance of an application running on a Xen VM.
In order to show another applicability of the models, consider a situationwhere one wants to know how powerful should be a hardware platform to sup-port with quality of service high request ratios. Figure 5(d) exhibits the serverresponse time as a function of the request rate for different speedups of the VM(PV M ), and different speedups of the IDD (PIDD). We use the same slowdownfactor and Linux demands of the experimental results for plotting the graph. Aswe increase the VM speedup the maximum request rate also increases. However,for PV M = 3 and PV M = 4 the maximal request rate is basically the samesince the system bottleneck is the IDD. When the IDD speedup is increased, themaximum request rate is also increased. This example shows how models can
438 F. Benevenuto et al.
Non−Virtual
(Characteristics)
Non−Virtual
BehaviourBehaviour VirtualSlowdown
...Speedup
Model Database
SystemWorkload
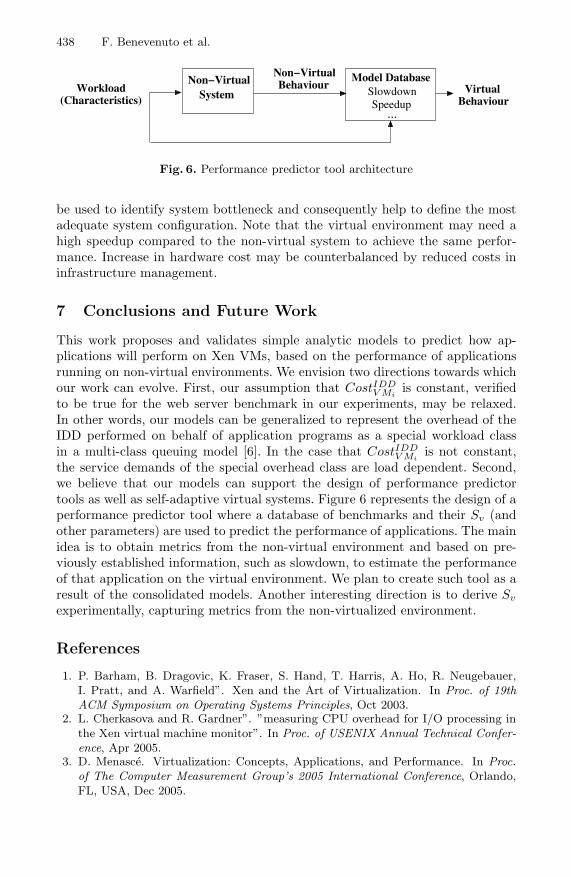
Fig. 6. Performance predictor tool architecture
be used to identify system bottleneck and consequently help to define the mostadequate system configuration. Note that the virtual environment may need ahigh speedup compared to the non-virtual system to achieve the same perfor-mance. Increase in hardware cost may be counterbalanced by reduced costs ininfrastructure management.
7 Conclusions and Future Work
This work proposes and validates simple analytic models to predict how ap-plications will perform on Xen VMs, based on the performance of applicationsrunning on non-virtual environments. We envision two directions towards whichour work can evolve. First, our assumption that CostIDD
V Miis constant, verified
to be true for the web server benchmark in our experiments, may be relaxed.In other words, our models can be generalized to represent the overhead of theIDD performed on behalf of application programs as a special workload classin a multi-class queuing model [6]. In the case that CostIDD
V Miis not constant,
the service demands of the special overhead class are load dependent. Second,we believe that our models can support the design of performance predictortools as well as self-adaptive virtual systems. Figure 6 represents the design of aperformance predictor tool where a database of benchmarks and their Sv (andother parameters) are used to predict the performance of applications. The mainidea is to obtain metrics from the non-virtual environment and based on pre-viously established information, such as slowdown, to estimate the performanceof that application on the virtual environment. We plan to create such tool as aresult of the consolidated models. Another interesting direction is to derive Sv
experimentally, capturing metrics from the non-virtualized environment.
References
1. P. Barham, B. Dragovic, K. Fraser, S. Hand, T. Harris, A. Ho, R. Neugebauer,I. Pratt, and A. Warfield”. Xen and the Art of Virtualization. In Proc. of 19thACM Symposium on Operating Systems Principles, Oct 2003.
2. L. Cherkasova and R. Gardner”. ”measuring CPU overhead for I/O processing inthe Xen virtual machine monitor”. In Proc. of USENIX Annual Technical Confer-ence, Apr 2005.
3. D. Menasce. Virtualization: Concepts, Applications, and Performance. In Proc.of The Computer Measurement Group’s 2005 International Conference, Orlando,FL, USA, Dec 2005.
Performance Models for Virtualized Applications 439
4. D. Gupta, R. Gardner, and L. Cherkasova”. XenMon: QoS Monitoring and Per-formance Profiling Tool. Technical Report HPL-2005-187, HP Labs, Oct 2005.
5. R. Jain. The Art of Computer Systems Performance Analysis: Techniques forExperimental Design, Measurement, Simulation, and Modeling. John Wiley andSons, INC, 1st edition, 1991.
6. D. Menasce, V. Almeida, and L. Dowdy. Capacity Planning and PerformanceModeling: From Mainframes to Client-Server Systems. Prentice-Hall, Inc., UpperSaddle River, NJ, USA, 1994.
7. D. A. Menasce, L. W. Dowdy, and V. A. F. Almeida. Performance by Design:Computer Capacity Planning By Example. Prentice Hall PTR, Upper Saddle River,NJ, USA, 2004.
8. A. Menon, J. R. Santos, Y. Turner, G. Janakiraman, and W. Zwaenepoel”. Diag-nosing Performance Overheads in the Xen Virtual Machine Environment. In Proc.of First ACM/USENIX Conference on Virtual Execution Environments (VEE’05),Chicago, IL, Jun 2005.
9. D. Mosberger and T. Jin”. httperf: A Tool for Measuring Web Server Perfor-mance. In Proc. of First Workshop on Internet Server Performance, pages 59—67,Madison, WI, Jun 1998.
10. A. W. Site. http://httpd.apache.org.11. VMWare Web Site. http://www.vmware.com.12. A. Whitaker, M. Shaw, and S. Gribble”. Scale and Performance in the Denali Iso-
lation Kernel. In Proc. of Operating Systems Design and Implementation (OSDI),Dec 2002.
13. Y. Bard. Performance Analysis of Virtual Memory Time-Sharing Systems. Proc.of IBM Systems Journal, 14(4):366–384, 1975.
14. Y. Bard. An analytic Model of the VM/370 System. Proc. of IBM Journal ofResearch and Development, 22(5):498–508, Set 1978.
Related Documents