Performance Metrics Performance Metrics CPS 181s April 10, 2003

Performance Metrics CPS 181s April 10, 2003. Should Performance Be Measured?
Dec 24, 2015
Welcome message from author
This document is posted to help you gain knowledge. Please leave a comment to let me know what you think about it! Share it to your friends and learn new things together.
Transcript

Performance MetricsPerformance Metrics
CPS 181s
April 10, 2003

Should Performance Be Should Performance Be Measured?Measured?
Should Performance Be Should Performance Be Measured?Measured?

MetricsMetricsMetricsMetricsAssessing the progress and health of on-line businesses
Financial progress: sales, margins, profit, market shareStrategic metrics require entire examination of the company: perception of
value proposition, marketplace offering, effectiveness of implementationBranding and implementation metrics focus on
> supply-chain performance> organizational dynamics> marketing communication effectiveness – including branding
Senior and stock market analysts tend to have a bias toward financial metrics
provide history of the company in the marketplacedo not reflect the strategy of the company
Managers need early warning system – metrics

Should Senior Managers be Should Senior Managers be Concerned About Metrics?Concerned About Metrics?Should Senior Managers be Should Senior Managers be Concerned About Metrics?Concerned About Metrics?
Organization metrics represent performance targets of the company
Percent increase in revenuePercent increase in unique visitorsLength of time visitors remain on siteCost of customer acquisition
Metrics valuable as employee reward or taking strategic action
Change processesChange strategyChange product strategies

Metrics Drive Behavior in a Metrics Drive Behavior in a Number of WaysNumber of Ways
Metrics Drive Behavior in a Metrics Drive Behavior in a Number of WaysNumber of Ways
Help define the business model Concrete goals with precise measurementsFocusing on measurement can increase the precision of the value
propositionHelp communicate strategy
Document performance targetsCommunicates strategy to workforceCreates buy-in to the metric-setting processes
Help track performanceInstantaneous feedback concerning site performance real-timeUsage, visitors, length of time on site, average sales, page views

Metrics Drive Behavior in a Metrics Drive Behavior in a Number of Ways...Number of Ways...
Metrics Drive Behavior in a Metrics Drive Behavior in a Number of Ways...Number of Ways...
Help increase accountabilityMetrics must be linked to the performance appraisal systemIndividual performance can be appraisals tied to companywide,
team-specific, and individual metricsSite usability can be tied to the interactive design functionCustomer service metrics can be tied to the customer service
department
Help Align ObjectivesAlign precise objectives, departmental functional goals,
companywide strategic activities as a whole
Current Challenges to Specifying Current Challenges to Specifying Metrics for Online BusinessesMetrics for Online Businesses
Current Challenges to Specifying Current Challenges to Specifying Metrics for Online BusinessesMetrics for Online Businesses
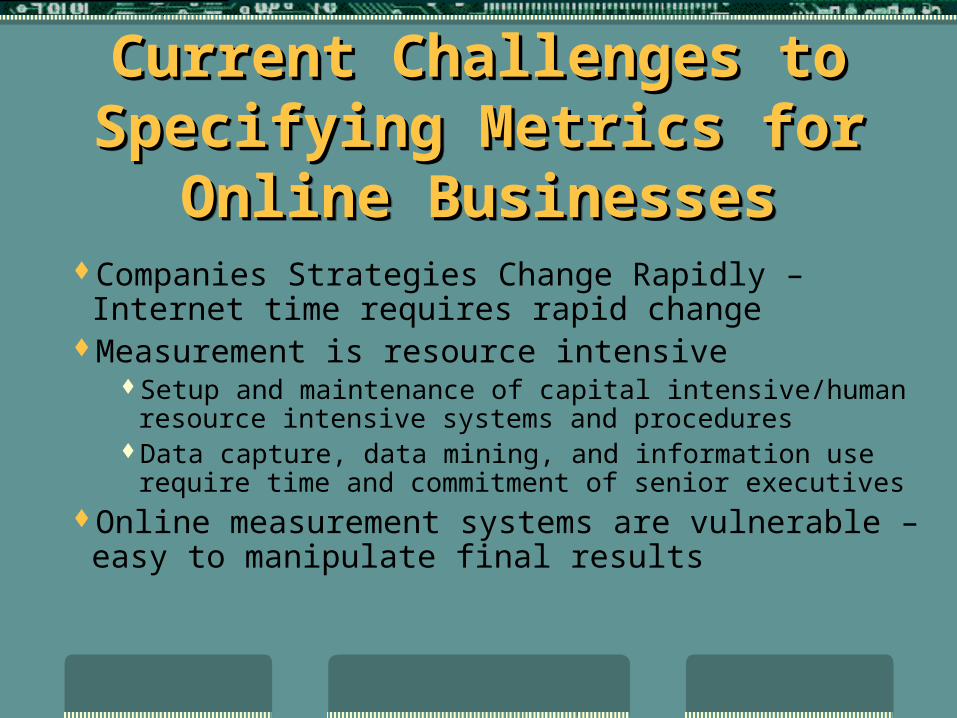
Companies Strategies Change Rapidly – Internet time requires rapid change
Measurement is resource intensiveSetup and maintenance of capital intensive/human resource
intensive systems and proceduresData capture, data mining, and information use require time and
commitment of senior executivesOnline measurement systems are vulnerable – easy to
manipulate final results

Current Challenges to Specifying Current Challenges to Specifying Metrics for Online Businesses...Metrics for Online Businesses...
Current Challenges to Specifying Current Challenges to Specifying Metrics for Online Businesses...Metrics for Online Businesses...
Soft metrics are not valued by the investment community Investment community looks at revenues, margins, number of
visitors, length of time on site, customer acquisition costsBut, ease of customer use, best value perception, and other market
research measures are frequently early warning indicators of site performance
Meaningful metrics change on Internet time – often as quickly as the time it takes to learn best how to interpret the retained original data

What Should We Measure?What Should We Measure?What Should We Measure?What Should We Measure?

How Can We Assess the Health How Can We Assess the Health of eCommerce Firms?...of eCommerce Firms?...
How Can We Assess the Health How Can We Assess the Health of eCommerce Firms?...of eCommerce Firms?...
The Balanced ScorecardIntroduced by Kaplan and NortonFinance balanced by other domains of the businessIncludes internal business processes and customer responsesFour categories
> Financial> Customer> Internal business systems> Learning and growth

Kaplan-Norton Balanced Scorecard Kaplan-Norton Balanced Scorecard Kaplan-Norton Balanced Scorecard Kaplan-Norton Balanced Scorecard
FINANCIAL
To succeed financially, how should we appear to our
shareholders?
INTERNAL BUSINESS PROCESS
To satisfy our shareholders and customers, at which businesses
must we excel?
CUSTOMER
To achieve our vision, how should we appear to our
customers?
LEARNING AND GROWTH
To achieve our vision, how will we sustain our ability to change
and improve?
Visionand
Strategy
Source: Kaplan, Robert S. and David P. Norton. 1996. Using the Balanced Scorecard as a Strategic Management System. Harvard Business Review 74 (January-February): 76.

K-N Financial and Customer K-N Financial and Customer MetricsMetrics
K-N Financial and Customer K-N Financial and Customer MetricsMetrics
Financial MetricsRevenue, revenue growth, gross margins, operating income,
net margin, earnings per share, cash flowReflect recent planning period , to some degree all previous
planning periodsCustomer Metrics
Management relationship of customers by the firmMarket shareCustomer acquisitionCustomer satisfactionCustomer profitabilityCustomized by the target segment

K-N Internal Business Process K-N Internal Business Process MetricsMetrics
K-N Internal Business Process K-N Internal Business Process MetricsMetrics
Innovation includes customer’s perception of innovativeness of the company
Operations – quality of entire supplyPostsale service – quality being offered to
customer

K-N Learning and Growth K-N Learning and Growth MetricsMetrics
K-N Learning and Growth K-N Learning and Growth MetricsMetrics
EmployeeSelectionTrainingRetentionSatisfaction
Information SystemsQuality of infrastructureTimeliness, accuracy, and utility of data
MotivationEmpowermentAlignment of company and personal goals

Limitations to the K-N Limitations to the K-N Balanced ScorecardBalanced Scorecard
Limitations to the K-N Limitations to the K-N Balanced ScorecardBalanced Scorecard
No clear definition of strategy or business models
Unclear location of organizational capabilities or resources in framework
Unclear where partnerships reside in framework
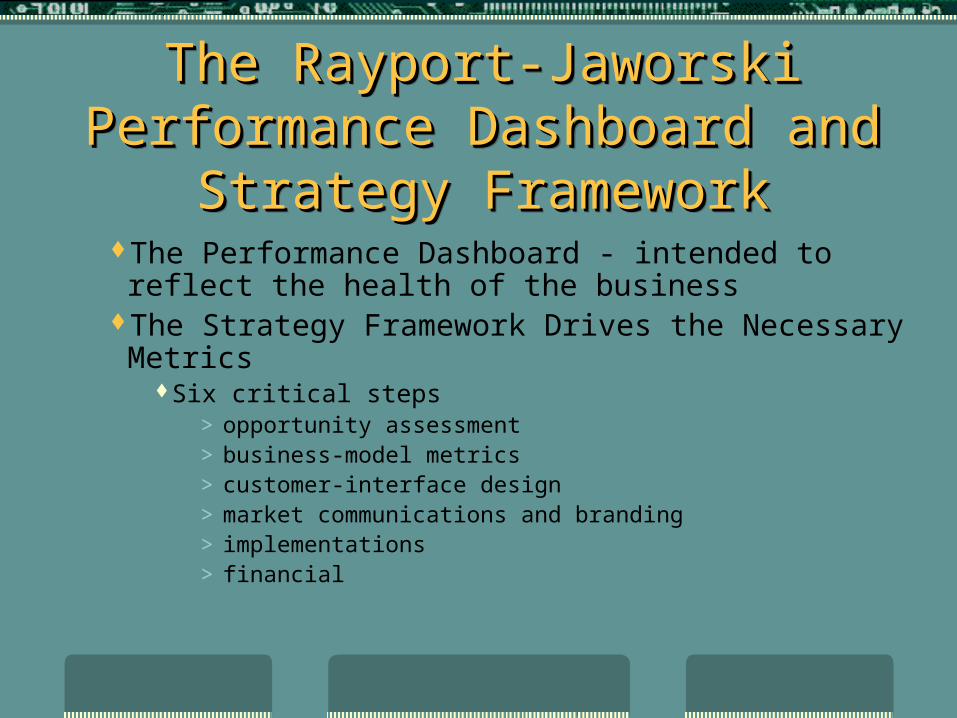
The Rayport-Jaworski Performance The Rayport-Jaworski Performance Dashboard and Strategy FrameworkDashboard and Strategy FrameworkThe Rayport-Jaworski Performance The Rayport-Jaworski Performance Dashboard and Strategy FrameworkDashboard and Strategy Framework
The Performance Dashboard - intended to reflect the health of the business
The Strategy Framework Drives the Necessary MetricsSix critical steps
> opportunity assessment> business-model metrics> customer-interface design> market communications and branding> implementations> financial

Introducing the R-J Performance DashboardIntroducing the R-J Performance DashboardIntroducing the R-J Performance DashboardIntroducing the R-J Performance Dashboard
FinancialMetrics
FinancialMetrics
Steps of Strategy:
Customer InterfaceCustomer Interface Implementation and Branding
Implementation and Branding
Performance Dashboard:
Areas Addressed:
Size of market opportunity
Attractiveness of target segments
Competitive landscape
Customer acquisition
Changes in customer behavior
Site experience and usability
Branding
Technology infrastructure
Internal organization
Relationship with suppliers and partners
Fulfillment capability
Revenue
Profit
Cost
Balance sheet
Market OpportunityAssessment
Market OpportunityAssessment Business ModelBusiness Model
Implementation & Branding
Metrics
Implementation & Branding
Metrics
CustomerInterface &
Outcome Metrics
CustomerInterface &
Outcome Metrics
Business ModelMetrics
Business ModelMetrics
OpportunityMetrics
OpportunityMetrics
Uniqueness of value proposition
Attractiveness of offering
Firm capabilities relative to competition
Sustainability of competitive position
EvaluationEvaluation

Components of the R-J Components of the R-J Performance DashboardPerformance DashboardComponents of the R-J Components of the R-J
Performance DashboardPerformance DashboardOpportunity Metrics
Ability to discern unfulfilled needs in the market place is criticalMarket-opportunity metrics asses the degree to which the firm
can accurately gauge the market opportunityBusiness-model Metrics
Capture subcomponents of the business model: egg diagram, resource systems, financial metrics
Value Proposition or Cluster Benefits Metrics> target segments, benefits offered, capabiliti4s that drive benefits> focus on customer’s perceptions> performance relative to the competitor’s benefits

R-J Branding and R-J Branding and Implementation MetricsImplementation Metrics
R-J Branding and R-J Branding and Implementation MetricsImplementation Metrics
Focus on the supply-chain performance, organizational dynamics, marketing communication effectiveness (including branding)
Fulfillment of the brand process metrics: customer awareness of the brand
Innovation metrics: ability to rapidly innovate, even if in a potentially discontinuous fashion

R-J Customer-Interface R-J Customer-Interface MetricsMetrics
R-J Customer-Interface R-J Customer-Interface MetricsMetrics
Customer-interface and customer-outcome metricsCustomer’s perception of the firm’s performance on each
level of the 7 C’s of the customer interfaceExample: customer’s rating of customization compared to
competitors’Other critical interface metrics
Including value proposition
R-J Customer-Outcome R-J Customer-Outcome MetricsMetrics
R-J Customer-Outcome R-J Customer-Outcome MetricsMetrics
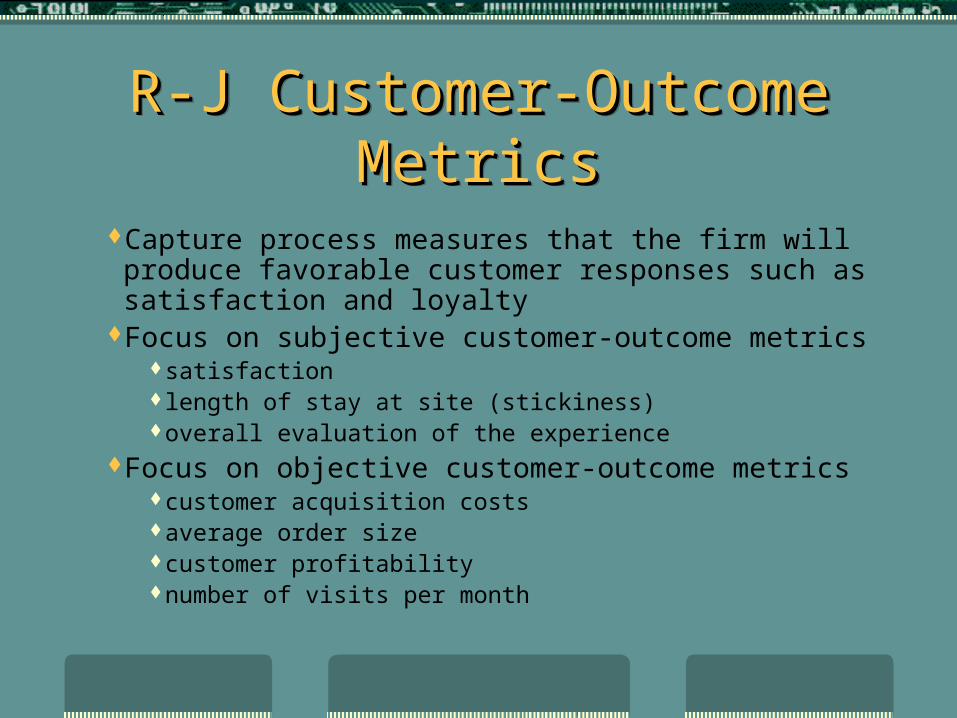
Capture process measures that the firm will produce favorable customer responses such as satisfaction and loyalty
Focus on subjective customer-outcome metricssatisfactionlength of stay at site (stickiness)overall evaluation of the experience
Focus on objective customer-outcome metricscustomer acquisition costsaverage order sizecustomer profitabilitynumber of visits per month

Financial MetricsFinancial MetricsFinancial MetricsFinancial Metrics
RevenuesCostsProfitsBalance–sheet metrics
Lise Buyer

Life Cycle of a CompanyLife Cycle of a CompanyLife Cycle of a CompanyLife Cycle of a Company
STARTUP/BETA
STARTUP/BETA
CUSTOMERACQUISITION
CUSTOMERACQUISITION MONETIZATIONMONETIZATION MATURITYMATURITY
Develop a platform for rapid growth by building a strong team and creating a flexible site.
Build market share as quickly as possible by aggressively spending on partnerships and promotion.
Increase revenues and customer lock-in by developing new revenue streams.
Control costs and optimize marketing expenditures to achieve profitable growth.
6 Months- 1 Year 1 Year - 2 Years 2 Years - 5 years > 5 Years
Strategy
Business.com TNBT.com
mValue.com Paypal.com Evite.com
Yahoo.com Amazon.com
Schwab AOL
Examples*
* At time of writing (3/2000)

What are the Steps to Implement What are the Steps to Implement the R-J Performance Dashboard?the R-J Performance Dashboard?What are the Steps to Implement What are the Steps to Implement the R-J Performance Dashboard?the R-J Performance Dashboard?
Step One: articulate business strategymarket opportunity assessmentbusiness modelcustomer-interface designbrandingimplementationevaluation

Steps Two and ThreeSteps Two and ThreeSteps Two and ThreeSteps Two and Three
Step Two: translate strategy into desired outcomesnot settling target levels but specifying outcomes
Step Three: devise metricsidentifies specific metrics that reflect the desired
outcomeslook-to-book ratios

Bill Gurley on the Power of Bill Gurley on the Power of Conversion RatesConversion Rates
Bill Gurley on the Power of Bill Gurley on the Power of Conversion RatesConversion Rates
Conversion Rate 2% 4% 8%
Advertising Spend 10,000$ 10,000$ 10,000$
Visitors 5000 5000 5000
Transactions 100 200 400
Cost/Transaction 100$ 50$ 25$
Revenue 10,000$ 20,000$ 40,000$
Marketing/Revenue (%) 100% 50% 25%
Average transaction size = $100 Source: J William Gurley
Source: Gurley, J. William. 2000. The Most Powerful Metric of All. CNET News.com, 21 February. URL: http://www.news.com/Perspectives/Column/0,176,403,00/html?tag=st.ne.

Steps Four and FiveSteps Four and FiveSteps Four and FiveSteps Four and Five
Step Four: link metrics to leading and lagging indicators
map entire set of indicatorsincluding leading & lagging indicators
Step Five: calculate current and target performancecurrent conversion ratesadvertising expendituresdegree of positive word of mouth

Blueprint to the R-J Performance DashboardBlueprint to the R-J Performance DashboardBlueprint to the R-J Performance DashboardBlueprint to the R-J Performance Dashboard
Step One: Articulate Business Strategy
Step One: Articulate Business Strategy
Step Two: Translate
Strategy Into Desired
Outcomes
Step Two: Translate
Strategy Into Desired
Outcomes
Step Three: Devise Metrics
Step Three: Devise Metrics
Step Four: Link Metrics To Leading
And Lagging Indicators
Step Four: Link Metrics To Leading
And Lagging Indicators
Step Five: Calculate
Current And Target
Performance
Step Five: Calculate
Current And Target
Performance
Def
ine
goal
s an
d va
lue
prop
ositi
onD
efin
e go
als
and
valu
e pr
opos
ition
Market Opportunity•Opportunity size?•Competitive environment?
Market Opportunity•Opportunity size?•Competitive environment?
Customer•How to acquire customers?•How will customers change?•The customer experience?
Customer•How to acquire customers?•How will customers change?•The customer experience?
Implementation and Branding
•How to develop brand?•How to go to market?
Implementation and Branding
•How to develop brand?•How to go to market?
Financial•Financial consequences in terms of revenue, profit, cost and balance sheet?
Financial•Financial consequences in terms of revenue, profit, cost and balance sheet?
Market Opportunity•Market size and growth•Average age and income•Competitor concentration
Market Opportunity•Market size and growth•Average age and income•Competitor concentration
Customer•Market share•Purchases / year•Success rate•Service requests / customer
Customer•Market share•Purchases / year•Success rate•Service requests / customer
Implementation•Customer brand awareness•System uptime percentage•Number of IT staff•% inaccurate orders
Implementation•Customer brand awareness•System uptime percentage•Number of IT staff•% inaccurate orders
Financial•Revenue•Profit•Earnings per share•Debt to Equity ratio
Financial•Revenue•Profit•Earnings per share•Debt to Equity ratio
•For each metric, determine the metrics that it affects and that affect it
•Map the linked set of metrics, indicating leading and lagging indicators
•Ensure that there is a balance between leading and lagging indicators
•For each metric, determine the metrics that it affects and that affect it
•Map the linked set of metrics, indicating leading and lagging indicators
•Ensure that there is a balance between leading and lagging indicators
Dev
elop
res
ourc
e sy
stem
req
uire
d to
del
iver
the
stra
tegy
Dev
elop
res
ourc
e sy
stem
req
uire
d to
del
iver
the
stra
tegy
•For each metric, calculate current level of performance
•Determine target level required to meet outcomes described in Step 2
•Ensure that targets are consistent with each other
•For each metric, calculate current level of performance
•Determine target level required to meet outcomes described in Step 2
•Ensure that targets are consistent with each other
Business Model•Unique value proposition?•Capabilities vs. competition?
Business Model•Unique value proposition?•Capabilities vs. competition?
Business Model•Customer perceived benefits•Exclusive partnerships•$ invested in technology vs competition
Business Model•Customer perceived benefits•Exclusive partnerships•$ invested in technology vs competition

What are the Three Sources of What are the Three Sources of Metrics Information That Firms Can Metrics Information That Firms Can
Use to Chart Their Progress?Use to Chart Their Progress?
What are the Three Sources of What are the Three Sources of Metrics Information That Firms Can Metrics Information That Firms Can
Use to Chart Their Progress?Use to Chart Their Progress?
Industry standard metricsBenchmark valuesOn-line Information

Online InformationOnline InformationOnline InformationOnline Information
Market research – primary customer dataAnalysts reports – blending market dataFinancial information – income statement, balance sheet,
statement of cash flowUse of Bizrate – use of dimensions of service Use of Forrester Reports – e-commerce reports – competitors,
consumers, technology evolution in a segment of the industryUse of Hoover’s Online – financial and market information for both
online and offline companies

U.S. Top 25 Web & Digital Media Properties (March 2000)U.S. Top 25 Web & Digital Media Properties (March 2000)U.S. Top 25 Web & Digital Media Properties (March 2000)U.S. Top 25 Web & Digital Media Properties (March 2000)
Source: Media Metrix (www.mediametrix.com/usa/press/releases/20000424.jsp) March 31, 2000
Rank Digital Media/Web Unique Visitors (000)1 AOL Network 59,8582 Yahoo Sites 48,3363 Microsoft Sites 46,5814 Lycos 32,8995 Excite @ Home 28,5716 Go Network 23,0067 NBC Internet 17,1698 Amazon 15,2179 Time Warner Online 13,63610 Real.com Network 13,48211 Go2Net Network 13,04112 AltaVista Network 12,55713 About.com Sites 12,32914 Ask Jeeves 12,26915 eBay 11,15516 LookSmart 10,55717 ZDNet Sites 10,22618 CNET Networks 10,02319 eUniverse Network 9,19820 JUNO/JUNO.COM 9,17721 EarthLink 8,52622 Infospace Impressions 8,30523 Viacom Online 8,13924 FortuneCity Network 7,80925 CitySearch-TicketMaster
Online7,689
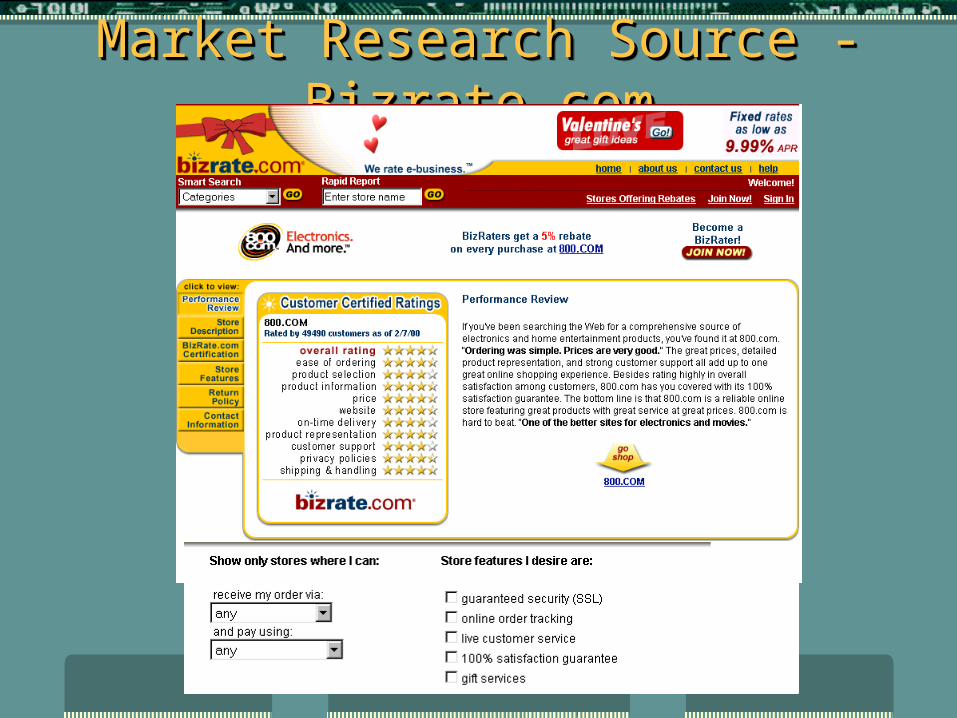
Market Research Source - Bizrate.comMarket Research Source - Bizrate.comMarket Research Source - Bizrate.comMarket Research Source - Bizrate.com

Analyst Source - ForresterAnalyst Source - ForresterAnalyst Source - ForresterAnalyst Source - Forrester

Financial Information Source - Hoovers OnlineFinancial Information Source - Hoovers OnlineFinancial Information Source - Hoovers OnlineFinancial Information Source - Hoovers Online

Mapping Internet Research Onto The Performance DashboardMapping Internet Research Onto The Performance Dashboard
Market
Implementation
Customer
Financial
Market Research AnalystFinancial
Information
Related Documents