PERFORMANCE MEASURES KEY RESULTS AND MEASURES ANNUAL REPORT September, 2016 Prepared by State Court Administrator’s Office Court Services Division, Research & Evaluation

Welcome message from author
This document is posted to help you gain knowledge. Please leave a comment to let me know what you think about it! Share it to your friends and learn new things together.
Transcript
Executive Summary
P E R F O R M A N C E M E A S U R E S
K E Y R E S U L T S A N D M E A S U R E S
A N N U A L RE P O R T
September, 2016
Prepared by State Court Administrator’s Office
Court Services Division, Research & Evaluation
Executive Summary
2
TABLE OF CONTENTS
Executive Summary .................................................................................................................................................. 4
Positive Performance Measure Results By Goal ........................................................................................... 5
Possible Areas of Concern ...................................................................................................................................... 8
Using Performance Measures for Administration ....................................................................................... 9
District Courts Review Results ............................................................................................................................. 9
Access to Justice ..................................................................................................................................................... 11
Access and Fairness Survey ................................................................................................................................. 11
Timeliness ................................................................................................................................................................. 14
Clearance Rates ........................................................................................................................................................ 14
Figure 2.1: Statewide Clearance Rates FY 2012 – FY 2016 .......................................................... 14
Figure 2.2: Overall (Including Minor Criminal) Clearance Rates FY2016 by District ....... 14
Figure 2.3: Statewide Major Criminal Clearance Rates – FY02-FY16 (15 Years) ............... 15
Figure 2.4: Statewide Clearance Rates FY12 – FY16 – By Case Group .................................... 16
Figure 2.5: Statewide Active Pending Caseload, Major Cases FY12 – FY16 .......................... 17
Time To Disposition ............................................................................................................................................... 18
Figure 2.6: Statewide Time to Disposition Cases Disposed in MNCIS in FY 2016 .............. 18
Figure 2.7: Percent Cases Disposed Beyond the 99th Percentile Objective FY 2016 by Case Group, By District .......................................................................................................................................... 19
Figure 2.8: Percent of Cases Disposed Statewide Beyond 99th Percentile FY2012- FY2016 by Case Category ............................................................................................................................................ 19
Figure 2.9: Percent of Delinquency Felony Cases Disposed Statewide Beyond 6 Months20
Age of Pending Cases .............................................................................................................................................. 21
Figure 2.10: Statewide Age of Pending Cases As Of 7/7/2016................................................... 21
Figure 2.11: Trend of Statewide % of Major Criminal Cases Pending Beyond 12 Months21
Figure 2.12: Trends in District Age of Pending Cases Past 99th Percentile, All Case Types22
Figure 2.13: 5th Degree Assault Charges Pending Beyond 99th Percentile (As of 7/7/2016) ............................................................................................................................................................................... 23
Figure 2.14: Percent of 5th Degree Assault Charges Pending beyond 9 months (goal is 1% or less), By County (As of 7/7/2016) ......................................................................................................... 24
Length of Time to Permanency and Adoption ............................................................................................. 25
Figure 2.15: Length of Time for Children to Reach Permanency in FY 2016, by District 25
Figure 2.16: Five Year Trend, Children Reaching Permanency by 18 months .................... 26
Figure 2.17: Length of Time for Children to Reach Adoption ..................................................... 26
Figure 2.18: Length of Time to Adoption, Statewide, FY12-FY16 ............................................. 26

Executive Summary
3
Figure 2.19: Average Number Days to Adoption, by Phase, by District, FY2016 ................ 27
Court of Appeals Dispositions Within Time Standards ............................................................................ 28
Figure 2.20: Percent of Court of Appeals Cases Disposed Within 290 Days of Filing, FY2014-FY2016 ............................................................................................................................................................... 28
Figure 2.21: Percent of Court of Appeals Cases Disposed Within 365 Days of Filing, FY2014-FY2016 ............................................................................................................................................................... 29
Supreme Court Dispositions Within Time Standards ............................................................................... 30
Figure 2.22: Supreme Court Timing Standards ................................................................................ 31
Integrity and Accountability ........................................................................................................................... 32
Data Quality Program............................................................................................................................................. 32
Excellence .................................................................................................................................................................. 34
Access and Fairness Survey ................................................................................................................................. 34
Fairness and Equity ............................................................................................................................................. 35
Access and Fairness Survey ................................................................................................................................. 35
Figure 5.1: Selected Results, Supreme Court, Court of Appeals Access and Fairness Survey ............................................................................................................................................................................... 35
Jury Pools .................................................................................................................................................................... 37
Figure 5.2: FY2016 Juror Race Comparison to 2010 American Community Survey Estimates ........................................................................................................................................................... 37
Figure 5.3: Comparison of FY2016 Jurors’ Gender to Census Results ..................................... 38
Quality Court Workplace Environment .................................................................................................... 39
Separation Rates ...................................................................................................................................................... 39
Figure 6.1: Separation Rates by District and MJC for FY2016 .................................................... 39
Figure 6.2: Total Separation Rates by District and MJC, FY2012 to FY2016 ........................ 40
Figure 6.3: Statewide Separation Rates by Type, FY2012 to FY2016 ..................................... 40
Quality Court Workplace Survey Results ....................................................................................................... 41
Data Details (Appendix) .................................................................................................................................... 42
Definition of Terms ....................................................................................................................................... 42
Analysis Notes ................................................................................................................................................. 44
Number of Juvenile Delinquency Felony Dispositions, FY 2016 ................................................ 45
Juror Race By County, State FY 2016 ..................................................................................................... 46
Executive Summary
4
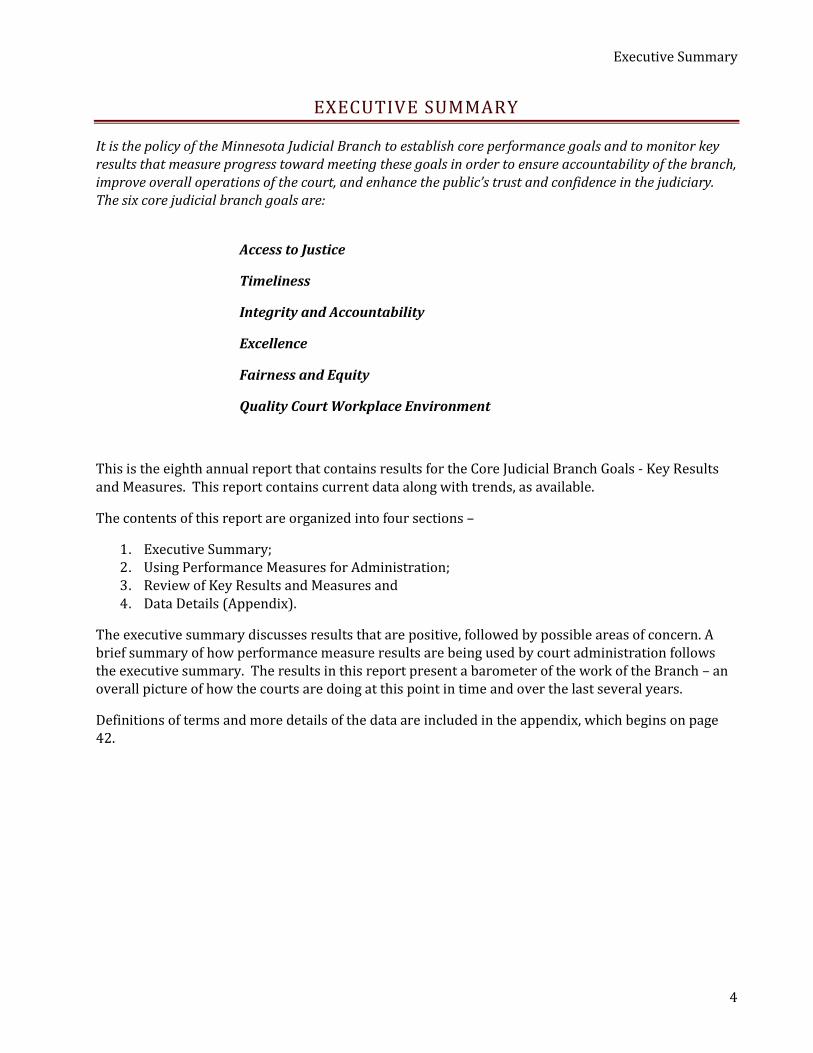
EXECUTIVE SUMMARY
It is the policy of the Minnesota Judicial Branch to establish core performance goals and to monitor key results that measure progress toward meeting these goals in order to ensure accountability of the branch, improve overall operations of the court, and enhance the public’s trust and confidence in the judiciary. The six core judicial branch goals are:
Access to Justice
Timeliness
Integrity and Accountability
Excellence
Fairness and Equity
Quality Court Workplace Environment
This is the eighth annual report that contains results for the Core Judicial Branch Goals - Key Results and Measures. This report contains current data along with trends, as available.
The contents of this report are organized into four sections –
1. Executive Summary; 2. Using Performance Measures for Administration; 3. Review of Key Results and Measures and 4. Data Details (Appendix).
The executive summary discusses results that are positive, followed by possible areas of concern. A brief summary of how performance measure results are being used by court administration follows the executive summary. The results in this report present a barometer of the work of the Branch – an overall picture of how the courts are doing at this point in time and over the last several years.
Definitions of terms and more details of the data are included in the appendix, which begins on page 42.
Executive Summary
5
7.2%
9.0% 9.5% 9.3%
7.1%
5%
6%
7%
8%
9%
10%
FY2012 FY2013 FY2014 FY2015 FY2016
% C
ases
Dis
po
sed
> 1
yr
% of Major Criminal cases disposed beyond 12 months (goal is 1% or less)
9.7% 9.3% 10.6% 10.8%
8.3% 8.6% 6.5% 6.2%
0%
5%
10%
15%
20%
End of 2009 End of 2010 FY2011 FY2012 FY2013 FY2014 FY2015 FY2016
% P
end
ing
Cas
es >
1yr
% of Major Criminal cases pending beyond 12 months (goal is 1% or less)
POSITIVE PERFORMANCE MEASURE RESULTS BY GOAL
Access to Justice
The measure for this goal is the Access and Fairness Survey.
The Court of Appeals and Supreme Court conducted their first Access and Fairness Survey in September 2015. Both appellate attorneys and district court judges responded to the surveys for each court.
The highest agreement levels from attorneys for both the Supreme Court and Court of Appeals survey relate to courtesy and respect as shown in this chart.
High levels of agreement from judges about the Supreme Court survey include:
The Court’s written decisions clearly state the applicable legal principles that govern the decision. (83% agree/strongly agree)
Higher levels of agreement from judges about the Court of Appeals survey include:
The Court of Appeals renders its decisions without any improper outside influences. (85% agree/strongly agree)
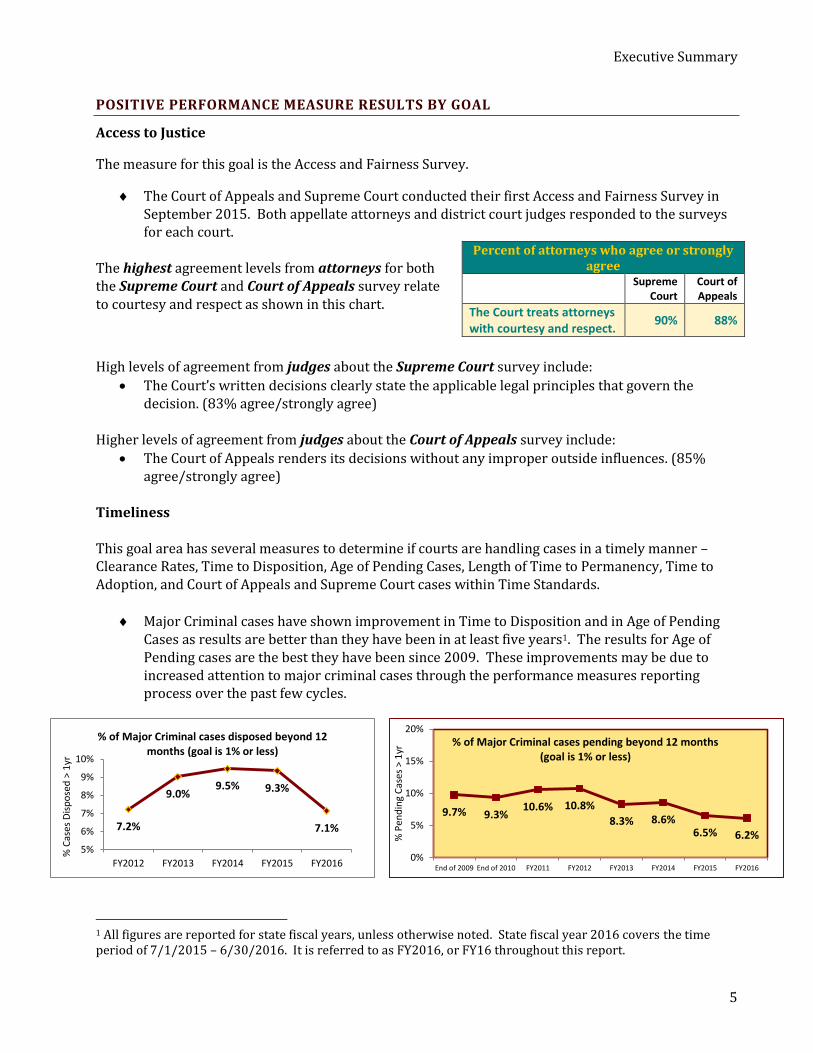
Timeliness This goal area has several measures to determine if courts are handling cases in a timely manner – Clearance Rates, Time to Disposition, Age of Pending Cases, Length of Time to Permanency, Time to Adoption, and Court of Appeals and Supreme Court cases within Time Standards.
Major Criminal cases have shown improvement in Time to Disposition and in Age of Pending Cases as results are better than they have been in at least five years1. The results for Age of Pending cases are the best they have been since 2009. These improvements may be due to increased attention to major criminal cases through the performance measures reporting process over the past few cycles.
1 All figures are reported for state fiscal years, unless otherwise noted. State fiscal year 2016 covers the time period of 7/1/2015 – 6/30/2016. It is referred to as FY2016, or FY16 throughout this report.
Percent of attorneys who agree or strongly agree
Supreme Court
Court of Appeals
The Court treats attorneys with courtesy and respect.
90% 88%

Executive Summary
6
As a trial judge, I dislike getting cases remanded but sometimes
it's necessary. I think I have been treated fairly.
Court of Appeals Survey Judge
Comment
All Court of Appeals cases, except in the criminal category, met the timing objective of disposing of 75% of cases within 290 days of filing and 90% of cases within 365 days of filing. Overall, 72% of cases disposed in FY2016 met the 290 day objective and 91% of cases disposed in that year met the 365 day objective.
Statewide Time to Disposition results in FY2016 meet the timing objectives for Major Civil, Dissolutions (with and without child) and Domestic Abuse cases.
Six districts had more than 60% of children reach adoption in FY2016 within 24 months of
removal from the home. (Goal = 60%) The state average of 56% is the second highest number of children reaching adoption by 24 months over the past five fiscal years.
Integrity and Accountability
The goal in this area is to ensure that the electronic record system is accurate, complete and timely.
As part of the ongoing efforts to assure appropriate access to court documents, a new summary report is available to identify potential ‘trouble spots’ and another report can be used by courts and SCAO as a guide in performing random reviews in the area of document security.
Excellence
The goal in this area is to achieve excellence in the resolution of cases by making decisions that are fair, reasoned, understandable, and that resolve the controversy at issue.
The results for the 2013 District Court Access and Fairness Survey statement used to measure excellence, “As I leave the court, I know what to do next about my case” had 84% of respondents who were in front of a judge agree or strongly agree.
Fairness and Equity
Measures for this goal area include juror representativeness and statements from the Access and Fairness survey.
The first ever Access and Fairness survey for appellate courts found district court judges with high levels of agreement for issues of fairness for both appellate courts as shown in the chart on the next page.
WCL Case Category
99th Percentile Objective (Months)
FY16 % Cases Disposed at 99th
Percentile
Major Civil 24 99.1%
Dissolutions 24 99.5%
Domestic Abuse 4 99.5%
Total All Cases
97.0%
Executive Summary
7
Percent of judges who agree/strongly agree Supreme
Court Court of Appeals
The Court adequately considers each case based upon its facts and the applicable law.
80% 80%
The Court’s written decisions reflect thoughtful and fair evaluation of the parties’ arguments
82% 80%
The next District Court Access & Fairness Survey will be conducted in FY 2018.
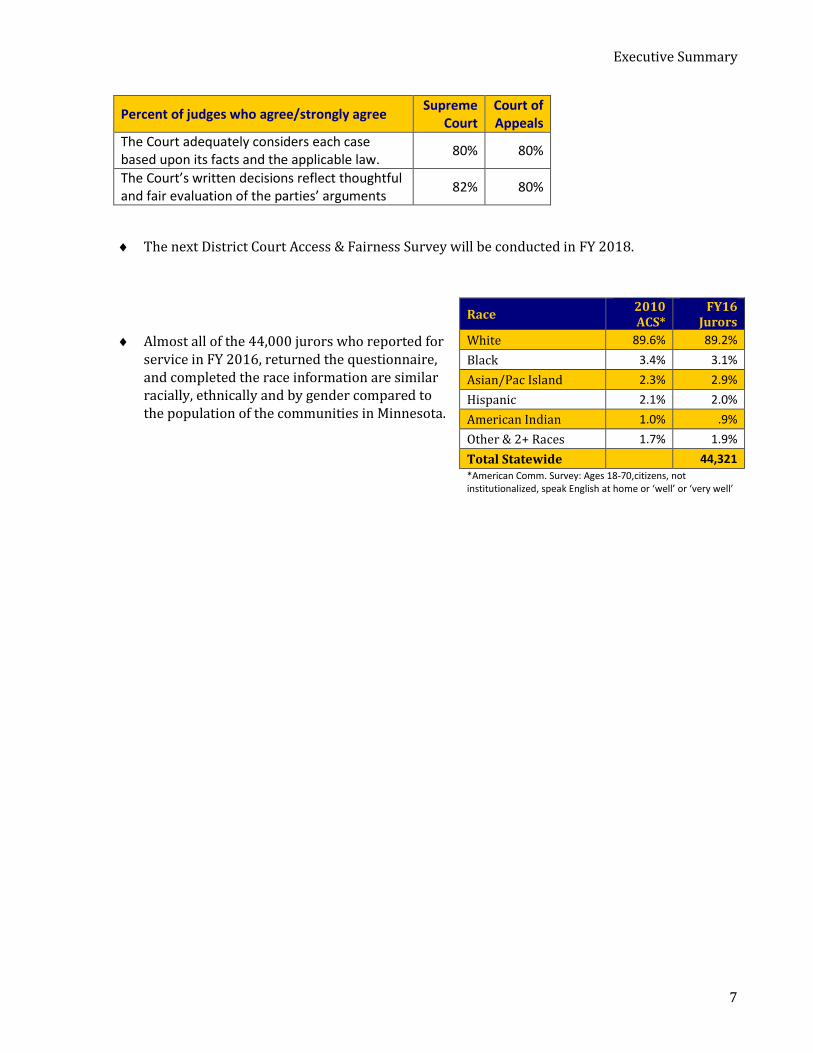
Almost all of the 44,000 jurors who reported for service in FY 2016, returned the questionnaire, and completed the race information are similar racially, ethnically and by gender compared to the population of the communities in Minnesota.
Race 2010 ACS*
FY16 Jurors
White 89.6% 89.2%
Black 3.4% 3.1%
Asian/Pac Island 2.3% 2.9%
Hispanic 2.1% 2.0%
American Indian 1.0% .9%
Other & 2+ Races 1.7% 1.9%
Total Statewide 44,321 *American Comm. Survey: Ages 18-70,citizens, not institutionalized, speak English at home or ‘well’ or ‘very well’
Executive Summary
8
POSSIBLE AREAS OF CONCERN
The measures in this section show possible areas of concern, but do not necessarily reflect poor performance.
Timeliness
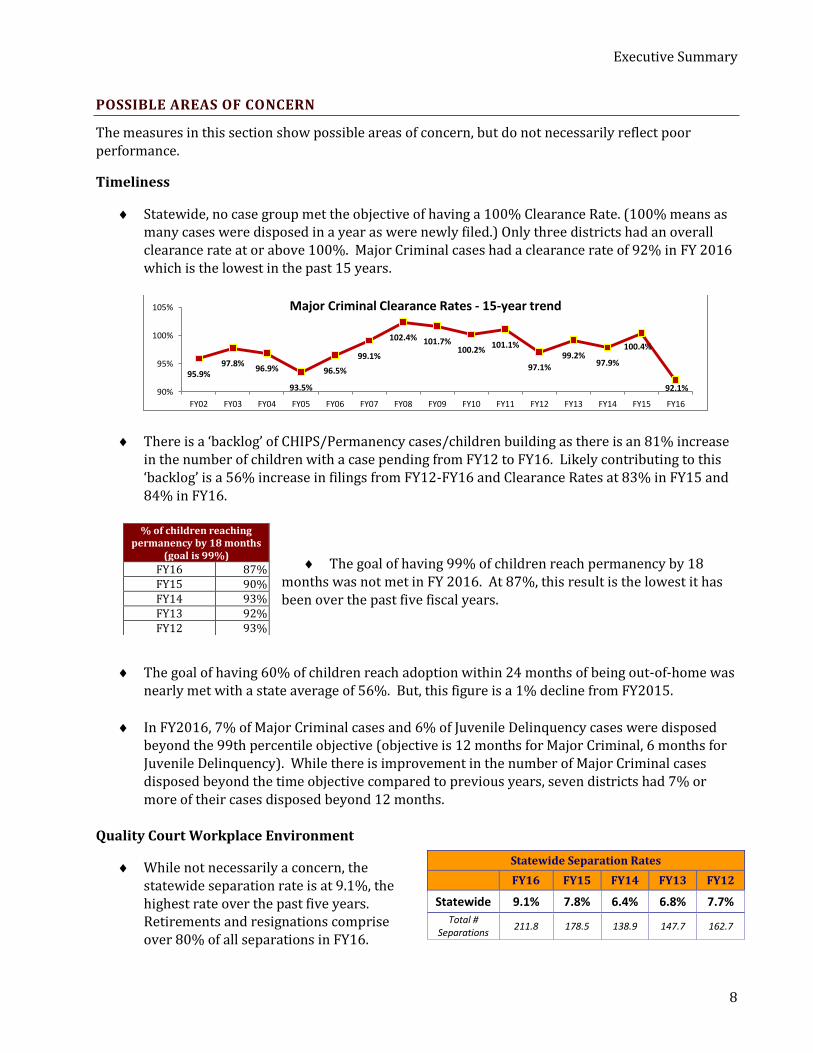
Statewide, no case group met the objective of having a 100% Clearance Rate. (100% means as many cases were disposed in a year as were newly filed.) Only three districts had an overall clearance rate at or above 100%. Major Criminal cases had a clearance rate of 92% in FY 2016 which is the lowest in the past 15 years.
There is a ‘backlog’ of CHIPS/Permanency cases/children building as there is an 81% increase in the number of children with a case pending from FY12 to FY16. Likely contributing to this ‘backlog’ is a 56% increase in filings from FY12-FY16 and Clearance Rates at 83% in FY15 and 84% in FY16.
The goal of having 99% of children reach permanency by 18 months was not met in FY 2016. At 87%, this result is the lowest it has been over the past five fiscal years.
The goal of having 60% of children reach adoption within 24 months of being out-of-home was nearly met with a state average of 56%. But, this figure is a 1% decline from FY2015.
In FY2016, 7% of Major Criminal cases and 6% of Juvenile Delinquency cases were disposed beyond the 99th percentile objective (objective is 12 months for Major Criminal, 6 months for Juvenile Delinquency). While there is improvement in the number of Major Criminal cases disposed beyond the time objective compared to previous years, seven districts had 7% or more of their cases disposed beyond 12 months.
Quality Court Workplace Environment
While not necessarily a concern, the statewide separation rate is at 9.1%, the highest rate over the past five years. Retirements and resignations comprise over 80% of all separations in FY16.
95.9% 97.8%
96.9%
93.5%
96.5%
99.1%
102.4% 101.7% 100.2%
101.1%
97.1%
99.2% 97.9%
100.4%
92.1% 90%
95%
100%
105%
FY02 FY03 FY04 FY05 FY06 FY07 FY08 FY09 FY10 FY11 FY12 FY13 FY14 FY15 FY16
Major Criminal Clearance Rates - 15-year trend
% of children reaching permanency by 18 months
(goal is 99%) FY16 87% FY15 90% FY14 93% FY13 92% FY12 93%
Statewide Separation Rates
FY16 FY15 FY14 FY13 FY12
Statewide 9.1% 7.8% 6.4% 6.8% 7.7%
Total # Separations
211.8 178.5 138.9 147.7 162.7
Using Performance Measures for Administration
9
USING PERFORMANCE MEASURES FOR ADMINISTRATION
Reviews of performance measure results are reported twice per year to the Judicial Council. The most recent written reports were submitted in March 2016 and oral reports are to be given in September 2016.
Reviewing results of performance measures has become routine at bench meetings and within court administration.
DISTRICT COURTS REVIEW RESULTS
The reviews of performance measure results by districts at the March, 2016 Judicial Council meeting concentrated on the best two and two most troubling results for each district/court.
Examples of Plans to Address Issues and Effectively Use Resources Many districts conducted comprehensive reviews of results of time to disposition, clearance rates and age of pending cases. Specific examples include:
The 1st District did a review that included discussing challenges and solutions which resulted in the implementation of a “Performance Measures Improvement Plan”. Along with regular monitoring and sharing of performance measure reports, the district requested an automated, visual cue in BenchWorks which would indicate to judges how long a case has been pending.
In the 2nd District, data cleanup was required for minor criminal cases due to the transition from ViBES to MNCIS2. Some conversion rules negatively affected results for age of pending cases, but resources were to be identified to clean up the data. Another difficult area was in Time to Permanency and Adoption. Several system challenges contributed to declining results. Judicial resources were evaluated for changing caseloads and timing performance with reallocations to address concerns in this area.
Major Criminal results improved in the 3rd District. Having a new Family Court Referee provided the ability to focus judge time on other case types, including major criminal. CHIPS results were troublesome so the district is working with court administration to minimize scheduling gaps and they have made judges more aware of and mindful of the timing measures.
There was a decrease in the percent of children reaching permanency within time guidelines in the 4th District compared to previous years. The county hired a significant number of new social workers due to the public scrutiny in the Child Protection area and workloads have increased.
2 The ViBES to MNCIS conversion included making a business decision to convert all drivers license suspension cases as ‘open’ in MNCIS rather than the status of ‘dormant’ as they had been in ViBES. These cases are now being reviewed case by case to determine which cases should be closed or remain open.
“Our steady improvement
in Major Criminal is cause
for celebration.”
3rd District

Using Performance Measures for Administration
10
“We recognize there is room to
improve…”
10th District
“The addition of a referee … has made a difference with the district’s minor civil cases in particular. …assigning conciliation, evictions, and implied consents to the referee has allowed each location to better manage the court’s calendar.”
6th District
The 5th District achieved the goal of having adoption orders filed within 24 months in the Time to Adoption for Children Under State Guardianship measurement. The results have improved to exceed the goal, and also exceed the statewide average. Juvenile Delinquency cases were pending beyond the 99th percentile at a high rate. A thorough review of pending cases was to be conducted to identify factors causing delay.
The 6th District has improved the results for major criminal time to disposition by having the district performance measures manager monitor reports and send weekly updates to judges with aging information. Minor Civil clearance rates have also improved due to adding a referee and centralizing processing of several minor civil case types in Cook County.
Each court administrator in the 7th District continues to review performance measure reports monthly and provides lists of cases not meeting objectives to local judges. Additionally, some local courts are reviewing calendar management practices and anticipate making additional changes to accommodate use of judge time from the 8th and 10th Districts as well as senior judges.
Juvenile Delinquency cases will be reviewed in the 8th District to determine if more can be done to improve the age of pending stats. Also, the 8th District managers and supervisors are reminded to closely monitor performance measure reports to catch clerical errors sooner.
The 9th District also had more negative results for Juvenile Delinquency time to disposition, and found one county had multiple continuances, returned mail, warrants issued, and files tracking with others while the original file ages out. A new judge rotation began that may improve the pending cases for Mahnomen, Pennington and Red Lake Counties.
Dependency/neglect and TPR case types were a troubling area in the 10th District. Filing increases were significant and timing performance suffered as a result. The district formed an ad hoc committee to consider whether GAL resources could be more effectively used in cases where appointment is mandated.
Access to Justice
11
ACCESS TO JUSTICE
The Minnesota Judicial Branch will be open, affordable and understandable to ensure access to justice.
Do participants perceive the courts to be accessible?
ACCESS AND FAIRNESS SURVEY
The Supreme Court and Court of Appeals conducted an Access and Fairness Survey for the first time in September, 2015. Each court had its own survey, with attorneys who practice appellate law and district court judges responding to them. This survey is planned to be repeated in approximately four years.
The next district court Access and Fairness Survey will be conducted in FY 2018. Two previous rounds of the survey were completed in 2008 and 2013.
The Minnesota Supreme Court and Court of Appeals conducted the first-ever Access & Fairness Survey in September, 2015. The survey instruments were based on the Quality of Services Survey designed by the National Center for State Courts. There were four versions of questionnaires designed for the two appellate courts with two sets of respondents, attorneys practicing appellate law and district court judges.
Results of the Supreme Court survey were shared with the Court and with the Judicial Council3
There were 349 responses from attorneys and 98 from district court judges
Nearly two-thirds of attorneys (64%) have been practicing law for 21 years or more
About half (49%) of judges responding to the survey have been on the bench for more than ten years
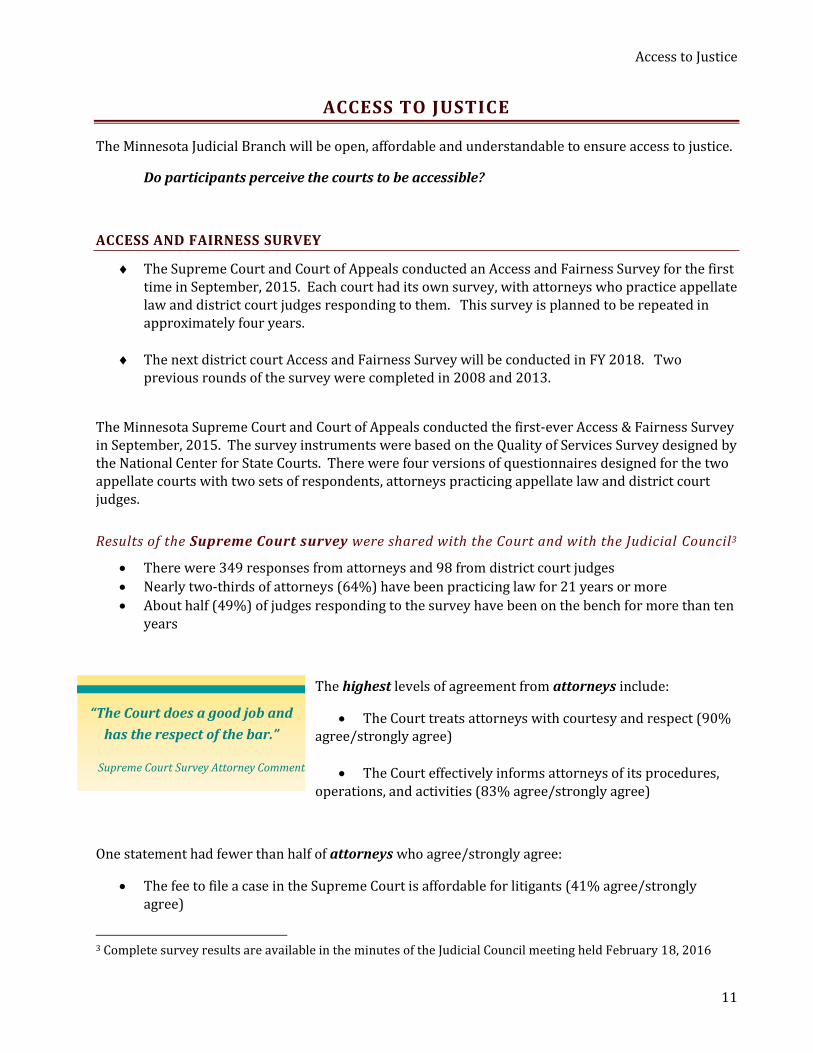
The highest levels of agreement from attorneys include:
The Court treats attorneys with courtesy and respect (90% agree/strongly agree)
The Court effectively informs attorneys of its procedures, operations, and activities (83% agree/strongly agree)
One statement had fewer than half of attorneys who agree/strongly agree:
The fee to file a case in the Supreme Court is affordable for litigants (41% agree/strongly agree)
3 Complete survey results are available in the minutes of the Judicial Council meeting held February 18, 2016
“The Court does a good job and
has the respect of the bar.”
Supreme Court Survey Attorney Comment
Access to Justice
12
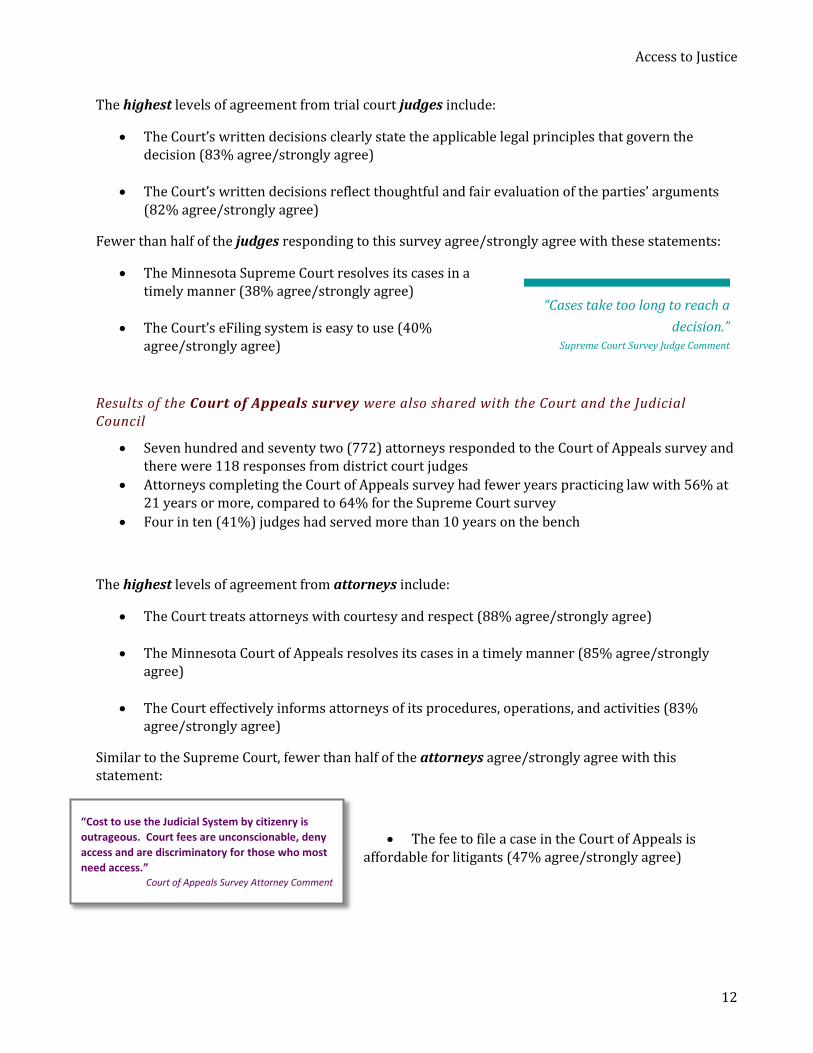
“Cost to use the Judicial System by citizenry is
outrageous. Court fees are unconscionable, deny
access and are discriminatory for those who most
need access.” Court of Appeals Survey Attorney Comment
“Cases take too long to reach a
decision.” Supreme Court Survey Judge Comment
The highest levels of agreement from trial court judges include:
The Court’s written decisions clearly state the applicable legal principles that govern the decision (83% agree/strongly agree)
The Court’s written decisions reflect thoughtful and fair evaluation of the parties’ arguments (82% agree/strongly agree)
Fewer than half of the judges responding to this survey agree/strongly agree with these statements:
The Minnesota Supreme Court resolves its cases in a timely manner (38% agree/strongly agree)
The Court’s eFiling system is easy to use (40% agree/strongly agree)
Results of the Court of Appeals survey were also shared with the Court and the Judicial Council
Seven hundred and seventy two (772) attorneys responded to the Court of Appeals survey and there were 118 responses from district court judges
Attorneys completing the Court of Appeals survey had fewer years practicing law with 56% at 21 years or more, compared to 64% for the Supreme Court survey
Four in ten (41%) judges had served more than 10 years on the bench
The highest levels of agreement from attorneys include:
The Court treats attorneys with courtesy and respect (88% agree/strongly agree)
The Minnesota Court of Appeals resolves its cases in a timely manner (85% agree/strongly agree)
The Court effectively informs attorneys of its procedures, operations, and activities (83% agree/strongly agree)
Similar to the Supreme Court, fewer than half of the attorneys agree/strongly agree with this statement:
The fee to file a case in the Court of Appeals is affordable for litigants (47% agree/strongly agree)

Access to Justice
13
The highest levels of agreement from trial court judges include:
The Court of Appeals renders its decisions without any improper outside influences (85% agree/strongly agree)
The Minnesota Court of Appeals resolves its cases in a timely manner (82% agree/strongly agree)
The lowest level of agreement from judges is:
The Court of Appeals decisions provide appropriate guidance for future cases (56% agree/ strongly agree)
“The Court of Appeals resolves cases in a timely and efficient manner. The
overwhelming majority of decisions are well supported, clear and appropriate…”
Court of Appeals Survey Judge Comment

Timeliness
14
92.4%
93.7%
94.4%
94.7%
94.8%
94.9%
96.0%
97.9%
100.5%
101.4%
102.3%
75% 80% 85% 90% 95% 100% 105%
6
2
4
8
10
9
State
5
7
1
3
Dis
tric
t
TIMELINESS
The Minnesota Judicial Branch will resolve cases and controversies in a timely and expeditious way without unnecessary delays.
Are trial courts handling cases in a timely manner?
CLEARANCE RATES
The statewide Clearance Rate for all case types combined is 96% (Goal = 100%) in FY 2016.
All case categories except Major Criminal have a Clearance Rate of 96% or higher.
Minor Civil cases show the highest Clearance Rate in FY2016 at 99%, while Major Criminal has the lowest rate at 92%.
Figure 2.1: Statewide Clearance Rates FY 2012 – FY 2016
The FY2016 Clearance Rate results, by case group, are generally lower than in FY2015. (Goal is 100% or higher.) Major Criminal, Probate/Mental Health, and Family groups in FY2016 have the lowest clearance rates in the past five years. The Gross Misdemeanor DWI (87%) clearance rate contributes to the overall low Major Criminal Clearance Rate. For Juvenile cases, the lower Clearance Rate results from three case categories with a rate of less than 90% - Non TPR Permanency at 83%; Dependency/Neglect at 84% and TPR
Permanency cases with a Clearance Rate of 88%.
Figure 2.2: Overall (Including Minor Criminal) Clearance Rates FY2016 by District
Figure 2.2 shows that the overall FY16 Clearance Rates, including Minor Criminal charges, by district, range from 92% in the 6th District to 102% in the 3rd District.
Case Group
Clearance Rates
FY12 FY13 FY14 FY15 FY16
Major Crim 97% 99% 98% 100% 92%
Major Civil 104% 102% 96% 104% 96%
Prob/MH 101% 99% 101% 99% 98%
Family 100% 101% 101% 101% 97%
Juvenile 99% 102% 95% 95% 96%
Minor Civil 98% 102% 100% 102% 99%
Minor Crim 97% 110% 95% 96% 96%
State 97% 109% 96% 97% 96%
Timeliness
15
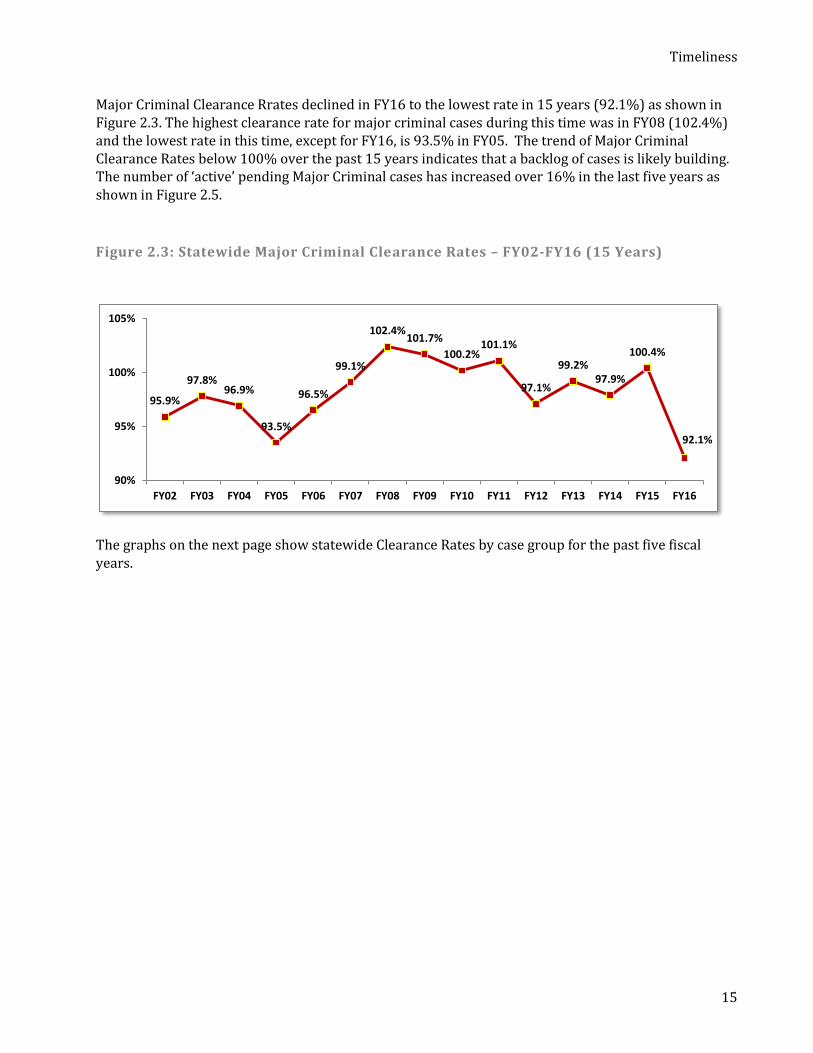
Major Criminal Clearance Rrates declined in FY16 to the lowest rate in 15 years (92.1%) as shown in Figure 2.3. The highest clearance rate for major criminal cases during this time was in FY08 (102.4%) and the lowest rate in this time, except for FY16, is 93.5% in FY05. The trend of Major Criminal Clearance Rates below 100% over the past 15 years indicates that a backlog of cases is likely building. The number of ‘active’ pending Major Criminal cases has increased over 16% in the last five years as shown in Figure 2.5.
Figure 2.3: Statewide Major Criminal Clearance Rates – FY02-FY16 (15 Years)
The graphs on the next page show statewide Clearance Rates by case group for the past five fiscal years.
95.9%
97.8% 96.9%
93.5%
96.5%
99.1%
102.4% 101.7%
100.2% 101.1%
97.1%
99.2% 97.9%
100.4%
92.1%
90%
95%
100%
105%
FY02 FY03 FY04 FY05 FY06 FY07 FY08 FY09 FY10 FY11 FY12 FY13 FY14 FY15 FY16

Timeliness
16
Figure 2.4: Statewide Clearance Rates FY12 – FY16 – By Case Group
97.2%
108.5%
95.7% 96.7% 96.0%
90%
95%
100%
105%
110%
FY12 FY13 FY14 FY15 FY16
Overall Clearance Rate (All Case Types)
97.1% 99.2%
97.9%
100.4%
92.1%
90%
95%
100%
105%
FY12 FY13 FY14 FY15 FY16
Major Criminal Clearance Rate
103.6% 101.6%
95.9%
103.7%
96.4%
90%
95%
100%
105%
110%
FY12 FY13 FY14 FY15 FY16
Major Civil Clearance Rate
98.2%
101.7% 99.9%
102.2% 99.2%
90%
95%
100%
105%
110%
FY12 FY13 FY14 FY15 FY16
Minor Civil Clearance Rate
100.4% 101.1% 101.0% 100.7%
97.3%
90%
95%
100%
105%
110%
FY12 FY13 FY14 FY15 FY16
Family Clearance Rate
96.6%
110.4%
94.9% 95.6% 95.8%
90%
95%
100%
105%
110%
115%
FY12 FY13 FY14 FY15 FY16
Minor Criminal Clearance Rate
100.9% 99.4%
100.8% 99.3%
97.9%
90%
95%
100%
105%
110%
FY12 FY13 FY14 FY15 FY16
Probate/Mental Health Clearance Rate
99.4%
102.9% 101.2%
98.3% 100.7%
90%
95%
100%
105%
110%
FY12 FY13 FY14 FY15 FY16
Juvenile Delinquency Clearance Rate
96.4% 98.1% 93.5%
82.8% 84.2%
80%
90%
100%
110%
FY12 FY13 FY14 FY15 FY16
CHIPS/Permanency Clearance Rate

Timeliness
17
Figure 2.5: Statewide Active Pending Caseload, Major Cases FY12 – FY16
Figure 2.5 shows that the number of cases pending in major case groups from FY12 to FY16 has declined in Major Civil, Family, and Juvenile Delinquency.
Increased numbers of cases/children are pending in Major Criminal (+16.2% from FY12-FY16), Probate/ Mental Health (+12.3% FY12-FY16) and Dependency/Neglect pending numbers have increased 81.3% from FY12-FY16.
Within the Dependency/Neglect category, the largest percent increase in pending numbers for the past five years is for TPR cases (+144%) and Non TPR Permanency cases (+135%).
0
3,000
6,000
9,000
12,000
15,000
18,000
21,000
24,000
27,000
30,000
FY12 FY13 FY14 FY15 FY16
Major Crim Major CivilFamily Juvenile DelDep/Neg Probate/MH
-19.0%
+16.2%
-9.2%
+81.3%
+12.3%
-.9%
Excludes Dormant Cases and Out on Warrant

Timeliness
18
TIME TO DISPOSITION
Statewide, 97% of all cases disposed in MNCIS in FY 2016 were disposed within the 99th percentile time objective. Therefore, 3% of all cases were disposed later than the objective.
Seven percent (7.1%) of Major Criminal cases were disposed beyond the 12 month objective in FY 2016 compared to 9.3% in FY 2015 and 9.5% in FY 2014. These numbers represent an improvement in Major Criminal Time to Disposition.
Major Civil, Dissolution (with or without child) and Domestic Abuse cases met or exceeded the timing objectives at the 99th percentile in FY 2016.
The Time to Disposition measure assesses the length of time it takes a court to process cases. This measure takes into account (subtracts out) periods during which cases are dormant.
Figure 2.6: Statewide Time to Disposition Cases Disposed in MNCIS in FY 2016
WCL Case Group 90th Percentile 97th Percentile 99th Percentile
Beyond 99th Total
Obj Cases % Obj Cases Cum
% Obj Cases Cum
% Cases % Cases Avg Days
Major Criminal 4 29,322 49.5 6 11,208 68.5 12 14,442 92.9% 4,222 7.1 59,194 157
Major Civil 12 31,171 91.9 18 1,959 97.6 24 512 99.1% 292 .9 33,934 121
Dissolutions 12 14,601 94.4 18 616 98.4 24 166 99.5 84 .5 15,467 109
Domestic Abuse 2 10,864 98.0 3 112 99.0 4 49 99.5 60 .5 11,085 9
Juvenile Del 3 13,623 78.9 5 2,128 91.3 6 486 94.1 1,020 5.9 17,257 65
Minor Criminal 3 465,731 84.3 6 57,192 94.7 9 14,156 97.2 15,332 2.8 552,411 84
State Total
565,312 82.0
73,215 92.6
29,811 97.0 21,010 3.0 689,348 91
Objectives are in months; Minor Criminal counts are cases, rather than charges as on other case statistics reports Only cases disposed in MNCIS are included
In FY2016, the Major Criminal category has the highest percent of cases disposed past the 99th percentile objective (7.1%). Within Major Criminal, 25% of the serious felony dispositions occurred after 12 months. Just over 9% of Major Criminal cases were disposed beyond the 99th objective in FY 2015, so there is an approximately two percent decline in cases disposed after one year. (Declining number is ‘positive’.)
Timeliness
19
0%
1%
2%
3%
4%
5%
6%
7%
8%
9%
10%
FY12 FY13 FY14 FY15 FY16
% d
isp
ose
d o
ver
99
th P
erc
en
tile
Major Crim
Juv Delinq
Minor Crim
Major Civil
Family
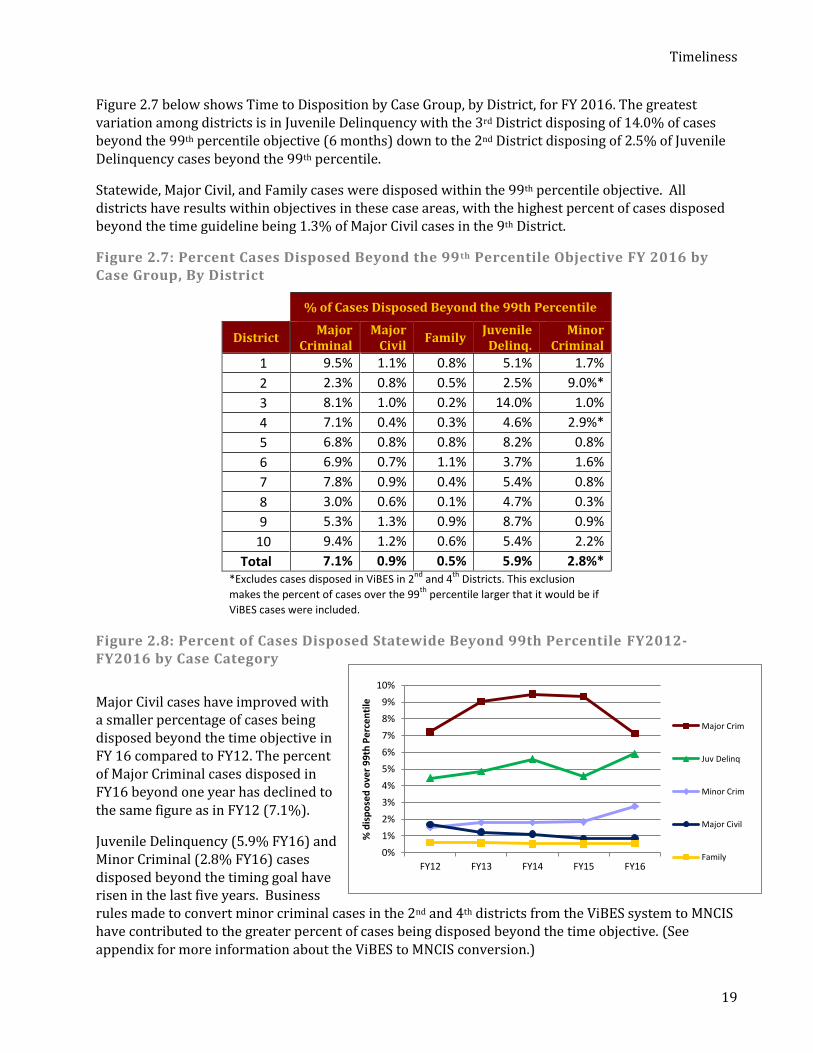
Figure 2.7 below shows Time to Disposition by Case Group, by District, for FY 2016. The greatest variation among districts is in Juvenile Delinquency with the 3rd District disposing of 14.0% of cases beyond the 99th percentile objective (6 months) down to the 2nd District disposing of 2.5% of Juvenile Delinquency cases beyond the 99th percentile.
Statewide, Major Civil, and Family cases were disposed within the 99th percentile objective. All districts have results within objectives in these case areas, with the highest percent of cases disposed beyond the time guideline being 1.3% of Major Civil cases in the 9th District.
Figure 2.7: Percent Cases Disposed Beyond the 99th Percentile Objective FY 2016 by Case Group, By District
% of Cases Disposed Beyond the 99th Percentile
District Major
Criminal Major
Civil Family
Juvenile Delinq.
Minor Criminal
1 9.5% 1.1% 0.8% 5.1% 1.7%
2 2.3% 0.8% 0.5% 2.5% 9.0%*
3 8.1% 1.0% 0.2% 14.0% 1.0%
4 7.1% 0.4% 0.3% 4.6% 2.9%*
5 6.8% 0.8% 0.8% 8.2% 0.8%
6 6.9% 0.7% 1.1% 3.7% 1.6%
7 7.8% 0.9% 0.4% 5.4% 0.8%
8 3.0% 0.6% 0.1% 4.7% 0.3%
9 5.3% 1.3% 0.9% 8.7% 0.9%
10 9.4% 1.2% 0.6% 5.4% 2.2%
Total 7.1% 0.9% 0.5% 5.9% 2.8%* *Excludes cases disposed in ViBES in 2
nd and 4
th Districts. This exclusion
makes the percent of cases over the 99th
percentile larger that it would be if
ViBES cases were included.
Figure 2.8: Percent of Cases Disposed Statewide Beyond 99th Percentile FY2012- FY2016 by Case Category
Major Civil cases have improved with a smaller percentage of cases being disposed beyond the time objective in FY 16 compared to FY12. The percent of Major Criminal cases disposed in FY16 beyond one year has declined to the same figure as in FY12 (7.1%).
Juvenile Delinquency (5.9% FY16) and Minor Criminal (2.8% FY16) cases disposed beyond the timing goal have risen in the last five years. Business rules made to convert minor criminal cases in the 2nd and 4th districts from the ViBES system to MNCIS have contributed to the greater percent of cases being disposed beyond the time objective. (See appendix for more information about the ViBES to MNCIS conversion.)
Timeliness
20
0.0% 0.0% 0.0% 0.0% 0.0% 0.0% 0.0% 0.0%
1.7% 2.0% 2.3%
3.7% 3.8%
5.6% 5.9% 6.7%
8.1% 8.6% 8.7% 9.5% 9.7% 9.8% 10.0% 10.0% 10.0% 10.2%
11.1% 11.1% 11.2% 11.8% 12.0% 12.4%
13.3% 15.0%
16.0% 16.7% 16.7%
18.5% 19.2% 20.0% 20.0% 20.7% 20.8% 21.1% 21.4% 21.4% 21.7% 22.0% 22.2% 22.2%
23.7% 24.0% 24.1%
25.0% 25.8%
26.7% 27.0% 27.3% 27.3% 28.0%
33.3% 37.3%
44.4% 47.4%
0% 10% 20% 30% 40% 50%
ItascaMorrison
SibleySwift
WabashaMcLeod
DodgeRedwood
CarverBeltramiRamsey
AnokaCarltonBenton
PolkHubbardSt. Louis
WrightMille LacsKandiyohi
WinonaHennepin
CassMartin
PopeDakotaBecker
CottonwoodStearns
WatonwanNicollet
ScottMeeker
WashingtonClearwaterBlue Earth
StevensFaribaultChisago
ToddRoseau
GoodhueCrow Wing
IsantiLeSueurWadena
LyonClay
KoochichingNobles
RiceSteele
SherburneOtter Tail
MowerBrown
FreebornAitkin
PineDouglasWaseca
OlmstedPenningtonMahnomen
% Delinq. Felony Cases Disposed Beyond 6 Months in FY16 (Goal is 1% or less)
(Counties with 10 or more dispositions)
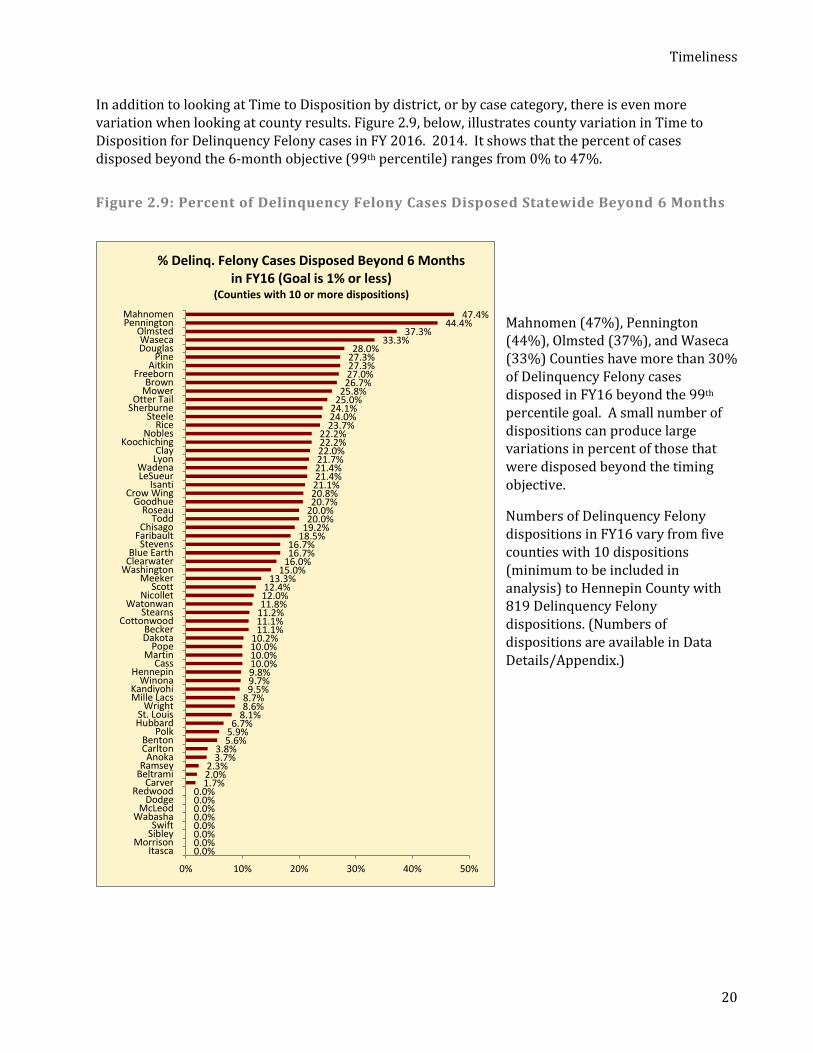
In addition to looking at Time to Disposition by district, or by case category, there is even more variation when looking at county results. Figure 2.9, below, illustrates county variation in Time to Disposition for Delinquency Felony cases in FY 2016. 2014. It shows that the percent of cases disposed beyond the 6-month objective (99th percentile) ranges from 0% to 47%.
Figure 2.9: Percent of Delinquency Felony Cases Disposed Statewide Beyond 6 Months
Mahnomen (47%), Pennington (44%), Olmsted (37%), and Waseca (33%) Counties have more than 30% of Delinquency Felony cases disposed in FY16 beyond the 99th percentile goal. A small number of dispositions can produce large variations in percent of those that were disposed beyond the timing objective.
Numbers of Delinquency Felony dispositions in FY16 vary from five counties with 10 dispositions (minimum to be included in analysis) to Hennepin County with 819 Delinquency Felony dispositions. (Numbers of dispositions are available in Data Details/Appendix.)

Timeliness
21
9.7% 9.3% 10.6% 10.8%
8.3% 8.6%
6.5% 6.2%
0%
5%
10%
15%
20%
End of 2009End of 2010 FY2011 FY2012 FY2013 FY2014 FY2015 FY2016
% P
en
din
g C
ase
s >
1yr
% of Major Criminal cases pending beyond 12 months (goal is 1% or less)
AGE OF PENDING CASES
Timing objectives for Age of Pending cases are being met for Dissolution cases. (Timing objectives are the same as those used for Time to Disposition.)
Among districts, the percent of all cases pending beyond the 99th percentile ranges from 2% in the 8th District to 9% in the 4th District. (Results are distorted negatively for the 2nd and 4th Districts due to business rule decisions when converting minor criminal cases from ViBES to MNCIS.)
Figure 2.10: Statewide Age of Pending Cases As Of 7/7/2016
The Minor Criminal age of pending cases is distorted due to the transition of cases from ViBES to MNCIS and business rules that increased dramatically the number of cases pending, and the length of time those cases have been pending. (See appendix for ViBES to MNCIS transition information.)
The statewide average for other case types pending over the 99th percentile ranges from 8% of Juvenile Delinquency cases to .8% of Dissolutions pending
beyond the time objective. There are 13.5% of Domestic Abuse cases pending beyond the 99th percentile objective of 4 months, likely due to the very small number of cases pending.
Figure 2.11: Trend of Statewide % of Major Criminal Cases Pending Beyond 12 Months
Results of Major Criminal Age of Pending cases have improved over the past several years (lower number is better). Major Criminal timing measures have been a focus of the past nearly two years – and older pending cases have been reduced during that time as shown in Figure 2.11.
Case Group 90th
Percen-tile
Cum 97th
Percen-tile
Cum 99th
Percen-tile
Over 99th
Percen-tile
Total Active Cases
Pending
Major Crim 57.8% 73.5% 93.8% 6.2% 29,139
Major Civil 89.6% 95.6% 97.7% 2.3% 10,511
Dissolutions 91.6% 97.7% 99.2% .8% 4,439
Dom Abuse 74.0% 81.0% 86.5% 13.5% 342
Juv Delinq 77.2% 88.9% 91.6% 8.4% 3,017
Minor Crim 44.6% 52.6% 56.3% 43.7% 194,048
State Total 49.5% 58.3% 63.9% 36.1% 241,496
Timeliness
22
0% 2% 4% 6% 8% 10% 12%
4
2
State
6
10
5
9
1
7
3
8
Dis
tric
t
7/7/2016 7/2/2015 7/3/2014 7/4/2013 6/30/2012
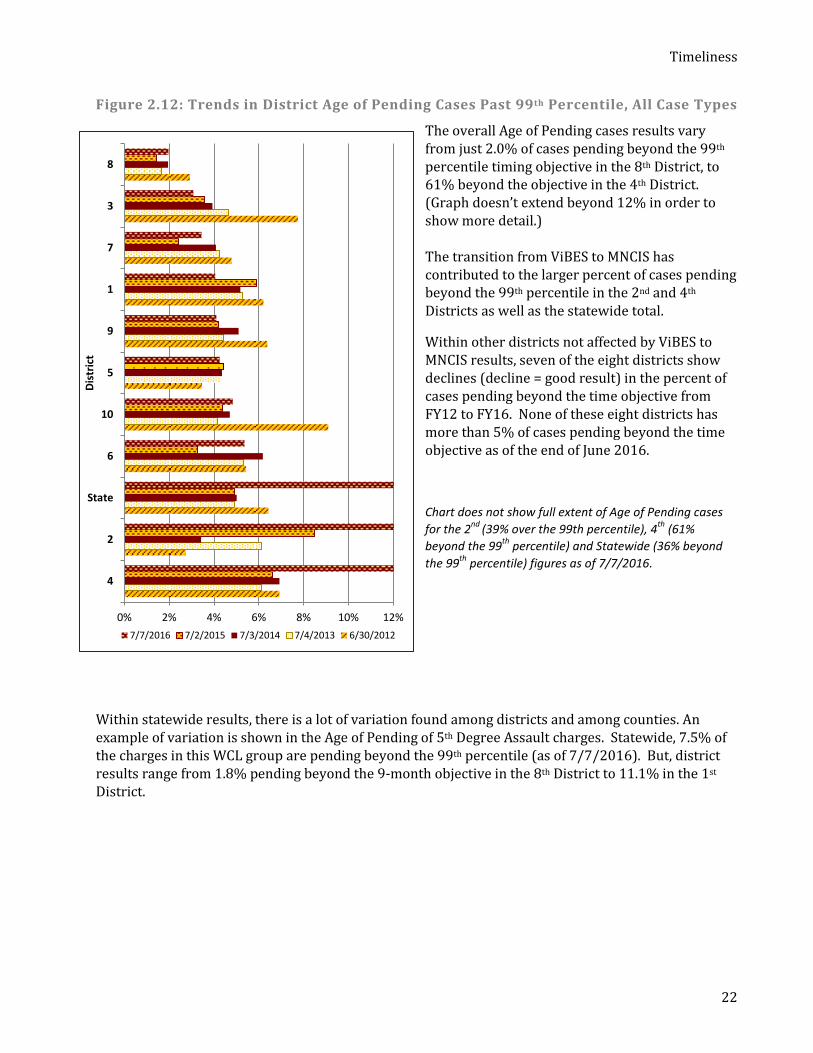
Figure 2.12: Trends in District Age of Pending Cases Past 99th Percentile, All Case Types
The overall Age of Pending cases results vary from just 2.0% of cases pending beyond the 99th percentile timing objective in the 8th District, to 61% beyond the objective in the 4th District. (Graph doesn’t extend beyond 12% in order to show more detail.) The transition from ViBES to MNCIS has contributed to the larger percent of cases pending beyond the 99th percentile in the 2nd and 4th Districts as well as the statewide total.
Within other districts not affected by ViBES to MNCIS results, seven of the eight districts show declines (decline = good result) in the percent of cases pending beyond the time objective from FY12 to FY16. None of these eight districts has more than 5% of cases pending beyond the time objective as of the end of June 2016.
Chart does not show full extent of Age of Pending cases
for the 2nd
(39% over the 99th percentile), 4th
(61%
beyond the 99th
percentile) and Statewide (36% beyond
the 99th
percentile) figures as of 7/7/2016.
Within statewide results, there is a lot of variation found among districts and among counties. An example of variation is shown in the Age of Pending of 5th Degree Assault charges. Statewide, 7.5% of the charges in this WCL group are pending beyond the 99th percentile (as of 7/7/2016). But, district results range from 1.8% pending beyond the 9-month objective in the 8th District to 11.1% in the 1st District.
Timeliness
23
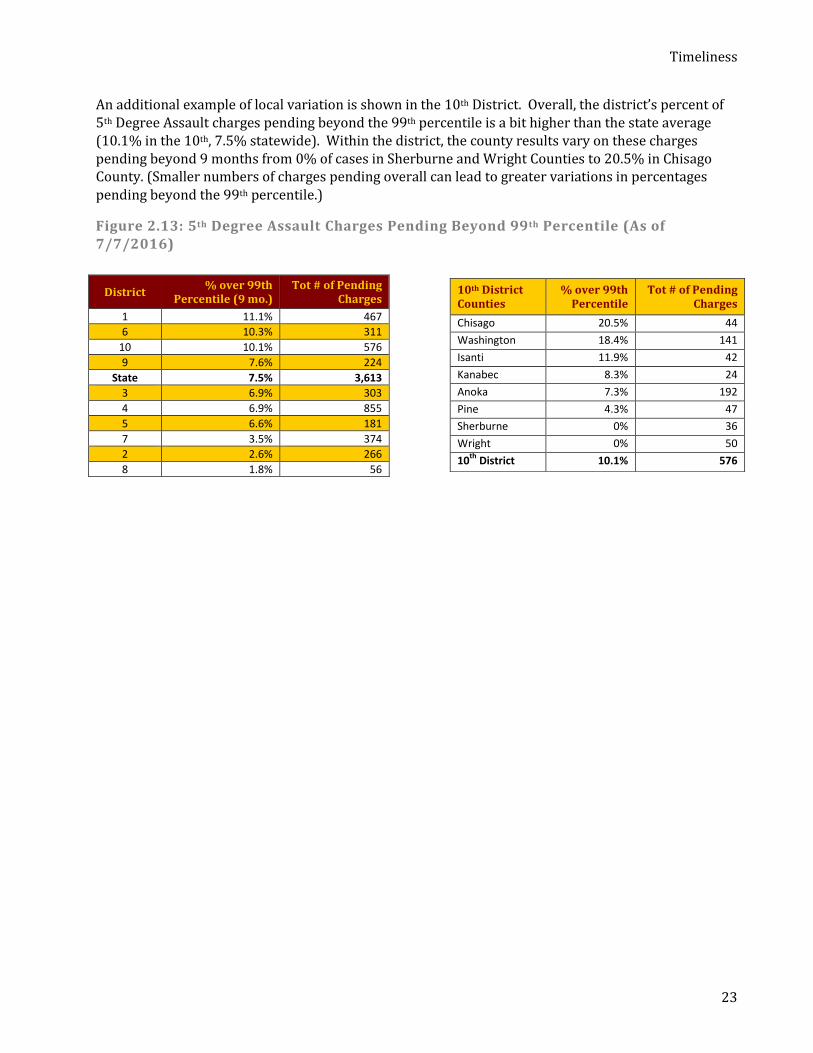
An additional example of local variation is shown in the 10th District. Overall, the district’s percent of 5th Degree Assault charges pending beyond the 99th percentile is a bit higher than the state average (10.1% in the 10th, 7.5% statewide). Within the district, the county results vary on these charges pending beyond 9 months from 0% of cases in Sherburne and Wright Counties to 20.5% in Chisago County. (Smaller numbers of charges pending overall can lead to greater variations in percentages pending beyond the 99th percentile.)
Figure 2.13: 5th Degree Assault Charges Pending Beyond 99th Percentile (As of 7/7/2016)
District % over 99th
Percentile (9 mo.) Tot # of Pending
Charges
1 11.1% 467
6 10.3% 311
10 10.1% 576
9 7.6% 224
State 7.5% 3,613
3 6.9% 303
4 6.9% 855
5 6.6% 181
7 3.5% 374
2 2.6% 266
8 1.8% 56
10th District Counties
% over 99th Percentile
Tot # of Pending Charges
Chisago 20.5% 44
Washington 18.4% 141
Isanti 11.9% 42
Kanabec 8.3% 24
Anoka 7.3% 192
Pine 4.3% 47
Sherburne 0% 36
Wright 0% 50
10th
District 10.1% 576

Timeliness
24
Across all counties, the percent of 5th Degree charges pending beyond the 9-month objective ranges from 22% to 0% as shown in Figure 2.14. As noted above, the percentages may appear distorted due to small numbers of charges in some counties. Thirty (30) courts have zero charges pending beyond the 99th percentile, and six of them have fewer than 10 charges pending.
Figure 2.14: Percent of 5th Degree Assault Charges Pending beyond 9 months (goal is 1% or less), By County (As of 7/7/2016)
0% 5% 10% 15% 20% 25%
WrightClay
SherburneBeltramiBeckerSteele
McLeodCass
MorrisonHoustonDouglas
PolkWatonwan
ItascaKandiyohi
DodgeTodd
WabashaNicollet
MeekerHubbardOtter Tail
RamseyScott
Blue EarthMowerStearns
PineBenton
OlmstedMahnomen
GoodhueHennepinPipestoneWadena
AnokaKanabecBrownCarver
FaribaultMille LacsSt. Louis
WinonaCarlton
RiceIsanti
NoblesDakota
Crow WingFreeborn
WashingtonAitkin
ChisagoLeSueur
Timeliness
25
“It is the policy of the Judicial Branch that juvenile protection cases… be expedited in conformance with state and federal requirements with the goal of serving the best interests of children by providing safe, stable, and permanent homes for abused and neglected children. … CJI judges accept shared responsibility
for monitoring and improving performance
on federal and judicial branch child
welfare measures and are encouraged to
develop and implement local plans to
improve such performance.”
Judicial Council Policy 601
LENGTH OF TIME TO PERMANENCY AND ADOPTION
Nearly seven of ten (66%) children who reached permanency during state FY2016 did so after being out of home for 12 months or less (across all types of CHIPS/ Permanency cases) compared to 72% in FY 2015. Nine of ten (87%) children reached permanency by 18 months, compared to 93% the previous fiscal year. (Goals are 90% by 12 months, 99% in 18 months.)
The objective of having 60% of children reach adoption within 24 months of removal from the home is considered an ‘aspirational goal’. In FY2016, 57% of children statewide were adopted within 24 months. District numbers range from 74% reaching adoption by 24 months to 29%.
One of the goals of the Children’s Justice Initiative (CJI) is for children removed from a custodial parent to have permanency and stability in their living situation. The Length of Time to Permanency report assists courts in determining the length of time it takes, over the lives of children, to provide permanency to those who are removed from home.
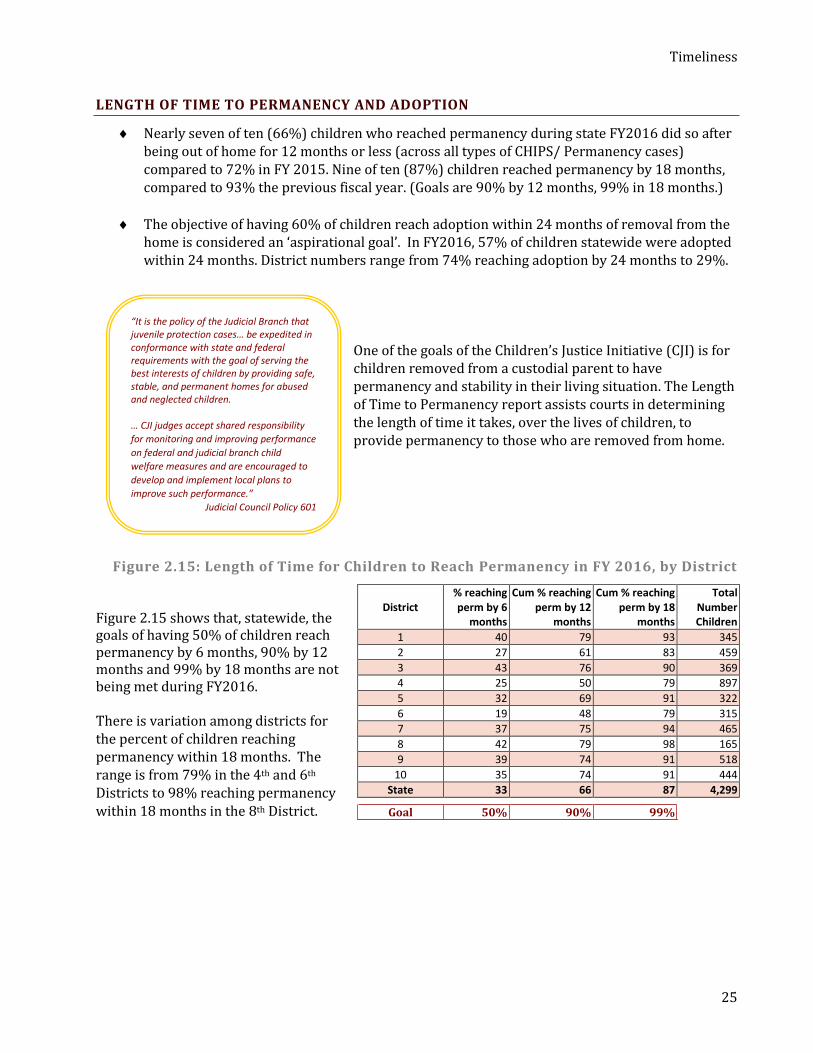
Figure 2.15: Length of Time for Children to Reach Permanency in FY 2016, by District
Figure 2.15 shows that, statewide, the goals of having 50% of children reach permanency by 6 months, 90% by 12 months and 99% by 18 months are not being met during FY2016. There is variation among districts for the percent of children reaching permanency within 18 months. The range is from 79% in the 4th and 6th Districts to 98% reaching permanency within 18 months in the 8th District.
District % reaching perm by 6
months
Cum % reaching perm by 12
months
Cum % reaching perm by 18
months
Total Number Children
1 40 79 93 345
2 27 61 83 459
3 43 76 90 369
4 25 50 79 897
5 32 69 91 322
6 19 48 79 315
7 37 75 94 465
8 42 79 98 165
9 39 74 91 518
10 35 74 91 444
State 33 66 87 4,299
Goal 50% 90% 99%

Timeliness
26
74%
40%
68% 61%
42%
29%
61% 67%
63%
44%
56%
0%
10%
20%
30%
40%
50%
60%
70%
80%
District (Total Num Children Adopted)
Figure 2.16: Five Year Trend, Children Reaching Permanency by 18 months
Over the past five fiscal years, the goal of 99% of children reaching permanency by 18 months has not been met by any individual district or the state. Statewide, the current FY16 result of 87% reaching permanency within 18 months is the lowest over the past five fiscal years.
The results for FY16 may be related to the increasing numbers of children who have CHIPS or Permanency cases filed. There were 6,498 children with CHIPS or Permanency cases filed in FY12, which then
increased each year. Filings in FY13 were 6,917; FY14 7,230; FY15 8,538 and FY16 10,162. Filings increased by 56% from FY12 to FY16.
Figure 2.17: Length of Time for Children to Reach Adoption
The Judicial Council set an objective that 60% of all children who are under State Guardianship should reach adoption with 24 months from removal from the home. Reports break the time it takes from removal from the home to being under state guardianship, and then the time it takes from the guardianship order to adoption.
Over half (56%) of the 772 children adopted in FY2016 reached adoption within 24 months of removal from home (goal is 60%). Six districts exceed the goal, while four districts had between 29% to 44% of children reaching adoption within two years.
Figure 2.18: Length of Time to Adoption, Statewide, FY12-FY16
The 56% of children reaching adoption by 24 months of being out of home in FY16 is the second best statewide result over the past five years as is shown in Figure 2.18.
The number of children reaching adoption has increased during this time from 440 in FY12 to 772 in FY16.
% of children reaching permanency by 18 months (goal is 99%), Fiscal Year 2012 to Fiscal Year 2016
District FY16 % FY15 % FY14 % FY13 % FY12 % 1 93 93 98 96 92
2 83 80 96 89 86
3 90 96 95 96 96
4 79 87 92 88 94
5 91 91 94 92 90
6 79 88 85 91 88
7 94 91 94 95 96
8 98 92 93 98 94
9 91 94 90 89 93
10 91 93 96 94 94
State 87% 90% 93% 92% 93%
Year Adoption Finalized
% Adopted by 24 Months
(Goal is 60%)
Total # Children Reaching Adoption
FY 2016 56% 772
FY 2015 57% 610
FY 2014 55% 548
FY 2013 49% 483
FY 2012 54% 440
Total % of Children Reaching Adoption within 24 Months of Removal from Home in FY16 (Goal-60%)

Timeliness
27
The automated Time to Adoption for Children Under State Guardianship report shows details for each child with the time to adoption broken into the time from removal from home to the guardianship order and then the time from guardianship order to adoption order. Figure 2.19 below shows that there is variation among districts in these two phases.
Figure 2.19: Average Number Days to Adoption, by Phase, by District, FY2016
Four districts have an average number of days per child to reach adoption below the 24 month time objective (730 days). (Lower numbers are generally a more positive result.)
The statewide average number of days from removal from the home to guardianship order (329 days) comprises 43% of the total time to adoption and 57% is the time from the guardianship order to adoption (436 days).
Jurisdictions can use these two categories of time to determine where efforts may be focused to improve the length of time to adoption. For instance, in the 8th District, 44% of the total time to adoption is represented in the time from the child being a state ward to the finalized adoption compared to the 2nd District which has 66% of the time to adoption represented in the state ward to adoption timeframe.
346 297 266 308 371 329 357 318 374 329 376
268 343 387 388
386 436 411 450
518 641 610 615 639 654 696
757 765 768 768
892 970 985
0
100
200
300
400
500
600
700
800
900
1000
8 1 3 7 4 State 10 9 5 2 6
Tota
l Avg
Day
s To
Ad
op
tio
n
District
Time to Adoption, Goal = 730 days or fewer (24 months)
Avg DaysState Wardto Adoption
Avg Days toPermanency
Timeliness
28
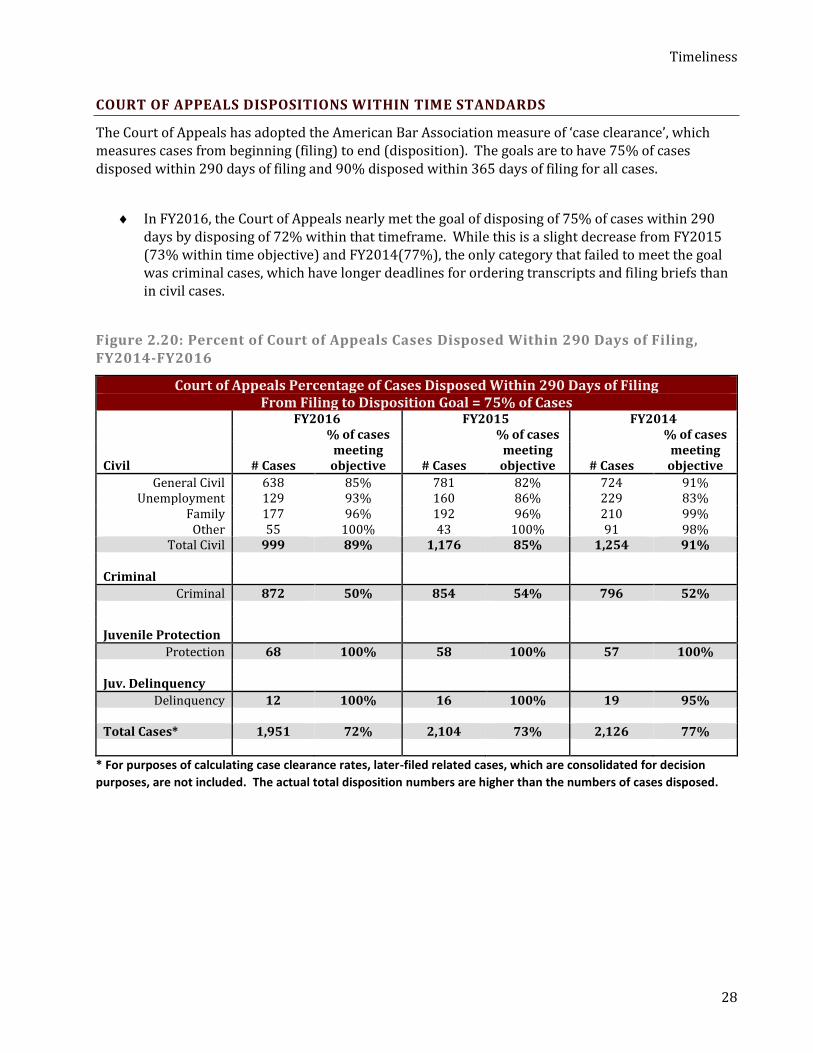
COURT OF APPEALS DISPOSITIONS WITHIN TIME STANDARDS
The Court of Appeals has adopted the American Bar Association measure of ‘case clearance’, which measures cases from beginning (filing) to end (disposition). The goals are to have 75% of cases disposed within 290 days of filing and 90% disposed within 365 days of filing for all cases.
In FY2016, the Court of Appeals nearly met the goal of disposing of 75% of cases within 290 days by disposing of 72% within that timeframe. While this is a slight decrease from FY2015 (73% within time objective) and FY2014(77%), the only category that failed to meet the goal was criminal cases, which have longer deadlines for ordering transcripts and filing briefs than in civil cases.
Figure 2.20: Percent of Court of Appeals Cases Disposed Within 290 Days of Filing, FY2014-FY2016
Court of Appeals Percentage of Cases Disposed Within 290 Days of Filing From Filing to Disposition Goal = 75% of Cases
FY2016 FY2015 FY2014
% of cases
meeting objective
% of cases
meeting objective
% of cases meeting
objective Civil # Cases # Cases # Cases
General Civil 638 85% 781 82% 724 91% Unemployment 129 93% 160 86% 229 83%
Family 177 96% 192 96% 210 99% Other 55 100% 43 100% 91 98%
Total Civil 999 89% 1,176 85% 1,254 91%
Criminal
Criminal 872 50% 854 54% 796 52%
Juvenile Protection
Protection 68 100% 58 100% 57 100%
Juv. Delinquency
Delinquency 12 100% 16 100% 19 95%
Total Cases* 1,951 72% 2,104 73% 2,126 77%
* For purposes of calculating case clearance rates, later-filed related cases, which are consolidated for decision
purposes, are not included. The actual total disposition numbers are higher than the numbers of cases disposed.

Timeliness
29
The Court of Appeals exceeded the goal of disposing 90% of cases within 365 days, by disposing of 92% of its cases within that time in FY2016. This result continues the pattern of exceeding this goal in FY2015 and FY2014. Only criminal cases did not meet the goal of 90%.
Figure 2.21: Percent of Court of Appeals Cases Disposed Within 365 Days of Filing, FY2014-FY2016
Court of Appeals Percentage of Cases Disposed Within 365 Days of Filing From Filing to Disposition Goal = 90% of Cases
FY2016 FY2015 FY2014
% of cases
meeting objective
% of cases
meeting objective
% of cases meeting
objective Civil # Cases # Cases # Cases
General Civil 638 99% 781 97% 724 99% Unemployment 129 100% 160 100% 229 100%
Family 177 199% 192 99% 210 100% Other 55 100% 43 100% 91 100%
Total Civil 999 99% 1,176 98% 1,254 99%
Criminal
Criminal 872 84% 854 83% 796 82%
Juvenile Protection
Protection 68 100% 58 100% 57 100%
Juv. Delinquency
Delinquency 12 100% 16 100% 19 100%
Total Cases* 1,951 92% 2,104 92% 2,126 93%
* For purposes of calculating case clearance rates, later-filed related cases, which are consolidated for decision
purposes, are not included. The actual total disposition numbers are higher than the numbers of cases disposed.
Timeliness
30
SUPREME COURT DISPOSITIONS WITHIN TIME STANDARDS
The Supreme Court adopted revised timing objectives in January, 2015 that were effective April 1, 2015.
Generally, the Supreme Court was closer to meeting timing objectives for cases from submission to disposition compared to the objectives for submission to circulation of majority.
The Supreme Court first approved timing objectives, or case dispositional goals, in March, 2007. The case categories, case-processing points of measurement, and timing objectives to complete certain events in the life-cycle of an appeal, were taken generally from standards adopted by the American Bar Association in 1994. The adopted timing objectives were considered aspirational but achievable.
In 2014, the Supreme Court undertook a study of its timing objectives in light of recommendations by the National Center for State Courts for model time standards for appellate courts. The Supreme Court also considered the time standards adopted by other states’ appellate courts.
Based on its study, the Supreme Court revised its timing objectives by reducing the number of case-processing events to which the standards apply, reducing the time allotted for disposition of an appeal, and reducing the percentage of cases (from 10% to 5%) that are not subject to a time standard (“Beyond 95th percentile” in the table). The Supreme Court adopted revised timing objectives in January 2015 that were effective April 1, 2015.
Data shown in Figure 2.22 on the next page identifies the court’s performance based on three factors: (1) the case type or jurisdiction (original/mandatory; discretionary; expedited); (2) the case-processing event (PFR to disposition; submission to circulation; submission to disposition); and (3) the timing objective to complete the event (“Days” in the table). “Cases” in the table represents the number of cases that met the timing objective in the time period. “%” in the table represents the percentage of cases within the time period that met the stated timing objective. “Total/Aver.” represents the total number of cases in the time period and the average number of days to complete the event.

Timeliness
31
Figure 2.22: Supreme Court Timing Standards
Supreme Court Time Standards
Performance Report: July 1, 2015-June 30, 2016 (FY2016)
Case Type: Event 75th
Percentile 95th
Percentile
Beyond 95th
Percentile
Total/
Aver.
Days Cases % Days Cases % Days Cases % Cases Aver
Mandatory/Original:
submission to circulation of
majority
45 17 40% 75 32 76% N/A 11 26% 43 61
Mandatory/Original:
submission to disposition 120 17 53% 180 28 88% N/A 4 13% 32 117
Discretionary: PFR filing to
disposition 50 347 55% 60 537 86% N/A 89 14% 626 50
Discretionary: submission
to circulation of majority 45 10 2% 75 25 66% N/A 13 34% 38 65
Discretionary: submission
to disposition 120 10 45% 180 18 81% N/A 4 18% 22 125
Expedited (TPR, Adopt’n):
PFR filing to disposition 25 20 100% 25 20 100% N/A N/A N/A 20 16
Expedited (TPR, Adopt’n):
submission to circulation of
majority
20 N/A N/A 30 N/A N/A N/A N/A N/A N/A N/A
Expedited (TPR, Adopt’n):
submission to disposition 45 N/A N/A 60 N/A N/A N/A N/A N/A N/A N/A
All case types: submission
to circulation of majority 45 27 33% 75 57 70% N/A 24 30% 81 63
All case types: submission
to disposition 120 27 50% 180 46 85% N/A 8 15% 54 121
Integrity and Accountability
32
“…It … is the policy of the Minnesota Judicial Branch that to ensure accurate, complete and uniform access to court records, and to ensure compliance with all applicable laws for the access of court records, the Appellate Courts and District Courts shall comply with document security and classification procedures, provisions and Court Administration Processes (CAPs) as applicable.”
Judicial Council Policy 505.3
Data Quality and Integrity
INTEGRITY AND ACCOUNTABILITY
The Minnesota Judicial Branch will ensure the integrity and accountability of its performance by maintaining a record system that is accurate, complete and timely.
Is the electronic record system accurate, complete and timely?
DATA QUALITY PROGRAM
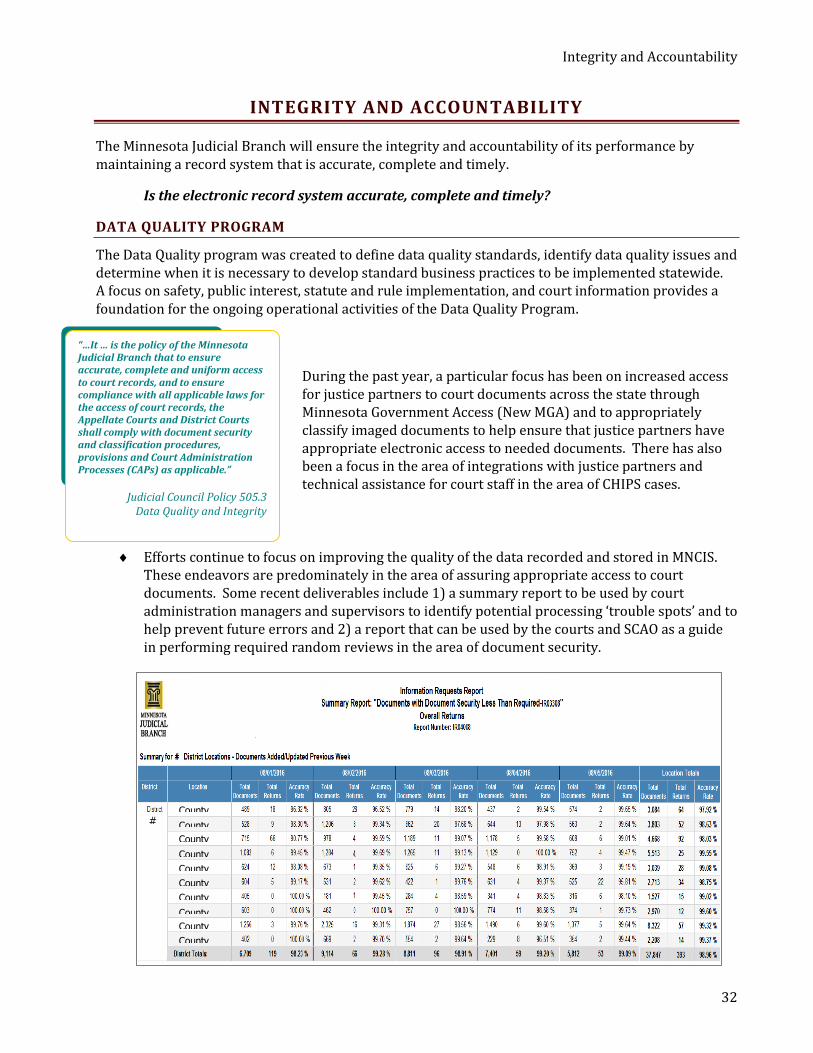
The Data Quality program was created to define data quality standards, identify data quality issues and determine when it is necessary to develop standard business practices to be implemented statewide. A focus on safety, public interest, statute and rule implementation, and court information provides a foundation for the ongoing operational activities of the Data Quality Program.
During the past year, a particular focus has been on increased access for justice partners to court documents across the state through Minnesota Government Access (New MGA) and to appropriately classify imaged documents to help ensure that justice partners have appropriate electronic access to needed documents. There has also been a focus in the area of integrations with justice partners and technical assistance for court staff in the area of CHIPS cases.
Efforts continue to focus on improving the quality of the data recorded and stored in MNCIS. These endeavors are predominately in the area of assuring appropriate access to court documents. Some recent deliverables include 1) a summary report to be used by court administration managers and supervisors to identify potential processing ‘trouble spots’ and to help prevent future errors and 2) a report that can be used by the courts and SCAO as a guide in performing required random reviews in the area of document security.
County
1 County
2 County
3 County
4 County
5 County
6 County
7 County
8 County
9 County
10
#

Integrity and Accountability
33
Recent development of MNCIS functionality to handle Order for Protections (OFP) and the related integration has created the need to add the OFP to the Point-to-Point monitoring activity. Point-to-Point integration monitoring is designed to ensure that justice partners have essential court information to complete their related activities. These integrations are the way conviction data is shared with other systems such as the Bureau of Criminal Apprehension (BCA), the National Instant Criminal Background Check (NICS), the Secretary of State, and the Department of Natural Resources (DNR).
o There are eight data integrations that the program monitors on a regular basis to identify any possible failures of the automated system. On an as-needed basis, data quality staff will provide targeted staff training with local courts so that data will be entered in MNCIS correctly to ensure the automated integrations work as designed.
Technical assistance for courts in the area of CHIPS data reporting is an integral part of the services provided to local courts. This involves in-depth analysis of courts’ CHIPS data and development of customized materials that identify records that need to be addressed so that data is correct and consistent with rule. This technical assistance involves one-on-one coaching and training with local staff to assist in ensuring quality data. This assistance also involves work with the Children’s Justice Initiative (CJI) on Permanency Technical Assistance Workshops which include a comprehensive review of CHIPS data and practices.
Specific efforts to clean up data over the last year include: o Contract and Consumer Credit case type assignment o DANCO – work with courts to correct cases that may have failed in a reconciliation with
BCA The reports, data files, tools and other resources of the Data Quality Program are available on SharePoint and CourtNet at this address. The Data Quality staff are also available for customized consultation.
Excellence
34
EXCELLENCE
The Minnesota Judicial Branch will achieve excellence in the resolution of cases by making decisions that are fair, reasoned, understandable, and that resolve the controversy at issue.
Do participants understand the orders given by the Court?
ACCESS AND FAIRNESS SURVEY
The most recent district court Access and Fairness Surveys were completed from January to April, 2013. Statewide, 4,710 court users submitted survey responses. The next survey should be completed in FY 2018 (July 1, 2017-June 30, 2018) to meet the every four year schedule, alternating every two years with the Quality Court Workplace Survey.
The statement used in district courts to measure the goal of Excellence had 84% of all respondents agree or strongly agree with the statement. This is the highest level of agreement within the Fairness section.
The measure for the Excellence goal is the final statement in the Fairness section of the Access and Fairness Survey: “As I leave the court, I know what to do next in my case.” The Fairness section of the survey is targeted to respondents who answered “Yes” to the question “Did you appear in front of a judicial officer today?” Overall, eighty-four percent (84%) of respondents agreed or strongly agreed with the statement.
There were some variations in responses to this question by different demographic breakdowns. The mean scores for the following roles, race/ethnicity and location were the highest for this statement (5 = strongly agree; 1 = strongly disagree):
Attorney representing a client (4.5)
District 1 (4.5)
Multi-racial (4.4)
White (4.3)
The mean scores for the following groups were the lowest for this statement:
Juvenile Delinquency case type (4.0)
District 6 (4.0)
Victim (3.8)

Fairness and Equity
35
FAIRNESS AND EQUITY
The Minnesota Judicial Branch will provide due process and equal protection of the law, and will ensure that individuals called for jury duty are representative of the population from which the jury is drawn.
Do participants perceive they were treated fairly, listened to and are they satisfied with the Court’s decision?
ACCESS AND FAIRNESS SURVEY
The Supreme Court and Court of Appeals conducted the Access and Fairness Survey for the first time in September, 2015.
The most recent District Court Access and Fairness Surveys were completed from January to April, 2013. Statewide, 4,710 court users submitted survey responses. The next survey will be conducted in FY 2018.
There were nearly 800 attorney responses to the Court of Appeals Access and Fairness Survey and over 100 judges. The Supreme Court survey received nearly 350 attorney responses and 98 judge responses. Several of the statements in the survey relate to questions of fairness and equity as shown in the following table.
Figure 5.1: Selected Results, Supreme Court, Court of Appeals Access and Fairness Survey
Percent of respondents who agree or strongly agree Supreme Court Court of Appeals
Attorneys Judges Attorneys Judges
The Court renders its decisions without any improper outside influences.
68% 58% 76% 85%
The Court adequately considers each case based upon its facts and the applicable law.
77% 80% 71% 80%
The Court’s written decisions reflect thoughtful and fair evaluation of the parties’ arguments
73% 82% 68% 80%
“..all are committed to doing this job
with integrity.”
Supreme Court Survey Attorney Comment
As a trial judge, I dislike getting cases remanded but sometimes
it's necessary. I think I have been treated fairly.
Court of Appeals Survey Judge
Comment
Fairness and Equity
36
The Fairness Section of the District Court Access and Fairness survey was targeted to respondents who answered “Yes” to the question of “Did you appear in front of a judicial officer today?” Complete results from the survey are available on CourtNet.
Statewide, over three-quarters (78%) or more of all respondents agreed or strongly agreed with all statements in the Fairness Section in the 2013 survey.
The statements with the highest percentage of agreement were:
As I leave the court, I know what to do next about my case (84%)
I was treated the same as everyone else (83%)
One statement in the Fairness section had fewer than eight in ten respondents agree/strongly agree.
The way my case was handled by the court was fair (78%)
Responses varied by demographic groups, especially by role of the survey respondent. The highest index scores are recorded for the following demographic groups (scores are from 0 to 100):
Respondents with Small Claims/Conciliation cases (89)
Attorneys representing a client (88)
Respondents age 65 or older (88)

Fairness and Equity
37
FAIRNESS AND EQUITY, CONTINUED
Are jurors representative of our communities? JURY POOLS
The jurors who reported to court during FY 2016 were very similar racially and ethnically compared to the population of the communities in Minnesota.
The gender of jurors is nearly identical to the population of Minnesota.
Demographics of jurors based on returned questionnaires come from the automated jury management system. Figure 5.2 below compares the racial breakdown of the population as reported in the 2010 American Community Survey to the jurors who reported for service in FY 2016, returned their questionnaires, and reported their race. Statewide, only 1.2% of jurors had missing race data.
The results of the American Community Survey are shown for information purposes and are not the official figures used by jury managers.
Figure 5.2: FY2016 Juror Race Comparison to 2010 American Community Survey Estimates
* Total Jurors with and without race reported.
Source: 2010 American Community Survey micro data estimates compiled by Minnesota State Demographic Center Population ages 18 to 70, not institutionalized, citizens, speak English at home or speak English "very well" or "well"
Reported Jurors = All jurors who report for service and return questionnaire (may or may not be in voir dire) (Source: JURY+ Next Generation Database; MJB Jury Reports)
Statewide, the jurors in FY 2016 are very similar to the people in Minnesota who are between 18-70 years old, not institutionalized, are citizens, and speak English at home or speak it “very well” or “well”.
White Black Hispanic
American Indian
Asian/Pacific Islander
Other & 2+ Races
Total*
2010 ACS
FY16 Jurors
2010 ACS
FY16 Jurors
2010 ACS
FY16 Jurors
2010 ACS
FY16 Jurors
2010 ACS
FY16 Jurors
2010 ACS
FY16 Jurors
FY16 Jurors
Minnesota 89.6% 89.2% 3.4% 3.1% 2.1% 2.0% 1.0% .9% 2.3% 2.9% 1.7% 1.9% 44,321
Anoka 90.4% 91.3% 3.4% 2.0% 1.9% 1.4% .5% .6% 2.4% 3.7% 1.3% 1.0% 1,459
Carver-Scott 92.9% 93.5% 1.4% 1.3% .9% 1.4% .7% .8% 3.2% 1.9% .9% 1.1% 1,683
Dakota 88.5% 87.9% 2.3% 2.6% 2.9% 3.2% .3% .6% 3.2% 3.4% 2.8% 2.4% 2,129
Hennepin 82.4% 81.4% 8.1% 7.4% 2.6% 2.9% .7% .6% 3.5% 4.4% 2.7% 3.3% 10,014
Olmsted 90.9% 91.1% 2.6% 2.4% 2.0% 1.6% 0% .3% 3.3% 3.0% 1.2% 1.7% 1,556
Ramsey 80.0% 77.9% 7.8% 6.8% 3.7% 3.1% .7% .6% 5.6% 8.6% 2.2% 3.0% 6,072
St. Louis 93.1% 96.8% .9% .2% 1.4% .5% 2.3% 1.1% .4% .5% 1.8% .9% 1,797
Stearns-Benton
94.0% 96.8% 3.4% 1.4% .6% .8% .2% .3% 1.6% .5% .2% 1.0% 2,229
Washington 92.0% 91.8% 1.7% 1.8% 1.8% 1.7% .3% .8% 2.9% 3.2% 1.2% 1.2% 882
Fairness and Equity
38
In the nine counties or areas that are large enough to report using the demographic criteria, four of the locations have a small overrepresentation of White jurors and three have slight overrepresentation of Asian/Pacific Island jurors. Three of nine locations have a small overrepresentation of Multi-Racial citizens. Black citizens are underrepresented in the juror figures in all of the nine locations except Dakota and Washington Counties.
County level juror data (available in the appendix) shows that the locations with the largest percentage by race are in the following locations:
White – Eight counties at 100% (previous years had up to 11 counties with 100% white) Black – Hennepin with 7.4% of jurors in that jurisdiction, Ramsey with 6.8% Asian/Pacific Islander – Ramsey at 8.6% of jurors Hispanic – Watonwan with 9.9% of jurors, Big Stone at 8.0% and Nobles at 6.6% Other and 2+ races – Pope at 5.0% of jurors American Indian – Mahnomen with 28.7% of jurors in that county
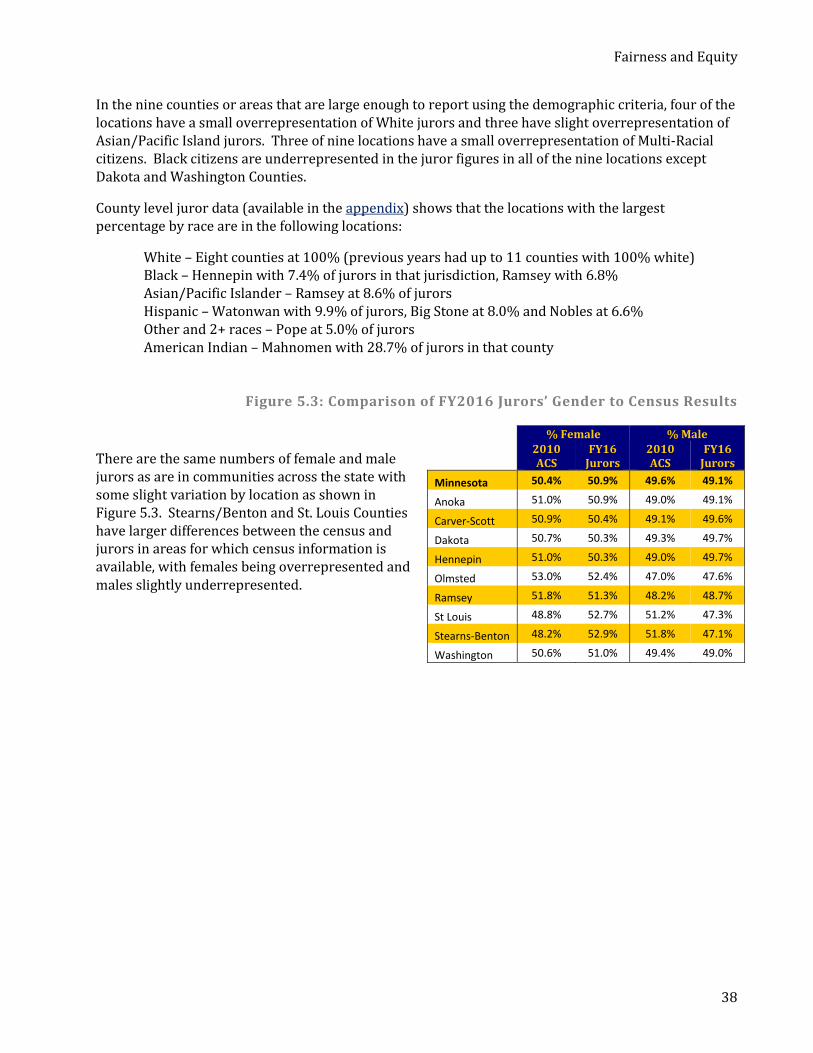
Figure 5.3: Comparison of FY2016 Jurors’ Gender to Census Results
There are the same numbers of female and male jurors as are in communities across the state with some slight variation by location as shown in Figure 5.3. Stearns/Benton and St. Louis Counties have larger differences between the census and jurors in areas for which census information is available, with females being overrepresented and males slightly underrepresented.
% Female % Male
2010 ACS
FY16 Jurors
2010 ACS
FY16 Jurors
Minnesota 50.4% 50.9% 49.6% 49.1%
Anoka 51.0% 50.9% 49.0% 49.1%
Carver-Scott 50.9% 50.4% 49.1% 49.6%
Dakota 50.7% 50.3% 49.3% 49.7%
Hennepin 51.0% 50.3% 49.0% 49.7%
Olmsted 53.0% 52.4% 47.0% 47.6%
Ramsey 51.8% 51.3% 48.2% 48.7%
St Louis 48.8% 52.7% 51.2% 47.3%
Stearns-Benton 48.2% 52.9% 51.8% 47.1%
Washington 50.6% 51.0% 49.4% 49.0%
Quality Court Workplace Environment
39
QUALITY COURT WORKPLACE ENVIRONMENT
The Minnesota Judicial Branch will ensure that judicial officers, court personnel and jurors are qualified to perform their duties and have the materials, motivation, direction, sense of mission, and commitment to do quality work.
What are our turnover rates?
SEPARATION RATES
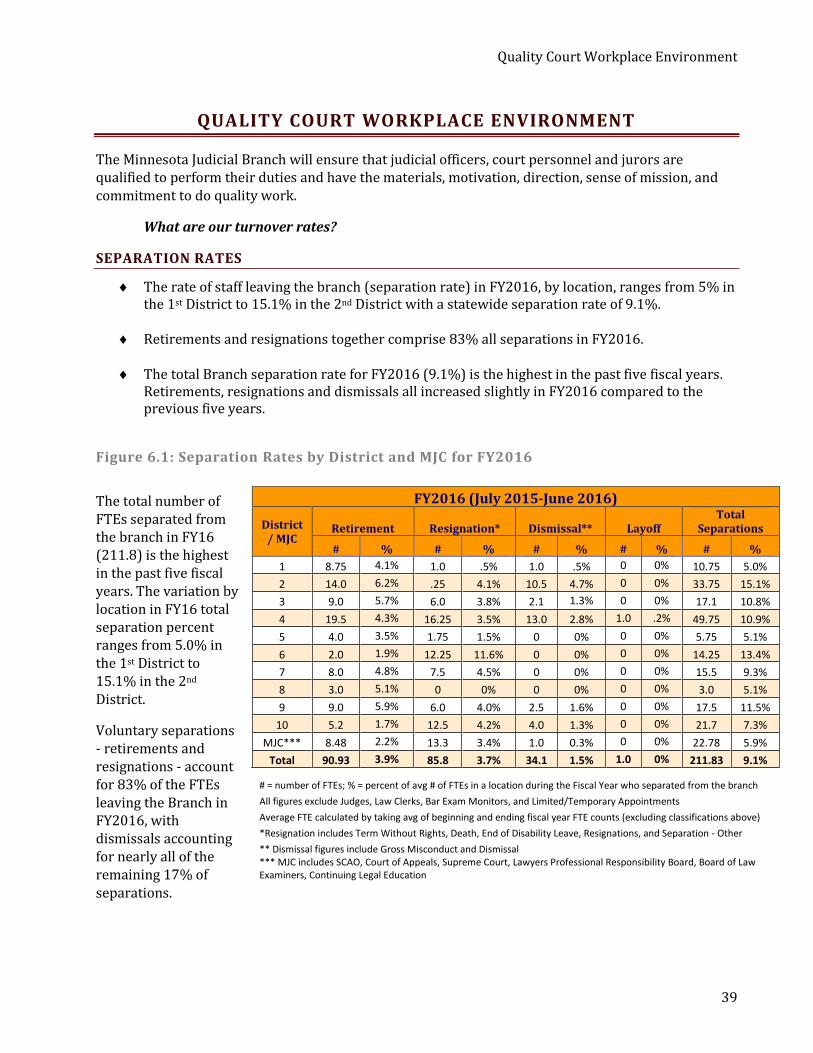
The rate of staff leaving the branch (separation rate) in FY2016, by location, ranges from 5% in the 1st District to 15.1% in the 2nd District with a statewide separation rate of 9.1%.
Retirements and resignations together comprise 83% all separations in FY2016.
The total Branch separation rate for FY2016 (9.1%) is the highest in the past five fiscal years. Retirements, resignations and dismissals all increased slightly in FY2016 compared to the previous five years.
Figure 6.1: Separation Rates by District and MJC for FY2016
The total number of FTEs separated from the branch in FY16 (211.8) is the highest in the past five fiscal years. The variation by location in FY16 total separation percent ranges from 5.0% in the 1st District to 15.1% in the 2nd District.
Voluntary separations - retirements and resignations - account for 83% of the FTEs leaving the Branch in FY2016, with dismissals accounting for nearly all of the remaining 17% of separations.
FY2016 (July 2015-June 2016)
District/ MJC
Retirement Resignation* Dismissal** Layoff Total
Separations
# % # % # % # % # %
1 8.75 4.1% 1.0 .5% 1.0 .5% 0 0% 10.75 5.0%
2 14.0 6.2% .25 4.1% 10.5 4.7% 0 0% 33.75 15.1%
3 9.0 5.7% 6.0 3.8% 2.1 1.3% 0 0% 17.1 10.8%
4 19.5 4.3% 16.25 3.5% 13.0 2.8% 1.0 .2% 49.75 10.9%
5 4.0 3.5% 1.75 1.5% 0 0% 0 0% 5.75 5.1%
6 2.0 1.9% 12.25 11.6% 0 0% 0 0% 14.25 13.4%
7 8.0 4.8% 7.5 4.5% 0 0% 0 0% 15.5 9.3%
8 3.0 5.1% 0 0% 0 0% 0 0% 3.0 5.1%
9 9.0 5.9% 6.0 4.0% 2.5 1.6% 0 0% 17.5 11.5%
10 5.2 1.7% 12.5 4.2% 4.0 1.3% 0 0% 21.7 7.3%
MJC*** 8.48 2.2% 13.3 3.4% 1.0 0.3% 0 0% 22.78 5.9%
Total 90.93 3.9% 85.8 3.7% 34.1 1.5% 1.0 0% 211.83 9.1%
# = number of FTEs; % = percent of avg # of FTEs in a location during the Fiscal Year who separated from the branch All figures exclude Judges, Law Clerks, Bar Exam Monitors, and Limited/Temporary Appointments
Average FTE calculated by taking avg of beginning and ending fiscal year FTE counts (excluding classifications above) *Resignation includes Term Without Rights, Death, End of Disability Leave, Resignations, and Separation - Other
** Dismissal figures include Gross Misconduct and Dismissal *** MJC includes SCAO, Court of Appeals, Supreme Court, Lawyers Professional Responsibility Board, Board of Law Examiners, Continuing Legal Education

Quality Court Workplace Environment
40
Figure 6.2: Total Separation Rates by District and MJC, FY2012 to FY2016
The statewide separation rate in FY2016 (9.1%) is higher than the previous four fiscal years. The 2nd District, in FY16, has the highest rate among all districts over these five fiscal years. (15.1%)
There are many different ways to calculate turnover rates (or separation rates.) So, not all numbers are exactly comparable, especially those that report figures by month instead of annually. The annual separation rate of 9.1% for the Branch is roughly estimated at .76% per month. This compares to U.S. Department of Labor, Bureau of Labor Statistics figures for State and Local government employees (excluding education) of 1.7% separations in June, 2016. The total separation rate of all of the private sector (total nonfarm) was 3.7% in June 20164
Figure 6.3: Statewide Separation Rates by Type, FY2012 to FY2016
The percent of separations from Resignation, Retirement and Dismissal all increased as a percent of total separations in FY2016 compared to the previous years as shown in Figure 6.3.
4 News Release from Bureau of Labor Statistics, U.S. Department of Labor, Job Openings and Labor Turnover Summary, August 10, 2016, USDL-16-1653.
District/MJC
FY16%
FY15 %
FY14%
FY13 %
FY12%
1 5.0% 8.5% 4.4% 4.0% 6.1%
2 15.1% 7.2% 8.6% 10.9% 9.8%
3 10.8% 5.8% 11.6% 3.9% 5.2%
4 10.9% 10.4% 5.2% 7.8% 11.2%
5 5.1% 6.1% 4.5% 3.8% 8.0%
6 13.4% 9.7% 8.6% 13.4% 5.4%
7 9.3% 5.7% 5.1% 2.6% 1.8%
8 5.1% 5.1% 5.0% 7.6% 4.7%
9 11.5% 5.9% 4.1% 4.2% 3.7%
10 7.3% 7.6% 8.6% 9.3% 5.1%
MJC 5.9% 7.7% 5.0% 5.6% 11.7%
Total 9.1% 7.8% 6.4% 6.8% 7.7% Total Number Separations
211.8 178.5 138.9 147.7 162.7
Separation Type
FY16 %
FY15 %
FY14 %
FY13 %
FY12 %
Retirement 3.9% 3.3% 3.0% 3.1% 3.5%
Resignation 3.7% 3.5% 2.7% 2.7% 3.1%
Dismissal 1.5% 1.0% .7% .9% 1.1%
Layoff 0% 0% 0% 0% 0%
Total 9.1% 7.8% 6.4% 6.8% 7.7%
Quality Court Workplace Environment
41
QUALITY COURT WORKPLACE ENVIRONMENT, CONTINUED
Do employees and judicial officers express satisfaction in their positions?
QUALITY COURT WORKPLACE SURVEY RESULTS
The next QCW Survey will be conducted in late September, 2016, alternating every two years with the Access and Fairness Survey.
One of the two previous Quality Court Workplace (QCW) Surveys was conducted in October 2012 and nearly 2,000 responses were received from employees and justices/judges.
In the results of the 2012 survey, the statement with the highest level of agreement among employees was: “I understand how my job contributes to the overall mission of the Minnesota Judicial Branch” (91% agree/strongly agree). The highest level of agreement among judges/ justices was: “I am proud I work in my court” (99% agree/strongly agree).
The Quality Court Workplace Survey will be conducted September 14-30, 2016 among justices, judges, and employees of the branch. Survey results will be available in late, 2016.

Data Details (Appendix)
42
DATA DETAILS (APPENDIX)
DEFINITION OF TERMS
Dates State Fiscal Year – Nearly all figures that are reported by year are reported using state fiscal year. For example, state fiscal year 2016 includes data from July 1, 2015 to June 30, 2016. This number is also referred to as FY2016, FY16. ViBES to MNCIS Conversion The ViBES to MNCIS conversion included making a business decision to convert all drivers license suspension cases as ‘open’ in MNCIS rather than the status of ‘dormant’ as they had been in ViBES. These cases are now being reviewed case by case to determine which cases should be closed or remain open. Timeliness Measures Clearance Rate – Number of dispositions for a specified period of time divided by the number of filings (multiplied times 100). A Clearance Rate of 100% indicates a court is ‘keeping up’ with cases filed. A Clearance Rate under 100% indicates a possible growing backlog. Time to Disposition – Assesses the length of time it takes to process cases compared to the Judicial Council objectives for timely case processing. The measure is reported as a percentage of cases meeting the timing objectives for when 90% of cases should be disposed, at the 97th percentile and at the 99th percentile. Any more than 1% of cases disposed beyond the 99th percentile are considered to have not met timing objectives. Age of Pending – Shows the percent of currently pending cases that are within the timing objectives for timely case processing. Data as of the end of each quarter is archived for trend reporting. Cases pending beyond the 99th percentile objective can be considered as one measure of court backlog. Length of Time to Permanency – Assesses whether or not timely permanency decisions are being made for children. Reports the number of children for whom permanency was achieved on a CHIPS or Permanency case, by type of permanency, and the length of time the child was out of home prior to the permanency order/disposition date for time periods of up to 6 months, up to 12 months, 15 months, 18 months, 24 months and over 24 months. The goal is to achieve permanency by 18 months for 99% of all children. Time to Adoption for Children under State Guardianship – Assesses whether or not adoptions occur within two years (24 months) of entering foster care for 60% of children reaching adoption. Reports the number of children for whom adoption was achieved, the length of time the child was out of home prior to being under state guardianship and the length of time from state guardianship to adoption. The combination of the two time periods equals Time to Adoption.
Data Details (Appendix)
43
Court of Appeals Dispositions within Time Standards – Reports the number and percent of cases, by case area, that met the objectives of disposing of 75% of cases within 290 days of filing and disposing of 90% of cases within 365 days of filing. Supreme Court Timing Standards – Reports identify the court’s performance based on three factors: (1) the case type or jurisdiction (original/mandatory; discretionary; expedited); (2) the case-processing event (PFR to disposition; submission to circulation; submission to disposition); and (3) the timing objective to complete the event.
Quality Court Workplace Environment Turnover Rate - Also called Separation Rate. Number of Full Time Equivalents (FTEs) who leave the branch during the fiscal year divided by the average number of FTEs employed in a location during that fiscal year (multiplied times 100). Rate excludes Judges, Law Clerks, Bar Exam Monitors and Limited/Temporary Appointments.
Data Details (Appendix)
44
ANALYSIS NOTES
The data in this document come from several sources. The results of timing measures for district courts come from MNJAD (Minnesota Judicial Analytical Database, or data warehouse) reports and the data represents both what exists at a point-in-time and trends over the past months and years. Data changes each week as new and updated information is loaded into the data warehouse from MNCIS (Minnesota Court Information System). All years noted in the timing area represent fiscal years, unless otherwise noted. The Trial Court Reports (MNJAD reports) for Clearance Rates, Time to Disposition, Age of Pending Cases, Length of Time to Permanency and Time to Adoption for Children under State Guardianship are available to judges and staff on CourtNet (the intranet of the Minnesota Judicial Branch). The Clearance Rates, Time to Disposition and Age of Pending Cases reports are available in the original tabular format as well as in color-coded “stoplight report” format. Readers of this report are encouraged to look at the data in this report as well as seek additional information using MNJAD and stoplight reports. Court of Appeals and Supreme Court timing information is reported from MACS (Minnesota Appellate Court System case management system) and reflects fiscal year figures.
Separation rates are reported from the Human Resources and Development Division of the State Court Administrator’s Office (SCAO) and reflect FY2016 and include trends back to FY2012. Juror information comes from the jury management system and includes jurors from FY2016 compared to results of the 2010 American Community Survey (replaces the previous long-form census).

Data Details (Appendix)
45
NUMBER OF JUVENILE DELINQUENCY FELONY DISPOSITIONS, FY 2016
Counties with 10 or more dispositions during FY 2016 are included in this chart. Time to Disposition data for this case type can be found on page 20 of this report.
County Total Delin. Felony Dispositions, FY16
County
Total Delin. Felony Dispositions, FY16
Aitkin 11 Nicollet 25
Anoka 190 Nobles 18
Becker 27 Olmsted 102
Beltrami 51 Otter Tail 36
Benton 18 Pennington 18
Blue Earth 54 Pine 11
Brown 30 Polk 17
Carlton 26 Pope 10
Carver 58 Ramsey 393
Cass 40 Redwood 10
Chisago 26 Rice 38
Clay 41 Roseau 10
Clearwater 25 Scott 105
Cottonwood 18 Sherburne 58
Crow Wing 53 Sibley 15
Dakota 196 St. Louis 148
Dodge 10 Stearns 89
Douglas 25 Steele 50
Faribault 27 Stevens 12
Freeborn 37 Swift 14
Goodhue 58 Todd 10
Hennepin 819 Wabasha 12
Hubbard 15 Wadena 14
Isanti 19 Waseca 12
Itasca 51 Washington 113
Kandiyohi 42 Watonwan 17
Koochiching 36 Winona 31
LeSueur 28 Wright 81
Lyon 23
Mahnomen 38
Martin 10
McLeod 11
Meeker 15
Mille Lacs 23
Morrison 23
Mower 62
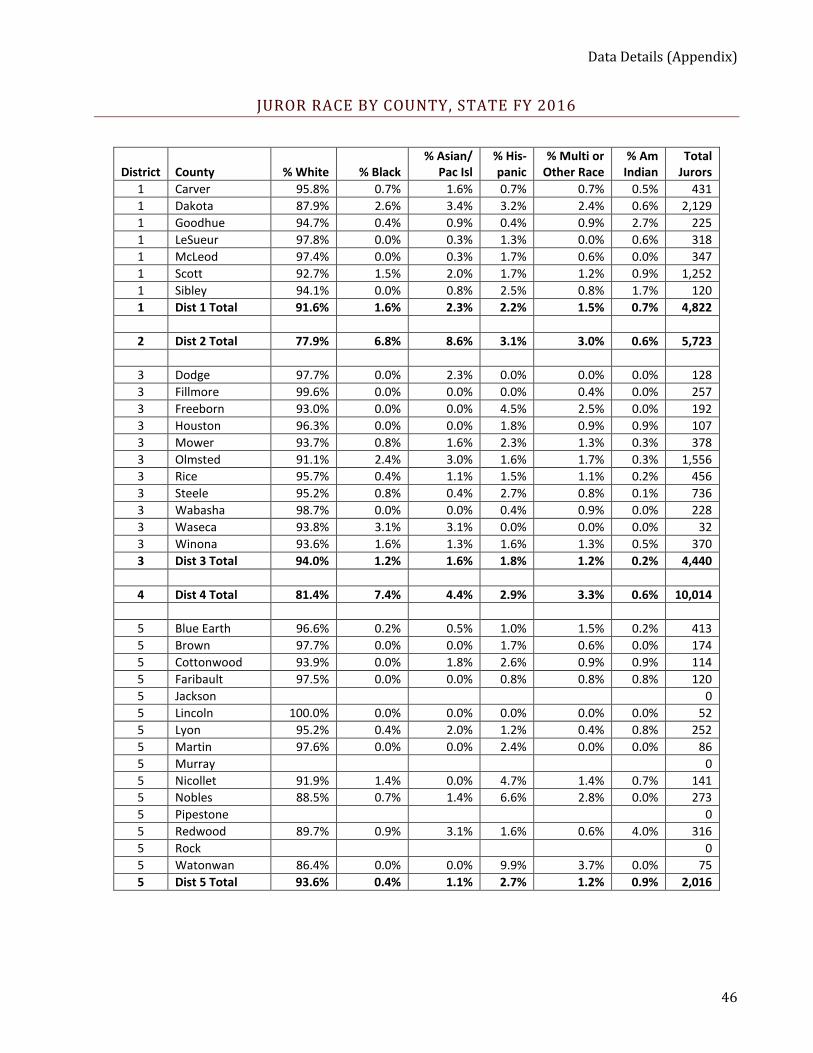
Data Details (Appendix)
46
JUROR RACE BY COUNTY, STATE FY 2016
District County % White % Black % Asian/
Pac Isl % His- panic
% Multi or Other Race
% Am Indian
Total Jurors
1 Carver 95.8% 0.7% 1.6% 0.7% 0.7% 0.5% 431
1 Dakota 87.9% 2.6% 3.4% 3.2% 2.4% 0.6% 2,129
1 Goodhue 94.7% 0.4% 0.9% 0.4% 0.9% 2.7% 225
1 LeSueur 97.8% 0.0% 0.3% 1.3% 0.0% 0.6% 318
1 McLeod 97.4% 0.0% 0.3% 1.7% 0.6% 0.0% 347
1 Scott 92.7% 1.5% 2.0% 1.7% 1.2% 0.9% 1,252
1 Sibley 94.1% 0.0% 0.8% 2.5% 0.8% 1.7% 120
1 Dist 1 Total 91.6% 1.6% 2.3% 2.2% 1.5% 0.7% 4,822
2 Dist 2 Total 77.9% 6.8% 8.6% 3.1% 3.0% 0.6% 5,723
3 Dodge 97.7% 0.0% 2.3% 0.0% 0.0% 0.0% 128
3 Fillmore 99.6% 0.0% 0.0% 0.0% 0.4% 0.0% 257
3 Freeborn 93.0% 0.0% 0.0% 4.5% 2.5% 0.0% 192
3 Houston 96.3% 0.0% 0.0% 1.8% 0.9% 0.9% 107
3 Mower 93.7% 0.8% 1.6% 2.3% 1.3% 0.3% 378
3 Olmsted 91.1% 2.4% 3.0% 1.6% 1.7% 0.3% 1,556
3 Rice 95.7% 0.4% 1.1% 1.5% 1.1% 0.2% 456
3 Steele 95.2% 0.8% 0.4% 2.7% 0.8% 0.1% 736
3 Wabasha 98.7% 0.0% 0.0% 0.4% 0.9% 0.0% 228
3 Waseca 93.8% 3.1% 3.1% 0.0% 0.0% 0.0% 32
3 Winona 93.6% 1.6% 1.3% 1.6% 1.3% 0.5% 370
3 Dist 3 Total 94.0% 1.2% 1.6% 1.8% 1.2% 0.2% 4,440
4 Dist 4 Total 81.4% 7.4% 4.4% 2.9% 3.3% 0.6% 10,014
5 Blue Earth 96.6% 0.2% 0.5% 1.0% 1.5% 0.2% 413
5 Brown 97.7% 0.0% 0.0% 1.7% 0.6% 0.0% 174
5 Cottonwood 93.9% 0.0% 1.8% 2.6% 0.9% 0.9% 114
5 Faribault 97.5% 0.0% 0.0% 0.8% 0.8% 0.8% 120
5 Jackson 0
5 Lincoln 100.0% 0.0% 0.0% 0.0% 0.0% 0.0% 52
5 Lyon 95.2% 0.4% 2.0% 1.2% 0.4% 0.8% 252
5 Martin 97.6% 0.0% 0.0% 2.4% 0.0% 0.0% 86
5 Murray 0
5 Nicollet 91.9% 1.4% 0.0% 4.7% 1.4% 0.7% 141
5 Nobles 88.5% 0.7% 1.4% 6.6% 2.8% 0.0% 273
5 Pipestone 0
5 Redwood 89.7% 0.9% 3.1% 1.6% 0.6% 4.0% 316
5 Rock 0
5 Watonwan 86.4% 0.0% 0.0% 9.9% 3.7% 0.0% 75
5 Dist 5 Total 93.6% 0.4% 1.1% 2.7% 1.2% 0.9% 2,016
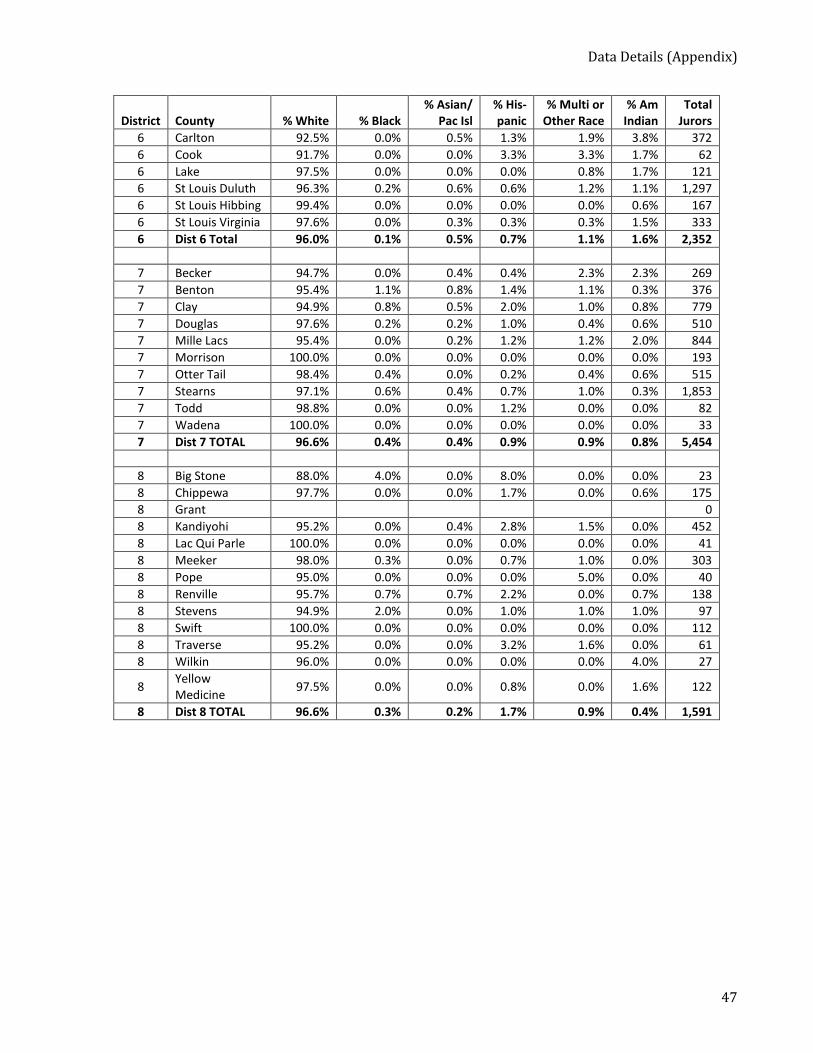
Data Details (Appendix)
47
District County % White % Black % Asian/
Pac Isl % His- panic
% Multi or Other Race
% Am Indian
Total Jurors
6 Carlton 92.5% 0.0% 0.5% 1.3% 1.9% 3.8% 372
6 Cook 91.7% 0.0% 0.0% 3.3% 3.3% 1.7% 62
6 Lake 97.5% 0.0% 0.0% 0.0% 0.8% 1.7% 121
6 St Louis Duluth 96.3% 0.2% 0.6% 0.6% 1.2% 1.1% 1,297
6 St Louis Hibbing 99.4% 0.0% 0.0% 0.0% 0.0% 0.6% 167
6 St Louis Virginia 97.6% 0.0% 0.3% 0.3% 0.3% 1.5% 333
6 Dist 6 Total 96.0% 0.1% 0.5% 0.7% 1.1% 1.6% 2,352
7 Becker 94.7% 0.0% 0.4% 0.4% 2.3% 2.3% 269
7 Benton 95.4% 1.1% 0.8% 1.4% 1.1% 0.3% 376
7 Clay 94.9% 0.8% 0.5% 2.0% 1.0% 0.8% 779
7 Douglas 97.6% 0.2% 0.2% 1.0% 0.4% 0.6% 510
7 Mille Lacs 95.4% 0.0% 0.2% 1.2% 1.2% 2.0% 844
7 Morrison 100.0% 0.0% 0.0% 0.0% 0.0% 0.0% 193
7 Otter Tail 98.4% 0.4% 0.0% 0.2% 0.4% 0.6% 515
7 Stearns 97.1% 0.6% 0.4% 0.7% 1.0% 0.3% 1,853
7 Todd 98.8% 0.0% 0.0% 1.2% 0.0% 0.0% 82
7 Wadena 100.0% 0.0% 0.0% 0.0% 0.0% 0.0% 33
7 Dist 7 TOTAL 96.6% 0.4% 0.4% 0.9% 0.9% 0.8% 5,454
8 Big Stone 88.0% 4.0% 0.0% 8.0% 0.0% 0.0% 23
8 Chippewa 97.7% 0.0% 0.0% 1.7% 0.0% 0.6% 175
8 Grant 0
8 Kandiyohi 95.2% 0.0% 0.4% 2.8% 1.5% 0.0% 452
8 Lac Qui Parle 100.0% 0.0% 0.0% 0.0% 0.0% 0.0% 41
8 Meeker 98.0% 0.3% 0.0% 0.7% 1.0% 0.0% 303
8 Pope 95.0% 0.0% 0.0% 0.0% 5.0% 0.0% 40
8 Renville 95.7% 0.7% 0.7% 2.2% 0.0% 0.7% 138
8 Stevens 94.9% 2.0% 0.0% 1.0% 1.0% 1.0% 97
8 Swift 100.0% 0.0% 0.0% 0.0% 0.0% 0.0% 112
8 Traverse 95.2% 0.0% 0.0% 3.2% 1.6% 0.0% 61
8 Wilkin 96.0% 0.0% 0.0% 0.0% 0.0% 4.0% 27
8 Yellow Medicine
97.5% 0.0% 0.0% 0.8% 0.0% 1.6% 122
8 Dist 8 TOTAL 96.6% 0.3% 0.2% 1.7% 0.9% 0.4% 1,591
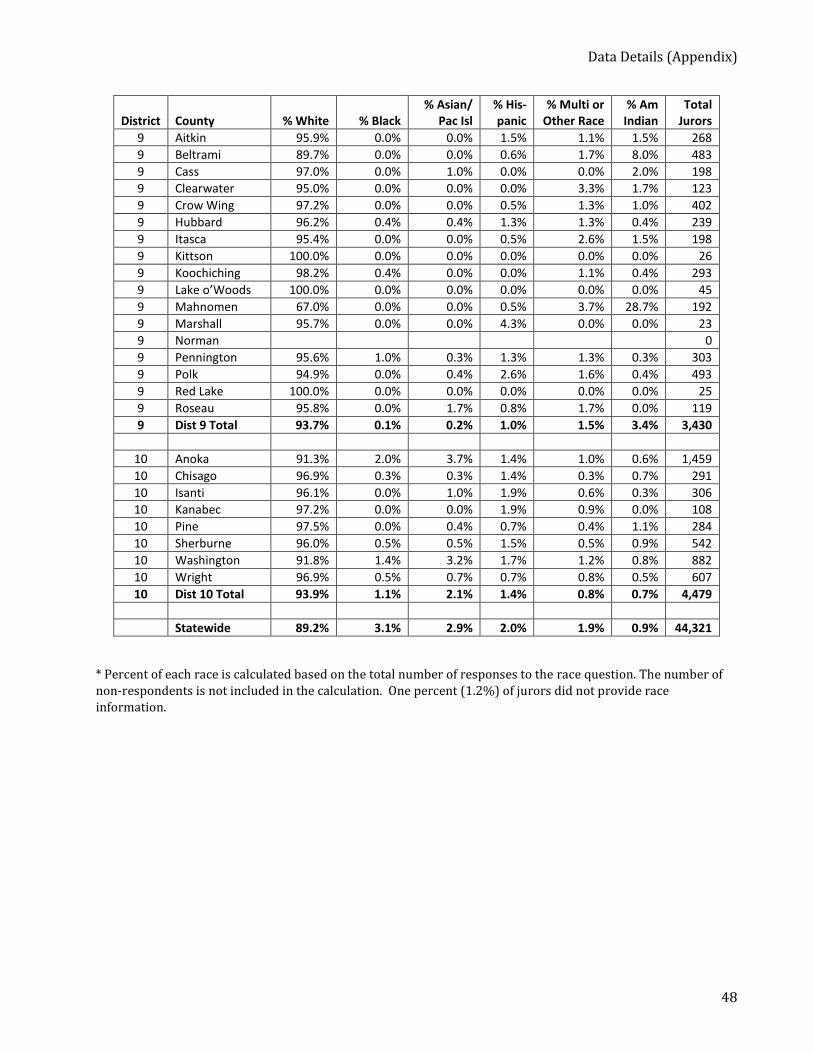
Data Details (Appendix)
48
District County % White % Black % Asian/
Pac Isl % His- panic
% Multi or Other Race
% Am Indian
Total Jurors
9 Aitkin 95.9% 0.0% 0.0% 1.5% 1.1% 1.5% 268
9 Beltrami 89.7% 0.0% 0.0% 0.6% 1.7% 8.0% 483
9 Cass 97.0% 0.0% 1.0% 0.0% 0.0% 2.0% 198
9 Clearwater 95.0% 0.0% 0.0% 0.0% 3.3% 1.7% 123
9 Crow Wing 97.2% 0.0% 0.0% 0.5% 1.3% 1.0% 402
9 Hubbard 96.2% 0.4% 0.4% 1.3% 1.3% 0.4% 239
9 Itasca 95.4% 0.0% 0.0% 0.5% 2.6% 1.5% 198
9 Kittson 100.0% 0.0% 0.0% 0.0% 0.0% 0.0% 26
9 Koochiching 98.2% 0.4% 0.0% 0.0% 1.1% 0.4% 293
9 Lake o’Woods 100.0% 0.0% 0.0% 0.0% 0.0% 0.0% 45
9 Mahnomen 67.0% 0.0% 0.0% 0.5% 3.7% 28.7% 192
9 Marshall 95.7% 0.0% 0.0% 4.3% 0.0% 0.0% 23
9 Norman 0
9 Pennington 95.6% 1.0% 0.3% 1.3% 1.3% 0.3% 303
9 Polk 94.9% 0.0% 0.4% 2.6% 1.6% 0.4% 493
9 Red Lake 100.0% 0.0% 0.0% 0.0% 0.0% 0.0% 25
9 Roseau 95.8% 0.0% 1.7% 0.8% 1.7% 0.0% 119
9 Dist 9 Total 93.7% 0.1% 0.2% 1.0% 1.5% 3.4% 3,430
10 Anoka 91.3% 2.0% 3.7% 1.4% 1.0% 0.6% 1,459
10 Chisago 96.9% 0.3% 0.3% 1.4% 0.3% 0.7% 291
10 Isanti 96.1% 0.0% 1.0% 1.9% 0.6% 0.3% 306
10 Kanabec 97.2% 0.0% 0.0% 1.9% 0.9% 0.0% 108
10 Pine 97.5% 0.0% 0.4% 0.7% 0.4% 1.1% 284
10 Sherburne 96.0% 0.5% 0.5% 1.5% 0.5% 0.9% 542
10 Washington 91.8% 1.4% 3.2% 1.7% 1.2% 0.8% 882
10 Wright 96.9% 0.5% 0.7% 0.7% 0.8% 0.5% 607
10 Dist 10 Total 93.9% 1.1% 2.1% 1.4% 0.8% 0.7% 4,479
Statewide 89.2% 3.1% 2.9% 2.0% 1.9% 0.9% 44,321
* Percent of each race is calculated based on the total number of responses to the race question. The number of non-respondents is not included in the calculation. One percent (1.2%) of jurors did not provide race information.
Related Documents