PERFORMANCE MEASURES FOR HIGHWAY CAPACITY DECISION MAKING WEST VIRGINIA PLANNING CONFERENCE – SEPTEMBER 16, 2015 SALEEM SALAMEH, P.E., PH.D. KYOVA IPC TRUNG VO, P.E. KIMLEY-HORN

PERFORMANCE MEASURES FOR HIGHWAY CAPACITY DECISION MAKING WEST VIRGINIA PLANNING CONFERENCE – SEPTEMBER 16, 2015 SALEEM SALAMEH, P.E., PH.D. KYOVA IPC.
Dec 30, 2015
Welcome message from author
This document is posted to help you gain knowledge. Please leave a comment to let me know what you think about it! Share it to your friends and learn new things together.
Transcript

PERFORMANCE MEASURES FORHIGHWAY CAPACITY DECISION MAKINGWEST VIRGINIA PLANNING CONFERENCE – SEPTEMBER 16, 2015
SALEEM SALAMEH, P.E., PH.D. KYOVA IPC
TRUNG VO, P.E. KIMLEY-HORN

2
OUTLINE
Moving Ahead for Progress in the 21st Century
KYOVA Performance Measurement
A Case Study in Highway Capacity Decision Making
3
MOVING AHEAD FOR PROGRESSIN THE 21ST CENTURYPERFORMANCE ELEMENTS . NATIONAL GOALS . PERFORMANCE MEASURES

4
PERFORMANCE ELEMENTS
1. National Goals
2. Measures
3. Targets
4. Plans
5. Reports
6. Accountability and Transparency
5
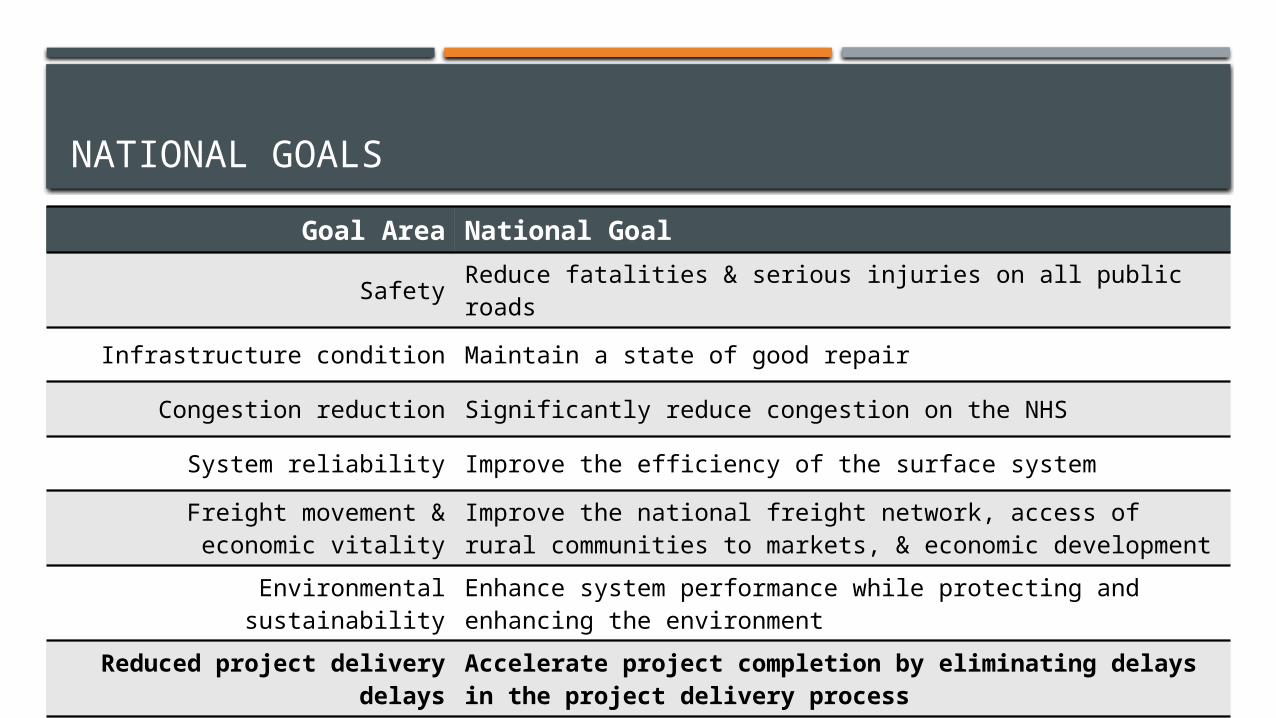
NATIONAL GOALS
Goal Area National Goal
Safety Reduce fatalities & serious injuries on all public roads
Infrastructure condition Maintain a state of good repair
Congestion reduction Significantly reduce congestion on the NHS
System reliability Improve the efficiency of the surface system
Freight movement &economic vitality
Improve the national freight network, access of rural communities to markets, & economic development
Environmental sustainability Enhance system performance while protecting and enhancing the environment
Reduced project delivery delays
Accelerate project completion by eliminating delays in the project delivery process

6
PERFORMANCE MEASURES
Safety Performance
Number of fatalities and number of serious injuries
Rate of fatalities and rate of serious injuries

7
PERFORMANCE MEASURES
Pavement and Bridge
Percentage of pavements in the Interstate System in good and poor condition
Percentage of pavements of the non-Interstate NHS in good and poor condition
Percentage of NHS bridges classified as being in good and poor condition
8
KYOVA PERFORMANCE MEASUREMENTSTRATEGIC HIGHWAY RESEARCH PROGRAM 2 . 2040 METROPOLITAN TRANSPORTATION PLAN
CONGESTION MANAGEMENT PROCESS . SPATIAL DECISION SUPPORT SYSTEM

9
STRATEGIC HIGHWAY RESEARCH PROGRAM 2 (SHRP 2)
SHRP 2 was created to Improve highway safety
Reduce congestion
Improve methods for renewing roads and bridges
KYOVA will use its SHRP 2 grant to establish a process that Conforms to national and state standards
Is easily repeatable
Coordinates with available data and data gathering practices

STRATEGIC HIGHWAY RESEARCH PROGRAM 2 (SHRP 2)TIMELINE OF EVENTS
January-March 2015 – KYOVA applied for and was awarded funding for C02: Performance Measures for Highway Capacity Decision-Making
May 2015 – Kickoff Conference Call with FHWA and completion of Statement of Work
August 2015 – Notification to proceed with work
September-November 2015 – Identify stakeholders and prepare for FHWA workshop
November 2015 – Stakeholder workshop
June 2016 – Complete SHRP 2 Implementation Assistance project
10

STRATEGIC HIGHWAY RESEARCH PROGRAM 2 (SHRP 2)IMPLEMENTATION SCHEDULE
Task # Deliverable/Activity Timeframe
1 Identify stakeholders 1 week
2 Kickoff meeting with stakeholders (merged with FHWA workshop) 2 weeks
3 Data needs coordination 4 weeks4 Preparation for FHWA workshop 4 weeks5 Conduct workshop with FHWA and stakeholders 1 week6 Summarize feedback from FHWA workshop 2 weeks7 Additional data gathering and coordination 4 weeks8 Develop action plan for C02 tool application 4 weeks9 Prepare C02 tool performance documentation 2 weeks10 Presentation to agency stakeholders 2 weeks
11
STRATEGIC HIGHWAY RESEARCH PROGRAM 2 (SHRP 2) FHWA WORKSHOP
Stakeholders will hear from representatives from FHWA, KYOVA, WVDOT, KYTC, and ODOT about current and forthcoming work on performance measures
Break-out group brainstorming to generate ideas on future “action steps”
Group dialogue on the framework and components of the Action Plan
Discussion of next steps for developing and implementing the Action Plan12

13
2040 METROPOLITAN TRANSPORTATION PLANPRIORITIZATION CRITERIA
Efficiency
Reduction in Delay
Reduction in Excess Demand
Support of Freight Priorities
Support of Transit Service
Support of Bicycle and Pedestrian Mobility
Safety
Growth Management
Economic Development
Existing Deficiency
Cost Effectiveness
State Priority
14
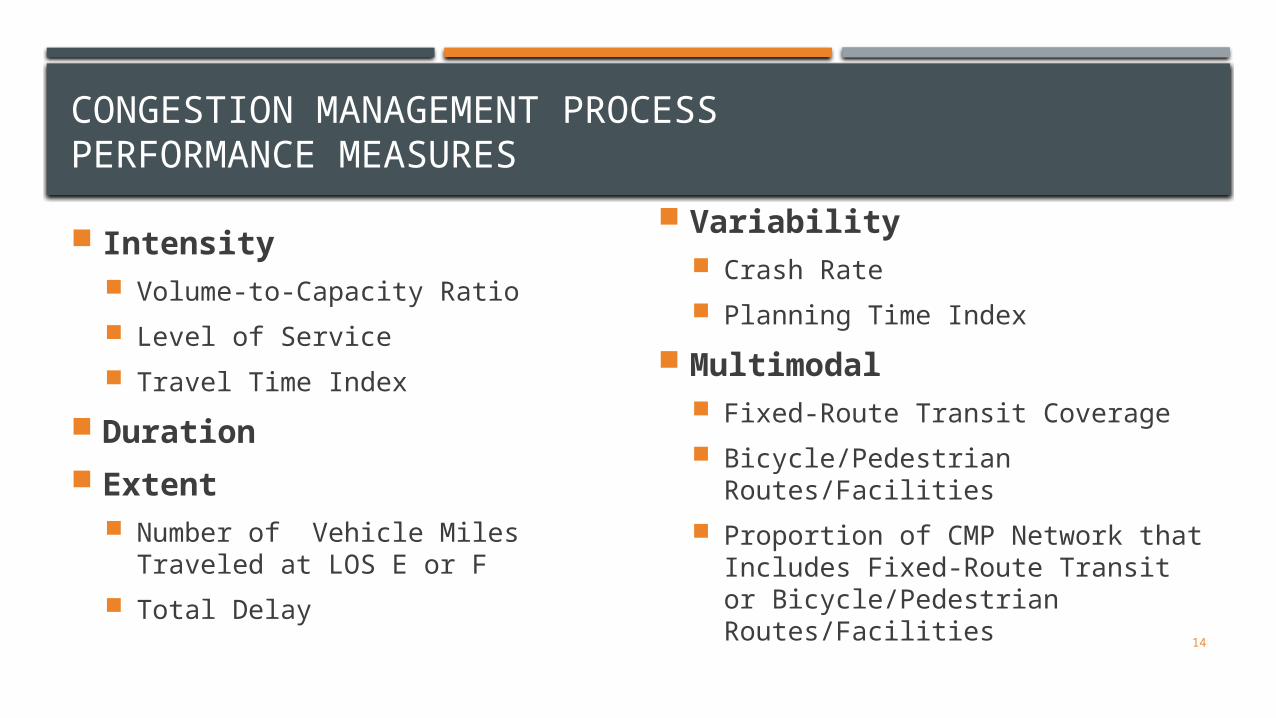
CONGESTION MANAGEMENT PROCESSPERFORMANCE MEASURES
Intensity Volume-to-Capacity Ratio
Level of Service
Travel Time Index
Duration
Extent Number of Vehicle Miles Traveled
at LOS E or F
Total Delay
Variability Crash Rate
Planning Time Index
Multimodal Fixed-Route Transit Coverage
Bicycle/Pedestrian Routes/Facilities
Proportion of CMP Network that Includes Fixed-Route Transit or Bicycle/Pedestrian Routes/Facilities

15
SPATIAL DECISION SUPPORT SYSTEM (SDSS)
A GIS-based system of relational databases, computational tools, and information sources used to
Store transportation system attribute and performance data
Perform technical analyses that identify/quantify congestion and assess the effectiveness of congestion reduction/mitigation strategies
Provide themes maps and system performance reports for stakeholders and decision makers

16
SPATIAL DECISION SUPPORT SYSTEM (SDSS)
Map Figures
KYOVA Transportation Management Area Boundary Volumes from Traffic Model Assignments
CMP Network Capacities from Traffic Model Assignments
Major River Crossings V/C Ratios from Traffic Model Assignments
Fixed Route Transit Coverage Levels of Service
Computed Crash Rates Compared to Statewide Average
Travel Time Indices
Congested Locations from Stakeholder Workshops Planning Time Indices
Downtown Railroad Underpass/Viaduct Locations

17
CHALLENGES AND OPPORTUNITIES
Providing both consistency and flexibility
Finding the right balance of national measures
Managing performance across jurisdictions
Data requirements and management
Linking performance measures to investments
Advancing technologies
18
CHALLENGES AND OPPORTUNITIES
Improved communication link between investments and results
Increased consistency
Increased coordination across jurisdictions
Greater understanding of what works
Spur discussions on the value of future performance management
Improved data collection, integration, reporting, and visualization
19
A CASE STUDY INHIGHWAY CAPACITY DECISION MAKINGNCDOT PRIORITIZATION PROCESS . BENEFIT/COST CRITERIA
TRAVEL TIME SAVINGS ANALYSIS . OPPORTUNITY FOR KYOVA

20
NCDOT PRIORITIZATION PROCESS
Strategic Transportation Investments Law passed in 2013
Replaces Equity Formula with Strategic Mobility Formula New data-driven process based on specific criteria
Equity Formula would have funded 175 highway projects
Mobility Formula will fund 478 highway projects
21
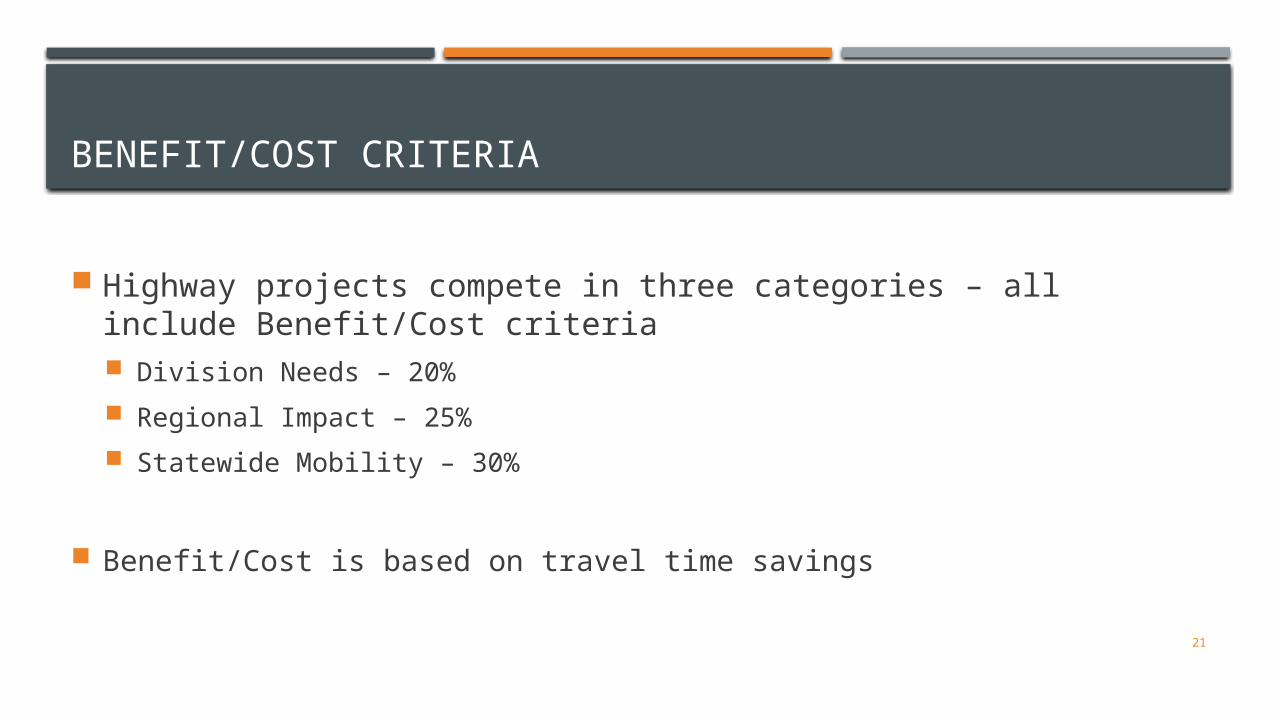
BENEFIT/COST CRITERIA
Highway projects compete in three categories – all include Benefit/Cost criteria Division Needs – 20%
Regional Impact – 25%
Statewide Mobility – 30%
Benefit/Cost is based on travel time savings

22
TRAVEL TIME SAVINGS ANALYSIS
TransModeler 4.0 is the selected microsimulation software to measure travel time savings for every highway project
Currently analyzing 98 projects – to be completed by end of October
Long-term byproduct is statewide microsimulation model
23
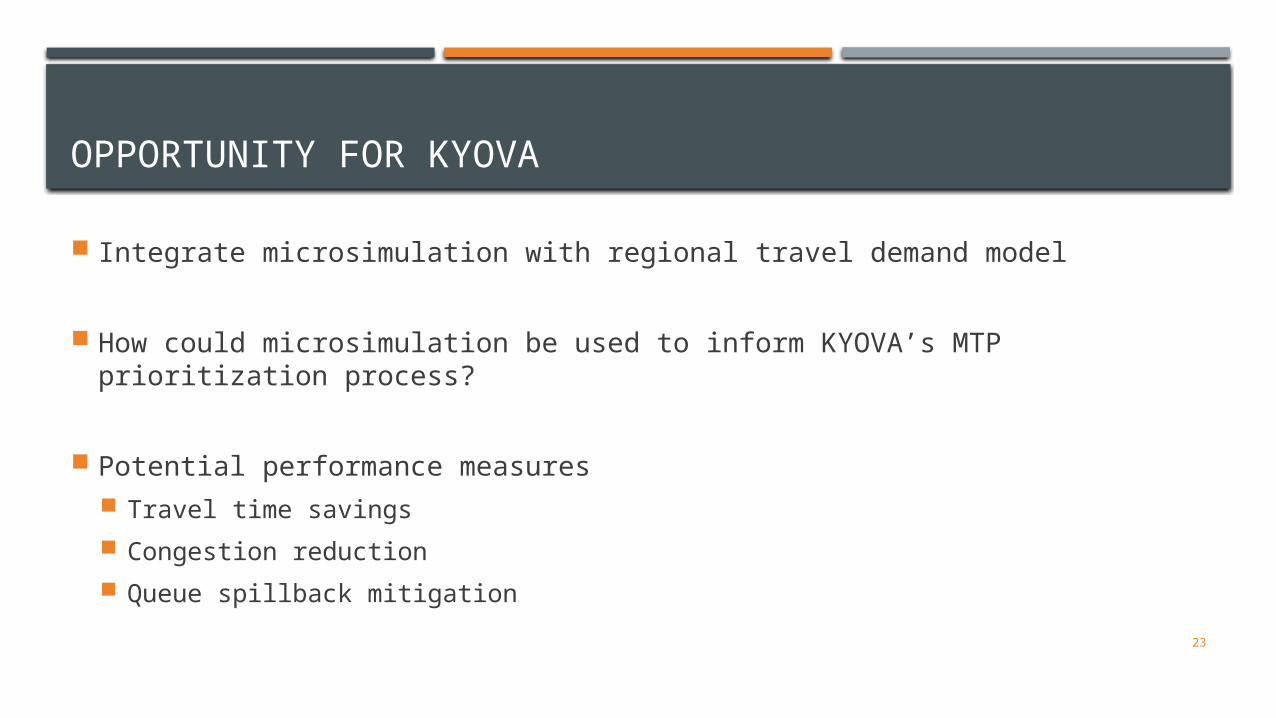
OPPORTUNITY FOR KYOVA
Integrate microsimulation with regional travel demand model
How could microsimulation be used to inform KYOVA’s MTP prioritization process?
Potential performance measures Travel time savings
Congestion reduction
Queue spillback mitigation

24
Saleem Salameh
KYOVA Interstate Planning Commission
Trung Vo
Kimley-Horn
Related Documents