Performance Measurement Working Group Presentation to APHEO Core Indicators Strategic Planning Julie Stratton, December 5, 2008

Performance Measurement Working Group Presentation to APHEO Core Indicators Strategic Planning Julie Stratton, December 5, 2008.
Jan 01, 2016
Welcome message from author
This document is posted to help you gain knowledge. Please leave a comment to let me know what you think about it! Share it to your friends and learn new things together.
Transcript
Performance Measurement Working GroupPresentation to APHEO Core Indicators Strategic Planning
Julie Stratton, December 5, 2008

Purpose of this Presentation
To describe the purpose and activities of the Performance Measurement Working Group
To describe the indicators selected To highlight issues which arose during the
indicator selection process To describe next steps for the report To highlight impact of this report for APHEO
Core Indicators

Why is this Important for APHEO Core Indicators
PMWG had many discussions about indicators
Questions arose during the PMWG process about how core indicators are selected
A few of the indicators in the report are different than APHEO’s Core Indicators – will need review
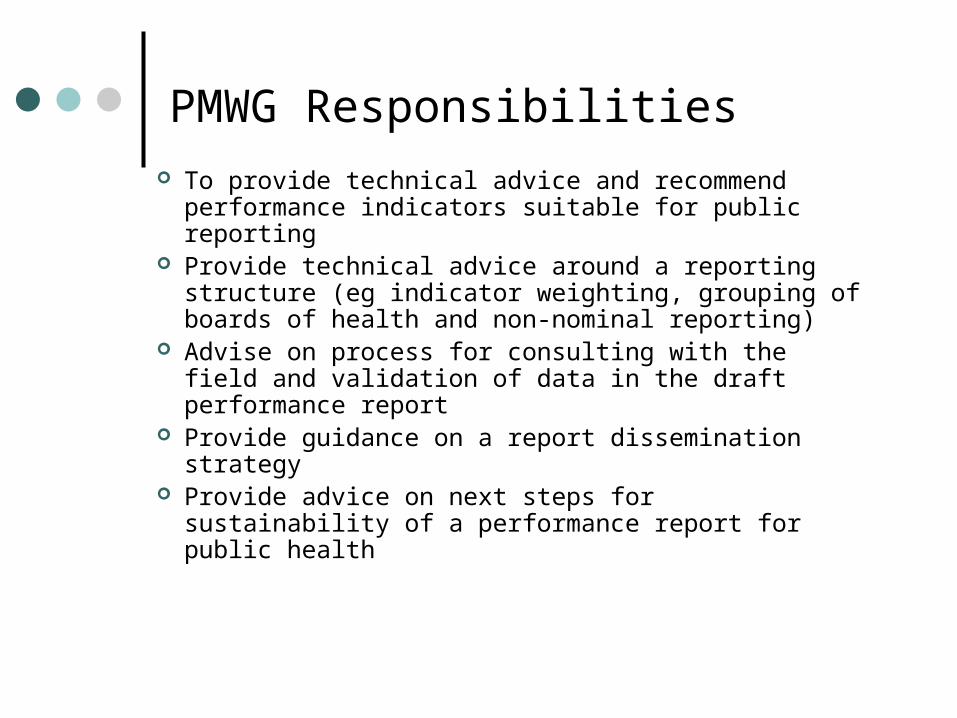
PMWG Responsibilities To provide technical advice and recommend
performance indicators suitable for public reporting Provide technical advice around a reporting
structure (eg indicator weighting, grouping of boards of health and non-nominal reporting)
Advise on process for consulting with the field and validation of data in the draft performance report
Provide guidance on a report dissemination strategy
Provide advice on next steps for sustainability of a performance report for public health

CRC Performance Measurement Framework
Performance Standards
Performance Measures
Performance Monitoring
and Reporting
Continuous Quality
Improvement
Organizational Standards
Program Standards
Legislated Requirements
Measures
Data Collection
Data Quality Control
Monitoring
Accreditation
Assessments
Public Reporting
Analysis & Learning
Revision & Adjustment
Foundations for the Performance Management Framework Funding, Human Resources, Integrated Data Systems

PMWG Framework – 5 Dimensions
Effectiveness Capacity Equitable Community Partnership Effectively Governed and Managed

Selection of Indicators
600+ potential public health indicators have been identified
Health status information is available from other sources (e.g. Canadian Community Health Survey, Canadian Institute for Health Information (CIHI), Statistics Canada, integrated Public Health Information System (iPHIS))
Approximately 35 indicators have been identified for inclusion in the report
Indicator rationale: represent areas where public health has influence availability of reliable data at the health unit level

Case Studies
• Will illustrate areas of public health practice that are not effectively represented by indicators
• Opportunity for health units to highlight local initiatives in areas such as partnerships with LHINs, work with priority populations, and community engagement
• Approximately 10 case studies to be included in the report

PMWG Framework – Effectiveness Dimension
Examples of indicators: Teen pregnancy rate Low birth weight rate % Breastfeeding duration > 6 months % of new mothers who receive a post-partum phone call Smoking prevalence rates % of population 12+ who are physically active or moderately active % of population 12 + reporting consuming recommended number of
servings of fruit and vegetables % of population 12+ with healthy body mass index Fall-related hospitalization rate among seniors % population participating in heavy drinking episodes (youth, adults) Incidence of enteric illnesses Incidence rate of Chlamydia Immunization coverage rates for Hepatitis B Immunization coverage rates for measles, mumps and rubella

PMWG Framework – Capacity Dimension
Examples of indicators: Board of health expenditures % of expenditures related to training and professional
development # of FTEs in selected job categories Job vacancy rates Staff lengths of service Emergency response plans tested # of adverse drinking water incidents # of infectious disease outbreaks in Long Term Care
facilities
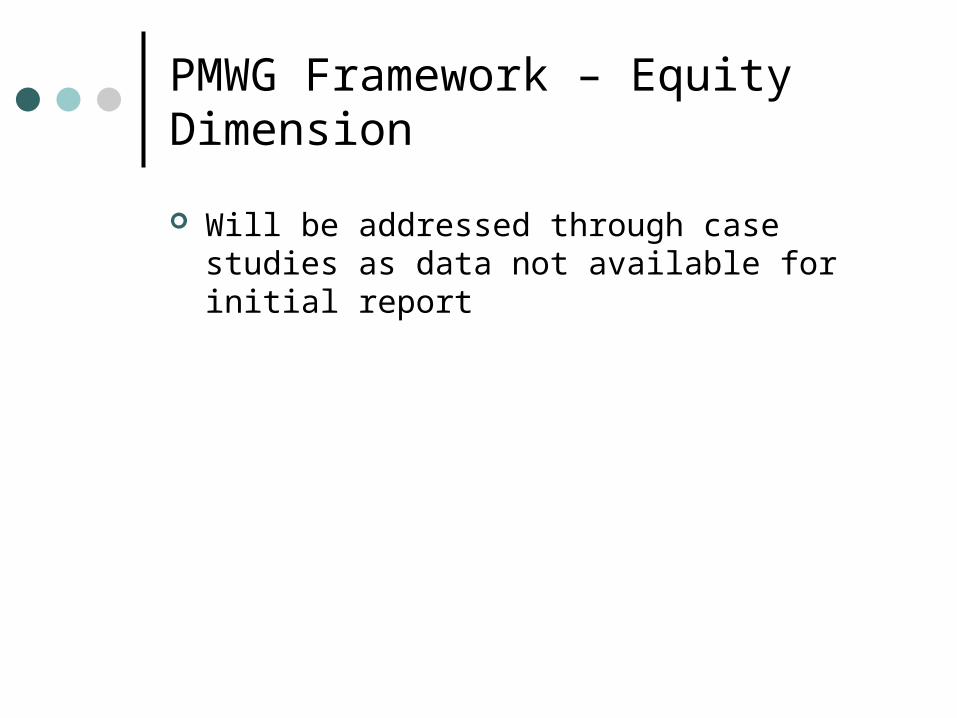
PMWG Framework – Equity Dimension
Will be addressed through case studies as data not available for initial report

PMWG Framework – Community Partnerships
Example of indicator: Familiarity of the public with the health unit’s
programs and services

PMWG Framework – Governance and Management Dimension
Examples of indicators: Budget variance between projected and actual
expenditures Board member participation at meetings – % of meetings
with quorum, % of meetings cancelled Board member orientation and Board self-evaluation Accreditation status Existence of current strategic plan Process for performance evaluation of Medical Officers of
Health FTE status of MOH and Associate MOHs Status of MOHs reporting to Boards of Health
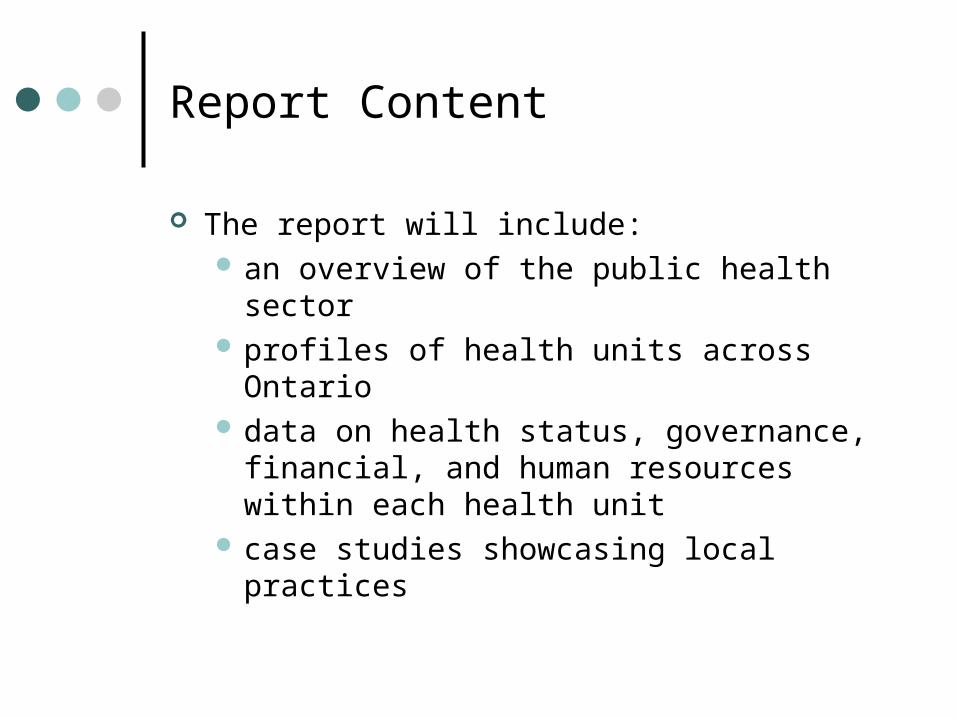
Report Content
The report will include: an overview of the public health sector profiles of health units across Ontario data on health status, governance, financial,
and human resources within each health unit
case studies showcasing local practices

Initial Public Report on Public Health The purpose of the report is:
snapshot of public health system not intended to be a performance report or
scorecard Developed in consultation with the Performance
Management Working Group Will reflect programs funded by MOHLTC, Ministry of
Health Promotion and Ministry of Children and Youth services
Intended audience: Boards of Health, Medical Officers of Health, other public health unit staff, government partners
Target release date: March 2009

Health Unit Profiles
Will present information by peer groups: remote (2), rural (10), urban/rural (12), city centre (4), suburban growth (7) and metro (1)
Most data for the profiles is currently available through existing sources; health units have been asked to provide information on small number of variables
Information on approximately 25 variables to be included in the report
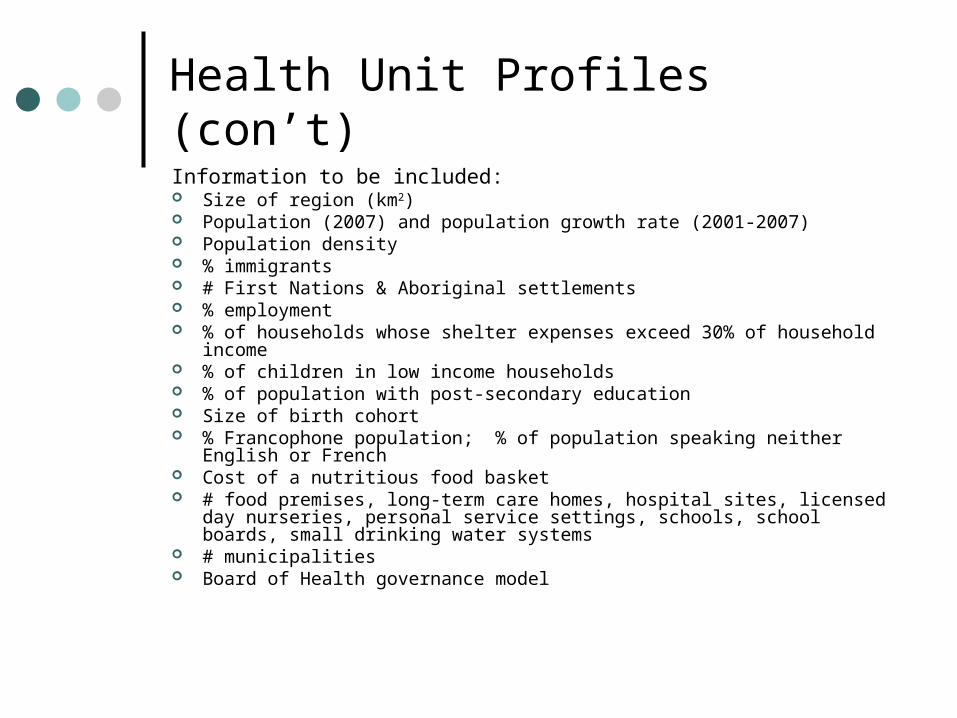
Health Unit Profiles (con’t)
Information to be included: Size of region (km2) Population (2007) and population growth rate (2001-2007) Population density % immigrants # First Nations & Aboriginal settlements % employment % of households whose shelter expenses exceed 30% of household income % of children in low income households % of population with post-secondary education Size of birth cohort % Francophone population; % of population speaking neither English or
French Cost of a nutritious food basket # food premises, long-term care homes, hospital sites, licensed day nurseries,
personal service settings, schools, school boards, small drinking water systems
# municipalities Board of Health governance model
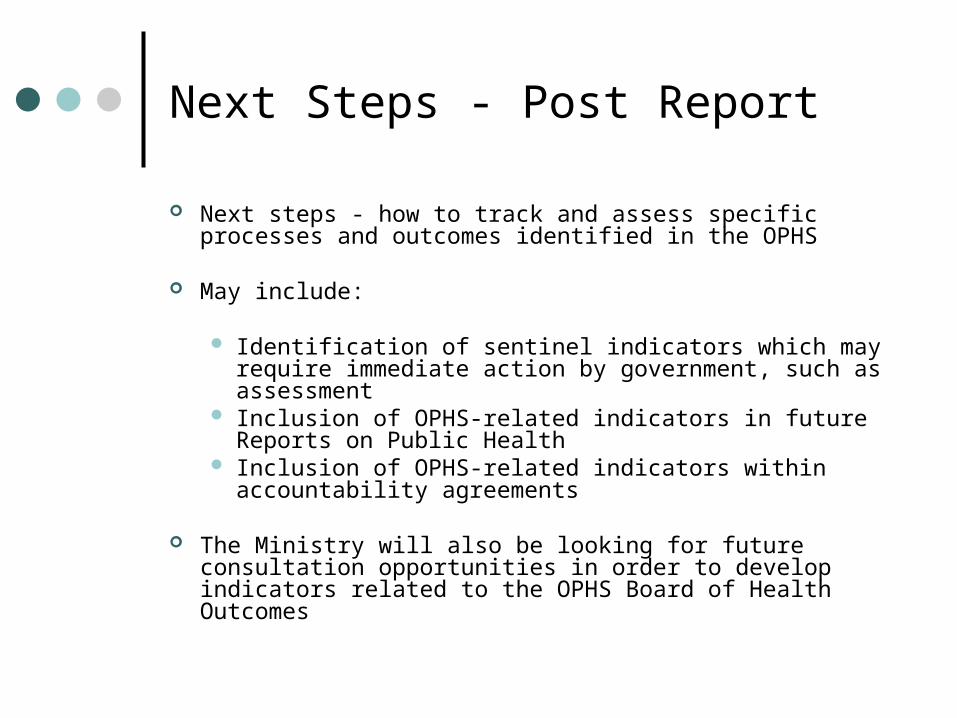
Next Steps - Post Report
Next steps - how to track and assess specific processes and outcomes identified in the OPHS
May include:
Identification of sentinel indicators which may require immediate action by government, such as assessment
Inclusion of OPHS-related indicators in future Reports on Public Health
Inclusion of OPHS-related indicators within accountability agreements
The Ministry will also be looking for future consultation opportunities in order to develop indicators related to the OPHS Board of Health Outcomes

Timelines
Survey underway October 23rd to November 14th
Contact health units to request full case studies
Early December
Case studies to be submitted
January 16th
Health units to verify indicators, survey data and profile information
Mid-January to early February
Report publication March

Implications for APHEO
Inclusion of rationale for the indicator supported by evidence to back up calculation (eg why low birth weight for full-term single births vs just single births)
Inclusion of additional resources (eg how to age standardize the CCHS)
Potential revision of indicators Determination of additional indicators which
may come out of the OPHS

Questions?
Related Documents


