Performance Measurement of a Dairy Supply Chain: A Balance Scorecard Perspective Dr. Gyan Prakash 1 , Mr. R.R.Pant 2 Assistant Professor 1 ABV-Indian Institute of Information Technology and Management Gwalior Gwalior- 474 015 [email protected] 2 PhD Candidate, Aligarh Muslim University, Aligarh, India Abstract—This article presents a case of the Indian dairy supply chain and demonstrates how balance score card (BSC) may be used to measure its performance. There are few studies which use BSC in performance measurement of a food supply chain and no one has used it in the context of the dairy supply chain. In this study, four components of BSC have been adapted to measure various performance related issues pertinent to the dairy supply chain in a State in India. Dairy supply chain practitioners would find this approach useful for value generation across various stages of dairy supply chains. Keywords- Dairy Suply Chain, Performace Measurement, Balance Score Card I. INTRODUCTION A popular management principle states that if you can not measure it, you can not manage it. In today’s dynamic business environment supply chains aim to increase efficiency (lower costs) and effectiveness (provide better service to internal and external customers) of their underlying processes. In order to achieve these objectives, supply chains need to develop performance measurement criterions or metrics to gauge their success in achieving these objectives, thereby, ensuring their survival and sustainable growth. A supply chain consists of various stages wherein the performance of one influences the other. Therefore, in order to measure the performance of a supply chain an integrated performance measurement system (PMS) is required to be developed. This paper explore elements of performance management for the dairy supply chain in the India. Performance management literature is extensively developed form insights derived from developed countries. Literature is not much developed from the perspectives of developing counties like India. This paper contributes to the supply chain management literature by developing indicators for measurement of performance of the dairy supply chain. Next couple of sections present review of literature and the adopted methodology. This is followed by the results and discussion, implication of findings and limitations and scope for future work. II. LITERATURE REVIEW Recent financial crisis and economic slowdown have forced firms to closely examine their internal operations, monitor performance and eliminate hidden inefficiencies across their supply chain processes. Little literature is available on the supply chain management (SCM) Performance. Common methods used for measuring supply chain performance include task specific key performance indicators (KPIs), balanced score cards (BSC) and other supply chain metrics. Various theories and practices [1], preconditions for effective performance measurement [2] and integration of performance metrics across the whole supply chain [3] have been discussed in the literature. Planning frameworks such as supply chain operations reference model (SCOR) based on supply chain processes results in best in class performance with effective planning across plan, buy, make, sell and return activities. Another framework balances financial and non- financial measures to achieve strategic alignment [7]. Overall, the measurement of supply chain performance requires that metrics must be consistent with overall corporate strategy, metrics must focus upon customer needs and expectations and metrics must be context specific. The underlying philosophy behind these metrics must focus upon processes, use a balanced approach in selecting and developing indicators, capture precise cost measurement and use technology to capture operational transactions. The commonly available performance measurement systems (PMSs) suffer from two main limitations when they are used for performance measurement of supply chains. First, their financial accounting principles lack forward looking perspective and measurement is restricted to directly measurable indicators. Secondly, these systems are not suitable for cutting edge SCM applications where performance measurement has to take into account wide range of controlling targets [4]. Moreover, most of the firms lack systems approach in which a supply chain must be viewed as a whole entity and measurement system should span across all stages of the supply chain [5]. Balanced card approach (BSC) was developed as a tool for aligning business activities to the vision and strategy of the organization, improving internal and external communications and monitoring organization’s performance against strategic goals [6, 7]. It includes four performance indicators, namely, customer perspective, internal-business processes, learning and growth and financials [8, 9, 10, 11]. Due to its structure BSC provides not only central control mechanism but also includes mechanism for improvement. 978-1-4799-0986-5/13/$31.00 ©2013 IEEE

Welcome message from author
This document is posted to help you gain knowledge. Please leave a comment to let me know what you think about it! Share it to your friends and learn new things together.
Transcript
Performance Measurement of a Dairy Supply Chain: A Balance Scorecard Perspective
Dr. Gyan Prakash1, Mr. R.R.Pant2 Assistant Professor
1ABV-Indian Institute of Information Technology and Management Gwalior Gwalior- 474 015
[email protected] 2PhD Candidate, Aligarh Muslim University, Aligarh, India
Abstract—This article presents a case of the Indian dairy supply chain and demonstrates how balance score card (BSC) may be used to measure its performance. There are few studies which use BSC in performance measurement of a food supply chain and no one has used it in the context of the dairy supply chain. In this study, four components of BSC have been adapted to measure various performance related issues pertinent to the dairy supply chain in a State in India. Dairy supply chain practitioners would find this approach useful for value generation across various stages of dairy supply chains.
Keywords- Dairy Suply Chain, Performace Measurement, Balance Score Card
I. INTRODUCTION
A popular management principle states that if you can not measure it, you can not manage it. In today’s dynamic business environment supply chains aim to increase efficiency (lower costs) and effectiveness (provide better service to internal and external customers) of their underlying processes. In order to achieve these objectives, supply chains need to develop performance measurement criterions or metrics to gauge their success in achieving these objectives, thereby, ensuring their survival and sustainable growth. A supply chain consists of various stages wherein the performance of one influences the other. Therefore, in order to measure the performance of a supply chain an integrated performance measurement system (PMS) is required to be developed.
This paper explore elements of performance management for the dairy supply chain in the India. Performance management literature is extensively developed form insights derived from developed countries. Literature is not much developed from the perspectives of developing counties like India. This paper contributes to the supply chain management literature by developing indicators for measurement of performance of the dairy supply chain. Next couple of sections present review of literature and the adopted methodology. This is followed by the results and discussion, implication of findings and limitations and scope for future work.
II. LITERATURE REVIEW
Recent financial crisis and economic slowdown have
forced firms to closely examine their internal operations,
monitor performance and eliminate hidden inefficiencies across their supply chain processes. Little literature is available on the supply chain management (SCM) Performance. Common methods used for measuring supply chain performance include task specific key performance indicators (KPIs), balanced score cards (BSC) and other supply chain metrics. Various theories and practices [1], preconditions for effective performance measurement [2] and integration of performance metrics across the whole supply chain [3] have been discussed in the literature. Planning frameworks such as supply chain operations reference model (SCOR) based on supply chain processes results in best in class performance with effective planning across plan, buy, make, sell and return activities. Another framework balances financial and non-financial measures to achieve strategic alignment [7]. Overall, the measurement of supply chain performance requires that metrics must be consistent with overall corporate strategy, metrics must focus upon customer needs and expectations and metrics must be context specific. The underlying philosophy behind these metrics must focus upon processes, use a balanced approach in selecting and developing indicators, capture precise cost measurement and use technology to capture operational transactions.
The commonly available performance measurement
systems (PMSs) suffer from two main limitations when they are used for performance measurement of supply chains. First, their financial accounting principles lack forward looking perspective and measurement is restricted to directly measurable indicators. Secondly, these systems are not suitable for cutting edge SCM applications where performance measurement has to take into account wide range of controlling targets [4]. Moreover, most of the firms lack systems approach in which a supply chain must be viewed as a whole entity and measurement system should span across all stages of the supply chain [5]. Balanced card approach (BSC) was developed as a tool for aligning business activities to the vision and strategy of the organization, improving internal and external communications and monitoring organization’s performance against strategic goals [6, 7]. It includes four performance indicators, namely, customer perspective, internal-business processes, learning and growth and financials [8, 9, 10, 11]. Due to its structure BSC provides not only central control mechanism but also includes mechanism for improvement.
978-1-4799-0986-5/13/$31.00 ©2013 IEEE

Though BSC is an extensively researched topic
however, there are not many studies on its adoption and implementation in the dairy industry. In SCM context also, there are few applications of BSC approach. A modified version of BSC for performance measurement of a supply chain has been used by some authors [12]. Some authors have used BSC model and developed a supply chain performance analysis approach [13]. This study along with other [14] explored logistics function. Some authors developed a BSC model for measuring day-to-day operations of supply chain [4]. Recently, some authors have developed a BSC based framework for performance measurement tailored exclusively for the food supply chain [16].
Nonetheless, other important management principle
to be kept in mind in selecting a performance measurement metrics i.e., - metrics drive behaviour. Unintended behaviours from a specific metric are a common problem. In many cases, metrics result in unplanned consequences that may cause short-time success, but may create other problems.
III. METHODOLOGY
A multiple item scale based on BSC approach has
been proposed for evaluation of performance of the dairy supply chains. The scale is based on four basic dimensions or performance measure perspectives, namely, financial, customer, internal business processes and learning and growth as suggested by earlier researchers [4, 7, 15]. Various KPIs belonging to these four perspectives relevant to the Indian dairy supply chain have been identified though exploratory research and discussions with the domain experts and academicians. Relevant financial and non financial indicators spanning four BSC perspectives and as suitable for the Indian dairy industry have been developed with the help of Delphi technique.
This list of the KPIs based on BSC for evaluation of
performance of dairy supply chains, has been validated through survey of respondents associated with various stages of the dairy supply chain in Madhya Pradesh state in India, namely, dairy farmers, milk collection centres (MCCs), processors, distributors/retailers and end consumers.
The respondents were asked to rate the identified
KPIs on a scale of 1 (not important) to 7 (very important) to find out their ranking and also to rate each BSC perspective by assigning a score ranging from 0 to 10. The list of KPIs belonging to the four perspectives of BSC which has been identified for measurement of performance of the dairy supply chain is depicted in Table I. In another study, the researcher had asked the respondents to rate the indicators proposed in the BSC model on a six point scale 1 (not important at all) and 6 (extremely important) [6]. Similarly, for prioritization of
the BSC perspectives in their model they had asked the respondents to assign scores ranging from 0 to 10.
TABLE I
LIST OF KPIS OF BSC FOR MEASUREMENT OF PERFORMANCE OF DAIRY SUPPLY CHAINS
Internal business processes Customer Financial Learning and growth Purchase order cycle time Customer query time Information processing cost Supplier assistance in solving problems Effectiveness of master production schedule Distribution lead time Supplier cost saving activities Strong R&D Supplier rejection rate Order lead time Variations against budget Buyer- supplier collaboration in problem
solving Total inventory cost Distribution performance Cost per operation hour Order entry method Frequency of delivery Distribution reliability Return on investment Level of information sharing Accuracy of forecasting techniques Quality of delivery goods Net price of products Supply chain collaboration Planned process cycle time Customer perceived value of product Transportation & distribution cost Supplier ability to respond to quality iisuesBackward Integration of processing units in milk procurement and production
Flexibility of service system to meet particular customer needs
Terms of payment PPP model in infrastructure development and cattle extension services
Use of IT and ERP systems Responsiveness to urgent delivery Net sales Training and HRD Use of new technology Effectiveness of distribution planning
schedule Total supply chain cost Corporate social responsibility (CSR)
New product development cycle Distribution network Cultural compatibility Implementation of HACCP and other quality control measures
Compliance to food quality and Codex standards
Innovations
Factory production of indigenous dairy products
Post transaction measures of customer service
Sustainability
Product variety and range Ease of contact Transparency in supply chain Quality check and traceability of incoming milk and raw materials
Supply chain integration Supply Chain Robustness
Capacity utilization To collect data respondents belonging to all the five
different stages of the dairy supply chain were first asked to assign a score of 0 to 10 to the four perspectives of BSC for prioritization for measuring performance. Subsequently, respondents were asked to rate various identified KPIs belonging to each perspective of the BSC as mentioned in Table I on a scale of 1 to 7 for deciding their importance and ranking. Mean values have been used for ranking of indicators and cases of tie have been resolved on the basis of their standard deviation. The questionnaire used for data collection is depicted in annexure.
IV. DISCUSSION
Table II shows results of responses received from respondents belonging to different stages of the dairy supply chain for prioritization of the BSC perspectives. Overall mean was calculated for each perspective based on the calculated mean value for each category of respondents of the dairy supply chain. Standard deviation, σ has also been calculated for each KPI for deciding ranking in case of a tie.
TABLE II
PRIORITIZATION OF BSC PERSPECTIVE (SCORES BETWEEN 0-10)
BSC Perspectives Farmers MCC Processors Distributors/ Retailers Consumers Overall Mean Std Deviation Internal business processes 8 9 10 10 9 9.2 0.837Customers 8 8 10 9 10 9 1.000Financial 7 8 10 9 9 8.6 1.140Learning and growth 7 8 9 9 9 8.4 0.894
Table III to VI shows results of the responses
received from respondents of the dairy supply chain for each identified KPI belonging to the four perspectives of BSC i.e. internal business process, customers, finance and learning and growth respectively. Overall mean for each KPI was calculated based on the calculated mean value for each category of respondents of the dairy supply chain for ranking of the KPIs. Standard deviation, σ has also been calculated for each KPI for deciding ranking in case of a tie. The indicators getting an overall rating of 6 and above for each perspective have been selected in the proposed BSC scale for performance measurement of the dairy supply chain.
Proceedings of the 2013 IEEE IEEM
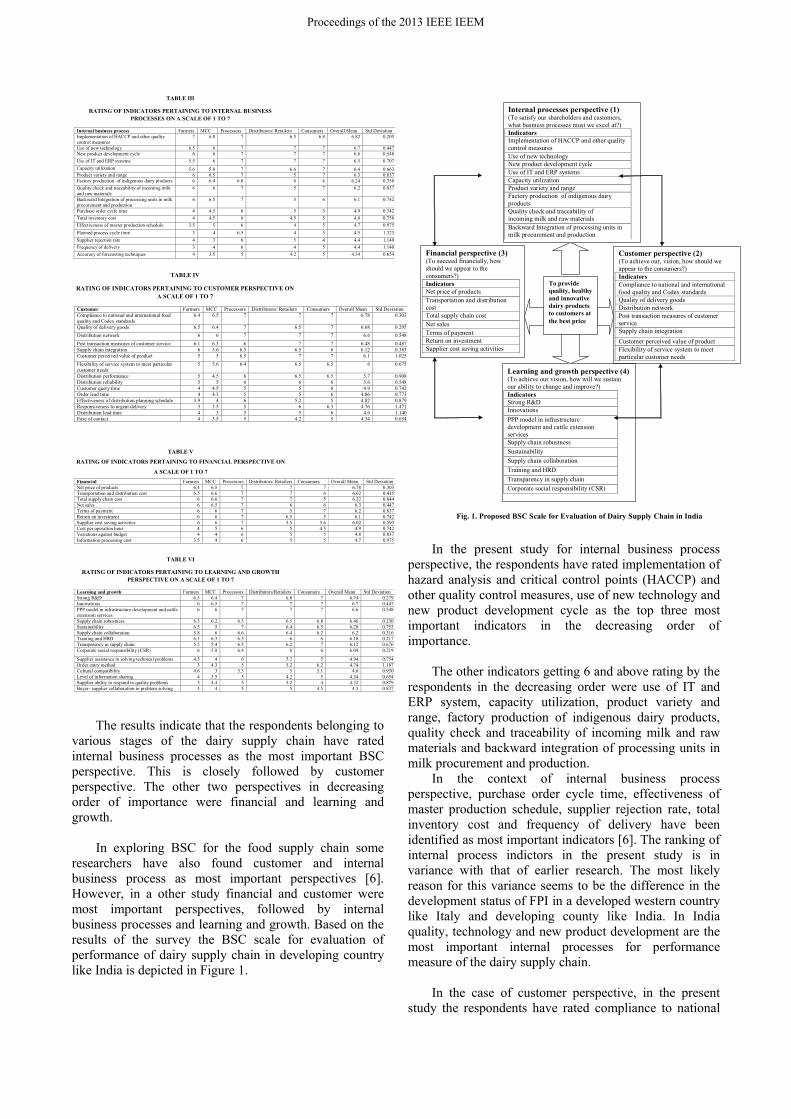
TABLE III
RATING OF INDICATORS PERTAINING TO INTERNAL BUSINESS PROCESSES ON A SCALE OF 1 TO 7
Internal business process Farmers MCC Processors Distributors/ Retailers Consumers Overall Mean Std DeviationImplementation of HACCP and other quality control measures
7 6.8 7 6.5 6.8 6.82 0.205
Use of new technology 6.5 6 7 7 7 6.7 0.447New product development cycle 6 6 7 7 7 6.6 0.548
Use of IT and ERP systems 5.5 6 7 7 7 6.5 0.707
Capacity utilization 5.6 5.8 7 6.6 7 6.4 0.663Product variety and range 6 6.5 7 5 7 6.3 0.837Factory production of indigenous dairy products 6 6.4 6.8 6 6 6.24 0.358
Quality check and traceability of incoming milk and raw materials
6 6 7 5 7 6.2 0.837
Backward Integration of processing units in milk procurement and production
6 6.5 7 5 6 6.1 0.742
Purchase order cycle time 4 4.5 6 5 5 4.9 0.742
Total inventory cost 4 4.5 6 4.5 5 4.8 0.758
Effectiveness of master production schedule 3.5 5 6 4 5 4.7 0.975
Planned process cycle time 3 4 6.5 4 5 4.5 1.323
Supplier rejection rate 4 3 6 5 4 4.4 1.140
Frequency of delivery 3 4 6 4 5 4.4 1.140
Accuracy of forecasting techniques 4 3.5 5 4.2 5 4.34 0.654
TABLE IV
RATING OF INDICATORS PERTAINING TO CUSTOMER PERSPECTIVE ON A SCALE OF 1 TO 7
Customer Farmers MCC Processors Distributors/ Retailers Consumers Overall Mean Std Deviation Compliance to national and international food quality and Codex standards
6.4 6.5 7 7 7 6.78 0.303
Quality of delivery goods 6.5 6.4 7 6.5 7 6.68 0.295
Distribution network 6 6 7 7 7 6.6 0.548
Post transaction measures of customer service 6.1 6.3 6 7 7 6.48 0.487Supply chain integration 6 5.6 6.5 6.5 6 6.12 0.383Customer perceived value of product 5 5 6.5 7 7 6.1 1.025
Flexibility of service system to meet particular customer needs
5 5.6 6.4 6.5 6.5 6 0.675
Distribution performance 5 4.5 6 6.5 6.5 5.7 0.908Distribution reliability 5 5 6 6 6 5.6 0.548Customer query time 4 4.5 5 5 6 4.9 0.742Order lead time 4 4.3 5 5 6 4.86 0.773Effectiveness of distribution planning schedule 3.9 4 6 5.2 5 4.82 0.879Responsiveness to urgent delivery 3 3.5 5 6 6.3 4.76 1.471Distribution lead time 4 3 5 5 6 4.6 1.140Ease of contact 4 3.5 5 4.2 5 4.34 0.654
TABLE V
RATING OF INDICATORS PERTAINING TO FINANCIAL PERSPECTIVE ON
A SCALE OF 1 TO 7
Financial Farmers MCC Processors Distributors/ Retailers Consumers Overall Mean Std DeviationNet price of products 6.4 6.5 7 7 7 6.78 0.303Transportation and distribution cost 6.5 6.6 7 7 6 6.62 0.415Total supply chain cost 6 6.6 7 7 5 6.32 0.844Net sales 6 6.5 7 6 6 6.3 0.447Terms of payment 6 6 7 5 7 6.2 0.837Return on investment 6 6 7 6.5 5 6.1 0.742Supplier cost saving activities 6 6 7 5.5 5.6 6.02 0.593Cost per operation hour 4 5 6 5 4.5 4.9 0.742Variations against budget 4 4 6 5 5 4.8 0.837Information processing cost 3.5 4 6 5 5 4.7 0.975
TABLE VI
RATING OF INDICATORS PERTAINING TO LEARNING AND GROWTH PERSPECTIVE ON A SCALE OF 1 TO 7
Learning and growth Farmers MCC Processors Distributors/Retailers Consumers Overall Mean Std Deviation Strong R&D 6.5 6.4 7 6.8 7 6.74 0.279Innovations 6 6.5 7 7 7 6.7 0.447PPP model in infrastructure development and cattle extension services
6 6 7 7 7 6.6 0.548
Supply chain robustness 6.3 6.2 6.5 6.5 6.8 6.46 0.230Sustainability 6.5 5 7 6.4 6.5 6.28 0.753Supply chain collaboration 5.8 6 6.6 6.4 6.2 6.2 0.316Training and HRD 6.1 6.3 6.5 6 6 6.18 0.217Transparency in supply chain 5.5 5.4 6.5 6.2 7 6.12 0.676Corporate social responsibility (CSR) 6 5.8 6.4 6 6 6.04 0.219
Supplier assistance in solving technical problems 4.5 4 6 5.2 5 4.94 0.754Order entry method 3 4.3 5 5.2 6.2 4.74 1.187Cultural compatibility 4.6 3 5.3 5 5.1 4.6 0.930Level of information sharing 4 3.5 5 4.2 5 4.34 0.654Supplier ability to respond to quality problems 3 4.4 5 5.2 4 4.32 0.879Buyer- supplier collaboration in problem solving 3 4 5 5 4.5 4.3 0.837
The results indicate that the respondents belonging to
various stages of the dairy supply chain have rated internal business processes as the most important BSC perspective. This is closely followed by customer perspective. The other two perspectives in decreasing order of importance were financial and learning and growth.
In exploring BSC for the food supply chain some
researchers have also found customer and internal business process as most important perspectives [6]. However, in a other study financial and customer were most important perspectives, followed by internal business processes and learning and growth. Based on the results of the survey the BSC scale for evaluation of performance of dairy supply chain in developing country like India is depicted in Figure 1.
Fig. 1. Proposed BSC Scale for Evaluation of Dairy Supply Chain in India
To provide quality, healthy and innovative dairy products to customers at the best price
Customer perspective (2) (To achieve our, vision, how should we appear to the consumers?) Indicators Compliance to national and international food quality and Codex standards Quality of delivery goods Distribution network Post transaction measures of customer service Supply chain integration
Customer perceived value of product Flexibility of service system to meet particular customer needs
Financial perspective (3) (To succeed financially, how should we appear to the consumers?) Indicators Net price of products Transportation and distribution cost Total supply chain cost Net sales Terms of payment Return on investment Supplier cost saving activities
Internal processes perspective (1) (To satisfy our shareholders and customers, what business processes must we excel at?) Indicators Implementation of HACCP and other quality control measures Use of new technology New product development cycle Use of IT and ERP systems Capacity utilization Product variety and range Factory production of indigenous dairy products Quality check and traceability of incoming milk and raw materials Backward Integration of processing units in milk procurement and production
Learning and growth perspective (4) (To achieve our vision, how will we sustain our ability to change and improve?) Indicators Strong R&D Innovations
PPP model in infrastructure development and cattle extension services Supply chain robustness
Sustainability
Supply chain collaboration
Training and HRD
Transparency in supply chain
Corporate social responsibility (CSR)
In the present study for internal business process
perspective, the respondents have rated implementation of hazard analysis and critical control points (HACCP) and other quality control measures, use of new technology and new product development cycle as the top three most important indicators in the decreasing order of importance.
The other indicators getting 6 and above rating by the
respondents in the decreasing order were use of IT and ERP system, capacity utilization, product variety and range, factory production of indigenous dairy products, quality check and traceability of incoming milk and raw materials and backward integration of processing units in milk procurement and production.
In the context of internal business process perspective, purchase order cycle time, effectiveness of master production schedule, supplier rejection rate, total inventory cost and frequency of delivery have been identified as most important indicators [6]. The ranking of internal process indictors in the present study is in variance with that of earlier research. The most likely reason for this variance seems to be the difference in the development status of FPI in a developed western country like Italy and developing county like India. In India quality, technology and new product development are the most important internal processes for performance measure of the dairy supply chain.
In the case of customer perspective, in the present
study the respondents have rated compliance to national
Proceedings of the 2013 IEEE IEEM
and international food quality and codex standards, quality of delivered goods and distribution network as the first three most important indicators in the decreasing order of importance. The other indicators getting 6 and above rating by the respondents in the decreasing order were post transaction measures of customer service, supply chain integration, customer perceived value of product and flexibility of service system to meet particular customer needs.
In the context of customer perspective, customer
query time, order lead time, distribution lead time, distribution performance, distribution reliability, effectiveness of distribution and planning schedule and quality of delivered goods have been identified as most important indicators. The ranking of indictors in the present study is in variance with that of earlier research. This also most probably could be attributed to difference in the development status of the FPI in developed and developing countries. In India the quality and distribution network of dairy products are important performance factors pertinent to customer perspective due to lack of investments, resources and infrastructure facilities.
In case of financial perspective, in the present study the respondents have rated net price of products, transportation and distribution cost and total supply chain cost as the top three most important indicators in the decreasing order of importance. The other indicators getting 6 and above rating by the respondents in the decreasing order were net sales, terms of payment, return on investment and supplier cost saving activities. In the context of financial perspective, information carrying cost and supplier cost saving activity have been identified as most important indicators. This is followed by variations against budget and cost per operation hour. There is difference in ranking of financial indicators between present study and those of the previous research. This could be that in India the final product quality, technology, cost of the product and supply chain are important factors measuring performance of dairy supply chain. However, in the developed countries the emphasis is on cost reduction.
In the case of learning and growth perspective, the
respondents have rated strong research and development (R&D), innovations and PPP model in infrastructure development and cattle extension services as the first three most important indicators in the decreasing order of importance. The other indicators getting 6 and above rating by the respondents in the decreasing order were supply chain robustness, sustainability, supply chain collaboration, training and HRD, transparency in supply chain and corporate social responsibility (CSR). In a previous study conducted in a developed country, learning and growth perspective, collaboration with the supply chain players, that is, supplier assistance in solving technical problems, supplier ability to respond to quality problems and buyer supplier collaboration in problem solving have been identified as most important indicators.
In developing countries like India R&D, innovation and PPP model are important performance for the dairy supply chain, where as collaboration between buyer and supplier in problem solving is the main concern in the developed countries.
V. CONCLUSIONS
This paper identified various indicators for four perspectives of BSC. These indicators may be used for measurement of the dairy supply chain performance in developing countries. Findings of the study suggest that importance of various BSC perspectives is different from that identified in the context of a developed country. These differences arise because of differences in available infrastructure, variable milk production, poor breed of cattle, poor consolidation during sourcing, unavailability of cold transportation infrastructure, and poor flow of information. These inherent challenges results in fragmentation of the Indian dairy supply chain. Building sourcing capabilities, developing robustness in operations, building transparency and managing traceability and information flow would transform processing competencies of the Indian dairy operators.
Dairy practitioners may use identified indicators for
measurement of their performance. This study has some inherent limitations. Data have been collected from only one state in the India. A study spanning across various states would strengthen generalization of findings. Future researchers may conduct similar studies in other developing countries for validation and updation of performance indicators.
REFERENCES
[1] B.M. Beamon, “Managing supply chain performance” International Journal of Operations and Production Management, vol. 19, no.3, pp.275-292, 1999.
[2] C. Morgan, “Structure, speed and resilience: performance measurement in the supply chain”, Business Process Management Journal, vol.10, no.5, pp.522-536, 2004.
[3] A. Gunasekaran, C., Patel, and E. Tirtiroglu, “A framework for supply chain performance measurement”, International Journal of Production Economics, vol. 87, no.3, pp.333-347, 2004.
[4] Bhagwat, R. and Sharma, M.K. “Performance measurement of supply chain management: a balanced measurement method”, Computers & Industrial Engineering, vol. 53 no. 1, pp. 43-62, 2007.
[5] F.T.S. Chan, “Performance measurement in a supply chain”, International Journal of Advanced Manufacturing Technology, vol.21 no.7, pp. 534-548, 2003.
[6] R.S. Kaplan, and R. Cooper, Cost & Effect: Using Integrated Cost Systems to Drive Profitability and Performance, Mass Harvard Business School Press, Cambridge, 1997.
Proceedings of the 2013 IEEE IEEM
[7] R.S. Kaplan, and D.P. Norton, “The balanced scorecard- measures that derive performance”, Harvard Business Review, vol.70 no. 1, pp.71-79, 1992.
[8] R.S. Kaplan, and D.P. Norton, “Putting the balanced scorecard to work”, Harvard Business Review, vol.71 no. 5, pp.134-147, 1993.
[9] R.S. Kaplan, and D.P. Norton, “Using the balanced scorecard as a strategic management system”, Harvard Business Review, vol.74 no. 1, pp.75-85, 1996.
[10] R.S. Kaplan, and D.P. Norton, “Transforming the balanced scorecard from performance measurement to strategic management part 1”, Accounting Horizons, vol.15 no. 1, pp.87-104., 2001a.
[11] R.S. Kaplan, and D.P. Norton, “Transforming the balanced scorecard from performance measurement to strategic management part 2”, Accounting Horizons, vol.15 no. 1, pp.147-160, 2001b.
[12] P.C. Brewer, and T.W. Sfeh, “Using balanced scorecard measure supply chain performance”, Journal of Business Logistics, vol.21 no.1, pp.75-93, 2000.
[13] H.J. Bullinger, M. Kuehner, and A. Van Hoof, “Analysing supply chain performance using a balanced measurement method”, International Journal of Production Research, vol. 40 no.15, pp. 3533-3543, 2002.
[14] J.H, Park, J.K. Lee, and Y.S. Yoo, “A framework for designing the balanced supply chain scorecard”, European Journal of Information Systems, vol.14 no. 4, pp.335-346, 2005.
[15] R. Bhagwat, and T.W. Sfeh, “Performance measurement of supply chain management: a balanced approach: Computers & Industrial Engineering, vol.50, no.1, pp.43-62, 2007.
Annexure
Kindly give scores to following components of balance score card (BSC) for measurement of performance of dairy supply chain on a scale of 0 (minimum) to 10 (maximum). BSC Perspectives Score between 0-10 Internal business processes Customers Financial Learning and growth
Rate the following indicators of financial perspective of BSC for measuring performance of dairy supply chain on a scale of 1 (not important) to 7 (very important).
Financial perspective Score between 1-7 Net price of products Transportation and distribution cost Total supply chain cost Net sales Terms of payment Return on investment Supplier cost saving activities Cost per operation hour Variations against budget Information processing cost
Rate the following indicators of internal business processes perspective of BSC for measuring performance of dairy supply chain on a scale of 1 (not important) to 7 (very important). Internal business process perspective Score between 1-7 Implementation of HACCP and other quality control measures Use of latest technology New product development cycle Use of IT and ERP systems Capacity utilization Product variety and range Factory production of indigenous dairy products
Quality check and traceability of incoming milk and materials
Backward Integration of processing units in milk procurement and production
Purchase order cycle time Total inventory cost Effectiveness of master production schedule Planned process cycle time Supplier rejection rate Frequency of delivery Accuracy of forecasting techniques
Rate the following indicators of customer perspective of BSC for measuring performance of dairy supply chain on a scale of 1 (not important) to 7 (very important). Customer perspective Score between 1-7 Compliance to national and international food quality and Codex standards Quality of delivery goods
Distribution network Post transaction measures of customer service Supply chain integration Customer perceived value of product
Flexibility of service system to meet particular customer needs Distribution performance Distribution reliability Customer query time Order lead time Effectiveness of distribution planning schedule Responsiveness to urgent delivery Distribution lead time Ease of contact
Rate the following indicators of learning and growth perspective of BSC for measuring performance of dairy supply chain on a scale of 1 (not important) to 7 (very important). Learning and growth Score between 1-7 Strong R&D Innovations PPP model in infrastructure development and cattle extension services Supply chain robustness Sustainability Supply chain collaboration Training and HRD Transparency in supply chain Corporate social responsibility (CSR) Supplier assistance in solving technical problems Order entry method Cultural compatibility Level of information sharing Supplier ability to respond to quality problems Buyer- supplier collaboration in problem solving
Proceedings of the 2013 IEEE IEEM
Related Documents


![SEMESTRÁLNY PROJEKT ZO STRATEGICKÉHO …scss.sk/smpmcd/files/semestralne_projekty1/strategicky manazment... · Fayol, alej aj už spomínaný Alfred Sloan. [3] Z hľadiska teórie](https://static.cupdf.com/doc/110x72/5b978dd609d3f25a5a8ce4eb/semestralny-projekt-zo-strategickeho-scsssksmpmcdfilessemestralneprojekty1strategicky.jpg)

