Performance Measurement for Business Development Services A Preliminary Framework

Welcome message from author
This document is posted to help you gain knowledge. Please leave a comment to let me know what you think about it! Share it to your friends and learn new things together.
Transcript

PerformanceMeasurement forBusinessDevelopmentServices
A PreliminaryFramework
Performance Measurement for BusinessDevelopment Services:
A Preliminary Framework
by
Mary McVayDevelopment Alternatives, Inc.
August 1999
This work was supported by the U.S. Agency for International Development, Bureau forGlobal Programs, Center for Economic Growth and Agricultural Development, Office ofMicroenterprise Development, through funding to the Microenterprise Best Practices (MBP)Project, contract number PCE-0406-C-00-90004-00.

Mary McVay has over 10 years of experience in microenterprise development in Africa, Asia, and the UnitedStates. She launched the first product development workshops for microentrepreneurs in Kenya with theUndugu Society of Kenya in 1989. As Monitoring and Evaluation Officer with USAID/Kenya, she evaluatedmicroenterprise programs and designed a $25 million microenterprise development project with a subsectordevelopment component. With CARE and the Small Enterprise Education and Promotion Network in 1996, shewrote one of the first frameworks for defining business development services and launched CARE’s Manual forthe Design and Implementation of Subsector Programs.
Acknowledgments
i
ACKNOWLEDGMENTS
The development of this performance measurement framework was dependent on theparticipation of business development services practitioners, donors, and researchers aroundthe world who generously shared their program evaluation guidelines, project documents,and feedback. The Business Development Services Working Group of the Small EnterpriseEducation and Promotion (SEEP) Network and the USAID Office of MicroenterpriseDevelopment gave essential feedback to the draft framework at the annual SEEP meeting andat later reviews. Nhu-An Tran, Communications Coordinator for the Microenterprise BestPractices Project at Development Alternatives, Inc., skillfully managed the solicitation andcollection of documents and facilitated the distribution of drafts to SEEP members and otherreviewers. Candace Nelson and Joan Parker made significant contributions to selectingindicators, synthesizing existing indicators into innovative new tools, and soliciting inputfrom SEEP members. The paper also benefited from the suggestions of Jack Levitsky beforeits presentation at the Committee of Donor Agencies for Small Enterprise DevelopmentConference in Brazil. Clare Tawney of Intermediate Technology Publications providededitorial assistance as well.
This project is the brainchild of Marshall Bear, without whose intellectual vision, practicalsupport, and extensive input into content and format the performance indicators would notexist. The author takes full responsibility for any errors or omissions in the paper and looksforward to further collaboration with business development services practitioners, donors,and researchers in the development and application of the performance measurementframework.

Microenterprise Best Practices Development Alternatives, Inc.
ii
iii
TABLE OF CONTENTS
EXECUTIVE SUMMARY ix
CHAPTER ONEINTRODUCTION 1
RATIONALE...................................................................................................................... 1RESEARCH METHOD......................................................................................................... 2
Gathering Sample Indicators................................................................................ 2Selecting Indicators ............................................................................................. 3Summarizing the Issues ....................................................................................... 4Assembling the Framework ................................................................................. 4Input from Practitioners ....................................................................................... 4Partnership with the Committee of Donor Agencies on Small Enterprise Development .................................................................................................. 5Next Steps ........................................................................................................... 5
CHAPTER TWOPERFORMANCE MEASUREMENT FRAMEWORK AND CORE INDICATORS 7
FRAMEWORK OVERVIEW.................................................................................................. 7General Issues in BDS Performance Measurement ............................................ 10
SCALE .......................................................................................................................... 11Proposed Indicators (level) ................................................................................ 11Proposed Methodology ...................................................................................... 12Issues with Measuring Scale .............................................................................. 13
OUTREACH .................................................................................................................... 15Proposed Indicators (level) ................................................................................ 15Proposed Methodology ...................................................................................... 15Issues with Measuring Outreach ........................................................................ 16
IMPACT.......................................................................................................................... 17Proposed Indicators ........................................................................................... 17Proposed Methodology ...................................................................................... 18Issues with Measuring Impact............................................................................ 19
COST-EFFECTIVENESS .................................................................................................... 21Proposed Indicators (level) ................................................................................ 21Proposed Methodology ...................................................................................... 21Issues with Measuring Cost-Effectiveness ......................................................... 22
SUSTAINABILITY ............................................................................................................ 24Proposed Indicators (level) ................................................................................ 24Proposed Methodology ...................................................................................... 25Issues with Measuring Sustainability ................................................................. 27
iv
CHAPTER THREENEXT STEPS 29LONG-TERM APPLICATIONS FOR THE BDS PERFORMANCE MEASUREMENT
FRAMEWORK............................................................................................................. 30
BIBLIOGRAPHY 33
ANNEX I: DEFINITION OF TERMS I-1
ANNEX II: EXAMPLE CASES OF PERFORMANCE INDICATORSIN USE II-1
ANNEX III: ORGANIZATIONS AND INDIVIDUALS CONSULTED III-1
ANNEX IV: MBP PUBLICATIONS SERIES IV-1
v
LIST OF TABLES AND FIGURES
Table Page
1 Summary of BDS Performance Measurement Framework ................................... 9
2 Examples of Scale Indicators in Use .................................................................. 14
3 Examples of Outreach Indicators in Use ............................................................ 16
4 Examples of Impact Indicators in Use................................................................ 20
5 Examples of Cost-Effectiveness Indicators in Use ............................................. 23
6 Examples of Sustainability Indicators in Use ..................................................... 28
Figure
1 Sample Format for Report on Program Scale ..................................................... 12
2 Sample Impact Report, Product Development Training...................................... 18
3 Suggested Standard Business Benefits Assessment Survey Questions................ 19
4 Sample Cost-Effectiveness Report, Product Development Training ................... 22
5 Sample Report on Sustainability ........................................................................ 26
6 Proposed Sustainability Indicator, Market Level ................................................ 26

vi

Acronyms List
vii
ACRONYMS LIST
ApproTEC Appropriate Technologies for Enterprise Creation
ATI Appropriate Technology International
BDS Business Development Services
BRAC Bangladesh Rural Action Committee
IDB Inter-American Development Bank
IDE International Development Enterprises
ILO International Labour Organization
ITDG Intermediate Technology Development Group
K-MAP Kenya Management Assistance Programme
MEDA Mennonite Economic Development Agency
MBP Microenterprise Best Practices Project
MSE Micro and Small Enterprises
NGO Nongovernmental Organization
SEEP Small Enterprise Education and Promotion Network
SEWA Self-Employed Women’s Association
SIYB Start and Improve Your Business
USAID Unites States Agency for International Development
WWB Women’s World Banking

Microenterprise Best Practices Development Alternatives, Inc.
viii
Chapter One—Introduction
1
CHAPTER ONEINTRODUCTION
RATIONALE
The Microenterprise Best Practices (MBP) Project is taking the lead in proposing anappropriate, practical, and valid mix of indicators that can be used to compare theperformance of business development services (BDS) across a wide range of serviceinterventions and country contexts. This paper presents a framework for measuring theperformance of business development services.
Defining performance standards for business development services that distinguish betweenbest and mediocre practices presents the field with a major challenge partly because of thecomplexity of bridging constraints to business growth in any economic system and partlybecause the BDS field is young. It is still in its introductory stage and its stakeholders—donors and practitioners—use non-standard indicators to measure performance. Thecomplexity of this challenge, however, has been mitigated to an extent by a generalagreement among BDS organizations and donors on the core principles that underlie goodbusiness development services. Principles that are well established include:
# Business-like and demand-led services;
# Services tailored to benefit the client;
# Cost recovery of services and overall program cost-effectiveness; and
# Delivery mechanisms for maximizing outreach and sustainable service access formicroenterprises over time.
Although these principles serve as helpful guides, BDS practitioners, funders, andmicroenterprise supporters in general recognize the urgent need to move beyond principlesand to define best practices and standards in BDS programs. Establishing measurementsystems that define better performing programs is a fundamental first step in identifying thepractices that contribute to positive outcomes.
This framework builds on previous MBP work in conceptualizing BDS research priorities inrelation to describing good practice in BDS programs and moving the field towards bestpractices. Clifton Barton’s paper, “Defining Institutional Options and Indicators ofPerformance,” recognized the importance of identifying performance indicators that gobeyond measuring the effects of delivering specific services and including the effects ofaddressing broader growth and business constraints. Marshall Bear’s paper,“Commercializing BDS for Micro and Small Enterprises (MSEs),” which focused MBPresearch investments on practitioners of good principles, defined specific research activitiesand identified a set of key questions to assess provider performance. The framework
Microenterprise Best Practices Development Alternatives, Inc.
2
presented here lays out specific performance indicators that may be used to select bestpractice cases for further analysis.
The framework complements current research taking place around the globe. First,practitioners have been innovating in both BDS program design and program evaluation.This framework is fundamentally based on practitioner innovations. Its contribution is insynthesizing the best of these innovations into core indicators, while still encouraginginnovation in indicator selection and use. Second, the Committee of Donor Agencies forSmall Enterprise Development’s Business Development Services Working Group hasfacilitated a series of case studies of business development services around the world. Thesehave been presented at conferences in Zimbabwe and Brazil. A third conference is scheduledfor the year 2000 in Vietnam, which will focus on Asia. This research, which includes casestudies, design presentations, and analytical work, is creating a significant body of literatureon BDS. Finally, the Small Enterprise Education and Promotions (SEEP) Network isengaged in research focusing on marketing services for microenterprises. The performancemeasurement system presented here is a tool to help practitioners and researchers objectivelyassess performance of BDS programs so that best practices can be distilled from betterperforming programs.
RESEARCH METHOD
This framework is based on existing performance indicators and methodologies: It is a “bestpractices” synthesis of program evaluation tools in use by BDS programs around the globe. Itwas assembled using the following process.
Gathering Sample Indicators
The research began with solicitation, review, and assessment of existing literature, programevaluations, guidelines, and practices in BDS performance measurement. Thirtyorganizations, in addition to the SEEP Business Development Services Working Group andall USAID missions, received solicitations for evaluation material. More than 50 cases wereexamined. Seventeen were used as examples throughout the framework to give the indicatorscontext and show how they were applied. These cases were equally distributed in Asia,Africa, and Latin America, with several representing Eastern Europe and the United States.The cases were fairly evenly distributed across three major interventions: training,technology, and marketing services. Policy advocacy and infrastructure services are severelyunderrepresented. Half of the programs were sector-based programs that offered severalservices; half also offered credit. Although the data presented are indicative of general levelsof performance achieved, some of the evaluations are old, and programs have clearlyachieved additional impact since the evaluations were completed. Therefore, the examplesused in the framework should be viewed as how performance indicators are used, andnot as up-to-date reports of the level of success achieved by the particular programs.The research method was particularly dependent on the supply of good evaluation materialfrom practitioners and BDS researchers.
Chapter One—Introduction
3
Selecting Indicators
Indicators were selected according to the following criteria:
Performance indicators standardized across a broad mix of business developmentservices. The intention was to assemble a set of indicators that can be used to compareopportunities and costs of different services and service mixes against a broad set of goalsthat all microenterprise development projects work toward. Although BDS projects maydiffer in terms of client focus, service mix, and delivery mechanisms, this frameworksuggests that these measures should be standardized for all BDS projects for four reasons.First, standard measures allow comparisons across service lines so that the field can betterunderstand the nature of demand for business development services that micro and smallenterprises value and pay for. The efforts to delineate clearly among business developmentservices have had only moderate success, in part because a significant portion of BDSprograms combine services. This practice obscures efforts to analyze the impact of individualservices and may dilute a central focus on the client. Second, both donors and researcherstend to group BDS programs together. Developing performance indicators comparable acrossservices responds to stakeholders who currently think of them as one type of program. Third,the cost and complexity of developing indicators for specific services are beyond theresources currently available to the field. Recognizing the value of service-specificindicators, this framework establishes mechanisms to help these indicators emerge fromadditional performance reporting and analysis in the long run. Lastly, the framework does notimply that all BDS programs will be held to the same performance standards, only that theywill be measured by these common indicators.
Comparable across program size and maturity. Given the high level of innovation in BDSprogramming, new and pilot programs are often a good reflection of best practices, yet theyoften perform poorly compared to programs that are older or that have had an opportunity toscale up or replicate. The framework attempts to select indicators that will reflect somestrong performance, even if a program is new or small in scope.
User friendly. The framework is intended to be practical, with indicators, methods, and toolsthat a wide range of BDS practitioners, even those with limited budgets and skills, can use.The strategy for selecting these was to ensure that practitioners with limited evaluationcapacity or resources could use them.
Valid. The indicators selected should be true and accurate representatives of achievementtoward a particular goal. It should not be easy to manipulate data to show a positive outcome,and the methodologies should generate objective, comparable data. This led the frameworktoward a quantitative approach.
Multiple uses for both evaluating performance and learning from practice. In thissystem, the indicators proposed and the information collected on benefits and costs can beput to multiple uses. They can be used not only to evaluate end results but also to design,monitor, and re-design BDS offerings in line with an understanding of BDS within a marketcontext. Proposed indicators track the process of acquisition, use, and benefits of delivered
Microenterprise Best Practices Development Alternatives, Inc.
4
services on both MSE customers and BDS providers. By tracking this process, BDSprograms can assess their effectiveness in satisfying existing customers and buildingadditional demand for relevant services. The chosen indicators are quantified so thatpractitioners can track actual against intended outcomes at each stage in the process.
Incentives for good practice. The indicators, if used as targets, should encourage BDSprograms to seek positive outcomes. For example, BDS programs should move away fromgeneralized constraint analysis to assessing the demand for the service. Impact indicatorsshould focus not on general economic benefits but rather on helping BDS providers deliverservices that are in high demand, that people value, and that people can benefit from.
Summarizing the Issues
Once BDS cases were assembled and indicator selection criteria were reviewed, the issuesfacing BDS performance measurement were considered and summarized. These issues havechallenged the BDS field for over a decade. The framework attempts to resolve, or workaround, many of these, such as identifying comparable indicators across services, identifyingthe appropriate unit for analyzing scale and sustainability in programs with complexinstitution arrangements, and measuring enterprise-level effects and the broader impact onreducing poverty or increasing economic growth. Others remain unresolved and invite furtherconsideration and input: whether subsidized activities are needed and if so for how long,whether the entrepreneur’s perspective on benefits and attribution is sufficient, and how toallocate costs to different program activities. Both resolved and unresolved issues areaddressed in the detailed description of the framework.
Assembling the Framework
The indicators were assembled into a summary matrix (see Table 1). The table is followed bya detailed description of the indicators and a list of the methodological tools that need to bedeveloped.
Input from Practitioners
This paper was presented to SEEP at its annual membership meeting in October 1998 inWashington, D.C. SEEP is an association of North American-based nongovernmentalorganizations that support microenterprise development in developing countries. SEEP’sWorking Group on Business Development Services provided essential input into theframework, which was subsequently modified into its current form.
Chapter One—Introduction
5
Partnership with the Committee of Donor Agencies for Small EnterpriseDevelopment
This paper was presented at the Committee of Donor Agencies for Small EnterpriseDevelopment Conference on Business Development Services in Brazil in March 1999. At theconference, the committee decided to take on the task of developing a common performancemeasurement framework and to use this framework as a starting point. The InternationalLabour Organization agreed to facilitate this process along with USAID. The first event willbe a virtual conference on performance measurement to be held in May 1999.
Next Steps
This proposed framework invites stakeholder involvement from BDS organizations anddonors in further refining the measurement system through interactive dialogue and fieldtesting. There are four immediate steps to finalizing and applying this performancemeasurement framework:
1. USAID’s and the Committee of Donor Agencies for Small Enterprise Development’ssponsorship of a virtual conference to refine the framework further with additionalpractitioner, donor, and researcher input. Participants will be presented with theframework and given an opportunity to raise concerns, suggest solutions to key issuesalready identified and present new issues, suggest additional cases and indicators to theframework, further develop practical and valid methodologies for assessing theindicators, exchange views about performance measurement, and develop a deeperunderstanding of the rational of performance measurement choices made in theframework. One outcome of the conference will be a guide for developing case studiesusing the framework for the committee to use in preparing cases for the next conferencein Hanoi.
2. Developing specific tools for using the framework. A glossary of definitions ofcommon terms, guidance on allocating costs, and customer survey instruments must beeither adopted from existing practice or developed to use with this framework.
3. Field testing the framework with BDS practitioners. The new tools and the frameworkas a whole will require a trial run. This may come in two forms: (1) MBP will formpartnerships with numerous practitioners who agree to incorporate their existing data intothe framework to see how readily it can be applied to existing evaluation systems and (2)MBP will form partnerships with several practitioners to test the framework by collectingraw data from clients.
4. Presenting the refined framework at the Committee of Donor Agencies for SmallEnterprise Development Conference in Hanoi in 2000.

Microenterprise Best Practices Development Alternatives, Inc.
6
7
Chapter Two—Performance Measurement Framework And Core Indicators
CHAPTER TWOPERFORMANCE MEASUREMENT FRAMEWORK
AND CORE INDICATORS
FRAMEWORK OVERVIEW
The MBP performance measurement framework proposes a set of indicators andmethodologies for collecting and reporting performance information for BDS programsfocused on microenterprises. The framework is presented in a summary matrix, followed bya detailed description of each category of indicators. Although the framework hasimplications for establishing best practice standards, it does not contain implicit performancestandards, nor does it contain biases towards any particular type of BDS or implementationmethodology. The particular level of performance that is appropriate for each type of BDSmay be established later. In addition, there is no attempt at this stage to prioritize theimportance of various indicators. Instead, the framework proposes a wide range of indicators,based on practice, that should capture a wide range of benefits.
The framework categorizes these indicators according to common goals that BDS programsseek to achieve and common players that they hope to affect. The goals and objectivesobserved to be important to BDS practitioners and donors include:
# Reaching large numbers of people (scale);
# Reaching under-served markets, particularly the poor (outreach);
# Improving people’s lives through poverty alleviation and enterprise growth (impact);
# Providing or facilitating business development services at the least possible cost (cost-effectiveness); and
# Ensuring that services and benefits continue in the long run (sustainability).
In addition, the framework is organized around four groups of players that practitioners anddonors typically analyze:
# Customers, usually entrepreneurs or farmers, are those being served or are benefitingfrom the service.
# Service providers directly interact with customers to supply the service. They may beprivate businesses, government agencies, nongovernmental organizations (NGOs), orcooperatives.
# The service facilitator designs and develops the service and raises and manages funds todo so. This player is usually, but not necessarily, an NGO or government agency.
8
Microenterprise Best Practices Development Alternatives, Inc.
# Sometimes the facilitator also is the provider, depending on the service delivery channelsbeing established. These two functions are separated in the framework, however, toreflect the many programs that have both players and the implications that these differentroles have on sustainability; and
# The market is defined as the general population of people exchanging goods and serviceswhose businesses might be affected by the introduction of the service into theircommercial lives. Often, BDS programs attempt to demonstrate the commercial viabilityof a service, for example, in the hope that others will copy and replicate it throughout themarket.
The framework examines relevant goal categories for each player being assessed or eachlevel of analysis. In the summary matrix (Table 1), the goal categories are on the vertical axisand the player is on the horizontal. The boxes in the body of the matrix summarize theproposed indicators for each goal category and beneficiary level.
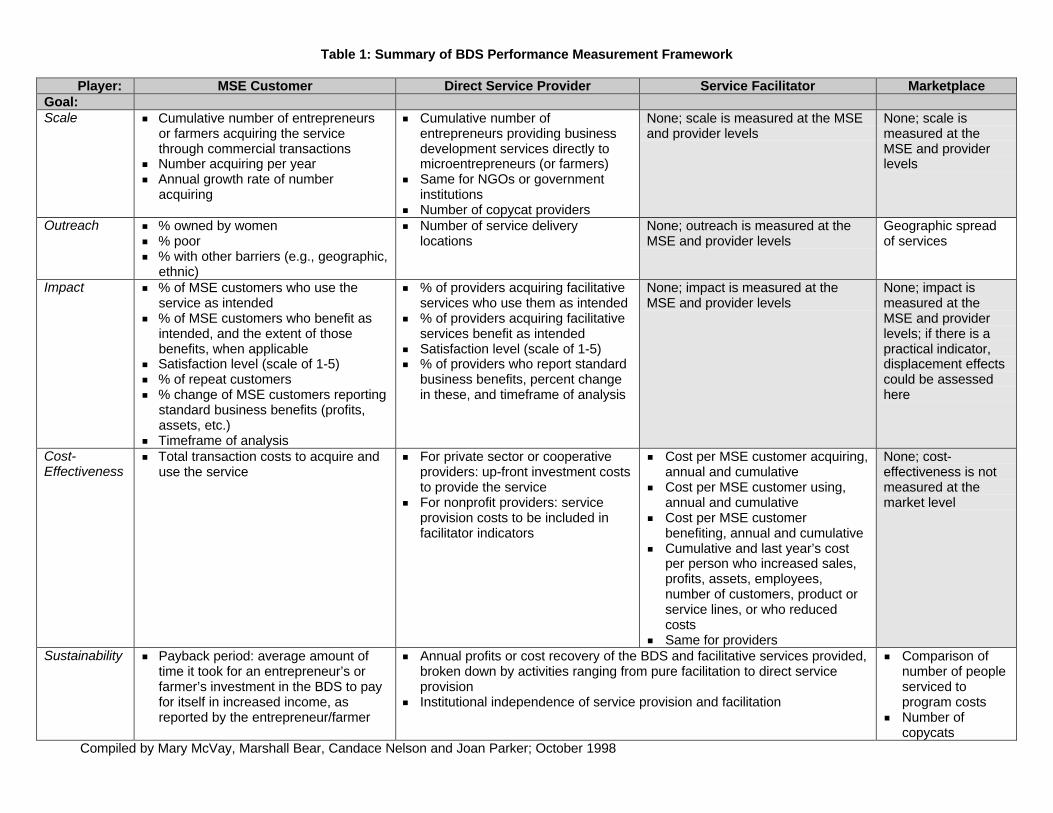
Table 1: Summary of BDS Performance Measurement Framework
Player: MSE Customer Direct Service Provider Service Facilitator MarketplaceGoal:Scale # Cumulative number of entrepreneurs
or farmers acquiring the servicethrough commercial transactions
# Number acquiring per year# Annual growth rate of number
acquiring
# Cumulative number ofentrepreneurs providing businessdevelopment services directly tomicroentrepreneurs (or farmers)
# Same for NGOs or governmentinstitutions
# Number of copycat providers
None; scale is measured at the MSEand provider levels
None; scale ismeasured at theMSE and providerlevels
Outreach # % owned by women# % poor# % with other barriers (e.g., geographic,
ethnic)
# Number of service deliverylocations
None; outreach is measured at theMSE and provider levels
Geographic spreadof services
Impact # % of MSE customers who use theservice as intended
# % of MSE customers who benefit asintended, and the extent of thosebenefits, when applicable
# Satisfaction level (scale of 1-5)# % of repeat customers# % change of MSE customers reporting
standard business benefits (profits,assets, etc.)
# Timeframe of analysis
# % of providers acquiring facilitativeservices who use them as intended
# % of providers acquiring facilitativeservices benefit as intended
# Satisfaction level (scale of 1-5)# % of providers who report standard
business benefits, percent changein these, and timeframe of analysis
None; impact is measured at theMSE and provider levels
None; impact ismeasured at theMSE and providerlevels; if there is apractical indicator,displacement effectscould be assessedhere
Cost-Effectiveness
# Total transaction costs to acquire anduse the service
# For private sector or cooperativeproviders: up-front investment coststo provide the service
# For nonprofit providers: serviceprovision costs to be included infacilitator indicators
# Cost per MSE customer acquiring,annual and cumulative
# Cost per MSE customer using,annual and cumulative
# Cost per MSE customerbenefiting, annual and cumulative
# Cumulative and last year’s costper person who increased sales,profits, assets, employees,number of customers, product orservice lines, or who reducedcosts
# Same for providers
None; cost-effectiveness is notmeasured at themarket level
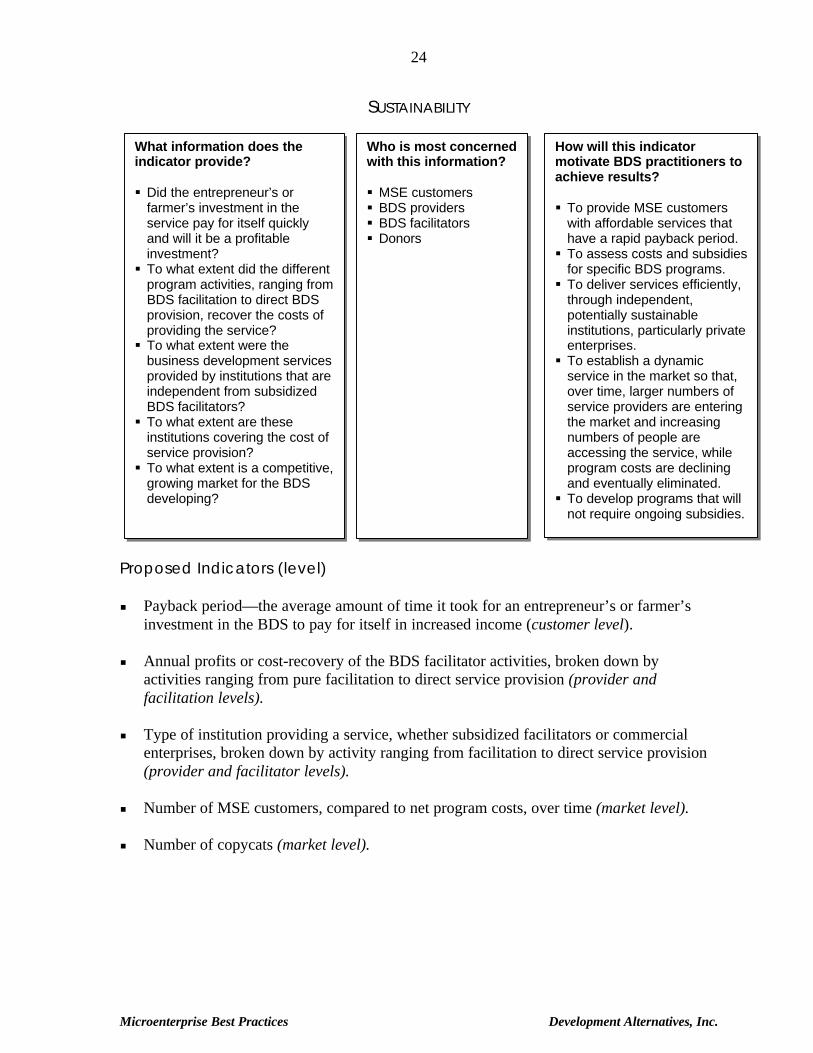
Sustainability # Payback period: average amount oftime it took for an entrepreneur’s orfarmer’s investment in the BDS to payfor itself in increased income, asreported by the entrepreneur/farmer
# Annual profits or cost recovery of the BDS and facilitative services provided,broken down by activities ranging from pure facilitation to direct serviceprovision
# Institutional independence of service provision and facilitation
# Comparison ofnumber of peopleserviced toprogram costs
# Number ofcopycats
Compiled by Mary McVay, Marshall Bear, Candace Nelson and Joan Parker; October 1998
Microenterprise Best Practices Development Alternatives, Inc.
10
General Issues in BDS Performance Measurement
There are many challenges in general in assessing the performance of BDS programs. Thefollowing are some that the framework has attempted to address:
General BDS indicators vs. service-specific indicators. On the one hand, it is useful tohave general BDS performance indicators in order to capture the benefits of multi-serviceprograms and to compare the performance of different services. On the other hand, service-specific indicators capture the benefits of particular services more accurately. Thisframework attempts to do both by establishing a general framework with some generalindicators into which service-specific indicators can be placed. The framework is designed sothat service-specific indicators should emerge as significant numbers of programs report theirperformance indicators within the context of the framework. For example, the impact sectionasks BDS programs to both define and report the “benefits” of their programs, while at thesame time asking them to report the standard business benefits of their programs, such asincreased profits and assets.
Assessing institutions vs. assessing products and services. Many BDS programs are still intheir product development phase. They are trying to scale up, and a few are developingstrategies for sustainability. As a result, some of the performance indicators relevant to themore developed field of microfinance do not capture the benefits of BDS programs. Thisframework selects indicators that are relevant for the product development phase of aprogram, in particular indicators that reflect customer satisfaction and expected programoutcomes, rather than broad impact and longer term sustainability. At the same time, theframework assesses cost-recovery and sustainability at a range of levels. In this manner, theframework reflects small steps that the field is making toward financial sustainability. AsBDS programs mature, it will reflect increasing levels of sustainability.
Level of analysis—enterprise, provider, facilitator, and market. In microfinanceprograms, the primary process in performance assessment is analyzing the operationalefficiency and financial sustainability of the microfinance institution. Few BDS programsengage in this type of performance assessment. One reason is the difference in institutionalarrangements often involved in BDS programs. These arrangements obscure the unit ofanalysis for assessing key variables such as scale, cost-effectiveness, and sustainability. Forexample, if an international nonprofit organization works, over a period of three years, with50 cooperatives to assist them in managing an oil press, each of which serves hundreds ofmicroenterprises, which institutions can be expected to become financially sustainable? Themicroenterprises, yes, the cooperatives, yes, but the BDS provider? No. Some internationalBDS providers, however, work with similar cooperatives and market their handicrafts hopingto earn a profit. Thus, performance expectations depend significantly on program design andintent. This framework gets around this issue by defining the levels of analysis as clearly aspossible and, in particular, differentiating among micro and small enterprise customers; BDSproviders, who directly service those customers; and BDS facilitators, who providetemporary assistance to providers and facilitate the market for BDS services. The providerand facilitator are sometimes the same organization, but this framework encourages BDSorganizations to differentiate between these roles in order to apply appropriate performance
Chapter Two—Performance Measurement Framework And Core Indicators
11
How will this indicatormotivate BDS practitionersto achieve results?(What incentives does theindicator give BDS facilitatorsand providers if used as atarget?)
§ To serve the largestpossible number ofmicroentrepreneurs andfarmers through commercialtransactions (customerspurchasing services orselling products throughcommercial agreements).§ To facilitate a competitive
market for services.
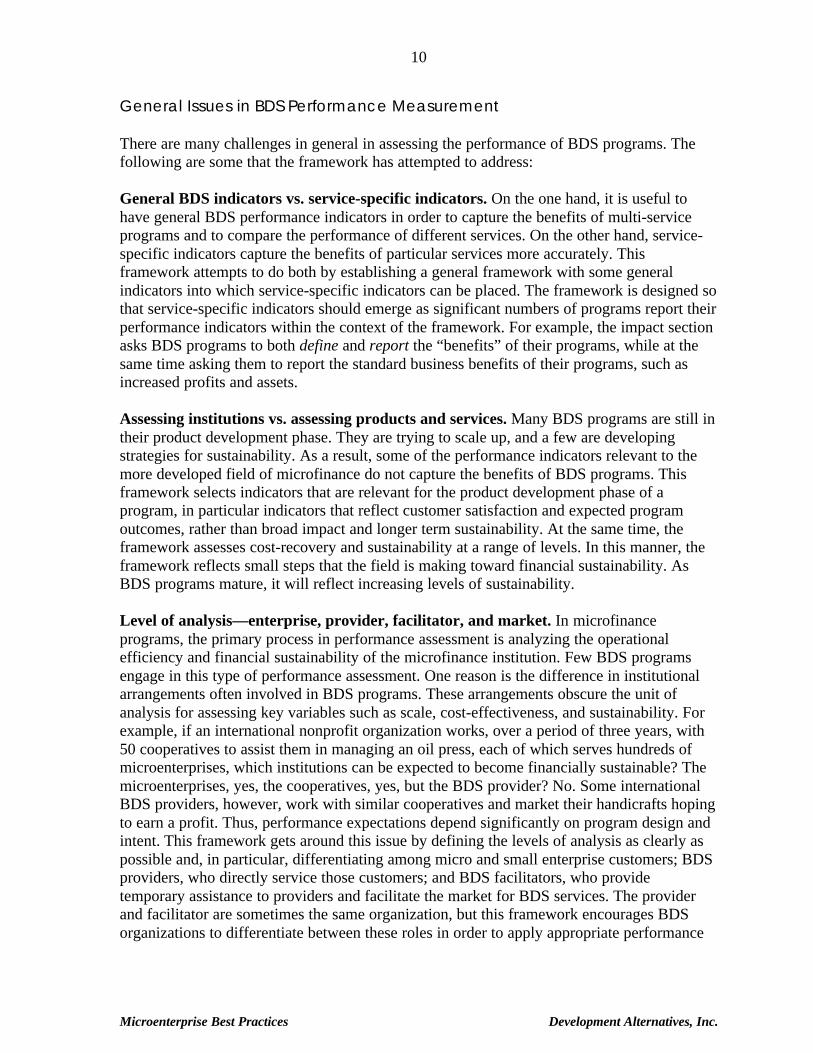
indicators to each function and, in particular, to separate sustainable from unsustainableactivities.
Quantitative or qualitative indicators. Many BDS programs, particularly programs thatfocus on structural changes, such as gender relations or policy changes, use qualitativeindicators to assess performance. However, quantitative indicators are more easily comparedacross programs and in different program contexts. This framework accommodatesqualitative program indicators by allowing BDS facilitators to define their objectives in eitherquantitative or qualitative terms, and then to aggregate the percent of beneficiaries that arerealizing those outcomes. At the same time, the framework tracks some standard quantitativeindicators. In the future, additional common indicators may emerge as more programs reporttheir outcome goals and results.
SCALE
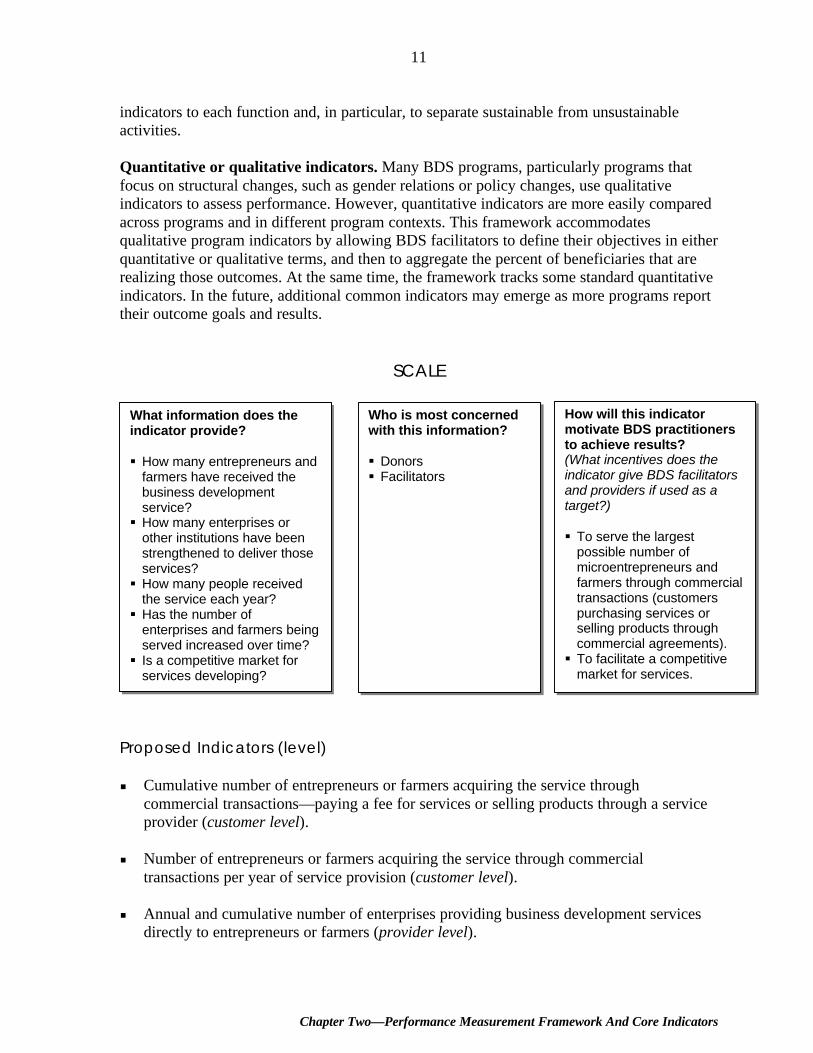
Proposed Indicators (level)
# Cumulative number of entrepreneurs or farmers acquiring the service throughcommercial transactions—paying a fee for services or selling products through a serviceprovider (customer level).
# Number of entrepreneurs or farmers acquiring the service through commercialtransactions per year of service provision (customer level).
# Annual and cumulative number of enterprises providing business development servicesdirectly to entrepreneurs or farmers (provider level).
Who is most concernedwith this information?
§ Donors§ Facilitators
What information does theindicator provide?
§ How many entrepreneurs andfarmers have received thebusiness developmentservice?§ How many enterprises or
other institutions have beenstrengthened to deliver thoseservices?§ How many people received
the service each year?§ Has the number of
enterprises and farmers beingserved increased over time?§ Is a competitive market for
services developing?
Microenterprise Best Practices Development Alternatives, Inc.
12
# Annual and cumulative number of NGOs or government institutions providing businessdevelopment services directly to entrepreneurs or farmers (provider level).
# Number of “copycats”—i.e., those service providers that started through a demonstrationeffect (market level).
Proposed Methodology
# A BDS facilitator who is also a direct provider tracks the number of entrepreneurs andfarmers who have paid a fee for a service, or sold goods or services through thefacilitator/provider, for each year since the beginning of the program.
# A BDS facilitator that works through separate providers tracks the providers whopaid a fee for services or sold goods or services through the facilitator for each year sincethe beginning of the program. The providers then track the microentrepreneurs or farmerswho purchased services or sold goods or services through providers since the programbegan. In tracking providers, the facilitator will distinguish between commercialenterprises, cooperatives, and nonprofit institutions (NGO or government agencies).
# Both types of BDS facilitators will distinguish between first-time and repeat customers.
# The cumulative figure is then broken down into years, and an annual and average annualpercentage growth rate is calculated.
# The cumulative number of enterprises acquiring the service is then divided by the numberof years the program has been in existence. This helps compare older programs withnewer programs more fairly.
# A methodology needs to be developed to define and measure copycats. The idea is toaccount for service providers that begin providing a BDS because they observed anotherprovider but did not benefit directly from the BDS program.
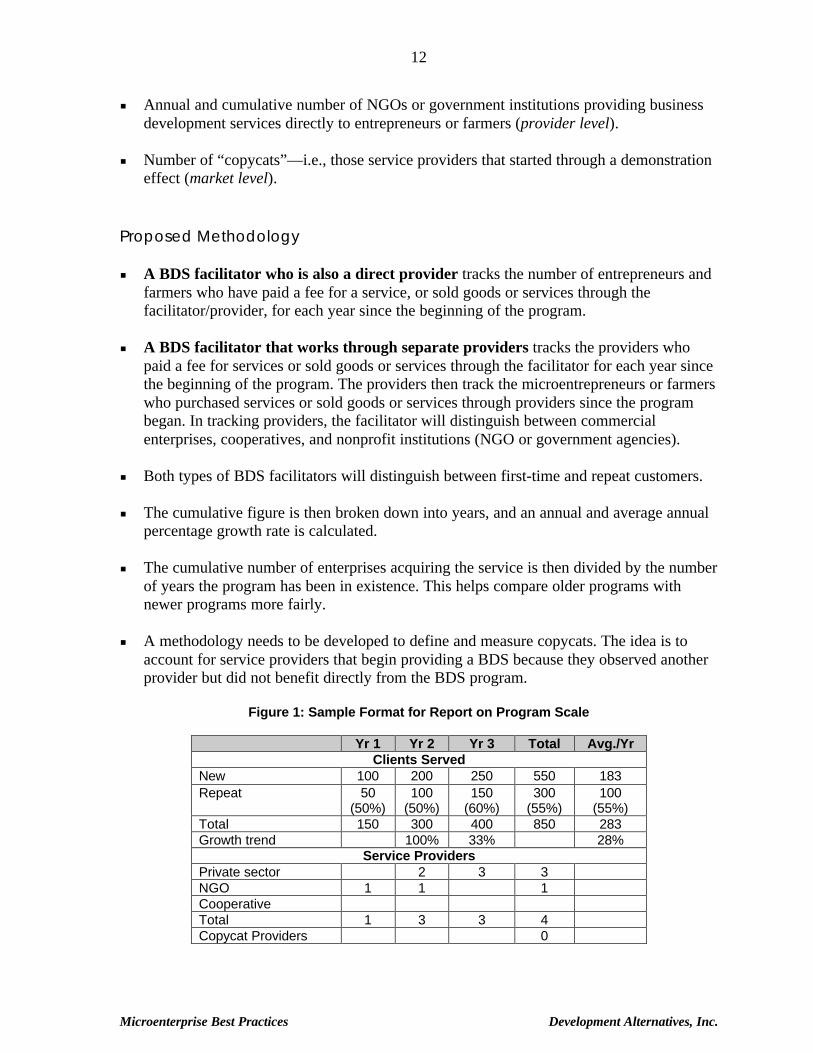
Figure 1: Sample Format for Report on Program Scale
Yr 1 Yr 2 Yr 3 Total Avg./YrClients Served
New 100 200 250 550 183Repeat 50
(50%)100
(50%)150
(60%)300
(55%)100
(55%)Total 150 300 400 850 283Growth trend 100% 33% 28%
Service ProvidersPrivate sector 2 3 3NGO 1 1 1CooperativeTotal 1 3 3 4Copycat Providers 0
Chapter Two—Performance Measurement Framework And Core Indicators
13
Issues with Measuring Scale
# Direct vs. indirect “beneficiaries.” (a) Who counts? Consumers of end products, familymembers, or employees? Only people who pay full costs or partial costs? (b) Is there aneed to distinguish “direct” from “indirect” beneficiaries? In a proper cost-benefitanalysis, or impact assessment, one would want to capture all the benefits of the program,including benefits to consumers, family members, and other indirect beneficiaries. Thisperformance framework, however, is focused on providing practitioners with indicatorsand incentives to provide better business development services to customers. The narrowdefinition of “beneficiaries”—as entrepreneurs and farmers acquiring a service throughcommercial transactions—reflects these this priorities.
# Active vs. cumulative clients. Microcredit programs track “active” borrowers, or peoplewho are borrowing at a particular moment. In contrast, BDS programs tend to track thenumber of people “served.” They may look at that figure annually or cumulatively overthe life of the project. This is due to the nature of the service. Whereas borrowing takesplace over a number of months or years and is often followed immediately by repeatborrowing, BDS services are sometimes one-time transactions or courses provided over amonth or two, but they are not continuous and ongoing the way that financial servicesare. Thus, the appropriate way to count clients is to count the number of people who havereceived the service over a specific period of time. The framework looks at the number ofclients served annually and cumulatively, the growth rate, and the number of repeatclients. Used together, these indicators reflect the raw number served, which illustrateswhether programs are growing and allows for a fair comparison of older and newerprograms.
# Farm and non-farm enterprises. Farmers are included as enterprises in this frameworkbecause so many BDS program serve farmers. Does this fit with the donor’s definition of“enterprise,” and if not, is that a problem?
# Bias against public goods programs. Some services, for example policy advocacy, havethe potential to affect large numbers of people who do not pay for the service. The factthat they do not count in this framework presents a bias against “public goods” orientedprograms and an incentive for BDS providers to identify some entrepreneurs that maypay for public goods services—for example, members of a trade association—in order forthat service to exist.
# Tracking. What incentives can BDS facilitators provide to external providers to track thenumber of and demographic information about their customers? Some programs provideservice providers with incentives to track. For example, ApproTEC provides brand-namequality control plates for its machines (which are inspected randomly). Each has a serialnumber that reflects the identity of the manufacturer. When the manufacturer needsadditional plates, they must report the customer list to ApproTEC, which in turn knowsthe number of customers roughly corresponds to the number of plates issued. Additionalmethodologies such as this need to be identified for other services.
Microenterprise Best Practices Development Alternatives, Inc.
14
# Institutions vs. service delivery points. Which is more significant for scale, the numberof institutions providing a service or the number of service delivery points? Thisframework selected the number of institutions because it is used more often and is easierto define. This indicator also creates an incentive to create a competitive market bycreating several delivery channels, rather than by serving the market through one largeinstitution.
# Comparing older and newer programs. Older programs may be larger. Newer, smallerprograms may have faster growth rates. It is hoped that using the combination of rawnumbers, average annual numbers, and annual growth rates will present an equitablepicture of programs across time and size.
# Copycats. Copycats may get help from other programs—or they may have started first.How to measure copycats remains an unresolved issue.
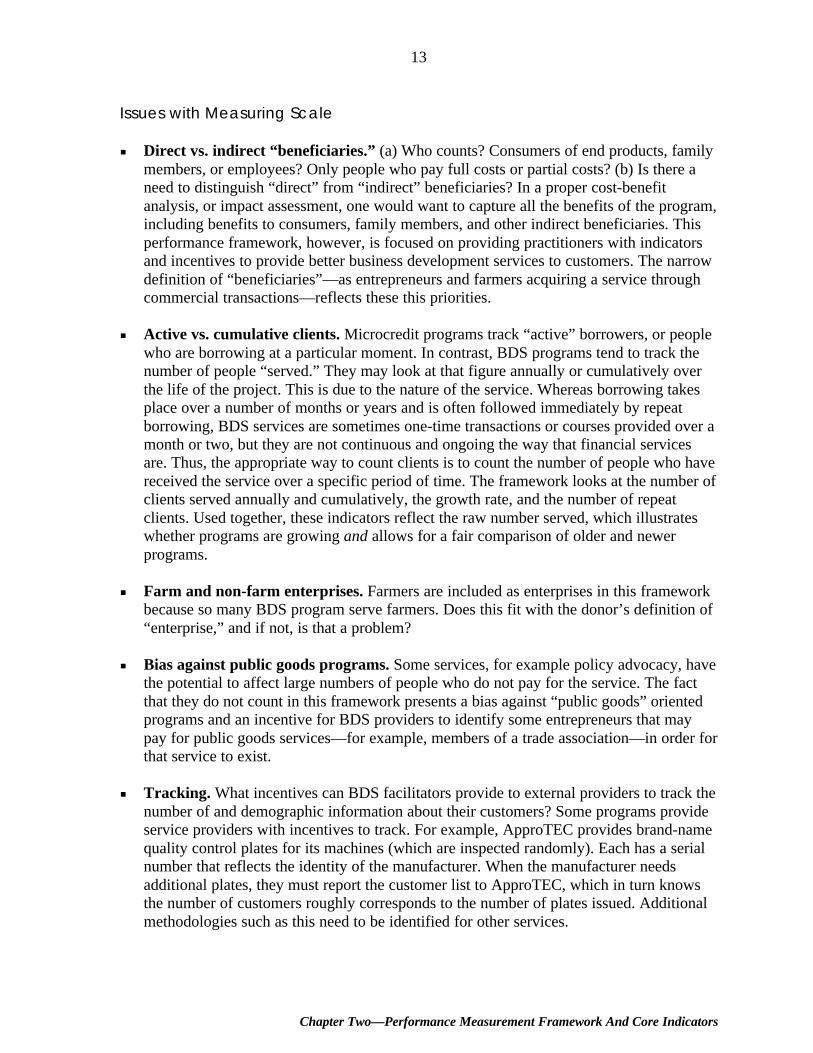
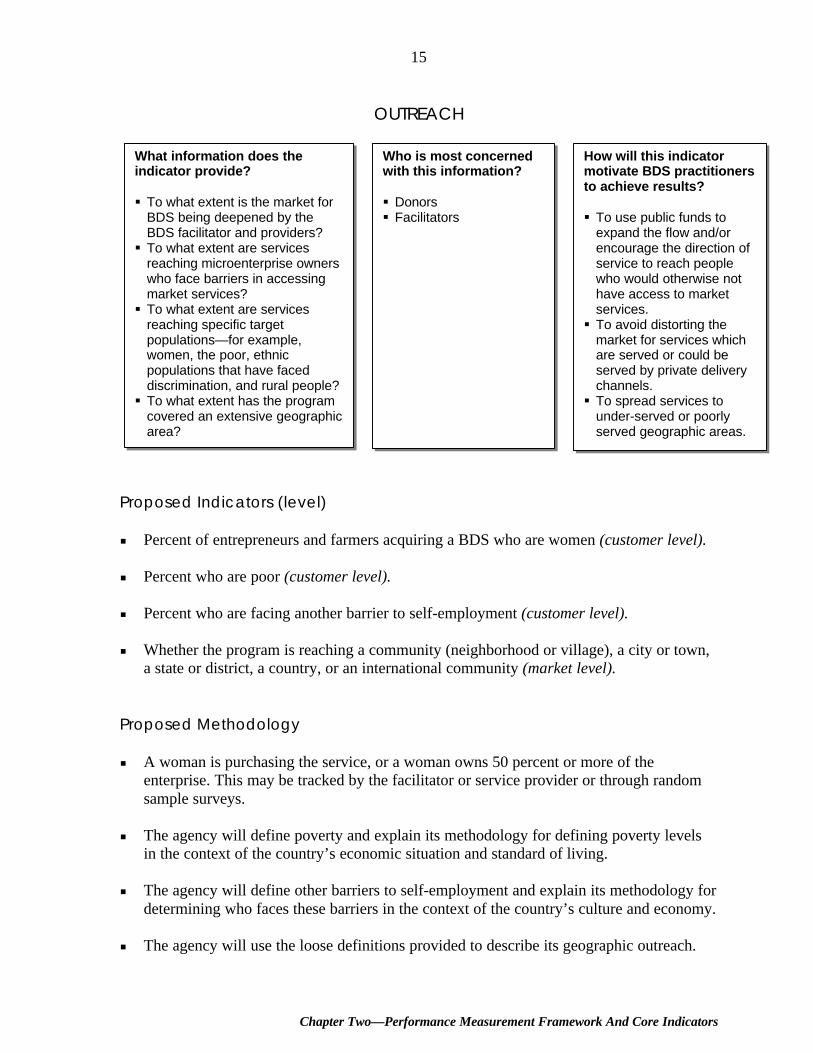
Table 2: Examples of Scale Indicators in Use
Organization, Program, Location Indicator and ResultsApproTEC, product developmenttraining, Kenya
76 clients trained in product development for a fee
ApproTEC, water pump program,Kenya
2,000 farmers purchased water pumps through 3manufacturers trained by ApproTEC
EnterpriseWorks (ATI), oil pressprogram, Tanzania
8,570 enterprises acquiring services, including oil presspurchasers, sunflower seed suppliers, and machinemanufacturers
IDE, water pumps, Bangladesh Over 2 million individuals purchasing water pumpsSEWA, vegetable vendorcooperatives, India
4,578 vendors pay member dues for advocacy services
IDB, voucher training program,Paraguay
4,530 individuals trained for a fee; 32 providers cashing invouchers
MEDA/PROARTE, crafts marketingcompany, Nicaragua
100 craftspeople selling crafts to PROARTE
Chapter Two—Performance Measurement Framework And Core Indicators
15
OUTREACH
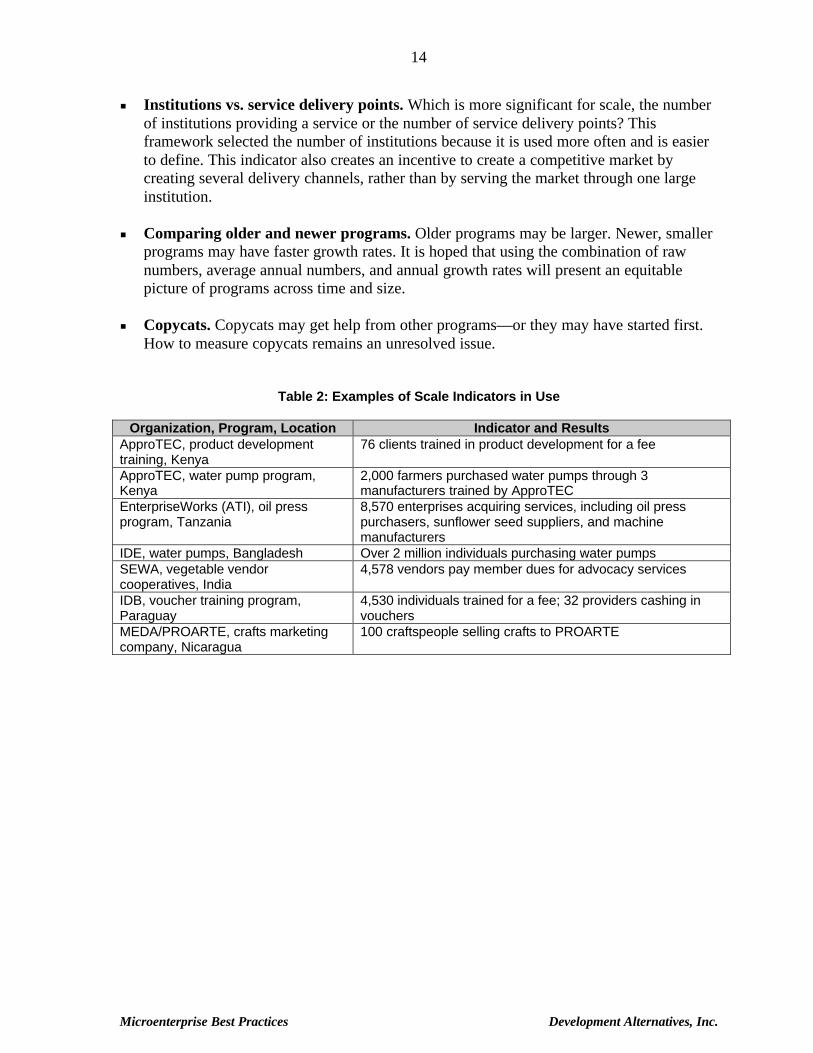
Proposed Indicators (level)
# Percent of entrepreneurs and farmers acquiring a BDS who are women (customer level).
# Percent who are poor (customer level).
# Percent who are facing another barrier to self-employment (customer level).
# Whether the program is reaching a community (neighborhood or village), a city or town,a state or district, a country, or an international community (market level).
Proposed Methodology
# A woman is purchasing the service, or a woman owns 50 percent or more of theenterprise. This may be tracked by the facilitator or service provider or through randomsample surveys.
# The agency will define poverty and explain its methodology for defining poverty levelsin the context of the country’s economic situation and standard of living.
# The agency will define other barriers to self-employment and explain its methodology fordetermining who faces these barriers in the context of the country’s culture and economy.
# The agency will use the loose definitions provided to describe its geographic outreach.
What information does theindicator provide?
§ To what extent is the market forBDS being deepened by theBDS facilitator and providers?§ To what extent are services
reaching microenterprise ownerswho face barriers in accessingmarket services?§ To what extent are services
reaching specific targetpopulations—for example,women, the poor, ethnicpopulations that have faceddiscrimination, and rural people?§ To what extent has the program
covered an extensive geographicarea?
Who is most concernedwith this information?
§ Donors§ Facilitators
How will this indicatormotivate BDS practitionersto achieve results?
§ To use public funds toexpand the flow and/orencourage the direction ofservice to reach peoplewho would otherwise nothave access to marketservices.§ To avoid distorting the
market for services whichare served or could beserved by private deliverychannels.§ To spread services to
under-served or poorlyserved geographic areas.
Microenterprise Best Practices Development Alternatives, Inc.
16
Issues with Measuring Outreach
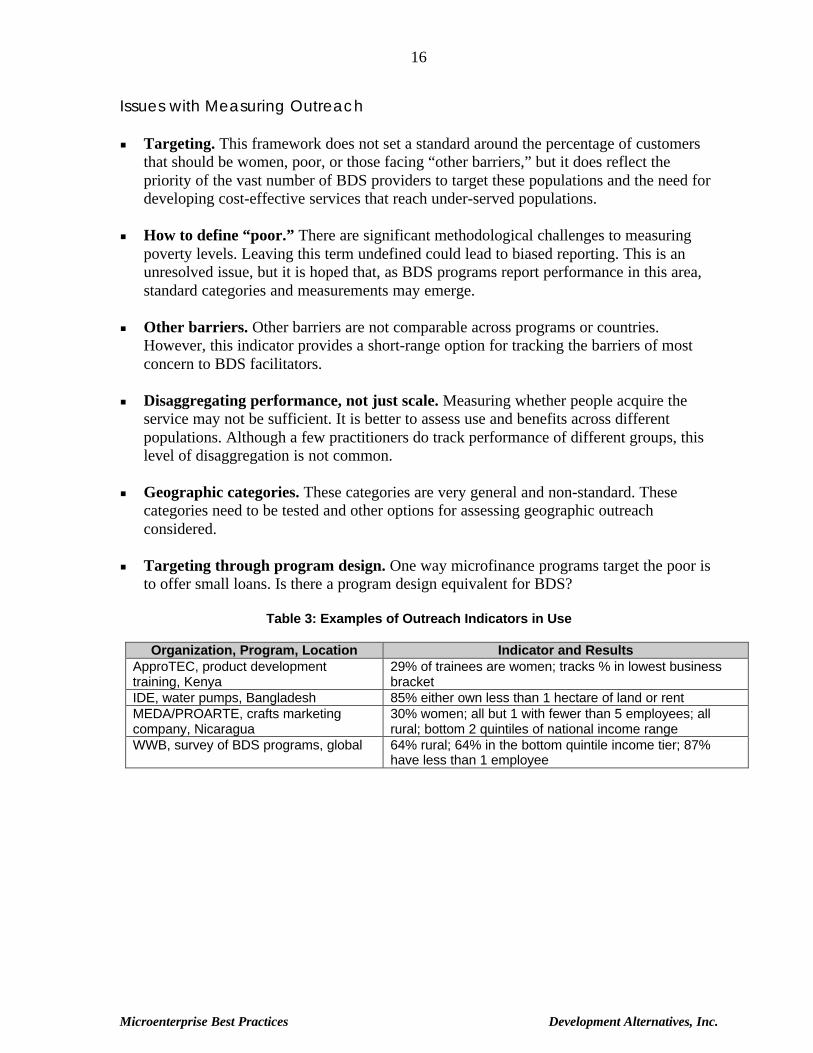
# Targeting. This framework does not set a standard around the percentage of customersthat should be women, poor, or those facing “other barriers,” but it does reflect thepriority of the vast number of BDS providers to target these populations and the need fordeveloping cost-effective services that reach under-served populations.
# How to define “poor.” There are significant methodological challenges to measuringpoverty levels. Leaving this term undefined could lead to biased reporting. This is anunresolved issue, but it is hoped that, as BDS programs report performance in this area,standard categories and measurements may emerge.
# Other barriers. Other barriers are not comparable across programs or countries.However, this indicator provides a short-range option for tracking the barriers of mostconcern to BDS facilitators.
# Disaggregating performance, not just scale. Measuring whether people acquire theservice may not be sufficient. It is better to assess use and benefits across differentpopulations. Although a few practitioners do track performance of different groups, thislevel of disaggregation is not common.
# Geographic categories. These categories are very general and non-standard. Thesecategories need to be tested and other options for assessing geographic outreachconsidered.
# Targeting through program design. One way microfinance programs target the poor isto offer small loans. Is there a program design equivalent for BDS?
Table 3: Examples of Outreach Indicators in Use
Organization, Program, Location Indicator and ResultsApproTEC, product developmenttraining, Kenya
29% of trainees are women; tracks % in lowest businessbracket
IDE, water pumps, Bangladesh 85% either own less than 1 hectare of land or rentMEDA/PROARTE, crafts marketingcompany, Nicaragua
30% women; all but 1 with fewer than 5 employees; allrural; bottom 2 quintiles of national income range
WWB, survey of BDS programs, global 64% rural; 64% in the bottom quintile income tier; 87%have less than 1 employee
Chapter Two—Performance Measurement Framework And Core Indicators
17
IMPACT
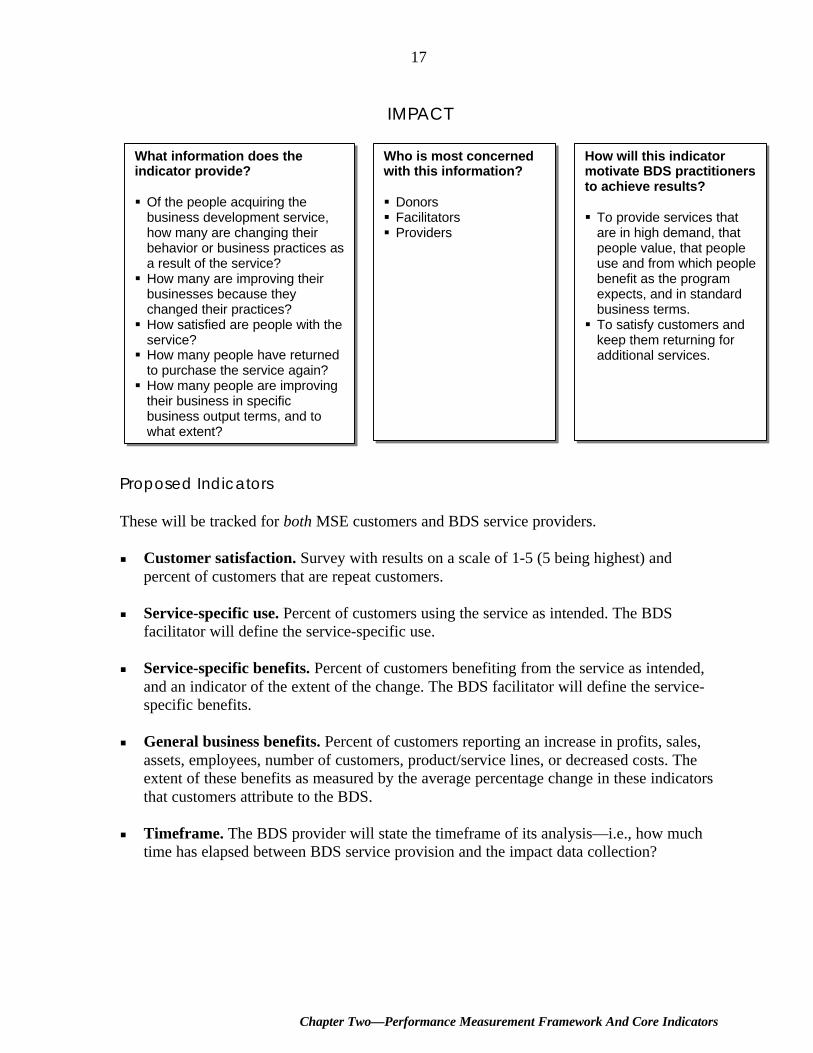
Proposed Indicators
These will be tracked for both MSE customers and BDS service providers.
# Customer satisfaction. Survey with results on a scale of 1-5 (5 being highest) andpercent of customers that are repeat customers.
# Service-specific use. Percent of customers using the service as intended. The BDSfacilitator will define the service-specific use.
# Service-specific benefits. Percent of customers benefiting from the service as intended,and an indicator of the extent of the change. The BDS facilitator will define the service-specific benefits.
# General business benefits. Percent of customers reporting an increase in profits, sales,assets, employees, number of customers, product/service lines, or decreased costs. Theextent of these benefits as measured by the average percentage change in these indicatorsthat customers attribute to the BDS.
# Timeframe. The BDS provider will state the timeframe of its analysis—i.e., how muchtime has elapsed between BDS service provision and the impact data collection?
What information does theindicator provide?
§ Of the people acquiring thebusiness development service,how many are changing theirbehavior or business practices asa result of the service?§ How many are improving their
businesses because theychanged their practices?§ How satisfied are people with the
service?§ How many people have returned
to purchase the service again?§ How many people are improving
their business in specificbusiness output terms, and towhat extent?
Who is most concernedwith this information?
§ Donors§ Facilitators§ Providers
How will this indicatormotivate BDS practitionersto achieve results?
§ To provide services thatare in high demand, thatpeople value, that peopleuse and from which peoplebenefit as the programexpects, and in standardbusiness terms.§ To satisfy customers and
keep them returning foradditional services.
Microenterprise Best Practices Development Alternatives, Inc.
18
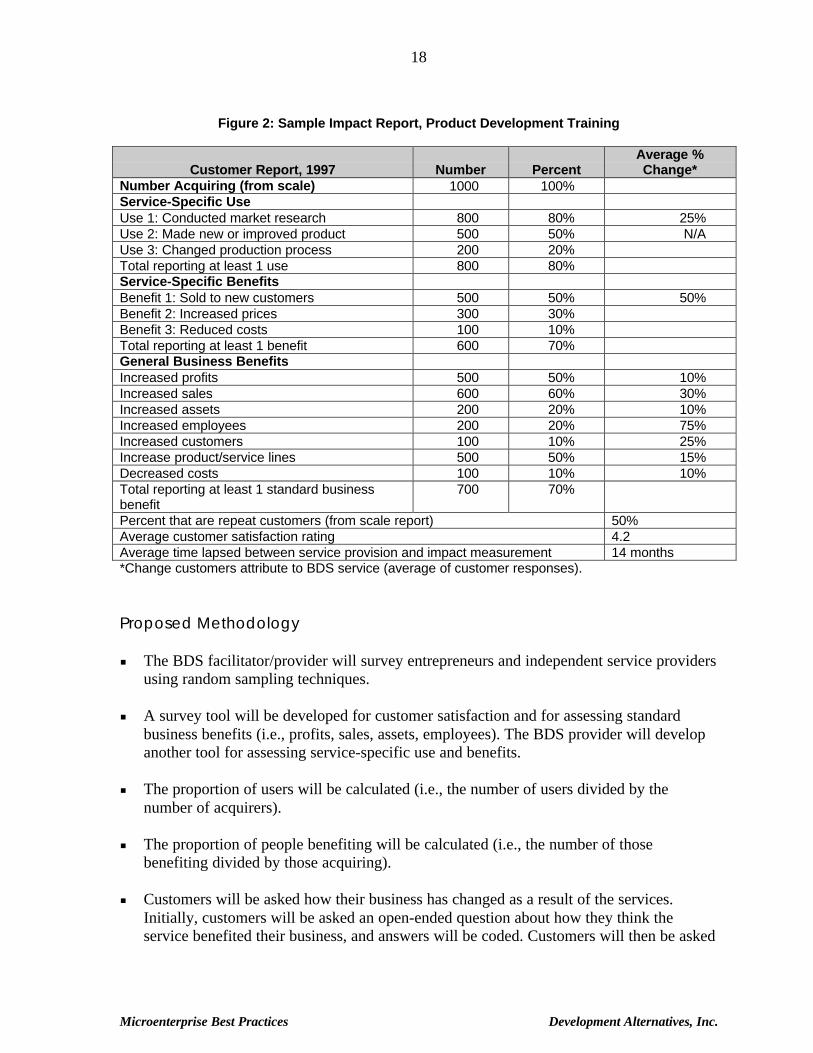
Figure 2: Sample Impact Report, Product Development Training
Customer Report, 1997 Number PercentAverage %Change*
Number Acquiring (from scale) 1000 100%Service-Specific UseUse 1: Conducted market research 800 80% 25%Use 2: Made new or improved product 500 50% N/AUse 3: Changed production process 200 20%Total reporting at least 1 use 800 80%Service-Specific BenefitsBenefit 1: Sold to new customers 500 50% 50%Benefit 2: Increased prices 300 30%Benefit 3: Reduced costs 100 10%Total reporting at least 1 benefit 600 70%General Business BenefitsIncreased profits 500 50% 10%Increased sales 600 60% 30%Increased assets 200 20% 10%Increased employees 200 20% 75%Increased customers 100 10% 25%Increase product/service lines 500 50% 15%Decreased costs 100 10% 10%Total reporting at least 1 standard businessbenefit
700 70%
Percent that are repeat customers (from scale report) 50%Average customer satisfaction rating 4.2Average time lapsed between service provision and impact measurement 14 months*Change customers attribute to BDS service (average of customer responses).
Proposed Methodology
# The BDS facilitator/provider will survey entrepreneurs and independent service providersusing random sampling techniques.
# A survey tool will be developed for customer satisfaction and for assessing standardbusiness benefits (i.e., profits, sales, assets, employees). The BDS provider will developanother tool for assessing service-specific use and benefits.
# The proportion of users will be calculated (i.e., the number of users divided by thenumber of acquirers).
# The proportion of people benefiting will be calculated (i.e., the number of thosebenefiting divided by those acquiring).
# Customers will be asked how their business has changed as a result of the services.Initially, customers will be asked an open-ended question about how they think theservice benefited their business, and answers will be coded. Customers will then be asked
Chapter Two—Performance Measurement Framework And Core Indicators
19
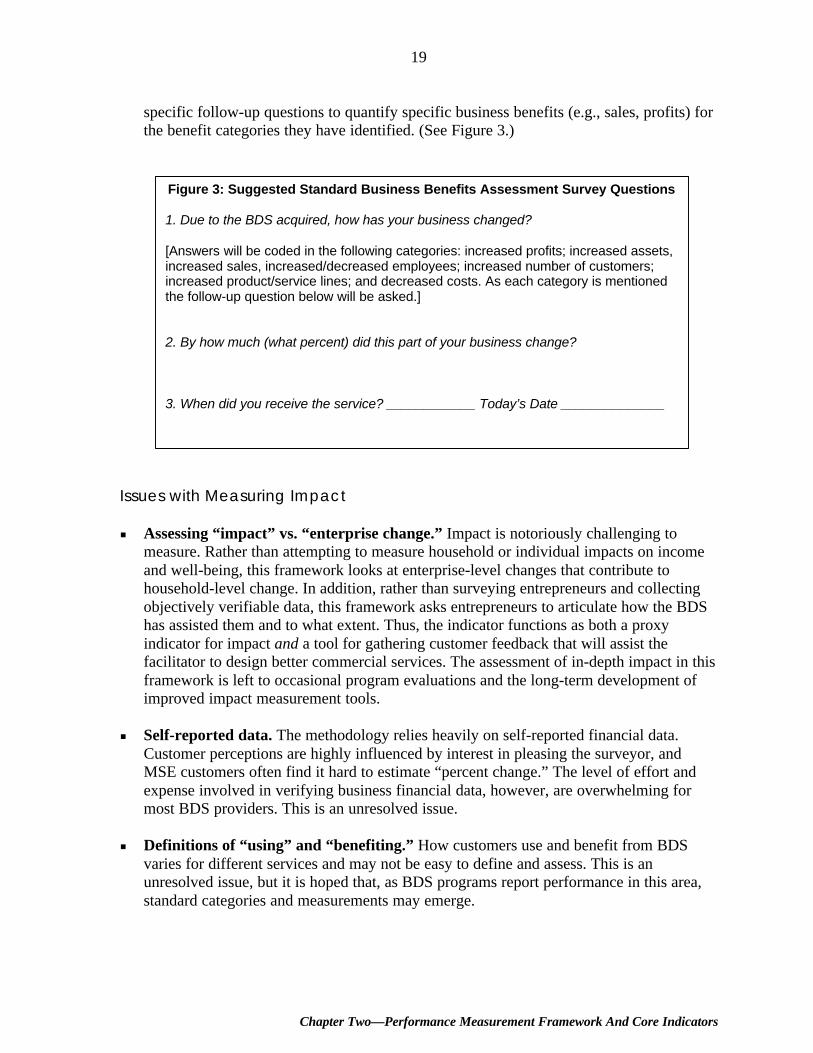
specific follow-up questions to quantify specific business benefits (e.g., sales, profits) forthe benefit categories they have identified. (See Figure 3.)
Issues with Measuring Impact
# Assessing “impact” vs. “enterprise change.” Impact is notoriously challenging tomeasure. Rather than attempting to measure household or individual impacts on incomeand well-being, this framework looks at enterprise-level changes that contribute tohousehold-level change. In addition, rather than surveying entrepreneurs and collectingobjectively verifiable data, this framework asks entrepreneurs to articulate how the BDShas assisted them and to what extent. Thus, the indicator functions as both a proxyindicator for impact and a tool for gathering customer feedback that will assist thefacilitator to design better commercial services. The assessment of in-depth impact in thisframework is left to occasional program evaluations and the long-term development ofimproved impact measurement tools.
# Self-reported data. The methodology relies heavily on self-reported financial data.Customer perceptions are highly influenced by interest in pleasing the surveyor, andMSE customers often find it hard to estimate “percent change.” The level of effort andexpense involved in verifying business financial data, however, are overwhelming formost BDS providers. This is an unresolved issue.
# Definitions of “using” and “benefiting.” How customers use and benefit from BDSvaries for different services and may not be easy to define and assess. This is anunresolved issue, but it is hoped that, as BDS programs report performance in this area,standard categories and measurements may emerge.
Figure 3: Suggested Standard Business Benefits Assessment Survey Questions
1. Due to the BDS acquired, how has your business changed?
[Answers will be coded in the following categories: increased profits; increased assets,increased sales, increased/decreased employees; increased number of customers;increased product/service lines; and decreased costs. As each category is mentionedthe follow-up question below will be asked.]
2. By how much (what percent) did this part of your business change?
3. When did you receive the service? ____________ Today’s Date ______________
Microenterprise Best Practices Development Alternatives, Inc.
20
# Scale vs. intensity of impact. The indicators focus more on the number of people usingand benefiting from the service than on the intensity of the benefits. Thus, the indicatormay provide an incentive to serve a large number of people with a low-return service.The framework attempts to address this by asking MSE customers the extent to whichthey benefited in percentage terms. Is this a sufficient measure of the intensity of programimpact? This is an unresolved issue.
# Attribution. The methodology does not suggest using a control group or comparingbusiness benefits to general business trends. Rather, it suggests asking MSE customers toattribute business changes to the services they acquired. Is this sufficient to ensure thatthe framework is measuring the impact of the specific BDS rather than measuring generalbusiness trends in the market?
# Cost-benefit analysis. This analysis is a more complete assessment tool than the onepresented here, but too complex and costly for most BDS facilitators. In addition, cost-benefit analysis is primarily concerned with assessing the economic costs and benefitsfrom the market perspective, rather than the financial costs and benefits from the point ofview of a BDS provider. As a result, the information it provides to help practitionersdeliver better commercial services is limited.
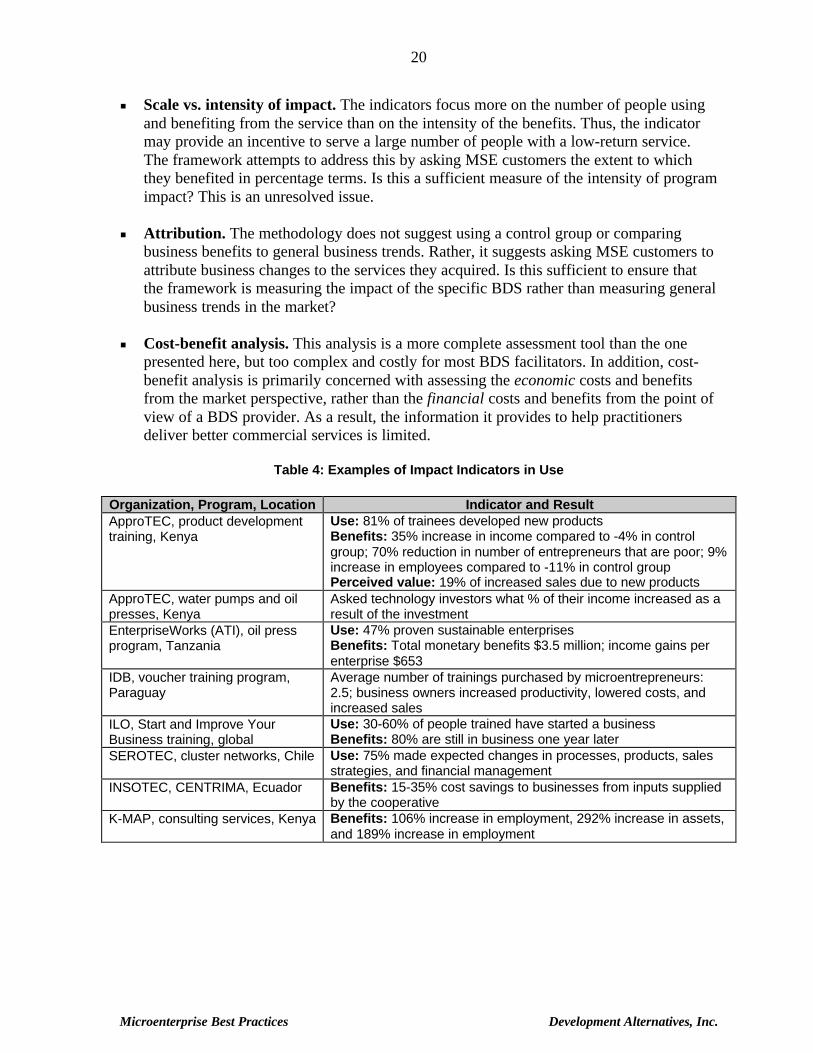
Table 4: Examples of Impact Indicators in Use
Organization, Program, Location Indicator and ResultApproTEC, product developmenttraining, Kenya
Use: 81% of trainees developed new productsBenefits: 35% increase in income compared to -4% in controlgroup; 70% reduction in number of entrepreneurs that are poor; 9%increase in employees compared to -11% in control groupPerceived value: 19% of increased sales due to new products
ApproTEC, water pumps and oilpresses, Kenya
Asked technology investors what % of their income increased as aresult of the investment
EnterpriseWorks (ATI), oil pressprogram, Tanzania
Use: 47% proven sustainable enterprisesBenefits: Total monetary benefits $3.5 million; income gains perenterprise $653
IDB, voucher training program,Paraguay
Average number of trainings purchased by microentrepreneurs:2.5; business owners increased productivity, lowered costs, andincreased sales
ILO, Start and Improve YourBusiness training, global
Use: 30-60% of people trained have started a businessBenefits: 80% are still in business one year later
SEROTEC, cluster networks, Chile Use: 75% made expected changes in processes, products, salesstrategies, and financial management
INSOTEC, CENTRIMA, Ecuador Benefits: 15-35% cost savings to businesses from inputs suppliedby the cooperative
K-MAP, consulting services, Kenya Benefits: 106% increase in employment, 292% increase in assets,and 189% increase in employment
Chapter Two—Performance Measurement Framework And Core Indicators
21
COST-EFFECTIVENESS
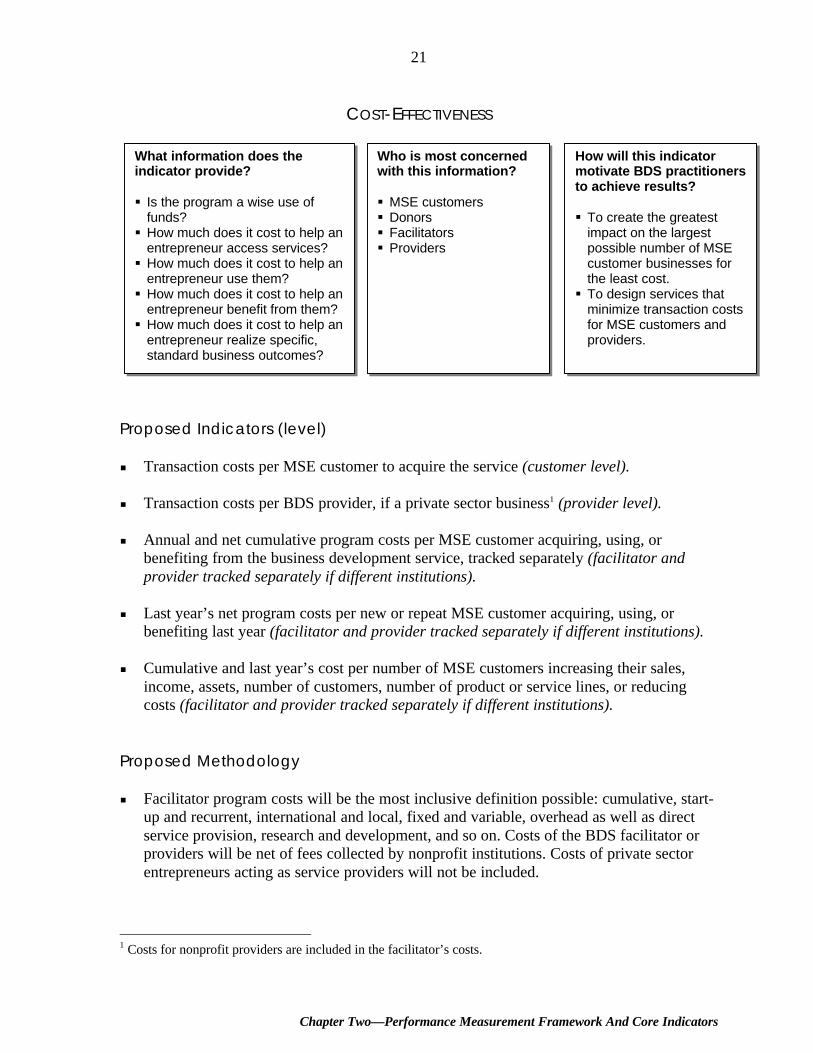
Proposed Indicators (level)
# Transaction costs per MSE customer to acquire the service (customer level).
# Transaction costs per BDS provider, if a private sector business1 (provider level).
# Annual and net cumulative program costs per MSE customer acquiring, using, orbenefiting from the business development service, tracked separately (facilitator andprovider tracked separately if different institutions).
# Last year’s net program costs per new or repeat MSE customer acquiring, using, orbenefiting last year (facilitator and provider tracked separately if different institutions).
# Cumulative and last year’s cost per number of MSE customers increasing their sales,income, assets, number of customers, number of product or service lines, or reducingcosts (facilitator and provider tracked separately if different institutions).
Proposed Methodology
# Facilitator program costs will be the most inclusive definition possible: cumulative, start-up and recurrent, international and local, fixed and variable, overhead as well as directservice provision, research and development, and so on. Costs of the BDS facilitator orproviders will be net of fees collected by nonprofit institutions. Costs of private sectorentrepreneurs acting as service providers will not be included.
1 Costs for nonprofit providers are included in the facilitator’s costs.
What information does theindicator provide?
§ Is the program a wise use offunds?§ How much does it cost to help an
entrepreneur access services?§ How much does it cost to help an
entrepreneur use them?§ How much does it cost to help an
entrepreneur benefit from them?§ How much does it cost to help an
entrepreneur realize specific,standard business outcomes?
Who is most concernedwith this information?
§ MSE customers§ Donors§ Facilitators§ Providers
How will this indicatormotivate BDS practitionersto achieve results?
§ To create the greatestimpact on the largestpossible number of MSEcustomer businesses forthe least cost.§ To design services that
minimize transaction costsfor MSE customers andproviders.
Microenterprise Best Practices Development Alternatives, Inc.
22
# Program costs will be translated into one currency and deflated to 1990 values. The stepstaken in currency translation will be noted.
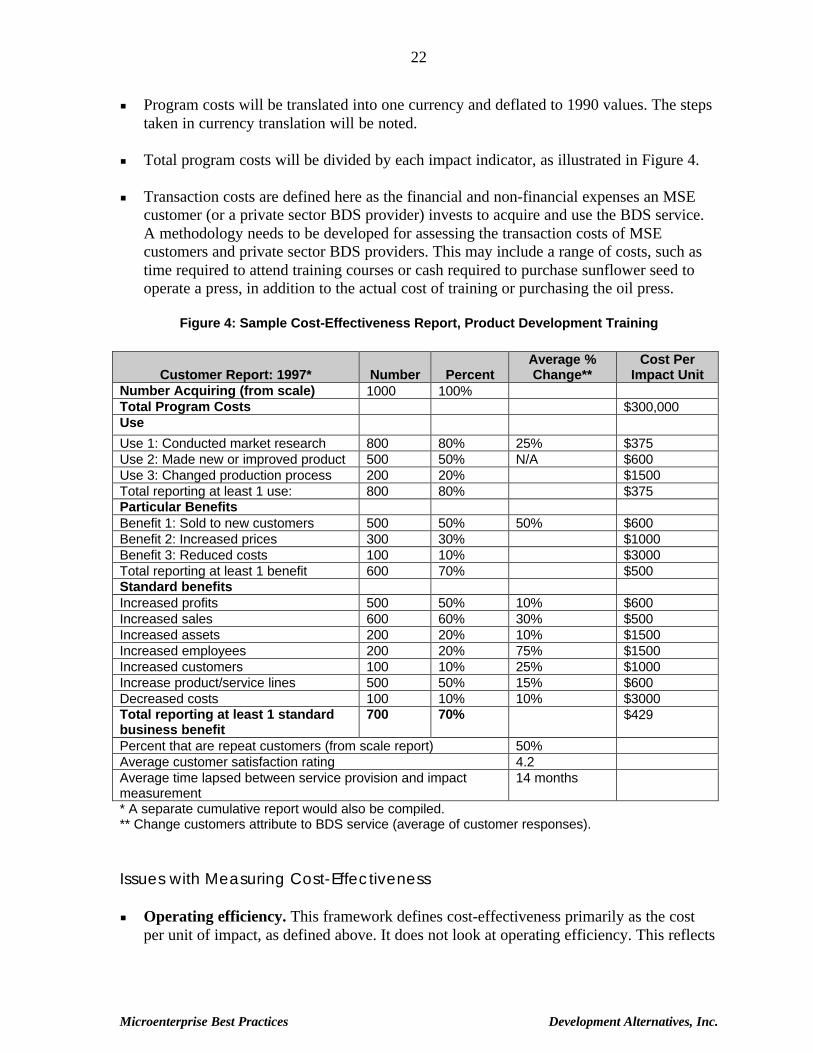
# Total program costs will be divided by each impact indicator, as illustrated in Figure 4.
# Transaction costs are defined here as the financial and non-financial expenses an MSEcustomer (or a private sector BDS provider) invests to acquire and use the BDS service.A methodology needs to be developed for assessing the transaction costs of MSEcustomers and private sector BDS providers. This may include a range of costs, such astime required to attend training courses or cash required to purchase sunflower seed tooperate a press, in addition to the actual cost of training or purchasing the oil press.
Figure 4: Sample Cost-Effectiveness Report, Product Development Training
Customer Report: 1997* Number PercentAverage %Change**
Cost PerImpact Unit
Number Acquiring (from scale) 1000 100%Total Program Costs $300,000Use
Use 1: Conducted market research 800 80% 25% $375Use 2: Made new or improved product 500 50% N/A $600Use 3: Changed production process 200 20% $1500Total reporting at least 1 use: 800 80% $375Particular BenefitsBenefit 1: Sold to new customers 500 50% 50% $600Benefit 2: Increased prices 300 30% $1000Benefit 3: Reduced costs 100 10% $3000Total reporting at least 1 benefit 600 70% $500Standard benefitsIncreased profits 500 50% 10% $600Increased sales 600 60% 30% $500Increased assets 200 20% 10% $1500Increased employees 200 20% 75% $1500Increased customers 100 10% 25% $1000Increase product/service lines 500 50% 15% $600Decreased costs 100 10% 10% $3000Total reporting at least 1 standardbusiness benefit
700 70% $429
Percent that are repeat customers (from scale report) 50%Average customer satisfaction rating 4.2Average time lapsed between service provision and impactmeasurement
14 months
* A separate cumulative report would also be compiled.** Change customers attribute to BDS service (average of customer responses).
Issues with Measuring Cost-Effectiveness
# Operating efficiency. This framework defines cost-effectiveness primarily as the costper unit of impact, as defined above. It does not look at operating efficiency. This reflects
Chapter Two—Performance Measurement Framework And Core Indicators
23
current practice among BDS providers. Unlike microfinance programs, in which a lowstaff-to-client ratio is generally positive, such measures in BDS could be equallyreflective of poor quality service—because the service itself is often made up of stafftime in the form of training and counseling. Sometimes, the lowest cost-to-impact ratiowill be achieved by a high staff-to-client ratio. To achieve a low cost-to-impact ratio,however, BDS providers need to monitor some intermediate indicators of efficiency thatare more readily available on a daily basis. More research is needed to identify bestpractices in this arena. One option that has been suggested is to include in the frameworkan opportunity for BDS facilitators to report their “operating efficiency” indicators,which would enrich the framework but also add to its complexity.
# Allocating costs. It is challenging to define what costs to allocate to a particular programor service, especially when facilitators are in engaged in multiple BDS or a mix of BDSand other development-oriented services. This framework suggests the most inclusivedefinition possible to avoid leaving out costs because of definition errors. Unfortunately,there will be significant room for manipulation here. This remains an unresolved issue.
# Transaction costs. This framework includes transaction costs to entrepreneurs or privatesector BDS providers. This is simply a cost indicator, not a cost-effectiveness indicator,and the data are challenging to collect. One may argue that these costs are taken intoconsideration under sustainability, where the framework looks at profitability of privatesector businesses. Nevertheless, many BDS facilitators do assess up-front investmentcosts to MSE customers and BDS providers that will invest in the service or in-serviceprovision. Unfortunately, these are usually estimates made during the program designphase, rather than actual data. This remains an unresolved issue.
# Comparing financial data across programs and currencies. There are differentstrategies for ensuring that financial data are comparable over time and across currencies.In general, BDS program costs occur in several currencies—donor currencies andimplementing country currencies. The costs need to be reported in one currency anddeflated to a single year. The results often vary depending on the order in which thesesteps are carried out. What is the most practical way to standardize? This is an unresolvedissue. Eventually, these values may be translated into U.S. dollars to compare acrossprograms. U.S. dollars have very different values in terms of local gross domestic productin different countries. Is it useful to express these costs in terms of gross domesticproduct? This remains an unresolved issue.
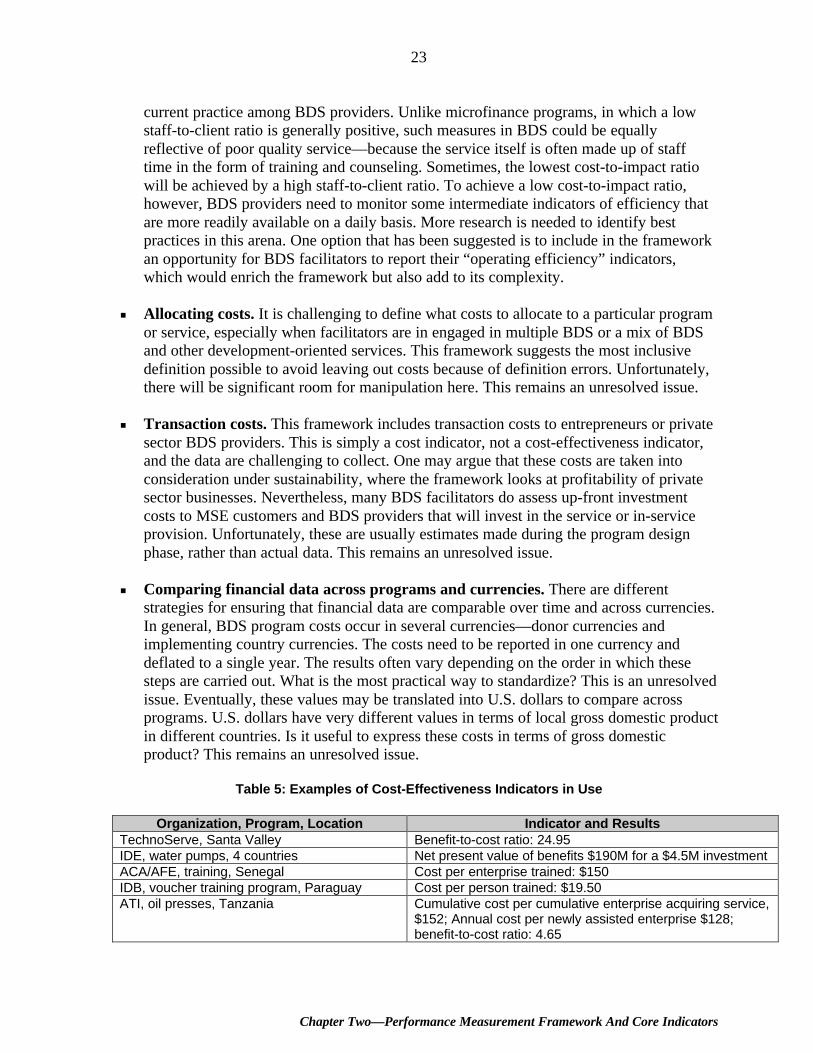
Table 5: Examples of Cost-Effectiveness Indicators in Use
Organization, Program, Location Indicator and ResultsTechnoServe, Santa Valley Benefit-to-cost ratio: 24.95IDE, water pumps, 4 countries Net present value of benefits $190M for a $4.5M investmentACA/AFE, training, Senegal Cost per enterprise trained: $150IDB, voucher training program, Paraguay Cost per person trained: $19.50ATI, oil presses, Tanzania Cumulative cost per cumulative enterprise acquiring service,
$152; Annual cost per newly assisted enterprise $128;benefit-to-cost ratio: 4.65
Microenterprise Best Practices Development Alternatives, Inc.
24
SUSTAINABILITY
Proposed Indicators (level)
# Payback period—the average amount of time it took for an entrepreneur’s or farmer’sinvestment in the BDS to pay for itself in increased income (customer level).
# Annual profits or cost-recovery of the BDS facilitator activities, broken down byactivities ranging from pure facilitation to direct service provision (provider andfacilitation levels).
# Type of institution providing a service, whether subsidized facilitators or commercialenterprises, broken down by activity ranging from facilitation to direct service provision(provider and facilitator levels).
# Number of MSE customers, compared to net program costs, over time (market level).
# Number of copycats (market level).
What information does theindicator provide?
§ Did the entrepreneur’s orfarmer’s investment in theservice pay for itself quicklyand will it be a profitableinvestment?§ To what extent did the different
program activities, ranging fromBDS facilitation to direct BDSprovision, recover the costs ofproviding the service?§ To what extent were the
business development servicesprovided by institutions that areindependent from subsidizedBDS facilitators?§ To what extent are these
institutions covering the cost ofservice provision?§ To what extent is a competitive,
growing market for the BDSdeveloping?
Who is most concernedwith this information?
§ MSE customers§ BDS providers§ BDS facilitators§ Donors
How will this indicatormotivate BDS practitioners toachieve results?
§ To provide MSE customerswith affordable services thathave a rapid payback period.§ To assess costs and subsidies
for specific BDS programs.§ To deliver services efficiently,
through independent,potentially sustainableinstitutions, particularly privateenterprises.§ To establish a dynamic
service in the market so that,over time, larger numbers ofservice providers are enteringthe market and increasingnumbers of people areaccessing the service, whileprogram costs are decliningand eventually eliminated.§ To develop programs that will
not require ongoing subsidies.
Chapter Two—Performance Measurement Framework And Core Indicators
25
Proposed Methodology
# The methodology for determining a payback period will be developed along with thecustomer impact survey. It is likely to be assessed in random sample surveys and may besimply the entrepreneur’s opinion of how long it took to recover the investment. Aneffort will be made to have the customer calculate both the cash paid to the serviceprovider and the other costs of the investment, including transaction costs.
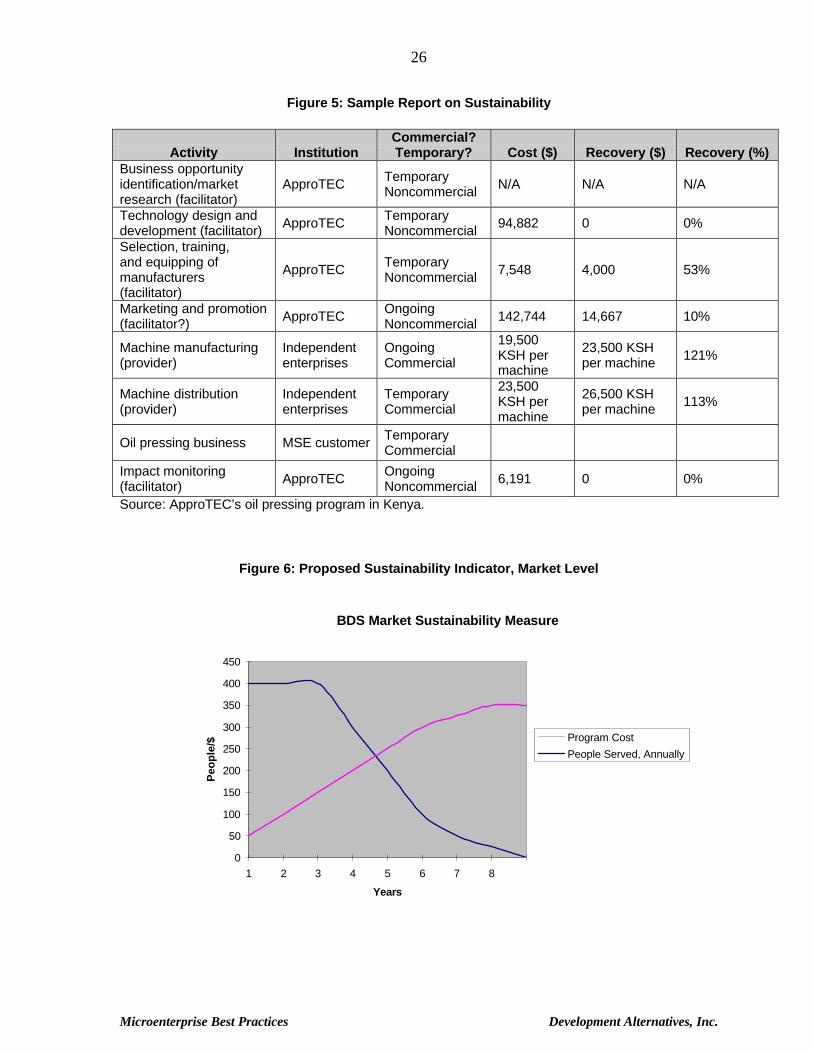
# The activities involved in developing and delivering the BDS to the entrepreneur will bebroken down in a table. For each activity, the table will indicate the institution carryingout the activity and whether the activity is intended to be commercial or subsidized,temporary or ongoing. Then, for each activity, the previous year’s costs and revenues willbe listed and compared in a ratio with a percentage format. It is understood that the mostfacilitative, subsidized activities may not recover any costs. In contrast, entrepreneursproviding a BDS should be making a profit. Institutions will define their own “steps”according to their programs and their capacities to break down costs. All program costsincurred in the previous year will be considered, including estimates of overheads, whichmay be a separate activity such as “management.” (See Figure 5.)
# Program costs will be translated into one currency and deflated to 1990 values.
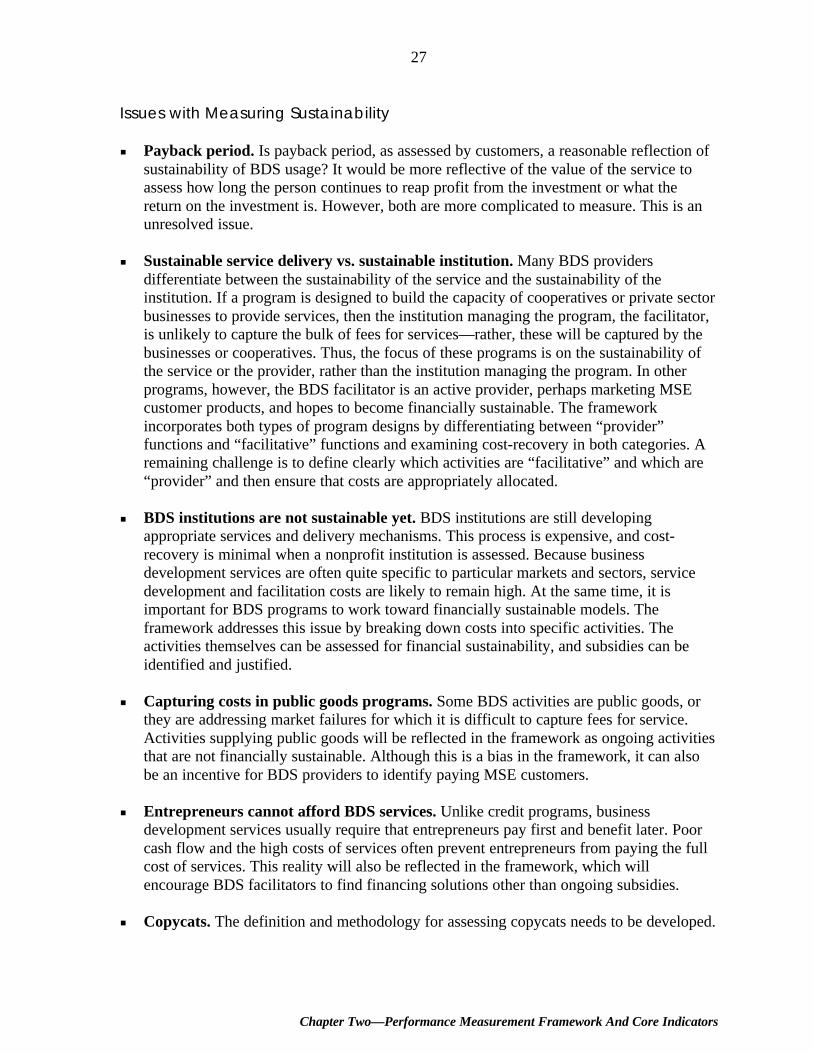
# After adjusting the program costs for inflation, the total annual program costs will beplotted on a graph. On the same graph will be plotted the number of people acquiring theservice each year. In early stages of a program, the lines are likely to be in parallelupward directions. As a program matures, if a sustainable market for the service isdeveloping, program costs should decline while the number of entrepreneurs acquiringthe service will continue to increase on an annual basis. Figure 6 provides a hypotheticalexample of what it might look like to compare annual program costs (net) to the annualnumber of entrepreneurs who are acquiring services. Since most agencies collect bothdata sets, the indicator would be easy to apply. If a service is becoming sustainable, thenmore people would continue to be served as net program costs, or subsidies, decline.
Microenterprise Best Practices Development Alternatives, Inc.
26
Figure 5: Sample Report on Sustainability
Activity InstitutionCommercial?Temporary? Cost ($) Recovery ($) Recovery (%)
Business opportunityidentification/marketresearch (facilitator)
ApproTEC TemporaryNoncommercial N/A N/A N/A
Technology design anddevelopment (facilitator) ApproTEC Temporary
Noncommercial 94,882 0 0%
Selection, training,and equipping ofmanufacturers(facilitator)
ApproTEC TemporaryNoncommercial 7,548 4,000 53%
Marketing and promotion(facilitator?) ApproTEC Ongoing
Noncommercial 142,744 14,667 10%
Machine manufacturing(provider)
Independententerprises
OngoingCommercial
19,500KSH permachine
23,500 KSHper machine 121%
Machine distribution(provider)
Independententerprises
TemporaryCommercial
23,500KSH permachine
26,500 KSHper machine 113%
Oil pressing business MSE customer TemporaryCommercial
Impact monitoring(facilitator) ApproTEC Ongoing
Noncommercial 6,191 0 0%
Source: ApproTEC’s oil pressing program in Kenya.
Figure 6: Proposed Sustainability Indicator, Market Level
BDS Market Sustainability Measure
0
50
100
150
200
250
300
350
400
450
1 2 3 4 5 6 7 8
Years
Peo
ple
/$ Program Cost
People Served, Annually
Chapter Two—Performance Measurement Framework And Core Indicators
27
Issues with Measuring Sustainability
# Payback period. Is payback period, as assessed by customers, a reasonable reflection ofsustainability of BDS usage? It would be more reflective of the value of the service toassess how long the person continues to reap profit from the investment or what thereturn on the investment is. However, both are more complicated to measure. This is anunresolved issue.
# Sustainable service delivery vs. sustainable institution. Many BDS providersdifferentiate between the sustainability of the service and the sustainability of theinstitution. If a program is designed to build the capacity of cooperatives or private sectorbusinesses to provide services, then the institution managing the program, the facilitator,is unlikely to capture the bulk of fees for services—rather, these will be captured by thebusinesses or cooperatives. Thus, the focus of these programs is on the sustainability ofthe service or the provider, rather than the institution managing the program. In otherprograms, however, the BDS facilitator is an active provider, perhaps marketing MSEcustomer products, and hopes to become financially sustainable. The frameworkincorporates both types of program designs by differentiating between “provider”functions and “facilitative” functions and examining cost-recovery in both categories. Aremaining challenge is to define clearly which activities are “facilitative” and which are“provider” and then ensure that costs are appropriately allocated.
# BDS institutions are not sustainable yet. BDS institutions are still developingappropriate services and delivery mechanisms. This process is expensive, and cost-recovery is minimal when a nonprofit institution is assessed. Because businessdevelopment services are often quite specific to particular markets and sectors, servicedevelopment and facilitation costs are likely to remain high. At the same time, it isimportant for BDS programs to work toward financially sustainable models. Theframework addresses this issue by breaking down costs into specific activities. Theactivities themselves can be assessed for financial sustainability, and subsidies can beidentified and justified.
# Capturing costs in public goods programs. Some BDS activities are public goods, orthey are addressing market failures for which it is difficult to capture fees for service.Activities supplying public goods will be reflected in the framework as ongoing activitiesthat are not financially sustainable. Although this is a bias in the framework, it can alsobe an incentive for BDS providers to identify paying MSE customers.
# Entrepreneurs cannot afford BDS services. Unlike credit programs, businessdevelopment services usually require that entrepreneurs pay first and benefit later. Poorcash flow and the high costs of services often prevent entrepreneurs from paying the fullcost of services. This reality will also be reflected in the framework, which willencourage BDS facilitators to find financing solutions other than ongoing subsidies.
# Copycats. The definition and methodology for assessing copycats needs to be developed.
Microenterprise Best Practices Development Alternatives, Inc.
28
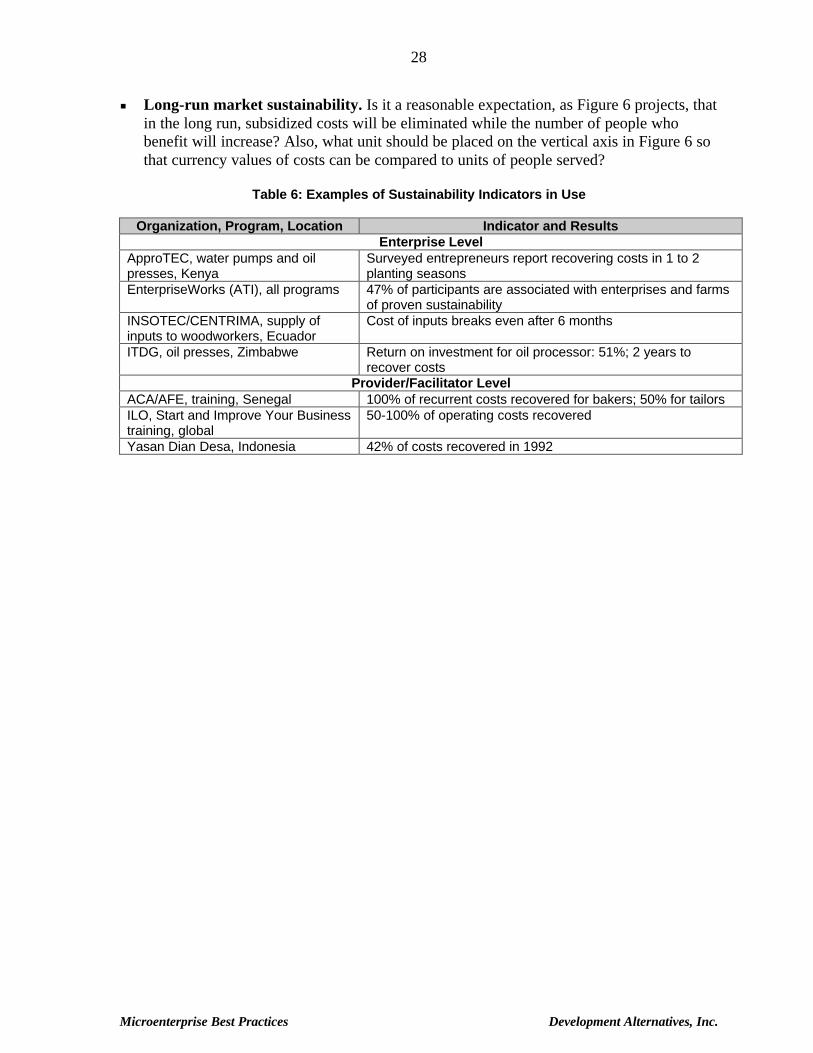
# Long-run market sustainability. Is it a reasonable expectation, as Figure 6 projects, thatin the long run, subsidized costs will be eliminated while the number of people whobenefit will increase? Also, what unit should be placed on the vertical axis in Figure 6 sothat currency values of costs can be compared to units of people served?
Table 6: Examples of Sustainability Indicators in Use
Organization, Program, Location Indicator and ResultsEnterprise Level
ApproTEC, water pumps and oilpresses, Kenya
Surveyed entrepreneurs report recovering costs in 1 to 2planting seasons
EnterpriseWorks (ATI), all programs 47% of participants are associated with enterprises and farmsof proven sustainability
INSOTEC/CENTRIMA, supply ofinputs to woodworkers, Ecuador
Cost of inputs breaks even after 6 months
ITDG, oil presses, Zimbabwe Return on investment for oil processor: 51%; 2 years torecover costs
Provider/Facilitator LevelACA/AFE, training, Senegal 100% of recurrent costs recovered for bakers; 50% for tailorsILO, Start and Improve Your Businesstraining, global
50-100% of operating costs recovered
Yasan Dian Desa, Indonesia 42% of costs recovered in 1992
Chapter Three—Next Steps
29
CHAPTER THREENEXT STEPS
The proposed MBP performance framework is based on documented BDS programevaluations and limited practitioner input. To further develop the validity and practicality ofthe tool and to ensure its global relevance for practitioners and donors, it needs to be furtherrefined, developed, and field tested. There are four immediate next steps in finalizing a set ofcore indicators based on input from a wider audience.
1) Virtual conference on the BDS performance framework. USAID, the InternationalLabour Organization, and the Committee of Donor Agencies for Small EnterpriseDevelopment will invite practitioners, donors, and researchers to participate in an electronicconference to discuss and further develop the MBP BDS performance framework.Participants will be presented with the framework and given an opportunity to:
# Raise concerns and alternative approaches;
# Suggest solutions to key issues already identified and new issues;
# Suggest additional cases and indicators to the framework;
# Further develop practical and valid methodologies for assessing the indicators; and
# Exchange views about performance measurement and develop a deeper understanding ofthe rationale of performance measurement choices made in the framework.
The conference will likely be organized around the five key indicator groups: scale, outreach,impact, cost-effectiveness, and sustainability. The dialogue will consider alternativeapproaches to performance measurement, identifying solutions to unresolved issues in theframework and any other issues identified by participants. In addition, the conference willbring out more examples of indicators and methodologies, more data on BDS performance,and potential partners for field testing the framework. The outcome will be a revised andimproved framework, understood by the global community of organizations involved in BDSprograms, and recommendations for next steps in field testing the framework and developingbest practice standards. In addition, the MBP Project can use this forum to identify partiesinterested in participating in field tests and further research, and the Committee of DonorAgencies can use the framework to guide the next round of case studies for its third BDSconference in Vietnam.
2) Development of research tools. Although the indicators are based on practice, the MBPframework points to the need to adapt data collection methodologies to fit the adjustedindicators. These tools are in their conceptual stage in the framework and will be developedfurther in the virtual conference. Finally, guidance and tools are needed to instruct
Microenterprise Best Practices Development Alternatives, Inc.
30
institutions on how to apply the performance framework. The following areas will require themost significant effort:
§ Definition of terms;
§ Definition and method for counting copycat providers;
§ Customer survey, primarily for identifying outreach, use, and benefits, but also forassessing payback period;
§ Guidance for calculating impact indicators, particularly for articulating the timeframe formeasuring benefits and defining use and benefits;
§ Guidance for allocating costs to a BDS program and adjusting to real values—for cost-effectiveness and sustainability indicators; and
§ Guidance for breaking down facilitative and provider functions.
This work will be done after the virtual conference to accommodate input from theconference.
3) Field testing. Because some aspects of the framework are already in practice, they do notneed to be tested. However, the newly proposed tools and the framework as a whole wouldrequire a trial run. This may come in two forms. First, MBP may form partnerships withnumerous practitioners who agree to formulate their existing data into the framework to seewhether it can be applied to existing evaluation systems. Second, MBP may formpartnerships with several practitioners to test the framework by collecting raw data fromclients. This activity would be developed in greater detail with input from practitioners at thevirtual conference.
4) Presentation of the framework at the Committee of Donor Agencies for SmallEnterprise Development Conference in Hanoi in 2000.
LONG-TERM APPLICATIONS FOR THE BDS PERFORMANCEMEASUREMENT FRAMEWORK
Once field tested and finalized, the framework can be used to:
# Inform program managers of progress in meeting goals and satisfying customers;
# Objectively select best practice cases for research and identification of best practices;
# Develop program selection criteria;
Chapter Three—Next Steps
31
# Develop program performance standards; and
# Collect regular data on the indicators used by service-specific programs and, thus,develop service-specific performance indicators and standards.
In this manner, it is hoped that the framework will contribute significantly to pushingforward the field of BDS programs to serve larger numbers of microenterprises moresustainably.

Microenterprise Best Practices Development Alternatives, Inc.
32
Bibliography
33
BIBLIOGRAPHY
ApproTEC. “Akili Project—Kenya Final Evaluation.” June 1997.
Barnes, Carolyn. “Assets and the Impact of Microenterprise Finance Programs,” AIMS BriefNo. 6, USAID, August 1996.
Barton, Cliffton. “Micro Enterprise Business Development Services: Defining InstitutionalOptions and Indicators for Performance,” USAID/DAI/MBP, September1997.
Bear, Marshall. “Building Markets for Business Development Services,” USAID/DAI/MBP,1998.
Bell, Charles, and Joseph Thomas. “Overview of MSP Sustainability Strategies,”USAID/Peru, December 1995.
Bowman, Margaret, et al. “Measuring Our Impact: Determining Cost-Effectiveness of Non-Governmental Organizations Development Projects,” Norwalk, Connecticut: TechnoServe,1989.
Brown, David W., and Neville Gnanapragasam. “NGO Development of Small Farmer Agro-Enterprises in Sri Lanka: A Study of Impacts, Useful Ideas, Lessons and Issues for FiveUSAID-Assisted NGO Programmes,” USAID Mission to Sri Lanka, November 1994.
Chen, Martha Alter. “Assessing the Impact of Microenterprise Services at the IndividualLevel,” AIMS Brief No. 16, USAID, November 1997.
Chen, Martha Alter (ed.). Beyond Credit: A Subsector Approach to Promoting Women’sEnterprises, Canada: Aga Khan Foundation, 1996.
Cohen, Monique, and Gary Gaile. “CGAP Working Group Impact AssessmentMethodologies: Highlights and Recommendations of a Virtual Meeting,” AIMS Brief No.13, USAID, May 1997.
Creevey, Lucy E., Koumakh Ndour, and Abdourahmane Thiam. “Evaluation of the Impactsof PRIDE/VITA [Programme Integre pour le Developpement de l’Entreprise/Volunteers inTechnical Assistance, Inc.], the Guinea Rural Enterprise Development Project,” GEMINItechnical report, No. 94, USAID/DAI, September 1995.
Dawson, Jonathan. “Beyond Credit: The Role of Complementary Business DevelopmentServices in Promoting Innovation Among Small Producers,” ITDG, Rugby, U.K., 1997.
Department for International Development. “Report on the Mid-Term Evaluation of theApproTEC Money Maker Pedal Pump,” British Development Division in Eastern Africa(BDDEA)/Department for International Development, January 1998.
Microenterprise Best Practices Development Alternatives, Inc.
34
Donor Committee for Small Enterprise Development. “Business Development Services forSMEs: A Preliminary Guideline for Donor-Funded Interventions—A Report to the DonorCommittee for Small Enterprise Development,” Donor Committee for Small EnterpriseDevelopment, April 1997.
Dunn, Elizabeth, et al. “Risks and the Impact of Microenterprise Services,” AIMS Brief No.4, USAID, August 1996.
Gaile, Gary, and Jennifer Foster. “Review of Methodological Approaches to the Study of theImpact of Microenterprise Credit Programs,” AIMS Brief No. 2, USAID, July 1996.
Goldmark, Lara, et al. “Preliminary Survey Results and Case Studies on BusinessDevelopment Services for Microenterprises,” Washington, D.C.: IDB, January 1997.
Grant, William. “Review of Donor-Funded Projects in Support of Micro- and Small-ScaleEnterprises in West Africa: Case Studies,” GEMINI technical report, No. 54b, March 1993.
Gunatilleke, Nimal G., and Hannan Ezekiel. “Developing the System of Business ServiceOrganizations and Enhancing Policy Dialogue: An Analysis of Selected Activities of thePrivate Sector Policy Support Unit, Sri Lanka,” University of Maryland at College Park.
International Science and Technology Institute, Inc. U.S. Agency for InternationalDevelopment. USAID Mission to Sri Lanka, October 1993.
Hagblade, Steven, and Donald Mead. “An Overview of Policies and Programs for PromotingGrowth of the Rural Economy,” draft paper.
Himes, Christina, and Lisa Servon. “Measuring Client Success: An Evaluation of Accion’sImpact on Microenterprises in the United States,” The U.S. Issues Series No. 2. Accion,April 1998.
Holtzman, John S., et al. “Innovative Approaches to Agribusiness Development in Sub-Saharan Africa. Volume 2: Secondary Research Findings—Final Report,” Abt Associates,Inc., USAID.
Hutchins, Rob, and Alan Gibson. “Kenya Management Assistance Programme: InnovativeDelivery of Counselling and Training: A Case Study on Business Development Services forSMEs,” Durham, U.K.: Springfield Centre for Business in Development,” July 1998.
Hulme, David. “Impact Assessment Methodologies for Microfinance: A Review,” USAID,AIMS Brief No. 164, August 1997.
Hyman, Eric, Lisa Stosch, and Valeria Budinich. “1995 Report on ATI’ s Program Impactand Learning,” Washington, D.C.: ATI (EnterpriseWorks), December 1996.

Bibliography
35
Hyman, Eric, and Luz Marina Delgado. “Midterm Evaluation of the Guatemala CeramicsProducers Project,” Washington, D.C.: ATI (EnterpriseWorks), February 1995.
Hyman, Eric, Errine Tukae Njiku, and Jonathan Herz. “Building the Capacity of the PrivateSector in Rural Tanzania Through the Promotion of Rural, Small Scale Oilseed Processing:An Evaluation of Phase I of the T-PRESS Project,” Washington, D.C.: ATI(EnterpriseWorks), July 1998.
Hyman, Eric, et al. “Building the Capacity of the Private Sector to CommercialiseTechnologies for Small Scale Irrigation in Senegal,” Science, Technology & Development,Vol .15, No. 1, April 1997, pp. 63-91.
Hyman, Eric, et al. “Commercialisation of Efficient Household Charcoal Stoves in Senegal,”Science, Technology & Development, Vol. 14, No. 1, April 1996, pp. 1-20.
IDE. “A Business Plan reflecting the Consolidation of International DevelopmentEnterprises—Bangladesh and the Emerging Krishok Bandhu Network. Colorado:International Development Enterprises, January 1994.
Inserra, Anne. “A Review of Approaches for Measurement of Microenterprise andHousehold Income,” USAID, AIMS Brief No. 8, September 1996.
Kerr, Kate, and Mary Lee McIntyre. “Final Program Evaluation: Export EnhancementProgram/Hungary—Aid to Artisans,” USAID Mission to Hungary, June 1995.
Litte, Peter. “Income and Assets as Impact Indicators,” USAID, AIMS Brief No. 12,February 1997.
Lusby, Frank. “Case Study and References,” Washington, D.C.: Action for Enterprise, 1997.
Nelson, Candace. “Training Goes to Market: A Comparative Study of Two Kenyan TrainingPrograms,” USAID/DAI/MBP, 1997.
Lusby, Frank. “Recommended Indicators for Peace Corps Business Advisory ServicesProgram,” internal document, 1997.
Pearson, Roland, et. al. “Final Evaluation and Sustainability Plan for the Swaziland BusinessManagement Extension Program: Final Report,” USAID Mission to Swaziland, November1994.
“Program Evaluation: Private Enterprise Development (K-MAP),” USAID Mission toKenya, July 1993.
Ritchie, Anne. “BRAC Rural Development Programme (RDP III). 1993 Monitoring Review.Micro Enterprise Program Review,” December 1993.
Microenterprise Best Practices Development Alternatives, Inc.
36
Saltzman, Sonia, et al. “Performance Standards in Microfinance: Accion’s Experience withthe CAMEL Instrument,” Discussion Paper Series, Document No. 7. Accion, 1998.
Sauder, Allan. “International Development Enterprises Evaluation of Marketing AppropriateTechnology Phase III,” Winnipeg, Manitoba: MEDA Consulting Group, October 1992.
Sebstad, Jennifer, and Gregory Chen. “Overview of Studies on the Impact of MicroenterpriseCredit,” AIMS Brief No. 1, USAID, July 1996.
Snodgrass, Donald. “Economic, Policy and Regulatory Environment,” AIMS Paper No. 7,USAID, September 1996.
Stosch, Lisa, and Eric Hyman. “ATI’s Impact Tracking System “(1996) and “Guidelines forCompleting the Impact Tracking Forms,” Washington, D.C.: EnterpriseWorks Worldwide,April 1997.
TechnoServe, Peru. “The Santa Valley Cost-Effectiveness Study,” July 1997.
TechnoServe. “Technoserve Core Indicators,” Internal memo, TechnoServe, March 1998.
Tolentino, A. “Guidelines for the Analysis of Policies and Programs for Small and MediumEnterprise Development,” ILO, 1995.
Tolentino, A. “Training and Development of Entrepreneurs/Managers of Small Enterprises:Pointers & Lessons Learned,” ILO, 1997.
USAID. “Tracking Cost-Effectiveness in Business Support Services: Developing SustainablePrograms.” Proceedings of a workshop at USAID Office of Microenterprise Development,December 1995.
USAID. “Evaluation of International Executive Service Corps (IESC) Component of thePrivate Enterprise Development Project,” USAID Mission to Kenya, October 1993.
USAID. “Evaluation of the Business Centre Project in Tanzania,” Vethouse Associates, Inc.and U.S. Agency for International Development, October 1995.
USAID, MDO. “Assessing the Impacts of Microenteprise Development: A Framework forAnalysis.” USAID MDO Brief No. 9, 1995.
Women’s World Banking. “Business Development Services for Micro and SmallEnterprises—A Resource Guide,” Women’s World Banking, June 1996.
Wortman, Miles. “Government Supported Business Development Services for Small andMedium Enterprises: A Survey of Good Practices,” Private Sector Development Program ofUNDP, November 1997.

I-1
ANNEX I
DEFINITION OF TERMS

I-2
I-3
Aquisition, Acquirers: People purchasing a service or obtaining it through commercialtransactions, such as selling a product through a marketing company, as differentiatedfrom those who are known to make use of it or those who are known to benefit from it.
Barriers to Self-Employment: Constraints faced by disadvantaged people in trying tobecome self-employed, including gender, ethnicity, geographic location, education level,disability, and political status.
BDS Facilitator: Organizations identifying, developing, and disseminating businesssupport services for microentrepreneurs or farmers.
BDS Provider: Organizations or enterprises supplying a business development servicedirectly to microentrepreneurs or farmers.
Best Practices: The most effective means to organize, select, deliver, or monitor businessdevelopment services for microenterprises currently in use.
Benefits, People Benefiting: Intended improvements resulting from the use of a businessdevelopment service; the people who have procured a service and are known to beexperiencing intended improvements as a result. The customer’s objectives are satisfiedby the use of the service.
Business Development Services: Non-financial microenterprise development support(for example, training services, technology development and dissemination, marketingassistance, and policy advocacy).
Commercial Transactions: Paying a fee for a service or selling goods or services.
Copycats: Organizations or enterprises that begin providing a service because theyobserved another organization or enterprise doing so, rather than through specific trainingor technical support.
Cost-Benefit Analysis: A specific tool that compares overall program costs to overallfinancial and quantitative social benefits resulting from program activities.
Cost-Effectiveness: A specific tool that compares program costs against some measure ofprogram output, such as the quantity or the value of goods sold.
Cost-Recovery: The practice of collecting fees for services to pay for the expensesincurred in providing the services to customers.
Deflated: Adjusted to real values; adjusting for inflation.
I-4
Impact: Changes in people’s lives as a result of achieving the benefits of a businessdevelopment service.
Indicator: Data that reflect the assessment of a particular outcome or result.
Methodology: Process for collecting and analyzing data to produce an indicator.
Outreach: The spread of services in the market, particularly the spread of services tounder-served populations and throughout a wide geographic area.
Payback Period: Average time it takes for an investment to pay for itself in increasedprofit.
Performance Standard: A specific level of an indicator that represents best practices.
Repeat Customer: Entrepreneur or farmer who procures a business development servicethrough a commercial transaction more than once.
Scale: The number of people a service reaches.
Sustainability: Ensuring that services and benefits continue in the long run.
Use, Users: Having procured business development service; using it as intended. Thismay be operating a new technology, developing new products, marketing to newcustomers, or applying new accounting systems.
Value: The customers’ estimate of the ability of the business development service tosatisfy their needs.
II-1
ANNEX II
EXAMPLE CASES OF PERFORMANCE INDICATORS IN USE

II-2
II-3
ACA and Action for Enterprise: Implemented training and sector development workwith tailors and bakers in Senegal (Lusby, 1997).
ApproTEC, Appropriate Technologies for Enterprise Creation: Operates the Akiliproduct development training project, treadle water pump development anddissemination, and oil press development and dissemination in Kenya (DFID, 1998;ApproTEC, 1997).
BRAC, Bangladesh Rural Action Committee: Reference is made to BRAC’s poultrydevelopment and deep tube wells programs for rural women in Bangladesh (Chen, 1996;Richie, 1993).
EnterpriseWorks Worldwide (formerly Appropriate Technology International, ATI):EnterpriseWorks contributed its program tracking system, which is largely based on cost-benefit analysis. Specific programs referred to include the oil press program in Tanzaniaand the Alpaca fiber program in Bolivia (Hyman, 1996, 1998).
IBD, Inter-American Development Bank: Provided survey results and analysis of theBDS program portfolio. The particular program referred to in this study is the trainingvoucher program in Paraguay (Goldmark, 1996).
IDE, International Development Enterprises: Implemented a treadle water pumpprogram in Bangladesh and other south Asian countries (IDE, 1994).
INSOTEC, CENTRIMA: Facilitated supply cooperatives in Ecuador (Dawson, 1997).
ITDG, Intermediate Technology Development Group: Reference is made to an indicatorin the oil press program in Zimbabwe (Dawson, 1997).
K-MAP, Kenya Management Assistance Programme: Provides business consulting andtraining services in Nairobi, Kenya (Hutchins, 1998).
MEDA, Mennonite Economic Development Agency: Supported the development ofPROARTE, a crafts marketing company in Nicaragua (Goldmark, 1997).
SEROTEC: A nonprofit business support organization that facilitates cluster networks inChile (Dawson, 1997).
SEWA, Self-Employed Women’s Association: Organizes and advocates on behalf ofself-employed women in India (Chen, 1996).
SIYB, Start and Improve Your Business, International Labour Organization: A fewgeneral indicators were distilled from Tolentino, 1995.
II-4
TechnoServe: Contributed its performance measurement system, which is a cost-benefitanalysis system. Specific reference is made to TechnoServe’s support for community-based enterprises in the Santa Valley, Peru (TechnoServe, 1997).
United States Peace Corps: A few general indicators were distilled from Lusby, 1997.
WWB, Women’s World Banking: Contributed its international survey of BDS programsconducted in 1996 (WWB, 1996).
YDD, Yasan Dian Desa: An NGO in Indonesia with a focus on dissemination ofappropriate technology that has been particularly active in the fish sector (Dawson,1997).

III-1
ANNEX III
ORGANIZATIONS AND INDIVIDUALS CONSULTED

III-2
III-3
ORGANIZATIONS AND INDIVIDUALS RECEIVING REQUESTS FOR BDSPROGRAM EVALUATION AND PERFORMANCE INFORMATION
Roberto R. CalingoPhilippines Business for Social Progress3/F PSDC Bldg.Magallanes cor. Real Sts.Intramuros, [email protected]
Marilyn CarrUNIFEM/UNDP/New YorkTel: [email protected]
Marty ChenHarvard Institute for InternalDevelopment14 Story StreetCambridge, MA [email protected]
Jonathan Dawson1 Garden TerraceHebden BridgeWest Yorks 1 [email protected]
Martin Fisher, [email protected]
Allan Gibson and Mark HaversSpringfield CenterDurham, [email protected]
Lara Goldmark, IDB1330 New York Ave., NWWashington, DC [email protected]
Malcolm HarperOld FarmhouseFilgrave BucksEngland MK109ETUK
Eric Hyman, EnterpriseWorks1828 L St. NW, Suite 1000Washington DC 20036Tel: (202) [email protected]
Anne Inserra, MSI/PMP1611 N. Kent St., Suite 803Arlington, VA 22209Tel: (703) 312-7540
Jennifer Isern, [email protected]
Steve LondnerTechnoServe40 Day StreetNorwalk, CT [email protected]
Frank LusbyAction for Enterprise3527 S. Utah StreetArlington, VA [email protected]
Mohini MalhotraCGAP Secretariat1818 H Street, NWRoom G4-115Washington, DC [email protected]

III-4
Catherine Masinde, DFID in [email protected]
Donald C. MeadMichigan State UniversityE. Lansing, MI [email protected]
Richard MeyerOhio State UniversityDepartment of Agricultural Economics2120 Fyffe RoadColumbus, OH [email protected]
Calvin MillerCARE151 Ellis St. NEAtlanta, GA [email protected]
Inez MurrayBusiness Development ServicesCoordinatorWomen's World Banking8 West 40th St.New York, NY [email protected]
Shams Mustafa, UNDPMUSTAFA%[email protected]
Candace NelsonSEEP70 Robbins RoadArlington, MA [email protected]
Larry Reed360 W. Butterfield Rd.Elmhurst, IL [email protected]
Allan SauderMEDA155 Frobisher Drive, Suite 1-106Waterloo, ON N2V 2E1
Don SchierlingExecutive Vice PresidentInternational Development Enterprises10403 West Colfax, Suite 500Lakewood, CO 80215Tel: [email protected]
Hugh [email protected]
Paul SevierTechnoServe1828 L St., NW, Suite 1040Washington, DC [email protected]
Jim Tanburn, [email protected]
Judith TendlerMIT(617) [email protected]
Didier ThysFreedom from Hunger1644 Davinci CourtDavis, CA 95617

III-5
SEEP WORKSHOP PARTICIPANTS
From DAI/MBP:
Mary McVayMarshall BearCandace Nelson, SEEPJoan ParkerRobin YoungNhu-An Tran
Participants:
Kim Alter, Save the ChildrenJaqueline Bass, Weidemann AssociatesKerk Burbank, Eastern CollegeJack Burga, COPEMETim Canedo, Action for EnterpriseGail Carter, ACDI/VOCAMonique Cohen, USAIDJeanne Downing, Weidemann AssociatesChad Evans, Latter-day Saint CharitiesJulian Gonsalves, IIRRAnicca Jansen, USAIDHugh Landry, Coady InstituteEtienne Larry, CECI (Canada)Steven Londner, TechnoServe, Inc.Kate McKee, USAIDCalvin Miller, CARENancy Natilson, Proj Mujer Int’lMary O’Keefe, ProdesarrolloRick Ringer, Dev-1 Consulting Ltd.Al Steiner, World PartnersVicki Tsiliopoulos, VITA

III-6

IV-1
ANNEX IV
MBP PUBLICATIONS SERIES

IV-2

IV-3

IV-4
Related Documents