Welcome message from author
This document is posted to help you gain knowledge. Please leave a comment to let me know what you think about it! Share it to your friends and learn new things together.
Transcript
Praise for this book
Bernard Marr’s latest book is an immensely valuable management
handbook as well as a great read! The approach he takes in
Strategic Performance Management is accessible to anyone. The book
includes tools, anecdotes, helpful hints and tips, and some fascinat-
ing case studies, making it a very practical guide for managers
hoping to transform the performance of their businesses.
Jocelyn Blackwell, Chief Executive Officer, Higham Group plc
This impressive book effectively melts the often disparate topics of
strategic analysis, performance measurement, and performance
management into a powerful framework for achieving strategic
success. Using practical examples and tools, Bernard Marr provides
fresh insights into the specific methods available to create a truly
performance-driven organization.
Christopher D. Ittner, Ernst & Young Professor of Accounting,
The Wharton School, University of Pennsylvania
At last, the definitive book on Strategic Performance Management!
In this comprehensive guide to the discipline, Bernard Marr has dis-
tilled theory and practice into the essential information any execu-
tive needs to take their performance management initiative to the
next level.
Steve Fluin, Chief Executive, performancesoft
In Strategic Performance Management Bernard Marr provides tren-
chant insights into how organizations can design and use metrics to
help maintain their dynamic capabilities in rapidly changing envir-
onments. The book is well written and will be insightful for both
academic and executive audiences at the senior level.
David Teece, Professor of Business Administration, Haas School
of Business, University of California at Berkeley
Bernard Marr has written a practical, yet thoughtful, book on strate-
gic performance management, which should provide a valuable
point of access to the subject for all managers – whether in the pri-
vate or public sectors. In a world of rapid and unpredictable change,
the emphasis on how they can create a structured learning environ-
ment is particularly apposite.
Dr Reg Hinkley, CEO, BP Pensions Trustee Limited
Bernard Marr provides a concise, focused, and tightly-integrated
approach to strategy analysis and performance management. The
performance-oriented approach to strategy development and man-
agement he outlines is superior to balanced scorecard approaches
because it is firmly based upon the fundamental drivers of value
creation.
Robert Grant, Professor of Management, Georgetown University
If you really want to improve the performance of your business read
this book first! Adopting its clear and practical advice will help ensure
success through visibility into what really matters and driving per-
formance that has real impact. It’s all here in one great book.
Nigel Youell, Business Performance Management Applications,
Hyperion Solutions
Bernard Marr has written a very valuable, insightful and easy to
read book on strategic performance management and value cre-
ation mapping. It will help to avoid that companies stay ignorant
to this important issue. The book shows practical and illustrative
cases and step-by-step guidance on how to go from management by
numbers to management by insights. In this book Bernard Marr
presents many well-designed templates for the identification of the
value proposition and value drivers, for the design of meaningful
performance indicators, and for the selection and adoption of soft-
ware applications for a more efficient and effective strategic know-
ledge navigation and decision making.
Leif Edvinsson, Professor of Intellectual Capital, Lund University
By skilfully blending research insights and real life experience,
Bernard Marr takes the reader on a journey through concepts, tools
and methodologies which enable managers to develop and execute
value driven strategies. He succeeds in creating a structured and
straightforward approach that will help managers at all levels of
any organization to become strategy focused leaders.
Fredrik Wastenson, President and CEO, Prodacapo AB
In a very pragmatic way this book outlines how to implement Strate-
gic Performance Management. By doing so, Bernard overcomes the
boundaries and shortcomings of the traditional Balanced Scorecard
approach and takes Performance Management to the next level: true
Strategic Performance Management!
Andreas Späne, Principal, Booz Allen Hamilton
Bernard Marr’s work on value driver mapping at Novo Nordisk has
been remarkably valuable. It allowed us to make transparent the
impact of our intangible heritage (Triple Bottom Line business
principle and Novo Nordisk Way of Management) on our overall
business performance. It also enabled us to include indicators for
our intangible performance drivers in our strategic planning and
ii Praise for this book
performance monitoring. I strongly recommend this book as a prac-
tical and inspirational tool to improve your strategic performance
management.
Hanne Schou-Rode, Vice President, Business Strategy &
Governance, Novo Nordisk A/S
Many organizations are still struggling to identify and manage the
value driver, both tangible and intangible, that help to deliver value
to their stakeholders. Unfortunately most books in this field are too
narrow, focusing either on the strategic aspects, on the performance
management issues, or on information technology matters. Bernard
Marr has done a great job by presenting a really integrated and
state-of-the-art approach to Strategic Performance Management – linking
together strategy and strategic planning, performance measurement,
and performance management (including the role of PM software).
This excellent book is a must read for everyone interested in per-
formance management.
Juergen H. Daum, CFO adviser, enterprise performance man-
agement expert, and Chief Solution Architect, SAP AG
Bernard Marr has authored another excellent book on measuring and
managing organizational value drivers. Especially the Value Creation
Map approach he has developed is a powerful tool to understand how
value is created and how the tangible and intangible assets interact as
value drivers. Bernard Marr’s approach has provided us with invalu-
able insights about our business and allowed us to validate our busi-
ness hypotheses.
Dr Holger Adelmann, Medical Science, AstraZeneca
Strategic performance management is high on the agenda of most
managers and senior executives.A superficial or wrong understand-
ing of performance management concepts often produces poor results
and disillusionment. Real benefits are only created by designing an
integrated system across the whole organisation based on common
understanding of strategic objectives. In this book Bernard Marr pro-
vides clear guidelines of how to make strategic performance manage-
ment work. Particularly insightful is his guidance on measuring
intangibles, which represents one of the key challenges for all organ-
isations. This book is entertaining to read, very comprehensible and
is brought alive by numerous real-life case studies. It will prove to
be of invaluable help in designing an efficient strategic performance
management system for your organisation.
Norbert Büchel, Chief Executive Officer, Procos Professional
Controlling Systems AG
Praise for this book iii
Strategic Performance Management is an exceptional book and the
first strategic management book that focuses on measuring and
managing intangibles as the key value drivers in today’s organi-
zations. I highly recommend it to top managers that are looking
to build successful business recipes for a sustainable competitive
advantage.
José M. Viedma Martí, Professor of Business Administration
Polytechnic University of Catalonia, Spain
Bernard Marr profoundly challenges many prevailing assumptions
about measurement and management. It is your chance to be enlight-
ened. If you feel that you are measuring the wrong things, if you
feel you haven’t identified all your intangible value drivers, and if,
like DHL, you think you should, then read this book.Value Creation
maps are powerful tools to clarify your strategy by identifying and
visualizing your tangible and intangible value drivers.
Gary Crates, Commercial Director, DHL
Bernard Marr’s lucid and highly accessible book, filled with practical,
real-life examples, is a pleasure to read and will greatly benefit any
organization that takes his thinking to heart.
Kenneth Donaldson, Director of Pensions Strategy, Dunnett
Shaw Ltd
Strategic Performance Management provides a great combination of
tools, cases, and philosophies that have helped much-admired firms
develop their performance management systems to deliver their strat-
egy. This book is an excellent road map for managing for excellence
in a format that is easy to understand and easier to implement.
Dr Yasar Jarrar, Executive Dean, Dubai School of Government
Do we need any more books on performance management, you might
ask? Well, if these books are anything like Bernard Marr’s book,
keep them coming! With well chosen examples and anecdotes, often
funny and always insightful, Strategic Performance Management is a
delight to read and even better it will entice the reader to act.
André A. de Waal, Associate Professor, Maastricht School of
Management, The Netherlands
This book provides invaluable insights on the approaches to linking
different parts of an organisation to provide a coherent view on
performance. I recommend it to professional accountants in busi-
ness seeking a more sophisticated and practical approach to per-
formance management.
Stathis Gould, Technical Specialist, Chartered Institute of Manage-
ment Accountants
iv Praise for this book
In Strategic Performance Management Bernard Marr gives good
examples of existing best practices and fresh insights into performance
management. There is something for everyone to learn in this book.
John Wilkes, Head of Performance Management, Capgemini UK
The book Strategic Performance Management tackles one of the most
important challenges corporations are facing today: the design of a
system to measure and manage the tangible and intangible perform-
ance drivers. The book provides the reader with a great overview
and sufficient details.What I particularly like about it is that it brings
together scientific approaches with practical management needs.
Bernard Marr has done great job in extracting, developing and
describing sophisticated and applicable tools that will enable man-
agers to make strategic performance management work.
Professor Dr Klaus Möller, Technical University of Munich,
Germany
With Strategic Performance Management Bernard Marr provides
clear guidance on how to overcome the challenge of effectively and
efficiently connecting strategy to action. He avoids the common trap
of proposing an all new ‘silver bullet’ strategy process or tool and
instead provides the context within which to connect existing the-
ories and methodologies in a simple and straightforward way.
David McCormick, Corporate Strategy, Royal Dutch Shell plc
This book effectively communicates the core of modern thought on
the management of intangibles in a strategic context. It is accessible
and simple, but not superficial or simplistic. It is a good overview
of the central themes in modern performance management and it
integrates fields such as management control, strategy, and intan-
gibles. Bernard Marr outlines a strong framework for the manage-
ment of businesses in the modern economy.
Jan Mouritsen, Professor, Copenhagen Business School, Denmark
This book provides comprehensive guidelines of how to develop
a strategic performance management system. With his step-by-step
approach, illustrated by real life examples, Bernard Marr ensures that
organizations identify, measure and manage the essential value driv-
ers that really matter.
Professor Dr Péter Horváth, IPRI – International Performance
Research Institute, Stuttgart, Germany
If you read only one management book this year, make it StrategicPerformance Management by Bernard Marr.This terrific book sets new
standards of how to measure and manage what really matters in
organizations today. In a thought-provoking manner, Bernard Marr
Praise for this book v
demonstrates why many traditional approaches to performance man-
agement are doomed to failure. I believe every business leader can
benefit from Bernard Marr’s refreshing thinking on strategic per-
formance management.
Roger Camrass, Director, Business Transformation Group, Fujitsu
This is an outstanding book! Bernard Marr provides leading edge
thinking on strategic performance management presented in an
engaging and practical way. This book is a milestone and a must
read for every manager trying to manage strategic performance.
Eggert Claessen, Managing Director, Tolvumidlun Ltd and
Chairman, GoPro Ltd
Excellent book! In Strategic Performance Management Bernard Marr
describes how managers can get a firm grip on their corporate per-
formance. He shows remarkable insight into this topic and fresh ideas
to make performance management work. With this book, Bernard
will teach you how to put passion into performance.
Frank Buytendijk, Research Vice-President Corporate Perfor-
mance Management, Gartner
Bernard Marr has done it again! With Strategic Performance Man-agement he delivers a fascinating, refreshing, and actionable read.
This book is not only a delight to read, it will open your mind,
guide you through the distracting complications and traps of meas-
uring and managing performance, and leave you with a clear vision
of strategic performance management for the 21st century.
Stuart Crainer, Editor, Financial Times Handbook of Management,
Editorial Fellow, London Business School
vi Praise for this book

Strategic Performance
Management

I dedicate this book to the two most important people in my life
my wonderful wife Claire and our daughter Sophia Kristina

Strategic Performance
Management
Leveraging and measuring your
intangible value drivers
Bernard Marr
AMSTERDAM • BOSTON • HEIDELBERG • LONDON • NEW YORK • OXFORD
PARIS • SAN DIEGO• SAN FRANCISCO • SINGAPORE • SYDNEY • TOKYO
Butterworth-Heinemann is an imprint of Elsevier
Butterworth-Heinemann is an imprint of ElsevierLinacre House, Jordan Hill, Oxford OX2 8DP, UK30 Corporate Drive, Suite 400, Burlington, MA 01803, USA
First edition 2006
Copyright © 2006, Bernard Marr. Published by Elsevier Ltd.All rights reserved.
The right of Bernard Marr to be identified as the author of this work has been asserted in accordance with the Copyright, Designs and Patents Act 1988
No part of this publication may be reproduced, stored in a retrieval system or transmitted in any form or by any means electronic, mechanical, photocopying, recording or otherwise without the prior written permission of the publisher
Permissions may be sought directly from Elsevier’s Science & Technology Rights Department in Oxford, UK: phone (�44) (0) 1865 843830; fax (�44) (0) 1865 853333; email:[email protected] you can submit your request online by visiting theElsevier web site at http://elsevier.com/locate/permissions, and selecting Obtaining permissionto use Elsevier material
NoticeNo responsibility is assumed by the publisher for any injury and/or damage to persons or property as a matter of products liability, negligence or otherwise, or from any use or operationof any methods, products, instructions or ideas contained in the material herein. Because ofrapid advances in the medical sciences, in particular, independent verification of diagnoses anddrug dosages should be made
British Library Cataloguing in Publication DataA catalogue record for this book is available from the British Library
Library of Congress Cataloging-in-Publication DataA catalog record for this book is available from the Library of Congress
ISBN-13: 978-0-7506-6392-2ISBN-10: 0-7506-6392-8
Printed and bound in Great Britain
06 07 08 09 10 10 9 8 7 6 5 4 3 2 1
For information on all Butterworth-Heinemann publications
visit our web site at books.elsevier.com
Contents
About the author xiii
Preface xv
Introduction 1
Part I Understanding and clarifying the strategic context 15
1 Understanding the strategic boundary conditions – purpose, values and goals 19
2 External strategic analysis – market-based view 273 Internal strategic analysis – resource-based view 394 Mapping and narrating value creation 62
Part II Managing performance in an enabled learning
environment 91
5 Performance indicators 976 Creating an enabled learning environment 1247 Extracting more management insights 146
Part III Automation of Strategic Performance Management 181
8 Benefits of automation 185
Appendix Selecting the appropriate software solution 197
Further reading on the topic 209
Index 211

This page intentionally left blank
About the author
Bernard Marr is one of the world’s leading experts on strategic per-formance management. He specializes in the identification, measure-ment, and management of value creation and strategic performancedrivers. In this capacity he has worked with many leading organiza-tions including Accenture,AstraZeneca, BP, DHL, Fujitsu, Gartner, HSBC,NovoNordisk, the Home Office, and Royal Dutch Shell. He has exten-sive work experience across the United States, Europe, Africa, theMiddle East and Asia, which makes him an acclaimed keynote speaker,consultant, teacher, and award-winning writer.
Having gained management experience in consulting, manufactur-ing and international trading corporations, Bernard Marr moved to theUniversity of Cambridge to become a management researcher at theJudge Institute of Management Studies. Since 1999 he has been aResearch Fellow at the renowned Centre for Business Performance at Cranfield School of Management, he also holds multiple visitingprofessorships.
Bernard Marr has contributed to over 100 books, reports, and arti-cles on topics such as Corporate Performance Management, BalancedScorecard, Strategy Maps, and Intangible Value Drivers. His recentbooks include Perspectives on Intellectual Capital: Managing,
Measuring and Reporting Intangibles, Weighing the Options: BSC
Software, and Automating your Scorecard.Currently, he is chairman of the international PMA IC Group,
Intangible Assets Editor of the journal Measuring Business Excellence,and a member of the editorial board of The Handbook of Strategic
Management and serves on the editorial boards of many leading jour-nals in the field. In its recent article ‘wise guys’ the CEO Journal rec-ognized Bernard Marr as one of today’s world-leading business brains.
For more information please see: http://www.cranfield.ac.uk/som/cbp/
Or e-mail: [email protected]

This page intentionally left blank
Preface
The term ‘Strategic Performance Management’, sometimes also called‘Corporate Performance Management’ or ‘Enterprise Performance Manage-ment’, has entered the agenda of most senior executives around theglobe. It is frequently used to refer to the processes of managing andmeasuring organizational performance. Today’s interest in the manage-ment and measurement of performance is driven not only by newcompliance and corporate governance regulations, but also by the urgeto identify, measure, and manage the organizational value drivers.Whereas identifying and managing traditional financial and physicalvalue drivers is difficult enough, identifying and leveraging the intan-gible value drivers is still seen as the holy grail of management.
Whereas executives and managers clearly recognize the vital import-ance of intangibles as key drivers of performance, their measurementand management is one of the weakest links in their strategic perform-ance management initiatives. I have been talking to many senior execu-tives, of both corporations and not-for-profit organizations, over the pastyears, and everyone shares the same frustration that the existing meas-ures are of little value. Even though record numbers of performancemeasures are being collected, often driven by the desire to provide bet-ter and more useful insights about the strategic value drivers, few valu-able insights are produced.
What everyone aspires to is to clearly understand how the strategicvalue drivers – tangible and intangible – help to provide the competen-cies needed to deliver value to all stakeholders. Following this under-standing, managers want relevant performance indicators that help themto extract worthwhile management insights.These insights should thenbe shared, discussed, validated and acted upon. Strategic performancemanagement is therefore used for strategic decision-making and learn-ing, not only at the executive level, but also throughout the entire organ-ization. In a performance-driven culture, strategy becomes everyone’severyday job. Relevant performance data is used to learn, to validate or
xvi Preface
challenge strategic assumptions, to assess risks, to evaluate the suitabilityof mergers and acquisitions, and most importantly to facilitate decision-making and actions.
This book is about how to put strategic performance managementinto practice. It is about how to identify, visualize and describe the tan-gible and intangible value drivers and the way they create core com-petencies, performance outputs, and value.And it is about establishingrelevant and meaningful performance indicators, which will then beused by everyone to extract insights, make decisions, validate andchallenge assumptions, assess risk, evaluate future directions, and tocontinuously learn.
The ideas, concepts and tools presented in this book are groundedin fields including strategic management, organizational learning, the-ory of measurement, and psychology. The tools and concepts haveproven to be powerful enablers of strategic performance managementinitiatives not only in world-leading corporations, but also in not-for-profit organizations, as well as central and local government institu-tions. The book is deliberately designed to be applicable for anyorganization, be it an international corporation, a small or medium-sized business, a business unit, department, a not-for-profit organiza-tion or a government institution. Throughout this book I will use theterm ‘organization’ to refer to all of the above.
Organizations that have successfully deployed many of the toolsand concepts described in this book include Astra Zeneca, BP, DHL,Fujitsu, Novo Nordisk, The Executive Office in Dubai, Royal DutchShell, as well as banks, insurance companies, manufacturing firms, andvarious local and central government institutions around the world.Without these organizations it would have been impossible for me tocreate my insights and tools and I would like to thank all of the manyexecutives, managers, and employees I have worked with over theyears.All of them have helped to shape my thinking.
The second major source of influence has come from my col-leagues at the Centre for Business Performance at the Cranfield Schoolof Management. This group of leading experts in measuring and man-aging performance has been an incubator for ideas and concepts onthe topic. It is impossible to create a book like this in a vacuum andmany of the ideas presented in this book have their roots in this greatreservoir of knowledge. However, this book is my cut of this jointpool of expertise. I would like to thank every single member of theCentre for Business Performance for providing me with a continu-ously stimulating and challenging environment, for their support andfriendship as well as the many valuable insights they provide. I wouldlike to mention Mike Bourne, Monica Franco, Dina Gray, Mike Kennerley,

Veronica Martinez, Steve Mason, Pietro Micheli, Karim Moustaghfir,Andy Neely, Göran Roos, and J. C. Spender. I would also like to thankmy colleagues who work ‘behind the scenes’, in particular AngelaWalters, Eva Barton, Sue Gregory, and Sue Gow and Jacqueline Brown.
Colleagues from other institutions who have been inspirational andsignificantly shaped my thinking on strategic performance manage-ment include Chris Argyris, Robert Grant, Chris Ittner, Robert Kaplan,Baruch Lev, Jan Mouritsen, Giovanni Schiuma, and David Teece. Thereare so many other individuals who have also influenced my thinkingand I hope they know who they are and how much I have valued anyinput and dialogue over the years. Special thanks go to Chris Adamsfor editorial support and to Tim Goodfellow for providing the oppor-tunity of turning my intangible ideas into a tangible book.
The other force that consciously challenges me, supports me, andgave me the space and time to write another book is made up of myfamily, my brother Marc Andre Marr, Julie and Alan Parkins, and espe-cially my beloved wife Claire and our daughter Sophia Kristina.
Preface xvii

This page intentionally left blank
Introduction
Today’s business world requires new approaches towards StrategicPerformance Management. The wrong approach will often drive dys-functional behaviour and jeopardize performance.Three key compon-ents of this problem are an incomplete picture of the strategy (thestrategy trap), the wrong performance measures (the measurementtrap), and the wrong approach towards managing performance (thePerformance Management trap). This book will outline how you canavoid these traps and provide you with the necessary tools to becomea truly performance-driven organization.
Imagine an organization with people who don’t really understand thestrategic goals and the direction where the organization is heading.The executive team of this organization believes that the noted down-turn in performance is in fact caused by this lack of strategic under-standing. They believe that they have a quite well-formulated strategybut need to improve its execution.To better align business unit perform-ance and employees’ activities with corporate objectives, the organiza-tion decides to initiate a Strategic Performance Management project. Keyelements of this are performance measures, which are developed bymanagers of each business unit.The managers hold brainstorm meetingsand create sets of measures based on the existing strategy. The teamsare careful to come up with measures for each of the different organ-izational functions and departments. It was quite easy to produce a setof measures and targets for most areas. These measures with targetsare then given to each functional manager and regular performanceevaluations are put in place to measure progress against targets.A bonuspool is created for all managers and therefore achieving their targetswill result in better pay.
Nine months pass by and the regular performance evaluations revealthat alignment has improved. Most measures have moved towards the
targeted performance levels and some business units have already mettheir annual targets.The executive team sees this continuous progressand deems their Strategic Performance Management project as success-ful. However, when after twelve months the overall performance datais brought together it reveals that organizational performance has fallen,even though the measures and targets of the different business unitswere met. In addition to this, some key people within the organizationhave decided to leave, and the employee and customer surveys revealsharp deterioration in performance.
What happened here? First of all, this organization didn’t really havea well-formulated strategy; secondly it fell into both the classic meas-urement trap and Performance Management trap. The wrong thingswere being measured, and where the right things were measured thewrong metrics were used.These metrics were then imposed on peoplewho didn’t want to be measured and couldn’t see how these metricswould be useful for them.They were not able to see how the measureswere linked to the strategy. This in turn frustrated people immenselyand caused dysfunctional behaviour. Since people knew that their per-formance was being judged on their achievements of hitting their per-formance targets, this is what they concentrated on.The consequencewas that it eliminated cross-departmental collaboration as everyone wasonly interested in their own performance. Performance measurementbecame a game of providing numbers to someone who would collatethem and then prepare reports. People stopped caring about overallstrategic objectives and were only interested in what was being meas-ured. Human beings are extremely creative and very quickly deviseways of delivering a good measure result without necessarily deliveringgood performance – especially if they believe that the measures are notreally providing them with any interesting insights.
Consequences of poor Performance Management
There are countless examples that illustrate the dysfunctional conse-quences of poor Performance Management. One example I particularlylike comes from an airport – a complex organization with differentbusiness units. Here, key performance measures were developed for thedifferent functional areas of the airport. On the arrivals side, customersatisfaction is equated to channelling passengers through the airport asquickly and conveniently as possible.What customers want is that oncethe plane has landed it quickly reaches its final parking spot, passen-gers get off the plane and swiftly pass through passport control, collecttheir luggage, and easily reach their transport links for their onward
2 Introduction
journey. A key factor for success therefore is the amount of time ittakes to get the luggage off the plane and onto the conveyor belt in theluggage reclaim area. Luggage handlers were therefore given a measureand a target of fifteen minutes.The way it was measured was easy sincedata was available about landing times as well as operational data fromthe conveyor belts.The measured time therefore started once the planelanded and stopped once the luggage reached the conveyor belt and itstarted moving.
Instead of focusing on customer satisfaction – the overall objective –the baggage handlers saw hitting the measurement target as a game.They wanted to look good in their performance review and thereforeensured that one of the baggage handlers took their emergency vehicleand raced up to each plane once it reached its final parking spot, thengrabbed the first piece of luggage off the plane, raced back to the ter-minal, put it on the conveyor belt and started the belt. This explainswhy this team, on paper, outperformed all other teams at the airport.It also explains why we see so many single pieces of luggage goinground on the conveyor belts of airports. Overall, it illustrates some ofthe dysfunctional consequences often caused by not understandingStrategic Performance Management and its behavioural implications.
What is Strategic Performance Management?
Strategic Performance Management is about creating an environment inwhich organizational performance becomes everyone’s everyday job.This involves a clear understanding by everyone in the organization of the strategic direction and competitive advantage as well as theiraccepted responsibility for continuous refinement of this strategic direc-tion. In such an environment employees use performance indicatorsto test and challenge the strategic assumptions that underlie perform-ance. Relevant performance indicators are collected to inform strategicdecision-making at all organizational levels, and not merely to put theminto reports that no one really cares about.
Strategic Performance Management (SPM) is therefore defined asthe organizational approach to define, assess, implement, andcontinuously refine organizational strategy. It encompasses method-ologies, frameworks and indicators that help organizations in theformulation of their strategy and enable employees to gain stra-tegic insights which allow them to challenge strategic assumptions,refine strategic thinking, and inform strategic decision-making andlearning.
Introduction 3
The strategy trap
One of the essential premises of this book is that strategy formulation(or, more commonly, reformulation) is a layered process and an essentialpre-requisite for successful Strategic Performance Management. A three-step pathway is required in order to build the essential ‘informationstock’ that is needed in order to make effective decisions about strategicdirections.
A sound strategy should be developed with the aid of a reasonablythorough analysis of the environment in which the organization oper-ates so that it can develop its value proposition more precisely. Usingdifferent tools to identify opportunities in the markets has been thetraditional approach of strategy formulation. Here, organizations choosea market or consumer segment and then align the organization with itsvalue proposition, internal processes, and capabilities to the opportunityin the market.
However, organizations have realized that they need to match external opportunities with their existing competencies. One strategythinker made a point when he said that ‘opportunism without compe-tence is a path to fairyland’.1 Over the past decade the Strategic Manage-ment field has seen a shift towards more internally focused approaches,where organizations exploit their internal strengths and competencies.The reasoning is summarized by Strategy Professor Robert Grant, whoargues that
in a world where customer preferences are volatile, the identity ofcustomers is changing, and the technologies for serving customers’requirements are continually evolving, an externally focused orien-tation does not provide a secure foundation for formulating long-term strategy. When the external is in a state of flux, the firm’sown resources and capabilities may be a much more stable basison which to define its identity. Hence, a definition of a businessin terms of what it is capable of doing may offer a more durablebasis for strategy than a definition based upon the needs whichthe business seeks to satisfy.2
In this view, markets are selected based on the exploitation of corecompetencies, which are based on the organizational resources. Here,the term ‘resources’ is used in the widest sense to include not onlyphysical and financial resources, but also intangible resources such asknowledge and skills, image and relationships, processes, intellectualproperty, organizational culture or intellectual property. Companies suchas 3M, Honda,The Walt Disney Company, or Wal-Mart have demonstrated
4 Introduction
how they based their strategies on their resource architecture and corecompetencies.3 In 3M’s case, for example, it allowed them to under-stand that they had shared competencies in substrates, coatings, andadhesives.4 Identifying the various ways to combine these core compe-tencies has allowed them to enter businesses as diverse as sticky tape,photographic film, magnetic tape, and ‘Post-it’ notes.
Market-based versus resource-based viewpoints
The various academic pundits of strategy formulation tend to positionthemselves in one of two camps: market-based theorists and resource-based theorists. Yet to practitioners either one seems intuitively to betoo narrow a view to understand the future potential of the enter-prise. Increasingly, attempts are being made to unite these two viewsof strategic management.This book will consider both points of view,since they complement each other and only together provide a com-prehensive understanding of the strategic situation of any organization.5
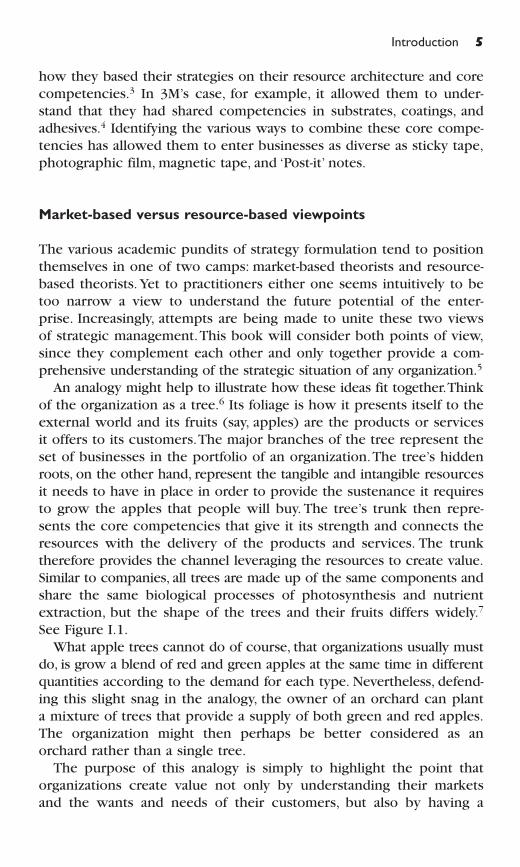
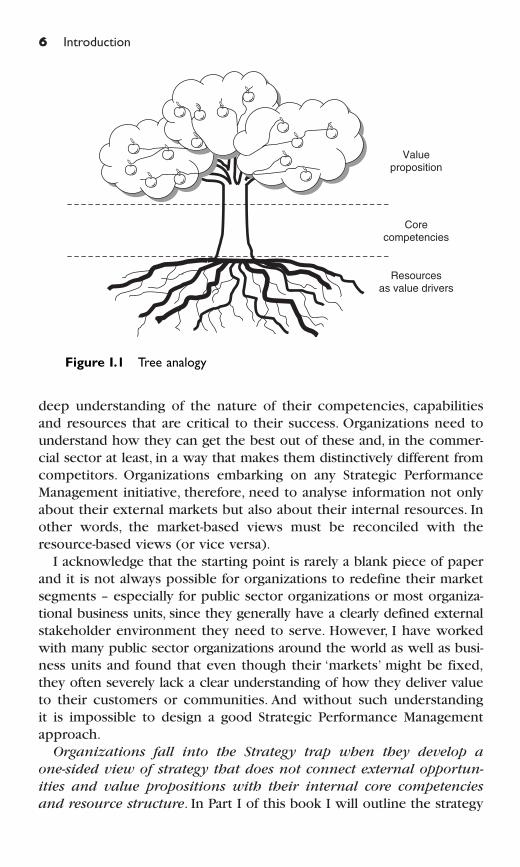
An analogy might help to illustrate how these ideas fit together.Thinkof the organization as a tree.6 Its foliage is how it presents itself to theexternal world and its fruits (say, apples) are the products or servicesit offers to its customers.The major branches of the tree represent theset of businesses in the portfolio of an organization.The tree’s hiddenroots, on the other hand, represent the tangible and intangible resourcesit needs to have in place in order to provide the sustenance it requiresto grow the apples that people will buy. The tree’s trunk then repre-sents the core competencies that give it its strength and connects theresources with the delivery of the products and services. The trunktherefore provides the channel leveraging the resources to create value.Similar to companies, all trees are made up of the same components andshare the same biological processes of photosynthesis and nutrientextraction, but the shape of the trees and their fruits differs widely.7
See Figure I.1.What apple trees cannot do of course, that organizations usually must
do, is grow a blend of red and green apples at the same time in differentquantities according to the demand for each type. Nevertheless, defend-ing this slight snag in the analogy, the owner of an orchard can planta mixture of trees that provide a supply of both green and red apples.The organization might then perhaps be better considered as anorchard rather than a single tree.
The purpose of this analogy is simply to highlight the point thatorganizations create value not only by understanding their marketsand the wants and needs of their customers, but also by having a
Introduction 5
deep understanding of the nature of their competencies, capabilitiesand resources that are critical to their success. Organizations need tounderstand how they can get the best out of these and, in the commer-cial sector at least, in a way that makes them distinctively different fromcompetitors. Organizations embarking on any Strategic PerformanceManagement initiative, therefore, need to analyse information not onlyabout their external markets but also about their internal resources. Inother words, the market-based views must be reconciled with theresource-based views (or vice versa).
I acknowledge that the starting point is rarely a blank piece of paperand it is not always possible for organizations to redefine their marketsegments – especially for public sector organizations or most organiza-tional business units, since they generally have a clearly defined externalstakeholder environment they need to serve. However, I have workedwith many public sector organizations around the world as well as busi-ness units and found that even though their ‘markets’ might be fixed,they often severely lack a clear understanding of how they deliver valueto their customers or communities. And without such understanding it is impossible to design a good Strategic Performance Managementapproach.
Organizations fall into the Strategy trap when they develop a
one-sided view of strategy that does not connect external opportun-
ities and value propositions with their internal core competencies
and resource structure. In Part I of this book I will outline the strategy
6 Introduction
Resourcesas value drivers
Corecompetencies
Valueproposition
Figure I.1 Tree analogy
development process from both views, which then allows you to pickyour appropriate starting point. In the end it doesn’t matter where westart as long as we create a comprehensive view of our strategy thatincludes the defined value proposition, the specific core competen-cies, and the underlying resource architecture. This comprehensiveunderstanding of strategy can then guide the development of relevantperformance indicators.
The measurement trap
Performance measures are vital aspects of our organizations and Per-formance Management. In the words of the fifth century BC philo-sopher Philolaus – without measures we can understand nothing and know nothing. Once organizations have defined and clarified theirstrategy, measures can be used to gauge performance in comparisonto, for example, their expectations, targets or competitors. Measuresenable us to define future goals like a certain market share or share-holder value, and they should help us understand whether we are onthe right track towards delivering our strategy. Indicators should allowus to challenge our business assumptions and provide us with insightsthat will guide our everyday decision-making. Without indicators wecan’t assess our success, we don’t know whether our assumptions ordecisions were correct, and we don’t see whether we are moving inthe right direction.
However, this is not what happens in most organizations.What I seeis often a very narrow use of measurement. Common reality is thatthere are too many metrics; no one knows why they are being col-lected, and most people agree that the measures that are used are notmeasuring what they are supposed to measure or what really matters.Organizations have become obsessed with measuring everything thatwalks and moves but often fail to measure what really matters. Inmany cases measurement has become an administrative burden wherewe spend a lot of our time collecting and reporting metrics, which weknow is of little or no value. As a consequence, few strategic insightsare extracted from the measures we collect and little or no learningtakes place.
Also, too many organizations are making the mistake of only meas-uring everything that is easy to measure. For example, they often tendto focus on efficiency measures with the hope that these will somehowequate to customer satisfaction or better financial performance. How-ever, it has long been established that it is dangerous to measure onething while hoping to achieve another. It is important to remember
Introduction 7

that measures focus our attention and drive behaviour.8 A classic examplecomes from call centres, where measures such as number of calls andcall duration are automatically produced by the system and thereforeeasily reported. The result is that because they are measured andreported people assume that they are important and relevant metricsfor the business.This is all okay until we find out that front-line agentscontinuously transfer customers or even cut them off to meet theirmeasures – while the efficiency targets are being achieved, customerservice and with it overall performance is not. Call centres, like mostdepartments and business units, are rarely detached operations with asolitary goal of driving down costs.They are integral parts of organiza-tions and their service or product offerings. Therefore, performancemeasures need to reflect the strategic direction of the entire organiza-tion.To avoid the measurement trap organizations need to put efficiencymeasures into the context of overall performance. This can only beachieved by clearly understanding the strategy of the organization.
As outlined above, strategy for today’s organizations involves notjust corporate objectives such as shareholder value but also an under-standing of how this can be delivered. Measures have to be developedfor the customer value proposition, the core competencies, and theunderlying resources.These then become leading indicators for futureperformance and important components of Strategic PerformanceManagement. One of the problems is that many of these leading indi-cators are intangible in nature and therefore intrinsically difficult toexpress in simple metrics.When it comes to concepts like ‘intellectualcapital’, ‘reputation’, or ‘organizational culture’ it is impossible to ‘meas-ure’ those in a traditional measurement sense.The reason for it is thatthe word ‘measure’ is often associated with accounting and mathemat-ics. It therefore works in the simplified world of financial numbers,where we can clearly define things and then reduce them to a number.However, businesses operate in a social context that is more complexand we therefore have to realize that by measuring things we will onlycapture part of the reality behind them.
A great example to illustrate our measurement limitations is measur-ing human intelligence.The ‘measure’ we would traditionally use is IQ(Intelligence Quotient). However, the questions that arise are: what isintelligence and what do IQ scores actually measure? Whereas thedetails of the answers to these questions are still subject to an ongoingdebate, on the whole IQ tests focus on our analytical and mathematicalreasoning. However, Dr Howard Gardner, Professor of Education atHarvard University, has shown that there are multiple facets to ourintelligence.9 His studies have identified eight different forms of intel-ligence – of which IQ only measures a small subset.
8 Introduction
The forms of intelligence identified by Gardner are linguistic intelli-gence (‘word smart’), logical-mathematical intelligence (‘number/reasoning smart’), interpersonal intelligence (‘people smart’), bodily-kinesthetic intelligence (‘body smart’), spatial intelligence (‘picturesmart’), musical intelligence (‘music smart’), naturalist intelligence(‘nature smart’) and intrapersonal intelligence (‘self smart’). This sug-gests that someone can be classed as intelligent when he or she, forexample, has great hand–eye coordination and awareness of space –and therefore becomes a great basketball or football player. Someonecan have great emotional intelligence and therefore be able to connectwith other people and become a great leader.10 Others might havegreat musical ability and become composers or musicians. All of thesepeople wouldn’t necessary need a high score on an IQ test, since itonly assesses linguistic and logical-mathematical skills.
The above example hopefully illustrates that measures cannot cap-ture the entire truth when it comes to intangibles. However, they canindicate the level of performance.They are therefore indicators, ratherthen measures, and have to be treated as such.
Organizations fall into the measurement trap when they don’t
link their indicators to the strategy of the organization and when
they attempt to quantify the unquantifiable or measure everything
that is easy to measure without focusing on the relevant and mean-
ingful indicators in order to use them for strategic decision-making
and learning. Part II of this book will outline how, based on the strat-egy of the organization, relevant indicators can be developed.
The management trap
Once we have identified the strategy and derived relevant perform-ance indicators we need to use them.Too many organizations believethat, once they have collected the measures and put them into spread-sheets or reports, this will by magic lead to better decision-making. Unfortunately this is not the case. I often use a short story toillustrate this point. Imagine three frogs sitting on a leaf in a pond.One of the three frogs decides to jump away – how many frogs areleft on the leaf? Still three! The one frog initially decided to jump but then changed his mind. Similar to this story, we put metrics inplace to help us make better decisions. However, unless we use thesemeasures and actually make better decisions nothing changes and no value is added. Instead, the opposite is the case; it becomes anadditional administrative burden with negative value that causes a lot of frustration.
Introduction 9
Today’s organizations have evolved and subsequently we need to evolve our Performance Management approaches. ManagementProfessor Charles Ehin writes that over the past hundred years or sowe have deliberately chosen to design our social institutions with almostone single purpose in mind – to control the behaviour of people withinthem. However, he continues, success in the knowledge age demandsthat we let go of the top-down, command-and-control framework.11
What we used to do in firms was specify the tasks someone had toperform and then put measures in place to control whether this wasachieved.
This approach was pioneered by Frederick Taylor at the beginningof the twentieth century, who called it ‘Scientific Management’.12
According to Taylor, it is only a matter of matching people to a taskand then supervising, rewarding and punishing them in accordance withtheir performance. In Taylor’s view, there was no such thing as skillrequired since all work could be analysed step-by-step, as a series ofunskilled operations that could then be combined into any kind of job.13
This control-driven Performance Management approach treats peoplerather like machines and it infers that someone else knows best howthey should perform their job. Scientific Management worked for Taylorin the mass production world of the industrial revolution, where theonly reason that people were working in factories was because theycouldn’t yet be replaced by machines. The effect was that it made people not only stupid but ignorant.14 But then no one expectedthem to be clever or innovative. In such a world it didn’t matter thatpeople stopped developing intelligence or imagination to look forways of improving processes or overcoming difficulties.
In today’s organizations, we generally want more from people thanjust for them to perform simple and repetitive tasks at a conveyorbelt. And more importantly we can’t afford for anyone to be ignorant.We rely on their insights in order to create innovative products andprocesses, we rely on their ability to build relationships with cus-tomers and other stakeholders, and we rely on their ability to inte-grate into teams and make performance their day-to-day job. And aswe have seen, these are the things we can’t really ‘measure’ in a con-trolling sense. Applying the machine-like command-and-control modelis not only inhumane but also goes against the increasing need fororganizations to be more adaptive to ever-changing customer needs inthe knowledge economy.15
If we therefore use measures to treat people like machines and tryto control them like robots we will not get any of their intellectual cap-ital or intangibles.We will get just what we measure, which is not whatwe want! If we fail to acknowledge these facts then we also get the
10 Introduction
dysfunctional behaviour and the gaming of measures. Instead, we needto create what I call an ‘enabled learning environment’. Here, peopleunderstand the strategy of the organization they are working in and useindicators that are aligned to this strategy to make better-informed deci-sions as well as to refine and challenge the strategy.The organization, inturn, understands and acknowledges the limitations of measurement andempowers people to become accountable for strategic performance.In this culture we engage everyone in Performance Management, insteadof ignoring their inputs and so creating a culture of apathy, lethargy,and anti-learning.16
Organizations fall into the Performance Management trap when
they either collect too many irrelevant measures or when they use
the measures in a command-and-control fashion; both situations
mean that measures will not be used for any strategic decision-
making or learning. Part II of this book will also describe how tocreate an enabled learning environment so that strategy and perform-ance become everyone’s everyday job.
IT support for Strategic Performance Management
Once strategy, indicators, and management approaches are in place,we need to implement them and ensure that they become embeddedinto the organization. And here is where software applications repre-sent vital enablers for those organizations that are serious aboutimplementing Strategic Performance Management. Today, there are still too many organizations that rely on spreadsheets to manage their performance without understanding their severe limitations.Nowadays, many specially designed software applications are on offer.These so-called Performance Management software applications aredesigned to enable data integration, analysis and communication inorder for us to extract real management insights from our performanceinformation.
Part III of this book will provide an overview of what these soft-ware packages can deliver. It will provide an insight into the role ofsuch automation tools and an understanding of the different capabil-ities and limitations of such tools. The problem we face today is thatthere are over thirty application providers to choose from, each ofthem claiming that their solution offers unique and important fea-tures. Selecting the wrong solution can undermine the entire develop-ment effort and the credibility of the Performance Managementsystem.17 Here you will be given a starting point as to how to selectthe appropriate automation solution for your organization.
Introduction 11
Structure of the book
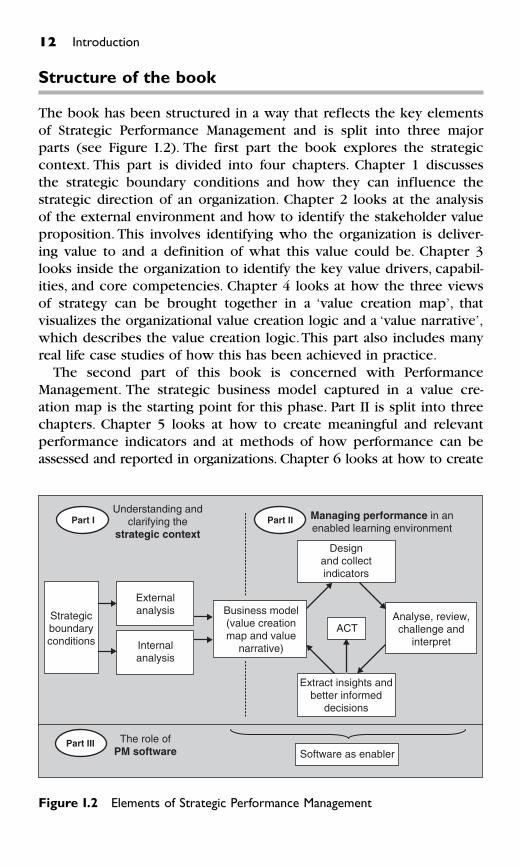
The book has been structured in a way that reflects the key elementsof Strategic Performance Management and is split into three majorparts (see Figure I.2). The first part the book explores the strategiccontext. This part is divided into four chapters. Chapter 1 discussesthe strategic boundary conditions and how they can influence thestrategic direction of an organization. Chapter 2 looks at the analysisof the external environment and how to identify the stakeholder valueproposition. This involves identifying who the organization is deliver-ing value to and a definition of what this value could be. Chapter 3looks inside the organization to identify the key value drivers, capabil-ities, and core competencies. Chapter 4 looks at how the three viewsof strategy can be brought together in a ‘value creation map’, thatvisualizes the organizational value creation logic and a ‘value narrative’,which describes the value creation logic.This part also includes manyreal life case studies of how this has been achieved in practice.
The second part of this book is concerned with PerformanceManagement. The strategic business model captured in a value cre-ation map is the starting point for this phase. Part II is split into threechapters. Chapter 5 looks at how to create meaningful and relevantperformance indicators and at methods of how performance can beassessed and reported in organizations. Chapter 6 looks at how to create
12 Introduction
Software as enabler
The role ofPM software
Part III
Designand collectindicators
Extract insights andbetter informed
decisions
Externalanalysis
Internalanalysis
Managing performance in anenabled learning environment
Understanding andclarifying the
strategic context
Part I Part II
Analyse, review,challenge and
interpret
ACT
Business model(value creationmap and value
narrative)
Strategicboundaryconditions
Figure I.2 Elements of Strategic Performance Management
an enabled learning environment in which performance informationis used for forward-looking learning. It also looks at how to align per-formance review meetings to this environment in order to extractmore valuable strategic management insights. Chapter 7 looks at moresophisticated ways of using the strategic business model and indica-tors. It discusses double-loop learning to challenge current strategicassumptions, as well as how to test and validate causal models, how toassess risks in your organization, and how to evaluate possible busi-ness extensions, mergers, and acquisitions.
The third and final part of this book will look at software-basedautomation of Strategic Performance Management. It will explorewhat the latest Strategic Performance Management software applica-tions can deliver and how this can be used to leverage the full poten-tial of Strategic Performance Management. An Appendix to Part IIIprovides an overview of the software market, a list of the leading vend-ors, and a framework to facilitate the software selection process.
References and endnotes
1 Andrews, K. R. (1971). The Concept of Corporate Strategy. DowJones-Irwin: Homewood, IL.
2 Grant, R. (1998). Contemporary Strategy Analysis. Blackwell:Oxford, p. 181.
3 For case studies see: Collis, D. J. and Montgomery, C. A. (1997).Corporate Strategy – Resources and the Scope of the Firm.McGraw-Hill: Boston; and Stalk, G., Evans, P. and Shulman, L. E. (1992).Competing on Capabilities: The New Rules of Corporate Strategy.Harvard Business Review,Vol. 70, No. 2, Mar/Apr, p. 57.
4 Prahalad, C. K. and Hamel, G. (1990).The Core Competence of theCorporation. Harvard Business Review,Vol. 68, No. 3, May/Jun, p. 79.
5 For a further discussion about the complementarities of theresource-based and market-based approach of strategic managementsee also: Conner, K. R. (1991).A Historical Comparison of Resource-Based Theory and Five Schools of Thought Within IndustrialOrganization Economics: Do We Have a New Theory of the Firm?Journal of Management, Vol. 17, No. 1, p. 121 or Spanos, Y. E. andLiokas, S. (2001). An Examination into Causal Logic of RentGeneration: Contrasting Porter’s Competitive Strategy Frameworkand the Resource-Based Perspective. Strategic Management Journal,Vol. 22, No. 10, pp. 907–34.
6 This analogy has been used on various occasions, one of the mostconvincing was by Prahalad, C. K. and Hamel, G. (1990). The Core
Introduction 13
Competence of the Corporation. Harvard Business Review,Vol. 68,No.3, May/Jun, p. 79. However, tree diagrams can be traced back tothe third-century Syrian philosopher’s diagram named after its devel-oper,‘Tree of Porphyry’ based upon the work of Aristotle.
7 Collis, D. J. and Montgomery, C. A. (1997). Corporate Strategy –Resources and the Scope of the Firm. McGraw-Hill: Boston, p. 130.
8 For a classic, but still very relevant article on the behavioural conse-quences of wrong measures see: Ridgway, V. F. (1956). DysfunctionalConsequences of Performance Measurements. Administrative
Science Quarterly,Vol. 1, No. 2, pp. 240–7.9 To learn about multiple intelligences see for example: Gardner, H.
(1993). Multiple Intelligences: The Theory in Practice. New York:Basic; and Gardner, H. (2000). Intelligence Reframed: Multiple
Intelligences for the 21st Century. New York: Basic.10 To find out about emotional intelligence see for example:
Goleman, D., Boyatzis, R. and McKee, A. (2001). Primal Leadership:The Hidden Driver of Great Performance. Harvard Business Review,Vol. 79, No. 11, pp. 42–51; and Goleman, D. (1996). Emotional
Intelligence:Why It Can Matter More Than IQ. Bloomsbury: London.11 Ehin, C. (2000). Unleashing Intellectual Capital. Butterworth-
Heinemann: Boston, p. 179.12 Taylor, W. F. (1913). The Principles of Scientific Management
(Reproduced by Lightning Source UK Ltd, 2005).13 Crainer, S. (1998). Key Management Ideas, 3rd edition. FT Prentice
Hall: London.14 Ibid. Adam Smith is quoted to have commented on the potential
problems of mass production (p. 30).15 Haeckel, S. (1999). Adaptive Enterprise: Creating and Leading
Sense-and-Respond Organizations. Harvard Business School Press:Boston.
16 See: Preskill, H. and Torres, R. T. (1999). Evaluative Inquiry of
Learning in Organizations. Sage:Thousand Oaks, CA, p. 63.17 Marr, B. and Neely, A. (2003). Automating your Scorecard: The
Balanced Scorecard Software Report, Gartner and Cranfield Schoolof Management, InfoEdge: Stamford, CT; or Marr, B. and Neely, A.(2003). Automating the Balanced Scorecard – selection criteria toidentify the appropriate software application. Measuring Business
Excellence,Vol. 7, No. 3, pp. 29–36.
14 Introduction

Part I
Understanding and
clarifying the strategic
context
Introduction to Part I
Strategic Performance Management is about challenging strategicassumptions, refining strategic thinking, and facilitating strategic decision-making and learning at all levels of the organization. It is about engagingeveryone in the strategy and its execution so that organizational perform-ance becomes everyone’s everyday job.The starting point for StrategicPerformance Management is therefore a shared understanding and clari-fication of the strategic context of the organization.We cannot expectpeople to implement and challenge our strategy if they don’t knowwhat this strategy is.
Understanding the realistic context of an organization’s strategicdirection might seem intuitive to the managers and executives involvedin determining its strategy. However, my experience has taught me dif-ferently. Far too often organizations embark on their PerformanceManagement initiatives without clarifying their strategy. Ignoring thethorough examination of the context of an enterprise’s strategy is a mis-take that we tend to make time after time.And if companies do under-stand the strategic context then it is often a one-sided view where theyeither look at external opportunities or internal competencies.The mainreason for this is that we are too often deeply submerged in the every-day micro-detail of the organization’s workings. However, if we want tomake Strategic Performance Management a success then we needto come up to the surface, take a deep breath and have a realistic lookat where we are.
While some managers and executives may feel that they clearly under-stand their organization’s strategy, my experience is that this under-standing is often their interpretation of the strategy and that othershave a significantly different interpretation of what the strategy is.Developing a common and shared understanding of the organization’sdirection is one of the most valuable and rewarding exercises. Thisshared understanding can then be translated into a visual and narrative
summary of the organizational business model. A so-called ‘value cre-ation map’ can be created to bring together on one piece of paper thekey components of the organization’s strategy, namely the stakeholdervalue proposition and the core competencies required to deliver thevalue proposition, as well as the key resources (tangible and intangible)that underlie the core competencies. This is then accompanied by abrief one-page narrative summary of this business model called the‘value narrative’.
The value creation map and value narrative describe the businessmodel and therefore a shared understanding of the strategy.This in turnhelps to create a common purpose, a shared identity, and a sense ofcommunity. This understanding of strategy can then be used to guidethe development of meaningful and relevant performance indicators,which can then be used to challenge and refine the business modeland its assumptions.
A comprehensive understanding of the strategic context thereforestarts with an understanding of the boundary conditions that delimitthe confines in which an organization operates. These boundaries areusually set by the overall purpose, the visionary goals, and the organ-izational values. In most cases these are already defined. Chapter 1describes what they are and their role in the organization. Chapters 2and 3 then look respectively at the critical external environment aswell as the vital internal competencies and resources. Organizationstend to have a better insight into the changes in the external environ-ment that pose both the biggest threats to and the best opportunitiesfor the future of their enterprises. The key here is to translate theseinto the right value proposition. However, before an organization isable to do this it has to assess whether it has the vital internal compe-tencies and resources needed to counter those threats or to capitalizeon those opportunities. Chapter 4 then describes how these insightscan be translated into a business model, visually represented in avalue creation map and described in a value narrative. The structureof this part of the book will follow the diagram depicted on page 18.
Too many Performance Management approaches assume that thestrategic context and business models are well understood by every-one in the organization. From my experience this is not always the caseand this is often a key contributing factor to the failing of PerformanceManagement initiatives.The following chapters bring different compon-ents of Strategic Management together to form a template for whatneeds to be addressed in order to understand the strategic context.Depending on how well your organization’s strategy is defined andunderstood you can select the appropriate starting point. For many pub-lic sector organizations or many business units the external context is
Introduction to Part I 17
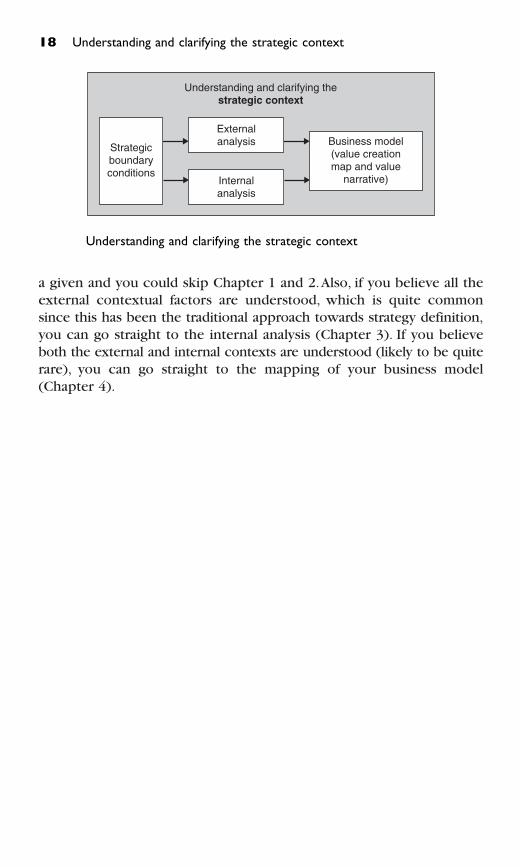
a given and you could skip Chapter 1 and 2.Also, if you believe all theexternal contextual factors are understood, which is quite commonsince this has been the traditional approach towards strategy definition,you can go straight to the internal analysis (Chapter 3). If you believeboth the external and internal contexts are understood (likely to be quiterare), you can go straight to the mapping of your business model(Chapter 4).
Understanding and clarifying thestrategic context
Business model(value creationmap and value
narrative)
Externalanalysis
Internalanalysis
Strategicboundaryconditions
Understanding and clarifying the strategic context
18 Understanding and clarifying the strategic context
1
Understanding the
strategic boundary
conditions – purpose,
values and goals
All organizations need to adapt over time – to either changes in theirexternal competitive environments, to regulatory demands, to chan-ging stakeholder wants and needs, or to evolving and changing inter-nal competencies. Nevertheless, some aspects of ‘what the enterpriseis there to do and how it will go about doing it’ remain relatively con-stant through time.These visionary ‘mission statements’ are created byorganizations in order to provide the overall guiding principles fortheir strategic thinking and their employees’ behaviour.The enterprise’sfounders often inaugurate them; although they can sometimes – butinfrequently – change when the organization takes a fundamentalchange of direction, such as in a merger situation, where perhaps con-flicting visions need to be harmonized. Essentially, what we are seek-ing here is the ‘glue’ that holds the whole organization together overquite a long period of time and sets the general boundaries in whichan organization operates.
However, this should not be confused with the frequently changingplatitudes iterated by successive chief executives, which purport to bevisionary mission statements, but say much the same things that otherfirms in the same line of business expound because it becomes fashion-able to emphasize certain characteristics. Usually such statements are,in fact, more like current strategic ambitions. Here we are looking for
20 Understanding and clarifying the strategic context
sound, long-lasting, and differentiated definitions of the very raison
d’etre of the enterprise. The questions I address in this chapterinclude:
� What are strategic boundary conditions?� What is the fundamental purpose?� What are core values?� What are the visionary goals?� How do boundary conditions set limits onto the forward strategy?
For a ‘proper’ visionary mission statement to achieve its ideologicalcommunication potential, it should include three essential components.These are:
� The fundamental purpose of the enterprise� Core values that the enterprise commits to on the way to achieving
its purpose� Visionary longer-term goals that the enterprise will pursue towards
achieving its aims.
Fundamental purpose
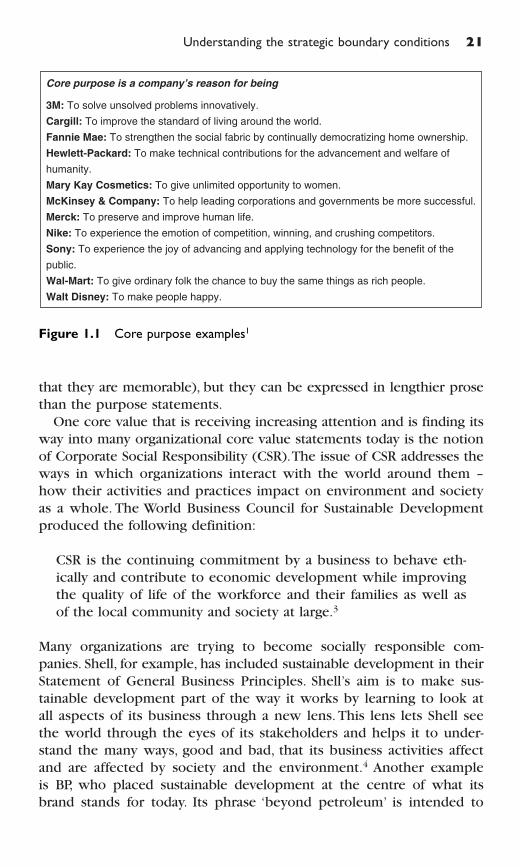
The fundamental purpose of the enterprise is the reason that it exists.It is normally expressed in brief, enduring and often loosely idealisticterms that nevertheless provide an over-riding focus for its ambitions.However, these ambitions are probably not new to the organization; theyshould already be existent within the culture of the organization,‘bub-bling under the surface’. See Figure 1.1 for illustrative examples of itsapplication within several commercial enterprises.
Core values
Core values should reflect the deeply held values that the organiza-tion espouses and should be totally independent of industry norms ortopical management fads. Values can set an enterprise apart from thecompetition by clarifying its identity, limiting its strategic and oper-ational freedom, and constraining the behaviour of its people.2 The corevalues that the enterprise commits to on the way to achieving its pur-pose should be few in number (typically not more than five to seven, so
Understanding the strategic boundary conditions 21
that they are memorable), but they can be expressed in lengthier prosethan the purpose statements.
One core value that is receiving increasing attention and is finding itsway into many organizational core value statements today is the notionof Corporate Social Responsibility (CSR).The issue of CSR addresses theways in which organizations interact with the world around them –how their activities and practices impact on environment and societyas a whole. The World Business Council for Sustainable Developmentproduced the following definition:
CSR is the continuing commitment by a business to behave eth-ically and contribute to economic development while improvingthe quality of life of the workforce and their families as well asof the local community and society at large.3
Many organizations are trying to become socially responsible com-panies. Shell, for example, has included sustainable development in theirStatement of General Business Principles. Shell’s aim is to make sus-tainable development part of the way it works by learning to look atall aspects of its business through a new lens. This lens lets Shell seethe world through the eyes of its stakeholders and helps it to under-stand the many ways, good and bad, that its business activities affectand are affected by society and the environment.4 Another example is BP, who placed sustainable development at the centre of what itsbrand stands for today. Its phrase ‘beyond petroleum’ is intended to
Core purpose is a company’s reason for being
3M: To solve unsolved problems innovatively.
Cargill: To improve the standard of living around the world.
Fannie Mae: To strengthen the social fabric by continually democratizing home ownership.
Hewlett-Packard: To make technical contributions for the advancement and welfare of
humanity.
Mary Kay Cosmetics: To give unlimited opportunity to women.
McKinsey & Company: To help leading corporations and governments be more successful.
Merck: To preserve and improve human life.
Nike: To experience the emotion of competition, winning, and crushing competitors.
Sony: To experience the joy of advancing and applying technology for the benefit of the
public.
Wal-Mart: To give ordinary folk the chance to buy the same things as rich people.
Walt Disney: To make people happy.
Figure 1.1 Core purpose examples1
encapsulate its sustainable long-term commitment to human progressand environmental leadership.5
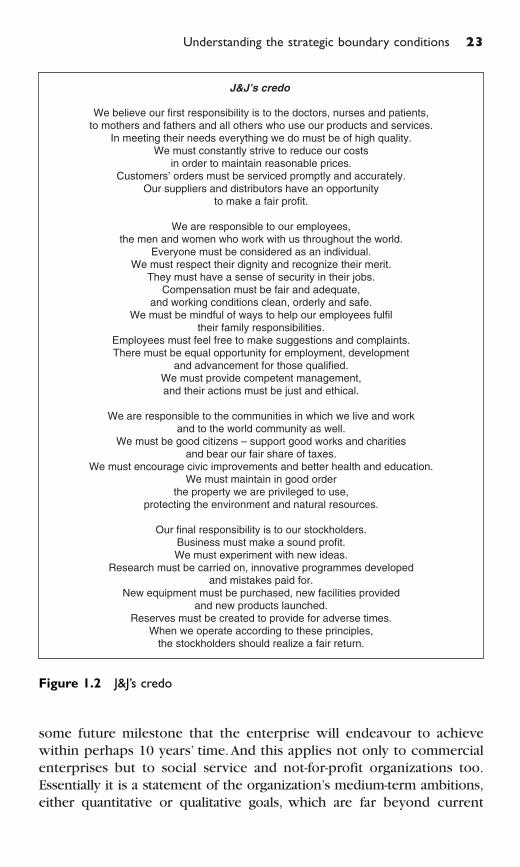
Johnson & Johnson, the giant US pharmaceuticals and healthcare firmhas, and continues to maintain, its core values in what it calls its ‘credo’.This has been in place for over sixty years, with only very minor clari-fications introduced in the meantime. First created in 1943 by GeneralRobert Wood Johnson, it is a one-page document that sets out the firm’s‘industrial philosophy’ as to the corporation’s responsibility to its vari-ous stakeholders. Sometimes seen as controversial, it puts customersfirst and shareholders last in its list of priorities. The company legit-imately claims that its employees have made countless decisions thatwere inspired by the philosophy embodied in the credo and that thesehave succeeded in enhancing the company’s reputation (not least dur-ing the company’s well-known Tylenol product recalls in the 1980s).The full text of this philosophy is reproduced in Figure 1.2.
However, there are dangers lurking here too. Adopting blandly niceideals that fail to differentiate an organization from its competitors isthe most pressing one.As Patrick Lencioni, a leading consultant in thisarea says:
Consider the motherhood-and-apple-pie values that appear in somany companies’ values statements – integrity, teamwork, ethics,quality, customer satisfaction, and innovation. In fact, 55% of allFortune 100 companies claim integrity is a core value, 49% espousecustomer satisfaction, and 40% tout teamwork. While these areinarguably good qualities, such terms hardly provide a distinctblueprint for employee behaviour. Cookie-cutter values don’t seta company apart from competitors; they make it fade into thecrowd.6
Neither does the concept of core values include those corporate ‘goodbehaviour’ booklets that contain mounds of cant, such as the 123 rulescreated by JPMorganChase for its people to follow every day, or the144 rules of ‘leadership imperatives’ issued by Cadbury Schweppes forits managers to ‘live and breathe’ (not to mention the further 82 principlesthat managers must not do). Moses had no such problems, and indeedhow many people can remember all Ten Commandments?
Visionary goals
The visionary longer-term goals that the enterprise will pursue towardsachieving its aims are clearly not the next year or two’s results, but
22 Understanding and clarifying the strategic context
Understanding the strategic boundary conditions 23
some future milestone that the enterprise will endeavour to achievewithin perhaps 10 years’ time.And this applies not only to commercialenterprises but to social service and not-for-profit organizations too.Essentially it is a statement of the organization’s medium-term ambitions,either quantitative or qualitative goals, which are far beyond current
J&J’s credo
We believe our first responsibility is to the doctors, nurses and patients,to mothers and fathers and all others who use our products and services.
In meeting their needs everything we do must be of high quality.We must constantly strive to reduce our costs
in order to maintain reasonable prices.Customers’ orders must be serviced promptly and accurately.
Our suppliers and distributors have an opportunityto make a fair profit.
We are responsible to our employees,the men and women who work with us throughout the world.
Everyone must be considered as an individual.We must respect their dignity and recognize their merit.
They must have a sense of security in their jobs.Compensation must be fair and adequate,
and working conditions clean, orderly and safe.We must be mindful of ways to help our employees fulfil
their family responsibilities.Employees must feel free to make suggestions and complaints.There must be equal opportunity for employment, development
and advancement for those qualified.We must provide competent management,and their actions must be just and ethical.
We are responsible to the communities in which we live and workand to the world community as well.
We must be good citizens – support good works and charitiesand bear our fair share of taxes.
We must encourage civic improvements and better health and education.We must maintain in good order
the property we are privileged to use,protecting the environment and natural resources.
Our final responsibility is to our stockholders.Business must make a sound profit.We must experiment with new ideas.
Research must be carried on, innovative programmes developedand mistakes paid for.
New equipment must be purchased, new facilities providedand new products launched.
Reserves must be created to provide for adverse times.When we operate according to these principles,
the stockholders should realize a fair return.
Figure 1.2 J&J’s credo
performance levels.7 For example, these might include ‘stretch goals’such as becoming the dominant player in a particular field, reaching acertain size, becoming the best at something (that will still be valid in10 years’ time), beating a particular competitor, or becoming a rolemodel in a different industry, and so on.The common theme is that theyare a challenge that will not easily be achieved – along the lines ofJohn F. Kennedy’s inspirational exhortation to ‘put a man on the moon’.When, eventually, these ambitions are reached, then of course theyhave to be replaced with a new challenge in order for the organiza-tion to renew itself. It is extraordinary how many commercial enter-prises and public services omit to do this and so become vulnerable tocomplacency.
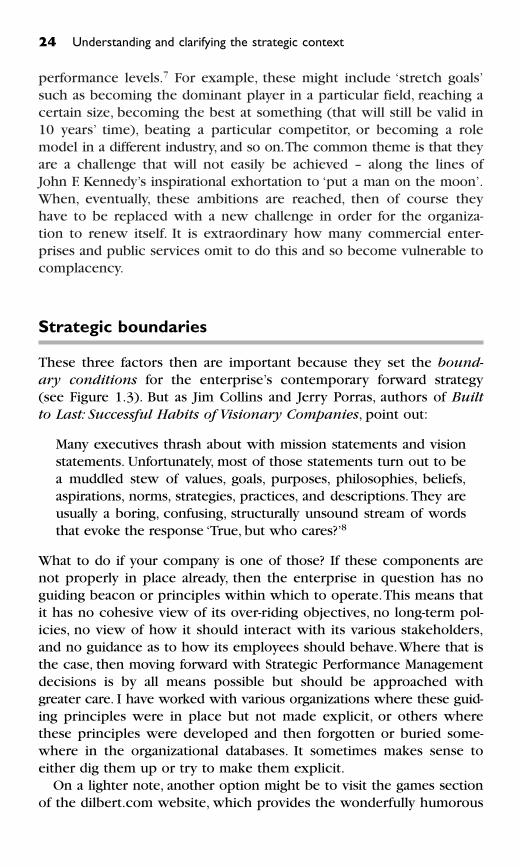
Strategic boundaries
These three factors then are important because they set the bound-
ary conditions for the enterprise’s contemporary forward strategy(see Figure 1.3). But as Jim Collins and Jerry Porras, authors of Built
to Last: Successful Habits of Visionary Companies, point out:
Many executives thrash about with mission statements and visionstatements. Unfortunately, most of those statements turn out to bea muddled stew of values, goals, purposes, philosophies, beliefs,aspirations, norms, strategies, practices, and descriptions. They areusually a boring, confusing, structurally unsound stream of wordsthat evoke the response ‘True, but who cares?’8
What to do if your company is one of those? If these components arenot properly in place already, then the enterprise in question has noguiding beacon or principles within which to operate.This means thatit has no cohesive view of its over-riding objectives, no long-term pol-icies, no view of how it should interact with its various stakeholders,and no guidance as to how its employees should behave.Where that isthe case, then moving forward with Strategic Performance Managementdecisions is by all means possible but should be approached withgreater care. I have worked with various organizations where these guid-ing principles were in place but not made explicit, or others wherethese principles were developed and then forgotten or buried some-where in the organizational databases. It sometimes makes sense toeither dig them up or try to make them explicit.
On a lighter note, another option might be to visit the games sectionof the dilbert.com website, which provides the wonderfully humorous
24 Understanding and clarifying the strategic context
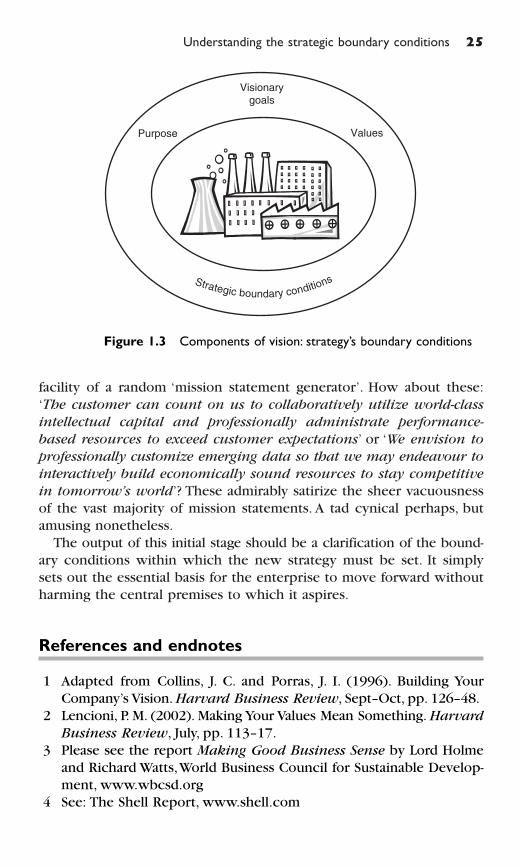
Understanding the strategic boundary conditions 25
facility of a random ‘mission statement generator’. How about these:‘The customer can count on us to collaboratively utilize world-class
intellectual capital and professionally administrate performance-
based resources to exceed customer expectations’ or ‘We envision to
professionally customize emerging data so that we may endeavour to
interactively build economically sound resources to stay competitive
in tomorrow’s world’? These admirably satirize the sheer vacuousnessof the vast majority of mission statements. A tad cynical perhaps, butamusing nonetheless.
The output of this initial stage should be a clarification of the bound-ary conditions within which the new strategy must be set. It simplysets out the essential basis for the enterprise to move forward withoutharming the central premises to which it aspires.
References and endnotes
1 Adapted from Collins, J. C. and Porras, J. I. (1996). Building YourCompany’s Vision. Harvard Business Review, Sept–Oct, pp. 126–48.
2 Lencioni, P. M. (2002). Making Your Values Mean Something. Harvard
Business Review, July, pp. 113–17.3 Please see the report Making Good Business Sense by Lord Holme
and Richard Watts,World Business Council for Sustainable Develop-ment, www.wbcsd.org
4 See: The Shell Report, www.shell.com
ValuesPurpose
Visionarygoals
Strategic boundary conditions
Figure 1.3 Components of vision: strategy’s boundary conditions

5 See: www.bp.com6 Lencioni, P. M. (2002). Ibid (see note 2 above).7 Referred to, in late 1990s-speak, as ‘Big, Hairy, Audacious Goals’ by
Collins & Porras (1996).8 Collins, J. C. and Porras, J. I. (1996). Building Your Company’s Vision.
Harvard Business Review, Sept–Oct, pp. 126–48.
26 Understanding and clarifying the strategic context
2
External strategic analysis –
market-based view
The second piece of analysis that needs to be completed in order tounderstand the strategic context is to take a hard look beyond theboundaries of the enterprise. This involves an external analysis of boththe macro-environment in which the enterprise operates and the micro-environment in which it competes with other providers of similarproducts or services. One would expect most companies to under-stand this part of their strategic context relatively well. The key out-come from the external analysis is the stakeholder value proposition –basically an answer to the questions of who are your key stakeholdersand what do you have to do to deliver to them?1 To follow my tree (ororchard) analogy and compare your organization with this metaphoricapple tree, the questions I believe you should try to answer include (seeFigure 2.1):
� Who are our stakeholders and what do they expect from our tree(orchard)?
� What kind of product and service attributes (apples) do our cus-tomers what?
� What competitors do we face?� What changes and discontinuities are there in the external
environment?� What are the different competitive forces in the market?� How does the overall macro-environment (economic, social, polit-
ical, etc.) impact our value proposition?
The tools presented in this chapter are individually well documentedin other Strategic Management publications (which are referenced
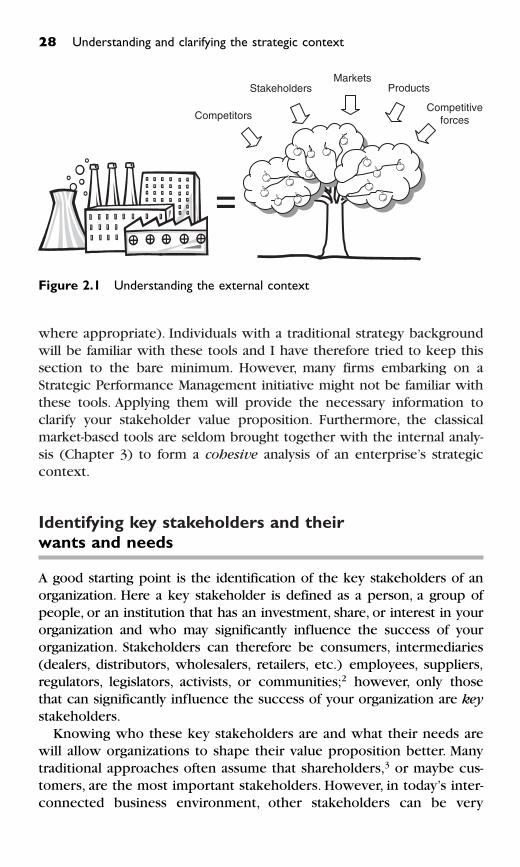
where appropriate). Individuals with a traditional strategy backgroundwill be familiar with these tools and I have therefore tried to keep thissection to the bare minimum. However, many firms embarking on aStrategic Performance Management initiative might not be familiar withthese tools. Applying them will provide the necessary information toclarify your stakeholder value proposition. Furthermore, the classicalmarket-based tools are seldom brought together with the internal analy-sis (Chapter 3) to form a cohesive analysis of an enterprise’s strategiccontext.
Identifying key stakeholders and their
wants and needs
A good starting point is the identification of the key stakeholders of anorganization. Here a key stakeholder is defined as a person, a group ofpeople, or an institution that has an investment, share, or interest in yourorganization and who may significantly influence the success of yourorganization. Stakeholders can therefore be consumers, intermediaries(dealers, distributors, wholesalers, retailers, etc.) employees, suppliers,regulators, legislators, activists, or communities;2 however, only thosethat can significantly influence the success of your organization are key
stakeholders.Knowing who these key stakeholders are and what their needs are
will allow organizations to shape their value proposition better. Manytraditional approaches often assume that shareholders,3 or maybe cus-tomers, are the most important stakeholders. However, in today’s inter-connected business environment, other stakeholders can be very
28 Understanding and clarifying the strategic context
Competitors
StakeholdersMarkets
Products
Competitiveforces
Figure 2.1 Understanding the external context
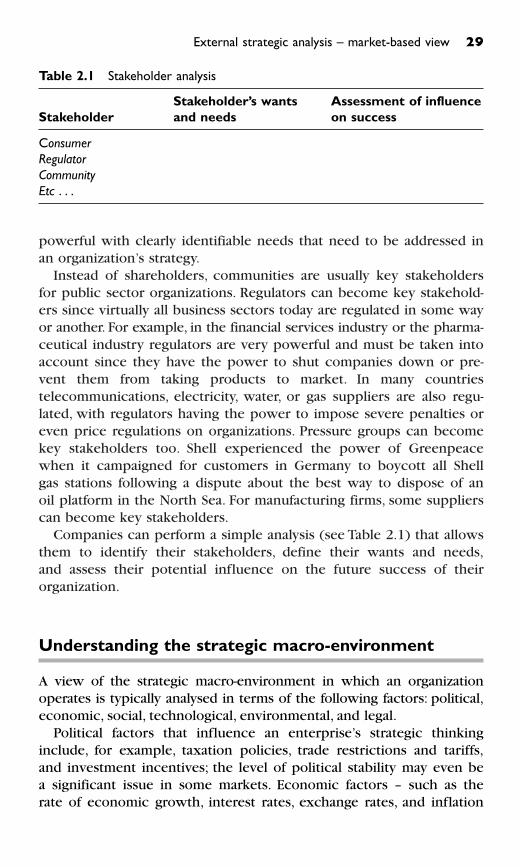
powerful with clearly identifiable needs that need to be addressed inan organization’s strategy.
Instead of shareholders, communities are usually key stakeholdersfor public sector organizations. Regulators can become key stakehold-ers since virtually all business sectors today are regulated in some wayor another. For example, in the financial services industry or the pharma-ceutical industry regulators are very powerful and must be taken intoaccount since they have the power to shut companies down or pre-vent them from taking products to market. In many countriestelecommunications, electricity, water, or gas suppliers are also regu-lated, with regulators having the power to impose severe penalties oreven price regulations on organizations. Pressure groups can becomekey stakeholders too. Shell experienced the power of Greenpeacewhen it campaigned for customers in Germany to boycott all Shellgas stations following a dispute about the best way to dispose of anoil platform in the North Sea. For manufacturing firms, some supplierscan become key stakeholders.
Companies can perform a simple analysis (see Table 2.1) that allowsthem to identify their stakeholders, define their wants and needs,and assess their potential influence on the future success of theirorganization.
Understanding the strategic macro-environment
A view of the strategic macro-environment in which an organizationoperates is typically analysed in terms of the following factors: political,economic, social, technological, environmental, and legal.
Political factors that influence an enterprise’s strategic thinkinginclude, for example, taxation policies, trade restrictions and tariffs,and investment incentives; the level of political stability may even bea significant issue in some markets. Economic factors – such as therate of economic growth, interest rates, exchange rates, and inflation
External strategic analysis – market-based view 29
Table 2.1 Stakeholder analysis
Stakeholder’s wants Assessment of influence
Stakeholder and needs on success
Consumer
Regulator
Community
Etc . . .
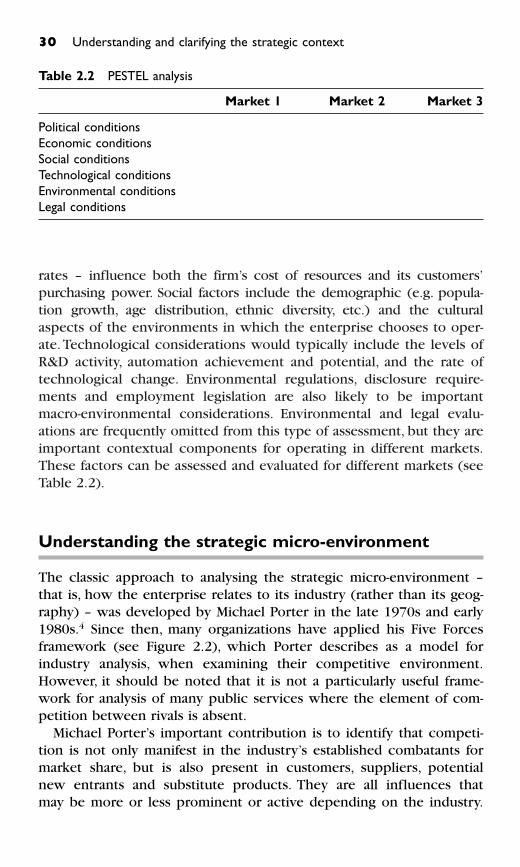
rates – influence both the firm’s cost of resources and its customers’purchasing power. Social factors include the demographic (e.g. popula-tion growth, age distribution, ethnic diversity, etc.) and the culturalaspects of the environments in which the enterprise chooses to oper-ate. Technological considerations would typically include the levels ofR&D activity, automation achievement and potential, and the rate oftechnological change. Environmental regulations, disclosure require-ments and employment legislation are also likely to be importantmacro-environmental considerations. Environmental and legal evalu-ations are frequently omitted from this type of assessment, but they areimportant contextual components for operating in different markets.These factors can be assessed and evaluated for different markets (seeTable 2.2).
Understanding the strategic micro-environment
The classic approach to analysing the strategic micro-environment –that is, how the enterprise relates to its industry (rather than its geog-raphy) – was developed by Michael Porter in the late 1970s and early1980s.4 Since then, many organizations have applied his Five Forcesframework (see Figure 2.2), which Porter describes as a model forindustry analysis, when examining their competitive environment.However, it should be noted that it is not a particularly useful frame-work for analysis of many public services where the element of com-petition between rivals is absent.
Michael Porter’s important contribution is to identify that competi-tion is not only manifest in the industry’s established combatants formarket share, but is also present in customers, suppliers, potentialnew entrants and substitute products. They are all influences that may be more or less prominent or active depending on the industry.
30 Understanding and clarifying the strategic context
Table 2.2 PESTEL analysis
Market 1 Market 2 Market 3
Political conditions
Economic conditions
Social conditions
Technological conditions
Environmental conditions
Legal conditions
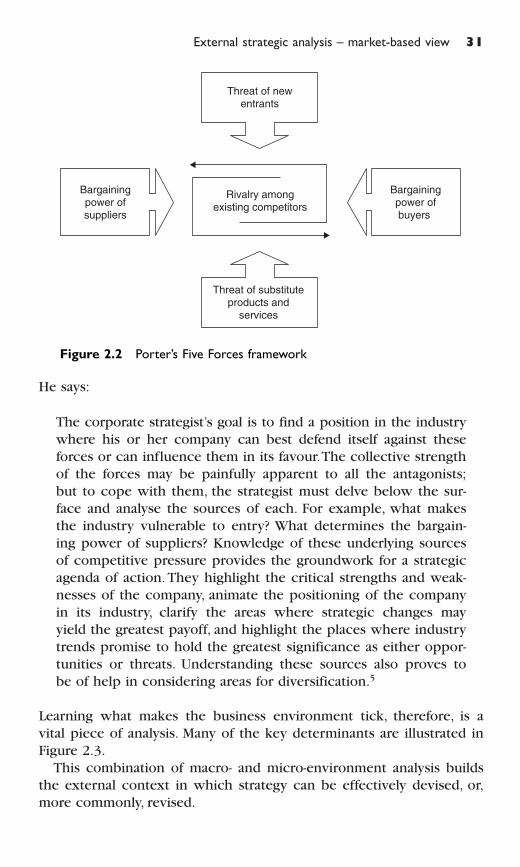
He says:
The corporate strategist’s goal is to find a position in the industrywhere his or her company can best defend itself against theseforces or can influence them in its favour.The collective strengthof the forces may be painfully apparent to all the antagonists;but to cope with them, the strategist must delve below the sur-face and analyse the sources of each. For example, what makesthe industry vulnerable to entry? What determines the bargain-ing power of suppliers? Knowledge of these underlying sourcesof competitive pressure provides the groundwork for a strategicagenda of action. They highlight the critical strengths and weak-nesses of the company, animate the positioning of the companyin its industry, clarify the areas where strategic changes mayyield the greatest payoff, and highlight the places where industrytrends promise to hold the greatest significance as either oppor-tunities or threats. Understanding these sources also proves tobe of help in considering areas for diversification.5
Learning what makes the business environment tick, therefore, is avital piece of analysis. Many of the key determinants are illustrated inFigure 2.3.
This combination of macro- and micro-environment analysis buildsthe external context in which strategy can be effectively devised, or,more commonly, revised.
External strategic analysis – market-based view 31
Threat of newentrants
Bargainingpower ofsuppliers
Bargainingpower ofbuyers
Threat of substituteproducts and
services
Rivalry amongexisting competitors
Figure 2.2 Porter’s Five Forces framework
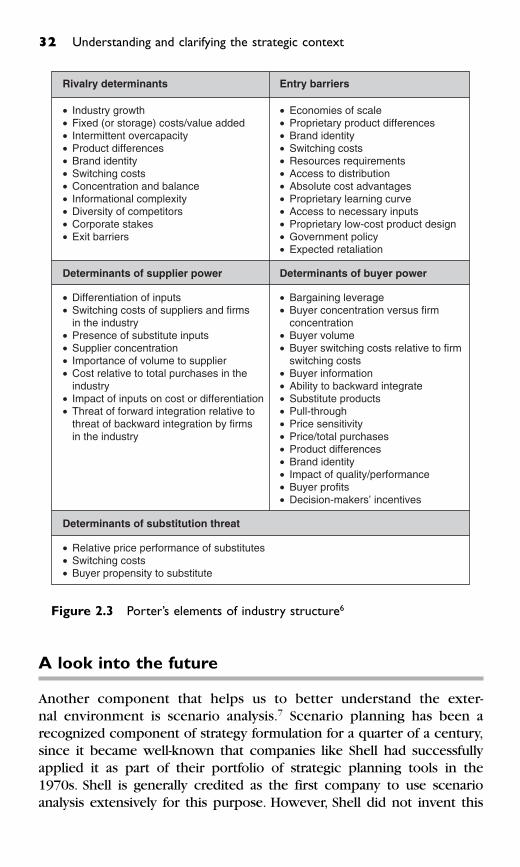
A look into the future
Another component that helps us to better understand the exter-nal environment is scenario analysis.7 Scenario planning has been arecognized component of strategy formulation for a quarter of a century,since it became well-known that companies like Shell had successfullyapplied it as part of their portfolio of strategic planning tools in the1970s. Shell is generally credited as the first company to use scenarioanalysis extensively for this purpose. However, Shell did not invent this
32 Understanding and clarifying the strategic context
Rivalry determinants Entry barriers
• Economies of scale• Proprietary product differences• Brand identity• Switching costs• Resources requirements• Access to distribution• Absolute cost advantages• Proprietary learning curve• Access to necessary inputs• Proprietary low-cost product design• Government policy• Expected retaliation
Determinants of supplier power Determinants of buyer power
• Bargaining leverage• Buyer concentration versus firm concentration• Buyer volume• Buyer switching costs relative to firm switching costs• Buyer information• Ability to backward integrate• Substitute products• Pull-through• Price sensitivity• Price/total purchases• Product differences• Brand identity• Impact of quality/performance• Buyer profits• Decision-makers’ incentives
Determinants of substitution threat
• Industry growth• Fixed (or storage) costs/value added• Intermittent overcapacity• Product differences• Brand identity• Switching costs• Concentration and balance• Informational complexity• Diversity of competitors• Corporate stakes• Exit barriers
• Differentiation of inputs• Switching costs of suppliers and firms in the industry• Presence of substitute inputs• Supplier concentration• Importance of volume to supplier• Cost relative to total purchases in the industry• Impact of inputs on cost or differentiation• Threat of forward integration relative to threat of backward integration by firms in the industry
• Relative price performance of substitutes• Switching costs• Buyer propensity to substitute
Figure 2.3 Porter’s elements of industry structure6
approach; in fact, similar methods have been used for more like half acentury. Herman Kahn developed the basic technique, which he initiallycalled ‘future-now’ thinking, for the RAND Corporation in the 1950s.
At first, Shell applied scenarios to making better decisions about cap-ital investment projects, which were more robust under a variety ofalternative futures, before adapting them to strategic planning more gen-erally. Shell of course is no stranger to the vagaries and impacts ofvolatile oil prices either then or today. Several practitioners from thecompany – including Pierre Wack, Kees van der Heijden and Arie deGeus – have described the art of applying scenario planning withinorganizations and what benefits can be accrued. Shell’s former managingdirector André Bénard commented in 1980 that: ‘Experience has taught
us that the scenario technique is much more conducive to forcing
people to think about the future than the forecasting techniques we
formerly used.’The basis of scenario planning involves defining and visualizing
alternative views of how today’s status quo in the operating environ-ment might evolve in the future. It distils the countless possibilities ofthe future state into a limited set of coherent views. And of course,what might happen in the future has a corollary: what to do about it?
Typically, scenario analysis asks ‘what if’ questions about the futuredirection of the ‘ecosystem’ in which the enterprise operates. So boththe macro- and micro-climate analysis, described above, will normallybe helpful towards informing this future-orientated analysis path. Thepower of scenario analysis, however, is in identifying the potentialimpacts of multiple events occurring simultaneously due to their inter-connectivity. Each scenario needs a general theme that the organiza-tion’s senior executives perceive as a potential threat – or opportunity –which needs to be addressed in the organization’s longer-term stra-tegic planning.
For example, Shell announced in June 2005 that the primary focus ofits scenario planning to 2025 would switch from its previous (2001)assumptions about technological advances – that might see a shift infuel consumption from oil to gas, nuclear and renewable energy – toone of national security and trust in the marketplace. Jeroen van derVeer, Chief executive, said:
Western societies now look to the state more than in recentdecades to lead the restoration of physical security and marketintegrity.This brings into sharper focus the power of the state toregulate and coerce, in a role involving both the direct interven-tion to fight terrorism and police the market, and a more generalemphasis on transparency, disclosure and good governance.
External strategic analysis – market-based view 33
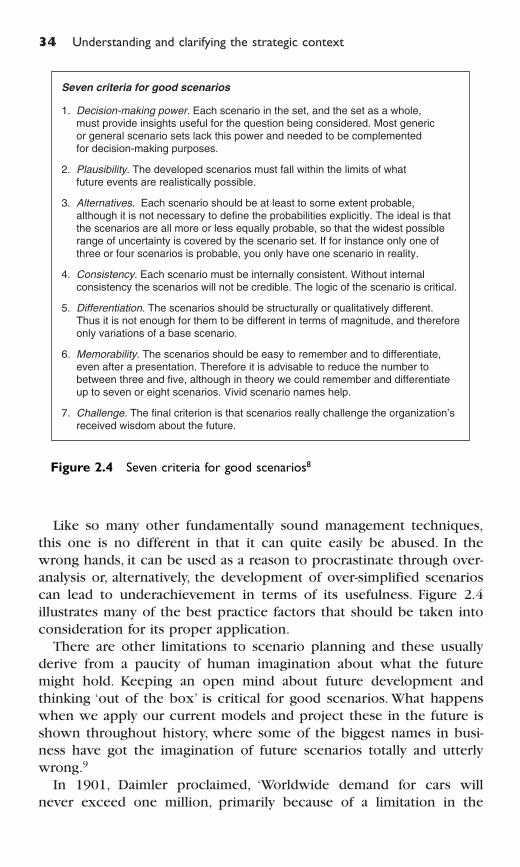
Like so many other fundamentally sound management techniques,this one is no different in that it can quite easily be abused. In thewrong hands, it can be used as a reason to procrastinate through over-analysis or, alternatively, the development of over-simplified scenarioscan lead to underachievement in terms of its usefulness. Figure 2.4illustrates many of the best practice factors that should be taken intoconsideration for its proper application.
There are other limitations to scenario planning and these usuallyderive from a paucity of human imagination about what the futuremight hold. Keeping an open mind about future development andthinking ‘out of the box’ is critical for good scenarios. What happenswhen we apply our current models and project these in the future isshown throughout history, where some of the biggest names in busi-ness have got the imagination of future scenarios totally and utterlywrong.9
In 1901, Daimler proclaimed, ‘Worldwide demand for cars willnever exceed one million, primarily because of a limitation in the
34 Understanding and clarifying the strategic context
1. Decision-making power. Each scenario in the set, and the set as a whole, must provide insights useful for the question being considered. Most generic or general scenario sets lack this power and needed to be complemented for decision-making purposes.
2. Plausibility. The developed scenarios must fall within the limits of what future events are realistically possible.
3. Alternatives. Each scenario should be at least to some extent probable, although it is not necessary to define the probabilities explicitly. The ideal is that the scenarios are all more or less equally probable, so that the widest possible range of uncertainty is covered by the scenario set. If for instance only one of three or four scenarios is probable, you only have one scenario in reality.
4. Consistency. Each scenario must be internally consistent. Without internal consistency the scenarios will not be credible. The logic of the scenario is critical.
5. Differentiation. The scenarios should be structurally or qualitatively different. Thus it is not enough for them to be different in terms of magnitude, and therefore only variations of a base scenario.
6. Memorability. The scenarios should be easy to remember and to differentiate, even after a presentation. Therefore it is advisable to reduce the number to between three and five, although in theory we could remember and differentiate up to seven or eight scenarios. Vivid scenario names help.
7. Challenge. The final criterion is that scenarios really challenge the organization’s received wisdom about the future.
Seven criteria for good scenarios
Figure 2.4 Seven criteria for good scenarios8
number of available chauffeurs’. In 1915, Thomas Edison thought thatfuelled motors would soon be replaced by nickel-iron batteries. In1945, Thomas Watson, then IBM’s chief executive, declared, ‘I thinkthere is a world market for five computers’. In 1968, the respectedBusiness Week magazine reported, ‘The Japanese car industry isn’tlikely to carve a big slice out of the US market’. A decade later, thechief executive of DEC was quoted as saying, ‘There is no reason forany individual to have a computer at home’. And, as recently as 1995,Microsoft’s Bill Gates famously commented, ‘Internet is just a hype’.These misjudgements show that it is impossible to accurately pre-dict the future. However, what we can use scenarios for is to identifypossible and internally consistent developments in the external environment.
Clarifying the stakeholder value proposition
A stakeholder value proposition is a declaration of the way an organ-ization proposes to use its resources and competencies to deliver aparticular combination of values to its key stakeholders. A valueproposition brings together elements such as customer needs andorganizational capabilities. This means that a definitive value prop-osition cannot be created until the internal analysis (see Chapter 3) iscompleted.
The traditional three value propositions, seen as a promise an organ-ization makes to its customers, are operational excellence, product lead-ership, and customer intimacy.10 Operational excellence means thatorganizations market standard products to their customers, at the bestprice with least inconvenience. These organizations tend to offer thebest price for their products within their competitors’ radar. Productleadership means providing the very best products (new designsand/or new technology) to customers at the right time. Product lead-ers offer innovative products of exceptionally high quality, where priceis not a significant barrier for their customers. Customer intimacymeans proposing the best total solution to customers.These organiza-tions focus on delivering the best expert advice and tailored serviceto their customers.11
Dr Veronica Martinez and her colleagues from Cranfield School of Management have extended these three traditional value proposi-tions to build a value matrix.12 The result of this combination is amatrix with six value propositions: innovators, brand managers, priceminimizers, simplifiers, technological integrators and socializors (seeTable 2.3).
External strategic analysis – market-based view 35
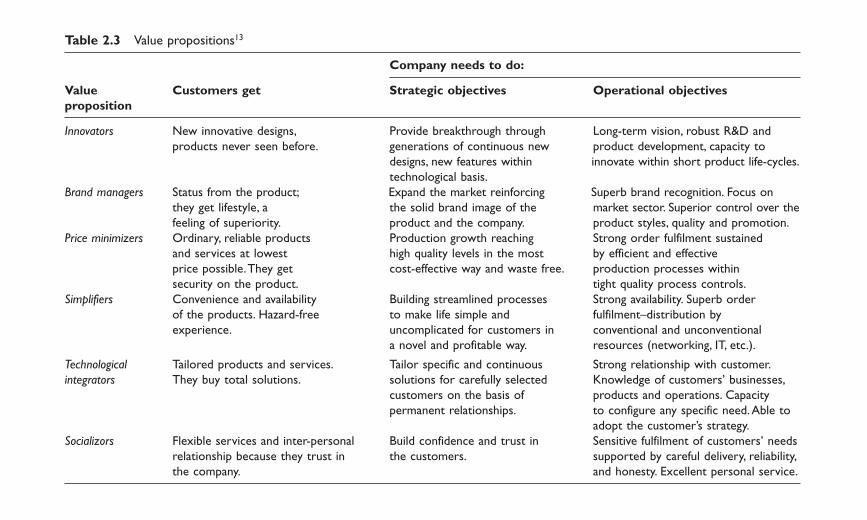
Table 2.3 Value propositions13
Company needs to do:
Value Customers get Strategic objectives Operational objectives
proposition
Innovators New innovative designs, Provide breakthrough through Long-term vision, robust R&D and
products never seen before. generations of continuous new product development, capacity to
designs, new features within innovate within short product life-cycles.
technological basis.
Brand managers Status from the product; Expand the market reinforcing Superb brand recognition. Focus on
they get lifestyle, a the solid brand image of the market sector. Superior control over the
feeling of superiority. product and the company. product styles, quality and promotion.
Price minimizers Ordinary, reliable products Production growth reaching Strong order fulfilment sustained
and services at lowest high quality levels in the most by efficient and effective
price possible.They get cost-effective way and waste free. production processes within
security on the product. tight quality process controls.
Simplifiers Convenience and availability Building streamlined processes Strong availability. Superb order
of the products. Hazard-free to make life simple and fulfilment–distribution by
experience. uncomplicated for customers in conventional and unconventional
a novel and profitable way. resources (networking, IT, etc.).
Technological Tailored products and services. Tailor specific and continuous Strong relationship with customer.
integrators They buy total solutions. solutions for carefully selected Knowledge of customers’ businesses,
customers on the basis of products and operations. Capacity
permanent relationships. to configure any specific need.Able to
adopt the customer’s strategy.
Socializors Flexible services and inter-personal Build confidence and trust in Sensitive fulfilment of customers’ needs
relationship because they trust in the customers. supported by careful delivery, reliability,
the company. and honesty. Excellent personal service.
External strategic analysis – market-based view 37
Understanding the external environment
Using the tools and classifications outlined in this chapter allows organ-izations to clarify the external environment and develop a better ideaabout their stakeholder value proposition. They can do this by askingthemselves who is it they are creating value for and what does valuein the context of the environment and the boundary conditions looklike.The next question is whether the organization is in a position todeliver this value proposition.To answer this question we move to theinternal analysis in the next chapter.
References and endnotes
1 For a good overview of different stakeholder needs and how tomeasure them see Neely, A., Adams, C. and Kennerley, M. (2002).The Performance Prism: The Scorecard for Measuring and
Managing Business Success. FT Prentice Hall: London.2 Ibid.3 Rappaport, A. (1998). Creating Shareholder Value: The New
Standard for Business Performance. Simon & Schuster: New York.4 See for example: Porter, M. E. (1980). Competitive Strategy. Free
Press: New York; or Porter, M. E. (1985). Competitive Advantage:
Creating and Sustaining Superior Performance. Free Press: NewYork.
5 Porter, M. E. (1979). How Competitive Forces Shape Strategy.Harvard Business Review, March/April, p. 137.
6 Source: Porter, M. E. (1985). Competitive Advantage: Creating and
Sustaining Superior Performance.The Free Press, p. 6.7 For an overview of how scenario planning can inform Strategic
Performance Management please see Fink, A., Marr, B., Siebe, A.,Kuhle, J.-P. (2005). The Future Scorecard: Combining internal andexternal scenarios to create strategic foresight. Management Deci-
sion, Vol. 43, No. 2. pp. 360–81.8 Source: Lindgren, M. and Bandhold, H. (2003). Scenario Planning.
Palgrave Macmillan, p. 31.9 I borrowed these examples from my colleagues and friends
Alexander Fink and Andreas Siebe, who have written a great bookon scenario management (unfortunately only available in German):Fink, A., Schlake, O. and Siebe, A. (2001). Erfolg Durch Szenario-
Management. Campus: Frankfurt.10 Treacy, M. and Wiersema, F. (1996). The disciplines of the market
leaders. Harper Collins: London.

11 I would like to thank Veronica Martinez for providing input forthis section. For more information see also Martinez, V. (forthcom-ing). A Model for Managing the Creation and Operation of Organ-izational Value:The Value Matrix. British Journal of Management.
12 Ibid.13 Ibid.
38 Understanding and clarifying the strategic context
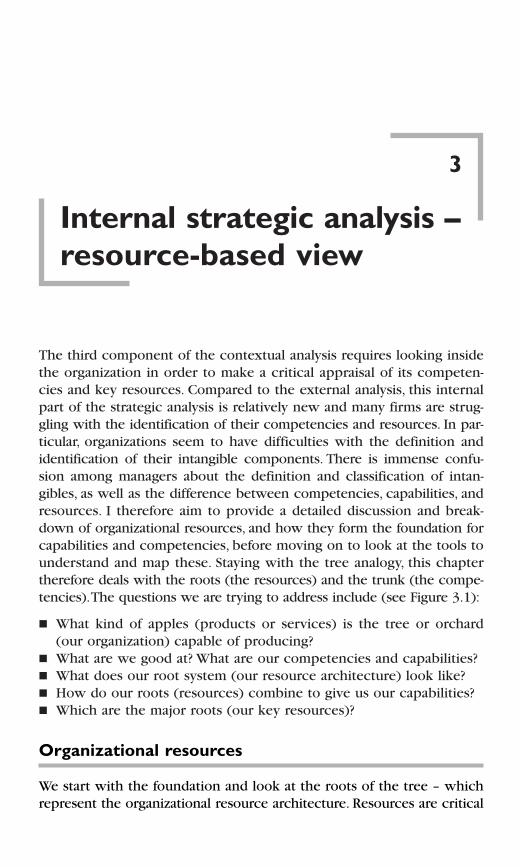
3
Internal strategic analysis –
resource-based view
The third component of the contextual analysis requires looking insidethe organization in order to make a critical appraisal of its competen-cies and key resources. Compared to the external analysis, this internalpart of the strategic analysis is relatively new and many firms are strug-gling with the identification of their competencies and resources. In par-ticular, organizations seem to have difficulties with the definition andidentification of their intangible components. There is immense confu-sion among managers about the definition and classification of intan-gibles, as well as the difference between competencies, capabilities, andresources. I therefore aim to provide a detailed discussion and break-down of organizational resources, and how they form the foundation forcapabilities and competencies, before moving on to look at the tools tounderstand and map these. Staying with the tree analogy, this chaptertherefore deals with the roots (the resources) and the trunk (the compe-tencies).The questions we are trying to address include (see Figure 3.1):
� What kind of apples (products or services) is the tree or orchard(our organization) capable of producing?
� What are we good at? What are our competencies and capabilities?� What does our root system (our resource architecture) look like?� How do our roots (resources) combine to give us our capabilities?� Which are the major roots (our key resources)?
Organizational resources
We start with the foundation and look at the roots of the tree – whichrepresent the organizational resource architecture. Resources are critical
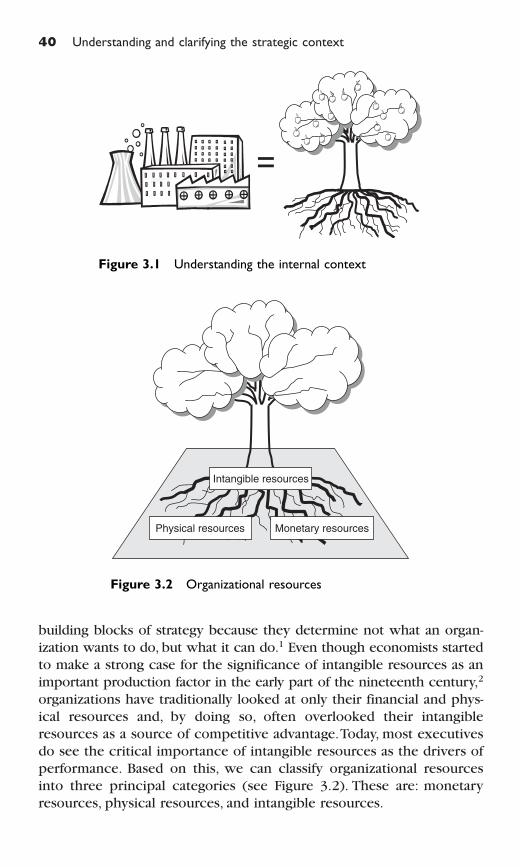
building blocks of strategy because they determine not what an organ-ization wants to do, but what it can do.1 Even though economists startedto make a strong case for the significance of intangible resources as animportant production factor in the early part of the nineteenth century,2
organizations have traditionally looked at only their financial and phys-ical resources and, by doing so, often overlooked their intangibleresources as a source of competitive advantage.Today, most executivesdo see the critical importance of intangible resources as the drivers ofperformance. Based on this, we can classify organizational resourcesinto three principal categories (see Figure 3.2). These are: monetaryresources, physical resources, and intangible resources.
40 Understanding and clarifying the strategic context
Figure 3.1 Understanding the internal context
Physical resources Monetary resources
Intangible resources
Figure 3.2 Organizational resources
Monetary resources are simply the amount of cash available – fromvarious sources such as cash flows, borrowings, asset sales, equity stakes,etc. – to invest in the maintenance and development of either physicalor intangible resources. Physical resources consist of such items as fac-tories, information and communication technology infrastructure, R&Dfacilities, plant and equipment, premises or land, and, in some cases,owned natural resources. Intangible resources are non-physical sourcesof value such as knowledge and skills of employees, brand image, repu-tation, relationships with suppliers, organizational culture, best prac-tices, or patents.
From a resource-based perspective, it is argued that resources are onlyvaluable if they provide a unique competitive advantage for the organ-ization and if they support the organization’s core competencies.3 Inorder for them to be strategically valuable, resources must thereforebe inimitable, not substitutable, tacit in nature, or synergistic.4 It is oftenargued that in today’s economy most physical resources are transientand are therefore rarely sources of competitive advantage.With this inmind, one might argue that they could therefore be ignored. However,many intangible resources are only valuable in relationship with existingphysical resources, or vice versa. Physical resources are often leversthat enable companies to benefit from their intangible resources.
Wal-Mart’s expertise in inventory replenishment, for example, is a keyintangible element, but without physical resources such as the innova-tive physical distribution centres and store layouts it would be less, ornot at all, valuable.5 The fact that physical resources rarely create a com-petitive advantage on their own does not mean that they cannot be keydrivers of competitive advantage and performance. One might thinkabout DeBeers and its possession of diamond mines, or oil companiessuch as Exxon or BP and their oil reserves. We will come back to theinterrelated nature of organizational resources, but before we do thiswe need to better define intangible resources and their important rolein creating value.
The importance of intangible resources
A recent survey commissioned by the consulting firm Accenturerevealed that most executives around the world believe that intangiblesare critical for the future success of their businesses.6 However, at thesame time, most agreed that their approaches to managing intangibleswere poor or non-existent. Indeed, it is estimated that the level of UScorporate investment in intangible assets, around $1 trillion annually,almost matches investment in tangible assets.7
Internal strategic analysis – resource-based view 41
But not only commercial enterprises are seeing the value in intangibleresources; other organizations and governments are recognizing theimportance of them also. In the United Kingdom, for example, PrimeMinister Tony Blair wrote in a recent Government White Paper thatintangible resources such as creativity and inventiveness are the great-est source of economic success but that too many firms have failed toput enough emphasis on R&D and developing skills.8 Patricia Hewitt,the UK’s Secretary of State for Trade and Industry, added in a recentreport that increasingly it is the intangible factors that underpin innov-ation and the best-performing businesses.9 A report of the BrookingsTask Force on Intangibles outlines that the large and growing discrep-ancy between the importance of intangible assets to economic growthand the ability to clearly identify, measure, and account for those assetsis a serious problem for business managers, investors, and governments.10
In order to identify intangibles we need to first define what we meanby them.
What are intangible resources?
The concept of intangible assets is frequently used, but not always welldefined. Often different terms are used to describe the same concept,which means that intangible resources are also referred to using termin-ology such as ‘intangible assets’, ‘intellectual capital’, or ‘knowledgeassets’.11 Since this book is about Strategic Performance Management,we use the terminology ‘intangible resource’, which is most closelyassociated with Strategic Management thinking.12
Many different classifications and definitions exist for intangibleresources. It is important to stress that there is no right or wrong clas-sification. Instead, what is important is that a classification is comprehen-sive, and doesn’t leave out important forms of intangible resources.Theclassification provided below ensures that all critical intangible resourcesare included.The key objective of this classification is to facilitate theidentification of the intangible resources within organizations. Debateswhether one intangible should be put into one category or another aretherefore not productive or particularly useful. What is important isthat we identify all intangible resources that matter.
Here, intangible resources are defined as non-tangible resources thatare attributed to an organization and which support an organization’scompetencies and therefore contribute to the delivery of the organiza-tional value proposition to its various stakeholders. Intangible resourcescan be split into three component classes: these are human resources,structural resources, and relational resources (see Figure 3.3).
42 Understanding and clarifying the strategic context
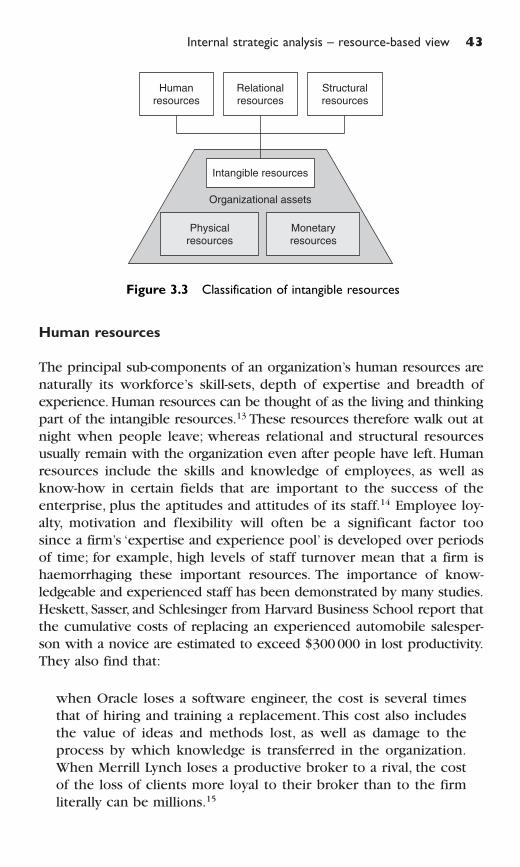
Human resources
The principal sub-components of an organization’s human resources arenaturally its workforce’s skill-sets, depth of expertise and breadth ofexperience. Human resources can be thought of as the living and thinkingpart of the intangible resources.13 These resources therefore walk out atnight when people leave; whereas relational and structural resourcesusually remain with the organization even after people have left. Humanresources include the skills and knowledge of employees, as well asknow-how in certain fields that are important to the success of theenterprise, plus the aptitudes and attitudes of its staff.14 Employee loy-alty, motivation and flexibility will often be a significant factor toosince a firm’s ‘expertise and experience pool’ is developed over periodsof time; for example, high levels of staff turnover mean that a firm ishaemorrhaging these important resources. The importance of know-ledgeable and experienced staff has been demonstrated by many studies.Heskett, Sasser, and Schlesinger from Harvard Business School report thatthe cumulative costs of replacing an experienced automobile salesper-son with a novice are estimated to exceed $300 000 in lost productivity.They also find that:
when Oracle loses a software engineer, the cost is several timesthat of hiring and training a replacement.This cost also includesthe value of ideas and methods lost, as well as damage to theprocess by which knowledge is transferred in the organization.When Merrill Lynch loses a productive broker to a rival, the costof the loss of clients more loyal to their broker than to the firmliterally can be millions.15
Internal strategic analysis – resource-based view 43
Physicalresources
Monetaryresources
Organizational assets
Intangible resources
Humanresources
Structuralresources
Relationalresources
Figure 3.3 Classification of intangible resources
Relational resources
Relational resources are the relationships that exist between an organ-ization and any outside party, both with key individuals and otherorganizations.These can include customers, intermediaries, employees,suppliers, alliance partners, regulators, pressure groups, communities,creditors or investors. Relationships tend to fall into two categories –those that are formalized through, for example, contractual obligationswith major customers and partners, and those that are more informal.While in the past, the former tended to be predominant, today the lat-ter have a more important say in how the enterprise is managed.Thetype of relationship can have an impact on the value of these relation-ships; for example, they can determine the effectiveness of the infor-mation that is transferred between related parties.
In today’s integrated economy and just-in-time supply chains, rela-tionships with trading partners and suppliers can be crucial.The follow-ing example comes from the cell phone industry.16 A fire in a Philipssemiconductor plant in Albuquerque, New Mexico destroyed parts ofthe production facilities to produce a crucial cell phone chip whichPhilips supplied to both Nokia in Finland and Ericsson in Sweden, twomajor competitors in this area. Both companies were alerted to thefire at the same time, being told that production might be interrupted fora few days but should be resumed shortly. In the past, Nokia identifiedall strategically important suppliers and ensured that close relation-ships were established. This meant that Nokia’s supply chain managerhad a good relationship with the Philips plant in Albuquerque.They haddaily communications and it soon became apparent that the produc-tion facility would not be up and running in a few days. Nokia there-fore was able to launch its contingency strategy; it globally sourcedand contracted alternative suppliers of this chip. Ericsson only foundout about the real extent of the fire much later, with the consequencethat Ericsson was unable to source sufficient chips to meet theirdemands, which probably contributed to the fact that Ericssondecided to discontinue the production of cell phones altogether.
Other factors that fall into this category are brand image, corporatereputation, and product/service reputation. Increasingly, this latter sub-category can be particularly important to the success or failure of organ-izations, and executives ignore this aspect at their peril. Researchcarried out by Richard Hall in 1992,17 in a survey of 95 firms, identifiedreputation, both of the company and the products, as a critical contribu-tor to overall success. A series of corporate scandals, the knock-on effectsof which caused the rapid meltdown of several formerly respectedcompanies (not least those of Enron, once the United States’ seventh
44 Understanding and clarifying the strategic context
largest company by market capitalization, and Arthur Andersen, one ofthe ‘big five’ accountancy firms worldwide) have since put an evenhigher emphasis on the relative importance of corporate reputation asa critical strategic aspect of intangible resources and a vital resource fordevelopment. Reputation is not only an important intangible resourcefor companies but also for public sector organizations and governments.In fact, a recent study found that perceived organizational reputationis a key success factor in local authorities.18
Structural resources
A firm’s structural resources cover a broad range of vital factors.Foremost among these factors are usually the organization’s essentialoperating processes, the way it is structured, its policies, its informa-tion flows and the content of its databases, its leadership and manage-ment style, its culture and its incentive schemes, but they also includethe intangible resources that are legally protected.These resources canbe sub-categorized into culture, practices and routines, and intellectualproperty.
Organizational culture can reinforce the achievement of the overallgoals, sometimes also referred to as social capital and context.19
Corporate culture gives each person in an organization a commonand distinctive method for transmitting and processing information; itdefines a common way of seeing things, sets the decision-making pat-tern, and establishes the value system.20 Culture resources embracecategories such as corporate culture, organizational values, and man-agement philosophies. They provide employees with a shared frame-work to interpret events, a framework that encourages individuals tooperate both as an autonomous entity and as a team in order to achievethe company’s objectives.21
Practices and routines can be important organizational resources.Shared knowledge in organizations is expressed in routines and prac-tices.22 Practices and routines include internal practices, virtual networksand review processes; these can be formalized or informal proceduresand tacit rules. Formalized routines include process manuals providingcodified procedures and rules; informal routines could be codes ofbehaviour or understood (but unstated) workflows. Practices and rou-tines determine how processes are being handled and how work flowsthrough the organization. An example of a process that has become avaluable strategic resource is the 25-minute airplane turnaround timeat Southwest Airlines.A process introduced as a necessity to start up thebusiness as a low-cost carrier, today has become a key differentiator.Any
Internal strategic analysis – resource-based view 45
additional minute at the gate would cost Southwest Airlines more than$186 million in investments and about $18 million in financing costs.23
Intellectual property – owned or legally protected intangibleresources – is becoming increasingly important. Patents and tradesecrets have become a key element of competition in high-tech organ-izations.24 Here intellectual property is defined as the sum of resourcessuch as patents, copyrights, trademarks, brands, registered design, tradesecrets, database content and processes whose ownership is grantedto the company by law.25 Intellectual property is an element of organ-izational knowledge that is owned by the organization and can’t walkout at night when everyone goes home. It represents the tools andenablers that help to define and differentiate an organization’s uniqueoffering to the markets in which it operates. Intellectual propertyincludes trademark symbols such as the McDonald’s Arches and theNike Swoosh, or the patented ‘1-click’ buying option at Amazon.com.Coca-Cola, for example, made a conscious decision to keep the formulafor Coke a trade secret that is actively protected. Had they patentedthe formula instead, their patent protection would have run out manyyears ago, most likely destroying their market share.
Even though most organizations possess a wide stock of intangibleresources not all of those are critical value drivers.The reasons for thisare that the value of resources is context specific and that resources arenot just static – they dynamically interact with each other to be trans-formed into capabilities and core competencies. For example, the know-how of creating light and durable composite materials so essential forsuccessful Formula One motor racing teams is probably of little value toa telecommunications firm. On the other hand, the brand awarenessand reputation of Amazon.com would fade rapidly without the efficientdistribution network, the well-designed internal processes, and thestrong supplier relationships it has developed.This is often referred toas the interconnectedness of resource stocks.
Capabilities and core competencies
No discussion about strategy and organizational resources would becomplete without a view of how the individual resources interrelatewith each other to create vital capabilities and core competencies.Similar to the definition of intangible resources, little consensus existsabout what exactly constitutes a capability or a core competence.Whilepeople often use the words ‘capabilities’ and ‘core competencies’ inter-changeably, I believe that some clear distinctions need to be made,which I outline below.
46 Understanding and clarifying the strategic context
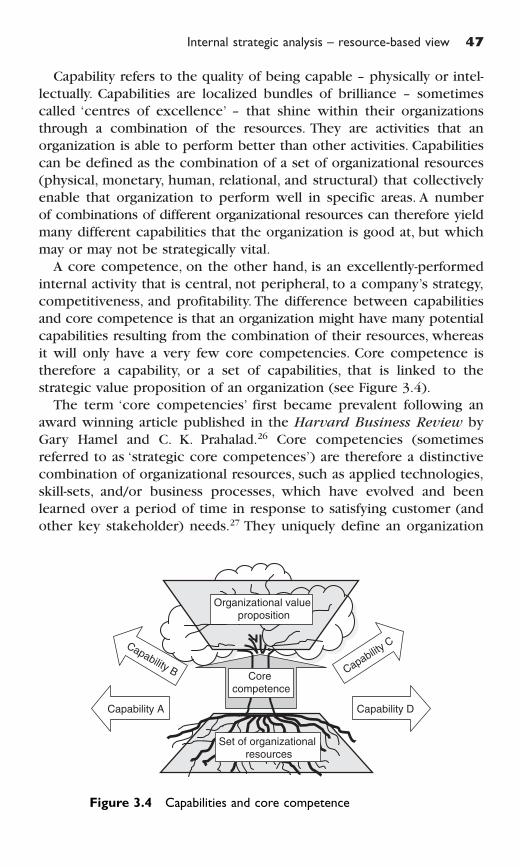
Capability refers to the quality of being capable – physically or intel-lectually. Capabilities are localized bundles of brilliance – sometimescalled ‘centres of excellence’ – that shine within their organizationsthrough a combination of the resources. They are activities that anorganization is able to perform better than other activities. Capabilitiescan be defined as the combination of a set of organizational resources(physical, monetary, human, relational, and structural) that collectivelyenable that organization to perform well in specific areas. A numberof combinations of different organizational resources can therefore yieldmany different capabilities that the organization is good at, but whichmay or may not be strategically vital.
A core competence, on the other hand, is an excellently-performedinternal activity that is central, not peripheral, to a company’s strategy,competitiveness, and profitability. The difference between capabilitiesand core competence is that an organization might have many potentialcapabilities resulting from the combination of their resources, whereasit will only have a very few core competencies. Core competence istherefore a capability, or a set of capabilities, that is linked to thestrategic value proposition of an organization (see Figure 3.4).
The term ‘core competencies’ first became prevalent following anaward winning article published in the Harvard Business Review byGary Hamel and C. K. Prahalad.26 Core competencies (sometimesreferred to as ‘strategic core competences’) are therefore a distinctivecombination of organizational resources, such as applied technologies,skill-sets, and/or business processes, which have evolved and beenlearned over a period of time in response to satisfying customer (andother key stakeholder) needs.27 They uniquely define an organization
Internal strategic analysis – resource-based view 47
Set of organizational resources
Organizational value proposition
Capability A Capability D
Capability B Capability C
Core competence
Figure 3.4 Capabilities and core competence
and provide a thread running through it, weaving their resourcestogether into a coherent whole.28 It is also the evolutionary learningprocess that gestates within the organization that makes it uniqueand, therefore, extremely difficult for competitors to replicate.
Often-quoted examples of core competencies are Sony’s expertisein miniaturization to create ‘pocketable’ consumer products and Honda’sability to get the best out of internal combustion engines.29 Honda’ssuperior expertise in compact engine construction enabled it to buildon this competence and become a major competitor to many estab-lished manufacturers of, for example, motorboat engines, lawn mowersand portable generators through its retail relationships, while continu-ing to sell automobiles and motorcycles through its own dealerships.Another company’s management that has built its success on its under-standing of the firm’s core competencies is Wal-Mart, which trans-formed the company by building on its knowledge of ‘cross-docking’.This supply chain management best practice – whereby incoming goodsare immediately trans-shipped to delivery vehicles without expensivewarehousing – was one of the factors that enabled Wal-Mart to outper-form its rival K-Mart.30
Recognizing what capabilities an organization possesses and whatcore competencies are required to deliver the organizational valueproposition is fundamental to strategy development. What can pose achallenge is harmonizing different capabilities that are required todeliver desired outcomes or core competencies, for example, excellentcustomer service. Consider a common business process, such as theorder-to-cash fulfilment process in an electronics business for instance.The customer places an order, the company makes and delivers it, andthen gets paid for it.To the customer it is a single process with multiplecomponents, but it implies the presence of at least six different cap-abilities.These are:
� Customer order handling capability� Planning and scheduling capability� Procurement capability� Manufacturing capability� Distribution capability� Credit management capability.
Each of these capabilities requires different skill-sets, different practices,different technologies (although some IT systems will likely be multi-functional and integrated) and different physical resources, such asoffices, a factory, and warehouses. If each component capability doesnot dovetail effectively and cohesively with its peers within the same
48 Understanding and clarifying the strategic context
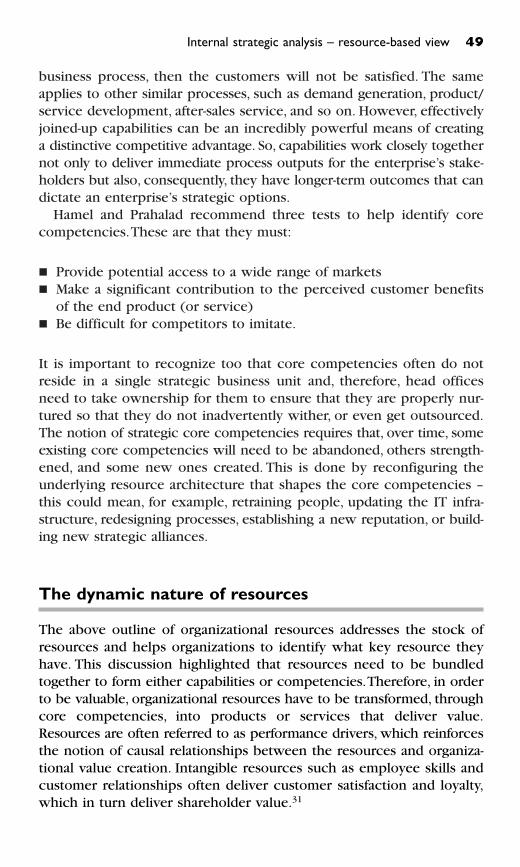
business process, then the customers will not be satisfied. The sameapplies to other similar processes, such as demand generation, product/service development, after-sales service, and so on. However, effectivelyjoined-up capabilities can be an incredibly powerful means of creatinga distinctive competitive advantage. So, capabilities work closely togethernot only to deliver immediate process outputs for the enterprise’s stake-holders but also, consequently, they have longer-term outcomes that candictate an enterprise’s strategic options.
Hamel and Prahalad recommend three tests to help identify corecompetencies.These are that they must:
� Provide potential access to a wide range of markets� Make a significant contribution to the perceived customer benefits
of the end product (or service)� Be difficult for competitors to imitate.
It is important to recognize too that core competencies often do notreside in a single strategic business unit and, therefore, head officesneed to take ownership for them to ensure that they are properly nur-tured so that they do not inadvertently wither, or even get outsourced.The notion of strategic core competencies requires that, over time, someexisting core competencies will need to be abandoned, others strength-ened, and some new ones created. This is done by reconfiguring theunderlying resource architecture that shapes the core competencies –this could mean, for example, retraining people, updating the IT infra-structure, redesigning processes, establishing a new reputation, or build-ing new strategic alliances.
The dynamic nature of resources
The above outline of organizational resources addresses the stock ofresources and helps organizations to identify what key resource theyhave. This discussion highlighted that resources need to be bundledtogether to form either capabilities or competencies.Therefore, in orderto be valuable, organizational resources have to be transformed, throughcore competencies, into products or services that deliver value.Resources are often referred to as performance drivers, which reinforcesthe notion of causal relationships between the resources and organiza-tional value creation. Intangible resources such as employee skills andcustomer relationships often deliver customer satisfaction and loyalty,which in turn deliver shareholder value.31
Internal strategic analysis – resource-based view 49
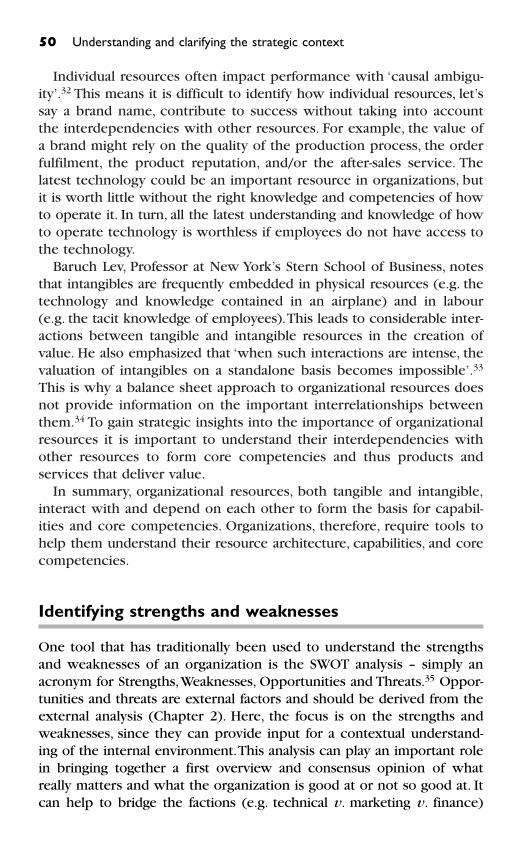
Individual resources often impact performance with ‘causal ambigu-ity’.32 This means it is difficult to identify how individual resources, let’ssay a brand name, contribute to success without taking into accountthe interdependencies with other resources. For example, the value ofa brand might rely on the quality of the production process, the orderfulfilment, the product reputation, and/or the after-sales service. Thelatest technology could be an important resource in organizations, butit is worth little without the right knowledge and competencies of howto operate it. In turn, all the latest understanding and knowledge of howto operate technology is worthless if employees do not have access tothe technology.
Baruch Lev, Professor at New York’s Stern School of Business, notesthat intangibles are frequently embedded in physical resources (e.g. thetechnology and knowledge contained in an airplane) and in labour(e.g. the tacit knowledge of employees).This leads to considerable inter-actions between tangible and intangible resources in the creation ofvalue. He also emphasized that ‘when such interactions are intense, thevaluation of intangibles on a standalone basis becomes impossible’.33
This is why a balance sheet approach to organizational resources doesnot provide information on the important interrelationships betweenthem.34 To gain strategic insights into the importance of organizationalresources it is important to understand their interdependencies withother resources to form core competencies and thus products andservices that deliver value.
In summary, organizational resources, both tangible and intangible,interact with and depend on each other to form the basis for capabil-ities and core competencies. Organizations, therefore, require tools tohelp them understand their resource architecture, capabilities, and corecompetencies.
Identifying strengths and weaknesses
One tool that has traditionally been used to understand the strengthsand weaknesses of an organization is the SWOT analysis – simply anacronym for Strengths,Weaknesses, Opportunities and Threats.35 Oppor-tunities and threats are external factors and should be derived from theexternal analysis (Chapter 2). Here, the focus is on the strengths andweaknesses, since they can provide input for a contextual understand-ing of the internal environment.This analysis can play an important rolein bringing together a first overview and consensus opinion of whatreally matters and what the organization is good at or not so good at. Itcan help to bridge the factions (e.g. technical v. marketing v. finance)
50 Understanding and clarifying the strategic context
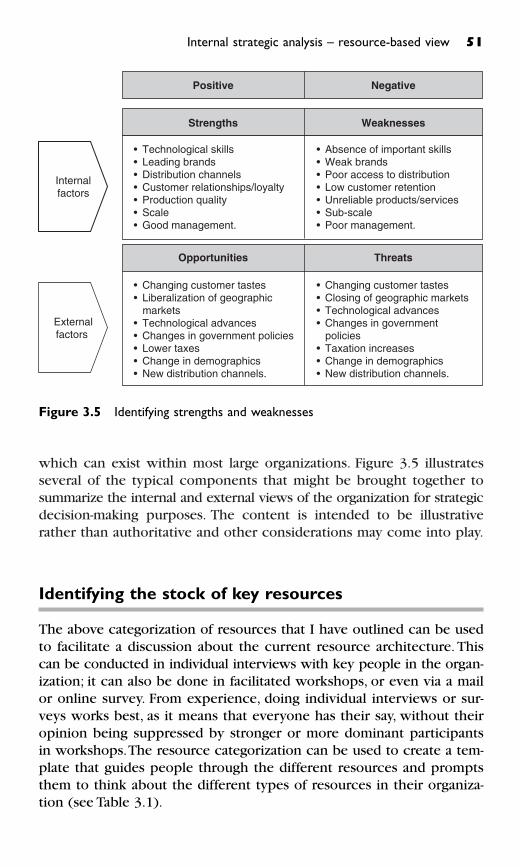
which can exist within most large organizations. Figure 3.5 illustratesseveral of the typical components that might be brought together tosummarize the internal and external views of the organization for strategicdecision-making purposes. The content is intended to be illustrativerather than authoritative and other considerations may come into play.
Identifying the stock of key resources
The above categorization of resources that I have outlined can be usedto facilitate a discussion about the current resource architecture. Thiscan be conducted in individual interviews with key people in the organ-ization; it can also be done in facilitated workshops, or even via a mailor online survey. From experience, doing individual interviews or sur-veys works best, as it means that everyone has their say, without theiropinion being suppressed by stronger or more dominant participantsin workshops.The resource categorization can be used to create a tem-plate that guides people through the different resources and promptsthem to think about the different types of resources in their organiza-tion (see Table 3.1).
Internal strategic analysis – resource-based view 51
• Changing customer tastes• Closing of geographic markets• Technological advances• Changes in government policies• Taxation increases• Change in demographics • New distribution channels.
• Changing customer tastes• Liberalization of geographic markets• Technological advances• Changes in government policies• Lower taxes• Change in demographics• New distribution channels.
• Technological skills• Leading brands• Distribution channels• Customer relationships/loyalty• Production quality• Scale• Good management.
• Absence of important skills• Weak brands• Poor access to distribution• Low customer retention• Unreliable products/services• Sub-scale• Poor management.
Opportunities
Strengths
Positive
Externalfactors
Internalfactors
Negative
Weaknesses
Threats
Figure 3.5 Identifying strengths and weaknesses
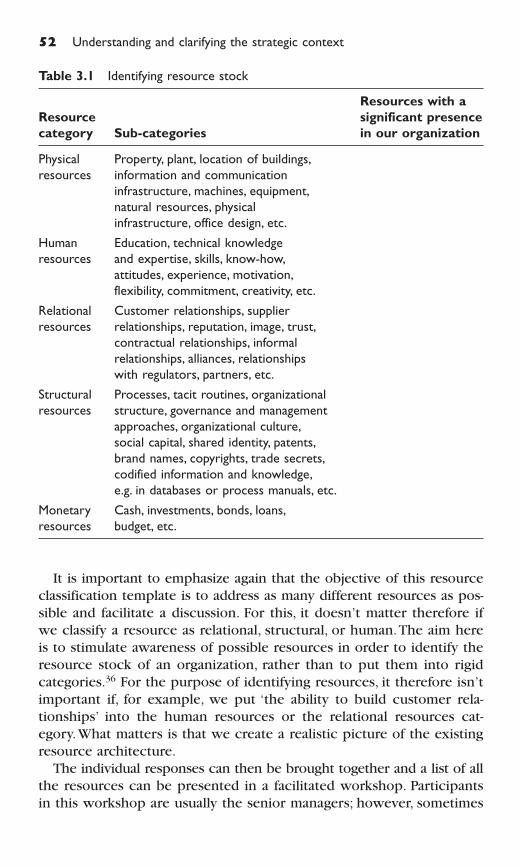
It is important to emphasize again that the objective of this resourceclassification template is to address as many different resources as pos-sible and facilitate a discussion. For this, it doesn’t matter therefore ifwe classify a resource as relational, structural, or human.The aim hereis to stimulate awareness of possible resources in order to identify theresource stock of an organization, rather than to put them into rigidcategories.36 For the purpose of identifying resources, it therefore isn’timportant if, for example, we put ‘the ability to build customer rela-tionships’ into the human resources or the relational resources cat-egory.What matters is that we create a realistic picture of the existingresource architecture.
The individual responses can then be brought together and a list of allthe resources can be presented in a facilitated workshop. Participantsin this workshop are usually the senior managers; however, sometimes
52 Understanding and clarifying the strategic context
Table 3.1 Identifying resource stock
Resources with a
Resource significant presence
category Sub-categories in our organization
Physical Property, plant, location of buildings,
resources information and communication
infrastructure, machines, equipment,
natural resources, physical
infrastructure, office design, etc.
Human Education, technical knowledge
resources and expertise, skills, know-how,
attitudes, experience, motivation,
flexibility, commitment, creativity, etc.
Relational Customer relationships, supplier
resources relationships, reputation, image, trust,
contractual relationships, informal
relationships, alliances, relationships
with regulators, partners, etc.
Structural Processes, tacit routines, organizational
resources structure, governance and management
approaches, organizational culture,
social capital, shared identity, patents,
brand names, copyrights, trade secrets,
codified information and knowledge,
e.g. in databases or process manuals, etc.
Monetary Cash, investments, bonds, loans,
resources budget, etc.
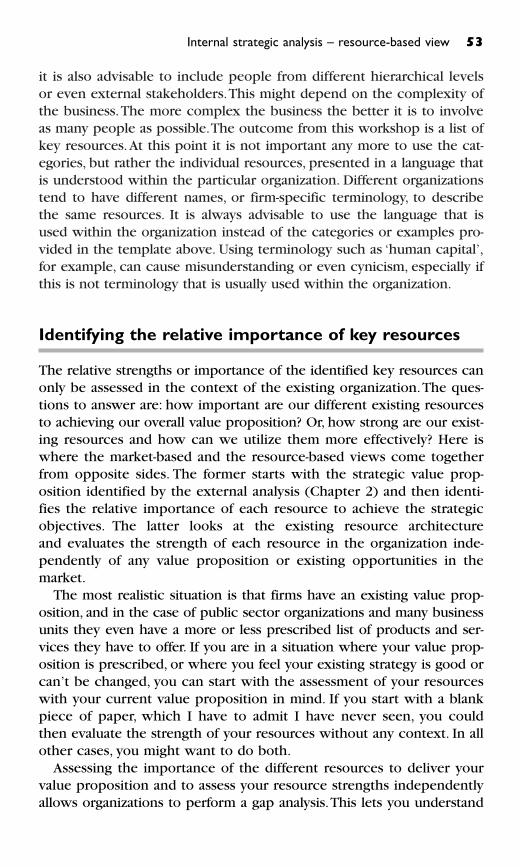
it is also advisable to include people from different hierarchical levelsor even external stakeholders.This might depend on the complexity ofthe business.The more complex the business the better it is to involveas many people as possible.The outcome from this workshop is a list ofkey resources.At this point it is not important any more to use the cat-egories, but rather the individual resources, presented in a language thatis understood within the particular organization. Different organizationstend to have different names, or firm-specific terminology, to describethe same resources. It is always advisable to use the language that isused within the organization instead of the categories or examples pro-vided in the template above. Using terminology such as ‘human capital’,for example, can cause misunderstanding or even cynicism, especially ifthis is not terminology that is usually used within the organization.
Identifying the relative importance of key resources
The relative strengths or importance of the identified key resources canonly be assessed in the context of the existing organization.The ques-tions to answer are: how important are our different existing resourcesto achieving our overall value proposition? Or, how strong are our exist-ing resources and how can we utilize them more effectively? Here iswhere the market-based and the resource-based views come togetherfrom opposite sides. The former starts with the strategic value prop-osition identified by the external analysis (Chapter 2) and then identi-fies the relative importance of each resource to achieve the strategicobjectives. The latter looks at the existing resource architecture and evaluates the strength of each resource in the organization inde-pendently of any value proposition or existing opportunities in themarket.
The most realistic situation is that firms have an existing value prop-osition, and in the case of public sector organizations and many businessunits they even have a more or less prescribed list of products and ser-vices they have to offer. If you are in a situation where your value prop-osition is prescribed, or where you feel your existing strategy is good orcan’t be changed, you can start with the assessment of your resourceswith your current value proposition in mind. If you start with a blankpiece of paper, which I have to admit I have never seen, you couldthen evaluate the strength of your resources without any context. In allother cases, you might want to do both.
Assessing the importance of the different resources to deliver yourvalue proposition and to assess your resource strengths independentlyallows organizations to perform a gap analysis.This lets you understand
Internal strategic analysis – resource-based view 53
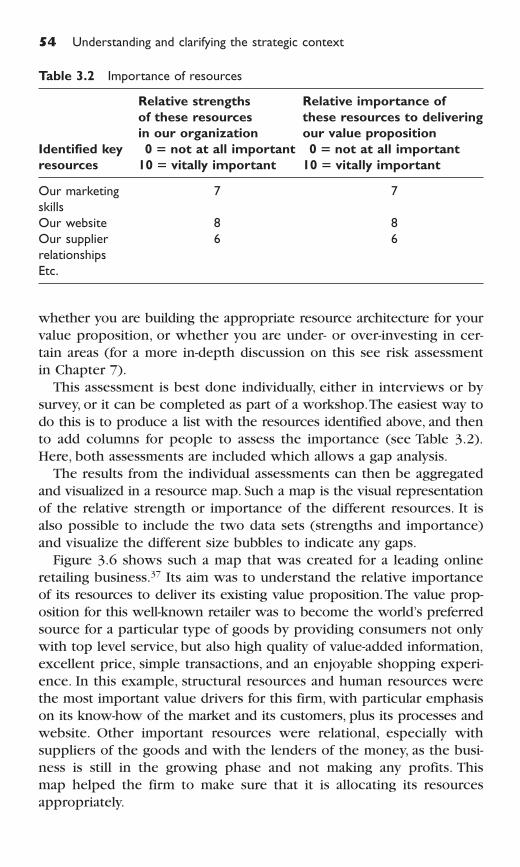
whether you are building the appropriate resource architecture for yourvalue proposition, or whether you are under- or over-investing in cer-tain areas (for a more in-depth discussion on this see risk assessmentin Chapter 7).
This assessment is best done individually, either in interviews or bysurvey, or it can be completed as part of a workshop.The easiest way todo this is to produce a list with the resources identified above, and thento add columns for people to assess the importance (see Table 3.2).Here, both assessments are included which allows a gap analysis.
The results from the individual assessments can then be aggregatedand visualized in a resource map. Such a map is the visual representationof the relative strength or importance of the different resources. It isalso possible to include the two data sets (strengths and importance)and visualize the different size bubbles to indicate any gaps.
Figure 3.6 shows such a map that was created for a leading onlineretailing business.37 Its aim was to understand the relative importanceof its resources to deliver its existing value proposition.The value prop-osition for this well-known retailer was to become the world’s preferredsource for a particular type of goods by providing consumers not onlywith top level service, but also high quality of value-added information,excellent price, simple transactions, and an enjoyable shopping experi-ence. In this example, structural resources and human resources werethe most important value drivers for this firm, with particular emphasison its know-how of the market and its customers, plus its processes andwebsite. Other important resources were relational, especially withsuppliers of the goods and with the lenders of the money, as the busi-ness is still in the growing phase and not making any profits. This map helped the firm to make sure that it is allocating its resourcesappropriately.
54 Understanding and clarifying the strategic context
Table 3.2 Importance of resources
Relative strengths Relative importance of
of these resources these resources to delivering
in our organization our value proposition
Identified key 0 � not at all important 0 � not at all important
resources 10 � vitally important 10 � vitally important
Our marketing 7 7
skills
Our website 8 8
Our supplier 6 6
relationships
Etc.
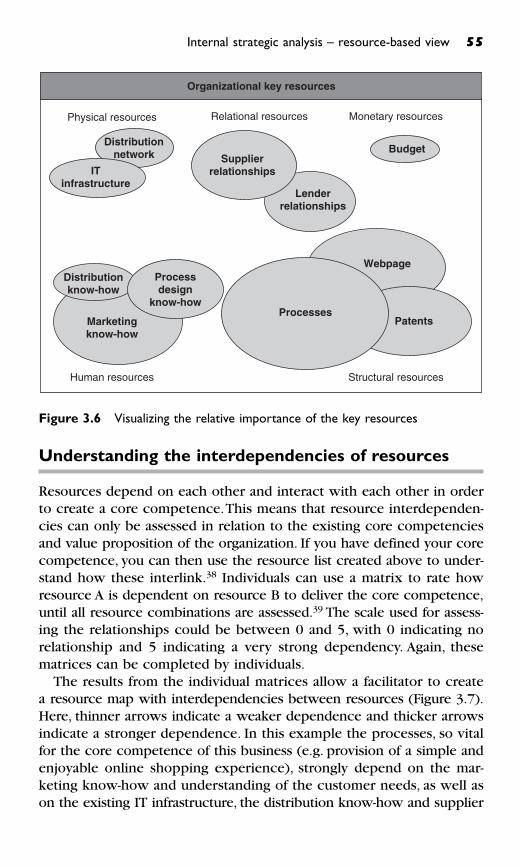
Understanding the interdependencies of resources
Resources depend on each other and interact with each other in orderto create a core competence.This means that resource interdependen-cies can only be assessed in relation to the existing core competenciesand value proposition of the organization. If you have defined your corecompetence, you can then use the resource list created above to under-stand how these interlink.38 Individuals can use a matrix to rate howresource A is dependent on resource B to deliver the core competence,until all resource combinations are assessed.39 The scale used for assess-ing the relationships could be between 0 and 5, with 0 indicating norelationship and 5 indicating a very strong dependency. Again, thesematrices can be completed by individuals.
The results from the individual matrices allow a facilitator to createa resource map with interdependencies between resources (Figure 3.7).Here, thinner arrows indicate a weaker dependence and thicker arrowsindicate a stronger dependence. In this example the processes, so vitalfor the core competence of this business (e.g. provision of a simple andenjoyable online shopping experience), strongly depend on the mar-keting know-how and understanding of the customer needs, as well ason the existing IT infrastructure, the distribution know-how and supplier
Internal strategic analysis – resource-based view 55
Organizational key resources
Marketingknow-how
Webpage
Budget
Patents
Distributionnetwork
Physical resources
Structural resourcesHuman resources
Relational resources Monetary resources
Lenderrelationships
Processes
Supplierrelationships
Distributionknow-how
Processdesign
know-how
ITinfrastructure
Figure 3.6 Visualizing the relative importance of the key resources
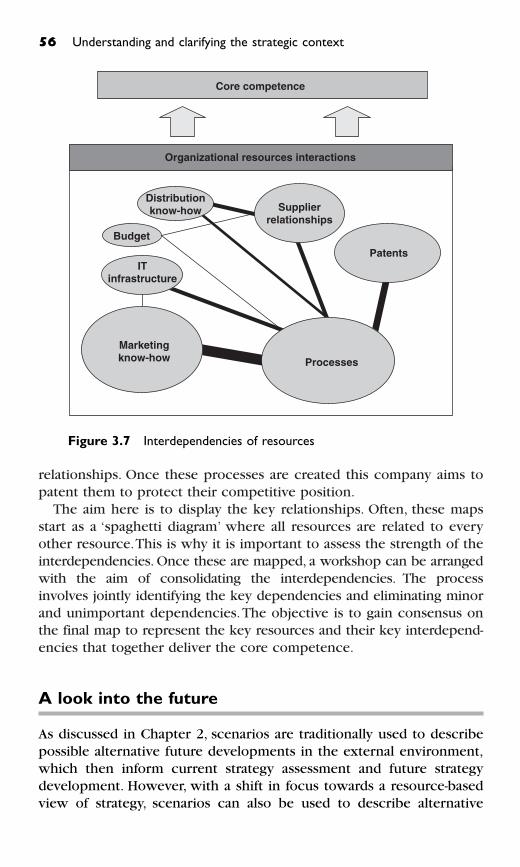
relationships. Once these processes are created this company aims topatent them to protect their competitive position.
The aim here is to display the key relationships. Often, these mapsstart as a ‘spaghetti diagram’ where all resources are related to everyother resource.This is why it is important to assess the strength of theinterdependencies. Once these are mapped, a workshop can be arrangedwith the aim of consolidating the interdependencies. The processinvolves jointly identifying the key dependencies and eliminating minorand unimportant dependencies.The objective is to gain consensus onthe final map to represent the key resources and their key interdepend-encies that together deliver the core competence.
A look into the future
As discussed in Chapter 2, scenarios are traditionally used to describepossible alternative future developments in the external environment,which then inform current strategy assessment and future strategydevelopment. However, with a shift in focus towards a resource-basedview of strategy, scenarios can also be used to describe alternative
56 Understanding and clarifying the strategic context
Core competence
Organizational resources interactions
Budget
Supplierrelationships
Patents
Marketingknow-how Processes
ITinfrastructure
Distributionknow-how
Figure 3.7 Interdependencies of resources
internal development paths for an organization.40 Internally, organiza-tions have many options of how to react to external opportunities andthreats. As outlined above, competencies are based on the resourceswhich often depend on each other and are often path-dependent – thatis, present choices about options are influenced by past choices.41
Within an organization there are often different perspectives on cur-rent problems, unsolved conflicts, different assumptions about the leverswhere changes could be initiated, different prioritizations of capabilityand resource development – and different interests. Considering thesedifferent views and accumulating diverse accounts about the possibledevelopments of the internal resources can yield important informationabout the future direction of the organization. Holding a workshop toexplore future developments of the organization allows managers tobring in their personal ideas and visions of the company’s future andsystematically link them to several strategy scenarios. Such workshopsare best led by an external facilitator who is experienced in develop-ing scenarios.
Understanding the internal environment
This chapter has emphasized the importance of understanding the internal resource architecture and core competencies of an organization.The outlined tools therefore allow organizations to clarify their internalcontext.Together with the external value proposition, be it a prescribedor market-based one, organizations can now use the insights gained tocreate their business model.This business model can subsequently bevisually mapped into a value creation map and described in a valuenarrative. How to do this will be the focus of the next chapter.
References and endnotes
1 Collis, D. J. and Montgomery, C. A. (1997). Corporate Strategy –
Resources and the Scope of the Firm. McGraw-Hill: Boston, p. 9.2 See for example: Senior, N.W. (1836). An Outline of the Science of
Political Economy. Longman: London; or Marshall, A. (1890).Principles of Economics. Macmillan: London. Volume I (1982):Knowledge and Knowledge Production, Volume II (1982): TheBranches of Learning, Volume III (1984): The Economics ofInformation and Human Capital (Posthumous).
3 See for example:Wernerfelt, B. (1984).A Resource-Based View of theFirm. Strategic Management Journal,Vol. 5, No. 2,Apr–Jun, p. 171.
Internal strategic analysis – resource-based view 57
4 See: Barney, J. B. (1991). Firm Resources and Sustained CompetitiveAdvantage. Journal of Management, Vol. 17, No. 1, p. 99; orRumelt, R. P. (1984). Towards a Strategic Theory of the Firm. InCompetitive Strategic Management (Lamp, R. B., ed.) pp. 89–102,Prentice Hall: New Jersey; or de Haas, M. and Kleingeld, A. (1999).Multilevel Design of Performance Measurement Systems: EnhancingStrategic Dialogue Throughout the Organization. Management
Accounting Research,Vol. 10, pp. 233–61.5 Stalk, G., Evans, P. and Shulman, L. E. (1992). Competing on Capabil-
ities: The New Rules of Corporate Strategy. Harvard Business
Review,Vol. 70, pp. 57–69.6 Molnar, M. J. (2004). Executive Views on Intangible Assets: Insights
From the Accenture/Economist Intelligence Unit Survey, Accenture
Research Note ‘Intangible Assets and Future Value’,Vol. Issue one,April.
7 Lev, B. (2002). Intangibles at a Crossroads: What’s Next? Financial
Executive, Vol. 18, No. 2, pp. 35–9.8 DTI (2003). Innovation Report – Competing in the Global
Economy: the Innovation Challenge. Department of Trade andIndustry – UK Government White Paper, London; and DTI (1998).Our Competitive Future: Building the Knowledge Driven Economy.Department of Trade and Industry – UK Government White Paper,London.
9 DTI (2004). Critical Success Factors: Creating Value From Your
Intangibles. Department of Trade and Industry: London.10 Blair, M. M. and Wallman, S. M. H. (2001). Unseen Wealth. Brookings
Institution Press: Boston.11 Marr, B. (ed.) (2005). Perspectives on Intellectual Capital: Multi-
disciplinary Insights into Management, Measurement, and
Reporting. Elsevier: Boston.12 Ibid.The terminology of assets is mostly linked with the accounting
discipline and knowledge assets, and intellectual capital is oftenlinked to knowledge management work.
13 See for example: Roos, J., Roos, G., Dragonetti, N. C. and Edvinsson, L.(1997). Intellectual Capital: Navigating the New Business Land-
scape. Macmillan: London.14 For additional reading see: Boisot, M. H. (1998). Knowledge Assets:
Securing Competitive Advantage in the Information Economy.Oxford University Press: Oxford; and Itami, H. (1987). Mobilizing
Invisible Assets. Harvard University Press: Cambridge, Massachusetts.15 Heskett, J. L., Sasser, W. E. and Schlesinger, L. A. (2003). The Value
Profit Chain: Treat Employees Like Customers and Customers
Like Employees. Free Press: New York, p. 75.
58 Understanding and clarifying the strategic context
16 See for example: Latour, A. (2001). A Blaze in Albuquerque Sets offMajor Crisis for Cell Phone Giants. Wall Street Journal, 29 January.
17 Hall, R. (1992). The Strategic Analysis of Intangible Resources.Strategic Management Journal, 13 (2), 135–44.
18 Carmeli, A. and Tishler, A. (2004). The Relationships BetweenIntangible Organizational Elements and Organizational Performance.Strategic Management Journal,Vol. 25, pp.1257–78.
19 See: Ghoshal, S. and Nahapiet, J. (1998). Social Capital, IntellectualCapital, and the Organizational Advantage. Academy of Management
Review, Vol. 23, No. 2, Apr, pp. 242; or Konno, N. and Nonaka, I.(1998).The Concept of “Ba”: Building a Foundation for KnowledgeCreation. California Management Review,Vol. 40, No. 3, pp. 40–54;or Brooking, A. (1996). Intellectual Capital: Core Assets for the
Third Millennium Enterprise. Thompson Business Press: London.20 Itami, 1987, p. 23 (see note 14 above).21 Marr, B., Neely, A. and Schiuma, G. (2004). The Dynamics of Value
Creation: Mapping Your Intellectual Performance Drivers. Journal
of Intellectual Capital,Vol. 5, No. 2, pp. 312–25.22 Nelson, R. R. and Winter, S. G. (1982). An Evolutionary Theory of
Economic Change. Harvard University Press: Cambridge, MA.23 As reported by Heskett, J. L., Sasser, W. E. and Schlesinger, L. A.
(2003). The Value Profit Chain: Treat Employees Like Customers
and Customers Like Employees. Free Press: New York, p. 203.24 Grindley, P. C. and Teece, D. J. (1997). Managing Intellectual Capital:
Licensing and Cross-Licensing in Semiconductors and Electronics.California Management Review,Vol. 39, No. 2,Winter, pp. 8–41.
25 See also: Clotier, L. M. and Gold, E. R. (2005).A Legal Perspective onIntellectual Capital. In Perspectives on Intellectual Capital (B. Marr,ed.) pp. 125–36, Elsevier: Boston; and Hall, R. (1989).The Managementof Intellectual Assets: A New Corporate Perspective. Journal of
General Management,Vol. 15, No.1, p. 53.26 Hamel, G. and Prahalad, C. K. (1990).The Core Competence of the
Corporation. Harvard Business Review,Vol. 68, No. 3, May/Jun, p. 79.27 See for example: Adams, C. and Johnson, D. (1998). The Concise
Blackwell Encyclopedia of Management. Blackwell Business,p. 624–5.
28 Ibid (see note 1 above), Collis and Montgomery (1997), p. 22.29 Ibid (see notes 5 and 26 above, respectively); Stalk et al. (1992)
and Hamel and Prahalad (1990).30 Ibid (see note 5 above), Stalk et al. (1992).31 See for example: Rucci, A. J., Kirn, S. P. and Quinn, R. T. (1998). The
Employee-Customer-Profit Chain at Sears. Harvard Business Review,Vol. 76, No. 1, pp. 83–97; and Ittner, C. D. and Larcker, D. F. (1998b).
Internal strategic analysis – resource-based view 59
Are Nonfinancial Measures Leading Indicators of Financial Perform-ance? An Analysis of Customer Satisfaction. Journal of Accounting
Research,Vol. 36, pp. 1–35.32 For a debate on causal ambiguity and interrelatedness of resources
see: Lippman, S.A. and Rumelt, R. P. (1982). Uncertain Imitability: anAnalysis of Interfirm Differences in Efficiency Under Competition.Bell Journal of Economics, Vol. 13, No. 2, Autumn, p. 418; andDierickx, I. and Cool, K. (1989). Asset Stock Accumulation AndSustainability Of Competitive Advantage. Management Science,Vol.35, No. 12, Dec, p. 1504; and King, A. W. and Zeithaml, C. P. (2001).Competencies and Firm Performance: Examining the CausalAmbiguity Paradox. Strategic Management Journal, Vol. 22, No. 1,Jan, p. 75.
33 Lev, B. (2001). Intangibles: Management, Measurement, and
Reporting. The Brookings Institution:Washington DC, p. 7.34 Roos, G. and Roos, J. (1997). Measuring Your Company’s Intellectual
Performance. Long Range Planning,Vol. 30, No. 3, Jun, p. 413.35 Nobody really knows who invented SWOT analysis, though it was
certainly being used by Harvard Business School academics duringthe 1960s.
36 Accountants have struggled with trying to categorize resources,especially intangibles, for many years, and their debate has yieldedlittle insights. For an accounting view on intangibles see: Lev, B.,Canibano, L. and Marr, B. (2005). An Accounting Perspective onIntellectual Capital. In Perspectives on Intellectual Capital: Multi-
disciplinary Insights into Management, Measurement, and
Reporting (B. Marr, ed.) pp. 42–55, Elsevier: Boston.37 Due to strict confidentiality agreements the name of this business
cannot be revealed.38 Göran and Johan Roos have been instrumental in developing an
understanding and mapping approach of resource interactions. Fortheir insights on resource interactions see, for example: Roos, G.and Roos, J. (1997). Measuring Your Company’s Intellectual Per-formance. Long Range Planning, Vol. 30, No. 3, Jun, p. 413; andGupta, O. and Roos, G. (2001). Mergers and Acquisitions Throughan Intellectual Capital Perspective. Journal of Intellectual Capital,Vol. 2, No. 3, pp. 297–309; and Pike, S. Roos, G. and Marr, B. (2005).Strategic management of intangible assets and value drivers inR&D organizations. R&D Management,Vol. 35, No. 2. pp. 111–24.
39 While Göran Roos et al., for example, use the Navigator Model toemphasize the influence and transformation from one resource tothe next, here we assess the interdependence for creating a corecompetence. See, for example, Marr, B. and Roos, G. (2005). A
60 Understanding and clarifying the strategic context
Strategy Perspective on Intellectual Capital. In Perspectives on
Intellectual Capital – Interdisciplinary Insights into Management,
Measurement and Reporting (B. Marr, ed.), Chapter 2, Elsevier:Boston; and Carlucci, D., Marr, B., Schiuma, G. (2004).The KnowledgeValue Chain – How Knowledge Management impacts BusinessPerformance. International Journal of Technology Management,Vol. 27, No 6/7, pp. 575–90; and Neely,A., Marr, B., Roos, G., Pike, S.and Gupta, O. (2003). Towards Third Generation PerformanceMeasurement. Controlling, Vol. 15, No. 3/4, pp. 129–35.
40 See for example: Fink, A., Marr, B., Siebe, A., Kuhle, J.-P. (2005). TheFuture Scorecard: Combining internal and external scenarios to cre-ate strategic foresight. Management Decision, Vol. 43, No. 2. pp.360–81.
41 See for example: Helfat, C. E. (2000). Guest Editor’s Introduction tothe Special Issue: The Evolution of Firm Capabilities. Strategic
Management Journal, Vol. 21, No. 10/11, Oct/Nov, p. 955; andPandza, K., Polajnar, A., Buchmeister, B. and Thorpe, R. (2003).Evolutionary Perspectives on the Capability Accumulation Process.International Journal of Operations & Production Management,Vol. 23, No. 7/8, p. 822; and Post, H. A. (1997). Building a Strategyon Competences. Long Range Planning,Vol. 30, No. 5, pp. 733–40.
Internal strategic analysis – resource-based view 61
4
Mapping and narrating
value creation
The previous chapters have given you an understanding of your com-petitive external environment as well as of your internal strengths andcompetencies. Bringing these together allows you now to create a pic-ture of your strategy and articulate it. This chapter will outline howthe strategy can be visualized in a value creation map and describedin a value creation narrative. Together, they allow organizations tomake their strategic plans explicit and communicate them to every-one within the organization in order for the strategy to be executed,challenged and refined. Questions addressed in this chapter include:
� Why do we need maps and narratives?� What are value creation maps and value creation narratives?� How do we create value creation maps and value creation narratives?� How do we cascade value creation maps in our organization?� How have organizations applied these tools in practice?
Without an explicit understanding of strategy, Strategic PerformanceManagement will never be possible. Today, one of the biggest barriersto successful Performance Management is that strategy is often com-municated in cryptic or incomplete ways, with the hope that emp-loyees will understand how it all fits together. In most cases they don’t!Organizational strategy has its roots in military strategy, and strategyexecution in organizations is often compared with an army fighting abattle. Two and a half thousand years ago, Sun Tzu, a wise Chinesegeneral, wrote that an army that both knows its enemy and knowsitself can fight a hundred battles without disaster. He continues that
once an army understands its enemy and knows its own strengths andweaknesses, it can lay out its plan.1 This is exactly what we are tryingto do here.
Chapters 1 to 3 have given readers the insights of understandingthe external competitive environment and the internal strengths andweaknesses of an organization. Now we need to bring them togetherin order to lay out a strategic plan and communicate it to everyone.Back to the army analogy, we would expect a general taking histroops into battle to provide detailed maps of the terrain, telling fieldofficers and troops exactly what the strategic objective is, and how heenvisaged that it can be achieved.2 Without a detailed plan, it wouldbe difficult, if not impossible, to clearly communicate a campaign.Thelikely consequence would be that the field officers and troops won’treally understand the strategic plan. However, in most organizations,leaders commonly communicate their strategy in cryptic and partialforms. Organizations regularly provide employees with lists of seem-ingly unrelated goals and targets, or budget forecasts in spreadsheets,without revealing how they fit together, thus providing very limiteddescriptions of the strategic objectives and how they could beachieved.
Why maps and narratives?
The primary function of value creation maps and value creation narra-tives is to communicate information so that it can become meaningful.Our human brain is there to interpret incoming information to createmeaning. The work of Nobel Prize winners Roger Sperry and RobertOrnstein discovered that the brain is divided into two halves, or hemi-spheres, and that different kinds of mental functioning take place ineach.3 Thus, the left hemisphere operates sequentially and dealslargely with ‘academic’ activities, such as reading, arithmetic and logic.By contrast, the right hemisphere operates holistically and deals morewith synthesizing and ‘artistic’ activities, such as art, music, colour andcreativity (see Figure 4.1). It is therefore easier for our brain to makemeaning of complex information when it is presented in visual for-mats.Visual maps are processed in our right hemisphere which is bet-ter equipped to deal with complex and holistic information. This iswhy a picture can be worth a thousand words.
Left-brain-focused people, who are strongly text oriented, could loseout on important insights to be gained from images depicted in pic-tures and diagrams. The reverse may not hold true with the right-brain-focused people not necessarily being deprived of more linear
Mapping and narrating value creation 63
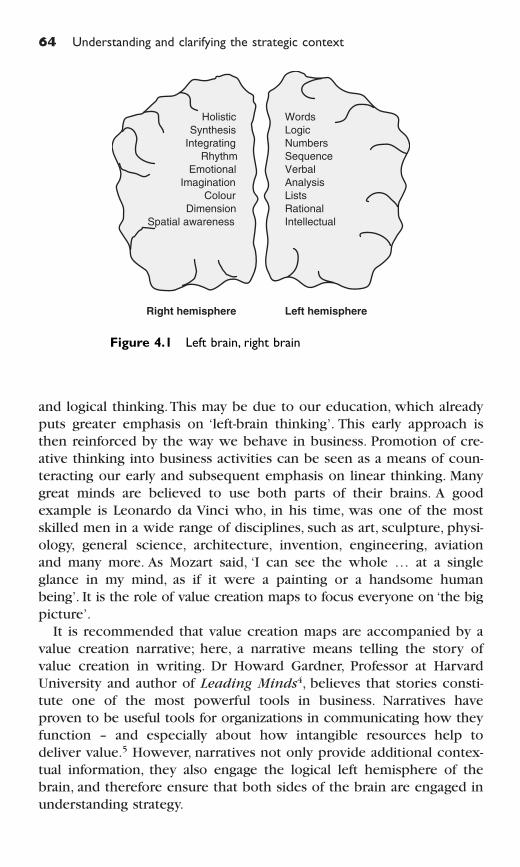
64 Understanding and clarifying the strategic context
and logical thinking.This may be due to our education, which alreadyputs greater emphasis on ‘left-brain thinking’. This early approach isthen reinforced by the way we behave in business. Promotion of cre-ative thinking into business activities can be seen as a means of coun-teracting our early and subsequent emphasis on linear thinking. Manygreat minds are believed to use both parts of their brains. A goodexample is Leonardo da Vinci who, in his time, was one of the mostskilled men in a wide range of disciplines, such as art, sculpture, physi-ology, general science, architecture, invention, engineering, aviationand many more. As Mozart said, ‘I can see the whole … at a singleglance in my mind, as if it were a painting or a handsome humanbeing’. It is the role of value creation maps to focus everyone on ‘the bigpicture’.
It is recommended that value creation maps are accompanied by avalue creation narrative; here, a narrative means telling the story ofvalue creation in writing. Dr Howard Gardner, Professor at HarvardUniversity and author of Leading Minds4, believes that stories consti-tute one of the most powerful tools in business. Narratives haveproven to be useful tools for organizations in communicating how theyfunction – and especially about how intangible resources help todeliver value.5 However, narratives not only provide additional contex-tual information, they also engage the logical left hemisphere of thebrain, and therefore ensure that both sides of the brain are engaged inunderstanding strategy.
Holistic
Synthesis
Integrating
Rhythm
Emotional
Imagination
Colour
Dimension
Spatial awareness
Words
Logic
Numbers
Sequence
Verbal
Analysis
Lists
Rational
Intellectual
Right hemisphere Left hemisphere
Figure 4.1 Left brain, right brain
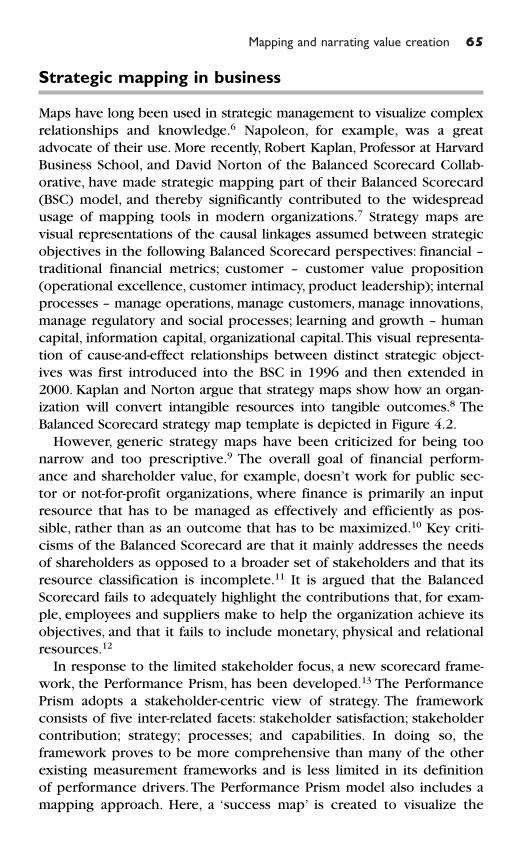
Mapping and narrating value creation 65
Strategic mapping in business
Maps have long been used in strategic management to visualize complexrelationships and knowledge.6 Napoleon, for example, was a greatadvocate of their use. More recently, Robert Kaplan, Professor at HarvardBusiness School, and David Norton of the Balanced Scorecard Collab-orative, have made strategic mapping part of their Balanced Scorecard(BSC) model, and thereby significantly contributed to the widespreadusage of mapping tools in modern organizations.7 Strategy maps arevisual representations of the causal linkages assumed between strategicobjectives in the following Balanced Scorecard perspectives: financial –traditional financial metrics; customer – customer value proposition(operational excellence, customer intimacy, product leadership); internalprocesses – manage operations, manage customers, manage innovations,manage regulatory and social processes; learning and growth – humancapital, information capital, organizational capital.This visual representa-tion of cause-and-effect relationships between distinct strategic object-ives was first introduced into the BSC in 1996 and then extended in2000. Kaplan and Norton argue that strategy maps show how an organ-ization will convert intangible resources into tangible outcomes.8 TheBalanced Scorecard strategy map template is depicted in Figure 4.2.
However, generic strategy maps have been criticized for being toonarrow and too prescriptive.9 The overall goal of financial perform-ance and shareholder value, for example, doesn’t work for public sec-tor or not-for-profit organizations, where finance is primarily an inputresource that has to be managed as effectively and efficiently as pos-sible, rather than as an outcome that has to be maximized.10 Key criti-cisms of the Balanced Scorecard are that it mainly addresses the needsof shareholders as opposed to a broader set of stakeholders and that itsresource classification is incomplete.11 It is argued that the BalancedScorecard fails to adequately highlight the contributions that, for exam-ple, employees and suppliers make to help the organization achieve itsobjectives, and that it fails to include monetary, physical and relationalresources.12
In response to the limited stakeholder focus, a new scorecard frame-work, the Performance Prism, has been developed.13 The PerformancePrism adopts a stakeholder-centric view of strategy. The frameworkconsists of five inter-related facets: stakeholder satisfaction; stakeholdercontribution; strategy; processes; and capabilities. In doing so, theframework proves to be more comprehensive than many of the otherexisting measurement frameworks and is less limited in its definitionof performance drivers. The Performance Prism model also includes amapping approach. Here, a ‘success map’ is created to visualize the
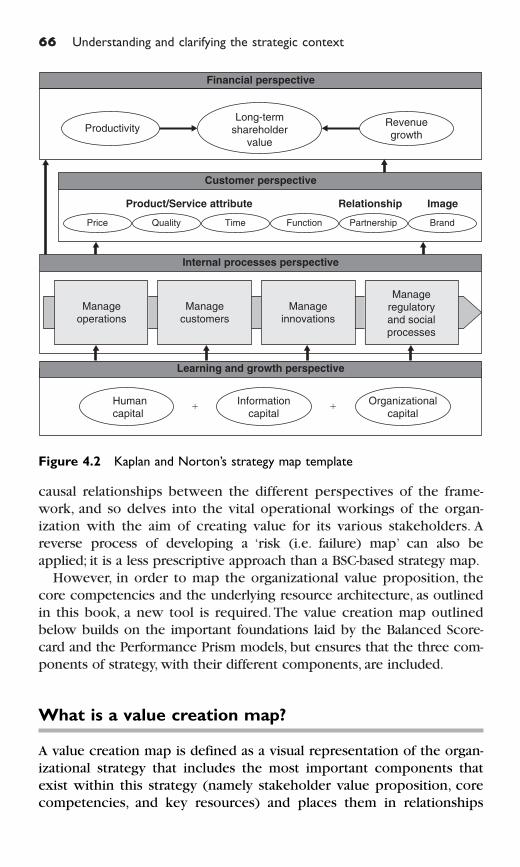
66 Understanding and clarifying the strategic context
causal relationships between the different perspectives of the frame-work, and so delves into the vital operational workings of the organ-ization with the aim of creating value for its various stakeholders. Areverse process of developing a ‘risk (i.e. failure) map’ can also beapplied; it is a less prescriptive approach than a BSC-based strategy map.
However, in order to map the organizational value proposition, thecore competencies and the underlying resource architecture, as outlinedin this book, a new tool is required. The value creation map outlinedbelow builds on the important foundations laid by the Balanced Score-card and the Performance Prism models, but ensures that the three com-ponents of strategy, with their different components, are included.
What is a value creation map?
A value creation map is defined as a visual representation of the organ-izational strategy that includes the most important components thatexist within this strategy (namely stakeholder value proposition, corecompetencies, and key resources) and places them in relationships
Long-termshareholder
value
Productivity
Humancapital
� �Information
capitalOrganizational
capital
Manageoperations
Price
Managecustomers
Manageinnovations
Manageregulatoryand socialprocesses
Quality Time Function Partnership Brand
Product/Service attribute Relationship Image
Learning and growth perspective
Customer perspective
Internal processes perspective
Financial perspective
Revenuegrowth
Figure 4.2 Kaplan and Norton’s strategy map template
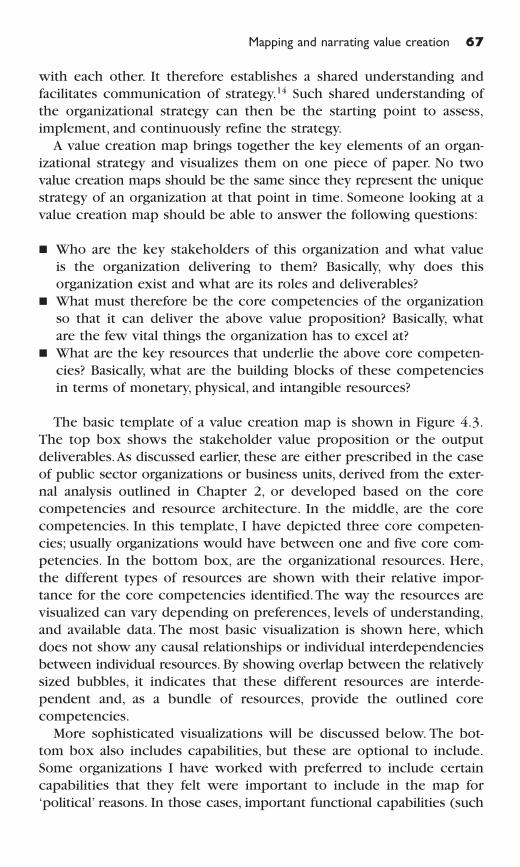
with each other. It therefore establishes a shared understanding andfacilitates communication of strategy.14 Such shared understanding ofthe organizational strategy can then be the starting point to assess,implement, and continuously refine the strategy.
A value creation map brings together the key elements of an organ-izational strategy and visualizes them on one piece of paper. No twovalue creation maps should be the same since they represent the uniquestrategy of an organization at that point in time. Someone looking at avalue creation map should be able to answer the following questions:
� Who are the key stakeholders of this organization and what valueis the organization delivering to them? Basically, why does thisorganization exist and what are its roles and deliverables?
� What must therefore be the core competencies of the organizationso that it can deliver the above value proposition? Basically, whatare the few vital things the organization has to excel at?
� What are the key resources that underlie the above core competen-cies? Basically, what are the building blocks of these competenciesin terms of monetary, physical, and intangible resources?
The basic template of a value creation map is shown in Figure 4.3.The top box shows the stakeholder value proposition or the outputdeliverables.As discussed earlier, these are either prescribed in the caseof public sector organizations or business units, derived from the exter-nal analysis outlined in Chapter 2, or developed based on the corecompetencies and resource architecture. In the middle, are the corecompetencies. In this template, I have depicted three core competen-cies; usually organizations would have between one and five core com-petencies. In the bottom box, are the organizational resources. Here,the different types of resources are shown with their relative impor-tance for the core competencies identified.The way the resources arevisualized can vary depending on preferences, levels of understanding,and available data. The most basic visualization is shown here, whichdoes not show any causal relationships or individual interdependenciesbetween individual resources. By showing overlap between the relativelysized bubbles, it indicates that these different resources are interde-pendent and, as a bundle of resources, provide the outlined core competencies.
More sophisticated visualizations will be discussed below. The bot-tom box also includes capabilities, but these are optional to include.Some organizations I have worked with preferred to include certaincapabilities that they felt were important to include in the map for‘political’ reasons. In those cases, important functional capabilities (such
Mapping and narrating value creation 67
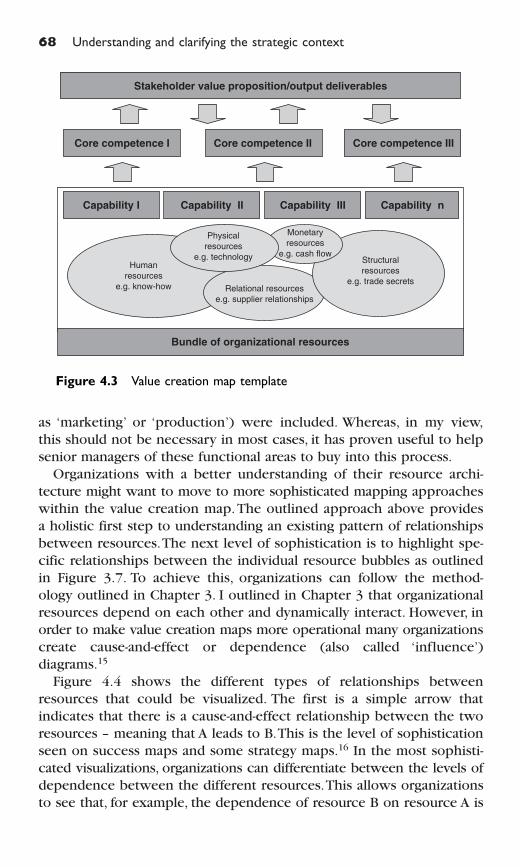
68 Understanding and clarifying the strategic context
as ‘marketing’ or ‘production’) were included. Whereas, in my view,this should not be necessary in most cases, it has proven useful to helpsenior managers of these functional areas to buy into this process.
Organizations with a better understanding of their resource archi-tecture might want to move to more sophisticated mapping approacheswithin the value creation map.The outlined approach above providesa holistic first step to understanding an existing pattern of relationshipsbetween resources.The next level of sophistication is to highlight spe-cific relationships between the individual resource bubbles as outlinedin Figure 3.7. To achieve this, organizations can follow the method-ology outlined in Chapter 3. I outlined in Chapter 3 that organizationalresources depend on each other and dynamically interact. However, inorder to make value creation maps more operational many organizationscreate cause-and-effect or dependence (also called ‘influence’) diagrams.15
Figure 4.4 shows the different types of relationships betweenresources that could be visualized. The first is a simple arrow thatindicates that there is a cause-and-effect relationship between the tworesources – meaning that A leads to B.This is the level of sophisticationseen on success maps and some strategy maps.16 In the most sophisti-cated visualizations, organizations can differentiate between the levels ofdependence between the different resources.This allows organizationsto see that, for example, the dependence of resource B on resource A is
Stakeholder value proposition/output deliverables
Core competence I Core competence II Core competence III
Human
resources
e.g. know-how Relational resources
e.g. supplier relationships
Structural
resources
e.g. trade secrets
Monetary
resources
e.g. cash flow
Physical
resources
e.g. technology
Capability I Capability II Capability III Capability n
Bundle of organizational resources
Figure 4.3 Value creation map template
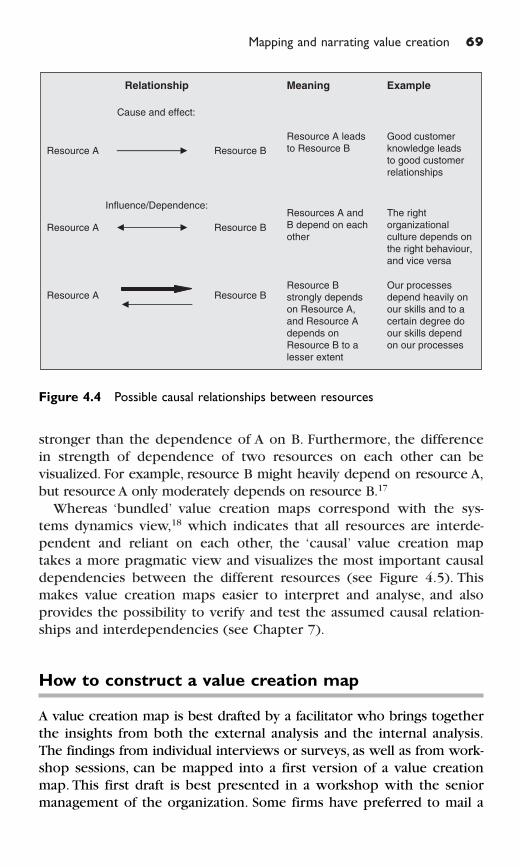
Mapping and narrating value creation 69
stronger than the dependence of A on B. Furthermore, the differencein strength of dependence of two resources on each other can bevisualized. For example, resource B might heavily depend on resource A,but resource A only moderately depends on resource B.17
Whereas ‘bundled’ value creation maps correspond with the sys-tems dynamics view,18 which indicates that all resources are interde-pendent and reliant on each other, the ‘causal’ value creation maptakes a more pragmatic view and visualizes the most important causaldependencies between the different resources (see Figure 4.5). Thismakes value creation maps easier to interpret and analyse, and alsoprovides the possibility to verify and test the assumed causal relation-ships and interdependencies (see Chapter 7).
How to construct a value creation map
A value creation map is best drafted by a facilitator who brings togetherthe insights from both the external analysis and the internal analysis.The findings from individual interviews or surveys, as well as from work-shop sessions, can be mapped into a first version of a value creationmap. This first draft is best presented in a workshop with the seniormanagement of the organization. Some firms have preferred to mail a
Resource A Resource B
Cause and effect:
Resource A leads
to Resource B
Good customer
knowledge leads
to good customer
relationships
Relationship ExampleMeaning
Influence/Dependence:
Resource BResource A
Resources A and
B depend on each
other
The right
organizational
culture depends on
the right behaviour,
and vice versa
Resource BResource AResource B
strongly depends
on Resource A,
and Resource A
depends on
Resource B to a
lesser extent
Our processes
depend heavily on
our skills and to a
certain degree do
our skills depend
on our processes
Figure 4.4 Possible causal relationships between resources
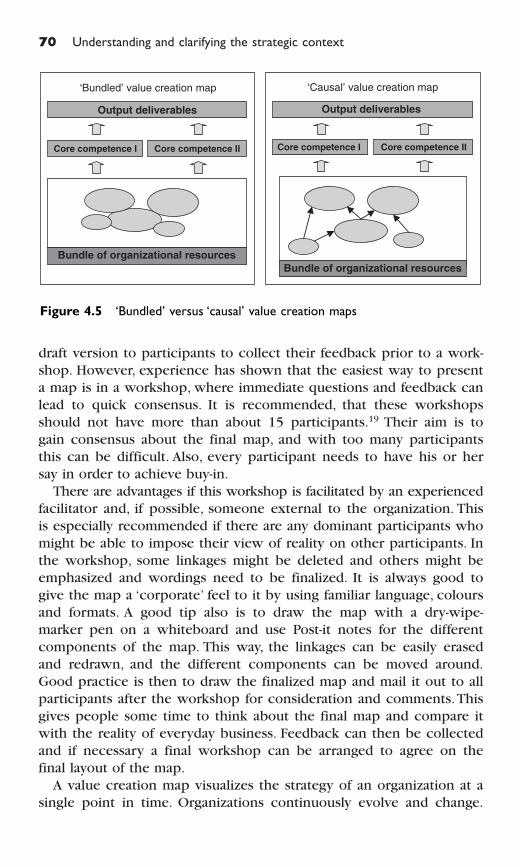
70 Understanding and clarifying the strategic context
draft version to participants to collect their feedback prior to a work-shop. However, experience has shown that the easiest way to presenta map is in a workshop, where immediate questions and feedback canlead to quick consensus. It is recommended, that these workshopsshould not have more than about 15 participants.19 Their aim is togain consensus about the final map, and with too many participantsthis can be difficult. Also, every participant needs to have his or hersay in order to achieve buy-in.
There are advantages if this workshop is facilitated by an experiencedfacilitator and, if possible, someone external to the organization. Thisis especially recommended if there are any dominant participants whomight be able to impose their view of reality on other participants. Inthe workshop, some linkages might be deleted and others might beemphasized and wordings need to be finalized. It is always good togive the map a ‘corporate’ feel to it by using familiar language, coloursand formats. A good tip also is to draw the map with a dry-wipe-marker pen on a whiteboard and use Post-it notes for the differentcomponents of the map. This way, the linkages can be easily erasedand redrawn, and the different components can be moved around.Good practice is then to draw the finalized map and mail it out to allparticipants after the workshop for consideration and comments.Thisgives people some time to think about the final map and compare itwith the reality of everyday business. Feedback can then be collectedand if necessary a final workshop can be arranged to agree on thefinal layout of the map.
A value creation map visualizes the strategy of an organization at asingle point in time. Organizations continuously evolve and change.
Output deliverables
Core competence IICore competence I
‘Bundled’ value creation map
Bundle of organizational resources
Output deliverables
Core competence IICore competence I
‘Causal’ value creation map
Bundle of organizational resources
Figure 4.5 ‘Bundled’ versus ‘causal’ value creation maps
The external and internal environments evolve and so the strategy needsto evolve too. This means that the value creation map needs to berevised on a regular basis in order to ensure that it reflects a currentview of the strategy. How often these revisions take place depends onthe speed of change in the industry the organization is part of. It isusually a good idea to align the revisions of the value creation mapwith the strategic planning cycles and, for many organizations, an annualrevision is adequate. However, in some emerging or fast-moving indus-tries this revision cycle can be accelerated.
What is a value creation narrative?
A value creation narrative is defined as a concise piece of written workthat describes the organizational strategy and tells the story of how thatorganization intends to create value by specifying its value proposition,required core competencies and key resources.A value creation narra-tive is there to accompany a value creation map and provide add-itional contextual information and allow organizations to explain thechain of events in a story format.20 Stories are the way we, as humanbeings, have communicated over thousands of years and our brain ispredisposed to absorb information in narrative form.
The format of a value creation narrative is not prescriptive. It verymuch depends on organizational preferences and should be alignedwith the corporate look and feel. However, a value creation narrativeshould not be longer than about 500 words.The story should be clearand readable, and written in a conversational style.21 It is recom-mended that jargon or technical terms which readers of the narrativemight not be familiar with are avoided as this may interfere with theirunderstanding. At the same time, it is important to use language andterms that are usually used and understood within the organization.Clarifying the strategy in a concise narrative is a powerful way of clari-fying the organizational strategy.
How to construct a value creation narrative
A value creation narrative provides contextual information of the strat-egy that is visualized in a value creation map.The value creation mapis therefore the starting point for writing a value creation narrative.Based on the map, an individual or a small group of people can producea draft version of the narrative.This draft is then circulated to a widergroup of people, usually the senior management team, who then review
Mapping and narrating value creation 71
the document and submit comments and suggested edits.These are thencollected by the individual or group that produced the draft to createthe final version of the narrative. Alternatively, and possibly for bestresults, the draft version of the value narrative is circulated and subse-quently a group session is arranged with the senior management teamto edit the report in an interactive workshop. This process can pro-duce over-long narratives – please remember that it must be concise.
Cascading value creation maps
A frequently raised question is when and how to cascade a value cre-ation map.A value creation map is supposed to be a management toolthat clarifies the strategy and therefore creates a shared identity andengages people in assessing and evolving this strategy. If this strategyis too distant and hence too abstract to people, it fails in its role.Employees need to be able to relate to the elements on the value cre-ation map – it must reflect their reality in order for them to identifywith it. It therefore becomes clear that a corporate value creation mapof, for example, a large and diverse international corporation will notbe meaningful for someone working as a middle manager in one ofthe many businesses or business units. It becomes too generic, tooabstract; and similar in many ways to corporate mission statementsthat are often no more than a set of well-meaning words that have lit-tle operative value for people working further removed from corpor-ate centres. For that reason, value creation maps have to be cascadedand translated to a meaningful local perspective.
How many value creation maps an organization needs depends on itssize and diversity. Let’s take, for example, a company like Royal DutchShell plc. Shell is a group of diverse companies that includes ‘Explorationand Production’ – responsible for finding and producing oil and gas;‘Renewables’ – building commercial scale wind parks and selling solarphotovoltaic panels; ‘Shell Trading’ – trading of crude oil, refined prod-ucts, gas, electrical power; and ‘Shell Global Solutions’ – providing busi-ness and operational consultancy, technical services and R&D expertiseto the energy industry worldwide, among other corporate entities.22
It is clear that all of these businesses have different stakeholdervalue propositions, unique core competencies, and very dissimilarresource architectures. As a consequence, each of the different busi-nesses would require their own value creation map and there would belittle similarity between them (but, I would argue, there should be elem-ents of connectivity between them). For more homogeneous organiza-tions, a similar value creation map can be used. Take, for example,
72 Understanding and clarifying the strategic context
Mapping and narrating value creation 73
companies such as Burger King or Hilton Hotels. Their individualrestaurants or hotels might have much the same generic value propos-itions, as well as an almost identical set of core competencies andresources but, potentially, substantially different product or service ingre-dients and pricing arrangements that reflect different customer expect-ations in different parts of the world.
Each business usually has a diverse set of functional business units,such as operations, HR, marketing, finance, logistics, IT, etc.These func-tional business units all contribute to delivering the overall value prop-osition of the business as a whole, but each of them has a valueproposition of its own. Various books and articles have been writtenabout how to strategically align functions, such as HR or IT, with theoverall strategy of the business.23 It is important that all functionalbusiness units understand how they contribute to the overall valueproposition.
The business level value creation map is often too abstract and gen-eral. Business units therefore need to cascade the value creation mapof the business as a whole into a map that reflects their reality, butwhich is aligned with the strategy of the business. Any cascade needsto be based on the value creation map of the business as a whole.Business units need to understand where and how they are contributingto the delivery of the overall strategy. In the case of an IT function, forinstance, its key contribution might be to one of the resource ‘bubbles’on the value creation map, e.g. an innovative technology base, whereasthe HR function, for example, might be contributing to various ‘bubbles’(see Figure 4.6). It is important that the link to the business strategy iskept explicit and I suggest that the different maps with their specificlinkages are visualized.Also, the value creation narrative plays an import-ant role in this as it has the ability to provide the contextual informa-tion of how the strategies integrate.
In terms of number of employees, it is more difficult to provide adefinite answer on when to cascade a value creation map. Cascadingbased on number of employees is more of an operational considerationthan a conceptual issue.The map might look the same or very similarfor a large number of people in the organization, but some of theunderlying indicators and objectives might vary significantly betweendifferent groups or departments. Let’s take Hilton Hotels again as anexample.The structure of the value creation map might look the samefor each hotel; however, there are clearly differences in the issues andunderlying measures. Another example is provided by local govern-ments. A central agency might provide a value creation map templateto be used in each local government office; however, the issues theyare facing will vary and cannot be generalized.
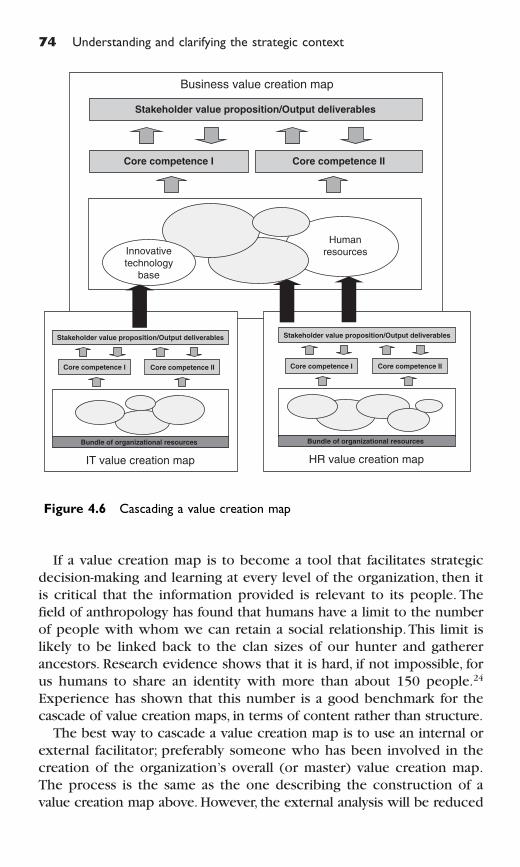
74 Understanding and clarifying the strategic context
If a value creation map is to become a tool that facilitates strategicdecision-making and learning at every level of the organization, then itis critical that the information provided is relevant to its people. Thefield of anthropology has found that humans have a limit to the numberof people with whom we can retain a social relationship.This limit islikely to be linked back to the clan sizes of our hunter and gathererancestors. Research evidence shows that it is hard, if not impossible, forus humans to share an identity with more than about 150 people.24
Experience has shown that this number is a good benchmark for thecascade of value creation maps, in terms of content rather than structure.
The best way to cascade a value creation map is to use an internal orexternal facilitator; preferably someone who has been involved in thecreation of the organization’s overall (or master) value creation map.The process is the same as the one describing the construction of avalue creation map above. However, the external analysis will be reduced
Human
resources
Stakeholder value proposition/Output deliverables
Core competence I Core competence II
Core competence I Core competence ICore competence II Core competence II
Bundle of organizational resources
IT value creation map
Bundle of organizational resources
HR value creation map
Business value creation map
Stakeholder value proposition/Output deliverables Stakeholder value proposition/Output deliverables
Innovative
technology
base
Figure 4.6 Cascading a value creation map
Mapping and narrating value creation 75
to a minimum as it only consists of identifying the key stakeholdersand their needs.This can often be derived from the existing organiza-tional value creation map. If this is not the case, then some of theexternal analysis tools can be used to determine how the business orbusiness unit helps to deliver the overall value proposition. Once thevalue proposition is clarified, the internal analysis will provide thedata to create a cascade of the value creation map.
Value creation maps and narratives in practice
The approaches outlined above have been implemented by manyorganizations around the globe. They have proven successful for avery diverse group of organizations from leading international blue-chip corporations to very small and medium-sized companies, as wellas many public sector and not-for-profit organizations, including cen-tral and local government institutions, schools and charities. It isimportant to highlight, however, that every organization takes its ownjourney, with its own interpretations of the tools and techniques.Below I have outlined some illustrative case studies that demonstratehow leading organizations have translated these concepts into realityand applied the tools in practice.They serve the purpose of being real-life examples that I hope might provide some guidance, but they willnever provide templates you can simply copy to reduce the effortsthat you have to go into creating your own value creation maps andnarratives. Every context and every strategy is different, and value cre-ation maps are unique descriptions of your organization at one pointin time.
Case study: DHL25
DHL is the global market leader in international express, air and
ocean freight, overland transport and logistics. With annual rev-
enues of nearly €24.5 billion in 2004, DHL offers innovative and
customized solutions from a single source. DHL has more than
170 000 full-time employees in about 4400 offices and 450 hubs,
warehouses and terminals around the globe. DHL ships more than
1 billion shipments each year for its 4.2 million customers. It has
global expertise in express, air and ocean freight, overland trans-
port and logistics solutions; DHL combines worldwide coverage
with an in-depth understanding of local markets.
76 Understanding and clarifying the strategic context
The development of the value creation map formed part of a
wider initiative to establish a more sophisticated Performance
Management system by understanding its value proposition and the
required performance drivers. The example in this case study was
developed for DHL Greece. In the Greek market, DHL is the dom-
inant player and clear market leader. However, with other competi-
tors entering this market, DHL’s goal is to maintain its high market
share through delivering superior customer service.
In order to establish the value proposition, the required core
competencies, and key resources, two surveys and a set of in-depth
interviews and workshop sessions were conducted. An internal sur-
vey of all DHL employees in Greece explored their views on the
key output deliverables, competencies, and key resources. At the
same time a survey of 300 key customers was conducted to ascer-
tain their perceptions of the value DHL is delivering to them. The
insights from these two surveys were then explored further in a
set of interviews with the senior management team as well as a
selection of middle managers and front-line employees. This gave
DHL a comprehensive understanding of its value proposition and
the value drivers that enable DHL to deliver its value proposition.
DHL identified high quality shipments together with superior
customer service as the key output deliverable in order to deliver
sustainable financial performance and shareholder value. In order to
deliver these, DHL needs core competencies in the harmonization
of their processes and networks, as well as an ongoing competence
in understanding changing customer needs. For this, relationship
resources and structural resources were most critical, followed
by human and physical resources. Figure 4.7 shows the bundled
value creation map with the key components of DHL’s strategy,
namely its value proposition, core competencies, and resource
architecture.
Once the bundled map had been created, a set of in-depths inter-
views and workshop sessions were used to identify the key interde-
pendencies between the different resources. Figure 4.8 shows the
map with its interdependencies. The map shows how the key
resources interact to demonstrate the most important interdepen-
dencies. At the bottom of the map are the DHL values and the
leadership style as well as the strong brand reputation that DHL
has in this market. DHL is seen as a clear market leader with the
strongest brand and a multinational reputation, which in turn allows
DHL to recruit the best people and build stronger customer trust.
The leadership style and values are what shapes the organizational
culture in DHL, which is open and entrepreneurial. Values include
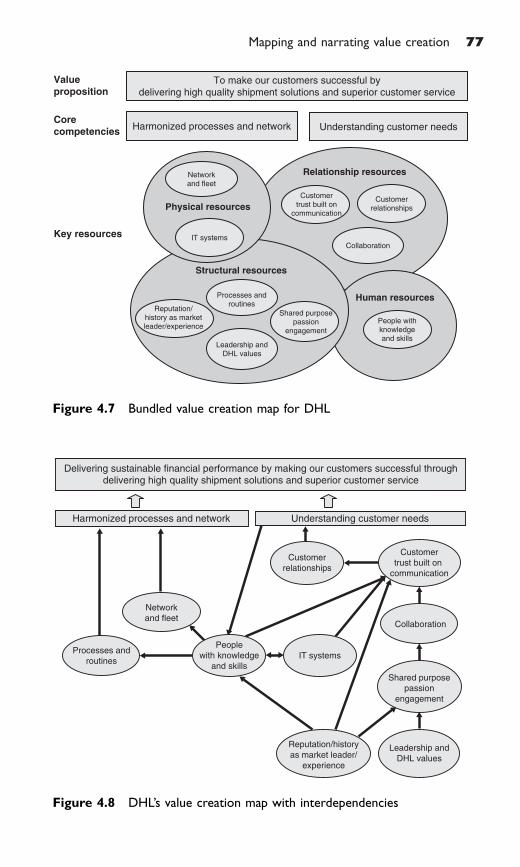
Mapping and narrating value creation 77
Collaboration
Structural resources
To make our customers successful by
delivering high quality shipment solutions and superior customer service
Harmonized processes and networkCore
competencies
Value
proposition
Understanding customer needs
Networkand fleet
Physical resources
IT systems
Customertrust built on
communication
Customerrelationships
Processes androutines
Reputation/history as marketleader/experience
Leadership andDHL values
Shared purposepassion
engagement
People withknowledgeand skills
Human resources
Key resources
Relationship resources
Figure 4.7 Bundled value creation map for DHL
Understanding customer needsHarmonized processes and network
Delivering sustainable financial performance by making our customers successful throughdelivering high quality shipment solutions and superior customer service
Customer
trust built on
communication
Collaboration
Shared purpose
passion
engagement
Leadership and
DHL values
Processes and
routines
Network
and fleet
People
with knowledge
and skills
Reputation/history
as market leader/
experience
IT systems
Customer
relationships
Figure 4.8 DHL’s value creation map with interdependencies
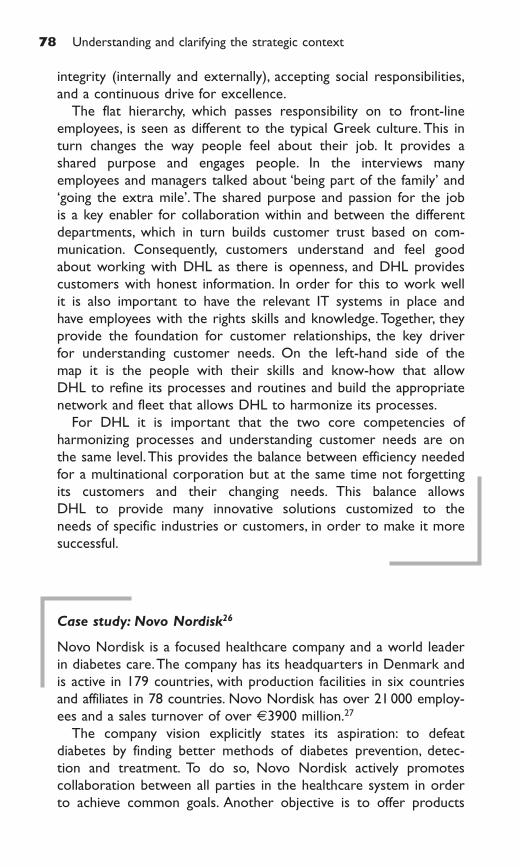
78 Understanding and clarifying the strategic context
Case study: Novo Nordisk26
Novo Nordisk is a focused healthcare company and a world leader
in diabetes care.The company has its headquarters in Denmark and
is active in 179 countries, with production facilities in six countries
and affiliates in 78 countries. Novo Nordisk has over 21 000 employ-
ees and a sales turnover of over €3900 million.27
The company vision explicitly states its aspiration: to defeat
diabetes by finding better methods of diabetes prevention, detec-
tion and treatment. To do so, Novo Nordisk actively promotes
collaboration between all parties in the healthcare system in order
to achieve common goals. Another objective is to offer products
integrity (internally and externally), accepting social responsibilities,
and a continuous drive for excellence.
The flat hierarchy, which passes responsibility on to front-line
employees, is seen as different to the typical Greek culture. This in
turn changes the way people feel about their job. It provides a
shared purpose and engages people. In the interviews many
employees and managers talked about ‘being part of the family’ and
‘going the extra mile’. The shared purpose and passion for the job
is a key enabler for collaboration within and between the different
departments, which in turn builds customer trust based on com-
munication. Consequently, customers understand and feel good
about working with DHL as there is openness, and DHL provides
customers with honest information. In order for this to work well
it is also important to have the relevant IT systems in place and
have employees with the rights skills and knowledge. Together, they
provide the foundation for customer relationships, the key driver
for understanding customer needs. On the left-hand side of the
map it is the people with their skills and know-how that allow
DHL to refine its processes and routines and build the appropriate
network and fleet that allows DHL to harmonize its processes.
For DHL it is important that the two core competencies of
harmonizing processes and understanding customer needs are on
the same level.This provides the balance between efficiency needed
for a multinational corporation but at the same time not forgetting
its customers and their changing needs. This balance allows
DHL to provide many innovative solutions customized to the
needs of specific industries or customers, in order to make it more
successful.
Mapping and narrating value creation 79
and services in other areas where the company can make a
difference. Here, the company is focused on biopharmaceuticals –
haemostasis management, growth disorders and hormone replace-
ment therapy – areas in which the company has gained a leading
position.
Further, the company believes that its focus is its strength, which
will enable it to achieve competitive business results. A job in Novo
Nordisk is never just a job. The company is committed to being
there for its customers whenever they need it, and to be innova-
tive and effective in everything it does. This also implies attracting
and retaining the best people by making the company a challenging
place to work. The company values are expressed in everyone’s
actions. ‘Decency is what counts,’ it says in the company vision.
‘Every day we strive to find the right balance between compassion
and competitiveness, the short and the long term, self and commit-
ment to colleagues and society, work and family life.’
The project to develop a value creation map was part of a wider
knowledge strategy initiative in Novo Nordisk to identify and
prioritize a set of strategic value drivers that can be influenced in
order to increase future value creation.The internal analysis consisted
of 16 interviews with managers/specialists as well as internal obser-
vations and reviews of internal documents. These lasted between 1
and 2 hours. Together they delivered the contextual information
which was used to create an initial value creation map and a value
creation narrative of the business context in Novo Nordisk. In a
facilitated workshop the map was finalized and subsequently a value
creation narrative was produced to accompany the map. Both the
narrative and the map are outlined below.
Novo Nordisk’s value creation narrative
Overall, Novo Nordisk’s promise is to be ‘leading the fight against
diabetes. Defeating diabetes is our passion and our business’. To be
able to deliver on this promise it must continuously develop innova-
tive products, processes and services. The key knowledge-based
elements to achieve this are good collaboration and creativity facili-
tated by the best skilled, committed and motivated people that are
able to leverage external relationships.
People in Novo Nordisk are a cornerstone of its performance
and Novo Nordisk’s people strategy aims to improve their ability
to address business challenges across borders. A key driver of per-
formance is having the best skilled and most knowledgeable people
with the capabilities needed to perform their job. This includes
both recruiting the best people as well as developing high perform-
ers internally.
In order to collaborate and be creative, people have to be com-
mitted and motivated. A key driver for commitment and motivation
in Novo Nordisk is if people feel passionate about what they do
and are engaged and feel pride in their job. Engagement and pride
derive from sharing a meaningful purpose with the organization.
This is further supported by the fact that Novo Nordisk has a
strong brand reputation and history, which also makes people feel
good about their job.
The values and commitments of Novo Nordisk are a key founda-
tion for its performance. The key values are ‘accountable’, ‘ambi-
tious’, ‘responsible’, ‘engaged with stakeholders’, ‘open and honest’,
and ‘ready for change’. The company is committed to pursuing its
objectives in a way that considers the Triple Bottom Line – a busi-
ness principle that requires balancing social, environmental and
financial responsibility in every decision and action. This business
principle influences Novo Nordisk’s reputation, enables Novo
Nordisk to build and maintain external relationships, fosters a
shared sense of purpose and creates a culture in which employees
are valued and empowered to develop and try new things. This in
turn motivates people.
Its market position as a leading player in a niche market, as well
as its values and its open and honest communication, helps to cre-
ate the brand needed to facilitate the development of external
relationships and also helps to attract the best people.These people
are then able to flourish and deliver the innovations needed for a
sustainable future performance.
Novo Nordisk’s value creation map
Figure 4.9 visualizes the above outlined narrative in a value creation
map. The bubble at the top represents the overall objectives and
the output deliverables, namely a strong R&D pipeline as well as
innovative products, processes, and services. The key competencies
are ‘commercialization’, ‘collaboration’, and ‘creativity’. The bubbles
underneath the competencies indicate the different resources that
were identified in Novo Nordisk and how they interact to deliver
core competencies and output deliverables.
Today, the value creation map is at the heart of a new prototype
Performance Management report called ‘Foresight’ (see Figure 4.10).
The aim of this new report will be to provide senior management
80 Understanding and clarifying the strategic context
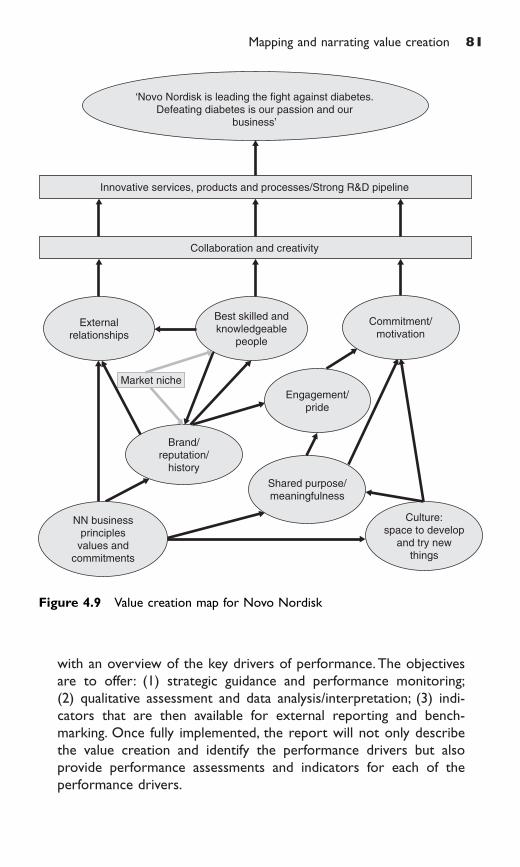
Mapping and narrating value creation 81
with an overview of the key drivers of performance.The objectives
are to offer: (1) strategic guidance and performance monitoring;
(2) qualitative assessment and data analysis/interpretation; (3) indi-
cators that are then available for external reporting and bench-
marking. Once fully implemented, the report will not only describe
the value creation and identify the performance drivers but also
provide performance assessments and indicators for each of the
performance drivers.
Shared purpose/meaningfulness
Best skilled andknowledgeable
people
Engagement/pride
Brand/reputation/
history
Culture:space to develop
and try newthings
Externalrelationships
Innovative services, products and processes/Strong R&D pipeline
‘Novo Nordisk is leading the fight against diabetes.Defeating diabetes is our passion and our
business’
Collaboration and creativity
Market niche
Commitment/motivation
NN businessprinciples
values andcommitments
Figure 4.9 Value creation map for Novo Nordisk
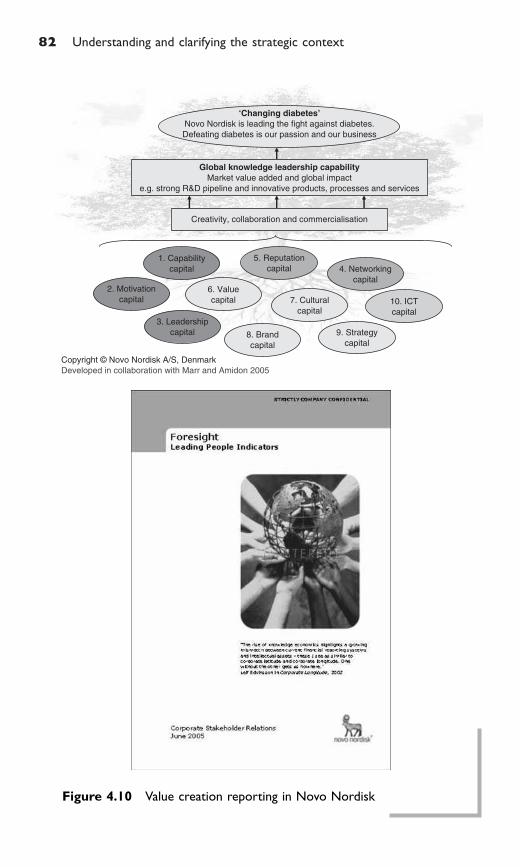
82 Understanding and clarifying the strategic context
‘Changing diabetes’
Novo Nordisk is leading the fight against diabetes.
Defeating diabetes is our passion and our business
Creativity, collaboration and commercialisation
Copyright © Novo Nordisk A/S, Denmark
Developed in collaboration with Marr and Amidon 2005
1. Capability
capital
2. Motivation
capital
3. Leadership
capital
4. Networking
capital
5. Reputation
capital
6. Value
capital
8. Brand
capital
7. Cultural
capital
9. Strategy
capital
10. ICT
capital
Global knowledge leadership capability
Market value added and global impact
e.g. strong R&D pipeline and innovative products, processes and services
Figure 4.10 Value creation reporting in Novo Nordisk
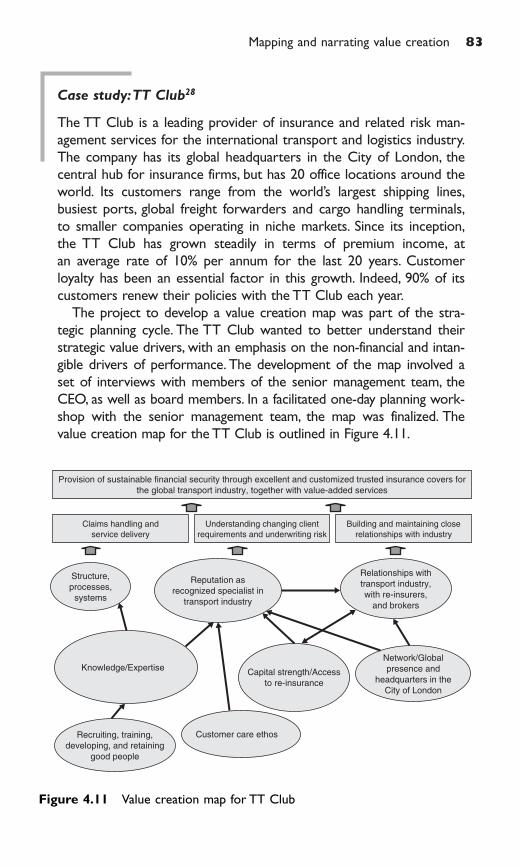
Mapping and narrating value creation 83
Case study:TT Club28
The TT Club is a leading provider of insurance and related risk man-
agement services for the international transport and logistics industry.
The company has its global headquarters in the City of London, the
central hub for insurance firms, but has 20 office locations around the
world. Its customers range from the world’s largest shipping lines,
busiest ports, global freight forwarders and cargo handling terminals,
to smaller companies operating in niche markets. Since its inception,
the TT Club has grown steadily in terms of premium income, at
an average rate of 10% per annum for the last 20 years. Customer
loyalty has been an essential factor in this growth. Indeed, 90% of its
customers renew their policies with the TT Club each year.
The project to develop a value creation map was part of the stra-
tegic planning cycle. The TT Club wanted to better understand their
strategic value drivers, with an emphasis on the non-financial and intan-
gible drivers of performance. The development of the map involved a
set of interviews with members of the senior management team, the
CEO, as well as board members. In a facilitated one-day planning work-
shop with the senior management team, the map was finalized. The
value creation map for the TT Club is outlined in Figure 4.11.
Network/Global
presence and
headquarters in the
City of London
Capital strength/Access
to re-insurance
Relationships with
transport industry,
with re-insurers,
and brokers
Provision of sustainable financial security through excellent and customized trusted insurance covers for
the global transport industry, together with value-added services
Claims handling and
service delivery
Recruiting, training,
developing, and retaining
good people
Building and maintaining close
relationships with industry
Understanding changing client
requirements and underwriting risk
Structure,
processes,
systems
Reputation as
recognized specialist in
transport industry
Knowledge/Expertise
Customer care ethos
Figure 4.11 Value creation map for TT Club
84 Understanding and clarifying the strategic context
The TT Club decided that their value proposition was to provide
sustainable financial security for the global transport industry by
offering excellent and customized insurance covers and value-added
services that people trust. They identified three key competencies:
(1) the claims handling and delivery of services such as risk assess-
ments and advice; (2) the deep understanding of the industry and
changing client demands and underwriting requirements; (3) the
ability to build and maintain close relationships with the industry,
which gives the TT Club the status of an independent body of the
industry.
These competencies are delivered through the structures,
processes and systems in place, together with the reputation and
recognition of the TT Club as a specialist and member of the
transport industry. These competencies are also delivered through
relationships not just with the transport industry, but also with re-
insurers and brokers. At the foundation of the value creation map
is the ability to recruit, train, develop, and retain good people who
help to create the knowledge and expertise needed. This know-
ledge, together with the strong customer care ethos, helps to shape
the TT Club’s reputation in the industry. Knowledge also shapes the
development of processes, structures, and systems.
At the centre of the map is capital strength and access to re-
insurance, one of the strongest resources in the TT Club.There is a
dynamic relationship between the relationships with re-insurers and
the access to re-insurance. Capital strength is also an important
driver of reputation; without appropriate capital strength the reputa-
tion would suffer very quickly.The TT Club’s global presence helps it
to create local relationships, which in turn help its reputation and
recognition in the field. The headquarters in London enable the TT
Club to develop the crucial relationships with brokers who sell
their products and with re-insurers to make re-insurance deals.
Case study: UK Home Office29
The purpose of the Home Office, a key central government institu-
tion in the United Kingdom, is to work with individuals and com-
munities to build a safe, just and tolerant society, enhancing
opportunities for all. In such a society rights and responsibilities go
hand in hand, and the protection and security of the public are
maintained and enhanced.This involves reducing crime and the fear of
crime, including combating terrorism and other threats to national
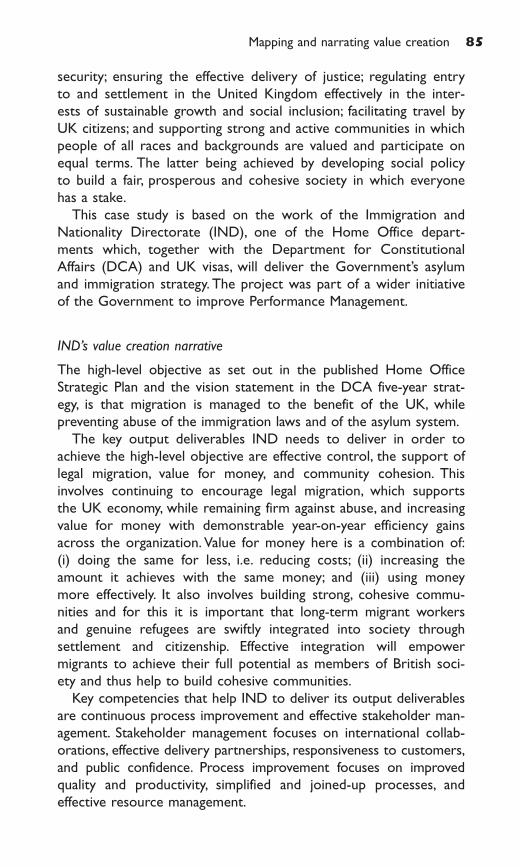
Mapping and narrating value creation 85
security; ensuring the effective delivery of justice; regulating entry
to and settlement in the United Kingdom effectively in the inter-
ests of sustainable growth and social inclusion; facilitating travel by
UK citizens; and supporting strong and active communities in which
people of all races and backgrounds are valued and participate on
equal terms. The latter being achieved by developing social policy
to build a fair, prosperous and cohesive society in which everyone
has a stake.
This case study is based on the work of the Immigration and
Nationality Directorate (IND), one of the Home Office depart-
ments which, together with the Department for Constitutional
Affairs (DCA) and UK visas, will deliver the Government’s asylum
and immigration strategy. The project was part of a wider initiative
of the Government to improve Performance Management.
IND’s value creation narrative
The high-level objective as set out in the published Home Office
Strategic Plan and the vision statement in the DCA five-year strat-
egy, is that migration is managed to the benefit of the UK, while
preventing abuse of the immigration laws and of the asylum system.
The key output deliverables IND needs to deliver in order to
achieve the high-level objective are effective control, the support of
legal migration, value for money, and community cohesion. This
involves continuing to encourage legal migration, which supports
the UK economy, while remaining firm against abuse, and increasing
value for money with demonstrable year-on-year efficiency gains
across the organization. Value for money here is a combination of:
(i) doing the same for less, i.e. reducing costs; (ii) increasing the
amount it achieves with the same money; and (iii) using money
more effectively. It also involves building strong, cohesive commu-
nities and for this it is important that long-term migrant workers
and genuine refugees are swiftly integrated into society through
settlement and citizenship. Effective integration will empower
migrants to achieve their full potential as members of British soci-
ety and thus help to build cohesive communities.
Key competencies that help IND to deliver its output deliverables
are continuous process improvement and effective stakeholder man-
agement. Stakeholder management focuses on international collab-
orations, effective delivery partnerships, responsiveness to customers,
and public confidence. Process improvement focuses on improved
quality and productivity, simplified and joined-up processes, and
effective resource management.
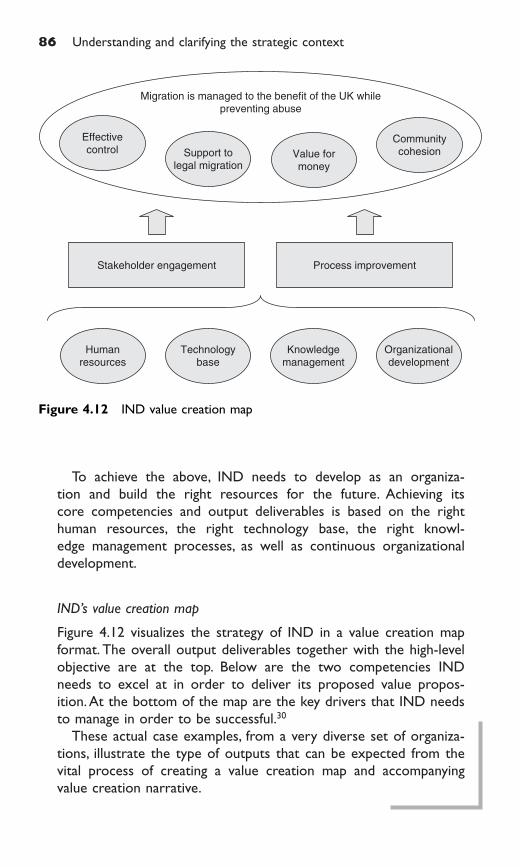
86 Understanding and clarifying the strategic context
To achieve the above, IND needs to develop as an organiza-
tion and build the right resources for the future. Achieving its
core competencies and output deliverables is based on the right
human resources, the right technology base, the right knowl-
edge management processes, as well as continuous organizational
development.
IND’s value creation map
Figure 4.12 visualizes the strategy of IND in a value creation map
format. The overall output deliverables together with the high-level
objective are at the top. Below are the two competencies IND
needs to excel at in order to deliver its proposed value propos-
ition.At the bottom of the map are the key drivers that IND needs
to manage in order to be successful.30
These actual case examples, from a very diverse set of organiza-
tions, illustrate the type of outputs that can be expected from the
vital process of creating a value creation map and accompanying
value creation narrative.
Migration is managed to the benefit of the UK whilepreventing abuse
Support tolegal migration
Effectivecontrol
CommunitycohesionValue for
money
Stakeholder engagement Process improvement
Organizationaldevelopment
Technologybase
Knowledgemanagement
Humanresources
Figure 4.12 IND value creation map
Mapping and narrating value creation 87
References and endnotes
1 Sun Tzu. (1981). The Art of War. Hodder & Stoughton: London.2 This analogy is borrowed from Kaplan, R. S. and Norton, D. P.
(2000b). Having Trouble With Your Strategy? Then Map It. Harvard
Business Review, Sept–Oct, pp. 167–76.3 Deutsch, G. and Springer, S. P. (1998). Left brain, right brain.
W. H. Freeman: New York; and Gardner, H. (1996). Leading Minds –
An Anatomy of Leadership. BasicBooks: New York.4 Gardner, H. (1996). Leading Minds – An Anatomy of Leadership.
BasicBooks: New York.5 Bukh, P. N., Larsen, H.T. and Mouritsen, J. (2001). Intellectual Capital
and the ‘Capable Firm’: Narrating, Visualising and Numbering forManaging Knowledge. Accounting, Organizations and Society,Vol. 26, No. 7–8, pp. 735–62.
6 For a good overview of how mapping is used in strategic manage-ment see: Huff, A. S. and Jenkins, M. (2002). Mapping Strategic
Knowledge. Sage: London.7 See for example: Ibid, Kaplan, R. S. and Norton, D. P. (2000b) (see
note 2 above); or Kaplan, R. S. and Norton, D. P. (2004a). Strategy
Maps – Converting Intangible Assets into Tangible Outcomes.Harvard Business School Press: Boston, MA; or Kaplan, R. S. andNorton, D. P. (2000a). The Strategy Focused Organization: How
Balanced Scorecard Companies Thrive in the New Business
Environment. Harvard Business School Press: Boston.8 Ibid, Kaplan, R. S. and Norton, D. P. (2000b) (see note 2 above);
Kaplan, R. S. and Norton, D. P. (2004b). Measuring the StrategicReadiness of Intangible Assets. Harvard Business Review, Vol. 82,No. 2, Feb, pp. 52–63.
9 Marr, B. and Adams, C. (2004). The Balanced Scorecard andIntangible Assets: Similar Ideas, Unaligned Concepts. Measuring
Business Excellence,Vol. 8, No. 3, pp. 18–27.10 Irwin, D. (2002). Strategy Mapping in the Public Sector. Long
Range Planning,Vol. 35, No. 6, pp. 637–47.11 See for example: Atkinson, A. A., Waterhouse, J. H. and Well, R. B.
(1997). A Stakeholder Approach to Strategic Performance Measure-ment. Sloan Management Review, Spring, pp. 25–37; or Maltz,A. C.,Reilly, R. R. and Shenhar,A. J. (2003). Beyond the Balanced Scorecard:Refining the Search for Organizational Success Measures. Long Range
Planning, Vol. 36, No. 2, pp. 187–204; or Ahn, H. (2001). Applyingthe Balanced Scorecard Concept: An Experience Report. Long
Range Planning, Vol. 34, No. 4, pp. 441–61; Ibid, Marr, B. andAdams, C. (2004) (see note 9 above).
88 Understanding and clarifying the strategic context
12 Ibid (see note 9 above), Marr, B. and Adams, C. (2004).13 Ibid, Neely, A., Adams, C. and Kennerley, M. (2002). The Performance
Prism: The Scorecard for Measuring and Managing Business
Success. FT Prentice Hall: London. For more information on thePerformance Prism concept also visit www.cranfield.ac.uk/som/cbp.
14 The definition of a value creation map was facilitated by the def-inition of a map, provided by Huff, A. S. and Jenkins, M. (2002).Mapping Strategic Knowledge. Sage: London, pp. 2–15.
15 One of the earliest uses of influence diagrams was by J. Forresterto represent a causal loop in a feedback system. Later, ProfessorRonald Howard from Stanford University and his colleague,Dr James Matheson, refined and popularised influence diagrams.See: Howard, R. A. and Matheson, J. E. (1990). Principles and
Applications of Decision Analysis, Volume I. Strategic DecisionsGroup: Menlo Park, California; and Howard, R.A. and Matheson, J. E.(1990). Principles and Applications of Decision Analysis,Volume II.Strategic Decisions Group: Menlo Park, California; and Howard, R.A.(1965) Dynamic Inference, Journal of the Operations Research
Society of America,Vol. 13, No. 5, Sept–Oct, pp. 712–33.16 Initial strategy maps showed linkages between individual object-
ives (see Kaplan, R. S. and Norton, D. P. (1996b). Linking theBalanced Scorecard to Strategy. California Management Review,Vol. 39, No. 1, pp. 53–79), whereas later templates only visualizerelationships between the perspectives (see Ibid, Kaplan, R.S. andNorton, D.P. (2004a) – see note 6 above).
17 For examples of influence diagrams see: Gupta, O. and Roos, G.(2001). Mergers and Acquisitions Through an Intellectual CapitalPerspective. Journal of Intellectual Capital,Vol. 2, No. 3, pp. 297–309;or Marr, B., Pike, S. and Roos, G. (2005). Strategic Management ofIntangible Assets and Value Drivers in R&D Organizations. R&D
Management,Vol. 35, No. 2, pp. 111–24.18 See for example the work by John Sterman at the Systems
Dynamics Research Group at MIT; or Sterman, J. (2000). Business
Dynamics: Systems Thinking and Modelling for a Complex
World. McGraw-Hill.19 If the organization wants to involve more than 15 people in the
workshop, it is suggested that a number of workshops should beconducted. Experience has shown that smaller groups seem towork better.
20 Professor Jan Mouritsen of Copenhagen Business School, with othercolleagues from Denmark, proposed the use of narratives for provid-ing contextual information for intellectual capital statements. See forexample: (DATI) Danish Agency of Trade and Industry (2000).
A Guideline for Intellectual Capital Statements – A Key to Knowl-
edge Management. Ministry of Trade and Industry: Copenhagen.21 Scott recommends the adoption of the language used in a serious
conversation, meaning using only as many words as necessary. See:Scott, R. (1989). Secrets of successful writing. Reference SoftwareInternational: San Francisco.
22 For more details see: www.shell.com23 See for example: Becker, B. E., Huselid, M. A. and Ulrich, D. (2001).
The HR Scorecard: Linking People, Strategy, and Performance.Harvard Business School Press: Boston, MA; or Keyes, J. (2005).Implementing the IT Balanced Scorecard: Aligning It With Cor-
porate Strategy. Auerbach Publishers: Philadelphia; or Graeser, V.,Pisanias, N. and Willcocks, L. P. (1998). Developing the IT Scorecard:
A Detailed Route Map to IT Evaluation and Performance Meas-
urement Through the Investment Cycle. Business Intelligence:London.
24 See for example: Nicholson, N. (1997). Evolutionary Psychology:Toward a New View of Human Nature and Organizational Society.Human Relations,Vol. 50, No. 9, pp. 1053–78.
25 This case study was jointly produced with Gary Crates, Head ofCommercial, DHL, South-East Europe and North Africa.
26 This case study was jointly produced with Hanne Schou-Rode,VicePresident Corporate Stakeholder Relations at Novo Nordisk andCharlotte Winther, Project Manager, Corporate Stakeholder Relationsat Novo Nordisk.
27 These figures are as per 2005, based on the 2004 Annual Report.28 This case study was jointly produced with Paul Neagle, CEO of the
TT Club and Nick Baker, Business Planning Director at the TT Club.29 This case study was jointly produced with Emma de-la-Haye, Carol
Jones and Mark Rigby from the Performance Management andGovernance Team.
30 Please note that the relative importance and relationships betweenthe resources has been taken out to protect confidentiality and com-petitive information.
Mapping and narrating value creation 89

This page intentionally left blank

Part II
Managing performance
in an enabled learning
environment
Introduction to Part II:
from command-and-
control to learning
For any Strategic Performance Management initiative to become suc-cessful, we need to create the appropriate environment and routinesin our organizations. What we have to move away from is the command-and-control mentality, in which backward-looking, pseudo-relevant metrics are being used to reward or punish people. In thecommand-and-control model, measures are used to assess people’sperformance and then make a judgement on whether they haveachieved their targets or not. In an enabled learning environment,indicators are instead used to learn, challenge, and improve future per-formance.1 This part of the book will outline how we can create anenabled learning environment, in which relevant performance indicatorsare collected and used as management information – managementinformation that is then used by a broad spectrum of the organiza-tion’s staff to assess and challenge its defined strategy and, in general,to help staff make better management decisions.
A parallel from educational assessments
There is an interesting parallel that we can find in the educationworld, where different forms of assessing students yield different out-comes. Traditionally, we tend to use summative assessments inschools. Summative assessment is an assessment, typically an exam ortest, that determines the learning outcome of an academic pro-gramme, let’s say a language course, at the end of the programme orat the end of a particular phase of the programme. Such assessments
Introduction to Part II: from command-and-control to learning 93
are judgements about the student’s learning, mostly in the form of agrade, which is given compared to some standard or to the perform-ance of others. These assessments often have high stakes attached tothem, e.g. a qualification, access to university, etc. Most exams andstandardized tests today are summative in nature. They are seen toprovide reliable and comparative data, and the assumption is that suchtests produce improvements in student learning. However, thisassumption is questioned by many since these assessments are notdesigned to provide contextualized feedback that is useful for helpingstudents and teachers during the course of a programme to improvelearning.
By contrast, formative assessment is a feedback process into an ongoing programme in order to improve the learning. It occurs whenteachers feed performance information back to students in ways thatenable the student to learn and fine-tune or modify what they have beendoing, or when students can engage in a similar, self-reflective process.
Whereas in summative assessments the result (e.g. grade) is at thecentre of attention, in formative assessments the improvement oflearning is the key objective.The former is backward-looking, whereasthe latter is about positively impacting on the future. Formative assess-ment is more about detecting learning shortcomings early enough anddoing something about them. It also engages the students and pro-vides them with useful information about their progress and anylearning gaps, which they can then use to make decisions about howto improve future learning.
Research in this area provides strong evidence that formative assess-ment is a powerful means to improve student learning, whereas sum-mative assessments such as standardized exams can, in fact, have aharmful effect.2 An article on the topic highlights the fact that mostclassroom testing encourages rote and superficial learning.3 ProfessorsPaul Black and Dylan William found that teachers often emphasizequantity of work over high quality. Actual assessment practices showthat marking and grading are overemphasized, while giving usefuladvice is underemphasized. Overall, summative assessments tend tohave a negative effect on student learning.
This problem is made worse by the fact that in many countriesschools or universities are now being assessed on the outcome ofsuch standardized summative assessments. The laudable aim is tomake schools accountable for their teaching quality and the progressin learning achieved by the students. The numerical outcomes ofthese assessments are then used to create, for example, school leaguetables which are published in order to inform parents and studentsabout the performance of different schools.4
The problem is that what is being measured is a proxy measure forlearning that only measures the numerical outcome of the exams andnot whether any real learning has taken place. This focus on proxyoutcome measures leaves the system open to cheating and thereforecan create dysfunctional behaviour.Teachers might only teach what isimportant to pass the exams with little actual learning, and studentsmight try to do as little as they can get away with to meet the min-imum requirement. Suddenly, the emphasis is not on learning, but onplaying the numbers game.
The reasons for this dysfunctional system are two-fold. First, the wrongapproach towards Performance Management is taken. Summative assess-ments focus on the past performance and provide little or no guidanceon what could be done differently in future learning. Students whoreceive a grade at the end of a course can’t do anything differently toimprove it. At the same time, schools that are being assessed with aleague table score receive no constructive feedback on how teachingquality could be improved. Second, the measures that are being used areproxy measures that are open to cheating. If we can’t see any value inthe measures we collect and don’t agree with the way these measuresare used, we get frustrated.This in turn has the effect that many peoplebelieve they might as well ‘cheat the system’ with the outcome thatthere is only superficial learning and a greater emphasis on quantityover high quality. In short, there is a massive loss of real learningpotential.
Once we’ve been ‘educated’, we get a job (hopefully). In organiza-tions we then tend to get much the same dysfunctional behaviour andgaming of numbers. If we don’t collect and apply the most relevantindicators (instead of opting for the ones that are easy to measure orprovide a view only of historic performance) and if we don’t createan environment in which indicators are used to inform our decision-making and learning, then we are heading down the very same shallowtrack.
Managing performance in an enabled
learning environment
In Part I of this book I focused on the strategic context of the organ-ization and the process of describing and mapping the organizationalstrategy.This provides us with a business model, which is the startingpoint for Strategic Performance Management. In order to create anenabled learning environment we must now collect the relevant per-formance indicators and use them to analyse, review, and challenge
94 Managing performance in an enabled learning environment
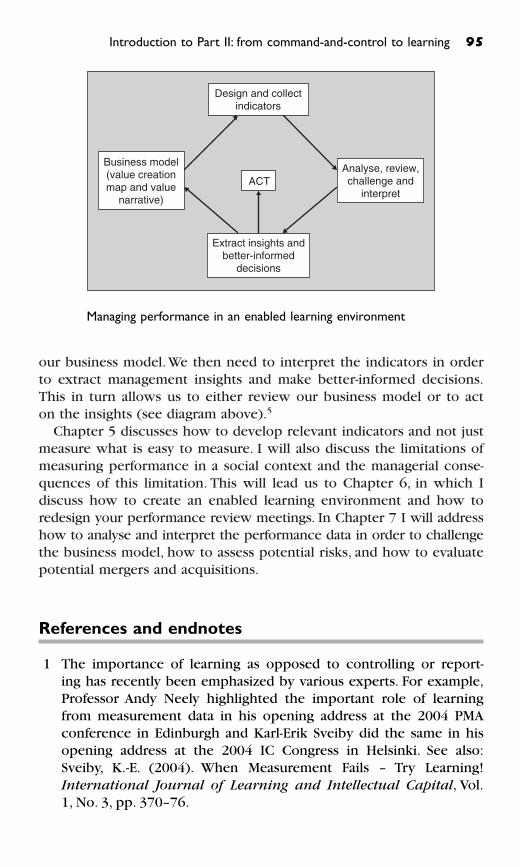
our business model. We then need to interpret the indicators in orderto extract management insights and make better-informed decisions.This in turn allows us to either review our business model or to acton the insights (see diagram above).5
Chapter 5 discusses how to develop relevant indicators and not justmeasure what is easy to measure. I will also discuss the limitations ofmeasuring performance in a social context and the managerial conse-quences of this limitation. This will lead us to Chapter 6, in which Idiscuss how to create an enabled learning environment and how toredesign your performance review meetings. In Chapter 7 I will addresshow to analyse and interpret the performance data in order to challengethe business model, how to assess potential risks, and how to evaluatepotential mergers and acquisitions.
References and endnotes
1 The importance of learning as opposed to controlling or report-ing has recently been emphasized by various experts. For example,Professor Andy Neely highlighted the important role of learningfrom measurement data in his opening address at the 2004 PMAconference in Edinburgh and Karl-Erik Sveiby did the same in hisopening address at the 2004 IC Congress in Helsinki. See also:Sveiby, K.-E. (2004). When Measurement Fails – Try Learning!International Journal of Learning and Intellectual Capital, Vol.1, No. 3, pp. 370–76.
Introduction to Part II: from command-and-control to learning 95
Design and collectindicators
Analyse, review,challenge and
interpret
Extract insights andbetter-informed
decisions
ACT
Business model(value creationmap and value
narrative)
Managing performance in an enabled learning environment
96 Managing performance in an enabled learning environment
2 For a discussion about formative assessments, see for example:Black, P., Dylan, W., Harrison, C., Lee, C., and Marshall, B. (2003).Assessment for Learning: Putting It into Practice. OpenUniversity Press: Maidenhead; or Black, P. and William, D. Inside theBlack Box: Raising Standards Through Classroom Assessment. Phi
Delta Kappan, October 1998. Black and William recognize thatstandardized tests are very limited measures of learning and reportthat studies of formative assessment show an effect size (the ratioof the average improvement in test scores in the innovation to therange of scores of typical groups of pupils on the same tests) onstandardized tests of between 0.4 and 0.7, larger than most knowneducational interventions.
3 See: www.fairtest.org, The Value of Formative Assessment, The
Examiner,Winter 1999.4 For UK school league table results see: www.dfes.gov.uk/
performancetables5 The thinking presented here is an evolution based on extensive
experience and research conducted at the Centre for BusinessPerformance at Cranfield School of Management Performance,where the Planning Value Chain was developed. The basic idea ofit is that organizations need to start by developing a businessmodel that reflects their basic hypothesis about their business;only then should they start collecting data and analysing and inter-preting that data to extract insights.We then need to communicatethese insights in order to make decisions and take actions.
5
Performance indicators
This chapter focuses on how to design appropriate performance indi-cators. It explores the role of measurement in organizations and whywe need indicators. A key challenge is that many of the things wewould like to measure are inherently difficult, if not impossible, tomeasure. I therefore take a look at the limitations of measurement andits implications for the usage of performance indicators. This chapterthen outlines how to design meaningful indicators and collect the rele-vant data that allows organizations to assess and challenge their strat-egy. Questions addressed in this chapter include:
� Why do we need performance measures?� What can we really measure, and where are the limitations of
measurement?� What implications do the limitations have on the usage of measures?� What is the difference between measurement and assessment, and
between a measure and an indicator?� How can we design meaningful performance indicators?� How can we collect and report relevant performance data?
Why do we need performance indicators?
Measurement has a central role in our society.Take this quote:
. . . when you can measure what you are talking about andexpress it in numbers you know something about it; but whenyou cannot measure it, when you cannot express it in numbers,your knowledge is of a meagre and unsatisfactory kind.
This passing comment by Sir William Thomson (later Lord Kelvin) in alecture to the Institution of Civil Engineers in 1883, is one of the mostfrequently cited quotes in measurement circles. The sentiment of thisstatement can be traced back to the philosopher Philolaus, in the fifthcentury B.C., who said that ‘without numbers, we can understandnothing and know nothing’.1 In ‘business-speak’, these statements areoften reduced to simple homilies, such as ‘you can’t manage anythingunless you measure it’ or Tom Peters’ well-known ‘what gets measuredgets done’. In his book about business Performance Measurement, mycolleague Professor Andy Neely provides a more considered view andprovides four key reasons why organizations measure performance.These are to: check position; communicate position; confirm prior-ities; and compel progress.2
� Check position: measures are used to establish where we are as anorganization. It is hard to define strategies or plan improvement ini-tiatives if we don’t know our starting point. Measurement alsoenables us to compare ourselves with other companies to under-stand where we are in comparison to others. Once the position isestablished, measures allow us to monitor our progress. Here theflying of an airplane is often used as an analogy. For a plane youneed to know where you are – your point of departure (A) – andthen you need to know where you want to go – your destination(B).This allows the crew to map out how to get from A to B. Onceon their way, measures provided by the various instruments on thedashboard enable the crew to monitor their progress.
� Communicate position: measures give you a means of communi-cating performance.These can be voluntary or legislative communi-cations. Legislative requirements, for example taxation and accountingpurposes, force organizations to produce things like annual reports.In many industries regulators require organizations to communicateperformance. And increasingly organizations voluntarily producereports on issues such as customer service, environmental perform-ance and whether they are meeting their social responsibilities.
� Confirm priorities: once measures are in place they allow organiza-tions to highlight what matters the most. Measures enable us toimprove organizational control, i.e. control of costs and manage-ment control.
� Compel progress: measures influence people’s behaviour and atti-tudes. Here the homily ‘you get what you measure’ is often used todemonstrate the point. If organizations measure aspects of perform-ance, it sends a signal that this is what is important.‘Show me whatyou will measure and I will show you what I will do. Confuse
98 Managing performance in an enabled learning environment
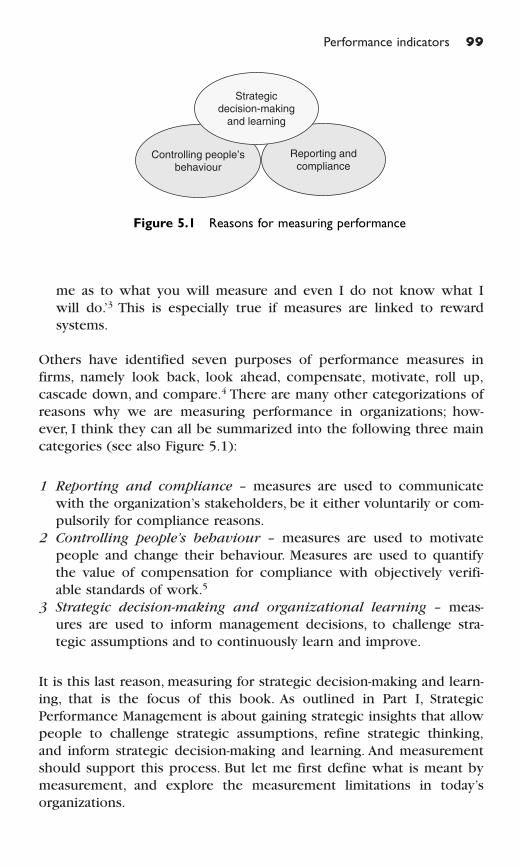
Performance indicators 99
me as to what you will measure and even I do not know what Iwill do.’3 This is especially true if measures are linked to rewardsystems.
Others have identified seven purposes of performance measures infirms, namely look back, look ahead, compensate, motivate, roll up,cascade down, and compare.4 There are many other categorizations ofreasons why we are measuring performance in organizations; how-ever, I think they can all be summarized into the following three maincategories (see also Figure 5.1):
1 Reporting and compliance – measures are used to communicatewith the organization’s stakeholders, be it either voluntarily or com-pulsorily for compliance reasons.
2 Controlling people’s behaviour – measures are used to motivatepeople and change their behaviour. Measures are used to quantifythe value of compensation for compliance with objectively verifi-able standards of work.5
3 Strategic decision-making and organizational learning – meas-ures are used to inform management decisions, to challenge stra-tegic assumptions and to continuously learn and improve.
It is this last reason, measuring for strategic decision-making and learn-ing, that is the focus of this book. As outlined in Part I, StrategicPerformance Management is about gaining strategic insights that allowpeople to challenge strategic assumptions, refine strategic thinking,and inform strategic decision-making and learning. And measurementshould support this process. But let me first define what is meant bymeasurement, and explore the measurement limitations in today’sorganizations.
Reporting andcompliance
Controlling people’sbehaviour
Strategicdecision-making
and learning
Figure 5.1 Reasons for measuring performance
What we can and can’t ‘measure’
Measurement has been defined as the assignment of numerals to represent properties.6 It is seen as the assignment of particular math-ematical characteristics to conceptual entities in such as way as topermit an unambiguous mathematical description of every situationinvolving the entity and the arrangements of all occurrences of it in aquasi-serial order.7 Whereas these technical definitions have been espe-cially useful in disciplines such as physics, in management we talkabout organizational performance measures. These have been definedas parameters used to quantify the efficiency and/or effectiveness ofpast action.8
An effectiveness measure of performance reveals how manyunits of the purpose were accomplished. It is a response to thequestion: ‘Are we doing the right things?’ On the other hand, anefficiency measure of performance reveals how many units ofthe purpose were accomplished per unit of resources con-sumed. It is a response to the question: ‘Are we doing the thingsin the right way?’9
Often the emphasis in measurement is on quantifications and num-bers, with the intention to provide us with an objective, uniform andrigorous picture of reality. However, this seems to work in some areasbetter than in others. We find it easy to quantify things like profits,return on assets, or cycle times and we can count incoming orders,service visits, or rejected deliveries. Some things though are not easilycounted or quantified. Things like organizational culture, our know-how, the strengths of customer relationships or the reputation of ourbrand are all inherently difficult if not impossible to measure. At thesame time, as we have seen from Chapter 3, it is often these less tan-gible resources that drive our future performance.
Albert Einstein, one of the great thinkers of the twentieth century,emphasized that ‘Not everything that can be counted counts, and noteverything that counts can be counted’.The problem arises when weuse numbers to measure things that can never be measured in a‘measurement’ sense.The author David Boyle, in his book on countingand numbers, writes that
‘We admit that numbers can’t reveal everything, but we try toforce them to anyway. We tend to solve the problem by measur-ing ever-more ephemeral aspects of life, constantly bumping upagainst the central paradox of the whole problem, which is that
100 Managing performance in an enabled learning environment
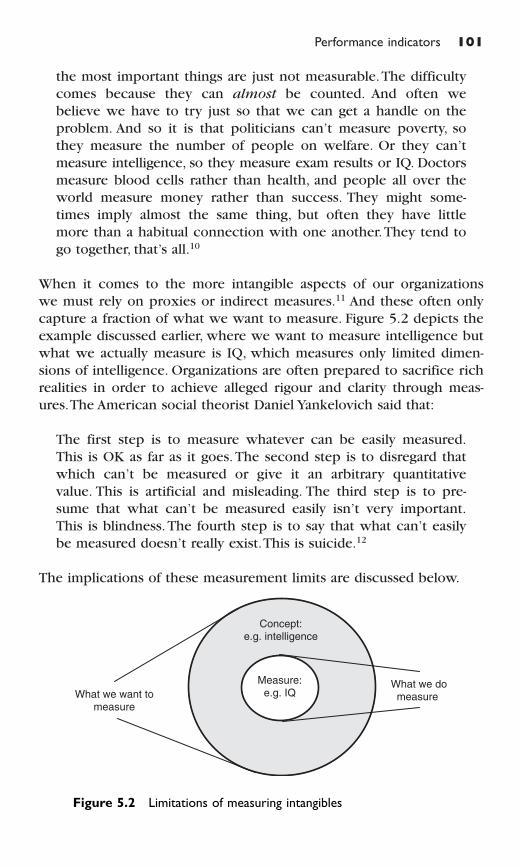
Performance indicators 101
the most important things are just not measurable.The difficultycomes because they can almost be counted. And often webelieve we have to try just so that we can get a handle on theproblem. And so it is that politicians can’t measure poverty, sothey measure the number of people on welfare. Or they can’tmeasure intelligence, so they measure exam results or IQ. Doctorsmeasure blood cells rather than health, and people all over theworld measure money rather than success. They might some-times imply almost the same thing, but often they have littlemore than a habitual connection with one another.They tend togo together, that’s all.10
When it comes to the more intangible aspects of our organizationswe must rely on proxies or indirect measures.11 And these often onlycapture a fraction of what we want to measure. Figure 5.2 depicts theexample discussed earlier, where we want to measure intelligence butwhat we actually measure is IQ, which measures only limited dimen-sions of intelligence. Organizations are often prepared to sacrifice richrealities in order to achieve alleged rigour and clarity through meas-ures.The American social theorist Daniel Yankelovich said that:
The first step is to measure whatever can be easily measured.This is OK as far as it goes. The second step is to disregard thatwhich can’t be measured or give it an arbitrary quantitativevalue. This is artificial and misleading. The third step is to pre-sume that what can’t be measured easily isn’t very important.This is blindness.The fourth step is to say that what can’t easilybe measured doesn’t really exist.This is suicide.12
The implications of these measurement limits are discussed below.
Concept:e.g. intelligence
Measure:e.g. IQWhat we want to
measure
What we domeasure
Figure 5.2 Limitations of measuring intangibles
Implications for the usage of measures
The mechanical objectivity that we often aim for in organizational meas-urement serves as an alternative to personal trust.13 Measures providea moral distance and make knowledge impersonal in a quest forobjectivity. Objectivity is required for the first two measurement rea-sons outlined above:
1 Reporting and compliance requires objectivity and in many caseseven external auditing. Organizations use external auditors to pro-vide an objective verification of the numbers they put in theirannual reports. Some companies such as Shell, for example, go evenfurther and also use external auditors to audit their numbers onenvironmental and social performance.
2 Using measures as a means of controlling people’s behaviour neces-sitates objectivity, especially if measures are linked to reward andcompensation.
In both scenarios personal trust is replaced with what are believed tobe objective numbers.There is, in fact, a complex relationship betweentrust and quantification. For example, when farmers and merchantsdidn’t trust each other to provide the right amount of wheat, theycould use the standard barrel stuck to the wall of the town hall,which would measure the agreed local bushel.14 It has been demon-strated that throughout history we were often able to win greatertrust for claims by giving them quantitative expressions.15 Nevertheless,it is dangerous to replace trust with measures, since the big assump-tion is that we can measure everything that matters. The fact is thatwhat matters the most in modern-day organizations is difficult to meas-ure and often impossible to express in meaningful numbers.
The dysfunctional consequences of measurements replacing trustcan be seen in myriad examples. One comes from food standards.Similar to the farmer and merchants using the standard barrel, todaywe rely on standards to facilitate international trade.The US food stand-ards, which are administered by the Department of Agriculture, spe-cify that, for example, a ‘US Fancy broccoli stalk’ has a diameter of notless then 2½ inches, or that the colour of a Grade A canned tomato isat least 90% red.16 The same applies to the European Union, whichspecifies the standard bend of a banana or the size and shape of apples.We presumably all agree that what really matters are the intangiblefactors such as the taste and nutritional quality of this produce, butthese are again difficult to measure. The standards are almost entirelybased on the easy-to-measure physical appearance of the produce.
102 Managing performance in an enabled learning environment
And, in fact, studies have found that this has encouraged farmers touse dangerous pesticides, not to increase yields, but for the sole pur-pose of maintaining cosmetic appearance to meet such standards.17
Problems with measurement and their implications for
reporting and compliance
Measurement for external reporting and compliance can be comparedto summative assessments, as discussed above. Here, measures provideobjective assessments about the overall effectiveness, impact, and/oroutcomes of organizational performance.18 Reports to regulators orfinancial reports fall into this category of stakeholder reporting andcompliance. According to the Financial Accounting Standards Board,the role of financial reporting is to provide useful information aboutthe performance of an organization. However, with an ever-increasinggap between the book value and market value of companies, account-ants are trying to get a handle on objectively measuring intangibles.The problem is that currently there are no meaningful standards toreport on intangible resources, such as relationships, know-how, orculture.
Thomas Johnson and Robert Kaplan wrote in their influential book,Relevance Lost, that the decreasing relevance of accounting is partlydue to the increasingly mechanical use of management accounting byuninspired executives trained to manage by numbers.19 While account-ants are working hard to regain relevance, many organizations areexploring alternative routes of providing more relevant information inthe form of voluntary reports. One example is the global investmentbank and financial services firm UBS. They realized that their annualfinancial report was insufficient in communicating the value of theintangible drivers of their business. UBS therefore spent 14 pages oftheir annual review explaining their value drivers and how they aremeasured. In the introduction to that section, USB writes:
To the outside world, our strength is often perceived as beingderived from the financial success of our business. Yet, at thesame time, we also believe our strength is projected throughother more intangible factors – factors such as the values weshare, our culture, our client relationships and our brands. Wehave distilled these factors into the five key elements of ClientFocus, Innovation and Learning, Talent and Culture, Brand andIdentity, and Financial Intelligence. They are the value drivers ofour business.20
Performance indicators 103
There is a clear requirement for summative Performance Measurementto enable organizations to report to external stakeholders or complywith regulations and laws. This is not a problem as long as organiza-tions understand that these measures are designed for that purposeonly. Much care should be taken before any of those measures areused for any of the other measurement purposes.
Problems with measurement and their implications for
controlling people’s behaviour
Measures can be used to influence what people do. The theoreticalmodel behind this is called ‘Agency Theory’.21 Its argument goes thatemployees (agents) don’t have the same objectives as the owner or insti-gator of a business (principal).This is why the principal puts measuresin place that will guide the behaviour of the agent, and therefore aligntheir objectives. However, this model can only work if the principalcan measure all critical dimensions of performance. If the principalmisses some aspects of performance it leaves a gap. And as we haveseen from the discussion above, this gap between what we want tomeasure and what we can measure is endemic.
Marshall Meyer, professor at the Wharton School of the Universityof Pennsylvania, argues in his book on Performance Measurement, that
people will exploit the gap between what we want to measureand what we can measure by delivering exactly what is meas-ured rather than the performance that is sought but cannot bemeasured.22
This causes dysfunctional behaviour and sub-optimal performance.Let’s take the example of a sales manager, whose main objective it isto visit customers in order to introduce a set of new products, whichthese customers will hopefully want to buy. Figure 5.3 shows thatoptimal performance is comprised of some easy-to-measure dimen-sions, e.g. number of sales visits and amount of time spent with cus-tomers, as well as some difficult-to-measure dimensions of performance,e.g. quality of the sales visits and preparation for the visit.23
What usually happens is that only the easy-to-measure dimensionsof performance are measured and then linked to a reward system. It istherefore not surprising that, in many firms, the number of sales visitssharply rises towards the end of the month just before the numbersare collected.The fact that these visits are of low quality and with lit-tle preparation is not taken into account. UK government targets on
104 Managing performance in an enabled learning environment
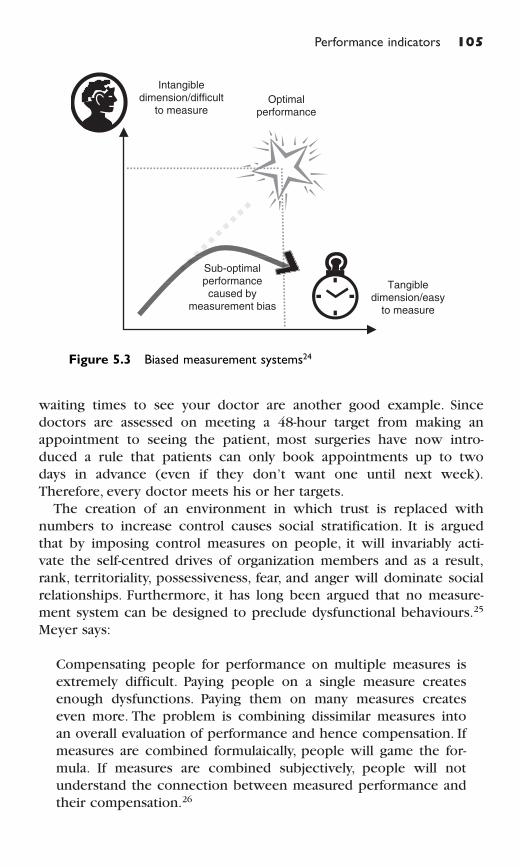
Performance indicators 105
waiting times to see your doctor are another good example. Sincedoctors are assessed on meeting a 48-hour target from making anappointment to seeing the patient, most surgeries have now intro-duced a rule that patients can only book appointments up to twodays in advance (even if they don’t want one until next week).Therefore, every doctor meets his or her targets.
The creation of an environment in which trust is replaced withnumbers to increase control causes social stratification. It is arguedthat by imposing control measures on people, it will invariably acti-vate the self-centred drives of organization members and as a result,rank, territoriality, possessiveness, fear, and anger will dominate socialrelationships. Furthermore, it has long been argued that no measure-ment system can be designed to preclude dysfunctional behaviours.25
Meyer says:
Compensating people for performance on multiple measures isextremely difficult. Paying people on a single measure createsenough dysfunctions. Paying them on many measures createseven more. The problem is combining dissimilar measures intoan overall evaluation of performance and hence compensation. Ifmeasures are combined formulaically, people will game the for-mula. If measures are combined subjectively, people will notunderstand the connection between measured performance andtheir compensation.26
Intangibledimension/difficult
to measure
Tangibledimension/easy
to measure
Optimalperformance
Sub-optimalperformancecaused by
measurement bias
Figure 5.3 Biased measurement systems24
106 Managing performance in an enabled learning environment
The above arguments therefore seriously question the usage of meas-ures for influencing behaviour in a command-and-control fashion.
Controlling machines makes sense; however, trying to controlthe behaviour of people creates negative and unpredictable con-sequences. For instance, showing a child how to cross the streetby holding his or her hand for the first few times makes a lot ofsense. Holding the child’s hand for the rest of his or her lifemakes no sense at all, and interferes with growth.27
In his book on measuring and managing performance, Robert Austin,Professor at Harvard Business School, makes a very strong case thatmeasurement for controlling people’s behaviour does not work intoday’s organizations. Instead, we should focus our efforts on what hecalls ‘informational measurement’ used for learning and strategic decision-making.28 In the next section we will take a closer look at what meas-urement for strategic decision-making and learning means.
Measurement for strategic decision-making and
learning
This book focuses on measurement for decision-making and learning.For this, the meaning of measurement is extended to not only focuson the narrow sense of measurement used in physics or mathematics.Here the words ‘performance assessment’ are used, rather then ‘meas-urement’. It is, therefore, not only about quantification and the assign-ment of numerals. Performance assessment is about the systematiccollection of information to enable comparison of a given situation orstatus relative to known objectives or goals; it enables organizations toevaluate performance. Inherent in it is the notion of value. Performanceassessment can, therefore, not only take the form of numerals but alsothe form of written descriptions, symbols, or colour codes.
As we all know, the perceived value of something is in the eye ofthe beholder. For some of us, a Rolex or Patek Philippe wristwatch isvaluable and we are willing to pay several thousand dollars or eurosto own one. We might see the value in its mechanical perfections, inthe craftsmanship, in the design, or we might value it as a prestigesymbol. If we only want a device to tell us the time, a simple Timex orSwatch would do the job perfectly. This means, in order to assess thevalue of something, we need to understand the value system and, inthis case, how the watch fits into this value system.
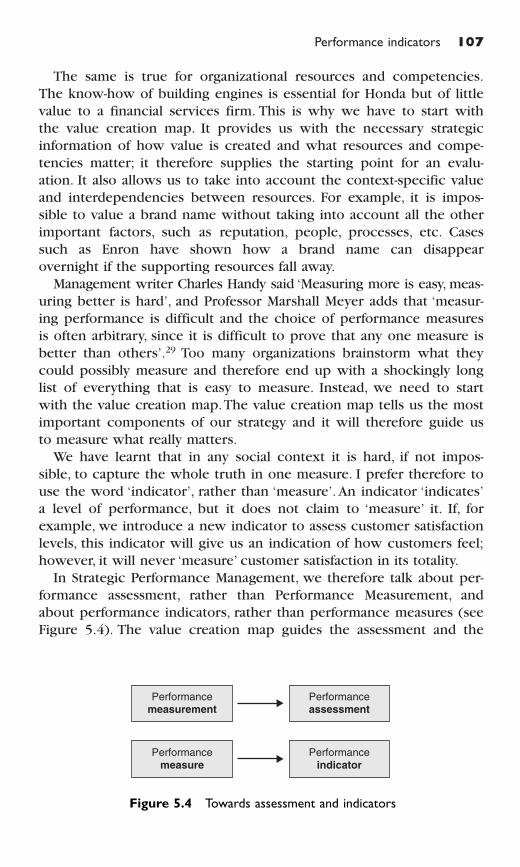
Performance indicators 107
The same is true for organizational resources and competencies.The know-how of building engines is essential for Honda but of littlevalue to a financial services firm. This is why we have to start withthe value creation map. It provides us with the necessary strategicinformation of how value is created and what resources and compe-tencies matter; it therefore supplies the starting point for an evalu-ation. It also allows us to take into account the context-specific valueand interdependencies between resources. For example, it is impos-sible to value a brand name without taking into account all the otherimportant factors, such as reputation, people, processes, etc. Casessuch as Enron have shown how a brand name can disappearovernight if the supporting resources fall away.
Management writer Charles Handy said ‘Measuring more is easy, meas-uring better is hard’, and Professor Marshall Meyer adds that ‘measur-ing performance is difficult and the choice of performance measuresis often arbitrary, since it is difficult to prove that any one measure isbetter than others’.29 Too many organizations brainstorm what theycould possibly measure and therefore end up with a shockingly longlist of everything that is easy to measure. Instead, we need to startwith the value creation map.The value creation map tells us the mostimportant components of our strategy and it will therefore guide usto measure what really matters.
We have learnt that in any social context it is hard, if not impos-sible, to capture the whole truth in one measure. I prefer therefore touse the word ‘indicator’, rather than ‘measure’. An indicator ‘indicates’a level of performance, but it does not claim to ‘measure’ it. If, forexample, we introduce a new indicator to assess customer satisfactionlevels, this indicator will give us an indication of how customers feel;however, it will never ‘measure’ customer satisfaction in its totality.
In Strategic Performance Management, we therefore talk about per-formance assessment, rather than Performance Measurement, andabout performance indicators, rather than performance measures (seeFigure 5.4). The value creation map guides the assessment and the
Performancemeasurement
Performanceassessment
Performancemeasure
Performanceindicator
Figure 5.4 Towards assessment and indicators
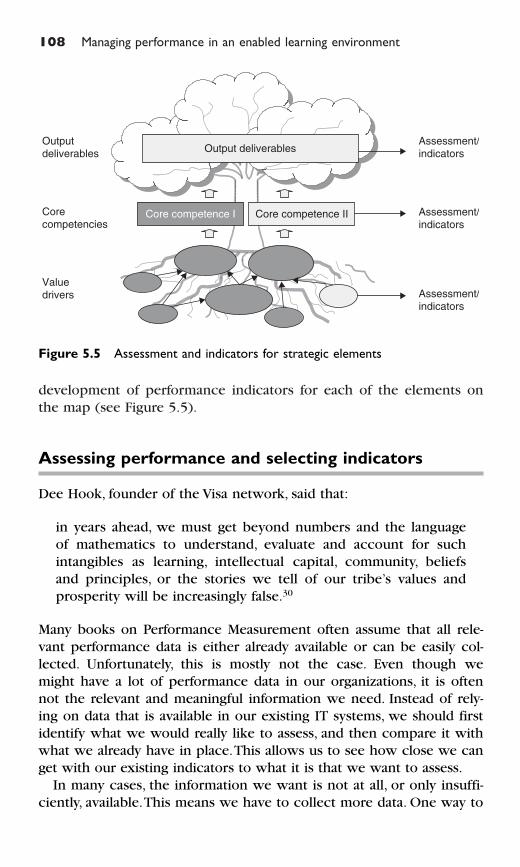
108 Managing performance in an enabled learning environment
development of performance indicators for each of the elements onthe map (see Figure 5.5).
Assessing performance and selecting indicators
Dee Hook, founder of the Visa network, said that:
in years ahead, we must get beyond numbers and the languageof mathematics to understand, evaluate and account for suchintangibles as learning, intellectual capital, community, beliefsand principles, or the stories we tell of our tribe’s values andprosperity will be increasingly false.30
Many books on Performance Measurement often assume that all rele-vant performance data is either already available or can be easily col-lected. Unfortunately, this is mostly not the case. Even though wemight have a lot of performance data in our organizations, it is oftennot the relevant and meaningful information we need. Instead of rely-ing on data that is available in our existing IT systems, we should firstidentify what we would really like to assess, and then compare it withwhat we already have in place.This allows us to see how close we canget with our existing indicators to what it is that we want to assess.
In many cases, the information we want is not at all, or only insuffi-ciently, available.This means we have to collect more data. One way to
Output deliverables
Core competence I Core competence II
Assessment/indicators
Assessment/indicators
Assessment/indicators
Valuedrivers
Corecompetencies
Outputdeliverables
Figure 5.5 Assessment and indicators for strategic elements
get a good idea about how to assess performance in a particular areais to ask the people who are most closely involved in that area. Fartoo often we impose measures on people. Assessing performance forstrategic learning means that people have to believe in the indicatorsand use them to inform their decision-making. Therefore, involvingpeople (both internal and external) is critically important.
Not only should we involve people in the selection of possible indi-cators, but also in the assessment of performance and the collectionof data. Many studies have shown that perceptional assessment is asreliable, if not more reliable, than archival data.31 It can provide richerinsights into the real level of performance because our brain is able tocomprehend performance more holistically. The way we involve people is to ask them to, for example, rank competitors, evaluate theservice delivery, assess the level of relationships with different sup-pliers, etc.These assessments can take the form of numerals, or grades;however, they can also take the form of a written assessment. Writtenassessments are able to capture much more information and allow usto more naturally communicate assessment outcomes. If numerals areused, these should be supplemented with at least a comments field to provide some explanatory narrative assessment in addition to anumber.
Traditionally, organizations have used archival data or larger-scalesurveys to access performance. Below, different data collection methodsare outlined to provide some alternative ways of collecting perform-ance information and perception data:
� Surveys and questionnaires provide a relatively inexpensive tool tocollect data from a large pool of people who can be at different loca-tions.32 This can be done via mail, e-mail, or internet. One big prob-lem with this is that there has been a huge influx of surveys overthe past few years as more and more organizations require data fortheir non-financial indicators.The consequence of this is that it is get-ting harder to make people complete a survey. It is always a goodidea to reduce the amount of time and effort required to collect per-formance data, not only for your organization, but also for your cus-tomers, employees, suppliers, etc.
It has been argued that surveys and questionnaires are one ofthe most difficult data collection methods to do well, as it takes asignificant time to construct clearly worded questions that willresult in useful and valid data. Surveys should always be pilot testedon a number of people before being used. This allows mistakes to be eliminated and clarifying questions to be added before thesurveys are sent out.
Performance indicators 109
110 Managing performance in an enabled learning environment
� Observations allow us to collect information by observing situ-ations or activities with little or no manipulation of the environ-ment. The observer can either take the role of a passiveonlooker/outsider, or can become involved in activities and, there-fore, take the role of partial or full participant observer.
The power of using observation methods is that it engages allof our senses not just our sight. It enables us to talk in andmake sense of the entire experience through our nose(smell), eyes (sight), ears (hearing), mouth (taste), and body(touch). Unlike other data collection methods, observationdata can provide us with a more holistic understanding of thephenomenon we’re studying.33
Observation data has the purpose of describing, which can take theformat of score sheets, checklists, narrative reports, video taping oraudio taping, depending on the level of detailed contextual informa-tion required.
� In-depth interviews are guided conversations with people, ratherthan structured queries. They involve putting forward open-ended(how, why, what) questions in a conversationally friendly and non-threatening manner.34 Interviews can be conducted face-to-faceor via telephone or video-conference. Interviews enable us to interact directly with respondents and may result in new insightsabout performance and provide examples, stories, and critical inci-dents that are helpful in order to understand performance moreholistically.35
� Focus groups are facilitated group discussions in which partici-pants can express and share their ideas, opinions and experiences.They provide a unique and interactive way to gather information andallow the collection of rich, qualitative information.Typically, a focusgroup will comprise between 5 and 20 pre-selected people who arewilling to participate.
� Mystery shopping is the assessment of a service by a ‘secret shopper’ posing as a client or customer. Some companies have in-house programmes, whereby the company hires its own mysteryshoppers; other firms hire external suppliers to provide this service.
� Peer-to-peer assessment is the assessment of performance in whichparticipants vote or assess each other’s performance. This caneither be done openly or anonymously.This enables people to learnfrom each other and to consider their own performance fromother people’s perspective.
Organizations have become much more creative about the way theyare assessing performance. Call centres now regularly audiotape phoneconversations between service agents and customers.You might recallan automated message before you are connected to a service agentnotifying you that the call might be recorded for training purposes.Many call centres now use a coach to listen to conversations and thensit down with service agents to see how they could improve the quali-tative aspects of their calls.
One organization introduced two types of carpets with sensors inthe entrance hall, one red and one green. Whenever employeesentered or left the building they could choose to step on either thegreen carpet, indicating they were happy, or on the red, indicatingthey were unhappy. Another organization automated their phone sys-tem to play a message once a conversation had ended, asking cus-tomers to rate their experience by pressing a button on their phone.Many service providers, such as hotels or banks, use focus groups toidentify what really matters to customers and then employ mysteryshoppers to assess service levels according to the identified criteria.There are many more fascinating ways of collecting qualitative per-formance data – for more information see, for example, the Handbook
of Qualitative Research.36
It is a good idea to collect performance data using different tech-niques and methodologies. This allows organizations to contrast andcompare the information gathered from the different methods.This iscalled ‘triangulation’.The rationale behind it is that the more informa-tion we have from as many sources as possible – which all haveadvantages, disadvantages, and different biases – the greater the likeli-hood that the information is reliable.
Organizations are often unaware of biases in their data.A frequentlycited anecdote is the Wald story.37 Abraham Wald was a statisticianduring World War II who helped the air force to assess where air-planes were most vulnerable to enemy fire. The plan was to subse-quently reinforce the most vulnerable parts of the plane. Each airplanewas examined for bullet holes and the areas that were disproportion-ately more often hit than others were identified. The air force nat-urally concluded that the areas with the most bullet holes should be reinforced. However, Wald made them aware of the bias in the sample. Only airplanes that returned to the base were examined andincluded in the analysis! This, therefore, shows that the areas with the many bullet holes have proven able to sustain enemy fire and sothese planes returned safely, whereas the areas with no bullet holesmight be the best to reinforce since planes hit in these areas did notreturn.
Performance indicators 111
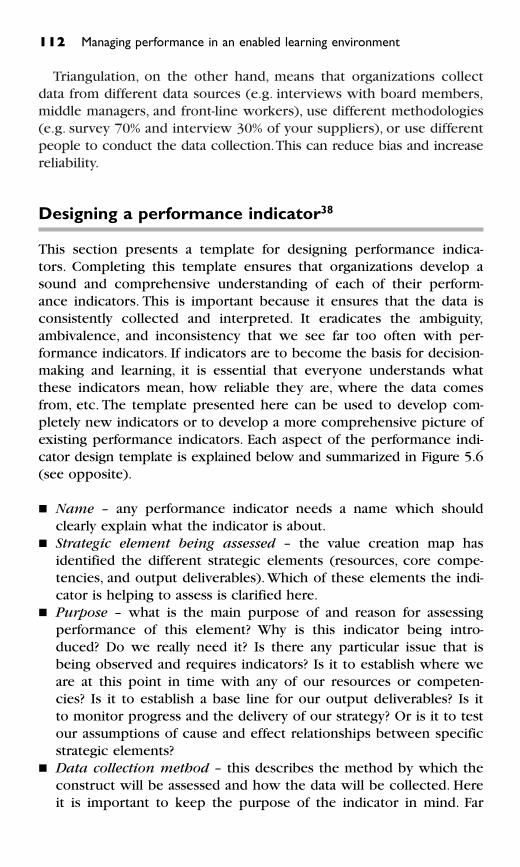
Triangulation, on the other hand, means that organizations collectdata from different data sources (e.g. interviews with board members,middle managers, and front-line workers), use different methodologies(e.g. survey 70% and interview 30% of your suppliers), or use differentpeople to conduct the data collection.This can reduce bias and increasereliability.
Designing a performance indicator38
This section presents a template for designing performance indica-tors. Completing this template ensures that organizations develop asound and comprehensive understanding of each of their perform-ance indicators. This is important because it ensures that the data isconsistently collected and interpreted. It eradicates the ambiguity,ambivalence, and inconsistency that we see far too often with per-formance indicators. If indicators are to become the basis for decision-making and learning, it is essential that everyone understands whatthese indicators mean, how reliable they are, where the data comesfrom, etc. The template presented here can be used to develop com-pletely new indicators or to develop a more comprehensive picture ofexisting performance indicators. Each aspect of the performance indi-cator design template is explained below and summarized in Figure 5.6(see opposite).
� Name – any performance indicator needs a name which shouldclearly explain what the indicator is about.
� Strategic element being assessed – the value creation map hasidentified the different strategic elements (resources, core compe-tencies, and output deliverables). Which of these elements the indi-cator is helping to assess is clarified here.
� Purpose – what is the main purpose of and reason for assessingperformance of this element? Why is this indicator being intro-duced? Do we really need it? Is there any particular issue that isbeing observed and requires indicators? Is it to establish where weare at this point in time with any of our resources or competen-cies? Is it to establish a base line for our output deliverables? Is itto monitor progress and the delivery of our strategy? Or is it to testour assumptions of cause and effect relationships between specificstrategic elements?
� Data collection method – this describes the method by which theconstruct will be assessed and how the data will be collected. Hereit is important to keep the purpose of the indicator in mind. Far
112 Managing performance in an enabled learning environment
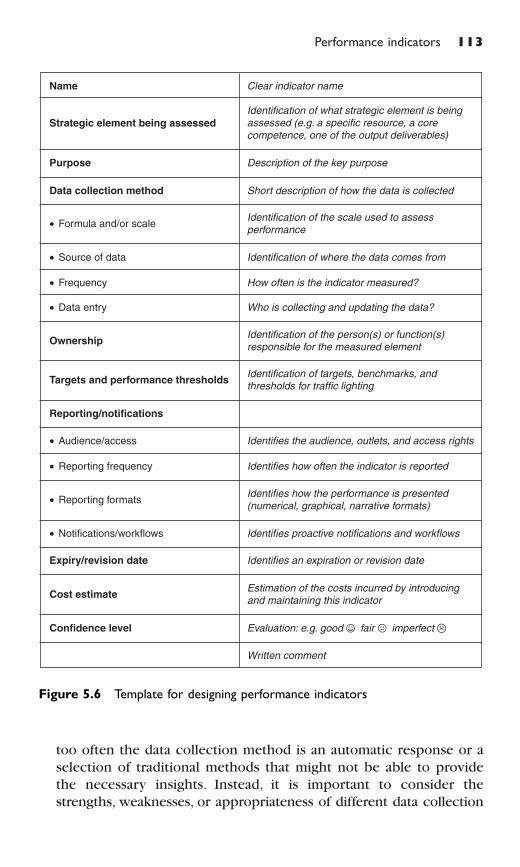
too often the data collection method is an automatic response or aselection of traditional methods that might not be able to providethe necessary insights. Instead, it is important to consider thestrengths, weaknesses, or appropriateness of different data collection
Performance indicators 113
Name
Strategic element being assessed
Purpose
Data collection method
• Formula and/or scale
• Source of data
• Frequency
• Data entry
Ownership
Targets and performance thresholds
Reporting/notifications
• Audience/access Identifies the audience, outlets, and access rights
Identifies how often the indicator is reported
Identifies how the performance is presented(numerical, graphical, narrative formats)
Identifies proactive notifications and workflows
Identifies an expiration or revision date
Estimation of the costs incurred by introducingand maintaining this indicator
Evaluation: e.g. good fair imperfect
Written comment
• Reporting frequency
• Reporting formats
• Notifications/workflows
Expiry/revision date
Cost estimate
Confidence level
Description of the key purpose
Short description of how the data is collected
Identification of the scale used to assessperformance
Identification of where the data comes from
How often is the indicator measured?
Who is collecting and updating the data?
Identification of the person(s) or function(s)responsible for the measured element
Identification of targets, benchmarks, andthresholds for traffic lighting
Clear indicator name
Identification of what strategic element is beingassessed (e.g. a specific resource, a corecompetence, one of the output deliverables)
Figure 5.6 Template for designing performance indicators
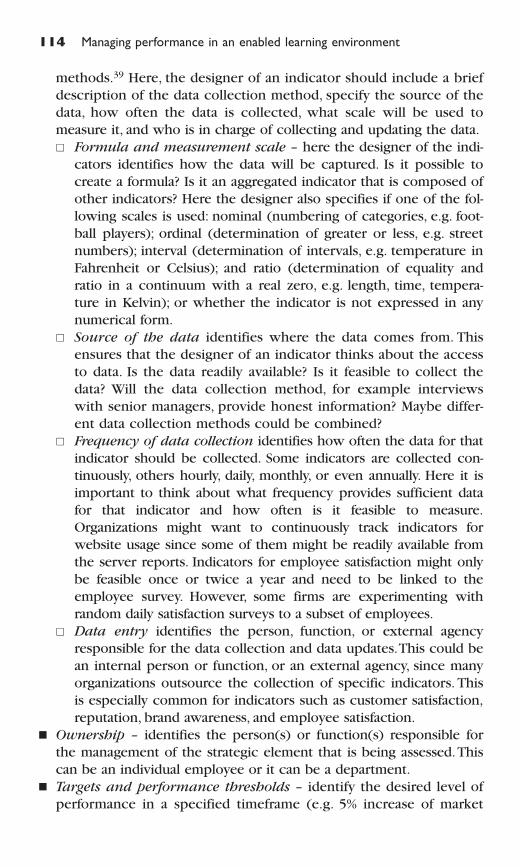
methods.39 Here, the designer of an indicator should include a briefdescription of the data collection method, specify the source of thedata, how often the data is collected, what scale will be used tomeasure it, and who is in charge of collecting and updating the data.� Formula and measurement scale – here the designer of the indi-
cators identifies how the data will be captured. Is it possible tocreate a formula? Is it an aggregated indicator that is composed ofother indicators? Here the designer also specifies if one of the fol-lowing scales is used: nominal (numbering of categories, e.g. foot-ball players); ordinal (determination of greater or less, e.g. streetnumbers); interval (determination of intervals, e.g. temperature inFahrenheit or Celsius); and ratio (determination of equality andratio in a continuum with a real zero, e.g. length, time, tempera-ture in Kelvin); or whether the indicator is not expressed in anynumerical form.
� Source of the data identifies where the data comes from. Thisensures that the designer of an indicator thinks about the accessto data. Is the data readily available? Is it feasible to collect thedata? Will the data collection method, for example interviewswith senior managers, provide honest information? Maybe differ-ent data collection methods could be combined?
� Frequency of data collection identifies how often the data for thatindicator should be collected. Some indicators are collected con-tinuously, others hourly, daily, monthly, or even annually. Here it isimportant to think about what frequency provides sufficient datafor that indicator and how often is it feasible to measure.Organizations might want to continuously track indicators forwebsite usage since some of them might be readily available fromthe server reports. Indicators for employee satisfaction might onlybe feasible once or twice a year and need to be linked to theemployee survey. However, some firms are experimenting withrandom daily satisfaction surveys to a subset of employees.
� Data entry identifies the person, function, or external agencyresponsible for the data collection and data updates.This could bean internal person or function, or an external agency, since manyorganizations outsource the collection of specific indicators. Thisis especially common for indicators such as customer satisfaction,reputation, brand awareness, and employee satisfaction.
� Ownership – identifies the person(s) or function(s) responsible forthe management of the strategic element that is being assessed.Thiscan be an individual employee or it can be a department.
� Targets and performance thresholds – identify the desired level ofperformance in a specified timeframe (e.g. 5% increase of market
114 Managing performance in an enabled learning environment
share by the end of March next year) as well as the performancedirection. Performance directions indicate at a glance whether it isbetter to exceed the planned target, hit the target value exactly, orwhether it is better to stay beneath the planned value. Financialresults or employee satisfaction are usually indicators where the‘bigger is better’ performance direction applies (the bigger thenumber of performance achieved in this area the better). On the other hand customer complaints or harmful emissions are indi-cators where ‘smaller is better’ (the fewer customer complaints acompany receives or the less a company pollutes the environmentthe better).
An example for ‘balance’ or ‘target is best’ would be quality indicatorswith SPC (Statistical Process Control) charts where there are upper aswell as lower limits that should not be exceeded and it is best to hitthe targeted tolerance range. Many firms use ‘traffic lighting’ to illus-trate the levels of performance. Here, the designer of an indicatorwould therefore specify the thresholds for red/underperformance,amber/medium performance, green/good performance, and sometimesblue/over performance. Here, it is also worth thinking about internalor external benchmarks; these can be derived from past performance,from other similar organizations or departments, or from forecasts.
� Reporting – Here, the designer of an indicator identifies the waythe performance indicator is reported. It identifies the audience,access restrictions, the reporting frequency, reporting formats andpossible notifications and workflows.� Audience and access identifies who will receive the reports on
this performance indicator, possible outlets or reports, as well aspossible access restrictions. Indicators can have different audi-ences. It might therefore be a good idea to identify primary, sec-ondary, and tertiary audiences.The primary audience will be thepeople directly involved in the management and decision-making related to the strategic element that is being assessed.The secondary audience could be other parts of the organiza-tion which would benefit from seeing the data. A possible ter-tiary audience could be external stakeholders.
This part of the design process would also look at possiblereports (existing or new) in which this indicator would beincluded. The designer of an indicator should also consideraccess restrictions to this indicator. There might be reasons whythe access to certain indicators is restricted to individuals, groupsof people, departments, or outsiders.
Performance indicators 115
� Reporting frequency identifies how often this indicator isreported. If the indicator is to serve a decision-making purposewithin the organization, then the indicator needs to providetimely information. The reporting frequency can be differentfrom the measurement frequency. An indicator might be col-lected hourly, but then reported as part of a quarterly perform-ance meeting.
� Reporting formats identify how the data is best presented. Theyshould clarify whether the indicator is reported as, for example, anumber, a narrative, a table, a graph or a chart.The best results areusually achieved if performance is reported in a mix of numerical,graphical and narrative formats (see also section on ReportingPerformance Indicators). Considerations here also include thepresentation of a data series and past performance. A graph con-taining past performance might be very useful in order to analysetrends over time and this could also include targets and bench-marks. Increasingly too, organizations use traffic lights or speed-ometer dials to present performance data.
� Notifications/workflows identify proactive notifications andpossible workflows. Workflows are predefined and automatedbusiness processes in which documents, information or tasks arepassed from one person or group of persons to others.Notifications are predefined and automated messages and involvethe proactive push of performance data, messages or alarm notifications to predefined individuals or groups. For example,e-mail notifications or workflows could be automatically trig-gered if an indicator is updated or moves over a predefinedthreshold.
� Expiry/revision date – indicators are sometimes introduced for aspecific period of time only (e.g. for the duration of major projectsor to keep on eye on restructuring efforts). The common practiceis that a significant number of indicators are introduced once andcollected for ever because no one ever goes back and identifies theindicators that are not needed any more. Other obviously tempor-ary indicators are introduced without giving them an expirationdate; however, for those indicators a revision date should be set thatallows the designers to review the template and check whether itis still valid.
� Estimated costs – another aspect that should be considered is thecosts of introducing and maintaining a performance indicator.There is often an implicit assumption by many managers and meas-urement experts that creating and maintaining measurement sys-tems does not incur significant costs.40 However, on the contrary,
116 Managing performance in an enabled learning environment
Performance indicators 117
measurement is expensive, especially if the indicators are supposedto be relevant and meaningful to aid decision-making and learn-ing.41 Costs can include the administrative and/or outsourcing costsof collecting the data, as well as the efforts needed to analyse andreport on the performance.
� Confidence level – once the above aspects of an indicator havebeen addressed, it is time to think about the validity of the indica-tors.To what extent do the indicators enable us to assess the givenstrategic element? For financial performance, the confidence levelwould normally be high, since established tools are available tomeasure it. However, when we try to measure our intangibles, suchas organizational culture, the confidence level would necessarily godown a peg or two. The assessment of the confidence level is sub-jective but forces anyone who designs an indicator to think abouthow well an indicator is actually ‘measuring’ what it was that it setout to ‘measure’. Organizations have different preferences of howto express confidence levels; some use percentages (0–100%),others use grades (1–5; or low, medium, high), colour codes (e.g.red, amber, green), or symbols (such as smiley faces). In addition,it is suggested that a brief written comment is included to clarifythe level of confidence.
Reporting performance indicators
Performance indicators are rarely reported in a manner that gives people sufficient information about the indicator. Any ambiguity leadsto doubts which in turn hamper decision-making and learning. It istherefore important to provide a comprehensive picture of an indica-tor. The design template outlined in Figure 5.6, provides much of theinformation needed to improve the way performance is reported. Inorder to report performance comprehensively, the following informa-tion should be included:
� Name of the indicator (see section above)� Strategic element being assessed – what strategic element is being
assessed (see section above). Often the best way to do this is toprovide a picture of the value creation map and highlight the elem-ent that is being assessed.
� Purpose – why is the indicator being used (see section above)?� Confidence level – how confident are we that this is a ‘good’ or
valid indicator (see section above)?
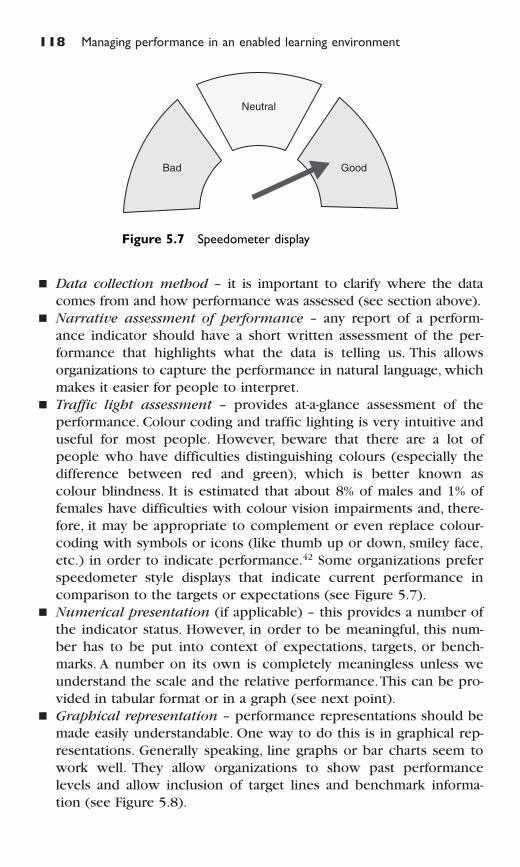
118 Managing performance in an enabled learning environment
� Data collection method – it is important to clarify where the datacomes from and how performance was assessed (see section above).
� Narrative assessment of performance – any report of a perform-ance indicator should have a short written assessment of the per-formance that highlights what the data is telling us. This allowsorganizations to capture the performance in natural language, whichmakes it easier for people to interpret.
� Traffic light assessment – provides at-a-glance assessment of theperformance. Colour coding and traffic lighting is very intuitive anduseful for most people. However, beware that there are a lot ofpeople who have difficulties distinguishing colours (especially thedifference between red and green), which is better known ascolour blindness. It is estimated that about 8% of males and 1% offemales have difficulties with colour vision impairments and, there-fore, it may be appropriate to complement or even replace colour-coding with symbols or icons (like thumb up or down, smiley face,etc.) in order to indicate performance.42 Some organizations preferspeedometer style displays that indicate current performance incomparison to the targets or expectations (see Figure 5.7).
� Numerical presentation (if applicable) – this provides a number ofthe indicator status. However, in order to be meaningful, this num-ber has to be put into context of expectations, targets, or bench-marks. A number on its own is completely meaningless unless weunderstand the scale and the relative performance.This can be pro-vided in tabular format or in a graph (see next point).
� Graphical representation – performance representations should bemade easily understandable. One way to do this is in graphical rep-resentations. Generally speaking, line graphs or bar charts seem towork well. They allow organizations to show past performance levels and allow inclusion of target lines and benchmark informa-tion (see Figure 5.8).
Bad
Neutral
Good
Figure 5.7 Speedometer display
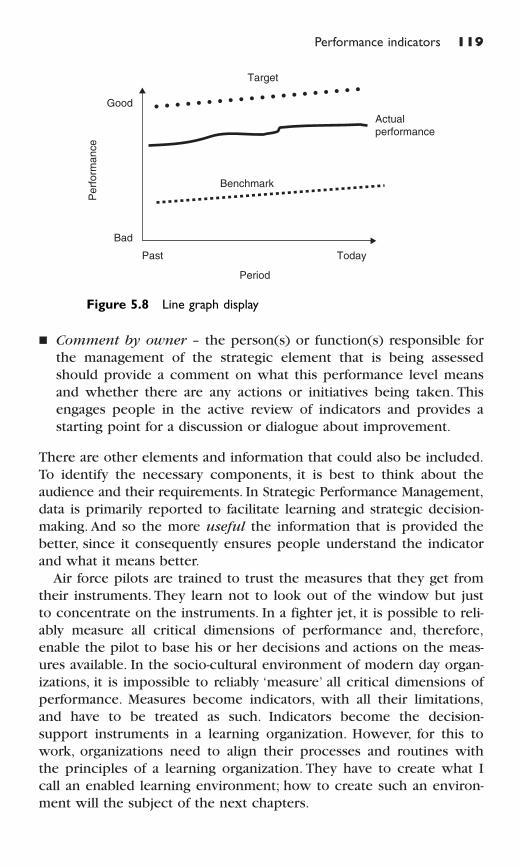
Performance indicators 119
� Comment by owner – the person(s) or function(s) responsible forthe management of the strategic element that is being assessedshould provide a comment on what this performance level meansand whether there are any actions or initiatives being taken. Thisengages people in the active review of indicators and provides astarting point for a discussion or dialogue about improvement.
There are other elements and information that could also be included.To identify the necessary components, it is best to think about theaudience and their requirements. In Strategic Performance Management,data is primarily reported to facilitate learning and strategic decision-making. And so the more useful the information that is provided thebetter, since it consequently ensures people understand the indicatorand what it means better.
Air force pilots are trained to trust the measures that they get fromtheir instruments. They learn not to look out of the window but justto concentrate on the instruments. In a fighter jet, it is possible to reli-ably measure all critical dimensions of performance and, therefore,enable the pilot to base his or her decisions and actions on the meas-ures available. In the socio-cultural environment of modern day organ-izations, it is impossible to reliably ‘measure’ all critical dimensions ofperformance. Measures become indicators, with all their limitations,and have to be treated as such. Indicators become the decision-support instruments in a learning organization. However, for this towork, organizations need to align their processes and routines withthe principles of a learning organization. They have to create what Icall an enabled learning environment; how to create such an environ-ment will the subject of the next chapters.
Past Today
Benchmark
Bad
GoodP
erf
orm
ance
Actualperformance
Target
Period
Figure 5.8 Line graph display
120 Managing performance in an enabled learning environment
References and endnotes
1 Quoted in Boyle, D. (2001). The Sum of Our Discontent: Why
Numbers Make Us Irrational.Texere: New York.2 Neely, A. (1998). Measuring Business Performance: Why, What
and How. Economist Books: London.3 Stein, R. E. (1997). The Theory of Constraints. Marcel Dekker Inc.:
New York.4 Meyer, M. W. (2002). Rethinking Performance Measurement –
Beyond the Balanced Scorecard. Cambridge University Press:Cambridge, p. 31.
5 This definition is based on the definition of motivational measure-ment by: Austin, R. D. (1996). Measuring and Managing Perform-
ance in Organizations. Dorset House Publishing: New York,p. 193.
6 Campbell, N. R. (1928). An Account of the Principles of Measure-
ment and Calculation. Longmans: London, p. 1.7 Caws, P. (1959). Definition and Measurement in Physics. In Measure-
ment: Definition and Theories (C. W. Churchman and P. Ratoosh,eds), pp. 3–17, John Wiley & Sons: New York.
8 Adams, C., Kennerley, M. and Neely, A. (2002). The Performance
Prism: The Scorecard for Measuring and Managing Business
Success. FT Prentice Hall: London.9 Mason, R. O. and Swanson, E. B. (1981). Measurement for Manage-
ment Decision: A Perspective. In Measurement for Management
Decision (R. O. Mason, Swanson, E. B.), Addison-Wesley: Reading,MA, pp. 10–25.
10 Ibid, Boyle, D. (2001), p. 30. (See note 1 above.)11 Blair, M. M. and Wallman, S. M. H. (2001). Unseen Wealth. Brookings
Institution Press: Boston, p. 15.12 From an interview with Daniel Yankelovich quoted in Adam Smith
[pseudonym of George J. W. Goodman] (1973). Supermoney.Michael Joseph: London, p. 286.
13 Porter, T. M. (1995). Trust in Numbers: The Pursuit of
Objectivity in Science and Public Life. Princeton University Press:Princeton.
14 Ibid, Boyle, D. (2001), p. 38. (See note 1 above.)15 See for example: Gooday, G. J. N. (2004). The Morals of Measure-
ment: Accuracy, Irony, and Trust in Late Victorian Electrical
Practice. Cambridge University Press: Cambridge; and Porter, T. M.(1995). Trust in Numbers: The Pursuit of Objectivity in Science
and Public Life. Princeton University Press: Princeton.
16 See: Austin, R. D. (1996). Measuring and Managing Performance
in Organizations. Dorset House Publishing: New York, p. 13.17 Sugarman, C. (1990). US Produce Standards Focus More on Appear-
ance Than Quality, The Pittsburgh Press,August 5, p. E1.18 See Torres, R.T., Preskill, H. S. and Piontek, M. E. (1996). Evaluation
Strategies for Communicating and Reporting: Enhancing
Learning in Organizations. Sage: Thousand Oaks, p. 2.19 Johnson, T. H. and Kaplan, R. S. (1987). Relevance Lost: The Rise
And The Fall Of Management Accounting. Harvard BusinessSchool Press: Boston, MA.
20 UBS Annual Review 2002, www.ubs.com (p. 25).21 For more information on the Agency Model see for example:
Ross, S. A. (1973). The Economic Theory of Agency: The Principal’sProblem. The American Economic Review, Vol. 63, No. 2,pp. 134–9; and Holström, B. (1977). On Incentives and Control in
Organizations (unpublished Ph.D. thesis), Stanford University,Stanford.
22 Meyer, M. W. (2002). Rethinking Performance Measurement –
Beyond the Balanced Scorecard. Cambridge University Press:Cambridge (page xxi).
23 The classic example is referral interview in a government agency,here the number of interviews is measured whereas the quality ofreferrals is not. See: Blau, P. M. (1963). The Dynamics of Bureau-
cracy: A Study of Interpersonal Relations in Two Government
Agencies. University of Chicago Press: Chicago.24 This figure was inspired by the cases and diagrams used by Austin,
R. D. (1996), Ibid (see note 5 above).25 Ridgway, V. F. (1956). Dysfunctional Consequences of Performance
Measurements. Administrative Science Quarterly, Vol. 1, No. 2,pp. 240–7.
26 Meyer, M. W. (2002). Rethinking Performance Measurement –
Beyond the Balanced Scorecard. Cambridge University Press:Cambridge, p. 8.
27 Ehin, C. (2000). Unleashing Intellectual Capital. ButterworthHeinemann: Boston, p. 138.
28 Ibid,Austin, R. D. (1996). (See note 5 above).29 Meyer, M. W. (2002). Rethinking Performance Measurement –
Beyond the Balanced Scorecard. Cambridge University Press:Cambridge, p. 2.
30 Quoted in Boyle, D. (2001), Ibid, p. 29. (See note 1 above.)31 See for example: Ketokivi, M. A. and Schroeder, R. G. (2004).
Perceptional Measures of Performance: Fact or Fiction? Journal of
Performance indicators 121
122 Managing performance in an enabled learning environment
Operations Management,Vol. 22, No. 3, pp. 247–64; or Boyd, B. K.,Dess, G. G. and Rasheed, A. M. A. (1993). Divergence BetweenArchival and Perceptional Measures of the Environment: Causesand Consequences. Academy of Management Review, Vol. 18,No. 2, pp. 204–26; or Ramanujam, V. and Venkatraman, N. (1987).Measurement of Business Economic Performance: An Examinationof Method Convergence. Journal of Management, Vol. 13, No. 1,pp. 109–12.
32 For more information see for example: Dillman, D. A. (1999). Mail
and Internet Surveys: The Tailored Design Method. Wiley:New York.
33 Preskill, H. and Russ-Eft, D. (2001). Evaluation in Organization –
A Systematic Approach to Enhancing Learning, Performance,
and Change. Perseus: Cambridge, MA, p. 200.34 See for example: Yin, K. (2003). Case Study Research. Design and
Methods (Applied Social Research Methods Series, Vol. 5). Sage:Newbury Park, CA.
35 Preskill, H. and Russ-Eft, D. (2001). Evaluation in Organization –
A Systematic Approach to Enhancing Learning, Performance,
and Change. Perseus: Cambridge, MA.36 Denzin, N. K. and Lincoln, Y. S. (eds) (2005). The Sage Handbook
of Qualitative Research, 3rd edition. Sage: Thousand Oaks.37 See for example: Mangel, M. and Samaniego, F. J. (1984). Abraham
Wald’s Work on Aircraft Survivability. Journal of American Statistical
Association, June, pp. 259–67.38 The majority of the thinking behind this section is credited to the
work conducted by my colleagues at Cranfield School of Manage-ment and Cambridge University. For more details see: Bourne, M.,Neely, A., Mills, J., Platts, K. and Richards, H. (2002). Getting the
Measures of Your Business. Cambridge University Press: Cambridge,p. 69; or Adams, C., Kennerley, M. and Neely, A. (2002). The
Performance Prism: The Scorecard for Measuring and Managing
Business Success. FT Prentice Hall: London, p. 34; or Bourne, M. C.S., Mills, J. F., Neely, A.D., Platts, K. W. W. and Richards, H. (1997).Designing Performance Measures: a Structured Approach. Inter-
national Journal of Operations & Production Management, Vol.17, No. 11–12, p. 1131.
39 Preskill, H. and Russ-Eft, D. (2001). Evaluation in Organization –
A Systematic Approach to Enhancing Learning, Performance,
and Change. Perseus: Cambridge, MA, p. 178.40 Ibid,Austin, R. D. (1996), p. 66. (See note 5 above.)

41 Gray, D. J. (2005). A Multi-Method Investigation into the Costs and
into the Benefits of Measuring Intellectual Capital Assets (unpub-lished Ph.D. thesis). Cranfield School of Management: Cranfield.
42 For more information see Prevent Blindness America: http//www.preventblindness.org
Performance indicators 123
6
Creating an enabled
learning environment
In today’s fast-moving global environment, organizations are forced tocontinuously innovate their products, services and processes to meetconstantly changing external demands. In order to innovate, improveand refine, organizations need to learn. Organizational learning occurswhen individuals inquire on the organization’s behalf.1 Creating anenabled learning environment forms the ‘space’ or ‘social context’ inwhich all individuals gain strategic insights, which in turn allows themto challenge strategic assumptions, refine strategic thinking, make betterdecisions and learn. This chapter focuses on how to create an enabledlearning environment. Questions addressed in this chapter include:
� What is an enabled learning environment?� How can we create an enabled learning environment?� How can we create the right social context for successful Strategic
Performance Management?� How can we align the performance review processes?� How have organizations created an enabled learning environment
in practice?
The previous chapters outlined how organizations can define and articu-late their strategy in value creation maps and value creation narratives,and how this strategic understanding can then be used to guide thedevelopment of meaningful performance indicators. The chaptershave therefore addressed how organizations can avoid the ‘strategytrap’ and ‘measurement trap’ (as discussed in the introduction to thisbook). Here, I will look at ways of creating an environment in which
Creating an enabled learning environment 125
everyone in the organization uses their strategic understanding and thecorresponding performance indicators in order to improve and learn.An enabled learning environment is essential if organizations want toavoid the ‘management trap’.
What is an enabled learning environment?
Most theorists agree that organizational learning takes place when indi-viduals and teams engage in dialogue, reflection, asking questions, andidentifying and challenging values, beliefs, and assumptions.2 An enabledlearning environment is an organizational environment in which allemployees are actively seeking new strategic insights, which are basedon their understanding of strategy and the performance indicators col-lected, to allow them to challenge strategic assumptions, refine stra-tegic thinking, to make better decisions and to learn.The word ‘enabled’stresses the fact that employees are also enabled or empowered to usestrategic insights. Having insights about how to improve things withoutthe authority to do something about it, is often a source of employeefrustration. In an enabled learning environment, the value creationmap and the performance indicators become the means for providinginformation for learning, decision-making and action.
Chris Argyris, professor at Harvard Business School, defines learningas occurring under two conditions. First, when an organization achieveswhat it intended to achieve and there is a match between the inten-tion and outcome. Second, when an organization identifies a mismatchbetween the intention and outcome and this mismatch is corrected,so that a mismatch is turned into a match.3 In order to learn, organiza-tions therefore require an understanding of their intentions and a wayto test the match or mismatch between their intended and actual per-formance. The value creation map and the value creation narrativemake the organizational intentions explicit.They represent the assumedbusiness model of how the organization is intending to create value.The performance indicators enable organizations to then test theseassumptions. This allows individuals in the organization to reflect onthe assumptions, learn from the insights, and improve their decision-making.
It is possible to distinguish between two types of organizational learn-ing: single-loop learning and double-loop learning.4 Single-loop learningtakes place when, for example, an assumed business model is tested,and then insights, decisions, and actions are derived from it. Double-loop learning takes place when, for example, an assumed businessmodel is tested and the insights lead to questioning of the underlying
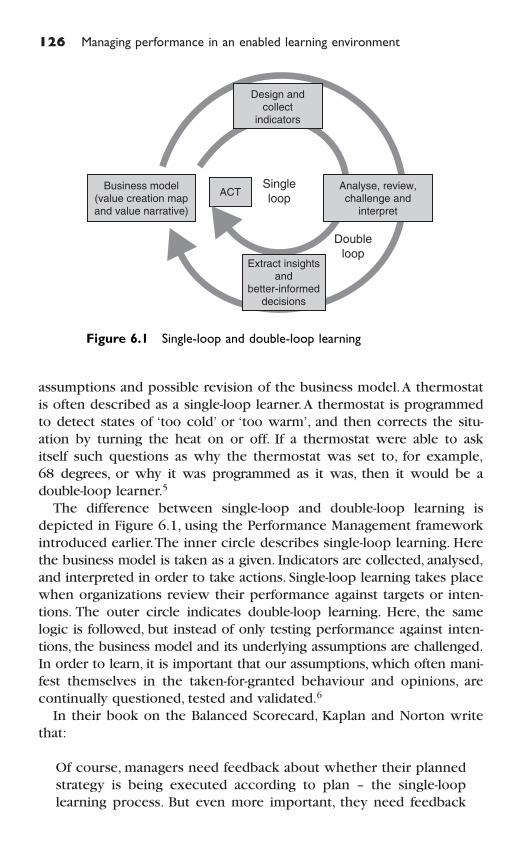
126 Managing performance in an enabled learning environment
assumptions and possible revision of the business model.A thermostatis often described as a single-loop learner.A thermostat is programmedto detect states of ‘too cold’ or ‘too warm’, and then corrects the situ-ation by turning the heat on or off. If a thermostat were able to askitself such questions as why the thermostat was set to, for example,68 degrees, or why it was programmed as it was, then it would be adouble-loop learner.5
The difference between single-loop and double-loop learning isdepicted in Figure 6.1, using the Performance Management frameworkintroduced earlier.The inner circle describes single-loop learning. Herethe business model is taken as a given. Indicators are collected, analysed,and interpreted in order to take actions. Single-loop learning takes placewhen organizations review their performance against targets or inten-tions. The outer circle indicates double-loop learning. Here, the samelogic is followed, but instead of only testing performance against inten-tions, the business model and its underlying assumptions are challenged.In order to learn, it is important that our assumptions, which often mani-fest themselves in the taken-for-granted behaviour and opinions, arecontinually questioned, tested and validated.6
In their book on the Balanced Scorecard, Kaplan and Norton writethat:
Of course, managers need feedback about whether their plannedstrategy is being executed according to plan – the single-looplearning process. But even more important, they need feedback
ACTBusiness model
(value creation mapand value narrative)
Single
loop
Double
loopExtract insights
andbetter-informed
decisions
Design andcollect
indicators
Analyse, review,challenge and
interpret
Figure 6.1 Single-loop and double-loop learning
Creating an enabled learning environment 127
about whether the planned strategy remains a viable and suc-cessful strategy – the double-loop learning process.7
I go even further than that and say that it is not just the managerswho need to question the underlying assumptions, it is everyone inthe organization.
In order for any learning to take place, organizations need to createthe right social context. What I call an ‘enabled learning environment’is diametrically opposed to the traditional command-and-control envir-onment. In the previous chapter, I have outlined the limitations ofmeasurement as a reason why the command-and-control environmentwill create dysfunctional behaviour.There is another important reasonwhy the command-and-control environment is no longer appropriatein today’s business environment: because it inhibits learning. I will nowtake you through a closer look at some of the barriers to an enabledlearning environment.
Barriers to an enabled learning environment
Our organizational structures are one of the key barriers to an enabledlearning environment. Too many firms still operate the command-and-control model in which a blame culture exists which brings outthe worst in people. A hierarchical command-and-control culture cre-ates fear, distrust, self-centredness, and protectionism. In such an envir-onment, no one is willing to openly and voluntarily share their insightsand knowledge. There is no incentive for collaboratively exploringperformance improvement and, therefore, real innovations are rare.
Another structural barrier is the way most performance review meet-ings are conducted.As the name ‘performance review meeting’ suggests,most of these are focused on past performance; often with a heavybias towards financial indicators, they tend to be centred on budgets.One of the key questions is whether the budget was achieved in the lastquarter or not. Even worse, much time is wasted presenting excusesabout why the performance targets weren’t met, often shifting blamefrom one individual or department to the other. Little time is spentthinking about the future and how the performance drivers have tobe managed to improve performance in the next quarter.
The way in which most organizations communicate and report per-formance is not conducive to learning. Organizations today seem to havea tendency to produce cryptic spreadsheets containing performancedata, which are then distributed as e-mail attachments.The fact that mostpeople will only have one quick glance at the data, and then quickly
128 Managing performance in an enabled learning environment
decide that they can’t really make sense of it, is rarely taken intoaccount. If organizations are unable to engage people in a dialogueand make them reflect on performance, no learning will ever take place.
Another barrier is more personal and related to our human nature.In their professional environment, people are not very good at admittingfailure and are, therefore, intrinsically unable to learn from their mis-takes. We seem to have universal human tendencies to avoid embar-rassment or threat, and we don’t like feeling vulnerable or incompetent.In his Harvard Business Review article, entitled ‘Teaching Smart
People How To Learn’, Chris Argyris explains that failure producesdefensive reasoning which can block learning, even if people’s com-mitment to learning is high. He says:
Put simply, because many professionals are almost always success-ful at what they do, they rarely experience failure. And becausethey have rarely failed, they have never learned how to learnfrom failure. So whenever their single-loop learning strategies gowrong, they become defensive, screen out criticism, and put the‘blame’ on anyone and everyone but themselves. In short, theirability to learn shuts down precisely at the moment they need itthe most.8
Next I will discuss how organizations can create an enabled learningenvironment and address some of the barriers outlined here.
Creating an enabled learning environment
In a subsequent HBR article, Argyris says ‘Most executives understandthat tougher competition will require more effective learning, broaderempowerment, and greater commitment from everyone in the com-pany.’9 In order to make learning more effective, organizations need tocreate an enabled learning environment. However, there is no easystep-by-step process that can be followed to create an enabled learningenvironment. And it takes time too. Creating the right social context,communicating performance more effectively, and aligning organiza-tional processes and routines are all major components.Where to startis a little bit of a ‘chicken and egg’ question – it’s hard to say whichmust come first. Changing the social context helps to change the rou-tines and practices, and changing the way we do things has an impacton the social context. I will now go on to discuss first how organiza-tions can create the right social context before I suggest ways to alignperformance review meetings.
Creating an enabled learning environment 129
Creating the right social context
True Strategic Performance Management does not simply emerge; itrequires a supportive organizational or social context.This social con-text needs to emphasize self-directed learning, personal commitmentto performance, mutual support, and trust. Different names and descrip-tions have been given to this social context: Janine Nahapiet fromOxford University and the late Sumantra Ghoshal from London BusinessSchool talk about ‘social capital’,10 whereas Ikujiro Nonaka and NoboruKonno use the Japanese word ‘Ba’11 to describe the physical, virtual, ormental space in which learning takes place.
Research shows that there is a big human and social element thatdetermines whether Performance Management will be successful ornot.12 Charles Ehin, of the Gore School of Business, presents fourinterwoven tenets for fostering positive social connections, voluntarycollaboration and learning; and these seem to be a good starting pointfor the creation of what I call the ‘right social context’.13 Here I out-line my interpretations of these tenets:
� Line-of-sight relationships – they allow us to create trust and toshare tacit understanding. Trust is one of the key components ofthe right social context. Humans are physiologically designed to besocial creatures.
‘Thus, an organization where people are unable to have periodicface-to-face contact soon becomes dysfunctional because its memberscannot develop a trusting relationship.’14
Tacit knowledge and routines, as opposed to explicit knowledge,are things we find hard to write down or explain in descriptions.Examples of tacit knowledge include the ability to ride a bike or howto swim – as well as aspects of organizational culture and ‘the waywe do things here’. It is difficult, if not impossible, to sit down andwrite a manual of how to ride a bike and then give it to someone andexpect them to go off and be able to ride a bike.Tacit knowledge isbest shared by observation, imitation and supervised practice, forwhich line-of-sight relationships are required.15
� Sense of community – a community is a social entity that servesboth its members individually and the community as a whole.Underpinned by effective line-of-sight relationships, it creates a basefor a group of people with shared interests, where compassion,empathy, and trust pervade.16 It gives individuals a sense of belong-ing, which fosters commitment, collaboration, and mutual respect.
� Common purpose – this is about meaning and an implicit agree-ment about direction. Can individuals associate themselves with the
130 Managing performance in an enabled learning environment
aspirations and perspectives of the organization or the team? Commonpurpose can often be linked to the boundary conditions of an organ-ization (see Chapter 1). Genuine commitment to the performance ofan organization simply does not happen unless individuals feel thatthey are empowered and respected partners on a joint journey.
� Visualizing wholes – this is about our capabilities to picture thewhole and engage in ‘systems thinking’. Instead of seeing individualparts of an organization, separate silos and departments with oftenopposing interests, individuals in organizations are able to see therelationships between the different parts and how they integrate tocreate value as a whole.
Creating the right social context is not about esoteric communities inwhich everyone happily does whatever they want. It is about creatinga performance-driven culture where trust, self-directed learning, mutualrespect and support lead to personal commitment to continuous per-formance improvement. The acts of developing a value creation mapand a value creation narrative (see Chapter 4) and then, where appro-priate, cascading it throughout the organization to make it relevant tolocal operating centres, help to visualize the whole and contribute to the development of a common purpose and a sense of community.This is especially so if organizations begin by engaging everyone in thedevelopment process. However, the softer dimensions around humanrelationships and trust cannot simply be implemented by using a setof tools.They will have to be cultivated over time. One way to do thisis to change the way performance is reviewed in organizations, whichI will address in the following section.
Aligning performance review meetings
In my experience, the way performance is reviewed in organizationscan be one of the most powerful barriers to Strategic PerformanceManagement. Below I outline three different scenarios of meetings usedto review organizational performance (see also Figure 6.2).Which onemost resembles the process used in your organization?
� ‘On trial’ reviews: this resembles a court of law, whereby individualsare required to present their ‘numbers’ and explain to ‘the boss’ andthe other individuals present why some are good and, particularly,why some are bad. It is a tense atmosphere of ‘trial by presenta-tion’. If any executive cannot deliver a glossy PowerPoint presentationand, most importantly, answer penetrating questions about their
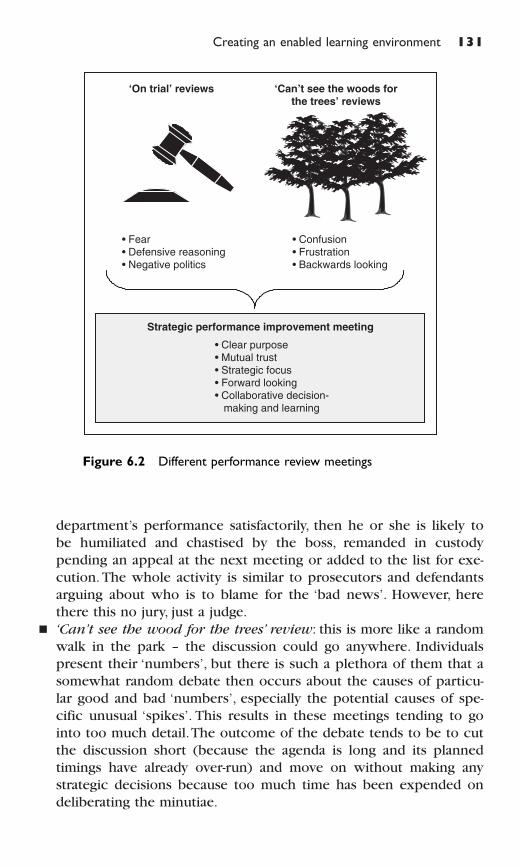
Creating an enabled learning environment 131
department’s performance satisfactorily, then he or she is likely tobe humiliated and chastised by the boss, remanded in custodypending an appeal at the next meeting or added to the list for exe-cution. The whole activity is similar to prosecutors and defendantsarguing about who is to blame for the ‘bad news’. However, herethere this no jury, just a judge.
� ‘Can’t see the wood for the trees’ review: this is more like a randomwalk in the park – the discussion could go anywhere. Individualspresent their ‘numbers’, but there is such a plethora of them that asomewhat random debate then occurs about the causes of particu-lar good and bad ‘numbers’, especially the potential causes of spe-cific unusual ‘spikes’. This results in these meetings tending to gointo too much detail.The outcome of the debate tends to be to cutthe discussion short (because the agenda is long and its plannedtimings have already over-run) and move on without making anystrategic decisions because too much time has been expended ondeliberating the minutiae.
‘On trial’ reviews ‘Can’t see the woods forthe trees’ reviews
Strategic performance improvement meeting
• Fear• Defensive reasoning• Negative politics
• Confusion• Frustration• Backwards looking
• Clear purpose• Mutual trust• Strategic focus• Forward looking• Collaborative decision- making and learning
Figure 6.2 Different performance review meetings
132 Managing performance in an enabled learning environment
The issues that are being discussed are not put into the contextof strategic intentions. Some strategic considerations might get dis-cussed, but they seldom seem to get resolved with practical actionsthat are agreed. One manager compared this kind of meeting to driving a car where you have lots of data and information from the dashboard, but no idea where you are or where you areheading.
� ‘Strategic performance improvement’ meeting: participants knowexactly what the agenda and discussion will be about and how thedifferent elements being discussed fit into the strategic plan of theorganization. Performance data (quantitative and qualitative) hasbeen circulated in advance and individuals present only the storybehind the data that is relevant to the planned discussion. Businessanalysts attend the meeting and provide feedback and commentsabout their work, as well as about the relevance and confidencelevels of the performance data. Leaders then present recommenda-tions about what actions should be taken based on this analysis.Most importantly, the whole emphasis of the meeting is about dia-logue and making collective decisions about what strategic actionsneed to be taken either to explore opportunities or deflect threats.The emphasis is on strategic decision-making and using both single-and double-loop learning to improve future performance.
Obviously there is territory in between these three extremes, but I amcertain that many employees in many organizations will recognizesome of the symptoms of the ‘on trial’ and ‘can’t see the wood for thetrees’ review meetings. If so, I believe they should reconsider the waythey approach this vital process and, therefore, suggest that they needto have a debate among themselves about how they could movetowards Strategic Performance Improvement Meetings. For a start, thename ‘review’ meeting automatically focuses the attention on past per-formance. Whereas it is important to look at past trends and see howthis might give us insights into future performance, many perform-ance ‘review’ meetings only look at the past and are too concernedabout finding excuses and shifting blame instead of concentrating onfuture performance and decision-making.
I have been a witness to several meetings that typify ‘on trial’ reviewsand each time I have been appalled by the tensions and dysfunc-tional behaviour that this type of review invokes. Clearly, there is nospirit of co-operation between individuals simply because this is astruggle for survival – each person or department pitted against theothers. This way of conducting performance reviews is very closelylinked to the aim of ‘controlling people’s behaviour’, discussed in the
Creating an enabled learning environment 133
previous chapter. ‘On trial’ reviews destroy any social context that isconducive to collaboration and learning, and instead bring out anarray of self-centred characteristics, negative politics, and a focus oncompliance.
My colleagues at the Centre of Business Performance – Andy Neely,Chris Adams and Mike Kennerley – describe in their book17, The
Performance Prism, an excellent actual example of a (predominantly‘can’t see the wood for the trees’) dysfunctional Strategic PerformanceReview meeting that I believe illustrates very clearly a process that isnot uncommon in boardrooms today. It is reproduced in an editedversion below.
Example of a dysfunctional Strategic Performance
Review process
The executive team of a leading logistics company would meet on amonthly basis to review performance. They would examine perform-ance in terms of its ability to achieve ‘notional result’, the company’sinternal measure of profitability. They would also review the oper-ational performance. One of the problems with the latter was that theamount of data and number of definitions of operational performancewere vast. For this company, operations could be reviewed in terms ofshipments (either by weight or number), shipments delivered (on time,to the right destination, in one piece), shipments collected (before aspecified time or from a specified location), packages lost (or re-routed),and so on.The volume and variety of data meant that the executive teamcould easily get engrossed in incredibly detailed reviews of specificareas of performance. While interesting in themselves, such detailedreviews of specific performance areas are not useful if the strategiccontext of these areas is forgotten.
The executive team clearly recognized this issue and began to ques-tion whether the structure and focus of their performance reviewswere appropriate for their business.They began to ask themselves: howshould we structure and coordinate performance reviews in a businessof the company’s size and complexity in the twenty-first century? Fartoo often organizations seem to allow performance reviews to evolvehaphazardly. Because specific measures are available, they are put onthe agenda. When a particular problem occurs, a new performanceindicator is developed, implemented and added to the agenda. Fifteenyears later that indicator is still on the agenda, even though the originalproblem is lost in the mists of time and the root causes of it havelong ago been eliminated.A director in another organization explained
134 Managing performance in an enabled learning environment
to me why it was good for him to have a lot of indicators. He said ‘Byhaving so many key performance indicators, I can always find at leastone that is moving in the right direction!’.
In this logistics company all of these factors added up.The perform-ance reviews had begun to lose their strategic focus, structure andpurpose.They provoked interesting discussions amongst the executiveteam, but often the same discussion took place month after monthafter month. Parodying this, one director commented how the per-formance review process would encourage him and his colleagues tobring massive spreadsheets to the meetings. These would be copiedonto acetates and then, in the meeting, they would pick specific cellson the spreadsheet more or less at random to talk about during theirrespective presentations. Often their opening statements would beprefaced with comments such as, ‘Oh, look at this. This is interesting.It is down 15% from last month’. The executive team would thenspend 15 minutes debating why the number in cell C72 was down by15%, before the director concerned would spot another interestingnumber in another interesting cell on the spreadsheet and so provokeanother highly therapeutic, but ultimately futile discussion. Anotherdirector described this as ‘numerical crosswords’.
The point was that the performance reviews had lost any strategicpurpose and any clarity was destroyed by the random data that wasreviewed. The executive team was getting so dragged into the minu-tiae of the data that they were losing sight of the big picture.Why so?It was not the fault of the people, as such. It was actually the fault ofthe process. The aims and objectives of the performance reviewprocess were not clearly articulated or widely understood. Withoutclear structure and purpose, the performance review had drifted andevolved into a process that simply encouraged the executive team todebate the minutiae.
Creating Productive Strategic Performance
Improvement Meetings
Below I outline how organizations can get away from performancereviews that create dysfunctional behaviours and frustrations, andhow they can create what I call a ‘Productive Strategic PerformanceImprovement Meeting’.
I have created a list of what I believe are the ten most importantaspects of successful Strategic Performance Improvement Meetings. Ihave divided this list into two parts: ‘Before the meeting’ and ‘At themeeting’ (see Figure 6.3).
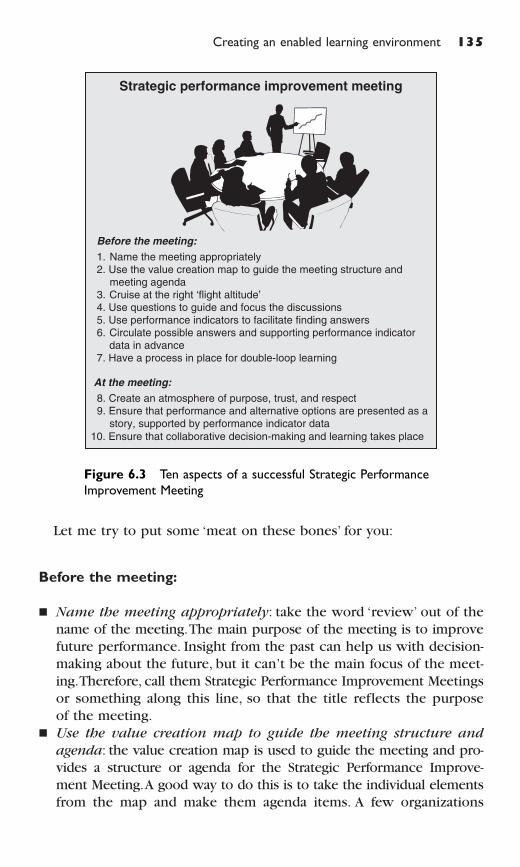
Creating an enabled learning environment 135
Let me try to put some ‘meat on these bones’ for you:
Before the meeting:
� Name the meeting appropriately: take the word ‘review’ out of thename of the meeting.The main purpose of the meeting is to improvefuture performance. Insight from the past can help us with decision-making about the future, but it can’t be the main focus of the meet-ing.Therefore, call them Strategic Performance Improvement Meetingsor something along this line, so that the title reflects the purposeof the meeting.
� Use the value creation map to guide the meeting structure and
agenda: the value creation map is used to guide the meeting and pro-vides a structure or agenda for the Strategic Performance Improve-ment Meeting.A good way to do this is to take the individual elementsfrom the map and make them agenda items. A few organizations
Strategic performance improvement meeting
Before the meeting:
1. Name the meeting appropriately2. Use the value creation map to guide the meeting structure and meeting agenda3. Cruise at the right ‘flight altitude’4. Use questions to guide and focus the discussions5. Use performance indicators to facilitate finding answers6. Circulate possible answers and supporting performance indicator data in advance7. Have a process in place for double-loop learning
At the meeting:
8. Create an atmosphere of purpose, trust, and respect9. Ensure that performance and alternative options are presented as a story, supported by performance indicator data
10. Ensure that collaborative decision-making and learning takes place
Figure 6.3 Ten aspects of a successful Strategic Performance
Improvement Meeting
136 Managing performance in an enabled learning environment
I have worked with have taken the key elements of their value cre-ation map and divided their Strategic Performance ImprovementMeeting into a set of sub-meetings, each of which then addresses thedifferent elements of their value creation map. They might spendthe morning discussing the output deliverables, e.g. the latest financialperformance and customer satisfaction.Then a subsequent meetingmight focus on, for example, ‘building better relationships with keycustomers’, another key element on their value creation map. In thisway, organizations ensure that all strategic elements are covered.
� Cruise at the right ‘flight altitude’: for these meetings it is import-ant that they take place at the right ‘flight altitude’;18. By this I meanthat the elements, and especially the information and data discussed,must be relevant and appropriate for the individuals in the meeting.The executive board should take the corporate or overall value cre-ation map to guide their meetings, departments would use their cas-caded value creation map, and so on (see also the section ‘Cascadingvalue creation maps in Chapter 4). In order to be actionable, thecontent and information discussed has to be relevant and meaning-ful to the purpose of each meeting and its participants. It simplywouldn’t be right if executive board members were to review per-formance at a detailed operational level (unless some key aspecthad been referred up to them by an operational team meeting for adecision that it was not able to make itself). Neither would it makesense for operational teams to review the strategic elements of thecorporation (unless they had some exceptional reason to do so, whichcan occasionally occur).
� Use questions to guide and focus the discussions: design a set ofquestions you want to answer during the meeting.Asking questionsin an inquiring way develops a spirit of curiosity that serves as acatalyst for learning.19 If one of the elements on the value creationmap and agenda is, for example, ‘reputation’ or ‘external relation-ships’, then the questions could for instance be: ‘Is our reputationincreasing?’; ‘Are we moving towards the reputation we want?’; ‘Arewe building the right relationships?’; ‘Are our relationships asstrong as we want them to be?’. The questions can then becomethe agenda items or even headings for sub-meetings.
� Use performance indicators to facilitate finding answers: the indi-viduals, or group of individuals, responsible for the different stra-tegic elements take responsibility for analysing the performance dataprior to the meeting with the aim of answering the posed ques-tion(s). The indicators that were developed for the different elem-ents of the value creation map are used to develop answers to thequestions posed for the different strategic elements. Data analysts
work closely with leaders who are seeking answers to their per-formance questions. The job of the analysts is to produce relevantanalysis of the available data so that these leaders can present theresults supported by the information derived from the performanceindicators.Analysts also help with the presentation of the data, find-ing the most appropriate way of visualizing indicator data and per-formance. In many cases it might be impossible to come up with aclear answer based on the data; in those cases a selected set ofalternative options should be produced.
� Circulate answers and supporting performance indicator data in
advance: the answers or a set of alternative options, together withthe essential indicators and performance data are circulated inadvance of the meeting.The latter should be the minimum standard;submission of some alternative options can be helpful to directingpre-meeting thought processes for discussion, but some of theanswers might have to wait until the meeting (where there can bea relevant and proper debate about them). This allows people toreflect on performance. Reflection, which is an important compon-ent of learning, often takes place in between meetings when wehave a minute to ourselves, or when we go for a walk, stare out ofthe window, or wash the dishes.20
� Have a process in place for double-loop learning: to avoid thetrap of discussing the existing elements of the value creation mapwithout ever questioning the underlying map itself, a strategicreview meeting is scheduled. How frequently these strategic reviewstake place depends on the speed of change in the industry (see thesection ‘How to construct a value creation map’ in Chapter 4); inmy view they should be scheduled at least once annually.
At the meeting:
� Create an atmosphere of purpose, trust, and respect: the atmospherein these meetings is purposeful but relaxed and friendly. Mutual trust,respect and support lead to personal commitment, joint decision-making, and learning. Instead of a blame culture, the focus is onfuture performance, dialogue, decision-making, and actions. A chair-man ensures that the agenda items are fully discussed and that anydialogue is constructive and aimed at improving future performance.Dialogue is an enabler for learning.
Through dialogue, individuals seek to inquire, share meanings,understand complex issues, and uncover assumptions. In other
Creating an enabled learning environment 137
138 Managing performance in an enabled learning environment
words, dialogue is what facilitates evaluative inquiry learningprocesses of reflection, asking questions, and identifying and clari-fying values, beliefs, assumptions, and knowledge.21
Dialogue, as opposed to discussion, has the goal of understanding,not competition.22 Dialogue requires the suspension of defensive rea-soning and is about learning for change. It empowers everyone toshare their thoughts and be heard, in order to reach joint conclusions.
� Ensure that performance and alternative options are presented
in a story, supported by performance indicator data: the meetingstarts with a look at the value creation map and it is highlightedwhere the strategic element that is being discussed fits into the strat-egy of the organization. Presenters come to the Strategic PerformanceImprovement Meeting with possible answers to the questions onthe agenda and (a set of alternative) proposals for acting, based onthe indicator data they have collected and analysed. Performance ispresented as a cohesive ‘story’ and data from the performance indi-cators is used to support these ‘stories’. Performance indicator datawill usually be presented in graphical form and the analysts whohelped to analyse the data attend the review meetings.
Each ‘story’ tells participants about where the organization is suc-ceeding and where it is failing in its endeavours to achieve its stra-tegic goals. It is accepted and expected that presenters report onissues where the organization has underperformed and highlight pos-sible shortcomings and problems. The chairperson for the meetingensures that any story will contain a mix of good and bad news,since the point of the meeting is to decide on the implications andto make decisions about future actions. In order to do this it is import-ant to assess performance in the context of the value creation map.
� Ensure that collaborative decision-making and learning takes
place: the implications of the stories and proposals are openly dis-cussed and the performance indicator data is used to evaluate dif-ferent alternatives. For this it is important that the validity andconfidence level of the various indicators is understood (see alsothe section ‘Designing a performance indicator’ in Chapter 5). Herethe role of the performance analyst is critical, as he or she can answerquestions about data collection methods, data analysis, possiblebias, and overall validity of the data. The indicator data is thereforeassessed and put into the strategic context of the organization.Thisfacilitates a better-informed debate and enables collaborative decision-making and mutual agreement on next steps and actions. In thiskind of environment it is acceptable to say ‘I don’t know the answer’,instead of finding any answer for the sake of it. Sometimes it is best
to have an open discussion about possible answers or to decide tocollect more data. Actions are agreed on, captured in the minutes,and then followed up at the next meeting.
The ten steps outlined here provide the ingredients for successfulPerformance Improvement Meetings in an enabled learning environ-ment. It will, however, take time and efforts by everyone involved tomake them work. Next I will share how Fujitsu was able to create anenabled learning environment as part of its Strategic PerformanceManagement initiative.
An enabled learning environment in practice:
the case of Fujitsu Services23
Fujitsu Services is one of the leading IT services companies in Europe,the Middle East and Africa. It has an annual turnover of £1.74 billion,employs 14 500 people and operates in over 20 countries. It designs,builds and operates IT systems and services for customers in thefinancial services, telecommunications, retail, utilities and governmentmarkets. Its core strength is the delivery of IT infrastructure manage-ment and outsourcing across desktop, networking and data centreenvironments, together with a full range of related services, from infra-structure consulting through to integration and deployment.
In Fujitsu Services, the helpdesks provide a critical function. Thesehelpdesk call centres represent an integral part of service delivery andthe primary point of contact for customers. If you are a customer thathas outsourced their IT infrastructure management to Fujitsu Services,the helpdesk would be your point of contact if anything goes wrongor if you experience any problems with your computer hard- or soft-ware. Helpdesk agents can then either solve the problem or pass thework on, e.g. to an engineer who then comes out and fixes the prob-lem. It is often argued how call centres are changing the way com-panies communicate with customers and that they are a strategic assetin delivering exceptional service quality. Many organizations believe theyare using their call centres to differentiate their product or service offer-ing, to build and maintain customer relationships, and drive customersatisfaction.
The reality, however, is often very different. I am sure most of youcan relate to the aggravation that is often caused when customers tryto contact call centres or helpdesks. It often starts with a finger balletto communicate with the interactive voice response (IVR) system, thenendless queuing listening to the same irritating piece of music, and
Creating an enabled learning environment 139
when we finally speak to someone they can sometimes be abrupt andunhelpful. Instead of treating call centres as service providers, they areoften treated as unnecessary cost centres that have to be squeezed forefficiency. In many cases this is due to outsourcing service level agree-ments, which specify performance targets of everything that is easy tomeasure such as queuing time, the number of calls taken, or averagecall duration.
In 1999, there was a growing realization at Fujitsu that the trad-itional approach to Performance Management was failing customers.Operating in the IT outsourcing sector, Fujitsu found it almost impos-sible to differentiate itself in a very aggressive marketplace. A func-tional focus resulted in a lack of cohesion and fragmentation. Notdissimilar to other call centres, many client accounts were operatingat contractual obligation levels and no higher, while 15% were at criticallevels of dissatisfaction and were unlikely to be renewed. Furthermore,the turnover of front-line call centre staff was 42%.
The message was stark for Fujitsu – it had to rethink its StrategicPerformance Management approach if it wanted to stand out from thecrowd. What Fujitsu found was that the traditional way of measuringand managing performance stood in the way of a new strategicapproach towards Performance Management. Fujitsu changed both theway that it approached Performance Measurement and PerformanceManagement. In addition, Fujitsu saw this as an opportunity not onlyto redesign the organization but also to change the way Fujitsuworked with its customers. It was clear that customer satisfaction hadto be a given. However, what Fujitsu wanted to change was its rela-tionship with its customers – from service level contracts to a part-nership model where customer success became a new goal. For this,it was critical to understand what was creating value for customersand what was not.
Fujitsu recognized that information about what was creating valuefor its customers had to come from its front-line agents, since they arethe ones speaking to customers all day long. However, the way per-formance was measured – with a strong focus on efficiency measures –prevented call centre agents from spending time ‘listening’ to customers.All focus was on speed and numbers.
The first step Fujitsu took was to remove these measures fromfront-line employees to avoid the ‘measurement trap’ and prevent dys-functional behaviour. Call duration and number of calls are still import-ant indicators for managers to ensure the correct levels of resourcing,but they are the wrong measures to influence the behaviour of front-line agents. Fujitsu realized that if front-line agents are measured andrewarded on overall service delivery, they are the ones who can help
140 Managing performance in an enabled learning environment
Creating an enabled learning environment 141
to improve exactly this. They can provide critical information aboutservice shortcomings, possible bottlenecks, and future innovation. Forthat reason, Fujitsu changed its approach and started to treat call centreagents as knowledge workers and began to leverage their knowledgefor process and product innovation.
In order to create the context for knowledge work, the second stepwas to establish what I call an enabled learning environment. Fujitsuredesigned its management approach with a new emphasis on people,the problem-solving process and value creation.This involved a changein management style with leadership principles based on intrinsic motiv-ation and the creation of possibilities for others to succeed in a waythat provides choice, not ultimatums. It involved the identification oftraining needs, the deployment of new skills, and the reorganization ofroles and responsibilities. The hierarchy within Fujitsu was essentiallyturned upside down. The role of managers was changed from one ofauthority to one of support.The central responsibility for them becamethe provision of the necessary knowledge and tools to allow front-linestaff to handle the needs of the customer and assume responsibility forthe end-to-end service, even if that service left the confines of thehelpdesk at Fujitsu and was transferred to other client suppliers.
Today, dedicated front-line teams take on the role of establishinghow they add value to their clients. They address questions such as‘what do our customers want to achieve?’ and ‘what is Fujitsu’s role inthis?’ Its new Strategic Performance Management approach enabledFujitsu to move from a make-and-sell mentality toward a sense-and-respond mentality.24 To understand how Fujitsu is creating value fortheir customers, front-line agents create a value creation map – a visualrepresentation of the value proposition to their customers and the keycompetencies and performance drivers required from Fujitsu to helpdeliver the value proposition. In a so-called ‘intervention process’, front-line agents analyse the customer requirements and map out how theycan help to deliver these. This often involves a visit to the customersites to better understand their environment, working conditions, andvalue proposition. Subsequently, the front-line agents design appropri-ate performance indicators which they own, review, and act upon.
One of Fujitsu’s customers is, for example, an airline company thathas outsourced its IT management to Fujitsu.Airline employees wouldring the helpdesk if they experienced any problems with their ITequipment (e.g. printer doesn’t work or servers are down).The successmeasures for the helpdesk team which handles the airline calls will bethe overall service rating from the airline, i.e. has the IT infrastructurebeen managed satisfactorily by Fujitsu, instead of ‘have the calls beenhandled within 2 minutes’. Front-line employees in Fujitsu now analyse
142 Managing performance in an enabled learning environment
and classify incoming calls in order to understand whether they are‘creating value’ or ‘restoring value’.The latter might be preventable byimproving processes as part of Fujitsu’s service delivery, e.g. an engi-neer didn’t turn up soon enough to fix an essential ticket printer at theairport and the customers are chasing up.
Front-line agents now look at what kind of calls they are getting andsee what they tell them about their overall end-to-end service delivery.They might get calls because other parts of the business are not deliver-ing and therefore customers are chasing their products. Trying toknock off a few seconds to optimize such calls would clearly be thewrong thing to do; instead, this information needs to be passed on inorder to improve performance along the entire value chain. Cross-functional performance improvement meetings are used to explorehow overall service delivery can be improved, and the input from front-line agents is of critical importance. Here new processes are establishedto ensure, for example, that either the engineer turns up more quickly,the printers are replaced with more reliable printers, or maybe clientsare trained to fix essential equipment by themselves.
Sometimes, sub-optimal processes in the customer organization areresponsible for problems with the IT systems and are, therefore, pre-ventable calls. In such cases the information is fed back to the clientsso that they can improve their own internal processes. In one case,Fujitsu discovered that many employees were ringing to reset pass-words at night, when no helpdesk was available for that client. Thismeant that they sometimes had to wait hours until the helpdeskagents were available again in the morning to reset a backlog of pass-words. Instead of arranging 24-hour helpdesk service, the solution wasfor the client company to change their processes and give some oftheir employees the ability to reset passwords when the helpdesk wasnot available. Under the old regime there would have been no incen-tive for anyone in Fujitsu to suggest this approach. For the airlinecompany, helpdesk intelligence has managed to reduce queues atticket offices, check-ins and boarding gates. Calls into the helpdeskhave fallen by 30%, system availability has increased, and client IToperating costs have decreased.
This new approach created completely new relationships betweenFujitsu and their clients. Instead of operating at only contractual obli-gation level according to efficiency measures specified in service levelagreements, Fujitsu now operates on a partner level that allows mutualperformance improvements. Commercial contracts between FujitsuServices and its clients had to be restructured to realize mutual benefitfrom call reduction and mutual value maximization.The results of thischange in the way performance is managed in Fujitsu Services are
impressive. Today, Fujitsu achieves 20% higher customer satisfaction,and was further able to increase its employee satisfaction by 40%. Itsstaff attrition decreased from 42% to 8%, operating costs decreased by20%, and contract renewal and service upgrades amounted to £200 m.Since implementation of its new Strategic Performance Managementapproach, Fujitsu won the National Business for the Best CustomerService Strategy and was awarded the European Call Centre of theYear award for the best people development programme.
Today, Fujitsu is continuously redesigning its capabilities and offer-ings, not based on market intelligence but on customer-knowledgeand Strategic Performance data. Fujitsu recognized the potential of anew Strategic Management approach and applied it in a wider con-text. In addition to the helpdesk environment, these principles havenow been applied to many other parts of the organization.
I believe that this case study demonstrates the power of an enabledlearning environment and how it can help to make Strategic Perform-ance Management a reality. It enables organizations to continuouslylearn and innovate, and therefore ensures long-term success.The time isright for more organizations to think about their Strategic PerformanceManagement processes and how to create an enabled learning environ-ment. In the next chapter I will discuss how the value creation mapsand associated indicators can be used to validate assumed causal models,to assess risks, and to evaluate potential mergers and acquisitions.
References and endnotes
1 See for example:Argyris, C. and Schön, D.A. (1978). Organizational
Learning: A Theory of Action Perspective.Addison-Wesley.2 See for example: Preskill, H. and Torres, R. T. (1999). Evaluative
Inquiry of Learning in Organizations. Sage, Thousand Oaks; andSenge, P. M. (1990). The Fifth Discipline: The Art and Practice of
the Learning Organization. Doubleday Currency: New York.3 See for example: Argyris, C. (1999). On Organizational Learning,
2nd edition. Blackwell: Malden.4 Argyris, C. (1978). Double Loop Learning in Organizations. Harvard
Business Review, Sept–Oct, pp. 115–25.5 Argyris, C. (1999). On Organizational Learning, 2nd edition.
Blackwell: Malden.6 Ibid, Preskill, H. and Torres, R.T. (1999), p. 66. (See note 2 above.)7 Kaplan, R. S. and Norton, D. P. (1996a). The Balanced Scorecard –
Translating Strategy into Action. Harvard Business School Press:Boston, MA, p. 17.
Creating an enabled learning environment 143
8 Argyris, C. (1991).Teaching Smart People to Learn. Harvard Business
Review, May/June, pp. 99–109.9 Argyris, C. (1994). Good Communication Blocks Learning. Harvard
Business Review, July/August, pp. 77–85.10 Ghoshal, S. and Nahapiet, J. (1998). Social Capital, Intellectual
Capital, and the Organizational Advantage. Academy of Management
Review,Vol. 23, No. 2,Apr, pp. 242.11 See for example: Konno, N. and Nonaka, I. (1998). The Concept of
‘Ba’: Building a Foundation for Knowledge Creation. California
Management Review, Vol. 40, No. 3, pp. 40–54; or Konno, N.,Nonaka, I. and Toyama, R. (2000). SECI, Ba and Leadership:A UnifiedModel of Dynamic Knowledge Creation. Long Range Planning,Vol. 33, No. 1, Feb, p. 5.
12 See for example: de Waal, A. A. (2002). Quest for Balance: The
Human Element in Performance Management Systems. Wiley:New York; or de Waal, A. A. (2001). Power of Performance Meas-
urement: How Leading Companies Create Sustained Value.Wiley:New York.
13 See for example: Ehin, C. (1998). Fostering Both Sides of HumanNature – the Foundation for Collaborative Relationships. Business
Horizons, May–June, pp. 15–25; and Ehin, C. (2000). Unleashing
Intellectual Capital. Butterworth Heinemann: Boston, MA.14 Ehin, C. (2000). Unleashing Intellectual Capital. Butterworth
Heinemann: Boston, p. 106.15 For more information on tacit knowledge see: Polanyi, M. (1958).
Personal Knowledge: Towards a Post-Critical Philosophy. Universityof Chicago Press: Chicago, Il.
16 Ehin, C. (2000). Unleashing Intellectual Capital. ButterworthHeinemann: Boston, p. 110.
17 Neely, A., Kennerley, M. and Adams, C. (2002). The Performance
Prism – The Scorecard for Measuring and Managing Business
Success. FT Prentice Hall, Chapter 11, pp. 345–6.18 I borrowed this phrase from Heinz Ahn, who uses it for a similar
purpose in his article Ahn, H. (2001). Applying the Balanced Score-card Concept:An Experience Report. Long Range Planning,Vol. 34,No. 4, pp. 441–61.
19 Ibid, Preskill, H. and Torres, R.T (1999), p. 65. (See note 2 above.)20 Ibid, Preskill, H. and Torres, R.T. (1999), p. 60. (See note 2 above.)21 Ibid, Preskill, H. and Torres, R. T. (1999), pp. 53–4. (See note 2
above.)22 See for example: Bohm, D. and Nichol, L. (eds) (1996). On Dialogue.
Routledge: London.
144 Managing performance in an enabled learning environment

23 This case study is based on my work with Fujitsu Services. Formore information see also: Marr, B. (2005). Strategic Performance
Management: Lessons From Call Centres. Cranfield School ofManagement: UK; or Marr, B. and Parry, S. (2004). PerformanceManagement In Call Centers: Lessons, Pitfalls and Achievements in Fujitsu Services. Measuring Business Excellence, Vol. 8, No. 4,pp. 55–62.
24 See for example: Barlow, S., Parry, S. and Faulkner, M. (2005).Sense and Respond: The Journey to Customer Purpose. Palgrave,Basingstoke; Haeckel, S. (1999). Adaptive Enterprise: Creating and
Leading Sense-and-Respond Organizations. Harvard Business SchoolPress: Boston, MA.
Creating an enabled learning environment 145
7
Extracting more
management insights
Most decisions made by managers either destroy long-term valueor don’t create any. . . . To be fair, most managers today don’thave a fighting chance to create value. They are often forced toplan, decide, and act without clear, coherent, or comprehensiveroadmaps.
I very much agree with this statement made by James Heskett, EarlSasser, and Leonard Schlesinger in their book on the value profit chain.1
Successful organizations in today’s global knowledge economy will bethose that create clear and comprehensible strategy roadmaps, and useperformance data in order to extract management insights for learningand decision-making. In the previous chapter, I have discussed how, inan enabled learning environment and through performance improve-ment meetings, the value creation map can be used to foster learningand improve everyday decision-making. This is the most powerful wayto engage everyone in strategic thinking and learning. However, thevalue creation map can be used for other types of analyses that allowyou to ‘validate’ your business model, to assess your risks, and to evalu-ate possible diversifications, acquisitions, and mergers. In this chapter, Iwill look at these aspects and address the following questions:
� In what ways can we use the value creation map to analyse ourorganization?
� How can Strategic Performance Management facilitate dynamiccapabilities?
� How can we test our business model and our assumptions?
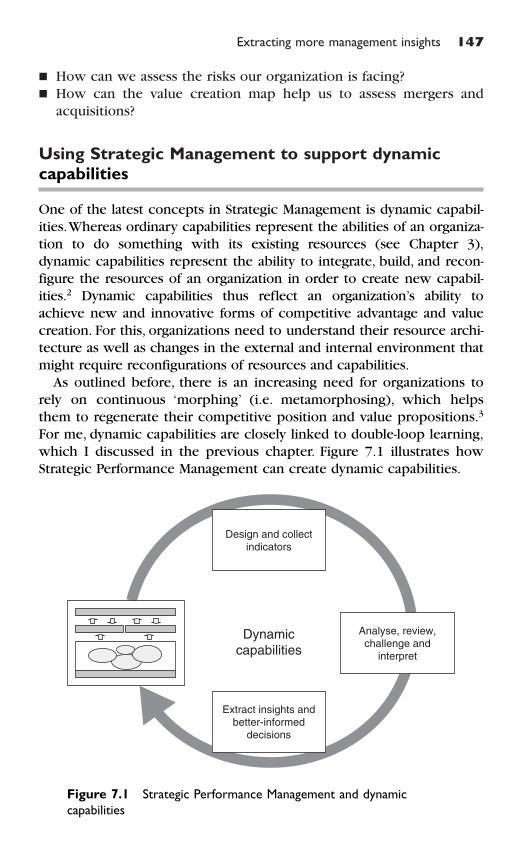
Extracting more management insights 147
� How can we assess the risks our organization is facing?� How can the value creation map help us to assess mergers and
acquisitions?
Using Strategic Management to support dynamic
capabilities
One of the latest concepts in Strategic Management is dynamic capabil-ities.Whereas ordinary capabilities represent the abilities of an organiza-tion to do something with its existing resources (see Chapter 3),dynamic capabilities represent the ability to integrate, build, and recon-figure the resources of an organization in order to create new capabil-ities.2 Dynamic capabilities thus reflect an organization’s ability toachieve new and innovative forms of competitive advantage and valuecreation. For this, organizations need to understand their resource archi-tecture as well as changes in the external and internal environment thatmight require reconfigurations of resources and capabilities.
As outlined before, there is an increasing need for organizations torely on continuous ‘morphing’ (i.e. metamorphosing), which helpsthem to regenerate their competitive position and value propositions.3
For me, dynamic capabilities are closely linked to double-loop learning,which I discussed in the previous chapter. Figure 7.1 illustrates howStrategic Performance Management can create dynamic capabilities.
Design and collectindicators
Dynamic
capabilities
Analyse, review,challenge and
interpret
Extract insights andbetter-informed
decisions
Figure 7.1 Strategic Performance Management and dynamic
capabilities
148 Managing performance in an enabled learning environment
By understanding and visualizing the business model in a value cre-ation map, you can collect the appropriate indicators that you canthen use to analyse, review and challenge the business model, andtherefore extract insights that allow you to make decisions about anynecessary reconfiguration of organizational resources and capabilities.
In Fujitsu, dynamic capabilities are not just a theory any more.4
Fujitsu has embraced the concept and realized that unless everyonecontinuously compares the created strategy roadmap with the emer-ging reality, a mismatch can quickly be created between what theorganization does and what the customers require. In its helpdeskenvironment (as discussed previously in Chapter 6), Fujitsu has putprocesses in place that enable front-line agents to understand howthey are creating better value for their clients.
However, in the same way that the external business environment ischanging, so are the demands and requirements of each client. By talk-ing to the clients day in and day out, front-line agents are now skilledto listen to what the customers are saying in order to detect anychanges in demands.This is reviewed on a regular basis and comparedwith the existing value creation assumptions. If any mismatches areidentified, required actions are explored and implemented.
Testing the value creation assumptions and assessing potential risksto the current business model are other forms of analysis that helporganizations to see possible areas where they need to reconfiguretheir current resource base. Below, I will explore how those can beused to extract management insights from the value creation map.
Testing value creation assumptions and
the business model
The value creation assumptions expressed in the causal value creationmaps and the value creation narratives are usually just that – assump-tions. However, if the map is developed correctly, with the participa-tion and involvement of as many key people as possible, it usuallyreflects reality extremely well. Nevertheless, many organizations wantto ‘test’ their assumptions and collect ‘evidence’ that their assumptionshold true.The performance data derived from the performance indica-tors can be used for that purpose and the value creation map, or partsof it, can be verified. In their book Evaluative Inquiry for Learning
in Organizations, Preskill and Torres write that:
no longer can senior management rely solely on gut feelings and information from their inner circle to make decisions.
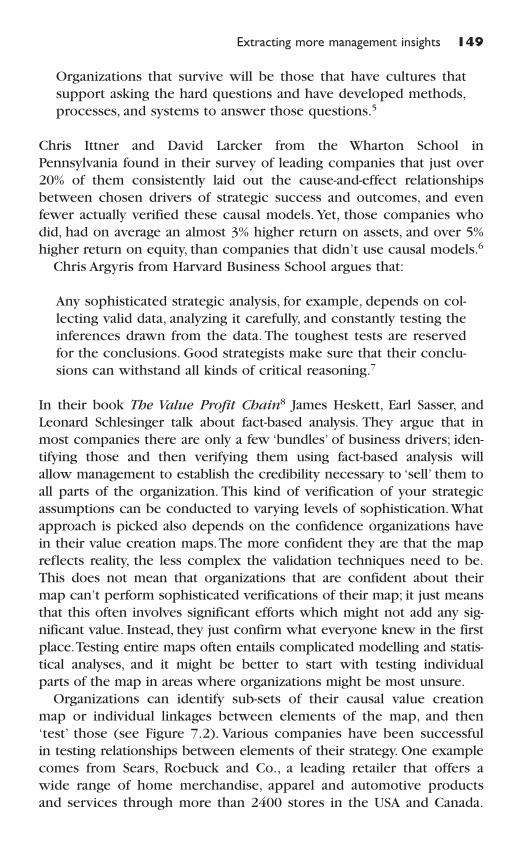
Organizations that survive will be those that have cultures thatsupport asking the hard questions and have developed methods,processes, and systems to answer those questions.5
Chris Ittner and David Larcker from the Wharton School inPennsylvania found in their survey of leading companies that just over20% of them consistently laid out the cause-and-effect relationshipsbetween chosen drivers of strategic success and outcomes, and evenfewer actually verified these causal models. Yet, those companies whodid, had on average an almost 3% higher return on assets, and over 5%higher return on equity, than companies that didn’t use causal models.6
Chris Argyris from Harvard Business School argues that:
Any sophisticated strategic analysis, for example, depends on col-lecting valid data, analyzing it carefully, and constantly testing theinferences drawn from the data. The toughest tests are reservedfor the conclusions. Good strategists make sure that their conclu-sions can withstand all kinds of critical reasoning.7
In their book The Value Profit Chain8 James Heskett, Earl Sasser, andLeonard Schlesinger talk about fact-based analysis. They argue that inmost companies there are only a few ‘bundles’ of business drivers; iden-tifying those and then verifying them using fact-based analysis willallow management to establish the credibility necessary to ‘sell’ them toall parts of the organization. This kind of verification of your strategicassumptions can be conducted to varying levels of sophistication.Whatapproach is picked also depends on the confidence organizations havein their value creation maps.The more confident they are that the mapreflects reality, the less complex the validation techniques need to be.This does not mean that organizations that are confident about theirmap can’t perform sophisticated verifications of their map; it just meansthat this often involves significant efforts which might not add any sig-nificant value. Instead, they just confirm what everyone knew in the firstplace.Testing entire maps often entails complicated modelling and statis-tical analyses, and it might be better to start with testing individualparts of the map in areas where organizations might be most unsure.
Organizations can identify sub-sets of their causal value creationmap or individual linkages between elements of the map, and then‘test’ those (see Figure 7.2). Various companies have been successfulin testing relationships between elements of their strategy. One examplecomes from Sears, Roebuck and Co., a leading retailer that offers awide range of home merchandise, apparel and automotive productsand services through more than 2400 stores in the USA and Canada.
Extracting more management insights 149
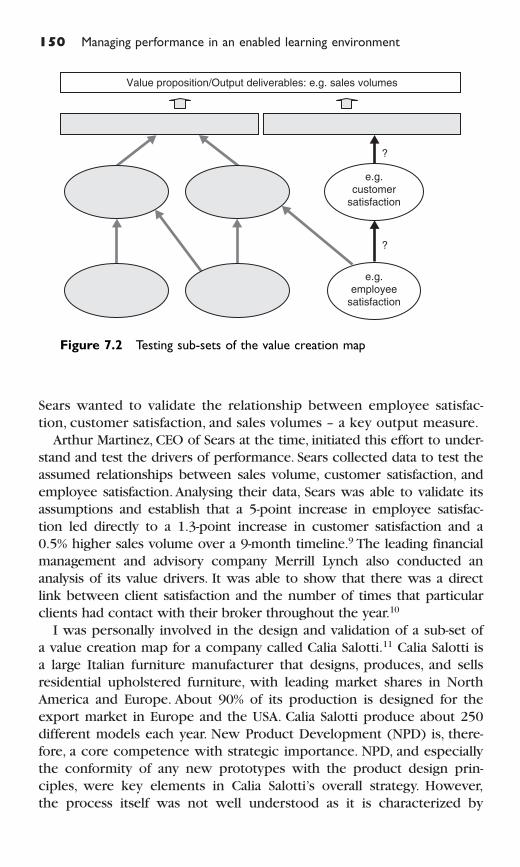
150 Managing performance in an enabled learning environment
Sears wanted to validate the relationship between employee satisfac-tion, customer satisfaction, and sales volumes – a key output measure.
Arthur Martinez, CEO of Sears at the time, initiated this effort to under-stand and test the drivers of performance. Sears collected data to test theassumed relationships between sales volume, customer satisfaction, andemployee satisfaction. Analysing their data, Sears was able to validate itsassumptions and establish that a 5-point increase in employee satisfac-tion led directly to a 1.3-point increase in customer satisfaction and a0.5% higher sales volume over a 9-month timeline.9 The leading financialmanagement and advisory company Merrill Lynch also conducted ananalysis of its value drivers. It was able to show that there was a directlink between client satisfaction and the number of times that particularclients had contact with their broker throughout the year.10
I was personally involved in the design and validation of a sub-set ofa value creation map for a company called Calia Salotti.11 Calia Salotti isa large Italian furniture manufacturer that designs, produces, and sellsresidential upholstered furniture, with leading market shares in NorthAmerica and Europe. About 90% of its production is designed for theexport market in Europe and the USA. Calia Salotti produce about 250different models each year. New Product Development (NPD) is, there-fore, a core competence with strategic importance. NPD, and especiallythe conformity of any new prototypes with the product design prin-ciples, were key elements in Calia Salotti’s overall strategy. However,the process itself was not well understood as it is characterized by
Value proposition/Output deliverables: e.g. sales volumes
?
?
e.g.customer
satisfaction
e.g.employee
satisfaction
Figure 7.2 Testing sub-sets of the value creation map
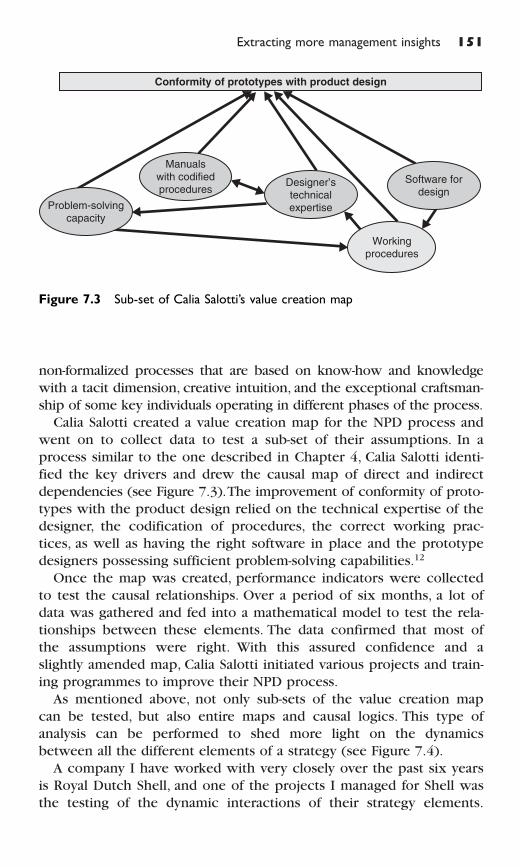
Extracting more management insights 151
non-formalized processes that are based on know-how and knowledgewith a tacit dimension, creative intuition, and the exceptional craftsman-ship of some key individuals operating in different phases of the process.
Calia Salotti created a value creation map for the NPD process andwent on to collect data to test a sub-set of their assumptions. In aprocess similar to the one described in Chapter 4, Calia Salotti identi-fied the key drivers and drew the causal map of direct and indirectdependencies (see Figure 7.3).The improvement of conformity of proto-types with the product design relied on the technical expertise of thedesigner, the codification of procedures, the correct working prac-tices, as well as having the right software in place and the prototypedesigners possessing sufficient problem-solving capabilities.12
Once the map was created, performance indicators were collectedto test the causal relationships. Over a period of six months, a lot ofdata was gathered and fed into a mathematical model to test the rela-tionships between these elements. The data confirmed that most ofthe assumptions were right. With this assured confidence and aslightly amended map, Calia Salotti initiated various projects and train-ing programmes to improve their NPD process.
As mentioned above, not only sub-sets of the value creation mapcan be tested, but also entire maps and causal logics. This type ofanalysis can be performed to shed more light on the dynamicsbetween all the different elements of a strategy (see Figure 7.4).
A company I have worked with very closely over the past six yearsis Royal Dutch Shell, and one of the projects I managed for Shell wasthe testing of the dynamic interactions of their strategy elements.
Conformity of prototypes with product design
Problem-solvingcapacity
Manualswith codifiedprocedures
Software fordesign
Designer’stechnicalexpertise
Workingprocedures
Figure 7.3 Sub-set of Calia Salotti’s value creation map
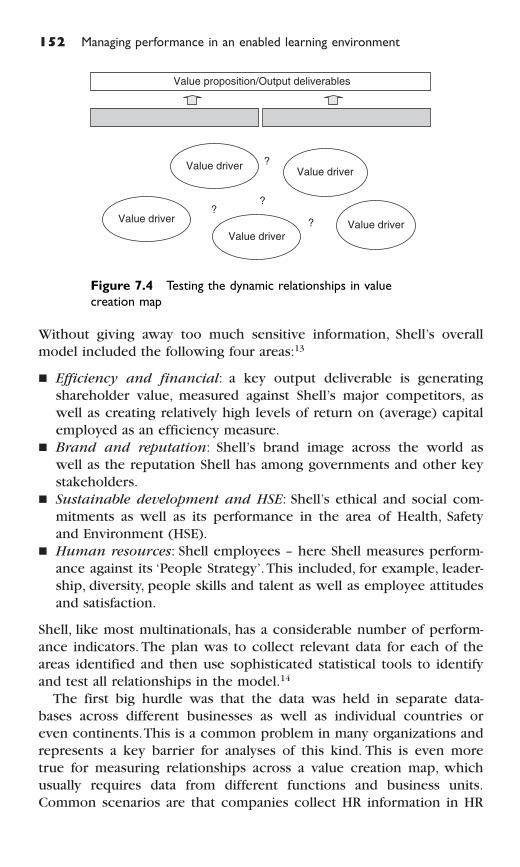
152 Managing performance in an enabled learning environment
Without giving away too much sensitive information, Shell’s overallmodel included the following four areas:13
� Efficiency and financial: a key output deliverable is generatingshareholder value, measured against Shell’s major competitors, aswell as creating relatively high levels of return on (average) capitalemployed as an efficiency measure.
� Brand and reputation: Shell’s brand image across the world aswell as the reputation Shell has among governments and other keystakeholders.
� Sustainable development and HSE: Shell’s ethical and social com-mitments as well as its performance in the area of Health, Safetyand Environment (HSE).
� Human resources: Shell employees – here Shell measures perform-ance against its ‘People Strategy’.This included, for example, leader-ship, diversity, people skills and talent as well as employee attitudesand satisfaction.
Shell, like most multinationals, has a considerable number of perform-ance indicators. The plan was to collect relevant data for each of theareas identified and then use sophisticated statistical tools to identifyand test all relationships in the model.14
The first big hurdle was that the data was held in separate data-bases across different businesses as well as individual countries oreven continents.This is a common problem in many organizations andrepresents a key barrier for analyses of this kind. This is even moretrue for measuring relationships across a value creation map, whichusually requires data from different functions and business units.Common scenarios are that companies collect HR information in HR
Value driver
Value driver
Value driver
Value proposition/Output deliverables
Value driver
Value driver
??
?
?
Figure 7.4 Testing the dynamic relationships in value
creation map
departments and financial data in finance departments; unfortunatelythis data is also often kept in separate and non-integrated databases.Adding to this problem is the fact that large organizations regularlyoutsource particular aspects of their Performance Measurement, mostcommonly employee surveys and customer or brand surveys. In manycases this means that organizations do not own the full data-set thatwas collected and therefore are unable to include it in their analysis.
At Shell, we collected financial data over two years from over 120countries. We used data from over 48 000 brand and customer inter-views, and from over 50 000 staff surveys, as well as HSE and social datafrom all countries. Using this systematic approach allowed us to createa more complete picture of performance and to understand the inter-relationship between the different performance areas.The analysis pro-vided some interesting insights that were then investigated further.However, most importantly, it facilitated discussions and debate aboutstrategy and inter-relationships. Even with the massive amount of datain Shell, which gave us fantastic statistical reliability, we didn’t take theoutcomes of the analysis as truth that can’t be challenged.We all agreedthat it is impossible to isolate all variables and ‘measure’ them reliably(as discussed in Chapter 5).
Whereas the exercise was valuable and triggered many worthwhilediscussions as a ‘one-off’ project in order to gain a better understand-ing of current strategy, I would question the value of such exercises ona more regular basis.They require massive efforts and are quite expen-sive to execute. Furthermore, I would question whether there are manyorganizations around that have sufficient valid performance data toperform such an analysis. Having said that, evolutions in PerformanceManagement software applications mean that increasingly this kind ofanalysis can now be performed routinely with the latest software tools(more on this in Part III).
Understanding and assessing risks15
Organizations (both corporations and not-for-profit) face many poten-tial areas where they are vulnerable to significant risks and it is import-ant that these risk factors are actively managed. Risk management as amanagement tool started to emerge in the 1990s (although the prob-lem has of course been around for much longer than that!). However,the main emphasis has been on financial risks and external risks.Financial risks are concerned only with financial uncertainties,whereas external risks are often identified in the external strategicanalysis (see Chapter 2). More recently, organizations have started to
Extracting more management insights 153
154 Managing performance in an enabled learning environment
look at risks more holistically in order to identify possible threats totheir business model and value creation.
Research carried out in 200416 found that half of 950 small andmedium-sized companies (with revenues between €30 and 360 m) ineleven European countries do not know how to manage the most sig-nificant risks they perceive to their businesses. Most senior executivessurveyed admitted that that they did not have processes in place toeffectively manage strategic and operational risks.The three most signifi-cant perceived risks, and those that businesses feel least able to man-age, were: increased competition; adverse changes in customer demand;and reduced productivity due to staff absenteeism and turnover. Whilemore than 75% of the companies surveyed claimed that increased com-petition was their most significant business risk, only half said that theyhad a robust mitigation plan to counter this risk.
One of the key problems has been for organizations to identify theareas where they face risks and are vulnerable. Since organizations stillfind it difficult to identify everything that matters, they often revert tothe traditional areas of risk: financial and external. However, the valuecreation map is a visual representation of your business model and allthe components required to deliver your value proposition. It can,therefore, guide the risk assessment and it allows organizations to iden-tify potential focus areas for their risk mitigation strategies much morecomprehensively (see Figure 7.5).
Your organization’s unique value creation map can be used toassess the risks in the value proposition as well as the risks concern-ing the resources identified to deliver the value proposition. In thisway organizations can cover all areas they believe are important fortheir business and are able to weigh up the potential significance ofthe risks that they face. Below, I will highlight some common riskareas in the external environment together with examples for each ofthe resource categories identified in Chapter 3.
External risks
Many of the external risks will usually be identified and addressed inthe external strategic analysis (see Chapter 2), when organizations lookat the political, economic, social, technological, environmental or legalconditions in their potential markets. Also, the five forces frameworkwill identify threats from competitors, suppliers, etc. Here, I will brieflylook at two common external risks – competition and market risks.
� Competition risk. Risks in this category can range from the emer-gence of a new supplier to the market (from a low labour cost
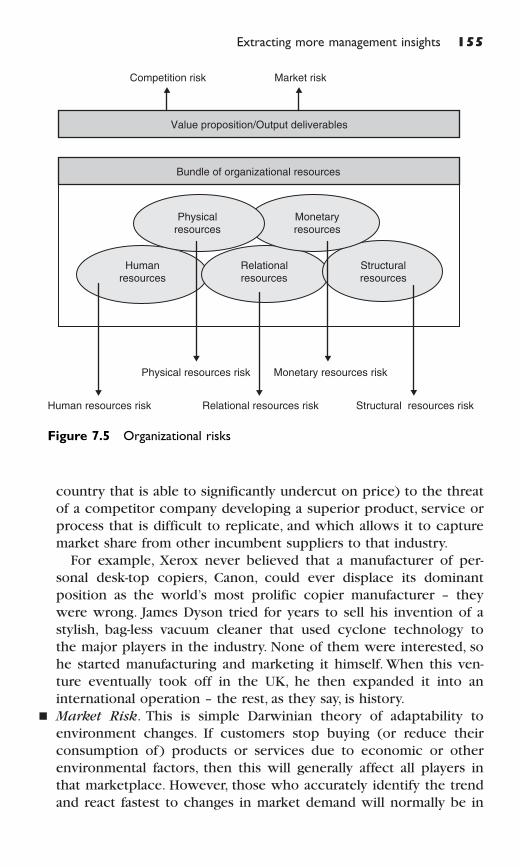
Extracting more management insights 155
country that is able to significantly undercut on price) to the threatof a competitor company developing a superior product, service orprocess that is difficult to replicate, and which allows it to capturemarket share from other incumbent suppliers to that industry.
For example, Xerox never believed that a manufacturer of per-sonal desk-top copiers, Canon, could ever displace its dominantposition as the world’s most prolific copier manufacturer – theywere wrong. James Dyson tried for years to sell his invention of astylish, bag-less vacuum cleaner that used cyclone technology tothe major players in the industry. None of them were interested, sohe started manufacturing and marketing it himself. When this ven-ture eventually took off in the UK, he then expanded it into aninternational operation – the rest, as they say, is history.
� Market Risk. This is simple Darwinian theory of adaptability toenvironment changes. If customers stop buying (or reduce theirconsumption of) products or services due to economic or otherenvironmental factors, then this will generally affect all players inthat marketplace. However, those who accurately identify the trendand react fastest to changes in market demand will normally be in
Value proposition/Output deliverables
Physicalresources
Bundle of organizational resources
Physical resources risk
Competition risk Market risk
Monetaryresources
Humanresources
Relationalresources
Structuralresources
Human resources risk Relational resources risk
Monetary resources risk
Structural resources risk
Figure 7.5 Organizational risks
the best position to survive a market downturn and prosper in thefuture, while others will be less fortunate.
As Gary Hamel and C. K. Prahalad observe:‘The cues, weak signals,and trend lines that suggest how the future might be different arethere for everyone to observe.’17 Getting caught in a position of hav-ing too much debt at the time of a market downturn is likely to leadto a Dickensian ‘Mr Micawber moment’ – witness all the dot-comcompanies that crashed and burned as soon as the bubble burst.
Monetary resource risk
Monetary or financial risk is an area with which many organizationsare quite familiar; especially financial institutions, where money is areal resource that needs to be actively managed. Insurance companiesor banks have to make sure that their monetary resources are suffi-cient and that the risk levels are adequate (or at least they should be,but there have been some notable exceptions). Here I will brieflylook at cash flow or capital risk as well as price risk.
� Cash flow and capital risk. For financial risk management, organ-izations deploy practices to optimize the manner in which theytake financial risk. This involves upholding relevant policies andprocedures, such as monitoring the risk that the cash flow of anorganization will be adequate to meet its financial obligations.Many companies use hedging as a technique to reduce or eliminatefinancial risk by, for example, taking two investment positions thatwill offset each other if prices change.
A prominent example of when financial risk management strat-egies go wrong can be seen in the case of Barings Bank. One of itsyoung traders, the now infamous Nick Leeson, went to Singaporeand was trading a very low risk strategy of just betting on the samefutures contracts in two different markets in Asia and basically justbuying low and selling high.At first he was phenomenally successfuland was regarded as a hero by Barings, who gave him more moneyto trade. Subsequently, when Nick lost a little bit of this money, hemanaged to cover up those losses by hiding them in a separateaccount. However, when trying to make back those losses, he beganto take much bigger risks with much larger sums of money.This pro-duced further losses when the markets went against his expecta-tions, so that he needed to hide these too and, as we all know, thisresulted in the collapse of the entire bank.
� Price risk. Companies have long been used to mitigating risks asso-ciated with fluctuations in critical financial elements of their business.
156 Managing performance in an enabled learning environment
Currency exchange rates and the price of certain commodities,such as oil or metals, have long been the bane of predictable earn-ings and the fluctuating costs of these are commonly ‘hedged’.There are other approaches to managing this kind of risk though.
For example, customers of Johnson Matthey, the UK-based inter-national producer of precious metal products, are obliged to pur-chase their precious metals (mainly gold, platinum and palladium)separately and ahead of the products that the company supplies.This is so that JM minimizes the inherent risks of price fluctuationsin its metal stocks while it manufactures the end products, such asautomotive and industrial catalysts. Consumers and small busi-nesses, however, have no means of off-setting price risk other thanstocking up ahead of price rises; this can have significant short-term economic effects.
Physical resource risk
There seems to be an increasing risk to our physical resources due tomore frequent natural and man-made disasters.A series of natural disas-ters and increased levels of international terrorist activities have bothcontributed to a heightened awareness of these risks. However, theseare not the only types of physical resource risks – some are muchmore mundane. Here, I will examine disaster risk and bottleneck risks.
� Disaster risk. Customers and investors alike need the comfort ofassurance that in the event of a major catastrophe, such as a devas-tating fire, bomb attack, airplane crash or a natural disaster at oneof their vital premises, a close to normal service can be providedby the company very rapidly after the event. For example, follow-ing the 9/11 attacks several financial services companies who usedthe World Trade Center and other nearby buildings were able toresume customer service activities within just a few hours fromback-up facilities they had set up for such a catastrophic event(though few would have predicted the severity of it). The same istrue of London-based companies following the damage caused tothe Baltic Exchange by IRA bombs in 1992.
� Bottleneck risk. If Eliyahu Goldratt taught manufacturing com-panies anything in his groundbreaking 1984 novel The Goal 18, it wasthe simple fact that a breakdown, failure or delay within a key con-straint part of an organization (in this context, a particular machinetool or production section on the factory floor) creates a problemfor the whole plant. There are areas of vulnerability in almost all
Extracting more management insights 157
158 Managing performance in an enabled learning environment
organizations where, if glitches occur, the resulting impact will befar greater than if there is a failure elsewhere, which can relativelyeasily be recovered.
Note to all call centre operators: make sure your telephone linesare always available and, in emergencies, offer a call-back facilitythat works – the enormity of the harm that bad call centres can dohas become legendary, but so real too in terms of retaining cus-tomer loyalty. Internal capacity constraints need to be recognizedand managed – they are ‘arteries’ that must be kept open at allcosts. Although this has been classified here as a physical resourcerisk, and it generally is, the problem it defines can also be aboutkey people in the organization too (see below) – particularly criticaldecision-makers and authorizers.
Human resource risk
A key risk that is regularly overlooked in organizations is risk relatedto its staff and to the knowledge they possess. Organizations are oftenunaware that there might be some individuals with critical knowledgeand expertise who could walk out any day. In Chapter 3, I discussedhow the cost of losing experienced staff can be several times thecosts of hiring and training a replacement. Another associated risk isthe fact that knowledge is an important but also very vulnerableresource – it tends to deplete over time if it is not nurtured.Furthermore, unfortunately, a small percentage of employees may notnecessarily be as trustworthy as we would like them to be. Here I willlook at knowledge risk, staffing risk, and employee theft risk.
� Knowledge risk. Like tangible assets, knowledge has to be main-tained to retain its value. Knowledge that is not kept up to date canquickly lose its value or even disappear. Our civilization seems tohave lost the knowledge of how the Egyptian pyramids were built;even with modern calculation techniques it cannot be explainedhow these structures remain standing. Knowledge, like all resources,is context specific. Changes in the external environment can makeknowledge and skills redundant, as many craftsmen experienced dur-ing the industrialization process that took place in the nineteenthand twentieth centuries. For example, companies that held a lot ofknowledge and expertise about how to build a typewriter experi-enced how quickly this knowledge can become redundant with thearrival of the computer.
Today, knowledge can be very short lived. Computer programs maybe standard one day, but can be replaced by new innovative
programs the next day. It is critical therefore for organizations tounderstand the value of their knowledge and ensure that continu-ous training keeps knowledge up to date.
� Staffing risk. The impact on productivity of disaffected staff notbeing engaged with their organization’s objectives can be substan-tial (see also Chapter 6). While strikes and increased levels ofabsenteeism provide evidence of extreme levels of employee dissat-isfaction, more subtle disaffection is achieved by slowing down, notanswering the telephone, being rude to customers, gaming imposedperformance measures, and so on. A number of studies have veri-fied the positive link between satisfied employees and happy cus-tomers, particularly in retailing (e.g. the well-known Sears, Roebuckcase illustrates this19).
It doesn’t work on a ‘standalone’ basis though because the mer-chandising element has to be good too, but it is a vital success fac-tor nevertheless. Organizations need to carefully monitor the pulseof employee perceptions about the firm and their relationship withit. In addition to employee morale, firms need to be aware of theirstaffing needs both in terms of numbers of employees and the skill-sets with which they need to be provided. The availability ofauthorized staff to make particular decisions is an important facetof this equation too.
� Employee theft risk. This is the principal reason that most largecompanies have an internal audit department. It is also the reasonwhy many organizations appear to have elaborate control proced-ures that seem to exhibit a lack of trust in their staff. Some staff aredishonest, albeit a small percentage, and there are many examplesof employees (often in collaboration with others) who have rippedtheir employers off for considerable sums of money. For example,in the United States, theft by staff in retail stores alone is estimatedto have reached a level of $14.9 bn in 200020; employee theft isresponsible for more than 46% of what the retail industry calls‘shrinkage’ – far more than theft by shoplifters.
Another study by KPMG of 5000 businesses, agencies and non-profit organizations in 1998, revealed that losses averaged $624 000from cheque fraud by employees, including forgeries and mailroomtheft; looting of company bank accounts by employees came in at anaverage of $300 000 per organization; theft and misuse of companycredit cards amounted to an average of more than $1.1 million; andthe average loss from expense account abuse was $141 000.
When the Association of Certified Fraud Examiners, based inAustin,Texas, conducted one of the USA’s first comprehensive stud-ies of employee fraud in 1996, it reported that companies typically
Extracting more management insights 159
lost 6% of their annual revenues to such theft.21 There is research thatsuggests organizations may be able to reduce the risk of theft by cre-ating what I call an enabled learning environment (see Chapter 6).
Structural resource risks
Risks to structural resources include threats to organizationalprocesses and routines, especially those posed by losing database con-tents and software because of hackers and viruses. There is also anincreasingly common risk of intellectual property theft, as well as thedanger to business success created by more powerful regulatoryregimes that are rightly intolerant of ‘old school’ exploitation prac-tices. Below, I will observe and illustrate each of these risks.
� IT systems risk. Hackers, viruses, worms and the like have created awhole new industry in computer protection. Many large companies’and governmental organizations’ computer systems have been para-lysed in the last few years by malignant individuals with high levels ofknowledge about information technology protocols who are intenton exposing the vulnerabilities of IT systems and their contents.Apartfrom the damage they create, which has to be repaired, viruses causelost data, lost work time and lost revenues (customers go elsewhere).While the internet has many upsides, it does have a downside too.
� Intellectual property rights theft risk. Luxury goods and technol-ogy companies are particularly, but by no means exclusively, proneto this type of risk. As I have noted earlier (in Chapter 3), intellec-tual property rights can take many forms, from branded goods,trademarks, logos and characteristic styling to more mundaneindustrial patents and media copyrights. We have all seen shadytraders in almost every major city and resort in the world that sellcopies of Rolex watches, Gucci or Prada handbags, Louis Vuittonluggage, DKNY or Calvin Klein jeans and various fanware, such asNew York Yankees caps or Manchester United shirts. And some-times they are remarkably good copies. But, while you may thinkthat this is relatively harmless since these traders are selling to alargely different set of consumers than the original brand ownersdo, the damage to the exclusivity of the brand is being done.
However, arguably, it all gets a bit more alarming when copyaerospace parts start being found at the spares stockists and main-tenance hangars of commercial airlines. But it is perhaps the music,film and software industries that have been hardest hit by IPRtheft. For years, audio and video cassettes and, more recently, CDs
160 Managing performance in an enabled learning environment
Extracting more management insights 161
and DVDs have been illegally copied by so-called pirates and soldinternationally in very large quantities.
Then along comes Shaun Fanning, the founder of Napster, whodeveloped a brilliant way of keeping lawyers very busy indeed byusing the internet to share music files among its community of usersso that anyone, anywhere in the world, could download music trackscompletely free of charge. Millions did. Musicians weren’t too happyabout it either since it deprived them of royalties from their songs.Evil pirate or ‘Robin Hood’? Despite losing a US Supreme Court casewith the Recording Industry Association of America, Fanning’s legacycan still be found on the internet today. Overall, in our global econ-omy, it has become increasingly difficult to protect our intellectualproperty.
� Regulatory risk. The reason I have included regulatory risk withinthe structural resource category, rather than in external risks orstakeholder relationship risks – although glitches in this area tendto have an adverse effect on the latter too – is that the root causeis often a failure in the framing, communication or policing ofinternal policies.As the power of regulators has escalated in recentyears, the risks of deliberate cheating and sloppy management areescalating too. Compliance issues are fundamental to doing busi-ness. For example, Transco, a UK gas utility company, was fined arecord £15 m in 2005 for breaching health and safety laws after aleaking gas main led to an explosion that killed four people.
Today, companies need to be sure that the whole of their organiza-tion is operating within regulatory rules and guidelines.The litany ofmajor companies who have been exposed and fined considerablesums for being involved in illegal activities expands almost daily inthe financial press. For example, in 2005 alone, regulatory bodies inthe United States and Europe have meted out substantial fines for:accounting fraud; price fixing cartels; bid rigging; bribery; marketabuse; mis-selling of financial services; mishandling of complaints;misleading advertising; failing to inform investors; and sales of abu-sive tax avoidance schemes. In addition, several senior executiveshave been jailed for terms ranging from 5 to 25 years. Firms need toexamine where they are at risk from regulatory investigation andclean up their ethical acts.
Relational resources risks
In today’s networked economy, relationships are crucial ingredientsfor all organizations in both the private and public sectors. Their
reputation hangs on these vital relationships and often the risk needsto be cascaded through the supply chain that helps to deliver the prod-ucts and/or services that the organization sells or provides. Here I will,therefore, examine reputation risk and supply chain risk.
� Reputation risk. This is probably the most under-rated and leastunderstood category of risk in this list. If a company fails to live upto its declared (or expected) values and is then consequentlyexposed to adverse media attention, then the consequences can becatastrophic.This has the potential to instantly disenfranchise all of acompany’s branding efforts. Naturally, this category not only includesboth product quality failures (such as recalls and warranty claims)and customer service quality failures but also negative media publi-city. For example, Arthur Andersen, one of the ‘Big 5’ worldwideaccountancy firms, imploded in just a period of weeks after a few ofits partners were involved in several high profile financial scandalsthat hit the worldwide media – its clients walked away in droves.
� Since 1992, Nike has been the focus of international scrutiny ofhow huge western companies treat their suppliers in some of thepoorest parts of the world. It has frequently been accused of pro-moting the use of ‘sweatshops’ in Indonesia, Vietnam, China andSouth America, where labour abuses, forced overtime and unsani-tary conditions abound. About 500 000 workers in over 350 factor-ies across the globe make Nike footwear and apparel. Activistgroups, such as Global Exchange, first bombarded the media allegingabuses. By 1997–98, an anti-Nike campaign led by human rightsactivists culminated in several ‘Protest Nike’ days in the USA.
Nike’s initial response was sluggish, but quickly gatheredmomentum when it realized the damage that could be done to itsbrand and also to its college campus sales. It, therefore, introduceda code of conduct for its suppliers, created a remediation plan andimplemented independent monitoring of its suppliers’ factories. Iteven published the location of many of these factories, which ithad previously refused to do on competitive grounds. Lost reputa-tion cannot only disenfranchise customers, but also current andpotential employees. The best people will move to the organiza-tions with the best reputation.
� Supply chain risk. Suppliers are a critical component of an organiza-tion’s ability to deliver products and services to its customers, espe-cially in the age of outsourcing ‘non-core’ activities. If a supplierdefaults for reasons of capacity shortages, quality failures, a strike,or a fire at their premises, then such disruptions are likely to have amajor impact on customer service. Since the advent of ‘Just-in-Time’
162 Managing performance in an enabled learning environment
delivery systems, which eliminate buffer stocks in the productionsystem, the impact of such events can have a very rapid impact.
For example, when Ford’s supplier of door and boot latchesdefaulted (not components that most people would associate withproduction criticality issues), plants in Dagenham and Colognecame to a halt. Consequently, output of nearly 3000 cars a day waslost and more than 10 000 workers were either sent home ordiverted to plant maintenance.
In 2005, British Airways’ sole supplier of in-flight meals at London’sHeathrow airport, Gate Gourmet, sacked over 650 unionized workerswhen a festering industrial dispute erupted into an illegal strike.(Gate Gourmet is part of a US private equity-owned company thatwas once part of British Airways before BA decided that catering wasnot one of its core competencies.) The situation rapidly escalatedwhen 1000 British Airways workers at Heathrow, many of whom hadrelatives affected by the Gate Gourmet strike, started their own unoffi-cial sympathy strike.This action forced the cancellation of flights andmore than 100 000 passengers were stranded, mostly at Heathrow,one of the busiest airports in the world, causing scenes of anger andchaos at the height of the August holiday season.
As a corollary to this drama, it was revealed that British Airwayshad squeezed its supplier so hard in pricing negotiations that GateGourmet had no alternative but to reduce its mainly Asian-originworkforce substantially, since the contract had become financiallyunviable (although, arguably, it could have examined other ways of parting company with them – to avoid insolvency of its UKoperations).
This is a classic example of a clash of interests and cultures withinthe supply chain that affected all the key stakeholders adversely.The customer (BA), the supplier, the customer’s passengers, both thesupplier’s and customer’s employees, and the shareholders of bothBA and Gate Gourmet were all losers.The trade unions involved mayyet, at the time of writing, also suffer recriminations.
In recent years, during which high profile cases of corporate wrong-doing have caught the attention of the media and NGO (Non-Governmental Organization) activists have become more vocal inattacking corporate behaviour, reputation management has climbedthe ladder of boardroom priorities. Reputations take years to develop,but can be destroyed very rapidly indeed. Because of the internet, thespeed with which a reputation can be attacked by a broad range ofdifferent stakeholders – customers, employees, former employees,former suppliers, labour and human rights activists, and so on – on a
Extracting more management insights 163
164 Managing performance in an enabled learning environment
global scale has been reduced to a matter of hours. Shareholders andfinancial analysts increasingly notice these factors too. It is not surpris-ing, therefore, that this element of risk now has the full attention ofmajor companies’ boards worldwide.
A 2003 survey22 found that 60% of the world’s CEOs view corporatereputation as a ‘much more important’ aspect of business than fiveyears ago.The study also found that maintaining a good reputation hasbecome so important that 65% of the world’s CEOs have taken fullresponsibility for managing this aspect of performance.This figure risesto 80% in the USA, whereas in Europe it stood at just 44% (possiblydue to closer relations between CEO and the board). CEOs acknow-ledge customers as the external force with greatest effect on reputa-tion, followed by print media, financial analysts and shareholders.
Risk assessment then is a highly significant factor for managing intoday’s business environment. So, executives need to get to grips withthe various risks that their organization faces. Given that there aremany potential risks, it is advisable to begin accumulating data thatgives organizations useful information about where they are mostexposed. In the next section I will discuss how the value creationmap can be used to analyse and evaluate potential risks.
Analysing risk
The first step in assessing risk, therefore, must be to identify possibleareas of risk.The best way to do this is to take the value creation mapand go through all its elements, identifying potential risks (see Figure7.6). These risks can then be captured in what I call a ‘risk log’. This is a table that can be used to capture, describe, assess and quantifypotential risks (see Table 7.1). This often requires obtaining factualinformation about these risks and then prioritizing their relativeimportance. Organizations need to assess the potential risk areas forthe component parts of their organization, categorize them, and thenassess which are most important to manage.
Completing a risk log
In a risk log, organizations can capture their key risks. It can become aworking document that is part of the Performance Management system.Below, I outline the various steps involved in creating such a risk log.
1 For each element on the value creation map, potential risks areidentified.This element-by-element approach ensures that all potential
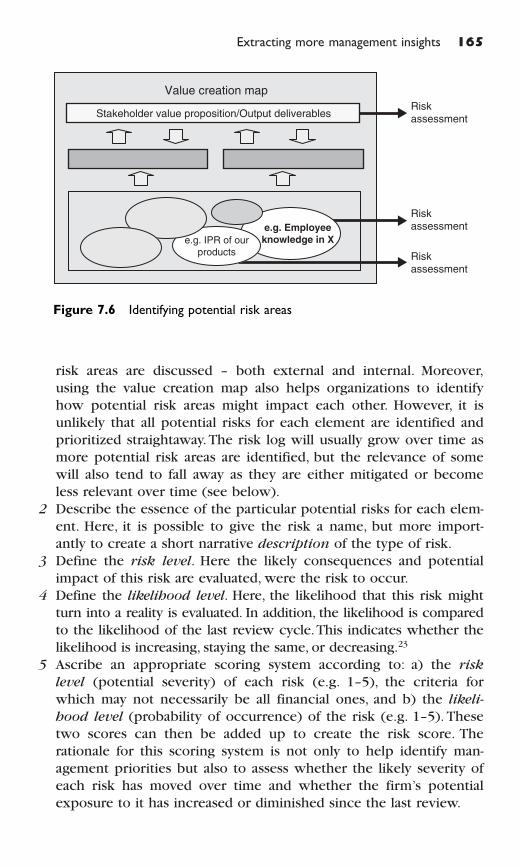
Extracting more management insights 165
risk areas are discussed – both external and internal. Moreover,using the value creation map also helps organizations to identifyhow potential risk areas might impact each other. However, it isunlikely that all potential risks for each element are identified andprioritized straightaway.The risk log will usually grow over time asmore potential risk areas are identified, but the relevance of somewill also tend to fall away as they are either mitigated or becomeless relevant over time (see below).
2 Describe the essence of the particular potential risks for each elem-ent. Here, it is possible to give the risk a name, but more import-antly to create a short narrative description of the type of risk.
3 Define the risk level. Here the likely consequences and potentialimpact of this risk are evaluated, were the risk to occur.
4 Define the likelihood level. Here, the likelihood that this risk mightturn into a reality is evaluated. In addition, the likelihood is comparedto the likelihood of the last review cycle.This indicates whether thelikelihood is increasing, staying the same, or decreasing.23
5 Ascribe an appropriate scoring system according to: a) the risk
level (potential severity) of each risk (e.g. 1–5), the criteria forwhich may not necessarily be all financial ones, and b) the likeli-
hood level (probability of occurrence) of the risk (e.g. 1–5). Thesetwo scores can then be added up to create the risk score. Therationale for this scoring system is not only to help identify man-agement priorities but also to assess whether the likely severity ofeach risk has moved over time and whether the firm’s potentialexposure to it has increased or diminished since the last review.
Value creation map
Risk assessment
Risk assessment
Risk assessment
Stakeholder value proposition/Output deliverables
e.g. IPR of our
products
e.g. Employee
knowledge in X
Figure 7.6 Identifying potential risk areas
166 Managing performance in an enabled learning environment
6 Assign responsibility (ownership) for managing each defined riskand define a review frequency for re-evaluation of subsequent riskmitigation activities.
Completing the risk log is best done within a project team. Differentsub-teams can be assigned to assess the risks of the different elementsof the value creation map. This ensures that several people who areknowledgeable in the subject matter work together and come eitherto a unanimous or aggregate score. Here, teamwork is important sincethis type of analysis can be highly subjective.That being the case, it isa good idea to ensure that the risk level and likelihood scores are notleft to a single individual. Furthermore, it is important to document asmuch information and logic as possible for the awarded scores in therisk log so that these can be revisited at the next review.
For each area, additional data can be collected and referenced inthe risk log. However, there is a real danger here too of making this anoverly bureaucratic process, and that is why I advocate a relativelysimplistic approach. The Pareto principle applies: 80� % of the riskcan be identified and assessed with 20% of the potential effortrequired to do it.
Having identified the highest priority risks (with high risk level andhigh likelihood level), management actions can be taken to modifytheir consequences and potential impacts on the firm. Typical actionsresulting from a risk analysis include:
� Buying insurance against occurrence� Development of mitigation plans (especially for emergencies/crises –
scenario planning techniques can assist this process)� Renegotiation of supplier contracts� Introduction of (internal/external) compliance audits� Introduction of new performance indicators to monitor emerging
trends.
This does not mean that lower severity/likelihood risks can be ignoredaltogether; it is just that management is unlikely to be able to set inmotion the corrective actions for large numbers of risks simultan-eously. However, if this is treated as part of a company-wide programme,then actions on lower priority risks might – with appropriate guidance –be delegated to lower ranking managers. Otherwise, they will have towait until the senior executives have first dealt with the highest prior-ity risk category and that might mean that the firm is still exposed tosome pretty substantial risks with which it is unready to cope.
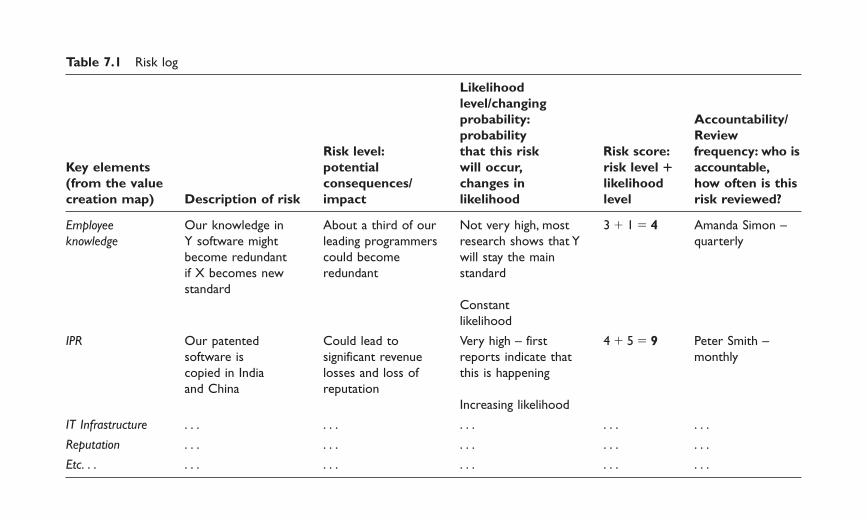
Table 7.1 Risk log
Likelihood
level/changing
probability: Accountability/
probability Review
Risk level: that this risk Risk score: frequency: who is
Key elements potential will occur, risk level � accountable,
(from the value consequences/ changes in likelihood how often is this
creation map) Description of risk impact likelihood level risk reviewed?
Employee Our knowledge in About a third of our Not very high, most 3 � 1 � 4 Amanda Simon –
knowledge Y software might leading programmers research shows that Y quarterly
become redundant could become will stay the main
if X becomes new redundant standard
standard
Constant
likelihood
IPR Our patented Could lead to Very high – first 4 � 5 � 9 Peter Smith –
software is significant revenue reports indicate that monthly
copied in India losses and loss of this is happening
and China reputation
Increasing likelihood
IT Infrastructure . . . . . . . . . . . . . . .
Reputation . . . . . . . . . . . . . . .
Etc. . . . . . . . . . . . . . . . . .
Although organizations have certainly been at risk for many cen-turies (how else would the insurance industry have become sowealthy?), arguably they have never been so at risk.Today, it is becom-ing increasingly common and necessary for organizations to appoint asenior risk manager.This is a post that often reports to a non-executivedirector but where the incumbent needs to work closely with oper-ational executives in far-flung parts of the organization. In internationalcompanies senior risk managers need to work closely with operationalexecutives in far-flung parts of the globe, as only they know wheretheir part of the firm is most vulnerable. Introducing an evaluationmethodology that everyone can relate to and then conducting a fairassessment of the potential risks is the first step towards mitigatingthe likely impacts that those risks could have on the firm.
Assessing mergers and acquisitions
M&A mania peaked around the turn of the last century.At that time, itwas virtually impossible to pick up a business publication that did notcontain a story about an M&A deal. In 1999 alone, over 26 000 M&Adeals were registered worldwide valued at $2.3 trillion and announce-ments of cross-border deals amounted to $1100 billion. Then, soonafter, stock markets began to plummet in the wake of the dot-comcrash and the number and value of M&A deals dried up too. Theevents of ‘9/11’ and fears about the Iraq war also exacerbated low levelsof business confidence. However, since the recovery of stock marketsacross the globe began after the first quarter of 2003, activity haspicked up once again. M&A is back on the corporate agenda.
So why are mergers and acquisitions so popular in good times? Theshort answer to this is that they offer a short-cut to growth that sim-ply cannot be attained by organic growth within the same timescales.Growth is what investors want companies to deliver – sales growthbut, more importantly, profit and cash flow growth too – so that shareprices and dividend yields grow in parallel. There are other strategicreasons too, such as:
� to eliminate a competitor by buying the company and so reducethe number of players in the industry sector
� to broaden geographic spread� to add additional products or services to the company’s portfolio
of offerings in order to increase penetration into lucrative existingmarkets
� to enter attractive new market segments
168 Managing performance in an enabled learning environment
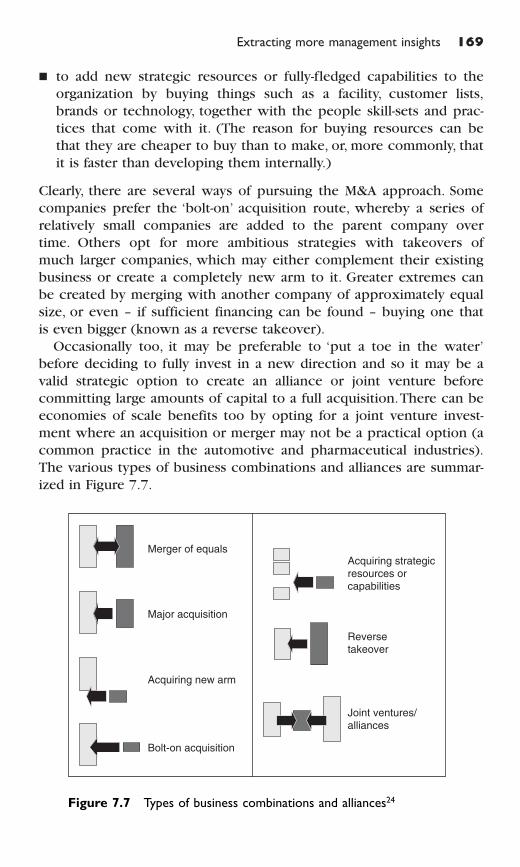
Extracting more management insights 169
� to add new strategic resources or fully-fledged capabilities to theorganization by buying things such as a facility, customer lists,brands or technology, together with the people skill-sets and prac-tices that come with it. (The reason for buying resources can bethat they are cheaper to buy than to make, or, more commonly, thatit is faster than developing them internally.)
Clearly, there are several ways of pursuing the M&A approach. Somecompanies prefer the ‘bolt-on’ acquisition route, whereby a series ofrelatively small companies are added to the parent company overtime. Others opt for more ambitious strategies with takeovers ofmuch larger companies, which may either complement their existingbusiness or create a completely new arm to it. Greater extremes canbe created by merging with another company of approximately equalsize, or even – if sufficient financing can be found – buying one thatis even bigger (known as a reverse takeover).
Occasionally too, it may be preferable to ‘put a toe in the water’before deciding to fully invest in a new direction and so it may be avalid strategic option to create an alliance or joint venture beforecommitting large amounts of capital to a full acquisition.There can beeconomies of scale benefits too by opting for a joint venture invest-ment where an acquisition or merger may not be a practical option (acommon practice in the automotive and pharmaceutical industries).The various types of business combinations and alliances are summar-ized in Figure 7.7.
Merger of equals
Major acquisition
Acquiring new arm
Bolt-on acquisition
Joint ventures/alliances
Reversetakeover
Acquiring strategicresources orcapabilities
Figure 7.7 Types of business combinations and alliances24
170 Managing performance in an enabled learning environment
However, there are well-documented problems with this M&Aapproach to growth. The biggest is that study after study has shownthat only around half of M&A transactions enjoy a successful outcome(with, perhaps surprisingly, domestic acquisitions perceived as onlyslightly more successful in achieving their aims than cross-borderones). The worse news is that the figure for joint ventures is evenlower. So that means, given the $2.3 trillion invested in M&A deals in1999, about $1.15 trillion or so was a wasted investment.25 That’s onehell of a lot of money and, even at somewhat lower levels of activitytoday, anything that can be done to alleviate that level of waste has gotto be worthwhile.
There are of course many reasons why mergers go ‘pear-shaped’: dif-ferent leadership styles leading to personality problems at the top; cul-tural differences; incompatible information systems; breakdowns incritical stakeholder relationships, and so on. But without doubt themost common culprit is the failure, in one way or another, to success-fully integrate the two entities.After the ink dries when the companiescomplete the deal, unity proves elusive, and instead of coming togetherthings fly apart.
‘A whole consulting industry thrives by advising companies onpost-merger integration, a salvage operation to recover somethingfrom the wreckage of impossible promises and ill-considered goals,’said The Economist,26 prescriptively adding that ‘companies that agreeon a clear strategy and management structure before they tie the knotstand a better chance of living happily ever after.’
Integrating two firms requires advance planning. But there is therub. Intelligent planning seems to be in short supply when M&A dealsare done.The sheer thrill of the ‘mega-deal’ can stimulate poor assess-ments of suitability and complementarities.
Pre-merger assessment
Mergers and acquisitions represent an exchange of both tangibleresources and intangible resources, requiring these resources to beassessed and valued. The takeover prices paid for targets in many ofthese deals, especially those in knowledge-intensive industries liketelecom, multimedia, biotechnology, etc. include very large paymentsfor goodwill and other intangible resources. Goodwill is essentially a‘kitchen-sink’ measure of an organization’s many intangible resourcesthat cannot be easily identified.
Value creation in these acquisitions, therefore, depends criticallyupon the acquirer’s ability to leverage the resources that it has acquired.
In acquisitions, the acquirer needs to combine at least some of its ownresources with those of the acquired firm to a greater or lesser degree,depending on the nature of the acquisition and the acquiring com-pany’s independence/integration philosophy towards its strategic devel-opment. This requires an understanding of the nature of the tangibleand especially the intangible resources of the two firms, how they com-plement one another and how they can be leveraged to improve futureperformance. Effective leveraging of intangible assets in acquisitionsrequires the ability to:
� Identify� Assess� Redeploy, and� Integrate the acquired resources.
Identifying, assessing, redeploying and integrating tangible resources isso much easier than doing the same for the intangible resources.Since many of the intangible resources are deeply embedded in theorganizational architecture, routines and cultures, this process poses aformidable challenge. Adding to the problem is the fact that access tothe target firm’s intangibles in an acquisition context can be limited.Recent reports of massive post-acquisition goodwill write-offs andrestructuring charges, amounting to billions of dollars, by Vodafone,Vivendi, Marconi, AOL-Time Warner, and so on emphasize the chal-lenge of this process.
At the same time, assessing intangible resources is often characterizedby poor audits at the pre-acquisition stage and poor post-acquisitionintegration planning.27 Without correct identification and assessment,the acquirers may overvalue the intangible resources thus causing valuedestruction for the acquiring organization’s shareholders and otherstakeholders. Or the acquirer might initially misjudge the suitability andcomplementarities of those resources, which will then cause problemsat the post-acquisition integration phase.28 Furthermore, the inability toproperly identify and assess the resource architecture of organizationsmight mean that acquirers overlook potential acquisition targetsbecause they do not understand the value of the intangible resourcesthe potential target company might possess.
The best way to complete a pre-merger assessment is to create avalue creation map for the target organization and then compare itwith the value creation map of the acquiring organization. Sometimesthis might be a problem because of access restrictions to the targetorganization in the pre-merger or pre-acquisition phase. However,where the takeover is a friendly (rather than hostile) one, in most
Extracting more management insights 171
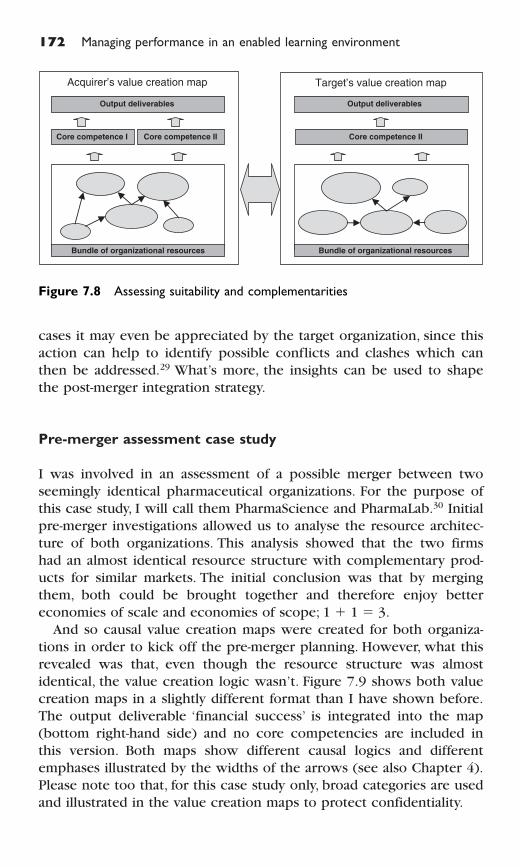
172 Managing performance in an enabled learning environment
cases it may even be appreciated by the target organization, since thisaction can help to identify possible conflicts and clashes which canthen be addressed.29 What’s more, the insights can be used to shapethe post-merger integration strategy.
Pre-merger assessment case study
I was involved in an assessment of a possible merger between twoseemingly identical pharmaceutical organizations. For the purpose ofthis case study, I will call them PharmaScience and PharmaLab.30 Initialpre-merger investigations allowed us to analyse the resource architec-ture of both organizations. This analysis showed that the two firmshad an almost identical resource structure with complementary prod-ucts for similar markets. The initial conclusion was that by mergingthem, both could be brought together and therefore enjoy bettereconomies of scale and economies of scope; 1 � 1 � 3.
And so causal value creation maps were created for both organiza-tions in order to kick off the pre-merger planning. However, what thisrevealed was that, even though the resource structure was almostidentical, the value creation logic wasn’t. Figure 7.9 shows both valuecreation maps in a slightly different format than I have shown before.The output deliverable ‘financial success’ is integrated into the map(bottom right-hand side) and no core competencies are included inthis version. Both maps show different causal logics and differentemphases illustrated by the widths of the arrows (see also Chapter 4).Please note too that, for this case study only, broad categories are usedand illustrated in the value creation maps to protect confidentiality.
Output deliverables
Core competence II
Bundle of organizational resources
Target’s value creation map
Output deliverables
Core competence I Core competence II
Bundle of organizational resources
Acquirer’s value creation map
Figure 7.8 Assessing suitability and complementarities

Extracting more management insights 173
Creating the two value creation maps revealed that in PharmaScienceeach team had one or two ‘stars’ – highly creative team leaders whogenerated much of the R&D output themselves.These individuals wereable to bring ideas together by being open-minded, but also had a verystrong ability to consolidate ideas into outputs.They were backed by aculture of support from their teams who worked towards the ideas ofone leader. Knowledge was only shared within teams and there was lit-tle knowledge sharing between teams in PharmaScience. Most teammembers had regular communications with the team leader, and mostof these communications took place face-to-face and via e-mail.
Resource interactions – Organization I (PharmaScience)
Stakeholderrelationships
Physicalinfrastructure
Practices androutines
Financialsuccess
Culture
Intellectualproperty
Resource interactions – Organisation II (PharmaLab)
Physicalinfrastructure
Practices androutines
Financialsuccess
Culture
Intellectualproperty
Humanresource
Humanresource
Stakeholderrelationships
Figure 7.9 Value creation maps for PharmaScience and PharmaLab
174 Managing performance in an enabled learning environment
The key component of this communication structure was the strongsupport culture with the team leader in the centre. The majority ofknowledge sharing was bi-directional between leader and team mem-ber, whereas there was little sharing between individual team mem-bers. Each team had shared databases, which were also used to codifyand consolidate information for the team leader to access. Much ofthe knowledge transfer was one-directional from the team member tothe team leader.
PharmaScience had a strong focus on codifying knowledge amongteam members and storing this information for the leader to access.The emphasis of the leader was then to apply this knowledge in orderto produce valuable output.The value creation map of PharmaScienceshowed how the support culture strongly influences the people, espe-cially the leaders, who then convert this gathered knowledge intointellectual property as well as directly into products and services,which generate financial success. The way team members interact issupported by practices and routines, such as regular meetings andshared databases. The physical infrastructure influences the wellbeingof the team members in PharmaScience.
Even though the resource base for PharmaLab was almost identical,the way R&D output was produced was very different. Creating thevalue creation map revealed that PharmaLab operated on a significantlydifferent model to PharmaScience. Instead of having the strong sup-port culture for the leaders, the teams in PharmaLab functioned asreal teams and freely shared knowledge within the team, as well aswith other teams in the organization. The culture was open and pro-moted the transfer of knowledge between internal and external stake-holders. This impacted the practices and routines and the way teammembers interacted. There were many more ad hoc meetingsbetween team members, and outputs and solutions were developed inteams. Team leaders had more of a coordinating role and were lessautocratic. Teams in PharmaLab developed output, which was thenturned into processes, patented, and sold. Fewer services were deliv-ered directly by the team leaders than at PharmaScience.The predomi-nant value creation logic in PharmaLab was a much more collaborativeR&D development that involved all members of the organization.
Once these differences became apparent, it was decided that amerger would not have been the best way forward.The value creationlogics were too different and it was believed that trying to mergethem would not work and, therefore, wouldn’t deliver the desiredeconomies of scope and scale. Instead, critical areas were identifiedand a joint venture approach was used to bring together some of thecore competencies of the two organizations.
Post-merger integration
Once the merger or acquisition has taken place, good post-mergerintegration is fundamental to successful M&A activity. A recent surveyby KPMG finds that two-thirds of the companies bought between1996 and 1998 still need to be properly integrated.31 However, as out-lined above, the integration process should not be a ‘salvage process’.It should be a planned process from the outset of the decision to dothe deal, i.e. part of the due diligence process, or pre-merger integra-tion planning.
The complexity, and so the difficulty, of integration tends to multi-ply with the size of the acquisition. At the lower end of the difficultyscale is the bolt-on acquisition. Here, there are usually earn-out clausesin the terms of the deal that help to retain the existing managementteam. Often, if the company being integrated is to remain a largelyindependent entity, there is not much more to do than to welcomethem to the fraternity of the larger company, integrate their financialreporting and HR administration systems with that of the acquirer,and let them get on with what they do best, although opportunitiesfor cross-selling of products or services should not be overlooked.
At the other end of the difficulty scale is the full-blown merger oftwo companies of roughly equal size and the reverse takeover of alarger company by a smaller one. The post-merger integration activityfor these latter two categories can be highly complex and may demandthe specialist expertise of an experienced team to help make the inte-gration a successful one. But, as noted above, there is historically only a50/50 chance of success. My view is that the earlier the integrationplanning process can start, the better the chances of succeeding.
Many types of mergers and acquisitions have economies of scale astheir principal raison d’etre. And so the realization of major cost sav-ings opportunities will usually be of primary importance. Cost savings,of course, come principally from sales of businesses or other tangibleassets, employee redundancies, enhanced purchasing power, and reduc-tions in working capital.They can also come from redeploying resourcesto more productive uses. Recently-merged GlaxoSmithKline reckonedit could save $400 m a year just by combining its separate R&D oper-ations and cutting out duplication – a saving, it claims, that it can thenplough back into more productive R&D.
There is an enormous amount of work to do if the full potential(and that is usually what is promised) of the merger or acquisition isto be realized. This is a massive programme of activity that will cer-tainly require a full-time project team for a period of several monthsor even years, with significant amounts of executive involvement, in
Extracting more management insights 175
order to deliver it. And, while all this is going on, the firm still needsto carry on its normal activities of delivering products and/or servicesto its customers. Savvy competitors won’t stand still in the meantimeeither. It is little wonder, therefore, that many organizations fail todeliver the promised results within the anticipated timescales andbudgets set at the outset. Let me give you an example of a typicallarge post-merger integration agenda:
� Integration of financial reporting and HR administration systems� Redesign management structure� Rationalization of overlapping functions (i.e. people)� Rationalization of overlapping facilities (i.e. buildings and equipment)� Rationalization of legal entities (i.e. subsidiaries)� Sell-off of unwanted parts of the acquired company [?]� Redundancy of excess people� Retention of key customers� Retention of key executives� Relocation of retained executives/best managers [?]� Avoid mass exodus of employees (communicate, communicate . . .)� Integrate key internal operational functions (e.g. R&D, Marketing &
Sales, Purchasing, Production, Distribution, etc.)� Integrate corporate support functions (e.g. HR, Finance, IT, etc.)� Integrate external supply chain components (e.g. dealers, distribu-
tors, suppliers)� Integrate information technology systems (e.g. different operating
systems)� Leverage increased buying power� Address regulatory compliance issues� Redesign corporate identity (e.g. if name change)
and last, but by no means least. . .� Unify internal culture of the merged company.
The last item requires some further explanation since this is one ofthe most important and distinctive intangible resources that an organ-ization possesses. When you start to meld different cultures togetherin an M&A situation, there can be problems. Culture compatibilityissues can be particularly complex for cross-border acquisitions wherethe values and practices of the different management teams can be atloggerheads, reflecting both their individual corporate cultures andtheir national cultures.The DaimlerChrysler ‘merger’ (really a takeoverof the latter by the former) was a classic example of this, with mas-sive differences in German and American attitudes to doing businessthat have taken several years to resolve.
176 Managing performance in an enabled learning environment
With this in mind, therefore, it is an indispensable pre-deal planningprocess to ensure that an evaluation of organizational compatibilitytakes place. And the value creation maps can facilitate much of thiswork. This also allows you to take a view of the nature of the targetorganization’s value proposition and relationships with its key stake-holders – for example, its investors, customers, intermediaries (deal-ers, distributors, retailers, etc.), employees, suppliers, regulators andthe communities in which it operates. Not only is the way that theserelationships are managed a good guide to the prevailing culturewithin the organization, but also this will highlight the importance ofpreserving (or improving) those relationships. It may be quite difficultto do so, for example, when substantial redundancies are planned as apart of the post-merger integration process.
Arguably then, better results should be achieved through betterplanning of post-merger integration activities prior to the deal beingexecuted. However, this is not as easy as it might seem on the surface.Practically, the planned deal may not even happen because of theintervention of another bidder or through a regulatory blockage, andso the management preparation activity could be entirely wasted; andnot many companies do enough serial major acquisitions to justifyhaving a dedicated internal post-merger integration team in placeready to deploy their expertise (whereas a small team might be justifi-able for an intended series of bolt-on acquisitions).
For merger and acquisition deals, the market-based view is mostcommonly necessary for selecting appropriate targets, but for post-merger integration it is the resource-based view that is paramount. Allfive categories of resources are vital components: monetary resources;physical resources; human resources; structural resources (such as cul-tures); and relational resources (in the context of a diverse set ofstakeholders). It is these that will, or will not, deliver the ultimatevalue proposition. Both views need to be integrated for successfulbusiness combination outcomes but, in common practice, this is cer-tainly not always the balance of priorities that is applied today.
References and endnotes
1 Heskett, J. L., Sasser, W. E. and Schlesinger, L. A. (1997). The Service
Profit Chain: How Leading Companies Link Profit and Growth
to Loyalty, Satisfaction, and Value. Simon & Schuster Inc.: New York.2 See for example: Pisano, G., Shuen,A. and Teece, D. (1997). Dynamic
Capabilities and Strategic Management. Strategic Management
Journal,Vol. 18, No. 7,Aug, p. 509; or Eisenhardt, K. M. and Martin, J.A.
Extracting more management insights 177
(2000). Dynamic Capabilities:What Are They? Strategic Management
Journal,Vol. 21, No. 10/11, Oct/Nov, p. 1105.3 Rindova, V. P. and Kotha, S. (2001). Continuous ‘Morphing’:
Competing Through Dynamic Capabilities, Form, and Function.Academy of Management Journal,Vol. 44, No. 6, Dec, p. 1263.
4 I would like to thank Dr Karim Moustaghfir for the assistance inthe work with Fujitsu, which earned him a Ph.D.
5 Preskill, H. and Torres, R.T. (1999). Evaluative Inquiry for Learning
in Organizations. Sage: Thousand Oaks.6 Ittner, C. D. and Larcker, D. F. (2003). Coming Up Short on Non-
financial Performance Measurement. Harvard Business Review,Nov, pp. 88–95.
7 Argyris, C. (1991). ‘Teaching Smart People to Learn’. Harvard
Business Review, May/June, pp. 99–109.8 Heskett, J., Sasser, E. and Schlesinger, L. (2003). The Value Profit
Chain. Free Press, New York.9 See for example: Kirn, S. P., Quinn, R. T. and Rucci, A. J. (1998). The
Employee-Customer-Profit Chain at Sears. Harvard Business Review,Vol. 76, No. 1, pp. 83–97; or Ibid, Heskett, J. L., Sasser, W. E. andSchlesinger, L.A. (1997) (see note 1 above).
10 Heskett, J. L., Sasser, W. E. and Schlesinger, L. A. (2003). The Value
Profit Chain: Treat Employees Like Customers and Customers
Like Employees. Free Press: New York, NY, p. 250.11 For the full case study see: Marr, B., Neely, A. and Schiuma, G.
(2004).The Dynamics of Value Creation: Mapping Your IntellectualPerformance Drivers. Journal of Intellectual Capital, Vol. 5, No. 2,pp. 312–25.
12 For more information see: Marr, B., Neely, A. and Schiuma, G.(2004).The Dynamics of Value Creation: Mapping Your IntellectualPerformance Drivers. Journal of Intellectual Capital, Vol. 5, No. 2,pp. 312–25.
13 The data presented in this case study was collected in 1999 and2000. The original case study was created with my colleaguesBruce Clark and Andy Neely, and presented at the 2002 PMAConference in Boston.
14 Systems of regression equations were estimated econometricallyand multiple estimation methods were used to test for sensitivityto assumptions (OLS, SUR, 2SLS, 3SLS).
15 I would like to thank my colleague Chris Adams for the valuableinput into this section. Risk management is one of his areas ofexpertise.
16 Conducted by Marsh, the world’s biggest insurance broker.17 Hamel, G. and Prahalad, C. K. (1994). Competing for the Future.
Harvard Business School Press: Boston, MA.
178 Managing performance in an enabled learning environment
18 Goldratt, E. (1984). The Goal. North River Press: New York.19 See for example: Kirn, S. P., Quinn, R. T. and Rucci, A. J. (1998). The
Employee-Customer-Profit Chain at Sears. Harvard Business
Review, Vol. 76, No. 1, pp. 83–97; or Heskett, J. L., Jones, T. O. andLoveman, G. W. (1994). Putting the Service-Profit Chain to Work.Harvard Business Review,Vol. 72, No. 2, p. 164; or Ibid, Heskett, J. L.,Sasser,W. E. and Schlesinger, L.A. (2003) (see note 10 above).
20 National Retail Security survey.21 Winter, G. (2000). Taking at the Office Reaches New Heights. New
York Times, July 12.22 Conducted by communications consultancy Hill & Knowlton and
executive headhunters Korn/Ferry (Reported in Financial Times,14 October 2003).
23 See for example: Drzik, J. and Slywotzky, A. J. (2005). Counteringthe Biggest Risk of All. Harvard Business Review, Vol. 83, No. 4,April, pp. 78–88.
24 Adapted from Adams, C. and Neely, A. (2000). Measuring Business
Combinations & Alliances, white paper.25 Adams, C. and Neely, A. (2000). The Performance Prism to Boost
M&A Success. Measuring Business Excellence, 4, 3.26 (1999). The Economist, January 9.27 See for example: James, A. D., Georghiou, L. and Metcalfe, J. S.
(1998). Integrating technology into merger and acquisition decision-making. Technovation, 18, 8/9, 563–73.
28 See for example: Sudarsanam, P. S. (1995). The Essence of Mergers
and Acquisitions, Prentice Hall; or Harrison, J. S., Hitt, M. A. andIreland, R. D. (2001). Mergers and Acquisitions, A Guide to Creating
Value for Stakeholders. Oxford University Press.29 For an interesting case example of an M&A assessment using the
intellectual capital lens see for example: Gupta, O. and Roos, G.(2001). Mergers and Acquisitions Through an Intellectual CapitalPerspective. Journal of Intellectual Capital, Vol. 2, No. 3,pp. 297–309.
30 For reasons of confidentiality I am unable to use their real names.For further information see also: Marr, B. (2004). Measuring andBenchmarking Intellectual Capital. Benchmarking – An Inter-
national Journal,Vol. 11, No. 6, pp. 559–70.31 See Financial Times, 22 February 2002.
Extracting more management insights 179

This page intentionally left blank

Part III
Automation of Strategic
Performance Management
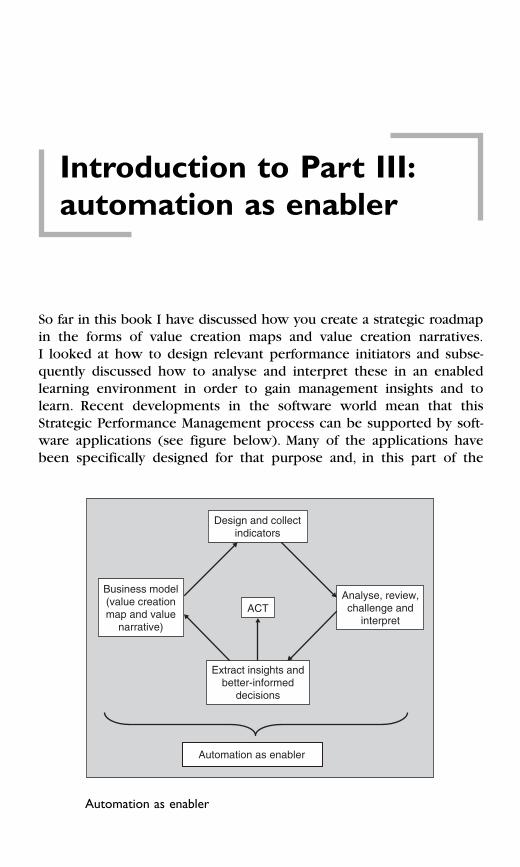
Design and collectindicators
Analyse, review,challenge and
interpret
Extract insights andbetter-informed
decisions
ACT
Business model(value creationmap and value
narrative)
Automation as enabler
Automation as enabler
Introduction to Part III:
automation as enabler
So far in this book I have discussed how you create a strategic roadmapin the forms of value creation maps and value creation narratives.I looked at how to design relevant performance initiators and subse-quently discussed how to analyse and interpret these in an enabledlearning environment in order to gain management insights and tolearn. Recent developments in the software world mean that thisStrategic Performance Management process can be supported by soft-ware applications (see figure below). Many of the applications havebeen specifically designed for that purpose and, in this part of the
Introduction to Part III: automation as enabler 183
book, I will take a closer look at what these applications can andcan’t do. Also, in the Appendix, I provide a framework that will helpyou to select the most appropriate tool for your organization.
However, before I discuss the benefits of, and selection criteria for,Strategic Performance Management software applications, I would liketo give you an important word of warning. Even though software appli-cations can be a powerful enabler of the Performance Managementprocess, this does not mean that these applications can do the work foryou.The key is to design unique value creation logics and then developidiosyncratic indicators that help you make better strategic decisions.
There is no short cut to this. My advice would be to run away veryquickly if software salesmen are trying to tell you otherwise.There areno industry templates and no magic off-the-shelf Strategic PerformanceManagement frameworks. And there are no lists of 10 key perform-ance indicators that you can take off a database and then start yourPerformance Management initiative.
However, implemented correctly and following the principles out-lined in this book, automation will allow you to unleash the full powerof Strategic Performance Management. It will give all employees accessto customized Performance Management data in their preferred formats,and it will allow collaborations, powerful analyses, and data integra-tion to provide a single version of the truth.
I recently conducted a study of the current Strategic PerformanceManagement practices among the 5000 largest companies in the UnitedStates.1 This study confirmed the power of Strategic Performance Man-agement applications. The study revealed that users of specializedStrategic Performance Management applications were most satisfied;whereas those organizations still using spreadsheets were the least sat-isfied. Many believed spreadsheets were inappropriate tools for StrategicPerformance Management. Shockingly, the study found that almost halfof the firms are still using spreadsheet applications, such as MicrosoftExcel, as their main tool for Strategic Performance Management. How-ever, many organizations are realizing that those solutions are toocumbersome, labour-intensive and unreliable.And many organizations arecurrently looking for appropriate replacements.The major disadvantagesof spreadsheet-based Strategic Performance Management solutions are:2
1 No scalability. Systems quickly reach the capacity desktop spread-sheets can handle. Performance Management spreadsheets can growinto big documents with colour coding, macros, calculations, etc.I have seen various spreadsheet-based applications become slow andprone to crashes. Often, there was just too much data and complexityin the spreadsheet, which wasn’t designed for that purpose.
184 Automation of Strategic Performance Management
2 Time-consuming to update. Spreadsheet-based solutions are usuallymanually fed and updated. In one organization that approached me, abusiness analyst spent about 2 months every quarter ‘updating thespreadsheets’. This is not only slow but also leaves immense roomfor errors.A KPMG study conducted in 1997 found that over 90% ofexisting spreadsheets contain mistakes!3
3 No collaboration and communication support. Information kept inindividual spreadsheets is not designed for collaboration or com-munication. The spreadsheets are often scattered around on differ-ent machines, and it requires enormous discipline to work from thesame spreadsheet.
4 Difficult analysis. Analysis is complicated for the reason that data isstored in individual spreadsheets; it is difficult and time-consumingto bring them together for analysis across more than one data-set.
Spreadsheet-based solutions are not really a workable option for anyorganization that is serious about Strategic Performance Management.For organizations that want to unleash the full potential of StrategicPerformance Management, there is no alternative to installing purpose-built software applications. However, before I move on to discuss soft-ware application in more detail, it is important to note one other thing:implementing Strategic Performance Management is not an IT project!Turning it into one will jeopardize the entire development efforts.4
Software will always only be an enabler and enhancer.This means thatif the foundations of the Strategic Performance Management approachare weak, the automation will be too.
References and endnotes
1 Marr, B. (2004). Business Performance Management – The State
of the Art. Hyperion Solutions and Cranfield School of Management:London.
2 Marr, B. and Neely, A. (2003). Automating Your Scorecard: TheBalanced Scorecard Software Report. Stamford, CT: Gartner, Inc.and Cranfield School of Management; Marr, B. and Neely, A. (2001).The Balanced Scorecard Software Report. Stamford, CT: Gartner,Inc. and Cranfield School of Management.
3 See for example: http://www.kpmg.co.za4 Marr, B. (2001). Scored for Life. Financial Management,
30 (1), April, pp. 14–17.
8
Benefits of automation
Implementing organization-wide Strategic Performance Management ini-tiatives requires IT support. So-called Strategic Performance Managementsolutions help to integrate data from disparate sources, enable organ-izations to analyse the data across all strategic elements, and mostimportantly allow collaboration and communication of the strategiclogic and key objectives organization-wide. This chapter discusses thebenefits of implementing a software application and the subsequentappendix introduces a framework that will assist you in the selectionprocess to find the most appropriate automation solution for you.Selecting the right application is critical for a successful implementa-tion. However, the fact that there are many different vendors, who alloffer quite diverse solutions, can make this a difficult task. Questionsaddressed in this chapter include:
� What are the benefits of Strategic Performance Management softwareapplications?
� How can Strategic Performance Management software support col-laboration and communication?
� How can Strategic Performance Management software support dataanalysis and extracting insights?
� How can Strategic Performance Management software help to inte-grate and manage data?
The software market for Strategic Performance Management applica-tions is growing constantly. Today, there are many vendors trying toget their share of the multi-billion dollar analytic application market.Paper and pencil, or simple spreadsheet tools might be sufficient atthe beginning when organizations start to design their Strategic Perform-ance Management approaches. However, in order to make Strategic
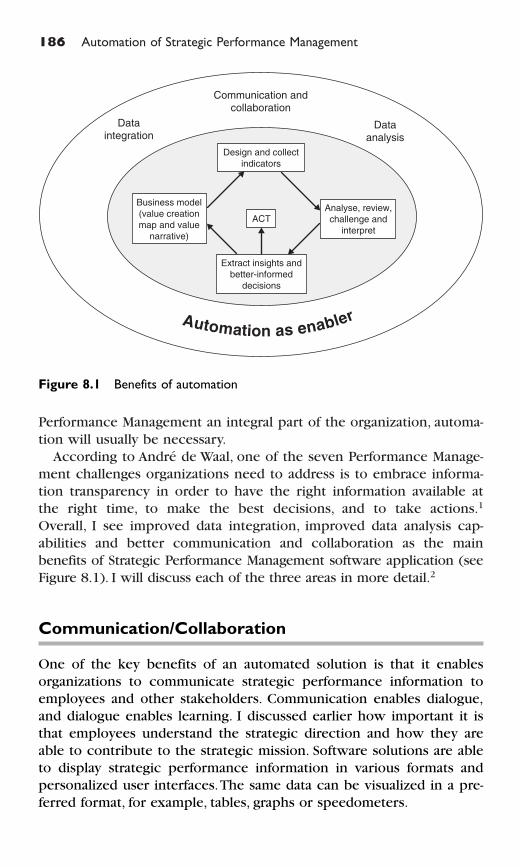
186 Automation of Strategic Performance Management
Performance Management an integral part of the organization, automa-tion will usually be necessary.
According to André de Waal, one of the seven Performance Manage-ment challenges organizations need to address is to embrace informa-tion transparency in order to have the right information available atthe right time, to make the best decisions, and to take actions.1
Overall, I see improved data integration, improved data analysis cap-abilities and better communication and collaboration as the main benefits of Strategic Performance Management software application (seeFigure 8.1). I will discuss each of the three areas in more detail.2
Communication/Collaboration
One of the key benefits of an automated solution is that it enablesorganizations to communicate strategic performance information toemployees and other stakeholders. Communication enables dialogue,and dialogue enables learning. I discussed earlier how important it isthat employees understand the strategic direction and how they areable to contribute to the strategic mission. Software solutions are ableto display strategic performance information in various formats andpersonalized user interfaces.The same data can be visualized in a pre-ferred format, for example, tables, graphs or speedometers.
Communication andcollaboration
Dataintegration
Dataanalysis
Design and collect
indicators
Analyse, review,
challenge and
interpret
Extract insights and
better-informed
decisions
ACT
Automation as enabler
Business model
(value creation
map and value
narrative)
Figure 8.1 Benefits of automation
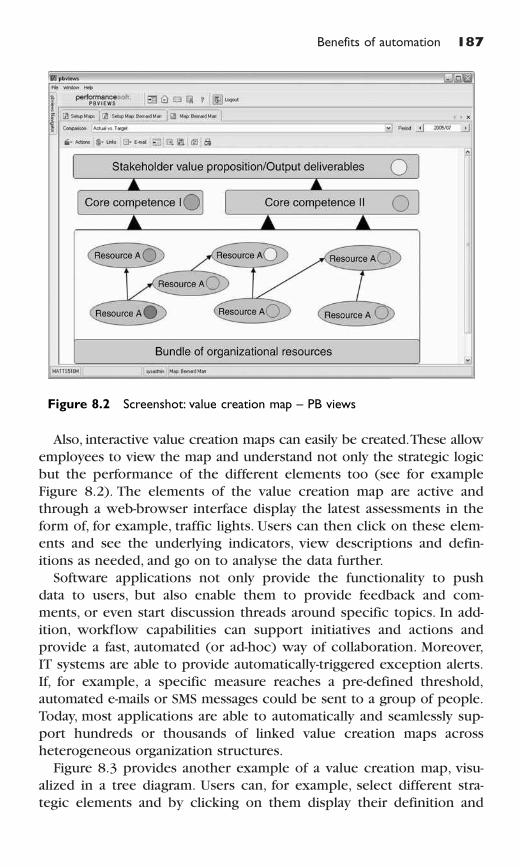
Benefits of automation 187
Also, interactive value creation maps can easily be created.These allowemployees to view the map and understand not only the strategic logicbut the performance of the different elements too (see for exampleFigure 8.2). The elements of the value creation map are active andthrough a web-browser interface display the latest assessments in theform of, for example, traffic lights. Users can then click on these elem-ents and see the underlying indicators, view descriptions and defin-itions as needed, and go on to analyse the data further.
Software applications not only provide the functionality to pushdata to users, but also enable them to provide feedback and com-ments, or even start discussion threads around specific topics. In add-ition, workflow capabilities can support initiatives and actions andprovide a fast, automated (or ad-hoc) way of collaboration. Moreover,IT systems are able to provide automatically-triggered exception alerts.If, for example, a specific measure reaches a pre-defined threshold,automated e-mails or SMS messages could be sent to a group of people.Today, most applications are able to automatically and seamlessly sup-port hundreds or thousands of linked value creation maps across heterogeneous organization structures.
Figure 8.3 provides another example of a value creation map, visu-alized in a tree diagram. Users can, for example, select different stra-tegic elements and by clicking on them display their definition and
Figure 8.2 Screenshot: value creation map – PB views
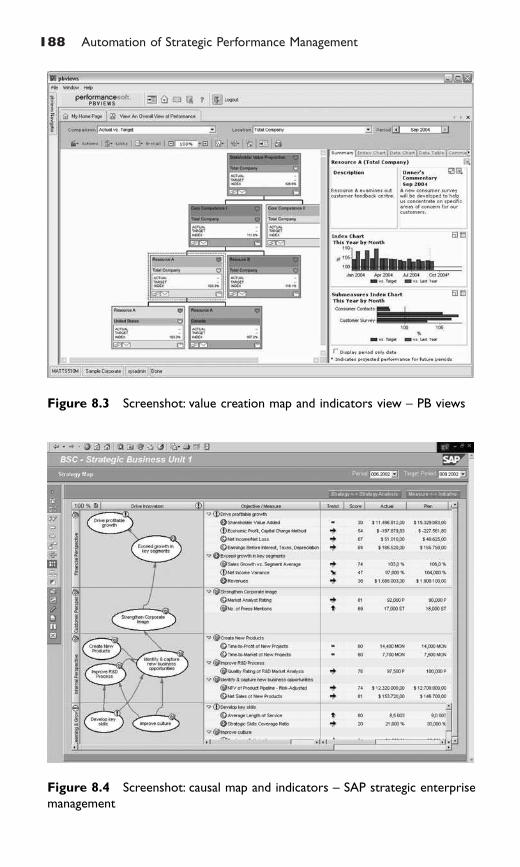
188 Automation of Strategic Performance Management
Figure 8.3 Screenshot: value creation map and indicators view – PB views
Figure 8.4 Screenshot: causal map and indicators – SAP strategic enterprise
management
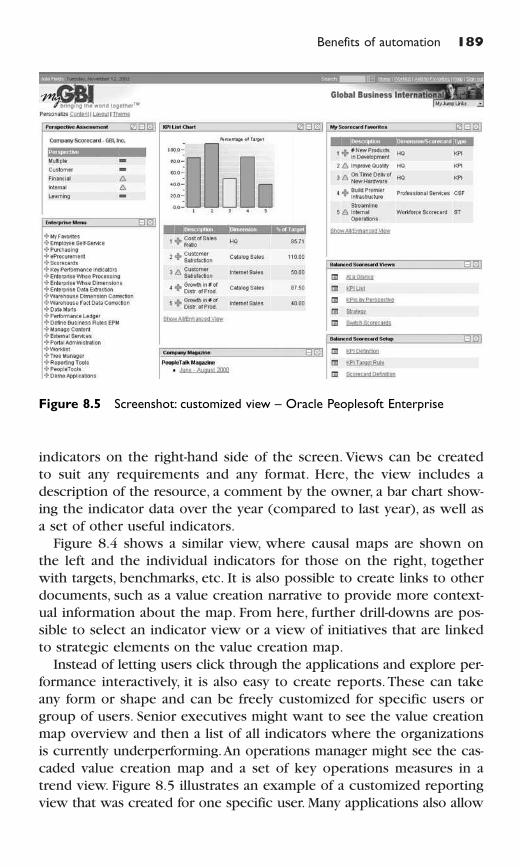
Benefits of automation 189
indicators on the right-hand side of the screen. Views can be createdto suit any requirements and any format. Here, the view includes adescription of the resource, a comment by the owner, a bar chart show-ing the indicator data over the year (compared to last year), as well asa set of other useful indicators.
Figure 8.4 shows a similar view, where causal maps are shown onthe left and the individual indicators for those on the right, togetherwith targets, benchmarks, etc. It is also possible to create links to otherdocuments, such as a value creation narrative to provide more context-ual information about the map. From here, further drill-downs are pos-sible to select an indicator view or a view of initiatives that are linkedto strategic elements on the value creation map.
Instead of letting users click through the applications and explore per-formance interactively, it is also easy to create reports. These can takeany form or shape and can be freely customized for specific users orgroup of users. Senior executives might want to see the value creationmap overview and then a list of all indicators where the organizationsis currently underperforming.An operations manager might see the cas-caded value creation map and a set of key operations measures in atrend view. Figure 8.5 illustrates an example of a customized reportingview that was created for one specific user. Many applications also allow
Figure 8.5 Screenshot: customized view – Oracle Peoplesoft Enterprise
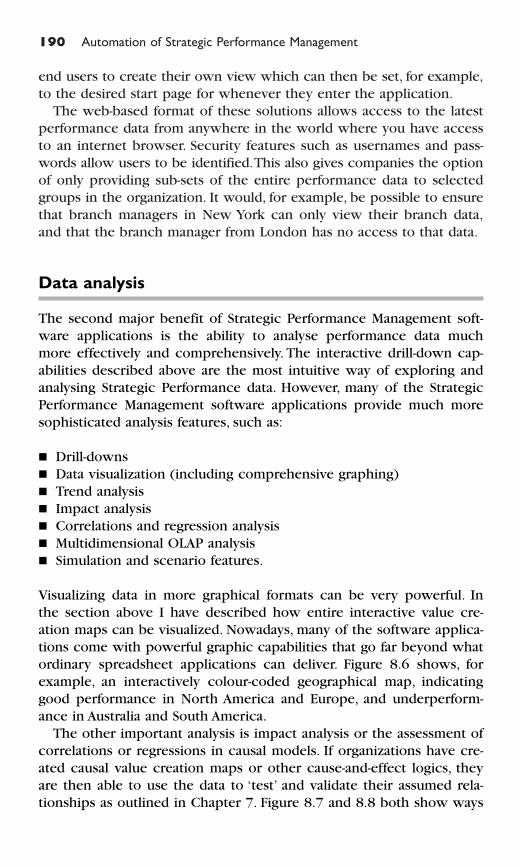
190 Automation of Strategic Performance Management
end users to create their own view which can then be set, for example,to the desired start page for whenever they enter the application.
The web-based format of these solutions allows access to the latestperformance data from anywhere in the world where you have accessto an internet browser. Security features such as usernames and pass-words allow users to be identified.This also gives companies the optionof only providing sub-sets of the entire performance data to selectedgroups in the organization. It would, for example, be possible to ensurethat branch managers in New York can only view their branch data,and that the branch manager from London has no access to that data.
Data analysis
The second major benefit of Strategic Performance Management soft-ware applications is the ability to analyse performance data muchmore effectively and comprehensively. The interactive drill-down cap-abilities described above are the most intuitive way of exploring andanalysing Strategic Performance data. However, many of the StrategicPerformance Management software applications provide much moresophisticated analysis features, such as:
� Drill-downs� Data visualization (including comprehensive graphing)� Trend analysis� Impact analysis� Correlations and regression analysis� Multidimensional OLAP analysis� Simulation and scenario features.
Visualizing data in more graphical formats can be very powerful. Inthe section above I have described how entire interactive value cre-ation maps can be visualized. Nowadays, many of the software applica-tions come with powerful graphic capabilities that go far beyond whatordinary spreadsheet applications can deliver. Figure 8.6 shows, forexample, an interactively colour-coded geographical map, indicatinggood performance in North America and Europe, and underperform-ance in Australia and South America.
The other important analysis is impact analysis or the assessment ofcorrelations or regressions in causal models. If organizations have cre-ated causal value creation maps or other cause-and-effect logics, theyare then able to use the data to ‘test’ and validate their assumed rela-tionships as outlined in Chapter 7. Figure 8.7 and 8.8 both show ways
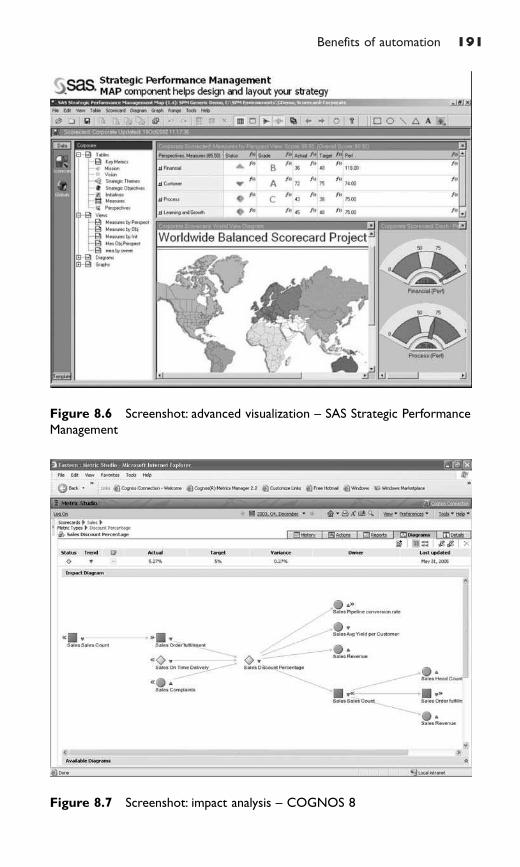
Benefits of automation 191
Figure 8.6 Screenshot: advanced visualization – SAS Strategic Performance
Management
Figure 8.7 Screenshot: impact analysis – COGNOS 8
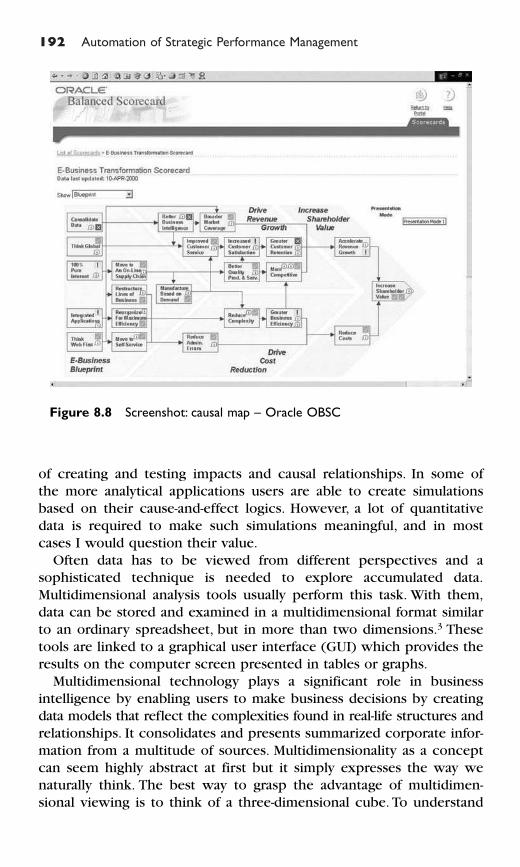
192 Automation of Strategic Performance Management
Figure 8.8 Screenshot: causal map – Oracle OBSC
of creating and testing impacts and causal relationships. In some ofthe more analytical applications users are able to create simulationsbased on their cause-and-effect logics. However, a lot of quantitativedata is required to make such simulations meaningful, and in mostcases I would question their value.
Often data has to be viewed from different perspectives and asophisticated technique is needed to explore accumulated data.Multidimensional analysis tools usually perform this task. With them,data can be stored and examined in a multidimensional format similarto an ordinary spreadsheet, but in more than two dimensions.3 Thesetools are linked to a graphical user interface (GUI) which provides theresults on the computer screen presented in tables or graphs.
Multidimensional technology plays a significant role in businessintelligence by enabling users to make business decisions by creatingdata models that reflect the complexities found in real-life structures andrelationships. It consolidates and presents summarized corporate infor-mation from a multitude of sources. Multidimensionality as a conceptcan seem highly abstract at first but it simply expresses the way wenaturally think. The best way to grasp the advantage of multidimen-sional viewing is to think of a three-dimensional cube. To understand
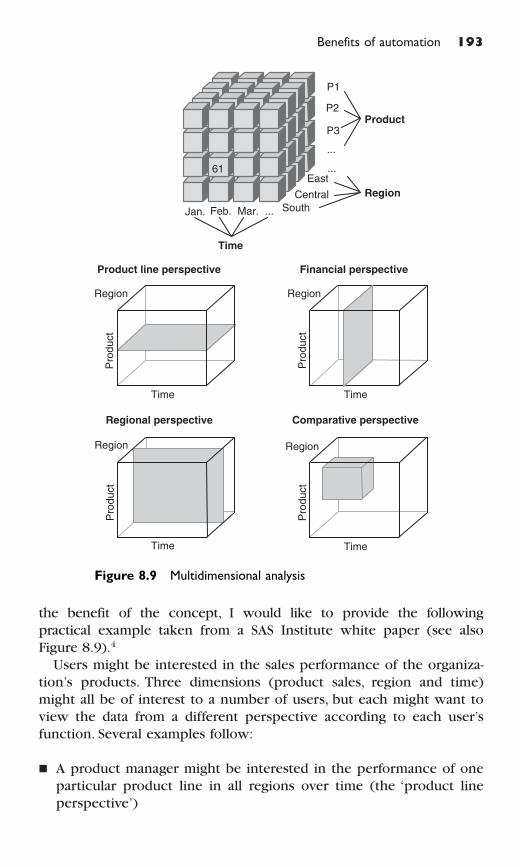
Benefits of automation 193
the benefit of the concept, I would like to provide the followingpractical example taken from a SAS Institute white paper (see alsoFigure 8.9).4
Users might be interested in the sales performance of the organiza-tion’s products. Three dimensions (product sales, region and time)might all be of interest to a number of users, but each might want toview the data from a different perspective according to each user’sfunction. Several examples follow:
� A product manager might be interested in the performance of oneparticular product line in all regions over time (the ‘product lineperspective’)
Pro
duct
Financial perspectiveProduct line perspective
Regional perspective Comparative perspective
Time
Pro
duct
Pro
duct
Pro
duct
TimeTime
Time
Region Region
Region Region
Time
Jan. Feb. Mar. ...
East
Central
South
...
Region
61
P2
P3
...
Product
P1
Figure 8.9 Multidimensional analysis
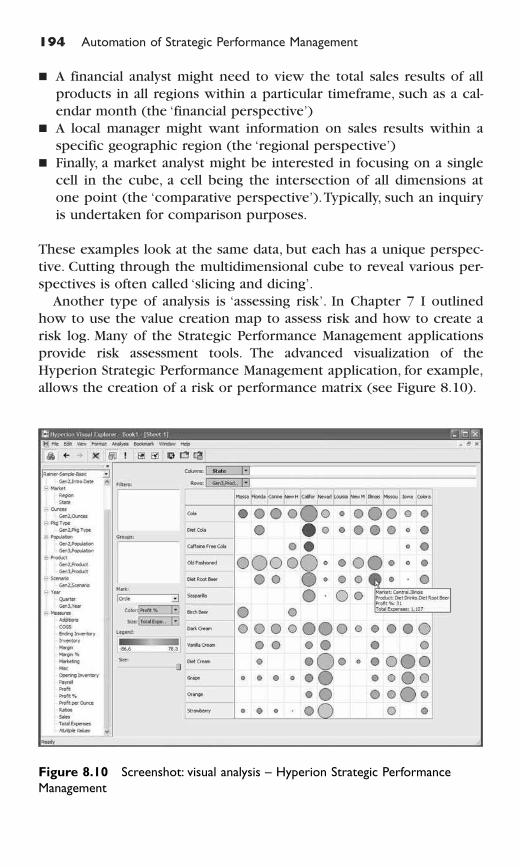
194 Automation of Strategic Performance Management
� A financial analyst might need to view the total sales results of allproducts in all regions within a particular timeframe, such as a cal-endar month (the ‘financial perspective’)
� A local manager might want information on sales results within aspecific geographic region (the ‘regional perspective’)
� Finally, a market analyst might be interested in focusing on a singlecell in the cube, a cell being the intersection of all dimensions atone point (the ‘comparative perspective’).Typically, such an inquiryis undertaken for comparison purposes.
These examples look at the same data, but each has a unique perspec-tive. Cutting through the multidimensional cube to reveal various per-spectives is often called ‘slicing and dicing’.
Another type of analysis is ‘assessing risk’. In Chapter 7 I outlinedhow to use the value creation map to assess risk and how to create arisk log. Many of the Strategic Performance Management applicationsprovide risk assessment tools. The advanced visualization of theHyperion Strategic Performance Management application, for example,allows the creation of a risk or performance matrix (see Figure 8.10).
Figure 8.10 Screenshot: visual analysis – Hyperion Strategic Performance
Management
Benefits of automation 195
Data integration and data management
The data issue is important in any comprehensive PerformanceMeasurement system. Any Strategic Performance Management applica-tion must be fed with the relevant data. Since a Strategic PerformanceManagement system provides a holistic view of performance, it needsto bring together data from very different organizational units anddepartments. A Strategic Performance Management software solutionshould work in harmony with existing data sources to fulfil its func-tion as a data integrator.
Managers often believe that it is just a matter of connecting to theexisting databases and then pulling out the data into the StrategicPerformance Management application. However, the efforts necessaryto integrate and collect data from disparate sources are often under-estimated. And more importantly, a lot of the performance datarequired is not readily available in existing databases. From my experi-ence, on average only about 20–30% of the required data is held inexisting databases.
The first step, therefore, is to find out which information is relevantand required, whether the data already exists and, if so, where it isstored and how the data can be accessed. Most organizations havemade significant investments in data warehouses, data marts andenterprise resource planning (ERP) systems, which means that a con-siderable portion of the required information can come directly fromthese back-office systems.
However, as mentioned above, a significant amount of informationwill usually come from office applications, such as Microsoft Excel,where the data is stored in spreadsheets. Increasingly there will alsobe data from third-party providers that has to be fed into an applica-tion.Third-parties could provide, for example, any benchmark informa-tion, customer satisfaction information, or brand and reputation data.Many organizations also outsource their employee satisfaction sur-veys. A large part of the organizational performance data may have tobe entered manually into the system, either because it is non-existentor because it is not stored in the available IT systems.Tapping into dif-ferent data sources and creating automated feeds is not a trivial taskand it is important, therefore, to ask yourself whether it is really neces-sary (and economical) to connect databases.
For Strategic Performance Management, the data is usually inte-grated into a single database or data warehouse, and therefore this cre-ates a single view of ‘the truth’.The Strategic Performance Managementsolution, however, is more than just a data repository. It should be a
196 Automation of Strategic Performance Management
tool to store and share information in order to turn it into knowledgeand learning. In their book Working Knowledge, Tom Davenport andLarry Prusak distinguish between data, information and knowledge.5
Data is just a structured record, with no meaning attached to it.Information, on the other hand, is a message that puts data into a con-text. It has a sender and a receiver and is meant to ‘inform’. It thereforeaims to influence or change the way the receiver perceives some-thing. Knowledge is what we make of the information. When we takeon information, we blend it with our experience and values in orderto turn it into actionable routines, processes, practices or norms.
Strategic Performance Management solutions are not just a big data-base full of numbers.They also hold, for example, visualizations, defin-itions, descriptions, comments, discussion threads, and action plans.These provide the rich contextual information that allows us to makesense of the data and turn it into actionable knowledge and learning –which is the key objective of Strategic Performance Management.
In summary, Strategic Performance Management solutions help us to:
1 integrate data and manage data and information2 analyse and visualize data in the most appropriate ways, and3 facilitate communication and collaboration.
They therefore support Strategic Performance Management initiativesand facilitate better-informed decision-making and organizationallearning.
References and endnotes
1 de Waal, A. A. (2001). Power of Performance Measurement: How
Leading Companies Create Sustained Value.Wiley: New York.2 Marr, B. and Neely,A. (2002). Software for Measuring Performance.
In Handbook of Performance Measurement, 2nd edn, (M. Bourne,ed.) pp. 210–41, Gee: London.
3 Creeth, R. and Pendse, N. (1999). The OLAP Report. London:Business Intelligence.
4 King, R., McIntyre, J., Moormann, M., and Walker, E. (1996). AFormula of OLAP Success. www.sas.com
5 Davenport, T. H. and Prusak, L. (1998). Working Knowledge: How
Organizations Manage What They Know. Harvard BusinessSchool Press: Boston, MA.
Appendix
Selecting the appropriate
software solution1
The market for software solutions is growing rapidly.You only need toturn to the internet, search on Strategic Performance Management soft-ware solutions, and you will easily find in excess of 25 different vendorsall of whom are willing to offer you a Performance Management appli-cation. Each vendor will claim unique advantages and features of theirparticular product, and each vendor will be able to provide credentialsfrom satisfied users. Managers looking for an appropriate solution fortheir organization often have little to base their decision on or few toolsto distinguish the various vendors. Here, I will address these issuesand provide you with an overview of the application market as wellas a framework of how to select the most suitable solution for yourorganization. Questions I will address in this appendix include:
� Is it better to buy a packaged solution or build your own?� How can we distinguish between the different products?� What credible vendors offer solutions?� How can you create your own list of requirements?
One of the first questions you will be faced with is: do I buy a packagedapplication from a specialized vendor or do I build my own? Someorganizations choose to develop their own software. The ‘create yourown’ solution allows organizations to address their unique needs andobjectives; however, it is generally more cost-effective to purchase apackaged application rather than to create your own.2 Besides thecost factors, packaged applications are usually quicker to implementwith vendors offering a wide variety of ancillary services such as conversion assistance, implementation training and system integration.
These packages also tend to represent the cumulative efforts of manyindividuals and organizations over a longer period of time, which usu-ally results in better, more user-friendly applications than most first-time attempts to create ‘home grown’ applications.
DaimlerChrysler, for example, initially decided to develop their ownsolution.The problem was that it took 5–10 people over 18 months todevelop the first, dubbed application. On the other hand, companiessuch as Skandia and Ericsson developed their own solutions and thenlater converted their developments into a product. Both have spun off acompany which now sells the software solution to other organizations.
The various reasons for choosing a packaged application as opposedto “self-made” solutions are summarized below.2
Reasons for choosing a packaged application:
� When there is a packaged application that fits nicely with the func-tional requirements of your organization
� When there is no wish or no possibility to heavily rely on internalIT resources for creating a customized solution
� For prototyping, light-weight packaged applications can be used to‘test’ different functionality before starting a full-blown automation.
Reasons for choosing a ‘home-grown’ solution:
� Functional criteria are not met by packaged applications� There may be Business Intelligence software available within your
organization that supports much of the functionality required� A wish for total integration of the existing planning and control
and/or knowledge management procedures, methodologies andtools within your organization.
Unless you have a lot of unused IT resources and an extremely goodunderstanding of functionality I would always recommend going for apackaged application.
Once you have decided to go for a packaged application, there aresome bigger choices to be made about:
� Implementation – what is your desired scope of the softwareimplementation?
� Integration – how deeply do you want to integrate the softwarewith operational and transactional systems?
� Customization and IT support/skills – to what extent do you needor want the software to be customized?
198 Appendix Selecting the appropriate software solution
Scope of the implementation
The scope of the implementation can be very different and variousvendors have different understandings of how much (or little) thescope of implementation should be.The smallest implementation scopewould be an off-the-shelf point solution that runs as a stand-aloneapplication on a PC and might replace an Excel spreadsheet by offeringmore specific functionality. These packages are usually quite inex-pensive and can be bought ready to use.The advantage is that you canstart using the software straight away, usually by inputting the datamanually.
To increase the scope, vendors offer a broader set of applicationswhich are likely to access a similar set of data.Those applications could,for example, include risk management, activity-based costing (ABC) oractivity-based management (ABM) solutions, planning and budgetingapplication as well as solutions for stakeholder relationship management(SRM), process mapping, workflow management, customer relation-ship management (CRM) or business consolidation. The implementa-tion scope broadens when companies also try to support some of theother applications or solutions. The broadest scope would be an inte-grated suite that offers all the functionality mentioned above. With anincreasing implementation scope there is also a rising need for tech-nical solutions like data warehouses or multidimensional databases thathold the data for the applications.
Organizations that are planning to purchase a software solutionshould consider the implementation scope, not only for the initial imple-mentation but also taking into account future plans.You might want tostart with simple reporting and analysis functionality but later expandthe solution to additional functionality. For example, many organizationsalready have applications for planning and budgeting or CRM in place.In this case they might want to ensure that the new application they arepurchasing is compatible with the applications already in place. Quite afew of the stand-alone solution providers have entered partnershipswith other third-party vendors in order to be able to offer native linksto products like ABM or CRM software.
Degree of integration
The degree of integration refers to how deeply the software is inte-grated with underlying operational systems like manufacturing systems,order entry, account systems, general ledger, purchasing, warehousing,human resource systems or general ERP systems.
Appendix Selecting the appropriate software solution 199
The data required for the applications often resides in the under-lying operational systems and databases. Full integration or ‘closed-loop’integration would mean that the application is seamlessly integratedwith the underlying operational systems and data can be fed automat-ically in either direction – from the underlying operational systems tothe application and vice versa.
The products on offer vary in their integration ability. Basic stand-alone applications might offer no integration capabilities with under-lying systems and are not designed for automated data feeds, but manualdata transfer.These systems, however, might offer integration on an ana-lytical level.This would mean users can analyse the existing data in thesystem through drill-downs, e.g. from an aggregate high-level perform-ance indicator to underlying indicators, by querying a database. If thesoftware application does not offer this capability it can be achievedby using Business Intelligence applications. Some applications offerintegration with business intelligence tools. Other applications aredesigned for full integration and do not even allow manual data input.As discussed in Chapter 8, I think manual data input is usually requiredand you might not need a lot of integration. It is important to reallythink about the level of integration you require.
Required customization and IT support
You also need to look at the required customization and the requiredIT support. Not all products in the marketplace were developed asapplications; some are more generic business intelligence tools thatallow organizations to customize their applications. Some of the moreadvanced products offer things like wizards that guide users throughparts of the design process for value creation maps or indicators.Other products offer little or no such guidance.
There are several issues you might want to consider before makingthe decision. The advantage of a ready-made application is that itincludes all the methodological intelligence as well as the input ofexperts.The downside might be that the methodology does not 100%fit with the methodology your organization would like to implement.If your organization has specific requirements which cannot be foundin any of the more advanced solutions it might be a reason for usingmore generic business intelligence tools. However, nowadays, most ofthe packaged applications offer enormous flexibility to be customizedto your requirements.
Besides using more generic business intelligence applications tocreate customized solutions you can also use vendors or consultants
200 Appendix Selecting the appropriate software solution
to customize solutions for you. There are a few management consult-ancies that specialize in customizing applications by using their ownor various third-party software components.This might be an option ifan organization lacks internal expertise in methodology or has not gotthe internal IT resources to support the internal developments.
Having thought about all the above, you are still left with too manychoices. So how do you know which of the different vendors to gowith? How do you cut down the list from 25 to 3 that you mightwant to put on a shortlist? What is the process of making the rightdecision about selecting the appropriate solution? In the next sectionI will present a framework that will assist you in the decision process.
SOFTWARE SELECTION FRAMEWORK
Selecting the right software solution is a major decision for mostorganizations.The prices for software solutions vary enormously froma few thousand US dollars to far over a million US dollars. A realisticstarting price lies at about $30 000 with typical spends in the regionof $200 000 for reasonably sized organizations. Making the wrongdecision, buying the wrong software, can not only result in a signifi-cant waste of time, energy and money, but can also undermine theentire effort and the credibility of the Performance Management sys-tem you are trying to put in place.
The starting point for any selection process has to be to recognizethat each organization has a unique set of requirements for its approach.It is therefore not possible to provide a list of requirements that isappropriate for every organization. Organizations differ in terms of size,IT infrastructure, communication style, required level of security, cashposition, strategic design, IT literacy, in-house capabilities, etc.All theseaspects affect the selection criteria of an appropriate software solution.For the purpose of developing a selection framework this means that Ican present the criteria you need to consider, but then you have todecide what you need and weigh each of the criteria to reflect yourunique set of requirements.
Following the same logic, each of the different software solutions avail-able has different strengths and weaknesses. Particular packages willbe relevant for certain organizations, while they may be completelyinappropriate for others.
It is therefore best to start with identifying what you really want andneed and then see whether that is available from packaged applica-tions.The easiest way to do this is to create a two-directional matrix inwhich you put weightings against each criteria. This matrix can then
Appendix Selecting the appropriate software solution 201
be used to compare available software products against the organiza-tional requirements (for an example, see Figure 9.1). In the followingsections I will define and explain each of the ten selection criteriayou should think about before choosing a software application.
Company and product
First it is a good idea to check basic company information about thevendor as well as information about the software product. The mainaspect here is the pricing, since prices as well as pricing models varysignificantly. Here it is important to check not just license fees butalso maintenance fees, which can fluctuate between 10–25% of thelicense fees. Software pricing is a complex issue and different pricingmodels might suit one organization better than others, e.g. pricing peruser versus pricing per package. However, software companies areoften flexible in their pricing and pricing models are subject to nego-tiation. It is also important to consider training and implementationcosts as they can drastically increase the overall price of solutions, butoften remain initially hidden.
As for the vendor company it might be good to understand thebackground of the company and the product, and how many peoplework on the solution. Very large software companies might have onlya few people working on their application, which might be treated asa by-product. On the other hand, a small company that specializes insoftware might have more expertise and a larger client list. The sizeand global presence of a software vendor might be important if organ-izations plan to implement the application globally or across coun-tries. Organizations might want to check the economic viability of thevendor considering recent collapses and mergers in this market.
Scalability
In order to assess the required scalability it is important to considerthe final implementation scope. Companies might initially only auto-mate one department or business unit but later plan to roll it outorganization-wide. There are three aspects of scalability. (1) The appli-cation should be scalable in terms of programming. It should, forexample, be easy to add new cascaded value creation maps. (2) Theunderlying database should be scalable since the amount of data andinformation accumulates quickly. (3) The communication approachshould be scalable so that it is easy to disseminate the informationthrough, for example, the Web browser. Language can also be an issue
202 Appendix Selecting the appropriate software solution
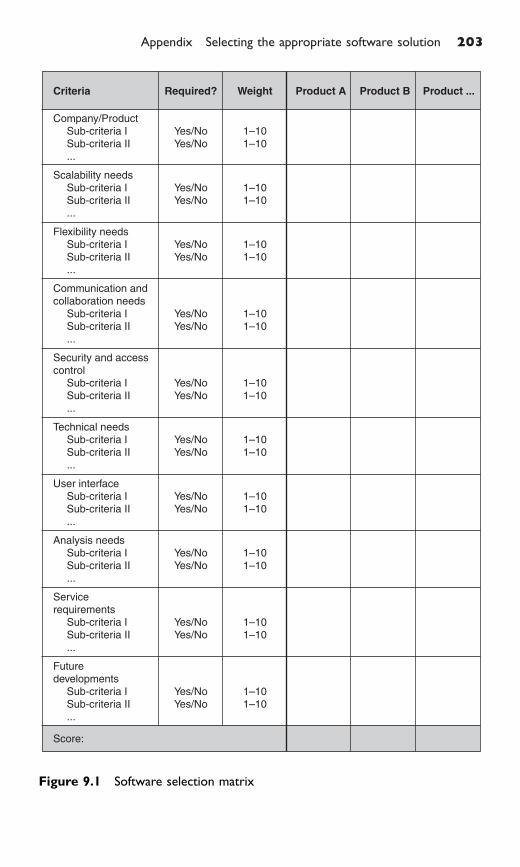
Appendix Selecting the appropriate software solution 203
Score:
Company/Product Sub-criteria I Sub-criteria II ...
Yes/NoYes/No
1–101–10
Scalability needs Sub-criteria I Sub-criteria II ...
Yes/NoYes/No
1–101–10
Flexibility needs Sub-criteria I Sub-criteria II ...
Yes/NoYes/No
1–101–10
Communication andcollaboration needs Sub-criteria I Sub-criteria II ...
Yes/NoYes/No
1–101–10
Security and accesscontrol Sub-criteria I Sub-criteria II ...
Yes/NoYes/No
1–101–10
Technical needs Sub-criteria I Sub-criteria II ...
Yes/NoYes/No
1–101–10
User interface Sub-criteria I Sub-criteria II ...
Yes/NoYes/No
1–101–10
Analysis needs Sub-criteria I Sub-criteria II ...
Yes/NoYes/No
1–101–10
Servicerequirements Sub-criteria I Sub-criteria II ...
Yes/NoYes/No
1–101–10
Futuredevelopments Sub-criteria I Sub-criteria II ...
Yes/NoYes/No
1–101–10
Criteria Required? Weight Product A Product B Product ...
Figure 9.1 Software selection matrix
for international organizations and they might want to check whetherthe application comes in various languages.
Flexibility and customization
This is an important aspect and nowadays organizations are less willingto invest in applications that are not, for example, able to integrate withother applications. Many tools provide interfaces with reporting pack-ages, activity-based costing solutions, CRM or planning tools. Flexibilityshould also be provided in terms of methodology support. Many organ-izations have multiple Performance Measurement and reporting needs;besides their strategic value creation map they might also want to usethe software for frameworks such as other business scorecards or assess-ment frameworks (e.g. Baldrige National Quality Award, EFQM Award,Deming Prize, Investors in People, etc.). It usually makes sense to use thesame application for all the Performance Measurement and reportingneeds.
Communication and collaboration
The communication aspect of any implementation is key. Organizationshave to address issues such as: do you want the software to be web-enabled, or even WAP enabled? Do you want users to be able to com-ment on any aspect of the strategy? Or do you want to restrict thecommentary to any group, e.g. managers responsible for certain aspectsin the strategy? For the majority of implementations it is important thatthe application integrates with the existing e-mail system so that alerts,reminders, assessments, and comments can be sent to specific users.
Most software solutions are able to trigger automated alerts, e-mailsor SMS messages, which can be sent to individuals or groups indicat-ing that certain areas of the business are under-performing and actionis required. Most applications allow you to assign owners (and per-sons responsible for data entry) in order to automate the data collec-tion and remind them if data, comments, or assessments have notbeen entered. You might want the software to support action andinclude activity or project management functionality that allows youto track progress against strategic objectives. Some organizations loveand fully embrace this data-push concept and workflows, whereasothers feel that such an approach is too intrusive and doesn’t fit withtheir current culture. Sometimes it is a good idea to start without theautomated e-mails and let people get used to the system and the infor-mation first.
204 Appendix Selecting the appropriate software solution
Security and access control
You need to decide about the level of security needed in the system;some organizations are very open and openly share all aspects of theirstrategic performance with all employees; others require very tightsecurity.
Technical specifications
The technical requirements depend on the existing information andcommunication infrastructure in your organization. Any new piece ofsoftware should support the existing desktop or network operatingsystem. For an application it can be important to be able to extractdata from existing data sources. This can be a major obstacle for anyimplementation. It is a good idea to involve the IT department in thediscussion about technical requirements.
User interface/Data presentation
Here you have to decide about your visualization and data presenta-tion needs.Applications vary between very graphical to more text andtables based. One of the most important aspects is the display of valuecreation maps and cause-and-effect relationships. I recommend goingfor interactive and dynamic visualizations, where the underlying datais linked to the different elements and where the connection meanssomething. Some tools just display graphics without any real data,drill-down or impact analysis functionality. Dynamic maps allow youto use them as a powerful communication tool with traffic lighting and even the opportunity to mathematically test assumed relationships.
Analysis functionality
Tools offer different levels of analysis capabilities, stretching from sim-ple drill-down capabilities to multidimensional analysis, complex statis-tical functionality, forecasting and even simulations. Organizationswhich require more complex analysis functionality often have toolsfor this already in place and have to decide whether to integrate orreplace those.Analysis functionality also includes the number of graph-ical displays (from bar charts to advanced 3-D charts). Requirements interms of charts and graphs depend on the indicators the organization
Appendix Selecting the appropriate software solution 205
tracks and their visualization requirements. It is especially important toinclude the business analysts in this discussion.
Service
Vendors offer different levels of service. Some offer no implementa-tion support and instead partner with consulting companies to pro-vide this. Other vendors offer comprehensive services including theirown implementation service, consulting, international service hot-lines, etc. Organizations need to be clear how much support theywant and whether the vendor or their partners can deliver this.
Future
Here the future developments and release frequency of the productare addressed, which might indicate the vendor’s attention and com-mitment to the product. It is also important to understand the futurevision of the software vendor, which will influence the direction ofany future product development. In an ideal case the future views ofthe vendor and your organization would be similar, in order to ensurefuture compatibility.
Overall, it is important to involve different people in the process ofdeveloping the requirements for your solution. Organizations often failto involve all key functions and end up with a solution that matchesonly half of their organizational requirements.When only IT people areinvolved they typically look for the IT-specific capabilities and com-patibility with the existing IT infrastructure. Finance people usuallylook for financial capabilities and possibly the most sensible econom-ical solutions. Business analysts may look for the most comprehensiveanalysis capabilities, and general managers may look for a good userinterface and ease of use. In order to address all requirements, it istherefore important to involve members of all four groups in the deci-sion process. My experience has taught me that the selection processis best led by members of the management team in close collabor-ation with business analysts and the IT function.
Once you have developed your unique list of requirements, you canstart to look for a suitable software solution that can deliver againstthose requirements and help to make your initiative a success. Below,in Figure 9.2, I present a list of the 25 leading vendors of softwareapplications. A final tip once you have narrowed down possible vend-ors to a shortlist – ask for reference clients that have implemented
206 Appendix Selecting the appropriate software solution
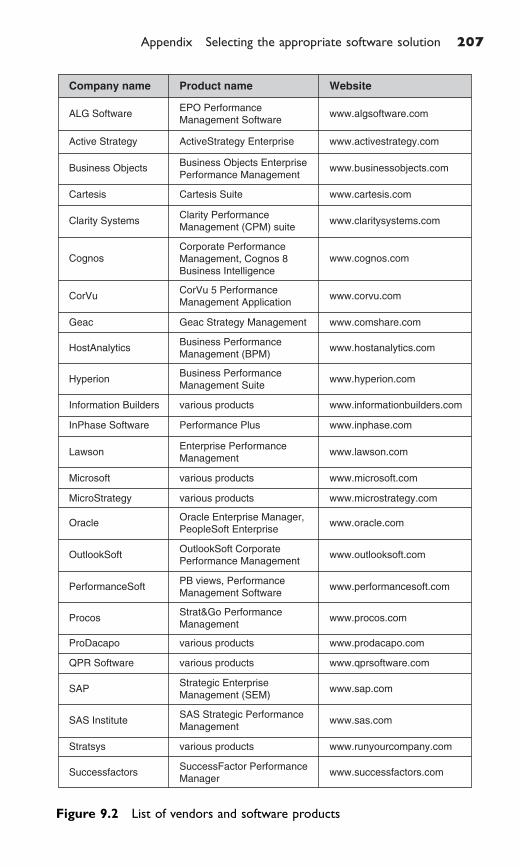
Appendix Selecting the appropriate software solution 207
Company name Product name Website
ALG SoftwareEPO PerformanceManagement Software
www.algsoftware.com
Active Strategy ActiveStrategy Enterprise www.activestrategy.com
Business ObjectsBusiness Objects EnterprisePerformance Management
www.businessobjects.com
Cartesis Cartesis Suite www.cartesis.com
Clarity SystemsClarity Performance
Management (CPM) suitewww.claritysystems.com
CognosCorporate Performance
Management, Cognos 8
Business Intelligence
www.cognos.com
CorVuCorVu 5 Performance
Management Applicationwww.corvu.com
Geac Geac Strategy Management www.comshare.com
HostAnalyticsBusiness Performance
Management (BPM)www.hostanalytics.com
HyperionBusiness Performance
Management Suitewww.hyperion.com
InPhase Software Performance Plus www.inphase.com
Lawson
Microsoft
Enterprise Performance
Managementwww.lawson.com
MicroStrategy
Information Builders
various products
various products
various products
www.microstrategy.com
www.microsoft.com
www.informationbuilders.com
OracleOracle Enterprise Manager,
PeopleSoft Enterprisewww.oracle.com
OutlookSoftOutlookSoft Corporate
Performance Managementwww.outlooksoft.com
PerformanceSoftPB views, Performance
Management Softwarewww.performancesoft.com
ProcosStrat&Go Performance
Managementwww.procos.com
ProDacapo various products www.prodacapo.com
QPR Software various products www.qprsoftware.com
SAPStrategic Enterprise
Management (SEM)www.sap.com
SAS InstituteSAS Strategic Performance
Managementwww.sas.com
www.runyourcompany.comStratsys various products
SuccessfactorsSuccessFactor Performance
Managerwww.successfactors.com
Figure 9.2 List of vendors and software products

applications of similar scope and scale, and contact them. Many willbe happy to provide these and a visit or conference call with othercustomers can be useful for both sides.
References and endnotes
1 This appendix is based on: Marr, B. and Neely, A. (2003).Automating Your Scorecard: The Balanced Scorecard Software
Report. Gartner and Cranfield School of Management: Stamford, CT.2 See for example: Marr, B. and Neely, A. (2002). Software for
Measuring Performance. In Handbook of Performance
Measurement, 2nd edn. (M. Bourne, ed.) Gee: London.
208 Appendix Selecting the appropriate software solution
Further reading on the topic
Readers who enjoyed this book might also be interested in anotherrecent book by Bernard Marr. Perspectives on Intellectual Capital:
Multidisciplinary Insight into Management, Measurement and
Reporting focuses especially on the topics of intangible assets andintellectual capital in organizations today. With contributions frommany leading experts in the field it provides a rich introduction andoverview of the topic.
It is now widely recognized that intangible elements in organizationsfunction as key differentiators and drivers of bottom-line performance.However, intangibles are encompassing many different constructs includ-ing competencies of employees, relationships with key stakeholders,well-designed processes, a strong brand image, or a positive organiza-tional culture, among many others. This broad spectrum led to a trulymultidisciplinary field. This book looks at each of the disciplinary viewsin more detail and, therefore, addresses questions such as:
� What is the economicimpact of intellectual capital?
� What are the strategic rolesof intangible value drivers?
� How can companies meas-ure and report the value oftheir intangible assets?
� What are the accountingguidelines for intangibles?
� What is the latest thinkingon intangibles in marketingor HR?
� And many more. . .
This edited book is the first tooutline the current state of theart in managing, measuring, andreporting of intellectual capitalfrom different disciplines andperspectives. It provides a well-grounded and comprehensiveintroduction to this fascinating topic.
Perspectives on Intellectual Capital by Bernard MarrPublished by Elsevier (2005)
ISBN 0-7506-7799-6

This page intentionally left blank
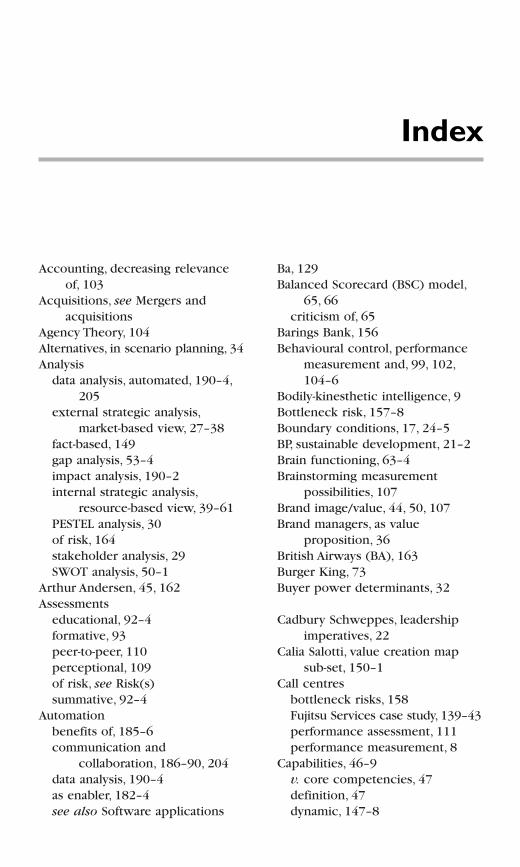
Accounting, decreasing relevanceof, 103
Acquisitions, see Mergers andacquisitions
Agency Theory, 104Alternatives, in scenario planning, 34Analysis
data analysis, automated, 190–4,205
external strategic analysis,market-based view, 27–38
fact-based, 149gap analysis, 53–4impact analysis, 190–2internal strategic analysis,
resource-based view, 39–61PESTEL analysis, 30of risk, 164stakeholder analysis, 29SWOT analysis, 50–1
Arthur Andersen, 45, 162Assessments
educational, 92–4formative, 93peer-to-peer, 110perceptional, 109of risk, see Risk(s)summative, 92–4
Automationbenefits of, 185–6communication and
collaboration, 186–90, 204data analysis, 190–4as enabler, 182–4see also Software applications
Ba, 129Balanced Scorecard (BSC) model,
65, 66criticism of, 65
Barings Bank, 156Behavioural control, performance
measurement and, 99, 102,104–6
Bodily-kinesthetic intelligence, 9Bottleneck risk, 157–8Boundary conditions, 17, 24–5BP, sustainable development, 21–2Brain functioning, 63–4Brainstorming measurement
possibilities, 107Brand image/value, 44, 50, 107Brand managers, as value
proposition, 36British Airways (BA), 163Burger King, 73Buyer power determinants, 32
Cadbury Schweppes, leadershipimperatives, 22
Calia Salotti, value creation mapsub-set, 150–1
Call centresbottleneck risks, 158Fujitsu Services case study, 139–43performance assessment, 111performance measurement, 8
Capabilities, 46–9v. core competencies, 47definition, 47dynamic, 147–8
Index
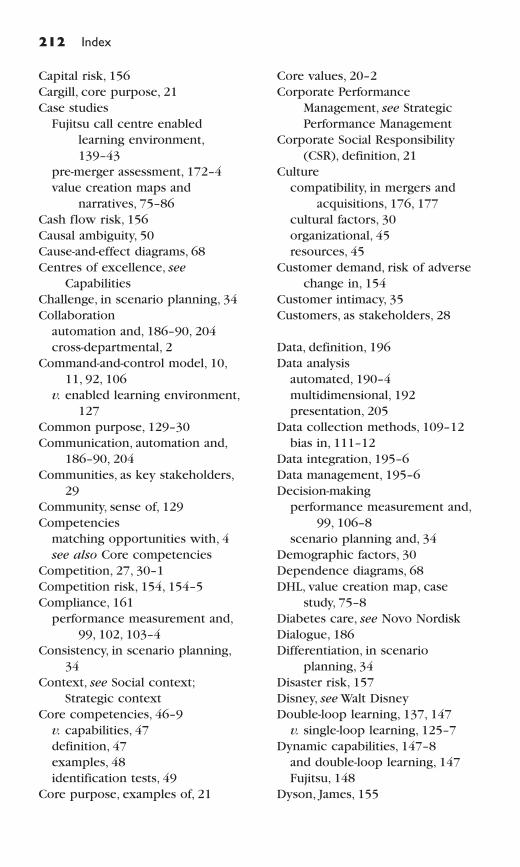
Capital risk, 156Cargill, core purpose, 21Case studies
Fujitsu call centre enabledlearning environment,139–43
pre-merger assessment, 172–4value creation maps and
narratives, 75–86Cash flow risk, 156Causal ambiguity, 50Cause-and-effect diagrams, 68Centres of excellence, see
CapabilitiesChallenge, in scenario planning, 34Collaboration
automation and, 186–90, 204cross-departmental, 2
Command-and-control model, 10,11, 92, 106
v. enabled learning environment,127
Common purpose, 129–30Communication, automation and,
186–90, 204Communities, as key stakeholders,
29Community, sense of, 129Competencies
matching opportunities with, 4see also Core competencies
Competition, 27, 30–1Competition risk, 154, 154–5Compliance, 161
performance measurement and,99, 102, 103–4
Consistency, in scenario planning,34
Context, see Social context;Strategic context
Core competencies, 46–9v. capabilities, 47definition, 47examples, 48identification tests, 49
Core purpose, examples of, 21
Core values, 20–2Corporate Performance
Management, see StrategicPerformance Management
Corporate Social Responsibility(CSR), definition, 21
Culturecompatibility, in mergers and
acquisitions, 176, 177cultural factors, 30organizational, 45resources, 45
Customer demand, risk of adversechange in, 154
Customer intimacy, 35Customers, as stakeholders, 28
Data, definition, 196Data analysis
automated, 190–4multidimensional, 192presentation, 205
Data collection methods, 109–12bias in, 111–12
Data integration, 195–6Data management, 195–6Decision-making
performance measurement and,99, 106–8
scenario planning and, 34Demographic factors, 30Dependence diagrams, 68DHL, value creation map, case
study, 75–8Diabetes care, see Novo NordiskDialogue, 186Differentiation, in scenario
planning, 34Disaster risk, 157Disney, see Walt DisneyDouble-loop learning, 137, 147
v. single-loop learning, 125–7Dynamic capabilities, 147–8
and double-loop learning, 147Fujitsu, 148
Dyson, James, 155
212 Index
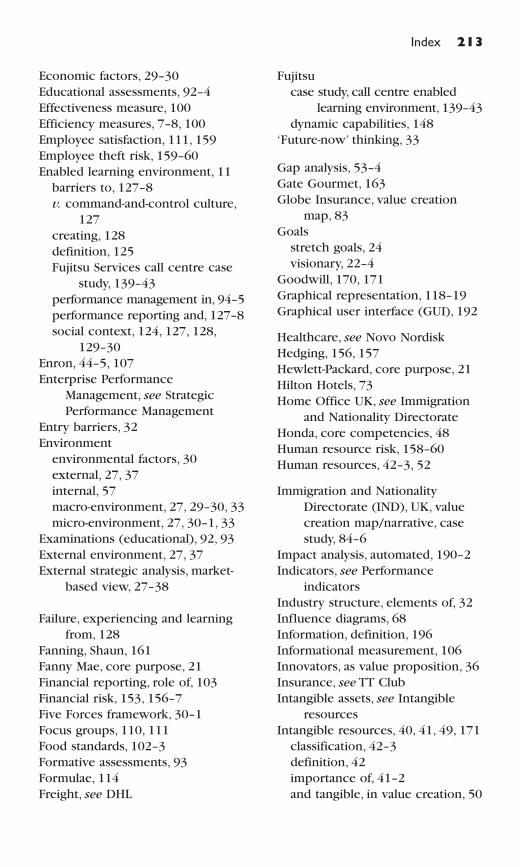
Economic factors, 29–30Educational assessments, 92–4Effectiveness measure, 100Efficiency measures, 7–8, 100Employee satisfaction, 111, 159Employee theft risk, 159–60Enabled learning environment, 11
barriers to, 127–8v. command-and-control culture,
127creating, 128definition, 125Fujitsu Services call centre case
study, 139–43performance management in, 94–5performance reporting and, 127–8social context, 124, 127, 128,
129–30Enron, 44–5, 107Enterprise Performance
Management, see StrategicPerformance Management
Entry barriers, 32Environment
environmental factors, 30external, 27, 37internal, 57macro-environment, 27, 29–30, 33micro-environment, 27, 30–1, 33
Examinations (educational), 92, 93External environment, 27, 37External strategic analysis, market-
based view, 27–38
Failure, experiencing and learningfrom, 128
Fanning, Shaun, 161Fanny Mae, core purpose, 21Financial reporting, role of, 103Financial risk, 153, 156–7Five Forces framework, 30–1Focus groups, 110, 111Food standards, 102–3Formative assessments, 93Formulae, 114Freight, see DHL
Fujitsucase study, call centre enabled
learning environment, 139–43dynamic capabilities, 148
‘Future-now’ thinking, 33
Gap analysis, 53–4Gate Gourmet, 163Globe Insurance, value creation
map, 83Goals
stretch goals, 24visionary, 22–4
Goodwill, 170, 171Graphical representation, 118–19Graphical user interface (GUI), 192
Healthcare, see Novo NordiskHedging, 156, 157Hewlett-Packard, core purpose, 21Hilton Hotels, 73Home Office UK, see Immigration
and Nationality DirectorateHonda, core competencies, 48Human resource risk, 158–60Human resources, 42–3, 52
Immigration and NationalityDirectorate (IND), UK, valuecreation map/narrative, casestudy, 84–6
Impact analysis, automated, 190–2Indicators, see Performance
indicatorsIndustry structure, elements of, 32Influence diagrams, 68Information, definition, 196Informational measurement, 106Innovators, as value proposition, 36Insurance, see TT ClubIntangible assets, see Intangible
resourcesIntangible resources, 40, 41, 49, 171
classification, 42–3definition, 42importance of, 41–2and tangible, in value creation, 50
Index 213
Intangibles, 39, 100indirect measures of, 100–1limitations of measurement, 101,
102, 103measurement of, 100–1, 102, 103performance indicators, 8
Intellectual capital, see Intangibleresources
Intellectual property, 46Intellectual property rights theft
risk, 160–1Intelligence, forms of, 8–9Intelligence Quotient (IQ), 8Internal environment, 57Internal strategic analysis, resource-
based view, 39–61Interpersonal intelligence, 9Interviews, in-depth, 110Intrapersonal intelligence, 9IT systems
risk to, 160see also Automation; Software
applications
Johnson & Johnson (J&J) credo(core values), 22, 23
Johnson Matthey, 157Joint ventures, 169, 170JPMorganChase, rules, 22Just-in-Time delivery systems, 162–3
Knowledgecontext specific, 158definition, 196tacit, 129
Knowledge assets, see Intangibleresources; Intellectual property
Knowledge risk, 158–9
League tables, schools, 93, 94Learning
effect of assessment method on,93–4
from failure, 128measurement for, 99, 106–8see also Enabled learning
environment; Organizationallearning
Leeson, Nick, 156Legal factors, 30Line-of-sight relationships, 129Linguistic intelligence, 9Logical-mathematical intelligence, 9
McKinsey & Company, corepurpose, 21
Macro-environment, 27, 29–30, 33Management, command-and-control
model, 10, 11, 92, 106v. enabled learning environment,
127Management trap, 1–2, 9–11Market-based strategy formulation/
analysis, 5–7, 27–38Market risk, 155–6Markets, see External strategic
analysisMary Kay Cosmetics, core purpose,
21Measurement, 97–8
behavioural control implications,99, 102, 104–6
biased systems, 105brainstorming and, 107definition, 100dysfunctional consequences of,
102–3, 104–6implications for usage, 102–6indicators, 9, 107informational, 106of intangibles, 100–1, 102, 103measures v. indicators, 9, 107objectivity in, 102, 103problems with, 103–6reporting and compliance
implications, 99, 102, 103–4scales, 114for strategic decision-
making/learning, 99, 106–8trust replaced by, 102–3, 105see also Intelligence Quotient;
Measurement trap;Performance measurement
Measurement trap, 1–2, 7–9
214 Index
Memorability, in scenario planning,34
Merck, core purpose, 21Mergers and acquisitions
assessing, 168–77bolt-on acquisitions, 169, 175, 177cost savings, 175culture compatibility, 176, 177goodwill, 170, 171post-merger integration, 170,
175–7post-merger integration agenda,
176pre-merger assessment, 170–2pre-merger assessment case
study, 172–4problems with, 170reasons for, 168–9types of, 169
Merrill Lynch, 150Micro-environment, 27, 30–1, 33Misjudgements, 34–5Mission statements, 19–24, 24–5Monetary resource risk, 156–7Monetary resources, 41, 52‘Morphing’, 147Multidimensionality, 192–4
functional perspectives, 193–4slicing and dicing, 194
Musical intelligence, 9Mystery shopping, 110, 111
Naturalist intelligence, 9Nike
core purpose, 21reputation risk, 162
Novo Nordisk, value creation map/narrative, case study, 78–82
Observations, 110Operational excellence, 35Opportunities, 50–1Organizational culture, 45Organizational learning
conditions under whichoccurring, 125
definition, 124double-loop, 137, 147performance measurement
and, 99single-loop v. double-loop, 125–7see also Learning
Organizational performancemeasures, see Performancemeasurement
Organizational resources, 4–5, 39–41see also Resources
Organizational strategy, 62–3, 71Organizations
as trees, 5–6, 27–8, 40as a whole, visualization of, 130
Perceptional assessment, 109Performance assessment, 106,
107–8, 108–12biases in data, 111, 112call centres, 111data collection methods, 109–12involving affected people, 109
Performance drivers, 49see also Resources
Performance indicators, 7, 8, 97–123costs, 116–17designing, 112–17intangible, 8v. measures, 9, 107reporting, 115–16, 117–19selecting, 108–12template for designing, 113, 117
Performance managementin enabled learning environment,
94–5poor, consequences of, 2–3
Performance Management trap, 1–2,9–11
Performance measurement, 1–2and behavioural control, 99, 102,
104–6call centres, 8and compliance, 99, 102, 103–4and decision-making, 99effectiveness measure, 100
Index 215
Performance measurement(Continued)
efficiency measures, 7–8, 100indicators v. measures, 9and organizational learning, 99outsourcing, 153reasons for, 98–9and reporting, 99, 102, 103–4see also Measurement;
Measurement trap; TargetsPerformance Prism, 65–6Performance review meetings
aligning, 130–4as barriers to enabled learning
environment, 127dysfunctional, 133–4past v. future performance, 132–3review types, 130–2spreadsheets in, 127–8see also Strategic Performance
Improvement MeetingsPESTEL (political, economic, social,
technological, environmental,legal conditions) analysis, 30
Pharmaceuticals, pre-mergerassessment case study, 172–4
Philips,Albuquerque plant fire, 44Physical resource risk, 157–8Physical resources, 41, 52Plausibility, in scenario planning, 34Political factors, 29–30Practices, 45Pressure groups, as key
stakeholders, 29Price minimizers, as value
proposition, 36Price risk, 156–7Product leadership, 35Productivity, risk of reduction
in, 154Products wanted by customers, 27Purpose
common, 129–30of enterprise, 20, 21
Questionnaires, 109
Reflection, between StrategicPerformance ImprovementMeetings, 137
Regulations, compliance with, 161performance measurement and,
99, 102, 103–4Regulators, as key stakeholders, 29Regulatory risk, 161Relational resources, 42–3, 44–5, 52Relational resources risks, 161–4Remuneration, based on
measurements, 105Reporting
financial, role of, 103formats for representation, 116,
118of performance, 127–8performance indicators, 115–16,
117–19performance measurement, 99,
102, 103–4Reports, automated, 189–90Reputation, 44–5Reputation management, 163–4Reputation risk, 162Resource-based strategy formulation/
analysis, 5–7, 39–61Resource maps, 54–5Resource stocks
identifying, 51–3interconnectedness of, 46
Resourcesclassification, 52–3culture resources, 45dynamic nature of, 49–50human, 42–3, 52intangible, see Intangible
resourcesinterdependencies of, 55–6monetary, 41, 52organizational, 4–5, 39–41physical, 41, 52relational, 42–3, 44–5, 52relationships between, 68–9relative importance of, 53–5structural, 42–3, 45–6, 52
216 Index
tangible and intangible in valuecreation, 50
see also Internal strategic analysis;Resource maps; Resourcestocks
Reverse takeovers, 169, 175Risk(s), 153–4
analysing, 164assessment, software applications
for, 194bottlenecks, 157–8capital, 156cash flow, 156competition, 154, 154–5customer demand changes, 154disaster, 157employee theft, 159–60external, 154–6financial, 153, 156–7human resource risk, 158–60intellectual property rights theft,
160–1to IT systems, 160knowledge risk, 158–9likelihood level, 165, 166, 167market, 155–6monetary resource risk, 156–7organizational, 154, 155perceived, 154physical resources, 157–8price risk, 156–7productivity reduction, 154regulatory, 161relational resources, 161–4reputation, 162risk (failure) maps, 66risk level, 165, 166, 167risk log, 164–8risk score, 165, 167staffing, 159structural resources, 160–1supply chain, 162–3
Risk management, 153–4actions after risk analysis, 166risk manager post, 168services, see TT Club
Rivalry determinants, 32Routines, 45, 129Royal Dutch Shell (Shell)
diversity in, 72Greenpeace campaign, 29scenario planning/analysis, 32–4sustainable development, 21testing strategy element
interactions, 151–3
Scenario analysis, 32–5Scenario planning
criteria, 34limitations, 34misjudgements, 34–5
Scenarios, internal developmentpaths, 56–7
Schools, league tables, 93, 94Scientific Management, 10Sears, Roebuck and Co., validating
relationships, 149–50, 159Services wanted by customers, 27Shareholders, as stakeholders, 28Shell, see Royal Dutch ShellSimplifiers, as value proposition, 36Social capital, 45, 129Social context, 45
enabled learning environment,124, 127, 128, 129–30
Social factors, 30Social relationships, maintainable
number, 74Socializors, as value proposition, 36Software applications, 11, 182–4
analysis capabilities, 205–6automated alerts, 187, 204benefits of automation, 185–6communication and
collaboration, 186–90, 204costs, 197, 201, 202customization, 200–1, 204data analysis, 190–4data integration and management,
195–6data presentation, 205flexibility, 204
Index 217
Software applications (Continued)
future developments, 206implementation scope, 199integration, degree of, 199–200IT support, 200–1products, 202, 206–8for risk assessment, 194scalability, 202security/access control, 205selection of, 197–208service levels, 206technical specifications, 205user interface, 205vendors/websites, 202, 206–8
Sonycore competencies, 48core purpose, 21
Southwest Airlines, 45–6Spatial intelligence, 9Speedometer display, 118Spreadsheets, 183
disadvantages of, 183–4in performance review, 127–8
Staffing risk, 159Stakeholder analysis, 29Stakeholder contribution, 65Stakeholder value proposition, 27,
35–6Stakeholders
analysis, 29identifying, 27, 28–9key, definition, 28satisfaction, 65wants and needs, 28–9
State involvement, 33Statistical Process Control (SPC)
charts, 115Strategic analysis, external, see
External strategic analysisStrategic boundaries, 17, 24–5Strategic context
clarification of, 16–18different interpretations of, 16
Strategic core competencies,see Core competencies
Strategic decision-makingperformance measurement and,
99, 106–8scenario planning and, 34
Strategic Performance ImprovementMeetings, 132
data analysts, 136–7, 138double-loop learning, 137before the meeting, 135–7at the meeting, 137–9productive, 134–9reflection, 137see also Performance review
meetingsStrategic Performance Management
(SPM)definition, 3elements of, 12IT support for, 11organizations deploying, xviwrong approach to, 1–2see also Performance
managementStrategy, organizational, 62–3, 71Strategy formulation, 4
market-based v. resource-basedviewpoints, 5–7
Strategy maps, 65, 66Balanced Scorecard (BSC) model,
65, 66Performance Prism model,
65–6see also Value creation maps
Strategy trap, 1–2, 4–7Strengths, 50–1Stretch goals, 24Structural resource risks, 160–1Structural resources, 42–3, 45–6, 52Substitution threat (products
and services), determinants of, 32
Summative assessments, 92–4Supplier power determinants, 32Suppliers, as key stakeholders, 29Supply chain risk, 162–3Surveys, 109
218 Index
SWOT (strengths, weaknesses,opportunities, threats) analysis,50–1
Systems thinking, 130
Targets, 1–2, 2–3Technological factors, 30Technological integrators, as value
proposition, 36Technology, as resource, 50Thinking
creative v. linear, 64‘future-now’, 33systems thinking, 130
Threats, 50–13M, 5
core purpose, 21Traffic light assessment, 115, 118Trees, organizations as, 5–6, 27–8, 40Triangulation, 111, 112Triple Bottom Line, 80Trust, 129
replaced by measurement, 102–3,105
TT Club, value creation map, casestudy, 83–4
UBS, measurement of value drivers,103
Valuecore values, 20–2perceived, 106
Value creationcausal models, 149, 151interaction between tangible and
intangible resources, 50testing assumptions, 148–53
Value creation maps, 17, 62, 64,107, 107–8
bundled, 69, 70cascading, 72–5case studies, 75–86causal, 69, 70construction of, 69–71definition, 66–7description, 66–9function of, 63–4as guides to risk assessment, 154interactive, 187–9in mergers and acquisitions, 177in pre-merger assessments, 171–4revision, 71sub-sets, 149–50template, 67–8testing value creation
assumptions in, 148–53see also Strategy maps
Value creation narratives, 17, 62, 64case studies, 75, 78–82, 84–6construction of, 71–2definition, 71format, 71function of, 63
Value matrix, 35–6Value propositions, 17, 27, 35–6
relative importance of keyresources, 53–4
Visionary goals, 22–4
Wal-Martcore competencies, 48core purpose, 21inventory replenishment, 41
Walt Disney, core purpose, 21Weaknesses, 50–1
Index 219
Related Documents