Performance Limits of Turbomachines David K. Hall Gas Turbine Laboratory Department of Aeronautics and Astronautics Massachusetts Institute of Technology Cambridge, MA 02139 January 26, 2010

Performance Limits of Turbomachines
Nov 08, 2014
Performance Limits of Turbomachines
Welcome message from author
This document is posted to help you gain knowledge. Please leave a comment to let me know what you think about it! Share it to your friends and learn new things together.
Transcript

Performance Limits of Turbomachines
David K. Hall
Gas Turbine LaboratoryDepartment of Aeronautics and Astronautics
Massachusetts Institute of TechnologyCambridge, MA 02139
January 26, 2010
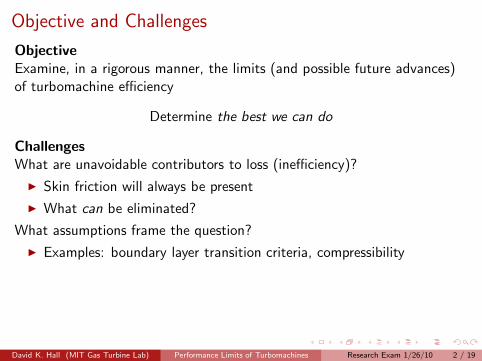
Objective and Challenges
Objective
Examine, in a rigorous manner, the limits (and possible future advances)of turbomachine efficiency
Determine the best we can do
Challenges
What are unavoidable contributors to loss (inefficiency)?
◮ Skin friction will always be present
◮ What can be eliminated?
What assumptions frame the question?
◮ Examples: boundary layer transition criteria, compressibility
David K. Hall (MIT Gas Turbine Lab) Performance Limits of Turbomachines Research Exam 1/26/10 2 / 19

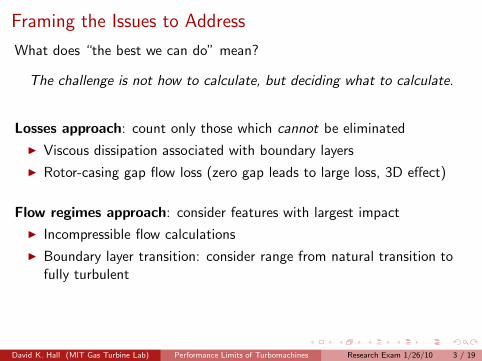
Framing the Issues to Address
What does “the best we can do” mean?
The challenge is not how to calculate, but deciding what to calculate.
David K. Hall (MIT Gas Turbine Lab) Performance Limits of Turbomachines Research Exam 1/26/10 3 / 19
Framing the Issues to Address
What does “the best we can do” mean?
The challenge is not how to calculate, but deciding what to calculate.
Losses approach: count only those which cannot be eliminated
◮ Viscous dissipation associated with boundary layers
◮ Rotor-casing gap flow loss (zero gap leads to large loss, 3D effect)
Flow regimes approach: consider features with largest impact
◮ Incompressible flow calculations
◮ Boundary layer transition: consider range from natural transition tofully turbulent
David K. Hall (MIT Gas Turbine Lab) Performance Limits of Turbomachines Research Exam 1/26/10 3 / 19
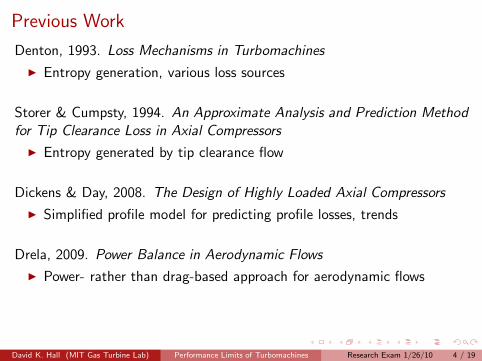
Previous Work
Denton, 1993. Loss Mechanisms in Turbomachines
◮ Entropy generation, various loss sources
Storer & Cumpsty, 1994. An Approximate Analysis and Prediction Method
for Tip Clearance Loss in Axial Compressors
◮ Entropy generated by tip clearance flow
Dickens & Day, 2008. The Design of Highly Loaded Axial Compressors
◮ Simplified profile model for predicting profile losses, trends
Drela, 2009. Power Balance in Aerodynamic Flows
◮ Power- rather than drag-based approach for aerodynamic flows
David K. Hall (MIT Gas Turbine Lab) Performance Limits of Turbomachines Research Exam 1/26/10 4 / 19

Stage Performance Estimation
Estimate attainable turbomachinery efficiency by assessing dissipationassociated with unavoidable contributors to loss
◮ Based on local flow irreversibilities (not loss correlations)◮ Allows for calculation of advanced-core engine performance
David K. Hall (MIT Gas Turbine Lab) Performance Limits of Turbomachines Research Exam 1/26/10 5 / 19
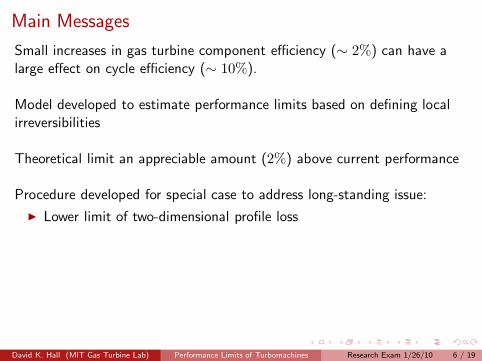
Main Messages
Small increases in gas turbine component efficiency (∼ 2%) can have alarge effect on cycle efficiency (∼ 10%).
Model developed to estimate performance limits based on defining localirreversibilities
Theoretical limit an appreciable amount (2%) above current performance
Procedure developed for special case to address long-standing issue:
◮ Lower limit of two-dimensional profile loss
David K. Hall (MIT Gas Turbine Lab) Performance Limits of Turbomachines Research Exam 1/26/10 6 / 19
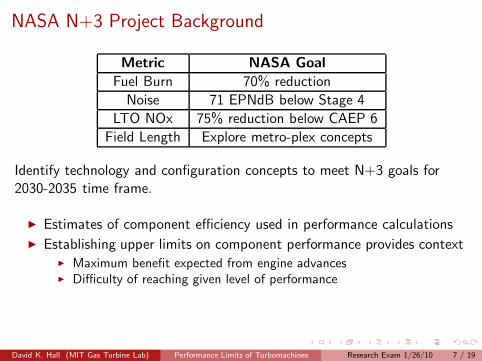
NASA N+3 Project Background
Metric NASA Goal
Fuel Burn 70% reduction
Noise 71 EPNdB below Stage 4
LTO NOx 75% reduction below CAEP 6
Field Length Explore metro-plex concepts
Identify technology and configuration concepts to meet N+3 goals for2030-2035 time frame.
◮ Estimates of component efficiency used in performance calculations
◮ Establishing upper limits on component performance provides context◮ Maximum benefit expected from engine advances◮ Difficulty of reaching given level of performance
David K. Hall (MIT Gas Turbine Lab) Performance Limits of Turbomachines Research Exam 1/26/10 7 / 19

Component Performance and Engine Efficiency
10 20 30 40 50 6011
12
13
14
15
16
Pressure ratio
Thr
ust−
Spe
cific
Fue
l Con
sum
ptio
n (T
SF
C)
η = 0.89η = 0.94
14% 17%
Cycle results calculated using semi-perfectgas engine cycle model (not discussed here)
◮ Representative turbofan cycle
◮ Mission and cycle held fixed
◮ Component efficiencies η varied
◮ Bypass ratio optimized for minimumTSFC
◮ Component efficiency alone has significant effect on cycle efficiency
◮ Greatest benefit if pressure ratio is optimized
David K. Hall (MIT Gas Turbine Lab) Performance Limits of Turbomachines Research Exam 1/26/10 8 / 19

Stage Characterization: Meanline DesignMeanline Flow Geometry
Flow coefficient φStage loading coefficient ψDegree of reaction ΛChord/pitch ratio σReynolds number Re
Blade Velocity Distribution
Linear blade velocity distribution◮ Function of above parameters
◮ Linear variation across pitch on huband casing
David K. Hall (MIT Gas Turbine Lab) Performance Limits of Turbomachines Research Exam 1/26/10 9 / 19
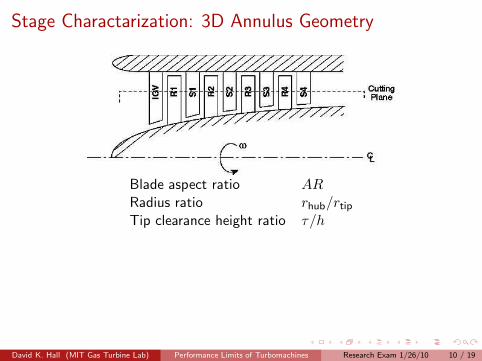
Stage Charactarization: 3D Annulus Geometry
Blade aspect ratio ARRadius ratio rhub/rtipTip clearance height ratio τ/h
David K. Hall (MIT Gas Turbine Lab) Performance Limits of Turbomachines Research Exam 1/26/10 10 / 19

Performance: sum inefficiencies due to various losses
Losses included (cannot be eliminated)Blade surface dissipation Turbulent boundary layer calculation (so far)Wake mixing 2D control volumeEndwall losses constant dissipation coefficientTip clearance losses 2D mixing model (rotor only)
Losses not included (may be mitigated in the future)
◮ Parasitic losses, leakage flows
◮ Losses due to three-dimensional effects
◮ Shock losses
David K. Hall (MIT Gas Turbine Lab) Performance Limits of Turbomachines Research Exam 1/26/10 11 / 19
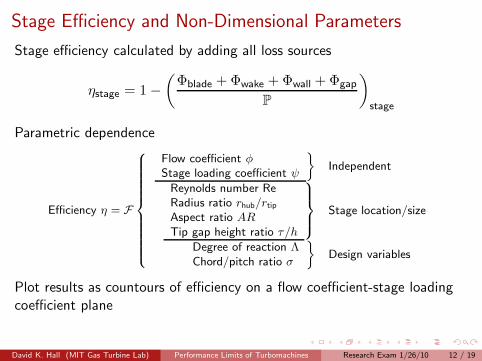
Stage Efficiency and Non-Dimensional Parameters
Stage efficiency calculated by adding all loss sources
ηstage = 1 −
(
Φblade + Φwake + Φwall + Φgap
P
)
stage
Parametric dependence
Efficiency η = F
8
>
>
>
>
>
>
>
>
>
>
<
>
>
>
>
>
>
>
>
>
>
:
Flow coefficient φStage loading coefficient ψ
ff
Independent
Reynolds number ReRadius ratio rhub/rtip
Aspect ratio ARTip gap height ratio τ/h
9
>
>
=
>
>
;
Stage location/size
Degree of reaction Λ
Chord/pitch ratio σ
ff
Design variables
Plot results as countours of efficiency on a flow coefficient-stage loadingcoefficient plane
David K. Hall (MIT Gas Turbine Lab) Performance Limits of Turbomachines Research Exam 1/26/10 12 / 19
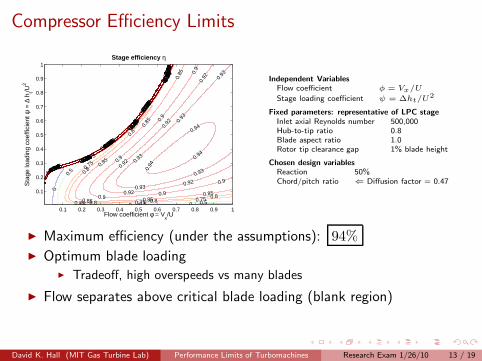
Compressor Efficiency Limits
00
0
0
00
0
0.50.50.5
0.50.5
0.50.
5
0.5
0.750.750.75
0.750.75
0.75
0.750.
75
0.75
0.80.80.8
0.8
0.8
0.8
0.8
0.8
0.80.
8
0.8
0.850.850.85
0.85
0.85
0.85
0.85
0.85
0.85
0.85
0.850.
85
0.85
0.9
0.90.9
0.90.
9
0.9
0.9
0.9
0.9
0.9
0.90.
9
0.9
0.92
0.92
0.92
0.92
0.920.92
0.92
0.92
0.92
0.920.
92
0.92
0.93
0.93
0.93
0.93
0.93
0.93
0.93
0.93
0.93
0.930.
93
0.93
0.94
0.94
0.94
0.94
0.940.
94
0.94
0.94
0.94
0.94
0.95
0.95
0.95
0.95
0.950.
95
0.95
0.96
0.96
0.96
0.96
0.960.
96
0.96
0.97
0.97
0.97
0.97
0.970.
97
0.97
0.97
5
0.97
5
0.975
0.975
0.9750.
975
0.98
0.98
0.98
0.98
0.980.
98
0.98
0.98
5
0.98
5
0.985
0.985
0.9850.
985
0.99
0.99
0.99
0.99
0.990.
99
0.99
0.99
5
0.99
5
0.995
0.995
0.9950.
995
1
1
11
1
1
1
Flow coefficient φ = Vx/U
Sta
ge lo
adin
g co
effic
ient
ψ =
∆ h
t/U2
Stage efficiency η
0.1 0.2 0.3 0.4 0.5 0.6 0.7 0.8 0.9 1
0.1
0.2
0.3
0.4
0.5
0.6
0.7
0.8
0.9
1
Independent Variables
Flow coefficient φ = Vx/U
Stage loading coefficient ψ = ∆ht/U2
Fixed parameters: representative of LPC stage
Inlet axial Reynolds number 500,000Hub-to-tip ratio 0.8Blade aspect ratio 1.0Rotor tip clearance gap 1% blade height
Chosen design variables
Reaction 50%Chord/pitch ratio ⇐ Diffusion factor = 0.47
◮ Maximum efficiency (under the assumptions): 94%
◮ Optimum blade loading◮ Tradeoff, high overspeeds vs many blades
◮ Flow separates above critical blade loading (blank region)
David K. Hall (MIT Gas Turbine Lab) Performance Limits of Turbomachines Research Exam 1/26/10 13 / 19

Model agrees with existing information (Dickens, 2008)
Flow coefficient φ = Vx/U
Sta
ge lo
adin
g co
effic
ient
ψ =
∆ h
t/U2
0.1 0.2 0.3 0.4 0.5 0.6 0.7 0.8 0.9 1
0.1
0.2
0.3
0.4
0.5
0.6
0.7
0.8
0.9
1
0.8
0.85
0.9
Loss build-up model 1D correlation
◮ General trends: location of peak, rate of drop away from peak
◮ Efficiency greater in magnitude (expected)
David K. Hall (MIT Gas Turbine Lab) Performance Limits of Turbomachines Research Exam 1/26/10 14 / 19
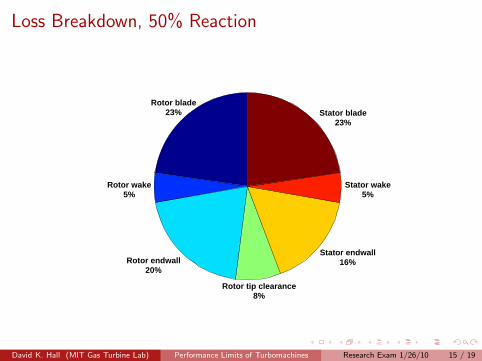
Loss Breakdown, 50% Reaction
Rotor blade23%
Rotor wake5%
Rotor endwall20%
Rotor tip clearance8%
Stator endwall16%
Stator wake5%
Stator blade23%
David K. Hall (MIT Gas Turbine Lab) Performance Limits of Turbomachines Research Exam 1/26/10 15 / 19

Lower Limit of Profile Loss
Goal: minimize loss (objective), find optimum velocity distribution (designvariables), given meanline flow parameters (design parameters)
Objective Calculation
◮ Cascade vortex lattice method (assume thin airfoil, finite camber)
(vupper, φ, ψ,Λ) ⇒ (vlower, σ)
◮ Boundary layer calculation (Drela)
(Re, vupper, vlower) ⇒ η
Optimization
◮ Automatic Differentiation (AD) software
η(vupper,Λ;φ,ψ,Re) ⇒ ∇η
◮ Broyden-Fletcher-Goldfarb-Shanno (BFGS) gradient-based optimizer
⇒ (ηmax, v∗
upper,Λ∗) = F(φ,ψ,Re)
David K. Hall (MIT Gas Turbine Lab) Performance Limits of Turbomachines Research Exam 1/26/10 16 / 19

Path to the Thesis
Complete Compressor Analysis
◮ Stage performance estimation and demonstration
◮ Profile loss assesment◮ Laminar flow and transition◮ Optimization process
Turbine Analysis
◮ Finite airfoil thickness
◮ Cooling flow and entropy generation
David K. Hall (MIT Gas Turbine Lab) Performance Limits of Turbomachines Research Exam 1/26/10 17 / 19
“Intellectual Nuggets”
Rational discrimination of procedure for defining a best case
◮ Logic behind choices of where to be optimistic vs conservative
Bottom-up loss model
◮ First of its kind, based on local irreversibilities
Profile Performance Limit
◮ Special case; answers “what is the best we can do?” fortwo-dimensional turbomachinery profile loss
David K. Hall (MIT Gas Turbine Lab) Performance Limits of Turbomachines Research Exam 1/26/10 18 / 19

Summary
Cycle studies show increases in gas turbine component efficiency canprovide a large benefit in overall fuel efficiency
A framework for estimating the upper bound on turbomachine efficiency isdeveloped
◮ Based on local flow irreversibilities
◮ Shows significant advances in component efficiency possible
Optimization of inputs (including velocity distribution) will allow forcalculation of minimum profile loss
David K. Hall (MIT Gas Turbine Lab) Performance Limits of Turbomachines Research Exam 1/26/10 19 / 19
Related Documents