Performance Improvement of Large Installation base of Wellhead Venturi Wet Gas Measurement in Petroleum Development Oman (PDO) Abdullah Al Obaidani, Khalil Al Hanashi, Hamed Al Hadhrami, Dawood Al Sulaimani - Petroleum Development Oman Abstract Wellhead wet gas metering using venturi meter with over-reading correction is widely used in many gas fields including gas fields operated by Petroleum Development Oman (PDO). A large installed base of more than 300 venturi based wet gas meters delivering real time data of flow rates of gas, condensate and water are used to determine produced volumes in these gas fields and carry out well and reservoir management activities. Managing the performance of these devices require thorough understanding of fluid flow rates, composition, correction algorithm parameters and final data transfer across different systems in the data loop. With continuous changes in flow rates and process conditions, focused efforts are necessary to maintain adequate performance of these devices. Within PDO, different personnel have different role in contributing to achieving the required performance from these devices, integrated efforts and processes in capturing and updating changes are required. This paper focuses on the experience and improvement achieved in the gas and condensate metering of one of the gas fields (referred to later as Field-A) where noticeable imbalance in the volume of hydrocarbons between the wells and export were observed since the commissioning of the Gas Plant (referred to later as Plant-A). A structured review by a multi-discipline team was initiated to focus on the whole data loop including sensor performance, parameters input, data transfer, algorithm set-up, procedures and staff competencies. The work has overall resulted in improving the fluid volume balance between wells to export. This paper also describes sensitivity of different parameters contributing to measurement error and how these could be eliminated or reduced. The paper also describes the challenges in meter sizing for changing flow profiles and depletion scenarios. Also, the challenges faced in the field in determining liquid loading (both condensate and water) using tracer dilution technique and mobile well testing units. An overall integration between technology, people and process is detailed in this paper as a mean to realize measurement performance that meets the requirement. 1. Introduction Managing performance of large installation base of flow sensors scattered at wells level, fields, production facilities and export network is becoming more challenging with the increasing demand from end data users for continuous and accurate quality data. The right technology for the application remains the most important first step towards realizing accurate and quality data during the operation phase. The application and its fluid data and process data need to be fully understood so the right technology and measuring method is selected. However, the selection and implementation of the right technology alone will not necessary ensure continuous accurate data is being delivered from these sensors. Correct installation, configuration, commissioning, parameters update, calibration, maintenance and performance review are essential elements. Additionally, a comprehensive set of procedures, clearly defined processes and competent multidiscipline teams are vital to ensure reviews and changes are adequate to achieve the required data quality at all times. The performance of the flow meters often are within the data users expectation when deployed in single phase streams, stable flow, known fluid properties and stable process. The performance often is impacted when other phases or impurities flow with the main phase in the same stream, especially when deployed at the upstream of the separation, processing and treatment facilities. Such streams are usually multiphase flow streams in the upstream oil

Welcome message from author
This document is posted to help you gain knowledge. Please leave a comment to let me know what you think about it! Share it to your friends and learn new things together.
Transcript

Performance Improvement of Large Installation base of Wellhead Venturi Wet Gas Measurement in Petroleum Development Oman (PDO)
Abdullah Al Obaidani, Khalil Al Hanashi, Hamed Al Hadhrami, Dawood Al Sulaimani - Petroleum Development Oman
Abstract
Wellhead wet gas metering using venturi meter with over-reading correction is widely used in many gas fields including gas fields operated by Petroleum Development Oman (PDO). A large installed base of more than 300 venturi based wet gas meters delivering real time data of flow rates of gas, condensate and water are used to determine produced volumes in these gas fields and carry out well and reservoir management activities. Managing the performance of these devices require thorough understanding of fluid flow rates, composition, correction algorithm parameters and final data transfer across different systems in the data loop. With continuous changes in flow rates and process conditions, focused efforts are necessary to maintain adequate performance of these devices. Within PDO, different personnel have different role in contributing to achieving the required performance from these devices, integrated efforts and processes in capturing and updating changes are required.
This paper focuses on the experience and improvement achieved in the gas and condensate metering of one of the gas fields (referred to later as Field-A) where noticeable imbalance in the volume of hydrocarbons between the wells and export were observed since the commissioning of the Gas Plant (referred to later as Plant-A). A structured review by a multi-discipline team was initiated to focus on the whole data loop including sensor performance, parameters input, data transfer, algorithm set-up, procedures and staff competencies. The work has overall resulted in improving the fluid volume balance between wells to export. This paper also describes sensitivity of different parameters contributing to measurement error and how these could be eliminated or reduced. The paper also describes the challenges in meter sizing for changing flow profiles and depletion scenarios. Also, the challenges faced in the field in determining liquid loading (both condensate and water) using tracer dilution technique and mobile well testing units.
An overall integration between technology, people and process is detailed in this paper as a mean to realize measurement performance that meets the requirement.
1. Introduction
Managing performance of large installation base of flow sensors scattered at wells level, fields, production facilities and export network is becoming more challenging with the increasing demand from end data users for continuous and accurate quality data. The right technology for the application remains the most important first step towards realizing accurate and quality data during the operation phase. The application and its fluid data and process data need to be fully understood so the right technology and measuring method is selected. However, the selection and implementation of the right technology alone will not necessary ensure continuous accurate data is being delivered from these sensors. Correct installation, configuration, commissioning, parameters update, calibration, maintenance and performance review are essential elements. Additionally, a comprehensive set of procedures, clearly defined processes and competent multidiscipline teams are vital to ensure reviews and changes are adequate to achieve the required data quality at all times. The performance of the flow meters often are within the data users expectation when deployed in single phase streams, stable flow, known fluid properties and stable process. The performance often is impacted when other phases or impurities flow with the main phase in the same stream, especially when deployed at the upstream of the separation, processing and treatment facilities. Such streams are usually multiphase flow streams in the upstream oil
and gas industry where conventional flow measurement techniques do not often work or require good understanding of the flow behavior, fluid characteristics and process changes. Deploying separation based methods generally solve these issues when engineered, operated and maintained adequately. However, several technical and commercial constrains play major role in deciding whether separation methods are feasible or alternative techniques should be sought. Managing gas and condensate production effectively requires continuous accurate flow data together with pressure and temperature and other key parameters. When the gas produced from the wells is dry gas, several measuring methods could be implemented with the expectation of good accuracy and performance. However, for wet gas production from the wells, continuous accurate determination of flow rates of all phases at economical level throws a challenge to flow measurement techniques. Although currently in the market there are several wet gas flow meters with good uncertainty for gas volume flow rate, often liquid volume flow rate uncertainty has relatively higher uncertainty. Furthermore, generally the costs of these devices fall outside the economic value for a low producing wet gas well.
Venturi meters behavior in measuring gas volume flow rate in a wet gas application was studied in past few decades with increasingly better understanding of parameters affecting the over-reading caused by liquid flowing with the gas. Several over-reading correction algorithms were developed to correct for these effects. Some of these algorithms use more than one differential pressure input or a combination of several differential pressure measurement input to compute the resultant over-reading and hence the corrected volume flow rate for gas and determining the liquid volume flow rates.
In gas fields operated by PDO, one of these over-reading correction algorithms is being used where it utilizes online measurement of the venturi throat differential pressure, flow line pressure, flow line temperature and several constants and operator input parameters. Although the principle generally works and delivers accuracies within the requirement, it requires several accurate input obtained by external methods. These include Condensate Gas Ratio (CGR), Water Gas Ratio (WGR), PVT data, fluid properties, etc. As these input parameters involve multiple discipline teams from petroleum technologists, engineering teams, operation teams, maintenance team, well engineering team, production chemistry personnel, real time operation systems engineers and corporate hydrocarbon accounting team, a comprehensive set of procedures, processes and clear roles are essential of the complete “system” to integrate effectively with the technology to achieve the anticipated data quality. Also, as the reservoir depletes, the flow operating envelope moves away from the flow meter designed operating envelope. Timely capturing and modifying the well head venturi wet gas flow meters for these changes is another challenge that requires adequate change process.
This paper details an improvement campaign carried out in one of these fields (refer to in this paper as Field-A), where a comprehensive study of aspects of technology, engineering, procedures, processes and people was carried out and resulted in an improved and sustained measurement performance of Field-A. The paper also highlights how a fully integrated system of technology, processes and people can deliver substantial improvements with virtually no cost.
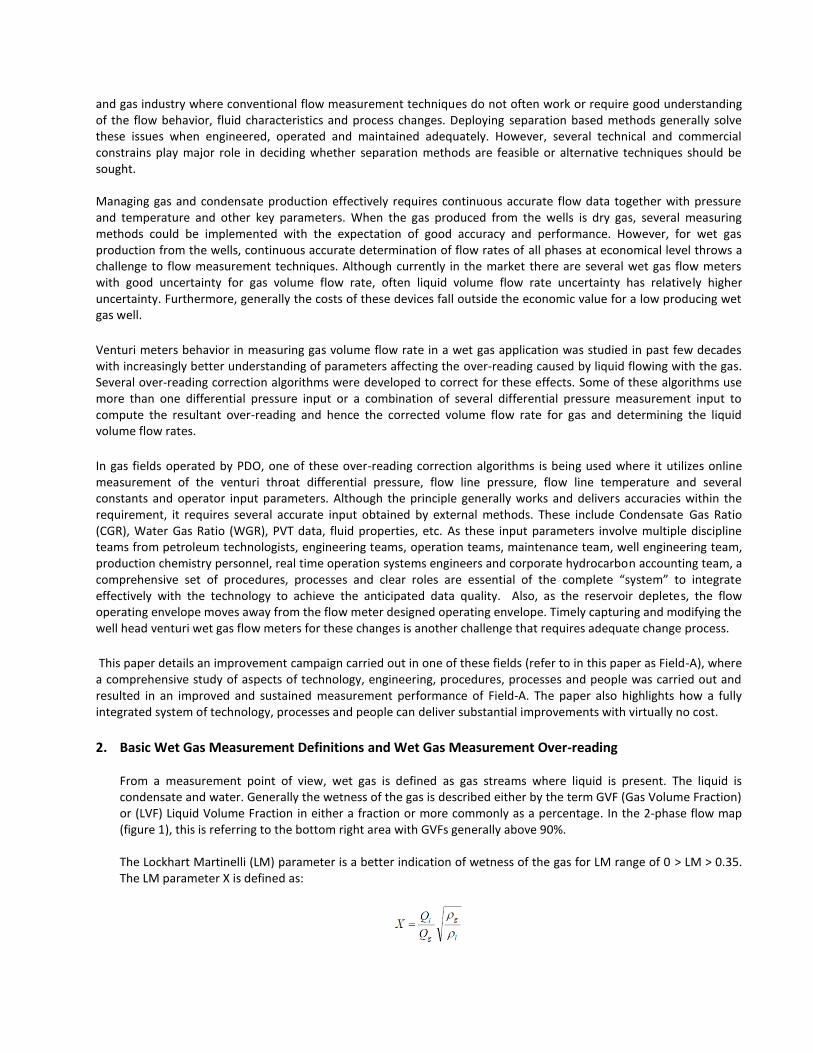
2. Basic Wet Gas Measurement Definitions and Wet Gas Measurement Over-reading From a measurement point of view, wet gas is defined as gas streams where liquid is present. The liquid is condensate and water. Generally the wetness of the gas is described either by the term GVF (Gas Volume Fraction) or (LVF) Liquid Volume Fraction in either a fraction or more commonly as a percentage. In the 2-phase flow map (figure 1), this is referring to the bottom right area with GVFs generally above 90%. The Lockhart Martinelli (LM) parameter is a better indication of wetness of the gas for LM range of 0 > LM > 0.35. The LM parameter X is defined as:

The wet gas metering uses a single-phase gas flow metering device (eg. Orifice, venturi or cone type) where a positive bias is introduced when small volume of liquids flows with the gas. This is referred to as “over-reading”. This can be corrected using industry established correlations, or sometimes models, to ultimately calculate the gas component flow rate. These corrections can only be applied when the fluids properties and the liquid contents are well known.
Figure 1: Two-Phase Flow Map
3. Main Measurements in Field-A Field-A is one of several gas fields which produce gas and condensate to an integrated network of gas processing and condensate stabilization plants. Several gas wells are producing to Facility-A where the gas is processed and exported to the main gas line. The condensate is exported to another facility for stabilization and export. The main measured streams are: 3.1 Wellhead Wet Gas Stream
Using ISO-5167 venturi meters with throat differential pressure measurement, recovery differential pressure measurement dP2 (not used in the calculation), pressure and temperature measurements. The calculation is implemented in the DCS. The overall uncertainty requirement for each phase varies but generally better than +/- 10 – 20%.
Figure 2 - Typical Drawing of a Venturi Meter for Wet Gas Measurement in PDO
3.2 Facility Inlet Separation
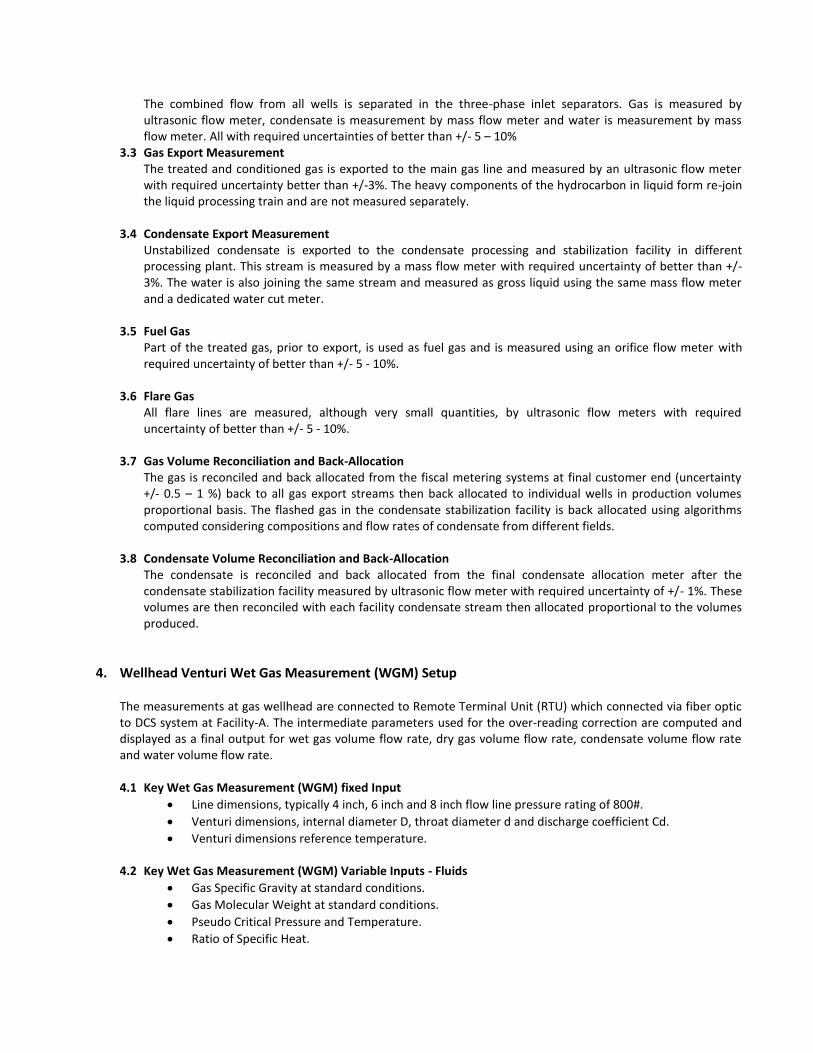
The combined flow from all wells is separated in the three-phase inlet separators. Gas is measured by ultrasonic flow meter, condensate is measurement by mass flow meter and water is measurement by mass flow meter. All with required uncertainties of better than +/- 5 – 10%
3.3 Gas Export Measurement The treated and conditioned gas is exported to the main gas line and measured by an ultrasonic flow meter with required uncertainty better than +/-3%. The heavy components of the hydrocarbon in liquid form re-join the liquid processing train and are not measured separately.
3.4 Condensate Export Measurement Unstabilized condensate is exported to the condensate processing and stabilization facility in different processing plant. This stream is measured by a mass flow meter with required uncertainty of better than +/- 3%. The water is also joining the same stream and measured as gross liquid using the same mass flow meter and a dedicated water cut meter.
3.5 Fuel Gas Part of the treated gas, prior to export, is used as fuel gas and is measured using an orifice flow meter with required uncertainty of better than +/- 5 - 10%.
3.6 Flare Gas All flare lines are measured, although very small quantities, by ultrasonic flow meters with required uncertainty of better than +/- 5 - 10%.
3.7 Gas Volume Reconciliation and Back-Allocation The gas is reconciled and back allocated from the fiscal metering systems at final customer end (uncertainty +/- 0.5 – 1 %) back to all gas export streams then back allocated to individual wells in production volumes proportional basis. The flashed gas in the condensate stabilization facility is back allocated using algorithms computed considering compositions and flow rates of condensate from different fields.
3.8 Condensate Volume Reconciliation and Back-Allocation The condensate is reconciled and back allocated from the final condensate allocation meter after the condensate stabilization facility measured by ultrasonic flow meter with required uncertainty of +/- 1%. These volumes are then reconciled with each facility condensate stream then allocated proportional to the volumes produced.
4. Wellhead Venturi Wet Gas Measurement (WGM) Setup The measurements at gas wellhead are connected to Remote Terminal Unit (RTU) which connected via fiber optic to DCS system at Facility-A. The intermediate parameters used for the over-reading correction are computed and displayed as a final output for wet gas volume flow rate, dry gas volume flow rate, condensate volume flow rate and water volume flow rate. 4.1 Key Wet Gas Measurement (WGM) fixed Input
Line dimensions, typically 4 inch, 6 inch and 8 inch flow line pressure rating of 800#.
Venturi dimensions, internal diameter D, throat diameter d and discharge coefficient Cd.
Venturi dimensions reference temperature.
4.2 Key Wet Gas Measurement (WGM) Variable Inputs - Fluids
Gas Specific Gravity at standard conditions.
Gas Molecular Weight at standard conditions.
Pseudo Critical Pressure and Temperature.
Ratio of Specific Heat.

Condensate Density at standard conditions.
Condensate Molecular Weight at standard conditions.
Water Density at standard conditions.
4.3 Key Wet Gas Measurement (WGM) Variable Inputs – Liquid Ratios
Condensate Gas Ratio (CGR) at standard conditions.
Water Gas Ratio (WGR) at standard conditions.
4.4 Key Wet Gas Measurement (WGM) – PVT Data
Gas density polynomial coefficients for range of operating Pressures and Temperatures.
Gas Molecular Weight linear coefficients for range of operating Pressures and Temperatures.
Gas Pseudo Critical Pressure and Temperature linear coefficients for ranges of pressures and temperatures.
Condensate density polynomial coefficients for range of operating Pressures and Temperatures.
Condensate Molecular Weight linear coefficients for range of operating Pressures and Temperatures.
4.5 Measured Variables
Venturi throat differential pressure.
Venturi recovery differential pressure (not used in the computation).
Upstream pressure.
Flow line temperature
Figure 3: Typical Wet Gas Measurement (WGM) System Overview and Data Flow
5. Filed-A Wellhead Measurement Historical Performance Since commissioning of Facility-A together with introduction of wet gas production from Field-A wells, it was observed that there is noticeable gap between the volumes of gas and condensate reported by wellhead venturi wet gas meters and the final export meter measured volumes. An imbalance of 40-50% was consistence but with a slightly declining trend.

Due to this imbalance, the monthly volumes reconciliation factors of Field-A has been low for quite some time distributing the imbalance proportional to the volumes produced from each well.
Figure 4: Field-A Gas and Condensate Reconciliation Factors Historical Trends
6. Improvement Methodology Since the final data delivered from a set of tens of measurement points within Field-A, Facility-A and other facilities in the production network system; it was necessary to get key parties involved from subsurface team, engineering team, operation and maintenance teams, hydrocarbon accounting team, metering specialists, production chemistry, real time operation, DCS engineers and process engineers to ensure the whole chain of measurement and data transfer if healthy and to capture where issues are and how they can be fixed. 6.1 Teams Involved
Below is a short list of some activities contributing to the measurement performance of the venturi based wet gas measurement managed by each team involved.
6.1.1 Well and Reservoir Management Team
The team manages the performance of the reservoirs contributing to the production of Field-A, obtaining updated CGR and WGR for each test period for each well and manages PVT data relevant to Field-A.
6.1.2 Process and Concept Engineering Team
The team support in PVT simulation, carry out flash calculations of condensate and supply initial fluid properties in different stage of the process. In addition, the team does conceptual studies for new metering requirement at wellheads, facilities and export systems and reviews metering upgrade requirements for the future depletion scenarios and production profiles.
6.1.3 Design Team
The team carries out all design activities including sizing the suitable size meters for forecasted production profile, procuring, inspecting and testing the new meters. Also supplying all configuration documents, drawings, data sheets, construction drawings, spares, etc. In addition, managing all related activities relevant to connecting the measurement across all links to the hydrocarbon accounting system and maintenance management system.
6.1.4 Construction Team

The team is responsible to ensure the meters and supporting instrumentation is constructed as per the approved for construction drawings, carry out loop checks, calibration of instruments, configuration, testing and pre-commissioning activities.
6.1.5 Commissioning Team
The team ensures the hydrocarbons are measured and data are available across all systems up to the hydrocarbon accounting system. Also, resolves any calibration, communication, configuration issues and prepare to handover to operations.
6.1.6 Operations Team
The team does checks on the measurement and accepts new meters installations. During operation they monitor and report the volumes measured should the automatic transfer has issues. Adjust choke size and update the CGR and WGR values in the correction algorithm. Also, reports any failures or issues in the measurement.
6.1.7 Site Maintenance and Calibration Team
The team is directly involved in executing the planned maintenance and calibration activities, keeps records of calibrations, update in the maintenance management system and carryout corrective and troubleshooting activities when required. In addition, team highlights any improvement required through a facility change proposal process. The maintenance team also gets involved during commissioning of new meter installations as part of the handover and acceptance stage.
6.1.8 Hydrocarbon Accounting Team
This team monitors wells production, plan well testing, validate well testing data, update CGR and WGR values in the hydrocarbon accounting system and optimize overall condensate and gas production to meet customers plans. Also, the team raises any potential mis-measurement issues to maintenance support team for corrective actions and troubleshooting. In addition, the team incorporates new fields and facilities in the allocation structure.
6.1.9 Metering Maintenance Support Team
The team involves in metering reviews, new metering projects as operation/maintenance input, participate in design reviews, testing and inspections of new meters and during integration activities. Also, the team maintains an overview of metering issues and interfaces with projects, operation and site maintenance teams and follow up actions implementation. The team provides second line maintenance support to the site metering maintenance and calibration team and provides coaching to new metering technicians.
6.1.10 Systems (DCS) Support Team The team configures the wet gas measurement calculation blocks in DCS, creates all relevant DCS tags, creates and modifies WGM DCS graphics and reports and adds new WGMs of new wells. The team also interfaces with real time operation team for data connectivity and reprogram WGMs from Metering Specialist team requests.
6.1.11 Real Time Operations Team (RTO) The RTO team manages all data connectivity from DCS and other systems in the field to the data historian, production portal and the automatic transfer to the hydrocarbon accounting system. The team also configures automatic reports of all production data from WGMs and facilities.
6.1.12 Metering Specialist and Support Team
The team sets the metering strategies, evaluates metering technologies, the owner of all metering related procedures and processes and is the technical authority for metering across all phases and

stages of projects and operations. The team also conducts metering audits, leads metering improvement initiatives and develops metering staff capabilities and competencies.
6.1.13 Production Chemistry Team
The team supports metering systems by providing fluid properties information, takes fluid verification samples, carries out fluid sample analysis and maintains database of all fluid sample results.
6.1.14 Information Technology Team The IT team configures the hydrocarbon accounting system for any new stream, upgrades or modifications and interfaces with real time operations team in few aspects of the automatic data transfer and RTO applications.
6.1.15 Technology Implementation Team The team updates the current and future challenges in metering and interface with stakeholders and the metering Specialist Support team to develop and update metering technology roadmap. The team provides corporate support for evaluation and introduction of new metering technologies.
6.2 The WGM Improvement Team
A team was formed consists of members from WRM, process engineering, hydrocarbon accounting, site maintenance, metering maintenance support, RTO, DCS systems and lead by a Metering Specialist to “dive-in” the whole metering network of Field-A and Facility-A together with a comprehensive focus to the complete gas and condensate network in all other facilities and fields. A Steering Committee was formed to provide support and facilitate the mission of the improvement team. The Steering Committee team consists of the Petroleum Manager, Engineering Manager, Operations Manager and the Automation Manager. The role of the Steering Committee was very evident in facilitating the implementation of the identified issues and proposed solutions. A monthly meeting with the Steering Committee was organized to go through findings, progress and to clear any obstacles that may hinder the progress.
6.3 The Methodology The improvement team developed a methodology to be used during the improvement campaign that engages stakeholders, evaluates current key measurements, substantiates causes of mis-measurement, quantity measurement errors and communicate closely with the Steering Committee. 6.3.1 Stakeholders Engagement Workshop
A workshop prior to start any physical work was conducted. Representatives from different teams and disciplines participated to pin exactly the current symptoms and problem areas, focus on different measurement segments and propose practical time and cost effective solutions.
6.3.2 Existing Measurement Issues The team then listed and prioritized the measurement and potential impact on the wet gas measurement and hence the reconciliation factors. The issues and solutions were categorized as quick-fix, medium term or sustainability solution.
6.3.3 Measurement Issues Substantiation The team then zoomed in all contributors of potential mis-measurements in the WGM, facility and export metering systems. Derived a focused plan towards addressing the high potential ones and picked sample WGMs for error quantification.
6.3.4 Measurement Errors Quantification

The team started first with the simple checks that may heavily impact the measurement. Examples of these are configuration. Data flow across systems. Totalizes and compensations health checks, PVT and fluid data and calibration of selected WGM dP transmitters. Then these were used in off-line WGM simulation tool to quantify measurement errors associated with main aspects of the WGM measurement.
6.3.5 Communication and Steer All findings, errors and proposals were communicated to the Steering Committee for implementation. Informing all stakeholders that there will be a change happening at certain defined result and has an impact on the measurement within approximately the quantified errors. This step was necessary to get stakeholders onboard and prepared for the change. Also, it served as obtaining agreement for higher management on the change and providing the required support to execute the recommendations.
6.3.6 Implementation All activities are implemented by the authorized teams and documentation is updated. DCS graphics and measurement tags are modified and the whole chain of data transfer is checked up to the hydrocarbon accounting system.
6.3.7 Review Following the implementation, the new measurement trend is monitored against the expected change from the off-line simulation then accepted by WRM and operations team. The same steps then repeated for all WGM, facility and export metering systems. Proposals for upgrades, engineering changes, procedure improvement, competency and development of staff are presented and planned as sustainability activities.
7. Stakeholders Engagement Workshop Outcome The workshop was an essential stage of the whole process, the improvement team considers it as one of the most important stages to capture issues, understand the priorities, manage the expectation of different teams and individuals involved, and to ensure consensus and commitment among stakeholders to contribute and support the improvement team. Attendees reflected representation from all involved team. The workshop was opened by the Steering Committee which has injected the required importance and urgency to the campaign. The workshop was facilitated by an independent staff who is not involved in measurement or a data user but is skilled in facilitation; this added more effective structure to the workshop and maximized efficiency during discussions and suggestions. The issues were categorized in four main focus themes: Wells & Well Testing, wellhead wet gas measurement (WGM), Facility Measurement and Reconciliation Process.
7.1 Theme 1: Wells and Well Testing
This theme focused on the adequacy of wells flow rate monitoring, forecast data, initiation process for wellhead meters change or parameters update, well testing methods used to obtain CGR and WGR values, PVT data and other key relevant aspects.
7.1.1 Well Monitoring
The main aspect is to realize timely based on meter design data, fluid properties and forecasted flow rates that a meter change will be required and to plan for it. As often the change process takes sometimes a year or more, it was evident that to manage this aspect an efficient process or tool was necessary to notify data user that a change may be required for a particular meter well in advance. Although Field-A wells flow rates were within the operating window of the wellhead venturi meters,
it was necessary to capture this process or tool for future and for other fields which may require meter change sooner than Field-A.
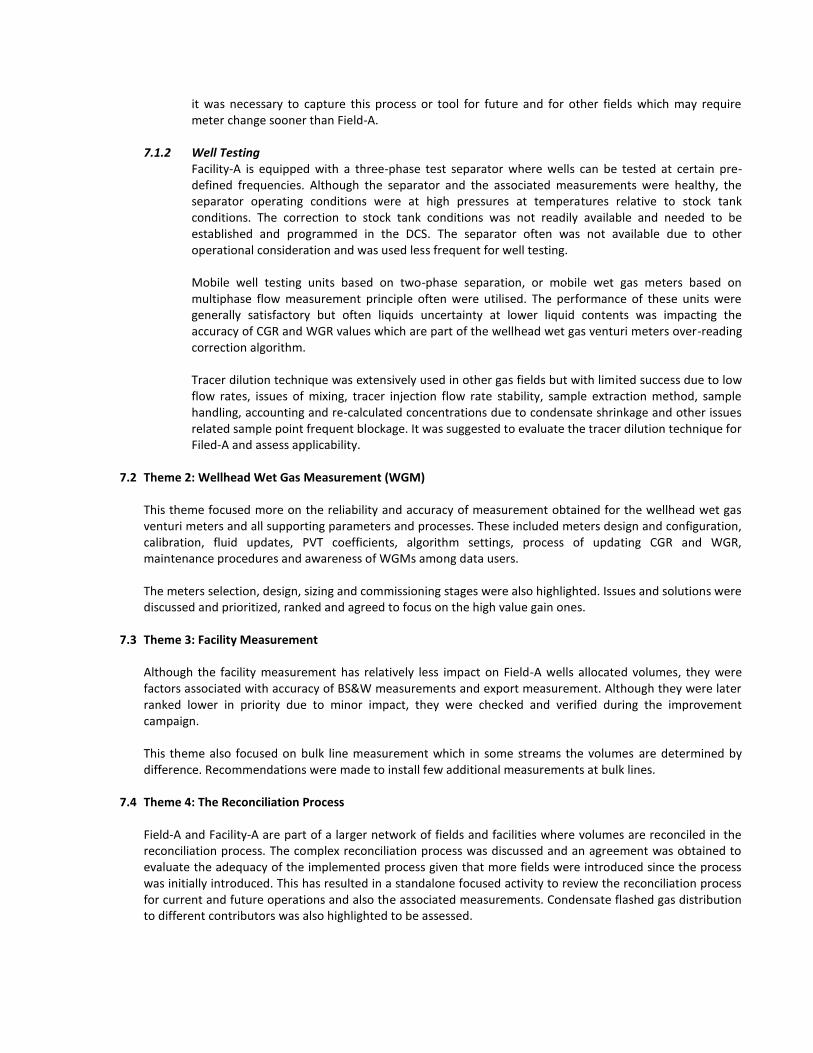
7.1.2 Well Testing Facility-A is equipped with a three-phase test separator where wells can be tested at certain pre-defined frequencies. Although the separator and the associated measurements were healthy, the separator operating conditions were at high pressures at temperatures relative to stock tank conditions. The correction to stock tank conditions was not readily available and needed to be established and programmed in the DCS. The separator often was not available due to other operational consideration and was used less frequent for well testing. Mobile well testing units based on two-phase separation, or mobile wet gas meters based on multiphase flow measurement principle often were utilised. The performance of these units were generally satisfactory but often liquids uncertainty at lower liquid contents was impacting the accuracy of CGR and WGR values which are part of the wellhead wet gas venturi meters over-reading correction algorithm. Tracer dilution technique was extensively used in other gas fields but with limited success due to low flow rates, issues of mixing, tracer injection flow rate stability, sample extraction method, sample handling, accounting and re-calculated concentrations due to condensate shrinkage and other issues related sample point frequent blockage. It was suggested to evaluate the tracer dilution technique for Filed-A and assess applicability.
7.2 Theme 2: Wellhead Wet Gas Measurement (WGM) This theme focused more on the reliability and accuracy of measurement obtained for the wellhead wet gas venturi meters and all supporting parameters and processes. These included meters design and configuration, calibration, fluid updates, PVT coefficients, algorithm settings, process of updating CGR and WGR, maintenance procedures and awareness of WGMs among data users. The meters selection, design, sizing and commissioning stages were also highlighted. Issues and solutions were discussed and prioritized, ranked and agreed to focus on the high value gain ones.
7.3 Theme 3: Facility Measurement Although the facility measurement has relatively less impact on Field-A wells allocated volumes, they were factors associated with accuracy of BS&W measurements and export measurement. Although they were later ranked lower in priority due to minor impact, they were checked and verified during the improvement campaign. This theme also focused on bulk line measurement which in some streams the volumes are determined by difference. Recommendations were made to install few additional measurements at bulk lines.
7.4 Theme 4: The Reconciliation Process Field-A and Facility-A are part of a larger network of fields and facilities where volumes are reconciled in the reconciliation process. The complex reconciliation process was discussed and an agreement was obtained to evaluate the adequacy of the implemented process given that more fields were introduced since the process was initially introduced. This has resulted in a standalone focused activity to review the reconciliation process for current and future operations and also the associated measurements. Condensate flashed gas distribution to different contributors was also highlighted to be assessed.

Table 1: Stakeholders Engagement Workshop Key Focused Areas
8. Main Findings in Wet Gas Measurement (WGM) The improvement team, with close collaboration with different teams and disciplines, managed to gather key data and information related to WGM meters, facilities and export metering systems. It was found that most causes of errors were in the venturi wet gas meters data and data transfer. Additionally few facilities meters and condensate flash algorithm required minor improvements. 8.1 WGM Measurement Improvement
Reference to Figure 3, all aspects of WGM measurement, up to the hydrocarbon accounting system, were checked. Figure 5 shows a summary overview of main errors contributors.
SN Issues / Concern Priority Proposed Solution /Suggestion
Proposed
Action Party
1
Rapid well decline (outside meter
envelope) 3
Predict time of change of meter (display live
operating envelope) Team A
2 Commingling wells 2 Adhere to WRM strategy Team A
3 Knowing reservoir split 2 Increase PLT acquisition frequency Team A
4 Forecasting correct decline 3
Provide and communicate forecast to
engineers and project teams Team B
5 Frequency of well testing 2
Provide and utilise permanent well testing
facilities Team B
6 Timely fixing malfuncted sensors 1 Review adequacy of manpower levels Team E
7 Testing wells at line conditions/separator 1 5 wells trials at flash condition Team C
8 Communication (well to DCS) 1 Continue improving the remaining 10% Team D
9 Data freezing 1 Continue improving Team F
10 Accuracy of CGR and WGR 2
Assess current and alternative testing
methods Team B
11
Meters operated outside operating
envelope 1 Replace venturi meters Team D
12
WGM algorithm transparency and
parameters configuration 1
Conduct full review and health check (define
single point responsibility) Team D
13 Maintenance of venturi meters 2
Review maintenance strategy and how issues
are reported to RTO support team Team D
14 Update of CGR and WGR in EC and WGM 2 Define focal point for each cluster Team C
15
Methodology/technology of determining
CGR and WGR 3
Review tracer technique
Re-design sample/injection points Team B
16
Who's the owner and what's the process
of update 1 Come up with procedure/process Team D
17 BS&W Measurement 3
Review all BS&W measurement and come up
with plan Team D
18 No bulk meters for key streams 2 Consider meter installation Team G
19 Snap shot measurement to EC 1 Configure average/totalised measurement Team D
20
Volume based allocation (impact of multi-
processing on individual fields
condensate) 3
Conduct pilot study of mass reconciliation and
Hysis modelling to assess the impact for
individual field Team B
21
Manual update of the reading (not
relaying on meters) 2 Improve WGM and communication Team C
22 Flash gas calculation 3 To carry out simulation Team C
23
Awareness of allocation structure and wet
gas metering 2 Conduct road show/engagement/training
Team C
Team D
24
Methodology of allocation in absence of
meters readings 3 Develop methodology/procedure
Team C
Team D
25 Condensate export meter not fiscalised 3 Fiscalise export meter Team G
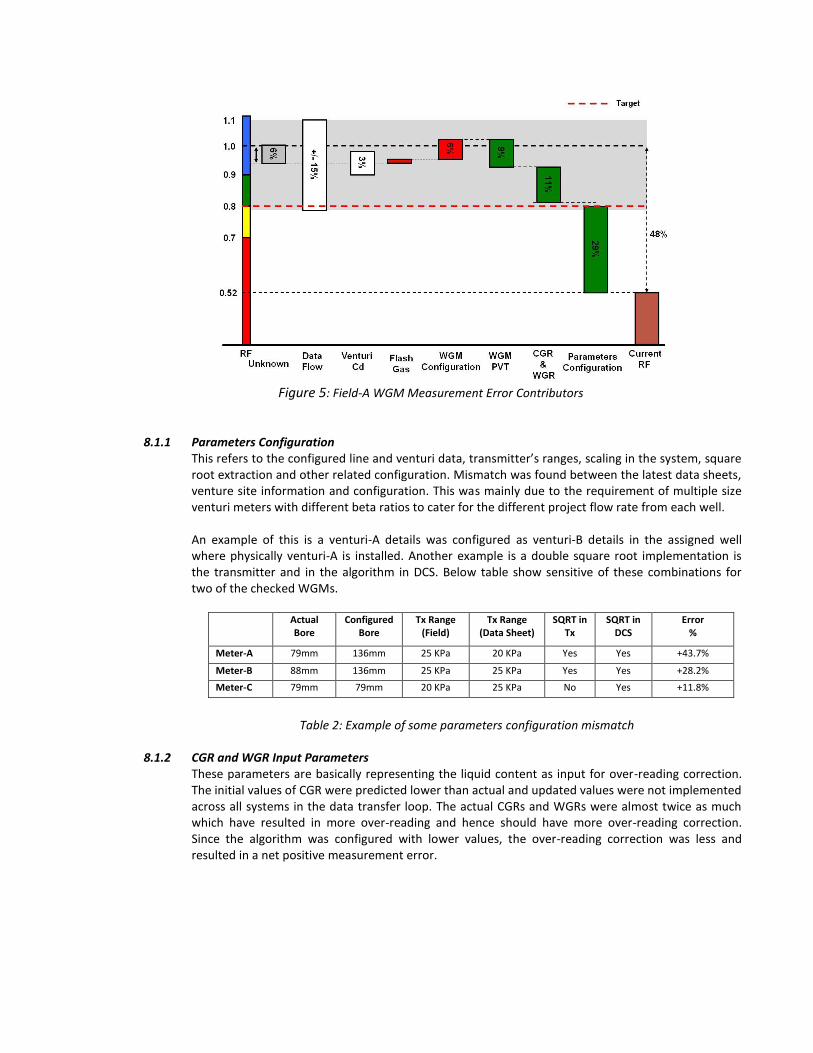
Figure 5: Field-A WGM Measurement Error Contributors
8.1.1 Parameters Configuration
This refers to the configured line and venturi data, transmitter’s ranges, scaling in the system, square root extraction and other related configuration. Mismatch was found between the latest data sheets, venture site information and configuration. This was mainly due to the requirement of multiple size venturi meters with different beta ratios to cater for the different project flow rate from each well. An example of this is a venturi-A details was configured as venturi-B details in the assigned well where physically venturi-A is installed. Another example is a double square root implementation is the transmitter and in the algorithm in DCS. Below table show sensitive of these combinations for two of the checked WGMs.
Actual
Bore Configured
Bore Tx Range
(Field) Tx Range
(Data Sheet) SQRT in
Tx SQRT in
DCS Error
%
Meter-A 79mm 136mm 25 KPa 20 KPa Yes Yes +43.7%
Meter-B 88mm 136mm 25 KPa 25 KPa Yes Yes +28.2%
Meter-C 79mm 79mm 20 KPa 25 KPa No Yes +11.8%
Table 2: Example of some parameters configuration mismatch
8.1.2 CGR and WGR Input Parameters These parameters are basically representing the liquid content as input for over-reading correction. The initial values of CGR were predicted lower than actual and updated values were not implemented across all systems in the data transfer loop. The actual CGRs and WGRs were almost twice as much which have resulted in more over-reading and hence should have more over-reading correction. Since the algorithm was configured with lower values, the over-reading correction was less and resulted in a net positive measurement error.
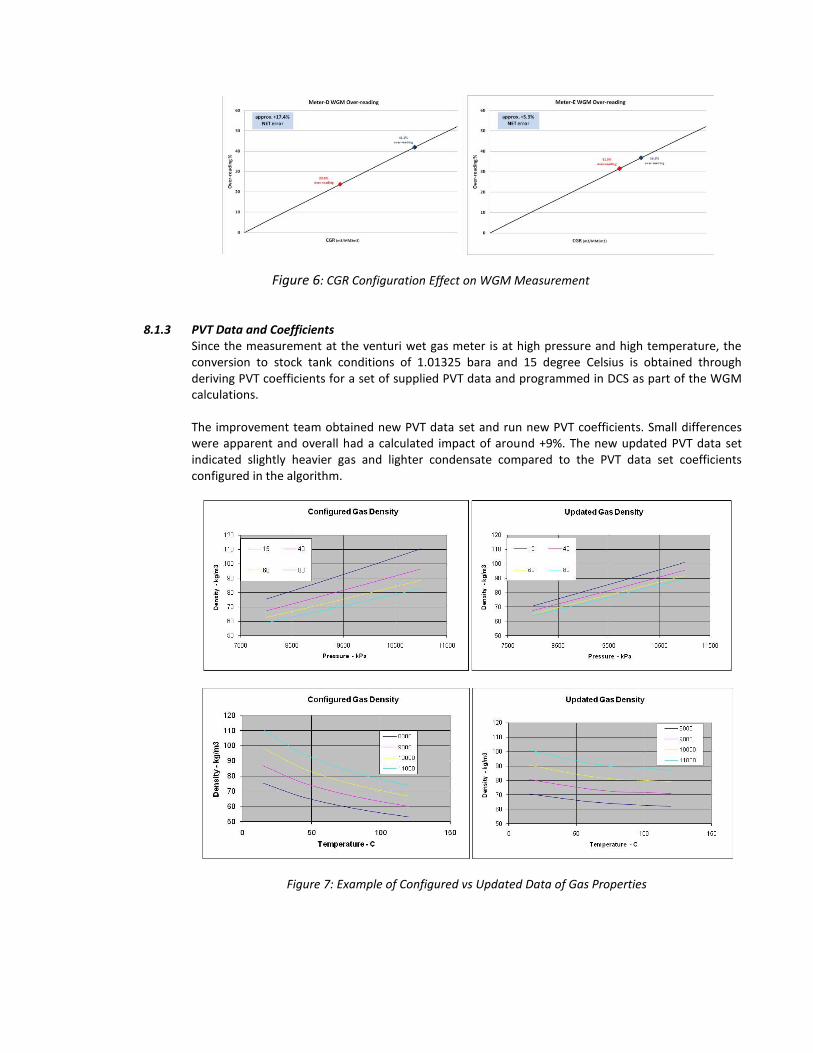
Figure 6: CGR Configuration Effect on WGM Measurement
8.1.3 PVT Data and Coefficients Since the measurement at the venturi wet gas meter is at high pressure and high temperature, the conversion to stock tank conditions of 1.01325 bara and 15 degree Celsius is obtained through deriving PVT coefficients for a set of supplied PVT data and programmed in DCS as part of the WGM calculations. The improvement team obtained new PVT data set and run new PVT coefficients. Small differences were apparent and overall had a calculated impact of around +9%. The new updated PVT data set indicated slightly heavier gas and lighter condensate compared to the PVT data set coefficients configured in the algorithm.
Figure 7: Example of Configured vs Updated Data of Gas Properties
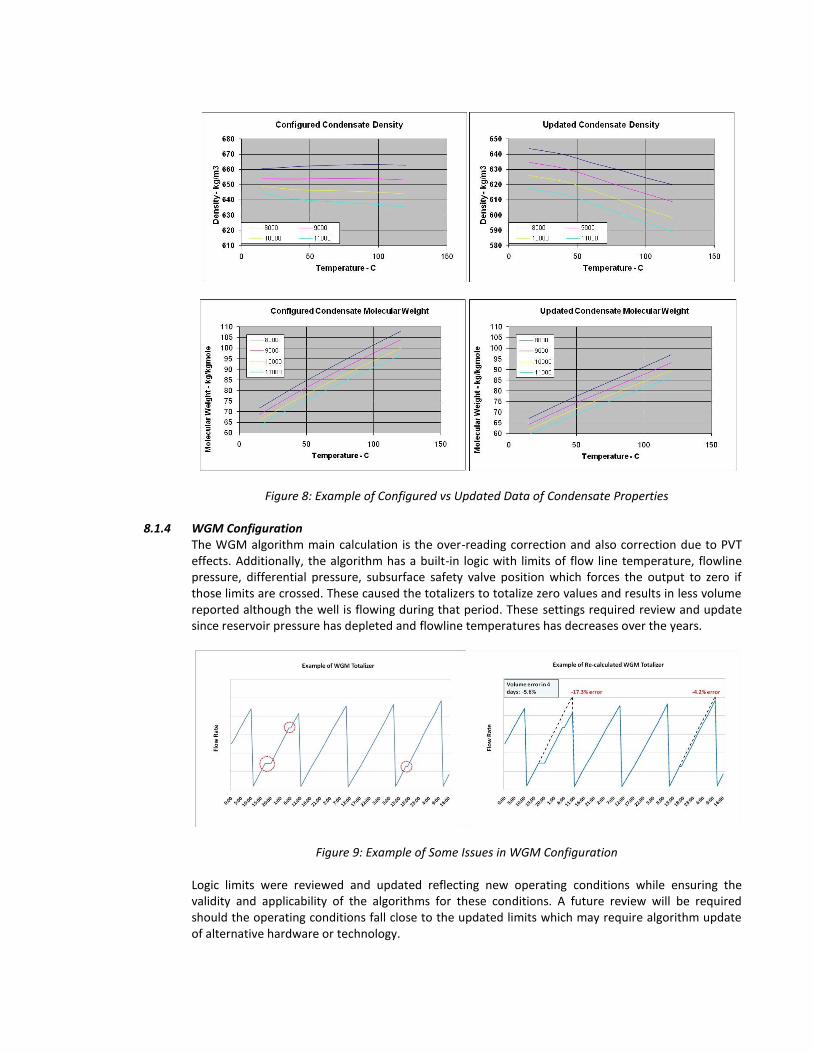
Figure 8: Example of Configured vs Updated Data of Condensate Properties
8.1.4 WGM Configuration The WGM algorithm main calculation is the over-reading correction and also correction due to PVT effects. Additionally, the algorithm has a built-in logic with limits of flow line temperature, flowline pressure, differential pressure, subsurface safety valve position which forces the output to zero if those limits are crossed. These caused the totalizers to totalize zero values and results in less volume reported although the well is flowing during that period. These settings required review and update since reservoir pressure has depleted and flowline temperatures has decreases over the years.
Figure 9: Example of Some Issues in WGM Configuration Logic limits were reviewed and updated reflecting new operating conditions while ensuring the validity and applicability of the algorithms for these conditions. A future review will be required should the operating conditions fall close to the updated limits which may require algorithm update of alternative hardware or technology.
8.1.5 Condensate Flashed Gas Measurement The flashed gas from condensate in the condensate stabilization plant is allocated back to all contributing field based on volumes-composition ratios. Although the measurement at flashed gas is adequate and the volumes compared to the total gas production is minor, the flashed gas was slightly over-allocated to Field-A. Updated fluid data and simulations concluded that less that -1% impact on Field-A reconciliation factor.
8.1.6 Venturi Discharge Coefficient (Cd) The discharge coefficients used in the WGM is as supplied by the venturi meters suppliers of a default of 0.995. As the uncertainty requirement for this application is +/- 10-20%, a venturi Cd calibration has not been considered as Reynolds numbers are above 500,000. An estimated maximum unconfirmed uncertainty of +/-3% was used to establish potential impact on the reconciliation factor.
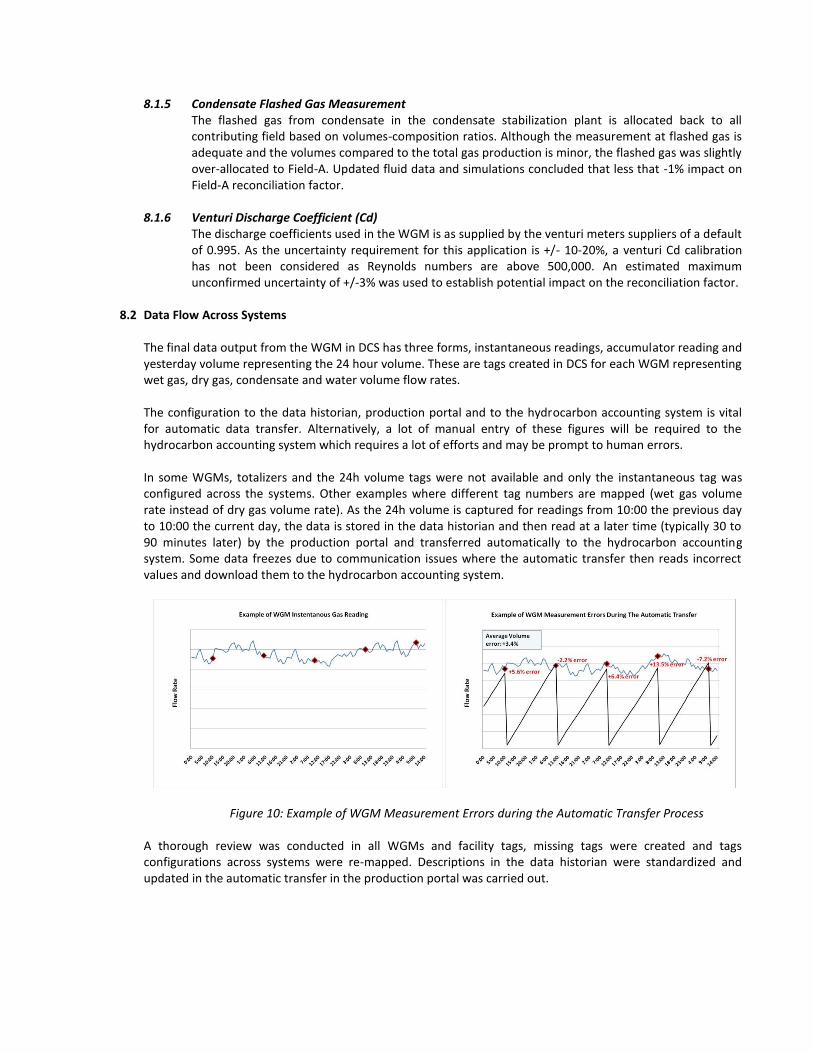
8.2 Data Flow Across Systems The final data output from the WGM in DCS has three forms, instantaneous readings, accumulator reading and yesterday volume representing the 24 hour volume. These are tags created in DCS for each WGM representing wet gas, dry gas, condensate and water volume flow rates. The configuration to the data historian, production portal and to the hydrocarbon accounting system is vital for automatic data transfer. Alternatively, a lot of manual entry of these figures will be required to the hydrocarbon accounting system which requires a lot of efforts and may be prompt to human errors. In some WGMs, totalizers and the 24h volume tags were not available and only the instantaneous tag was configured across the systems. Other examples where different tag numbers are mapped (wet gas volume rate instead of dry gas volume rate). As the 24h volume is captured for readings from 10:00 the previous day to 10:00 the current day, the data is stored in the data historian and then read at a later time (typically 30 to 90 minutes later) by the production portal and transferred automatically to the hydrocarbon accounting system. Some data freezes due to communication issues where the automatic transfer then reads incorrect values and download them to the hydrocarbon accounting system.
Figure 10: Example of WGM Measurement Errors during the Automatic Transfer Process A thorough review was conducted in all WGMs and facility tags, missing tags were created and tags configurations across systems were re-mapped. Descriptions in the data historian were standardized and updated in the automatic transfer in the production portal was carried out.

9. Overall Performance Improvement Implementation of the identified key issues has immediately resulted in considerable improvement. Although no hardware were changed, no vendor was called in and virtually at no additional costs, significant improvement was realized in both gas and condensate reconciliation factors for Field-A. In addition, automatic transfer of data has improved where the load on operations staff in manually entering the data in the hydrocarbon accounting system was significantly reduced. 9.1 Reconciliation Factor Improvement
The gas reconciliation factor has improved and sustained at a factor of 1.03 – 1.07 indicating an imbalance of some 3% - 7% compared to an imbalance of 40% - 50%. In addition, wells flow rates were more accurately determined on a day to day basis rather than only monthly volumes. The same campaign was carried out using the same methodology in Field-B and subsequently in all other fields and resulted in various improvements in the reconciliation factors of gas and condensate.
9.2 Automatic Transfer Improvement Another important measure to the success of the improvement campaign was the percentage of automatic data transfer against manual data transfer. This gives an indication of both data quality and reliability of the whole data loop from sensor up to the hydrocarbon accounting system. Also it indicates end users acceptance to the data. An improvement from some 10% automatic data transfer to above 90% automatic data transfer.
Figure 10: Improvement Achieved in Gas Reconciliation Factors and Automatic Data Transfer
10. Sustainability Activities Having addressed the measurement issues and realized improvements in both key elements of reconciliation factors and automatic data transfer, the focus was given to sustainability activities which will ensure continuity of the realized improvement. These were focused on staff awareness, engagement, coaching, training and competency. Also, it gave focus to processes and procedures which are key to ensure a complete link between technology and people.
10.1 People Road shows, awareness sessions, training on wet gas measurement relevant to these fields were conducted both at head offices and sites covering all teams involved in delivering quality and reliable data from sensors to the hydrocarbon accounting system.
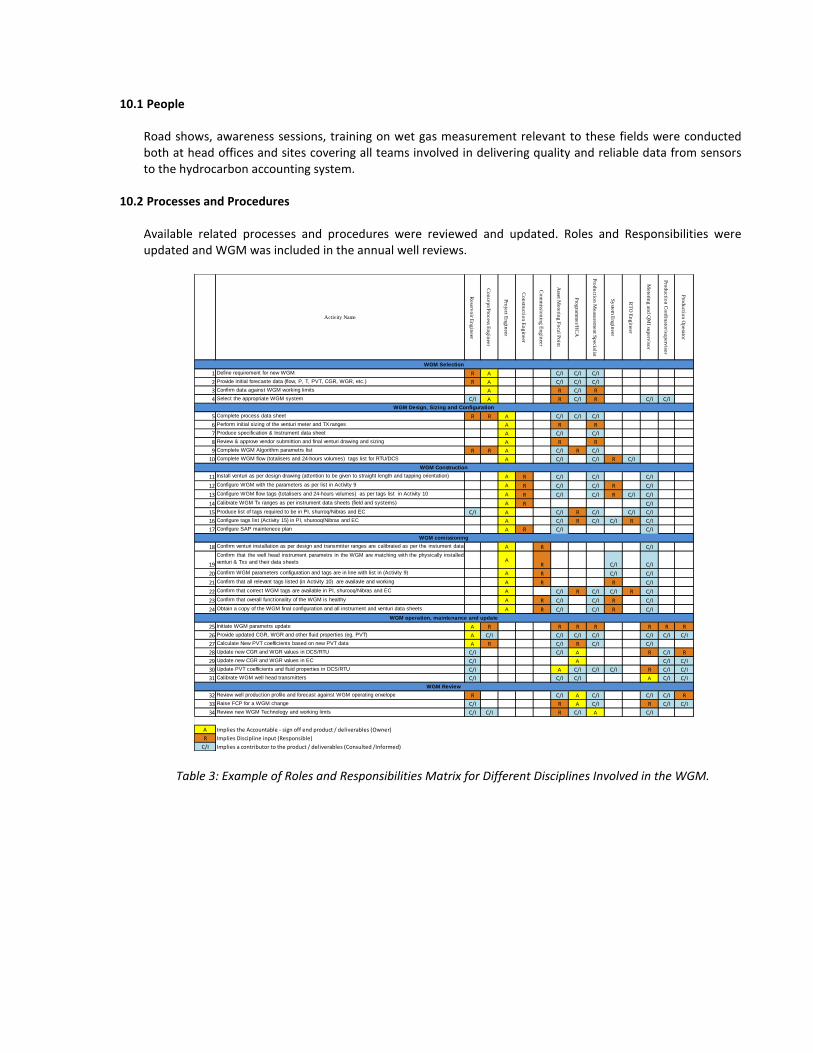
10.2 Processes and Procedures Available related processes and procedures were reviewed and updated. Roles and Responsibilities were updated and WGM was included in the annual well reviews.
Table 3: Example of Roles and Responsibilities Matrix for Different Disciplines Involved in the WGM.
Activity Name
Rese
rvo
ir En
gin
eer
Co
ncep
t/Pro
cess E
ng
ineer
Pro
ject E
ng
ineer
Co
nstru
ctio
n E
ng
ineer
Co
mm
ission
ing
En
gin
eer
Asse
t Mete
ring
Fo
cal P
oin
t
Pro
gra
mm
er/H
CA
Pro
du
ctio
n M
easu
rem
en
t Sp
ecia
list
Sy
stem
En
gin
eer
RT
O E
ng
ineer
Mete
ring
an
d Q
MI su
perv
isor
Pro
du
ctio
n C
ord
inato
r/sup
erv
isor
Pro
du
ctio
n O
pera
tor
1 Define requirement for new WGM R A C/I C/I C/I
2 Provide initial forecaste data (flow, P, T, PVT, CGR, WGR, etc.) R A C/I C/I C/I
3 Confirm data against WGM working limits A R C/I R
4 Select the appropriate WGM system C/I A R C/I R C/I C/I
5 Complete process data sheet R R A C/I C/I C/I
6 Perform initial sizing of the venturi meter and TX ranges A R R
7 Produce specification & Instrument data sheet A C/I C/I
8 Review & approve vendor submittion and final venturi drawing and sizing A R R
9 Complete WGM Algorithm parametrs list R R A C/I R C/I
10 Complete WGM flow (totalisers and 24-hours volumes) tags list for RTU/DCS A C/I C/I R C/I
11 Install venturi as per design drawing (attention to be given to straight length and tapping orientation) A R C/I C/I C/I
12 Configure WGM with the parameters as per list in Activity 9 A R C/I C/I R C/I
13 Configure WGM flow tags (totalisers and 24-hours volumes) as per tags list in Activity 10 A R C/I C/I R C/I C/I
14 Calibrate WGM Tx ranges as per instrument data sheets (field and systems) A R C/I
15 Produce list of tags required to be in PI, shurroq/Nibras and EC C/I A C/I R C/I C/I C/I
16 Configure tags list (Activity 15) in PI, shurooq/Nibras and EC A C/I R C/I C/I R C/I
17 Configure SAP maintenece plan A R C/I C/I
18 Confirm venturi installation as per design and transmitter ranges are calibrated as per the instument data
sheetsA R C/I
19
Confirm that the well head instrument parametrs in the WGM are matching with the physically installed
venturi & Txs and their data sheets AR C/I C/I
20 Confirm WGM parameters configuration and tags are in line with list in (Activity 9) A R C/I C/I
21 Confirm that all relevant tags listed (in Activity 10) are availavle and working A R R C/I
22 Confirm that correct WGM tags are available in PI, shurooq/Nibras and EC A C/I R C/I C/I R C/I
23 Confirm that overall functionality of the WGM is healthy A R C/I C/I R C/I
24 Obtain a copy of the WGM final configuration and all instrument and venturi data sheets A R C/I C/I R C/I
25 Initiate WGM parametrs update A R R R R R R R
26 Provide updated CGR, WGR and other fluid properties (eg. PVT) A C/I C/I C/I C/I C/I C/I C/I
27 Calculate New PVT coefficients based on new PVT data A R C/I R C/I C/I
28 Update new CGR and WGR values in DCS/RTU C/I C/I A R C/I R
29 Update new CGR and WGR values in EC C/I A C/I C/I
30 Update PVT coefficients and fluid properties in DCS/RTU C/I A C/I C/I C/I R C/I C/I
31 Calibrate WGM well head transmitters C/I C/I C/I A C/I C/I
32 Review well production profile and forecast against WGM operating envelope R C/I A C/I C/I C/I R
33 Raise FCP for a WGM change C/I R A C/I R C/I C/I
34 Review new WGM Technology and working limts C/I C/I R C/I A C/I
A Implies the Accountable - sign off end product / deliverables (Owner)
R Implies Discipline input (Responsible)
C/I Implies a contributor to the product / deliverables (Consulted /Informed)
WGM Review
WGM Selection
WGM Design, Sizing and Configuration
WGM comissioning
WGM operation, maintenance and update
WGM Construction
11. Conclusion New technologies in measurement play an important role to achieve accurate and reliable measurement for the required applications. An equally important element is how these technologies are implemented, kept in healthy condition, reviewed regularly, the required parameters are updated and measurement performance s reviewed. In Oil and Gas industry, especially in large fields operations where multiple disciplines and teams involved in delivering quality data, it is essential to establish comprehensive set of processes and procedures that governs measurement performance. A thorough system of the right technology for the application, competent personnel who are kept engaged and communicated with and adequate processes and procedures that brings technology and people together will ensure that the required measurement performance is achieved. This improvement campaign has demonstrated that measurement improvement can be achieved through people and process aligned with the implemented technology. A structured methodology form engagement of key teams, supported by Steering Committee of key management personnel, proper evaluation and quantification of measurement errors prior to implementation and managing data users expectation were key aspects of the campaign success. Eventually, a complete synchronization of the three elements of technology, people and process complemented with regular reviews will be the input to explore for new technologies which can deliver more and maximizes measurement value.
12. Acknowledgement The author thanks the co-authors, the improvement team members, the Steering Committee, the stakeholders’ engagement workshop participants and all personnel who have provided support to this campaign. With their commitment and support this improvement has been realized. Thank you all.
Related Documents


