• Performance Evaluations • Troubleshooting & Optimization • Hydraulics Optimization • Training 2122 East Leland Circle Mesa, AZ 85213 1 (602) 810-7420 Date: April 21, 2014 Deston Dishion City of Bishop 377 West Line Street, P. O. Box 1236 Bishop, California 93515 Re: 2014 City of Bishop Wastewater Lagoon Performance Evaluation for Nitrogen Control Deston: Enclosed is the April 21, 2014 report for H&S Environmental’s performance evaluation of the of the City of Bishop’s wastewater lagoon treatment system The purpose of this report is to identify the cause(s) of elevated ammonia and nitrate concentrations from the effluent of the pond system and present solutions to eliminate nitrogen discharge in an effort to reduce elevated nitrogen in the monitoring wells. For the purposes of this report we will assume effluent ammonia can and will be converted to nitrate in the soil to effect groundwater nitrate levels. This assumption will allow us to focus on treatment options designed to eradicate nitrogen compounds within the pond system before discharge. The site visit of March 26 th and 27th showed excellent housekeeping and only minimal sludge accumulation in all four (4) ponds. Generally speaking the pond system is running well with an average 2013 effluent BOD 5 concentration of 37.7 mg/l and an average BOD 5 removal efficiency of 86.12%. Current 2014 test results show a BOD 5 removal efficiency of 90.1% Monitoring Wells # 2 and # 4 have shown at times to exceed groundwater monitoring well nitrate permit limit concentrations of 10 mg/L. Outlined in this report are a number of recommendations that address opportunities to optimize the performance of the City of Bishop’s wastewater treatment facility for nitrogen removal. The potential for greater nitrogen removal from the system is good. Thank you for your cooperation before, during and after this evaluation. Please do not hesitate to call (480) 274-8410 or e-mail [email protected] Sincerely, Steve Harris President H&S Environmental, LLC

Welcome message from author
This document is posted to help you gain knowledge. Please leave a comment to let me know what you think about it! Share it to your friends and learn new things together.
Transcript

• Performance Evaluations
• Troubleshooting & Optimization
• Hydraulics Optimization
• Training
2122 East Leland Circle Mesa, AZ 85213 1 (602) 810-7420
Date: April 21, 2014
Deston Dishion
City of Bishop
377 West Line Street, P. O. Box 1236
Bishop, California 93515
Re: 2014 City of Bishop Wastewater Lagoon Performance Evaluation for Nitrogen Control
Deston:
Enclosed is the April 21, 2014 report for H&S Environmental’s performance evaluation
of the of the City of Bishop’s wastewater lagoon treatment system
The purpose of this report is to identify the cause(s) of elevated ammonia and nitrate
concentrations from the effluent of the pond system and present solutions to eliminate nitrogen
discharge in an effort to reduce elevated nitrogen in the monitoring wells. For the purposes of
this report we will assume effluent ammonia can and will be converted to nitrate in the soil to
effect groundwater nitrate levels. This assumption will allow us to focus on treatment options
designed to eradicate nitrogen compounds within the pond system before discharge.
The site visit of March 26th
and 27th showed excellent housekeeping and only minimal
sludge accumulation in all four (4) ponds. Generally speaking the pond system is running well
with an average 2013 effluent BOD5 concentration of 37.7 mg/l and an average BOD5 removal
efficiency of 86.12%. Current 2014 test results show a BOD5 removal efficiency of 90.1%
Monitoring Wells # 2 and # 4 have shown at times to exceed groundwater monitoring
well nitrate permit limit concentrations of 10 mg/L.
Outlined in this report are a number of recommendations that address opportunities to
optimize the performance of the City of Bishop’s wastewater treatment facility for nitrogen
removal. The potential for greater nitrogen removal from the system is good.
Thank you for your cooperation before, during and after this evaluation. Please do not
hesitate to call (480) 274-8410 or e-mail [email protected]
Sincerely,
Steve Harris
President
H&S Environmental, LLC
Report Prepared By:Steve Harris, President, H&S Environmental, LLCMay 21, 2014
PERFORMANCE EVALUATION REPORT
Client: Deston Dishion
City of Bishop
377 West Line Street
P. O. Box 1236
Bishop, California 93515
Date of Inspection: March 26th
& 27th Data Review: Lab Data from 2001 to 2014
Field Sampling by H&S Environmental, LLC and City of Bishop Grab Samples Special Sampling and Analysis by BSK Labs
Sampling Performed by ESCSD
Inspection Participants:
H&S Environmental: Steve Harris, H&S Environmental, LLC, (480) 274-8410
The City of Bishop: Deston Deshon, Superintendent, 1 (559) 694-6164
Gary Milici
Jim Moffett
Eastern Sierra CSD: Dan Noland
Section 1
Bishop WWTP – Performance Evaluation
Page 2 of 20
Introduction and Background
1.0 Scope and Purpose
In January of 2014 H&S Environmental, LLC began discussions with Deston Deshon of the
City of Bishop about methods Deston could use to optimize the Bishop wastewater
stabilization pond system for nitrogen removal. After several discussions and a review of the
data, Steve Harris of H&S Environmental, LLC made a site visit to the Bishop WWTF.
The information used in this evaluation for nitrogen removal optimization includes the
following:
• Interviews with Deston on the general condition of the lagoon system
• Reviews of the Lab Results by BSK Labs, Sierra Analytical, and ESCSD
• A review of 2001 through 2014 influent and effluent and monitoring well sampling results
• An on-site inspection and testing of the lagoon system on March 26th
& 27th
, 2014
• Reviews of operations and sampling protocols, and Bishop’s own test results with Deston
• The analysis of specialized testing by BSK Labs
The purpose of this evaluation is to identify ways to improve the treatment process to meet
ground water monitoring nitrogen requirements. For the purposes of this performance
evaluation we will assume that all ammonia and organic nitrogen leaving the pond system will
eventually be converted to nitrate and find it way to the ground water monitoring wells.
The focus of this report then is to offer solutions for ammonia and nitrate remediation within
the pond system itself before plant discharge to pasture or percolation basins To determine if
in-pond remediation is possible we will analyze and evaluate lagoon system performance with
respect to (i) historical data reviewed, (ii) additional data gathered from special testing, (iii)
samples gathered from the on-site visit by H&S Environmental, LLC and (iv) a review of
sampling and testing protocols practiced by Bishop personnel.
To accomplish the general objective mentioned above, specific objectives were accomplished
by evaluating data as to whether nitrogen is removed by volatilization, assimilation, or
nitrification when the pond system does in fact remove ammonia and nitrates. Central to
answering these questions is also to determine whether accumulated sludge is feeding nitrogen
back into the system.
This report covers the performance of the Bishop, California system as it existed as of March
17, 2014.
Bishop WWTP-Performance Evaluation
Page 3 of 20
Section 2 – Findings
2.0 Findings
Based on the results of 14 years of wastewater data collected from January 2001 to April 2014, and
specialized on-site testing, the following conclusions can be made about the Bishop, California
wastewater lagoon system:
1. The overall health of the pond system is excellent with the latest effluent BOD5 results yielding 26
mg/l. This equates to a Cell # 3 BOD5 removal efficiency of 91%. Soluble Cell # 3 effluent BOD5
concentrations tested at 3 mg/l indicating that after 38 days of retention time most of the BOD is caused
by algae respiring in the BOD5 bottle during the five day duration of the BOD5 test. Thus in the final cells
of Bishop’s wastewater lagoon system, BOD concentrations are such that nitrification can occur.
2. Based on the average influent flow-rate of .700 MGD, the average theoretical detention times of
the aeration basin, the facultative cell, and the final polishing cell were respectively 15.8, 10.6, and 11.6
days. If we consider the added retention time of Cell # 4, the retention time increases by 11 days to a total
retention time of 49 days. Adequate retention time exists to remove ammonia and nitrate.
3. The organic strength of the raw wastewater is typical of residential wastewater. An average
influent biochemical oxygen demand (BOD5) of 270.6 mg/1 was reported over the fourteen (14) years,
since January 2001. The maximum influent BOD5 during this time was 416 mg/l and the minimum was
148 mg/l. With low soluble BOD in the final treatment cells and retention times between 15 and 20 days
in these final treatment cells, the pond system should be capable of supporting nitrifying bacteria. If
nitrification is not occurring we must look to other controlling factors.
4. At nine o’clock in the morning cell # 1 dissolved oxygen concentrations were 1.4 to 1.1 in the
aerated section of the pond. Further down this treatment cell to the Cell #2 transfer structure, dissolved
oxygen concentrations dropped to below 1 mg/l. At 11:00 in the morning dissolved oxygen
concentrations rose to over 16 mg/l in Cell # 4 indicating a tremendous untapped oxygen resource if
recirculation were used. This excess oxygen brought to the head of the plant could provide the oxygen
necessary to lower the BOD faster for an earlier start to ammonia removal.
5. From January 2001 to present (April, 2014) the trend in the raw influent BOD5 concentration is up
while the trend in effluent BOD5 discharge is down. BOD Removal Efficiency is at its highest since
2001…improved by 26%.
6. Ammonia, nitrate, and alkalinity data clearly show the pond has the ability to nitrify. The ability
of the pond system to nitrify is however limited in degree during optimal temperatures and is completely
absent during colder weather. The aerated lagoon system is ineffective in the removal or conversion of
ammonia nitrogen (NH3-N) to nitrate (NO3). In eight (8) samples taken over the course of 1 year, eight (8)
Pond # 4 samples show an average effluent ammonia concentration of 11.65 mg/l. Over the same time
period average Pond # 3 effluent ammonia concentrations averaged 12.74 mg/l. This shows us that
through most of the year nitrifying bacteria are not active for ammonia reduction.

Bishop WWTP-Performance Evaluation
Page 4 of 20
Section 2 – Findings - Continued
While tests show the presence of nitrifying bacteria (NBOD), they are not actively involved in the
ammonia removal process most of the time. For the purposes of the assumptions of this report, this leads
to elevated monitoring well nitrate levels.
7. Sludge has accumulated 1.32 inches in Cell # 4 since 2012 and has accumulated 3.0 inches in Cell
# 3 over the same period. Sludge can feed ammonia and nitrate back into the water column. In all four (4)
treatment cells a total of 8,869,814 gallons of sludge exists. This volume is spread out through four (4)
cells. This volume is equal to about 2,200 dry tons at an estimated Total Solids concentration of 6%.
8. Monitoring well nitrate concentrations are on the rise. As of the 4th
quarter of 2013 there were 14
Monitoring Well # 4 nitrate violations with 11 data points close to violation. Over the same time period
there were 4 nitrate permit violations in Monitoring Well # 2 with 8 samples close to the permit limit.
9. Solids from the effluent and settling ponds are primarily algae cells that affect the effluent BOD5
values. Soluble BOD5 values (the BOD5 test with the Algae removed) show effluent BOD5 to be around
3 mg/l. This is the true measure of the pond system’s ability to stabilize human waste. With retention
times over 40 days, all human waste entering the pond system has been stabilized. Remaining coliform
and organic load is from water fowl, decaying plant material, and algae. Cell # 3 BOD5 concentrations are
low enough to support nitrifying bacteria.
10. From eight (8) samples taken over the year 2012, effluent alkalinity for Bishop’s Cell # 3 averaged
201.4 mg/l. This is sufficient alkalinity for the nitrification process.
11. Measurements of temperature, pH, and dissolved oxygen (DO) were and are obtained as grab
samples in situ and therefore represent instantaneous values which depend on the time of day the analyses
were performed. Wide swings in dissolved oxygen concentrations can be measured throughout the day
and evening.
12. Based on data provided by the City of Bishop effluent pH ranges are normal and suitable for
nitrification.

Bishop WWTP-Performance Evaluation
Page 5 of 20
Section 3 – Recommendations
RECOMMENDATIONS
Based on the results of 14 years of data analyzed, site visits, and intra-pond BOD5 and nitrogen
testing, along with 2 complete sludge profiles, below are twelve (12) recommendations for
improved nitrogen removal from the existing wastewater stabilization pond system currently used
by the City of Bishop, California.
Secondary treatment standards are being consistently exceeded with respect to BOD5 removal.
Semi-annual or quarterly intra-pond BOD5, CBOD5, Dissolved Oxygen, and ammonia testing
should be continued. This data is needed to support the City of Bishop’s desire to have a thorough
understanding of the biochemical reactions and the timing of these processes, for opportunities to
optimize the system for better water quality. Twelve recommendations for better lagoon system
ammonia removal:
1. Controlled Discharge.
2. Nitrifying Trickling Filters.
3. Sand Filters.
4. Perc Basins Conversion
5. Moving Bed Reactors.
6. Moving Bed Reactors
7. Aerated Rock Filters.
8. Ringlace, other fixed film media.
9. Bacteria addition
10. Verimiculture bio filter
11. Recirculation
12. Sludge Removal
1. Controlled Discharge.
Lagoon systems in Iowa have discovered that if they can retain their treated water during cold winter time
conditions they can then discharge that mass during the spring, summer, and fall months when nitrification
and assimilation rates are greater. These systems simply bleed stored winter time effluent into the treatment
cells along with the full spring, summer, and fall flow being treated diretly. (Please see attached WEF, 2002
Paper on Newhall, IA) There is perhaps enough latent storage volume within the two treatment facilities to
accommodate wintertime storage. Storage volume would have to be approximately 50 to 60 million gallons.
2. Nitrifying Trickling Filters
While it is an older technology, trickling filters positioned at the end of the treatment cells provide
the attachment sites necessary to expose nitrifiers to effluent ammonia. The chief problem with
lagoons is that the biomass necessary to accommodate nitrifiers (floc) is absent in the final cells of
lagoon systems. With the exception of water passing over the sludge blanket or water passing
algae in the photic zone there is nothing to keep nitrifiers suspended long enough to come in
contact with ammonia to oxidize it. If nitrifiers are attached to a media and ammonia laden water is
poured over the attached nitrifiers then ammonia can be reduced. MBBR systems, aerated rock
filters, and

Bishop WWTP-Performance Evaluation
Page 6 of 20
Section 3 – Recommendations - Continued
sand filters operate under the same principal…provide an attachment site for nitrifying bacteria and
bring the ammonia to the nitrifiers. Please see paper entitled; Brentwood_BT_TF Lagoon
Treatment Study_2010
3. Sand Filters
Similar to nitrifying trickling filters are sand filters in providing attachment sites for nitrifying bacteria.
The challenge for nitrifying trickling filters and sand filters is that they treat cooled wastewater from the
final cells in a lagoon system. This water is typically very cold…too cold to support nitrification—
typically. As it says in the 2011 EPA lagoon manual Section # 7 on Upgrading Pond Effluents:
“Intermittent sand filtration is capable of polishing pond effluents at relatively low cost
and is similar to the practice of slow sand filtration in potable water treatment. As the
wastewater passes through the bed, TSS and other organic matter are removed through a
combination of physical straining and biological degradation processes. The particulate
matter collects in the top 5 - 8 cm (2 - 3 in) of the filter bed. This accumulation eventually
clogs the surface and prevents effective infiltration of additional effluent. At that time,
the bed is taken out of service, the top layer of clogged sand removed, and the unit is put
back into service. The removed sand can be washed and reused or discarded.”
Ponds using trickling filters in Massachusetts report getting effluent ammonia levels to between 1.5
and 2.7 mg/l through a sand filter. Many others report ammonia reduction as well (Please see the
EPA’s Chapter 7 on Pond Upgrades in the Appendix particularly Table 7-3 and Table 7-4 & 7-5)
4. Percolation Basin Conversion
If a sand filter can be operated to discharge ammonia concentrations of less than 1 mg/l, and
less,…could a perc basin be repacked with washed sand and pea gravel to be converted to a large
flooded sand filter basin with nitrification capabilities? Could a small section of percolation basin
be devoted to a demonstration site with cleaned washed sand and pea gravel added, and fitted with
an underdrain (for sampling harvesting) to see if a basin can support effluent nitrification? If the
percolation basins are already a part of the treatment process could effluent then be judged on the
effluent that is arriving at the underdrain? This strategy is a low cost alternative to building and
maintaining an activated sludge system just to meet a nitrate groundwater permit.
5. In-Pond Floating Moving Bed Reactor
Because lagoons lack the biomass volume necessary and properly positioned to nitrify, attachment
media can be suspended in the water column to provide housing for the biomass necessary for
ammonia conversion to nitrate. To this end Bradley Innovations with the help of Perdue University
has created and optimized a floating MBBR system. This system accelerates ammonia removal
using an aerated media coated with nitrifying bacteria that floats within the lagoon system to
remove ammonia. The floating MBBR has reduced a winter time effluent ammonia level from 30
mg/l to single digit ammonia concentration ranging from 1 to 6 mg/l. Please see the Appendix
under Bradley Innovations for more information on the performance of their floating moving bed
reactor.

Bishop WWTP-Performance Evaluation
Page 7 of 20
Section 3 – Recommendations - Continued
6. Standard Moving Bed Biofilm Reactor
AquaCELL is an example of a proven, state of the art fixed‐film moving bed biofilm reactor (MBBR).
Thousands of submerged polyethylene (HDPE) biofilm carriers are in constant motion spinning and
moving within an aerated or mechanically mixed basin. These biofilm carriers support nitrifier growth for
greater ammonia removal. These reactors can be used as tertiary treatment units at the end of a lagoon
system. They are similar in cost to an activated sludge system except they produce less sludge. They
claim ammonia removal down to 1 mg/l. Please see Appendix for more information on the AquaCELL
product.
7. Aerated Rock Filters
Rock filters have been used in the Midwest for years to polish wastewater lagoon effluent. The aerated
portion is new. Vertical-flow aerated rock filters have shown to consistently produce effluents with lower
ammonium-N concentrations (<0.3 mg N/L). Bruce Smith with, C.B. Smith Company, Inc.
9238 Gravois Road, St. Louis, Missouri 63123 designs and builds these aerated rock filters. Please see
rock filter documents in Appendix.
8. Ringlace or other fixed film media
This is fixed film media “hung” from the surface of the water column down to the bottom of the
treatment cell. In the upper aerobic zone of the treatment cell water column, aeration and ammonia
concentrations are sufficient enough to support nitrifying bacteria. These suspended media are
placed at a location in the lagoon where BOD5 is below 20 to 30 mg/l and there is enough
dissolved oxygen present. Typically the media are shaded to protect the media growth from the
damaging UVB rays of the sun. On the www.lagoononline.com website, see: NITRIFICATION
OF A LAGOON EFFLUENT USING FIXED FILM MEDIA: PILOT STUDY RESULTS By WES
RIPPLE. In this report a fixed film material suspended in the water column with water temperatures
averaging 2-3oC, and showed reduced effluent ammonia down to 0.1, 0.1, and 0.28 mg/…In New
Hampshire during the winter! These systems can be built in-house for relatively little money
aerating the fixed film using blowers and diffusers for a cost effective way to increase the
performance of fixed film system.
9. Bacteria addition
The BioLynceus Company can produce large quantities of nitrifying bacteria that can be added
directly to the pond system to remove ammonia. These bacteria added are still subject to a lack of
attachment sites, low dissolved oxygen concentrations, and cold weather. Nitrifiers would best be
added to Cell # 3 where nitrification is most likely to occur. BioLynceus can also produce
denitrifying bacteria that are able to remove nitrates in contaminated groundwater wells. For the
cost, this may be an alternative worth testing at least.
Bishop WWTP-Performance Evaluation
Page 8 of 20
Section 3 – Recommendations - Continued
10. Verimiculture / Bio Filter
A trial is currently being conducted in Firebaugh, CA at the time of this writing that shows promise
for ammonia removal. This bio filter is five (5) feet deep with gravel and sand under matrix
covered by several feet of sawdust, worms, bacteria, protozoa, nematodes, and fungi. This system
is kept aerobic not mechanically but by millions of worms moving throughout the filter bed
creating aeration holes as they feeding on organic matter and bacteria. The average effluent
ammonia concentration using this green technology through the winter is 1.36 mg/l with ammonia
levels as low as .34 mg/l during the coldest months. Please see Appendix for more information on
this green technology.
11. Recirculation
In and of itself recirculation is not the answer to ammonia and nitrate removal. This is because the
pond currently nitrifies only occasionally. Recirculation is the treatment strategy of returning a
portion of the effluent flow back to the head of the plant to lift the oxygen concentrations of the
primary cell or other cell that is oxygen deficient. At times during the day effluent dissolved
oxygen concentrations can reach 35 mg/l.
When the pond is nitrifying nitrates (NO3) are produced which become an oxygen source itself.
When a system is nitrifying, recirculation returns oxygen in two (2) forms; dissolved oxygen
(D.O.) and Nitrate, NO3. Giving a portion of the effluent a second pass is one way to remove
nitrate from the system when it is present. NO3 is readily consumable by heterotrophic bacteria
(BOD removing bacteria). In fact adding Calcium Nitrate is a solution for odor control in
collection systems and lagoons.
On one of the site visits 16.6 mg/l of dissolved oxygen was measured in treatment cell # 4 at 11:00
in the morning. Measurements in the 30s have been recorded from this cell. These high D.O.s are
a valuable resource. Most aeration equipment cannot come close to generating 35 mg/l of
dissolved oxygen; 9 mg/l would be about the max for even diffused air systems. Based on direct
D.O. measurement made within each treatment cell, effluent with elevated dissolved oxygen
concentrations brought back to the primary treatment cell would allow cell number 1 to more
quickly consume the influent BOD load so the cells in the latter part of the system can get busy
preventing nitrogen from reaching the monitoring wells. Recirculation can also be used to transfer
oxygen to areas requiring more dissolved oxygen, like areas where nitrification is likely to occur
and D.O. resources are determined to be limited.
Recirculation is a common practice in wastewater lagoons and is successfully used throughout the
country to improve water quality in wastewater treatment lagoons. Lagoon operators have few
tools to work with and this is one of the best.
Sludge removal.
Years ago the City of Bishop oxidized a large portion of their pond system’s sludge blankets by
using a probiotic oxidizing agent. It is our recommendation to continue this practice again even if
just for a short period. Solids have accumulated to the point where consideration should be given
to remove sludge to prevent nitrogen feedback from the sludge. Sludge oxidation technology has

Bishop WWTP-Performance Evaluation
Page 9 of 20
Section 3 – Recommendations - Continued
advanced to the point where sludge blankets can now be spot treated in areas where sludge has
accumulated. Sludge removal can now be directed to areas like corners and edges where the bulk
of flow bypasses most of the time. Focus can now be placed on corners and edges without wasting
a liquid product as liquids may short circuit through the liquid system. Please see Appendix for
documentation and case study.

46
57
52
22
27
49
43
41
55
52
58
66
69
62
47
51
3940
44
57
65
34
47
44
30
49
21
40
67
47
38
41
15
2928
3738
26
0
10
20
30
40
50
60
70
80
1/5
/20
11
2/5
/20
11
3/5
/20
11
4/5
/20
11
5/5
/20
11
6/5
/20
11
7/5
/20
11
8/5
/20
11
9/5
/20
11
10
/5/2
01
1
11
/5/2
01
1
12
/5/2
01
1
1/5
/20
12
2/5
/20
12
3/5
/20
12
4/5
/20
12
5/5
/20
12
6/5
/20
12
7/5
/20
12
8/5
/20
12
9/5
/20
12
10
/5/2
01
2
11
/5/2
01
2
12
/5/2
01
2
1/5
/20
13
2/5
/20
13
3/5
/20
13
4/5
/20
13
5/5
/20
13
6/5
/20
13
7/5
/20
13
8/5
/20
13
9/5
/20
13
10
/5/2
01
3
11
/5/2
01
3
12
/5/2
01
3
1/5
/20
14
2/5
/20
14
3/5
/20
14
The City of Bishop California's Cell # 3 Effluent BOD
as of 4/3/2014
Cell # 3 Effluent BOD
Linear (Cell # 3 Effluent BOD)
Bishop WWTP Performance Evaluation
Page 10 of 20
Section 4 – Data Analysis
Data Analysis
Optimum Conditions for Nitrification
Nitrification is the biological conversion of ammonia to nitrate and denitrification is the biological
conversion of nitrate to nitrogen gas for true nitrogen removal. Ammonia can also be removed through
volatilization and assimilation both involving natural processes. For this report and evaluation we will
focus on nitrification for ammonia removal even though a substantial amount of ammonia can be removed
through assimilation by algae and volatilization.
For nitrification to occur the following conditions must be present:
• Dissolved Oxygen Concentration > 2.0 mg/l
• Optimum Temperature 30oC
• pH Range 7.5 – 9.0 Inhibition above 8.5 (Scott P.H. et all 1994)
• The Absence of Sulfide, Heavy Metals and Other Toxicity
• Long Retention Times (Middlebrooks, 1999)
• Good Mixing (self-limiting in their own waste products)
• Sufficient Alkalinity > 250 mg/l as HCO3-
• Nitrifying Bacteria must be Present
• A Surface for Nitrifying Bacteria to Attach Themselves (For example: floc particles, fixed film, or other media)
• Low Organic Loading BOD5 < 30 mg/l (Scott et al, 1994)
• ORP +50 to +300 (Gronoszy, et al, 1971)
(Adapted from USEPA, 1993 except as otherwise referenced)
BOD5 Removal for Nitrification
For ammonia removal to occur BOD5 concentrations must be below 20 mg/l. The City of Bishop’s pond
system does an excellent job at removing BOD from the influent load.
In one of the more recent specialized
tests run on the City of Bishop’s
effluent, Soluble BOD5 was as low as 3
mg/l!
Ammonia removal through nitrification
will begin at that point where the BOD5
has dropped to below 20 to 30 mg/l.
Presumably this is in Cell # 2 or # 3 or
both.
If enough BOD is removed in the
Primary Cell the remaining treatment
cells can be used to remove nutrients.
Chart 1. A Four Year Look at Effluent BOD from the City of Bishop’s Cell # 3

Bishop WWTP Performance Evaluation
Page 11 of 20
Section 4 – Data Analysis – Cont -
Evidence of Nitrification for Ammonia Removal
Reduced alkalinity and ammonia with elevated nitrates indicates the possibility of nitrification.
Chart # 4 above indicates the presence of nitrifying bacteria in the effluent. The NBOD (BOD5 – CBOD5) is 38.3 mg/l. This
means that 38.3 mg/l of BOD5 is being caused by nitrifying bacteria converting ammonia to nitrate in the BOD5 test bottle.
The NBOD is the relative number of nitrifying bacteria in the sample. So the pond system at Bishop does nitrify but does it
incompletely and sporadically. An NBOD of 38.3 tells us more oxygen is needed burn up the ammonia IN the lagoon.
Keeping ammonia out of the BOD5 test bottle by removing it within the lagoon is a solid strategy for nitrogen control.
Chart 2. Reduced Alkalinity and Ammonia with Elevated
Nitrate Indicates Nitrification Chart 3 Elevated Ammonia and Alkalinity with No Nitrate Present
indicates the Absence of Nitrification
Chart 4 CBOD A Sign of Nitrification

Bishop WWTP Performance Evaluation Page 12 of 20
Section 4 – Data Analysis – Cont -
As nitrification occurs, ammonia is converted to nitrate as seen in the charts below. Even though nitrification is taking place,
the City of Bishop’s wastewater treatment system is not removing nitrogen compounds sufficient enough to prevent possible
ground water contamination. The goal is to eliminate ammonia and nitrate from leaving with the pond system effluent.
Bishop WWTP Performance Evaluation
0
1
2
3
4
5
6
7
0
5
10
15
20
25
30
Nit
rate
(m
g/l
)
Am
mo
nia
(m
g/l
)
Evidence of Nitrification from Sampling Performed on Cell # 4
through the Year 2012
Ammonia
Nitrate-N
0
0.5
1
1.5
2
2.5
3
3.5
4
4.5
0
5
10
15
20
25
30
35
Nit
rate
(m
g/l
)
Am
mo
nia
(m
g/l
)
Evidence of Nitrification in the City of Bishop's Pond # 3
for the Sampling Year 2012
Ammonia
TKN
Nitrate-N
Figure 5 Nitrates Up, Ammonia Down. Residual Ammonia and Nitrate Left Over
indicating Partial Nitrification
Chart 6 Partial Nitrification. In complete nitrification all the ammonia and nitrate would be gone
Page 13 of 20
Section 4 – Data Analysis – Cont -
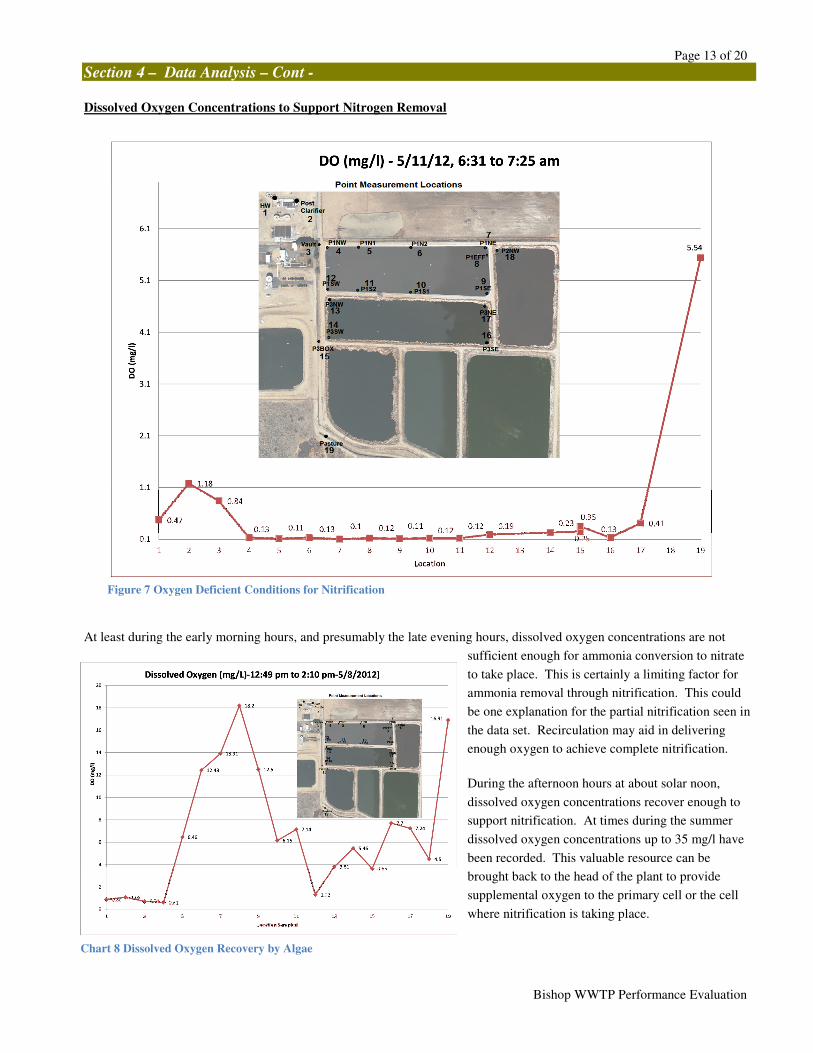
Dissolved Oxygen Concentrations to Support Nitrogen Removal
At least during the early morning hours, and presumably the late evening hours, dissolved oxygen concentrations are not
sufficient enough for ammonia conversion to nitrate
to take place. This is certainly a limiting factor for
ammonia removal through nitrification. This could
be one explanation for the partial nitrification seen in
the data set. Recirculation may aid in delivering
enough oxygen to achieve complete nitrification.
During the afternoon hours at about solar noon,
dissolved oxygen concentrations recover enough to
support nitrification. At times during the summer
dissolved oxygen concentrations up to 35 mg/l have
been recorded. This valuable resource can be
brought back to the head of the plant to provide
supplemental oxygen to the primary cell or the cell
where nitrification is taking place.
Bishop WWTP Performance Evaluation
Figure 7 Oxygen Deficient Conditions for Nitrification
Chart 8 Dissolved Oxygen Recovery by Algae
Page 14 of 20
Section 4 – Data Analysis – Cont -
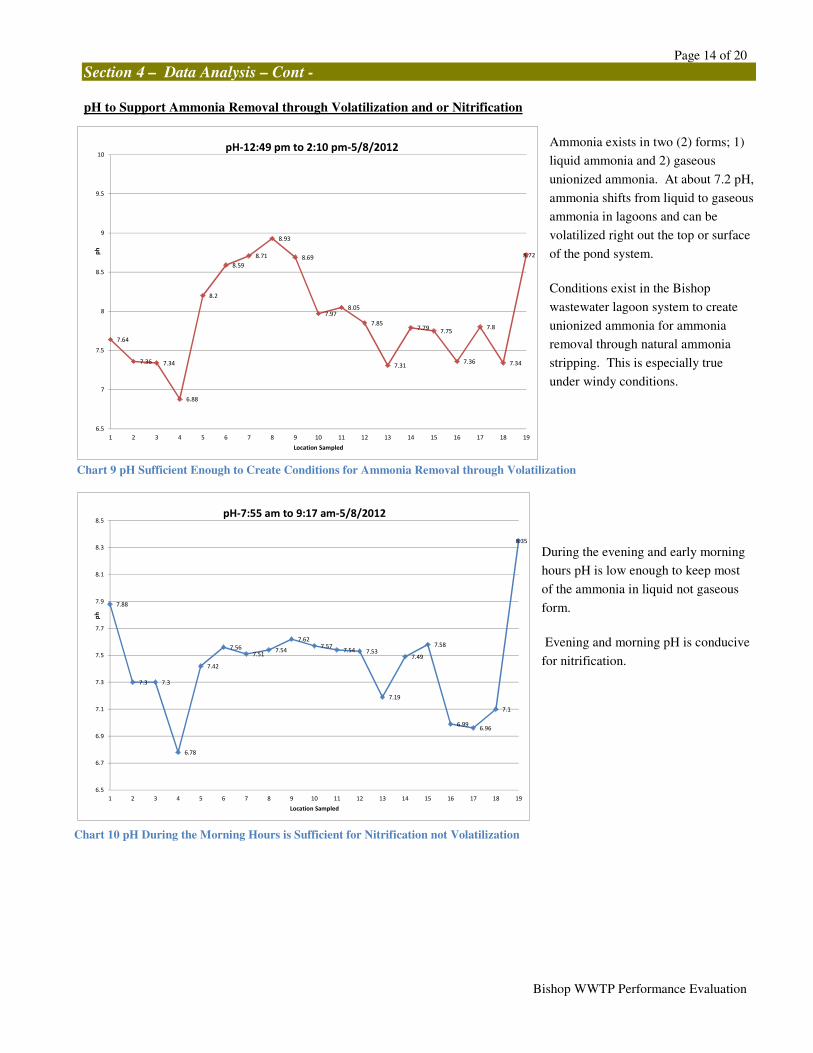
pH to Support Ammonia Removal through Volatilization and or Nitrification
Ammonia exists in two (2) forms; 1)
liquid ammonia and 2) gaseous
unionized ammonia. At about 7.2 pH,
ammonia shifts from liquid to gaseous
ammonia in lagoons and can be
volatilized right out the top or surface
of the pond system.
Conditions exist in the Bishop
wastewater lagoon system to create
unionized ammonia for ammonia
removal through natural ammonia
stripping. This is especially true
under windy conditions.
During the evening and early morning
hours pH is low enough to keep most
of the ammonia in liquid not gaseous
form.
Evening and morning pH is conducive
for nitrification.
Bishop WWTP Performance Evaluation
7.64
7.36 7.34
6.88
8.2
8.59
8.71
8.93
8.69
7.978.05
7.85
7.31
7.797.75
7.36
7.8
7.34
8.72
6.5
7
7.5
8
8.5
9
9.5
10
1 2 3 4 5 6 7 8 9 10 11 12 13 14 15 16 17 18 19
ph
Location Sampled
pH-12:49 pm to 2:10 pm-5/8/2012
7.88
7.3 7.3
6.78
7.42
7.567.51
7.54
7.627.57
7.54 7.53
7.19
7.49
7.58
6.996.96
7.1
8.35
6.5
6.7
6.9
7.1
7.3
7.5
7.7
7.9
8.1
8.3
8.5
1 2 3 4 5 6 7 8 9 10 11 12 13 14 15 16 17 18 19
ph
Location Sampled
pH-7:55 am to 9:17 am-5/8/2012
Chart 9 pH Sufficient Enough to Create Conditions for Ammonia Removal through Volatilization
Chart 10 pH During the Morning Hours is Sufficient for Nitrification not Volatilization
Page 15 of 20
Section 4 – Data Analysis – Cont -
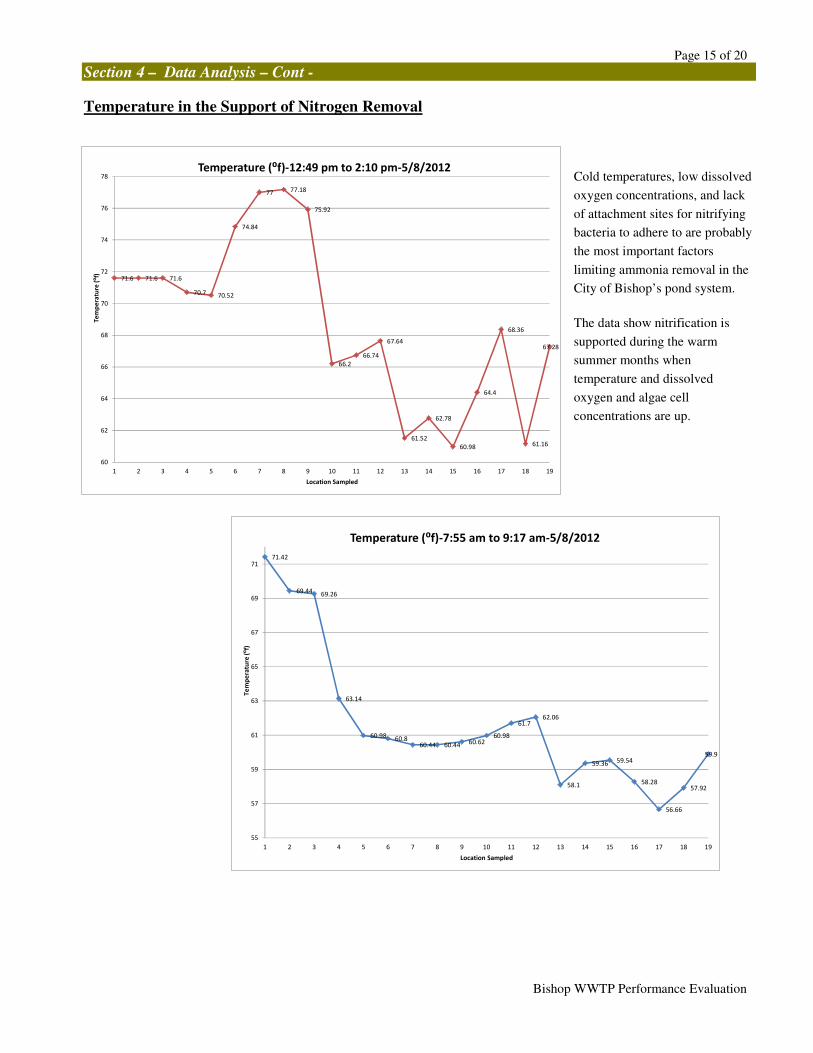
Temperature in the Support of Nitrogen Removal
Cold temperatures, low dissolved
oxygen concentrations, and lack
of attachment sites for nitrifying
bacteria to adhere to are probably
the most important factors
limiting ammonia removal in the
City of Bishop’s pond system.
The data show nitrification is
supported during the warm
summer months when
temperature and dissolved
oxygen and algae cell
concentrations are up.
Bishop WWTP Performance Evaluation
71.6 71.6 71.6
70.7 70.52
74.84
77 77.18
75.92
66.2
66.74
67.64
61.52
62.78
60.98
64.4
68.36
61.16
67.28
60
62
64
66
68
70
72
74
76
78
1 2 3 4 5 6 7 8 9 10 11 12 13 14 15 16 17 18 19
Te
mp
era
ture
(⁰f
)
Location Sampled
Temperature (⁰f)-12:49 pm to 2:10 pm-5/8/2012
71.42
69.4469.26
63.14
60.98 60.860.44 60.44 60.62
60.98
61.762.06
58.1
59.36 59.54
58.28
56.66
57.92
59.9
55
57
59
61
63
65
67
69
71
1 2 3 4 5 6 7 8 9 10 11 12 13 14 15 16 17 18 19
Te
mp
era
ture
(⁰f
)
Location Sampled
Temperature (⁰f)-7:55 am to 9:17 am-5/8/2012
Page 16 of 20
Section 4 – Data Analysis – Cont -
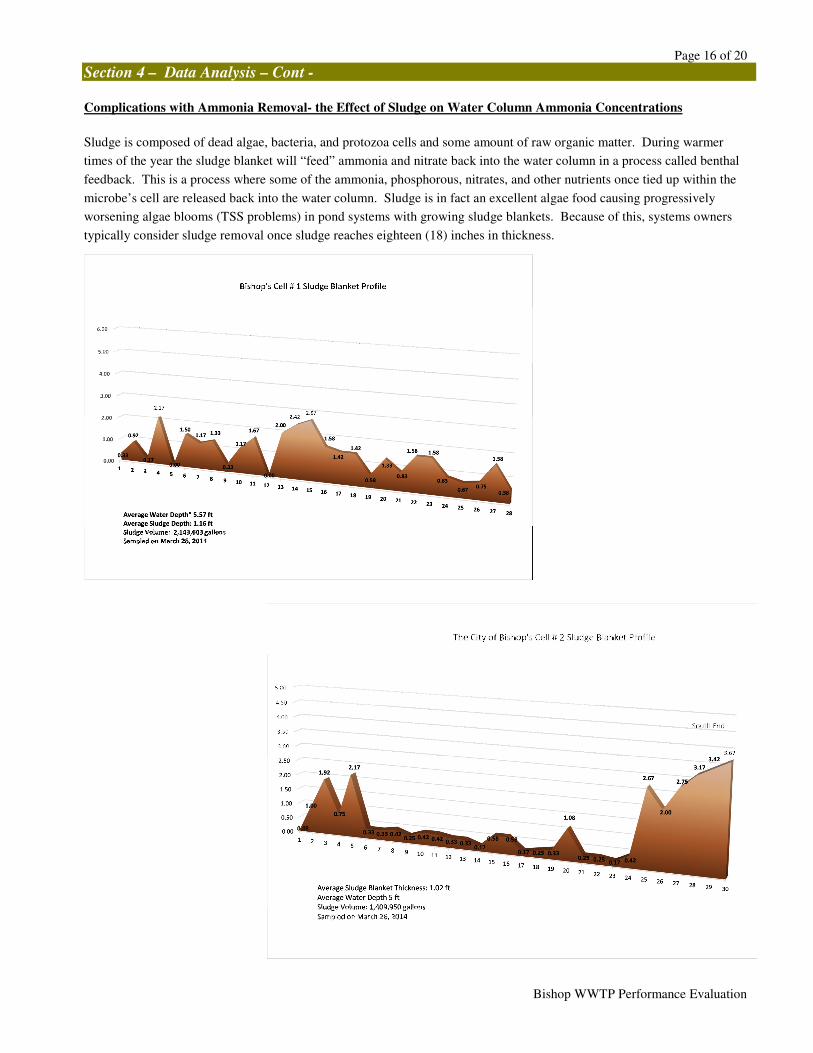
Complications with Ammonia Removal- the Effect of Sludge on Water Column Ammonia Concentrations
Sludge is composed of dead algae, bacteria, and protozoa cells and some amount of raw organic matter. During warmer
times of the year the sludge blanket will “feed” ammonia and nitrate back into the water column in a process called benthal
feedback. This is a process where some of the ammonia, phosphorous, nitrates, and other nutrients once tied up within the
microbe’s cell are released back into the water column. Sludge is in fact an excellent algae food causing progressively
worsening algae blooms (TSS problems) in pond systems with growing sludge blankets. Because of this, systems owners
typically consider sludge removal once sludge reaches eighteen (18) inches in thickness.
Bishop WWTP Performance Evaluation
Page 17 of 20
Section 4 – Data Analysis – Cont -
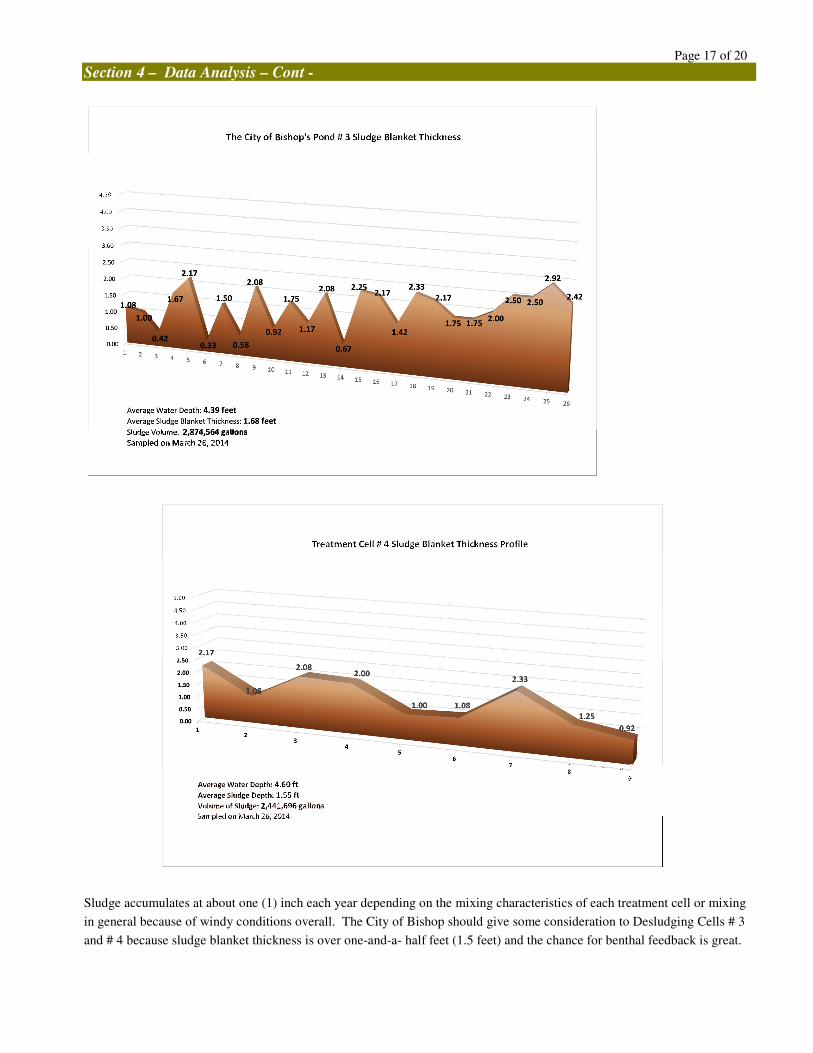
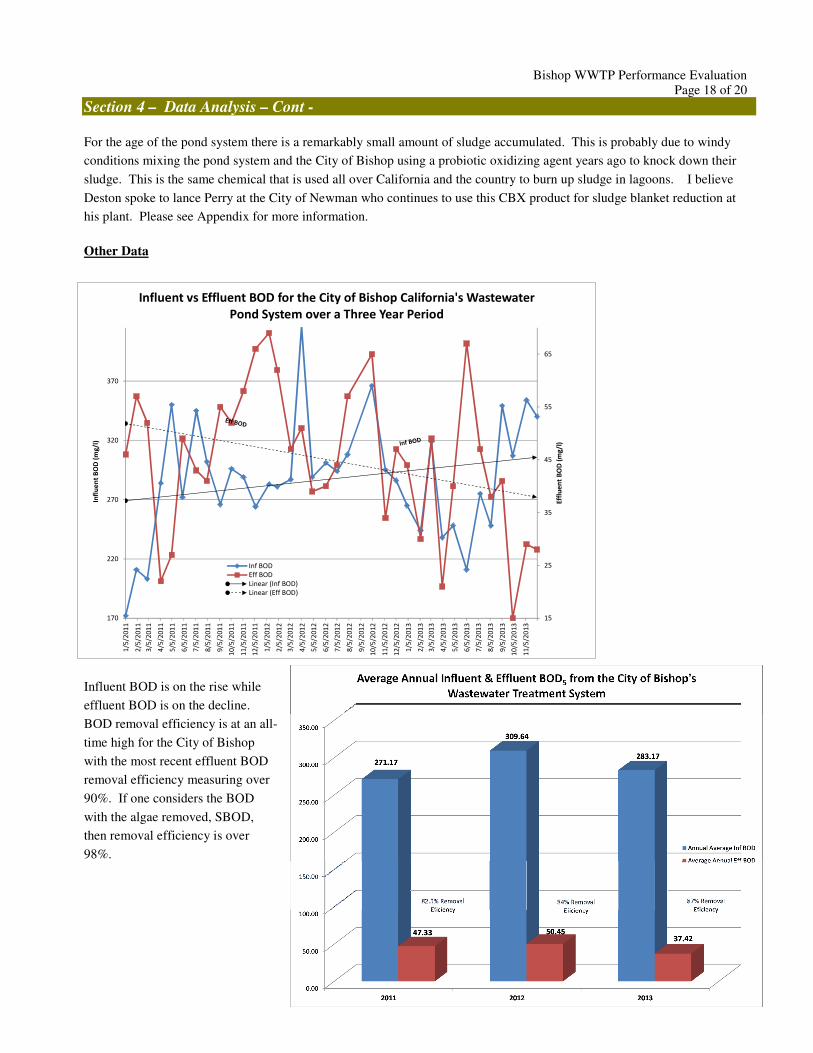
Sludge accumulates at about one (1) inch each year depending on the mixing characteristics of each treatment cell or mixing
in general because of windy conditions overall. The City of Bishop should give some consideration to Desludging Cells # 3
and # 4 because sludge blanket thickness is over one-and-a- half feet (1.5 feet) and the chance for benthal feedback is great.
Bishop WWTP Performance Evaluation Page 18 of 20
Section 4 – Data Analysis – Cont -
For the age of the pond system there is a remarkably small amount of sludge accumulated. This is probably due to windy
conditions mixing the pond system and the City of Bishop using a probiotic oxidizing agent years ago to knock down their
sludge. This is the same chemical that is used all over California and the country to burn up sludge in lagoons. I believe
Deston spoke to lance Perry at the City of Newman who continues to use this CBX product for sludge blanket reduction at
his plant. Please see Appendix for more information.
Other Data
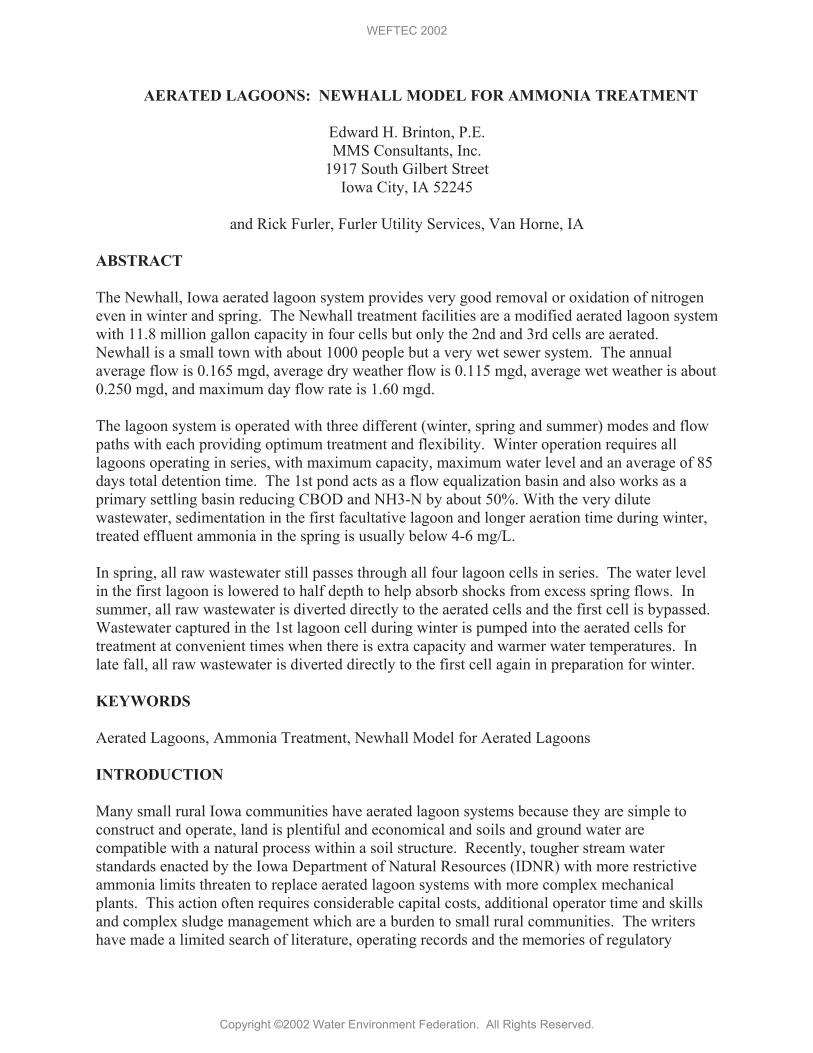
Influent BOD is on the rise while
effluent BOD is on the decline.
BOD removal efficiency is at an all-
time high for the City of Bishop
with the most recent effluent BOD
removal efficiency measuring over
90%. If one considers the BOD
with the algae removed, SBOD,
then removal efficiency is over
98%.
15
25
35
45
55
65
170
220
270
320
370
1/5
/20
11
2/5
/20
11
3/5
/20
11
4/5
/20
11
5/5
/20
11
6/5
/20
11
7/5
/20
11
8/5
/20
11
9/5
/20
11
10
/5/2
01
1
11
/5/2
01
1
12
/5/2
01
1
1/5
/20
12
2/5
/20
12
3/5
/20
12
4/5
/20
12
5/5
/20
12
6/5
/20
12
7/5
/20
12
8/5
/20
12
9/5
/20
12
10
/5/2
01
2
11
/5/2
01
2
12
/5/2
01
2
1/5
/20
13
2/5
/20
13
3/5
/20
13
4/5
/20
13
5/5
/20
13
6/5
/20
13
7/5
/20
13
8/5
/20
13
9/5
/20
13
10
/5/2
01
3
11
/5/2
01
3
Eff
lue
nt
BO
D (
mg
/l)
Infl
ue
nt
BO
D (
mg
/l)
Influent vs Effluent BOD for the City of Bishop California's Wastewater
Pond System over a Three Year Period
Inf BOD
Eff BOD
Linear (Inf BOD)
Linear (Eff BOD)

0.9
3.1
10.4
6.8
3.2
0.4
3.12.9
1.7
2.5
4.7
3.8
3.1
4
3
2.6
0.3
3.7
1.9
0.6
4
6.9
4.7
4.2
3.5
6.8
2.62.3
10.4
5.8
1.6
0.20.2
6.2
2.2
0.7
1.1
6
2.4
5.1
2
3.6
5.4
3.6
5.4
1.7
16.7
5.2
2.4
9.7
3.1
8.9
3.9
5.2
8.2
9.2
0.9
8.1
6.7
7.3
9.2
4.3
9.7
6.2
5
8.8
7.8
5.2
4.4
3.1
12.1
5.2
4.7
3.3
1.3
3.5
8.6
2.3
3
0.6
2.22.11.9 2
2.3
2.82.6
3 3
2
7.5
9.2
2.1
6.26.16.4
6.1
4.6
14.4
6.46.66.6
16.6
10.3
5.3
3.9
6.8
4.9
10.1
9
12.512.6
7.47.5
15.5
8.9
11.4
8.9
11.4
5.3
4.5
10.8
8.4
9.99.9
9.2
9.7
7.9
9.9
99.3
6.1
10.8
9.8
6.4
4.8
9.89.6
9.8 9.8
6.8
9.7
7.3
13.4
16.1
13.3
5
0
2
4
6
8
10
12
14
16
18
Q1
19
95
Q3
19
95
Q1
19
96
Q3
19
96
Q1
19
97
Q3
19
97
Q2
19
98
Q4
19
98
Q2
19
99
Q4
19
99
Q2
20
00
Q4
20
00
Q2
20
01
Q4
20
01
Q2
20
02
Q4
20
02
Q2
20
03
Q4
20
03
Q2
20
04
Q4
20
04
Q2
20
05
Q4
20
05
Q4
20
05
Q2
20
06
Q4
20
06
Q2
20
07
Q4
20
07
Q2
20
08
Q4
20
08
Q2
20
09
Q4
20
09
Q2
20
10
Q4
20
10
Q2
20
11
Q4
20
11
Q2
20
12
Q4
20
12
Eighteen Years of Nitrate Concentrations in the City of Bishop's
Monitoring Wells # 2 & # 4
MW-2
MW-4
Linear (MW-2)
Linear (MW-4)
18 MW Nitrate Violations Since 1995
14 More Data Points at
or Near Violation
Bishop WWTP Performance Evaluation Page 19 of 20
Section 5 – Summary
In Summary monitoring well nitrate concentrations are on the rise.
If we assume that all the ammonia and
nitrate leaving the pond system has the
potential to contaminate the groundwater,
then the solution to monitoring wells free of
nitrate is to discharge as little ammonia and
nitrate as possible from the pond system.
As seen from the data above, the system
does have the potential to remove ammonia
through nitrification and volatilization.
Currently the pond system does this only
partially.
Solutions exist to make up for the
deficiencies of Bishop’s pond system to
completely nitrify year round. These
solutions are found in the recommendations
above and in the appendix following this report.
Section 5 – Conclusions
CONCLUSIONS
Cold temperatures, low dissolved oxygen concentrations, and a lack of attachment sites for nitrifying
bacteria are probably the most important factors limiting ammonia removal in the City of Bishop’s pond
system. With the exception of sludge removal, each of the twelve (12) recommendations offered above
addresses these deficiencies in one way or the other.
Controlled discharge addresses the temperature issues by holding the effluent until warmer weather
allows for ammonia removal. Nitrifying trickling filters, sand filters, percolation basin modification,
MBBR systems, floating MBBR systems, Rock filters and bio filters all provide the attachment sites
necessary for the microbes who consume ammonia and nitrates.
Some of these solutions cost more or less but the two technologies with the most promise appear to be
the bio filter and aerated rock filter. The bio filter provides self-heating with an incredibly diverse
microbial community structure to remove pollutants of all types including ammonia, TSS and BOD as
well as TDS. It is important to note that all of these technologies will aid in further BOD, TSS, and
TDS removal.
One of the most cost effective means of removing ammonia for the City of Bishop may be the
conversion of an existing percolation basin to a flooded sand filter basin for ammonia control. This
would entail repacking a basin with gravel and then washed sand with underdrains added as sampling
ports. Judgment of final effluent quality would be made from samples harvested at the sample ports of
these underdrains with the percolation basins becoming part of the treatment system.

Bishop WWTP Performance Evaluation Page 20 of 20
Section 5 – Conclusions-Cont.
No one treatment cell has an overabundance of sludge. With the combined mass in all four (4) ponds being over 2,200 dry tons or 8,800,000 gallons, this much sludge is sure to have an effect on ammonia and nitrate concentrations due to the releasing of nitrogen compounds. Some efforts at sludge removal must be taken.
INTRA-POND diagnostic testing should continue to be performed at least twice each year. This practice will help
operators isolate where and why problems are occurring. Consider learning to perform the COD test yourself so
you can do intra pond “BOD” analysis on your own schedule and frequency. Once you purchase the equipment
the test is fairly cost effective to run especially when you consider the information a test like this will reveal. The
COD test is simple to run and you have COD/BOD correlation data since 2001. Companies like HACH have
taken all the guess work and potential for error out of the COD test.
There is a where, a when, and a why to lagoon problem solving. Determining where treatment is or is not
occurring is critically important to optimizing lagoon systems and getting plants into compliance. Please see
Diagnostic BODs in the Appendix and make a commitment to performing these kinds of tests.
Thank you for the opportunity to serve the good people of the City of Bishop
Steve Harris
President
H&S Environmental, LLC
AERATED LAGOONS: NEWHALL MODEL FOR AMMONIA TREATMENT
Edward H. Brinton, P.E.
MMS Consultants, Inc. 1917 South Gilbert Street
Iowa City, IA 52245
and Rick Furler, Furler Utility Services, Van Horne, IA
ABSTRACT
The Newhall, Iowa aerated lagoon system provides very good removal or oxidation of nitrogen even in winter and spring. The Newhall treatment facilities are a modified aerated lagoon system with 11.8 million gallon capacity in four cells but only the 2nd and 3rd cells are aerated. Newhall is a small town with about 1000 people but a very wet sewer system. The annual average flow is 0.165 mgd, average dry weather flow is 0.115 mgd, average wet weather is about 0.250 mgd, and maximum day flow rate is 1.60 mgd. The lagoon system is operated with three different (winter, spring and summer) modes and flow paths with each providing optimum treatment and flexibility. Winter operation requires all lagoons operating in series, with maximum capacity, maximum water level and an average of 85 days total detention time. The 1st pond acts as a flow equalization basin and also works as a primary settling basin reducing CBOD and NH3-N by about 50%. With the very dilute wastewater, sedimentation in the first facultative lagoon and longer aeration time during winter, treated effluent ammonia in the spring is usually below 4-6 mg/L. In spring, all raw wastewater still passes through all four lagoon cells in series. The water level in the first lagoon is lowered to half depth to help absorb shocks from excess spring flows. In summer, all raw wastewater is diverted directly to the aerated cells and the first cell is bypassed. Wastewater captured in the 1st lagoon cell during winter is pumped into the aerated cells for treatment at convenient times when there is extra capacity and warmer water temperatures. In late fall, all raw wastewater is diverted directly to the first cell again in preparation for winter. KEYWORDS
Aerated Lagoons, Ammonia Treatment, Newhall Model for Aerated Lagoons
INTRODUCTION
Many small rural Iowa communities have aerated lagoon systems because they are simple to construct and operate, land is plentiful and economical and soils and ground water are compatible with a natural process within a soil structure. Recently, tougher stream water standards enacted by the Iowa Department of Natural Resources (IDNR) with more restrictive ammonia limits threaten to replace aerated lagoon systems with more complex mechanical plants. This action often requires considerable capital costs, additional operator time and skills and complex sludge management which are a burden to small rural communities. The writers have made a limited search of literature, operating records and the memories of regulatory
WEFTEC 2002
Copyright ©2002 Water Environment Federation. All Rights Reserved.
officials to locate non-conventional and successfully operating aerated lagoon systems which are capable of meeting the tougher winter and spring ammonia limits. The Newhall, Iowa system is a unique multi-cell aerated lagoon system with varying seasonal configurations and which has successfully treated nitrogen and met the tougher ammonia limits even in winter and spring. Newhall is a small rural village located in eastern Iowa, 20 minutes from Cedar Rapids. Newhall contains a small meat locker, a small parochial school and the usual country village activity with no unusual pollutant loading. There were 886 people in the 2000 census with about 1000 population equivalents and 370 metered accounts. Rick Furler is a licensed wastewater operator who operates Furler Utility Services, a certified laboratory in nearby Van Horne. Furler is the contract operator for Newhall and a dozen other small community wastewater systems including several aerated lagoons, facultative lagoons and activated sludge treatment systems. Furler is the individual who observed the lagoon behavior, developed the new ideas for Newhall and convinced the community leaders, consulting engineers and IDNR staff to allow the creation of the Newhall system. NEWHALL LAGOONS – PRIOR TO 1997
A two cell, facultative lagoon system was originally constructed in late 1950's probably with a design for 120 days retention time and about 1 acre surface area per 100 people. Both cells were nearly identical with a total of 5.5 acres, 10.8 million gallon (MG) capacity and 6 foot water depth as shown in Figure 1. The ponds were modified in 1992 by construction of earthen embankments to divide the west cell in half and raise the height to increase the water depth to 10 feet as shown in Figure 2. This provided a total capacity of the reconstructed aerated lagoon system of 6.4 MG and a detention time in the aerated cells of 25 days during wet weather but 55 days during dry weather. The accumulated sludge was removed from both facultative ponds during the reconstruction. A submerged diffused air (EDI Reef) system with buried ductile iron and plastic piping and compressed air blower were added to serve both the new aerated cells #2 and #3. A floating baffle was added to divide the 3rd and 4th quiescent cell to allow algae to settle. The east pond was abandoned. For the first 5 years, until 1997, only the 2 aerated cells and the quiescent cell were used and no wastewater was allowed into the abandoned cell. TYPICAL AERATED LAGOON DESIGN CRITERIA
A typical two pond, two cell aerated lagoon system with the 3rd quiescent cell is shown in Figure 3. Aeration and mixing would be provided by either a diffused air system on the floor or mechanical aerators floating on the surface. The water level would be between 6 to 15 feet and constant. Detention time would be highly variable since the size of the aerated system is fixed but the flow rate may vary considerably from wet to dry seasons.
WEFTEC 2002
Copyright ©2002 Water Environment Federation. All Rights Reserved.

Figure 1 Newhall 2-Cell Lagoon (1960-1992)
Figure 2 Newhall 3-Cell Lagoon (1992-1997)
1st Cell
Aerated
Old Cell #2
Abandoned
From City
Baffle
2nd Cell
Aerated
3rd Cell
Quiescent
Cell #1
5.4 MG
6 Ft. Depth
Cell #2
5.4 MG
6 Ft. Depth
From City
WEFTEC 2002
Copyright ©2002 Water Environment Federation. All Rights Reserved.
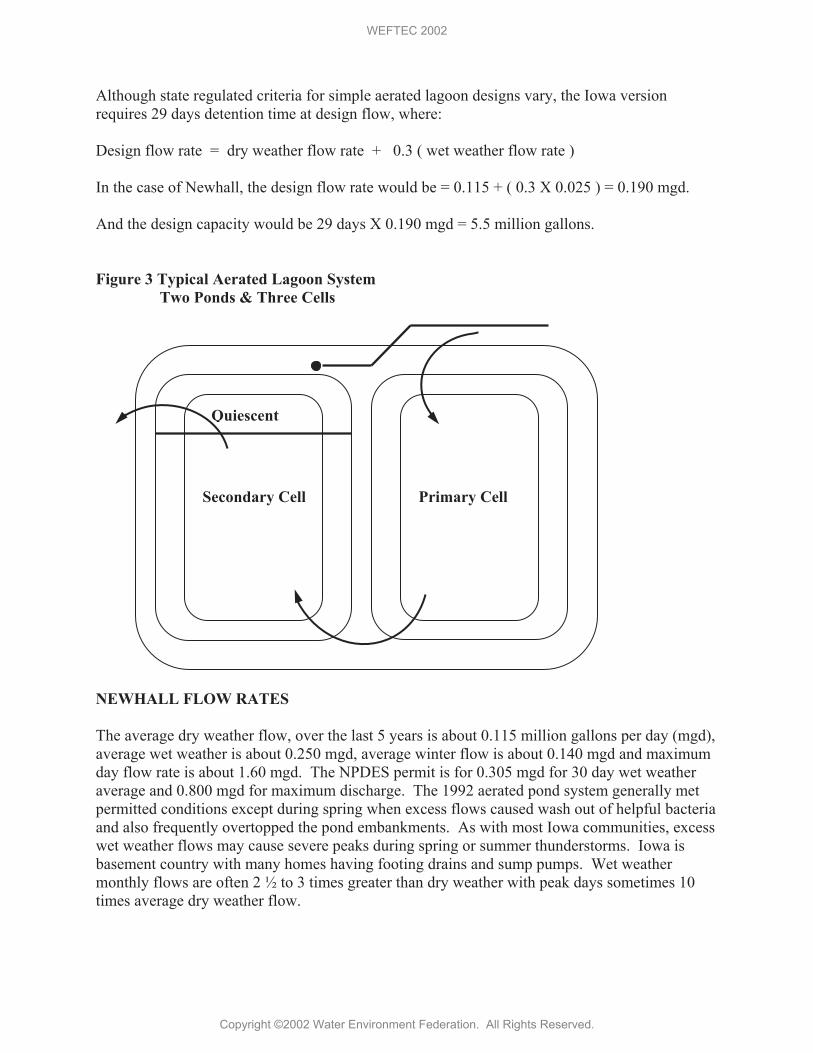
Although state regulated criteria for simple aerated lagoon designs vary, the Iowa version requires 29 days detention time at design flow, where: Design flow rate = dry weather flow rate + 0.3 ( wet weather flow rate ) In the case of Newhall, the design flow rate would be = 0.115 + ( 0.3 X 0.025 ) = 0.190 mgd. And the design capacity would be 29 days X 0.190 mgd = 5.5 million gallons. Figure 3 Typical Aerated Lagoon System
Two Ponds & Three Cells
NEWHALL FLOW RATES The average dry weather flow, over the last 5 years is about 0.115 million gallons per day (mgd), average wet weather is about 0.250 mgd, average winter flow is about 0.140 mgd and maximum day flow rate is about 1.60 mgd. The NPDES permit is for 0.305 mgd for 30 day wet weather average and 0.800 mgd for maximum discharge. The 1992 aerated pond system generally met permitted conditions except during spring when excess flows caused wash out of helpful bacteria and also frequently overtopped the pond embankments. As with most Iowa communities, excess wet weather flows may cause severe peaks during spring or summer thunderstorms. Iowa is basement country with many homes having footing drains and sump pumps. Wet weather monthly flows are often 2 ½ to 3 times greater than dry weather with peak days sometimes 10 times average dry weather flow.
Secondary Cell Primary Cell
Quiescent
WEFTEC 2002
Copyright ©2002 Water Environment Federation. All Rights Reserved.

MODIFIED LAGOON – NEWHALL DESIGN MODEL
Furler observed the effect of the excess flow conditions, and considered the availability of the abandoned cell. He convinced the community and consulting engineers to include the cell which was abandoned in 1992 as a seasonal flow equalization basin prior to the aerated cells. Although the IDNR resisted since it was an unconventional design, ultimately a construction permit was issued and in the Summer of 1997 the pond system piping was modified. The specified goal was to manage excess spring flows and allow a new winter and spring flow configuration. Figure 4 shows the modification which has been named the Newhall Model. A short pipeline and two valves were added to allow raw wastewater to be diverted to the far end of the abandoned cell. A pump station was added at the opposite corner to move water from this pond to the aerated cells. The pumping equipment was salvaged from another location in town. This arrangement provided a series flow path through the old 2.75 acre, 5.4 MG facultative pond which is now called cell #1 and control of the flow rate to the aerated cells. No aeration equipment was added to cell #1. White Amur, a special grass eating carp were added to the 3rd cell and 4th cell. All this work was a relatively low cost modification since the abandoned cell was already available. Figure 4 Newhall Winter Operation, 4-Cell Aerated Lagoon (1997+)
Figure 4 shows winter operation when, from late October through March, all wastewater is pumped to cell #1 and the valve to the aerated cells is closed. It often takes 4 to 6 weeks to raise the water level in cell #1 to the maximum 6 foot level. During the filling time, no wastewater is
2nd Cell
Aerated
1st Cell
Not Aerated
5.4 MG
Baffle
3rd Cell
Aerated
4th Cell Quiescent
Winter
Operation
Circulation
Pump
WEFTEC 2002
Copyright ©2002 Water Environment Federation. All Rights Reserved.
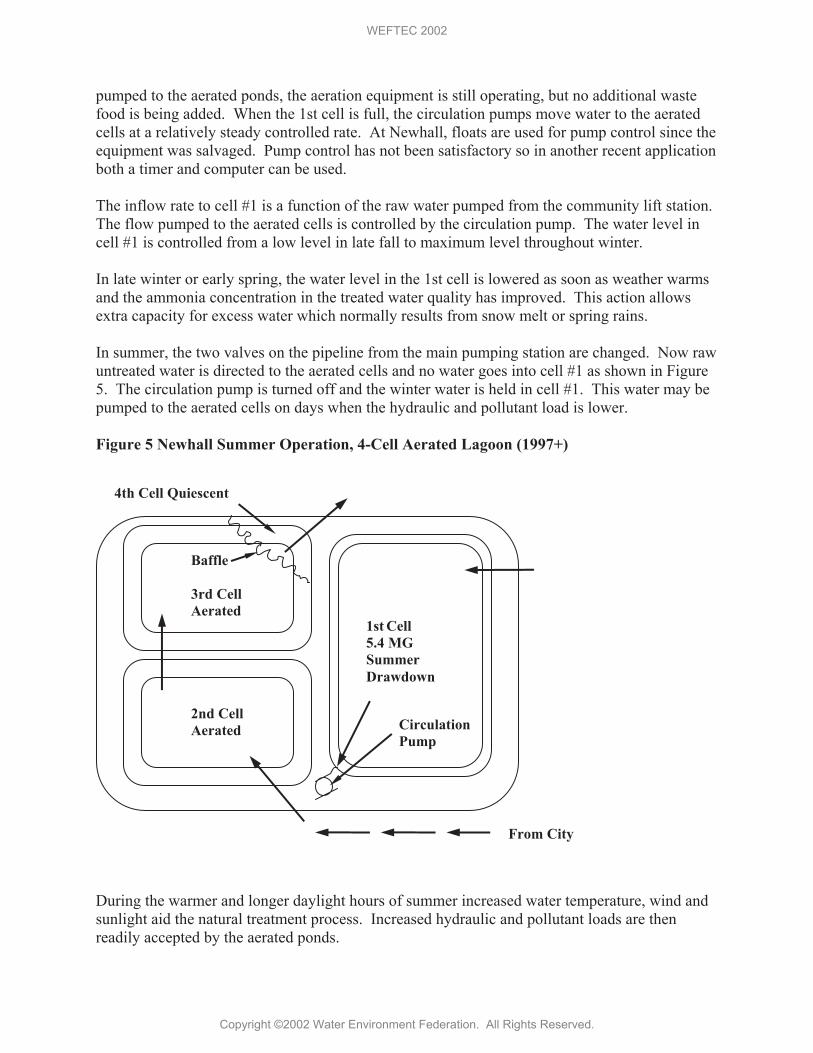
pumped to the aerated ponds, the aeration equipment is still operating, but no additional waste food is being added. When the 1st cell is full, the circulation pumps move water to the aerated cells at a relatively steady controlled rate. At Newhall, floats are used for pump control since the equipment was salvaged. Pump control has not been satisfactory so in another recent application both a timer and computer can be used. The inflow rate to cell #1 is a function of the raw water pumped from the community lift station. The flow pumped to the aerated cells is controlled by the circulation pump. The water level in cell #1 is controlled from a low level in late fall to maximum level throughout winter. In late winter or early spring, the water level in the 1st cell is lowered as soon as weather warms and the ammonia concentration in the treated water quality has improved. This action allows extra capacity for excess water which normally results from snow melt or spring rains. In summer, the two valves on the pipeline from the main pumping station are changed. Now raw untreated water is directed to the aerated cells and no water goes into cell #1 as shown in Figure 5. The circulation pump is turned off and the winter water is held in cell #1. This water may be pumped to the aerated cells on days when the hydraulic and pollutant load is lower.
Figure 5 Newhall Summer Operation, 4-Cell Aerated Lagoon (1997+)
During the warmer and longer daylight hours of summer increased water temperature, wind and sunlight aid the natural treatment process. Increased hydraulic and pollutant loads are then readily accepted by the aerated ponds.
2nd Cell
Aerated
1st Cell
5.4 MG
Summer
Drawdown
Baffle
3rd Cell
Aerated
4th Cell Quiescent
From City
Circulation
Pump
WEFTEC 2002
Copyright ©2002 Water Environment Federation. All Rights Reserved.

In Summer 2001, additional modifications were made to improve the hydraulic capacity and overall performance. A new outlet structure and effluent weir were constructed and some additional inter cell piping was added. Aerated cell #3 was drained, the diffusers were replaced and accumulated sludge was removed. As a consequence all the White Amur died and the bacteria were without oxygen for a month. No work was done on aerated cell #2 since it was required to treat all water during the maintenance activity. There was about 2-3 feet of accumulated sludge in cell #2. Work was completed in October, cell #3 was filled in fall and the process was restarted in winter. OPERATIONAL DATA AND ANALYSIS
An aerated lagoon system using a prescribed Iowa design would not be expected to provide any significant treatment of ammonia nitrogen in winter or spring because of cold water. Figure 6 is a chart of the average monthly ammonia concentration of the treated water from a typical aerated lagoon system. The Iowa ammonia effluent limits are determined specifically for each situation. However, in many communities, the discharge limits may range from 12 to15 mg/L in winter to 6 to 9 mg/L in spring and fall. Raw wastewater total nitrogen concentration data from small rural communities is very rare because it is not required by the discharge permits. No raw wastewater total nitrogen data was available from Newhall during earlier years. However, some data was collected by the authors during a special sampling period and other data is available from similar communities. Normal values for TKN-nitrogen concentration in raw wastewater during the winter months from similar communities with drier sewer systems may range from 25 to 40 mg/L. The Newhall modified aerated lagoon system demonstrates very low ammonia nitrogen concentration values even in the winter and spring. Figure 7 is a chart prepared from the average monthly effluent ammonia concentrations reported for 6 years during the 5 most difficult months. Before 1997, using only the two large aerated cells, effluent ammonia water quality was between 10 to 15 mg/L. The raw wastewater in Newhall is often very dilute, with carbonaceous biochemical oxygen values (CBOD) often in the range of 40 to 150 and usually below 100 mg/L. The average monthly values for 1999 are shown in Figure 8. One might conclude the low ammonia concentration in the treated effluent shown in Figure7 during the years 1995 – 1996 is merely the effect of dilution. However winter is usually drier and low raw wastewater concentration, even though more dilute than most communities, cannot explain the improved results in the years 1998 – 2000. After 1997, while using the modified Newhall system, ammonia concentration in late winter and spring was always below 4 to 6 mg/L, which is a remarkable result. If the average concentration of nitrogen in the untreated wastewater is estimated to have been as low as 15 to 30 mg/L during winter there would be 55% to 75% removal or oxidation of nitrogen in winter and spring.
WEFTEC 2002
Copyright ©2002 Water Environment Federation. All Rights Reserved.
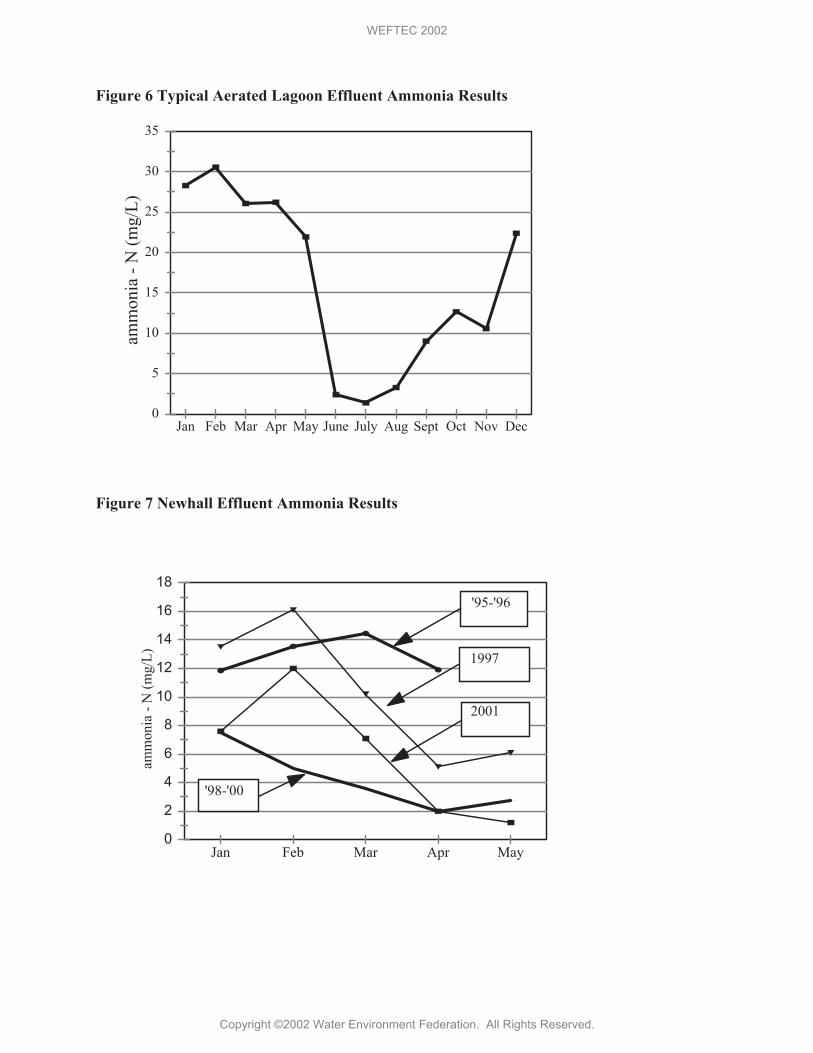
Figure 6 Typical Aerated Lagoon Effluent Ammonia Results
0
5
10
15
20
25
30
35 am
mo
nia
- N
(m
g/L
)
Jan Feb Mar Apr May June July Aug Sept Oct Nov Dec
Figure 7 Newhall Effluent Ammonia Results
0
2
4
6
8
10
12
14
16
18
amm
onia
- N
(m
g/L
)
Jan Feb Mar Apr May
'95-'96
1997
2001
'98-'00
WEFTEC 2002
Copyright ©2002 Water Environment Federation. All Rights Reserved.

Figure 8 Newhall Influent CBOD Concentration
20
40
60
80
100
120
140
160 C
BO
D (
MG
/l)
Jan March May July Sept Nov
Figure 9 Newhall Special Sampling Results – Winter, 2000
0
10
20
30
40
50
60
nit
rog
en, m
g/L
Jan 20 Feb 3 Feb 10 Feb 17 Feb 24 Mar 9 Mar 23 Apr 6
cell 1 influent
cell 1 effluent
aerated lagoon
system effluent
WEFTEC 2002
Copyright ©2002 Water Environment Federation. All Rights Reserved.
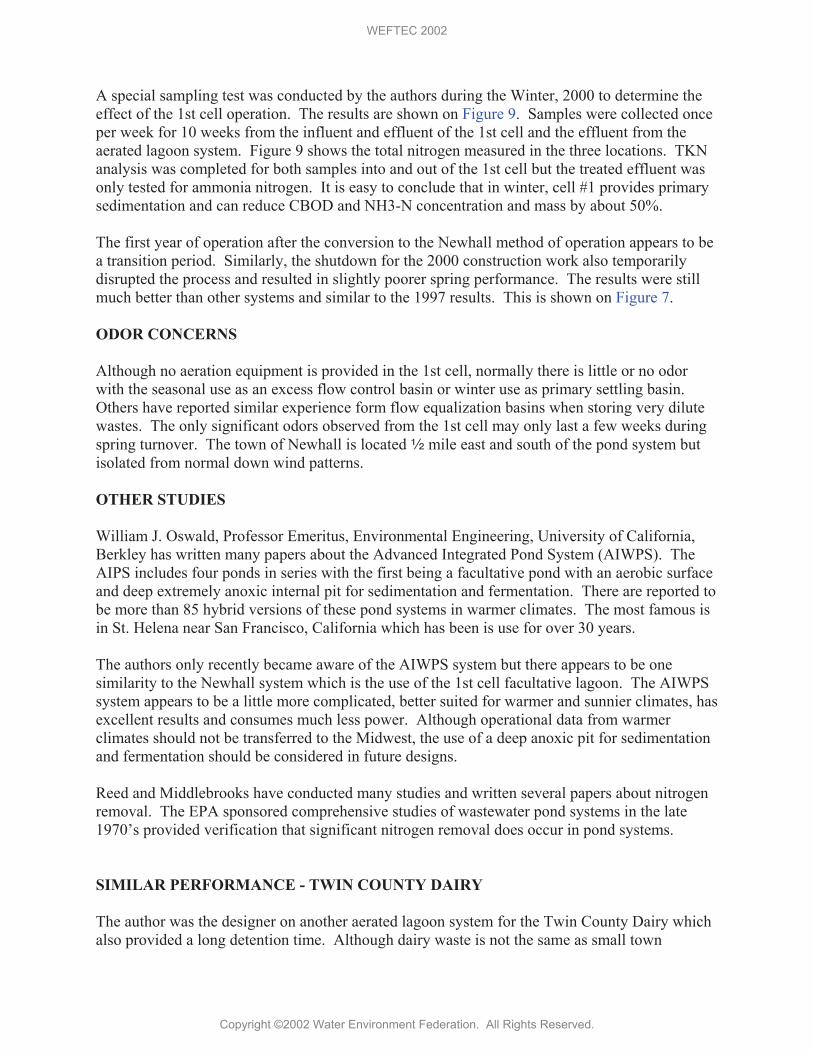
A special sampling test was conducted by the authors during the Winter, 2000 to determine the effect of the 1st cell operation. The results are shown on Figure 9. Samples were collected once per week for 10 weeks from the influent and effluent of the 1st cell and the effluent from the aerated lagoon system. Figure 9 shows the total nitrogen measured in the three locations. TKN analysis was completed for both samples into and out of the 1st cell but the treated effluent was only tested for ammonia nitrogen. It is easy to conclude that in winter, cell #1 provides primary sedimentation and can reduce CBOD and NH3-N concentration and mass by about 50%. The first year of operation after the conversion to the Newhall method of operation appears to be a transition period. Similarly, the shutdown for the 2000 construction work also temporarily disrupted the process and resulted in slightly poorer spring performance. The results were still much better than other systems and similar to the 1997 results. This is shown on Figure 7. ODOR CONCERNS
Although no aeration equipment is provided in the 1st cell, normally there is little or no odor with the seasonal use as an excess flow control basin or winter use as primary settling basin. Others have reported similar experience form flow equalization basins when storing very dilute wastes. The only significant odors observed from the 1st cell may only last a few weeks during spring turnover. The town of Newhall is located 2 mile east and south of the pond system but isolated from normal down wind patterns. OTHER STUDIES
William J. Oswald, Professor Emeritus, Environmental Engineering, University of California, Berkley has written many papers about the Advanced Integrated Pond System (AIWPS). The AIPS includes four ponds in series with the first being a facultative pond with an aerobic surface and deep extremely anoxic internal pit for sedimentation and fermentation. There are reported to be more than 85 hybrid versions of these pond systems in warmer climates. The most famous is in St. Helena near San Francisco, California which has been is use for over 30 years. The authors only recently became aware of the AIWPS system but there appears to be one similarity to the Newhall system which is the use of the 1st cell facultative lagoon. The AIWPS system appears to be a little more complicated, better suited for warmer and sunnier climates, has excellent results and consumes much less power. Although operational data from warmer climates should not be transferred to the Midwest, the use of a deep anoxic pit for sedimentation and fermentation should be considered in future designs.
Reed and Middlebrooks have conducted many studies and written several papers about nitrogen removal. The EPA sponsored comprehensive studies of wastewater pond systems in the late 1970’s provided verification that significant nitrogen removal does occur in pond systems.
SIMILAR PERFORMANCE - TWIN COUNTY DAIRY
The author was the designer on another aerated lagoon system for the Twin County Dairy which also provided a long detention time. Although dairy waste is not the same as small town
WEFTEC 2002
Copyright ©2002 Water Environment Federation. All Rights Reserved.
wastewater nor are the aerated treatment processes identical, the Dairy case is included in this paper because of similar results and the support for the conclusions included herein. Twin County Dairy, Inc. is a locally owned and operated small cheese processing plant located near Kalona, Iowa. The dairy is actually a cheese processing plant and retail cheese store and has been in operation for more than 50 years. The Dairy processes approximately 800,000 pounds of milk each day in winter months and 600,000 to 750,000 pounds each day in summer months. The Dairy needed to make improvements to the wastewater treatment facilities to reduce the amount of ammonia nitrogen being discharged to Ramsey Creek. The existing aerated pond system was too small, only providing 25 days of aeration time and no nitrification was occurring even in the summer. The design loading for the new treatment facilities was 125,000 gallons, 300 pounds of CBOD and 60 pounds of nitrogen per day for average wet weather conditions. Nitrogen concentration in the raw wastewater is normally in the range of 60 to 80 mg/L. The ammonia limits for the Dairy are 20 mg/L and 20 pounds per day. The Dairy is extremely well operated and produces a relatively uniform and not particularly strong wastewater each day, year round, except when there is an accidental milk spill. With a milk spill or leak, the CBOD loading may reach 3,000 to 5,000 pounds in one day. The primary goals for new wastewater treatment facilities were to achieve a 50 to 75% reduction in ammonia, depending on the season and to contain and treat any accidental milk spill without compromising stream water quality standards. New large aerated wastewater stabilization ponds were constructed in 1998. The pond system was designed to be operated with variable water level and storage amounts and seasonally variable discharge rates in order to comply with the stream water quality limits. The new pond system has approximately 16 million gallon storage capacity with 60 days minimum to 130 days maximum detention time. New aerated pond #1 and new pond #2 are both approximately 2.5 acres in surface area, 10 feet deep, with an 8 million gallon capacity. The long detention time in the pond system was expected to achieve the required ammonia effluent criteria with low operating cost. Excess capacity would be available to accommodate any accidental milk spills and allow for maintenance activities. Wastewater flow was first diverted into the new ponds in the first week of December, 1998 and began to flow into the second pond in February, 1999. Because pond construction started in the fall, electrical work and mechanical aerators were not installed and operational until January. In January, six 1,500 gallon loads of seed bacteria from an activated sludge plant were dumped into the south pond to help start the process. Floating baffles were installed in March. The first water was discharged in March about 150 days after it first entered the process. The Dairy uses a licensed contract operator and all samples are sent to a certified commercial laboratory for analysis. Since start up in 1999, samples of raw and treated wastewater are collected twice a week. The raw sample is a 24 hour, time based composite but the treated effluent is a grab sample. Occasionally other samples from intermediate points are also collected. Tests are performed for TKN, ammonia, and nitrate nitrogen as well as the usual CBOD, suspended solids, pH, temperature, etc. All flow to and through the aerated lagoon
WEFTEC 2002
Copyright ©2002 Water Environment Federation. All Rights Reserved.

system is by gravity. Two flow meters are provided – one into and one out for discharge of the system. Both are inspected and calibrated frequently and the data from each is compared to verify good flow data. The author has a great deal of confidence in the collection, testing and reporting of data from the Dairy. Figure 10 is a chart of the nitrogen parameters in the new aerated lagoons at the Twin County Dairy facility during the 1999 start-up. Nitrogen treatment is much slower than CBOD reduction and is a very good indicator of the aerated pond system biological activity. The top line is the concentration of nitrogen (measured as TKN) in the untreated wastewater. The line which starts in the middle of the chart in April is the lagoon system effluent ammonia concentration. The line which starts low and rises to the middle is the effluent nitrate concentration. The first water quality test data was very good considering the process was started in winter. During this time there were very little seed bacteria, cold weather, ice cover, no aerators or mixing and no intermediate pond baffles. In spite of all these adverse conditions, the spring discharge water met the permit requirements. During the first three months of operation, ammonia nitrogen was reduced about 50% with only plain sedimentation and this was the project goal. The nitrification process began to show good results after 6 months of operation during warmer weather.
Figure 10 Twin County Dairy During Start-up.
0
20
40
60
80
nit
rogen
(m
g/L
)
Jan March May July Sept Nov
effl, NH3-N
effl, NO3-N
influent, TKN
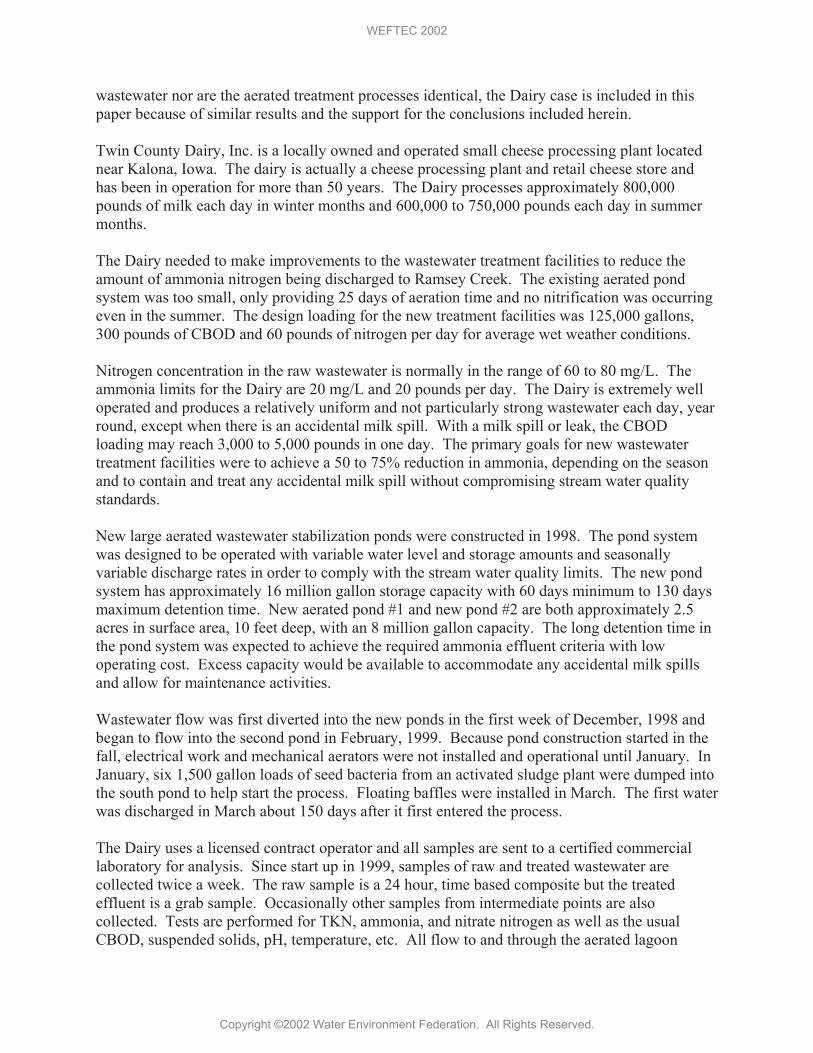
The Dairy performance has been very good since start-up, through the winter months and even when subjected to occasional huge milk spills. Figure 11 is a chart of the TKN nitrogen into and ammonia concentration out of the Dairy aerated lagoon system during the Winter of 2001-2002. It can be observed the effluent ammonia nitrogen is less than 25% of the influent total nitrogen.
WEFTEC 2002
Copyright ©2002 Water Environment Federation. All Rights Reserved.
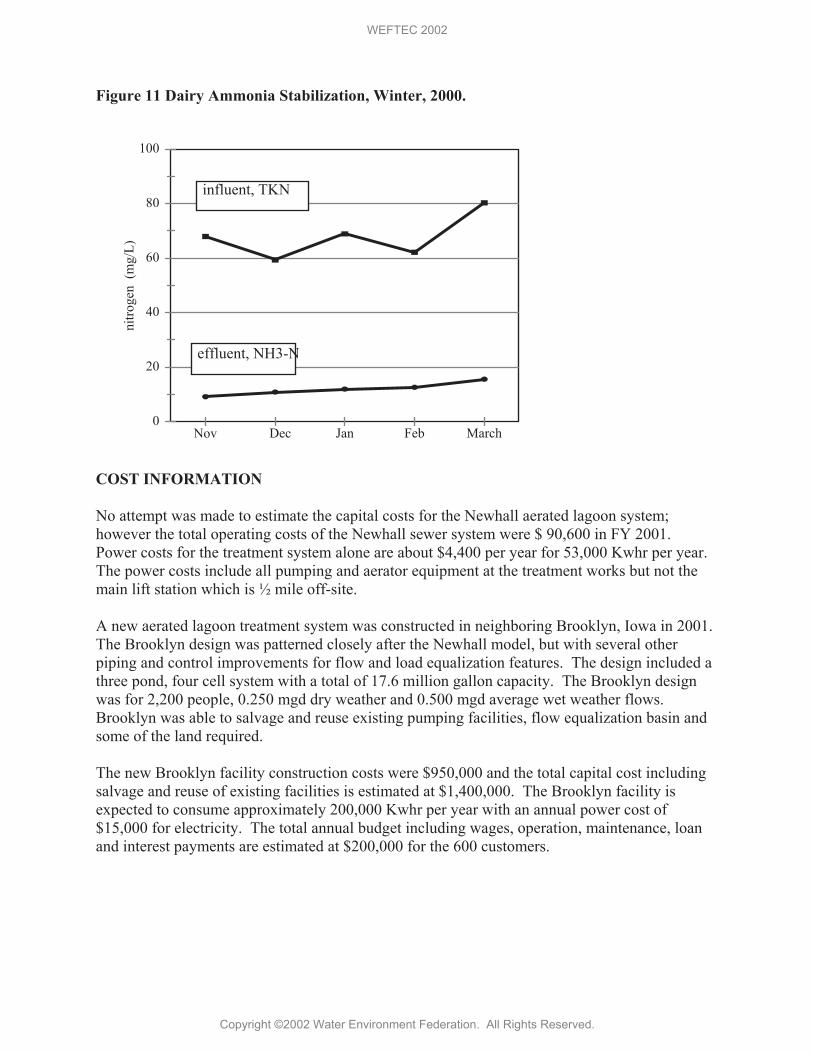
Figure 11 Dairy Ammonia Stabilization, Winter, 2000.
0
20
40
60
80
100
nit
rog
en (m
g/L
)
Nov Dec Jan Feb March
effluent, NH3-N
influent, TKN
COST INFORMATION
No attempt was made to estimate the capital costs for the Newhall aerated lagoon system; however the total operating costs of the Newhall sewer system were $ 90,600 in FY 2001. Power costs for the treatment system alone are about $4,400 per year for 53,000 Kwhr per year. The power costs include all pumping and aerator equipment at the treatment works but not the main lift station which is ½ mile off-site. A new aerated lagoon treatment system was constructed in neighboring Brooklyn, Iowa in 2001. The Brooklyn design was patterned closely after the Newhall model, but with several other piping and control improvements for flow and load equalization features. The design included a three pond, four cell system with a total of 17.6 million gallon capacity. The Brooklyn design was for 2,200 people, 0.250 mgd dry weather and 0.500 mgd average wet weather flows. Brooklyn was able to salvage and reuse existing pumping facilities, flow equalization basin and some of the land required. The new Brooklyn facility construction costs were $950,000 and the total capital cost including salvage and reuse of existing facilities is estimated at $1,400,000. The Brooklyn facility is expected to consume approximately 200,000 Kwhr per year with an annual power cost of $15,000 for electricity. The total annual budget including wages, operation, maintenance, loan and interest payments are estimated at $200,000 for the 600 customers.
WEFTEC 2002
Copyright ©2002 Water Environment Federation. All Rights Reserved.

CONCLUSIONS
The Newhall aerated lagoon installation provides very good nitrogen treatment even in the winter and spring as indicated on the performance charts. Before 1997, using only the two cell aerated ponds, effluent water quality was greater than the 10 mg/L ammonia permit limits. After 1997, with sedimentation in the 1st cell, organic and nitrogen loadings were reduced as much as 50%. Lower and controlled flow rates into the aerated cells were provided by the flow equalization cell. A longer aeration time and less demand for oxygen in aerated cells #2 and #3 provided some nitrification even with low temperatures so ammonia concentrations in the spring were below 6 mg/L. Even with cold temperatures, with 50% of the waste material already removed, lower and controlled flow rates, longer aeration time, plenty of oxygen and good mixing, improved nitrogen treatment was provided. A multi-cell aerated lagoon system with varying seasonal configurations may successfully treat nitrogen often reducing ammonia in discharge by 75% even in winter. Aerated lagoons with long detention time can meet many ammonia water quality limits at very reasonable costs. This is a significant achievement which may present a new beneficial alternative to communities which desire a simple treatment process and where there is available land and good soil. This investigation and reporting was conducted by individuals who do not normally do this type of work and were using very limited resources. Other more qualified investigators should gather additional data and conduct their own analysis in order to confirm or improve on the Newhall results. The Brooklyn aerated lagoon facility, which was patterned after the Newhall Model should serve to add considerably to operational procedures and database. ACKNOWLEDGEMENTS
The authors wish to acknowledge the financial assistance and support from MMS Consultants, Inc. MMS is a small civil engineering, surveying and landscape architecture firm located in Iowa City, Iowa. MMS became actively involved in research of performance of unusual aerated lagoon systems located in the Midwest in order to provide better service to their clients.
REFERENCES
Oswald, William J. (1991) Introduction to Advanced Integrated Wastewater Ponding Systems, Wat. Sci. Tech. Vol 24, No.5, pp. 1-7. Reed, Sherwood C. ; Crites, Ronald W.; Middlebrooks, E. Joe ( 1995). Natural Systems for
Waste Management and Treatment, 2nd Ed. McGraw-Hill.
WEFTEC 2002
Copyright ©2002 Water Environment Federation. All Rights Reserved.
Nitrifying Trickling Filter Provides Reliable,
Low-Energy, and Cost-Effective Tertiary Municipal
Wastewater Treatment of a Lagoon Effluent
Jerry Bounds1, Jianchang Ye2, Frank M. Kulick III2, Joshua P. Boltz3
1City of Newton, Mississippi 393452Brentwood Industries Inc., 610 Morgantown Road, Reading, Pennsylvania 19611
3CH2M HILL, Inc., 4350 West Cypress Street, Suite 600, Tampa, Florida 33607
Reprinted with permission from Proceedings of
WEFTEC® 2010, the 83rd Annual Water Environment Federation Technical Exhibition and Conference,
New Orleans, LA, October 2-6, 2010.
Copyright © 2010 Water Environment Federation, Alexandria, Virginia.

Nitrifying Trickling Filter Provides Reliable, Low-Energy and Cost-Effective Tertiary Municipal Wastewater Treatment of a Lagoon Effluent
Jerry Bounds 1, Jianchang Ye 2*, Frank M. Kulick III 2, Joshua P. Boltz 3
1Newton POTW, Highway 80 West, City of Newton, Mississippi, 39345 2Brentwood Industries Inc., 610 Morgantown Road, Reading, Pennsylvania,19611 3CH2M HILL, Inc.,4350 West Cypress Street, Suite 600,Tampa, Florida, 33607 *To whom correspondence should be addressed. Email: [email protected] ABSTRACT The case study described in this paper demonstrates that the nitrifying trickling filter (NTF) is a reliable and robust bioreactor. The studied NTF was designed to oxidize ammonia-nitrogen (NH3-N) remaining in the effluent stream of an aerated lagoon that is located in Newton, Mississippi, USA. NTF performance data was collected during a period beginning in June 2007 and ending in January 2010. An analysis of the data demonstrated that the NTF consistently met, amongst other permitted criteria, a moderately stringent permit limit requiring an annual average NH3-N concentration less than 2.0-mg/L remaining in the effluent stream. Comparison of operating costs revealed that the NTF evaluated in this study required approximately one-third of the power required to meet the same treatment objective with a moving bed biofilm reactor (MBBR). However, the NTF required a slightly more foot print than the MBBR (e.g. 90 vs. 80 m2) to meet the treatment objective. The studied NTF was designed using generally accepted criteria defined throughout this paper. The NTF used medium-density modular plastic trickling filter media comprised of corrugated plastic sheets. The required biofilm surface area, and therefore bioreactor volume, was defined based on a 0.65-g NH3-N/m2/d zero-order nitrification rate and a 0.1-kg/m3/d five-day biochemical oxygen demand (BOD5) load at 12oC. The method for calculating NTF ventilation is demonstrated. Implementation of the NTF design and construction included some unique features: (1) the NTF influent pumps were located to provide NTF effluent recirculation (which provides proper media wetting, controls biofilm thickness and minimizes macro fauna accumulation), (2) use of influent pump(s) speed control to optimize the NTF superficial hydraulic application rate (or Spülkraft), (3) the ventilating area was conservatively designed to maximize airflow, and therefore process oxygen, for the nitrification process (i.e., 0.1-m2 (1.0-ft2) open area per 2.4-m (8.0-ft) of NTF periphery), and (4) the application of a column and pier support system to facilitate simple installation and increased air flow. KEYWORDS: Nitrifying Trickling Filter; NTF; Nitrification; Biofilm; Reactor; Aerated Lagoon; Ventilation; Design; Energy; Efficient; Operating Cost.
WEFTEC 2010
Copyright ©2010 Water Environment Federation. All Rights Reserved.3750
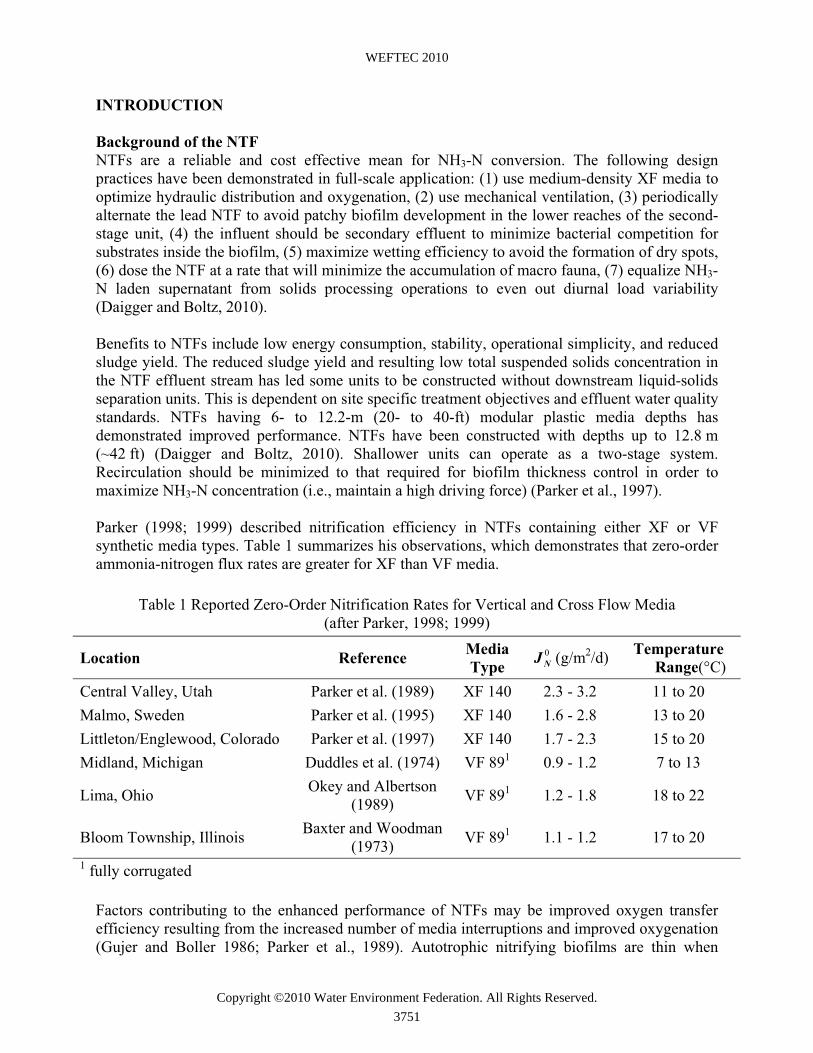
INTRODUCTION Background of the NTF NTFs are a reliable and cost effective mean for NH3-N conversion. The following design practices have been demonstrated in full-scale application: (1) use medium-density XF media to optimize hydraulic distribution and oxygenation, (2) use mechanical ventilation, (3) periodically alternate the lead NTF to avoid patchy biofilm development in the lower reaches of the second-stage unit, (4) the influent should be secondary effluent to minimize bacterial competition for substrates inside the biofilm, (5) maximize wetting efficiency to avoid the formation of dry spots, (6) dose the NTF at a rate that will minimize the accumulation of macro fauna, (7) equalize NH3-N laden supernatant from solids processing operations to even out diurnal load variability (Daigger and Boltz, 2010). Benefits to NTFs include low energy consumption, stability, operational simplicity, and reduced sludge yield. The reduced sludge yield and resulting low total suspended solids concentration in the NTF effluent stream has led some units to be constructed without downstream liquid-solids separation units. This is dependent on site specific treatment objectives and effluent water quality standards. NTFs having 6- to 12.2-m (20- to 40-ft) modular plastic media depths has demonstrated improved performance. NTFs have been constructed with depths up to 12.8 m (~42 ft) (Daigger and Boltz, 2010). Shallower units can operate as a two-stage system. Recirculation should be minimized to that required for biofilm thickness control in order to maximize NH3-N concentration (i.e., maintain a high driving force) (Parker et al., 1997). Parker (1998; 1999) described nitrification efficiency in NTFs containing either XF or VF synthetic media types. Table 1 summarizes his observations, which demonstrates that zero-order ammonia-nitrogen flux rates are greater for XF than VF media.
Table 1 Reported Zero-Order Nitrification Rates for Vertical and Cross Flow Media (after Parker, 1998; 1999)
Location Reference Media Type
0NJ (g/m2/d) Temperature
Range(°C) Central Valley, Utah Parker et al. (1989) XF 140 2.3 - 3.2 11 to 20 Malmo, Sweden Parker et al. (1995) XF 140 1.6 - 2.8 13 to 20 Littleton/Englewood, Colorado Parker et al. (1997) XF 140 1.7 - 2.3 15 to 20 Midland, Michigan Duddles et al. (1974) VF 891 0.9 - 1.2 7 to 13
Lima, Ohio Okey and Albertson (1989) VF 891 1.2 - 1.8 18 to 22
Bloom Township, Illinois Baxter and Woodman (1973) VF 891 1.1 - 1.2 17 to 20
1 fully corrugated
Factors contributing to the enhanced performance of NTFs may be improved oxygen transfer efficiency resulting from the increased number of media interruptions and improved oxygenation (Gujer and Boller 1986; Parker et al., 1989). Autotrophic nitrifying biofilms are thin when
WEFTEC 2010
Copyright ©2010 Water Environment Federation. All Rights Reserved.3751
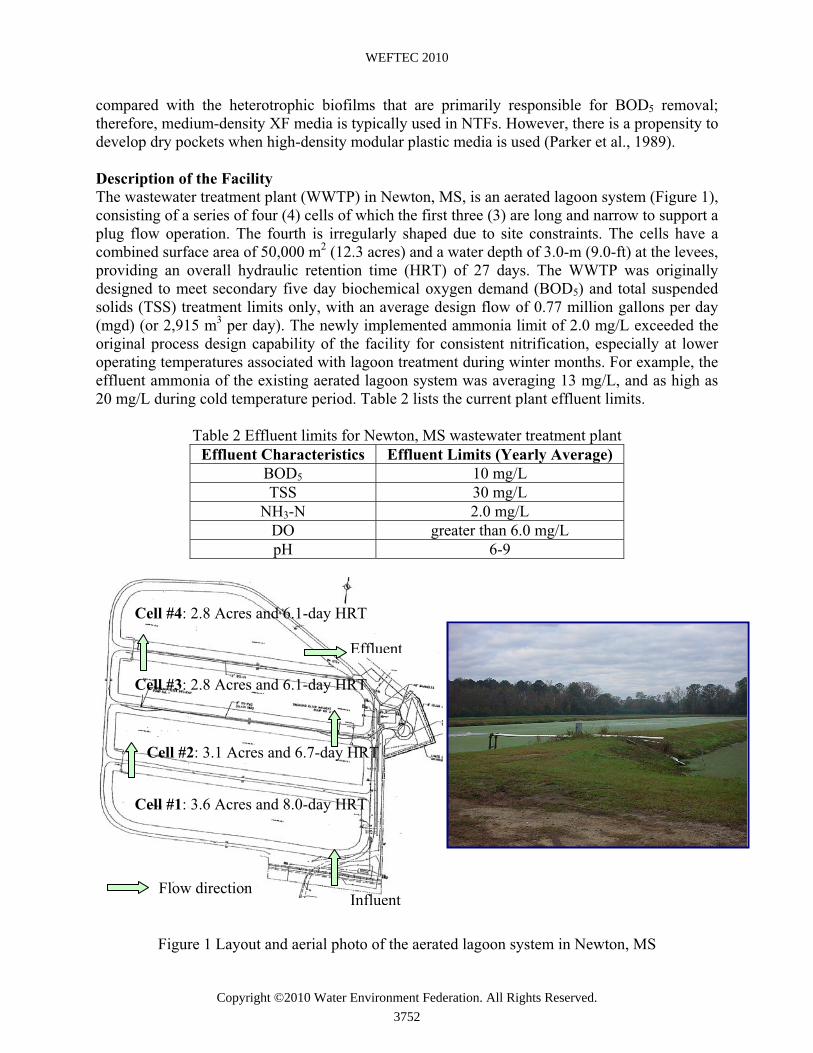
compared with the heterotrophic biofilms that are primarily responsible for BOD5 removal; therefore, medium-density XF media is typically used in NTFs. However, there is a propensity to develop dry pockets when high-density modular plastic media is used (Parker et al., 1989). Description of the Facility The wastewater treatment plant (WWTP) in Newton, MS, is an aerated lagoon system (Figure 1), consisting of a series of four (4) cells of which the first three (3) are long and narrow to support a plug flow operation. The fourth is irregularly shaped due to site constraints. The cells have a combined surface area of 50,000 m2 (12.3 acres) and a water depth of 3.0-m (9.0-ft) at the levees, providing an overall hydraulic retention time (HRT) of 27 days. The WWTP was originally designed to meet secondary five day biochemical oxygen demand (BOD5) and total suspended solids (TSS) treatment limits only, with an average design flow of 0.77 million gallons per day (mgd) (or 2,915 m3 per day). The newly implemented ammonia limit of 2.0 mg/L exceeded the original process design capability of the facility for consistent nitrification, especially at lower operating temperatures associated with lagoon treatment during winter months. For example, the effluent ammonia of the existing aerated lagoon system was averaging 13 mg/L, and as high as 20 mg/L during cold temperature period. Table 2 lists the current plant effluent limits.
Table 2 Effluent limits for Newton, MS wastewater treatment plant Effluent Characteristics Effluent Limits (Yearly Average)
BOD5 10 mg/L TSS 30 mg/L
NH3-N 2.0 mg/L DO greater than 6.0 mg/L pH 6-9
Figure 1 Layout and aerial photo of the aerated lagoon system in Newton, MS
Influent
Effluent
Cell #1: 3.6 Acres and 8.0-day HRT
Cell #3: 2.8 Acres and 6.1-day HRT
Cell #4: 2.8 Acres and 6.1-day HRT
Cell #2: 3.1 Acres and 6.7-day HRT
Flow direction
WEFTEC 2010
Copyright ©2010 Water Environment Federation. All Rights Reserved.3752

Biofilm Technologies for Lagoon Effluent Polishing Nitrification in an aerated lagoon may be difficult due to several factors including oxygen limitation, poor distribution of influent wastewater and mixing, low operating temperatures, and also the limited ability to retain slow-growing autotrophic nitrifiers. Biofilm technologies such as the trickling filter and moving bed biofilm reactor (MBBR) have been shown able to retain dense nitrifying biomass inventory on a supporting media surface (Parker et al., 1989, Wessman and Johnson, 2006, and Hewell, 2009), therefore independent of the suspended biomass in a typical activated sludge or lagoon process. A number of criteria, including maximizing the use of existing assets, minimizing operational requirements, and minimizing life-cycle costs were applied to determine the most feasible biofilm technology for the Newton, MS upgrade. The NTF alternative was eventually selected to bring the plant into compliance with the ammonia limit due to its process capability and reliability and also cost-effectiveness. Objectives This case study is intended to evaluate long-term performance data collected from a NTF treating effluent from an aerated lagoon system at the City of Newton, MS Wastewater Treatment Plant. In addition to evaluating system performance, the study is also aimed at discussing design criteria (according to Boltz et al., 2010) and implementation methodology of the NTF and also comparing the NTF operating costs with a hypothetical MBBR process. DESIGN CONSIDERATIONS OF THE NTF Process Design of Combined Carbon Oxidation and Nitrification Trickling Filter The NTF at Newton, MS was sized based on an influent BOD5 and NH3-N concentrations of 30 and 20 mg/L, respectively, at the average design flow rate of 0.77 mgd. Per the published performance data for trickling filters (e.g. TKNOX=1.086·[BOD5:TKN]-0.44 with a standard deviation of 0.175 g TKN/m2/d at 15oC) (Boltz et al., 2010; Boltz, 2010), a zero-order nitrification rate of approximately 0.65 g NH3-N/m2/d at a winter temperature of 12oC was developed for determining the overall media volume/surface area requirement. A dense structured sheet plastic media with a specific surface area of 157 m2/m3 (48 ft2/ft3) was selected to minimize the footprint of the NTF and also because of the expected relatively low biomass yield from a nitrifying biofilm. The NTF was ultimately sized with a diameter of 10.6-m (35-ft) and a media depth of 6.1-m (20-ft). This was also consistent with the ammonia percentage removal requirement (e.g. ~90% from 20 to 2 mg/L for the permit) at the resulted NTF organic load of 0.11 kg/m3-day (or 7 lbs/1,000 ft3-day) (US EPA, 2000). NTF Influent Pumps Two centrifugal influent pumps, each with a maximum pumping capacity of 44.2 liters per minute, lpm (700 gpm) were located in the influent (or east) and effluent (or west) sides of Cell #3, respectively for redundant operation and potential process control flexibility. The treated wastewater from the trickling filter can be returned to either the middle of the Cell #3 as recirculation flow or the inlet of the Cell #4 for final clarification. The east pump was intended to operate during winter months to minimize the exposure of wastewater to the cold atmosphere for an extended HRT and therefore reduce the negative impact of low temperatures on the nitrification performance of the trickling filter. The west pump was designed to provide flow
WEFTEC 2010
Copyright ©2010 Water Environment Federation. All Rights Reserved.3753

recirculation to the trickling filter by pumping mixed wastewater from both Cell #2 and the filter effluent as returned to the middle of the Cell #3. The influent to the trickling filter was metered and controlled at a constant flow rate of 22.1 lpm (350 gpm) in order to maintain a consistent filter wetting rate (e.g. about 23.5 m3/m2-d or 0.4 gpm/ft2) and also to provide better control for the hydraulically propelled distributor (Figure 3). Flow fluctuation from the existing pumping rate of 22.1 lpm (350 gpm) was equalized through recirculation between cells. Plugging of trickling filter media with lagoon algae was not encountered as the influent pipes of the pumps were submerged about 1.0-m (3-ft) below the surface where no or limited algae was present.
Hydraulically Propelled Distributor A hydraulic propelled distributor with brake orifice assemblies in each arm was designed for flow distribution over the structured sheet media, primarily due to the enhanced control of the influent pumps for a constant flow rate. The hydraulic reaction distributor has a stationary center weldment supporting a turntable base from which a rotating assembly with distribution arms is suspended (Figure 4). The center assembly consists of a stationary support pier (Figure 5) anchored to the concrete center column which elevates and supports the main bearing assembly. The pier contains port cuts, which serves as a weir to allow for free water discharge from the stationary pier into rotating tub (Figure 6). Each distribution arm has openings fitted with flow spreaders and replaceable orifice plates to distribute the flow evenly from each hole (Figure 7). The hydraulically propelled distributor has minimum and maximum flow capacities of 300 and 700 gpm, respectively and it also has minimum and maximum operating speeds of 0.95 and 2.0 rpm, respectively. The minimum and maximum flows and operating speeds of the distributor provide equivalent SK in the range of 3-16 mm/pass, which appears consistent with the typical dosing rates for a rock filter (WEF, 1998). However, no performance reduction was observed as a result of the low operating SK values for a structured sheet media NTF.
Figure 2 Filter influent pumps in Cell #3 Figure 3 Filter influent meter
WEFTEC 2010
Copyright ©2010 Water Environment Federation. All Rights Reserved.3754
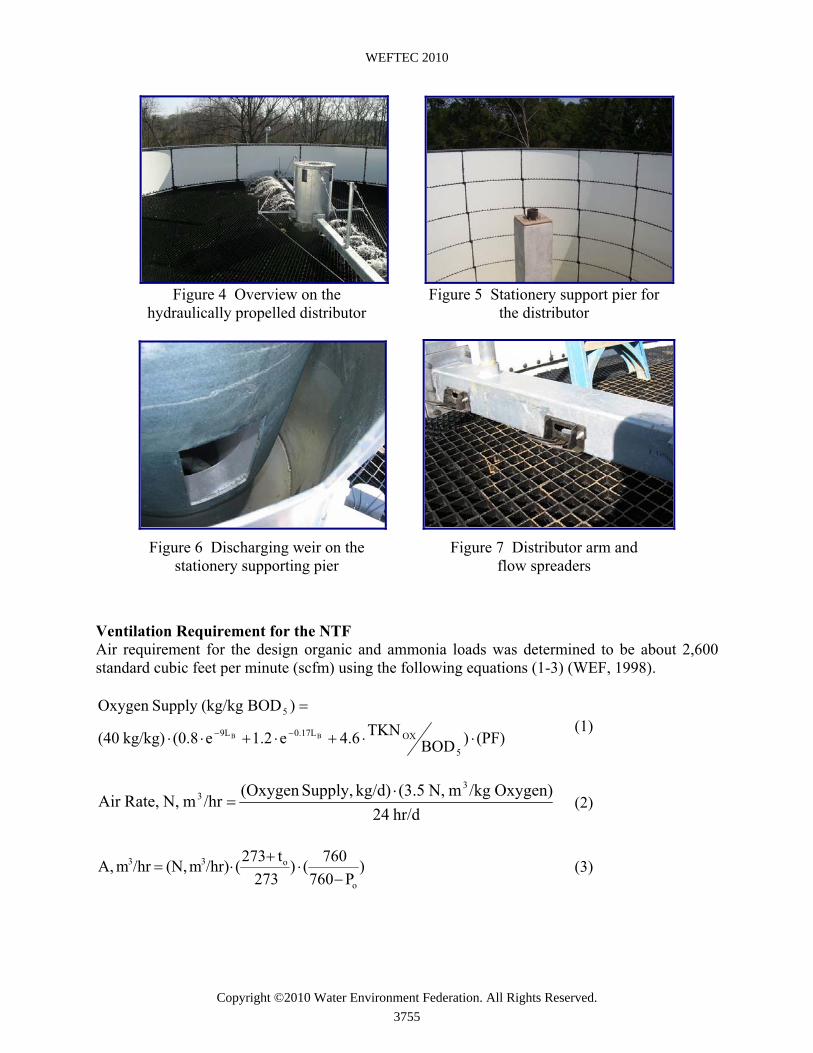
Ventilation Requirement for the NTF Air requirement for the design organic and ammonia loads was determined to be about 2,600 standard cubic feet per minute (scfm) using the following equations (1-3) (WEF, 1998).
(PF))BODTKN4.6e1.2e(0.8kg/kg)(40
)BOD(kg/kgSupplyOxygen
5
OX0.17L9L
5
BB �������
�
�� (1)
hr/d24Oxygen)/kgmN,(3.5kg/d)Supply,(Oxygen
/hrmN,Rate,Air3
3 �� (2)
)P760
760()273
t273(/hr)m(N,/hrmA,o
o33
��
��� (3)
Figure 4 Overview on the hydraulically propelled distributor
Figure 5 Stationery support pier for the distributor
Figure 6 Discharging weir on the stationery supporting pier
Figure 7 Distributor arm and flow spreaders
WEFTEC 2010
Copyright ©2010 Water Environment Federation. All Rights Reserved.3755
Where: LB = Organic load of the NTF, 0.11 kg/m3-day (or 7.0 lbs/1,000 ft3-day) TKNOX = Influent TKN - Net Yield Organic N - Effluent TKN, kg/day PF = Peaking factor, 2.5 for the Newton, MS NTF to = Ambient air temperature, 30oC P0 = Site pressure, 744 mm Hg at a site elevation of 500-ft The headloss (or pressure drop) through plastic media as induced by the required air flow rate of 2,600 scfm was estimated to be approximately 1.74×10⁻² Pa (7.0×10⁻⁵ inch of water) based on the following equations (4-5) (WEF, 1998). Multipliers of 1.6 and 1.5 were also considered in the calculation to account for the cross-flow media and inlet and other head losses.
)2gv(N�P
2
�� (4)
(L/A))10(6.62
p
5
eD3.15N �� �
��� (5) Where: v – Superficial air velocity, m/s (ft/sec) g – Acceleration of gravity, 9.8 m/s2 (or 32.2 ft/sec2) N – Tower resistance, number of velocity heads lost in tower Np – Packing loss, velocity heads L – Liquid loading, lbs/hr (kg/hr) A – Tower top surface area, ft2 (m2) D – Media depth, ft (m) The driving pressure as resulted from a natural draft was estimated to be 0.131 Pa (5.25×10⁻⁴ inch of water) downflow based on the equations of (6) and (7) (WEF, 2000). This far exceeds the air flow requirement as determined by the process demands, indicating natural draft should be adequate for the NTF operation if the air inlets do not restrict flow.
)TT
ln(
TTT
2
1
21m
�� (6)
D)T1
T1(7.64�P
m0
���� (7)
Where: T0 – Outside temperature, 540 oR (or 80 oF) Tm – Inside or water temperature, 538 oR (or 78 oF) D – Media depth, ft (m)
WEFTEC 2010
Copyright ©2010 Water Environment Federation. All Rights Reserved.3756
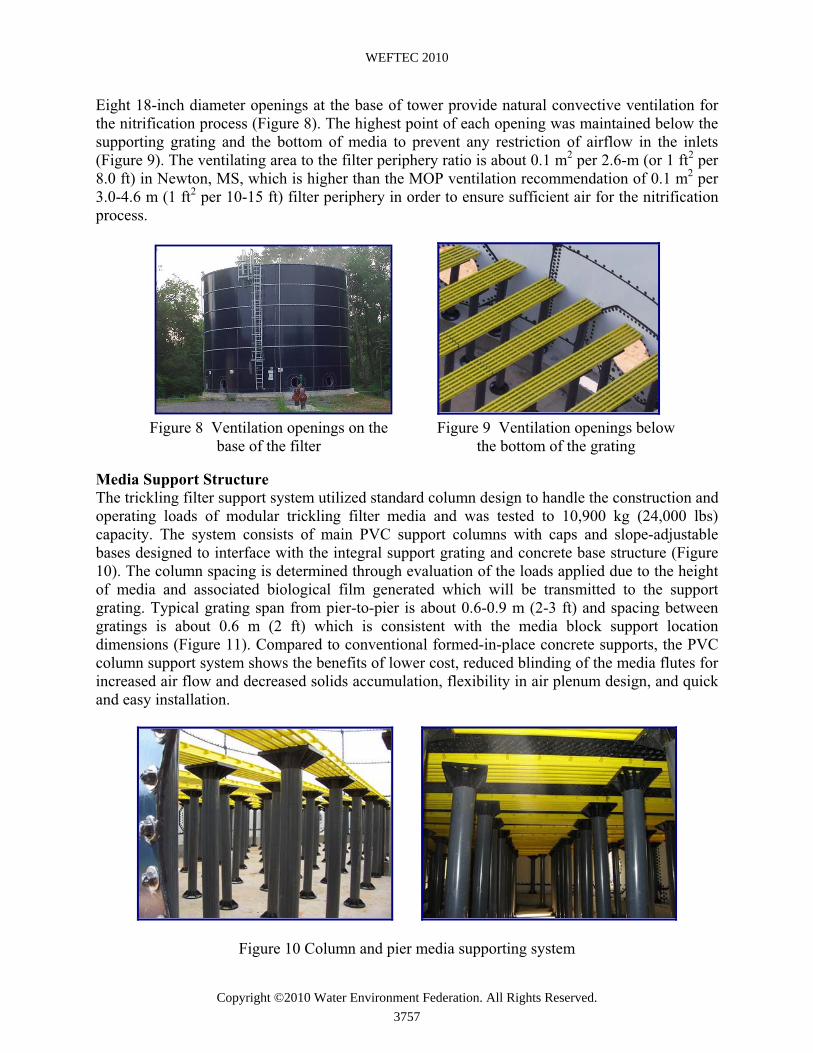
Eight 18-inch diameter openings at the base of tower provide natural convective ventilation for the nitrification process (Figure 8). The highest point of each opening was maintained below the supporting grating and the bottom of media to prevent any restriction of airflow in the inlets (Figure 9). The ventilating area to the filter periphery ratio is about 0.1 m2 per 2.6-m (or 1 ft2 per 8.0 ft) in Newton, MS, which is higher than the MOP ventilation recommendation of 0.1 m2 per 3.0-4.6 m (1 ft2 per 10-15 ft) filter periphery in order to ensure sufficient air for the nitrification process.
Media Support Structure The trickling filter support system utilized standard column design to handle the construction and operating loads of modular trickling filter media and was tested to 10,900 kg (24,000 lbs) capacity. The system consists of main PVC support columns with caps and slope-adjustable bases designed to interface with the integral support grating and concrete base structure (Figure 10). The column spacing is determined through evaluation of the loads applied due to the height of media and associated biological film generated which will be transmitted to the support grating. Typical grating span from pier-to-pier is about 0.6-0.9 m (2-3 ft) and spacing between gratings is about 0.6 m (2 ft) which is consistent with the media block support location dimensions (Figure 11). Compared to conventional formed-in-place concrete supports, the PVC column support system shows the benefits of lower cost, reduced blinding of the media flutes for increased air flow and decreased solids accumulation, flexibility in air plenum design, and quick and easy installation.
Figure 10 Column and pier media supporting system
Figure 8 Ventilation openings on the base of the filter
Figure 9 Ventilation openings below the bottom of the grating
WEFTEC 2010
Copyright ©2010 Water Environment Federation. All Rights Reserved.3757

CENTER TO CENTER PIER SPACING
2'-6" SQUARE CENTER DISTRIBUTION COLUMN
2'-0"
5'-0" SQUARE SUMP AREA
3'-0"
CENTER TO CENTER PIER SPACING2'-0"
2'-0" 2'-0"
(4) PIERS LOCATED IN SUMP AREA TO BE GROUT FILLED (BY OTHERS)
Figure 11 Layout and photo of column and pier media supporting system
Under Drain of the NTF A clearance of 1.37-m (4.5-ft) between the bottom of the plastic media and the filter floor at the outside wall was maintained to allow for free air flow and ventilation. The filter floor is sloped towards an effluent well located in the center of the filter, where wastewater flows to either Cell #3 or #4 by gravity.
Figure 11 Trickling filter under drain well and pipe PERFORMANCE Ammonia Removal in the NTF The NTF was started up during the coldest temperature period in late January, 2007 and significant nitrification did not occur initially until the wastewater temperatures rose to greater than 15oC after about six weeks. However, the performance data collected from the past three years have shown the acclimated NTF was able to handle the temperature fluctuations and achieve consistent nitrification and meet the ammonia discharge limits. A single effluent ammonia spike was observed during the early filter operation (e.g. June 2007) due to a concurrently increased BOD and TSS loads to the filter (Figure 12); however, individual increases of either BOD or TSS concentrations to the NTF later on (e.g. November 2007 and January 2008) did not compromise the nitrification performance. The nitrification activity of the filter was also confirmed by the fact that a significant amount of alkalinity was consumed in the
WEFTEC 2010
Copyright ©2010 Water Environment Federation. All Rights Reserved.3758

filter (Figure 13). This was equivalent to approximately 6.8 g alkalinity consumed per 1.0 g of ammonia removed, close to the theoretical alkalinity requirement for a nitrification process (e.g. 7.1 g alkalinity per g of ammonia). The slight deviation of alkalinity consumption as compared to the theoretical number may be attributed to the alkalinity credits resulted from a possible denitrification process as occurred in the filter when the nitrate-rich filter effluent is mixed with the raw wastewater from Cell #2 and returned to the filter. The ammonia concentration observed in the plant effluent was shown slightly higher than those measured directly from the filter effluent. For example, on August 9, 2007, ammonia concentrations of the filter influent, effluent, and the plant effluent were 17.5, 0.6, and 3.1 mg/L, respectively. Sampling of wastewater in different locations and depths in Cell #4 (Figure 14) confirmed that ammonia release was occurring likely as a result of anaerobic digestion of sludge. This was also evidenced that the deeper the samples were taken, the higher the ammonia levels were detected (Figure 15). The sludge sampling results in Cell #4 has led the plant to temporarily close the cross connection between Cell #3 and #4 to facilitate direct discharge of treated effluent from Cell #3 prior to scheduling a sludge removal event in Cell #4.
0
5
10
15
20
25
1/25/07 7/25/07 1/25/08 7/25/08 1/25/09 7/25/09 1/25/10
NH
3-N
(mg/
L)
0
10
20
30
40
Was
tew
ater
Tem
pera
ture
(o C)
TF Influent NH3-NTF Effluent NH3-NPlant Effluent NH3-NWastewater TEMP, oC
Figure 12 Ammonia removal performance of the NTF at Newton, MS
y = 6.7661x
0
40
80
120
160
200
0 5 10 15 20 25NH3-N Removed in Trickling Filter (mg/L)
Alk
alin
ity C
onsu
med
(mg/
L)
Figure 13 Correlation between alkalinity consumption and ammonia removed in the NTF
WEFTEC 2010
Copyright ©2010 Water Environment Federation. All Rights Reserved.3759
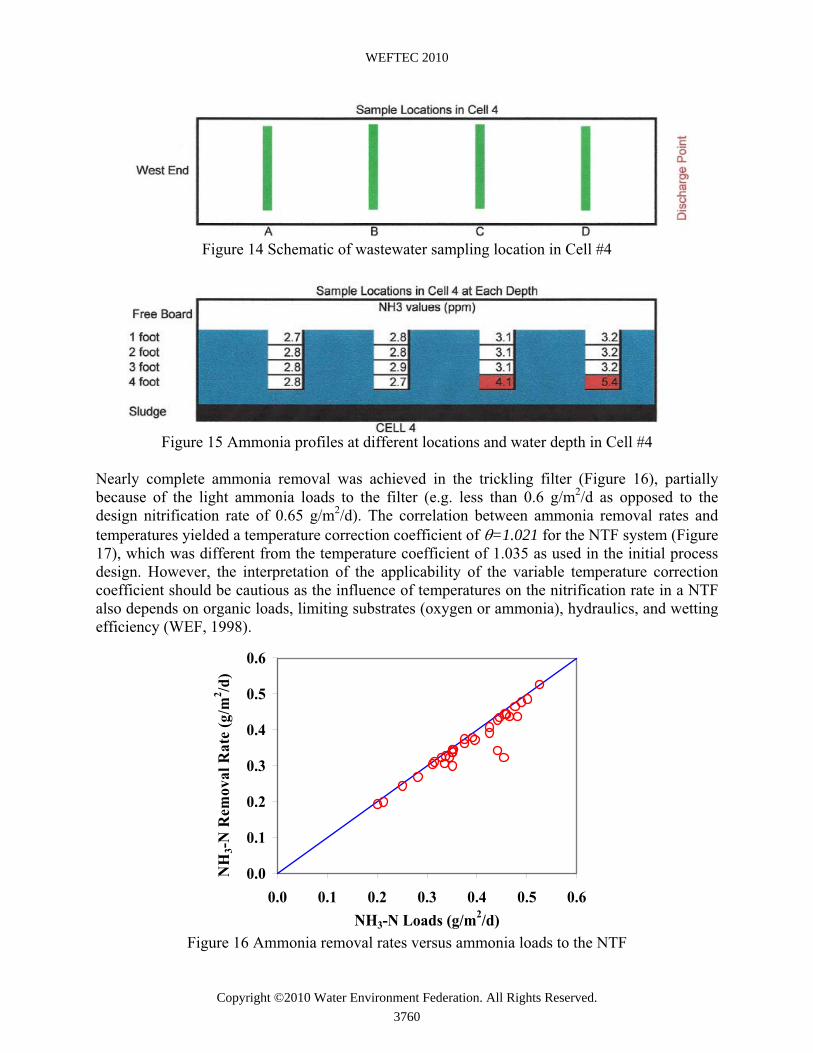
Figure 14 Schematic of wastewater sampling location in Cell #4
Figure 15 Ammonia profiles at different locations and water depth in Cell #4
Nearly complete ammonia removal was achieved in the trickling filter (Figure 16), partially because of the light ammonia loads to the filter (e.g. less than 0.6 g/m2/d as opposed to the design nitrification rate of 0.65 g/m2/d). The correlation between ammonia removal rates and temperatures yielded a temperature correction coefficient of �=1.021 for the NTF system (Figure 17), which was different from the temperature coefficient of 1.035 as used in the initial process design. However, the interpretation of the applicability of the variable temperature correction coefficient should be cautious as the influence of temperatures on the nitrification rate in a NTF also depends on organic loads, limiting substrates (oxygen or ammonia), hydraulics, and wetting efficiency (WEF, 1998).
0.0
0.1
0.2
0.3
0.4
0.5
0.6
0.0 0.1 0.2 0.3 0.4 0.5 0.6NH3-N Loads (g/m2/d)
NH
3-N
Rem
oval
Rat
e (g
/m2 /d
)
Figure 16 Ammonia removal rates versus ammonia loads to the NTF
WEFTEC 2010
Copyright ©2010 Water Environment Federation. All Rights Reserved.3760

rNH3-N = 0.2073x1.021Temp
0.0
0.2
0.4
0.6
10 15 20 25 30 35 40
Wastewater Temperature (oC)
NH
3-N
Rem
oval
Rat
e (g
/m2 /d
)
Figure 17 Effect of temperature on ammonia removal rates in the NTF
BOD and TSS Removal The influent BOD concentrations to the trickling filter ranged from about 10 to 45 mg/L. No apparent BOD reduction was seen during early sampling prior to August 2007 (Figure 18). This may be primarily due to the presence of TSS in the filter effluent. Settling of solids in the Cell #4 contributed to an overall enhanced BOD polishing with an average plant effluent BOD of 5.0 mg/L. The filter influent and effluent TSS concentrations were comparable (Figure 19), indicating low solids yields from the BOD polishing and nitrification processes. The solids as sloughed off from the trickling filter has also shown good settleability and the plant effluent TSS were averaging approximately 8.0 mg/L.
0
10
20
30
40
50
1/25/07 5/25/07 9/25/07 1/25/08
CB
OD
5 (m
g/L
)
Influent CBOD5Effluent CBOD5Effluent Soluble BOD5
Figure 18 CBOD5 concentrations in the filter influent, filter effluent, and the plant effluent
WEFTEC 2010
Copyright ©2010 Water Environment Federation. All Rights Reserved.3761
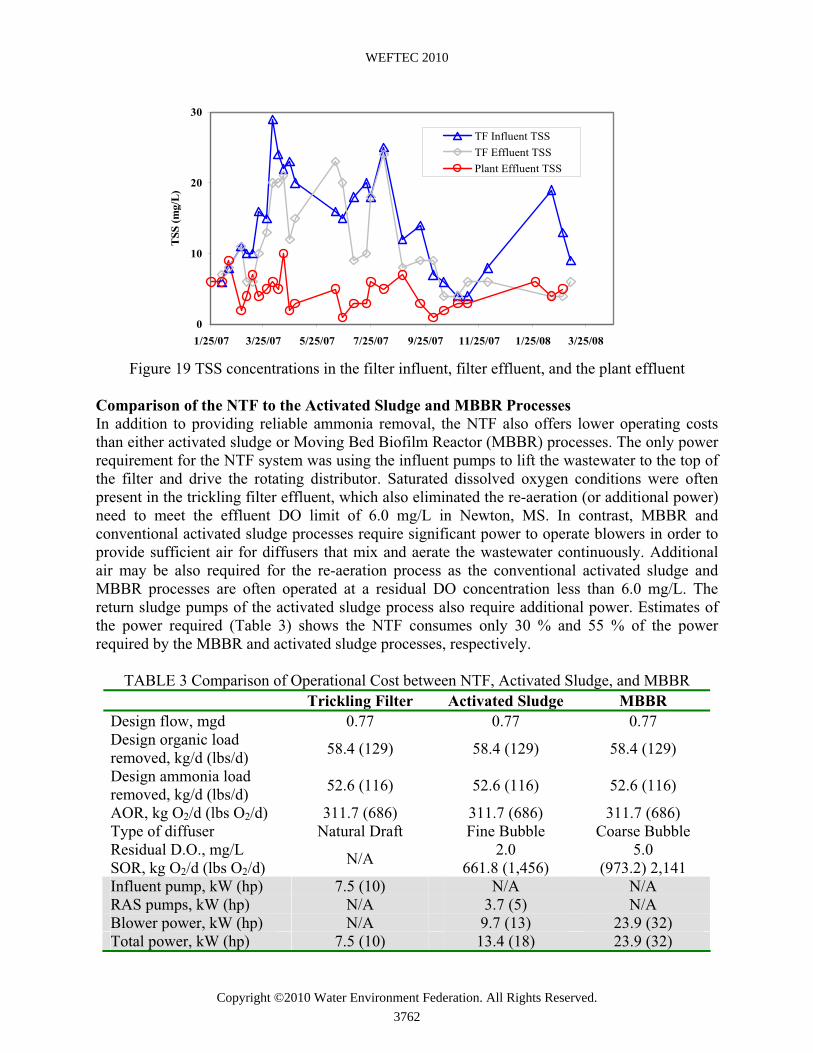
0
10
20
30
1/25/07 3/25/07 5/25/07 7/25/07 9/25/07 11/25/07 1/25/08 3/25/08
TSS
(mg/
L)
TF Influent TSSTF Effluent TSSPlant Effluent TSS
Figure 19 TSS concentrations in the filter influent, filter effluent, and the plant effluent
Comparison of the NTF to the Activated Sludge and MBBR Processes In addition to providing reliable ammonia removal, the NTF also offers lower operating costs than either activated sludge or Moving Bed Biofilm Reactor (MBBR) processes. The only power requirement for the NTF system was using the influent pumps to lift the wastewater to the top of the filter and drive the rotating distributor. Saturated dissolved oxygen conditions were often present in the trickling filter effluent, which also eliminated the re-aeration (or additional power) need to meet the effluent DO limit of 6.0 mg/L in Newton, MS. In contrast, MBBR and conventional activated sludge processes require significant power to operate blowers in order to provide sufficient air for diffusers that mix and aerate the wastewater continuously. Additional air may be also required for the re-aeration process as the conventional activated sludge and MBBR processes are often operated at a residual DO concentration less than 6.0 mg/L. The return sludge pumps of the activated sludge process also require additional power. Estimates of the power required (Table 3) shows the NTF consumes only 30 % and 55 % of the power required by the MBBR and activated sludge processes, respectively.
TABLE 3 Comparison of Operational Cost between NTF, Activated Sludge, and MBBR Trickling Filter Activated Sludge MBBR Design flow, mgd 0.77 0.77 0.77 Design organic load removed, kg/d (lbs/d) 58.4 (129) 58.4 (129) 58.4 (129)
Design ammonia load removed, kg/d (lbs/d) 52.6 (116) 52.6 (116) 52.6 (116)
AOR, kg O2/d (lbs O2/d) 311.7 (686) 311.7 (686) 311.7 (686) Type of diffuser Natural Draft Fine Bubble Coarse Bubble Residual D.O., mg/L 2.0 5.0 SOR, kg O2/d (lbs O2/d) N/A 661.8 (1,456) (973.2) 2,141 Influent pump, kW (hp) 7.5 (10) N/A N/A RAS pumps, kW (hp) N/A 3.7 (5) N/A Blower power, kW (hp) N/A 9.7 (13) 23.9 (32) Total power, kW (hp) 7.5 (10) 13.4 (18) 23.9 (32)
WEFTEC 2010
Copyright ©2010 Water Environment Federation. All Rights Reserved.3762
On the other hand, the MBBR may require less foot print when compared to the NTF, primarily because the MBBR biofilm carrier has a higher specific surface area (e.g. 500 m2/m3 or 150 ft2/ft3) than the NTF media (e.g. 157 m2/m3 or 48 ft2/ft3 for this study). However, the difference of the foot print requirements between the NTF and MBBR may be reduced because the NTF typically contains fill media up to 100% of the tank volume (as compared to a typical 50-60% media fill for a MBBR reactor) and is also able to stack a media depth up to 42-ft (as opposed to a typical side water depth (SWD) of 10-ft for a MBBR reactor). For example, it was estimated that the MBBR would require a foot print of approximately 80-m2 for the Newton, MS WWTP upgrade, assuming an ammonia surface flux rate of 0.7-g NH3-N/m2/d, a SWD of 10-ft, and 60% media fill (Hewell, 2009). This was only slightly less than the foot print requirement of the NTF (e.g. approximately 90-m2 at the filter diameter of 10.6-m or 35-ft). CONCLUSIONS This case study has demonstrated that the NTF system can be an effective tertiary process to an aerated lagoon to achieve reliable nitrification. Performance data collected for more than two years has shown that the NTF was able to consistently meet the ammonia discharge limit of 2.0 mg/L. The comparison of operating energy costs reveals that the NTF with corrugated modular plastic media is significantly lower than other fixed-film alternatives, and as low as one third of the energy consumed by a MBBR process. Despite having less media specific surface area, the NTF required a comparable foot print to the MBBR system, mainly because the NTF has a higher media fill and is less restrictive on constructing a deeper NTF tower than a MBBR reactor. The design of the NTF involved the use of generally accepted design criteria based on the Manual of Practice (Boltz et al., 2009), including sizing the media surface area requirement or bioreactor volume using a zero-order nitrification rate of 0.65 g NH3-N/m2/d and a BOD5 load of 0.1-kg/m3/d at 12oC and determining the ventilation requirement. Implementation of the NTF design and construction included some unique features: (1) the NTF influent pumps were located to provide NTF effluent recirculation (which provides proper media wetting, controls biofilm thickness and minimizes macro fauna accumulation), (2) use of influent pump(s) speed control to optimize the NTF superficial hydraulic application rate (or Spülkraft), (3) the ventilating area was conservatively designed to maximize airflow, and therefore process oxygen, for the nitrification process (i.e., 0.1-m2 (1.0-ft2) open area per 2.4-m (8.0-ft) of NTF periphery), and (4) the application of a column and pier support system to facilitate simple installation and increased air flow. ACKNOWLEDGEMENT The authors would like to thank Dave Krichten, the former trickling filter Product Manager of Brentwood Industries, Inc. for his contribution in coordinating the early abstract submission prior to his retirement.
WEFTEC 2010
Copyright ©2010 Water Environment Federation. All Rights Reserved.3763
REFERENCES Baxter and Woodman Environmental Engineers (1973). “Nitrification in Wastewater Treatment:
Report of the Pilot Study” Prepared for the Sanitary District of Bloom Township, Illinois. Boltz, J.P. (2010). Trickling Filter and Trickling Filter-Suspended Growth Process Design
(Chapter 3). In: Biofilm Reactors. WEF Manual of Practice No. 35, McGraw Hill, New York, USA. In press.
Boltz, J.P., Morgenroth, E., deBarbadillo, C., Dempsey, M., McQuarrie, J., Ghylin, T., Harrison, J., and Nerenberg, R. (2009). Biofilm Reactor Technology and Design (Chapter 13). In: Design of Municipal Wastewater Treatment Plants, Volume 2, Fifth Edition. WEF Manual of Practice No. 8, ASCE Manuals and Reports on Engineering Practice No. 76. McGraw Hill, New York, USA.
Daigger, G.T., and Boltz, J.P. (2010). Trickling filter and trickling filter suspended growth process design and operation: a state-of-the art review. Water Environment Research. In press.
Duddles, G.A., Richardson, S.E., and Barth, E.F. (1974). Plastic Medium Trickling Filters for Biological Nitrogen Control. J. WPCF, 46(5), 937-946.
Gujer, W., and Boller, M. (1986). Design of a Nitrifying Trickling Filter Based on Theoretical Concepts. Wat. Res., 20, 1353.
Hewell (2009) Efficiently Nitrify Lagoon Effluent Using Moving Bed Biofilm Reactor (MBBR) Treatment Process, Texas AWWA, Texas Water ’07
Okey, R.W., and Albertson, O.E. (1989). Evidence of Oxygen Limiting Conditions During Tertiary Fixed-Film Nitrification. J. WPCF., 61, 510.
Parker, D., Lutz, M., Dahl, R., and Bernkopf, S. (1989). Enhancing Reaction Rates in Nitrifying Trickling Filters through Biofilm Control. Journal WPCF, 61(5), 618-631.
Parker, D.S., Lutz, M., Andersson, B., and Aspegren, H. (1995). Effect of Operating Variables on Nitrification rates in Trickling Filters. Wat. Env. Res., 67(7), 1111-1118.
Parker, D.S., Jacobs, T., Bower, E., Stowe, D.W., and Farmer, G. (1997). Maximizing Trickling Filter Nitrification Through Biofilm Control: Research Review and Full Scale Application. Wat. Sci. Tech., 36(1), 255-262.
Parker, D.S. (1998). “Establishing Biofilm System Evaluation Protocols.” WERF Workshop: Formulating a Research Program for Debottlenecking, Optimizing, and Rerating Existing Wastewater Treatment Plants. Proceedings of the 71st Water Environment Federation Technical Exhibition and Conference (WEFTEC), Orlando, FL.
Parker, D. S. (1999). Trickling Filter Mythology. J. Env. Eng., 125(7), 618-625. US EPA (2000) Wastewater Technology Fact Sheet: Trickling Filter Nitrification. WEF (1998). In: Design of Municipal Wastewater Treatment Plant, 4th Edition, WEF Manual of
Practice 8. Water Environment Federation, Alexandria, VA. WEF (2000). In: Aerobic Fixed-Growth Reactor. Water Environment Federation, Alexandria,
VA. Wessman, F.G. and Johnson, C.H. (2006). Cold Weather Nitrification of Lagoon Effluent Using
a Moving Bed Biofilm Reactor (MBBR) Treatment Process. Proceedings of the 79th Annual Conference and Exposition (WEFTEC 2006), Dallas, Texas, USA, October 21-25.
WEFTEC 2010
Copyright ©2010 Water Environment Federation. All Rights Reserved.3764
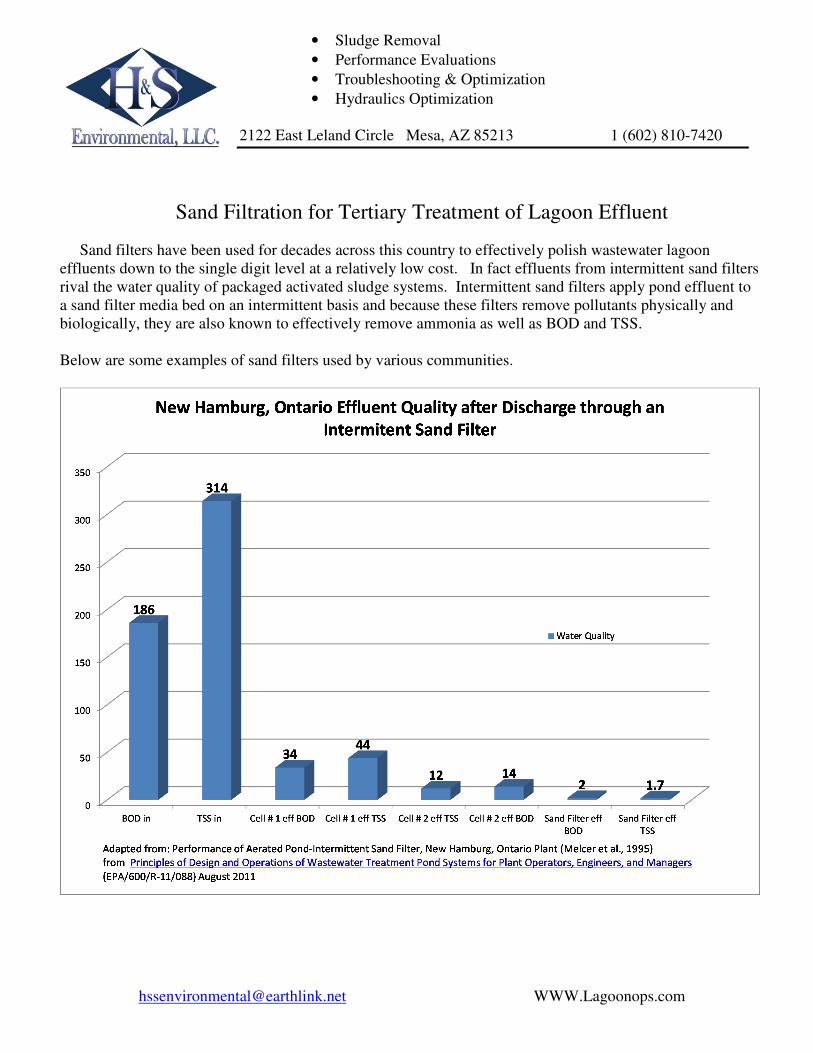
[email protected] WWW.Lagoonops.com
• Sludge Removal
• Performance Evaluations
• Troubleshooting & Optimization
• Hydraulics Optimization
2122 East Leland Circle Mesa, AZ 85213 1 (602) 810-7420
Sand Filtration for Tertiary Treatment of Lagoon Effluent
Sand filters have been used for decades across this country to effectively polish wastewater lagoon
effluents down to the single digit level at a relatively low cost. In fact effluents from intermittent sand filters
rival the water quality of packaged activated sludge systems. Intermittent sand filters apply pond effluent to
a sand filter media bed on an intermittent basis and because these filters remove pollutants physically and
biologically, they are also known to effectively remove ammonia as well as BOD and TSS.
Below are some examples of sand filters used by various communities.

[email protected] WWW.Lagoonops.com
Below is a chart representing five (5) different communities’ experiences all using intermittent sand filters.
You will notice the average TSS removal efficiency for these five (5) different sand filters is seventy-nine
(79) percent and the BOD removal efficiency is seventy-eight (78) percent. The addition of an intermittent sand
filter (or DynaSand) to any one of the 10/15 TESI lagoons will more than any other upgrade (aside from
desludging) get these plants in compliance. Most communities using sand filters report long term and sustained
single digit TSS and BOD compliance.
4 4.86
3.5 2.9
5.94.7 5.1
8.6 7.86.4
10.1
2.7 3.5
13.7 13.7 13.7
30 30.1
34
23.9
28.5
32.4 32.4 32.4
70.7
2320.8
0
10
20
30
40
50
60
70
80
1 2 3 4 5 6 7 8 9 10 11 12 13 14
TS
S (
mg
/l)
Sand Filter Influent TSS vs Sand Effuent TSS for Five Different
Wastewater lagoon Systems
Sand Filter Effluent TSS
Sand Filter Influent TSS
Average TSS Removal Efficiecy for Intermittant Sand Filters: 79%
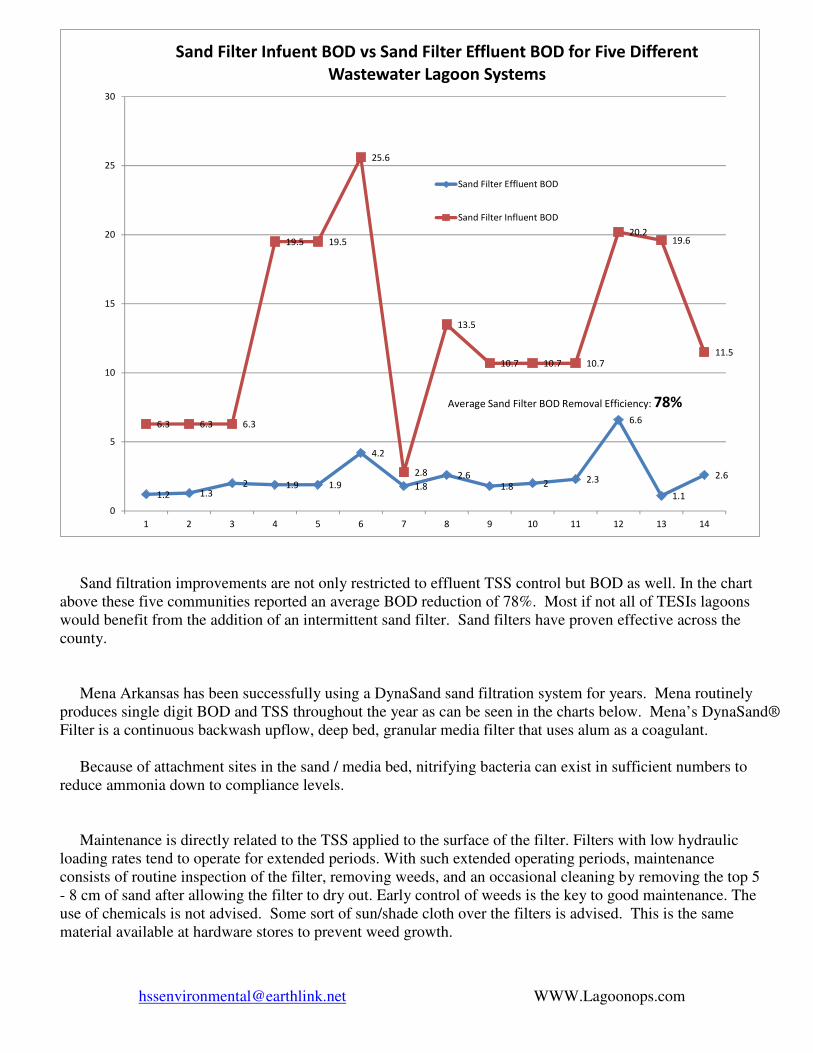
[email protected] WWW.Lagoonops.com
Sand filtration improvements are not only restricted to effluent TSS control but BOD as well. In the chart
above these five communities reported an average BOD reduction of 78%. Most if not all of TESIs lagoons
would benefit from the addition of an intermittent sand filter. Sand filters have proven effective across the
county.
Mena Arkansas has been successfully using a DynaSand sand filtration system for years. Mena routinely
produces single digit BOD and TSS throughout the year as can be seen in the charts below. Mena’s DynaSand®
Filter is a continuous backwash upflow, deep bed, granular media filter that uses alum as a coagulant.
Because of attachment sites in the sand / media bed, nitrifying bacteria can exist in sufficient numbers to
reduce ammonia down to compliance levels.
Maintenance is directly related to the TSS applied to the surface of the filter. Filters with low hydraulic
loading rates tend to operate for extended periods. With such extended operating periods, maintenance
consists of routine inspection of the filter, removing weeds, and an occasional cleaning by removing the top 5
- 8 cm of sand after allowing the filter to dry out. Early control of weeds is the key to good maintenance. The
use of chemicals is not advised. Some sort of sun/shade cloth over the filters is advised. This is the same
material available at hardware stores to prevent weed growth.
1.2 1.32 1.9 1.9
4.2
1.82.6
1.8 2 2.3
6.6
1.1
2.6
6.3 6.3 6.3
19.5 19.5
25.6
2.8
13.5
10.7 10.7 10.7
20.219.6
11.5
0
5
10
15
20
25
30
1 2 3 4 5 6 7 8 9 10 11 12 13 14
Sand Filter Infuent BOD vs Sand Filter Effluent BOD for Five Different
Wastewater Lagoon Systems
Sand Filter Effluent BOD
Sand Filter Influent BOD
Average Sand Filter BOD Removal Efficiency: 78%
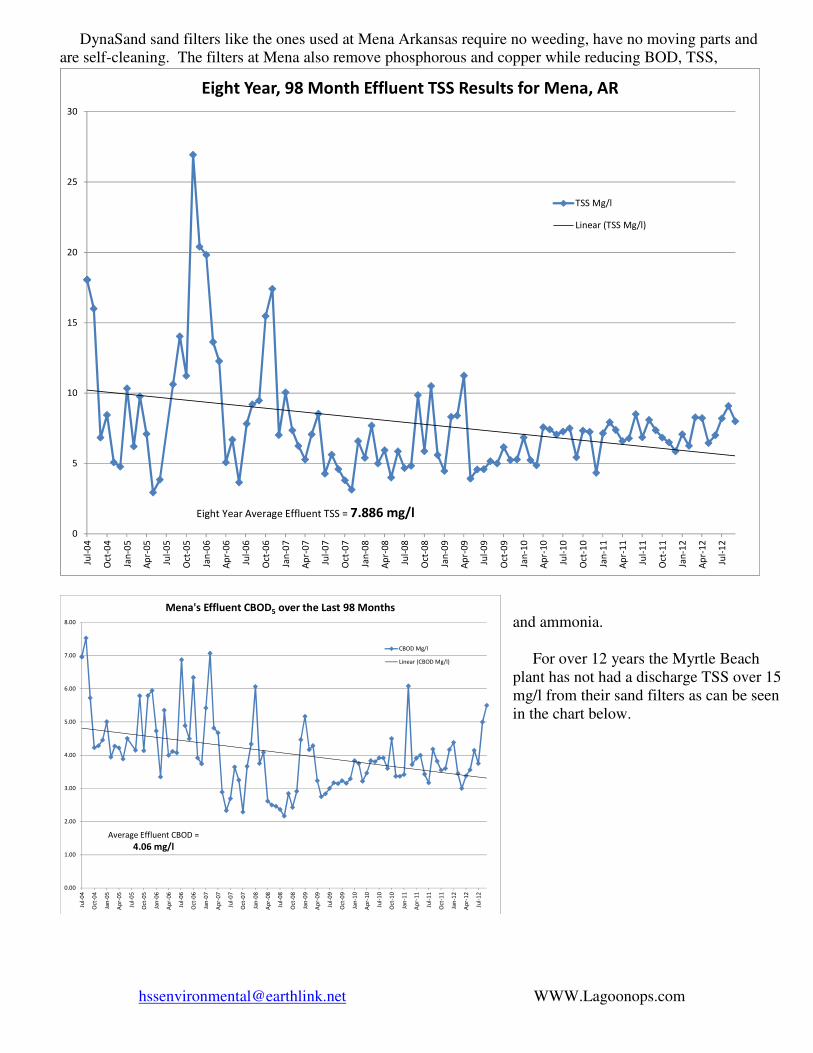
[email protected] WWW.Lagoonops.com
DynaSand sand filters like the ones used at Mena Arkansas require no weeding, have no moving parts and
are self-cleaning. The filters at Mena also remove phosphorous and copper while reducing BOD, TSS,
and ammonia.
For over 12 years the Myrtle Beach
plant has not had a discharge TSS over 15
mg/l from their sand filters as can be seen
in the chart below.
0.00
1.00
2.00
3.00
4.00
5.00
6.00
7.00
8.00
Jul-
04
Oct
-04
Jan
-05
Ap
r-0
5
Jul-
05
Oct
-05
Jan
-06
Ap
r-0
6
Jul-
06
Oct
-06
Jan
-07
Ap
r-0
7
Jul-
07
Oct
-07
Jan
-08
Ap
r-0
8
Jul-
08
Oct
-08
Jan
-09
Ap
r-0
9
Jul-
09
Oct
-09
Jan
-10
Ap
r-1
0
Jul-
10
Oct
-10
Jan
-11
Ap
r-1
1
Jul-
11
Oct
-11
Jan
-12
Ap
r-1
2
Jul-
12
Mena's Effluent CBOD5 over the Last 98 Months
CBOD Mg/l
Linear (CBOD Mg/l)
Average Effluent CBOD =
4.06 mg/l
0
5
10
15
20
25
30
Jul-
04
Oct
-04
Jan
-05
Ap
r-0
5
Jul-
05
Oct
-05
Jan
-06
Ap
r-0
6
Jul-
06
Oct
-06
Jan
-07
Ap
r-0
7
Jul-
07
Oct
-07
Jan
-08
Ap
r-0
8
Jul-
08
Oct
-08
Jan
-09
Ap
r-0
9
Jul-
09
Oct
-09
Jan
-10
Ap
r-1
0
Jul-
10
Oct
-10
Jan
-11
Ap
r-1
1
Jul-
11
Oct
-11
Jan
-12
Ap
r-1
2
Jul-
12
Eight Year, 98 Month Effluent TSS Results for Mena, AR
TSS Mg/l
Linear (TSS Mg/l)
Eight Year Average Effluent TSS = 7.886 mg/l
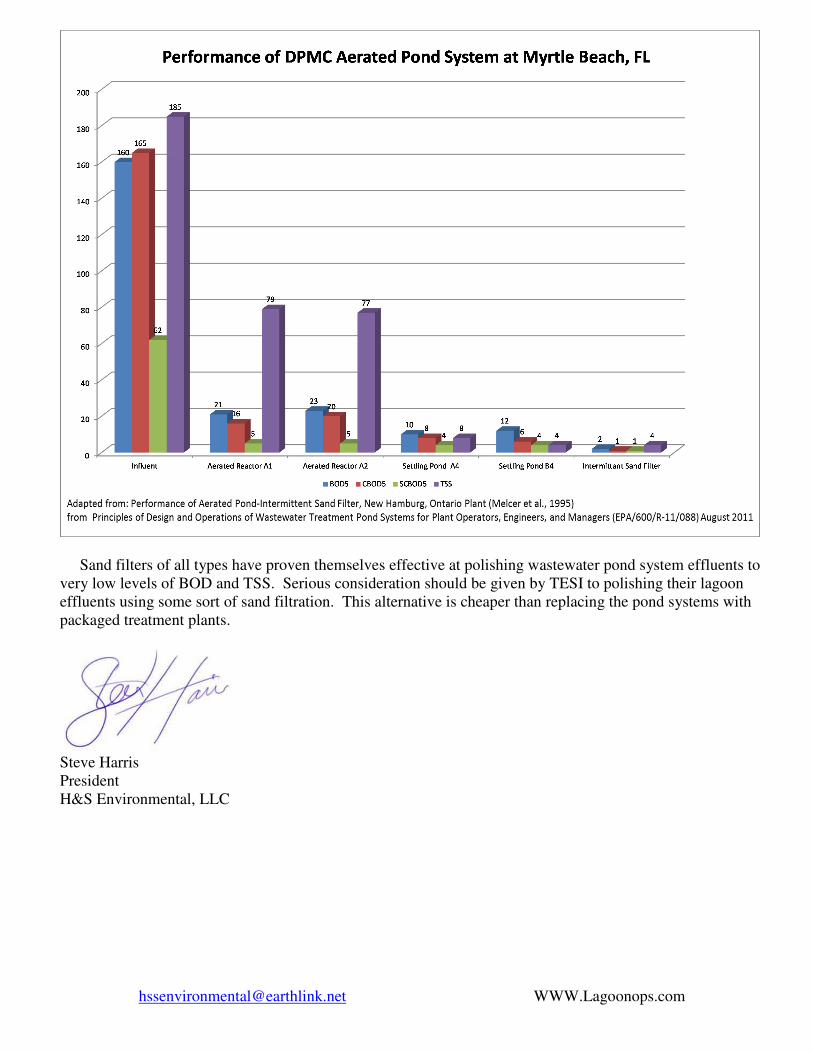
[email protected] WWW.Lagoonops.com
Sand filters of all types have proven themselves effective at polishing wastewater pond system effluents to
very low levels of BOD and TSS. Serious consideration should be given by TESI to polishing their lagoon
effluents using some sort of sand filtration. This alternative is cheaper than replacing the pond systems with
packaged treatment plants.
Steve Harris
President
H&S Environmental, LLC

The effect of aerated rock filter geometry on the rate of nitrogen removal from facultative pond effluents
R. Hamdan1,2 and D. D. Mara1
1 School of Civil Engineering, University of Leeds, Leeds LS2 9JT, UK (E-mail: [email protected] and [email protected]) 2 University Tun Hussein Onn Malaysia, 86400 Batu Pahat, Johor, Malaysia (E-mail: [email protected]) Abstract Rock Filters are an established technology for polishing waste stabilization pond effluents. However, they rapidly become anoxic and consequently do not remove ammonium-nitrogen. Horizontal-flow aerated rock filters (HFARF), developed to permit nitrification and hence ammonium-N removal, were compared with a novel vertical-flow aerated rock filter (VFARF). There were no differences in the removals of BOD5, TSS and TKN, but the VFARF consistently produced effluents with lower ammonium-N concentrations (<0.3 mg N/L) than the HFARF (0.8−1.5 mg N/L).
Keywords Aerated rock filters; ammonium nitrogen; facultative ponds; horizontal flow; vertical flow
INTRODUCTION Rock filters (RF) are a well-established technology for ‘polishing’ maturation pond effluents to provide high-quality effluents in terms of BOD and total suspended solids (TSS) (O’Brien et al., 1973; Martin and Weller, 1973; Swanson and Williamson, 1980; Middlebrooks, 1988, 1995; Saidam et al., 1995; Neder et al., 2002; US EPA, 2002). However, these RF rapidly become anoxic and there is no (or very little) removal of ammonia. To remove ammonia the RF must be aerated and it is better to treat facultative (rather than maturation) pond effluents in aerated RF so as to remove the need for maturation ponds and thus save land; aeration also improves BOD and TSS removals (Johnson 2005; Mara and Johnson and Mara 2006). Johnson and Mara (2007) found that an aerated RF outperformed an unaerated subsurface horizontal-flow constructed wetland (SSHF-CW) and Mara (2006) showed that the combination of a primary facultative pond and an aerated RF produced a better quality effluent, required less land, and was cheaper, than a septic tank and SSHF-CW. [Aeration has also been proposed for SSHF-CW by Davies and Hart (1990), Cottingham et al. (1999), Maltais-Landry et al. (2007) and Ouellet-Plamondon et al. (2007).] In this paper we report results obtained from two pilot-scale aerated RF of very different geometries. Both received the same volumetric hydraulic loading and air flow rates, but one had a depth of 0.5 m (as in the original work by Johnson, 2005) and the other a depth of 2 m. MATERIALS AND METHODS Pilot-scale units The facultative pond was loaded at 80 kg BOD/ha day (Abis and Mara, 2003) using a variable-speed peristaltic pump (Watson Marlow model 505S pump fitted with a model 501RL pump head). A vertical-flow aerated RF (VFARF) and a horizontal-flow aerated RF (HFARF) were operated in parallel at our experimental station at Yorkshire Water’s Wastewater Treatment Works at Esholt, Bradford. The dimensions and operating conditions of the two RF are given in Table 1 and they are shown in Figures 1 and 2.
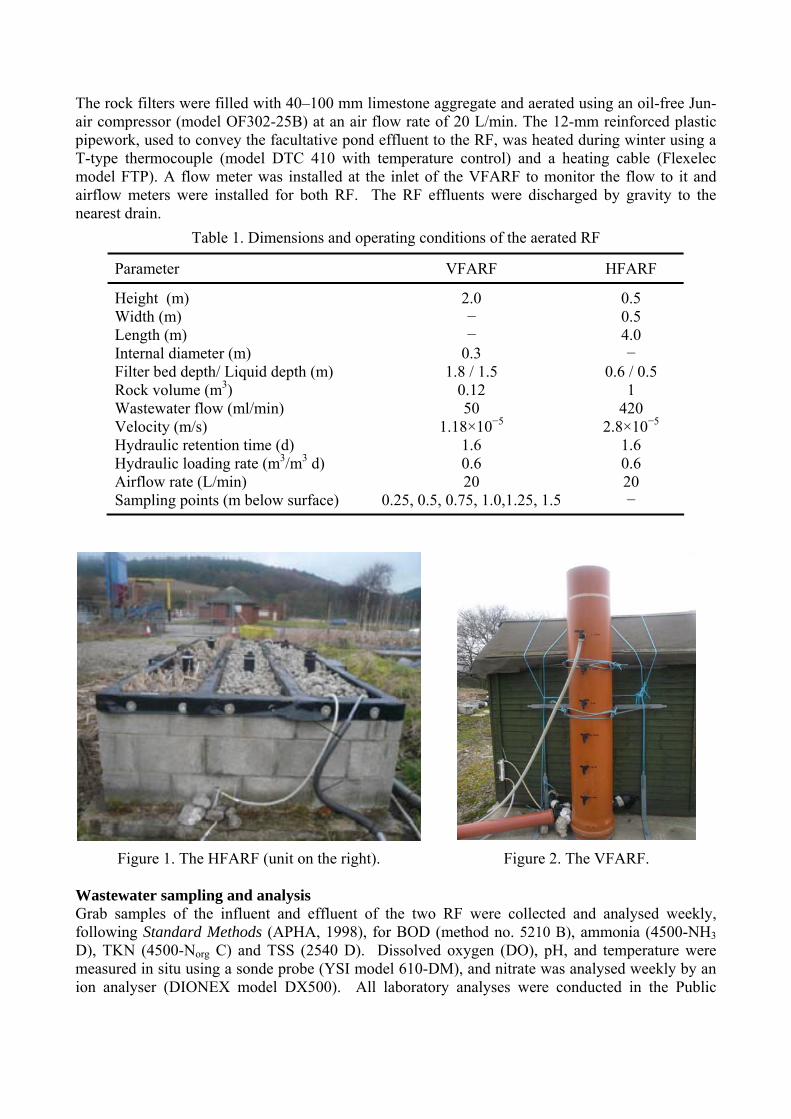
The rock filters were filled with 40–100 mm limestone aggregate and aerated using an oil-free Jun-air compressor (model OF302-25B) at an air flow rate of 20 L/min. The 12-mm reinforced plastic pipework, used to convey the facultative pond effluent to the RF, was heated during winter using a T-type thermocouple (model DTC 410 with temperature control) and a heating cable (Flexelec model FTP). A flow meter was installed at the inlet of the VFARF to monitor the flow to it and airflow meters were installed for both RF. The RF effluents were discharged by gravity to the nearest drain.
Table 1. Dimensions and operating conditions of the aerated RF
Parameter VFARF HFARF
Height (m) 2.0 0.5 Width (m) − 0.5 Length (m) − 4.0 Internal diameter (m) 0.3 − Filter bed depth/ Liquid depth (m) 1.8 / 1.5 0.6 / 0.5 Rock volume (m3) 0.12 1 Wastewater flow (ml/min) 50 420 Velocity (m/s) 1.18×10⁻⁵ 2.8×10⁻⁵ Hydraulic retention time (d) 1.6 1.6 Hydraulic loading rate (m3/m3 d) 0.6 0.6 Airflow rate (L/min) 20 20 Sampling points (m below surface) 0.25, 0.5, 0.75, 1.0,1.25, 1.5 −
Figure 1. The HFARF (unit on the right).
Figure 2. The VFARF. Wastewater sampling and analysis Grab samples of the influent and effluent of the two RF were collected and analysed weekly, following Standard Methods (APHA, 1998), for BOD (method no. 5210 B), ammonia (4500-NH3 D), TKN (4500-Norg C) and TSS (2540 D). Dissolved oxygen (DO), pH, and temperature were measured in situ using a sonde probe (YSI model 610-DM), and nitrate was analysed weekly by an ion analyser (DIONEX model DX500). All laboratory analyses were conducted in the Public

Health Engineering Laboratories, School of Civil Engineering, University of Leeds (16 km from Esholt). RESULTS AND DISCUSSION BOD5 removal Generally BOD5 removal was slightly higher in the VFARF than in the HFARF. The BOD5 removal efficiency of the VFARF varied from 67 to 90% and in the HFARF from 48 to 84%. As shown in Figure 3, the BOD5 concentration in the RF influents was in the range 21–80 mg/L; in the VFARF effluent it was 7−9 mg/L and in the HFARF effluent 9−14 mg/L (these effluent ranges are not significantly different − student t test: p = 0.14). Both effluents complied with the BOD5 requirements of the EU Urban Waste Water Treatment Directive (UWWTD) (Council of the European Communities, 1991).
0102030405060708090
100
Mar-08 Apr-08
BO
D5 C
once
ntra
tion
(mg/
l)
0
10
20
30
40
50
60
70
80
90
100
Rem
oval
Effi
cien
cy (%
)
VF Eff Removal HF Eff Removal EC UWWTD eff limitARFs inf VF eff HFeff
Figure 3. VFARF and HFARF influent and effluent BOD5 concentrations and removal efficiencies. TSS removal Figure 4 shows that the HFARF performed slightly better than the VFARF but the effluent TSS concentrations were not significantly different (t test: p = 0.37); both complied with the requirements of the UWWTD.
0
20
40
60
80
100
120
140
160
Mar-08 Apr-08
TSS
(mg/
l)
0
10
20
30
40
50
60
70
80
90
100
Rem
oval
Effi
cien
cy (%
)
VF Eff Removal HF Eff Removal EC UWWTD eff limitARFs inf VF eff HFeff
Figure 4. VFARF and HFARF influent and effluent TSS concentrations and removal efficiencies.
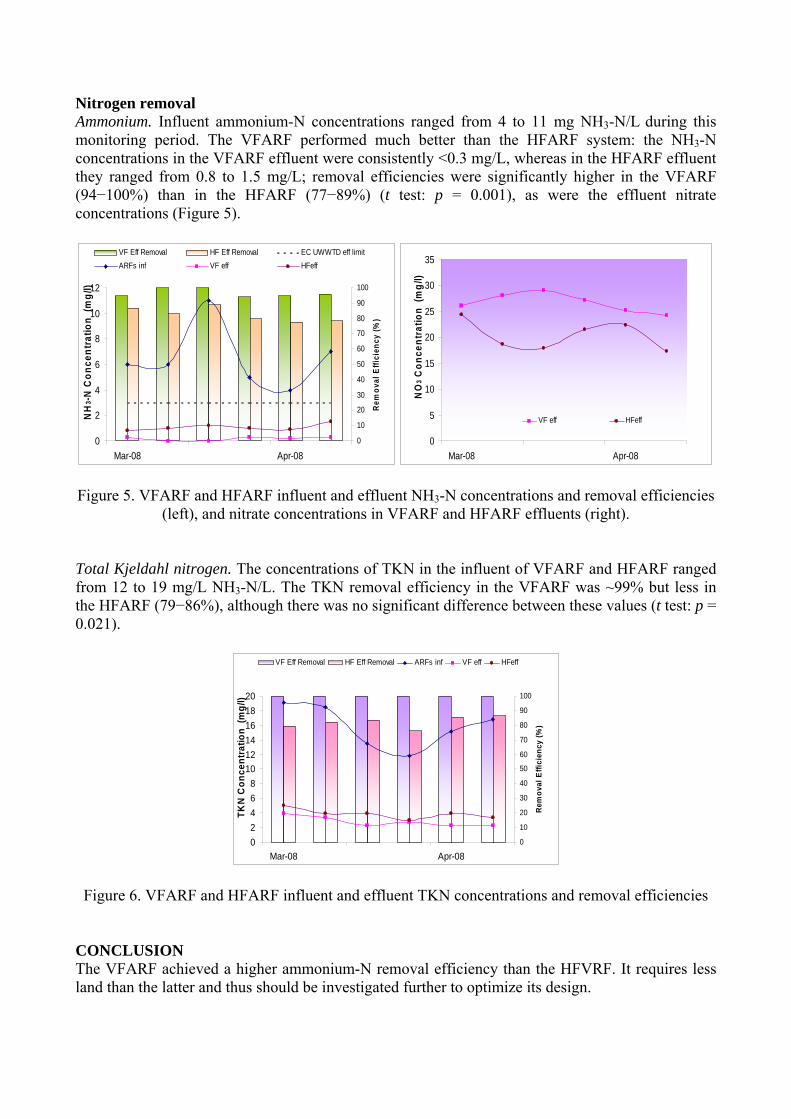
Nitrogen removal Ammonium. Influent ammonium-N concentrations ranged from 4 to 11 mg NH3-N/L during this monitoring period. The VFARF performed much better than the HFARF system: the NH3-N concentrations in the VFARF effluent were consistently <0.3 mg/L, whereas in the HFARF effluent they ranged from 0.8 to 1.5 mg/L; removal efficiencies were significantly higher in the VFARF (94−100%) than in the HFARF (77−89%) (t test: p = 0.001), as were the effluent nitrate concentrations (Figure 5).
0
2
4
6
8
10
12
Mar-08 Apr-08
NH
3 -N C
once
ntra
tion
(mg/
l)
0
10
20
30
40
50
60
70
80
90
100
Rem
oval
Effi
cien
cy (%
)
VF Eff Removal HF Eff Removal EC UWWTD eff limitARFs inf VF eff HFeff
0
5
10
15
20
25
30
35
Mar-08 Apr-08
NO
3 Con
cent
ratio
n (m
g/l)
VF eff HFeff
Figure 5. VFARF and HFARF influent and effluent NH3-N concentrations and removal efficiencies
(left), and nitrate concentrations in VFARF and HFARF effluents (right).
Total Kjeldahl nitrogen. The concentrations of TKN in the influent of VFARF and HFARF ranged from 12 to 19 mg/L NH3-N/L. The TKN removal efficiency in the VFARF was ~99% but less in the HFARF (79−86%), although there was no significant difference between these values (t test: p = 0.021).
02468
101214161820
Mar-08 Apr-08
TKN
Con
cent
ratio
n (m
g/l)
0
10
20
30
40
50
60
70
80
90
100
Rem
oval
Effi
cien
cy (%
)
VF Eff Removal HF Eff Removal ARFs inf VF eff HFeff
Figure 6. VFARF and HFARF influent and effluent TKN concentrations and removal efficiencies
CONCLUSION The VFARF achieved a higher ammonium-N removal efficiency than the HFVRF. It requires less land than the latter and thus should be investigated further to optimize its design.
ACKNOWLEDGEMENTS We wish to acknowledge Yorkshire Water for providing not only the WSP experimental site at Esholt, but also for their almost daily help at the site.
REFERENCES Abis, K. L. and Mara, D. D. (2003). Research on waste stabilisation ponds in the United Kingdom: Initial
results from pilot-scale facultative ponds. Water Science and Technology 48 (2), 1−8. APHA (1998). Standard Methods for the Examination of Water and Wastewater, 20th ed. American Public
Health Association, Washington, DC. Cottingham, P. D., Davies, T. H. and Hart, B. T. (1999). Aeration to promote nitrification in constructed
wetlands. Environmental Technology 20 (1), 69–75. Council of the European Communities (1991). Council Directive 91/271/EEC of 21 May 1991 concerning
urban waste water treatment. Official Journal of the European Communities L135, 40–52 (30 May). Davies, T. H. and Hart, B. T. (1990). Use of aeration to promote nitrification in reed beds treating
wastewater. In Constructed Wetlands in Water Pollution Control (ed. Cooper, P. F. and Findlater, B. C.), pp. 383−389. Pergamon Press, Oxford.
Johnson, M. L. (2005). Aerated rock filters for enhanced ammonia and faecal coliform removal from facultative pond effluents. Journal of the Chartered Institution of Water and Environmental Management 19 (5), 143−146.
Johnson, M. L. and Mara D. D. (2007). Ammonia removal from facultative pond effluents in a constructed wetland and an aerated rock filter: performance comparison in winter and summer. Water Environment Research 79 (5), 567−570.
Maltais-Landry, G., Chazarenc, F., Comeau, Y., Troesch, S. and Brisson, J. (2007). Effects of artificial aeration, macrophyte species, and loading rate on removal efficiency in constructed wetland mesocosms treating fish farm wastewater. Journal of Environmental Engineering and Science 6 (4), 409−414.
Mara, D. D. (2006). Constructed wetlands and waste stabilization ponds for small rural communities in the United Kingdom: a comparison of land area requirements, performance and costs. Environmental Technology 27 (4), 573−757.
Mara, D. D. and Johnson, M. L. (2006). Aerated rock filters for enhanced ammonia and fecal coliform removal from facultative pond effluents. Journal of Environmental Engineering, American Society of Civil Engineers 132 (4), 574−577.
Martin, J. L. and Weller, R. (1973). Removal of Algae from Oxidation Pond Effluent by Upflow Rock Filtration. Department of Civil Engineering, University of Kansas, Lawrence, KS.
Middlebrooks, E. J. (1988). Review of rock filters for the upgrade of lagoon effluents. Journal of the Water Pollution Control Federation 60 (9), 1657−1662.
Middlebrooks, E. J. (1995). Upgrading pond effluents: an overview. Water Science and Technology 31 (12), 353−368.
Neder, K. D., Carneiro, G. A., Queiroz, T. R., and de Souza, M. A. A. (2002). Selection of natural treatment processes for algae removal from stabilisation pond effluents in Brasília, using multi-criterion methods. Water Science and Technology 46 (4−5), 347−354.
O’Brien, W. J.; McKinney, R. E.; Turvey, M. D.; Martin, D. M. (1973) Two methods for algae removal from wastewater stabilization ponds. Water & Sewage Works Journal 120 (3), 66−73.
Ouellet-Plamondon, C., Chazarenc, F., Comeau, Y. and Jacques Brisson, J. (2007). Artificial aeration to increase pollutant removal efficiency of constructed wetlands in cold climate. Ecological Engineering 27 (3), 258–264.
Saidam, M. Y., Ramadan, S. A., and Butler, D. (1995). Upgrading waste stabilization pond effluent by rock filters. Water Science and Technology 31(12), 369−378.
Swanson, G. R., and Williamson, K. J. (1980). Upgrading lagoon effluents with rock filters. Journal of the Environmental Engineering Division, American Society of Civil Engineers 106 (EE6), 1111–1129.
US EPA (2002). Rock Media Polishing Filter for Lagoons (Wastewater Technology Fact Sheet No. EPA 832-F-02-023). Office of Water, US Environmental Protection Agency, Washington, DC.
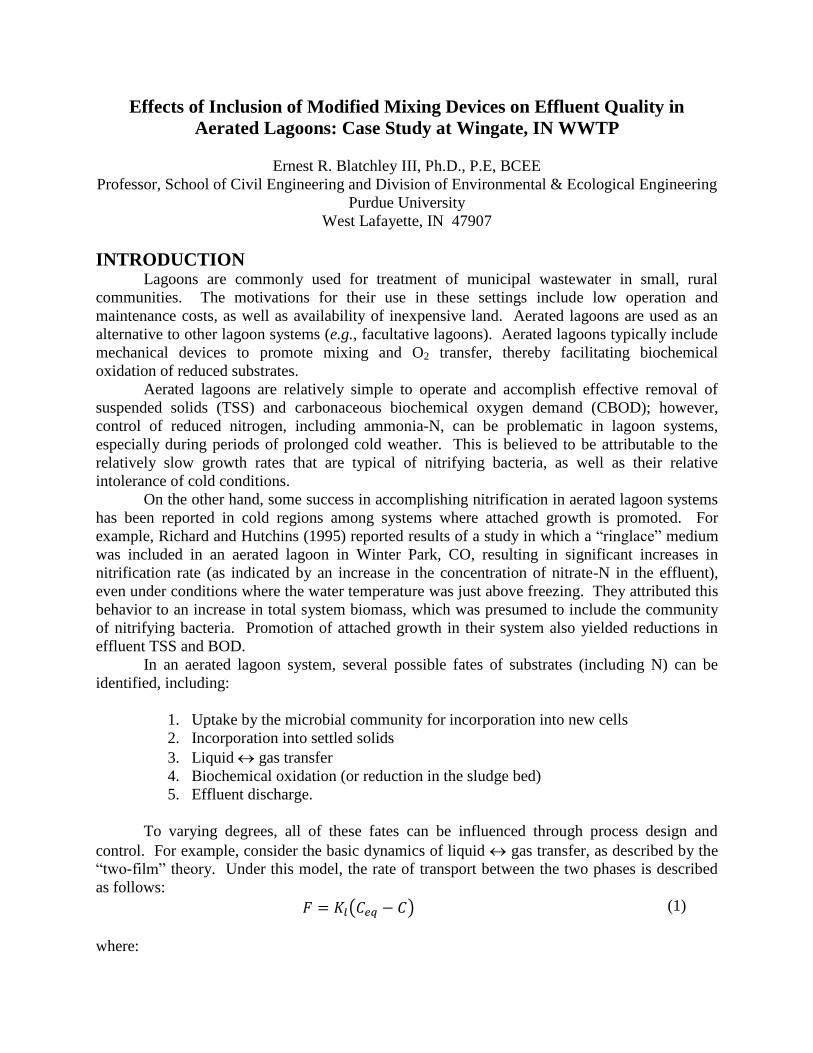
Effects of Inclusion of Modified Mixing Devices on Effluent Quality in
Aerated Lagoons: Case Study at Wingate, IN WWTP
Ernest R. Blatchley III, Ph.D., P.E, BCEE
Professor, School of Civil Engineering and Division of Environmental & Ecological Engineering
Purdue University
West Lafayette, IN 47907
INTRODUCTION Lagoons are commonly used for treatment of municipal wastewater in small, rural
communities. The motivations for their use in these settings include low operation and
maintenance costs, as well as availability of inexpensive land. Aerated lagoons are used as an
alternative to other lagoon systems (e.g., facultative lagoons). Aerated lagoons typically include
mechanical devices to promote mixing and O2 transfer, thereby facilitating biochemical
oxidation of reduced substrates.
Aerated lagoons are relatively simple to operate and accomplish effective removal of
suspended solids (TSS) and carbonaceous biochemical oxygen demand (CBOD); however,
control of reduced nitrogen, including ammonia-N, can be problematic in lagoon systems,
especially during periods of prolonged cold weather. This is believed to be attributable to the
relatively slow growth rates that are typical of nitrifying bacteria, as well as their relative
intolerance of cold conditions.
On the other hand, some success in accomplishing nitrification in aerated lagoon systems
has been reported in cold regions among systems where attached growth is promoted. For
example, Richard and Hutchins (1995) reported results of a study in which a “ringlace” medium
was included in an aerated lagoon in Winter Park, CO, resulting in significant increases in
nitrification rate (as indicated by an increase in the concentration of nitrate-N in the effluent),
even under conditions where the water temperature was just above freezing. They attributed this
behavior to an increase in total system biomass, which was presumed to include the community
of nitrifying bacteria. Promotion of attached growth in their system also yielded reductions in
effluent TSS and BOD.
In an aerated lagoon system, several possible fates of substrates (including N) can be
identified, including:
1. Uptake by the microbial community for incorporation into new cells
2. Incorporation into settled solids
3. Liquid gas transfer
4. Biochemical oxidation (or reduction in the sludge bed)
5. Effluent discharge.
To varying degrees, all of these fates can be influenced through process design and
control. For example, consider the basic dynamics of liquid gas transfer, as described by the
“two-film” theory. Under this model, the rate of transport between the two phases is described
as follows:
( )
(1)
where:

F = net flux of compound between phases
= net mass transport rate of compound between phases, per unit interfacial area
Kl = overall mass transfer coefficient, based on liquid-phase concentration
Ceq = liquid-phase concentration that is in equilibrium with (bulk) gas phase
C = actual liquid-phase concentration.
When C = Ceq, the system is at equilibrium and no net transport will be observed. When C < Ceq,
net transport will be from gas liquid phase. When C > Ceq, the opposite will be true (i.e., net
transport will be from liquid gas phase). In general, the difference between the equilibrium
and actual conditions is used to represent the “driving force” for transport between the two
phases in contact.
Any change to the system that affects one or more terms in this equation can be expected
to also affect the net rate of transport between the gas and liquid phases. For example, the
inclusion of mechanical mixing (normally applied to the liquid phase) is known to decrease
resistance to transport on the liquid side of the gas:liquid interface. For volatile compounds, this
can lead to a substantial increase in the overall mass transfer coefficient. In addition, some
mixing devices can increase the gas:liquid interfacial area, thereby promoting mass transfer.
Independent of mechanical mixing, it is also possible to influence the rate of mass
transport by changing system chemistry, so as to alter the equilibrium condition. For example,
ammonia-N is known to participate in a simple acid-base reaction:
(2)
Like all acid-base reactions, equilibrium conditions for this reaction are established essentially
instantaneously, and are governed by pH. The equilibrium condition for this reaction determines
the fraction of ammonia-N that is present as NH3, as well as the fraction that is present as NH4+.
The equilibrium for this acid-base reaction is defined as follows:
[ ][
]
[ ]
(3)
At T = 20C, the acid-dissociation constant for this reaction has a value of 10-9.3
(Stumm and
Morgan, 1996). Therefore, because NH3 is volatile and NH4+ is not, knowledge of equilibrium
for this reaction provides information about the distribution of ammonia-N, defined as:
[ ] [ ]
(4)
that is present in the volatile form (NH3) and the non-volatile form (NH4+). Figure 1 illustrates
this equilibrium distribution. From this illustration, it is evident that as pH increases to approach
the pKa of equation (3), we should expect the efficiency of removal of ammonia-N from water to
increase, simply because a larger fraction of the ammonia-N will be present in the volatile form,
thereby increasing the “driving force” for liquidgas transfer.
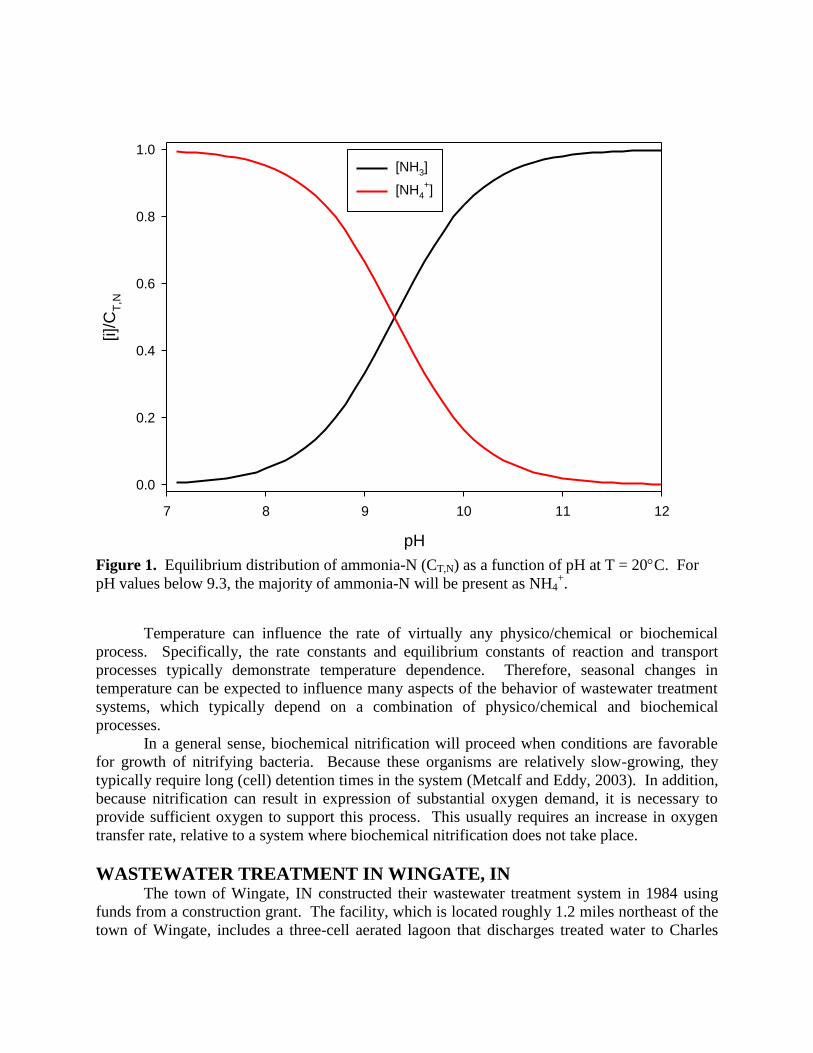
pH
7 8 9 10 11 12
[i]/
CT
,N
0.0
0.2
0.4
0.6
0.8
1.0
[NH3]
[NH4
+]
Figure 1. Equilibrium distribution of ammonia-N (CT,N) as a function of pH at T = 20C. For
pH values below 9.3, the majority of ammonia-N will be present as NH4+.
Temperature can influence the rate of virtually any physico/chemical or biochemical
process. Specifically, the rate constants and equilibrium constants of reaction and transport
processes typically demonstrate temperature dependence. Therefore, seasonal changes in
temperature can be expected to influence many aspects of the behavior of wastewater treatment
systems, which typically depend on a combination of physico/chemical and biochemical
processes.
In a general sense, biochemical nitrification will proceed when conditions are favorable
for growth of nitrifying bacteria. Because these organisms are relatively slow-growing, they
typically require long (cell) detention times in the system (Metcalf and Eddy, 2003). In addition,
because nitrification can result in expression of substantial oxygen demand, it is necessary to
provide sufficient oxygen to support this process. This usually requires an increase in oxygen
transfer rate, relative to a system where biochemical nitrification does not take place.
WASTEWATER TREATMENT IN WINGATE, IN The town of Wingate, IN constructed their wastewater treatment system in 1984 using
funds from a construction grant. The facility, which is located roughly 1.2 miles northeast of the
town of Wingate, includes a three-cell aerated lagoon that discharges treated water to Charles

Ludlow Ditch. The facility receives septic effluent from residential and commercial activities in
Wingate. The Wingate wastewater treatment system was originally configured with two 5-HP
“arrow” mixers in the first lagoon, with one 3-HP mixer in each of the second and third lagoons
(16 HP total). In this configuration, the system accomplished acceptable treatment with respect
to BOD and TSS. However, the performance of the system has been inconsistent or poor with
respect to removal of ammonia-N, particularly during periods of extended cold weather.
Discharge limitations on ammonia-N were included in the Wingate NPDES permit beginning in
the winter of 2011. Therefore, modifications to the system and/or the method of operation will
be required to comply with these pending permit limits.
A conventional approach to this problem involves construction of a “mechanical”
wastewater treatment facility to replace the lagoons. Such a system can accomplish reliable
treatment, such that consistent permit compliance can be accomplished. However, these systems
are more complicated and expensive to operate than lagoons, and the capital costs of such a
system are likely to represent an unacceptable financial burden for the community.
Another option is to alter the lagoon system to improve its performance, particularly as
related to removal of ammonia-N. The specific alteration that is being examined at Wingate is
the inclusion of alternative mixing devices, and inclusion of media to allow for development of
an attached-growth community in the lagoons. This approach is conceptually similar to the
approach reported by Richard and Hutchins (1995). As described previously, such a system
should allow for a substantial increase in the total biomass within the system, possibly including
an increase in the population of nitrifiers. Relative to a conventional mechanical (or “package”)
system, this modification to the existing lagoon system has substantially lower capital costs. In
addition, the basic operation of the lagoon system remains largely unchanged.
To examine the effectiveness of this approach, a long-term experiment was initiated at
the Wingate WWTP as a collaborative effort involving the Town of Wingate; Bradley
Environmental (BE); Commonwealth Biolabs (CB); the Indiana Department of Environmental
Management (IDEM); and Purdue University (School of Civil Engineering). Participation on the
part of Purdue University originally involved Professor M.K. Banks. However, Professor Banks
has left Purdue University and is unable to continue her participation in this project.
PROJECT HISTORY The project was initiated in July 2010 with installation of a single BE 1-HP pump (see
Figure 2) in the third lagoon at the Wingate facility. Data collection was initiated in December
2010, with analyses being performed by CB. In February 2011, six additional BE 1-HP pumps
were installed in the first lagoon. Soon thereafter (February 2011), 1-HP enclosed biochemical
reactors (“BOBBER,” see Figure 3) were installed in each of lagoons 2 and 3 (one each). In
October 2011, the BOBBER in lagoon 3 was moved to lagoon 2, and four additional BOBBERs
were installed.
The 1-HP BE pumps draw water from the lagoon through an 8” port and is discharged
back into the lagoon through an array of radially-oriented PVC pipes (see Figure 2). In lagoon 1,
the six 1-HP BE pumps are distributed roughly uniformly across the surface of the lagoon.
Lagoon 2 is now configured with six BOBBERs, which are also distributed roughly uniformly
across the surface of the lagoon. For these systems, water is again drawn toward the device
through a series of radially-oriented PVC pipes. However, in the BOBBER system the water is
discharged into a 6’-diameter black plastic sphere that contains a medium with a high specific

surface area which provides extensive surface area for development of attached growth within
the system.
Figure 2. Schematic illustration of 1-HP BE mixing devices installed at Wingate WWTP (left);
digital image of 1-HP BE surface mixing device (images provided by Bradley Environmental).
Figure 3. Digital images of BE “BOBBER” devices (photos provided by Bradley
Environmental).
METHODS In addition to routine collection and analysis of samples for monthly reporting of system
operation and performance, sample collection was initiated in December 2010. Effluent samples
from all three lagoons were collected roughly every other week from the Wingate facility and
transported to the CB labs for analysis. Analyses conducted by CB labs included the following:
Ammonia-N: performed by basification of samples to pH > 11 (to convert all ammonia-N
to NH3), followed by analysis with an ammonia-selective electrode. The voltage signal
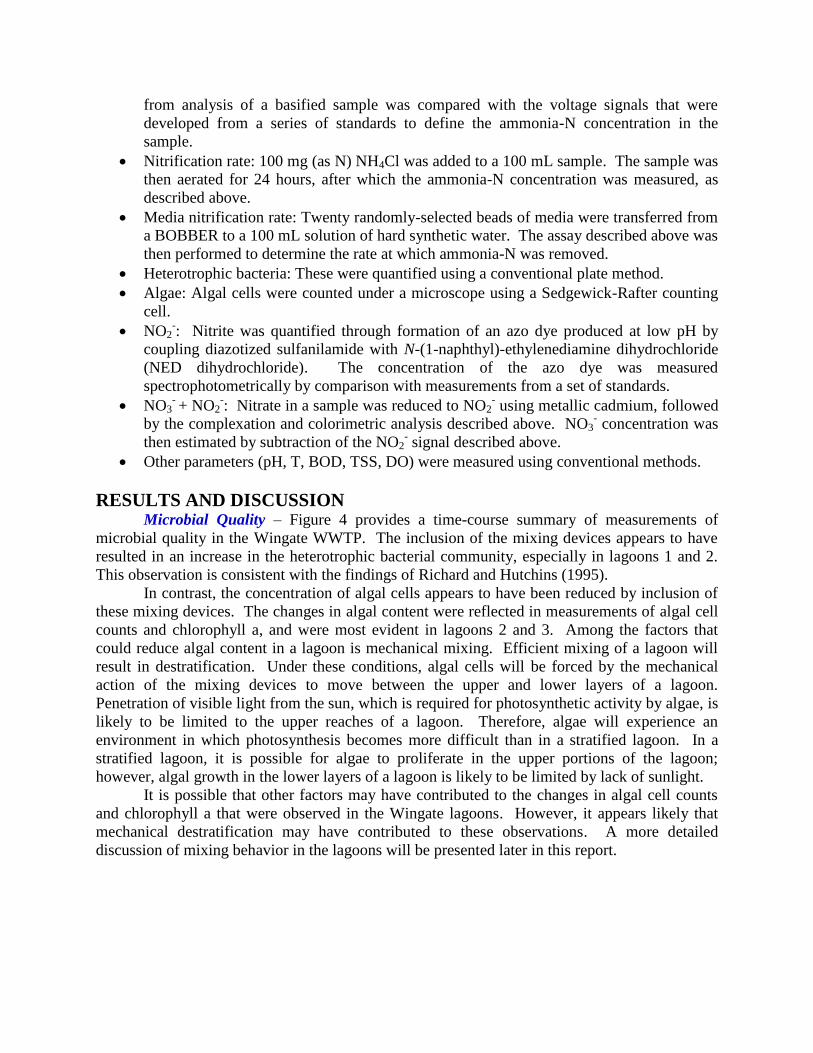
from analysis of a basified sample was compared with the voltage signals that were
developed from a series of standards to define the ammonia-N concentration in the
sample.
Nitrification rate: 100 mg (as N) NH4Cl was added to a 100 mL sample. The sample was
then aerated for 24 hours, after which the ammonia-N concentration was measured, as
described above.
Media nitrification rate: Twenty randomly-selected beads of media were transferred from
a BOBBER to a 100 mL solution of hard synthetic water. The assay described above was
then performed to determine the rate at which ammonia-N was removed.
Heterotrophic bacteria: These were quantified using a conventional plate method.
Algae: Algal cells were counted under a microscope using a Sedgewick-Rafter counting
cell.
NO2-: Nitrite was quantified through formation of an azo dye produced at low pH by
coupling diazotized sulfanilamide with N-(1-naphthyl)-ethylenediamine dihydrochloride
(NED dihydrochloride). The concentration of the azo dye was measured
spectrophotometrically by comparison with measurements from a set of standards.
NO3- + NO2
-: Nitrate in a sample was reduced to NO2
- using metallic cadmium, followed
by the complexation and colorimetric analysis described above. NO3- concentration was
then estimated by subtraction of the NO2- signal described above.
Other parameters (pH, T, BOD, TSS, DO) were measured using conventional methods.
RESULTS AND DISCUSSION Microbial Quality – Figure 4 provides a time-course summary of measurements of
microbial quality in the Wingate WWTP. The inclusion of the mixing devices appears to have
resulted in an increase in the heterotrophic bacterial community, especially in lagoons 1 and 2.
This observation is consistent with the findings of Richard and Hutchins (1995).
In contrast, the concentration of algal cells appears to have been reduced by inclusion of
these mixing devices. The changes in algal content were reflected in measurements of algal cell
counts and chlorophyll a, and were most evident in lagoons 2 and 3. Among the factors that
could reduce algal content in a lagoon is mechanical mixing. Efficient mixing of a lagoon will
result in destratification. Under these conditions, algal cells will be forced by the mechanical
action of the mixing devices to move between the upper and lower layers of a lagoon.
Penetration of visible light from the sun, which is required for photosynthetic activity by algae, is
likely to be limited to the upper reaches of a lagoon. Therefore, algae will experience an
environment in which photosynthesis becomes more difficult than in a stratified lagoon. In a
stratified lagoon, it is possible for algae to proliferate in the upper portions of the lagoon;
however, algal growth in the lower layers of a lagoon is likely to be limited by lack of sunlight.
It is possible that other factors may have contributed to the changes in algal cell counts
and chlorophyll a that were observed in the Wingate lagoons. However, it appears likely that
mechanical destratification may have contributed to these observations. A more detailed
discussion of mixing behavior in the lagoons will be presented later in this report.

12/01/2010
03/01/2011
06/01/2011
09/01/2011
12/01/2011
03/01/2012
Hete
rotr
ophic
Bacte
ria (
cfu
/mL)
100
1000
10000
100000
Lagoon 1 Effluent
Lagoon 2 Effluent
Lagoon 3 Effluent
Process Changes
12/01/2010
03/01/2011
06/01/2011
09/01/2011
12/01/2011
03/01/2012
Alg
al C
ells
(cells
/mL)
10
100
1000
Date
12/01/2010
03/01/2011
06/01/2011
09/01/2011
12/01/2011
03/01/2012
Chlo
rophyll
a
0
1
2
3
4
5
Figure 4. Time-course measurements of microbial quality in effluent samples from the three
lagoons at the Wingate WWTP. For each panel, the vertical dashed lines indicate the last three
modifications to the system. Top panel represents measurements of heterotrophic bacteria;
center panel represents algal cell counts; bottom panel illustrates measurements of chlorophyll a.

Alkalinity and pH – These two parameters are intimately linked to each other, and to the
fundamental biochemistry of the lagoons. In a broad sense, many processes will influence
(carbonate) alkalinity and pH in an aerated lagoon system. However, three important processes
will include oxidation of carbonaceous BOD, oxidation of nitrogenous BOD, and photosynthesis.
Biochemically-mediated oxidation of carbonaceous substrates will involve a wide array
of compounds. Using a simple carbohydrate as an example of a carbonaceous substrate, the role
of inorganic carbon in this process can be illustrated:
(5)
In this reaction, aerobic microorganisms combine a carbohydrate and oxygen to yield CO2 and
H2O as a means of gaining access to chemical energy.
The expression of NBOD involves a community of microbes that participate in a
symbiotic process to oxidize ammonia-N to nitrate, with nitrite as an intermediate:
→
(6)
→
(7)
(8)
The Nitroso bacteria may include species such as Nitrosomonas or Nitrosococcus, while the
Nitro bacteria that participate in this process may include Nitrobacter or Nitrospira (Metcalf and
Eddy, 2003). In addition to oxidation of reduced substrates, both of these processes also result in
“consumption” of alkalinity, either through production of CO2 (which functions as an acid) or
through the direct production of H+.
In many respects, photosynthesis opposes these oxidation processes, or works to
complete the elemental cycles of carbon, oxygen, and nitrogen. The following expression is
representative of the stoichiometry of photosynthesis:
(9)
In this process, energy in the form of visible radiation (usually from the sun) will drive the
photosynthetic process to yield carbohydrates and molecular oxygen as products. In addition,
inorganic carbon in the form of CO2 is “consumed” in this process, thereby reducing the acidity
of the solution.
Given the complexity of the microbial community and the soluble substrates in a system
such as an aerated lagoon, it is likely that other processes will influence alkalinity and pH.
However, the processes listed above (and their analogs) are likely to be important contributors to
the overall behavior of alkalinity and pH. Therefore, changes in the lagoon environment that
alter the microbial population, particularly as related to the organisms that are responsible for
BOD expression and photosynthesis, can be expected to influence lagoon alkalinity and pH.
Figure 5 illustrates the time-course behavior of alkalinity in the Wingate lagoons. In the
12-month period preceding the completion of the modifications to the lagoons, a cycle of
alkalinity was evident, whereby alkalinity was generally lowest in mid-summer, and highest in
fall and winter. Inclusion of the entire mixing system at Wingate appears to have resulted in a
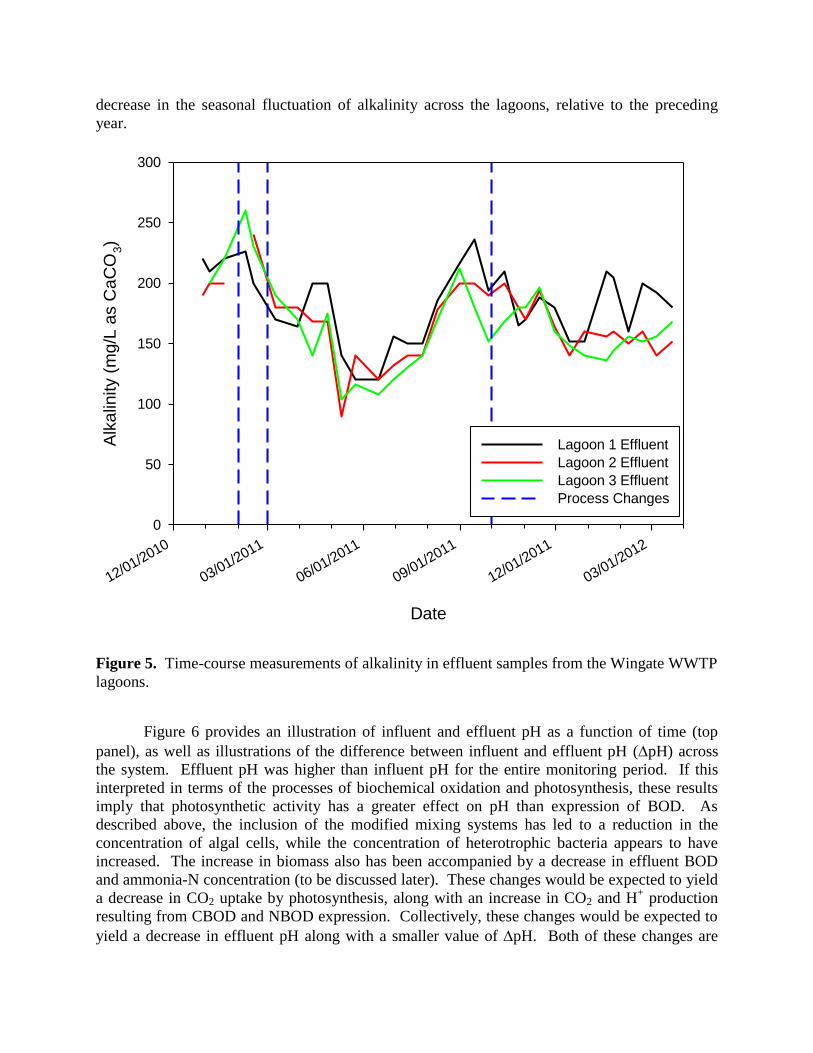
decrease in the seasonal fluctuation of alkalinity across the lagoons, relative to the preceding
year.
Date
12/01/2010
03/01/2011
06/01/2011
09/01/2011
12/01/2011
03/01/2012
Alk
alin
ity (
mg/L
as C
aC
O3)
0
50
100
150
200
250
300
Lagoon 1 Effluent
Lagoon 2 Effluent
Lagoon 3 Effluent
Process Changes
Figure 5. Time-course measurements of alkalinity in effluent samples from the Wingate WWTP
lagoons.
Figure 6 provides an illustration of influent and effluent pH as a function of time (top
panel), as well as illustrations of the difference between influent and effluent pH (pH) across
the system. Effluent pH was higher than influent pH for the entire monitoring period. If this
interpreted in terms of the processes of biochemical oxidation and photosynthesis, these results
imply that photosynthetic activity has a greater effect on pH than expression of BOD. As
described above, the inclusion of the modified mixing systems has led to a reduction in the
concentration of algal cells, while the concentration of heterotrophic bacteria appears to have
increased. The increase in biomass also has been accompanied by a decrease in effluent BOD
and ammonia-N concentration (to be discussed later). These changes would be expected to yield
a decrease in CO2 uptake by photosynthesis, along with an increase in CO2 and H+ production
resulting from CBOD and NBOD expression. Collectively, these changes would be expected to
yield a decrease in effluent pH along with a smaller value of pH. Both of these changes are

evident in the pattern of data illustrated in Figure 4, particularly for the period since October
2011. However, it is important to recognize that the full configuration of the lagoons with all
mixers operating has only been in place for roughly 6 months, and as such it is not possible to
define the behavior of this system in terms of an annual cycle.
Date
1/1/2010
4/1/2010
7/1/2010
10/1/2010
1/1/2011
4/1/2011
7/1/2011
10/1/2011
1/1/2012
4/1/2012
pH
7.0
7.5
8.0
8.5
9.0
Influent
Effluent
Process Changes
Date
01/01/2010
04/01/2010
07/01/2010
10/01/2010
01/01/2011
04/01/2011
07/01/2011
10/01/2011
01/01/2012
04/01/2012
p
H
0.0
0.2
0.4
0.6
0.8
1.0
1.2
1.4
Figure 6. Time-course measurements of influent and effluent pH at the Wingate WWTP (top
panel). Bottom panel illustrates difference between influent and effluent pH (pH) as a function
of time.
The behavior of the bacteria that are responsible for nitrification is known to be related to
pH. Specifically, pH is known to influence nitrifier activity via changes in the form and
availability of inorganic carbon, activation or deactivation of nitrifying bacteria, and inhibition
by formation of NH3 or HNO2. Villaverde et al. (1997) examined nitrifier activity in an
attached-growth system and found that the optimum pH for ammonia-oxidizing bacteria was
near pH = 8.2 (see Figure 7, left). This observation was consistent with earlier findings of
Alleman (1984). Villaverde et al. (1997) also observed that free ammonia (NH3) inhibits the
activity of nitrite-oxidizing bacteria (see Figure 7, right).
Figure 7. Observations of the effect of pH on activity of nitrifying bacteria (from Villaverde et
al., 1997). Left panel illustrates activity of Nitrosomonas spp. as a function of pH. Right panel
illustrates accumulation of NH3-N as a function of pH (left vertical axis) as well as accumulation
of NO2--N as a function of pH (right vertical axis).
Nitrogen – A primary objective of this project was to examine the ability of the process
modifications to improve removal of ammonia-N. Figure 8 illustrates influent and effluent
ammonia-N as a function of time. The inclusion of the complete set of mixing devices, which
was completed in October of 2011, appears to have resulted in improved removal of ammonia-N
form the lagoons in winter.
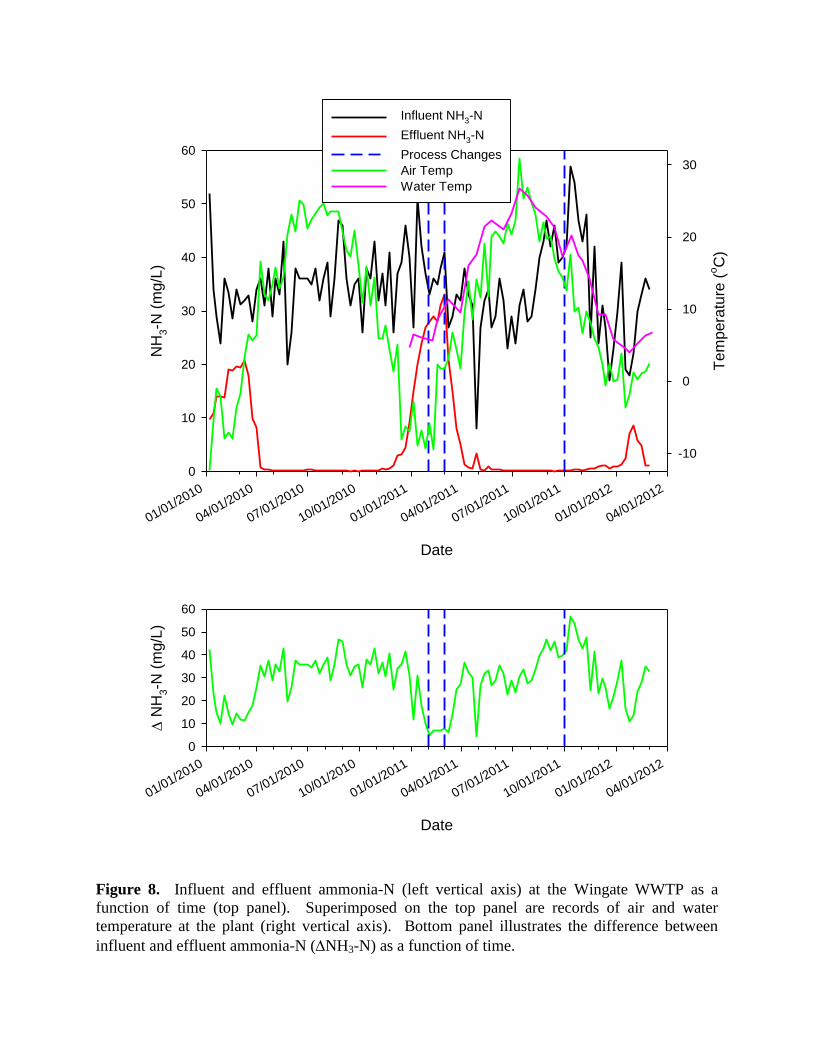
Date
01/01/2010
04/01/2010
07/01/2010
10/01/2010
01/01/2011
04/01/2011
07/01/2011
10/01/2011
01/01/2012
04/01/2012
NH
3-N
(m
g/L
)
0
10
20
30
40
50
60
Tem
pera
ture
(oC
)
-10
0
10
20
30
Influent NH3-N
Effluent NH3-N
Process Changes
Air Temp
Water Temp
Date
01/01/2010
04/01/2010
07/01/2010
10/01/2010
01/01/2011
04/01/2011
07/01/2011
10/01/2011
01/01/2012
04/01/2012
N
H3-N
(m
g/L
)
0
10
20
30
40
50
60
Figure 8. Influent and effluent ammonia-N (left vertical axis) at the Wingate WWTP as a
function of time (top panel). Superimposed on the top panel are records of air and water
temperature at the plant (right vertical axis). Bottom panel illustrates the difference between
influent and effluent ammonia-N (NH3-N) as a function of time.

The results of these measurements are in qualitative agreement with the report of
Richards and Hutchins (1995), in that promotion of attached-growth and an overall increase in
biomass within the system appears to have yielded improvement in removal of ammonia-N from
the system.
Also included in Figure 8 (top panel) are measurements of air and water temperature at
the Wingate facility. These measurements are included in this graph because the behavior of
nitrifying bacteria is known to be adversely affected by cold temperature. The bottom panel of
Figure 8 illustrates the change in ammonia-N concentration (NH3-N) as a function of time.
There is considerable variability in this signal, but a clear seasonal pattern is evident, whereby
removal of ammonia-N diminished during the winter months. This pattern generally holds
across the entire data set, but the reduction in ammonia-N removal was less pronounced in winter
2011-2012 than in previous years.
It is important to recognize that the winter of 2011-2012 was unusually mild in central
Indiana, in terms of air temperature. On the other hand, water temperature at the Wingate
facility during the winter of 2011-2012 was similar to water temperature in the preceding winter
season, yet removal ammonia was improved in winter 2011-2012 relative to previous years.
One other issue to consider regarding the temperature signals is heat transfer. The
physics of heat transfer are similar to those of mass or momentum transfer. Systems that
increase mass transfer (e.g., by improved mixing) are likely to increase heat (and momentum)
transfer. In a general sense, the dynamics of heat transfer between air and (liquid) water can be
described mathematically by a relationship of the following form:
( )
(10)
where,
FH = flux of heat between air and water
= rate of heat transfer from air to water per unit air:water interfacial area
KH = overall heat transfer coefficient
Tair = air temperature
Twater = water temperature.
In general, the rate of heat transfer between phases will be determined by the product of
the interfacial contact area, the heat transfer coefficient, and the difference between air and water
temperatures. The mixing systems included at the Wingate facility almost certainly increased the
interfacial contact area between air and water, as well as the heat transfer coefficient (because of
improved mixing). Interestingly, water temperature during winter 2011-2012 was similar to the
water temperature during winter 2010-2011, despite the fact that air temperatures during winter
2010-2011 were substantially lower. In other words, the driving force for heat transfer (T) was
smaller in winter 2011-2012. This suggests that heat transfer was improved by the new mixing
devices. If this is true, then it is possible that water temperature could be substantially reduced
by the system during a period of prolonged cold weather, as is common in central Indiana
winters. It is not clear how this may affect performance of the system with respect to
nitrification (or other aspects of treatment), but this is an issue that should be monitored in the
future.
Figure 9 illustrates the time-course behavior of ammonia-N (top), nitrite (center), and
nitrate in effluent samples from the three lagoons at Wingate. Ammonia-N was removed in all
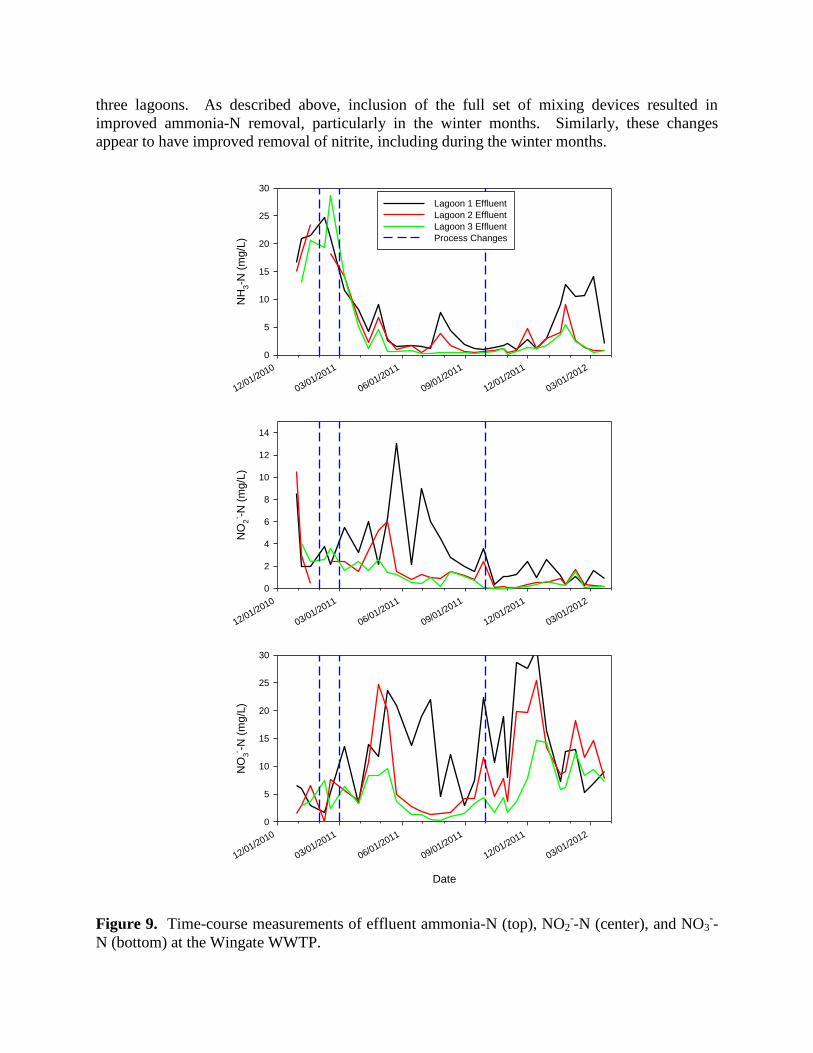
three lagoons. As described above, inclusion of the full set of mixing devices resulted in
improved ammonia-N removal, particularly in the winter months. Similarly, these changes
appear to have improved removal of nitrite, including during the winter months.
12/01/2010
03/01/2011
06/01/2011
09/01/2011
12/01/2011
03/01/2012
NH
3-N
(m
g/L
)
0
5
10
15
20
25
30
Lagoon 1 Effluent
Lagoon 2 Effluent
Lagoon 3 Effluent
Process Changes
12/01/2010
03/01/2011
06/01/2011
09/01/2011
12/01/2011
03/01/2012
NO
2
- -N (
mg/L
)
0
2
4
6
8
10
12
14
Date
12/01/2010
03/01/2011
06/01/2011
09/01/2011
12/01/2011
03/01/2012
NO
3
- -N (
mg/L
)
0
5
10
15
20
25
30
Figure 9. Time-course measurements of effluent ammonia-N (top), NO2--N (center), and NO3
--
N (bottom) at the Wingate WWTP.
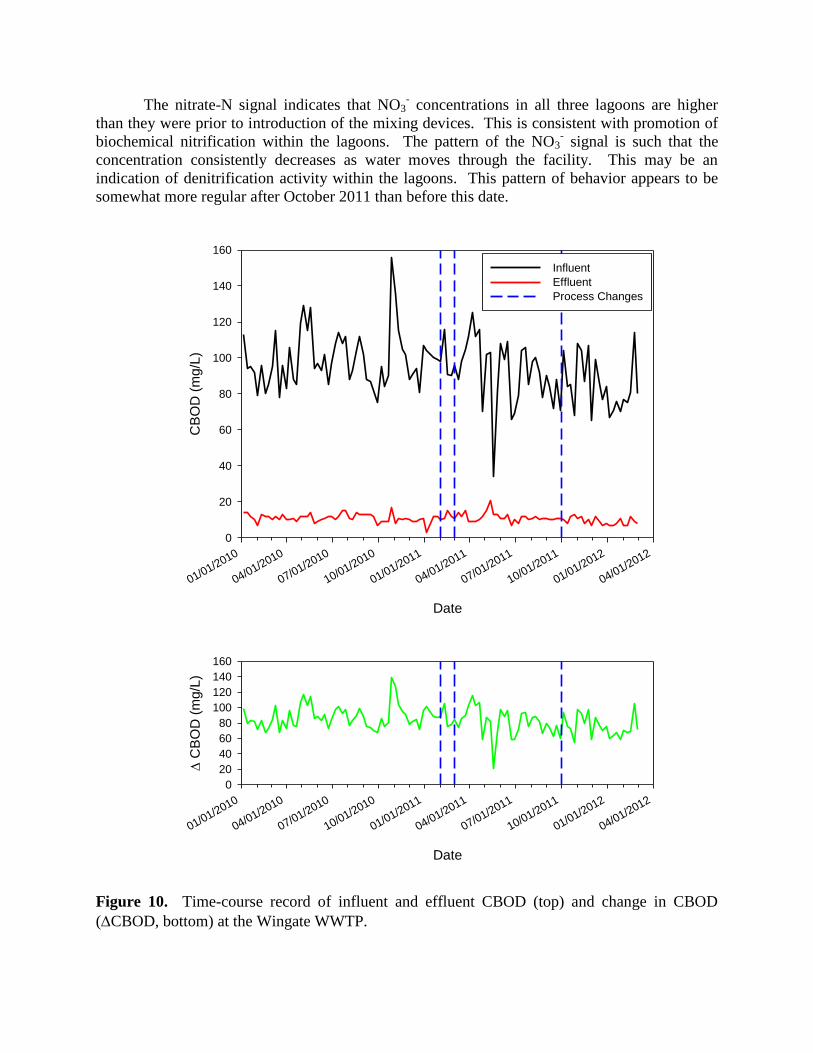
The nitrate-N signal indicates that NO3- concentrations in all three lagoons are higher
than they were prior to introduction of the mixing devices. This is consistent with promotion of
biochemical nitrification within the lagoons. The pattern of the NO3- signal is such that the
concentration consistently decreases as water moves through the facility. This may be an
indication of denitrification activity within the lagoons. This pattern of behavior appears to be
somewhat more regular after October 2011 than before this date.
Date
01/01/2010
04/01/2010
07/01/2010
10/01/2010
01/01/2011
04/01/2011
07/01/2011
10/01/2011
01/01/2012
04/01/2012
CB
OD
(m
g/L
)
0
20
40
60
80
100
120
140
160
Influent
Effluent
Process Changes
Date
01/01/2010
04/01/2010
07/01/2010
10/01/2010
01/01/2011
04/01/2011
07/01/2011
10/01/2011
01/01/2012
04/01/2012
C
BO
D (
mg/L
)
0
20
40
60
80
100
120
140
160
Figure 10. Time-course record of influent and effluent CBOD (top) and change in CBOD
(CBOD, bottom) at the Wingate WWTP.
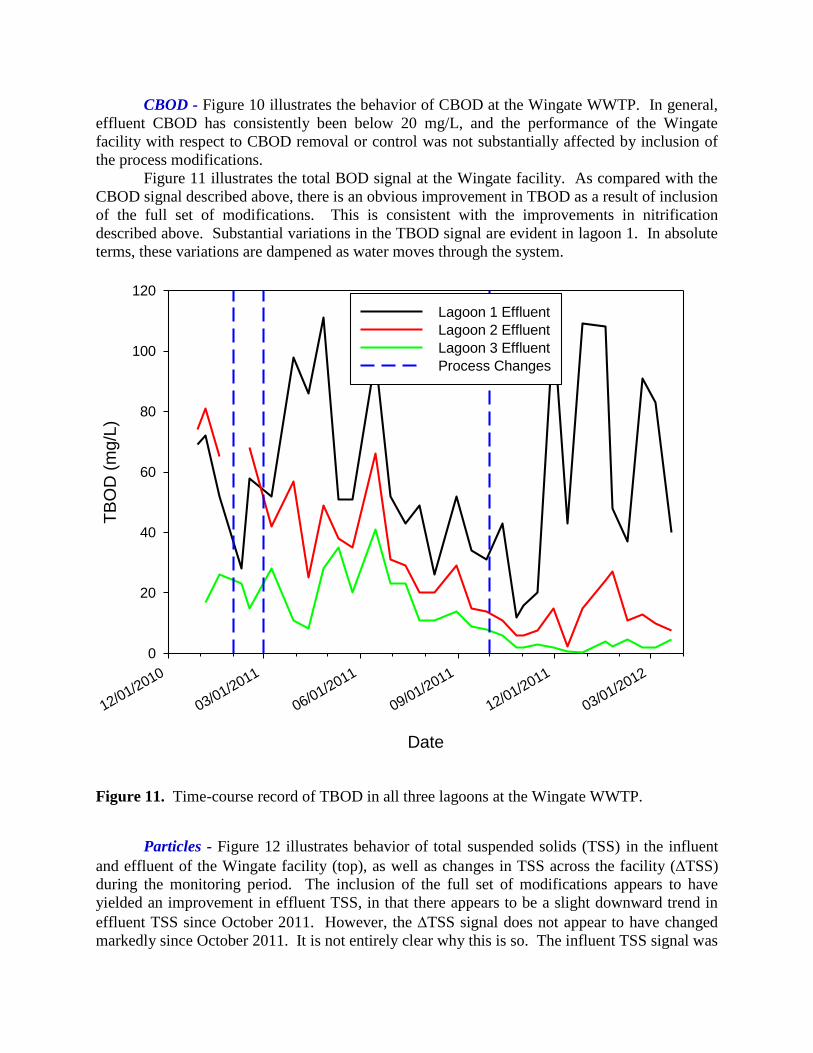
CBOD - Figure 10 illustrates the behavior of CBOD at the Wingate WWTP. In general,
effluent CBOD has consistently been below 20 mg/L, and the performance of the Wingate
facility with respect to CBOD removal or control was not substantially affected by inclusion of
the process modifications.
Figure 11 illustrates the total BOD signal at the Wingate facility. As compared with the
CBOD signal described above, there is an obvious improvement in TBOD as a result of inclusion
of the full set of modifications. This is consistent with the improvements in nitrification
described above. Substantial variations in the TBOD signal are evident in lagoon 1. In absolute
terms, these variations are dampened as water moves through the system.
Date
12/01/2010
03/01/2011
06/01/2011
09/01/2011
12/01/2011
03/01/2012
TB
OD
(m
g/L
)
0
20
40
60
80
100
120
Lagoon 1 Effluent
Lagoon 2 Effluent
Lagoon 3 Effluent
Process Changes
Figure 11. Time-course record of TBOD in all three lagoons at the Wingate WWTP.
Particles - Figure 12 illustrates behavior of total suspended solids (TSS) in the influent
and effluent of the Wingate facility (top), as well as changes in TSS across the facility (TSS)
during the monitoring period. The inclusion of the full set of modifications appears to have
yielded an improvement in effluent TSS, in that there appears to be a slight downward trend in
effluent TSS since October 2011. However, the TSS signal does not appear to have changed
markedly since October 2011. It is not entirely clear why this is so. The influent TSS signal was

quite variable in samples collected after October 2011, but within this variable signal there
appears to be a slight downward trend in influent TSS. With the relatively long residence time
that characterizes the Wingate lagoons, it is reasonable to expect some dampening of the TSS
signal by simple equalization. It is difficult to conclude from this data set that any significant
improvement in TSS removal can be ascribed to the process modifications.
Date
01/01/2010
04/01/2010
07/01/2010
10/01/2010
01/01/2011
04/01/2011
07/01/2011
10/01/2011
01/01/2012
04/01/2012
TS
S (
mg/L
)
0
20
40
60
80
100
Influent
Effluent
Process Changes
Date
01/01/2010
04/01/2010
07/01/2010
10/01/2010
01/01/2011
04/01/2011
07/01/2011
10/01/2011
01/01/2012
04/01/2012
T
SS
(m
g/L
)
0
20
40
60
80
100
Figure 12. Time-course record of influent and effluent TSS at the Wingate WWTP (top) and
changes in TSS (TSS) across the Wingate facility (bottom).
Figure 13 provides a more comprehensive summary of the behavior of suspended
particles at the Wingate facility. The data presented in Figure 13, in which suspended particles
are characterized by measures of TSS (top panel), settleable solids (center panel), and turbidity
(bottom panel), indicate improved particle removal as a result of inclusion of the process
modifications. These observations are consistent with those reported by Richard and Hutchins
(1995).
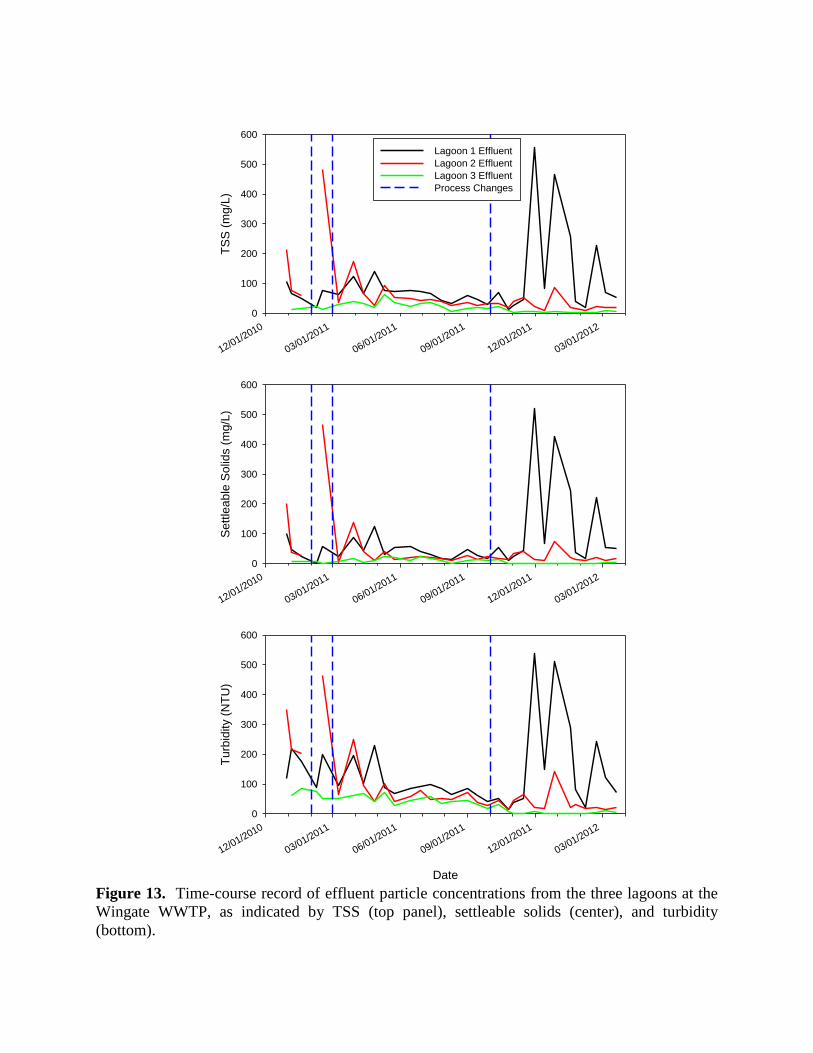
12/01/2010
03/01/2011
06/01/2011
09/01/2011
12/01/2011
03/01/2012
TS
S (
mg/L
)
0
100
200
300
400
500
600
Lagoon 1 Effluent
Lagoon 2 Effluent
Lagoon 3 Effluent
Process Changes
12/01/2010
03/01/2011
06/01/2011
09/01/2011
12/01/2011
03/01/2012
Se
ttle
ab
le S
olid
s (
mg/L
)
0
100
200
300
400
500
600
Date
12/01/2010
03/01/2011
06/01/2011
09/01/2011
12/01/2011
03/01/2012
Tu
rbid
ity (
NT
U)
0
100
200
300
400
500
600
Figure 13. Time-course record of effluent particle concentrations from the three lagoons at the
Wingate WWTP, as indicated by TSS (top panel), settleable solids (center), and turbidity
(bottom).

Sludge Blanket Depth - Collectively, the improvements in NBOD removal and
suspended solids removal imply that sludge production within the Wingate facility should
increase as a result of inclusion of the process modifications. Figure 14 provides a summary of
sludge depth measurements that have been performed periodically at the Wingate WWTP
roughly once per month, beginning in May 2011. No obvious trend of increasing sludge depth is
evident from these measurements. Therefore, if changes in sludge accumulation in the Wingate
facility do result from the process changes, it appears that these will be evident on a longer time-
scale than is illustrated in Figure 14.

Lagoon 1
Date
5/1/2011 7/1/2011 9/1/2011 11/1/2011 1/1/2012 3/1/2012
Slu
dge D
epth
(in
ches)
0
10
20
30
40
50
60
Location A
Location B
Location C
Process Changes
Lagoon 2
Date
5/1/2011 7/1/2011 9/1/2011 11/1/2011 1/1/2012 3/1/2012
Slu
dge D
epth
(in
ches)
0
10
20
30
40
50
60
Location A
Location B
Location C
Process Changes
Lagoon 3
Date
5/1/2011 7/1/2011 9/1/2011 11/1/2011 1/1/2012 3/1/2012
Slu
dge D
epth
(in
ches)
0
10
20
30
40
50
60
Location A
Location B
Location C
Process Changes
Figure 14. Time-course measurements of sludge depth in the lagoons at the Wingate WWTP:
lagoon 1 (top), lagoon 2 (center), lagoon 3 (bottom).
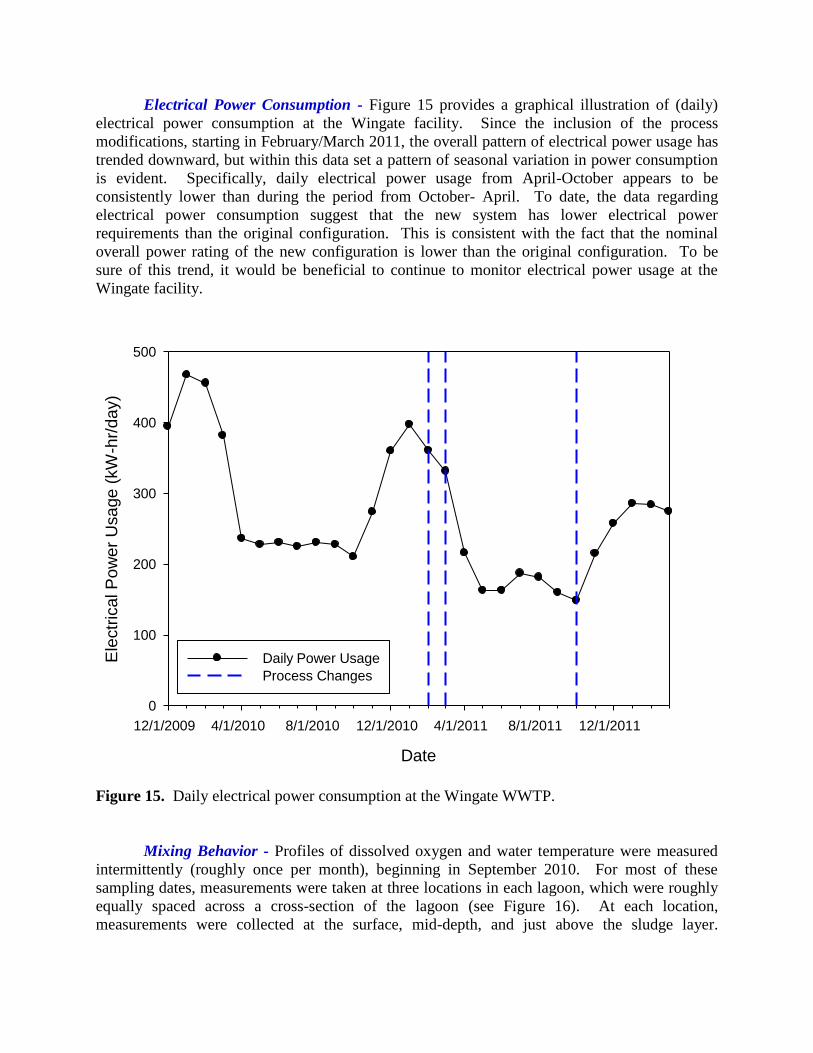
Electrical Power Consumption - Figure 15 provides a graphical illustration of (daily)
electrical power consumption at the Wingate facility. Since the inclusion of the process
modifications, starting in February/March 2011, the overall pattern of electrical power usage has
trended downward, but within this data set a pattern of seasonal variation in power consumption
is evident. Specifically, daily electrical power usage from April-October appears to be
consistently lower than during the period from October- April. To date, the data regarding
electrical power consumption suggest that the new system has lower electrical power
requirements than the original configuration. This is consistent with the fact that the nominal
overall power rating of the new configuration is lower than the original configuration. To be
sure of this trend, it would be beneficial to continue to monitor electrical power usage at the
Wingate facility.
Date
12/1/2009 4/1/2010 8/1/2010 12/1/2010 4/1/2011 8/1/2011 12/1/2011
Ele
ctr
ica
l P
ow
er
Usa
ge
(kW
-hr/
da
y)
0
100
200
300
400
500
Daily Power Usage
Process Changes
Figure 15. Daily electrical power consumption at the Wingate WWTP.
Mixing Behavior - Profiles of dissolved oxygen and water temperature were measured
intermittently (roughly once per month), beginning in September 2010. For most of these
sampling dates, measurements were taken at three locations in each lagoon, which were roughly
equally spaced across a cross-section of the lagoon (see Figure 16). At each location,
measurements were collected at the surface, mid-depth, and just above the sludge layer.
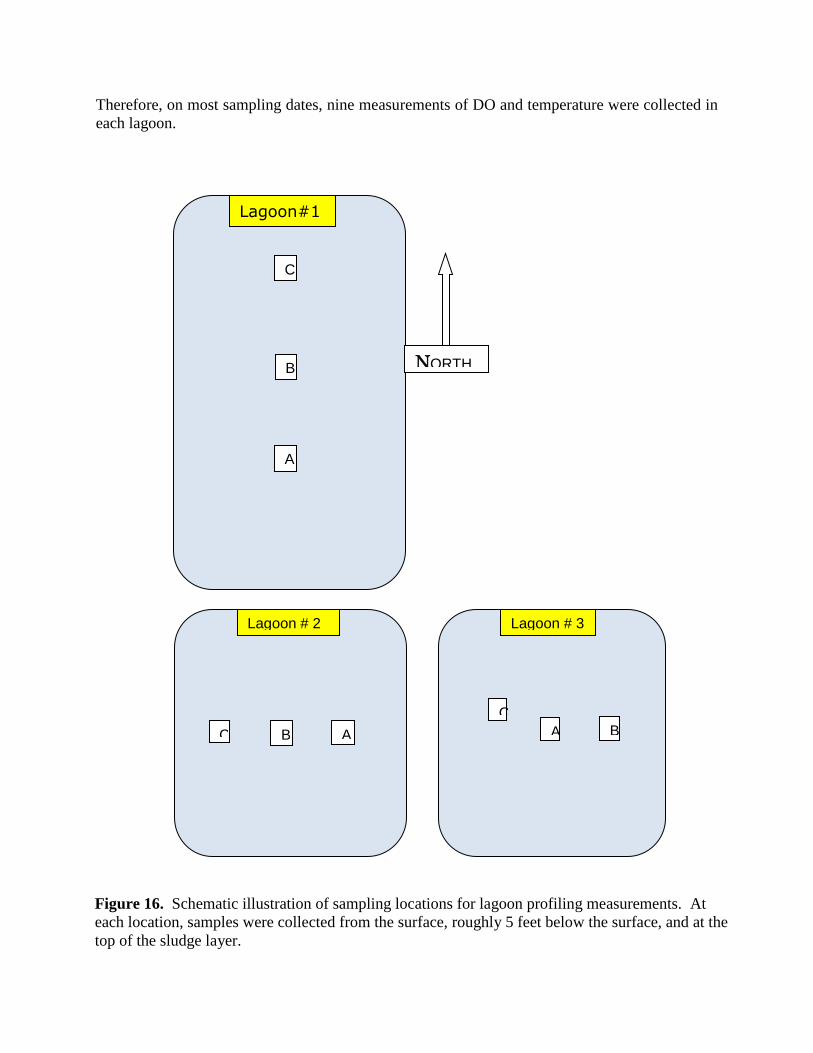
Therefore, on most sampling dates, nine measurements of DO and temperature were collected in
each lagoon.
A
B
C
Lagoon#1
Lagoon # 2 Lagoon # 3
A B C A B C
NORTH
Figure 16. Schematic illustration of sampling locations for lagoon profiling measurements. At
each location, samples were collected from the surface, roughly 5 feet below the surface, and at the
top of the sludge layer.

Date
9/1/2010 12/1/2010 3/1/2011 6/1/2011 9/1/2011 12/1/2011 3/1/2012
Dis
so
lve
d O
xyge
n C
on
ce
ntr
atio
n (
mg/L
)
0
2
4
6
8
10
12
14
16
Lagoon 1
Lagoon 2
Lagoon 3
Process Changes
Date
9/1/2010 12/1/2010 3/1/2011 6/1/2011 9/1/2011 12/1/2011 3/1/2012
Wa
ter
Te
mp
era
ture
(oC
)
0
5
10
15
20
25
30 Lagoon 1
Lagoon 2
Lagoon 3
Process Changes
Figure 17. Results from lagoon profiling measurements. Top panel illustrates dissolved
oxygen concentration measurements, while bottom panel illustrates water temperature
measurements. Symbols represent the mean of all measurements (n=9 for most dates), while
error bars represent one standard deviation for this same set of measurements.
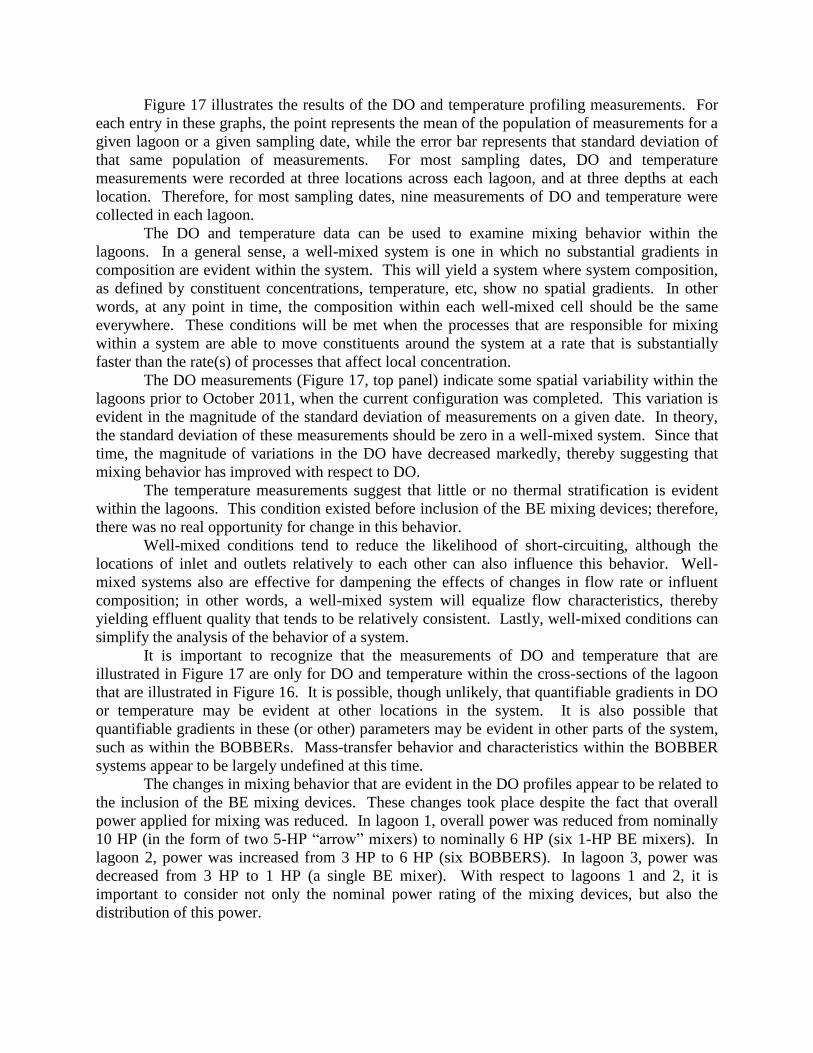
Figure 17 illustrates the results of the DO and temperature profiling measurements. For
each entry in these graphs, the point represents the mean of the population of measurements for a
given lagoon or a given sampling date, while the error bar represents that standard deviation of
that same population of measurements. For most sampling dates, DO and temperature
measurements were recorded at three locations across each lagoon, and at three depths at each
location. Therefore, for most sampling dates, nine measurements of DO and temperature were
collected in each lagoon.
The DO and temperature data can be used to examine mixing behavior within the
lagoons. In a general sense, a well-mixed system is one in which no substantial gradients in
composition are evident within the system. This will yield a system where system composition,
as defined by constituent concentrations, temperature, etc, show no spatial gradients. In other
words, at any point in time, the composition within each well-mixed cell should be the same
everywhere. These conditions will be met when the processes that are responsible for mixing
within a system are able to move constituents around the system at a rate that is substantially
faster than the rate(s) of processes that affect local concentration.
The DO measurements (Figure 17, top panel) indicate some spatial variability within the
lagoons prior to October 2011, when the current configuration was completed. This variation is
evident in the magnitude of the standard deviation of measurements on a given date. In theory,
the standard deviation of these measurements should be zero in a well-mixed system. Since that
time, the magnitude of variations in the DO have decreased markedly, thereby suggesting that
mixing behavior has improved with respect to DO.
The temperature measurements suggest that little or no thermal stratification is evident
within the lagoons. This condition existed before inclusion of the BE mixing devices; therefore,
there was no real opportunity for change in this behavior.
Well-mixed conditions tend to reduce the likelihood of short-circuiting, although the
locations of inlet and outlets relatively to each other can also influence this behavior. Well-
mixed systems also are effective for dampening the effects of changes in flow rate or influent
composition; in other words, a well-mixed system will equalize flow characteristics, thereby
yielding effluent quality that tends to be relatively consistent. Lastly, well-mixed conditions can
simplify the analysis of the behavior of a system.
It is important to recognize that the measurements of DO and temperature that are
illustrated in Figure 17 are only for DO and temperature within the cross-sections of the lagoon
that are illustrated in Figure 16. It is possible, though unlikely, that quantifiable gradients in DO
or temperature may be evident at other locations in the system. It is also possible that
quantifiable gradients in these (or other) parameters may be evident in other parts of the system,
such as within the BOBBERs. Mass-transfer behavior and characteristics within the BOBBER
systems appear to be largely undefined at this time.
The changes in mixing behavior that are evident in the DO profiles appear to be related to
the inclusion of the BE mixing devices. These changes took place despite the fact that overall
power applied for mixing was reduced. In lagoon 1, overall power was reduced from nominally
10 HP (in the form of two 5-HP “arrow” mixers) to nominally 6 HP (six 1-HP BE mixers). In
lagoon 2, power was increased from 3 HP to 6 HP (six BOBBERS). In lagoon 3, power was
decreased from 3 HP to 1 HP (a single BE mixer). With respect to lagoons 1 and 2, it is
important to consider not only the nominal power rating of the mixing devices, but also the
distribution of this power.
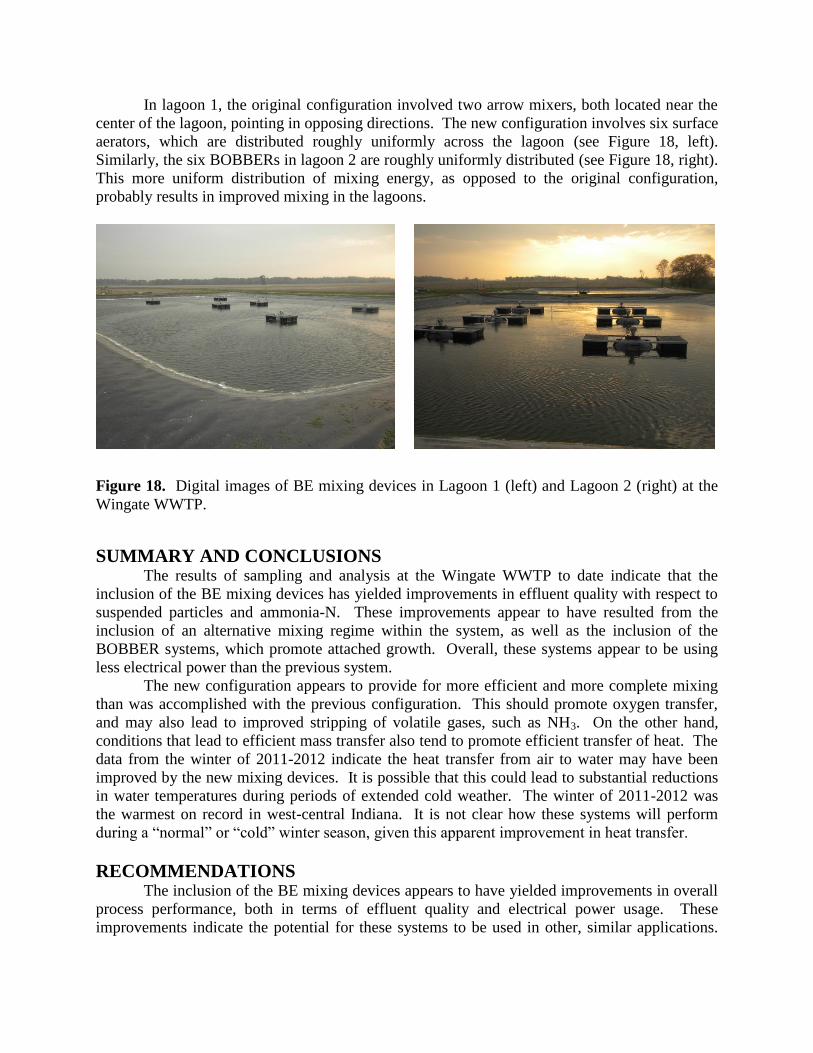
In lagoon 1, the original configuration involved two arrow mixers, both located near the
center of the lagoon, pointing in opposing directions. The new configuration involves six surface
aerators, which are distributed roughly uniformly across the lagoon (see Figure 18, left).
Similarly, the six BOBBERs in lagoon 2 are roughly uniformly distributed (see Figure 18, right).
This more uniform distribution of mixing energy, as opposed to the original configuration,
probably results in improved mixing in the lagoons.
Figure 18. Digital images of BE mixing devices in Lagoon 1 (left) and Lagoon 2 (right) at the
Wingate WWTP.
SUMMARY AND CONCLUSIONS The results of sampling and analysis at the Wingate WWTP to date indicate that the
inclusion of the BE mixing devices has yielded improvements in effluent quality with respect to
suspended particles and ammonia-N. These improvements appear to have resulted from the
inclusion of an alternative mixing regime within the system, as well as the inclusion of the
BOBBER systems, which promote attached growth. Overall, these systems appear to be using
less electrical power than the previous system.
The new configuration appears to provide for more efficient and more complete mixing
than was accomplished with the previous configuration. This should promote oxygen transfer,
and may also lead to improved stripping of volatile gases, such as NH3. On the other hand,
conditions that lead to efficient mass transfer also tend to promote efficient transfer of heat. The
data from the winter of 2011-2012 indicate the heat transfer from air to water may have been
improved by the new mixing devices. It is possible that this could lead to substantial reductions
in water temperatures during periods of extended cold weather. The winter of 2011-2012 was
the warmest on record in west-central Indiana. It is not clear how these systems will perform
during a “normal” or “cold” winter season, given this apparent improvement in heat transfer.
RECOMMENDATIONS The inclusion of the BE mixing devices appears to have yielded improvements in overall
process performance, both in terms of effluent quality and electrical power usage. These
improvements indicate the potential for these systems to be used in other, similar applications.

And given the number of lagoon-based systems that are in use in the U.S. and elsewhere, there
certainly appears to be a market for this type of system.
At present, there is no well-defined approach to be used in the design of systems based on
this technology. On the other hand, design approaches for other, related systems are in place.
Therefore, it is likely that the principles of design that have been applied in these related systems
could be adapted to the BE mixers. Moreover, the extension of this technology to other
facilities, and possibly other settings, represents a logical opportunity for continued collaboration
among the participants in this project.
In terms of applied research, several specific topics appear to merit attention. These
include:
Quantification of NH3 and CBOD uptake rates by the attached-growth community in the
BOBBER systems – this behavior of the system is likely to be influenced by mass-
transfer behavior and the composition of the microbial community within the BOBBERs.
By defining this behavior and the process parameters that influence this behavior, it may
be possible to develop a design procedure for the BOBBER system that can be verified
against field measurements.
Fluid mechanics in aerated lagoons – the BOBBERs and the BE mixers appear to have
resulted in improved mixing behavior in the lagoons at Wingate. However, the evidence
to define this behavior is incomplete. Numerical simulations (perhaps involving
computational fluid dynamics) and physical tests (e.g., “tracer” tests to allow
measurement of the residence time distribution of lagoon cells) may be beneficial as
methods of validating the effects of the mixing devices. In addition, these tests may
indicate opportunities for improvement of mixing behavior in lagoons.
Mass and heat transfer – the improved mixing in the Wingate lagoons should yield
increased mass and heat transfer. With respect to mass transfer, one area of particular
relevance is the ability of these systems to transfer oxygen. However, a closely-related
issue is the potential to strip volatile gases, such as NH3. Heat transfer is likely to be
most important in the winter months. Detailed information about heat transfer
characteristics of these systems may provide insights into the behavior of these systems
in cold-weather months, as well as opportunities to improve this behavior.
REFERENCES Alleman, J.E. (1984) “Elevated Nitrite Occurrence in Biological Wastewater Treatment
Systems,” Water Science & Technology, 17, 409-419.
Metcalf & Eddy (2003) Wastewater Engineering: Treatment and Reuse, Fourth Edition
(G.T. Tchobanoglous, F.L. Burton, and H.D. Stensel), McGraw-Hill, New York.
Richard, M. and Hutchins, B. (1995) “Enhanced Cold Temperature Nitrification in a
Municipal Aerated Lagoon Using Ringlace Fixed Film Media,” Presented at the Rocky
Mountain American Waterworks Association / Water Environment Association Annual
Conference, Sheridan Wyoming September 11th, 1995.
Stumm, W. and Morgan, J.J. (1996) Aquatic Chemistry: Chemical Equilibria and Rates
in Natural Waters, Third Edition, John Wiley & Sons, New York.
Villaverde, S.; Garcia-Encina, P.A., Fdz-Polanco, F. (1997) “Influence of pH Over
Nitrifying Biofilm Activity in Submerged Biofilters,” Water Research, 31, 1180-1186.

Enhanced Operations in an Aerated Lagoon System at the Wingate, Indiana
WWTP
Blythe, William. G. (Bradley Innovation Group, Ladoga, IN); Bradley, James G. (Bradley Innovation
Group, Ladoga, IN); Denman, David (Indiana Department of Environmental Management); Knutti,
Ramon (Town of Wingate, Wingate, IN), Bright, Greg, R. (Commonwealth Biomonitoring, Inc.
Indianapolis, IN), Blatchley III, Ernest R. (Purdue University, West Lafayette, IN)
High effluent ammonia concentration during periods of low temperature is an important limitation of
lagoons in temperate regions. Reduced activity among nitrifying organisms during periods of extended
cold temperatures slows down or stops the nitrification process. Many small communities will face high
capital and operating costs as they are required to replace lagoons, expand their capacity and/or construct
new mechanical wastewater treatment plants in order to comply with their NPDES permit effluent
limitations..
To address these problems, a new approach to wastewater treatment was developed and evaluated based
on technology that had previously been applied in the aquaculture industry. This approach involved the
use of Moving Bed Biological Reactors (MBBRs) to enhance activity among nitrifying bacteria.
MBBRs, which were designed and developed by Bradley Innovation Group (Ladoga, IN), the BOBBER,
were installed at the Wingate, IN WWTP.
Figure 1 illustrates the application of six surface aerators in the primary lagoon at Wingate, and six
MBBRs (BOBBER) in the secondary lagoon at the same facility. The BOBBERs are spherical reactors
that have been packed with a medium that has a high specific surface area, thereby yielding a large
surface area for growth of attached organisms. Water from the secondary lagoon is continuously
circulated through the MBBRs, thereby promoting O2 transfer and nitrification.
Figure 1. Digital image of the primary (background) and secondary (foreground) lagoons at the Wingate
WWTP. The primary lagoon was modified to include six 1-HP surface aerators, while the secondary
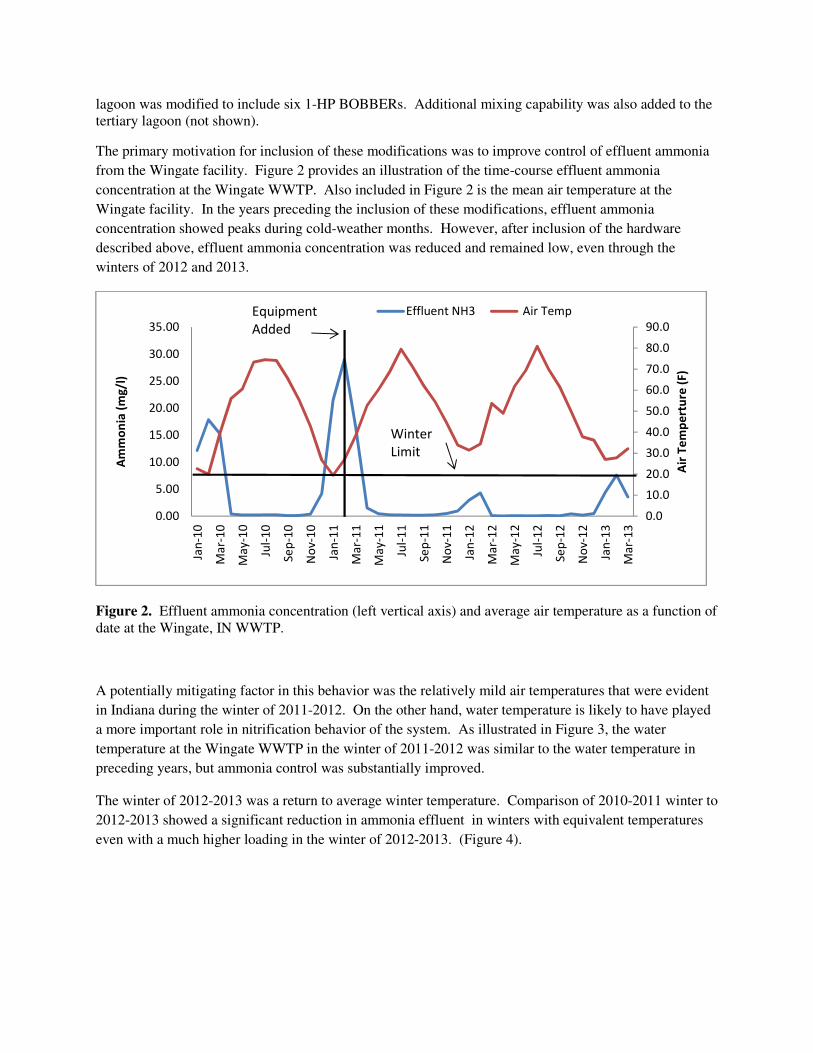
lagoon was modified to include six 1-HP BOBBERs. Additional mixing capability was also added to the
tertiary lagoon (not shown).
The primary motivation for inclusion of these modifications was to improve control of effluent ammonia
from the Wingate facility. Figure 2 provides an illustration of the time-course effluent ammonia
concentration at the Wingate WWTP. Also included in Figure 2 is the mean air temperature at the
Wingate facility. In the years preceding the inclusion of these modifications, effluent ammonia
concentration showed peaks during cold-weather months. However, after inclusion of the hardware
described above, effluent ammonia concentration was reduced and remained low, even through the
winters of 2012 and 2013.
Figure 2. Effluent ammonia concentration (left vertical axis) and average air temperature as a function of
date at the Wingate, IN WWTP.
A potentially mitigating factor in this behavior was the relatively mild air temperatures that were evident
in Indiana during the winter of 2011-2012. On the other hand, water temperature is likely to have played
a more important role in nitrification behavior of the system. As illustrated in Figure 3, the water
temperature at the Wingate WWTP in the winter of 2011-2012 was similar to the water temperature in
preceding years, but ammonia control was substantially improved.
The winter of 2012-2013 was a return to average winter temperature. Comparison of 2010-2011 winter to
2012-2013 showed a significant reduction in ammonia effluent in winters with equivalent temperatures
even with a much higher loading in the winter of 2012-2013. (Figure 4).
0.0
10.0
20.0
30.0
40.0
50.0
60.0
70.0
80.0
90.0
0.00
5.00
10.00
15.00
20.00
25.00
30.00
35.00
Jan
-10
Ma
r-1
0
Ma
y-1
0
Jul-
10
Se
p-1
0
No
v-1
0
Jan
-11
Ma
r-1
1
Ma
y-1
1
Jul-
11
Se
p-1
1
No
v-1
1
Jan
-12
Ma
r-1
2
Ma
y-1
2
Jul-
12
Se
p-1
2
No
v-1
2
Jan
-13
Ma
r-1
3
Air
Te
mp
ert
ure
(F
)
Am
mo
nia
(m
g/l
)
Effluent NH3 Air TempEquipment
Added
Winter
Limit

Figure 3. Ammonia-N (left vertical axis) through the three lagoons of the Wingate WWTP, along with
corresponding water temperatures.
Figure (4). Ammonia-N influent and effluent loading for the winters of 2010-11 and 2012-13
Nitrification rates in the Bradley Environmental MBBR’s were not adversely affected by low water
temperatures in winter 2011-2012 (see Figure 5). Total suspended solids (TSS) and biochemical oxygen
demand (CBOD) have displayed marked, consistent improvement since introduction of the study
equipment (see Figure 6).
Overall, the rated power of the mixing devices at the Wingate facility was reduced by from 16 HP to 13
HP, and overall energy consumption was reduced by 40% through these modifications. The capital
0
5
10
15
20
25
30
12
/29
/2…
1/2
9/2
01
1
2/2
8/2
01
1
3/3
1/2
01
1
4/3
0/2
01
1
5/3
1/2
01
1
6/3
0/2
01
1
7/3
1/2
01
1
8/3
1/2
01
1
9/3
0/2
01
1
10
/31
/2…
11
/30
/2…
12
/31
/2…
1/3
1/2
01
2
2/2
9/2
01
2
3/3
1/2
01
2
4/3
0/2
01
2
5/3
1/2
01
2
6/3
0/2
01
2
7/3
1/2
01
2
8/3
1/2
01
2
9/3
0/2
01
2
10
/31
/2…
11
/30
/2…
12
/31
/2…
1/3
1/2
01
3
2/2
8/2
01
3
Am
mo
nia
(m
g/l
) W
ate
r T
em
p.
(C)
Lagoon 1
Lagoon 2
Effluent
Water Temp.
0.00
50.00
100.00
150.00
200.00
250.00
300.00
350.00
December January February March
Am
mo
nia
Lo
ad
ing
(lb
)
Influent Ammonia 2010-11 Influent Ammonia 2012-13
Effluent Ammonia 2010-11 Effluent Ammonia 2012-13
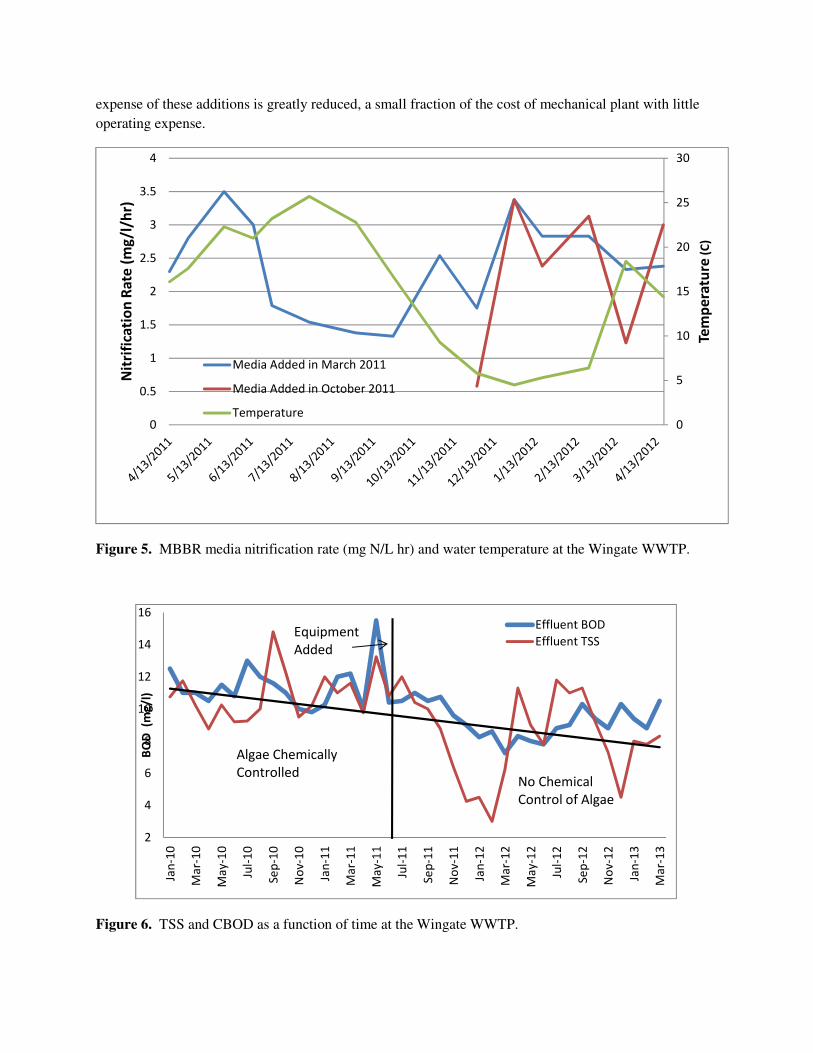
expense of these additions is greatly reduced, a small fraction of the cost of mechanical plant with little
operating expense.
Figure 5. MBBR media nitrification rate (mg N/L hr) and water temperature at the Wingate WWTP.
Figure 6. TSS and CBOD as a function of time at the Wingate WWTP.
0
5
10
15
20
25
30
0
0.5
1
1.5
2
2.5
3
3.5
4
Tem
pe
ratu
re(C
)
Nit
rifi
cati
on
Ra
te (
mg
/l/h
r)
Media Added in March 2011
Media Added in October 2011
Temperature
2
4
6
8
10
12
14
16
Jan
-10
Ma
r-1
0
Ma
y-1
0
Jul-
10
Se
p-1
0
No
v-1
0
Jan
-11
Ma
r-1
1
Ma
y-1
1
Jul-
11
Se
p-1
1
No
v-1
1
Jan
-12
Ma
r-1
2
Ma
y-1
2
Jul-
12
Se
p-1
2
No
v-1
2
Jan
-13
Ma
r-1
3
BO
D
(mg
/l)
Effluent BOD
Effluent TSS
Algae Chemically
Controlled
Equipment
Added
No Chemical
Control of Algae

7-1
CHAPTER 7
UPGRADING POND EFFLUENTS 7.1 INTRODUCTION There are two general ways to upgrade pond effluents: adding a solids removal step or making modifications to the pond process. The selection of the appropriate method to achieve a desired effluent quality depends upon the design conditions and effluent limits imposed on the facility. The various methods are discussed in the following sections: Solids Removal Methods and Operation Modifications and Additions to Typical Designs. 7.2 SOLIDS REMOVAL METHODS The occasional high concentration of TSS in the effluent, which can exceed 100 mg/L, has been a major operational challenge to pond systems. The solids are composed primarily of algae and other pond detritus, not wastewater solids. These high concentrations usually occur, during the summer months. Solids removal mechanisms include the use of intermittent sand filters, recirculating sand filters, rock filters, coagulation-flocculation and dissolved air flotation. Nolte & Associates (1992) conducted a review of the literature covering recirculating sand filters and intermittent sand filters. 7.2.1 Intermittent Sand Filtration Intermittent sand filtration applies pond effluent to a sand filter bed on a periodic or intermittent basis. The use of intermittent sand filters has a long and successful history of treating wastewaters (Massachusetts Board of Health, 1912; Grantham et al., 1949; Furman et al., 1955). A summary of the design characteristics and performance of several systems employed in Massachusetts around 1900 is presented in Table 7-1. These systems were treating raw or primary effluent wastewater and producing an excellent effluent. A typical intermittent sand filter is shown in Figure 7-1.

7-2
Table 7-1. Design and Performance of Early Massachusetts Intermittent Sand Filters (Mass. Board of Health, 1912; Mancl and Peeples, 1991).
Location Year Started
Loading Rate
(gal/d/ac)
Filter Depth
(in)
SandSize (mm)
Ammonia Removal BOD5 Removal
Influent(mg/L)
Effluent(mg/L)
Influent (mg/L)
Effluent (mg/L)
Andover 1902 3500 48-60 0.15-0.2 - - - -
Brockton - - - - 40.7 1.5 314 6.2
Concord 1899 83,000 - - - - - -
Farmington - - 70 0.06-0.12 27.3 2.7 - -
Gardner 1891 122,000 60 0.12-0.18 21.2 7.5 139 9.5
Leicester - - - - - - 321 13.1
Natick - - - - 12.4 2.3 - -
Spencer 1897 61,000 48 0.18-0.34 16 2.1 116 6.9
See p. xiv for conversion table.
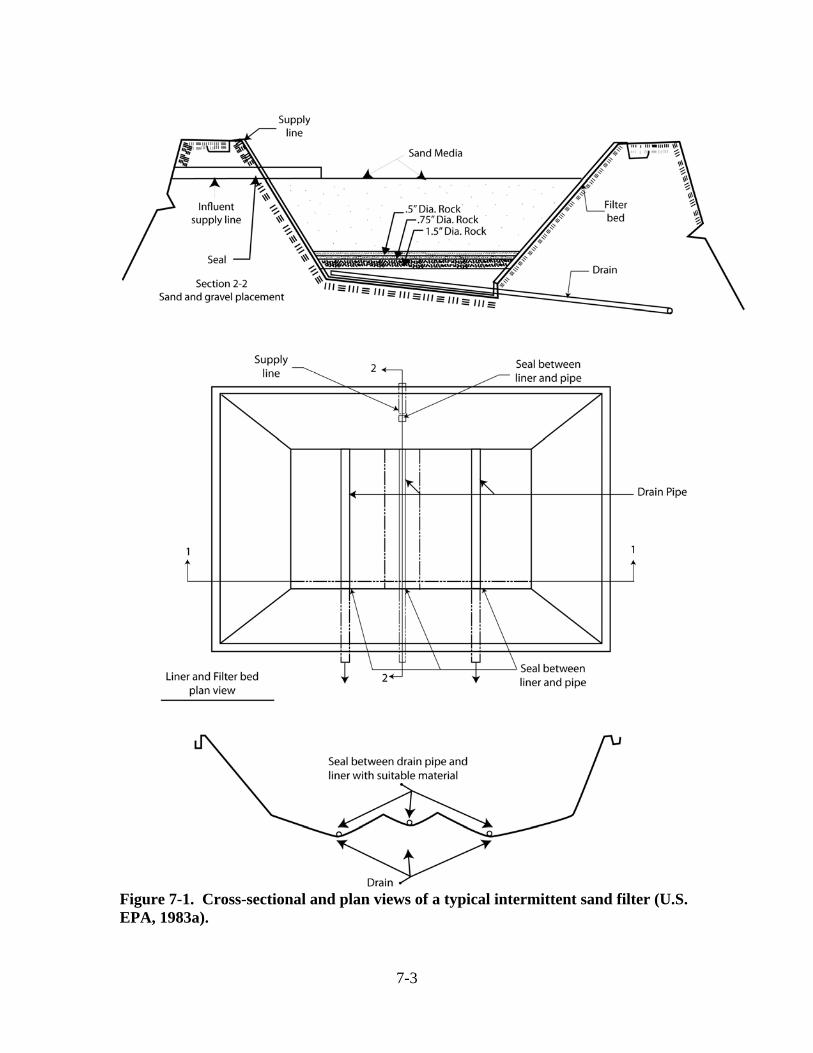
7-3
Figure 7-1. Cross-sectional and plan views of a typical intermittent sand filter (U.S. EPA, 1983a).

7-4
Intermittent sand filtration is capable of polishing pond effluents at relatively low cost and is similar to the practice of slow sand filtration in potable water treatment. As the wastewater passes through the bed, TSS and other organic matter are removed through a combination of physical straining and biological degradation processes. The particulate matter collects in the top 5 - 8 cm (2 - 3 in) of the filter bed. This accumulation eventually clogs the surface and prevents effective infiltration of additional effluent. At that time, the bed is taken out of service, the top layer of clogged sand removed, and the unit is put back into service. The removed sand can be washed and reused or discarded. 7.2.1.1 Summary of Performance Summaries of the performance of intermittent sand filters treating pond effluents conducted during the 1970’s and 1980’s are presented in Tables 7-2 and 7-3. Table 7-2 is a summary of studies reported in the literature and EPA documents, and Table 7-3 is a summary of results from field investigations at three full-scale systems consisting of ponds followed by intermittent sand filters. These are the most extensive studies conducted in the US. Though there are some effluent concentration above the 30/30 (TSS/BOD5 mg/L) limit, on the whole, the results demonstrate that it is possible to produce an effluent with TSS and BOD5 less than 15 mg/L from anaerobic, facultative and aerated ponds followed by intermittent sand filters with effective sizes less than or equal to 0.3 mm. It should be noted that Mt. Shasta Wastewater Treatment Plant retired the intermittent sand filter bed and has been using dissolved air flotation to remove algae since 2000 (see Section 7.2.5). The treatment process consists of headworks, four oxidation ponds, ballast lagoon dosing basin, dissolved air flotation system, intermittent backwash filter, chlorine contact chamber, declorination system and discharge line. The treated wastewater can be discharged to any of three locations, depending on water quality and time of year: the Sacramento River, a leach field located adjacent to Highway 89, or the Mt. Shasta Resort Golf Course (http://ci.mt-shasta.ca.us/publicworks/wastewater.php). The intermittent sand filter bed was determined to be too labor intensive, although it worked fairly well (Jackie Brown, pers. comm., 2010).
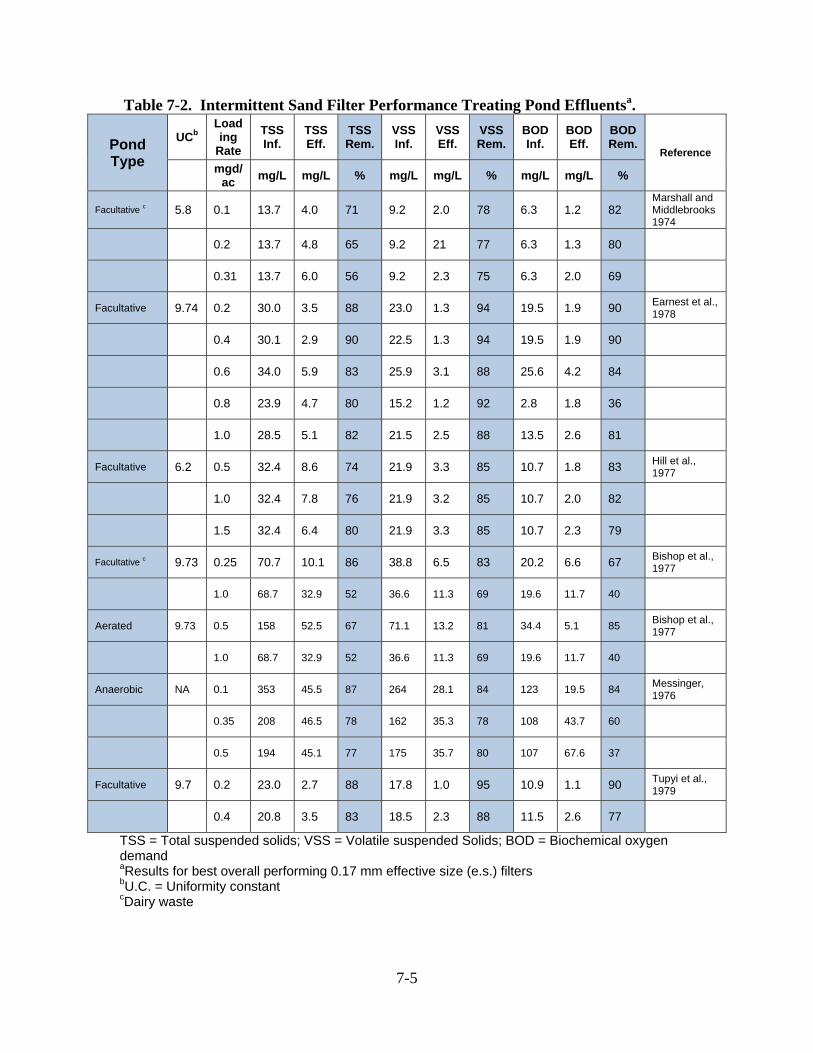
7-5
Table 7-2. Intermittent Sand Filter Performance Treating Pond Effluentsa.
Pond Type
UCb Loading
Rate TSS Inf.
TSS Eff.
TSS Rem.
VSS Inf.
VSS Eff.
VSS Rem.
BOD Inf.
BOD Eff.
BOD Rem.
Reference
mgd/ac mg/L mg/L % mg/L mg/L % mg/L mg/L %
Facultative c 5.8 0.1 13.7 4.0 71 9.2 2.0 78 6.3 1.2 82 Marshall and Middlebrooks1974
0.2 13.7 4.8 65 9.2 21 77 6.3 1.3 80
0.31 13.7 6.0 56 9.2 2.3 75 6.3 2.0 69
Facultative 9.74 0.2 30.0 3.5 88 23.0 1.3 94 19.5 1.9 90 Earnest et al., 1978
0.4 30.1 2.9 90 22.5 1.3 94 19.5 1.9 90
0.6 34.0 5.9 83 25.9 3.1 88 25.6 4.2 84
0.8 23.9 4.7 80 15.2 1.2 92 2.8 1.8 36
1.0 28.5 5.1 82 21.5 2.5 88 13.5 2.6 81
Facultative 6.2 0.5 32.4 8.6 74 21.9 3.3 85 10.7 1.8 83 Hill et al., 1977
1.0 32.4 7.8 76 21.9 3.2 85 10.7 2.0 82
1.5 32.4 6.4 80 21.9 3.3 85 10.7 2.3 79
Facultative c 9.73 0.25 70.7 10.1 86 38.8 6.5 83 20.2 6.6 67 Bishop et al., 1977
1.0 68.7 32.9 52 36.6 11.3 69 19.6 11.7 40
Aerated 9.73 0.5 158 52.5 67 71.1 13.2 81 34.4 5.1 85 Bishop et al., 1977
1.0 68.7 32.9 52 36.6 11.3 69 19.6 11.7 40
Anaerobic NA 0.1 353 45.5 87 264 28.1 84 123 19.5 84 Messinger, 1976
0.35 208 46.5 78 162 35.3 78 108 43.7 60
0.5 194 45.1 77 175 35.7 80 107 67.6 37
Facultative 9.7 0.2 23.0 2.7 88 17.8 1.0 95 10.9 1.1 90 Tupyi et al., 1979
0.4 20.8 3.5 83 18.5 2.3 88 11.5 2.6 77
TSS = Total suspended solids; VSS = Volatile suspended Solids; BOD = Biochemical oxygen demand aResults for best overall performing 0.17 mm effective size (e.s.) filters bU.C. = Uniformity constant cDairy waste

7-6
Table 7-3. Mean Performance Data for Three Full-Scale Pond-Intermittent Sand Filter Systems (Russel et al., 1979 in Crites, 2006).
Parameter Mt. Shasta CA Moriarty NM Ailey GA Pond Eff
Filter Eff
Facility Eff
Pond Eff
Filter Eff
Facility Eff
PondEffluent
Filter Effluent
Facility Effluent
BOD5 (mg/L) 22 11 8 30 17 17 22 8 6
Soluble BOD5 (mg/L) 7 4 5 17 16 16 10 6 5
TSS (mg/L) 49 18 16 81 13 13 43 15 13
VSS (mg/L) 34 13 10 64 9 9 32 8 6
FC (col/100ml) 292 30 <2 290 18 34 55 8 <1
pH 87 68 66 8.9 8.0 8.0 8.9 7.1 6.8
DO (mg/L) 12.4 5.5 5.3 10.9 8.3 8.3 10.2 7.4 7.9
COD (mg/L) 100 87 68 84 43 43 57 32 25
Soluble COD (mg/L) 71 64 50 67 34 34 41 23 16
Akl (mg/L as CaCO3)
75 51 42 293 260 260 84 76 69
TP (mg-P/L) 3.88 3.09 2.72 4.02 2.8 2.8 3.10 2.67 2.45
TKN (mg-N/L) 11.1 7.5 5.2 22 121 121 7.3 4.1 2.2
NH3 (mg-N/L) 5.56 1.83 1.76 16 9.16 9.16 0.658 0.402 0.31
Org-N (mg N/L) 56 5.7 3.4 5.7 3.3 3.3 6.7 3.8 1.9
NO2= (mg-
N/L) 0.56 7.7 0.020 159 1.66 1.66 0.56 77 0.020
NO3- (mg-
N/L) 0.78 43 45 0.09 4.09 4.09 349,175 21583 29360
Total Algal Count 4x10⁵ 1x10⁵ 1x10⁵ 8x10⁵ 3x10⁴ 3x10⁴ NA NA 0.070
Flow (mgd) NA NA 0.488 NA 0.046 NA
NA = Not Available Rich and Wahlberg (1990) evaluated the performance of five facultative pond-intermittent sand filter systems located in South Carolina and Georgia. A summary of the design characteristics and performance of these systems is shown in Table 7-4. The systems provided superior performance when compared with ten aerated pond systems
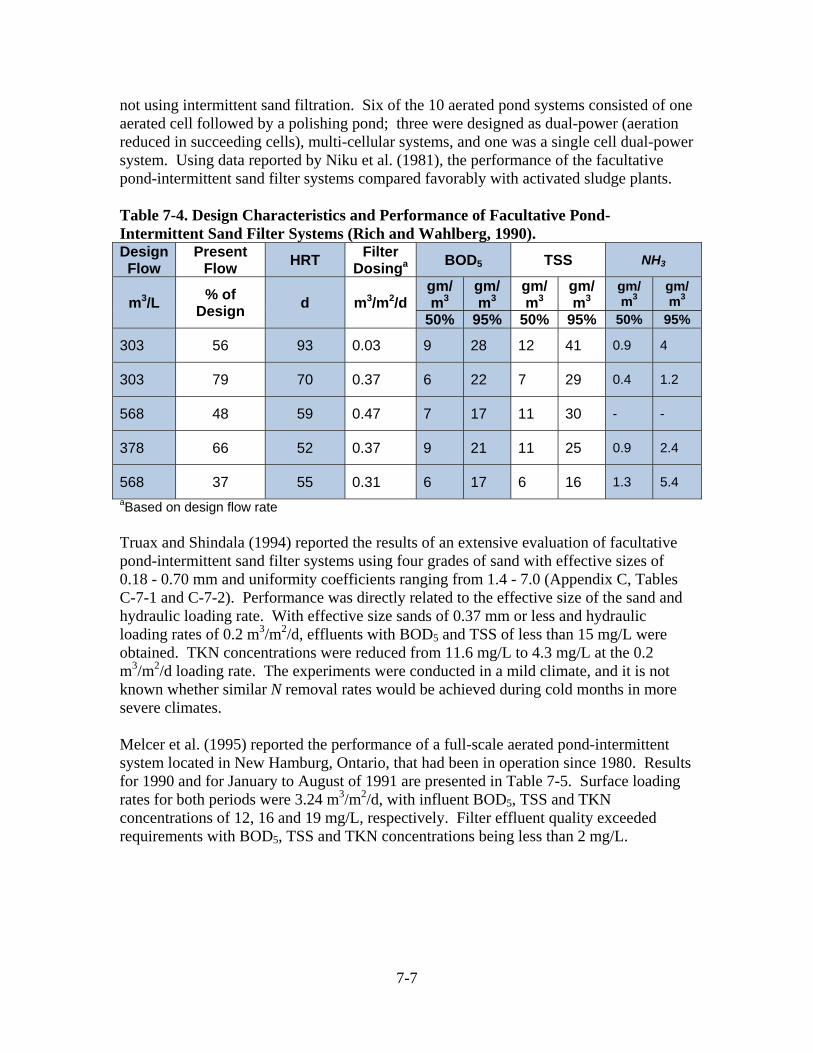
7-7
not using intermittent sand filtration. Six of the 10 aerated pond systems consisted of one aerated cell followed by a polishing pond; three were designed as dual-power (aeration reduced in succeeding cells), multi-cellular systems, and one was a single cell dual-power system. Using data reported by Niku et al. (1981), the performance of the facultative pond-intermittent sand filter systems compared favorably with activated sludge plants. Table 7-4. Design Characteristics and Performance of Facultative Pond-Intermittent Sand Filter Systems (Rich and Wahlberg, 1990). Design Flow
Present Flow HRT Filter
Dosinga BOD5 TSS NH3
m3/L % of Design d
m3/m2/d
gm/ m3
gm/ m3
gm/ m3
gm/ m3
gm/ m3
gm/ m3
50% 95% 50% 95% 50% 95%
303 56 93 0.03 9 28 12 41 0.9 4
303 79 70 0.37 6 22 7 29 0.4 1.2
568 48 59 0.47 7 17 11 30 - -
378 66 52 0.37 9 21 11 25 0.9 2.4
568 37 55 0.31 6 17 6 16 1.3 5.4 aBased on design flow rate Truax and Shindala (1994) reported the results of an extensive evaluation of facultative pond-intermittent sand filter systems using four grades of sand with effective sizes of 0.18 - 0.70 mm and uniformity coefficients ranging from 1.4 - 7.0 (Appendix C, Tables C-7-1 and C-7-2). Performance was directly related to the effective size of the sand and hydraulic loading rate. With effective size sands of 0.37 mm or less and hydraulic loading rates of 0.2 m3/m2/d, effluents with BOD5 and TSS of less than 15 mg/L were obtained. TKN concentrations were reduced from 11.6 mg/L to 4.3 mg/L at the 0.2 m3/m2/d loading rate. The experiments were conducted in a mild climate, and it is not known whether similar N removal rates would be achieved during cold months in more severe climates. Melcer et al. (1995) reported the performance of a full-scale aerated pond-intermittent system located in New Hamburg, Ontario, that had been in operation since 1980. Results for 1990 and for January to August of 1991 are presented in Table 7-5. Surface loading rates for both periods were 3.24 m3/m2/d, with influent BOD5, TSS and TKN concentrations of 12, 16 and 19 mg/L, respectively. Filter effluent quality exceeded requirements with BOD5, TSS and TKN concentrations being less than 2 mg/L.
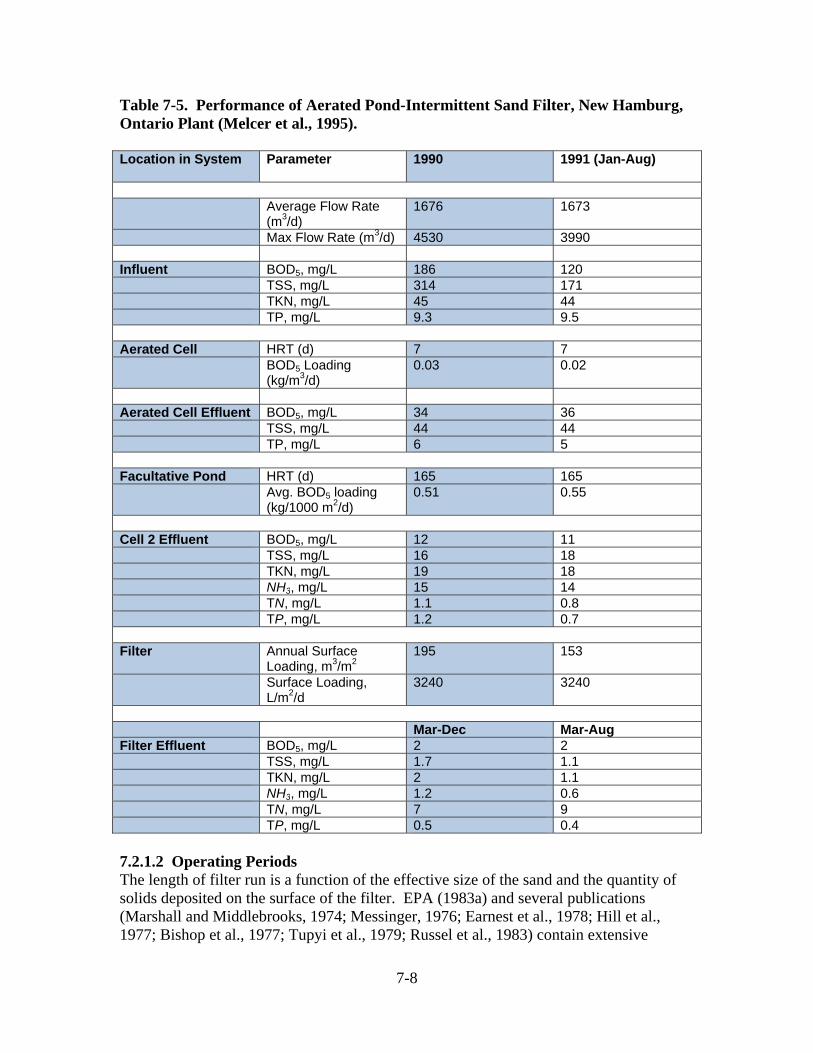
7-8
Table 7-5. Performance of Aerated Pond-Intermittent Sand Filter, New Hamburg, Ontario Plant (Melcer et al., 1995). Location in System
Parameter 1990 1991 (Jan-Aug)
Average Flow Rate
(m3/d) 1676 1673
Max Flow Rate (m3/d) 4530 3990 Influent BOD5, mg/L 186 120 TSS, mg/L 314 171 TKN, mg/L 45 44 TP, mg/L 9.3 9.5 Aerated Cell HRT (d) 7 7 BOD5 Loading
(kg/m3/d) 0.03 0.02
Aerated Cell Effluent BOD5, mg/L 34 36 TSS, mg/L 44 44 TP, mg/L 6 5 Facultative Pond HRT (d) 165 165 Avg. BOD5 loading
(kg/1000 m2/d) 0.51 0.55
Cell 2 Effluent BOD5, mg/L 12 11 TSS, mg/L 16 18 TKN, mg/L 19 18 NH3, mg/L 15 14 TN, mg/L 1.1 0.8 TP, mg/L 1.2 0.7 Filter Annual Surface
Loading, m3/m2 195 153
Surface Loading, L/m2/d
3240 3240
Mar-Dec Mar-Aug Filter Effluent BOD5, mg/L 2 2 TSS, mg/L 1.7 1.1 TKN, mg/L 2 1.1 NH3, mg/L 1.2 0.6 TN, mg/L 7 9 TP, mg/L 0.5 0.4 7.2.1.2 Operating Periods The length of filter run is a function of the effective size of the sand and the quantity of solids deposited on the surface of the filter. EPA (1983a) and several publications (Marshall and Middlebrooks, 1974; Messinger, 1976; Earnest et al., 1978; Hill et al., 1977; Bishop et al., 1977; Tupyi et al., 1979; Russel et al., 1983) contain extensive
7-9
information on the relationship between solids deposited on the surface of a filter and the length of run time. Truax and Shindala (1994) also reported similar run times. 7.2.1.3 Maintenance Requirements Maintenance is directly related to the quantity of solids applied to the surface of the filter, and this is related to the concentration of solids in the influent to the filter and the hydraulic loading rate. Filters with low hydraulic loading rates tend to operate for extended periods. With such extended operating periods, maintenance consists of routine inspection of the filter, removing weeds, and an occasional cleaning by removing the top 5 - 8 cm of sand after allowing the filter to dry out. Early control of weeds is the key to good maintenance. The use of chemicals is not advised. In Wisconsin, where there are many sand filters, the O&M manuals advise that the sand beds can be tilled if the weeds are very small. Once they have grown, however, they need to be removed manually (Jack Saltes, Wisconsin Department of Natural Resources, pers. comm., 2010). 7.2.1.4 Hydraulic Loading Rates Typical hydraulic loading rates on a single-stage filter range from 0.37 - 0.56 m3/m2/d. If the TSS in the influent to the filter routinely exceeds 50 mg/L, the hydraulic loading rate should be reduced to 0.19 - 0.37 m3/m3/d to increase the filter run. In cold weather locations, the lower end of the range is recommended to avoid having to clean the filter during the winter months. 7.2.1.5 Design of Intermittent Sand Filters Algae removal from pond effluent is almost totally a function of the sand size used. With a required BOD5 and TSS below 30 mg/L, a single-stage filter with medium sand (effective size = 0.3 mm) will produce a reasonable filter run. If better effluent quality is required, finer sand (effective size = 0.15 - 0.2 mm) or a two-stage filtration system with the finer sand in the second stage should be used. The total filter area required for a single-stage operation is calculated by dividing the expected influent flow rate by the hydraulic loading rate selected for the system. One spare filter unit should be included to permit continuous operation, since the cleaning process may require several days. An alternate approach is to provide temporary storage in the pond units. Three filter beds are the preferred arrangement to permit maximum flexibility. In small systems that depend on manual cleaning, the individual bed should not be bigger than about 90 m2. Larger systems with mechanical cleaning equipment could have individual filter beds up to 5000 m2. The design depth of sand in the bed should be at least 45 cm with a sufficient depth for at least one year of cleaning cycles. A single cleaning operation may remove 2.5 - 5 cm of sand. A 30-day filter run would then require an additional 30 cm of sand. In the typical case, an initial bed depth of about 90 cm of sand is usually provided. A graded gravel layer 30 - 45 cm separates the sand layer from the under drains. The bottom layer is graded so that its effective size is four times as great as the openings in the under-drain piping. The successive layers of gravel are progressively finer to prevent intrusion of sand. An alternative is to use gravel around the underdrain piping and then a permeable

7-10
geo-textile membrane to separate the sand from the gravel. Further details on design and performance are presented in the U.S. EPA (1983a), Reed et al. (1995) and Crites et al. (2006). A design example for an intermittent sand filter treating a pond effluent is presented in Example C-7-1 in Appendix C. 7.2.2 Rock Filters A rock filter operates by allowing pond effluent to travel through a submerged porous rock bed, causing algae to settle out on the rock surfaces as the liquid flows through the void spaces. The accumulated algae are then biologically degraded. Algae removal with rock filters has been studied extensively at Eudora, Kansas; California, Missouri; and Veneta, Oregon (USEPA, 1983a). Rock filters have been installed throughout the United States and the world, and performance has varied (USEPA, 1983a; Middlebrooks, 1988; and Saidam et al., 1995). A diagram of the Veneta rock filter is shown in Figure 7-2. The West Monroe, Louisiana rock filters were essentially the same as the one in Veneta, but the filters received higher loading rates. Several rock filters of various designs have been constructed in Illinois with varied success. Many of the Illinois filters produced an excellent effluent, but the designs varied widely (Menninga, pers. comm., 1986). Figure 7-3 contains diagrams of the various types of rock filters in use in Illinois. Snider (pers. comm., 1998) designed a rock filter for Prineville, Oregon and knew of one built at Harrisburg, Oregon. Performance and design detail are not available, but Snider indicated that the systems were designed using information from the Veneta system.

7-11
Figure 7-2. Rock filter at Veneta, Oregon (Swanson and Williamson, 1980).

7-12
Figure 7-3. State of Illinois rock filter configurations (Menninga, pers. comm.,1986). The principal advantages of the rock filter are the relatively low construction cost and simple operation. Odor problems can occur, and the design life for the filters and the cleaning procedures has not yet been firmly established. Several units have been operating successfully for over 20 years. Archer and O’Brien (2005) have used inter-pond rock filters to improve suspended solids and nitrogen removal. Rock embankments across the ponds provide filtering, reduced short-circuiting, and increased surface area to grow nitrifying bacteria.
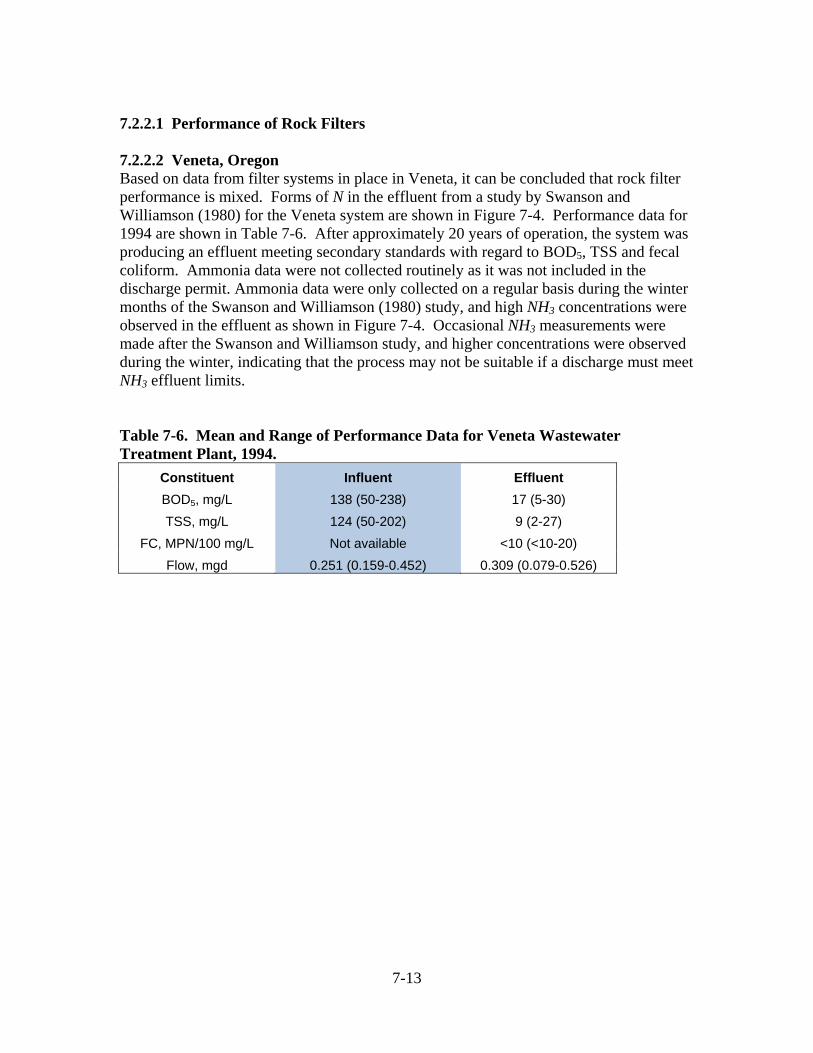
7-13
7.2.2.1 Performance of Rock Filters 7.2.2.2 Veneta, Oregon Based on data from filter systems in place in Veneta, it can be concluded that rock filter performance is mixed. Forms of N in the effluent from a study by Swanson and Williamson (1980) for the Veneta system are shown in Figure 7-4. Performance data for 1994 are shown in Table 7-6. After approximately 20 years of operation, the system was producing an effluent meeting secondary standards with regard to BOD5, TSS and fecal coliform. Ammonia data were not collected routinely as it was not included in the discharge permit. Ammonia data were only collected on a regular basis during the winter months of the Swanson and Williamson (1980) study, and high NH3 concentrations were observed in the effluent as shown in Figure 7-4. Occasional NH3 measurements were made after the Swanson and Williamson study, and higher concentrations were observed during the winter, indicating that the process may not be suitable if a discharge must meet NH3 effluent limits. Table 7-6. Mean and Range of Performance Data for Veneta Wastewater Treatment Plant, 1994.
Constituent Influent Effluent BOD5, mg/L 138 (50-238) 17 (5-30) TSS, mg/L 124 (50-202) 9 (2-27)
FC, MPN/100 mg/L Not available <10 (<10-20) Flow, mgd 0.251 (0.159-0.452) 0.309 (0.079-0.526)

FigurJan, 7.2.2StamWestthat uremoMonrwhile12 ourates frequthe lo
re 7-4. NitrFeb, Mar, A
.3 West Momberg et al. (1t Monroe, Loused for the Vvals were leroe systems e there were ut of over 10on the West
uently exceedoading rate b
rogen specieApr and Ma
onroe, Loui1984) presenouisiana. ThVeneta facil
ess than thoseproduced efoccasional e
00 samples et and East filded the desigby a factor of
es in Venetaay-78 (Swan
siana nted performhe systems wlity (<0.3 m3
e reported foffluent BOD5exceedancesxceeded 30 lter were 3.5gn rate by a f 2 to 3, whi
7-14
a wastewatenson and W
mance resultswere loaded a3 of wastewaor the Veneta5 and TSS co
s of BOD5 tomg/L for eit
5 and 1.8 mgfactor of 2 to
ich greatly ex
r treatmentWilliamson, 1
s for the two at higher hyd
ater/d per roca system. Inoncentration
o 40 mg/L anther parametgd, respectiveo 3. This rexceeded the
t rock filter.1980).
rock filters draulic loadick m3), and tn general, thens less than 3nd TSS to 50ter. The desiely, and the sulted in an Veneta load
. Nov-77;
operating ining rates thathe TSS e West
30 mg/L, but0 mg/L, onlyign flow flow rates increase in
ding rate.
n an
t y
7-15
7.2.2.4 Jordan Rock Filters Saidam et al. (1995) performed a series of studies of rock filters treating pond effluent in Assram, Jordan. The filters were arranged in three trains, the first train consisting of two filters in series, with the first filter containing rock and having an average diameter of 18 cm followed by a filter containing local gravel (wadi gravel) with an average diameter of 11.6 cm. The second train contained the same rock as used in the first filter, but with an average diameter of 2.4 cm. The wadi gravel was used in the first filter of the third train, and the second filter contained an aggregate with an average diameter of 1.27 cm. The filters in the three trains were operated in series, and the characteristics of the wastewater, hydraulic loading rates, and the characteristics of the effluents from the various filters are shown in Table 7-7. The removal efficiencies obtained in the first run for the various filters and the trains are summarized in Table 7-8. Even though the rock sizes of several of the filters were similar to what was used at Veneta and West Monroe, the hydraulic loading rates exceeded the maximum recommended value of 0.3 m3/m3/d and the quality of the effluents was much lower. There was insufficient DO in the influent to oxidize NH3, and considering the temperature of the influent wastewater and the H2S in the effluent, it is likely that the filters were anaerobic. On the other hand, TSS was lowered by 60 percent and fecal coliform levels met WHO guidelines for unrestricted use of the effluent for agricultural purposes (WHO, 2003).

7-16
Table 7-7. Performance of Rock Filters (Saidam et al., 1995).
Unit Hydraulic Loading
Rate m3/m3-d
Run T °C
DO mg/L
TSS mg/L
BOD5 mg/L
TFCC mpn/
100mg/L NH4-N mg/L
INFLUENT 1 25.7 3.2 201 95 1.10E+04 85 2 21 4.8 234 105 6.3E+04 93 3 14.0 4.0 213 122 9.6+05 97 4 15.0 3.5 101 108 1.6W+04 71
FIRST TRAIN 131 61 2.2E+03 Rock Filter 1 0.498 1 25.1 1.2 200 81 5.7E+04 89
Avg. Diameter – 18 cm 0.634 2 20.0 1.5 156 100 8.1E+05 96 Voids=49% 0.5 to .58 3 13.4 1.0 76 77 1.4E+04 96
Surface Area =17 m2/m3 0.5 to .58 4 13.0 2.1 72 78 36 1.00E+03
Wadi Gravel Filter 1 0.386 1 25.2 1.9 161 66 4.2E+04 91 Avg. Diameter=11.6 cm 0.634 2 129 77 4.7E+05
Voids=41% 0.5 to .58 3 13.4 1.0 66 74 1.10E+04 97 Surface Area =25 2/m3 0.5 to .58 4 13.0 1.9 71
SECOND TRAIN 130 53 1.9E+03 Rock Filter 2 0.311 1 25.3 1.1 203 79 5.00E+04 89
Avg. Diameter = 18 cm 0.634 2 19.7 1.4 164 87 8.6E+05 98 Voids=49% 0.5 to .58 3 13.3 1.0 88 92 1.00E+04 98
Surface Area =17 m2/m3 0.5 to .58 4 13.7 1.9 71
102 51 1.5E+03E
Coarse Aggregate Filter 2 0.333 1 25.6 1.7 154 65 3.2E+04 89 Avg. Diameter=2.4 cm 0.634 2 19.9 1.4 134 73 5.4E+05 98
Voids=40% 0.5 to .58 3 13.3 1.0 60 87 6.5E+03 97 Surface Area =150 2/m3 0.5 to .58 4 15.0 1.9 71
THIRD TRAIN 109 48 1.6E+03
Wadi Gravel Filter 3 0.274 1 25.7 1.6 206 76 6.8E+04 91 Avg. Diameter=11.6 cm 0.634 2 20.2 1.4 150 86 3.2E+05 96
Voids=41% 0.5 to .58 3 13.3 1.0 81 76 6.3E+03 97 Surface Area =25 2/m3 0.5 to .58 4 15.0 1.9 71
79 42 6.4E+02 Medium Aggregate Filter 3 0.442 1 25.9 2.0 121 72 3.3E+04 92
Avg. Diameter=1.27 cm 0.634 2 19.7 1.5 108 66 4.4E+05 96 Voids=28% 0.5 to .58 3 13.4 1.0 45 59 3.3E+03 100
Surface Area =327 2/m3 0.5 to .58 4 13.0 1.9 71

7-17
Table 7-8. Summary of Removal Efficiency in the First Run (Saidam et al., 1995).
Parameter
Percent Removal of Individual Filters % Removal Per Train
Rock Filter
1
Wadi Gravel Filter
1
Rock Filter
2
Coarse Aggregate
Filter 2
Wadi Gravel Filter
3
Medium Aggregate
Filter 3
1st Train
2nd Train
3rd Train
TSS 34 41 35 22 46 25 61 49 59
BOD5 36 41 44 4 49 13 62 46 56
COD 19 18 21 15 24 25 33 33 44
Total P 9 15 9 30 18 33 24 35 46
Total FC 80 55 83 21 85 60 90 86 94
Color 25 34 28 20 30 36 51 42 55
HLR m3/m3/d 0.498 0.386 0.311 0.333 0.274 0.442 - - -
7.2.2.5 New Zealand Rock Filters Rock filters have been used in New Zealand for removing high concentrations of algae from pond effluents (Middlebrooks et al,2005). The systems were developed from sub-surface flow wetlands without plants. The rock ranged from 12 – 24 cm in diameter, with the coarser rocks at the inlet and outlet to distribute the flow evenly. A cross-section of the rock filter at Paeroa, New Zealand is shown in Figure 7-5.
Figure 7-5. Cross-sectional view of Paeroa, New Zealand rock filter (Middlebrooks et al., 2005).
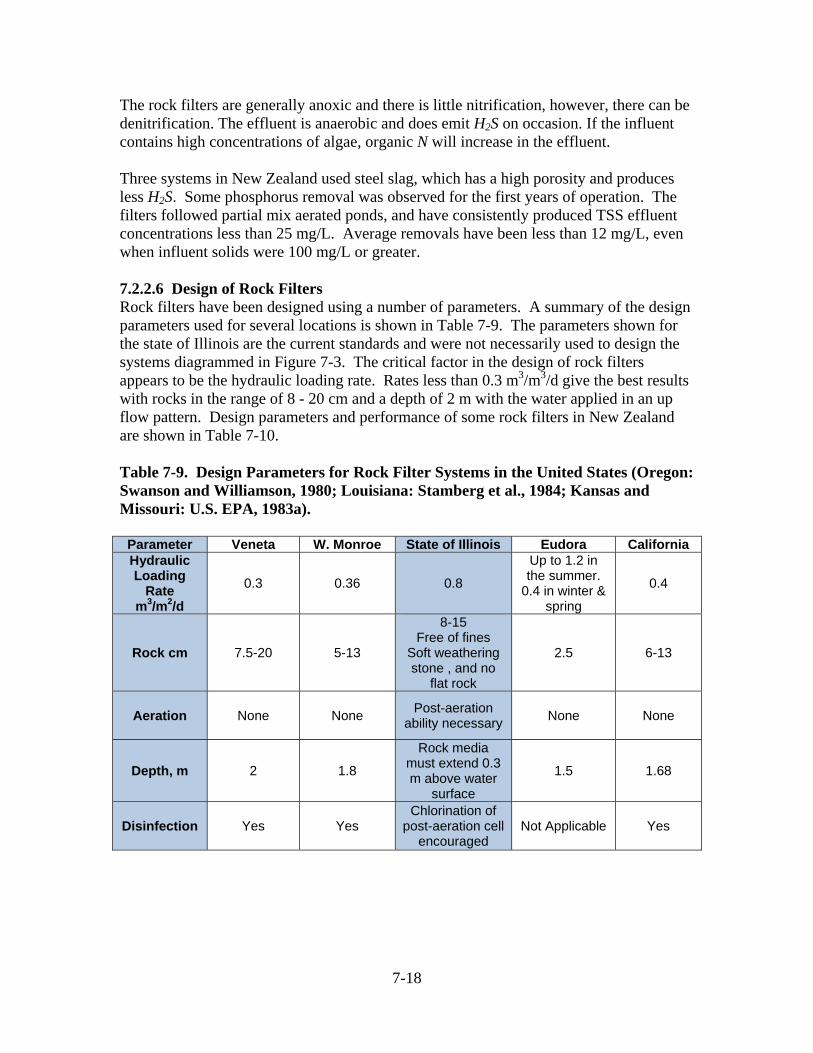
7-18
The rock filters are generally anoxic and there is little nitrification, however, there can be denitrification. The effluent is anaerobic and does emit H2S on occasion. If the influent contains high concentrations of algae, organic N will increase in the effluent. Three systems in New Zealand used steel slag, which has a high porosity and produces less H2S. Some phosphorus removal was observed for the first years of operation. The filters followed partial mix aerated ponds, and have consistently produced TSS effluent concentrations less than 25 mg/L. Average removals have been less than 12 mg/L, even when influent solids were 100 mg/L or greater. 7.2.2.6 Design of Rock Filters Rock filters have been designed using a number of parameters. A summary of the design parameters used for several locations is shown in Table 7-9. The parameters shown for the state of Illinois are the current standards and were not necessarily used to design the systems diagrammed in Figure 7-3. The critical factor in the design of rock filters appears to be the hydraulic loading rate. Rates less than 0.3 m3/m3/d give the best results with rocks in the range of 8 - 20 cm and a depth of 2 m with the water applied in an up flow pattern. Design parameters and performance of some rock filters in New Zealand are shown in Table 7-10. Table 7-9. Design Parameters for Rock Filter Systems in the United States (Oregon: Swanson and Williamson, 1980; Louisiana: Stamberg et al., 1984; Kansas and Missouri: U.S. EPA, 1983a).
Parameter Veneta W. Monroe State of Illinois Eudora California Hydraulic Loading
Rate m3/m2/d
0.3 0.36 0.8
Up to 1.2 in the summer.
0.4 in winter & spring
0.4
Rock cm 7.5-20 5-13
8-15 Free of fines
Soft weathering stone , and no
flat rock
2.5 6-13
Aeration None None Post-aeration ability necessary None None
Depth, m 2 1.8
Rock media must extend 0.3 m above water
surface
1.5 1.68
Disinfection Yes Yes Chlorination of
post-aeration cell encouraged
Not Applicable Yes

7-19
Table 7-10. Design Parameters and Performance of New Zealand Rock Filters (Middlebrooks, 2005).
Waluku Paeroa Ngatea Clarks Beach
Design flow (average) m3/day 3,000 2,067 460 375Current flow (average) m3/day 1,800 2,100 250 290Width m 29.6 22 26.3 32Length m 97.4 131 136.0 62No. of beds 10 8 2 2Total rock filter area m2 28,868 23,056 7,154 3,875Rock size mm 20/10 20/10 20/10 20/10Rock type slag slag slag greywackeRock depth m 0.5 0.5-0.8 0.5-0.8 0.5-0.65Rock filter loading rate (average)
mm/day `62 91 35 75
Rock filter loading rate (average)
m3/m3 day 0.14 0.20 0.08 0.17
Average water depth m 0.45 0.45 0.45 0.45Hydraulic retention time (average)
days 3.3 2.2 5.8 1.5
Year constructed 1993 2000 2002 1998Average water quality (mg/L) CBOD5 average 6 5 3 95 percentile 11 19 6 Suspended Solids average 12 9 6 95 percentile 24 17 9 NH3 average 5 7 15 95 percentile 24 12 27 Total N average 8 10 19 95 percentile 20 17 36 7.2.2.7 Aerated Rock Filter To address the lack of NH3 removal in rock filters, Mara and Johnson (2006) constructed an aerated rock filter with perforated pipe placed in the underdrain. They operated the aerated rock filter in parallel with a non-aerated control over an 18-month period. Facultative pond effluent containing approximately 10 mg/L of NH3 was applied to the filters at a hydraulic rate of 150 L/m2/d during the first eight months of operation and at 300 L/m2/d thereafter. Ammonia concentrations in the aerated filter effluent were less than 3 mg/L, and NO3
- concentrations were approximately 5 mg/L, while the control filter N concentrations were approximately 7 mg/L. Ammonia removal did not occur in the non-aerated control, and there was a statistically significant increase in the mean NH3 concentration between the influent and effluent. Fecal coliform concentrations were reduced in the aerated filter from 103 to 104 per 100mL to a geometric mean count of 65 per 100 mL. BOD5 and TSS removals were much higher in the aerated filter. The 95 percentile effluent concentrations in the aerated filter were 9 and 10 mg/L, respectively, while the effluent concentrations from the control were 38 and 43 mg/L. Increasing the hydraulic loading rate from 150 to 300 L /m2/d did not negatively affect the mean percentage BOD5, NH3 and fecal coliform removals. There was a slight reduction in the TSS removals. It was concluded that the use of aerated rock filters
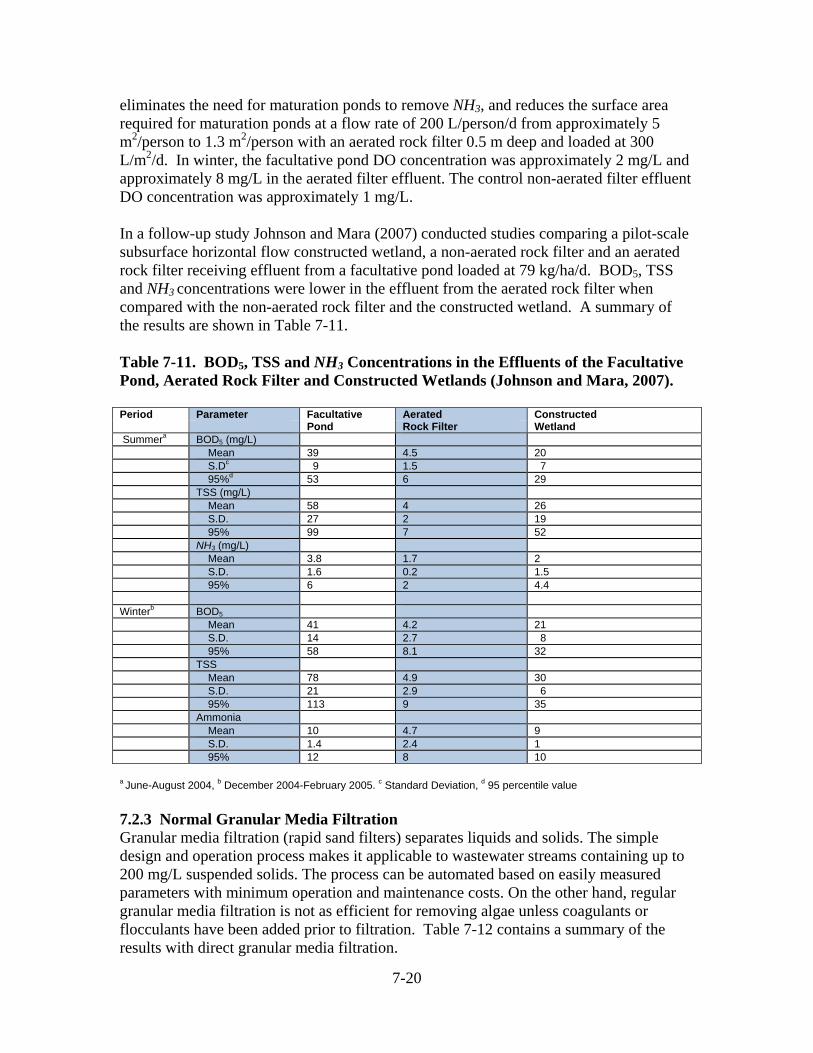
7-20
eliminates the need for maturation ponds to remove NH3, and reduces the surface area required for maturation ponds at a flow rate of 200 L/person/d from approximately 5 m2/person to 1.3 m2/person with an aerated rock filter 0.5 m deep and loaded at 300 L/m2/d. In winter, the facultative pond DO concentration was approximately 2 mg/L and approximately 8 mg/L in the aerated filter effluent. The control non-aerated filter effluent DO concentration was approximately 1 mg/L. In a follow-up study Johnson and Mara (2007) conducted studies comparing a pilot-scale subsurface horizontal flow constructed wetland, a non-aerated rock filter and an aerated rock filter receiving effluent from a facultative pond loaded at 79 kg/ha/d. BOD5, TSS and NH3 concentrations were lower in the effluent from the aerated rock filter when compared with the non-aerated rock filter and the constructed wetland. A summary of the results are shown in Table 7-11. Table 7-11. BOD5, TSS and NH3 Concentrations in the Effluents of the Facultative Pond, Aerated Rock Filter and Constructed Wetlands (Johnson and Mara, 2007). Period Parameter Facultative Aerated Constructed Pond Rock Filter Wetland Summera BOD5 (mg/L) Mean 39 4.5 20 S.Dc 9 1.5 7 95%d 53 6 29 TSS (mg/L) Mean 58 4 26 S.D. 27 2 19 95% 99 7 52 NH3 (mg/L) Mean 3.8 1.7 2 S.D. 1.6 0.2 1.5 95% 6 2 4.4 Winterb BOD5 Mean 41 4.2 21 S.D. 14 2.7 8 95% 58 8.1 32 TSS Mean 78 4.9 30 S.D. 21 2.9 6 95% 113 9 35 Ammonia Mean 10 4.7 9 S.D. 1.4 2.4 1 95% 12 8 10 a June-August 2004, b December 2004-February 2005. c Standard Deviation, d 95 percentile value 7.2.3 Normal Granular Media Filtration Granular media filtration (rapid sand filters) separates liquids and solids. The simple design and operation process makes it applicable to wastewater streams containing up to 200 mg/L suspended solids. The process can be automated based on easily measured parameters with minimum operation and maintenance costs. On the other hand, regular granular media filtration is not as efficient for removing algae unless coagulants or flocculants have been added prior to filtration. Table 7-12 contains a summary of the results with direct granular media filtration.

7-21
Table 7-12. Summary of Direct Filtration with Rapid Sand Filters (d50 = diameter of 50 percent of sand).
Investigator Coagulant Filter
Loading gpm/sf
Filter Depth
cm
Sand Size mm
Findings
Borchardt and O’Melia
(1961)
none
0.2-2 61 d50 = 0.32 Removal declines to 21-45% after 15 hr 50% algae removal
Fe 7 mg/L 2.1 61 d50 = 0.40
Davis and Borchardt
(1966)
none 0.49 NA d50 = 0.75 22% algae removal none 0.49 d50 = 0.29 34% algae removal none 1.9 d50 = 0.75 10% algae removal none 1.9 d50 = 0.29 2% algae removal Fe NA NA d50 = 0.75 45% algae removal
Foss and Borchardt
(1969) none 2 91 d50 = 0.71 pH 2.5, 90% removal
Lynam et al.
(1969) none 1.1 28 d50 = 0.55 62% TSS removal
Kormanik
and Cravens (1978)
none - - - 11-45% TSS removal
Diatomateous earth filtration is capable of producing a high-quality effluent when treating wastewater treatment pond water, but the filter cycles are generally less than 3 hours. This results in excessive usage of backwash water and diatomateous earth, which increases costs and eliminates this method of filtration as an alternative for polishing wastewater treatment pond effluents. 7.2.4 Coagulation-Flocculation Coagulation followed by sedimentation has been applied extensively for the removal of suspended and colloidal materials from water. Lime, alum and ferric salts are the most commonly used coagulating agents. Floc formation is sensitive to parameters such as pH, alkalinity, turbidity and temperature. Most of these variables have been studied, and their effects on the removal of water supply turbidity have been evaluated. In the case of the chemical treatment of wastewater treatment pond effluents, however, the data are not comprehensive. Shindala and Stewart (1971) investigated chemical treatment of treatment pond effluents as a post-treatment process to remove the algae and to improve the quality of the effluent. They found that the optimum dosage for best removal of the parameters studied was 75-100 mg/L of alum. When this dosage was used, the removal of phosphate was 90 percent and the BOD5 was 70 percent.

7-22
Tenney (1968) has shown that at a pH range of 2 to 4, algal flocculation was effective when a constant concentration of a cationic polyelectrolyte (10 mg/L of C-31) was used. Golueke and Oswald (1965) conducted a series of experiments to investigate the relation of hydrogen ion concentrations to algal flocculation. In this study, only H2SO4 was used, and only to lower the pH. Golueke and Oswald found that flocculation was most extensive at a pH value of 3, which agrees with Tenney’s results and reported algal removals of about 80-90 percent. Algal removal efficiencies by cationic polyelectrolytes were not affected in the pH range of 6-10. The California Department of Water Resources (1971) reported that of 60 polyelectrolytes tested, 17 compounds were effective with regard to coagulation of algae and were economically competitive when compared to mineral coagulation used alone. Generally, a dose of less than 10 mg/L of the polyelectrolytes was required for effective coagulation. A daily addition of 1 mg/L of FeCl3 to the algal growth pond resulted in significant reductions in the required dosage of both organic and inorganic coagulants. McGarry (1970) studied the coagulation of algae in treatment pond effluents and reported the results of a complete factorial designed experiment using the common jar test. Tests were performed to determine the economic feasibility of using polyelectrolytes as primary coagulants alone or in combination with alum. McGarry also investigated some of the independent variables that affected the flocculation process, such as concentration of alum, flocculation turbulence, concentration of polyelectrolytes, pH after the addition of coagulants, chemical dispersal conditions, and high rate oxidation pond suspension characteristics. Alum was found to be effective for coagulation of algae from high rate oxidation pond effluent. The lowest cost per unit algal removal was obtained with alum alone (75-100 mg/L). Al-Layla and Middlebrooks (1975) evaluated the effects of temperature on algae removal using coagulation-flocculation-sedimentation. Removal at a given alum dosage decreased as the temperature increased. Maximum algae removal generally occurred at an alum dosage of approximately 300 mg/L at 10 °C. At higher temperatures, alum dosages as high as 600 mg/L did not produce removals equivalent to the results obtained at 10 °C with 300 mg/L of alum. The settling time required to achieve significant removals, flocculation time, organic carbon removal, total P removal, and turbidity removal were found to vary inversely as the temperature of the wastewater increased. Dryden and Stern (1968) and Parker (1976) reported on the performance and operating costs of a coagulation-flocculation system followed by sedimentation, filtration, and chlorination, with discharge to recreational lakes. This system, in Lancaster, California, probably has the longest operating record of any coagulation-flocculation system treating wastewater treatment pond effluent. The TSS concentrations of influent coming to the plant have ranged from about 120 to 175 mg/L, and the plant has produced an effluent with a turbidity of less than 1 Jackson turbidity unit (JTU) most of the time. Aluminum sulfate [Al2(SO4)3] dosages have ranged from 200 to 360 mg/L. The design capacity is 1893 m3/d (0.5 mgd).

7-23
Coagulation-flocculation is not easily controlled and requires expert operating personnel at all times. A large volume of sludge may be produced, which can introduce an additional operating cost. 7.2.5 Dissolved Air Flotation Several studies have shown the dissolved air flotation process to be an efficient and a cost-effective means of algae removal from wastewater treatment pond effluents. The performance obtained in several of these studies is summarized in Table 7-13. Table 7-13. Summary of Typical Dissolved Air Flotation Performance.
Location and Reference
Coagulant and Dose (mg/L)
Overflow Rate
(gpm/sf)
Detention Time
(minutes)
BOD5 Influent (mg/L)
Effluent (mg/L)
% Removed
Stockton 1 Parker (1976)
Alum, 225 Acid added to pH 6.4 2.7a 17a 46 5 89
Lubbock2 Ort (1972) Limec, 150 NA 12b 280-
450 1.3 >99
Eldorado3 Komline-
Sanderson Engineering
(1972)
Alum, 200 4.0c 8c 93 <3 <97
Logan4 Bare (1971) Alum, 300 1.3-2.4d NA NA NA NA
Sunnyvale1 Stone et al.,
(1975)
Alum, 175 Acid added to pH 6.0 to
6.3 2.0e 11e NA NA NA
Stockton1 Parker (1976)
Alum, 225 Acid added to pH 6.4 2.7a 17a 104 20 81
Lubbock2 Ort (1972) Limec, 150 NA 12b 240-
360 0-50 >79
Eldorado3 Komline-
Sanderson Engineering
(1972)
Alum, 200 4.0c 8c 450 36 92
Logan4 Bare (1971) Alum, 300 1.3-2.4d NA 100 4 96
Sunnyvale1 Stone et al.,
(1975)
Alum, 175 Acid added to pH 6.0 to
6.3 2.0e 11e 150 30 80
1California, 2Texas, 3Arizona, 4Utah a 33% pressurized (35-60 psi) recycle b30% pressurized (50 psi) recycle c 100% pressurized recycle d 25% pressurized (45 psi) recycle e 27% pressurized (55-70 psi) recycle Three basic types of dissolved air flotation are employed to treat wastewaters: total, partial and recycle pressurization. These three types are illustrated by flow diagrams in
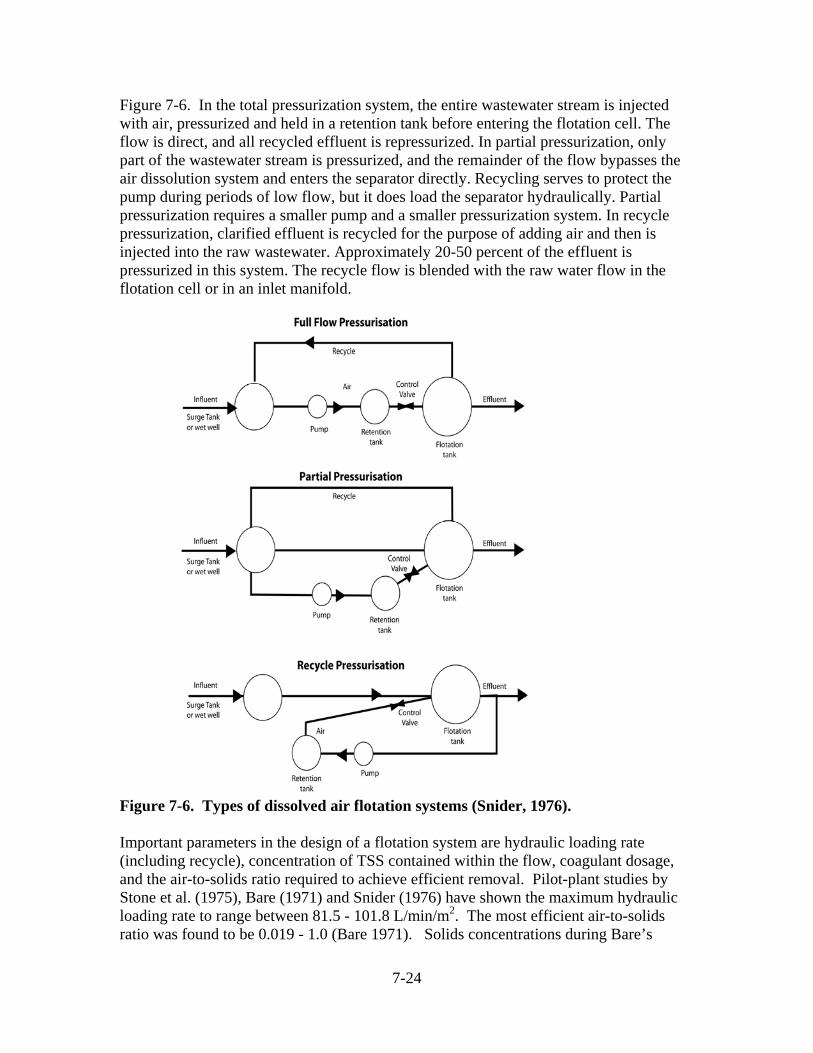
7-24
Figure 7-6. In the total pressurization system, the entire wastewater stream is injected with air, pressurized and held in a retention tank before entering the flotation cell. The flow is direct, and all recycled effluent is repressurized. In partial pressurization, only part of the wastewater stream is pressurized, and the remainder of the flow bypasses the air dissolution system and enters the separator directly. Recycling serves to protect the pump during periods of low flow, but it does load the separator hydraulically. Partial pressurization requires a smaller pump and a smaller pressurization system. In recycle pressurization, clarified effluent is recycled for the purpose of adding air and then is injected into the raw wastewater. Approximately 20-50 percent of the effluent is pressurized in this system. The recycle flow is blended with the raw water flow in the flotation cell or in an inlet manifold.
Figure 7-6. Types of dissolved air flotation systems (Snider, 1976). Important parameters in the design of a flotation system are hydraulic loading rate (including recycle), concentration of TSS contained within the flow, coagulant dosage, and the air-to-solids ratio required to achieve efficient removal. Pilot-plant studies by Stone et al. (1975), Bare (1971) and Snider (1976) have shown the maximum hydraulic loading rate to range between 81.5 - 101.8 L/min/m2. The most efficient air-to-solids ratio was found to be 0.019 - 1.0 (Bare 1971). Solids concentrations during Bare’s
7-25
studies were 125 mg/L. Experimental results with the removal of algae indicate that lower hydraulic rates and air-to-solids ratios than those recommended by the manufacturers of industrial equipment should be employed when attempting to remove algae. In combined sedimentation flotation pilot-plant studies at Windhoek, Namibia, van Vuuren and van Duuren (1965) reported effective hydraulic loading rates to range between 11.2 and 30.5 L/min/m2, with flotation provided by the naturally dissolved gases. Because air was not added, air-solids ratios were not reported. They also noted that it was necessary to use from 125 - 175 mg/L of Al2(SO4)3 to flocculate the effluent containing from 25 - 40 mg/L of algae. Subsequent reports on a total flotation system by van Vuuren et al. (1965) stated that a dose of 400 mg/L of Al2(SO4)3 was required to flocculate a 110 mg/L algal suspension sufficiently to obtain a removal that was satisfactory for consumptive reuse of the water. Based on data provided by Parker et al. (1973), Stone et al. (1975), Bare (1971), and Snider (1976), it appears that a much lower dose of alum can be applied to produce an effluent that will meet present discharge standards. Dissolved air flotation with the application of coagulants performs essentially the same function as coagulation-flocculation-sedimentation, except that a much smaller system is required with the flotation device. Flotation will occur in shallow tanks with hydraulic residence times of 7-20 min, compared with hours in deep sedimentation tanks. Overflow rates can be as high as 81.5-101.8 L/min-m2 with flotation; whereas, a value of less than 40.7 L/min-m2 is recommended with sedimentation. However, it must be pointed out that the sedimentation process is much simpler to operate and maintain than the flotation process, and when applied to small systems, consideration must be given to this factor. The flotation process does not require a separate flocculation unit, and this has definite advantages. It has been shown that it is best to add alum at the point of pressure release where mixing occurs so that the chemicals are well dispersed. Brown and Caldwell (1976) designed two tertiary treatment plants that employ flotation, and have developed design considerations that should be applied when employing flotation. These features are not included in standard flotation units and should be incorporated to ensure good algae removal (Parker, 1976). In addition to incorporating various mechanical improvements, Brown and Caldwell recommended that the tank surface be protected from excessive wind currents to prevent float movement to one side of the tank. It was also recommended that the flotation tank be covered in rainy climates to prevent the breakdown of the floc. Another proposed alternative is to store the wastewater in treatment ponds during the rainy season and then operate the flotation process at a higher rate during dry weather. Dissolved air flotation thickening (DAFT) has been used at the Stockton, California regional wastewater treatment facility for many years to remove algae from the treatment ponds ahead of the tertiary filtration process. Performance results for the period June -

7-26
October 2005 are shown in Figures 7-7 and 7-8. Average pond influent TSS concentrations averaged 74 mg/L (range: 20 - 223). Effluent concentrations averaged 34 mg/L, (range: 15 – 105). The percentage removal averaged 50 percent. In 2009-2010, the DAFT process tanks and internal equipment underwent major rehabilitation. Additional skimmer arms were added to improve removal of floating algae, and the initial results indicate improved performance (Figure 7-9). DAFT influent is secondary effluent that has received further treatment in facultative ponds, then flows through a constructed wetlands that was put in service in 2007. Alum is fed to the DAFT influent for chemical conditioning of the algae solids. Performance results available for 2010 show the influent TSS concentrations average 70 mg/L and effluent TSS concentrations average 17 mg/L, for an average removal efficiency of 76 percent (Larry Parlin, pers. comm. 2010).
Figure 7-7. TSS removal from pond effluent in dissolved air flotation with alum addition (Middlebrooks, 2005).
0
25
50
75
100
125
150
175
Ja … Fe… M… A… O…
Influent TSS, mg/L
Date
TSS Removal in DAF at Stockton, CAPond Eff & DAF InfDAF Effluent In f = 214 & 223
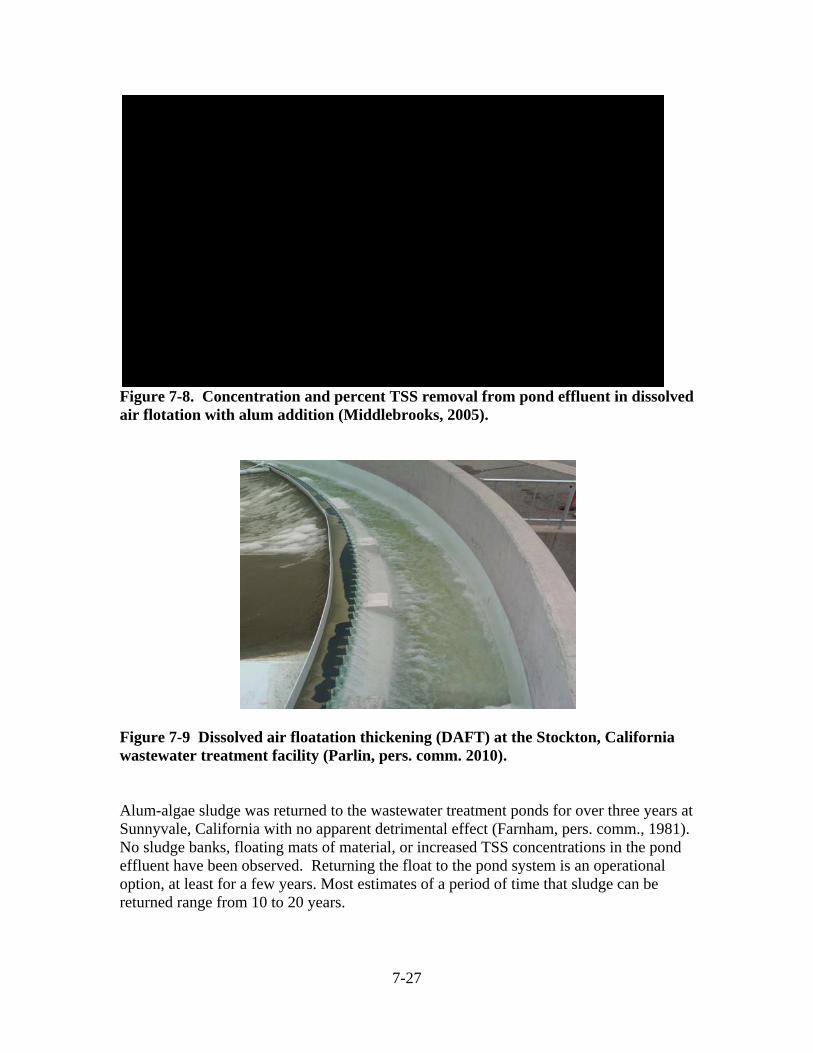
7-27
Figure 7-8. Concentration and percent TSS removal from pond effluent in dissolved air flotation with alum addition (Middlebrooks, 2005).
Figure 7-9 Dissolved air floatation thickening (DAFT) at the Stockton, California wastewater treatment facility (Parlin, pers. comm. 2010). Alum-algae sludge was returned to the wastewater treatment ponds for over three years at Sunnyvale, California with no apparent detrimental effect (Farnham, pers. comm., 1981). No sludge banks, floating mats of material, or increased TSS concentrations in the pond effluent have been observed. Returning the float to the pond system is an operational option, at least for a few years. Most estimates of a period of time that sludge can be returned range from 10 to 20 years.
-40.00
-20.00
0.00
20.00
40.00
60.00
80.00
100.00
-50
0
50
100
150
200
Percent
Removed
TSS
Removed,
mg/L
Date
DAF Data for Stockton, CA
Concentration Removed
% Removal
7-28
Sludge disposal from a dissolved air flotation system can present considerable challenges. Alum-algae sludge is very difficult to dewater and discard. Centrifugation and vacuum filtration of raw alum-algae sludge have produced marginal results. Indications are that lime coagulation may prove to be as effective as alum to produce sludge that is more easily dewatered. Brown and Caldwell (1976) evaluated heat treatment of alum-algae sludges using the Porteous, Zimpro® low-oxidation, and Zimpro® high-oxidation processes without great effect. The Purifa process, using chlorine to stabilize the sludge, produced a sludge that was dewaterable on sand beds or in a pond. If algae are killed before entering an anaerobic digester, the proportion of volatile matter destruction and dewatering can provide more useful results. But, as with the other sludge treatment and disposal processes, additional operations and costs are incurred, which may make the option of dissolved air flotation less competitive financially. 7.3 OPERATIONS MODIFICATIONS AND ADDITIONS 7.3.1 Autoflocculation and Phase Isolation Autoflocculation of algae (natural settling under specific environmental conditions) has been observed in some studies (Golueke and Oswald, 1965; McGriff and McKinney, 1971; McKinney, 1971; Hill et al., 1977). Chlorella was the predominant alga occurring in most of the cultures. Laboratory-scale continuous experiments with mixtures of activated sludge and algae have produced large bacteria-algae flocs with good settling characteristics (Hill et al., 1977; Hill and Shindala, 1977). Floating algal blankets have been reported in the presence of chemical coagulants in some cases (Shindala and Stewart, 1971; van Vuuren and van Duuren, 1965). This may be caused by the entrapment of gas bubbles produced during metabolism or by the fact that, at a particular stage in the growth cycle, algae have neutral buoyancy. In an 11,355 L/hr (3000 g/h) pilotplant that combined flocculation and sedimentation, a floating algal blanket was formed with alum doses of 125 -170 mg/L. About 50 percent of the algae was able to be skimmed from the surface (van Vuuren and van Duuren, 1965). Given the unpredictable occurrence of conditions necessary for autoflocculation, it can not be considered a reliable method for removing algae from wastewater treatment ponds. Phase isolation is defined as the operation of a pond system to create natural conditions favorable to settling of algae and some success has been reported based on this phenomenon to remove algae from pond effluents. The results of a study by McGriff (1981) of a full-scale operation of a phase isolation system were not consistent. Oswald and Green, (2000), enhanced algal growth is in a high rate pond with a raceway configuration and a slow-moving paddle wheel to keep algae suspended. This concentrated algal slurry is sent to a settling basin, where the algae can be concentrated further and sent to a drying bed. There is potential to use the algal slurry for feed supplement, soil fertilization and amendment and, most recently, for biofuel production (Woertz et al., 2009, Brune et al., 2009).

7-29
7.3.2 Baffles and Attached Growth The enhancement of attached microbial growth in oxidation ponds is an apparently practical solution for maintaining biological populations while still obtaining the treatment desired. Although baffles are considered useful primarily to ensure good mixing and to eliminate the problem of short-circuiting, they provide a substrate for bacteria, algae, and other microorganisms to grow (Reynolds et al., 1975; Polprasert and Agarwalla, 1995). In general, attached growth surpasses suspended growth if sufficient surface area is available. In anaerobic or facultative ponds with baffling or biological disks, the microbiological community consists of a gradient of algae to photosynthetic, chromogenic bacteria and, finally, to nonphotosynthetic, nonchromogenic bacteria (Reynolds et al., 1975). In these experiments, the microbial growth associated with the baffled system was identified as the mechanism that produced a more effective treatment. Simple fixed baffles constructed of wood or plastic, floating plastic baffles used to improve hydraulic characteristics, or, indeed, any surface can provide a substrate on which microbial growth can take place. Polprasert and Agarwalla (1995) demonstrated the significance of biofilm biomass growing on the side walls and bottoms of ponds and presented a model for substrate utilization in facultative ponds using first-order reactions for both suspended and biofilm biomass. 7.3.3 Land Application The design and operation of land treatment systems is described in detail in Reed et al., (1995), Crites et al., (2000) and U.S. EPA (2006). These publications should be consulted before designing a land application system to polish a pond effluent. Ecological conditions will dictate whether this is as an option that should be considered. 7.3.4 Macrophyte and Animal Systems Various macrophytic floating plans have been used to reduce algal concentrations and TSS in maturation ponds. Rittman and McCarty (2001). Detailed design information can be obtained in Reed et al., (1995), Pearson and Green (1995), Mara et al. (1996), Pearson et al. (2000) and Shilton (2005). 7.3.4.1 Floating Plants Water hyacinths (Eichhornia crassipes), duckweed (Lemna spp), pennywort (Centella asiatica), and water ferns (Azolla spp.) appear to offer the greatest potential for wastewater treatment. Each has its own environmental requirements, and hyacinths, pennywort, and duckweeds are the only floating plants that have been evaluated in pilot - or full-scale systems. Detailed design considerations are presented in Reed et al. (1995). Information about the use of these plants to improve wastewater quality for reuse can be found in Rose (1999). 7.3.4.2 Submerged Plants Submerged aquatic macrophytes for treatment of wastewaters have been studied extensively in the laboratory, greenhouses, a pilot study by McNabb (1976), and in large
7-30
scale wetland storm water treatment systems designed to remove P to less than 20 mg/L (South Florida Water Management District, 2003). 7.3.4.3 Daphnia and Brine Shrimp Daphnia spp. are filter feeders and their main contribution to wastewater treatment is the removal of suspended solids, particularly algae (U.S. EPA, 2002). Daphnia is sensitive to the concentration of NH3 in wastewater, which is toxic to invertebrates. To be effective, shading is required to prevent the growth of algae that will result in high pH values during the daytime. The addition of acid and gentle aeration may be necessary. 7.3.4.4 Fish Fish have been grown in treated wastewaters for centuries, and, where toxics are not encountered, the process has been successful. Many species of fish have been used in wastewater treatment, but fish activity is temperature dependent. Most grow successfully in warm water. Catfish and minnows are exceptions. Dissolved oxygen concentrations are critical and the presence of NH3 is toxic to the young of the species. Detailed studies of fish in wastewater treatment ponds have been conducted by Coleman (1974) and Henderson (1979). Numerous studies of fish culture have been conducted around the world. Polprasert and Koottatep (2005) presented an excellent summary of the use of algae eating fish in pond systems. 7.4 CONTROL OF ALGAE AND DESIGN OF SETTLING BASINS Control of algae in wastewater treatment pond effluents has been a major concern throughout the history of the use of these systems. Algae grow in maturation and polishing ponds following all types of treatment processes, which increases the TSS in the effluent. State design standards requiring long detention times in the final cell in a pond system have inadvertently exacerbated the problem. In recognition of the difference between the source of the TSS in the influent and the effluent, the state of Minnesota has mandated a higher TSS limit of 45 mg/L for ponds. (Steve Duerre, pers. comm.) It has been established that few, if any, of the solids in pond effluents are fecal matter or material entering the pond system. This has led to much discussion about the necessity to remove algae from pond effluents. Although the concern that the TSS might harbor human pathogens may not be realistic, when the algae die, settle out and decay, they do create some O2 demand on the receiving stream. The concern about decay and O2 consumption has led to investigations of the most effective methods to remove algae and how to design systems to minimize growth in the settling basins. Toms et al. (1975) studied algal growth rates in polishing ponds receiving activated sludge effluents for 18 months. They concluded that growth rates for the dominant species were less than 0.48 /d, and if the HRT was less than two days, algal growth would not be a problem. At HRT less than 2.5 days, the effluent TSS decreased. Uhlmann (1971) reported no algal growth in hyper-fertilized ponds when the detention times were less than 2.5 days. Toms et al. (1975) evaluated one- and four-cell polishing ponds and found that for HRT beyond 2.5 days the TSS increased in both ponds, but significant growth did not occur until after 4 - 5 days in the four-cell pond.
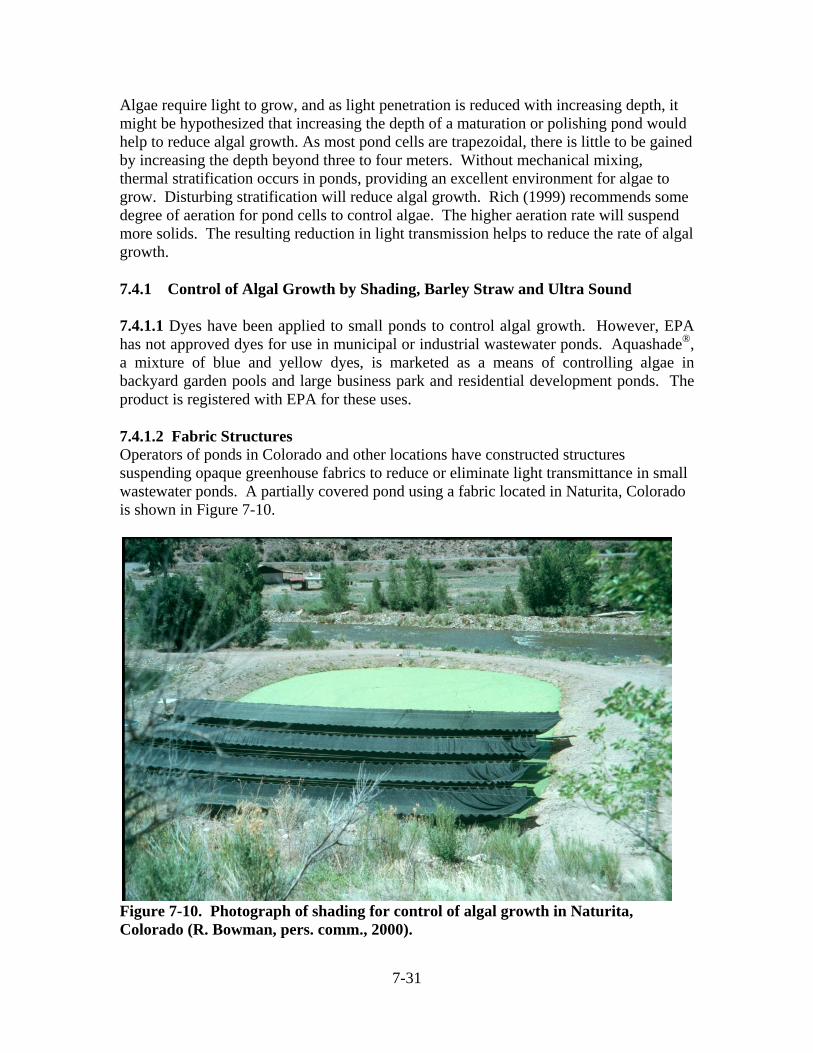
7-31
Algae require light to grow, and as light penetration is reduced with increasing depth, it might be hypothesized that increasing the depth of a maturation or polishing pond would help to reduce algal growth. As most pond cells are trapezoidal, there is little to be gained by increasing the depth beyond three to four meters. Without mechanical mixing, thermal stratification occurs in ponds, providing an excellent environment for algae to grow. Disturbing stratification will reduce algal growth. Rich (1999) recommends some degree of aeration for pond cells to control algae. The higher aeration rate will suspend more solids. The resulting reduction in light transmission helps to reduce the rate of algal growth.
7.4.1 Control of Algal Growth by Shading, Barley Straw and Ultra Sound
7.4.1.1 Dyes have been applied to small ponds to control algal growth. However, EPA has not approved dyes for use in municipal or industrial wastewater ponds. Aquashade®, a mixture of blue and yellow dyes, is marketed as a means of controlling algae in backyard garden pools and large business park and residential development ponds. The product is registered with EPA for these uses.
7.4.1.2 Fabric Structures Operators of ponds in Colorado and other locations have constructed structures suspending opaque greenhouse fabrics to reduce or eliminate light transmittance in small wastewater ponds. A partially covered pond using a fabric located in Naturita, Colorado is shown in Figure 7-10.
Figure 7-10. Photograph of shading for control of algal growth in Naturita, Colorado (R. Bowman, pers. comm., 2000).
7-32
The screening effect has been successful, but in some cases fabrics were not fastened adequately and they were damaged by the wind. Covering the final pond with adequate protection from the wind should reduce or eliminate algal growth. With full coverage of the surface, anaerobic conditions may develop and aeration of the effluent may be necessary to meet discharge standards. Partial shading in correct proportions should reduce the possibility of creating anaerobic conditions. 7.4.1.3 Barley Straw In 1980 it was observed that the addition of barley straw to a lake reduced the algal concentration. Placing barley straw in ponds has been proposed as a means of controlling algal growth. Details for the application of barley straw is given in IACR-Centre for Aquatic Plant Management (1999) and the state of Illinois guidance for application and discussion of how to classify barley straw in this application is found in Appendix H. Figure 7-11 shows a barley straw application in the final cell in an aerated pond system in New Baden, Illinois (Zhou et al., 2005). During decomposition, the chemicals listed in Table 7-11 are released to the water and inhibit the growth of algae (Everall and Lees, 1997). The acceptability of this method of algal control by regulatory agencies has not been resolved.
Figure 7-11. A barley straw boom in cell 3, New Baden, Illinois wastewater pond system. Table 7-14. List of Chemicals Produced by Decomposing Straw (Everall and Lees, 1997). Acetic Acid 3-Methylbutanoic Acid 2-Methylbutanonic Acid Hexanoic Acid

7-33
Octanoic Acid Nonanoic Acid Decanoic Acid Dodecanoic Acid Tetradecanoic Acid Hexadecanoic Acid 1-Methylnaphthalene 2-(1,1-Dimethlyethyl Phenol) 2,6-Dimethoxy-4-(2-propenyl) Phenol 2,3-Dihydrobenzofuron 5,6,7,7A-Tetrahydro-4,4,7A-trimethyl-2(4H) benzofuranone 1,1,4,4-Tetramethyl-2,6-bis(methylene) cyclohexone 1-Hexacosene 11 Unidentified 7.4.1.4 Ultra Sound Ultra sound devices have been used for algal control in golf course ponds, large residential area ponds, and water treatment storage ponds, but limited data are available for municipal pond systems. A microcosm study at the Centre for Aquatic Plant Management (CAPM) in Reading, Berkshire, United Kingdom evaluated the efficacy of several treatment options to control algae (Clarke, 2004). Methods included an ultrasonic device, a recirculating pump, bacteria, barley straw, Aquavantage (electromagnet treatment), EcoFlow (fixed magnet) and a control. The results of the experiments are summarized in Figure 7-12. According to Clarke (2004), none of the treatments appeared to remove the algae to a level that would meet water quality requirements. Differences in the level of algae could be seen, but some of the four replicate tanks in all treatments remained turbid and green. The only tanks that were clear were found to be populated by Daphnia spp., an invertebrate herbivore. Clarke reported that no significant differences could be found between treatments. The variability and experimental challenges made it difficult to draw conclusions as to the possible causes of either growth or inhibition of growth. The CAPM investigated the mode of action of ultrasound on algae. Clarke reported Spirogyra and Selenastrum were damaged irreversibly by the treatment.

7-34
Figure 7-12. Change in chlorophyll over time under different treatment conditions (Clarke, 2004).
7.5 COMPARISON OF VARIOUS DESIGN PROCEDURES The variety of configurations and objectives of the design approaches for nutrient removal make it difficult to make direct comparisons to determine which will be the most effective for a given site. Reasonable reaction rates must be selected, but if the pond hydraulic system is designed and constructed so that the theoretical HRT is approached, reasonable success can be assured with all of the design methods. Short-circuiting is the greatest deterrent to successful pond performance, barring any toxic effects. The importance of the hydraulic design of a pond system to achieve water quality objectives cannot be overemphasized. 7.6 OPERATIONAL MODIFICATIONS TO FACULTATIVE PONDS 7.6.1 Controlled Discharge Ponds No rational or empirical design model exists specifically for the design of controlled discharge wastewater ponds. The unique features of controlled discharge ponds are long-term retention and periodic, controlled discharge usually once or twice a year. Rational and empirical design models applied to facultative pond design may also be applied to the design of controlled discharge ponds, provided allowance is made for the required larger storage volumes. Application of the ideal plug flow model developed for facultative ponds can be applied to controlled discharge ponds if HRTs of less than 120 days are considered. A study of 49 controlled discharge ponds in Michigan indicated that discharge periods vary from less than 5 days to more than 31 days, and residence times were 120 days or greater (Pierce, 1974). Ponds of this type have operated satisfactorily in the north-central United States using the following design criteria:
7-35
• Overall organic loading: 22-28 kg BOD5/ha/d (20-25 lb BOD5/ac/d) • Liquid depth: Not more than 2 m (6 ft) for the first cell, not more than 2.5 m (8 ft)
for subsequent cells • Hydraulic detention: At least 6 months of storage above the 0.6 m (2 ft) liquid
level (including precipitation), but not less than the period of ice cover • Number of cells: At least 3 for reliability, with piping flexibility for parallel or
series operation The design of the controlled discharge pond must include an analysis showing that receiving stream water quality standards will be maintained during discharge intervals, and that the receiving watercourses can accommodate the discharge rate from the pond. The design must also include a recommended discharge schedule. Selecting the optimum day and hour for release of the pond contents is critical to the success of this method. The operation and maintenance manual must include instructions on how to correlate pond discharge with effluent and stream quality. The pond contents and stream must be carefully monitored before and during the release of the pond contents. In a typical program, discharge of effluents follows a consistent pattern for all ponds. The following steps are usually taken:
• Isolate the cell to be discharged, usually the final one in the series, by shutting off the valve on the inlet line from the preceding cell.
• Arrange to analyze samples for BOD5, TSS, VSS, pH, and other parameters
which may be required for a particular location.
• Plan work so as to be able to spend full time on control of the discharge throughout the period.
• Sample contents of the cell to be discharged for DO, noting turbidity, color, and
any unusual conditions.
• Monitor conditions in the stream to receive the effluent.
• Notify the state regulatory agency of results of these observations and plans for discharge and obtain approval.
• If discharge is approved, commence discharge, and continue so long as weather is
favorable, DO is near or above saturation values, and turbidity is not excessive following the prearranged discharge flow pattern among the cells.
o Draw down the last 2 cells in the series (if there are 3 or more) to about 46 - 60 cm (18 - 24 in) after isolation, interrupting the discharge for a week or

7-36
more to divert raw waste to a cell that has been drawn down, and resting the initial cell before its discharge.
o When the first cell is drawn down to about 60 cm (24 in) depth, the usual series flow pattern, without discharge, is resumed.
o During discharge to the receiving waters, samples should be taken at least 3 times each day near the discharge pipe for immediate DO analysis. Additional testing may be required for TSS.
Experience with these ponds is limited to northern states with seasonal and climatic influences on algal growth. See Appendix G for step-by-step instructions for controlled discharge operation (Minnesota Pollution Control Authority). The process will be quite effective for BOD5 removal in any location and will also work with a more frequent discharge cycle than semi-annually, depending on receiving water conditions and requirements. Operating the isolation cell on a fill-and-draw batch basis is similar to the “phase isolation” technique. 7.6.2 Complete Retention Ponds In areas of the United States where the moisture deficit (evaporation minus rainfall) exceeds 75 cm (30 in) annually, a complete retention wastewater pond may prove to be the most economical method of disposal. Complete retention ponds must be sized to provide the necessary surface area to evaporate the total annual wastewater volume plus the precipitation that would fall on the pond. The system should be designed for the maximum wet year and minimum evaporation year of record if overflow is not permissible under any circumstances. Less-stringent design standards may be appropriate in situations where occasional overflow is acceptable or an alternative disposal area is available under emergency conditions. Monthly evaporation and precipitation rates must be known to properly size the system. Complete retention ponds usually require large land areas, and these areas may not be productive once they have been committed to this type of system. Land for this system must be naturally flat or be shaped to provide ponds that are uniform in depth, and have large surface areas. The design procedure for a complete retention wastewater pond system is presented in the following example. 7.6.2.1 Design Conditions See Appendix C, Example C-7-3. 7.6.3 Hydrograph Controlled Release The hydrograph controlled release (HCR) pond is a variation of the controlled discharge pond. This management practice was first put into practice in the southern United States, but can be used successfully in most areas of the world. In this case the discharge periods are controlled by a gauging station in the receiving stream and are allowed to occur during high flow periods. During low flow periods, the effluent is stored in the HCR pond.

7-37
The process design uses conventional facultative or aerated ponds for the basic treatment, followed by the HCR cell for storage and/or discharge. No treatment allowances are made during design for the residence time in the HCR cell; its sole function is storage. Depending on stream flow conditions, storage needs may range from 30 - 120 days. The design maximum water level in the HCR cell is typically about 2.4 m (8 ft), with the minimum water level at 0.6 m (2 ft). Other physical elements are similar to conventional pond systems. The major advantage of the HCR system is the possibility of utilizing lower discharge standards during high flow conditions as compared to a system designed for very stringent low flow requirements operated on a continuous basis. A summary of the design approach is shown in Appendix B. Table 7-15. Hydrograph Controlled Release Pond Design Basics Used in United States. a. Basic Principle: At critical low river flow, BOD5 and TSS loadings are reduced by restricting effluent discharge rates rather than decreasing concentration of pollutants. Zirschsky and Thomas (1987). b. Pond system must be sized to retain wastewater during low flow (Q10/7). Use existing ponds or build storage ponds. Q10/7 = once-in-10-year low flow rate for 7-day period. Zirschsky and Thomas (1987). c. Assimilative capacity of receiving stream must be established by studying historical data or estimated using techniques such as that proposed by Hill and Zitta (1982). Zirschsky and Thomas (1987) performed a nationwide assessment of HCR systems, which showed that they are effective, economical and simple to operate. HCR systems were also found to be an effective means of upgrading a pond effluent. 7.7 COMBINED SYSTEMS In certain situations it is desirable to design pond systems in combinations, i.e., an anaerobic or an aerated pond (Li et al., 2006) followed by a facultative or a polishing pond. These combinations use the same design as the individual ponds. For example, the aerated pond would be designed as described in Chapter 3, Section 3.4, and the predicted effluent quality from this unit would be the influent quality for the facultative pond, which would be designed as described in Chapter 3, Section 3.3. Many of the proprietary systems described in Chapter 4 are combinations of various types of ponds. 7.8 PERFORMANCE COMPARISONS WITH OTHER REMOVAL METHODS Designers and owners of small systems are strongly encouraged to use as simple a technology as feasible. Experience has shown that small communities or larger municipalities without properly trained operating personnel and access to spare parts, inevitably encounter serious maintenance problems using sophisticated technology and frequently fail to meet effluent standards. Methods discussed in this chapter that require good maintenance and operator skills are dissolved air flotation, centrifugation, coagulation-flocculation, and granular media filtration (rapid sand or mixed-media filters with chemical addition). At locations where operation and maintenance are available, these processes can be made to work well. In summary, there are many methods of removing or controlling algae concentrations in pond effluents. Selection of the proper method for a particular site is dependent on many

7-38
variables. Small communities with limited resources and untrained operating personnel should select as simple a system as is suitable to the site situation. In rural areas with adequate land, ponds such as controlled discharge ponds or hydrograph controlled release ponds are an appropriate choice. In arid areas, the total containment pond should be considered. Performance by these types of treatment is controlled by selecting the time of discharge and can be managed to produce an effluent (BOD5 and TSS < 30 mg/L) that meets compliance standards. Where land is limited and resources and personnel are not available, it is best to utilize relatively simple methods to control algae in effluents. Intermittent sand filters, application of effluent to farmlands, overland flow, rapid infiltration, constructed wetlands, and rock filters are reasonable choices. Intermittent sand filters with low application rates and a warm climate will provide nitrification. Application to farm land will reduce both N and P, while producing a satisfactory effluent.
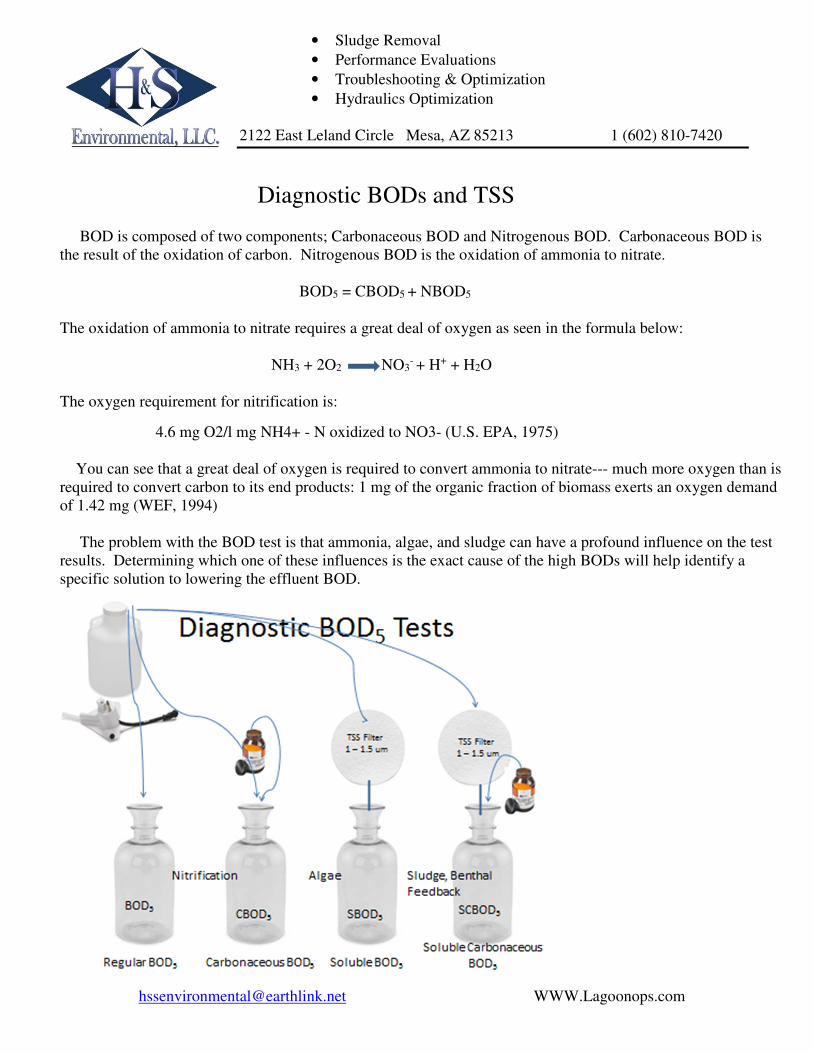
[email protected] WWW.Lagoonops.com
• Sludge Removal
• Performance Evaluations
• Troubleshooting & Optimization
• Hydraulics Optimization
2122 East Leland Circle Mesa, AZ 85213 1 (602) 810-7420
Diagnostic BODs and TSS
BOD is composed of two components; Carbonaceous BOD and Nitrogenous BOD. Carbonaceous BOD is
the result of the oxidation of carbon. Nitrogenous BOD is the oxidation of ammonia to nitrate.
BOD5 = CBOD5 + NBOD5
The oxidation of ammonia to nitrate requires a great deal of oxygen as seen in the formula below:
NH3 + 2O2 NO3- + H+ + H2O
The oxygen requirement for nitrification is: 4.6 mg O2/l mg NH4+ - N oxidized to NO3- (U.S. EPA, 1975)
You can see that a great deal of oxygen is required to convert ammonia to nitrate--- much more oxygen than is
required to convert carbon to its end products: 1 mg of the organic fraction of biomass exerts an oxygen demand
of 1.42 mg (WEF, 1994)
The problem with the BOD test is that ammonia, algae, and sludge can have a profound influence on the test
results. Determining which one of these influences is the exact cause of the high BODs will help identify a
specific solution to lowering the effluent BOD.

[email protected] WWW.Lagoonops.com
Failing to understand the source and cause of the BOD is to potentially apply the wrong solution to achieving
10/15s. waste both time and money on a solution that may yield few results toward a 10/15 solution.
• BOD5Regular Five Day BOD
5 A standard used to measure the strength of wastewater.
BOD5 = CBOD
5 + NBOD
5 Used as a standard. Also used as a testing starting point to
understand more about what is going on in a lagoon. A BOD is needed to calculate NBOD
5; an indication of a lagoon’s ability to nitrify.
• SBOD5/Filtered BOD5. Also called a Soluble BOD
5. The BOD
5 test sample is first run
through a filter. Measures the most readily oxidizeable portion of the wastewater sample. SBOD
5 = SCBOD
5 + SNBOD
5 Rich, (1999) needed to calculate SCBOD
5“…it is unusual to
see SBOD5 in the effluent greater than 20% of the total”. Richard & Bowman (1991)
• CBOD5Carbonaceous Biological Demand. The BOD
5 test run with a nitrification
suppressant added to inhibit nitrification’s effect on dissolved oxygen in the BOD5 test
bottle. CBOD5 = BOD
5-NBOD
5 A better measure of a lagoon’s ability to stabilize waste.
• NBOD5 = BOD
5-CBOD
5 = The relative number of nitrifying bacteria in the BOD test bottle.
Rich (1999) • SCBOD
5:Soluble Carbonaceous BOD
5 The BOD
5 test run after it is filtered and the
nitrification suppressant is added. The influence of a lagoon’s sludge blanket in feeding BOD back to the water column. Also used with CBOD
5 to determine algae’s effect on the
BOD5 test: (PBOD
5)
• PBOD5 = CBOD
5 – SCBOD
5 A PBOD > 70% of the BOD
5 in the effluent indicates a solids
loss problem” Richard & Bowman (1991). Also assumed to be algae’s influence on the BOD
5 test result.
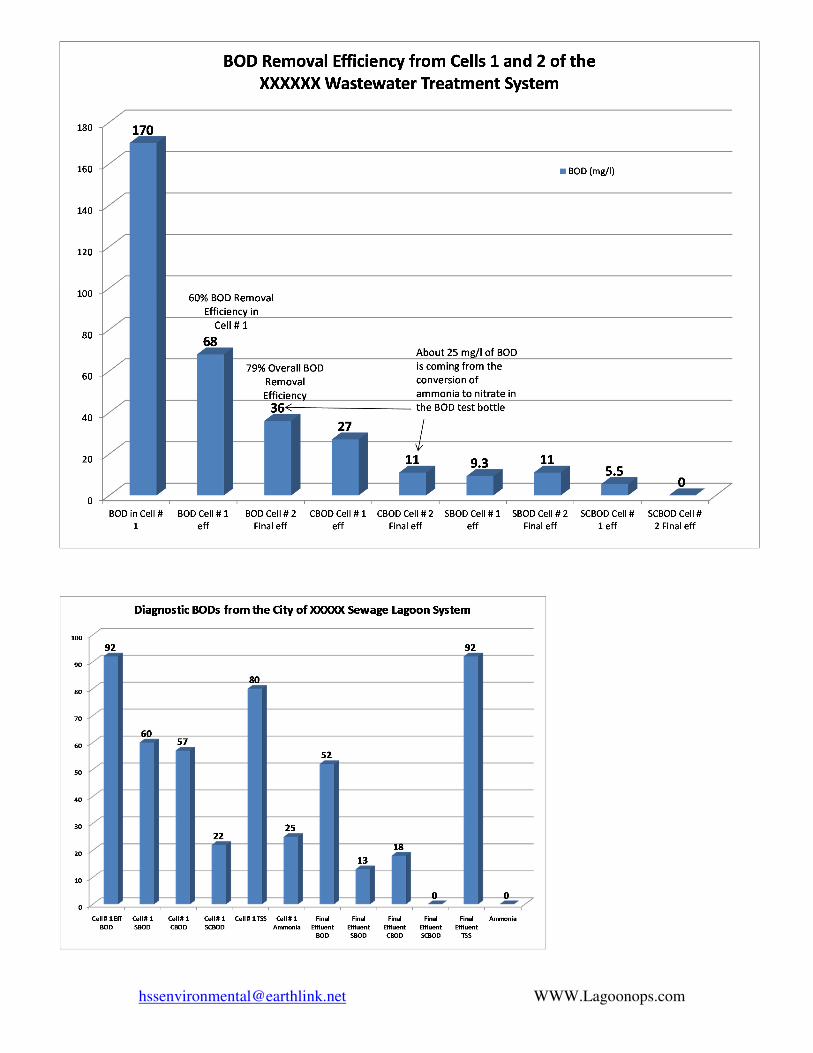
[email protected] WWW.Lagoonops.com

[email protected] WWW.Lagoonops.com
Determining Where the BOD Problem is Occurring
What are the BOD5 and CBOD5 coming into and out of each cell?
Intra-Pond Testing
A primary treatment cell should be removing between 60 to 80% of a pond’s influent BOD. If not, then
determine why. For solving BOD problems there is a where the BOD problem is occurring and why a BOD
problem is occurring and when it is occurring. Run a series of diagnostic BODs between each pond to
determine the cause of a BOD problem. Because of the influence of accumulated sludge, algae, and/or
nitrification in the BOD test bottle, one of the ponds may be adding BOD back to the system. Isolate the
cause and location and timing of the BOD problem to effectively reduce effluent BOD.
Diagnostic BODs are not something you do every week or each month but several times a year to identify
the cause or the WHY of the elevated BOD. All this takes the guess work out by knowing why the problem
is occurring and then take measures to solve the problem.

[email protected] WWW.Lagoonops.com
The same type of thing can be done with the TSS test. Have the lab take the filter used in the TSS test
and look at it under the microscope. Look for black spots indicating sludge particles leaving with the
effluent. Look for bacteria floc, or anything else unusual leaving with the effluent. High TSS could be
caused by a rotifer or daphnia bloom. It could be caused by sludge particles leaving with the effluent. You
will never know until you look.
Know what types of solids are leaving with the lagoon effluent.
Each type of solid material leaving a lagoon has a meaning. Sludge particles leaving with a lagoon
effluent mean it may be time to desludge or raise the effluent discharge pipe. The presence of filamentous
bacteria may be evidence of the need to add more air or reduce the loading to the lagoon system. Certain
other type of filaments may indicate excessive oils or grease in the system. Sometimes a rotifer or daphnia
bloom may get out with the effluent and be picked up as TSS. Ask your lab to identify the types of solids
leaving your pond system.
A Volatile Suspended
Solids (VSS) test will
help further determine if
the TSS sample is
composed mostly of algae
or nonvolatile material.
Low VSS indicates the
presence of sludge solids,
grit, gravel, etc.
Steve Harris
President
H&S Environmental, LLC

CBX ProOxidizer is a biochemical formulation, scientifically designed to accelerate the oxidation ofbio-solids in wastewater lagoons, digesters, collection systems, percolation basins and spray fields.CBX ProOxidizer produces quicker results, with less maintenance and greater efficiency.
2 MILLION GALLONS OF SLUDGE REMOVED IN 16 MONTHS, SAVING = $140,000+
Calvert City, Kentucky revealed a29.8% sludge reduction in Cell 1over the last 16 months of usingCBX ProOxidizer. The SecondaryCell experienced a 50% overallsludge blanket volume reduction.This is equivalent to 667,723 gal-lons of sludge.
With CBX ProOxidizer “pay-for-perform-ance” or “per-acre-dredging” programs thereare no disposal costs, no odors, no permits,no land application, land filling, no truckingoffsite and you only pay when sludge isremoved. Sludge is oxidized on site over timewhile the lagoon remains online.We developed a revolutionary spot removaltechnique that gives wastewater operators theability to target problem areas and removesludge in increments that fit budgets andincreases lagoon efficiency. In the exampleabove in Chandler Arizona, a 1 acre sectionof sludge was marked and removed by 50% (from an average 79.2” of sludge down to 42”) in 6 months. This techniqueallows the costs of dredging to be spread over time without hindering operations in the slightest.
COCA COLA SAVES $300,000 A YEAR IN REMOVAL COSTS
Coca Cola has saved over $300,000in a year at one bottling plant byoptimizing their wastewater systemusing CBX ProOxidizer & our othersolutions. CBX ProOxidizer works byreducing sludge on-site without tak-ing lagoons offline or using mechan-ical removal processes. Sludgeremoval is guaranteed!
THE ONLY SLUDGE REMOVAL SPOT TREATMENT, TARGETS HIGH BUILDUP AREAS

CBX ProOxidizer has a long history of unplugging themost stubborn non-perking basins. In this case studyCBX ProOxidizer helped a series non-perking basinsto start percolating within 42 hours, when previous toapplication it took 2 to 3 weeks. Don’t waste time till-ing basins, use CBX ProOxidizer with less effort andlower cost.
CBX PROOXIDIZER REMOVES BLACK PLUG LAYER FROM PERCOLATION BASINS
LIFT STATION CLEAN UP AND ODOR REMOVAL
Do you have an odor or grease problem in your lift station? Fats,oils and grease (F.O.G.) build up in lift stations producing horri-ble odors. CBX ProOxidizer removes the F.O.G. build up andimmediately eliminates the odor.
The residents surrounding theMesa Oaks lift station atMission Hills CSD inCalifornia, would constantlycomplain of noxious hydro-gen sulfide odors. Residentswould not even barbeque outside on the weekendsbecause of the odors. After adding CBX ProOxidizer to the lift sta-tion, odors were completely and immediately eliminated. Nowwhenever there is an odor problem in another part of the collectionsystem, the wastewater superintendent simply adds CBX ProOxidizerdirectly into that lift station to spot treat the odors.
CBX ProOxidizer has also eliminatedgrease throughout the collection system.Typically a 3 inch cake of greaseclogged the top of the gravity main overthe first two manholes leading to thesewer plant. After applications of CBXProOxidizer there is no more grease
build up. The headworks use to stink and flow black, now it is odorfree and the flow looks like grey water.
"Mission Hills CSD has been looking for a solutionto our lift station's odor and grease build up foryears. We have been injecting Bioxide® with someresults but we would still get complaints about thehorrible odors. After seeing success from injectingCBX ProOxidizer into our lagoons and seeingsludge removal, I asked our waste water consultantSteve Harris what he recommended for our lift sta-tions. He said CBX ProOxidizer would also cleanout our lift station and remove odors. He was rightand we've been using it ever since."
Sean De Havilin, Wastewater SuperintendentMission Hills CSD
Steve Harris, author of the book “WastewaterLagoon Troubleshooting” and sought after lagoonconsultant says about CBX ProOxidizer:
“After 18 years of sludge judging lagoons, opti-mizing lagoons, troubleshooting lagoons, andtraveling the world to solve lagoon problems, Ihave never seen a more refined and bioactiveproduct than CBX ProOxidizer.
I have devoted my career to optimizing waste-water lagoon systems, trained thousands of lagoonoperators, engineers, and state regulators, andhave even written a book on the subject of waste-water lagoon troubleshooting. I have seen lots ofproducts making all sorts of claims about lagoonsludge removal, but CBX ProOxidizer is the onlylagoon sludge removal product I will recommend.”
TESTIMONIALS
Growing with a vision for the future

Did you know that Worms can purify wastewater from communities and industries.
BIDA® = Green + Clean + Low Cost
Our Technology

Our Experience
Over 100 plants installed in 5 countries (Chile, NZ, Spain, Mexico and Brazil)
Adopted by food industry and rural communities
Tested in extreme climate conditions including Antarctica and Atacama desert

CLEANTECH OPEN (Silicon Valley, November 2011)
vRanked 1st among 1,500 participants at a
world level.
v1st Latin American company to win
award, beating government backed
contenders from the EU
Clean Tech Open Award 2011
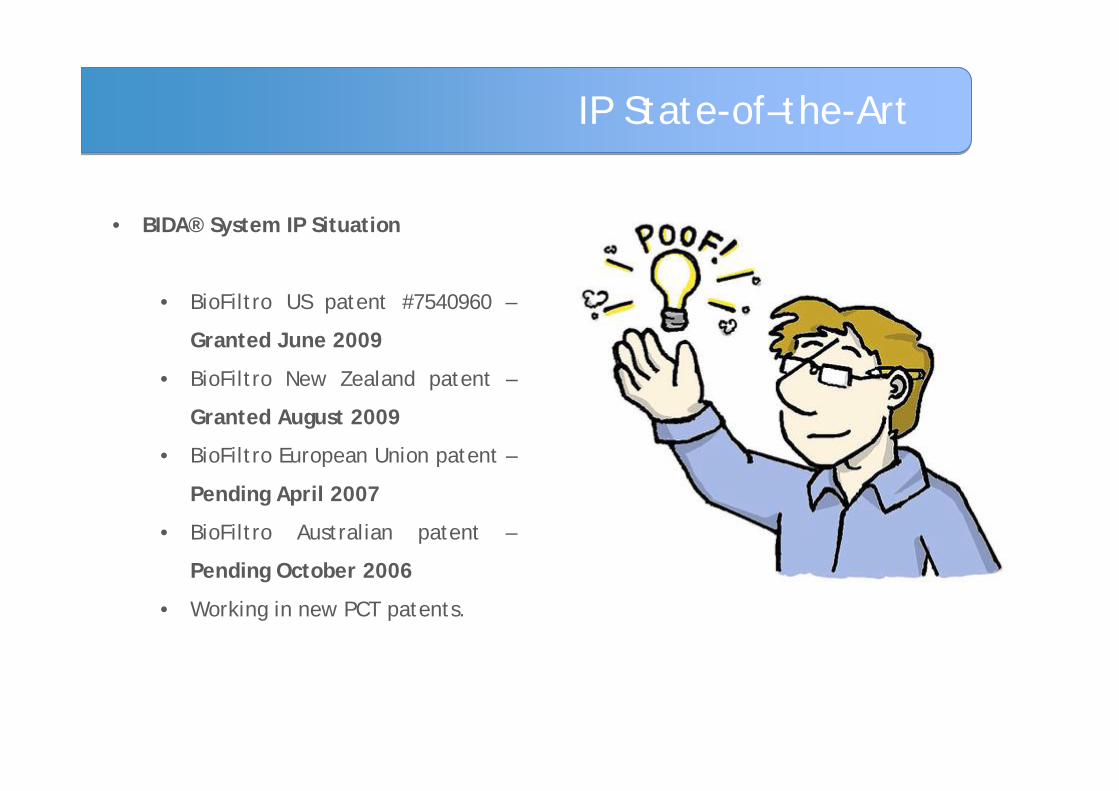
• BIDA® System IP Situation
• BioFiltro US patent #7540960 –
Granted June 2009
• BioFiltro New Zealand patent –
Granted August 2009
• BioFiltro European Union patent –
Pending April 2007
• BioFiltro Australian patent –
Pending October 2006
• Working in new PCT patents.
IP State-of–the-Art

TRADITIONAL SOLUTIONS SUSTAINABLE SOLUTION
Centralized Wastewater Management Decentralized Wastewater Management
Decentralization
DWM
Conventional waste water treatment solutions:
High OPEX and CAPEX
Energy and Chemicals
Sludge + Odor
Difficult Operation
Conventional Solutions = High Costs
ECONOMIC SUSTAINABILITY-Lower OPEX.-Lower CAPEX. -Lower power consumption.-Produce casting (organic fertilizer).-Produce worms (protein source)
ENVIRONMENTAL SUSTAINABILTY-No sludge is generated.-No odor.-No chemicals.-Allows the reuse of water.
Our solution – Sustainability

SewagevHouses or communities without access to a
sewage treatment plant
vResorts, hotels, and restaurants in remote
areas
vRecreational parks, campsites, RV parks
vMining camps or lodging camps
vRural schools, clinics, colleges
vMilitary outposts
vEmergency or disaster relief operations
Liquid Industrial Wastev Dairy industryv Wine industryv Salmon and shrimp farmsv Agribusinessv Food processing industryv Slaughter and cold storage
industry v Animal feed lots
Sludge TreatmentvSludge generated in traditional liquid
industrial waste treatment plants
vSludge generated in traditional sewage
treatment plants
Our solution – Applications


Our Experience
RURAL COMMUNITIES
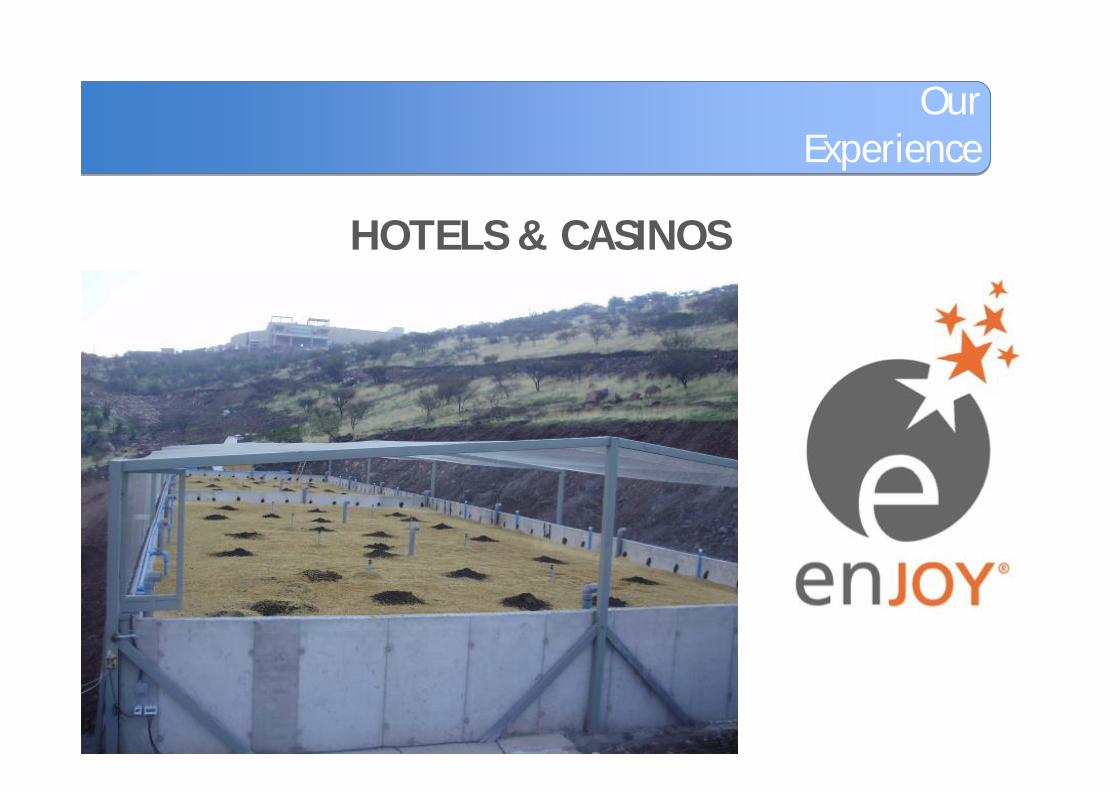
Our Experience
HOTELS & CASINOS
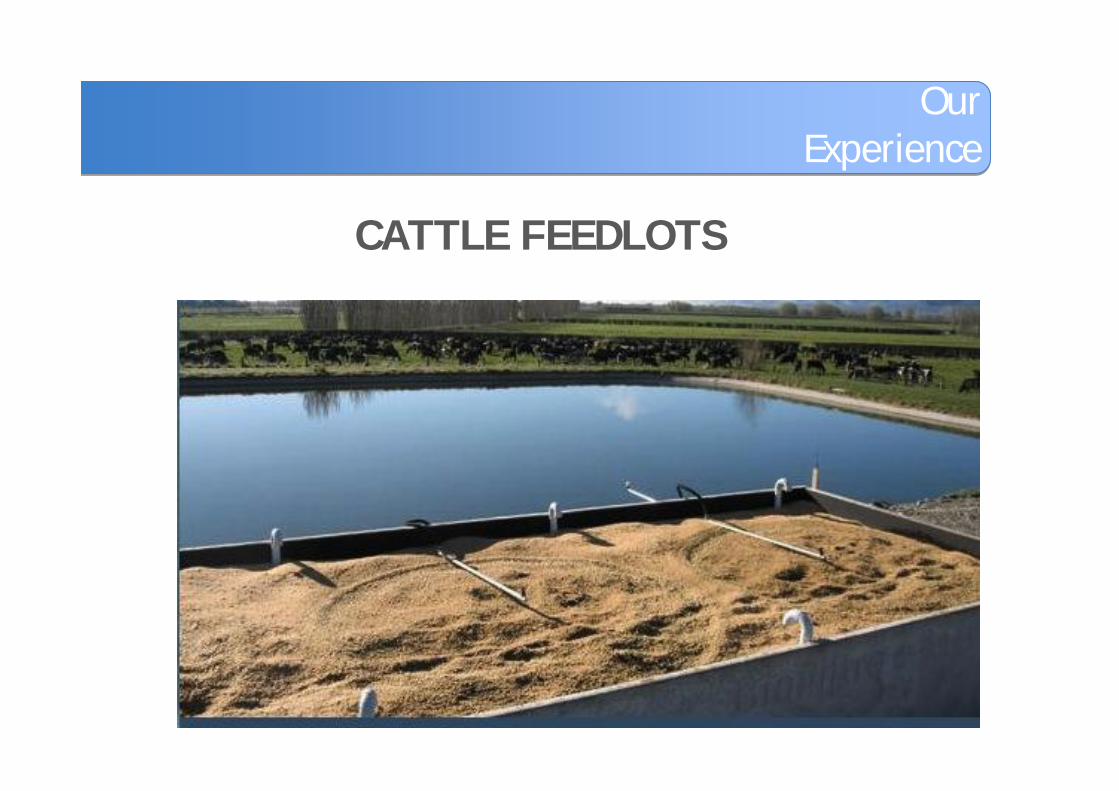
Our Experience
CATTLE FEEDLOTS
Our Experience
PIGS FARMS

Our Experience
POULTRY FARMS
Our Experience
SLAUGHTERHOUSES

Our Experience
MEAT PROCESSING INDUSTRY
Our Experience
FISH PROCESSING INDUSTRY

Our Experience
MILK AND CHEESE FACTORY

Our Experience
WINERIES
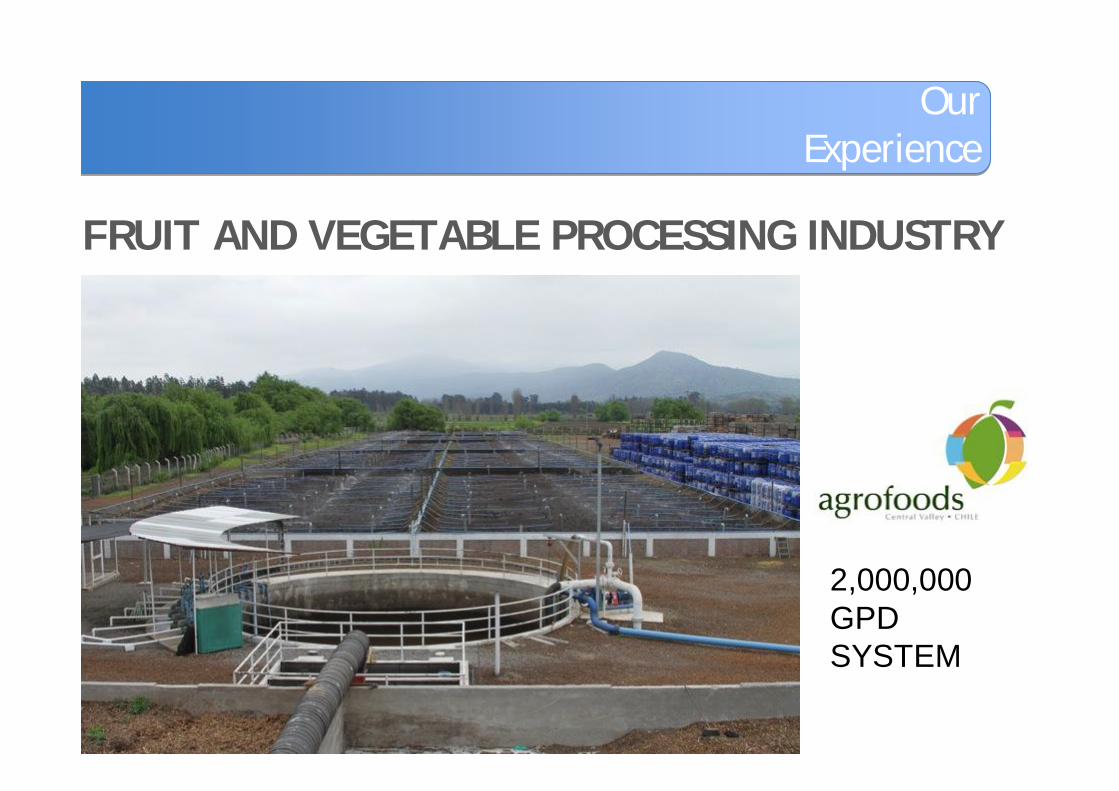
Our Experience
FRUIT AND VEGETABLE PROCESSING INDUSTRY
2,000,000
GPD
SYSTEM
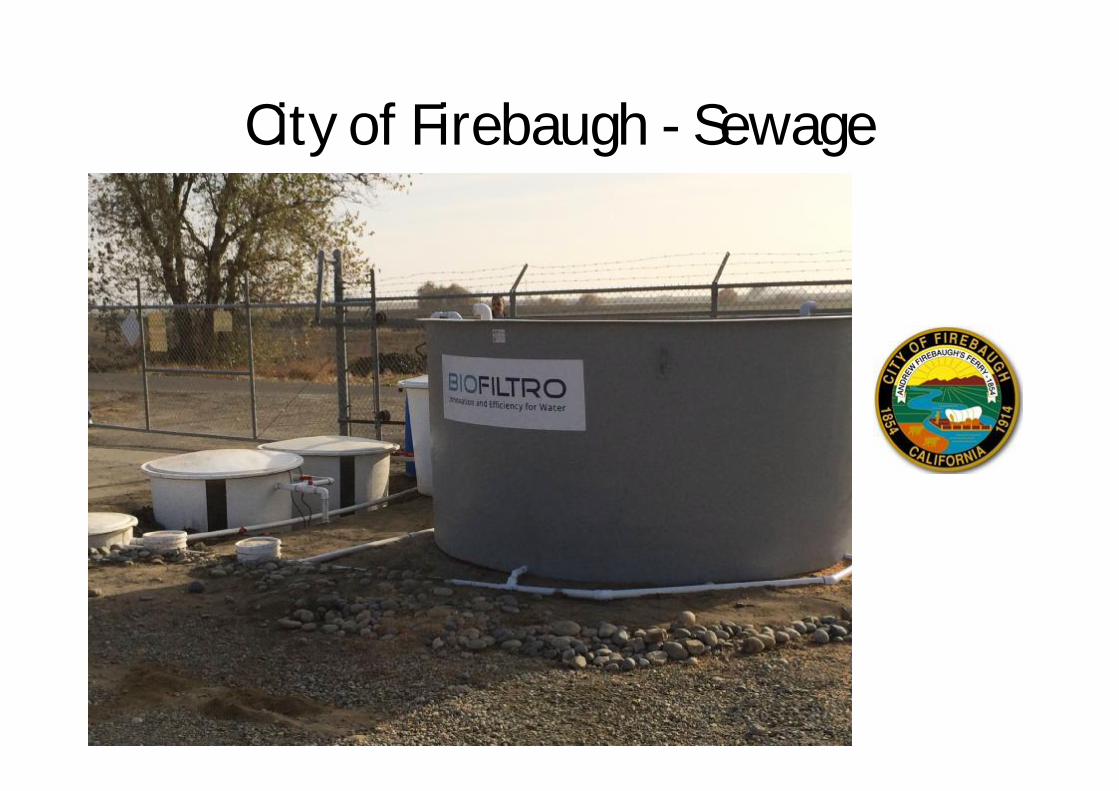
City of Firebaugh - Sewage

Tomatek/NJFC – Tomato WW

Pilot Systems Available For Tour:
-Fresno State Dairy
-Tomatek
-City of Firebaugh
Status
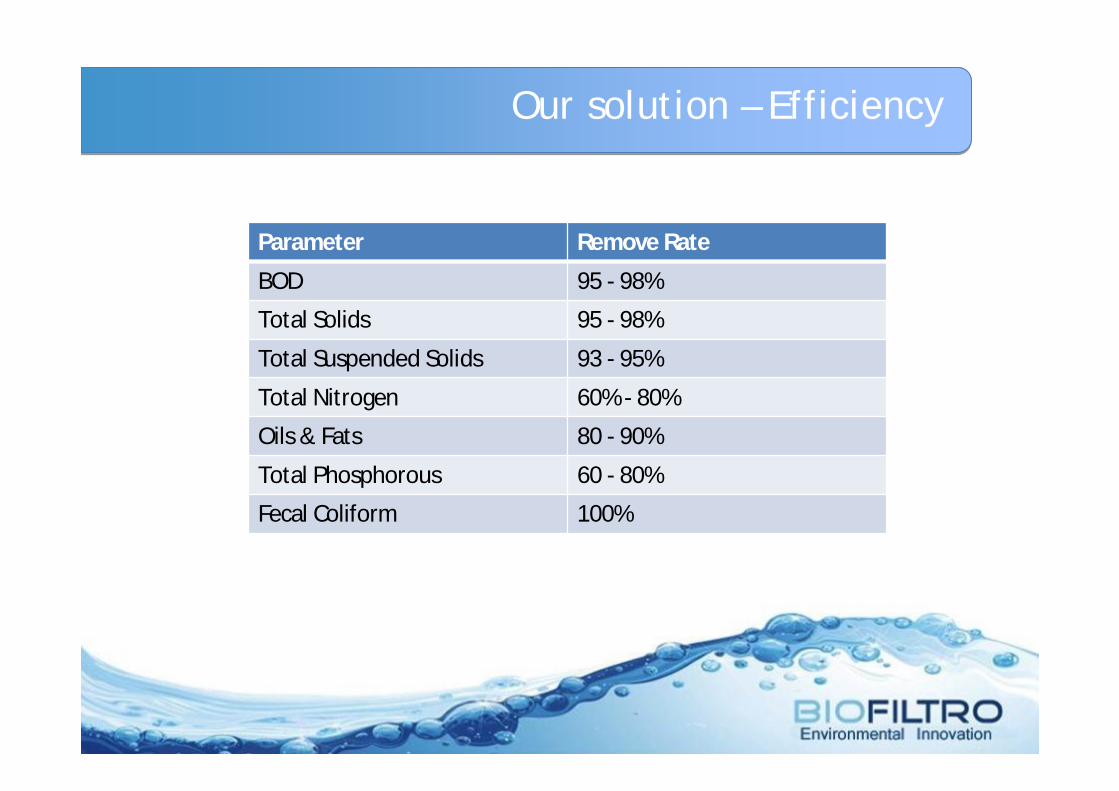
Parameter Remove Rate
BOD 95 - 98%
Total Solids 95 - 98%
Total Suspended Solids 93 - 95%
Total Nitrogen 60% - 80%
Oils & Fats 80 - 90%
Total Phosphorous 60 - 80%
Fecal Coliform 100%
Our solution – Efficiency
Related Documents


