Performance evaluation of public-private partnerships (PPPs) in developing countries: A case study of Bangladesh Author Hossain, Mohammad Published 2018-11-16 Thesis Type Thesis (PhD Doctorate) School Dept Account,Finance & Econ DOI https://doi.org/10.25904/1912/1730 Copyright Statement The author owns the copyright in this thesis, unless stated otherwise. Downloaded from http://hdl.handle.net/10072/385936 Griffith Research Online https://research-repository.griffith.edu.au

Welcome message from author
This document is posted to help you gain knowledge. Please leave a comment to let me know what you think about it! Share it to your friends and learn new things together.
Transcript

Performance evaluation of public-private partnerships (PPPs)in developing countries: A case study of Bangladesh
Author
Hossain, Mohammad
Published
2018-11-16
Thesis Type
Thesis (PhD Doctorate)
School
Dept Account,Finance & Econ
DOI
https://doi.org/10.25904/1912/1730
Copyright Statement
The author owns the copyright in this thesis, unless stated otherwise.
Downloaded from
http://hdl.handle.net/10072/385936
Griffith Research Online
https://research-repository.griffith.edu.au

Performance evaluation of public-private partnerships (PPPs)
in developing countries: A case study of Bangladesh
Mohammad Hossain
BCom, M.Acc, M.Econ
Department of Accounting, Finance and Economics
Griffith Business School
Griffith University
Submitted in fulfilment of the requirements of the degree of Doctor of
Philosophy
November 2018

ii
Declaration of originality
This work has not previously been submitted for a degree or diploma in any
university. To the best of my knowledge and belief, the thesis contains no material
previously published or written by another person except where due reference is made in
the thesis itself.
16 November 2018
___________________________ __________________
Mohammad Hossain Date
iii
Abstract
Since the emergence in the early 1990s, PPP options have become increasingly
popular to the governments of both developed and developing countries. On average, US$
95b are invested annually in the developing countries in the form of PPP options up until
2017. However, a mixed result is documented with respect to their performances. PPP
arrangements include multiple stakeholders that have diverse interests associated with
their particular affiliations, and accordingly the performance expectations of these
stakeholders also differ. Traditional approaches to performance evaluation are unable to
capture all of the expectations to be included in the process of PPP project evaluation.
Hence, using appropriate performance indicators and analysing their relative importance
in influencing the performance score of particular projects remains unexplored in the
developing country context.
Against this backdrop, this study examines current practices of PPP performance
evaluation, develops a framework of weighted performance indicators for developing
countries and applies the model in a number of PPP projects in Bangladesh. A mixed-
method approach has been used, which includes the analytical hierarchy process (AHP)
for establishing weights of the key performance areas (KPAs) and associated indicators
and a case study method for applying the developed model to selected PPP projects in
Bangladesh.
Results show that ‘financing’, ‘planning and initiation’ and ‘transparency and
accountability’ are the most important KPAs in evaluating PPP performances in
Bangladesh and ‘feasibility analysis’, ‘life cycle evaluation and monitoring’ and ‘optimal
risk allocation’ are the most significant performance indicators. Unlike traditional
performance evaluation methods, a prioritised set of performance indicators and KPAs
iv
for the PPPs of Bangladesh has been identified. The findings also reveal that sincere
government commitment is relatively more important for the success of PPPs than the
enactment of enabling legislation in the context of developing countries. This suggests
more efforts are required to be employed by the host government to build confidence in
the private partner selected for engagement in PPP arrangements. Furthermore, a
framework for performance evaluation of power sector PPPs, based on the KPAs, has
been proposed. This could be used for evaluating the performance of power PPPs in a
more objective and systematic way in Bangladesh and other South Asian countries.
Finally, the weighted process applied to the various performance indicators provides an
improved understanding of the relative significance of KPAs and their component
indicators.
Attaching weights to the KPAs and performance indicators of PPPs, and applying
those weights to derive individual project scores in a developing country context,
especially in Bangladesh, represents an innovation and thus a contribution to the PPP
performance literature. Awareness of the outcomes of the weighted performance
evaluation process developed in this study could help project implementers and regulators
prioritise their attention and resource allocation decisions related to achievement of
performance improvement on the more significant key performance areas. The weighted
process is expected to contribute to reducing biases of either perceived Likert scaled
scores or only the weightings in PPP performance evaluation.
KEYWORDS: Analytical hierarchy process (AHP); key performance areas (KPAs);
performance indicators; public-private partnerships (PPPs); infrastructure provision.
v
List of publications from this thesis
Published:
1. Hossain, M., Guest, R., & Smith, C. (2018). Performance Indicators of Public Private Partnership in Bangladesh: An Implication for Developing Countries. International Journal of Productivity and Performance Management (In press).
2. Hossain, M., Guest, R., & Smith, C. (2018). Developing Weights for Performance Indicators of Public Private Partnerships (PPPs) in Emerging Countries: An Application of Analytical Hierarchy Process (AHP). Paper presented at the 4th 2018 Academy of Business and Emerging Markets (ABEM) Conference, Manila, Philiphine.
Work-in-progress:
3. Hossain, M., Guest, R., & Smith, C. (2019). Comparative analysis on the studies of PPP performance evaluation between developed and developing countries: A systematic literature review. Interantional Journal of Project Management (Planned outlet).
4. Hossain, M., Guest, R., & Smith, C. (2019). Improved performance assessment of power sector PPPs in Bangladesh through weighted indicator system: A methodological innovation. International journal of Productivity and Performance Management (Planned outlet).
5. Hossain, M., Guest, R., & Smith, C. (2019). Role of public sector commitment to the success of power PPPs in developing countries: Evidence from Bangladesh. Energy Policy (Planned outlet)

vi
Acknowledgment
I would like to express my gratitude to all of those who assisted me throughout
the whole period of my PhD journey, but in particular to the following:
First of all, I am most grateful to my Creator, the Almighty ALLAH (SWT), who
blessed me with HIS guidance on this earth and made this difficult job easy for me.
I am sincerely grateful to my principal supervisors—Professor Ross Guest and
Professor Christine Smith, for their countless support, motivation, and guidance
throughout the study. They provided invaluable feedback with great care to improve my
thesis, and my papers submitted for publication. They guided me in the right direction
and made this difficult task comfortable. I am also grateful to both of them for their mental
support to me at the most difficult time when my family urgency emerged. I would also
like to thank my former principal supervisor, Dr. Alex Robson, for his assistance and
advice during the early days of my research.
I would like to extend my gratitude to the industry practitioners in Bangladesh for
their contributions via their participation in the survey and by providing me access to the
required information. I am also thankful to the former Senior Secretary to the Power
Division of the Government of Bangladesh, for his support in facilitating access to the
affiliated organisations. I am thankful to Mr. Wahid, Mahmood, Momin, Zillur, Amin,
Fazlu, and many more for their sincere cooperation.
I am thankful to the Government of Bangladesh for allowing me deputation for
this study, and to Griffith University for the scholarships and so many amenities for this
study and comfortable living in Brisbane.

vii
Finally, it is to my family that I owe forever. I am grateful to my mother whom I
needed to give time for taking care of her in her old age. I will always be thankful to my
beloved wife, Teema, for her endless support and encouragement in the most difficult
time, and for her hard work and patience in maintaining the family affairs single-handedly
for over three and a half years. Thanks, Teema, for your great sacrifice throughout my
PhD journey. I am also thankful to my daughter, Tasmiya, and my sons Wasif and Muadh,
who have had their father absent from them during his studies—thanks for your time that
you made a charity for me.
I am also thankful to the Bangladesh community around Robertson, who made
our community life comfortable and enjoyable.
viii
Table of contents
Declaration of originality .............................................................................................. ii Abstract ....................................................................................................................... iii List of publications from this thesis ............................................................................... v
Acknowledgment ......................................................................................................... vi Table of contents ........................................................................................................ viii List of tables ............................................................................................................... xii List of figures.............................................................................................................. xv
List of abbreviations ................................................................................................. xvii
Chapter One: Introduction ......................................................................................... 1
1.1 Background of the study ...................................................................................... 2
1.1.1 A global trend of PPPs ........................................................................................ 2
1.1.2 Study focus on the PPPs of developing countries................................................. 3
1.1.3 Relative importance of PPP performance indicators ............................................ 3
1.2 Research gaps, research questions and contribution .............................................. 4
1.3 Methodology........................................................................................................ 7
1.4 Research contribution .......................................................................................... 8
1.5 Structure of the thesis ........................................................................................... 9
Chapter Two: Performance evaluation of PPPs: A focus on developing countries 12
2.1 Introduction ....................................................................................................... 13
2.2 Development of PPP performance evaluation ..................................................... 13
2.3 The performance prism framework .................................................................... 15
2.4 Global experiences of PPP performances ........................................................... 15
2.4.1 Performances in the developed countries: A critical review ................................ 15
2.4.2 Performances in the developing countries: A critical review ............................... 17
2.5 PPP performance evaluation practices in developing country context ................. 20
2.5.1 Public sector comparator (PSC) approach .......................................................... 22
2.5.2 (Key) Performance indicator system .................................................................. 26
2.5.3 Lifecycle evaluation approach: A critical review ................................................ 34
2.5.4 Output specification approach ............................................................................ 36
2.5.5 Organisational level performance evaluation ...................................................... 39
2.6 KPAs and performance indicators in developing countries ................................. 41
2.6.1 Clustering performance indicators into KPAs .................................................... 41
ix
2.6.2 Defining KPAs ................................................................................................. 42
2.6.3 Defining performance indicators ....................................................................... 45
2.7 Research gap and related research questions ...................................................... 48
Chapter Three: Public-private partnerships (PPPs) in developing countries: A focus on the power sector in Bangladesh.................................................................. 49
3.1 Introduction ....................................................................................................... 50
3.2 Understanding PPPs and their taxonomy ............................................................ 50
3.2.1 Definitions of PPPs ........................................................................................... 50
3.2.2 Taxonomy of PPPs ........................................................................................... 52
3.3 Power sector PPPs (IPPs) in developing countries .............................................. 55
3.4 PPP initiatives in Bangladesh ............................................................................. 56
3.4.1 Evolution of PPPs ............................................................................................. 56
3.4.2 Current practices (models) and future trend of PPPs .......................................... 59
3.5 Power sector PPPs (independent power producers, IPPs) in Bangladesh ............. 64
3.5.1 Power sector development and its long-term perspective ................................... 64
3.5.2 Institutional set-up for IPP implementation ....................................................... 67
3.5.3 Development, current status and future trend of IPPs ........................................ 72
3.5.4 An assessment of IPPs ...................................................................................... 80
3.6 Research gap and associated research questions ................................................. 82
Chapter Four: Research methodology ..................................................................... 84
4.1 Introduction ....................................................................................................... 85
4.2 Research process ................................................................................................ 85
4.3 Analytical hierarchy process (AHP) ................................................................... 89
4.3.1 Use of AHP: Overview, scope, sample size and relative advantages .................. 89
4.3.2 Structuring hierarchy of the KPAs and indicators .............................................. 91
4.3.3 Constructing a pairwise matrix .......................................................................... 92
4.3.4 Calculating weights of the KPAs and indicators ................................................ 94
4.3.5 Checking consistency of the judgment .............................................................. 95
4.3.6 Aggregating individual weights......................................................................... 96
4.4 Qualitative approach: Case study method ........................................................... 97
4.4.1 Case study method and its rationale .................................................................. 97
4.4.2 Case study process ............................................................................................ 98
4.4.3 Case selection: Sector focus, sampled cases and their selection criteria.............. 99
4.5 Ethical consideration ........................................................................................ 101
x
4.6 Limitations of the study ................................................................................... 101
4.6.1 Limitations of the AHP ................................................................................... 101
4.6.2 Limitations of the case study ........................................................................... 103
Chapter Five: Establishing weights of KPAs and performance indicators of PPPs in Bangladesh .......................................................................................................... 105
5.1 Introduction ..................................................................................................... 106
5.2 Establishing weights for KPAs of PPPs in Bangladesh ..................................... 106
5.2.1 Questionnaire survey ...................................................................................... 106
5.2.2 Calculating and analysing the weights of KPAs............................................... 109
5.2.3 Comparative analysis and ANOVA test .......................................................... 113
5.3 Establishing weights for performance indicators of PPPs ................................. 117
5.3.1 Calculating and analysing the weights of indicators ......................................... 117
5.3.2 Comparative analysis and ANOVA test .......................................................... 127
5.4 Reliability testing ............................................................................................. 131
5.5 Critical discussion of the results ....................................................................... 132
5.5.1 KPAs of PPPs in developing countries ............................................................ 132
5.5.2 Performance indicators of PPPs in developing countries .................................. 133
5.6 Concluding remarks ......................................................................................... 137
Chapter Six: Case studies of power PPPs—an analysis of project experiences ..... 139
6.1 Introduction ..................................................................................................... 140
6.2 Framework of PPP performance....................................................................... 140
6.2.1 Pathway framework of PPP performance ........................................................ 140
6.2.2 Concept of a sustainable energy system........................................................... 143
6.3 Presentation of case studies .............................................................................. 144
6.3.1 360MW Haripur Power Ltd (HPL) .................................................................. 144
6.3.2 110MW Khulna Power Company Ltd (KPCL) ................................................ 150
6.3.3 55MW Dhaka Northern Power Generations Ltd (DNPGL) .............................. 155
6.3.4 55MW Dhaka Southern Power Generations Ltd (DSPGL) .............................. 159
6.3.5 150MW B-R Powergen Ltd (B-R) .................................................................. 163
6.3.6 412MW Haripur Power Plant (H412) .............................................................. 167
6.4 Analysis and discussion ................................................................................... 170
6.4.1 Outcomes in relation to initial goals ................................................................ 170
6.4.2 Outcomes in the context of KPAs ................................................................... 177
6.5 Concluding remarks ......................................................................................... 180
xi
Chapter Seven: Assessment of individual project scores using developed weights 181
7.1 Introduction ..................................................................................................... 182
7.2 Data collection: Questionnaire design and survey conduct ............................... 182
7.3 Data screening and authentication .................................................................... 183
7.4 Calculating project performance scores ............................................................ 183
7.5 Analysing weighted and unweighted scores of the projects .............................. 187
7.5.1 Weighted and unweighted scores of KPAs ...................................................... 187
7.5.2 Weighted and unweighted scores of indicators ................................................ 192
7.5.3 Overall scores of the projects .......................................................................... 198
7.5.4 Sensitivity analysis: ........................................................................................ 198
7.6 Discussions and findings .................................................................................. 205
7.6.1 Relative significance of KPAs......................................................................... 206
7.6.2 Relative significance of indicators ................................................................... 209
7.7 Concluding remarks ......................................................................................... 211
Chapter Eight: Conclusion and policy recommendations ..................................... 214
8.1 Introduction ..................................................................................................... 215
8.2 Review of the research questions and major findings ....................................... 215
8.3 Value and significance of the study .................................................................. 218
8.4 Limitations of the study ................................................................................... 219
8.5 Policy recommendations and future research directions .................................... 221
Appendix 1 (table A1 to A7): Weighted scores for case study projects ...................... 225
Appendix 2: Invitation and survey questionnaire ....................................................... 233
Appendix 3: Request letter to Secretary of Power Division, GoB .............................. 243
Appendix 4: Research Information sheet for respondent ............................................ 245
Appendix 5: Questionnaire for project-specific survey .............................................. 249
References ................................................................................................................ 257
xii
List of tables
Table 2. 1: Summary of previous studies of performance measurement of PPPs ...................... 28
Table 2. 2: Key performance areas and indicators/sub-indicators with their definitions ............ 46
Table 3. 1: PPP initiatives in Bangladesh by policy and project dimension, 1995-2018 ............ 58
Table 3. 2: List of PPP projects in pipelines in Bangladesh ...................................................... 59
Table 3. 3: Typical risk arrangement for road PPPs in Bangladesh ........................................... 62
Table 3. 4: PPP infrastructures by sector, 1991-2017: Bangladesh versus South Asia............... 63
Table 3. 5: Overview of the power sector in Bangladesh in June, 2017 .................................... 65
Table 3. 6: PPP power projects (IPPs) implemented from 1997 to June 2017 ........................... 76
Table 3. 7: PPP power projects (IPPs) currently being implemented, 2018 ............................... 77
Table 3. 8: Coal-based and nuclear power projects by public sector, 2018 ............................... 79
Table 4. 1: The scale of relative importance ............................................................................ 93
Table 4. 2: Example of a pairwise comparison ......................................................................... 93
Table 5. 1: Summary of the respondents ................................................................................ 108
Table 5. 2: Pair-wise comparison matrix of KPAs ................................................................. 111
Table 5. 3: Mean weights of KPAs by expert groups ............................................................. 112
Table 5. 4: Results of ANOVA for financing and socioeconomic development ...................... 115
Table 5. 5: Results of post hoc comparisons between groups using Tukey’s HSD method ..... 116
Table 5. 6: Pair-wise comparison matrix of planning and initiation (PI) ................................. 117
Table 5. 7: Pair-wise comparison matrix of tendering (T) ...................................................... 118
Table 5. 8: Pair-wise comparison matrix of construction and operation (CO) ......................... 118
Table 5. 9: Pair-wise comparison matrix of sustainability of partnerships (SP)....................... 119
Table 5. 10: Pair-wise comparison matrix of financing (F) .................................................... 119
Table 5. 11: Pair-wise comparison matrix of transparency and accountability (TA) ............... 120
Table 5. 12: Pair-wise comparison matrix of stakeholder satisfaction (SS) ............................. 120
Table 5. 13: Pair-wise comparison matrix of partner satisfaction (PS) .................................... 121
xiii
Table 5. 14: Pair-wise comparison matrix of end user satisfaction (EUS) ............................... 121
Table 5. 15: Pair-wise comparison matrix of socioeconomic development (SED) .................. 122
Table 5. 16: Mean weights (>0.0246) of 19 indicators ........................................................... 125
Table 5. 17: Mean weights (<0.0246) of the remaining 22 indicators ..................................... 126
Table 5. 18: Results of the one-way ANOVA for PIT, SCM, DPI and LCEM ........................ 129
Table 5. 19: Results of post hoc comparisons between groups using Tukey’s HSD method .... 130
Table 5. 20: Summary of different reliability measures .......................................................... 131
Table 6. 1: Framework of performance evaluation of power PPPs ......................................... 142
Table 6. 2: Profile of Haripur Power Limited........................................................................ 145
Table 6. 3: Estimated cost and financing structure of Haripur Power Limited ........................ 146
Table 6. 4: Risk allocation matrix of Haripur Power Limited ................................................. 148
Table 6. 5: Outcomes of the HPL in relation to KPAs ............................................................ 150
Table 6. 6: Profile of the KPCL ............................................................................................. 151
Table 6. 7: Initial project cost and financing structure of KPCL ............................................. 153
Table 6. 8: Outcomes of the KPCL in relation to KPAs ......................................................... 154
Table 6. 9: Profile of the DNPGL .......................................................................................... 155
Table 6. 10: Initial project cost and financing structure of DNPGL ........................................ 157
Table 6. 11: Outcomes of the DNPGL in relation to KPAs .................................................... 159
Table 6. 12: Profile of the DSPGL......................................................................................... 160
Table 6. 13: Project cost and financing structure of DSPGL .................................................. 161
Table 6. 14: Outcomes of the DSPGL in relation to KPAs ..................................................... 163
Table 6. 15: Profile of the B-R .............................................................................................. 164
Table 6. 16: Project cost and financing structure of B-R ........................................................ 165
Table 6. 17: Outcomes of the B-R in relation to KPAs ........................................................... 166
Table 6. 18: Profile of the H412 power plant ......................................................................... 167
Table 6. 19: Project cost and financing structure of H412 ...................................................... 169
Table 6. 20: Outcomes of the H412 in relation to KPAs......................................................... 170
Table 6. 21: Summary of the goals achieved by the selected projects ..................................... 171

xiv
Table 6. 22: Outcomes in the context of KPAs by projects .................................................... 177
Table 7. 1: Unweighted and weighted scores of six projects by KPAs and indicators ............. 185
Table 7. 2: Performance objectives used to reduce unweighted scores ................................... 200
Table 7. 3: Results summary of sensitivity analysis by KPAs ................................................ 202
xv
List of figures
Figure 2. 1: PPP investment in four sectors in the developing world by six regions .................. 18
Figure 2. 2: PPP investment in developing economies by four sectors...................................... 18
Figure 2. 3: Comparative picture between PSC and PPP approach ........................................... 23
Figure 2. 4: Process flow of writing output specifications ........................................................ 38
Figure 2. 5: Value creation and capture in PPPs: An integrated model ..................................... 41
Figure 3. 1: PPP nomenclature and degree of public and private party involvement ................. 54
Figure 3. 2: Private investment in power sector in developing countries, 2017 ......................... 56
Figure 3. 3: Power generations MW by plant and source type, 2017 ........................................ 66
Figure 3. 4: A typical structure of a private power project in Bangladesh ................................. 68
Figure 3. 5: Institutional framework of the power sector in Bangladesh ................................... 69
Figure 3. 6: A typical model of IPP (Haripur Power Ltd) in Bangladesh .................................. 74
Figure 3. 7: Power generation (MW) by Sector........................................................................ 75
Figure 3. 8: Projected generation capacity by sector, 2018-2021 .............................................. 78
Figure 3. 9: Installation of additional capacity (MW) (estimated) by fuel type by 2025 ............ 79
Figure 3. 10: Installed generation capacity by sector, 1997-2017 ............................................. 81
Figure 4. 1: Research process flow .......................................................................................... 88
Figure 4. 2: AHP hierarchy of KPAs and indicators/sub-indicator ........................................... 92
Figure 4. 3: Pairwise comparison matrix.................................................................................. 94
Figure 5. 1: Weight ranges of the KPAs by different expert groups ........................................ 114
Figure 5. 2: Weights of top 19 indicators (mean >0.0244) by different expert groups ............. 127
Figure 6. 1: Conceptual framework of pathway of PPP performance ..................................... 141
Figure 6. 2: Image of the Haripur Power Limited .................................................................. 147
Figure 6. 3: Image of the KPCL ............................................................................................ 153
Figure 6. 4: Pathway framework of power sector PPP performance ....................................... 179
Figure 7. 1: Weighted and unweighted ranking of the six projects by KPAs........................... 188
xvi
Figure 7. 2: Pattern of weighted and unweighted scores of the six projects by KPAs .............. 192
Figure 7. 3: Unweighted and weighted scores of the indicators in HPL .................................. 194
Figure 7. 4: Unweighted and weighted scores of the indicators in KPCL ............................... 194
Figure 7. 5: Unweighted and weighted scores of the indicators in DNPGL ............................ 195
Figure 7. 6: Unweighted and weighted scores of the indicators in DSPGL ............................. 195
Figure 7. 7: Unweighted and weighted scores of the indicators in B-R ................................... 195
Figure 7. 8: Unweighted and weighted scores of the indicators in H412 ................................. 196
Figure 7. 9: Pattern of unweighted and weighted scores of the indicators in six projects ......... 197
Figure 7. 10: Unweighted (reduced) and weighted scores of the HPL .................................... 203
Figure 7. 11: Unweighted (reduced) and weighted scores of the KPCL .................................. 204
Figure 7. 12: Unweighted (reduced) and weighted scores of the DNPGL ............................... 204
Figure 7. 13: Unweighted (reduced) and weighted scores of the DSPGL ............................... 204
Figure 7. 14: Unweighted (reduced) and weighted scores of the B-R ..................................... 205
Figure 7. 15: Unweighted (reduced) and weighted scores of the H412 ................................... 205
xvii
List of abbreviations
A Availability of services
ADB Asian Development Bank
ADP Annual development programme
AES Applied Energy Services
AHP Analytical hierarchy process
AIJ Aggregating individual judgement
AIP Aggregating individual priorities
ANP Analytical network process
ANOVA Analysis of variance
BDT Bangladeshi Taka
BEPRC Bangladesh Energy and Research Council
BERC Bangladesh Energy Regulatory Commission
BIFFL Bangladesh Infrastructure Finance Fund Ltd
BIM Building information modelling
BLT Build lease transfer
BOO Build own operate
BOT Build operate transfer
B-R B-R Powergen Ltd
BTO Build transfer operate
BPDB Bangladesh Power Development Board
BROT Build rehabilitation operate transfer
C Cost performance
CDC Commonwealth Development Corporation
CFA Confirmatory factor analysis
CI Consistency index
CO Construction and operation
COD Commercial operation date
CR Consistency ratio
CSF Critical success factor
DB Design build
xviii
DBF Design build finance
DBFO Design build finance operate
DBOM Design build operate maintain
DESCO Dhaka Electric Supply Company
DNPGL Dhaka North Power Generation Ltd
DPDC Dhaka Power Distribution Company
DPI Disclosure of project information
DS Dispute settlement
DSM Demand side management
DSPGL Dhaka South Power Generation Ltd
E Economy of services
ECS Efficient concessionaire selection
EF Environment friendliness
EG Employment generation
EGCB Electricity Generation Company of Bangladesh
EPC Engineering, procurement and construction
EPEC European PPP Expertise Centre
ERM Efficient risk management
EUS End user satisfaction
EVM Eigenvalue method
F Financing
FA Feasibility assessment
FC Financial cost
FMO The Netherlands Development Finance Company
FSA Fuel supply agreement
FT Fairness and transparency
G2G Government to Government
GCI Geometric consistency index
GL Government liabilities
GoB Government of Bangladesh
Gwh Gigawatt per hour
H412 412MW Haripur Power Plant
HFO Heavy fuel oil
xix
HPL 360MW Haripur Power Ltd
HRD Human Resource Development
HSD Honestly significant difference
ImA Implementation agreement
IA Implementability assessment
ICB Investment Corporation of Bangladesh
ID Infrastructure development
IDA International Development Association
IDCOL Infrastructure Development Company Ltd
IFB Invitation for bid
IFC International Finance Corporation
IIFC Infrastructure Investment Facilitation Company
IL Integration of locals
IMF International Monetary Fund
IPO Initial public offerings
IPPs Independent power producers
IPFF Investment Promotion and Financing Facility
IPS Innovation in public sector
JICA Japan International Cooperation Agency
JIT Just in time
KPA Key performance area
KPCL 110MW Khulna Power Company Ltd
KPI Key performance indicator
LCEM Life cycle evaluation and monitoring
LCM Life cycle maintainability
LLA Land lease agreement
MLR Multiple linear regression
MO Meeting objectives
MPEMR Ministry of Power, Energy and Mineral Resources
MW Megawatt
Mwh Megawatt hour
NA Needs assessment
NCCBL National Credit and Commercial Bank Ltd
xx
NPV Net present value
NWZPDC North West Zone Power Distribution Company
OECD Organisation for Economic Co-operation and Development
OMT Other monthly tariff
ORA Optimal allocation of risk
ORS Optimal revenue sharing
P Profitability
PBS Polli Biddut Somity
PCA Principal component analysis
PG Payments and government guarantees
PGCB Power Grid Company of Bangladesh
PFI Private finance initiative
PI Planning and initiation
PIT Public interest test
PMS Performance measurement system
PPA Power purchase agreement
PPI Private participation in infrastructure
PPP Public-private partnership
PPPTAF Public-private partnership Technical Assistance Fund
PRG Partial risk guarantees
PrKS Private sector knowledge and skill
PRR Partners roles and responsibilities
PrS Project sustainability
PS Partners satisfaction
PSC Public sector comparator
PSD PPP sector development
PSMP Power sector master plan
PSPGP Private Power Generation Policy 1996
PuCC Public sector capacities in coordination
Qa Quality of assets
Qs Quality of services
RC Responsiveness of concessionaire
RCOD Required commercial operation date
xxi
RD Relationship dilemma
REB Rural Electrification Board
RFP Request for proposal
RFQ Request for quotation
RGMM Row geometric mean method
RI Random index
ROE Return on equity
RPCL Rural Power Company Ltd
RQ Research question
SC Standardised contract
SCM Selection criteria and method
SED Socioeconomic development
SIPP Short-term independent power producer
SMART Specific, measurable, achievable, reliable and time bound
SO SMART objectives
SP Sustainability of partnerships
SPV Special purpose vehicle
SREDA Sustainable and Renewable Energy Development Authority
SS Stakeholder satisfaction
SZPDC South Zone Power Distribution Company
T Tendering
TA Transparency and accountability
TC Time consideration
Tk/Kwh Taka per kilowatt hour
TR Trust and respect
TOPSIS Technique for order of preference by similarity to ideal solution
UAE United Arab Emirates
UK United Kingdom
UNCTAD United Nations Conference on Trade and Development
US United States
VFM Value for money
VGF Viability Gap Fund
WB World Bank

xxii
WQI Water quality index
WZPDC West Zone Power Distribution Company

1
Chapter One: Introduction
2
1.1 Background of the study
Two aspects of public-private partnerships (PPPs) provide the motivating points
for this study: formulating a performance measurement approach and evaluating the
actual performance of individual PPPs using this approach in the context of developing
countries. A detailed discussion of the background of the study follows, starting from a
global perspective of PPPs and then focusing on the specific research topic undertaken
for this study.
1.1.1 A global trend of PPPs
The PPP concept emerged in the early 1990s in the United Kingdom (Yescombe,
2011). At present, PPPs have become a popular option for governments of both developed
and developing countries, as they seek to reach the strategic objective of achieving value
for money (VFM) from the public investment through partnerships with the private sector
(J. Liu, Love, Smith, Regan, & Palaneeswaran, 2015; Osei-Kyei & Chan, 2017a;
Raisbeck, Duffield, & Xu, 2010). However, mixed results are documented with respect
to the performance of PPPs, irrespective of the country status. Unlike traditional methods,
a PPP arrangement includes multiple stakeholders who have diverse interests associated
with their affiliations; accordingly, performance expectations from the PPPs also differ
(Hodge & Greve, 2017).
Most of these expectations depend on which performance aspects of PPPs are
measured, and for whom (Hodge & Greve, 2017). Traditional approaches to performance
evaluation of construction projects, for example, are unable to capture all of the
performance expectation necessary for inclusion in the process of evaluation (J. Liu,
Love, Davis, Smith, & Regan, 2015).
3
1.1.2 Study focus on the PPPs of developing countries
This study focuses on a developing country perspective with respect to PPP
performance evaluation. Up until 2017, US$ 95b (on average) was invested annually in
developing countries via private sector participation (World Bank PPI Database, 2018).
This trend indicates a growing attractiveness of PPPs among governments from
developing countries (Osei-Kyei & Chan, 2017a), especially those in the middle-income
category that are losing their eligibility for concessional loans from international
organisations such as the World Bank and the International Monetary Fund. While this
study focuses on developing countries, it recognises that these nations, generally
speaking, have a relatively poor operating and institutional environment, with more scope
for opportunism and corruption, factors which are associated with the success or failure
of PPP projects (Hammami, Ruhashyankiko, & Yehoue, 2006; Panayides, Parola, & Lam
Jasmine, 2015; Percoco, 2014; Trebilcock & Rosenstock, 2015). PPPs in the developing
countries also often underperform due to a weaker financial market, unstable
macroeconomic factors, and a lack of political commitment (Sanghi, Sundakov, &
Hankinson, 2007).
1.1.3 Relative importance of PPP performance indicators
To measure PPP performance, different approaches have been applied previously.
An objective-based measurement approach has also been used to measure whether the
initially specified objectives have been achieved, compared with pre-specified standards
(Lam & Javed, 2015). Governments often evaluate project success or failure by
considering the political purpose and governance strength of the project, rather than by
using utilitarian characteristics (Hodge & Greve, 2017). A theory-based performance
evaluation was proposed by Jeffares et al. (2009), with six performance domains
including policy goal achievement, following democratic norms, innovation in the public
4
sector, connectivity to inspire innovation, coordination to achieve collaborations and
coalition to achieve sustainable partnerships. Likewise, a key performance indicator
(KPI) system, one of the most prominent approaches currently in use, focuses on a
number of indicators to measure different dimensions of performance, such as
efficiencies, outcomes, service qualities, financial performances, process, and activities
(OECD, 2008; Regan, Smith, & Love, 2011). This approach assesses the performance of
the different indicators separately and does not attempt to combine these assessments into
a single score that permits comparison across different PPP projects.
A project success index (Osei-Kyei & Chan, 2017a) developed in earlier research
was based on critical success factors (CSF), in which ex-post performance indicators were
ignored. Furthermore, using a Likert scale survey, Yuan et al. (2012) derived an estimate
of the relative importance of the indicators without differentiating between the operating
contexts of the PPPs. Accordingly, the results found in such a study cannot be used for
generalising the performance framework applicable to a specific group of countries such
as developing countries. Likewise, in the context of some European countries, the
‘overall’ success of transport PPPs was measured, but the regional focus in this study and
the research approach to measuring the relative importance of the performance are
different (Liyanage & Villalba-Romero, 2015).
1.2 Research gaps, research questions and contribution
From this background, conventional performance evaluation approaches seem to
be used for evaluating PPP performance. These approaches appear to be inadequate
because the relative significance (weight) of the various performance indicators, which
can impact an overall performance assessment, has not been measured. Identifying the
relative importance of the various performance indicators is important because it allows
5
weights to be applied when assessing PPP performance. In using an unweighted indicator
system, an equal weighting is implicitly given to all indicators when measuring the overall
performance. But the weighted process includes the relative importance of the indicators
as well as the actual performance (score) in measuring the performance related to different
performance areas and to assess the overall performance of a PPP project. This interaction
between weights and actual performance allows the analyst to accurately assess the
relative contribution of the different performance areas, which include different factors
or performance objectives that eventually contribute to the success of the PPPs. Therefore
an improved understanding, gained on the relative importance of the indicators by
applying the weighted process, can assist in focusing relatively more important
performance areas for the improvement of overall performance of the projects and for
adopting policy responses to target the source of potential failure of PPPs.
For example, good performances related to areas such as financing arrangement,
transparency in procurement and planning and initiation in Haripur Power Ltd in
Bangladesh are reported as elements contributing to making this project successful (M.
Khan, Riley, & Wescott, 2012; World Bank, 2014a). But it is unclear how much these
performance areas are significant in assessing the performance of this project, relative to
others: for instance, to the socioeconomic development area. This will be explored later
in this study by applying the analytical hierarchy process (AHP) approach.
The AHP method will be used, because of its relative advantages over the other
methods available, for establishing weights of criteria/performance indicators. It has been
applied to a wide range of areas in evaluating performance, but has not yet been used in
establishing weights for KPAs and indicators of PPPs in the developing country context,
especially in Bangladesh. In PPPs, it has appeared to have some applications in different
contexts and concentrations, including identifying design development factors in
6
Australia (Raisbeck & Tang, 2013), SWOT analysis in China (Yuan, Guang, Wang
Xiaoxiao, Li Qiming, & Skibniewski, 2012) and risk assessment in China (Li & Zou,
2011). Other applications are focused on critical success factors as well.
However, the application of the AHP in this study is different from that of the
previous studies in terms of context and focus. Specifically, experts in relation to PPPs in
Bangladesh (context) are surveyed to develop weights for the KPAs and indicators
(concentration) of PPP perfroamnce evalaution. The major contribution of this study is
thus a methodological innovation in an application of the weights developed by using the
AHP in a developing country context. The resulting performance evaluation approach
(weighted KPAs and indicators) is applied to a number of completed PPP projects to
demonstrate how it could work to improve our understanding of actual PPP performance
in a developing country context. Bangladesh, as a developing country, has been selected
for a case study in the application of this new approach.
Bangladesh is considered as an ideal case for analysis because firstly it has
become one of Asia’s most remarkable and unexpected success stories in recent years
(Basu, 2018). It has a PPP operating environment as well as economic status that is
comparable to that of other countries in the region. PPP arrangements first appeared in
this country in the mid-nineties, almost immediately after they materialised in the
developed countries (The National Parliament GoB, 2016), and initially, a number of
executed PPPs showed good performances in the power sector. Afterwards, schedule
lapses and cost overruns have become common features (M. Khan et al., 2012).
Nevertheless, an interest in using the PPP option in different sectors has grown recently
(BPDB Annual Report, 2017; PPP Authority, 2018). Conversely, very little evidence
relating to actual PPP performance evalution exists for this nation and for other
developing countries.
7
These important and unaddressed research gaps raise an overall research question:
How can the performance of public-private partnership projects in developing countries
be measured and evaluated?
In order to find answers to this question, a set of research questions (RQ) are
framed:
RQ1. What are the most appropriate indicators and hence KPAs of PPPs in
developing countries?
RQ2. What are the weights of the different KPAs and indicators of PPP
performance in developing countries and how do they differ from those of
developed countries?
RQ3. What are the most important performance areas of the power sector PPPs
in Bangladesh using a traditional approach of analysing case experiences?
RQ4. What are the actual performance scores of the sample of power sector
PPPs in Bangladesh applying developed weights of KPAs and indicators
and how do they differ from unweighted scores derived from industry
experts and/or readily available performance assessments?
1.3 Methodology
A mixed-method approach is considered useful for this study. As our research
questions suggest, the literature on performance evaluation of PPPs has been reviewed
and forty-one performance indicators have been identified in the first phase. These
indicators are grouped into eight KPAs. In the second phase, a structured questionnaire
based on the AHP method has been used to elicit perceptions of PPP experts in
Bangladesh on the relative importance of these KPAs and their associated indicators. The
8
survey responses have been processed and calculated using Microsoft Excel and Expert
Choice (software), and ultimately the weights of the various KPAs and indicators are
established.
In the third phase, the case study component of the study begins with reporting
the case experiences related to a small number of the selected power sector PPPs that
have been implemented in Bangladesh. In this stage, a project-specific structured
questionnaire survey was administered to each of the spokespersons from the selected
projects to obtain their perceptions (scores) for their project performance using a set of
indicators. The obtained scores are then interacted (weighted) with the weights already
established by using the AHP method. Finally, these findings are examined and linked to
the project experiences, and arguments are developed, based on results, with the support
of the previously reviewed literature. Further details on this methodology have been
provided in chapter four.
1.4 Research contribution
The study contributes to the literature in several ways. First, attaching weights to
the KPAs and performance indicators of PPPs, and applying those weights to derive
individual project scores in a developing country context, especially in Bangladesh,
represents an innovation and thus a contribution to the PPP performance literature. Unlike
traditional performance evaluation methods, a prioritised set of performance indicators
and KPAs for the PPPs of Bangladesh has been identified. Second, it is argued that
government determination/commitment is relatively more important to the success of
PPPs than is the enactment of laws and regulations in the context of developing countries.
This finding suggests that more efforts are required to be employed by the host
government to build confidence in the private sector partner selected for engagement in
9
PPP arrangements. Third, a framework for performance evaluation of power sector PPPs,
based on the KPAs, has been proposed, which could be used for evaluating the
performance of power PPPs in a more objective and systematic way, not only in
Bangladesh but also in other developing countries in the South Asian region. Fourth, the
weighted process applied to the various performance indicators provides an improved
understanding of the relative significance of KPAs and their component indicators. This
in turn could help project implementers and regulators by informing them of the relatively
more important performance areas, for which special attention should be paid in relation
to more targeted resource allocation. This research, therefore, adds value to the literature
of PPP performance evaluation, especially in the developing country context.
1.5 Structure of the thesis
The thesis has been reported in eight chapters.
Chapter one presents an introduction to the study. It focuses mainly on the
background of the study, the research gaps and their related research questions, the
methodology in brief, the contribution to the knowledge, and the structure of this thesis.
Chapter two presents a review of the literature on performance evaluation
practices in PPPs and finds a research gap focusing on the developing country
perspective. In particular, this chapter presents discussion of the development of
performance evaluation systems, the global experiences of PPPs, the performance
evaluation practices in developing countries, and the definitions of KPAs and indicators.
Chapter three provides a review of PPP related literature in the developing
countries, focusing on the power sector in Bangladesh. The discussion includes key
concepts and typology of PPPs, as well as emerging needs for and challenges to
10
implementing PPPs in developing countries. This chapter also presents a background of
PPP initiatives in Bangladesh, focusing on the PPP implementation in the power sector.
Chapter four outlines details of the methodology used in this study. It presents
details of the rationale for selecting methods, the research process and the types of
methods adopted, and points to the potential limitations of this study. This chapter also
presents details of the AHP method used for establishing weights of the KPAs and
indicators, the case study method employed for analysing the selective case experiences
and the application of the developed weights to those project cases to derive project
performance scores.
Chapter five presents research findings related to RQ2: what are the weights of
the different KPAs and indicators in developing countries and how do they differ from
those of developed countries? This chapter presents details on establishing weights,
including the design and conduct of the survey and the respondent selection criteria, and
presents critical discussion on the results derived in this chapter.
Chapter six presents a case study and an assessment of individual project
performances of the selected power generation PPPs in Bangladesh. In particular, this
chapter addresses RQ3: what are the most important performance areas of power sector
PPPs in Bangladesh using a traditional approach of case experiences. A conceptual
framework of the pathway of PPP performance and the concept of a sustainable energy
system are used for analysing these case experiences.
Chapter seven presents the outcome of research findings related to RQ4: what
are the actual performance scores of the sample of power sector PPPs in Bangladesh
applying developed weights of KPAs and indicators and how do they differ from
unweighted scores derived from industry experts and/or readily available performance
11
assessments? This chapter provides details on designing a questionnaire and conducting
surveys with experts related to the six selected projects, the results from the survey, and
the analysis and discussion of those results.
Chapter eight concludes the study by providing overall conclusions, research
limitations and directions for future research. In particular, this chapter reviews the
research questions initially formulated, briefly presenting answers to those research
questions and the value and significance of the study. This chapter then presents research
limitations, related policy recommendations, and directions for future research.

12
Chapter Two: Performance evaluation of
PPPs: A focus on developing countries
13
2.1 Introduction
This chapter reviews the literature on the performance evaluation of PPPs,
focusing in particular on the various methodological approaches and performance
experiences (Section 2.2, Section 2.3). It is argued that these approaches cannot be
empirically applied without modification to developing countries, because the relative
importance (measured by weights) of the performance indicators are likely to be quite
different to those for developed countries (Section 2.4). Unique weights need to be
determined for developing countries (Section 2.5, Section 2.6). The chapter notes that
Bangladesh is chosen as the country of application (discussed further in Chapter 3) and
that the analytical hierarchy process (AHP) is chosen as the method to establish the
weights for the performance indicators (Section 2.7 and discussed in Chapter 4).
2.2 Development of PPP performance evaluation
Organisations achieve their goals by satisfying their customers through better
efficiency and effectiveness than are shown by their competitors. Although this definition
is from a marketing perspective, it has wider implications for both the public and private
organisations in achieving their goals (Kotler, 1984). In addition, organisations should
consider internal and external causes that might influence their courses of actions (Slack,
1991). Reflecting these causes, Neely et al. (2005) argued that organisational performance
level is a function of the efficiency and effectiveness of the course of an action. Three
things are relevant: a) the performance measurement, defined as “the process of
quantifying efficiency and effectiveness of action”; b) the performance measure, defined
as “a metric used to quantify the efficiency and/or effectiveness of an action”; and c) the
performance measurement system, defined as “the set of metrics used to quantify both
the efficiency and effectiveness of actions” (Neely, Gregory, & Platts, 2005, p. 1229).
14
Throughout the history of measuring organisational performance, ‘success’ was
an ultimate concern used to measure any attainment of organisational objectives
(Kennerley & Neely, 2003). Before the 1980s, time assessment was predominantly a basis
by which to measure organisational performance (Bruns, 1998). The double entry
accounting system was used to measure transactions among traders. With the advent of
the concept of ownership separation from the firm’s management, the measure of returns
on investment (ROE) was applied for the evaluation of the performance (Johnson, 1983).
Traditional performance measures seem to be insufficient in rapidly changing business
environments, as they are based on historical information, are only internally focused,
ignore customer or competitor concerns and lack an organisational strategic aspect
(Kaplan & Norton, 1992; Kennerley & Neely, 2003). These shortcomings have led to a
considerable amount of time and resources being invested in developing a comprehensive
performance measurement system (PMS) that would extend the focus onto the contexts
and objectives of organisations.
A traditional framework of cost, time, and quality is insufficient for evaluating
very complex PPP ventures in both developed and developing countries. This framework
needs to be extended to a broader form of evaluation mechanism, irrespective of the
countries in which PPP projects are implemented (Love, Liu, Matthews, Sing, & Smith,
2015; Raisbeck et al., 2010). Designing an appropriate performance evaluation
framework for PPPs has been argued to be more challenging than that for conventional
public procurement (Grimsey & Lewis, 2002). In addition, no single method seems to fit
all PPP types since they are so varied in attributes and purposes.
Review of the theoretical development of PPPs suggests that currently, there is no
such notable performance measurement framework in PPPs. However, the performance
15
prism, a conceptual framework of lifecycle-based PPP performance measurement
approach, has recently been developed (J. Liu, Love, Davis, et al., 2015).
2.3 The performance prism framework
“The performance prism framework is a tool which can be used by management
teams to influence their thinking about what the key questions are that they want to
address when seeking to manage their business” (Neely et al. 2001). Considering this
viewpoint, a dynamic life-cycle performance measurement framework that consists of a
set sixty-three core indicators into five perspectives has been developed (J. Liu, Love,
Davis, et al. 2015). Some of these indicators are common in the developing countries
perspective and thus considered PPP performance indicators in our research. However,
this framework ignored the relative importance of the indicators in performance
evaluation.
2.4 Global experiences of PPP performances
2.4.1 Performances in the developed countries: A critical review
Developed countries such as the UK, Canada, and Australia, where PPP first
materialized, have shown relatively better success because their governments
continuously evaluate PPP arrangements, with respect to achieving the best value for
money. The levels of performance differ across jurisdiction that varies, depending on their
institutional qualities, economic status, cultural attributes, financial market, and other
factors. In developed countries, changes are brought into as and when required (KPMG,
2010). Advanced issues, such as stable risk allocation, designing robust business cases
and effective control of concessionaire, are considered to be priority issues for developed
countries (De Jong, Mu, Stead, Ma, & Xi, 2010). Relationship management in developed
countries is more focused on maintaining sustainable partnerships to achieve a superior
16
value of PPPs (Zou, Kumaraswamy, Chung, & Wong, 2014). Designing and bundling
require a high level of expertise, which the only developed countries might have the
luxury of demanding (Iossa & Martimort, 2015).
In the UK, PPP was first adopted early in the 1990s; since then the PFI model has
been implemented in various sectors at the national level, and technical advice has been
provided to local government authorities. By 2006, around 500 PPP projects were in
operation, which demonstrated PPPs popularity in the UK (Yescombe, 2011). In the
present decade, a range of sectors have adopted the PPP option, including education,
health, and defence departments. Initially, many local authorities did not cooperative in
using PPPs, but PFIs in the education sector boosted their confidence in PPP effectiveness
(Osei-Kyei, 2017).
PPPs have shown superior performance in Australia as well. Australian PPPs have
demonstrated cost efficiency over traditional procurement to an extent of 30.8 percent
(when measured from the contractual commitment to final outcome). They have also
shown a schedule performance that was 3.4 percent ahead of average time, whereas the
traditional project was completed 23.5 percent behind the scheduled time (Raisbeck et
al., 2010). The PPP market is mature and is considered a successful one among the
advanced nations for achieving a better value for money though there are noteworthy
mega project failures such as CLEM7, Sydney Harbour Tunnel. However, improvement
is needed for non-uniform accountability and transparency system, private sector capacity
constraints, incomplete contract, unfair bid market, and sector suitability for PPP projects
(Regan et al., 2011).
In the USA and Canada, similar and well-structured PPPs have been implemented.
In Canada, diverse sectors are involved in PPPs; in the USA, transport infrastructure
seems to be the major sector using PPPs. Unlike the UK, where design-build-finance-
17
operate (DBFO) concession type was largely used in the transport sector, the US applies
different concessions that include design-build (DB), design-build-finance (DBF) and
design-build-operate-maintain (DBOM). The level of performance in these countries
appears to be moderate, although Canada seems ahead of the USA, which could have
extended use of PPPs to various sectors (Osei-Kyei, 2017; Reinhardt, 2011). Other
developed countries, including Japan and some European countries, have also shown
interest in adopting PPP options (Yescombe, 2011).
2.4.2 Performances in the developing countries: A critical review
Increasing PPP investment trend
The PPP concept emerged in developing countries in the mid-nineties. Since then
PPP investment has grown significantly. Up until 2016, US$ 95b on average was invested
annually in developing countries by private sector participation (World Bank PPI
Database, 2018). This amount represents approximately 20 percent of the total
infrastructure investment in the developing countries (Klein, 2015). This growing trend
indicates the popularity of the PPP option among governments across developing
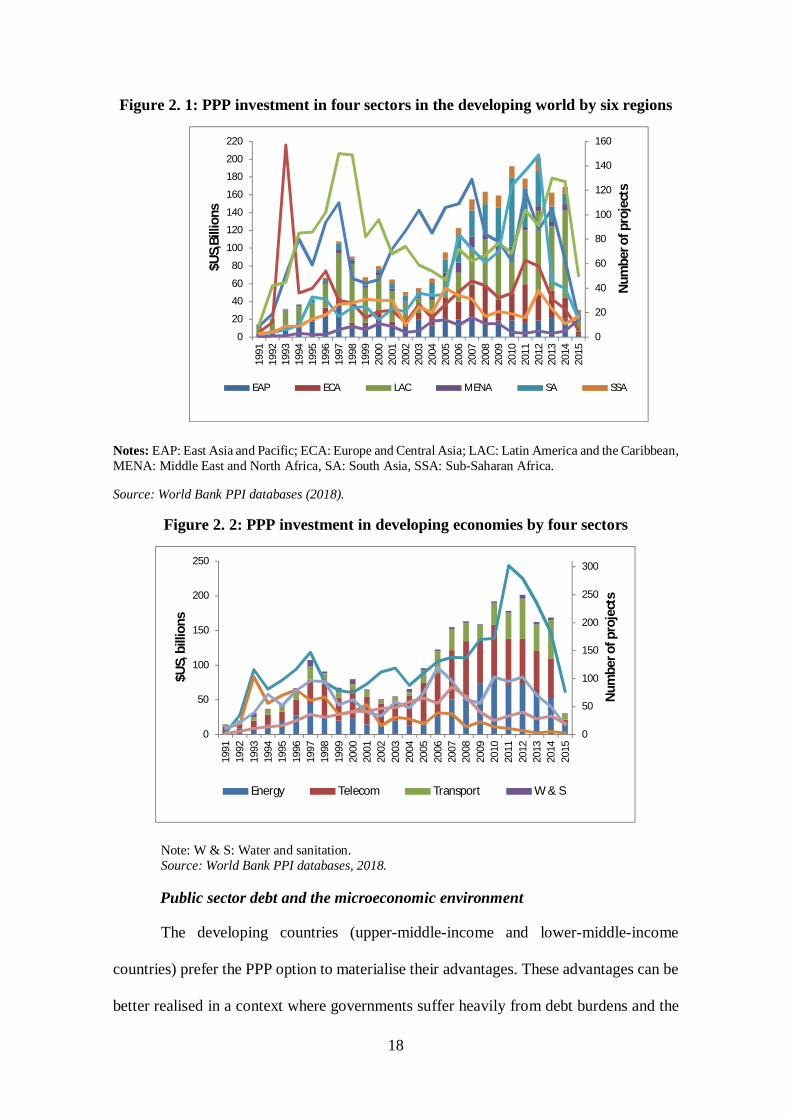
countries. Figure 2.1 shows PPP investment trends in the developing countries from 1991
to 2015 in billion US$ and in number of projects. Latin America and the Caribbean have
the highest of these except from 2002 to 2004. From 2005 to 2012, the PPP investment
around the developing countries more than doubled, increasing to approximately 200
billion US$ in 2014 from 100 billion US$ in 2005. Figure 2.2 shows sector-wise PPP
investment scenarios in the developing economies: the energy and telecom sectors were
dominant until recently, when the transport sector also began attracting more PPP
investments. The energy sector accounts for more project counts but with a lower amount
of investment values; the telecom and transport sectors include mega projects with large
investment (World Bank PPI Database, 2018).
18
Figure 2. 1: PPP investment in four sectors in the developing world by six regions
Notes: EAP: East Asia and Pacific; ECA: Europe and Central Asia; LAC: Latin America and the Caribbean, MENA: Middle East and North Africa, SA: South Asia, SSA: Sub-Saharan Africa.
Source: World Bank PPI databases (2018).
Figure 2. 2: PPP investment in developing economies by four sectors
Note: W & S: Water and sanitation. Source: World Bank PPI databases, 2018.
Public sector debt and the microeconomic environment
The developing countries (upper-middle-income and lower-middle-income
countries) prefer the PPP option to materialise their advantages. These advantages can be
better realised in a context where governments suffer heavily from debt burdens and the
0
20
40
60
80
100
120
140
160
0
20
40
60
80
100
120
140
160
180
200
220
1991
1992
1993
1994
1995
1996
1997
1998
1999
2000
2001
2002
2003
2004
2005
2006
2007
2008
2009
2010
2011
2012
2013
2014
2015
Num
ber o
f pro
ject
s
$US,
Billi
ons
EAP ECA LAC MENA SA SSA
0
50
100
150
200
250
300
0
50
100
150
200
250
1991
1992
1993
1994
1995
1996
1997
1998
1999
2000
2001
2002
2003
2004
2005
2006
2007
2008
2009
2010
2011
2012
2013
2014
2015
Num
ber o
f pro
ject
s
$US,
bill
ions
Energy Telecom Transport W & S

19
aggregate demand and market size are greater. PPP options also become effective in
countries that have previous PPP experiences, better macroeconomic stability, and
relatively better marketability of the services (Hammami et al., 2006; Yang, Hou, &
Wang, 2013). However, developing countries often underperform, due to their poor
regulatory qualities, their weaker financial market, their unstable macroeconomic factors,
and their lack of political commitment (Sanghi, Sundakov, & Hankinson, 2007). Private
investors in India, for example, who mostly took loans from state-owned banks, are under
pressure of interest obligations. Infrastructure indebtedness has risen and non-performing
assets have grown up in the banking sectors because of the credit expansion (World Bank,
2014b).
Corruption and moral hazard
PPP performances differ with respect to industry-specific variations, depending
on the nature of the infrastructure under development, the type of technology required,
and how capital intensive the project is (Hammami et al., 2006). Corruption in PPPs, as
revealed in Latin American developing countries (Guasch, Laffont, & Straub, 2007), in
China (De Jong et al., 2010), and in Eastern European developing countries, has created
moral hazard problems for governments. Governments have provided implicit or explicit
guarantees that encourage contract renegotiation in anticipation of a bail-out program to
be offered to the contractors by the government (Engel, Fischer, & Galetovic, 2014b).
This problem might create contingent liabilities for future governments (Percoco, 2014).
The political environment, opportunity cost and accounting system in PPPs
Private sector participation in PPP ventures in developing countries has a
significant link to the political environment that can support the reduction of costs and
risks associated with PPP investment. In particular, the activities of opposition parties are
associated with building confidence in private investors (Moszoro, Araya, Ruiz Nunez,
20
& Schwartz, 2014). Furthermore, the conceptual difficulties of the opportunity cost of the
public funds, and the accounting tricks used in government accounting, might lead to a
misunderstanding of the worthiness of PPPs (Trebilcock & Rosenstock, 2015). For
example, a case of an opportunity cost may happen in user-fee-based projects, where the
state forgoes the future revenue streams and provides contractors with controlling and
supervising authorities to extract the revenues from the projects (Daniels & Trebilcock,
1996). An accounting trick may apply in masking government long-term liabilities, when
the government pays the contractors for the facilities over the life of the project, in the
case of non-user fee-based PPPs (OECD, 2008).
2.5 PPP performance evaluation practices in developing country context
The literature on PPP performance mechanisms experienced across different
jurisdictions of PPPs has been comprehensively reviewed. This review is presented in list
form in table (see table 2.1, section 2.4.2).
A little research has so far been accomplished in the developing country context.
Those studies represented in table 2.1 depict some country focus, but it mostly relates to
the countries in which the survey was directed. A few studies (Almarri & Boussabaine,
2017; Atmo, Duffield, Zhang, & Wilson, 2017; Yuan, Li Wei, Zheng Xiaodan, &
Skibniewski, 2018) relate to the developing countries, including China, Indonesia, and
UAE, but those studies do not focus on our subject, the performance evaluation
mechanism. For example, Atmo et al. (2017) and Almarri & Boussabaine (2017) made a
comparative study between two countries on the aspects other than PPP performance
measurement approaches. Yuan et al., (2018) developed a model of a performance
evaluation framework for measuring the operation performance (OP) of public housing
delivery in China. All the other studies have either a global perspective or a developed
country context.
21
Clearly, the outcomes of the review of PPP performance evaluation approaches
indicate that few publications report actual PPP performances and their measurement
approaches, either as research outcomes or as disclosed information (reports). Any
research attempted up until now was in the context of developed countries. However,
PPPs in developing countries has materialised through following the models and practices
implemented in the developed countries. Sometimes donor agencies (including World
Bank, IMF, and ADB) prescribe the use of PPP models in the developing counties, if
funding is provided by them. Such prescription holds features of the commonly practiced
models of PPPs implemented in developed countries; their performance evaluation
mechanisms are automatically transferred to the implementation process in developing
countries.
Some studies document performance measurement practices in developing
countries (Marin, 2009; World Bank, 2017b, 2017d). In these studies, it is evident that
performance is measured based on the coverage of infrastructures built on a PPP basis, as
well as their service quality, operational efficiency and level of prices charged for the
services (Marin, 2009). The procuring authority gathers information from operators on
performance indicators (as specified in the contract document) to be considered
responsible for measuring performances (World Bank, 2017b). In India, the Philippines,
and South Africa, output-based specifications are used as articulated in the contract
document (World Bank, 2017d).
Comprehensive evaluation mechanisms are absent even in such developed
countries as Australia and the UK. Their approaches to performance evaluation have
concentrated mostly on discussing the advantages and disadvantages of PPPs (J. Liu,
Love, Sing, Smith, & Matthews, 2017). A lack of stakeholder-specific and incomplete
performance mechanisms exists, even in the developed countries (Hodge & Greve, 2017).
22
Given these circumstances, an assumption might be made that a PPP performance
evaluation system holds features and practices common to both developed and developing
countries, except where a specific country develops its own comprehensive evaluation
mechanisms that include individual project features and local elements of operating
conditions.
The following sections include detailed discussion of the PPP performance
measurement literature that focuses on the public sector comparator (PSC) approach, the
key performance indicator (KPI) system, the life cycle approach, the output specification,
and the organisational performance evaluation. The PSC approach is a baseline scenario
used for comparing the PPP option with traditional procurement, where the risk adjusted
cost of the PPP option is considered (World Bank, 2017d). The value for money (VFM)
from adopting the PPP option is assessed using this approach.
The key performance indicator system focuses mainly on project level
performances, with various indicators used to measure actual performances (Haponava &
Al-Jibouri, 2012). This system has recently been extended to the life cycle approach,
which accounts for the different process factors that appear in the project life (J. Liu,
Love, Davis, et al., 2015; Love et al., 2015). Output specifications specify which outputs
are required from the project; they are an essential part of the contract document that
governs the procurement and monitoring of PPP projects (Lam & Javed, 2015;
Yescombe, 2007).
2.5.1 Public sector comparator (PSC) approach
In the PSC approach, it is important to use the same assumptions as used for PPPs,
with respect to timing, funding, output specification and performance standards (Grimsey
& Lewis, 2005). After an actual bid, PSC might be compared with the actual to conclude
whether the proposed PPP bid promises better VFM (Kweun, 2018). The primary
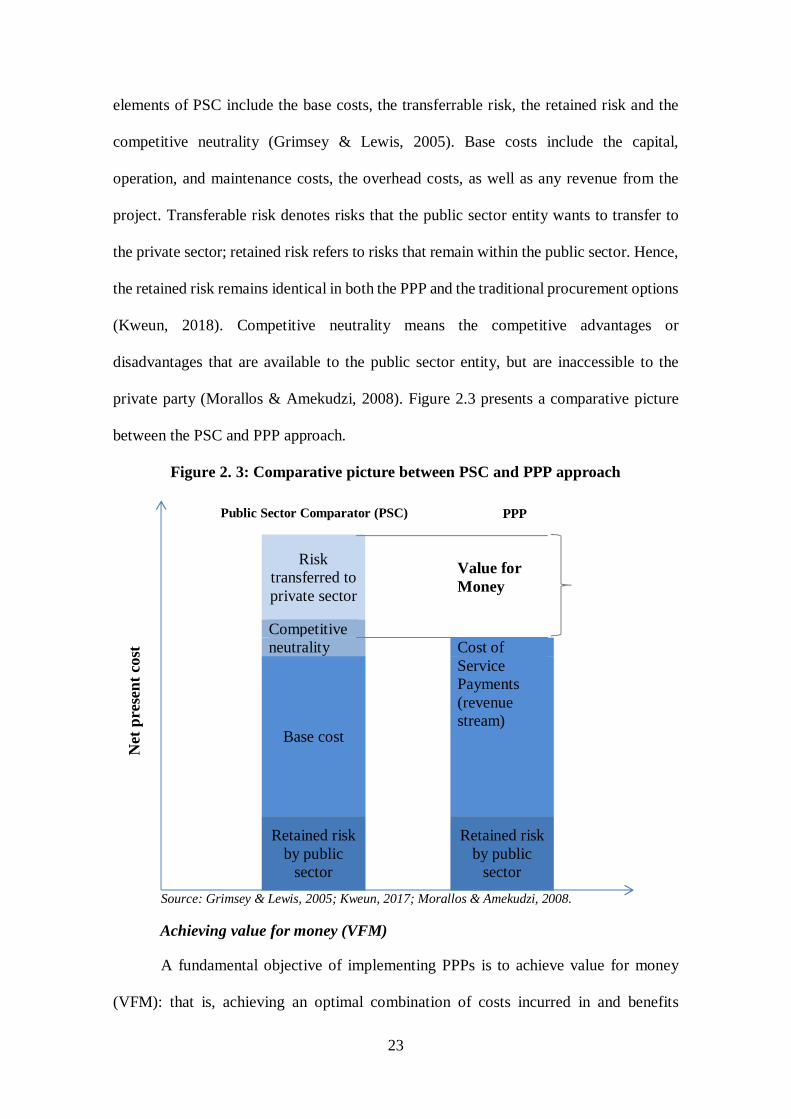
23
elements of PSC include the base costs, the transferrable risk, the retained risk and the
competitive neutrality (Grimsey & Lewis, 2005). Base costs include the capital,
operation, and maintenance costs, the overhead costs, as well as any revenue from the
project. Transferable risk denotes risks that the public sector entity wants to transfer to
the private sector; retained risk refers to risks that remain within the public sector. Hence,
the retained risk remains identical in both the PPP and the traditional procurement options
(Kweun, 2018). Competitive neutrality means the competitive advantages or
disadvantages that are available to the public sector entity, but are inaccessible to the
private party (Morallos & Amekudzi, 2008). Figure 2.3 presents a comparative picture
between the PSC and PPP approach.
Figure 2. 3: Comparative picture between PSC and PPP approach
Risk
transferred to private sector
Value for Money
Competitive neutrality Cost of
Base cost
Service Payments (revenue stream)
Retained risk
by public sector
Retained risk by public
sector
Source: Grimsey & Lewis, 2005; Kweun, 2017; Morallos & Amekudzi, 2008.
Achieving value for money (VFM)
A fundamental objective of implementing PPPs is to achieve value for money
(VFM): that is, achieving an optimal combination of costs incurred in and benefits
Public Sector Comparator (PSC) PPP
Net
pre
sent
cos
t
24
realized from a delivery of public services. An analysis of VFM is performed, based on
some qualitative parameters (rationale, the scope of private financing and on-site
conditions) and some quantitative aspects (fiscal cost), to signal the viability of a PPP
project to the decision makers (Kweun, 2018). Furthermore, the best price for a given
quantity and standard of output, measured in terms of relative financial benefit, can also
be regarded as VFM (Grimsey & Lewis, 2005). The VFM analysis is typically used
during an ex-ante assessment of the project: it is very rare in an ex-post evaluation in the
current operational practice (Shaoul, Stafford, & Stapleton, 2006).
VFM assessment practice in developing countries
Although the construction and application of a PSC is an innate part of all PPPs
in the UK and Australia, and is active in some other regions of the world, many countries
do not use a PSC approach in assessing VFM. It even happens in developed countries
such as the USA and France. In the USA, the VFM is sought through the tendering
process; in France, a concession model is used to determine it (Grimsey & Lewis, 2005).
However, some developing countries, including South Africa, use a PSC calculation for
VFM assessment; Argentina uses a competitive bidding process to gauge this value. India,
which applies a PPP option for producing power, building road infrastructures, and
procuring hospital and water and sanitation services, uses a cost estimate for assessing
VFM, rather than using the PSC systematically. If actual bids come to the level that is
substantially different to the estimates, further analysis is done to justify the actual bids.
The Philippines uses a best-practice approach that includes different structures of PPPs,
such as build-operate-transfer (BOT), build-own-operate (BOO), build-transfer-operate
(BTO), and build-lease-transfer (BLT). Water supply and sanitation projects in east and
west Manila are two examples of a ‘best practice’ approach in delivering water services.
VFM recorded by the winning bidder, to provide water supplies at a lower price, was
25
compared to the water services by the traditional approach (Grimsey & Lewis, 2005). In
Bangladesh, no formal PSC tool has been used until now, but, through competitive
tendering, the VFM is realised by awarding the project to the highest bidders. Both the
technical and the financial proposals are considered in selecting competent bidders (PPP
Authority, 2016).
Criticism of PSC
PSC-based value for money appraisal has also been criticised. A recent
development in the VFM analysis literature claims that VFM analysis should include four
general categories: social welfare analysis, non-financial benefits and cost to public sector
agencies, local governments, and users and non-users of the project (DeCorla-Souza,
Ham, & Timothy, 2016). DeCorla-Souza et al. (2016) also recommended that the benefit-
cost analysis (BCA) could supplement the VFM analysis by contributing to a greater
transparency and accountability in the PPP procurement process.
The VFM appraisal system, which is biased in favour of policy expansion, is
constrained by the unavailability of information needed for evaluating performances
(Shaoul et al., 2006). The UK Public Accounts Committee criticised the PSC process as
a ‘manipulation’ (Hodge & Greve, 2017); other researchers (Ball, Heafey, & King, 2007)
have argued that the VFM analysis is a subjective analysis of risks associated with a
project. Risk transfer to a private party is subject to the assumptions made for a) the
amount of risk to be transferred and b) the calculation of value for the transferred risk. A
change in the hypothetical assumptions regarding risk can change the NPV calculation.
In addition to those risks transferred to the private sector, other risks, such as
obsolescence, changing needs and service performance outcomes, are retained by the
public sector, which indirectly costs the public. Further, with contracts that last longer,
such as 20 to 50 years, the financial evaluation of the cost and transferred risk might be
26
incomplete, where non-financial matters and long-run consequences need to be taken care
of (Grimsey & Lewis, 2005; Morallos & Amekudzi, 2008).
2.5.2 (Key) Performance indicator system
The concept of using an indicator system for evaluating performances, which
originated from the theory of benchmarking, and which is currently used in many
industries, has the objectives of improving business activities and setting higher targets.
Indicators are generally used to compare actual achievements with the targets (Haponava
& Al-Jibouri, 2009, 2012). The performance indicator system is widely used in
construction projects; measurement previously focused mainly on the project level, but
recently widened its scope to the process or life cycle of the project (Haponava & Al-
Jibouri, 2012). KPIs include a) efficiency measures (e.g., inputs and outputs); b)
effectiveness in terms of outcomes (e.g., the quantity and the volume of access); c) service
quality measures; d) financial performance measures; and e) process and activity
measures. These KPIs are commonly used in both developed and developing countries,
with little variations in their application (OECD, 2008).
KPI system adopted in PPPs
The KPI system has been adopted into PPPs from the project management area,
along with their embedded features: cost, time and quality (the iron triangle) are the
principal indicators in measuring project performances (J. Liu, Love, Smith, Regan, &
Sutrisna, 2014). However, PPPs differ from traditional projects with respect to a)
stakeholder interest, b) the different purposes of the project (also include political
purposes), the unique procurement approach, and the complex project features (J. Liu et
al., 2017; Yuan, Wang, Skibniewski, & Li Qiming, 2012). Performance indicators of
PPPs might even change with changing conditions of the operating environment and the
project features. Further, the measurement approach evolves from the traditional one
27
towards a more comprehensive evaluation technique that can capture the interest of multi-
stakeholders.
Summary of the studies on KPIs
Previous studies (Lawther & Martin, 2014; J. Liu, Love, Smith, Matthews, &
Sing, 2016; Mladenovic, Vajdic, Wündsch, & Temeljotov-Salaj, 2013; Osei-Kyei &
Chan, 2017a; Saeed, Duffield, & Hui Felix Kin, 2018; Yuan et al., 2018; Yuan, Zeng,
Skibniewski, & Li, 2009; Zhou, Keivani, & Kurul, 2013) presented different models of
the performance framework/indicator system for PPPs. A complete list of reviewed
literature with the main features of the studies has been enumerated in table 2.1. Most of
these studies have either focused on developed countries or used a global perspective.
Three studies (Yuan et al., 2018; Yuan, Skibniewski, Li Qiming, & Zheng Lei, 2010;
Yuan, Wang, et al., 2012) have focused on China, a particular country that has different
characteristics of governance and economy from other developing countries. Only the
study of Osei-Kyei & Chan, 2017a has a developing country focus, especially on Ghana.
But the authors mentioned that the conclusion drawn in this study should not be
generalised for all developing countries. However, in the following paragraphs, a detailed
discussion on the notable studies of performance indicators system has been made.
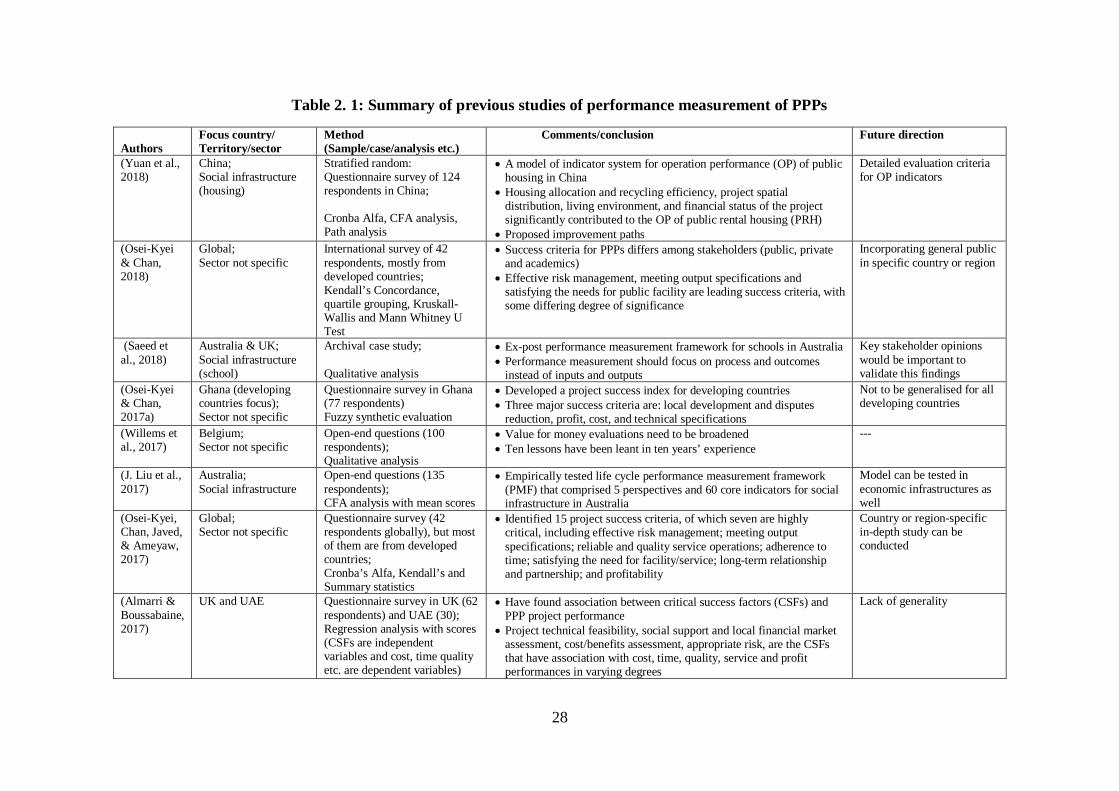
28
Table 2. 1: Summary of previous studies of performance measurement of PPPs
Authors
Focus country/ Territory/sector
Method (Sample/case/analysis etc.)
Comments/conclusion Future direction
(Yuan et al., 2018)
China; Social infrastructure (housing)
Stratified random: Questionnaire survey of 124 respondents in China; Cronba Alfa, CFA analysis, Path analysis
A model of indicator system for operation performance (OP) of public housing in China
Housing allocation and recycling efficiency, project spatial distribution, living environment, and financial status of the project significantly contributed to the OP of public rental housing (PRH)
Proposed improvement paths
Detailed evaluation criteria for OP indicators
(Osei-Kyei & Chan, 2018)
Global; Sector not specific
International survey of 42 respondents, mostly from developed countries; Kendall’s Concordance, quartile grouping, Kruskall-Wallis and Mann Whitney U Test
Success criteria for PPPs differs among stakeholders (public, private and academics)
Effective risk management, meeting output specifications and satisfying the needs for public facility are leading success criteria, with some differing degree of significance
Incorporating general public in specific country or region
(Saeed et al., 2018)
Australia & UK; Social infrastructure (school)
Archival case study; Qualitative analysis
Ex-post performance measurement framework for schools in Australia Performance measurement should focus on process and outcomes
instead of inputs and outputs
Key stakeholder opinions would be important to validate this findings
(Osei-Kyei & Chan, 2017a)
Ghana (developing countries focus); Sector not specific
Questionnaire survey in Ghana (77 respondents) Fuzzy synthetic evaluation
Developed a project success index for developing countries Three major success criteria are: local development and disputes
reduction, profit, cost, and technical specifications
Not to be generalised for all developing countries
(Willems et al., 2017)
Belgium; Sector not specific
Open-end questions (100 respondents); Qualitative analysis
Value for money evaluations need to be broadened Ten lessons have been leant in ten years’ experience
---
(J. Liu et al., 2017)
Australia; Social infrastructure
Open-end questions (135 respondents); CFA analysis with mean scores
Empirically tested life cycle performance measurement framework (PMF) that comprised 5 perspectives and 60 core indicators for social infrastructure in Australia
Model can be tested in economic infrastructures as well
(Osei-Kyei, Chan, Javed, & Ameyaw, 2017)
Global; Sector not specific
Questionnaire survey (42 respondents globally), but most of them are from developed countries; Cronba’s Alfa, Kendall’s and Summary statistics
Identified 15 project success criteria, of which seven are highly critical, including effective risk management; meeting output specifications; reliable and quality service operations; adherence to time; satisfying the need for facility/service; long-term relationship and partnership; and profitability
Country or region-specific in-depth study can be conducted
(Almarri & Boussabaine, 2017)
UK and UAE Questionnaire survey in UK (62 respondents) and UAE (30); Regression analysis with scores (CSFs are independent variables and cost, time quality etc. are dependent variables)
Have found association between critical success factors (CSFs) and PPP project performance
Project technical feasibility, social support and local financial market assessment, cost/benefits assessment, appropriate risk, are the CSFs that have association with cost, time, quality, service and profit performances in varying degrees
Lack of generality
29
Cost and quality were the least/minimal performance criteria that could be predicted by the factors
(Atmo et al., 2017)
Indonesia 56 power projects (cost, time and quality data); Two-way ANOVA, graphs and other quantitative analysis
Compared outcomes of PPP power projects with traditional ones PPPs have superior time and operating availability (quality)
performance than traditional ones while no differences are in cost performance
Suggested for selection of experienced providers and enabling policies to attract international operator to come forward
Could be extended to a regional focus
(Hodge & Greve, 2017)
Global, but focused on developed countries
Review of the archival literature on PPP performance and beyond; Qualitative analysis
P3 has meanings in five levels: project, delivery method, policy, governance tool and cultural context
Judging success depends on who it is for P3 will remain a successful option for political leaders with flexibility
in usage
Hinted on necessity of stakeholder-specific and appropriate performance evaluation mechanism
(Klijn & Koppenjan, 2016)
Netherlands; Sector not specific
Questionnaire survey (144 respondents from 68 PPP projects); Multi-level regression analysis
Investigated impact of contract features including possible sanctions, contract complexity, flexibility and scope of renegotiation on performances
Found only sanction possibility has impact on performances Need to look beyond contract terms to properly understand and
manage PPP performances
Suggested for more evidences
(J. Liu et al., 2016)
Australia; Social infrastructure (hospital, prison and school)
Interviews (25 in Australia); Qualitative analysis (Nvivo Software)
A process based or life cycle performance measurement framework has been proposed in place of traditional one, where a series of performance indicators will be used to measure performances
Have strategic focus on value for money
Suggested for case study and CFA to validate these findings
(Love et al., 2015)
Global, focused on developed countries; Sector not specific
Review of literature on PPP performance evaluation
Life-cycle approach to project evaluation is needed Application of building information modelling (BIM) in PPP project
process evaluation can result in PPPs to be ‘future proofed’ and management of assets over the whole life to be successful
Further testing and application of BIM approach in PPP process evaluation
(J. Liu, Love, Carey, Smith, & Regan, 2015)
Australia; Infrastructure overall
Literature review; Vector Error Correction Model/Unit root test/Co-integration test/Variance decomposition
Developed a set of KPIs for ex-ante evaluation of macroeconomic environment for PPPs and found critical to such evaluation using Granger causality test
Conditions of global economy is essential KPI for ex-ante PPP environment evaluation
Construction price level, domestic economic conditions, money market conditions, and unemployment level are the most critical KPIs in the ex-ante evaluations of PPP infrastructure projects.
Selecting of a suitable option between PPP and traditional procurement might be a future agenda
(J. Liu, Love, Davis, et al., 2015)
Global; Sector not specific
Literature review; Conceptual model
Based on five measurements facets of performance prism, a conceptual model of life cycle performance measurement framework has been proposed for PPP project evaluation
Mentioning case study to be conducted to validate the model
30
(Liyanage & Villalba-Romero, 2015)
UK, Spain, Portugal and Greece; Transport sector
Case study; Qualitative Comparative Analysis (QCA)
Developed a methodology of measuring the success of PPPs, encompassing three perspectives including management, stakeholders and contract perspectives
Perception of success may change if perspectives change
Attaching weights to the KPIs/using different perspectives and mores cases to see if what results come out
(Lam & Javed, 2015)
Australia & UK Questionnaire survey (131 from UK) and 62 (Australia); Cronbach’s Alfa; Kendall’s concordance; Mann Whitney Test
Comparative study shows that pitfall issues and change management issues are
Common pitfalls include conflicts between input and output specifications
Performance standards are compromised with affordability, Small changes are often made by the public sector authorities Changes are dealt with by anticipatory provisions in output
specifications, or negotiations as and when they arise
----
(Javed, Lam, & Chan, 2014)
Global; Sector not specific
Experimental approach based on Game theory, conducted in university students
A detailed and clear output specification with cost-sharing framework facilitates change negotiation in PPPs
More research-based game theory to confirm these findings
(Lawther & Martin, 2014)
Australia & Canada; Transport sector
Case study; Two cases from Australia and Canada
KPI system is inappropriate to measure the performances from the perspectives of agency, societal or project goals
Inappropriate choice of KPIs and standards
----
(Zhou et al., 2013)
UK; PFI projects
Literature review for identifying indicators; Questionnaire survey (65 respondents); Kruskal-Wallis test
KPIs and benchmarking are developed for measuring sustainability performance of the PFI projects. Environmental, economic, social and technical aspects have been considered.
Important KPIs are care of end-users, whole life costing, health and safety, capital cost, energy consumption during operation and low maintenance cost
In-depth qualitative analysis is demanding
(Mladenovic et al., 2013)
Global; Transport sector mainly
Brainstorming outcomes are refined by literature support and then expert surveys; 18 experts participated; Frequency of mention approach
KPIs are classified into three groups: Technical, operational and financial KPIs
Two layers approach has been developed: first, objective based project evaluation from stakeholders’ perspectives. Objectives include profitability (private sector), effectiveness and value for money (public) and level of service (users). Second, an adjusted and weighted combination of fulfilment of the specific stakeholder objectives will lead to an overall approach of describing a PPPs success or failure.
A large number of KPIs are common among the public and private partners, implying that private partners are aware of the objectives of PPPs and are committed to provide better public services.
Identifying appropriate CSFs and KPIs might be interesting research agenda
(Oyedele, 2013)
UK; PFI projects
Focus group discussion; Questionnaire survey (87 respondents); Cronbach’s alfa/Multiple regression/spearman correlation
Developed a predictor model comprising seven CSFs, which would help contractors avoid performance failure payment deduction and thus help to maximise profits of the sponsors
Seven CFSs are good working relationship, minimal use of subjective measures, a functioning help desk, realistic performance standards,
The study was limited to UK industry; other countries might be the focus of future research with similar approach
31
quality of service delivery, use of just in time (JIT) inventory system and contractor’s active participation in design process.
(Javed, Lam, & Zou, 2013)
Australia Semi-structured interviews (19 experts from across Australia); Qualitative analysis (Triangulation of interviews)
A good set of output specifications is conducive to the achievement of value for money, innovation, risk transfer, whole life asset performance
Too many and complex KPIs were specified in Australia PPPs, which are difficult to monitor and implement while very prescriptive specifications hindered innovations and did not allow appropriate risk allocation
A careful drafting of output specifications can mitigate these challenges
This result learnt from fail-projects should be further investigated
(Yuan, Wang, et al., 2012)
Global, but focused on China
Questionnaire survey (141 respondents based on stratified random sampling); CFA analysis
A conceptual model of KPIs developed by the same authors is empirically tested by using CFA and an improved model of 41 performance indicators has been developed
Performance improvements within PPPs are strongly influenced by reasonable procurement, design and planning in the public sector, effective process control in the private sector, and the ultimate satisfaction of both the public and private sectors
Cause and effect relationship between performance packages, PIs and project performance should be clarified by future research
(Raisbeck et al., 2010)
Australia; Infrastructures overall
Project data (21 PPP and 33 traditional projects selected from across Australia);
PPP provided superior performances in cost and time dimensions over traditional procurements and PPP advantages increase with the size and complexity of projects
Common techniques need to be developed for measuring PPPs performance across the globe
(Yuan et al., 2010)
Global, focused on China; Social infrastructure (Beijing Olympic)
Questionnaire survey (141 respondents based on stratified random sampling); Fuzzy entropy method and fuzzy TOPSIS method
A group decision weight of 15 performance objectives has been derived by using fuzzy entropy method, where different stakeholder decision is reflected
Selecting appropriate performance objective levels for PPP projects
Quantitative assessment (weight) of performance objectives and finding model of reduced number of indicators
(Yuan et al., 2009)
Global; Stakeholders perspective, sectors not specific
Literature review and goal setting theory for identifying objectives; Questionnaire survey (141 respondents based on stratified random sampling); Cronbach’s alfa/Mann-Whitney test/ANOVA
15 performance objectives are identified from the literature reviews and all of them are important objectives though stakeholder groups differ on public sector budget constraint, risk, revenues and guarantees. However, they have similar opinions on cost time and quality etc.
A conceptual model of process factors those are static and dynamic. These factors influence performance of PPPs
A call for developing relative importance of objectives by using mathematical model; Application of improved and more objective method to get rid of fuzziness bias
(Hodge & Greve, 2007)
Global, but Australia focused
Literature reviews; Qualitative analysis
Have both success and failure experiences, with some glowing policy promises
Mixed results of PPP effectiveness
Need to strengthen evaluation mechanism and free assessment from political bias
Source: Author
32
A critical review of related literature
J. Liu et al. (2015) developed a set of KPIs for ex-ante evaluation of the
macroeconomic environment for PPPs and found them critical to such evaluation. The
most critical ones are the construction price level, the domestic economic conditions, the
money market conditions, and the unemployment level. J. Liu et al. (2016) subsequently
proposed a process-based or life-cycle performance measurement framework in place of
the traditional one. In this study, a series of performance indicators have been proposed
to be used for focusing on the VFM measurement. Both of these studies are based on
Australia, with implications for other countries.
Yuan et al., (2009) developed a performance objectives model that comprises five
performance packages: project quality, financial and marketing, innovation and learning,
stakeholders, and process indicators. Using a Likert scale survey among different
stakeholders from around the globe, Yuan et al. (2012) then derived an estimate of the
relative importance of the indicators; however, the operating context of the PPP project
was ignored. For example, better transparency and accountability for executing a PPP
project in an advanced country can cause project performance to vary more widely than
that of a relatively poor operating environment in a developing country. Accordingly, the
results found in such a study cannot be used for generalising a performance framework
applicable to a specific group of countries, such as developing countries. In the context
of some European countries, the ‘overall’ success of transport PPPs was measured by
using a qualitative approach (Liyanage & Villalba-Romero, 2015).
Yuan et al., (2018) proposed a model of an indicator system for improving
operation performance (OP) and performance improvement pathways for public rental
housing (PRH) in China. The OP, which includes 23 indicators, consists of four packages,
housing allocation and recycling efficiency, project spatial distribution, living
33
environment, and financial status of the project; it has significantly contributed to the OP
of PRH (Yuan et al., 2018).
From an international survey, Osei-Kyei et al. (2017) identified a set of 15 project
success criteria that included effective risk management, meeting output specifications,
reliable and quality service operations, adherence to time, satisfying the need for public
service, long-term relationship and partnership, and profitability. Most of the experts in
the survey were from developed countries; the criteria reported were very generic, but
were not sector or stakeholder specific. Success criteria for PPPs differ in different sectors
and even among stakeholders (e.g., private, public and academic) (Osei-Kyei et al., 2017).
Using the same survey results, Osei-Kyei & Chan (2018) recognized three leading PPP
success criteria: effective risk management, meeting output specifications and satisfying
needs for public facilities. For PPPs in developing countries, a project success index,
based on ex-ante critical success factors, was developed (Osei-Kyei & Chan, 2017a) using
a country-specific (Ghana) Likert scale survey. This result should not be generalised for
other developing countries, but might be used as a reference for future research.
For measuring the sustainability of PFI building and other infrastructure projects,
Zhou et al. 2013 developed a framework of KPIs with 28 sustainability indicators grouped
into four dimensions: environmental, economic, social and technical. The most important
indicators among them are whole-life costing health and safety, capital cost, energy
consumption during operation and low maintenance cost. Their study is limited by the
sampling bias caused by the geographic location, based on England and Wales, and the
application of a quantitative approach. For monitoring the performance of transport PPPs,
Mladenovic et al. (2013) introduced a two-layer approach for evaluating PPP projects.
First to be performed is an evaluation of the project objectives that includes profitability
(private sector), effectiveness and value for money (public) and level of service (users)
34
from the perspectives of different stakeholders. Second is an adjusted combination of
fulfilling the objectives of a specific stakeholder group, leading to an overall approach of
telling the success or failure of a PPP project. KPIs are classified into three groups:
technical, operational and financial KPIs. A large number of these KPIs are common
among the public and private partners. This implies that private partners are aware of the
objectives of PPPs and are committed to providing better public services (Mladenovic et
al., 2013).
Criticism of the KPI system
Several criticisms are made about using the KPI system. KPIs used in PPPs are
product-based, as the traditional performance evaluation techniques are (Regan et al.,
2011); accordingly, they are inadequate for measuring agency or social objectives (J. Liu,
Love, Carey, et al., 2015; Yuan et al., 2018). Selecting indicators and setting standards to
measure performance are critical to the success of the KPI system. Performance measures
and standards change over time and need to be adjusted, because initial standards may
have been too low, and because goals of the projects may evolve over its life. For
example, raising standards might be favoured by public partners but opposed by private
partners if additional resources are required for meeting higher standards (Lawther &
Martin, 2014).
2.5.3 Lifecycle evaluation approach: A critical review
Unlike traditional procurements, PPPs follow a dynamic process that takes place
over the life of the projects. To arrest the dynamic issues, a lifecycle approach that can be
considered as an extension to the KPI system is needed to better evaluate the PPPs
performance. Each phase in the cycle should have a number of performance indicators,
depending on the project characteristics and the local elements of the operating context,
where the projects being implemented (Love et al., 2015). During this life cycle, static
35
and dynamic factors that appear in the process can be used to track the performance of
the project and are important for allowing public and private partners to make appropriate
decisions to improve value for money efforts. But a level of sophistication in the
knowledge of macro, micro, financial and political conditions is required for proper
understanding of these performance indicators for both of the public and private sectors
(Yuan et al., 2009).
Other researchers (European Investment Bank, 2011; J. Liu, Love, Davis, et al.,
2015) have proposed a process-based performance framework instead of a KPI-based
static (ex-post and ex-ante) review mechanism for evaluating project performances.
Advocates of this system claimed that evaluating PPPs requires many components, that
including documentation, financing, and taxation, should be considered in the process (J.
Liu, Love, Davis, et al., 2015). Market and business risks may arise from the complexity
of long-term contract arrangements and may change over the project life (Raisbeck et al.,
2010). The following studies have proposed and discussed a lifecycle-based performance
measurement framework in the context of a theoretical perspective, even though its
application is yet far from fruition in both developed and developing countries.
J. Liu, Love, Davis, et al. (2015) has proposed a dynamic life-cycle performance
measurement framework that consists of a set of phase-based core indicators into five
perspectives of the performance prism. Core indicators are expected to capture the
dynamic factors that appear in each project phase, giving public and private sector
manager better insight into a comprehensive evaluation of PPPs. Using this model,
practitioners can monitor and improve performance while the project is still ongoing (J.
Liu, Love, Davis, et al., 2015). J. Liu et al. (2017) later empirically tested this conceptual
model and found that all measurement perspectives (facets) and core indicators except
four are significantly correlated to the PPP performance. This model will allow
36
performance evaluation even during the inception phase of a PPP, by evaluating
stakeholders’ satisfaction level along with their contribution to the project (J. Liu et al.,
2017).
A life cycle approach with a building information modelling (BIM) was
developed to enable the shortcomings of the PSC to be addressed visually and in a
dynamic manner. It will provide with real-time information to monitor performance,
which will ensure that VFM is being achieved. BIM is expected to improve a coordination
and integration between special purpose vehicle, end-users, and the public sector and
deliver a digital representation of physical assets and their functional features that would
facilitate an informed decision making across a project lifecycle (Love et al., 2015). Love
et al. (2015) divided the process of a PPP project into three phases: initiation and planning,
procurement and partnerships. However, the process in practice includes more aspects
than this—such as financing, transparency and accountability, as well as stakeholders’
satisfaction and socio-economic development.
2.5.4 Output specification approach
Along with many aspects (including purpose and scope of the PPP projects,
performance requirements, compliance standards, risk allocation), the output
specifications specify which outputs are required from the projects, but not how these
outputs will be achieved (Javed, 2013; Yescombe, 2007). Output specification is integral
to the contract document of PPPs, which specify and guide the procurement and
monitoring PPP project over its lifecycle (Lam & Javed, 2015). Procuring agencies define
the technical and operational requirements of the facilities and use this approach for the
outputs to be achieved, leaving opportunities for private operators to apply their expertise
in the design, construction and operation of the facilities (Javed, 2013). Output
specification also relates other elements such as payment and change mechanisms. In the
37
payment mechanism, the availability payments are made, subject to the fulfilment of the
output specifications, while the rectifications and changes in different performance
measures and indicators are linked to the change mechanism (Javed et al., 2014).
Minimum required performances are the pre-requisites for the payment to be made to the
contractors. Failure to ensure a certain level of performances, as specified in the output
specifications, results in a deduction of payments (Oyedele, 2013). Output specifications
are also used to monitor the standard of services over the life of the projects. This differs
from the traditional technical specifications, on the grounds that traditional specifications
prescribe the materials and labour required for the services and for the way the services
will be delivered. In contrast, output specifications in the case of PPPs are what the
services’ constructed infrastructures deliver and the levels of operation of the facilities.
Output specifications are thus set in a configuration with users’ needs (Javed, 2013;
Oyedele, 2013). A process flow for writing output specifications is presented in figure
2.4.
Pitfalls of output specifications
While output specifications serve a great purpose in measuring and monitoring
performances of the PPP projects, some pitfalls exist in this approach. Performance
evaluation using this mechanism seems ambiguous, excessively complex and difficult to
manage. Failure to define and follow the service requirements precisely leads to
substandard outcomes. Sources of pitfalls relate to a lack of completeness and clarity. As
with the traditional technical specifications, the input transparency of PPPs is relatively
high compared to output transparency. Unclear guidelines of procuring agencies leave
room for the private sector to behave strategically, avoiding the requirements of the output
specifications. Again, multi-interpretable output specifications provide scope for the
agencies to avoid performance requirements. Setting output specifications requires a high
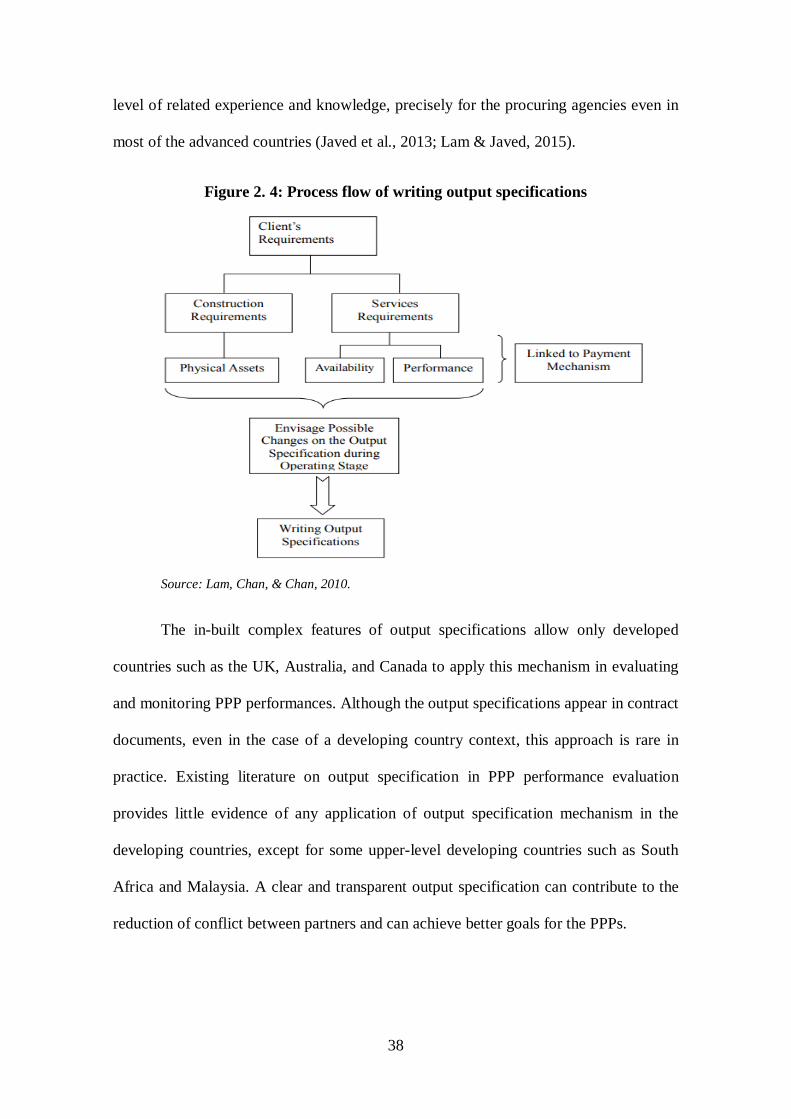
38
level of related experience and knowledge, precisely for the procuring agencies even in
most of the advanced countries (Javed et al., 2013; Lam & Javed, 2015).
Figure 2. 4: Process flow of writing output specifications
Source: Lam, Chan, & Chan, 2010.
The in-built complex features of output specifications allow only developed
countries such as the UK, Australia, and Canada to apply this mechanism in evaluating
and monitoring PPP performances. Although the output specifications appear in contract
documents, even in the case of a developing country context, this approach is rare in
practice. Existing literature on output specification in PPP performance evaluation
provides little evidence of any application of output specification mechanism in the
developing countries, except for some upper-level developing countries such as South
Africa and Malaysia. A clear and transparent output specification can contribute to the
reduction of conflict between partners and can achieve better goals for the PPPs.
39
2.5.5 Organisational level performance evaluation
Discussion in the previous sections has focused on different performance
evaluation mechanisms related to project level performance. This section covers the
review of organisational level performance literature from the broader perspective of
developed and developing countries because of the unavailability of related literature
specific to the developing countries. Organisational level performance differs from
project level performance with respect to the different factors used to evaluate their
performances. Project level performance generally helps to attain organisational
performance (Elwakil, 2017).
Although a considerable amount of attention and resources has been devoted to
PPPs, no conclusive evidence has been found to show that PPPs have so far truly
demonstrated notable organizational performance. The lack of transparency in PPP
financial reporting and irregular updates to PPP information are critical findings
(Homkes, 2011). Nonetheless, evidence of relatively more accountability was found in
the Flemish social PPPs, where actors were more active in the accountability forums and
behaved more actively, and their activities resulted in democratic accountability
(Willems, 2014). Because PPPs take the organisational form in between the private and
public bureaucracies, they require multidisciplinary skills (Hodge & Greve, 2007).
Accordingly, their performance evaluation needs to include areas that would focus on
policy or goal achievement, democratic norms, transformation or innovation in the public
sector, incentives to innovation or connectivity, and coordination and coalition (Jeffares,
Sullivan, & Bovaird, 2009).
However, a political context might thwart the designing of such a holistic
approach because the political consideration might be different otherwise (Higgins &
Huque, 2014). To ensure greater public interest, the concept of ‘less government’ and
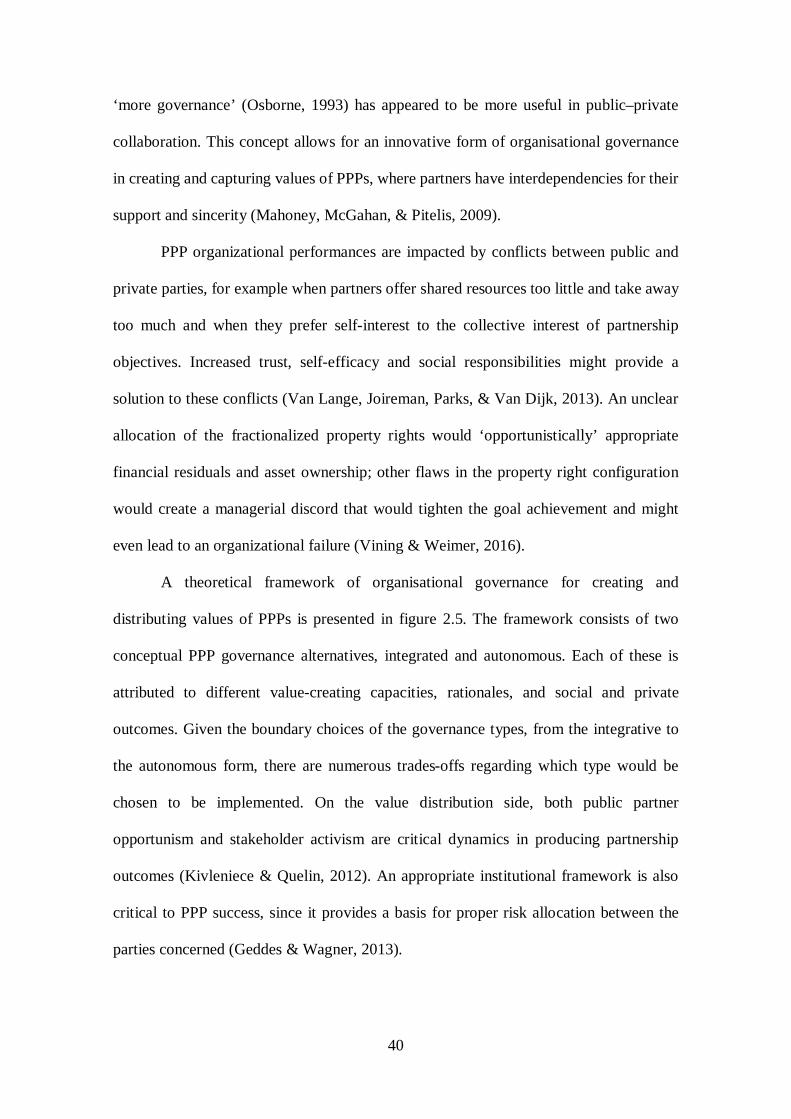
40
‘more governance’ (Osborne, 1993) has appeared to be more useful in public–private
collaboration. This concept allows for an innovative form of organisational governance
in creating and capturing values of PPPs, where partners have interdependencies for their
support and sincerity (Mahoney, McGahan, & Pitelis, 2009).
PPP organizational performances are impacted by conflicts between public and
private parties, for example when partners offer shared resources too little and take away
too much and when they prefer self-interest to the collective interest of partnership
objectives. Increased trust, self-efficacy and social responsibilities might provide a
solution to these conflicts (Van Lange, Joireman, Parks, & Van Dijk, 2013). An unclear
allocation of the fractionalized property rights would ‘opportunistically’ appropriate
financial residuals and asset ownership; other flaws in the property right configuration
would create a managerial discord that would tighten the goal achievement and might
even lead to an organizational failure (Vining & Weimer, 2016).
A theoretical framework of organisational governance for creating and
distributing values of PPPs is presented in figure 2.5. The framework consists of two
conceptual PPP governance alternatives, integrated and autonomous. Each of these is
attributed to different value-creating capacities, rationales, and social and private
outcomes. Given the boundary choices of the governance types, from the integrative to
the autonomous form, there are numerous trades-offs regarding which type would be
chosen to be implemented. On the value distribution side, both public partner
opportunism and stakeholder activism are critical dynamics in producing partnership
outcomes (Kivleniece & Quelin, 2012). An appropriate institutional framework is also
critical to PPP success, since it provides a basis for proper risk allocation between the
parties concerned (Geddes & Wagner, 2013).
41
Figure 2. 5: Value creation and capture in PPPs: An integrated model
Source: Kivleniece & Quelin, 2012.
2.6 KPAs and performance indicators in developing countries
2.6.1 Clustering performance indicators into KPAs
The use of performance indicators in evaluating PPP performance depends on the
types of projects and the operating environment in which the projects are being executed.
A broad set of indicators are common in both developed and developing country studies,
though some indicators appear in some jurisdictions but not in others, based on the context
and project features. Available research has attempted to develop sets of performance
indicators using different names such as performance objectives (Yuan, Wang, et al.,
2012), performance measures (Liyanage & Villalba-Romero, 2015), KPIs (Mladenovic
et al., 2013), and dynamic life cycle performance measurement (J. Liu, Love, Davis, et
al., 2015).
Partnership rationale
Reduced environmental uncertainty
Compensation for market externalities
Access to/use of idiosyncratic resources
Value creation mechanisms
Value capture/distribution mechanisms
Integrative
Partnerships governance
Autonomous
Public sector claims
(opportunism)
External stakeholder
claims (activism)
Private value or benefits
Common or
Social benefits
Political benefits
42
Yuan et al. (2012) previously grouped performance indicators into five categories:
a) physical characteristics of the projects, b) financial and marketing aspects, c)
innovation and learning, d) stakeholders’ requirements and e) project implementation.
Mladenovic et al. (2013) clustered public sector KPIs based on economic, technical, and
operation and maintenance aspects. J. Liu et al. (2015) grouped a set of core indicators in
a dynamic life-cycle performance framework into three major phases: initiation and
planning, procurement and partnerships. Using the essence of these studies in relation to
grouping indicators, we have clustered performance indicators into KPAs, based on the
phases of a PPP project in the context of developing countries. Sub-section 3.5.2 provides
a definition of the KPAs, based on the existing literature.
2.6.2 Defining KPAs
Planning and Initiation
Planning and initiation refers to a detailed plan and initiative for undertaking a
PPP project. This includes service planning, functional design brief, implementation
planning, and feasibility assessment. The implementation plan states the size and nature
of the risks associated with the project and sets management strategies for handling those
risks. In a case of poor planning, private parties may take undue privileges (World Bank,
2017d). To measure the performance of the planning and initiation KPA, the indicators
that underlie this measurement in developing countries include needs assessment,
SMART objectives, implement-ability assessment, feasibility analysis, and public
interest test.
Tendering
Tendering, the process of awarding a contract to the concessionaire, begins with
developing an expression of interest and ends with awarding the contract to the winning
bidder after exhausting all of the necessary tasks within the tendering phase. PPP
43
tendering practices differ in developed and developing countries (T. Liu, Wang, &
Wilkinson, 2016). The important indicators responsible for measuring tendering
performances include efficient concessionaire selection, selection criteria and method,
fairness and transparency and a standardised contract.
Construction and Operation
Bundling of the design, construction, operation and other tasks in the construction
phase depends on the characteristics of the project and the allocation of risk among the
parties involved (Iossa & Martimort, 2015). In this study, for the case of the developing
countries, an ideal bundling type comprising design, construction, and operation is
considered. After finishing construction of the facilities, the operation starts and continues
until the end of the project life, which may extend to, for example, 20 to 30 years, unless
the contract is renewed or ownership of the assets is transferred. In order for the
performance of this area to be assessed, the identified indicators are cost, time, quality,
life cycle maintainability, and dispute settlement.
Sustainability of Partnerships
Sustainability of partnerships refers to the durability of a partnership in terms of
its effectiveness and attainment of superior value for the PPPs (Zou et al., 2014).
Partnerships form at the point of awarding the contract and continue over the construction
and operational periods of the project (Love et al., 2015). Collective interest is more
important than each party’s individual interest in the partnership arrangement (McCarter
& Kamal, 2013). In our study, the sustainability of partnerships is considered an important
performance area, as PPP performance largely depends on the sound state of partnerships.
Trust and respect, relationship conflict, private sector knowledge, and public sector
capacities are the indicators used for assessing the sustainability of partnerships.
44
Financing
Financing refers to an arrangement by the project company for investment in the
project is often organized by third parties in the form of a consortium for the larger project
(World Bank, 2017d). The capacity of a PPP project to be delivered ‘on time’ and ‘on
budget’ depends on the availability and cost of finance (Engel, Fischer, & Galetovic,
2014a). Further, lack of timely finance for a PPP project becomes more evident in
developing countries and greatly affects the actual outcome of the PPPs (Chong & Poole,
2013). Financing includes optimal risk allocation, financial cost, payment, and
government guarantees, as well as optimal revenue sharing and government liabilities.
Transparency and accountability
In PPPs, higher levels of transparency and accountability KPAs create safeguards
to ensure that public services are not compromised for the sake of private profits (Forrer,
Kee, Newcomer, & Boyer, 2010). While transparency is a new focus of concern in
advanced countries, it requires extra attention in developing countries, since the PPPs in
the latter are implemented in a relatively poor operating environment. Empirical evidence
suggests a negative relationship of PPP performance with transparency and accountability
in developing countries (Hammami et al., 2006). The transparency and accountability
area comprises indicators such as the integration of locals, the disclosure of project
information, the life cycle evaluation and the monitoring and responsiveness of
concessionaire.
Stakeholder satisfaction
Satisfaction differs for the different stakeholders in PPPs, based on their
involvement as a public or private party or as users. A PPP project may be considered
successful from a private point of view; however, it may be unsuccessful from a public
point of view (Liyanage & Villalba-Romero, 2015). In this study, we broadly consider
45
two types of stakeholders, the partnering parties (private and public sector) and the end
users, in measuring their satisfaction level on the project performances, based on the
perceptions of the survey respondents. For measuring partner satisfaction, the indicators
that are taken into consideration include meeting objectives, value for money,
profitability and efficient risk management. For measuring end user satisfaction,
appropriate indicators include economy, availability, and quality of the services.
Socioeconomic development
Socioeconomic development refers to the ultimate benefit from the project for the
economy and society in the long run. It depends on the benefits realised and the costs
incurred by PPPs. A careful assessment of benefits and costs is needed to understand the
order of magnitude of the socioeconomic development that may be realised by PPPs
(Adighibe, 2015). This area includes five indicators: PPP sector development, innovation
in the public sector, infrastructure development, employment generation, and
environmental friendliness.
2.6.3 Defining performance indicators
Table 2.2 represents a comprehensive list of forty-one performance indicators,
grouped under the eight KPAs we derived from our review of extant literature. Some of
these indicators are selected based on understanding gained from the discussion in the
references cited in table 2.2. Clustering of these identified indicators considers each
indicator’s relevance to a particular KPA, the degree of the performance of that KPA it
represents, and its place in the life cycle of a project. Indicators that appear repeatedly in
the project life are included in the KPA in which they first appear. However, most of the
indicators belong to KPAs in a sequential order relating to the different phases that appear
one after another in the life cycle process of PPPs.
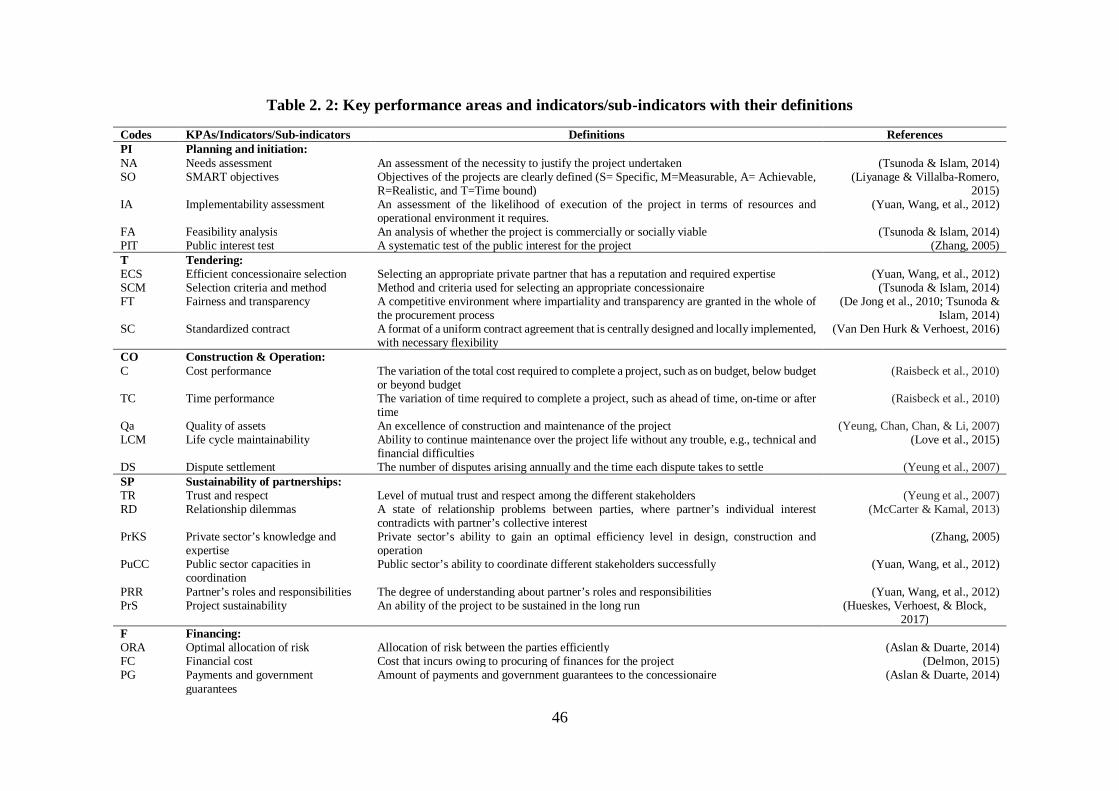
46
Table 2. 2: Key performance areas and indicators/sub-indicators with their definitions
Codes KPAs/Indicators/Sub-indicators Definitions References PI Planning and initiation: NA Needs assessment An assessment of the necessity to justify the project undertaken (Tsunoda & Islam, 2014) SO SMART objectives Objectives of the projects are clearly defined (S= Specific, M=Measurable, A= Achievable,
R=Realistic, and T=Time bound) (Liyanage & Villalba-Romero,
2015) IA Implementability assessment
An assessment of the likelihood of execution of the project in terms of resources and operational environment it requires.
(Yuan, Wang, et al., 2012)
FA Feasibility analysis An analysis of whether the project is commercially or socially viable (Tsunoda & Islam, 2014) PIT Public interest test A systematic test of the public interest for the project (Zhang, 2005) T Tendering: ECS Efficient concessionaire selection Selecting an appropriate private partner that has a reputation and required expertise (Yuan, Wang, et al., 2012) SCM Selection criteria and method Method and criteria used for selecting an appropriate concessionaire (Tsunoda & Islam, 2014) FT Fairness and transparency A competitive environment where impartiality and transparency are granted in the whole of
the procurement process (De Jong et al., 2010; Tsunoda &
Islam, 2014) SC Standardized contract A format of a uniform contract agreement that is centrally designed and locally implemented,
with necessary flexibility (Van Den Hurk & Verhoest, 2016)
CO Construction & Operation: C Cost performance The variation of the total cost required to complete a project, such as on budget, below budget
or beyond budget (Raisbeck et al., 2010)
TC Time performance The variation of time required to complete a project, such as ahead of time, on-time or after time
(Raisbeck et al., 2010)
Qa Quality of assets An excellence of construction and maintenance of the project (Yeung, Chan, Chan, & Li, 2007) LCM Life cycle maintainability Ability to continue maintenance over the project life without any trouble, e.g., technical and
financial difficulties (Love et al., 2015)
DS Dispute settlement The number of disputes arising annually and the time each dispute takes to settle (Yeung et al., 2007) SP Sustainability of partnerships: TR Trust and respect Level of mutual trust and respect among the different stakeholders (Yeung et al., 2007) RD Relationship dilemmas A state of relationship problems between parties, where partner’s individual interest
contradicts with partner’s collective interest (McCarter & Kamal, 2013)
PrKS Private sector’s knowledge and expertise
Private sector’s ability to gain an optimal efficiency level in design, construction and operation
(Zhang, 2005)
PuCC Public sector capacities in coordination
Public sector’s ability to coordinate different stakeholders successfully (Yuan, Wang, et al., 2012)
PRR Partner’s roles and responsibilities The degree of understanding about partner’s roles and responsibilities (Yuan, Wang, et al., 2012) PrS Project sustainability An ability of the project to be sustained in the long run (Hueskes, Verhoest, & Block,
2017) F Financing: ORA Optimal allocation of risk Allocation of risk between the parties efficiently (Aslan & Duarte, 2014) FC Financial cost Cost that incurs owing to procuring of finances for the project (Delmon, 2015) PG Payments and government
guarantees Amount of payments and government guarantees to the concessionaire (Aslan & Duarte, 2014)
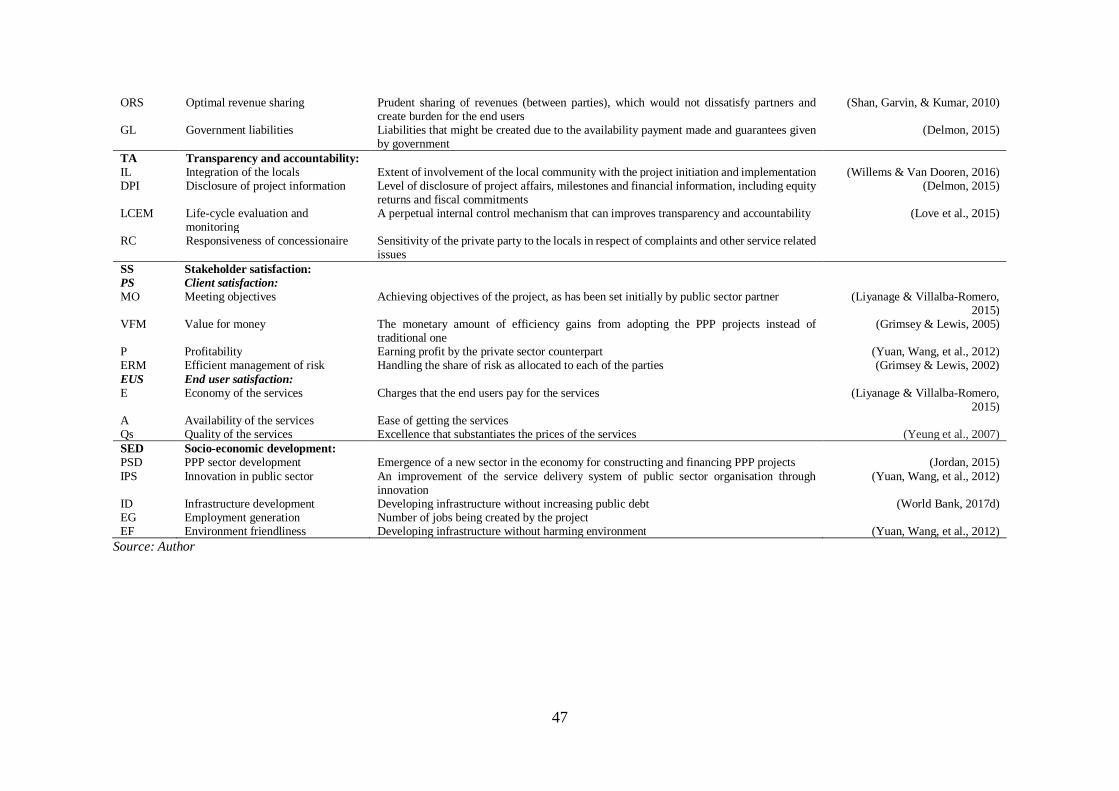
47
ORS Optimal revenue sharing Prudent sharing of revenues (between parties), which would not dissatisfy partners and create burden for the end users
(Shan, Garvin, & Kumar, 2010)
GL Government liabilities Liabilities that might be created due to the availability payment made and guarantees given by government
(Delmon, 2015)
TA Transparency and accountability: IL Integration of the locals Extent of involvement of the local community with the project initiation and implementation (Willems & Van Dooren, 2016) DPI Disclosure of project information Level of disclosure of project affairs, milestones and financial information, including equity
returns and fiscal commitments (Delmon, 2015)
LCEM Life-cycle evaluation and monitoring
A perpetual internal control mechanism that can improves transparency and accountability (Love et al., 2015)
RC Responsiveness of concessionaire Sensitivity of the private party to the locals in respect of complaints and other service related issues
SS Stakeholder satisfaction: PS Client satisfaction: MO Meeting objectives Achieving objectives of the project, as has been set initially by public sector partner (Liyanage & Villalba-Romero,
2015) VFM Value for money The monetary amount of efficiency gains from adopting the PPP projects instead of
traditional one (Grimsey & Lewis, 2005)
P Profitability Earning profit by the private sector counterpart (Yuan, Wang, et al., 2012) ERM Efficient management of risk Handling the share of risk as allocated to each of the parties (Grimsey & Lewis, 2002) EUS End user satisfaction: E Economy of the services Charges that the end users pay for the services (Liyanage & Villalba-Romero,
2015) A Availability of the services Ease of getting the services Qs Quality of the services Excellence that substantiates the prices of the services (Yeung et al., 2007) SED Socio-economic development: PSD PPP sector development Emergence of a new sector in the economy for constructing and financing PPP projects (Jordan, 2015) IPS Innovation in public sector An improvement of the service delivery system of public sector organisation through
innovation (Yuan, Wang, et al., 2012)
ID Infrastructure development Developing infrastructure without increasing public debt (World Bank, 2017d) EG Employment generation Number of jobs being created by the project EF Environment friendliness Developing infrastructure without harming environment (Yuan, Wang, et al., 2012)
Source: Author
48
2.7 Research gap and related research questions
From the literature review in this chapter, the conventional performance
evaluation approaches, including public sector comparator (PSC) analysis, unweighted
key performance indicator systems, life cycle approaches to performance evaluation, and
output specifications, appear to be in practice for evaluating PPP performances. These
mechanisms appear to be inadequate to reveal the true performances of PPPs. In contrast,
the relative significance of the KPAs and the indicators that impact on the overall
performance score can provide an improved understanding of the actual performances of
PPPs, especially in developing countries, where local elements and project features would
be considered when selecting relevant KPAs and indicators. Moreover, the application of
an analytical hierarchy process (AHP) to establish the weights of KPAs and indicators in
a setting of developing countries, and certainly in Bangladesh, is a new research attempt.
Against this backdrop, a research gap has been identified that addresses the following
research question: what are the weights of the different key performance areas (KPAs)
and indicators of PPP performance evaluation in developing countries and how do they
differ from those of developed countries?
The next chapter, which provides a review of the general key concepts and
typology of PPPs, has focuses particularly on the power sector in Bangladesh.

49
Chapter Three: Public-private partnerships
(PPPs) in developing countries: A focus on
the power sector in Bangladesh
50
3.1 Introduction
This chapter initially presents a review of the key concepts and typology of PPPs
(Section 3.2). Subsequently, a special focus has been given to the power sector of
developing countries, especially of Bangladesh. It is argued that power sector PPPs
significantly contributed to reducing power crises in some developing countries while
they failed in some other countries (Section 3.3). Bangladesh has shown notable success
in implementing initial power sector PPPs. But cost overruns and schedule lapses
occurred in some power projects (Section 3.4, 3.5 and discussed in Chapter 6). Based on
these paradoxical circumstances, two related research questions have been formulated in
chapter (Section 3.6).
3.2 Understanding PPPs and their taxonomy
3.2.1 Definitions of PPPs
Understanding PPPs is critical to evaluating the performance of PPPs across
developing countries. However, one of the challenges in defining universally accepted
PPP performance measures relates to the lack of established theories in this relatively new
and underdeveloped field of research. PPPs often fail due to a mismatch of the
expectations of public and private parties, a lack of clear government objectives and
commitment, poorly defined policies, and poor risk management (Kwak, Chih, & Ibbs,
2009). Conversely, PPPs promise significant benefits to the public sector, including
reducing government budgetary pressure, transferring risk to the private sector, and
increasing the value for money (VFM) in infrastructure investment (Kwak et al., 2009).
Although no single definition of PPP is universally accepted, OECD (2008)
defines a PPP as:
51
“An agreement between the government and one or more private partners
(which may include the operators and the financers) according to which the
private partners deliver the service in such a manner that the service delivery
objectives of the government are aligned with the profit objectives of the
private partners and where the effectiveness of the alignment depends on a
sufficient transfer of risk to the private partners” (OECD, 2008).
IMF (2006) defines PPP as:
“. . .an arrangement where the private sector supplies infrastructure assets
and services that traditionally have been provided by the government”(IMF,
2006).
Further, Standard and Poor’s (2005) added the aspect of ‘length of contract’ as medium-
to long-term in its definition of PPPs, and delimited that:
“PPP is any medium- to long-term relationship between the public and
private sectors, involving the sharing of risks and rewards of multi-sector
skills, expertise and finance to deliver desired policy outcomes”.
The U.S. Department of Transportation (DOT) defines that:
“Public-private partnerships (P3s) are contractual agreements between a
public agency and a private-sector entity that allow for greater private-sector
participation in the delivery and financing of transportation projects”(US
Department of Transportation, 2017).
The World Bank (2012) has a more comprehensive definition that is more widely used
and accepted:
“PPP is a long-term contract between a private party and a government
entity, for providing a public asset or service, in which the private party bears
52
significant risk and management responsibility, and remuneration is linked to
performance”(World Bank, 2018).
Grimsey and Lewis (2005) provided a broader definition:
“PPP fills a space between traditionally procured government projects and
full privatisation.”
That space has the scope to engage in the short-term management contracts, to go
through to the concession contracts, and to enter into the long-term ventures like
designing, constructing, operating and delivering services to end users. These ventures
generally involve substantial transfer of risks to the private parties.
3.2.2 Taxonomy of PPPs
PPPs cover the whole spectrum between pure public and pure private provisions,
with the specific objectives and attributes of the individual project being highly variable.
Thus, the types and nature of PPPs are also diverse. Figure 3.1 represents PPP
nomenclature and the degree of involvement of the public and private parties in
partnerships. It is difficult, but not impossible, to determine exact types. PPPs can be
distinguished by the parties involved, by the mode of operation, and by the aims or goals.
Further categorisation is possible by the activity, time span and level of
institutionalisation (Homkes, 2011). Furthermore, PPP arrangements might be regarded
as:
“a) Institutional co-operation for joint production and risk sharing (such as
the Netherlands Port Authority), b) Long-term infrastructure contracts
(LTICs), which emphasize tight specification of outputs in long-term legal
contracts (as exemplified in UK Private Finance Initiative projects), c) Public
policy networks (in which loose stakeholder relationships are emphasized), d)
Civil society and community development, and e) Urban renewal and
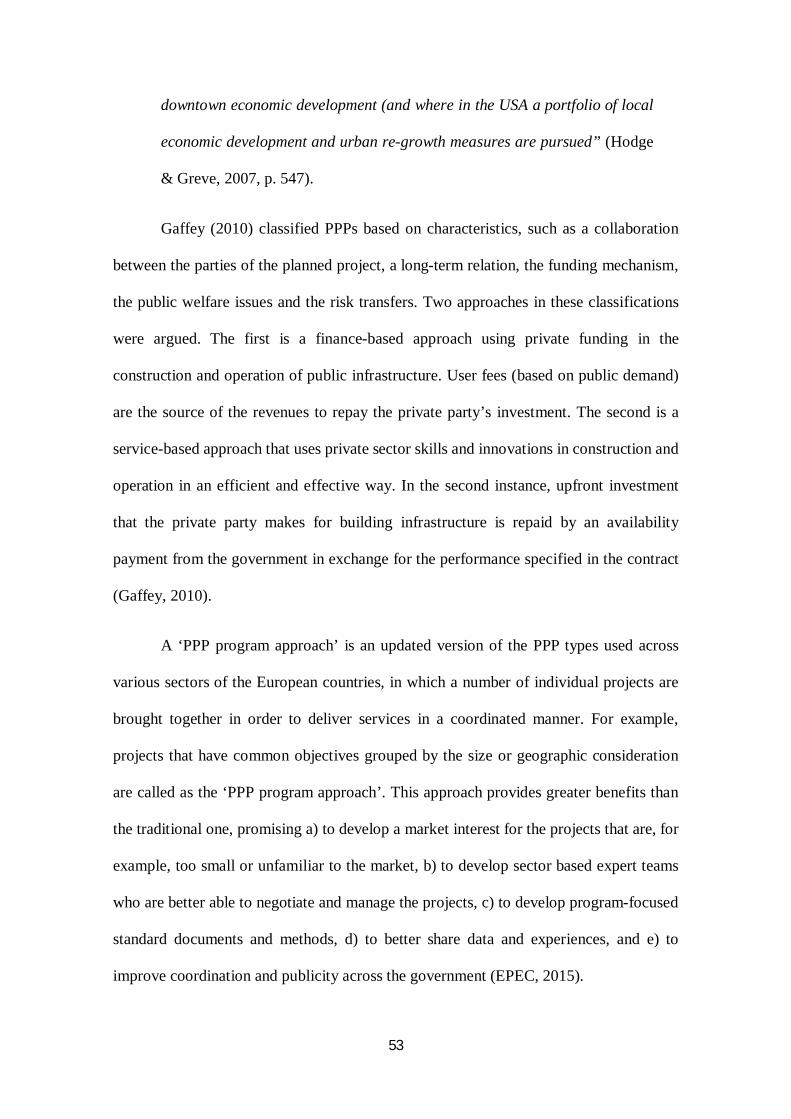
53
downtown economic development (and where in the USA a portfolio of local
economic development and urban re-growth measures are pursued” (Hodge
& Greve, 2007, p. 547).
Gaffey (2010) classified PPPs based on characteristics, such as a collaboration
between the parties of the planned project, a long-term relation, the funding mechanism,
the public welfare issues and the risk transfers. Two approaches in these classifications
were argued. The first is a finance-based approach using private funding in the
construction and operation of public infrastructure. User fees (based on public demand)
are the source of the revenues to repay the private party’s investment. The second is a
service-based approach that uses private sector skills and innovations in construction and
operation in an efficient and effective way. In the second instance, upfront investment
that the private party makes for building infrastructure is repaid by an availability
payment from the government in exchange for the performance specified in the contract
(Gaffey, 2010).
A ‘PPP program approach’ is an updated version of the PPP types used across
various sectors of the European countries, in which a number of individual projects are
brought together in order to deliver services in a coordinated manner. For example,
projects that have common objectives grouped by the size or geographic consideration
are called as the ‘PPP program approach’. This approach provides greater benefits than
the traditional one, promising a) to develop a market interest for the projects that are, for
example, too small or unfamiliar to the market, b) to develop sector based expert teams
who are better able to negotiate and manage the projects, c) to develop program-focused
standard documents and methods, d) to better share data and experiences, and e) to
improve coordination and publicity across the government (EPEC, 2015).
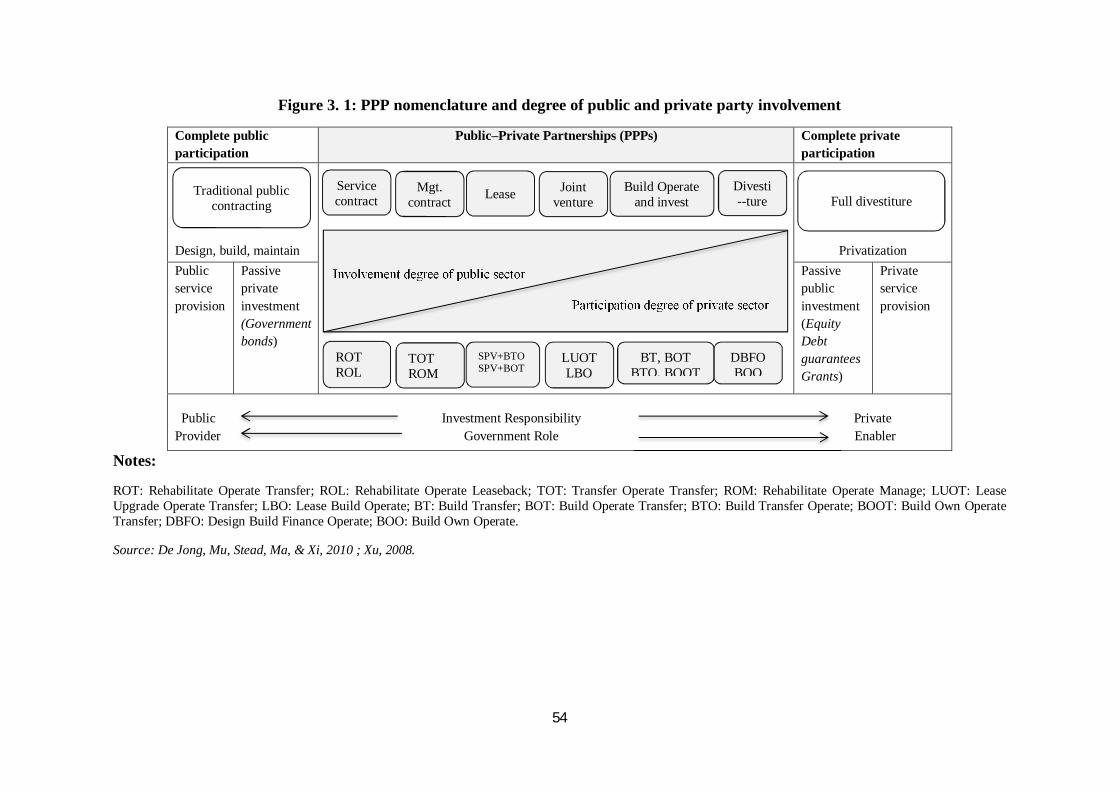
54
Figure 3. 1: PPP nomenclature and degree of public and private party involvement
Complete public participation
Public–Private Partnerships (PPPs) Complete private participation
Design, build, maintain
Privatization
Public service provision
Passive private investment (Government bonds)
Passive public investment (Equity Debt guarantees Grants)
Private service provision
Public Investment Responsibility Private Provider Government Role Enabler
Notes:
ROT: Rehabilitate Operate Transfer; ROL: Rehabilitate Operate Leaseback; TOT: Transfer Operate Transfer; ROM: Rehabilitate Operate Manage; LUOT: Lease Upgrade Operate Transfer; LBO: Lease Build Operate; BT: Build Transfer; BOT: Build Operate Transfer; BTO: Build Transfer Operate; BOOT: Build Own Operate Transfer; DBFO: Design Build Finance Operate; BOO: Build Own Operate.
Source: De Jong, Mu, Stead, Ma, & Xi, 2010 ; Xu, 2008.
Service contract
Mgt. contract
Joint venture Lease Build Operate
and invest Divesti --ture
Involvement degree of public sector
Participation degree of private sector
ROT ROL
TOT ROM
SPV+BTO SPV+BOT
LUOT LBO
BT, BOT BTO, BOOT
DBFO BOO
Traditional public contracting Full divestiture
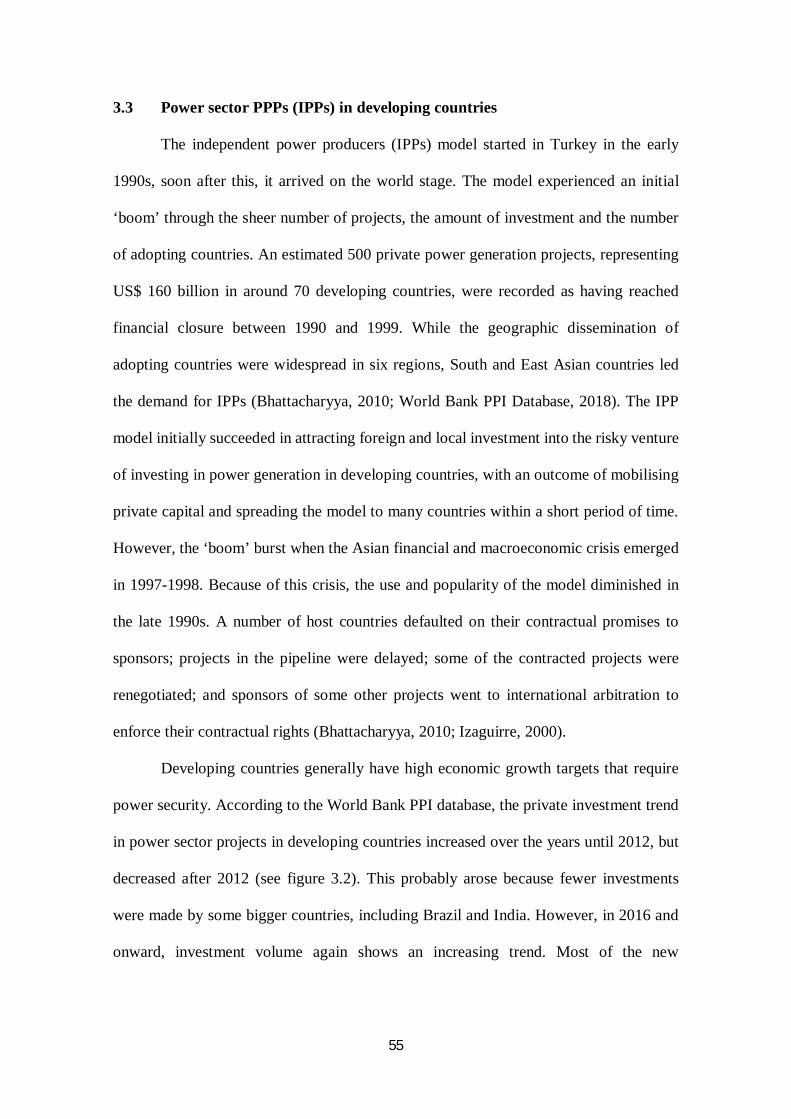
55
3.3 Power sector PPPs (IPPs) in developing countries
The independent power producers (IPPs) model started in Turkey in the early
1990s, soon after this, it arrived on the world stage. The model experienced an initial
‘boom’ through the sheer number of projects, the amount of investment and the number
of adopting countries. An estimated 500 private power generation projects, representing
US$ 160 billion in around 70 developing countries, were recorded as having reached
financial closure between 1990 and 1999. While the geographic dissemination of
adopting countries were widespread in six regions, South and East Asian countries led
the demand for IPPs (Bhattacharyya, 2010; World Bank PPI Database, 2018). The IPP
model initially succeeded in attracting foreign and local investment into the risky venture
of investing in power generation in developing countries, with an outcome of mobilising
private capital and spreading the model to many countries within a short period of time.
However, the ‘boom’ burst when the Asian financial and macroeconomic crisis emerged
in 1997-1998. Because of this crisis, the use and popularity of the model diminished in
the late 1990s. A number of host countries defaulted on their contractual promises to
sponsors; projects in the pipeline were delayed; some of the contracted projects were
renegotiated; and sponsors of some other projects went to international arbitration to
enforce their contractual rights (Bhattacharyya, 2010; Izaguirre, 2000).
Developing countries generally have high economic growth targets that require
power security. According to the World Bank PPI database, the private investment trend
in power sector projects in developing countries increased over the years until 2012, but
decreased after 2012 (see figure 3.2). This probably arose because fewer investments
were made by some bigger countries, including Brazil and India. However, in 2016 and
onward, investment volume again shows an increasing trend. Most of the new
56
investments in power generation focus on renewable energy sources, especially in
countries such as Brazil, China, Malaysia and Egypt.
Figure 3. 2: Private investment in power sector in developing countries, 2017
Source: World Bank PPI Database, 2018.
3.4 PPP initiatives in Bangladesh
3.4.1 Evolution of PPPs
In Bangladesh, PPP initiatives can be traced back to the mid-1990s, when they
started under the ‘Private Sector Power Generation Policy’ (PSPGP) in 1996 (Planning
Commission GoB, 2016). Before this policy, the government had entered into a number
of individual PPP transactions, but had failed to achieve a remarkable success. Under this
policy, two large power projects, the Meghnaghat (450MW) and the Haripur (360MW)
power plants, were successfully contracted, with World Bank and Asian Development
Bank (ADB) support. Building on this success, the government introduced the ‘Private
Sector Infrastructure Guidelines’ in 2004 to support infrastructure development in other
areas. Program-based PPP initiatives started under this policy, yet only a handful of
0
10
20
30
40
50
60
70
80
90
0
50
100
150
200
250
300
350
400
1990
1991
1992
1993
1994
1995
1996
1997
1998
1999
2000
2001
2002
2003
2004
2005
2006
2007
2008
2009
2010
2011
2012
2013
2014
2015
2016
2017
No.
of p
roje
cts
Inve
stm
ent i
n U
S$ (b
illio
ns)
Year
Project count Investment
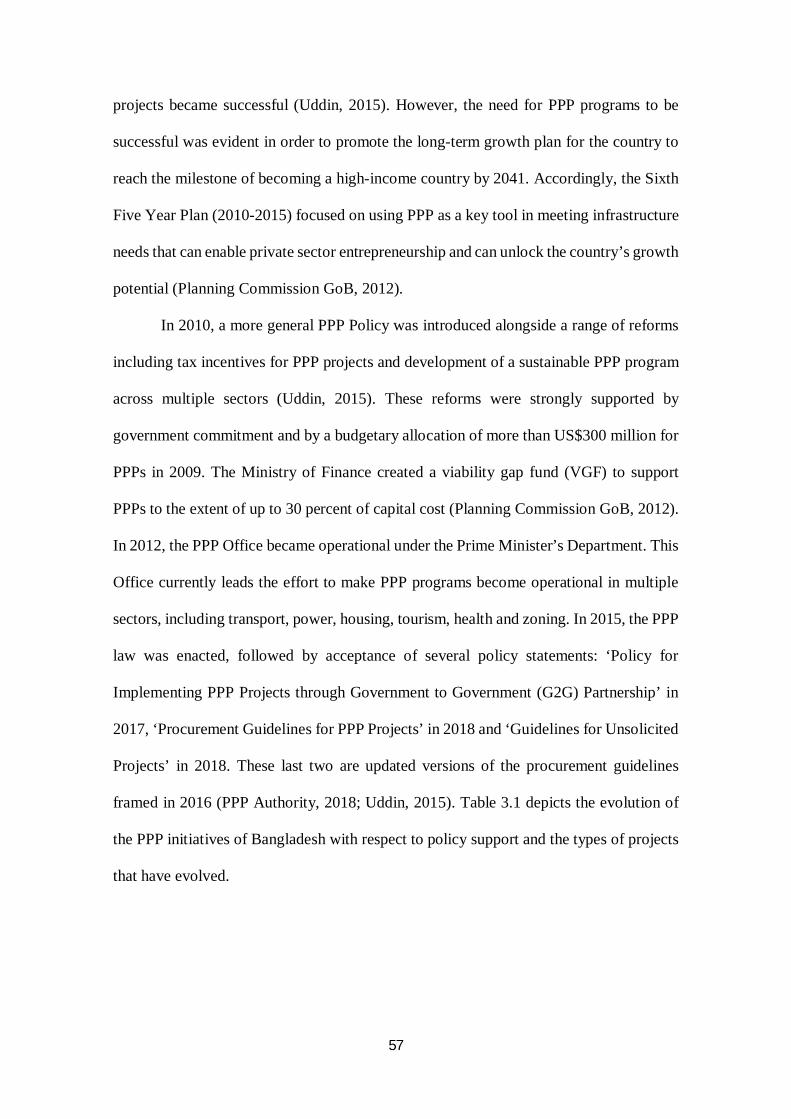
57
projects became successful (Uddin, 2015). However, the need for PPP programs to be
successful was evident in order to promote the long-term growth plan for the country to
reach the milestone of becoming a high-income country by 2041. Accordingly, the Sixth
Five Year Plan (2010-2015) focused on using PPP as a key tool in meeting infrastructure
needs that can enable private sector entrepreneurship and can unlock the country’s growth
potential (Planning Commission GoB, 2012).
In 2010, a more general PPP Policy was introduced alongside a range of reforms
including tax incentives for PPP projects and development of a sustainable PPP program
across multiple sectors (Uddin, 2015). These reforms were strongly supported by
government commitment and by a budgetary allocation of more than US$300 million for
PPPs in 2009. The Ministry of Finance created a viability gap fund (VGF) to support
PPPs to the extent of up to 30 percent of capital cost (Planning Commission GoB, 2012).
In 2012, the PPP Office became operational under the Prime Minister’s Department. This
Office currently leads the effort to make PPP programs become operational in multiple
sectors, including transport, power, housing, tourism, health and zoning. In 2015, the PPP
law was enacted, followed by acceptance of several policy statements: ‘Policy for
Implementing PPP Projects through Government to Government (G2G) Partnership’ in
2017, ‘Procurement Guidelines for PPP Projects’ in 2018 and ‘Guidelines for Unsolicited
Projects’ in 2018. These last two are updated versions of the procurement guidelines
framed in 2016 (PPP Authority, 2018; Uddin, 2015). Table 3.1 depicts the evolution of
the PPP initiatives of Bangladesh with respect to policy support and the types of projects
that have evolved.
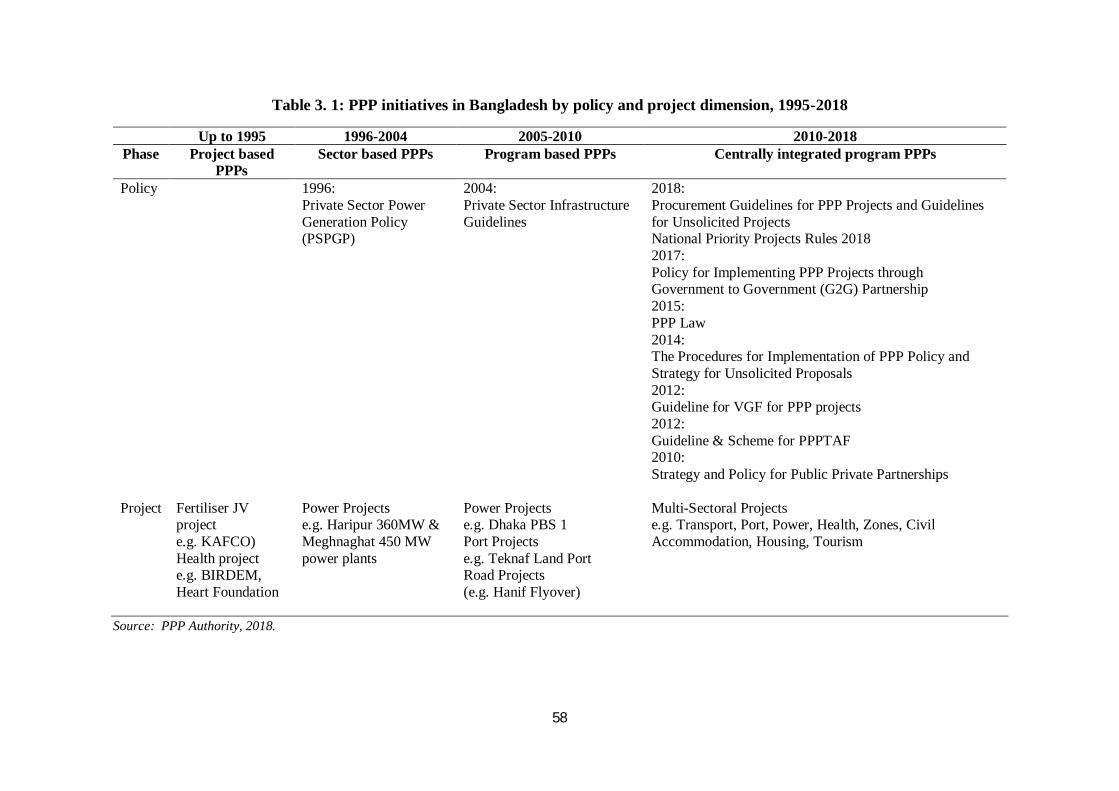
58
Table 3. 1: PPP initiatives in Bangladesh by policy and project dimension, 1995-2018
Up to 1995 1996-2004 2005-2010 2010-2018 Phase Project based
PPPs Sector based PPPs Program based PPPs Centrally integrated program PPPs
Policy 1996: Private Sector Power Generation Policy (PSPGP)
2004: Private Sector Infrastructure Guidelines
2018: Procurement Guidelines for PPP Projects and Guidelines for Unsolicited Projects National Priority Projects Rules 2018 2017: Policy for Implementing PPP Projects through Government to Government (G2G) Partnership 2015: PPP Law 2014: The Procedures for Implementation of PPP Policy and Strategy for Unsolicited Proposals 2012: Guideline for VGF for PPP projects 2012: Guideline & Scheme for PPPTAF 2010: Strategy and Policy for Public Private Partnerships
Project Fertiliser JV project e.g. KAFCO) Health project e.g. BIRDEM, Heart Foundation
Power Projects e.g. Haripur 360MW & Meghnaghat 450 MW power plants
Power Projects e.g. Dhaka PBS 1 Port Projects e.g. Teknaf Land Port Road Projects (e.g. Hanif Flyover)
Multi-Sectoral Projects e.g. Transport, Port, Power, Health, Zones, Civil Accommodation, Housing, Tourism
Source: PPP Authority, 2018.
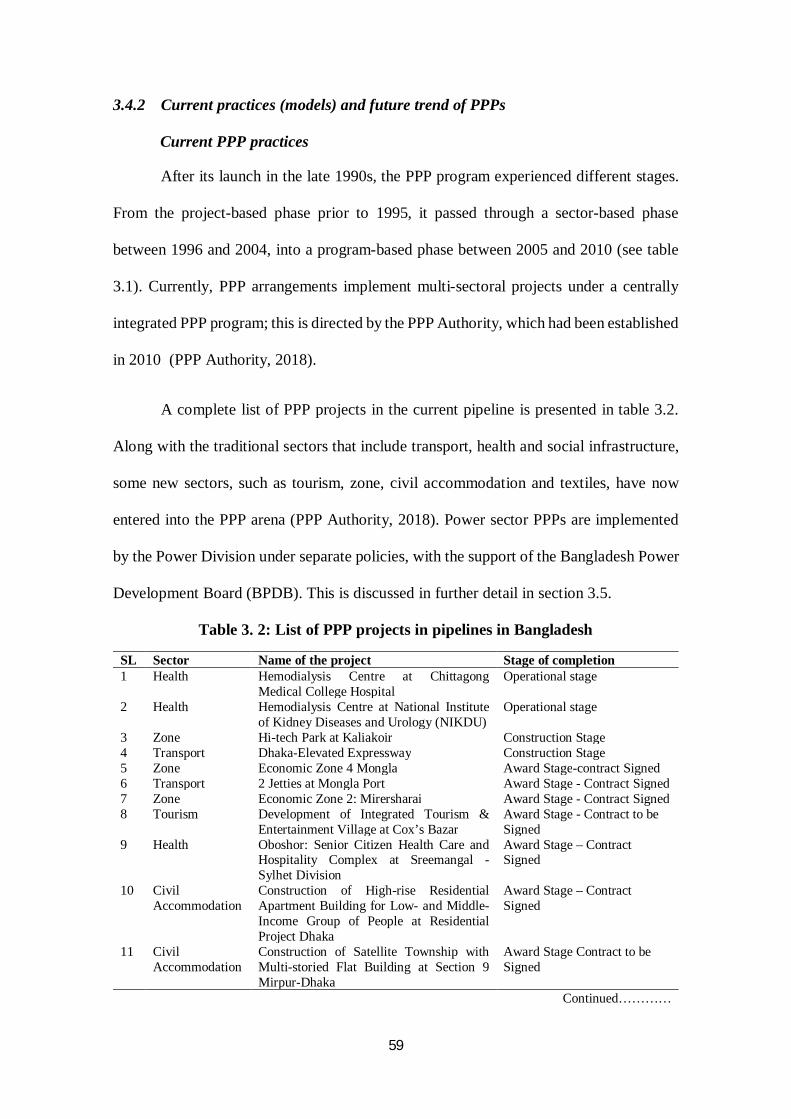
59
3.4.2 Current practices (models) and future trend of PPPs
Current PPP practices
After its launch in the late 1990s, the PPP program experienced different stages.
From the project-based phase prior to 1995, it passed through a sector-based phase
between 1996 and 2004, into a program-based phase between 2005 and 2010 (see table
3.1). Currently, PPP arrangements implement multi-sectoral projects under a centrally
integrated PPP program; this is directed by the PPP Authority, which had been established
in 2010 (PPP Authority, 2018).
A complete list of PPP projects in the current pipeline is presented in table 3.2.
Along with the traditional sectors that include transport, health and social infrastructure,
some new sectors, such as tourism, zone, civil accommodation and textiles, have now
entered into the PPP arena (PPP Authority, 2018). Power sector PPPs are implemented
by the Power Division under separate policies, with the support of the Bangladesh Power
Development Board (BPDB). This is discussed in further detail in section 3.5.
Table 3. 2: List of PPP projects in pipelines in Bangladesh
SL Sector Name of the project Stage of completion 1 Health Hemodialysis Centre at Chittagong
Medical College Hospital Operational stage
2 Health Hemodialysis Centre at National Institute of Kidney Diseases and Urology (NIKDU)
Operational stage
3 Zone Hi-tech Park at Kaliakoir Construction Stage 4 Transport Dhaka-Elevated Expressway Construction Stage 5 Zone Economic Zone 4 Mongla Award Stage-contract Signed 6 Transport 2 Jetties at Mongla Port Award Stage - Contract Signed 7 Zone Economic Zone 2: Mirersharai Award Stage - Contract Signed 8 Tourism Development of Integrated Tourism &
Entertainment Village at Cox’s Bazar Award Stage - Contract to be Signed
9 Health Oboshor: Senior Citizen Health Care and Hospitality Complex at Sreemangal - Sylhet Division
Award Stage – Contract Signed
10 Civil Accommodation
Construction of High-rise Residential Apartment Building for Low- and Middle-Income Group of People at Residential Project Dhaka
Award Stage – Contract Signed
11 Civil Accommodation
Construction of Satellite Township with Multi-storied Flat Building at Section 9 Mirpur-Dhaka
Award Stage Contract to be Signed
Continued…………
60
12 Social Infrastructure
Development of Occupational Diseases Hospital, Labour Welfare Center and Commercial Complexes at Chasara, Narayanganj
Award Stage Contract to be Signed
13 Social Infrastructure
Development of Occupational Diseases Hospital, Labour Welfare Center and Commercial Complexes at Tongi, Gazipur
Procurement Stage - Negotiation Completed
14 Tourism Development of a Five-Star Hotel in Chittagong
Procurement Stage - RFP
15 Tourism Establishment of Intl. Standard Tourism Complex at Existing Motel Upal Compound of BPC at Cox’s Bazar
Procurement Stage - IFB
16 Transport Upgrading of Dhaka Bypass to 4 Lane (Madanpur-Debogram-Bhulta-Joydebpur)
Procurement Stage - RFP
17 Tourism Naf Tourism Park (Jaliardwip) Procurement Stage 18 Zone Hi-Tech Park in Sylhet Procurement Stage 19 Transport Construction of Laldia Bulk Terminal Procurement Stage - RFQ 20
Transport Flyover from Santinagar to Mawa Road via 4th (New) Bridge over Buriganga River
Procurement Stage - RFQ
21 Tourism Establishment of 5 Star Hotel with other Facilities at Existing Parjatan Motel Sylhet Compound of BPC Sylhet
Procurement Stage - IFB
22 Education Medical College and Modernization of Railway Hospital at CRB in Chittagong
Procurement Stage – IFB
23 Civil Accommodation
Development of Shopping Mall with Hotel-cum-Guest House at Bangladesh Railway Land near Chittagong Railway Station, Chittagong
Procurement Stage - IFB
24 Civil Accommodation
Construction of multi-storied Commercial cum Residential Apartment complex with modern amenities at Nasirabad, Chittagong Under PPP
Procurement Stage - IFB
25 Textile Development of Textile Mill at Demra, Dhaka
Procurement Stage - IFB
26 Textile Development of Textile Mill at Tongi, Gazipur
Procurement Stage - IFB
27 Housing Installation of Water Supply, Sewerage, Drainage System & Solid Waste Management System in Purbachal New Town
Procurement Stage - IFB
28 Transport Improvement of Hatirjheel (Rampura Bridge) -Shekherjaiga-Amulia-Demra Road
Procurement Stage - RFQ
29 Transport Construction of a New Inland Container Depot (ICD) near Dhirasram Railway Station
Project Development Stage - Detailed Feasibility Study
30 Transport Dhaka-Chittagong Access Controlled Highway
Project Development Stage - Detailed Feasibility Study
31 Civil Accommodation
Shopping Mall with Hotel-cum-Guest House on the unused Railway land in Khulna
Project Development Stage - Detailed Feasibility Study
32 Zone Development of Economic Zone (EZ) at Jamalpur
Project Development Stage - Detailed Feasibility Study
33 Tourism Establishment of Three Star Standard Hotel and other Facilities of Existing Hotel Pashur Compound of BPC at Mongla Bagerhat
Project Development Stage - Detailed Feasibility Study
Continued……
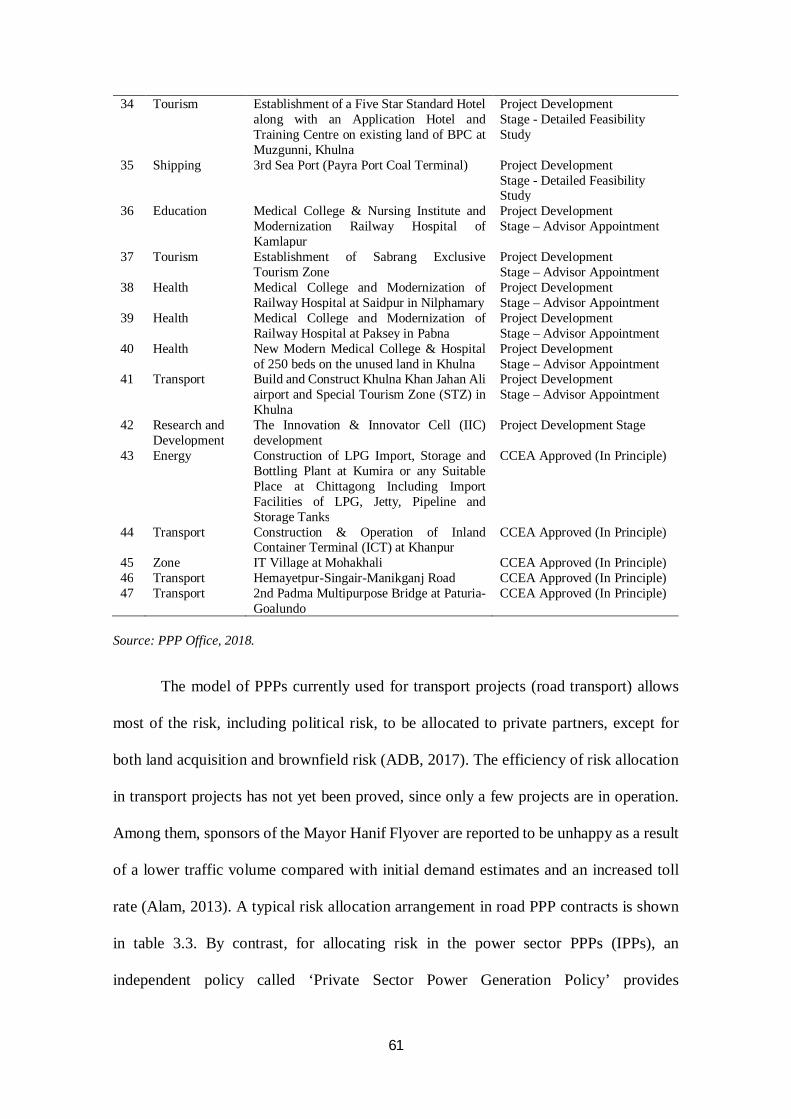
61
34 Tourism Establishment of a Five Star Standard Hotel along with an Application Hotel and Training Centre on existing land of BPC at Muzgunni, Khulna
Project Development Stage - Detailed Feasibility Study
35 Shipping 3rd Sea Port (Payra Port Coal Terminal) Project Development Stage - Detailed Feasibility Study
36 Education Medical College & Nursing Institute and Modernization Railway Hospital of Kamlapur
Project Development Stage – Advisor Appointment
37 Tourism Establishment of Sabrang Exclusive Tourism Zone
Project Development Stage – Advisor Appointment
38 Health Medical College and Modernization of Railway Hospital at Saidpur in Nilphamary
Project Development Stage – Advisor Appointment
39 Health Medical College and Modernization of Railway Hospital at Paksey in Pabna
Project Development Stage – Advisor Appointment
40 Health New Modern Medical College & Hospital of 250 beds on the unused land in Khulna
Project Development Stage – Advisor Appointment
41 Transport Build and Construct Khulna Khan Jahan Ali airport and Special Tourism Zone (STZ) in Khulna
Project Development Stage – Advisor Appointment
42 Research and Development
The Innovation & Innovator Cell (IIC) development
Project Development Stage
43 Energy Construction of LPG Import, Storage and Bottling Plant at Kumira or any Suitable Place at Chittagong Including Import Facilities of LPG, Jetty, Pipeline and Storage Tanks
CCEA Approved (In Principle)
44 Transport Construction & Operation of Inland Container Terminal (ICT) at Khanpur
CCEA Approved (In Principle)
45 Zone IT Village at Mohakhali CCEA Approved (In Principle) 46 Transport Hemayetpur-Singair-Manikganj Road CCEA Approved (In Principle) 47 Transport 2nd Padma Multipurpose Bridge at Paturia-
Goalundo CCEA Approved (In Principle)
Source: PPP Office, 2018.
The model of PPPs currently used for transport projects (road transport) allows
most of the risk, including political risk, to be allocated to private partners, except for
both land acquisition and brownfield risk (ADB, 2017). The efficiency of risk allocation
in transport projects has not yet been proved, since only a few projects are in operation.
Among them, sponsors of the Mayor Hanif Flyover are reported to be unhappy as a result
of a lower traffic volume compared with initial demand estimates and an increased toll
rate (Alam, 2013). A typical risk allocation arrangement in road PPP contracts is shown
in table 3.3. By contrast, for allocating risk in the power sector PPPs (IPPs), an
independent policy called ‘Private Sector Power Generation Policy’ provides
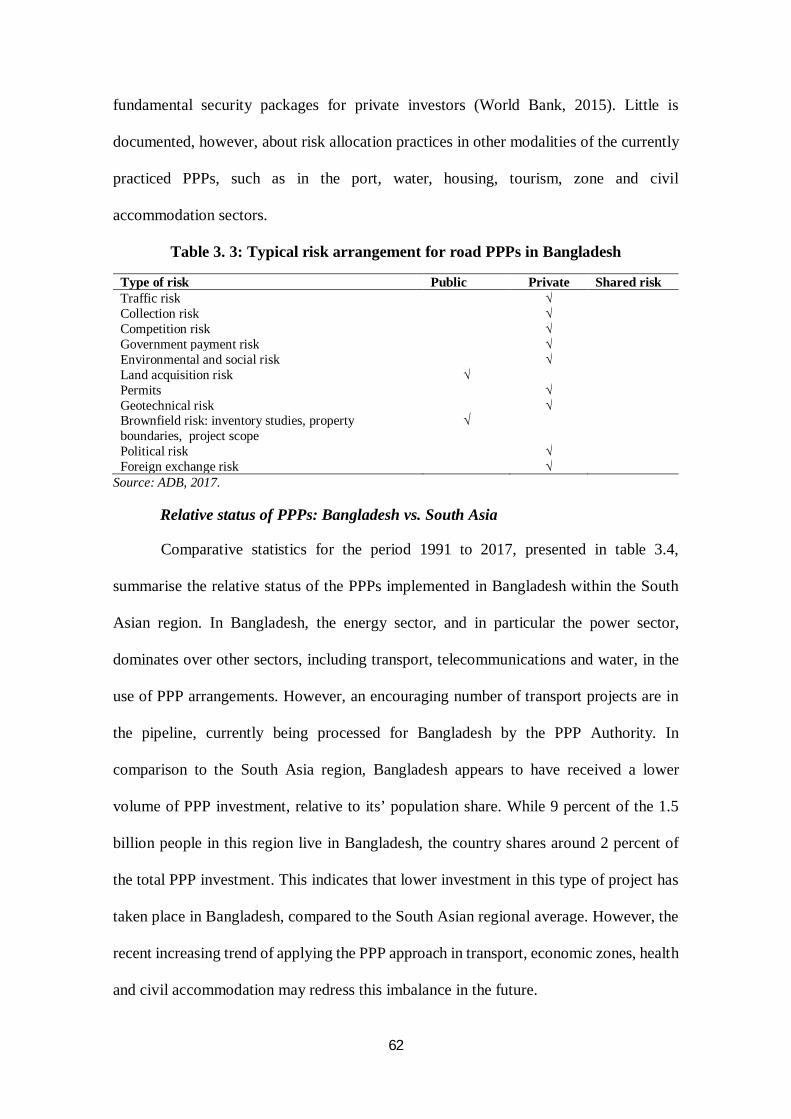
62
fundamental security packages for private investors (World Bank, 2015). Little is
documented, however, about risk allocation practices in other modalities of the currently
practiced PPPs, such as in the port, water, housing, tourism, zone and civil
accommodation sectors.
Table 3. 3: Typical risk arrangement for road PPPs in Bangladesh
Type of risk Public Private Shared risk Traffic risk √ Collection risk √ Competition risk √ Government payment risk √ Environmental and social risk √ Land acquisition risk √ Permits √ Geotechnical risk √ Brownfield risk: inventory studies, property boundaries, project scope
√
Political risk √ Foreign exchange risk √
Source: ADB, 2017.
Relative status of PPPs: Bangladesh vs. South Asia
Comparative statistics for the period 1991 to 2017, presented in table 3.4,
summarise the relative status of the PPPs implemented in Bangladesh within the South
Asian region. In Bangladesh, the energy sector, and in particular the power sector,
dominates over other sectors, including transport, telecommunications and water, in the
use of PPP arrangements. However, an encouraging number of transport projects are in
the pipeline, currently being processed for Bangladesh by the PPP Authority. In
comparison to the South Asia region, Bangladesh appears to have received a lower
volume of PPP investment, relative to its’ population share. While 9 percent of the 1.5
billion people in this region live in Bangladesh, the country shares around 2 percent of
the total PPP investment. This indicates that lower investment in this type of project has
taken place in Bangladesh, compared to the South Asian regional average. However, the
recent increasing trend of applying the PPP approach in transport, economic zones, health
and civil accommodation may redress this imbalance in the future.
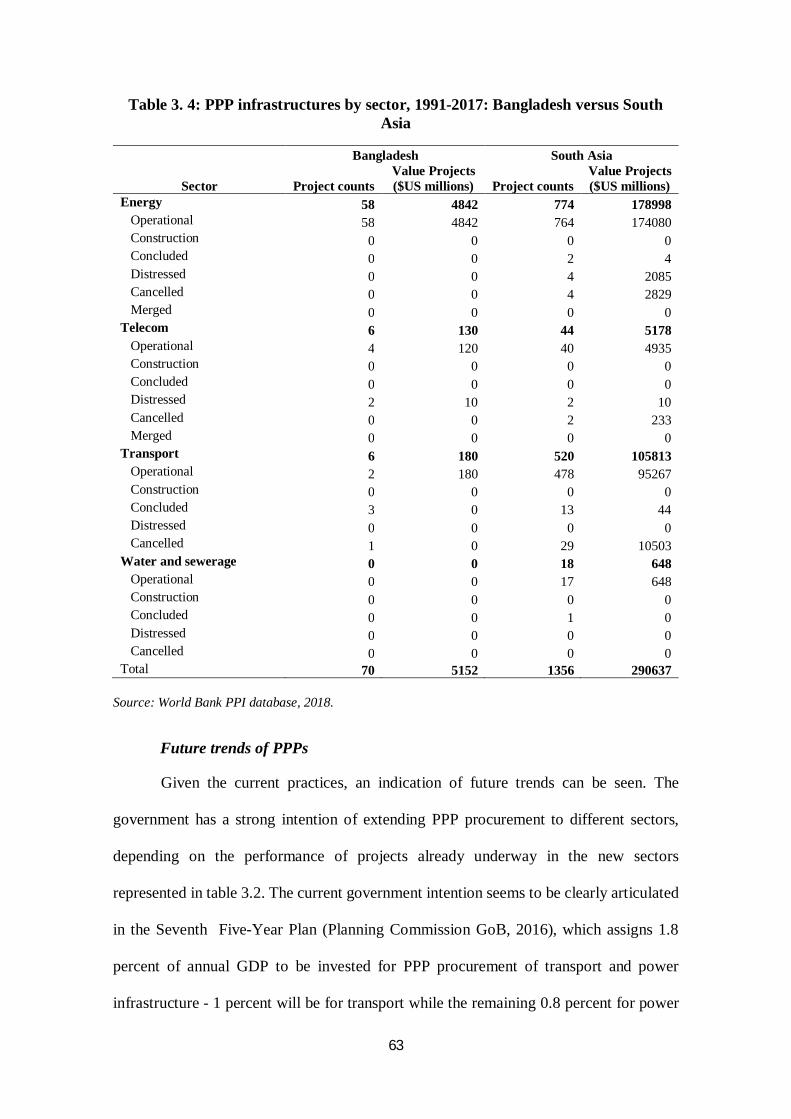
63
Table 3. 4: PPP infrastructures by sector, 1991-2017: Bangladesh versus South Asia
Bangladesh South Asia
Sector Project counts Value Projects ($US millions) Project counts
Value Projects ($US millions)
Energy 58 4842 774 178998 Operational 58 4842 764 174080 Construction 0 0 0 0 Concluded 0 0 2 4 Distressed 0 0 4 2085 Cancelled 0 0 4 2829 Merged 0 0 0 0 Telecom 6 130 44 5178 Operational 4 120 40 4935 Construction 0 0 0 0 Concluded 0 0 0 0 Distressed 2 10 2 10 Cancelled 0 0 2 233 Merged 0 0 0 0 Transport 6 180 520 105813 Operational 2 180 478 95267 Construction 0 0 0 0 Concluded 3 0 13 44 Distressed 0 0 0 0 Cancelled 1 0 29 10503 Water and sewerage 0 0 18 648 Operational 0 0 17 648 Construction 0 0 0 0 Concluded 0 0 1 0 Distressed 0 0 0 0 Cancelled 0 0 0 0 Total 70 5152 1356 290637
Source: World Bank PPI database, 2018.
Future trends of PPPs
Given the current practices, an indication of future trends can be seen. The
government has a strong intention of extending PPP procurement to different sectors,
depending on the performance of projects already underway in the new sectors
represented in table 3.2. The current government intention seems to be clearly articulated
in the Seventh Five-Year Plan (Planning Commission GoB, 2016), which assigns 1.8
percent of annual GDP to be invested for PPP procurement of transport and power
infrastructure - 1 percent will be for transport while the remaining 0.8 percent for power
64
sector infrastructures. US$3.8b is a target to be invested annually in PPP projects over the
next five years, along with a further 30 percent of the Annual Development Program
(ADP) (PPP Authority, 2017). The PPP model currently used in different sectors includes
BOO, BOT and BROT types that are also common around the developing world (ADB,
2017).
3.5 Power sector PPPs (independent power producers, IPPs) in Bangladesh
3.5.1 Power sector development and its long-term perspective
An overview of the power sector
Bangladesh, one of the emerging countries, has the potential to transform its
current status among developing countries to a high-income level by 2041; its government
has revealed ‘Vision 2041’ for this purpose. The country has a target of providing
electricity for all by 2021, having a current electrification rate, according to the World
Bank, of 761 percent, though the government claimed that this reached 80 percent in June
2017 (BPDB Annual Report, 2017). In 1971, when Bangladesh became independent, only
3 percent of the population was connected to electricity. Although there is insufficient
generation to meet local demand, the generation and consumption of electricity have
increased significantly over the past two decades (World Bank, 2017c). The total installed
capacity has increased from 2908 MW in 1997 to 13555 MW in 2017; accordingly,
generation has also increased from 2114 MW to 9479 MW. The maximum estimated
demand has also increased from 2419 MW to 12644 MW (World Bank, 2015). A brief
overview of the status of the power sector of Bangladesh is provided in table 3.5. The gap
1 World Bank: https://data.worldbank.org/indicator/EG.ELC.ACCS.ZS?locations=BD

65
between demand and supply, which is increasing and is estimated to be currently around
3,000 MW, can be explained by a rapid increase in the domestic use of electricity. To
bridge this gap, the government is committed to attracting private investors to invest in
power generation (S. Islam, 2017; World Bank, 2015).
Table 3. 5: Overview of the power sector in Bangladesh in June, 2017
Installed capacity (MW) 13555 Peak demand (MW) 12644 Maximum peak generation (MW) 9479 Number of consumers NA Access to electricity: 80% Urban (2014) 91% Rural (2014) 51% Per capita generation 351 Per capita consumption 308 System loss (transmission and distribution) 12.74% Per unit generation cost (public and private) (Tk/Kwh) 5.24 Per unit fuel cost (thermal plants) (Tk/Kwh) 2.76
Source: BPDB Annual Report, 2017; World Bank, 2017.
Per capita electricity consumption in Bangladesh, which was 79 kWh two decades
ago in 1997, was 308 kWh in 2017.This represents one of the lowest per capita electricity
consumption rates in the world (World Bank, 2017c). Moreover, the quality of electricity
services cannot be maintained because of the load shedding and the low voltage supply,
along with the transmission and distribution losses. Many places in both urban and rural
areas suffer from load-shedding almost every alternate hour. Around 79 percent of
connected consumers face load-shedding and 60 percent of them face low voltage supply
(World Bank, 2017c). While the electricity generation and consumption have increased
over the past two decades, the system losses had declined to 11.2 percent in 2015 from
21.2 percent in 2004, as a result of the government reform initiatives adopted for
upgrading transmission and distribution lines and for unbundling these services from the
authority of BPDB (World Bank, 2017c).
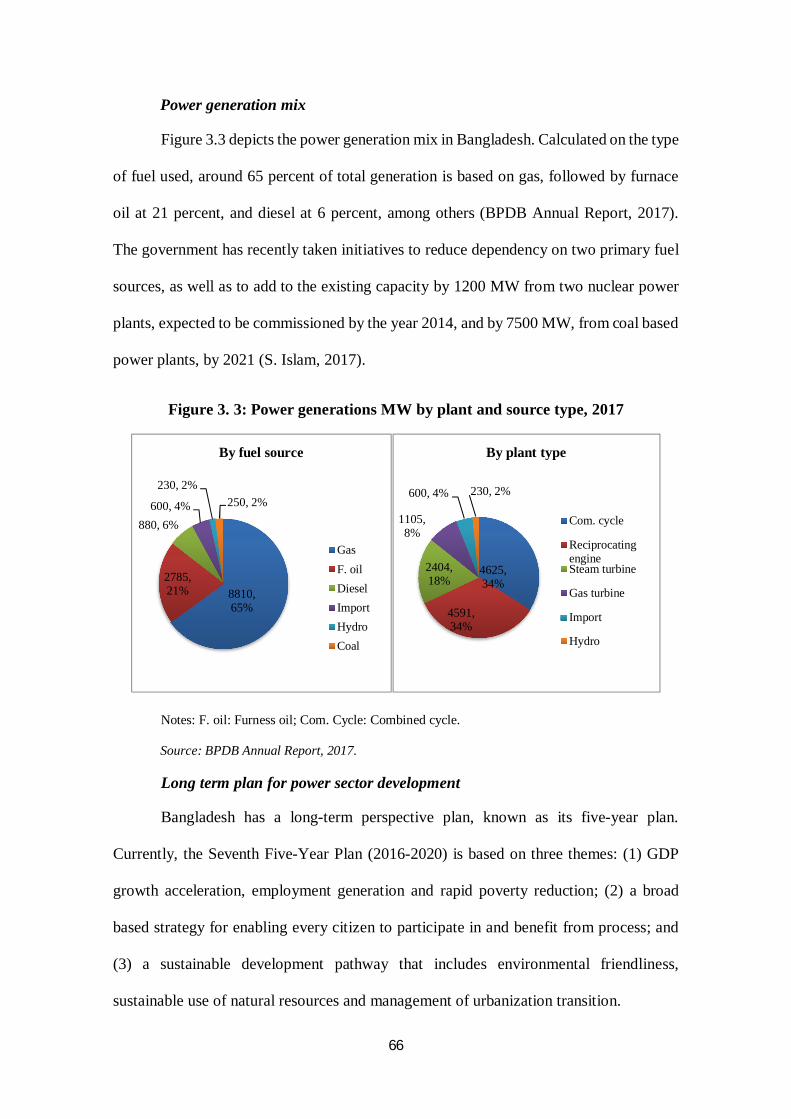
66
Power generation mix
Figure 3.3 depicts the power generation mix in Bangladesh. Calculated on the type
of fuel used, around 65 percent of total generation is based on gas, followed by furnace
oil at 21 percent, and diesel at 6 percent, among others (BPDB Annual Report, 2017).
The government has recently taken initiatives to reduce dependency on two primary fuel
sources, as well as to add to the existing capacity by 1200 MW from two nuclear power
plants, expected to be commissioned by the year 2014, and by 7500 MW, from coal based
power plants, by 2021 (S. Islam, 2017).
Figure 3. 3: Power generations MW by plant and source type, 2017
Notes: F. oil: Furness oil; Com. Cycle: Combined cycle.
Source: BPDB Annual Report, 2017.
Long term plan for power sector development
Bangladesh has a long-term perspective plan, known as its five-year plan.
Currently, the Seventh Five-Year Plan (2016-2020) is based on three themes: (1) GDP
growth acceleration, employment generation and rapid poverty reduction; (2) a broad
based strategy for enabling every citizen to participate in and benefit from process; and
(3) a sustainable development pathway that includes environmental friendliness,
sustainable use of natural resources and management of urbanization transition.
8810, 65%
2785, 21%
880, 6%600, 4%
230, 2%250, 2%
By fuel source
GasF. oilDieselImportHydroCoal
4625, 34%
4591, 34%
2404, 18%
1105, 8%
600, 4% 230, 2%
By plant type
Com. cycle
ReciprocatingengineSteam turbine
Gas turbine
Import
Hydro
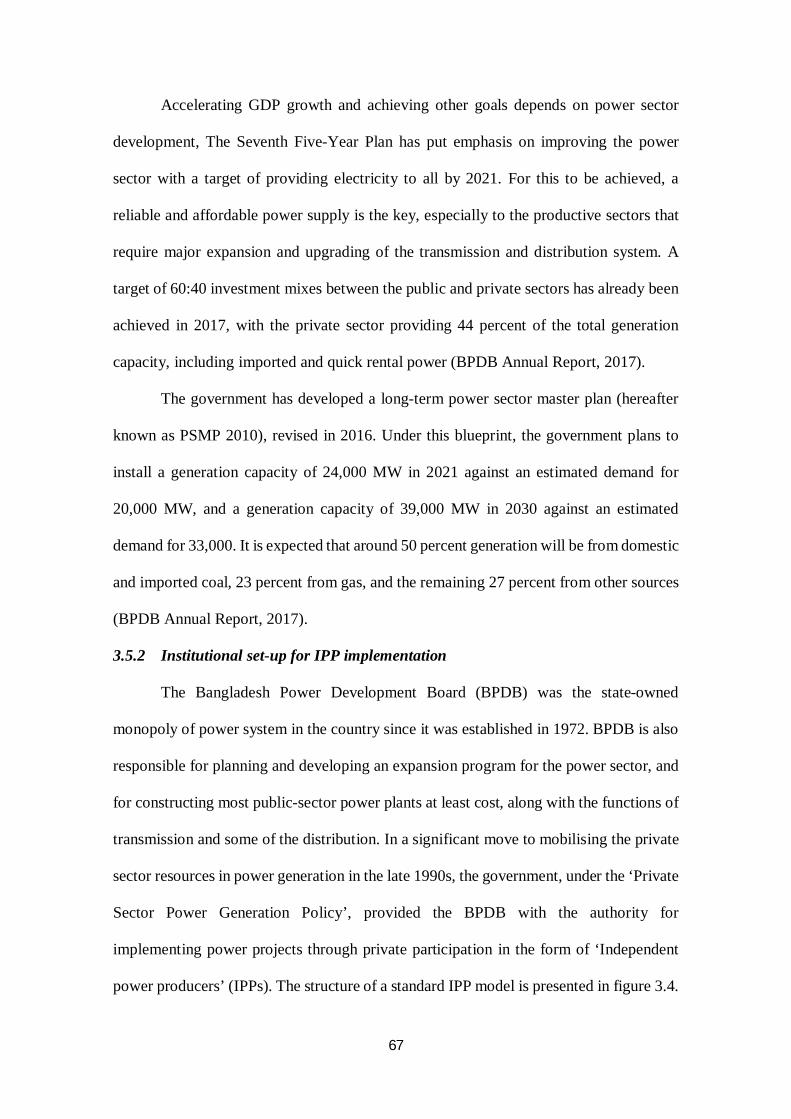
67
Accelerating GDP growth and achieving other goals depends on power sector
development, The Seventh Five-Year Plan has put emphasis on improving the power
sector with a target of providing electricity to all by 2021. For this to be achieved, a
reliable and affordable power supply is the key, especially to the productive sectors that
require major expansion and upgrading of the transmission and distribution system. A
target of 60:40 investment mixes between the public and private sectors has already been
achieved in 2017, with the private sector providing 44 percent of the total generation
capacity, including imported and quick rental power (BPDB Annual Report, 2017).
The government has developed a long-term power sector master plan (hereafter
known as PSMP 2010), revised in 2016. Under this blueprint, the government plans to
install a generation capacity of 24,000 MW in 2021 against an estimated demand for
20,000 MW, and a generation capacity of 39,000 MW in 2030 against an estimated
demand for 33,000. It is expected that around 50 percent generation will be from domestic
and imported coal, 23 percent from gas, and the remaining 27 percent from other sources
(BPDB Annual Report, 2017).
3.5.2 Institutional set-up for IPP implementation
The Bangladesh Power Development Board (BPDB) was the state-owned
monopoly of power system in the country since it was established in 1972. BPDB is also
responsible for planning and developing an expansion program for the power sector, and
for constructing most public-sector power plants at least cost, along with the functions of
transmission and some of the distribution. In a significant move to mobilising the private
sector resources in power generation in the late 1990s, the government, under the ‘Private
Sector Power Generation Policy’, provided the BPDB with the authority for
implementing power projects through private participation in the form of ‘Independent
power producers’ (IPPs). The structure of a standard IPP model is presented in figure 3.4.
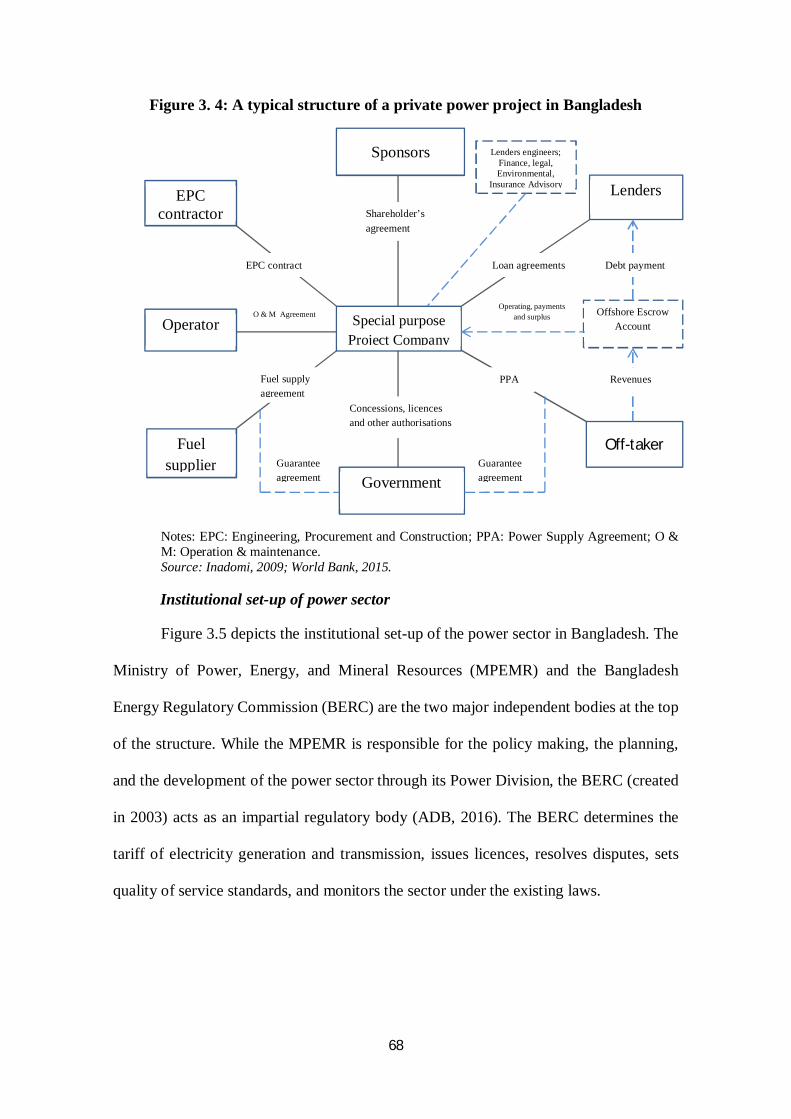
68
Figure 3. 4: A typical structure of a private power project in Bangladesh
Notes: EPC: Engineering, Procurement and Construction; PPA: Power Supply Agreement; O & M: Operation & maintenance. Source: Inadomi, 2009; World Bank, 2015.
Institutional set-up of power sector
Figure 3.5 depicts the institutional set-up of the power sector in Bangladesh. The
Ministry of Power, Energy, and Mineral Resources (MPEMR) and the Bangladesh
Energy Regulatory Commission (BERC) are the two major independent bodies at the top
of the structure. While the MPEMR is responsible for the policy making, the planning,
and the development of the power sector through its Power Division, the BERC (created
in 2003) acts as an impartial regulatory body (ADB, 2016). The BERC determines the
tariff of electricity generation and transmission, issues licences, resolves disputes, sets
quality of service standards, and monitors the sector under the existing laws.
EPC contractor
Sponsors
Operator
Lenders engineers; Finance, legal, Environmental,
Insurance Advisory
Fuel supplier
Government
Lenders
Special purpose Project Company
Off-taker
Offshore Escrow Account
Concessions, licences and other authorisations
Guarantee agreement
Guarantee agreement
Loan agreements Debt payment
Revenues PPA
Operating, payments and surplus
Shareholder’s agreement
EPC contract
O & M Agreement
Fuel supply agreement
69
Figure 3. 5: Institutional framework of the power sector in Bangladesh
Note: BERC: Bangladesh Energy Regulatory Commission; MPEMR: Ministry of Power, Energy, and Mineral Resources; SREDA: Sustainable and renewable energy development authority; BEPRC: Bangladesh energy and power research council; BPDB: Bangladesh Power Development Board; APSCL: Ashuganj Power Station Company Limited; NWPGC: North West Zone Power Generation Company Limited; EGCB: Electricity Generation Company of Bangladesh; CPGCBL: Coal Power Generation Company Bangladesh Limited; RPCL: Rural Power Company Limited (an IPP); IPP: independent power producer; PGCB: Power Grid Company of Bangladesh Limited; SZPDC: South Zone Power Distribution Company; DPDC: Dhaka Power Distribution Company; WZPDC: West Zone Power Distribution Company; NWPDC: North West Zone Power Distribution Company; REB: Rural Electrification Board; DESCO: Dhaka Electric Supply Company Ltd. Source: ADB, 2016; Power Division, 2016.
The BERC comprises a chairman and four members appointed by the president
on the proposal of the Ministry (World Bank, 2017c). The power division, the most
important authority, formulates and implements policies related to power planning,
generation and distribution. Under the supervision of this division, four independent
authorities were created, based on their specific purposes and technical expertise. The
Office of Energy Audit and Chief Electrical Inspector has been created for inspecting and
Generation
Transmission
Distribution
Bangladesh Energy Regulatory Commission (BERC)
Power Division
Office of Energy Audit and Chief Electrical Inspector
Independent
BEPRC
BPDB
APSCL
NWPGC
EGCB
CPGCBL
RPCL IPPs I Small IPPs
SZPDC DPDC DESCO WZPDC NWZPDC REBI BPDB
Power Grid Company Bangladesh (PGCB) (An enterprise of BPDB)
Power Sector Companies and State-Owned Enterprises
Government and Regulatory Bodies
SREDA Power Cell
Ministry of Power, Energy and Mineral Resources (MPEMR)
70
monitoring installation, as well as for issuing licences for higher and medium tension
customers, contractors, engineers and electricians (ADB, 2016). The sustainable and
renewable energy development authority (SREDA) was established in 2014 to promote
renewable energy and energy efficiency (World Bank, 2017c). In 1993, the Power Cell
was created as a technical unit assigned to implement reforms and to assist in the design
and monitoring of reform measures (ADB, 2016). The Bangladesh Energy and Research
Council (BEPRC) has been established to carry out research and development in the
energy and power sector. BEPRC is committed to seeking innovative solutions to meet
the needs in the power and energy sector, and to provide a platform for the local and
international expertise, to work in collaboration for a sustainable and efficient energy
solution (Power Division, 2016).
BPDB: The most important entity
Before 1977, the BPDB (a vertically-integrated state-owned organisation)
managed the national power system under the direct authorization of MPEMR. In order
to develop distribution networks, the government established the Rural Electrification
Board (REB) in 1977. In the early 1990s, the government-initiated a power sector reform
program focused on vertical unbundling that allowed creation of separate entities for
distribution and transmission functions. The government, under this reform, encouraged
private sector participation, established an energy regulatory commission (BERC) and
shifted to a single buyer market.
The BPDB was disintegrated and different companies for generation, transmission
and distribution were created. These include four generation companies, one
transmission, and four distribution companies. BPDB has been assigned as the single
buyer, purchasing generated electricity from state-owned and private generators and
selling electricity it to distribution companies. In 2017, the BPDB and its subsidiaries
71
owned around 56 percent of the country’s generation capacity. Private sector generators
including IPPs/SIPPs share around 40 percent of the total capacity, while imports from
India accounts for the remaining 4 percent. The BPDB is also responsible for distributing
electricity in urban areas except the Dhaka Metropolitan area, for which the Dhaka Power
Distribution Company (DPDC) and the Dhaka Electric Supply Company (DESCO) are
assigned. For urban areas in the south, west, and northwest zones in the country, separate
power distribution companies, including the SZPDC, WZPDC, and NWZPDC are
assigned. The Rural Electrification Board through the Palli Bidyut Samities (PBS) is
assigned for rural areas. Power Grid Company of Bangladesh Limited (PGCB),
established in 1996, is another subsidiary of BPDB, and the former owns and operates
the transmission system (Power Division, 2018; World Bank, 2017c).
Laws governing power sector
The fundamental law that governs the power sector is the Electricity Act of 1910,
which was revised in 2012. The revised law was updated to permit private participation
in power sector investments. The mother law defines the functions of the different
institutions involved in the provision of electricity services. For engaging private sector
in power generation, the government formulated a specific policy called ‘Private Sector
Power Generation Policy’ in 1996, which was later revised in 2004. Following the
adoption of this policy, a number of successful power projects (e.g., Haripur Power Ltd
and Meghnaghat Power Plant) were implemented. The revised law also promotes
developing alternative sources of energy and a time-bound plan to diversify fuel sources,
which should include renewable technologies with a principle of least-cost generation
(ADB, 2016; Ahamad & Tanin, 2013).
72
3.5.3 Development, current status and future trend of IPPs
Development of IPPs commences with power sector reform
In 1994, the Government of Bangladesh (GoB) initiated a power sector reform
program that envisioned the following: (a) Unbundling of the power sector through
separating power generation, transmission and distribution functions; (b) Corporatization
and commercialization of evolving power sector entities; (c) Creation of a regulatory
agency in the form of Bangladesh Energy Regulatory Commission (BERC); (d)
Encouraging private sector participation and PPPs in power sector; (e) Financial
restructuring and recovery plan for the sector; (f) Introducing cost reflective tariff for
financial viability of the utilities and efficient use of electricity; (g) Development of
demand side management (DSM) including energy efficiency measures to conserve
energy; (h) Development of alternative/renewable energy resources; and (i) Capacity
building and human resource development (HRD) for the sector entities and corporate
bodies (PA Consulting Group, 2008; World Bank, 2015).
Private Sector Power Generation Policy for IPPs
In response to the reform program, the GoB introduced the ‘Private Sector Power
Generation Policy’ that was formulated in 1996 and revised in 2004. The policy elements,
together called a ’Fundamental Security Package‘, includes features that were attractive
to national and international power developers, as follows: (a) Model Implementation
Agreement (ImA), Power Purchase Agreement (PPA), and Fuel Supply Agreement
(FSA); (b) The PPA guarantees to purchase produced power via a single buyer (BPDB);
(c) Under the FSA, fuel supply will be guaranteed by the GoB in case the supplier is a
public sector organisation. The credit of the state-owned entity is backed by the
government and the credit worthiness of the fuel supplier (stated-owned entity) is
guaranteed should the required fuel be imported when there is a shortage of gas supply;
73
(d) The ImA provides guarantees for the adjustment of certain tariff components as a
result of variations in the exchange rate, fuel prices and the inflation rate; (e) There shall
be exemption from corporate income tax for the private power companies for a period of
15 years; (f) Repatriation facilities for invested capital, profits and dividends shall be
provided and local currency (Taka) would be convertible for international payments on
the current account (Power Division, 1996; World Bank, 2015).
IPP models in Bangladesh
Following the introduction of this policy, IPPs started to contribute to power
generation from the late 1990s. The first successfully commissioned IPPs in Bangladesh
were Haripur Power Ltd (360 MW) and Meghnaghat Power Plant-I (450 MW) during
1998-2002. The IPP model used in Bangladesh is a type of PPP. The common attributes
of an operating environment and governance structure of a country require a
customisation of IPPs (Bhattacharyya, 2010). The commonly used IPP model in
developing countries, especially in Bangladesh, is a BOO, BOT, BROT type model, for
which a long-term concession is structured to allow the private partner to build the project,
operate it for the specified contract term, and transfer its ownership to the sponsors upon
expiry of this term (World Bank PPI Database, 2018). Two types of IPPs are in existence:
IPPs and SIPPs. While IPPs are independent power producers that have a relatively
longer-term contract, SIPPs are short-term IPPs that are usually in operation for only three
to five years. For these models, the host country provides a legal framework that
facilitates sponsors meeting performance obligations and payment for the provision of
private services (ADB, 2017; N. Islam, 2015). For example, in Bangladesh, the ‘Private
Sector Power Generation Policy-1996’ provided a fundamental security package that
includes a guarantee for implementing a project, purchasing electricity, and supplying
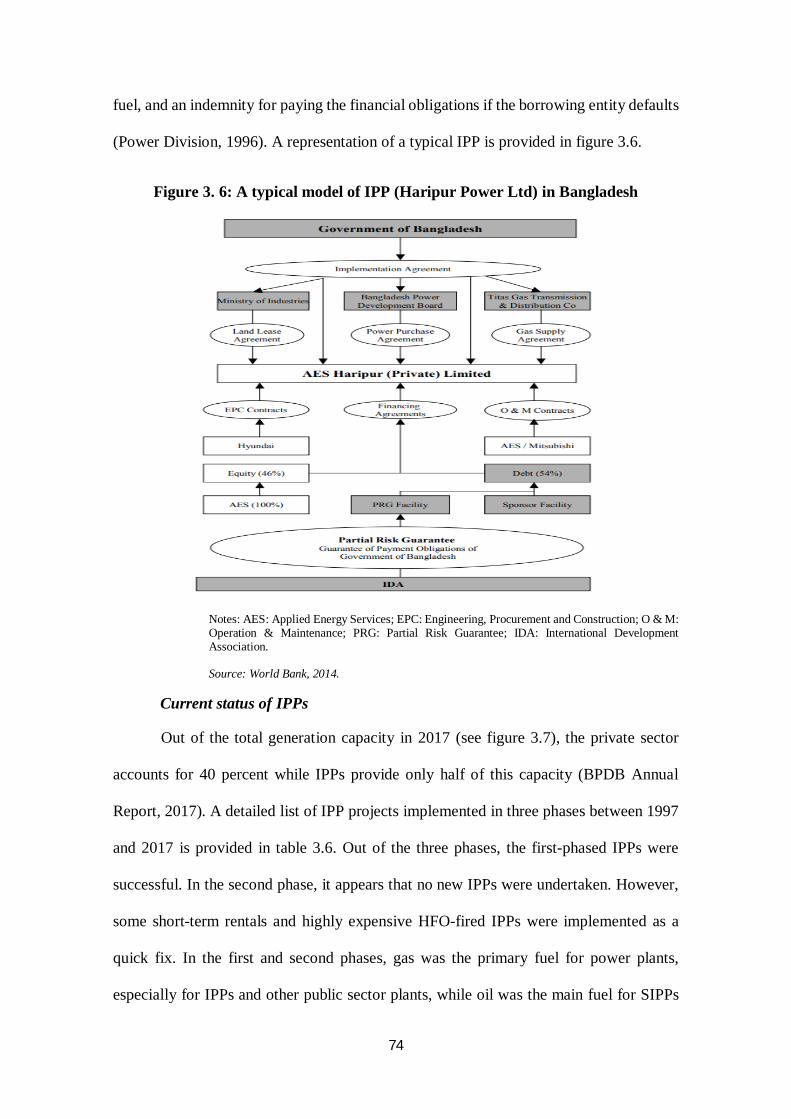
74
fuel, and an indemnity for paying the financial obligations if the borrowing entity defaults
(Power Division, 1996). A representation of a typical IPP is provided in figure 3.6.
Figure 3. 6: A typical model of IPP (Haripur Power Ltd) in Bangladesh
Notes: AES: Applied Energy Services; EPC: Engineering, Procurement and Construction; O & M: Operation & Maintenance; PRG: Partial Risk Guarantee; IDA: International Development Association.
Source: World Bank, 2014.
Current status of IPPs
Out of the total generation capacity in 2017 (see figure 3.7), the private sector
accounts for 40 percent while IPPs provide only half of this capacity (BPDB Annual
Report, 2017). A detailed list of IPP projects implemented in three phases between 1997
and 2017 is provided in table 3.6. Out of the three phases, the first-phased IPPs were
successful. In the second phase, it appears that no new IPPs were undertaken. However,
some short-term rentals and highly expensive HFO-fired IPPs were implemented as a
quick fix. In the first and second phases, gas was the primary fuel for power plants,
especially for IPPs and other public sector plants, while oil was the main fuel for SIPPs
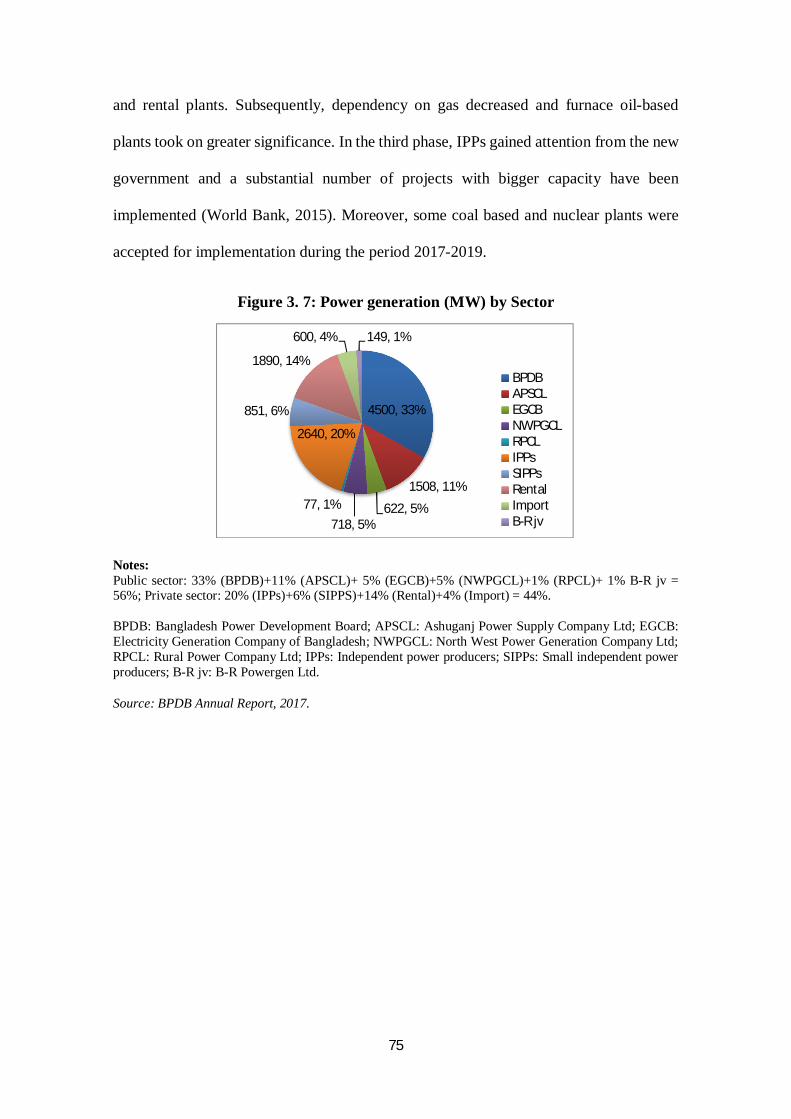
75
and rental plants. Subsequently, dependency on gas decreased and furnace oil-based
plants took on greater significance. In the third phase, IPPs gained attention from the new
government and a substantial number of projects with bigger capacity have been
implemented (World Bank, 2015). Moreover, some coal based and nuclear plants were
accepted for implementation during the period 2017-2019.
Figure 3. 7: Power generation (MW) by Sector
Notes: Public sector: 33% (BPDB)+11% (APSCL)+ 5% (EGCB)+5% (NWPGCL)+1% (RPCL)+ 1% B-R jv = 56%; Private sector: 20% (IPPs)+6% (SIPPS)+14% (Rental)+4% (Import) = 44%. BPDB: Bangladesh Power Development Board; APSCL: Ashuganj Power Supply Company Ltd; EGCB: Electricity Generation Company of Bangladesh; NWPGCL: North West Power Generation Company Ltd; RPCL: Rural Power Company Ltd; IPPs: Independent power producers; SIPPs: Small independent power producers; B-R jv: B-R Powergen Ltd.
Source: BPDB Annual Report, 2017.
4500, 33%
1508, 11%
622, 5%718, 5%
77, 1%
2640, 20%
851, 6%
1890, 14%
600, 4% 149, 1%
BPDBAPSCLEGCBNWPGCLRPCLIPPsSIPPsRentalImportB-R jv
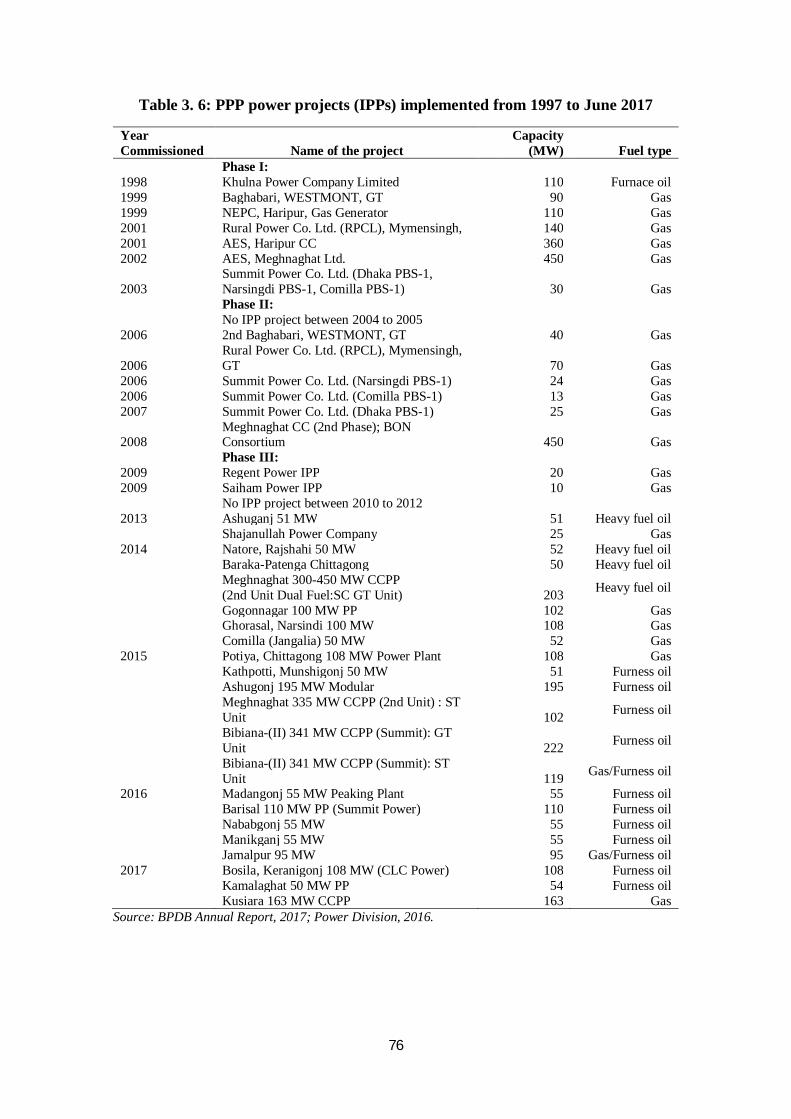
76
Table 3. 6: PPP power projects (IPPs) implemented from 1997 to June 2017
Year Commissioned Name of the project
Capacity (MW) Fuel type
Phase I: 1998 Khulna Power Company Limited 110 Furnace oil 1999 Baghabari, WESTMONT, GT 90 Gas 1999 NEPC, Haripur, Gas Generator 110 Gas 2001 Rural Power Co. Ltd. (RPCL), Mymensingh, 140 Gas 2001 AES, Haripur CC 360 Gas 2002 AES, Meghnaghat Ltd. 450 Gas
2003 Summit Power Co. Ltd. (Dhaka PBS-1, Narsingdi PBS-1, Comilla PBS-1) 30 Gas
Phase II: No IPP project between 2004 to 2005 2006 2nd Baghabari, WESTMONT, GT 40 Gas
2006 Rural Power Co. Ltd. (RPCL), Mymensingh, GT 70 Gas
2006 Summit Power Co. Ltd. (Narsingdi PBS-1) 24 Gas 2006 Summit Power Co. Ltd. (Comilla PBS-1) 13 Gas 2007 Summit Power Co. Ltd. (Dhaka PBS-1) 25 Gas
2008 Meghnaghat CC (2nd Phase); BON Consortium 450 Gas
Phase III: 2009 Regent Power IPP 20 Gas 2009 Saiham Power IPP 10 Gas No IPP project between 2010 to 2012 2013 Ashuganj 51 MW 51 Heavy fuel oil Shajanullah Power Company 25 Gas 2014 Natore, Rajshahi 50 MW 52 Heavy fuel oil Baraka-Patenga Chittagong 50 Heavy fuel oil
Meghnaghat 300-450 MW CCPP (2nd Unit Dual Fuel:SC GT Unit) 203 Heavy fuel oil
Gogonnagar 100 MW PP 102 Gas Ghorasal, Narsindi 100 MW 108 Gas Comilla (Jangalia) 50 MW 52 Gas 2015 Potiya, Chittagong 108 MW Power Plant 108 Gas Kathpotti, Munshigonj 50 MW 51 Furness oil Ashugonj 195 MW Modular 195 Furness oil
Meghnaghat 335 MW CCPP (2nd Unit) : ST Unit 102 Furness oil
Bibiana-(II) 341 MW CCPP (Summit): GT Unit 222 Furness oil
Bibiana-(II) 341 MW CCPP (Summit): ST Unit 119 Gas/Furness oil
2016 Madangonj 55 MW Peaking Plant 55 Furness oil Barisal 110 MW PP (Summit Power) 110 Furness oil Nababgonj 55 MW 55 Furness oil Manikganj 55 MW 55 Furness oil Jamalpur 95 MW 95 Gas/Furness oil 2017 Bosila, Keranigonj 108 MW (CLC Power) 108 Furness oil Kamalaghat 50 MW PP 54 Furness oil Kusiara 163 MW CCPP 163 Gas
Source: BPDB Annual Report, 2017; Power Division, 2016.
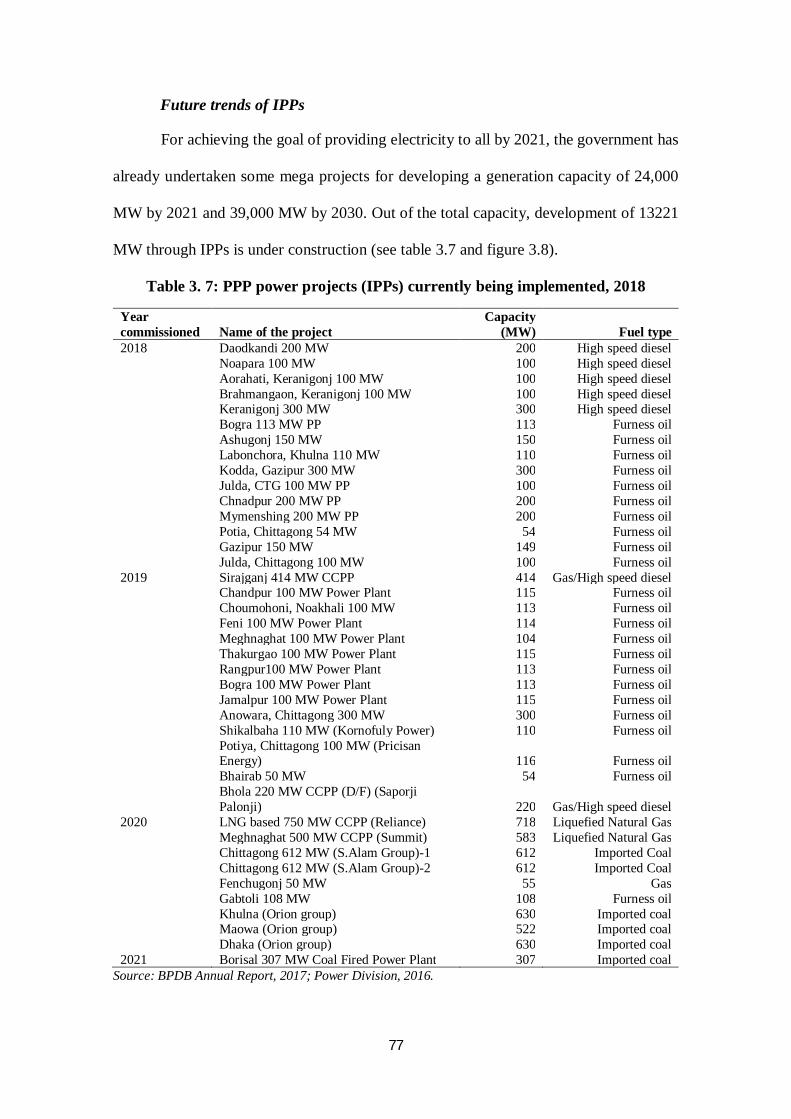
77
Future trends of IPPs
For achieving the goal of providing electricity to all by 2021, the government has
already undertaken some mega projects for developing a generation capacity of 24,000
MW by 2021 and 39,000 MW by 2030. Out of the total capacity, development of 13221
MW through IPPs is under construction (see table 3.7 and figure 3.8).
Table 3. 7: PPP power projects (IPPs) currently being implemented, 2018
Year commissioned Name of the project
Capacity (MW) Fuel type
2018 Daodkandi 200 MW 200 High speed diesel Noapara 100 MW 100 High speed diesel Aorahati, Keranigonj 100 MW 100 High speed diesel Brahmangaon, Keranigonj 100 MW 100 High speed diesel Keranigonj 300 MW 300 High speed diesel Bogra 113 MW PP 113 Furness oil Ashugonj 150 MW 150 Furness oil Labonchora, Khulna 110 MW 110 Furness oil Kodda, Gazipur 300 MW 300 Furness oil Julda, CTG 100 MW PP 100 Furness oil Chnadpur 200 MW PP 200 Furness oil Mymenshing 200 MW PP 200 Furness oil Potia, Chittagong 54 MW 54 Furness oil Gazipur 150 MW 149 Furness oil Julda, Chittagong 100 MW 100 Furness oil 2019 Sirajganj 414 MW CCPP 414 Gas/High speed diesel Chandpur 100 MW Power Plant 115 Furness oil Choumohoni, Noakhali 100 MW 113 Furness oil Feni 100 MW Power Plant 114 Furness oil Meghnaghat 100 MW Power Plant 104 Furness oil Thakurgao 100 MW Power Plant 115 Furness oil Rangpur100 MW Power Plant 113 Furness oil Bogra 100 MW Power Plant 113 Furness oil Jamalpur 100 MW Power Plant 115 Furness oil Anowara, Chittagong 300 MW 300 Furness oil Shikalbaha 110 MW (Kornofuly Power) 110 Furness oil
Potiya, Chittagong 100 MW (Pricisan Energy) 116 Furness oil
Bhairab 50 MW 54 Furness oil
Bhola 220 MW CCPP (D/F) (Saporji Palonji) 220 Gas/High speed diesel
2020 LNG based 750 MW CCPP (Reliance) 718 Liquefied Natural Gas Meghnaghat 500 MW CCPP (Summit) 583 Liquefied Natural Gas Chittagong 612 MW (S.Alam Group)-1 612 Imported Coal Chittagong 612 MW (S.Alam Group)-2 612 Imported Coal Fenchugonj 50 MW 55 Gas Gabtoli 108 MW 108 Furness oil Khulna (Orion group) 630 Imported coal Maowa (Orion group) 522 Imported coal Dhaka (Orion group) 630 Imported coal 2021 Borisal 307 MW Coal Fired Power Plant 307 Imported coal
Source: BPDB Annual Report, 2017; Power Division, 2016.
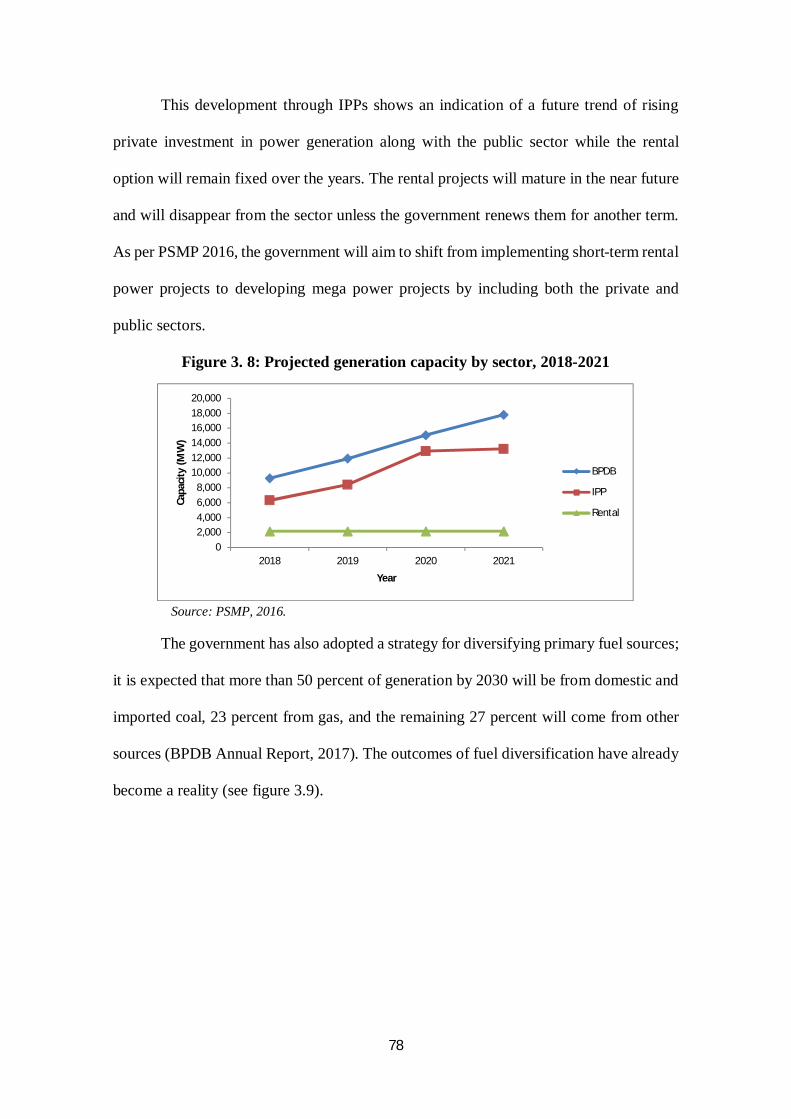
78
This development through IPPs shows an indication of a future trend of rising
private investment in power generation along with the public sector while the rental
option will remain fixed over the years. The rental projects will mature in the near future
and will disappear from the sector unless the government renews them for another term.
As per PSMP 2016, the government will aim to shift from implementing short-term rental
power projects to developing mega power projects by including both the private and
public sectors.
Figure 3. 8: Projected generation capacity by sector, 2018-2021
Source: PSMP, 2016.
The government has also adopted a strategy for diversifying primary fuel sources;
it is expected that more than 50 percent of generation by 2030 will be from domestic and
imported coal, 23 percent from gas, and the remaining 27 percent will come from other
sources (BPDB Annual Report, 2017). The outcomes of fuel diversification have already
become a reality (see figure 3.9).
02,0004,0006,0008,000
10,00012,00014,00016,00018,00020,000
2018 2019 2020 2021
Capa
city
(MW
)
Year
BPDB
IPP
Rental
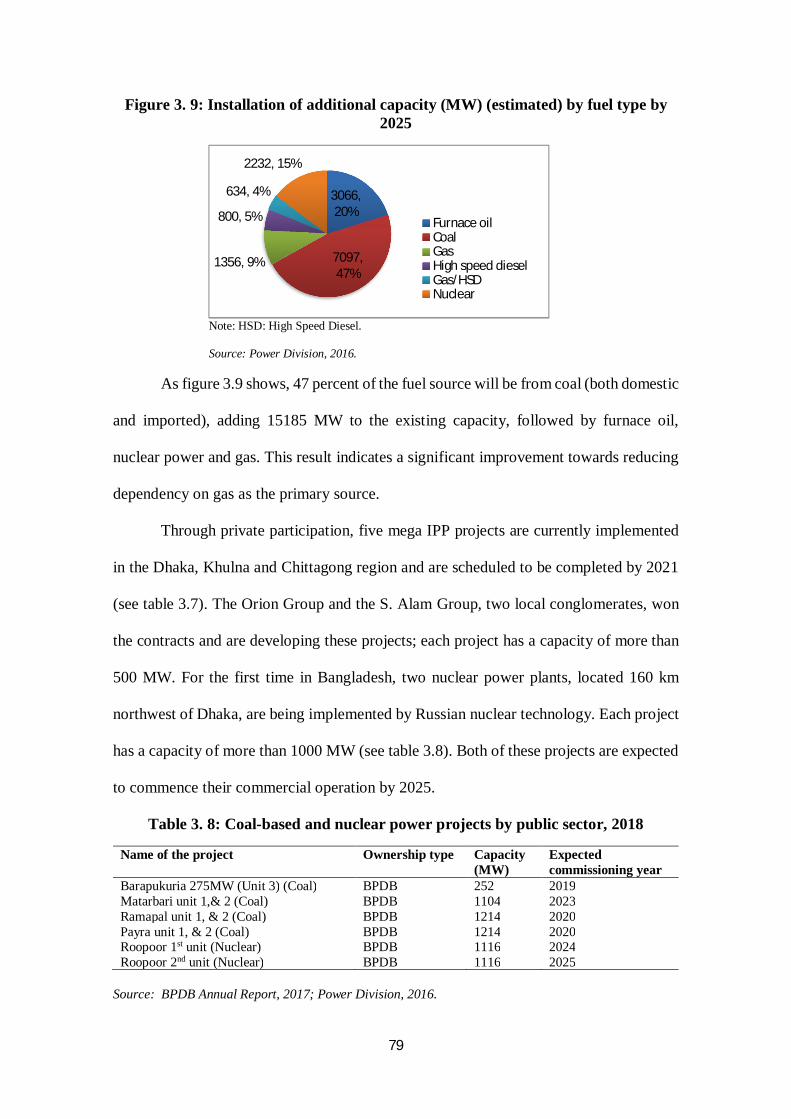
79
Figure 3. 9: Installation of additional capacity (MW) (estimated) by fuel type by 2025
Note: HSD: High Speed Diesel.
Source: Power Division, 2016.
As figure 3.9 shows, 47 percent of the fuel source will be from coal (both domestic
and imported), adding 15185 MW to the existing capacity, followed by furnace oil,
nuclear power and gas. This result indicates a significant improvement towards reducing
dependency on gas as the primary source.
Through private participation, five mega IPP projects are currently implemented
in the Dhaka, Khulna and Chittagong region and are scheduled to be completed by 2021
(see table 3.7). The Orion Group and the S. Alam Group, two local conglomerates, won
the contracts and are developing these projects; each project has a capacity of more than
500 MW. For the first time in Bangladesh, two nuclear power plants, located 160 km
northwest of Dhaka, are being implemented by Russian nuclear technology. Each project
has a capacity of more than 1000 MW (see table 3.8). Both of these projects are expected
to commence their commercial operation by 2025.
Table 3. 8: Coal-based and nuclear power projects by public sector, 2018
Name of the project Ownership type Capacity (MW)
Expected commissioning year
Barapukuria 275MW (Unit 3) (Coal) BPDB 252 2019 Matarbari unit 1,& 2 (Coal) BPDB 1104 2023 Ramapal unit 1, & 2 (Coal) BPDB 1214 2020 Payra unit 1, & 2 (Coal) BPDB 1214 2020 Roopoor 1st unit (Nuclear) BPDB 1116 2024 Roopoor 2nd unit (Nuclear) BPDB 1116 2025
Source: BPDB Annual Report, 2017; Power Division, 2016.
3066, 20%
7097, 47%
1356, 9%
800, 5%
634, 4%
2232, 15%
Furnace oilCoalGasHigh speed dieselGas/HSDNuclear
80
3.5.4 An assessment of IPPs
One of the objectives of undertaking power projects through IPPs was to utilise
private sector resources for power generation because of government budgetary
limitations (Planning Commission GoB, 2012). Participation of multilateral lenders (such
as the World Bank and the Asian Development Bank) made the first-phased IPPs
successful. Their involvement was critical, given their experience in lending in emerging
markets and their ability to provide credit enhancement facilities that included political
risk insurance (M. Khan et al., 2012; World Bank, 2015). During the period 1998 to 2002,
two IPP projects (Haripur Power Ltd and Meghnaghat Power Plant) contributed to a lion’s
share of generation capacity (see figure 3.10). These two, along with some other small
private power projects, were considered successful and became examples for other
developing countries to follow. The measures of success included achieving the
commercial operation date on time and implementing the projects within the agreed
budget (World Bank, 2014a). The tariff rate of US$ 0.0273 was the lowest IPP tariff in
Bangladesh and one of the lowest to date in the world (Azad, 2002). For developing these
projects, efficient concessionaires were selected via a process of competitive tendering,
and government commitment to implementing the projects was uncompromising with
any other vested interest (S. Khan, 2007).
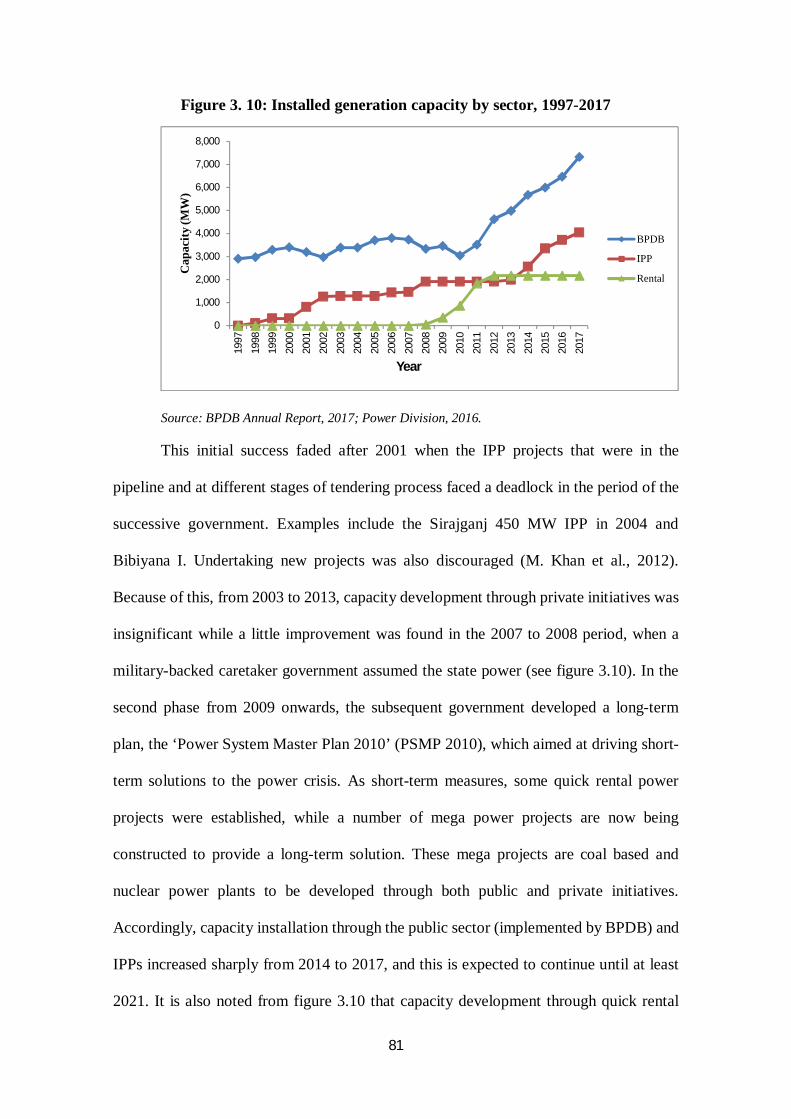
81
Figure 3. 10: Installed generation capacity by sector, 1997-2017
Source: BPDB Annual Report, 2017; Power Division, 2016.
This initial success faded after 2001 when the IPP projects that were in the
pipeline and at different stages of tendering process faced a deadlock in the period of the
successive government. Examples include the Sirajganj 450 MW IPP in 2004 and
Bibiyana I. Undertaking new projects was also discouraged (M. Khan et al., 2012).
Because of this, from 2003 to 2013, capacity development through private initiatives was
insignificant while a little improvement was found in the 2007 to 2008 period, when a
military-backed caretaker government assumed the state power (see figure 3.10). In the
second phase from 2009 onwards, the subsequent government developed a long-term
plan, the ‘Power System Master Plan 2010’ (PSMP 2010), which aimed at driving short-
term solutions to the power crisis. As short-term measures, some quick rental power
projects were established, while a number of mega power projects are now being
constructed to provide a long-term solution. These mega projects are coal based and
nuclear power plants to be developed through both public and private initiatives.
Accordingly, capacity installation through the public sector (implemented by BPDB) and
IPPs increased sharply from 2014 to 2017, and this is expected to continue until at least
2021. It is also noted from figure 3.10 that capacity development through quick rental
0
1,000
2,000
3,000
4,000
5,000
6,000
7,000
8,000
1997
1998
1999
2000
2001
2002
2003
2004
2005
2006
2007
2008
2009
2010
2011
2012
2013
2014
2015
2016
2017
Cap
acity
(MW
)
Year
BPDB
IPP
Rental
82
projects has remained stagnant over the past few years, meaning that no new quick rentals
have been undertaken.
Transparent procurement is critical for PPPs to be successful at the end of the
project term. But a small number of players with close connections with the government
in Bangladesh make the bidding process uncompetitive, which might lead to an inefficient
concessionaire selection. This could be the sign of limited transparency. Furthermore,
other issues include that a/the high risk premium, the rent capture at the early stage of
project implementation, the prolonged decision making and the examples of only a few
recent successes in IPPs should also have an impact on the assessment of PPP initiatives
in the power sector in Bangladesh (M. Khan et al., 2012; Transparency International
Bangladesh, n.d).
3.6 Research gap and associated research questions
No significant research has been undertaken on evaluating PPP performances,
especially power PPPs (IPPs) in Bangladesh and accordingly very limited literature in the
context of Bangladesh is available. Based on multilateral agency reports (World Bank,
ADB, and IMF), company annual reports, government documents, media commentaries,
and other online sources, a critical analysis has been undertaken in this chapter.
Bangladesh represents an ideal case for evaluating the performance of power PPPs. It has
become one of Asia’s success stories in recent years (Basu, 2018). Its PPP operating
environment and economic status are comparable to those of other countries in the region.
Initially, a number of executed PPPs in Bangladesh showed good performances in the
power sector. Conversly, after these initial successes, schedule lapses and cost overruns
have become common features (M. Khan et al., 2012).
83
Nevertheless, the interest in using the PPP option in different sectors, including
the power sector, has expanded recently (BPDB Annual Report, 2017; PPP Authority,
2018). However, very little knowledge exists of actual PPP performances and
measurement indicators for use in evaluating these performances. This suggests multiples
research questions to be addressed in this research: for example, what are the most
important performance areas of the power sector PPPs in Bangladesh using a traditional
approach of analysing case experiences? What are the actual performance scores of the
sample of power sector PPPs in Bangladesh applying developed weights of KPAs and
indicators and how do they differ from unweighted scores derived from industry experts
and/or readily available performance assessments? The next chapter presents details of
the methodology used in this study.

84
Chapter Four: Research methodology
85
4.1 Introduction
This chapter outlines details of the methodology used in this study. A mixed-
method approach utilising both quantitative and qualitative methods is employed (Section
4.2). A multi-criteria decision model, namely the analytical hierarchy process (AHP), is
used to attain quantitative preference values for key performance areas (KPAs) and
indicators (Section 4.3). Then the case study method is employed for analysing selected
case experiences and for applying the developed weights of the KPAs/indicators to those
project cases to derive project scores (Section 4.4 and discussed in Chapter 6 and Chapter
7).
4.2 Research process
The research process presented in figure 4.1 is divided into four phases. Phase 1
begins with a fresh research idea in mind, reviews the related literature, then transforms
the initial research idea into the final research problem. A set of four research questions
(RQs) or objectives were formulated to achieve the overall research objective, which asks
how the performance of public–private partnerships (PPPs) can be measured and
explained in developing countries? The following four questions are our research
objectives:
(RQ1) What are the most appropriate indicators and hence KPAs of PPPs in
developing countries?
(RQ2) What are the weights of the different KPAs and indicators in developing
countries and how do these weights differ from those in developed
countries?
(RQ3) What are the most important performance areas of the power sector PPPs
in Bangladesh using a traditional approach of analysing case experiences?
86
(RQ4) What are the actual performance scores of the sample of power sector
PPPs in Bangladesh applying developed weights of KPAs and indicators
and how do they differ from unweighted scores derived from industry
experts and/or readily available performance assessments?
In Phase 1, we develop both a research outline for this study and a framework of
performance indicators for evaluating PPP performances in the developing countries.
Through developing the framework, the first research objective is achieved.
In Phase 2, the weights of the different KPAs and indicators are established, which
is our second research objective. The research activities in this phase involve designing
the structured questionnaire, conducting the survey, calculating the KPA weights, and
analysing and discussing the results. These established weights are later used to derive
individual project performance scores by interacting them with Likert scaled scores
obtained through a project-specific questionnaire survey conducted in phase 3.
In Phase 3, the case study process begins by reviewing different sectors that have
implemented PPPs in Bangladesh. From this comprehensive review, we found the power
sector PPPs to be appropriate for the case study. Six projects were selected based on some
pre-defined criteria (discussed in section 4.4.3). Each case study was developed by
documenting the experiences of the projects that provide the subject matter for the cases.
This documentation was used to achieve our third research objective.
For the fourth research objective, a project-specific structured questionnaire
survey was conducted at a later stage in this phase to obtain project performance scores
against a set of indicators. The scores obtained were then weighted using the AHP weights
already established in chapter 5, thereby answering research RQ4.
Finally, in Phase 4, results derived from solving RQ4 are examined and linked to
the project experiences, and arguments are developed based on results and with the

87
support of findings from the previous literature. Conclusions are drawn, based on the
overall findings of this study, and policy implications are suggested accordingly.
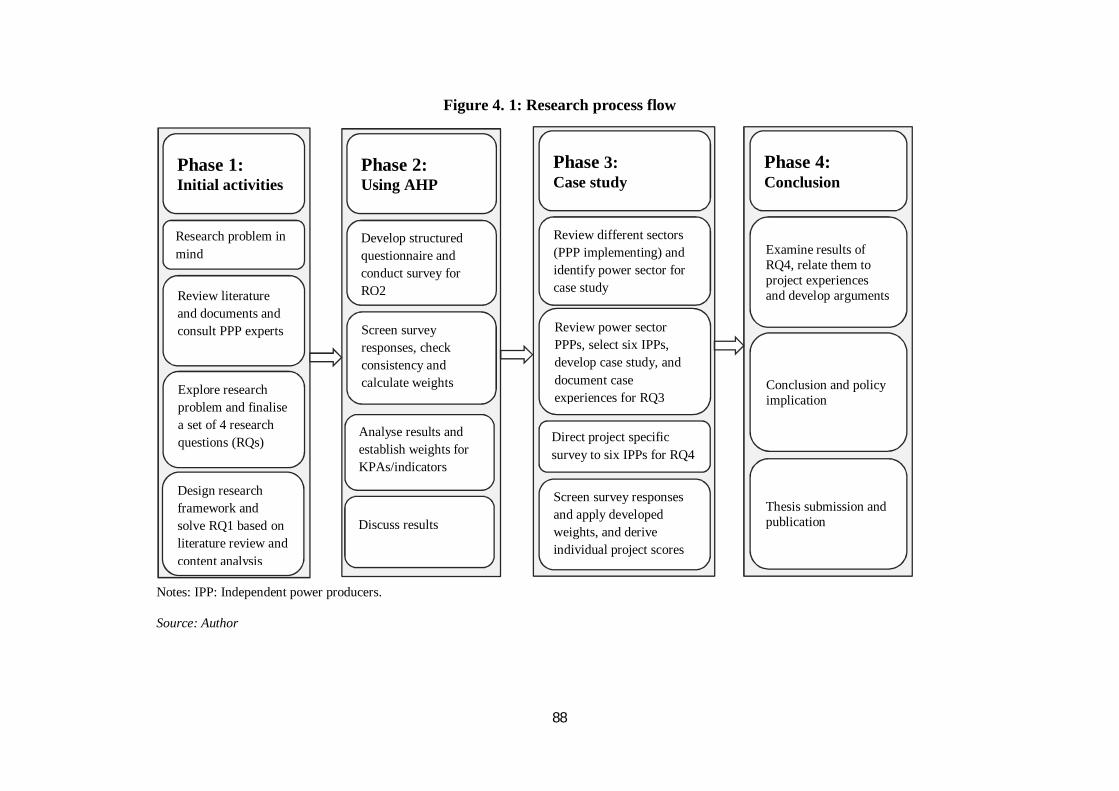
88
Figure 4. 1: Research process flow
Notes: IPP: Independent power producers.
Source: Author
Phase 1: Initial activities
Research problem in mind
Phase 2: Using AHP
Phase 3: Case study
Review literature and documents and consult PPP experts
Explore research problem and finalise a set of 4 research questions (RQs)
Design research framework and solve RQ1 based on literature review and content analysis
Develop structured questionnaire and conduct survey for RQ2
Screen survey responses, check consistency and calculate weights
Discuss results
Review different sectors (PPP implementing) and identify power sector for case study
Review power sector PPPs, select six IPPs, develop case study, and document case experiences for RQ3
Direct project specific survey to six IPPs for RQ4
Screen survey responses and apply developed weights, and derive individual project scores
Phase 4: Conclusion
Examine results of RQ4, relate them to project experiences and develop arguments
Conclusion and policy implication
Thesis submission and publication
Analyse results and establish weights for KPAs/indicators
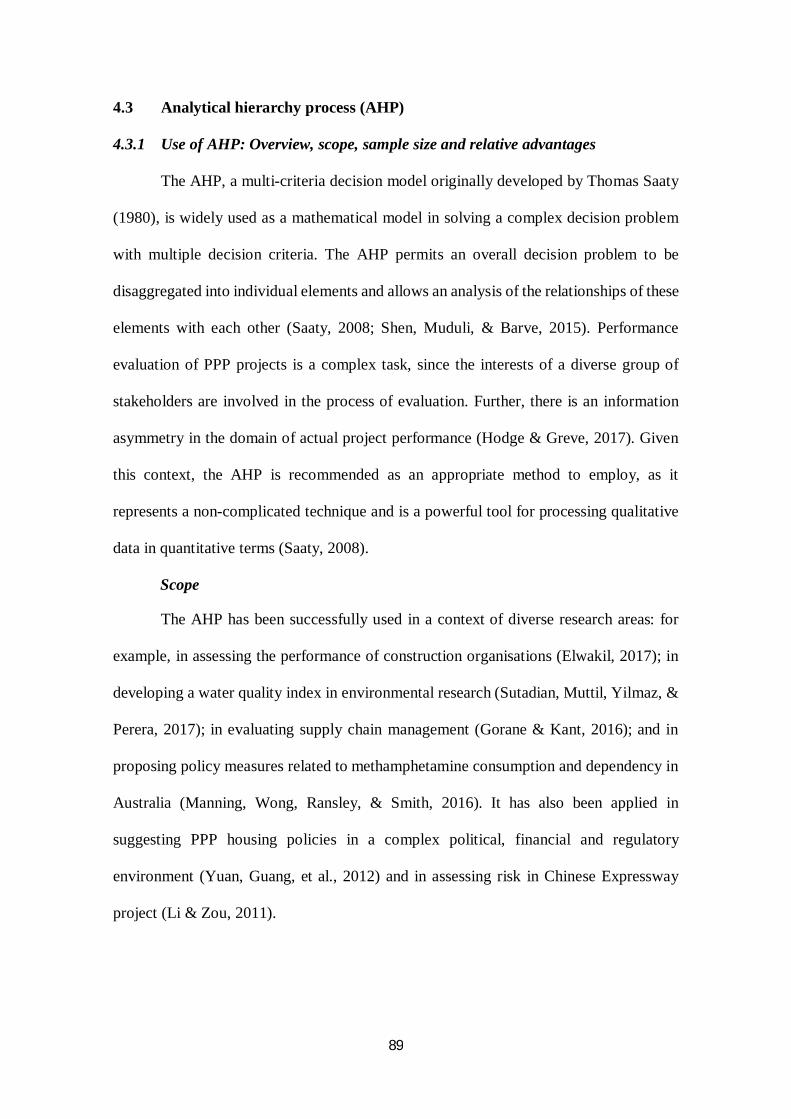
89
4.3 Analytical hierarchy process (AHP)
4.3.1 Use of AHP: Overview, scope, sample size and relative advantages
The AHP, a multi-criteria decision model originally developed by Thomas Saaty
(1980), is widely used as a mathematical model in solving a complex decision problem
with multiple decision criteria. The AHP permits an overall decision problem to be
disaggregated into individual elements and allows an analysis of the relationships of these
elements with each other (Saaty, 2008; Shen, Muduli, & Barve, 2015). Performance
evaluation of PPP projects is a complex task, since the interests of a diverse group of
stakeholders are involved in the process of evaluation. Further, there is an information
asymmetry in the domain of actual project performance (Hodge & Greve, 2017). Given
this context, the AHP is recommended as an appropriate method to employ, as it
represents a non-complicated technique and is a powerful tool for processing qualitative
data in quantitative terms (Saaty, 2008).
Scope
The AHP has been successfully used in a context of diverse research areas: for
example, in assessing the performance of construction organisations (Elwakil, 2017); in
developing a water quality index in environmental research (Sutadian, Muttil, Yilmaz, &
Perera, 2017); in evaluating supply chain management (Gorane & Kant, 2016); and in
proposing policy measures related to methamphetamine consumption and dependency in
Australia (Manning, Wong, Ransley, & Smith, 2016). It has also been applied in
suggesting PPP housing policies in a complex political, financial and regulatory
environment (Yuan, Guang, et al., 2012) and in assessing risk in Chinese Expressway
project (Li & Zou, 2011).
90
Sample size
The AHP normally utilises a relatively small sample size, but the sampled
population should have the required expertise, knowledge and experiences of the subject
that they are going to judge. Some examples given here of the application of AHP
illustrate this use of small sample sizes. Sutadian et al. (2017) surveyed only 15 relevant
experts in developing water quality indices (WQIs) in Indonesia. Elwakil (2017) collected
the judgments of 63 experts in order to propose a new organisational performance
assessment model. He also integrated the AHP with multiple linear regressions (MLR) to
identify the critical success factors (CSFs) that are responsible for ensuring better
organisational performance. Similarly, using the judgements of only 5 experts, Li and
Zou (2011) developed an extended fuzzy AHP technique to assess the risk of a
construction project in Hong Kong. Cheung et al. (2001) used survey results from 26
developers and project managers when assessing key factors in procurement selection. In
the design development of PPP projects in particular, Raisbeck and Tang (2013) utilised
36 responses from a pool of experts involved in PPP projects in identifying design
development factors, in the case of Australia. The AHP process does not require a large
sample size since it operates in a structured questionnaire environment (Raisbeck & Tang,
2013).
Relative advantages
The AHP has been applied for determining the weights of indicators because of
its relative advantages over other available methods. For example, a large sample size and
a linearity assumption of the indicators are required to apply a statistics-based method
such as principal component analysis (PCA) (Ali, Ibrahim, Mengersen, Shitan, & Juahir,
2013; Hutcheson & Sofroniou, 1999). But the scarcity of available data and the non-
linearity assumption of indicators, in this study, disallow application of the PCA method.

91
Among the participatory-based methods, the Delphi and AHP methods are commonly
used to elicit the judgement of experts in related fields (Yeung, Chan, Chan, Chiang, &
Yang, 2012; Yeung et al., 2007). The Delphi method needs to be directed among the
experts in several rounds, which needs more time and resources (Franklin & Hart, 2007).
By contrast, the AHP approach is simple to use and so is more appropriate for applying
transitive ordering of human personal preferences to make pairwise comparisons (Saaty,
1990). Also, it has an attractive feature of generating consistency index that measures the
degree of inconsistencies in the judgement of the respondents (Saaty & Vargas, 1984).
4.3.2 Structuring hierarchy of the KPAs and indicators
The first step in developing the AHP includes construction of a hierarchy that
contains all KPAs and indicators in relation to a goal that needs to be achieved. At the top
of the hierarchy is the goal; below are KPAs in level 1, indicators in level 2, and sub-
indicators in level 3. The number of levels varies depending on the type and complexity
of the particular decision problem. A hierarchical representation of this study is depicted
in figure 4.2.
For our study, forty-one indicators were identified by an extensive review of
related literature and consultation with PPP contract documents and practitioners (in
Bangladesh). These indicators were then clustered into eight KPAs, based on: (a) their
relevance with a particular performance area; (b) their appearance in the time line of the
project life cycle, such as the pre-implementation phase or the implementation phase; and
(c) their presence in the long run in the economy and society.
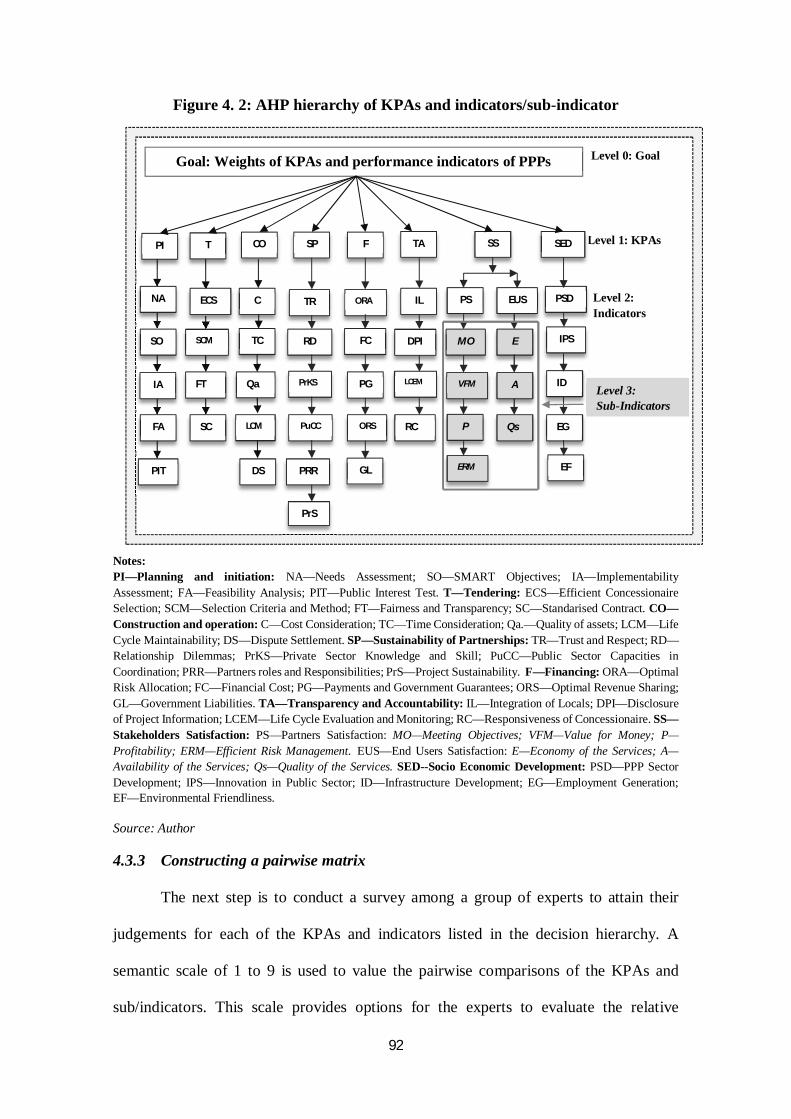
92
Figure 4. 2: AHP hierarchy of KPAs and indicators/sub-indicator
Notes: PI—Planning and initiation: NA—Needs Assessment; SO—SMART Objectives; IA—Implementability Assessment; FA—Feasibility Analysis; PIT—Public Interest Test. T—Tendering: ECS—Efficient Concessionaire Selection; SCM—Selection Criteria and Method; FT—Fairness and Transparency; SC—Standarised Contract. CO—Construction and operation: C—Cost Consideration; TC—Time Consideration; Qa.—Quality of assets; LCM—Life Cycle Maintainability; DS—Dispute Settlement. SP—Sustainability of Partnerships: TR—Trust and Respect; RD—Relationship Dilemmas; PrKS—Private Sector Knowledge and Skill; PuCC—Public Sector Capacities in Coordination; PRR—Partners roles and Responsibilities; PrS—Project Sustainability. F—Financing: ORA—Optimal Risk Allocation; FC—Financial Cost; PG—Payments and Government Guarantees; ORS—Optimal Revenue Sharing; GL—Government Liabilities. TA—Transparency and Accountability: IL—Integration of Locals; DPI—Disclosure of Project Information; LCEM—Life Cycle Evaluation and Monitoring; RC—Responsiveness of Concessionaire. SS—Stakeholders Satisfaction: PS—Partners Satisfaction: MO—Meeting Objectives; VFM—Value for Money; P—Profitability; ERM—Efficient Risk Management. EUS—End Users Satisfaction: E—Economy of the Services; A—Availability of the Services; Qs—Quality of the Services. SED--Socio Economic Development: PSD—PPP Sector Development; IPS—Innovation in Public Sector; ID—Infrastructure Development; EG—Employment Generation; EF—Environmental Friendliness.
Source: Author
4.3.3 Constructing a pairwise matrix
The next step is to conduct a survey among a group of experts to attain their
judgements for each of the KPAs and indicators listed in the decision hierarchy. A
semantic scale of 1 to 9 is used to value the pairwise comparisons of the KPAs and
sub/indicators. This scale provides options for the experts to evaluate the relative
Level 0: Goal
Level 1: KPAs
Level 2: Indicators
Goal: Weights of KPAs and performance indicators of PPPs
PI
NA
SO
IA
FA
PIT
T CO SP F
ECS C
TC
Qa
SCM
FT
SC LCM
DS
TR
RD
PrKS
ORA
FC
PG
PuCC
PRR
PrS
ORS
GL
TA SS SED
PS
ERM
P
VFM
MO
EUS IL
RC
LCEM
DPI E
A
Qs
PSD
IPS
ID
EG
EF
Level 3: Sub-Indicators
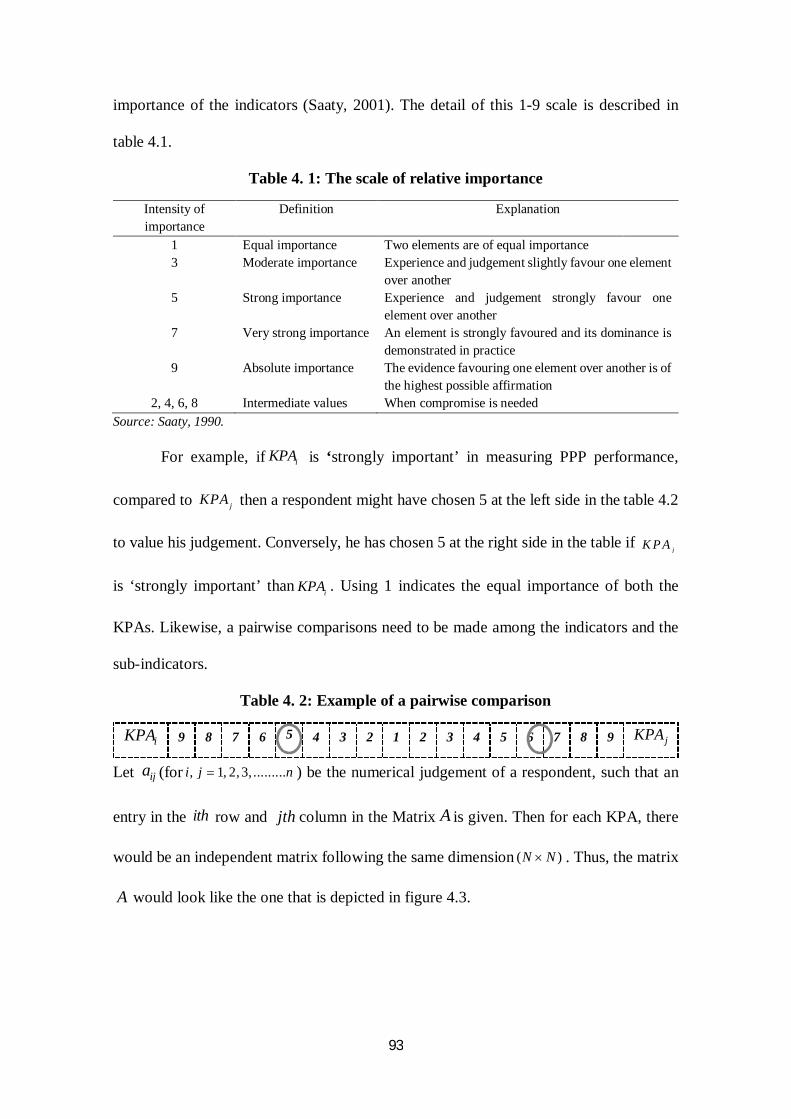
93
importance of the indicators (Saaty, 2001). The detail of this 1-9 scale is described in
table 4.1.
Table 4. 1: The scale of relative importance
Intensity of importance
Definition Explanation
1 Equal importance Two elements are of equal importance 3 Moderate importance Experience and judgement slightly favour one element
over another 5 Strong importance Experience and judgement strongly favour one
element over another 7 Very strong importance An element is strongly favoured and its dominance is
demonstrated in practice 9 Absolute importance The evidence favouring one element over another is of
the highest possible affirmation 2, 4, 6, 8 Intermediate values When compromise is needed
Source: Saaty, 1990.
For example, if is ‘strongly important’ in measuring PPP performance,
compared to then a respondent might have chosen 5 at the left side in the table 4.2
to value his judgement. Conversely, he has chosen 5 at the right side in the table if
is ‘strongly important’ than . Using 1 indicates the equal importance of both the
KPAs. Likewise, a pairwise comparisons need to be made among the indicators and the
sub-indicators.
Table 4. 2: Example of a pairwise comparison
9 8 7 6 5 4 3 2 1 2 3 4 5 6 7 8 9
Let (for ) be the numerical judgement of a respondent, such that an
entry in the row and column in the Matrix is given. Then for each KPA, there
would be an independent matrix following the same dimension . Thus, the matrix
would look like the one that is depicted in figure 4.3.
iKPA
jKPA
jK P A
iKPA
iKPA jKPA
ija , 1, 2,3, .........i j n
ith jth A
( )N N
A
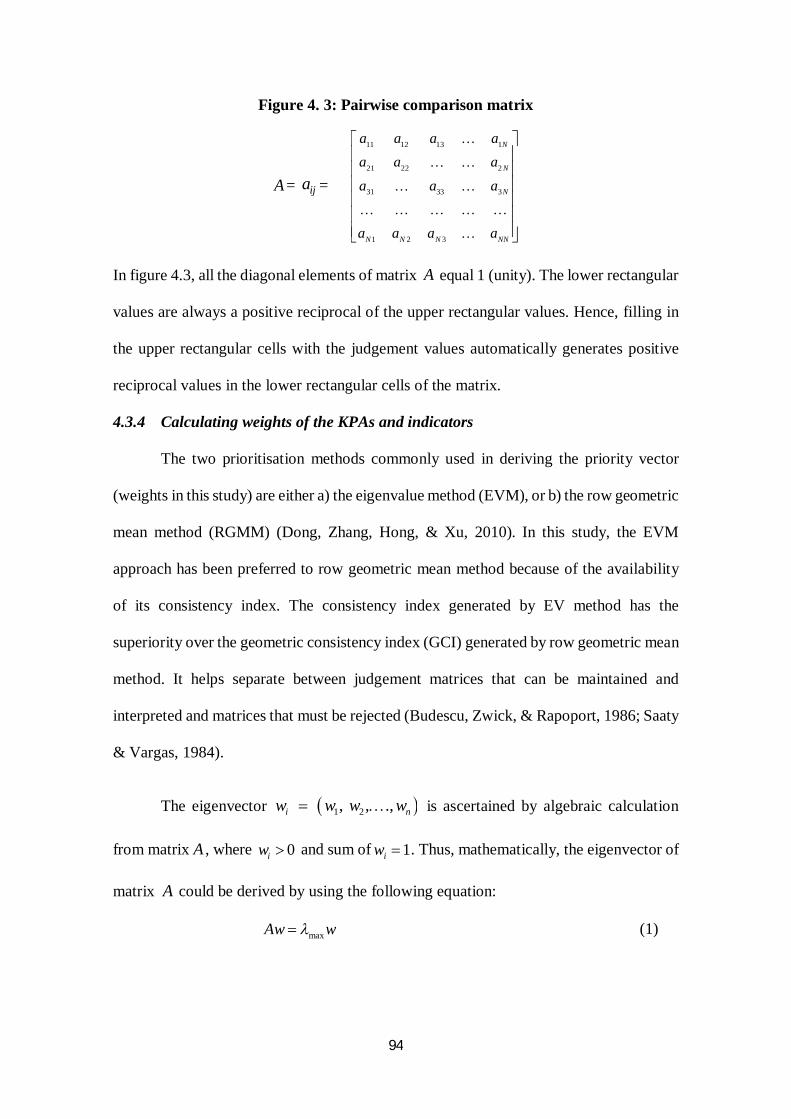
94
Figure 4. 3: Pairwise comparison matrix
= =
In figure 4.3, all the diagonal elements of matrix equal 1 (unity). The lower rectangular
values are always a positive reciprocal of the upper rectangular values. Hence, filling in
the upper rectangular cells with the judgement values automatically generates positive
reciprocal values in the lower rectangular cells of the matrix.
4.3.4 Calculating weights of the KPAs and indicators
The two prioritisation methods commonly used in deriving the priority vector
(weights in this study) are either a) the eigenvalue method (EVM), or b) the row geometric
mean method (RGMM) (Dong, Zhang, Hong, & Xu, 2010). In this study, the EVM
approach has been preferred to row geometric mean method because of the availability
of its consistency index. The consistency index generated by EV method has the
superiority over the geometric consistency index (GCI) generated by row geometric mean
method. It helps separate between judgement matrices that can be maintained and
interpreted and matrices that must be rejected (Budescu, Zwick, & Rapoport, 1986; Saaty
& Vargas, 1984).
The eigenvector is ascertained by algebraic calculation
from matrix , where and sum of . Thus, mathematically, the eigenvector of
matrix could be derived by using the following equation:
(1)
A ija
11 12 13 1
21 22 2
31 33 3
1 2 3
N
N
N
N N N NN
a a a aa a aa a a
a a a a
A
1 2 , , .,i nw w w w
A 0iw 1iw
A
maxAw w
95
where is the largest eigenvalue of the matrix and is the corresponding
eigenvector. By normalising the eigenvector for each of the matrix, priority vector
(weights) is derived (Saaty, 1990). Normalising each of the matrixes follows the equation:
(2)
where is the largest eigenvalue of matrix .
4.3.5 Checking consistency of the judgment
Consistency checking involves measurement of the intransitivity of the
respondent answers (Manning, Ransley, Smith, Mazerolle, & Cook, 2013). For example,
a transitive ordering of preferences is such that if the relative importance of is greater
than , and is greater than , then obviously is greater than . This logic of
transitivity is considered as an axiom of rationality in relation to the preferences of
individuals (Saaty, 1990). In a subjective judgement of a human being, logical
consistency is generally more feasible than perfect consistency (Sutadian et al., 2017).
Thus, the Consistency Index ( ) is the indicator that tells the ‘closeness to consistency’
of a set of pairwise comparison judgements:
(3)
where is the Consistency Index, is the dimensions, and is the largest
eigenvalue of the matrix . is the most important estimate that measures the
consistency of the experts’ judgement. It always equals if and only if is a perfectly
consistent matrix and equals or greater than if is a reciprocal matrix. Thus, the
closer an estimate of is to , the more consistent the judgement is (Saaty, 1990).
For particular different dimensions of the matrix, a Random Index based on mean
max A w
maxA w w
max A
A
B B C A C
CI
max
1nCI
n
CI n max
A max
n A
n A
max n
( )RI
96
values across judgements has been generated (Saaty, 1980). The Consistency Ratio
is then calculated using the following equation:
(4)
In general, is considered acceptable. However, in the case of a large
number of criteria in a comparison matrix tends to exceed the general standard of
0.10. Further review of the judgement of respondents might result in better consistency.
In this study, respondents with inconsistencies were requested to revise their pairwise
comparisons to reduce the inconsistent ordering of the preferences.
Geometric consistency index (GCI)
Given a pairwise comparison matrix with and priority
vector, , using RGMM, the is given (Crawford & Williams, 1985):
(5)
where is the ratio of the priority vectors.
4.3.6 Aggregating individual weights
The next step involves synthesising the weights found in the different levels of
the hierarchy to obtain global weights of the sub/indicators by employing one of two
possible aggregating approaches: aggregating individual priorities (AIP) or aggregating
individual judgements (AIJ) (Dong et al., 2010). In AIJ, the individual judgment matrix
is aggregated to obtain a collective judgment matrix, from which a collective weight is
derived. In AIP, individual weights are elicited first and then aggregated to derive
collective weights. Proponents of AIP argue that the Pareto principle of social choice
theory is violated when using the AIJ method (Ramanathan & Ganesh, 1994). Again,
CI
( )CR
CRCIRI
0.10CR
CR
ijA a , 1, 2, ...i j n
w GCI
2
( 1)( 2)(log log )i
i j ijj
GCIn n
wa
w
i
j
ww
97
application of the AIJ or AIP depends on whether the groups behave as a synergistic unit
or as a collective of individuals (Cao, Leung, & Law, 2008). Barzilai and Golany (1994)
argue, however, that both the approaches generate very similar results (Barzilai & Golany,
1994).
In this study, the AIP is applied by aggregating individual priorities in each level
of the hierarchy. Aggregation could be done based on either weighted arithmetic means
or weighted geometric means (Forman & Peniwati, 1998). In this study, the weighted
geometric mean method is applied for three reasons: (a) the geometric mean method
satisfies both the unanimity condition (Pareto principle) and the homogeneity condition
(Saaty, 1990); (b) the geometric mean method preserves the symmetric structure of the
judgment matrix; and (c) the arithmetic mean method overestimates the group priorities
when individual priorities are high (Ishizaka, Balkenborg, & Kaplan, 2009). The derived
aggregated priorities are then normalised for each hierarchy level, such that their sums
equal unity (1).
4.4 Qualitative approach: Case study method
4.4.1 Case study method and its rationale
The case study method is widely used in social science research. It is a useful
method for developing a rich and comprehensive understanding of organisations,
programs or projects, processes, institutions and events (Osei-Kyei, 2017; Yin, 2014). In
the case study, an investigator has no control over a contemporary set of events and
attempts to explore in depth the materials related to each case and, where relevant, by
including comparisons to multiple cases of a similar nature. Furthermore, using the case
study method is appropriate where a unique situation prevails and has not been a subject
of detailed and systematic investigation previously (Liyanage & Villalba-Romero, 2015;
98
Yin, 2014). However, the case study approach has some limitations when it uses a single
case that is inadequate in generalising a conclusion. It also lacks rigour and objectivity.
But this approach is recommended in a context where existing theories are inadequate
and where the required data is unavailable. In addition, in our research, the developed
weights (findings in chapter 5) of KPAs and indicators need to be applied to a number of
completed projects to test the effectiveness of this model. Given these circumstances, a
case study method appears to be a useful approach in answering research questions 3 and
4 of this research.
Our main research objective relating to the case study is deriving an actual
performance score for selected power PPPs by applying the developed weights. To
achieve this objective, we adopted an exploratory approach that used in-depth case study
research in the first phase of the case study approach, before applying these weights to
ascertain individual project performance scores. The three objectives resulting from our
application of case study methodology include (1) understanding experiences of power
sector PPPs implemented in different phases since the beginning of such initiatives in
Bangladesh; (2) identifying key performance areas (KPAs) practically important to power
sector PPPs (IPPs) in Bangladesh; and (3) deriving performance scores of completed IPP
projects and analysing them with respect to their implication for IPPs’ contribution to the
sustainable power sector development and the potential challenges to implementing
power PPPs.
4.4.2 Case study process
The case study process in this research started with reviewing the literature and
government documents available about PPPs in Bangladesh. From the understanding of
PPP initiatives in Bangladesh that we had built, we considered that the power sector PPPs
(specifically, Independent power producers—IPPs) would be appropriate for answering
99
RQ3 and RQ4. Detail of the reason for considering power sector PPPs has been stated in
sub-section 4.4.3. We selected six IPPs, based on a set of pre-defined criteria (discussed
in the following sub-section).
For our case study analysis, specific data and information on these six projects
were gathered from different sources, including project annual reports for multiple years,
media reports and commentaries, World Bank reports, project company websites,
environmental report and other independent analysis. To verify its authenticity, the
collected information was cross-checked across multiple sources, especially with reports
of financers (including the Dhaka Stock Exchange) and World Bank. Respective project
spokespersons were also consulted to allow ambiguity of any information to be removed.
This consultation occurred during the administration of a project specific questionnaire
survey used to obtain the perceptions of key project personnel related to individual project
KPA performances. This questionnaire survey, conducted among key spokespersons for
the six selected projects, asked them to provide a score using a Likert scale (1-7 scale) for
each of the performance indicators, based on their perception and experiences in the
project.
We performed a detailed analysis of the contents of the assembled case study
materials in order to understand project experiences that include the objectives of project
implementation, its milestones and financing structures, its achievements and its
important performance indicators. In the second phase of the case study, the developed
weights of KPAs and indicators are applied to the selected IPP projects to derive
performance scores for them.
4.4.3 Case selection: Sector focus, sampled cases and their selection criteria
The power sector executed relatively a higher number of PPP projects since PPP
option emerges, and these projects are perceived to have a good outcome to improve
100
power shortage in the country. Moreover, this sector has a substantial number of
completed projects that are operational and thus considered suitable for performance
evaluation (BPDB Annual Report, 2017). In contrast, other sectors such as transport,
housing, tourism, hospitals and commercial zoning have recently entered into PPP
options (PPP Authority, 2018). Given this background, the power sector PPPs have been
considered for evaluating performance of PPP initiatives.
Careful selection of a set of projects is important to avoid a sampling bias that
might happen in selecting either the most successful projects or the worst performing ones
(Atmo et al., 2017; Raisbeck et al., 2010). Four PPP power projects (IPPs) governed by
the ‘Private Sector Power Generation Policy’ were selected. The remaining two projects,
also independent power projects, are implemented and operated by state-owned
organisations. These two projects are considered critical for an understanding of their
differences, in the form of operations, and of their outcomes.
However, we had to carefully select some specific criteria that may contribute to
an appropriate set of six IPP projects. We selected the following five criteria. (1) Projects
are to be from a different time period of the IPP era. Two early (implemented during
1997-2001) and four recently implemented (during 2015-2016) projects have been
selected. From 2002 to 2011, no projects (IPPs) were implemented. (2) Projects should
be in commercial operation for more than 1.5 years. (3) Projects should allow, relatively
speaking, better access to information and publicly available documents and other
information. (4) Projects should be of a reasonable size, such as a capacity of more than
50MW; (5) Projects should relate to different fuel types to allow for exploration of the
impact of this aspect on project performances.
101
4.5 Ethical consideration
The methodology includes a structured-questionnaire survey by which experts
with the experience of PPP implementation in Bangladesh are asked to know their
judgement on the relative importance of the KPAs and indicators of PPP performance
evaluation. It also includes a project-specific questionnaire for the
managers/representatives from the selected projects to collect their assessment on their
respective project performance based on their experience and project-specific actual
information. Both questionnaires required human involvement in the research process.
So, as per the Griffith University Research Ethics Manual (GUREM), ethical clearance
was obtained. The related approval number is GU Ref No: 2016/718.
4.6 Limitations of the study
Two different approaches have been used as components of the methodology in
this research. The AHP process has been used to develop weightings for the KPAs and
indicators; the case study method has been used to select and come to understand a sample
of completed projects in sufficient depth to usefully apply those weights to derive
performance scores for these projects. Obviously, the limitations of each of these methods
should be recognised.
4.6.1 Limitations of the AHP
The AHP approach has a number of potential limitations. These weaknesses,
discussed in detail in the literature (Harker & Vargas, 1987), include the hierarchy
composition, the scale used to measure the intensity of preferences, the potential selection
bias in choosing respondents and the degree of ambiguity in the questions asked to the
respondents (Manning et al., 2016). Hierarchy configuration is a critical issue when there
are alternatives for a decision and when a decision problem cannot be structured
102
hierarchically because of interactions and dependence between lower- and higher-level
elements. In that case, the analytical network process (ANP) is more useful instead of
AHP (Saaty, 2013). However, as the priorities (weights) are established in ANP in the
same way they are established in AHP, our basic objective in this study would still be
achieved. Hence, a simple configuration of three levels has helped avoid hierarchical
complexities (Manning, 2008).
Regarding the use of the 1-9 scale of measurement, some critics have questioned its
ability to precisely measure the intensity of preferences, but Harker and Vargas (1987)
has analysed this debate and has proved that this scale can accurately represent the
intensity of individual preferences (Manning, 2008). It would be excellent if more
representative sampling could be drawn, covering all sectors entering into PPP options,
such as housing and accommodation, zoning, tourism and textile sectors. Selection of a
substantial number of experienced respondents representing major sectors in Bangladesh
has minimised the selection bias. To ensure that the questions asked in the AHP survey
were fathomable, clear instructions on how to respond to the questions were provided, as
was a verbal clarification of any queries made by respondents.
This model of weighting performance indicators to derive overall performance
scores for particular PPP projects has not been practically tested for a large number of
cases. Therefore, future research could apply this model to a wider range of completed
PPP projects, in order to derive their individual scores in Bangladesh and other
developing countries and to test for the sensitivity of the results to differences in weights.
Moreover, the experts used for deriving our KPA weights were selected from only one
developing country. A wider set of respondents from more developing countries might be
useful and would allow for comparison of KPA weights and overall project scores
between the Bangladesh and other national contexts.
103
4.6.2 Limitations of the case study
The first limitation of the case study would be the lack of generalisability of the
findings from a limited number of cases. Using a case study approach can be argued as
lacking rigor and objectivity (Rowley, 2002). Our study would not be an exception to this
form of criticism. Selecting only six projects might eliminate potentially important
findings that otherwise may be drawn from unattended projects. However, our projects
were carefully selected to avoid the potential loss of any significant information from
other projects. Pre-defined criteria were set for benchmarking the projects based on some
previous similar studies (Atmo & Duffield, 2014; Atmo et al., 2017). In addition, our
study was an exploratory one, used to demonstrate the value of the chosen approach for
deriving performance scores for individual PPPs. Follow-up research would allow
confirmation that the preliminary findings reported in this study would be useful in other
industry and/or national contexts.
Secondly, there is a confidentiality concern to disclose project information
publicly because the disclosure of some information would provide an advantage to
competitors. Projects, such as power PPPs, seem to be relatively sensitive in this respect
in developing countries including Bangladesh. However, information collected was
verified by a cross check with alternative sources, including independent reports and an
analysis of a third party (World Bank, PPI database, environmental reports etc.) to
minimise the potential loss of, or bias in relation to, any critically important information.
Thirdly, in the project-specific questionnaire designed to obtain the scores of
project performance, a spokesperson for each project was asked to provide a score for
their project. However, this person, necessarily a high level official responsible for
operating that project, might be biased in scoring positively for the project since they are
affiliated with it. Obtaining perceptions with regard to key aspects of project performance
104
from such individuals was considered appropriate and the only possible way of obtaining
the information, especially where objective information on performance is unavailable
because of their sensitivity to disclosure, with the exception of project annual reports.
Such annual reports were fully utilised for documenting case experiences, but they needed
to be supplemented by subjective assessments of key project personnel relating to a
number of performance indicators not included in these annual reports.
Fourthly, some of the indicators included in our study may have limited practical
use in evaluating IPP project performance in Bangladesh, or even in other developing
countries. Furthermore, evaluating project performance using these large numbers of
indicators appears difficult, such that a more concise list of indicators may be more
effective for use in evaluating PPP performance in subsequent studies.
The next chapter presents the outcome of the research findings relating to RQ2:
what are the weights of the different KPAs and indicators of PPP performance evaluation
in developing countries and how do these weights differ from developed countries?

105
Chapter Five: Establishing weights of KPAs
and performance indicators of PPPs in
Bangladesh
106
5.1 Introduction
This chapter presents the outcome of research findings related to RQ2: what are
the weights of the different KPAs and indicators of PPP performance evaluation in
developing countries and how do they differ from those of developed countries? In
particular, details for establishing weights are provided, including the design and conduct
of the survey and the respondent selection criteria (Section 5.2). The weights of the KPAs
and performance indicators are established with a reliability analysis (Section 5.3 and
5.4). Finally, a critical discussion of the results derived in this chapter has been made
(Section 5.4).
5.2 Establishing weights for KPAs of PPPs in Bangladesh
5.2.1 Questionnaire survey
An AHP supportive structured questionnaire was used to elicit the pairwise
comparisons made by the experts of PPPs in Bangladesh on the KPAs and indicators of
PPP performance evaluation. In this questionnaire, a semantic scale of 1 to 9 was used to
value the pairwise comparisons. The survey was conducted during the period from
November 2016 to February 2017. Detailed discussion is presented in the following three
sub-sections.
Structure of the questionnaire
The survey questionnaire was designed in two sections. The first section collected
background information that related to the respondents, including types of organisation,
current position and roles in organisation, and working experiences. The second section
was structured into two parts. The first part, which contained eight level-1 KPAs, was
organized to allow respondents to make a pairwise comparison of each KPA over the
other using Saaty’s (1-9) scale. The second part, which outlined indicators and sub-
indicators in levels 2 and 3 of the hierarchy, under each of the KPAs, sought pairwise
107
comparisons in relation to the indicators and sub-indicators (see figure 4.2, chapter 4, for
a depiction of the hierarchy employed in this research).
Respondent selection criteria
Bangladesh, like most other developing countries, has a very limited number of
highly experienced PPP experts. To identify these expert groups, a two-stage sampling
approach was used (Osei-Kyei & Chan, 2017a). In the first stage, a purposive sampling
was employed based on pre-defined criteria that included:
Experience and detailed knowledge of PPP arrangements;
Currently working in one of the PPP projects in Bangladesh;
Experience of training and educating related employees;
Engagement in the regulatory body or public sector authority of PPP projects.
Built on these criteria, profiles and relevant information (e.g., names, contact
details, designation and so on) relating to the potential respondents were gathered from
online and physical sources in relevant organisations and with them a preliminary list was
made. In the second stage, we met a number of selected people from the list, visiting their
offices with the offer of an information session, and then following up with a request for
advice regarding their known peers and others who have experience in PPPs. Some of the
experts recommended by these selected individuals were found to already be included in
the preliminary list. Other names were added to the list at this stage. The final list was
extended to 110 PPP experts (see table 5.1).
These participants belong to organisations such as the national PPP Authority; the
PPP cells in four government divisions; two dedicated infrastructure funding bodies, the
Infrastructure Development Company Ltd (IDCOL) and the Bangladesh Infrastructure
Finance Fund Ltd (BIFFL); one consulting organisation, the Infrastructure Investment
Facilitation Company (IIFC); as well as four leading PPP implementing private
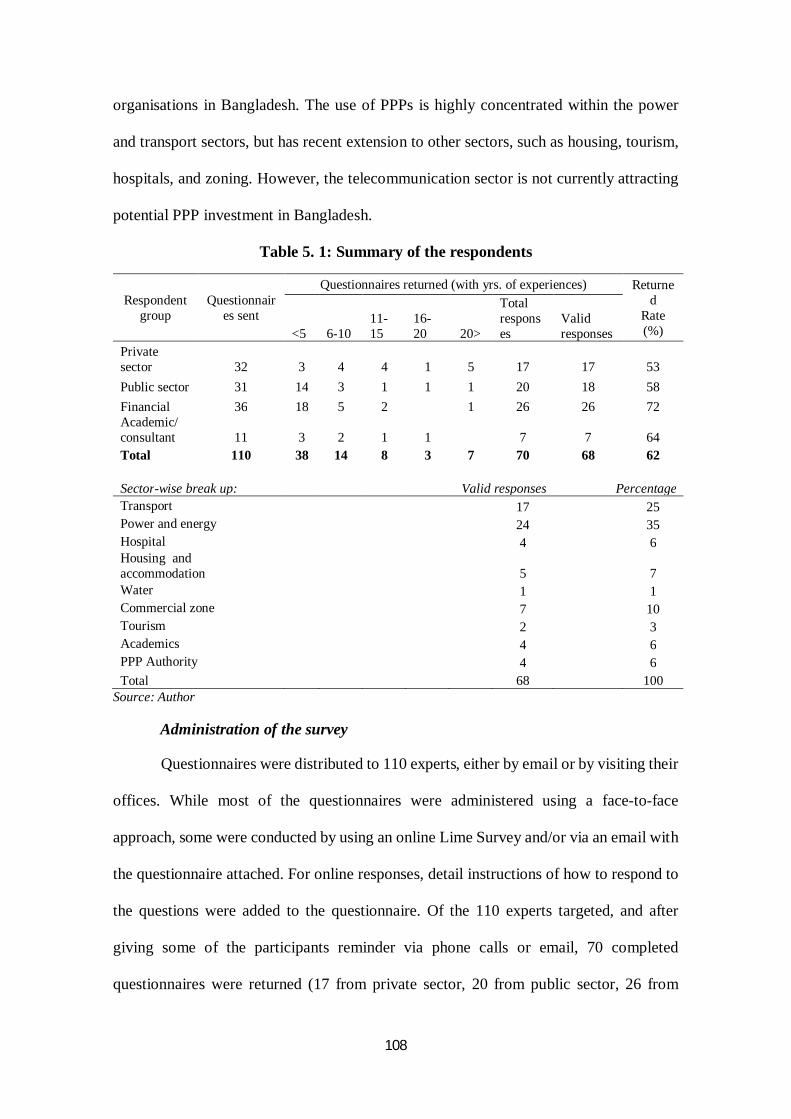
108
organisations in Bangladesh. The use of PPPs is highly concentrated within the power
and transport sectors, but has recent extension to other sectors, such as housing, tourism,
hospitals, and zoning. However, the telecommunication sector is not currently attracting
potential PPP investment in Bangladesh.
Table 5. 1: Summary of the respondents
Respondent group
Questionnaires sent
Questionnaires returned (with yrs. of experiences) Returned
Rate (%) <5 6-10
11-15
16-20 20>
Total responses
Valid responses
Private sector 32 3 4 4 1 5 17 17 53 Public sector 31 14 3 1 1 1 20 18 58 Financial 36 18 5 2 1 26 26 72 Academic/ consultant 11 3 2 1 1 7 7 64 Total 110 38 14 8 3 7 70 68 62 Sector-wise break up: Valid responses Percentage Transport 17 25 Power and energy 24 35 Hospital 4 6 Housing and accommodation 5 7 Water 1 1 Commercial zone 7 10 Tourism 2 3 Academics 4 6 PPP Authority 4 6 Total 68 100
Source: Author
Administration of the survey
Questionnaires were distributed to 110 experts, either by email or by visiting their
offices. While most of the questionnaires were administered using a face-to-face
approach, some were conducted by using an online Lime Survey and/or via an email with
the questionnaire attached. For online responses, detail instructions of how to respond to
the questions were added to the questionnaire. Of the 110 experts targeted, and after
giving some of the participants reminder via phone calls or email, 70 completed
questionnaires were returned (17 from private sector, 20 from public sector, 26 from

109
financial sector and 7 from academic/research organisation). Of these, 68 responses were
considered valid; the remaining two were invalid because of their incompleteness. This
number, 62 percent of the total eligible PPP experts in the country, represents extremely
robust participation for a country like Bangladesh. The highest response rate (72 percent)
was recorded with participants from dedicated PPP financing organisations. The
responses from the public (58 percent) and private sector (53 percent) groups were close
to the average response rate (62 percent). Most of the respondents (76 percent) have
experience of between 1 and 10 years with PPPs, which implies that PPP practitioners are
generally new in terms of experience; PPP practitioners with long-term experience are
extremely rare in the Bangladesh context. Both the sample size and high response rate are
adequate for further analysis: for example, Raisbeck and Tang (2013) used 36 responses;
Ameyaw and Chan (2015), 40 responses; and Elwakil (2017), 63 responses. The
combination of young and experienced practitioners adds to the authenticity and
reliability of the responses. A detailed discussion of the reliability of the expert judgement
is presented in section 5.4.
5.2.2 Calculating and analysing the weights of KPAs
The weights of the KPAs and the indicators are calculated by using the AHP
approach, the details of which have been discussed in chapter 4. Microsoft Excel is
usefully applied for calculating the weights by systematically following the steps of the
AHP. The resultant weights for KPAs are presented in table 5.2 as a normalised priority
vector.
Establishing weights of KPAs and indicators (related to RQ2) using AHP method
(scale of 1 to 9) and assessing performance of the selected projects using Likert scale
(scale of 1 to 7) are two separate things. Since the two purposes are different, the use of
1-9 scale (used in the AHP) in determining weights does not have any problem with using
110
1-7 Likert scale to obtain a comparable performance score of the selected projects. This
might be clearer with the following discussion.
A semantic scale of 1 to 9 was used to make a pair-wise comparison among the
KPAs and indicators to establish weights for them. These weights (numerical values)
show relative importance of the KPAs and indicators in measuring project performances.
The first purpose here ends with establishing weights. These weights are then interacted
with the perceived Likert scaled scores to derive an effective/true score of the KPAs and
indicators. Normalization was then done by averaging the total weighted scores of 37
indicators that are used in the performance measurement process in the selected projects.
The remaining 4 (41-37) indicators are found unused in these projects for PPP
performance measurement and thus dropped from computing their normalized weighted
scores. These results are analysed later in this sub-section and discussed in sub-section
5.5.1.
The analysis of the experts’ judgements suggests that the KPA ‘financing’ (F, with
a weight of 0.176) is considered to be the most important when measuring the
performance of PPPs with respect to developing countries such as Bangladesh. The next,
in order of importance, are the KPAs ‘planning and initiation’ (PI, with 0.162),
‘transparency and accountability’ (TA, with 0.155), ‘tendering’ (T, with 0.108),
‘stakeholder satisfaction’ (SS, with 0.104), ‘construction and operation’ (CO, with 0.101),
‘sustainability of partnerships’ (SP, with 0.099) and ‘socioeconomic development’ (SED,
with 0.095) (see table 5.3). The notable weight difference between the top three KPAs
and the remaining KPAs indicates that the KPA ‘financing’, ‘planning and initiation’, and
‘transparency and accountability’ are considerably more important than the remaining
KPAs for developing countries. While the top KPA, F, received a weight of 0.162, the
least important KPA, SED received a weight of 0.095.
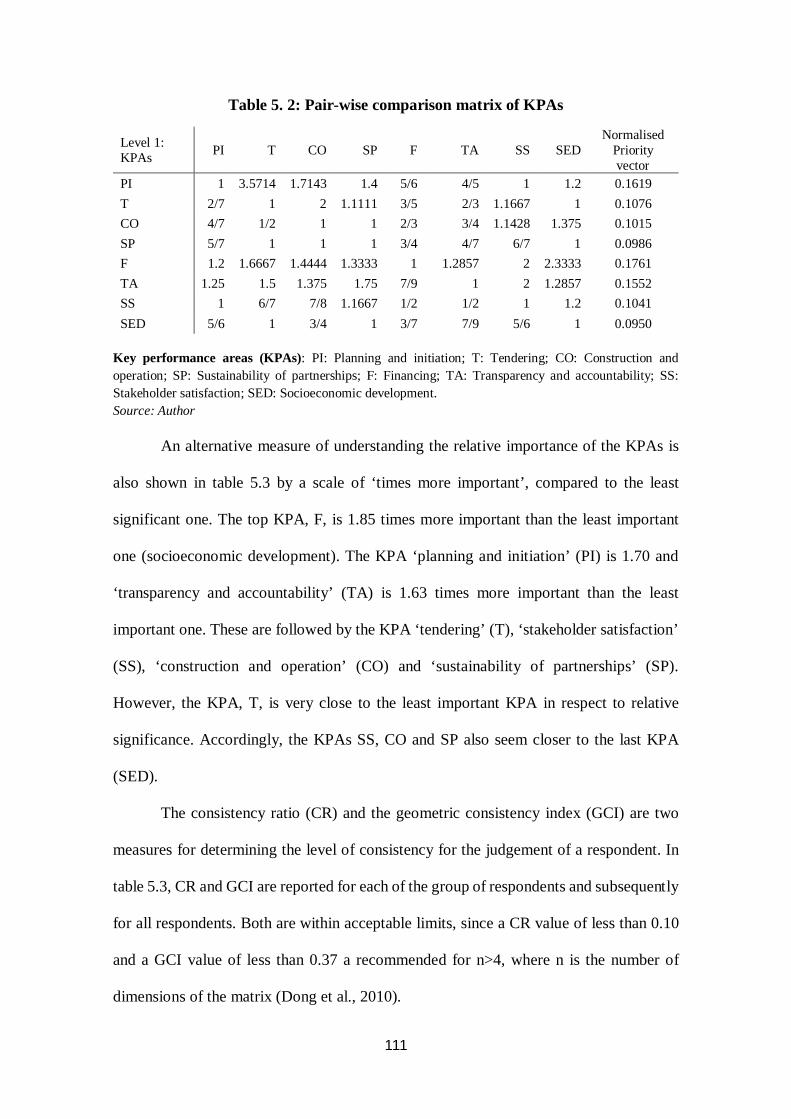
111
Table 5. 2: Pair-wise comparison matrix of KPAs
Level 1: KPAs
PI T CO SP F TA SS SED Normalised
Priority vector
PI 1 3.5714 1.7143 1.4 5/6 4/5 1 1.2 0.1619 T 2/7 1 2 1.1111 3/5 2/3 1.1667 1 0.1076 CO 4/7 1/2 1 1 2/3 3/4 1.1428 1.375 0.1015 SP 5/7 1 1 1 3/4 4/7 6/7 1 0.0986 F 1.2 1.6667 1.4444 1.3333 1 1.2857 2 2.3333 0.1761 TA 1.25 1.5 1.375 1.75 7/9 1 2 1.2857 0.1552 SS 1 6/7 7/8 1.1667 1/2 1/2 1 1.2 0.1041 SED 5/6 1 3/4 1 3/7 7/9 5/6 1 0.0950
Key performance areas (KPAs): PI: Planning and initiation; T: Tendering; CO: Construction and operation; SP: Sustainability of partnerships; F: Financing; TA: Transparency and accountability; SS: Stakeholder satisfaction; SED: Socioeconomic development. Source: Author
An alternative measure of understanding the relative importance of the KPAs is
also shown in table 5.3 by a scale of ‘times more important’, compared to the least
significant one. The top KPA, F, is 1.85 times more important than the least important
one (socioeconomic development). The KPA ‘planning and initiation’ (PI) is 1.70 and
‘transparency and accountability’ (TA) is 1.63 times more important than the least
important one. These are followed by the KPA ‘tendering’ (T), ‘stakeholder satisfaction’
(SS), ‘construction and operation’ (CO) and ‘sustainability of partnerships’ (SP).
However, the KPA, T, is very close to the least important KPA in respect to relative
significance. Accordingly, the KPAs SS, CO and SP also seem closer to the last KPA
(SED).
The consistency ratio (CR) and the geometric consistency index (GCI) are two
measures for determining the level of consistency for the judgement of a respondent. In
table 5.3, CR and GCI are reported for each of the group of respondents and subsequently
for all respondents. Both are within acceptable limits, since a CR value of less than 0.10
and a GCI value of less than 0.37 a recommended for n>4, where n is the number of
dimensions of the matrix (Dong et al., 2010).
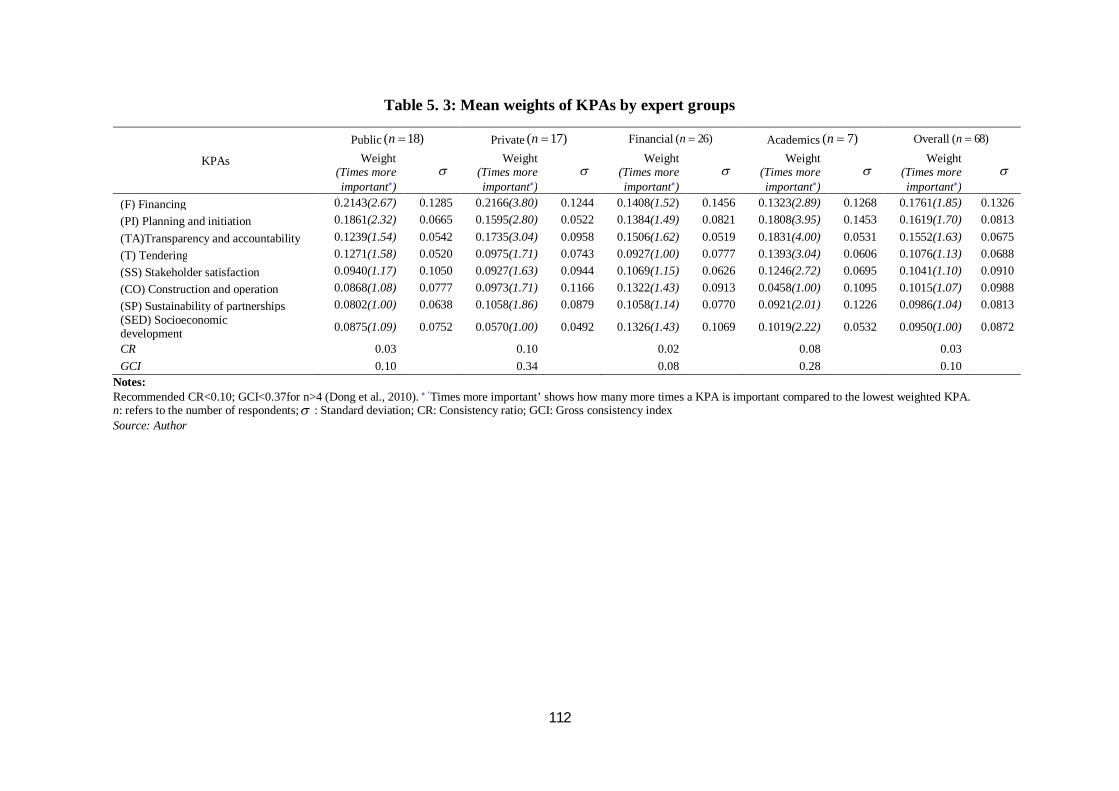
112
Table 5. 3: Mean weights of KPAs by expert groups
KPAs
Public Private Financial Academics Overall Weight
(Times more important)
Weight
(Times more important)
Weight
(Times more important)
Weight
(Times more important)
Weight
(Times more important)
(F) Financing 0.2143(2.67) 0.1285 0.2166(3.80) 0.1244 0.1408(1.52) 0.1456 0.1323(2.89) 0.1268 0.1761(1.85) 0.1326 (PI) Planning and initiation 0.1861(2.32) 0.0665 0.1595(2.80) 0.0522 0.1384(1.49) 0.0821 0.1808(3.95) 0.1453 0.1619(1.70) 0.0813 (TA)Transparency and accountability 0.1239(1.54) 0.0542 0.1735(3.04) 0.0958 0.1506(1.62) 0.0519 0.1831(4.00) 0.0531 0.1552(1.63) 0.0675 (T) Tendering 0.1271(1.58) 0.0520 0.0975(1.71) 0.0743 0.0927(1.00) 0.0777 0.1393(3.04) 0.0606 0.1076(1.13) 0.0688 (SS) Stakeholder satisfaction 0.0940(1.17) 0.1050 0.0927(1.63) 0.0944 0.1069(1.15) 0.0626 0.1246(2.72) 0.0695 0.1041(1.10) 0.0910 (CO) Construction and operation 0.0868(1.08) 0.0777 0.0973(1.71) 0.1166 0.1322(1.43) 0.0913 0.0458(1.00) 0.1095 0.1015(1.07) 0.0988 (SP) Sustainability of partnerships 0.0802(1.00) 0.0638 0.1058(1.86) 0.0879 0.1058(1.14) 0.0770 0.0921(2.01) 0.1226 0.0986(1.04) 0.0813 (SED) Socioeconomic development 0.0875(1.09) 0.0752 0.0570(1.00) 0.0492 0.1326(1.43) 0.1069 0.1019(2.22) 0.0532 0.0950(1.00) 0.0872
CR 0.03 0.10 0.02 0.08 0.03 GCI 0.10 0.34 0.08 0.28 0.10
Notes: Recommended CR<0.10; GCI<0.37for n>4 (Dong et al., 2010). ‘Times more important’ shows how many more times a KPA is important compared to the lowest weighted KPA. n: refers to the number of respondents; : Standard deviation; CR: Consistency ratio; GCI: Gross consistency index Source: Author
( 18)n ( 17)n ( 26)n ( 7)n ( 68)n
113
5.2.3 Comparative analysis and ANOVA test
Comparative analysis
A comparative analysis among the four expert groups, as shown in figure 5.1,
reveals that both the private and public sector experts consider KPA ‘financing’ (F, with
a weight of 0.2166 and 0.2143 respectively) to be the most important area responsible for
measuring PPP performance, while finance and academic experts consider that
‘transparency and accountability’ (TA) is the most important KPA (0.1506 and 0.1831).
In determining the second most important KPA, the public sector experts and the
academics agreed on KPA ‘planning and initiation’ (PI), while the private sector and the
finance experts disagreed. The private sector experts ranked ‘tendering’ (T) to be second
most important KPA, while the finance experts ranked ‘financing’ (F) in that position.
The public, private and academic groups considered KPA ‘tendering’ (T) to be
moderately significant in evaluating PPP performances, but the financial group perceived
it to be the least significant KPA, probably because financiers in PPPs are less concerned
about the tendering process itself and are more interested in the business potentiality of
PPPs. ‘Stakeholder satisfaction’ (SS) appears to be a KPA that is equally significant to
both the public and private sector respondents, but is less important to academics and
financial respondents. This might be associated with the degree of involvement of both
sectors in partnerships, while the academic and financial groups seem to be less sensitive
to the satisfaction of the stakeholders.
These four groups have also demonstrated diversity when considering which KPA
is to be the least significant. Private sector respondents consider ‘socioeconomic
development’ (SED) to be the least important KPA while public sector respondents
perceived sustainability of partnerships (SP) to be the least significant. In other words,
the public sector respondents seem to be more interested in the socioeconomic
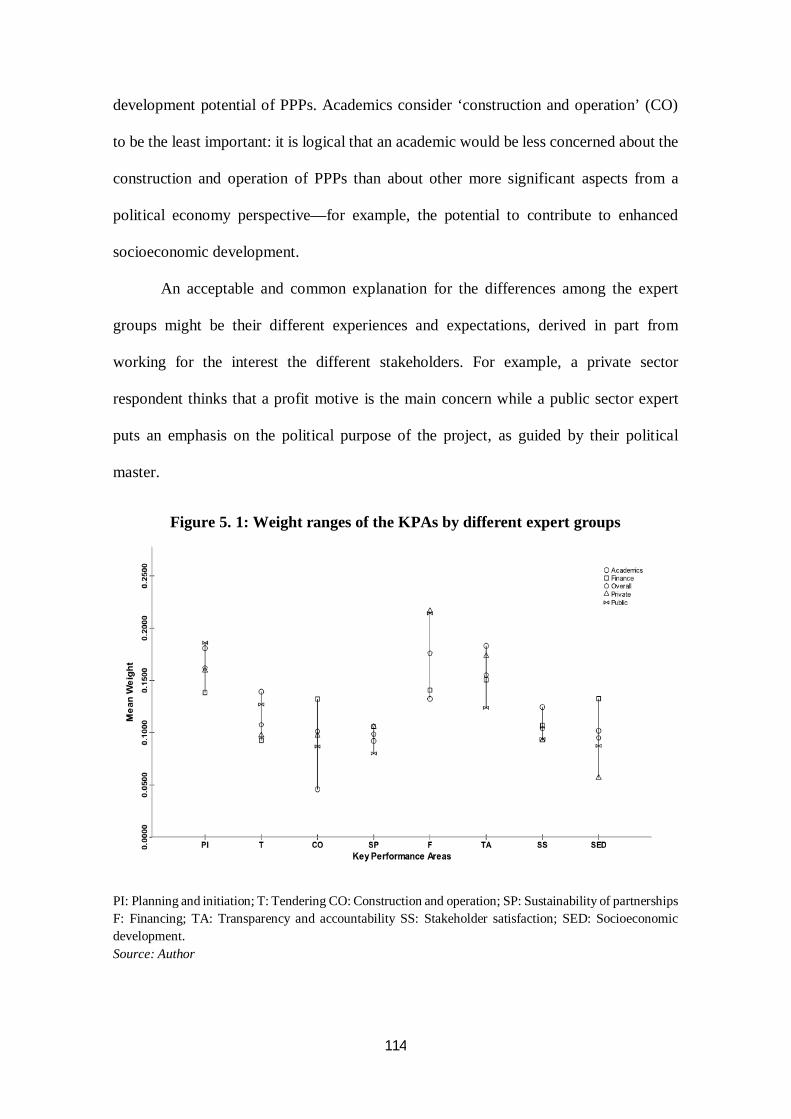
114
development potential of PPPs. Academics consider ‘construction and operation’ (CO)
to be the least important: it is logical that an academic would be less concerned about the
construction and operation of PPPs than about other more significant aspects from a
political economy perspective—for example, the potential to contribute to enhanced
socioeconomic development.
An acceptable and common explanation for the differences among the expert
groups might be their different experiences and expectations, derived in part from
working for the interest the different stakeholders. For example, a private sector
respondent thinks that a profit motive is the main concern while a public sector expert
puts an emphasis on the political purpose of the project, as guided by their political
master.
Figure 5. 1: Weight ranges of the KPAs by different expert groups
PI: Planning and initiation; T: Tendering CO: Construction and operation; SP: Sustainability of partnerships F: Financing; TA: Transparency and accountability SS: Stakeholder satisfaction; SED: Socioeconomic development. Source: Author
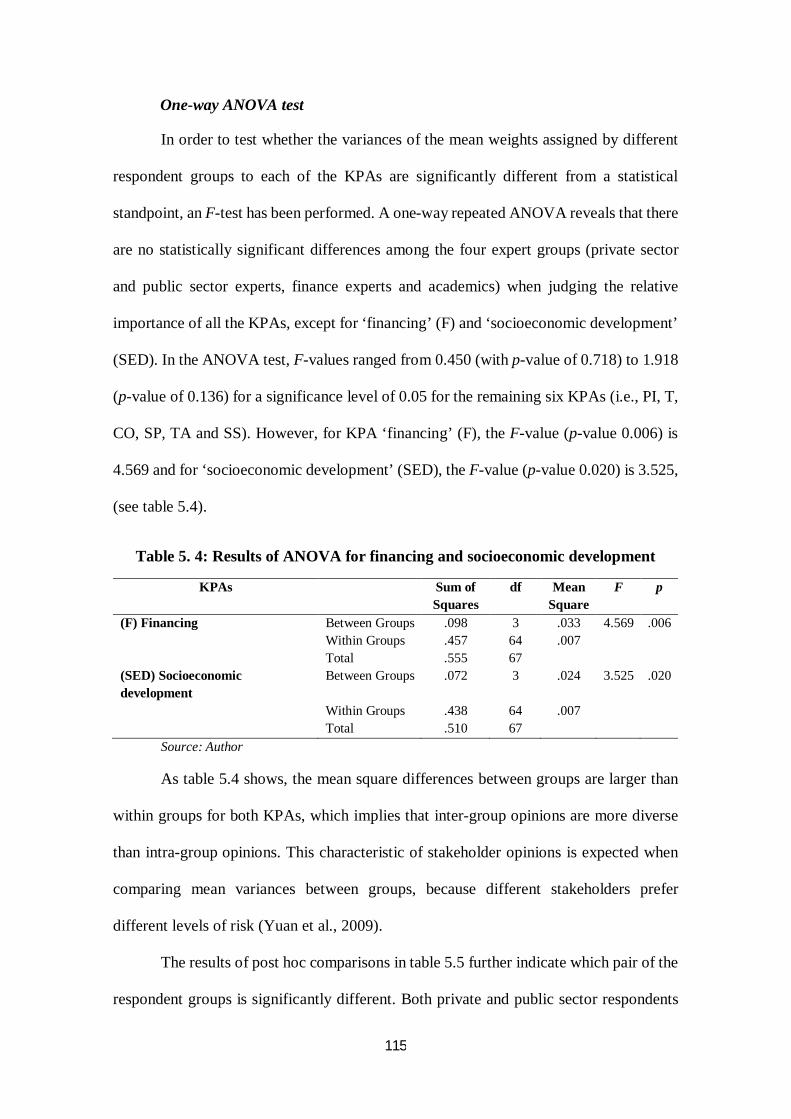
115
One-way ANOVA test
In order to test whether the variances of the mean weights assigned by different
respondent groups to each of the KPAs are significantly different from a statistical
standpoint, an F-test has been performed. A one-way repeated ANOVA reveals that there
are no statistically significant differences among the four expert groups (private sector
and public sector experts, finance experts and academics) when judging the relative
importance of all the KPAs, except for ‘financing’ (F) and ‘socioeconomic development’
(SED). In the ANOVA test, F-values ranged from 0.450 (with p-value of 0.718) to 1.918
(p-value of 0.136) for a significance level of 0.05 for the remaining six KPAs (i.e., PI, T,
CO, SP, TA and SS). However, for KPA ‘financing’ (F), the F-value (p-value 0.006) is
4.569 and for ‘socioeconomic development’ (SED), the F-value (p-value 0.020) is 3.525,
(see table 5.4).
Table 5. 4: Results of ANOVA for financing and socioeconomic development
KPAs Sum of Squares
df Mean Square
F p
(F) Financing Between Groups .098 3 .033 4.569 .006 Within Groups .457 64 .007 Total .555 67 (SED) Socioeconomic development
Between Groups .072 3 .024 3.525 .020
Within Groups .438 64 .007 Total .510 67
Source: Author
As table 5.4 shows, the mean square differences between groups are larger than
within groups for both KPAs, which implies that inter-group opinions are more diverse
than intra-group opinions. This characteristic of stakeholder opinions is expected when
comparing mean variances between groups, because different stakeholders prefer
different levels of risk (Yuan et al., 2009).
The results of post hoc comparisons in table 5.5 further indicate which pair of the
respondent groups is significantly different. Both private and public sector respondents
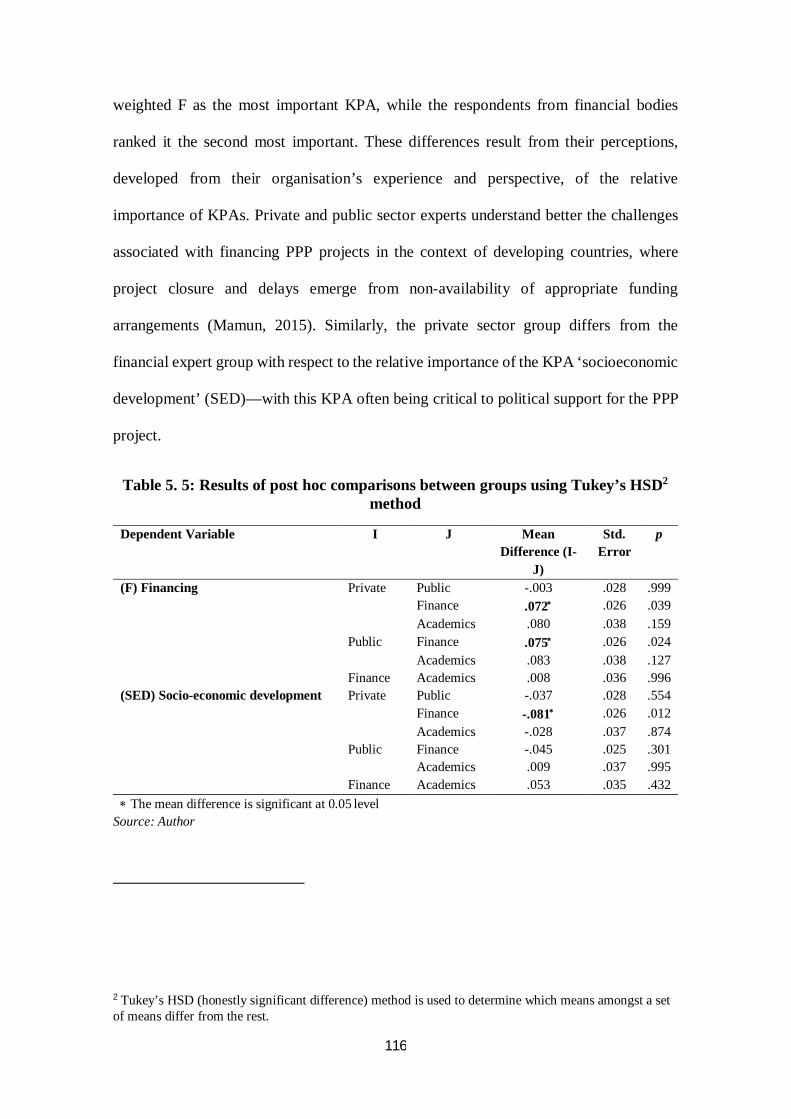
116
weighted F as the most important KPA, while the respondents from financial bodies
ranked it the second most important. These differences result from their perceptions,
developed from their organisation’s experience and perspective, of the relative
importance of KPAs. Private and public sector experts understand better the challenges
associated with financing PPP projects in the context of developing countries, where
project closure and delays emerge from non-availability of appropriate funding
arrangements (Mamun, 2015). Similarly, the private sector group differs from the
financial expert group with respect to the relative importance of the KPA ‘socioeconomic
development’ (SED)—with this KPA often being critical to political support for the PPP
project.
Table 5. 5: Results of post hoc comparisons between groups using Tukey’s HSD2 method
Dependent Variable I J Mean Difference (I-
J)
Std. Error
p
(F) Financing Private Public -.003 .028 .999 Finance .072 .026 .039 Academics .080 .038 .159 Public Finance .075 .026 .024 Academics .083 .038 .127 Finance Academics .008 .036 .996 (SED) Socio-economic development Private Public -.037 .028 .554 Finance -.081 .026 .012 Academics -.028 .037 .874 Public Finance -.045 .025 .301 Academics .009 .037 .995 Finance Academics .053 .035 .432 The mean difference is significant at 0.05 level
Source: Author
2 Tukey’s HSD (honestly significant difference) method is used to determine which means amongst a set of means differ from the rest.
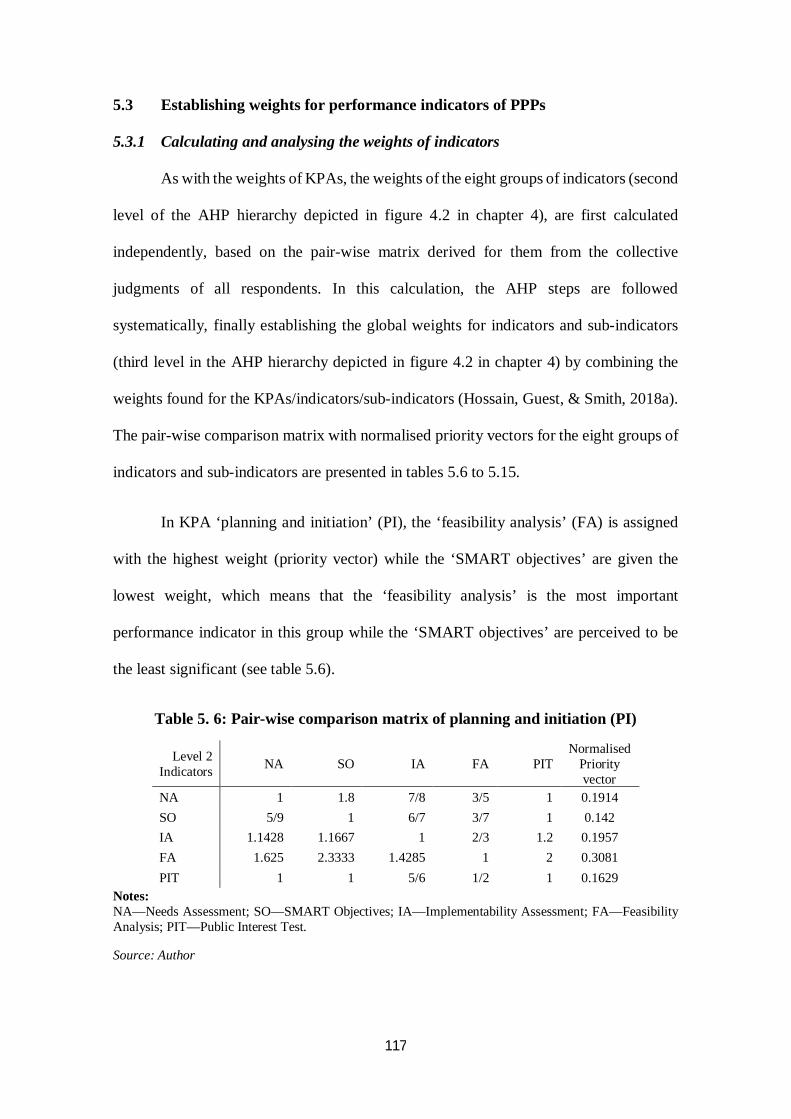
117
5.3 Establishing weights for performance indicators of PPPs
5.3.1 Calculating and analysing the weights of indicators
As with the weights of KPAs, the weights of the eight groups of indicators (second
level of the AHP hierarchy depicted in figure 4.2 in chapter 4), are first calculated
independently, based on the pair-wise matrix derived for them from the collective
judgments of all respondents. In this calculation, the AHP steps are followed
systematically, finally establishing the global weights for indicators and sub-indicators
(third level in the AHP hierarchy depicted in figure 4.2 in chapter 4) by combining the
weights found for the KPAs/indicators/sub-indicators (Hossain, Guest, & Smith, 2018a).
The pair-wise comparison matrix with normalised priority vectors for the eight groups of
indicators and sub-indicators are presented in tables 5.6 to 5.15.
In KPA ‘planning and initiation’ (PI), the ‘feasibility analysis’ (FA) is assigned
with the highest weight (priority vector) while the ‘SMART objectives’ are given the
lowest weight, which means that the ‘feasibility analysis’ is the most important
performance indicator in this group while the ‘SMART objectives’ are perceived to be
the least significant (see table 5.6).
Table 5. 6: Pair-wise comparison matrix of planning and initiation (PI)
Level 2 Indicators NA SO IA FA PIT
Normalised Priority vector
NA 1 1.8 7/8 3/5 1 0.1914 SO 5/9 1 6/7 3/7 1 0.142 IA 1.1428 1.1667 1 2/3 1.2 0.1957 FA 1.625 2.3333 1.4285 1 2 0.3081 PIT 1 1 5/6 1/2 1 0.1629
Notes: NA—Needs Assessment; SO—SMART Objectives; IA—Implementability Assessment; FA—Feasibility Analysis; PIT—Public Interest Test.
Source: Author
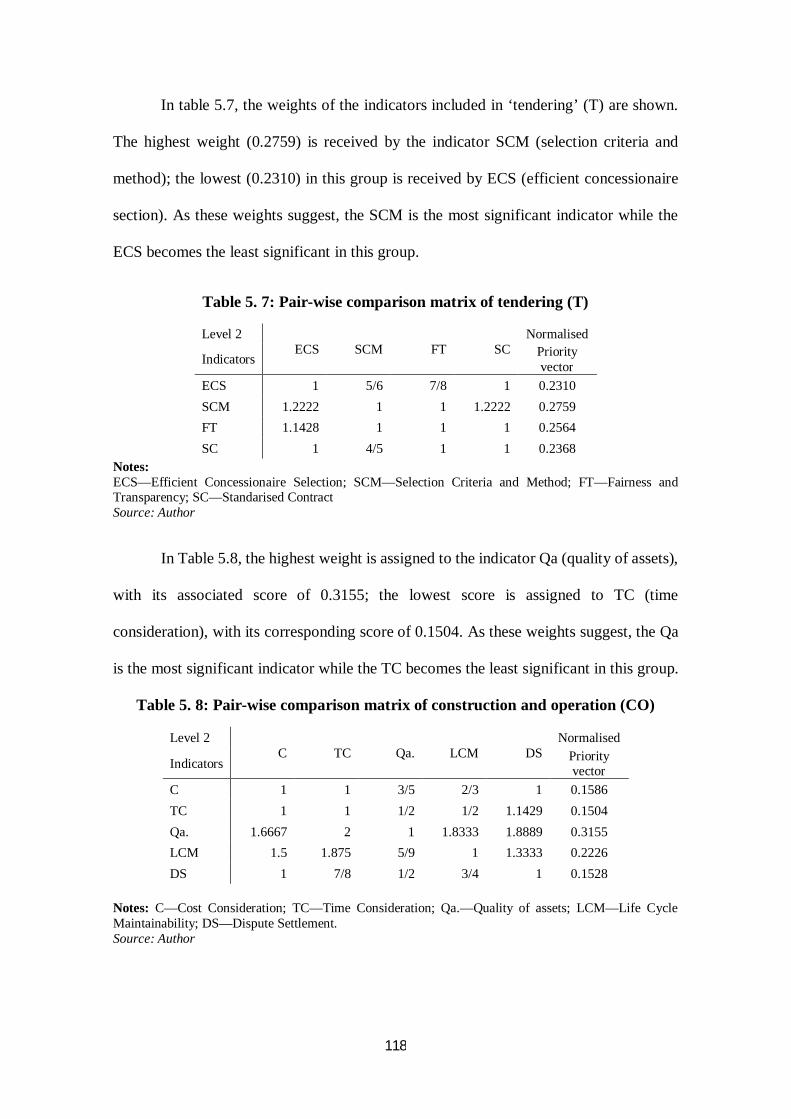
118
In table 5.7, the weights of the indicators included in ‘tendering’ (T) are shown.
The highest weight (0.2759) is received by the indicator SCM (selection criteria and
method); the lowest (0.2310) in this group is received by ECS (efficient concessionaire
section). As these weights suggest, the SCM is the most significant indicator while the
ECS becomes the least significant in this group.
Table 5. 7: Pair-wise comparison matrix of tendering (T)
Level 2 ECS SCM FT SC
Normalised
Indicators Priority vector
ECS 1 5/6 7/8 1 0.2310 SCM 1.2222 1 1 1.2222 0.2759 FT 1.1428 1 1 1 0.2564 SC 1 4/5 1 1 0.2368
Notes: ECS—Efficient Concessionaire Selection; SCM—Selection Criteria and Method; FT—Fairness and Transparency; SC—Standarised Contract Source: Author
In Table 5.8, the highest weight is assigned to the indicator Qa (quality of assets),
with its associated score of 0.3155; the lowest score is assigned to TC (time
consideration), with its corresponding score of 0.1504. As these weights suggest, the Qa
is the most significant indicator while the TC becomes the least significant in this group.
Table 5. 8: Pair-wise comparison matrix of construction and operation (CO)
Level 2 C TC Qa. LCM DS
Normalised
Indicators Priority vector
C 1 1 3/5 2/3 1 0.1586 TC 1 1 1/2 1/2 1.1429 0.1504 Qa. 1.6667 2 1 1.8333 1.8889 0.3155 LCM 1.5 1.875 5/9 1 1.3333 0.2226 DS 1 7/8 1/2 3/4 1 0.1528
Notes: C—Cost Consideration; TC—Time Consideration; Qa.—Quality of assets; LCM—Life Cycle Maintainability; DS—Dispute Settlement. Source: Author
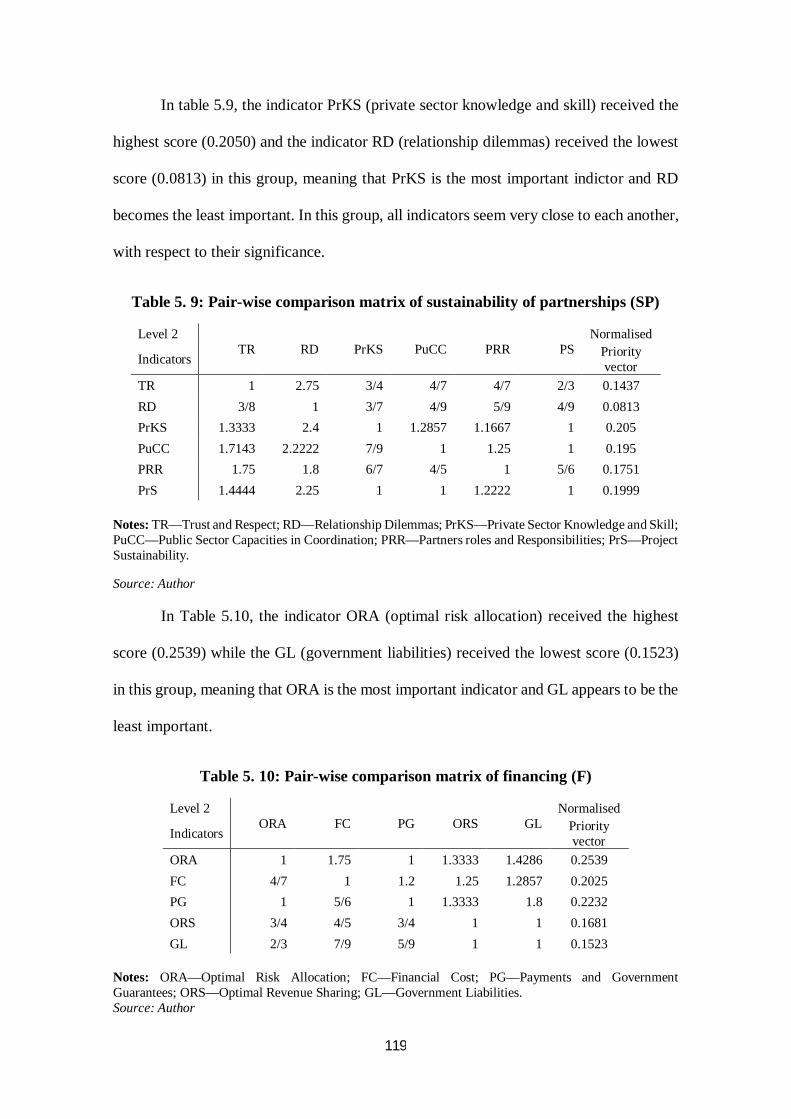
119
In table 5.9, the indicator PrKS (private sector knowledge and skill) received the
highest score (0.2050) and the indicator RD (relationship dilemmas) received the lowest
score (0.0813) in this group, meaning that PrKS is the most important indictor and RD
becomes the least important. In this group, all indicators seem very close to each another,
with respect to their significance.
Table 5. 9: Pair-wise comparison matrix of sustainability of partnerships (SP)
Level 2 TR RD PrKS PuCC PRR PS
Normalised
Indicators Priority vector
TR 1 2.75 3/4 4/7 4/7 2/3 0.1437 RD 3/8 1 3/7 4/9 5/9 4/9 0.0813 PrKS 1.3333 2.4 1 1.2857 1.1667 1 0.205 PuCC 1.7143 2.2222 7/9 1 1.25 1 0.195 PRR 1.75 1.8 6/7 4/5 1 5/6 0.1751 PrS 1.4444 2.25 1 1 1.2222 1 0.1999
Notes: TR—Trust and Respect; RD—Relationship Dilemmas; PrKS—Private Sector Knowledge and Skill; PuCC—Public Sector Capacities in Coordination; PRR—Partners roles and Responsibilities; PrS—Project Sustainability.
Source: Author
In Table 5.10, the indicator ORA (optimal risk allocation) received the highest
score (0.2539) while the GL (government liabilities) received the lowest score (0.1523)
in this group, meaning that ORA is the most important indicator and GL appears to be the
least important.
Table 5. 10: Pair-wise comparison matrix of financing (F)
Level 2 ORA FC PG ORS GL
Normalised
Indicators Priority vector
ORA 1 1.75 1 1.3333 1.4286 0.2539 FC 4/7 1 1.2 1.25 1.2857 0.2025 PG 1 5/6 1 1.3333 1.8 0.2232 ORS 3/4 4/5 3/4 1 1 0.1681 GL 2/3 7/9 5/9 1 1 0.1523
Notes: ORA—Optimal Risk Allocation; FC—Financial Cost; PG—Payments and Government Guarantees; ORS—Optimal Revenue Sharing; GL—Government Liabilities. Source: Author
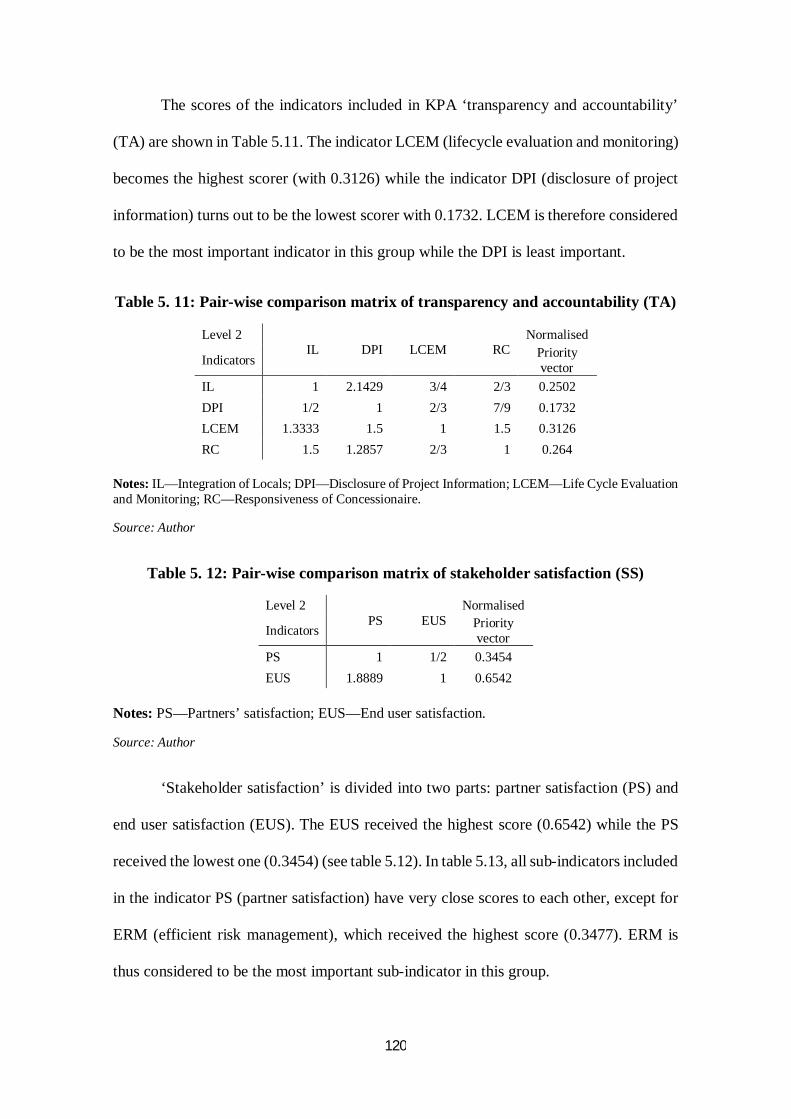
120
The scores of the indicators included in KPA ‘transparency and accountability’
(TA) are shown in Table 5.11. The indicator LCEM (lifecycle evaluation and monitoring)
becomes the highest scorer (with 0.3126) while the indicator DPI (disclosure of project
information) turns out to be the lowest scorer with 0.1732. LCEM is therefore considered
to be the most important indicator in this group while the DPI is least important.
Table 5. 11: Pair-wise comparison matrix of transparency and accountability (TA)
Level 2 IL DPI LCEM RC
Normalised
Indicators Priority vector
IL 1 2.1429 3/4 2/3 0.2502 DPI 1/2 1 2/3 7/9 0.1732 LCEM 1.3333 1.5 1 1.5 0.3126 RC 1.5 1.2857 2/3 1 0.264
Notes: IL—Integration of Locals; DPI—Disclosure of Project Information; LCEM—Life Cycle Evaluation and Monitoring; RC—Responsiveness of Concessionaire.
Source: Author
Table 5. 12: Pair-wise comparison matrix of stakeholder satisfaction (SS)
Level 2 PS EUS
Normalised
Indicators Priority vector
PS 1 1/2 0.3454 EUS 1.8889 1 0.6542
Notes: PS—Partners’ satisfaction; EUS—End user satisfaction.
Source: Author
‘Stakeholder satisfaction’ is divided into two parts: partner satisfaction (PS) and
end user satisfaction (EUS). The EUS received the highest score (0.6542) while the PS
received the lowest one (0.3454) (see table 5.12). In table 5.13, all sub-indicators included
in the indicator PS (partner satisfaction) have very close scores to each other, except for
ERM (efficient risk management), which received the highest score (0.3477). ERM is
thus considered to be the most important sub-indicator in this group.
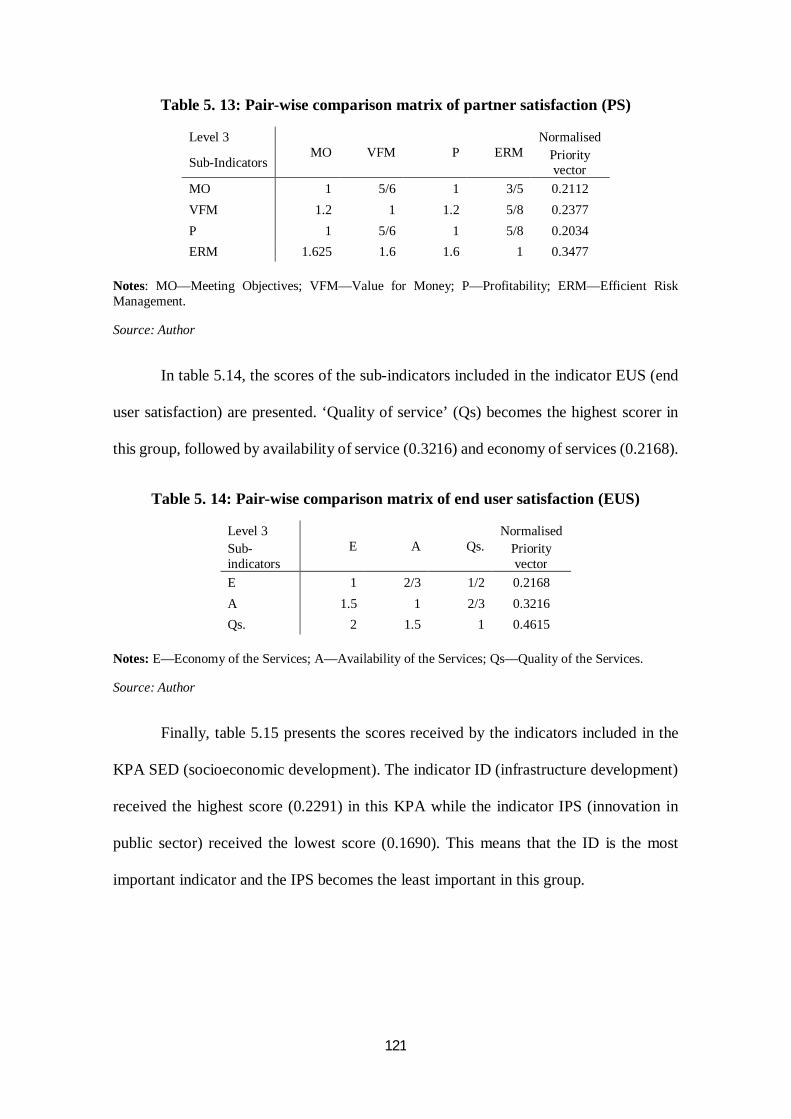
121
Table 5. 13: Pair-wise comparison matrix of partner satisfaction (PS)
Level 3 MO VFM P ERM
Normalised
Sub-Indicators Priority vector
MO 1 5/6 1 3/5 0.2112 VFM 1.2 1 1.2 5/8 0.2377 P 1 5/6 1 5/8 0.2034 ERM 1.625 1.6 1.6 1 0.3477
Notes: MO—Meeting Objectives; VFM—Value for Money; P—Profitability; ERM—Efficient Risk Management.
Source: Author
In table 5.14, the scores of the sub-indicators included in the indicator EUS (end
user satisfaction) are presented. ‘Quality of service’ (Qs) becomes the highest scorer in
this group, followed by availability of service (0.3216) and economy of services (0.2168).
Table 5. 14: Pair-wise comparison matrix of end user satisfaction (EUS)
Level 3 E A Qs.
Normalised Sub-indicators
Priority vector
E 1 2/3 1/2 0.2168 A 1.5 1 2/3 0.3216 Qs. 2 1.5 1 0.4615
Notes: E—Economy of the Services; A—Availability of the Services; Qs—Quality of the Services.
Source: Author
Finally, table 5.15 presents the scores received by the indicators included in the
KPA SED (socioeconomic development). The indicator ID (infrastructure development)
received the highest score (0.2291) in this KPA while the indicator IPS (innovation in
public sector) received the lowest score (0.1690). This means that the ID is the most
important indicator and the IPS becomes the least important in this group.
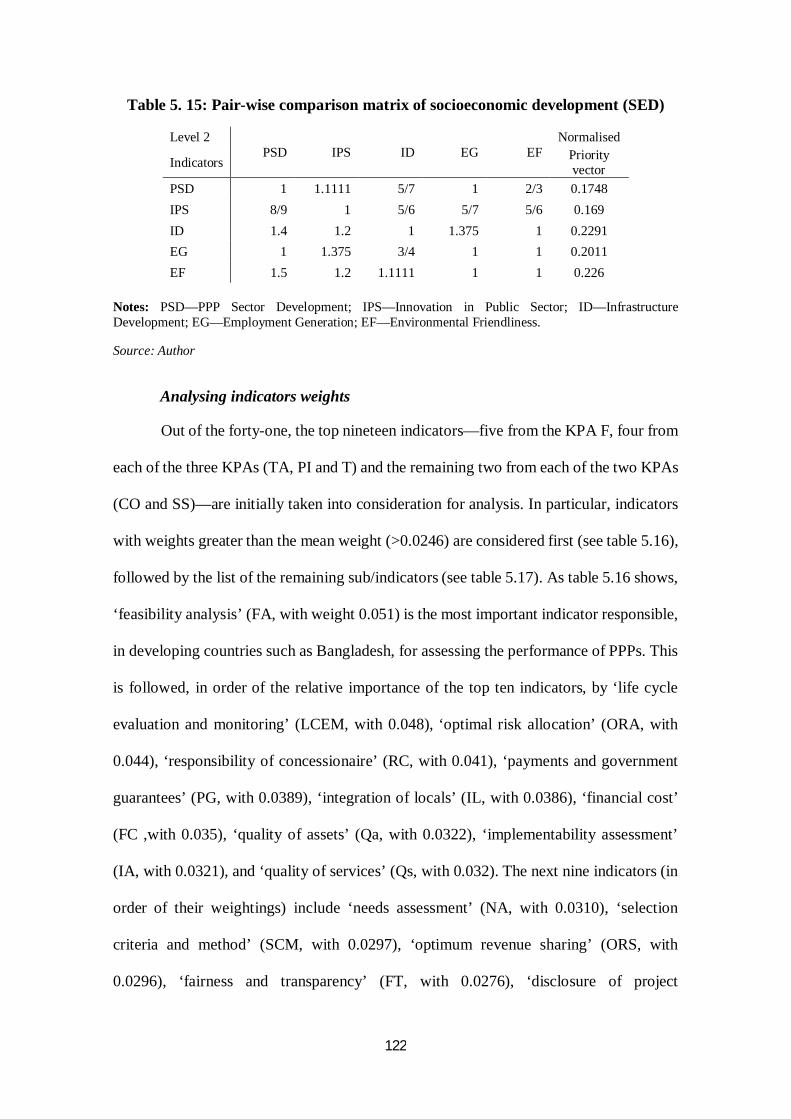
122
Table 5. 15: Pair-wise comparison matrix of socioeconomic development (SED)
Level 2 PSD IPS ID EG EF
Normalised
Indicators Priority vector
PSD 1 1.1111 5/7 1 2/3 0.1748 IPS 8/9 1 5/6 5/7 5/6 0.169 ID 1.4 1.2 1 1.375 1 0.2291 EG 1 1.375 3/4 1 1 0.2011 EF 1.5 1.2 1.1111 1 1 0.226
Notes: PSD—PPP Sector Development; IPS—Innovation in Public Sector; ID—Infrastructure Development; EG—Employment Generation; EF—Environmental Friendliness.
Source: Author
Analysing indicators weights
Out of the forty-one, the top nineteen indicators—five from the KPA F, four from
each of the three KPAs (TA, PI and T) and the remaining two from each of the two KPAs
(CO and SS)—are initially taken into consideration for analysis. In particular, indicators
with weights greater than the mean weight (>0.0246) are considered first (see table 5.16),
followed by the list of the remaining sub/indicators (see table 5.17). As table 5.16 shows,
‘feasibility analysis’ (FA, with weight 0.051) is the most important indicator responsible,
in developing countries such as Bangladesh, for assessing the performance of PPPs. This
is followed, in order of the relative importance of the top ten indicators, by ‘life cycle
evaluation and monitoring’ (LCEM, with 0.048), ‘optimal risk allocation’ (ORA, with
0.044), ‘responsibility of concessionaire’ (RC, with 0.041), ‘payments and government
guarantees’ (PG, with 0.0389), ‘integration of locals’ (IL, with 0.0386), ‘financial cost’
(FC ,with 0.035), ‘quality of assets’ (Qa, with 0.0322), ‘implementability assessment’
(IA, with 0.0321), and ‘quality of services’ (Qs, with 0.032). The next nine indicators (in
order of their weightings) include ‘needs assessment’ (NA, with 0.0310), ‘selection
criteria and method’ (SCM, with 0.0297), ‘optimum revenue sharing’ (ORS, with
0.0296), ‘fairness and transparency’ (FT, with 0.0276), ‘disclosure of project
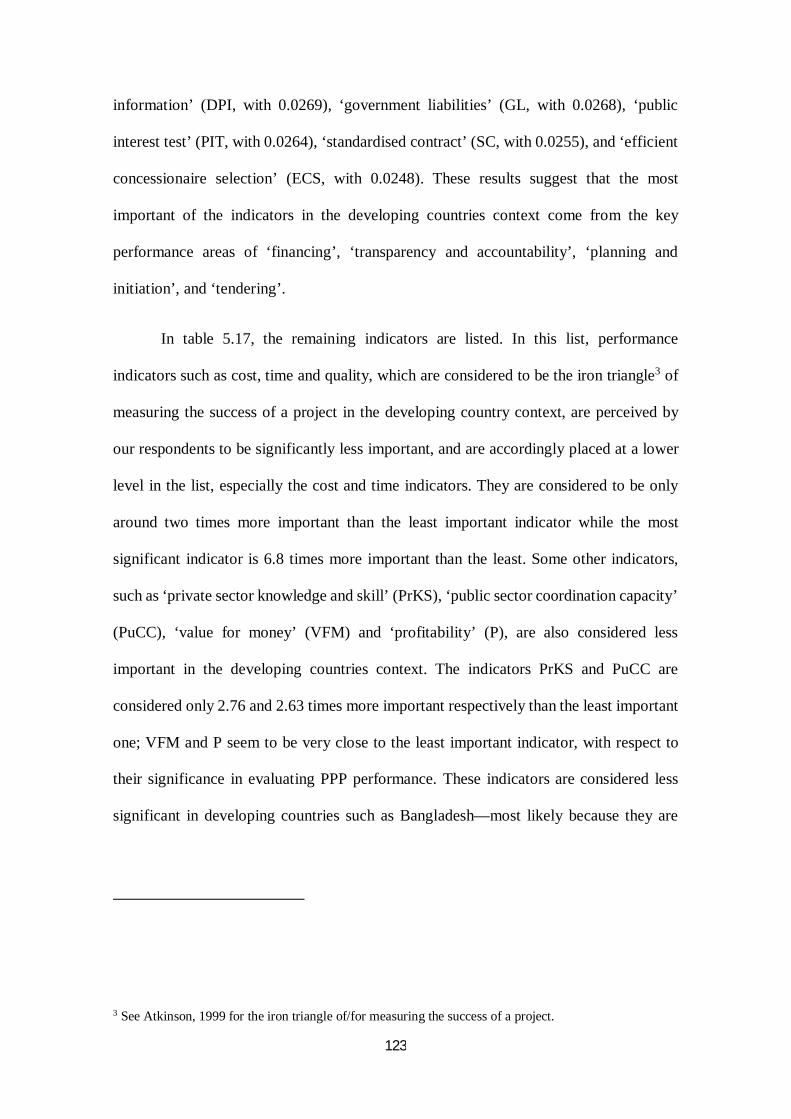
123
information’ (DPI, with 0.0269), ‘government liabilities’ (GL, with 0.0268), ‘public
interest test’ (PIT, with 0.0264), ‘standardised contract’ (SC, with 0.0255), and ‘efficient
concessionaire selection’ (ECS, with 0.0248). These results suggest that the most
important of the indicators in the developing countries context come from the key
performance areas of ‘financing’, ‘transparency and accountability’, ‘planning and
initiation’, and ‘tendering’.
In table 5.17, the remaining indicators are listed. In this list, performance
indicators such as cost, time and quality, which are considered to be the iron triangle3 of
measuring the success of a project in the developing country context, are perceived by
our respondents to be significantly less important, and are accordingly placed at a lower
level in the list, especially the cost and time indicators. They are considered to be only
around two times more important than the least important indicator while the most
significant indicator is 6.8 times more important than the least. Some other indicators,
such as ‘private sector knowledge and skill’ (PrKS), ‘public sector coordination capacity’
(PuCC), ‘value for money’ (VFM) and ‘profitability’ (P), are also considered less
important in the developing countries context. The indicators PrKS and PuCC are
considered only 2.76 and 2.63 times more important respectively than the least important
one; VFM and P seem to be very close to the least important indicator, with respect to
their significance in evaluating PPP performance. These indicators are considered less
significant in developing countries such as Bangladesh—most likely because they are
3 See Atkinson, 1999 for the iron triangle of/for measuring the success of a project.

124
mostly related to an aspect of the efficiency of applying the PPP option, which seems to
be more of a concern in advanced countries PPPs.
The consistency ratio (CR) and the geometric consistency index (GCI) calculated
for each of the groups of respondents, and subsequently for all respondents, provide a
value that is acceptable within the recommended limits for accepting the response of the
respondents (see table 5.17). A CR value of less than 0.10 and a GCI value of less than
0.37 are recommended for n>4, where n is the number of dimensions of the matrix (Dong
et al., 2010).
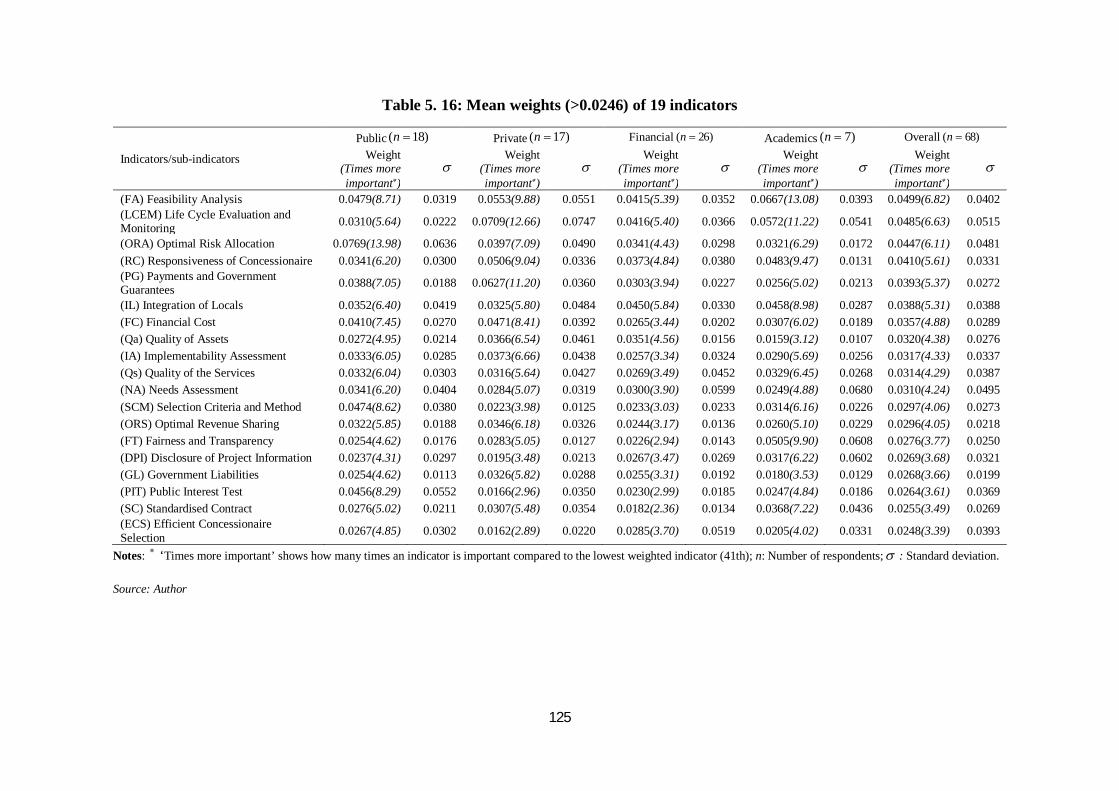
125
Table 5. 16: Mean weights (>0.0246) of 19 indicators
Indicators/sub-indicators
Public Private Financial Academics Overall Weight
(Times more important)
Weight
(Times more important)
Weight
(Times more important)
Weight
(Times more important)
Weight
(Times more important)
(FA) Feasibility Analysis 0.0479(8.71) 0.0319 0.0553(9.88) 0.0551 0.0415(5.39) 0.0352 0.0667(13.08) 0.0393 0.0499(6.82) 0.0402 (LCEM) Life Cycle Evaluation and Monitoring 0.0310(5.64) 0.0222 0.0709(12.66) 0.0747 0.0416(5.40) 0.0366 0.0572(11.22) 0.0541 0.0485(6.63) 0.0515
(ORA) Optimal Risk Allocation 0.0769(13.98) 0.0636 0.0397(7.09) 0.0490 0.0341(4.43) 0.0298 0.0321(6.29) 0.0172 0.0447(6.11) 0.0481 (RC) Responsiveness of Concessionaire 0.0341(6.20) 0.0300 0.0506(9.04) 0.0336 0.0373(4.84) 0.0380 0.0483(9.47) 0.0131 0.0410(5.61) 0.0331 (PG) Payments and Government Guarantees 0.0388(7.05) 0.0188 0.0627(11.20) 0.0360 0.0303(3.94) 0.0227 0.0256(5.02) 0.0213 0.0393(5.37) 0.0272
(IL) Integration of Locals 0.0352(6.40) 0.0419 0.0325(5.80) 0.0484 0.0450(5.84) 0.0330 0.0458(8.98) 0.0287 0.0388(5.31) 0.0388 (FC) Financial Cost 0.0410(7.45) 0.0270 0.0471(8.41) 0.0392 0.0265(3.44) 0.0202 0.0307(6.02) 0.0189 0.0357(4.88) 0.0289 (Qa) Quality of Assets 0.0272(4.95) 0.0214 0.0366(6.54) 0.0461 0.0351(4.56) 0.0156 0.0159(3.12) 0.0107 0.0320(4.38) 0.0276 (IA) Implementability Assessment 0.0333(6.05) 0.0285 0.0373(6.66) 0.0438 0.0257(3.34) 0.0324 0.0290(5.69) 0.0256 0.0317(4.33) 0.0337 (Qs) Quality of the Services 0.0332(6.04) 0.0303 0.0316(5.64) 0.0427 0.0269(3.49) 0.0452 0.0329(6.45) 0.0268 0.0314(4.29) 0.0387 (NA) Needs Assessment 0.0341(6.20) 0.0404 0.0284(5.07) 0.0319 0.0300(3.90) 0.0599 0.0249(4.88) 0.0680 0.0310(4.24) 0.0495 (SCM) Selection Criteria and Method 0.0474(8.62) 0.0380 0.0223(3.98) 0.0125 0.0233(3.03) 0.0233 0.0314(6.16) 0.0226 0.0297(4.06) 0.0273 (ORS) Optimal Revenue Sharing 0.0322(5.85) 0.0188 0.0346(6.18) 0.0326 0.0244(3.17) 0.0136 0.0260(5.10) 0.0229 0.0296(4.05) 0.0218 (FT) Fairness and Transparency 0.0254(4.62) 0.0176 0.0283(5.05) 0.0127 0.0226(2.94) 0.0143 0.0505(9.90) 0.0608 0.0276(3.77) 0.0250 (DPI) Disclosure of Project Information 0.0237(4.31) 0.0297 0.0195(3.48) 0.0213 0.0267(3.47) 0.0269 0.0317(6.22) 0.0602 0.0269(3.68) 0.0321 (GL) Government Liabilities 0.0254(4.62) 0.0113 0.0326(5.82) 0.0288 0.0255(3.31) 0.0192 0.0180(3.53) 0.0129 0.0268(3.66) 0.0199 (PIT) Public Interest Test 0.0456(8.29) 0.0552 0.0166(2.96) 0.0350 0.0230(2.99) 0.0185 0.0247(4.84) 0.0186 0.0264(3.61) 0.0369 (SC) Standardised Contract 0.0276(5.02) 0.0211 0.0307(5.48) 0.0354 0.0182(2.36) 0.0134 0.0368(7.22) 0.0436 0.0255(3.49) 0.0269 (ECS) Efficient Concessionaire Selection 0.0267(4.85) 0.0302 0.0162(2.89) 0.0220 0.0285(3.70) 0.0519 0.0205(4.02) 0.0331 0.0248(3.39) 0.0393
Notes: ‘Times more important’ shows how many times an indicator is important compared to the lowest weighted indicator (41th); n: Number of respondents; : Standard deviation.
Source: Author
( 18)n ( 17)n ( 26)n ( 7)n ( 68)n
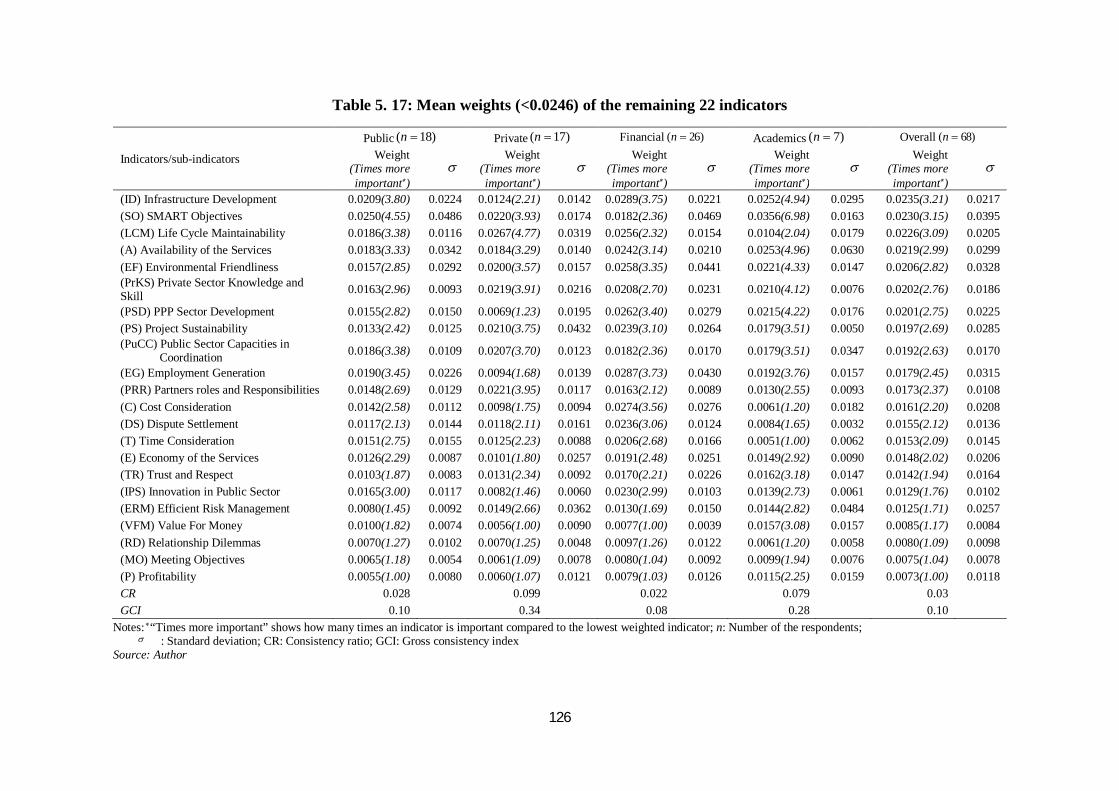
126
Table 5. 17: Mean weights (<0.0246) of the remaining 22 indicators
Indicators/sub-indicators
Public Private Financial Academics Overall Weight
(Times more important)
Weight
(Times more important)
Weight
(Times more important)
Weight
(Times more important)
Weight
(Times more important)
(ID) Infrastructure Development 0.0209(3.80) 0.0224 0.0124(2.21) 0.0142 0.0289(3.75) 0.0221 0.0252(4.94) 0.0295 0.0235(3.21) 0.0217 (SO) SMART Objectives 0.0250(4.55) 0.0486 0.0220(3.93) 0.0174 0.0182(2.36) 0.0469 0.0356(6.98) 0.0163 0.0230(3.15) 0.0395 (LCM) Life Cycle Maintainability 0.0186(3.38) 0.0116 0.0267(4.77) 0.0319 0.0256(2.32) 0.0154 0.0104(2.04) 0.0179 0.0226(3.09) 0.0205 (A) Availability of the Services 0.0183(3.33) 0.0342 0.0184(3.29) 0.0140 0.0242(3.14) 0.0210 0.0253(4.96) 0.0630 0.0219(2.99) 0.0299 (EF) Environmental Friendliness 0.0157(2.85) 0.0292 0.0200(3.57) 0.0157 0.0258(3.35) 0.0441 0.0221(4.33) 0.0147 0.0206(2.82) 0.0328 (PrKS) Private Sector Knowledge and Skill 0.0163(2.96) 0.0093 0.0219(3.91) 0.0216 0.0208(2.70) 0.0231 0.0210(4.12) 0.0076 0.0202(2.76) 0.0186
(PSD) PPP Sector Development 0.0155(2.82) 0.0150 0.0069(1.23) 0.0195 0.0262(3.40) 0.0279 0.0215(4.22) 0.0176 0.0201(2.75) 0.0225 (PS) Project Sustainability 0.0133(2.42) 0.0125 0.0210(3.75) 0.0432 0.0239(3.10) 0.0264 0.0179(3.51) 0.0050 0.0197(2.69) 0.0285 (PuCC) Public Sector Capacities in Coordination 0.0186(3.38) 0.0109 0.0207(3.70) 0.0123 0.0182(2.36) 0.0170 0.0179(3.51) 0.0347 0.0192(2.63) 0.0170
(EG) Employment Generation 0.0190(3.45) 0.0226 0.0094(1.68) 0.0139 0.0287(3.73) 0.0430 0.0192(3.76) 0.0157 0.0179(2.45) 0.0315 (PRR) Partners roles and Responsibilities 0.0148(2.69) 0.0129 0.0221(3.95) 0.0117 0.0163(2.12) 0.0089 0.0130(2.55) 0.0093 0.0173(2.37) 0.0108 (C) Cost Consideration 0.0142(2.58) 0.0112 0.0098(1.75) 0.0094 0.0274(3.56) 0.0276 0.0061(1.20) 0.0182 0.0161(2.20) 0.0208 (DS) Dispute Settlement 0.0117(2.13) 0.0144 0.0118(2.11) 0.0161 0.0236(3.06) 0.0124 0.0084(1.65) 0.0032 0.0155(2.12) 0.0136 (T) Time Consideration 0.0151(2.75) 0.0155 0.0125(2.23) 0.0088 0.0206(2.68) 0.0166 0.0051(1.00) 0.0062 0.0153(2.09) 0.0145 (E) Economy of the Services 0.0126(2.29) 0.0087 0.0101(1.80) 0.0257 0.0191(2.48) 0.0251 0.0149(2.92) 0.0090 0.0148(2.02) 0.0206 (TR) Trust and Respect 0.0103(1.87) 0.0083 0.0131(2.34) 0.0092 0.0170(2.21) 0.0226 0.0162(3.18) 0.0147 0.0142(1.94) 0.0164 (IPS) Innovation in Public Sector 0.0165(3.00) 0.0117 0.0082(1.46) 0.0060 0.0230(2.99) 0.0103 0.0139(2.73) 0.0061 0.0129(1.76) 0.0102 (ERM) Efficient Risk Management 0.0080(1.45) 0.0092 0.0149(2.66) 0.0362 0.0130(1.69) 0.0150 0.0144(2.82) 0.0484 0.0125(1.71) 0.0257 (VFM) Value For Money 0.0100(1.82) 0.0074 0.0056(1.00) 0.0090 0.0077(1.00) 0.0039 0.0157(3.08) 0.0157 0.0085(1.17) 0.0084 (RD) Relationship Dilemmas 0.0070(1.27) 0.0102 0.0070(1.25) 0.0048 0.0097(1.26) 0.0122 0.0061(1.20) 0.0058 0.0080(1.09) 0.0098 (MO) Meeting Objectives 0.0065(1.18) 0.0054 0.0061(1.09) 0.0078 0.0080(1.04) 0.0092 0.0099(1.94) 0.0076 0.0075(1.04) 0.0078 (P) Profitability 0.0055(1.00) 0.0080 0.0060(1.07) 0.0121 0.0079(1.03) 0.0126 0.0115(2.25) 0.0159 0.0073(1.00) 0.0118 CR 0.028 0.099 0.022 0.079 0.03 GCI 0.10 0.34 0.08 0.28 0.10
Notes: “Times more important” shows how many times an indicator is important compared to the lowest weighted indicator; n: Number of the respondents; : Standard deviation; CR: Consistency ratio; GCI: Gross consistency index
Source: Author
( 18)n ( 17)n ( 26)n ( 7)n ( 68)n
127
5.3.2 Comparative analysis and ANOVA test
Comparative analysis
For a comparative analysis, the indicators that have a mean weight greater than
0.0244 are considered. The rationale for choosing 0.0244 as the cut-off value is primarily
because it is the average value of all weightings in the indicators (Yeung et al., 2012).
Notable features of the results of the remaining indicators are also considered (see
discussion of this result in sub-section 5.5.2) in order to draw an overall conclusion for
this chapter. As shown in figure 5.2, all the expert groups assigned similar weights to
eight indicators, with weights ranging from 0.027-0.033 to 0.018-0.033.
Figure 5. 2: Weights of top 19 indicators (mean >0.0244) by different expert groups
NA: Needs assessment; FA: Feasibility analysis; IA: Implementability assessment; PIT: Public interest test; ECS: Efficient concessionaire selection; SCM: Selection criteria and method; FT: Fairness and transparency; SC: Standardised contract; Qa: Quality of assets; ORA: Optimal risk allocation; FC: Financial cost; PG: Payments and guarantees; ORS: Optimal revenue sharing; GL: Government liabilities; IL: Integration of locals; DPI: Disclosure of project info; LCEM: Life cycle evaluation and monitoring; RC: Responsiveness of concessionaire; Qs: Quality of services. Source: Hossain, Guest, & Smith, 2018a.
These eight include (from the lowest ranges) ‘quality of assets’ (Qs, with 0.027-
0.033), followed by ‘needs assessment’ (NA), ‘optimal revenue sharing’ (ORS),
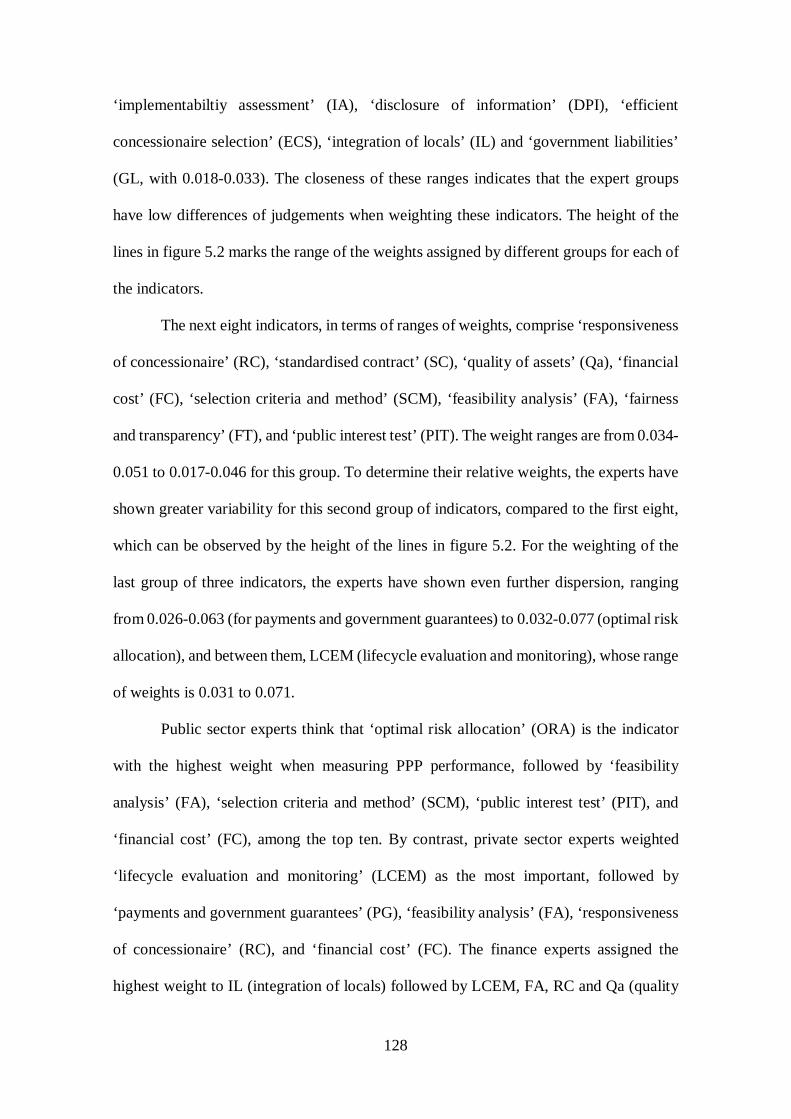
128
‘implementabiltiy assessment’ (IA), ‘disclosure of information’ (DPI), ‘efficient
concessionaire selection’ (ECS), ‘integration of locals’ (IL) and ‘government liabilities’
(GL, with 0.018-0.033). The closeness of these ranges indicates that the expert groups
have low differences of judgements when weighting these indicators. The height of the
lines in figure 5.2 marks the range of the weights assigned by different groups for each of
the indicators.
The next eight indicators, in terms of ranges of weights, comprise ‘responsiveness
of concessionaire’ (RC), ‘standardised contract’ (SC), ‘quality of assets’ (Qa), ‘financial
cost’ (FC), ‘selection criteria and method’ (SCM), ‘feasibility analysis’ (FA), ‘fairness
and transparency’ (FT), and ‘public interest test’ (PIT). The weight ranges are from 0.034-
0.051 to 0.017-0.046 for this group. To determine their relative weights, the experts have
shown greater variability for this second group of indicators, compared to the first eight,
which can be observed by the height of the lines in figure 5.2. For the weighting of the
last group of three indicators, the experts have shown even further dispersion, ranging
from 0.026-0.063 (for payments and government guarantees) to 0.032-0.077 (optimal risk
allocation), and between them, LCEM (lifecycle evaluation and monitoring), whose range
of weights is 0.031 to 0.071.
Public sector experts think that ‘optimal risk allocation’ (ORA) is the indicator
with the highest weight when measuring PPP performance, followed by ‘feasibility
analysis’ (FA), ‘selection criteria and method’ (SCM), ‘public interest test’ (PIT), and
‘financial cost’ (FC), among the top ten. By contrast, private sector experts weighted
‘lifecycle evaluation and monitoring’ (LCEM) as the most important, followed by
‘payments and government guarantees’ (PG), ‘feasibility analysis’ (FA), ‘responsiveness
of concessionaire’ (RC), and ‘financial cost’ (FC). The finance experts assigned the
highest weight to IL (integration of locals) followed by LCEM, FA, RC and Qa (quality
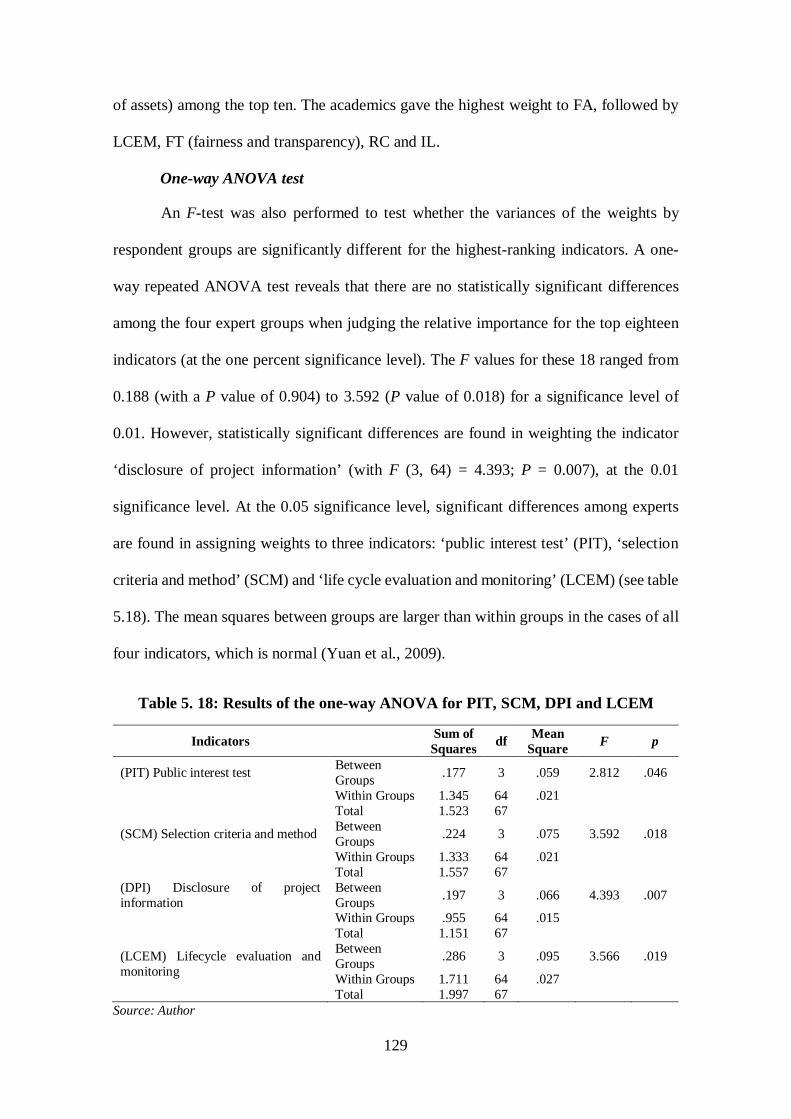
129
of assets) among the top ten. The academics gave the highest weight to FA, followed by
LCEM, FT (fairness and transparency), RC and IL.
One-way ANOVA test
An F-test was also performed to test whether the variances of the weights by
respondent groups are significantly different for the highest-ranking indicators. A one-
way repeated ANOVA test reveals that there are no statistically significant differences
among the four expert groups when judging the relative importance for the top eighteen
indicators (at the one percent significance level). The F values for these 18 ranged from
0.188 (with a P value of 0.904) to 3.592 (P value of 0.018) for a significance level of
0.01. However, statistically significant differences are found in weighting the indicator
‘disclosure of project information’ (with F (3, 64) = 4.393; P = 0.007), at the 0.01
significance level. At the 0.05 significance level, significant differences among experts
are found in assigning weights to three indicators: ‘public interest test’ (PIT), ‘selection
criteria and method’ (SCM) and ‘life cycle evaluation and monitoring’ (LCEM) (see table
5.18). The mean squares between groups are larger than within groups in the cases of all
four indicators, which is normal (Yuan et al., 2009).
Table 5. 18: Results of the one-way ANOVA for PIT, SCM, DPI and LCEM
Indicators Sum of Squares df Mean
Square F p
(PIT) Public interest test Between Groups .177 3 .059 2.812 .046
Within Groups 1.345 64 .021 Total 1.523 67
(SCM) Selection criteria and method Between Groups .224 3 .075 3.592 .018
Within Groups 1.333 64 .021 Total 1.557 67 (DPI) Disclosure of project information
Between Groups .197 3 .066 4.393 .007
Within Groups .955 64 .015 Total 1.151 67
(LCEM) Lifecycle evaluation and monitoring
Between Groups .286 3 .095 3.566 .019
Within Groups 1.711 64 .027 Total 1.997 67
Source: Author
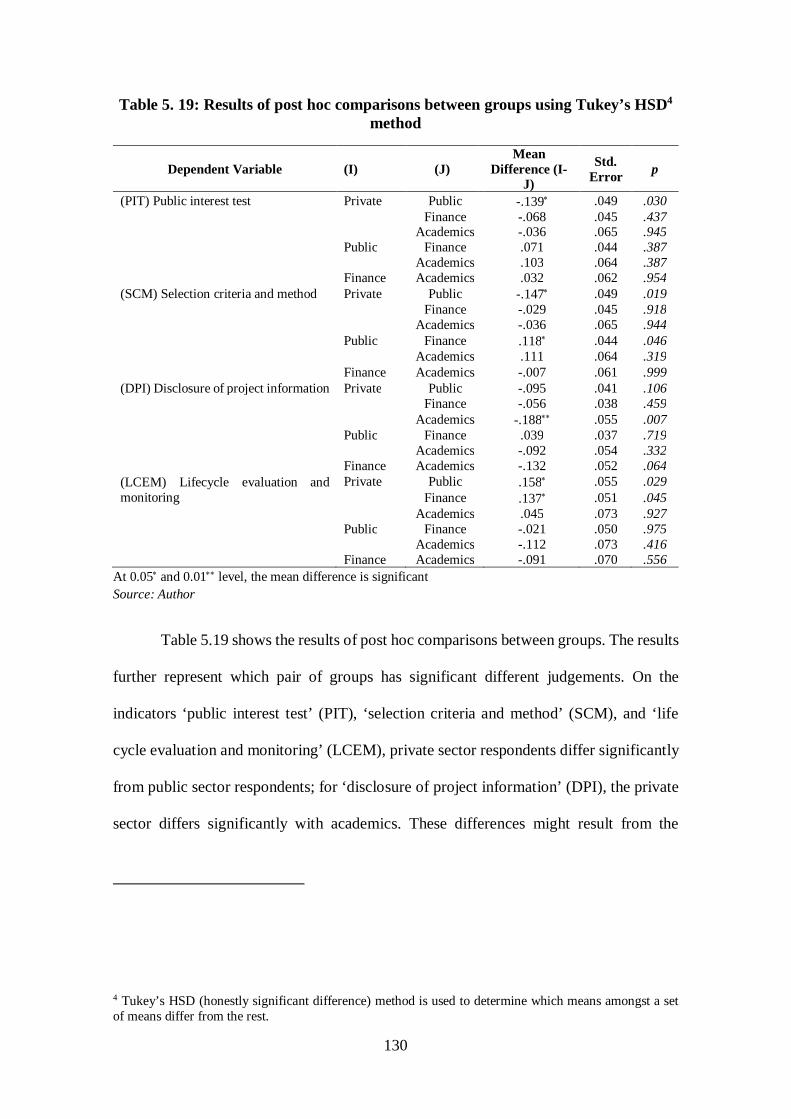
130
Table 5. 19: Results of post hoc comparisons between groups using Tukey’s HSD4 method
Dependent Variable (I) (J) Mean
Difference (I-J)
Std. Error p
(PIT) Public interest test Private Public -.139 .049 .030 Finance -.068 .045 .437 Academics -.036 .065 .945 Public Finance .071 .044 .387 Academics .103 .064 .387 Finance Academics .032 .062 .954 (SCM) Selection criteria and method Private Public -.147 .049 .019 Finance -.029 .045 .918 Academics -.036 .065 .944 Public Finance .118 .044 .046 Academics .111 .064 .319 Finance Academics -.007 .061 .999 (DPI) Disclosure of project information Private Public -.095 .041 .106 Finance -.056 .038 .459 Academics -.188 .055 .007 Public Finance .039 .037 .719 Academics -.092 .054 .332 Finance Academics -.132 .052 .064 (LCEM) Lifecycle evaluation and monitoring
Private Public .158 .055 .029 Finance .137 .051 .045
Academics .045 .073 .927 Public Finance -.021 .050 .975 Academics -.112 .073 .416 Finance Academics -.091 .070 .556
At 0.05 and 0.01 level, the mean difference is significant Source: Author
Table 5.19 shows the results of post hoc comparisons between groups. The results
further represent which pair of groups has significant different judgements. On the
indicators ‘public interest test’ (PIT), ‘selection criteria and method’ (SCM), and ‘life
cycle evaluation and monitoring’ (LCEM), private sector respondents differ significantly
from public sector respondents; for ‘disclosure of project information’ (DPI), the private
sector differs significantly with academics. These differences might result from the
4 Tukey’s HSD (honestly significant difference) method is used to determine which means amongst a set of means differ from the rest.
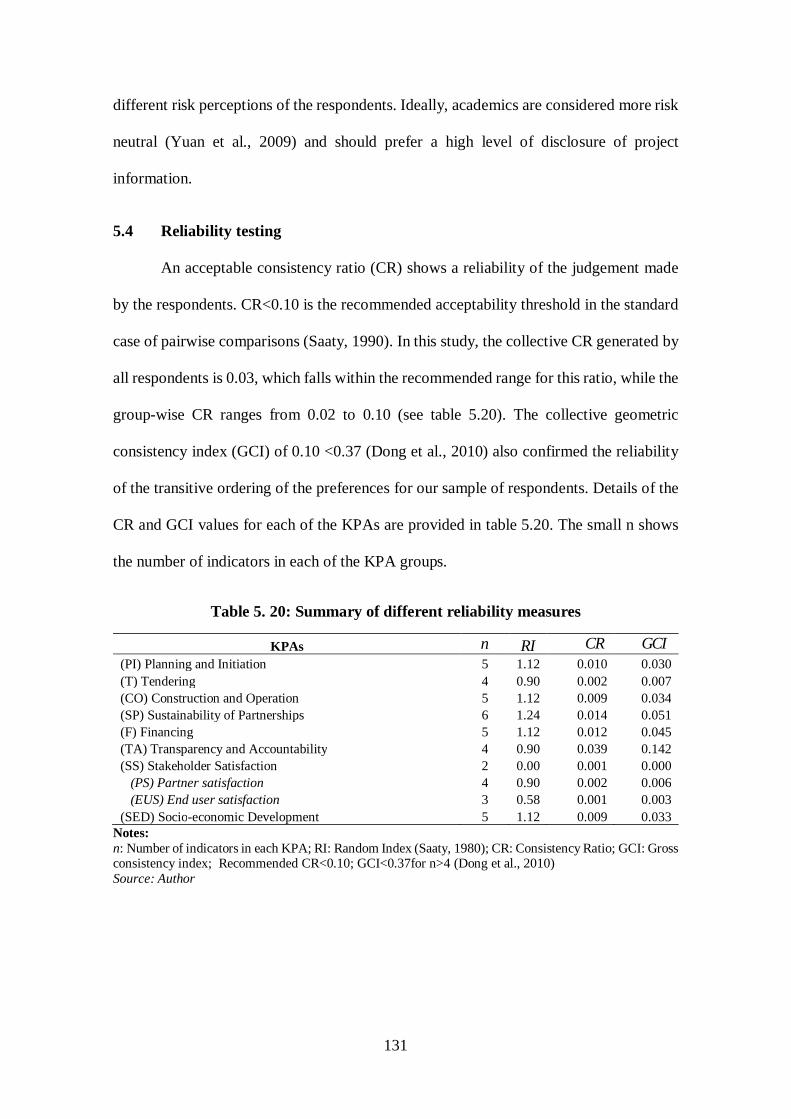
131
different risk perceptions of the respondents. Ideally, academics are considered more risk
neutral (Yuan et al., 2009) and should prefer a high level of disclosure of project
information.
5.4 Reliability testing
An acceptable consistency ratio (CR) shows a reliability of the judgement made
by the respondents. CR<0.10 is the recommended acceptability threshold in the standard
case of pairwise comparisons (Saaty, 1990). In this study, the collective CR generated by
all respondents is 0.03, which falls within the recommended range for this ratio, while the
group-wise CR ranges from 0.02 to 0.10 (see table 5.20). The collective geometric
consistency index (GCI) of 0.10 <0.37 (Dong et al., 2010) also confirmed the reliability
of the transitive ordering of the preferences for our sample of respondents. Details of the
CR and GCI values for each of the KPAs are provided in table 5.20. The small n shows
the number of indicators in each of the KPA groups.
Table 5. 20: Summary of different reliability measures
KPAs
(PI) Planning and Initiation 5 1.12 0.010 0.030 (T) Tendering 4 0.90 0.002 0.007 (CO) Construction and Operation 5 1.12 0.009 0.034 (SP) Sustainability of Partnerships 6 1.24 0.014 0.051 (F) Financing 5 1.12 0.012 0.045 (TA) Transparency and Accountability 4 0.90 0.039 0.142 (SS) Stakeholder Satisfaction 2 0.00 0.001 0.000 (PS) Partner satisfaction 4 0.90 0.002 0.006 (EUS) End user satisfaction 3 0.58 0.001 0.003 (SED) Socio-economic Development 5 1.12 0.009 0.033
Notes: n: Number of indicators in each KPA; RI: Random Index (Saaty, 1980); CR: Consistency Ratio; GCI: Gross consistency index; Recommended CR<0.10; GCI<0.37for n>4 (Dong et al., 2010) Source: Author
n RI CR GCI
132
5.5 Critical discussion of the results
5.5.1 KPAs of PPPs in developing countries
To the best of our knowledge, no study has previously determined weights for the
key performance areas (KPAs) of PPPs in the context of the developing countries,
including Bangladesh, using an AHP approach. This study has successfully applied the
AHP method in establishing weights for the eight KPAs and their related indicators. In
this section, a critical discussion has been made on results relating to these KPAs.
Of the leading three KPAs, ‘financing’ (F) and ‘transparency and accountability’
(TA) are considered together for discussion, followed by ‘planning and initiation’ (PI).
First, the importance of KPA F can be observed by the case of the Elevated Expressway
in Bangladesh, where three deadlines were missed in starting construction (Mamun,
2015). Failure to arrange the required funding delayed project completion and thus
affected the perceived performance of PPPs in Bangladesh. Lack of timely finance for a
PPP project, which becomes more obvious in developing countries than in developed
ones, greatly affects the actual outcome of the PPPs (Chong & Poole, 2013). Developing
countries have a huge investment gap for infrastructure development, and only 20 percent
of the infrastructure investment demand is fulfilled by private participation (Ruiz-Nuñez
& Wei, 2015). This also signals that the availability of financing is generally a critical
issue in developing countries, including Bangladesh.
TA in Bangladesh is also considered to be a relatively critical KPA, for it has an
association with the governance qualities that impact on PPP performances. Bangladesh
shares these qualities with other developing countries in the region, especially in South
Asia. Earlier studies recognized that institutional qualities attract the private sector to
invest into PPPs, resulting in better performance in developing countries (Hammami et
al., 2006; Panayides et al., 2015). Similarly, PI has been perceived to be significant by
133
our respondents because of its link with poor planning and erroneous project selection,
which might have an impact on performance. The World Bank (2017) reported that weak
planning failed to achieve good value for money in a Mumbai water infrastructure project
in India, a developing country like Bangladesh. Likewise, rating ‘tendering’ (T), as the
fourth KPA, indicates its relatively higher importance in the Bangladesh context.
The KPAs relating to ‘stakeholder satisfaction’ (SS), ‘socioeconomic
development’ (SED) and ‘sustainability of partnerships’ (SP) appear to be relatively less
important in Bangladesh, probably because they are considered issues that are more
pertinent to PPPs in developed countries Previous research acknowledged that some
issues (relating to these KPAs), such as stable risk allocation, designing robust business
cases and effective control on concessionaire arrangements, are considered priority issues
for developed countries (De Jong et al., 2010). Relationship management in developed
countries is also more focused on maintaining sustainable partnerships in order to attain
superior value from PPPs (Zou et al., 2014). ‘Construction and operation’ (CO) is the
phase where outcomes begin to be generated and where an efficient bundling and contract
design will have an impact on such results. Clearly, designing and bundling are capacity
issues that require a high level of expertise, which the only developed countries might
have the luxury of demanding. Because of this, respondents in Bangladesh have perceived
the CO KPA to be less significant.
5.5.2 Performance indicators of PPPs in developing countries
The most significant top ten indicators include ‘feasibility analysis’ (FA), ‘life
cycle evaluation and monitoring’ (LCEM), ‘optimal risk allocation’ (ORA),
‘responsiveness of concessionaire’ (RC), ‘payments and government guarantees’ (PG),
‘integration of locals’ (IL), ‘financial cost’ (FC), ‘quality of assets’ (Qa),
‘implementability assessment’ (IA), and ‘quality of services’ (Qs), although the
134
remaining indicators are not insignificant. But their relative importance differs across
different countries. Country-specific differences in experience with these indicators might
lead to the variances in their relative significance. As a result, our discussion will focus
on why these indicators are significant in the context of Bangladesh, and will relate these
causes to similar studies previously published regarding the developing countries.
FA holds the highest overall weighting, which implies that it is the most
significant indicator of PPP performance in Bangladesh, where a number of mega projects
were cancelled, renegotiated or stalled, largely because of the absence of a detailed
feasibility study. An example of a cancelled project is the Shah Amanat International
Airport, the contract for which was signed in 2005, but was subsequently cancelled in
2007 (ADB, 2017). Lack of rigorous feasibility analysis in the project planning stage of
the Dhaka Elevated Expressway was also reported to be the main cause of delay in
reaching financial closure. Earlier research supported these findings that the FA has a link
with schedule performance, and is generally associated with better service performance
of developing countries’ PPPs (Almarri & Boussabaine, 2017).
LCEM is a recent concept (as a performance indicator) in PPP performance
evaluation, even in the developed countries (Love et al., 2015). For Bangladesh, it is
difficult to tell why the LCEM is rated as one of the most important indicators. However,
the life cycle perspective of PPP projects is essential for all countries, irrespective of their
development status. Over the longer term, a phase-based evaluation and monitoring
process that passes through a phase of ‘learning by doing’ is critical for making a PPP
project successful in Bangladesh. Lessons learnt from this phase need to be calibrated for
improved outcomes related to PPP performance. For achieving better value for money,
operating and maintenance costs in every phase of the project need to be reviewed
periodically, with corrective actions taken as required (Love et al., 2015).
135
Our respondents perceived ‘optimal risk allocation’ (ORA) as important for PPPs
in Bangladesh because projects implemented in this manner require a complex analysis
of risk from the perspectives of the different stakeholders. Bangladesh lacks this sort of
skilled expertise, at least in the public sector, as indicated by the perception (weights) of
the respondents in the public sector group (see table 5.16). PPP experts in Bangladesh are
yet to acquire this skill. Optimism bias and corruption in Bangladesh might encourage
allocating risk sub-optimally and taking advantage of opportunistic contract cancellation
and renegotiation. Previous studies (Ameyaw & Chan, 2015; Percoco, 2014) also
supported this result in other developing countries.
The ‘responsiveness of the concessionaire’ (RC) is an accountability concern that
is fairly common in the developing countries, including Bangladesh, where holding
concessionaires accountable to their commitments suffers from strict enforcement of
contract terms. However, flexibility in enforcing contract terms might encourage
concessionaires to be unresponsive to the local needs and demands that relate to the
services and promises made by the project. So RC is placed by our respondents in the top
ten performance indicators in Bangladesh. ‘Payments and government guarantees’ (PG)
is also considered an important indicator: sponsors anticipate a higher uncertainty on
revenue flows from projects in Bangladesh, which makes PPP projects difficult to be
commercially viable. Implementation guarantees and security packages provided by the
government have resulted in better performances of some early implemented power
projects in Bangladesh (M. Khan et al., 2012).
Bangladesh has a small geographic area that is heavily populated and with limited
usable land that is in high demand. Implementing PPP projects often requires the need to
acquire land or free it from the existing occupants. In cases where locals have not been
included in the process of project implementation by offering them incentives or
136
counselling measures, disputes arise, and thus ‘integration of locals’ becomes an issue
that can impact negatively on project performance. Integrating locals to implementing
PPP projects has also been found to be an important indicator (Osei-Kyei & Chan, 2017b).
‘Financial cost’ is also a significant criterion that might influence PPP
performance (as perceived by our respondents). Lending by local banks to long-term
investment associated with PPP projects in Bangladesh might act to crowd-out private
investment and make financing more expensive. Similar evidence was recorded in a study
on barriers to PPPs in Nigeria, where financing PPPs suffered from a scarcity of long-
term financing arrangements (Babatunde, Perera, Zhou, & Udeaja, 2015). Quality of
assets and of services (the 8th and 10th indicators) in Bangladesh could be linked to the
institutional qualities in the public sector and to the innovative skill characteristics more
normally associated with the private sector. Output specifications that include these
qualities were also found to be significant in other developing countries (Osei-Kyei &
Chan, 2017a). ‘Implementability assessment’ is also important, probably because
Bangladesh has constrained resources and has political risk that becomes significant in a
transition of power to a different political party.
Also above the mean weight (>0.0246), after the top ten indicators, are other
indicators: ‘needs assessment’ (NA), ‘selection criteria and method’ (SCM), ‘optimal
revenue sharing’ (ORS), ‘fairness and transparency’ (FT), ‘disclosure of project
information’ (DPI), ‘government liabilities’ (GL), ‘public interest test’ (PIT),
‘standardised contract’ (SC) and ‘efficient concessionaire selection’ (ECS) (see table
5.16). This implies that they are significant as well, but have a lesser degree of impact on
the performance measurement. SCM, FT, DPI and ECS are associated with the process
of concessionaire selection, its transparency and ultimately its governance qualities.
Bangladesh, as a developing country, possesses poor governance qualities that might lead
137
our respondents to perceive these indicators to be significant ones. While NA, ORS, GL,
PIT and SC all are broadly linked with the skill of the analyst responsible for assessing
these aspects, GL and PIT are also associated to some extent with political commitments.
The ability of PPP facilitators in Bangladesh is increasing, but there is scope for it to
improve further, although the political commitments are weak and are not anticipated to
improve.
Besides these nineteen indicators, others such as cost, time, profitability, value for
money, private sector expertise and public sector capacities, and dispute settlement are
commonly perceived as the leading PPP performance indicators in both developed and
developing countries (Raisbeck et al., 2010). However, they are positioned, in the case of
Bangladesh, in the lower level of importance weightings. This can be explained by
reasons specific to these indicators. The lower importance assigned to cost and time
indicators could be caused by a higher scope for opportunistic renegotiation to allow
private partners to offset losses incurred due to cost overrun and time delays, as evident
in transport PPPs (N. Islam, 2015). Indicators such as private sector expertise and public
sector capacities could be linked to the poor competitive environment that prevails in
Bangladesh. An assessment of the value for money indicator depends on the cost
components of a PSC analysis, which is not often conducted in Bangladesh. The scope
for rent capture, and a strong network of private partners with the government (M. Khan
et al., 2012), generates less concern about project’s profitability than about winning the
PPP project contract.
5.6 Concluding remarks
In this chapter, the relative importance (weights) of performance indicators and
KPAs of PPPs in developing countries has been established by using the AHP method. A
set of different performance indicators including, for example, ‘feasibility analysis’ (FA),
138
‘lifecycle evaluation and monitoring’ (LCEM), ‘optimal risk allocation’ (ORA) and
‘responsiveness of concessionaire’ (RC), are found to be dominant in the developing
countries context; ‘financing’ (F), ‘planning and initiation’ (PI) and ‘transparency and
accountability’ (TA) are perceived as leading KPAs. Why the leading KPAs and
indicators in the developing countries are different from the developed countries has been
discussed. The next chapter, which presents a case study exploring the performance areas
of the power sector PPPs in Bangladesh, finds differences in the outcomes resulting from
using these two different evaluation approaches—the traditional way of case analysis and
the KPA system.
139
Chapter Six: Case studies of power PPPs—
an analysis of project experiences
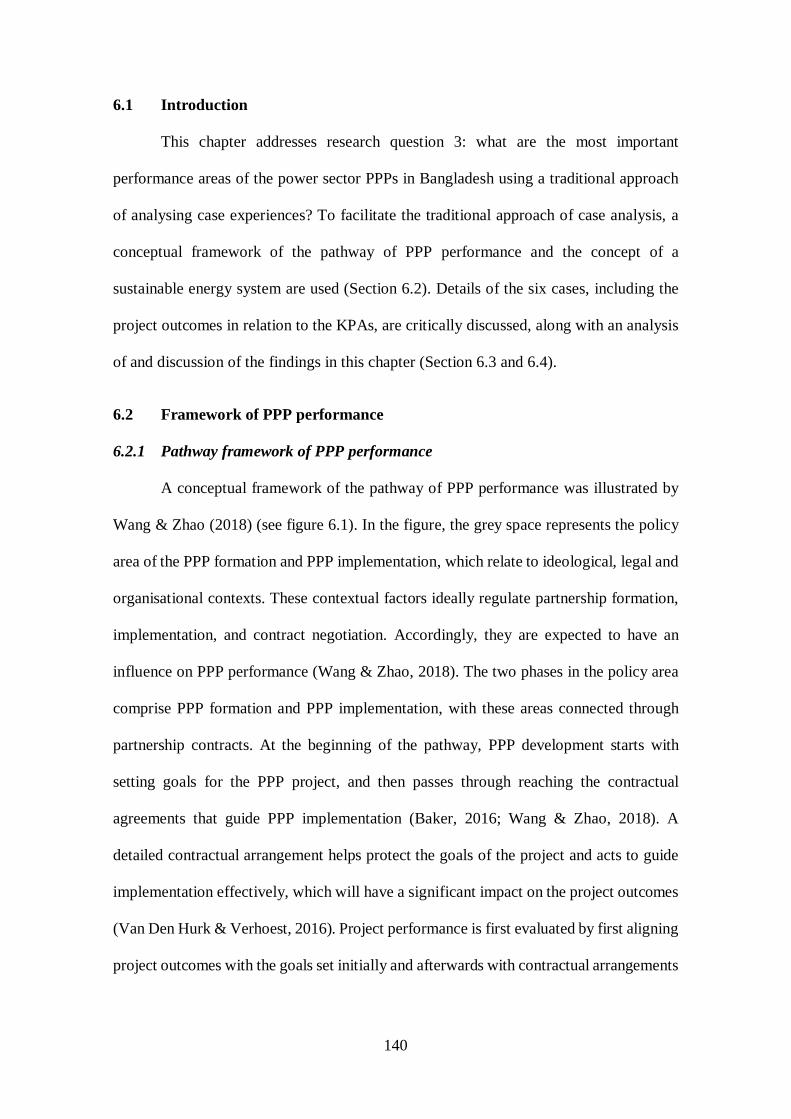
140
6.1 Introduction
This chapter addresses research question 3: what are the most important
performance areas of the power sector PPPs in Bangladesh using a traditional approach
of analysing case experiences? To facilitate the traditional approach of case analysis, a
conceptual framework of the pathway of PPP performance and the concept of a
sustainable energy system are used (Section 6.2). Details of the six cases, including the
project outcomes in relation to the KPAs, are critically discussed, along with an analysis
of and discussion of the findings in this chapter (Section 6.3 and 6.4).
6.2 Framework of PPP performance
6.2.1 Pathway framework of PPP performance
A conceptual framework of the pathway of PPP performance was illustrated by
Wang & Zhao (2018) (see figure 6.1). In the figure, the grey space represents the policy
area of the PPP formation and PPP implementation, which relate to ideological, legal and
organisational contexts. These contextual factors ideally regulate partnership formation,
implementation, and contract negotiation. Accordingly, they are expected to have an
influence on PPP performance (Wang & Zhao, 2018). The two phases in the policy area
comprise PPP formation and PPP implementation, with these areas connected through
partnership contracts. At the beginning of the pathway, PPP development starts with
setting goals for the PPP project, and then passes through reaching the contractual
agreements that guide PPP implementation (Baker, 2016; Wang & Zhao, 2018). A
detailed contractual arrangement helps protect the goals of the project and acts to guide
implementation effectively, which will have a significant impact on the project outcomes
(Van Den Hurk & Verhoest, 2016). Project performance is first evaluated by first aligning
project outcomes with the goals set initially and afterwards with contractual arrangements
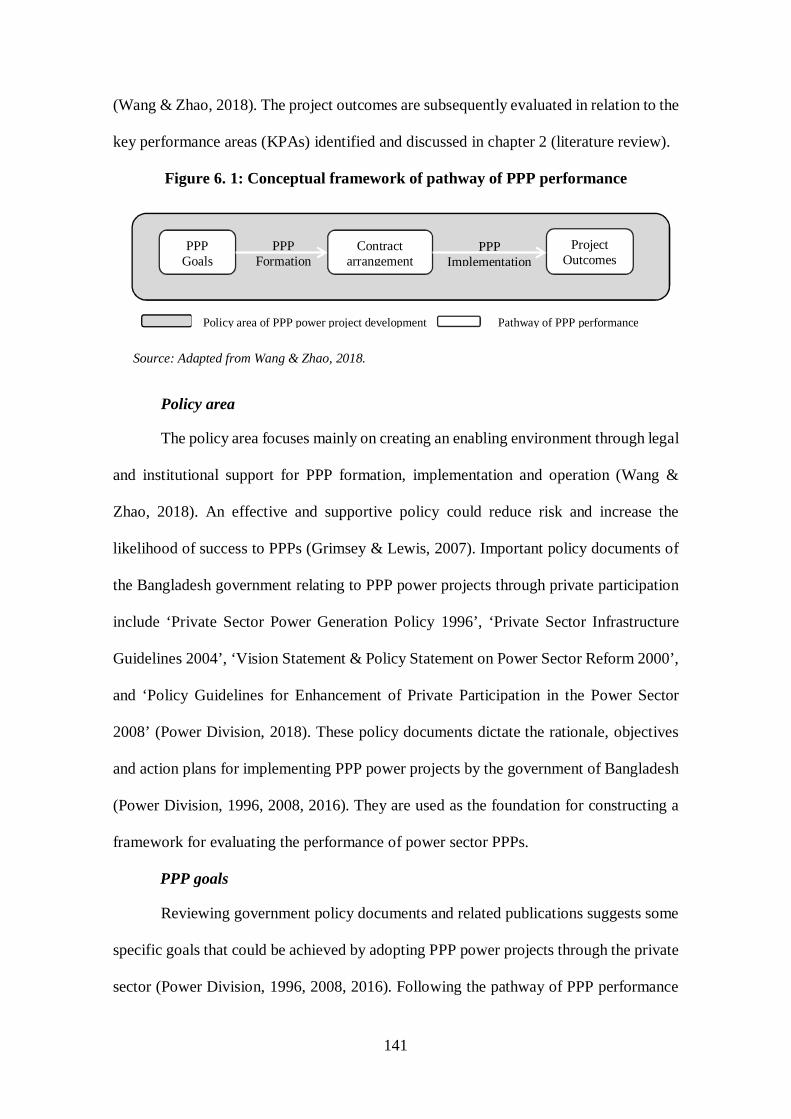
141
(Wang & Zhao, 2018). The project outcomes are subsequently evaluated in relation to the
key performance areas (KPAs) identified and discussed in chapter 2 (literature review).
Figure 6. 1: Conceptual framework of pathway of PPP performance
Source: Adapted from Wang & Zhao, 2018.
Policy area
The policy area focuses mainly on creating an enabling environment through legal
and institutional support for PPP formation, implementation and operation (Wang &
Zhao, 2018). An effective and supportive policy could reduce risk and increase the
likelihood of success to PPPs (Grimsey & Lewis, 2007). Important policy documents of
the Bangladesh government relating to PPP power projects through private participation
include ‘Private Sector Power Generation Policy 1996’, ‘Private Sector Infrastructure
Guidelines 2004’, ‘Vision Statement & Policy Statement on Power Sector Reform 2000’,
and ‘Policy Guidelines for Enhancement of Private Participation in the Power Sector
2008’ (Power Division, 2018). These policy documents dictate the rationale, objectives
and action plans for implementing PPP power projects by the government of Bangladesh
(Power Division, 1996, 2008, 2016). They are used as the foundation for constructing a
framework for evaluating the performance of power sector PPPs.
PPP goals
Reviewing government policy documents and related publications suggests some
specific goals that could be achieved by adopting PPP power projects through the private
sector (Power Division, 1996, 2008, 2016). Following the pathway of PPP performance
PPP Implementation
Project Outcomes
PPP Goals
PPP Formation
Contract arrangement
Policy area of PPP power project development Pathway of PPP performance
142
in figure 6.1, a performance framework for evaluating the PPP power projects selected in
this case study has been constructed (see table 6.1) based on policy guidelines related to
PPP power projects and the concept of the sustainable energy system (see sub-section
6.2.2 for details). In addition to the policy documents, the existing literature on PPP power
projects in the context of developing countries has also been reviewed to support the
construction of the performance framework for this case study approach.
Table 6. 1: Framework of performance evaluation of power PPPs
Performance area Attributes Improving power supply Ability to provide electricity to more people Promote private participation Support private sector to be engaged in power generation Local entrepreneurship development
Promoting local entrepreneurs to be involved in investing power sector
Innovative financing Out of the box financial arrangement for power sector projects Local capital market development Contributing to developing local equity and debt capital market Harness competition Transparent and accountable process of concessionaire selection Fuel diversification Reducing dependency on gas and using an alternative fuel source Fair and competitive tariffs Balancing between competitive tariffs and affordability of
consumers Efficiency gains Achieving optimal values from using limited resources Risk transfer Shifting construction and other risks to private participants
Source: Power Division, 1996, 2004, 2008, 2016.
Security packages or contractual arrangements
The policy elements extracted from the related documents from the ‘policy area’
section, together called a ‘security package’, include a number of contract agreements
and other privileges offered to private sector investors. These contract agreements include
an implementation agreement (ImA), a power purchase agreement (PPA), a fuel supply
agreement (FSA), and a land lease/acquisition agreement (LLA). The ImA provides
guarantees for an adjustment of certain tariff components as a result of variations in the
exchange rate, fuel prices, and inflation rate. The PPA provides the guarantee of produced
power to be purchased by a single buyer (namely the BPDB). Under the FSA, fuel supply
is guaranteed by the Government of Bangladesh (GoB) in the cases where the supplier is
a public sector organisation. The required land for the project is provided either by state-
143
owned organisations through lease arrangements, or is acquired directly by the
government, or is directly purchased by the sponsors, depending on the provision of the
LLA (Power Division, 1996, 2008, 2016). Furthermore, there are exemptions from
corporate income tax for the private power companies for a period of 15 years.
Repatriation facilities for invested capital, profits and dividends are provided; local
currency (Taka) is convertible for international payments on the current account (Power
Division, 1996; World Bank, 2015).
Project outcomes
Project outcomes are the ultimate performances or achievements that occur
because of the collaborative activities in PPP implementation governed by the contractual
arrangements (Wang & Zhao, 2018). These performances are evaluated by aligning them
with the goals of the projects revealed during the formation of PPP. This is a traditional
way of evaluating the performances of the power sector PPPs. The actual project
outcomes are also evaluated by aligning them with the KPAs, and the differences in the
outcomes derived from using two different approaches are discussed.
6.2.2 Concept of a sustainable energy system
The concept provided by Boston (2013) of a sustainable energy system consists
of three aspects: energy security, affordability, and environmental sustainability.
Achieving a trade-off between these aspects is needed to ensure a sustainable energy
system because they are interrelated (Atmo & Duffield, 2014; Boston, 2013). The goal of
the government is to provide affordable and reliable electricity to all, by 2021, without
compromising environmental sustainability. These three aspects are integrated with the
goals revealed in the government policy documents and are considered when evaluating
the performance of the selected projects.
144
6.3 Presentation of case studies
6.3.1 360MW Haripur Power Ltd (HPL)
Background of private sector power generation
Before presenting the Haripur Power Limited (HPL) case, some background on
the power sector of Bangladesh is needed. In the late 1990s, the power sector in
Bangladesh experienced a number of difficulties such as severe power shortages, poor
services to the existing limited customer base, unrecorded consumption, low tariff rates,
low bill recovery levels (i.e., 80 percent of the bills) and the high level of system losses
(World Bank, 2000a, 2014a). The sector at that time had an available capacity of
2400MW power supply, the net of the installed capacity of 3200MW. With this supply,
only 15 percent of the total population had access to electricity services. Given this
background, along with rapidly increasing electricity demand and shortages of public
sector investment in this sector, the government called on private sector investors to
become involved (World Bank, 2014a).
Objectives of HPL
The HPL was developed with the objectives of (a) alleviating power shortages in
a cost-effective and reliable manner; (b) saving of millions of dollars by replacing diesel-
based power generation projects that also have adverse environmental impacts; and (c)
mobilising private sector investments in developing power projects. These objectives
were to assist the government to reduce its budgetary gap and to enable the undertaking
of new power projects (World Bank, 2014a).
Key information on the HPL
The HPL, the first independent power producer (IPP), was built by the AES
(Applied Energy Services) of United States under the name of Haripur Power Ltd that
145
was incorporated in Bangladesh. Details of this project information are presented in table
6.2.
Table 6. 2: Profile of Haripur Power Limited
1 Project milestones/phases: Date estimated: Date achieved: Date tender calling NA June/1997 Contract signing (ImA/PPA/GSA/LA) NA Sept/1998 Construction begins NA Nov/1999 Year financial closure June/2000 April/2001 Commercial operation date (COD): Dec/2001 June/2001 (Simple Cycle)
Dec/2001 (Combined Cycle) 2 Project information: Installed capacity (MW) 360 MW Generation capacity (MW) 360 MW Fuel type/technology Natural Gas Total investment US$ 183 Million Concession period 22 Years Contract type BOO (Build, Own and Operate) Sponsor/developer AES (USA) (Original); Pendekar Energy (Malaysia)
(Current) Project status Operational Buyer type Single buyer (BPDB) Contracted levelised tariff US cents 2.73/kWh Tariff structure Capacity (Payment for fixed cost);
Energy (Payment for fuel + O & M (variable) Contribution to total generation 10% (Commissioning time) 4% (2017) Government control Line ministry (MPEMR, Central Govt.) 3 Project attributes/features: Implementation agreement
(ImA, with MPEMR) MPEMR guaranteed construction on site and compliance to PPA, GSA and LLA
Power purchasing agreement
(PPA, with BPDB) BPDB is the single off-taker of the energy output
Gas supply agreement (GSA, with Titas)
Titas is the state owned gas supplier
Land lease agreement (LLA with Ministry of Industries)
Ministry of Industries provided land for the contract term
Indemnity agreement (Between government and IDA)
Government guaranteed IDA for resolving any non-compliance of ImA/PPA/GSA/LLA
Procurement method Competitive tendering Number of bidders 12 sponsors submitted unsolicited bids—6 were issued
RFP—4 dropped tenders Notes: BPDB—Bangladesh Power Development Board; MPEMR—Ministry of Power, Energy and Mineral Resources; O & M—Operation & Maintenance; GSA—Gas Supply Agreement; RFP—Request for Proposal; IDA—International Development Association Source: Islam, 2015; World Bank, 2000a, 2000b, 2014.
The HPL, one of the early IPPs in Bangladesh, won the contract through a
competitive bidding process related to developing the project on a BOO basis, with a
concession period of 22 years. This plant is located 24 km southeast of the capital city
(Dhaka) in a power hub for the country.
146
Financing, guarantees, and agreements
The US$ 183 million project was initially financed by equity (US$ 68 million),
by an International Finance Corporation (IFC) loan (US$ 54 million) and by a commercial
bank loan (US$ 60.9 million). The commercial loan was backed by International
Development Association (IDA) partial risk guarantees (PRG) on a security structure
supported by the government guarantees (World Bank, 2015). Details of the project cost
and its financing structure are presented in table 6.3.
Table 6. 3: Estimated cost and financing structure of Haripur Power Limited
a) Project cost Estimate (US$ million)
Actual (US$ million)
Percentage
Cost components: EPC (Engineering procurement and construction)
124.00 124.00 100
Other construction 22.00 19.60 89 Development cost 8.00 8.00 100 Contingencies 5.00 0 0 Financing cost 3.00 3.00 100 IDC (Institutional Development Credit) 12.00 12.00 100 Debt servicing reserve account 9.00 9.00 100 Total estimated cost 183.00 175.60 96
b) Financing structure Equity 76.7 73.7 96 Senior sponsor facility/FMO 37.0 37.0 100 Subordinated sponsor loan a 8.4 8.4 100 IDA (International Development Association) guaranteed commercial loan
60.9 60.9 100
Total 183.0 175.6 96 Debt-equity 54:46 54:46
Note: aSubordinated sponsor loan is part of the equity; FMO—The Netherlands Development Finance Company
Source: World Bank, 2014.
The government guarantees include some important agreements about the state
rights and obligations of the participating parties in the project. The agreements signed
by the project company and the different government agencies were: (a) an
Implementation Agreement (ImA) with the Ministry of Power, Energy and Mineral
Resources (MPEMR); (b) a Purchasing Agreement (PPA) with Bangladesh Power
Development Board (BPDB); (c) a Gas Supply Agreement (GSA) with Titas
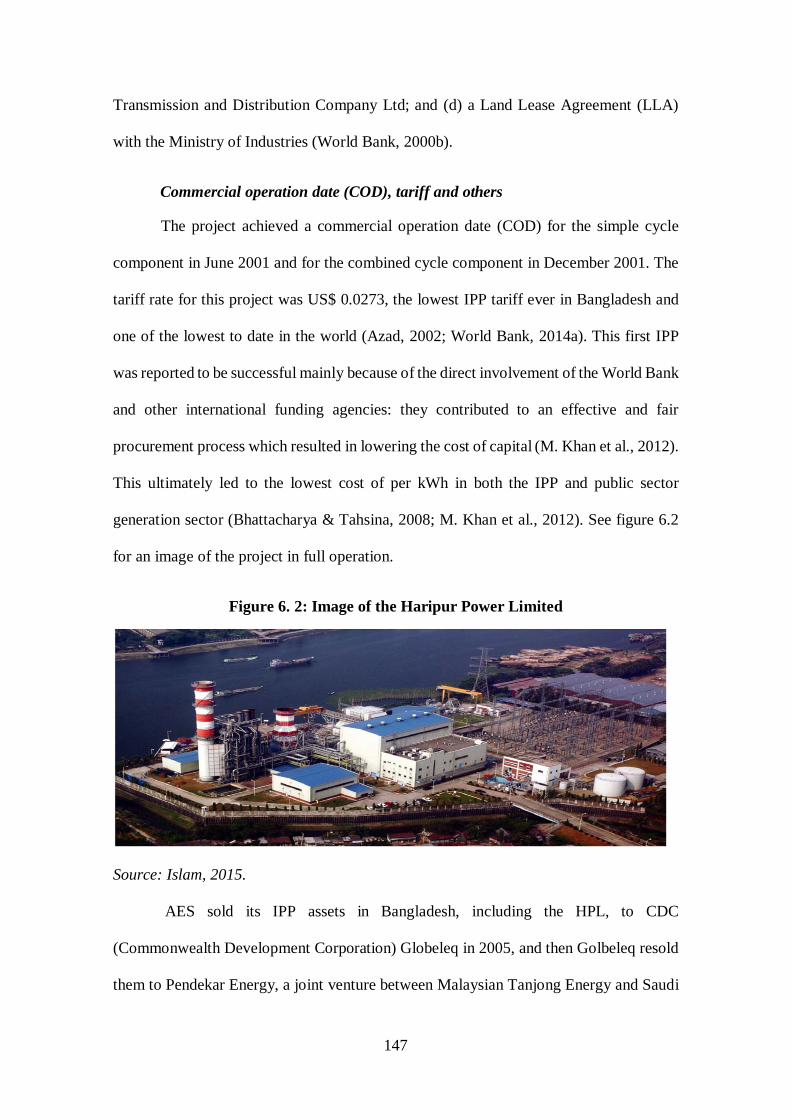
147
Transmission and Distribution Company Ltd; and (d) a Land Lease Agreement (LLA)
with the Ministry of Industries (World Bank, 2000b).
Commercial operation date (COD), tariff and others
The project achieved a commercial operation date (COD) for the simple cycle
component in June 2001 and for the combined cycle component in December 2001. The
tariff rate for this project was US$ 0.0273, the lowest IPP tariff ever in Bangladesh and
one of the lowest to date in the world (Azad, 2002; World Bank, 2014a). This first IPP
was reported to be successful mainly because of the direct involvement of the World Bank
and other international funding agencies: they contributed to an effective and fair
procurement process which resulted in lowering the cost of capital (M. Khan et al., 2012).
This ultimately led to the lowest cost of per kWh in both the IPP and public sector
generation sector (Bhattacharya & Tahsina, 2008; M. Khan et al., 2012). See figure 6.2
for an image of the project in full operation.
Figure 6. 2: Image of the Haripur Power Limited
Source: Islam, 2015.
AES sold its IPP assets in Bangladesh, including the HPL, to CDC
(Commonwealth Development Corporation) Globeleq in 2005, and then Golbeleq resold
them to Pendekar Energy, a joint venture between Malaysian Tanjong Energy and Saudi
148
Aljomiah, in 2007. Both AES and CDC Globeleq sold their businesses in Bangladesh as
a part of their relocation strategy (World Bank, 2000b, 2014a)
Risk allocation
Table 6.4 shows the risks associated with the project, which were allocated to the
private sector (sponsor and lender) and the government.
Table 6. 4: Risk allocation matrix of Haripur Power Limited
Risk type Private sector (Sponsor and lender)
Government
Pre-construction: Design ⃝
Debt-equity financing ⃝
Construction:
Cost overruns ⃝
Schedule delays ⃝
Operation:
Operation and maintenance ⃝
Output quality specification ⃝
Fuel supply availability ⃝ Fuel supply prices ⃝ Tariff payment ⃝ Concession term:
Currency devaluation ⃝ Currency convertibility and trans ⃝ Political force majeure ⃝ Prevention of dispute resolution through arbitration
⃝
Changes in laws ⃝ Expropriation ⃝ Land lease ⃝ Natural force majeure relating to project ⃝
Natural force majeure relating to gas supply and pipeline
⃝
Demand accuracy ⃝ Regulatory risk ⃝
Source: World Bank, 2000a, 2014.
This risk allocation was designed by the World Bank (IFC) particularly for the
HPL when they provided loans and guarantees to this project. However, this model was
later used in most of the IPP projects in Bangladesh, including the selected IPPs described
in this study, with some negotiated modifications. These modifications are listed in the
descriptions of the respective project sections.
149
Outcomes in relation to KPAs
As described previously, the KPAs of PPPs (detailed in chapter 2) are built on the
performance indicators identified by the review of related literature and assigned with
weightings developed by using the AHP (in chapter 5).
Although these KPAs are based on different sectors, the performance areas
(objectives) of the power sector PPPs have relevance to these KPAs, since the PPPs have
some common performance objectives, irrespective of specific sectors. Hence, the KPAs
are considered useful for making a comparative analysis of the project actual outcomes.
The actual outcomes are built on objective information extracted from the description of
the cases. The eight KPAs, including ‘planning and initiation’ (PI), ‘tendering’ (T),
‘construction and operation’ (CO), ‘sustainability of partnerships’ (SP), ‘financing’ (F),
‘transparency and accountability’ (TA), ‘stakeholder satisfaction’ (SS), and
‘socioeconomic development’ (SED), are used in the analysis.
The performance outcomes of the HPL, presented in table 6.5, give objective
information on the performance measures related to each of the KPAs. In light of the KPA
system, the performance outcomes in six KPAs seemed to be fulfilled; they were partially
achieved in two areas: transparency and accountability and socioeconomic development
areas. The life cycle issue of transparency and accountability is a recent phenomenon in
PPP performance evaluation; the long-term benefits (or costs) in relation to socio-
economic development are difficult to be determined.
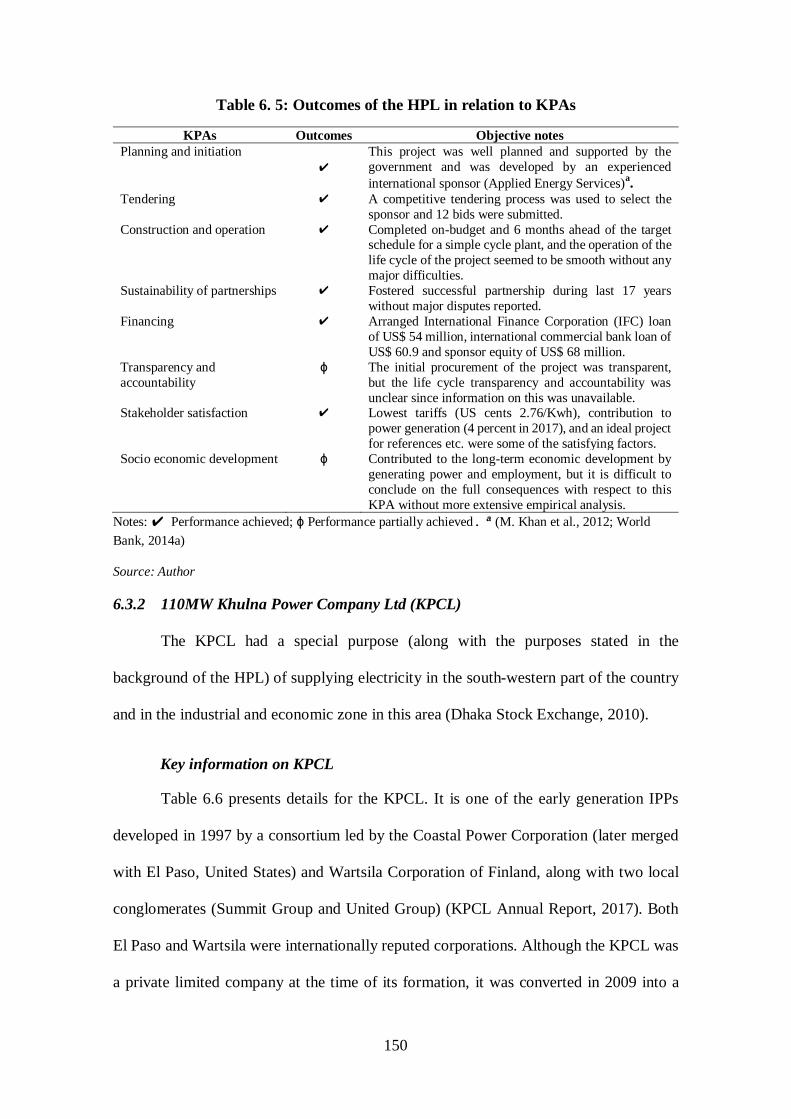
150
Table 6. 5: Outcomes of the HPL in relation to KPAs
KPAs Outcomes Objective notes Planning and initiation
✔ This project was well planned and supported by the government and was developed by an experienced international sponsor (Applied Energy Services)a.
Tendering ✔ A competitive tendering process was used to select the sponsor and 12 bids were submitted.
Construction and operation ✔ Completed on-budget and 6 months ahead of the target schedule for a simple cycle plant, and the operation of the life cycle of the project seemed to be smooth without any major difficulties.
Sustainability of partnerships ✔ Fostered successful partnership during last 17 years without major disputes reported.
Financing ✔ Arranged International Finance Corporation (IFC) loan of US$ 54 million, international commercial bank loan of US$ 60.9 and sponsor equity of US$ 68 million.
Transparency and accountability
ϕ The initial procurement of the project was transparent, but the life cycle transparency and accountability was unclear since information on this was unavailable.
Stakeholder satisfaction ✔ Lowest tariffs (US cents 2.76/Kwh), contribution to power generation (4 percent in 2017), and an ideal project for references etc. were some of the satisfying factors.
Socio economic development ϕ Contributed to the long-term economic development by generating power and employment, but it is difficult to conclude on the full consequences with respect to this KPA without more extensive empirical analysis.
Notes: ✔ Performance achieved; ϕ Performance partially achieved. a (M. Khan et al., 2012; World Bank, 2014a)
Source: Author
6.3.2 110MW Khulna Power Company Ltd (KPCL)
The KPCL had a special purpose (along with the purposes stated in the
background of the HPL) of supplying electricity in the south-western part of the country
and in the industrial and economic zone in this area (Dhaka Stock Exchange, 2010).
Key information on KPCL
Table 6.6 presents details for the KPCL. It is one of the early generation IPPs
developed in 1997 by a consortium led by the Coastal Power Corporation (later merged
with El Paso, United States) and Wartsila Corporation of Finland, along with two local
conglomerates (Summit Group and United Group) (KPCL Annual Report, 2017). Both
El Paso and Wartsila were internationally reputed corporations. Although the KPCL was
a private limited company at the time of its formation, it was converted in 2009 into a
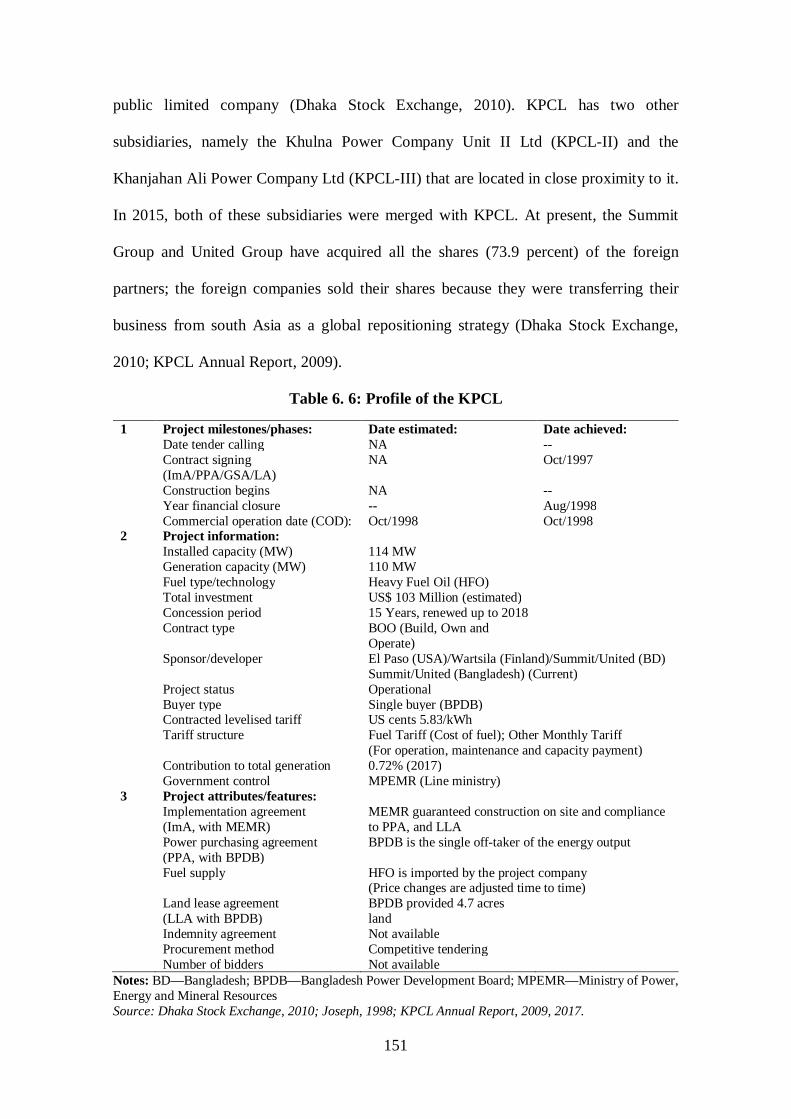
151
public limited company (Dhaka Stock Exchange, 2010). KPCL has two other
subsidiaries, namely the Khulna Power Company Unit II Ltd (KPCL-II) and the
Khanjahan Ali Power Company Ltd (KPCL-III) that are located in close proximity to it.
In 2015, both of these subsidiaries were merged with KPCL. At present, the Summit
Group and United Group have acquired all the shares (73.9 percent) of the foreign
partners; the foreign companies sold their shares because they were transferring their
business from south Asia as a global repositioning strategy (Dhaka Stock Exchange,
2010; KPCL Annual Report, 2009).
Table 6. 6: Profile of the KPCL
1 Project milestones/phases: Date estimated: Date achieved: Date tender calling NA -- Contract signing
(ImA/PPA/GSA/LA) NA Oct/1997
Construction begins NA -- Year financial closure -- Aug/1998 Commercial operation date (COD): Oct/1998 Oct/1998 2 Project information: Installed capacity (MW) 114 MW Generation capacity (MW) 110 MW Fuel type/technology Heavy Fuel Oil (HFO) Total investment US$ 103 Million (estimated) Concession period 15 Years, renewed up to 2018 Contract type BOO (Build, Own and
Operate)
Sponsor/developer El Paso (USA)/Wartsila (Finland)/Summit/United (BD) Summit/United (Bangladesh) (Current)
Project status Operational Buyer type Single buyer (BPDB) Contracted levelised tariff US cents 5.83/kWh Tariff structure Fuel Tariff (Cost of fuel); Other Monthly Tariff
(For operation, maintenance and capacity payment) Contribution to total generation 0.72% (2017) Government control MPEMR (Line ministry) 3 Project attributes/features: Implementation agreement
(ImA, with MEMR) MEMR guaranteed construction on site and compliance to PPA, and LLA
Power purchasing agreement (PPA, with BPDB)
BPDB is the single off-taker of the energy output
Fuel supply HFO is imported by the project company (Price changes are adjusted time to time)
Land lease agreement (LLA with BPDB)
BPDB provided 4.7 acres land
Indemnity agreement Not available Procurement method Competitive tendering Number of bidders Not available
Notes: BD—Bangladesh; BPDB—Bangladesh Power Development Board; MPEMR—Ministry of Power, Energy and Mineral Resources Source: Dhaka Stock Exchange, 2010; Joseph, 1998; KPCL Annual Report, 2009, 2017.
152
The project was developed on a BOO basis, with a concession period of 15 years.
The concession was later renewed for 5 years. The plant is located in a suburb of the
Khulna city. It is the third biggest city in Bangladesh and an industrial hub located in the
south-western part of the country, 259 km driving distance from Dhaka.
Financing, guarantees, and agreements
The US$ 103 million project was financed by equity (US$ 47.8 million), an
International Finance Corporation (IFC) ‘A’ loan and equity (US$ 25.8 million), and an
IFC ‘B’ loan 5 (US$ 29.4 millions) (Joseph, 1998). Equity financing was arranged by the
El Paso Corporation, Wartsila of Finland, and the locally-based Summit and the United
Group (see details in table 6.7). The KPCL signed different agreements with different
government bodies and agencies. These agreements included an Implementation
Agreement (ImA), a Power Purchasing Agreement (PPA), and a Land Lease Agreement
with BPDB (KPCL Annual Report, 2009). The project company itself is responsible for
supplying fuel to the plant; this was paid back by the government as a fuel tariff. The Kuo
Oil Pte Ltd of Singapore has been supplying the necessary fuel to the company through
United Summit Coastal Oil Ltd.
Commercial operation date (COD), tariff and others
The project achieved commercial operation date (COD) for this plant in October
1998 without any schedule delay (KPCL Annual Report, 2009). Figure 6.3 depicts the
KPCL project in full operation. The initial contracted tariff rate was US$ 0.0583/kWh;
5 When an IFC loan includes financing from the market, it retains a portion of the loan for its own account, which is called the ‘A’ Loan, and sells participations in the remaining portion to participants. This is called the ‘B’ Loan.

153
the agreed tariff structure comprises two components—fuel tariff and other monthly tariff
(OMT) (Power Cell, 2006). The fuel tariff is a pass-through item, the cost of which might
change depending on the fluctuation of oil prices in the international oil market, and the
price of fuel cost for each year is indexed in accordance with power purchase agreement.
OMT is calculated based on the electricity volume (MWh) delivered to the grid line
(Dhaka Stock Exchange, 2010).
Table 6. 7: Initial project cost and financing structure of KPCL
Components Estimate (US$ million) Estimated cost 103 Financing structure: Equity: 47.8 Coastal Power Corp., USA (73.9%) 35.32 Wartsila Corp., Finland (6.1%) 2.92 Summit Group (local, 10%) 4.78 United Group (local, 10%) 4.78 Loan (IFC sanction): 55.2 IFC A loan 22.5 IFC Equity 3.3 IFC B loan (Syndicated loan) 29.4 Debt-equity ratio 54:46
Source: Dhaka Stock Exchange, 2010; Joseph, 1998.
Figure 6. 3: Image of the KPCL
Source: Google map
Risk allocation
The risk allocation to the KPCL is quite similar to that of the HPL. A detailed risk
allocation matrix is given in table 6.4. The KPCL differs from the HPL only with respect
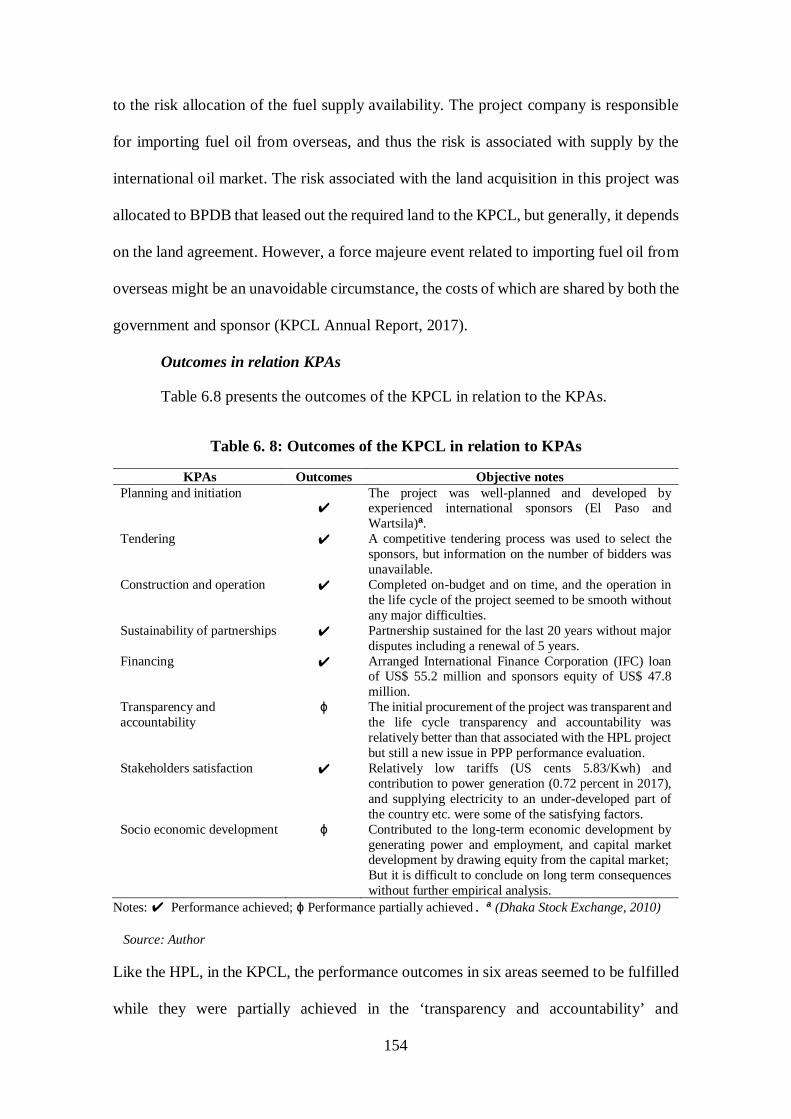
154
to the risk allocation of the fuel supply availability. The project company is responsible
for importing fuel oil from overseas, and thus the risk is associated with supply by the
international oil market. The risk associated with the land acquisition in this project was
allocated to BPDB that leased out the required land to the KPCL, but generally, it depends
on the land agreement. However, a force majeure event related to importing fuel oil from
overseas might be an unavoidable circumstance, the costs of which are shared by both the
government and sponsor (KPCL Annual Report, 2017).
Outcomes in relation KPAs
Table 6.8 presents the outcomes of the KPCL in relation to the KPAs.
Table 6. 8: Outcomes of the KPCL in relation to KPAs
KPAs Outcomes Objective notes Planning and initiation
✔ The project was well-planned and developed by experienced international sponsors (El Paso and Wartsila)a.
Tendering ✔ A competitive tendering process was used to select the sponsors, but information on the number of bidders was unavailable.
Construction and operation ✔ Completed on-budget and on time, and the operation in the life cycle of the project seemed to be smooth without any major difficulties.
Sustainability of partnerships ✔ Partnership sustained for the last 20 years without major disputes including a renewal of 5 years.
Financing ✔ Arranged International Finance Corporation (IFC) loan of US$ 55.2 million and sponsors equity of US$ 47.8 million.
Transparency and accountability
ϕ The initial procurement of the project was transparent and the life cycle transparency and accountability was relatively better than that associated with the HPL project but still a new issue in PPP performance evaluation.
Stakeholders satisfaction ✔ Relatively low tariffs (US cents 5.83/Kwh) and contribution to power generation (0.72 percent in 2017), and supplying electricity to an under-developed part of the country etc. were some of the satisfying factors.
Socio economic development ϕ Contributed to the long-term economic development by generating power and employment, and capital market development by drawing equity from the capital market; But it is difficult to conclude on long term consequences without further empirical analysis.
Notes: ✔ Performance achieved; ϕ Performance partially achieved. a (Dhaka Stock Exchange, 2010)
Source: Author
Like the HPL, in the KPCL, the performance outcomes in six areas seemed to be fulfilled
while they were partially achieved in the ‘transparency and accountability’ and
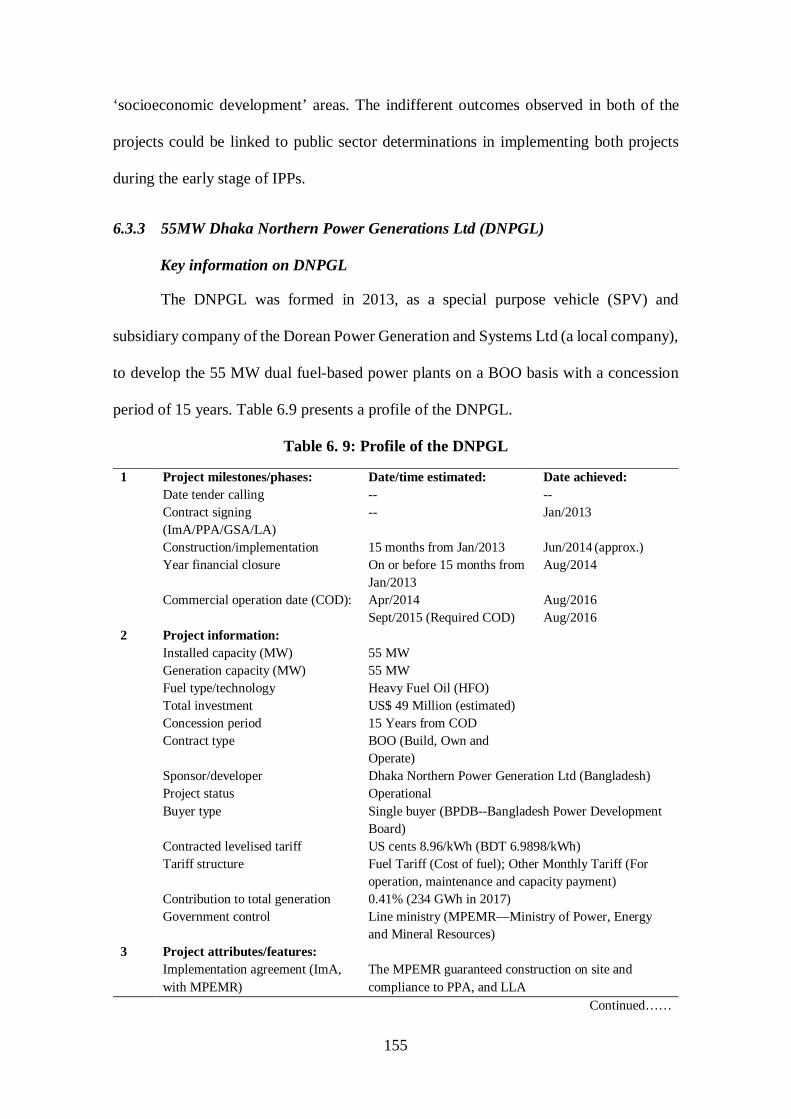
155
‘socioeconomic development’ areas. The indifferent outcomes observed in both of the
projects could be linked to public sector determinations in implementing both projects
during the early stage of IPPs.
6.3.3 55MW Dhaka Northern Power Generations Ltd (DNPGL)
Key information on DNPGL
The DNPGL was formed in 2013, as a special purpose vehicle (SPV) and
subsidiary company of the Dorean Power Generation and Systems Ltd (a local company),
to develop the 55 MW dual fuel-based power plants on a BOO basis with a concession
period of 15 years. Table 6.9 presents a profile of the DNPGL.
Table 6. 9: Profile of the DNPGL
1 Project milestones/phases: Date/time estimated: Date achieved: Date tender calling -- -- Contract signing
(ImA/PPA/GSA/LA) -- Jan/2013
Construction/implementation 15 months from Jan/2013 Jun/2014 (approx.) Year financial closure On or before 15 months from
Jan/2013 Aug/2014
Commercial operation date (COD): Apr/2014 Aug/2016 Sept/2015 (Required COD) Aug/2016 2 Project information: Installed capacity (MW) 55 MW Generation capacity (MW) 55 MW Fuel type/technology Heavy Fuel Oil (HFO) Total investment US$ 49 Million (estimated) Concession period 15 Years from COD Contract type BOO (Build, Own and
Operate)
Sponsor/developer Dhaka Northern Power Generation Ltd (Bangladesh) Project status Operational Buyer type Single buyer (BPDB--Bangladesh Power Development
Board) Contracted levelised tariff US cents 8.96/kWh (BDT 6.9898/kWh) Tariff structure Fuel Tariff (Cost of fuel); Other Monthly Tariff (For
operation, maintenance and capacity payment) Contribution to total generation 0.41% (234 GWh in 2017) Government control Line ministry (MPEMR—Ministry of Power, Energy
and Mineral Resources) 3 Project attributes/features: Implementation agreement (ImA,
with MPEMR) The MPEMR guaranteed construction on site and compliance to PPA, and LLA
Continued……
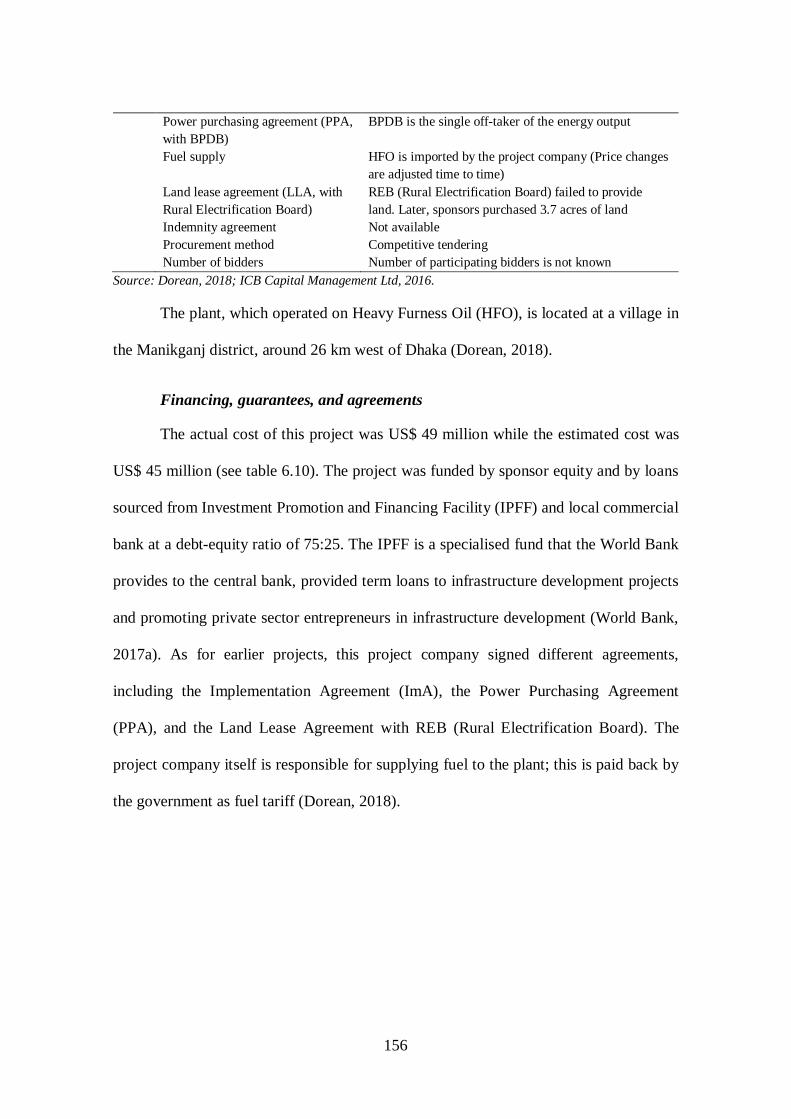
156
Power purchasing agreement (PPA,
with BPDB) BPDB is the single off-taker of the energy output
Fuel supply HFO is imported by the project company (Price changes are adjusted time to time)
Land lease agreement (LLA, with Rural Electrification Board)
REB (Rural Electrification Board) failed to provide land. Later, sponsors purchased 3.7 acres of land
Indemnity agreement Not available Procurement method Competitive tendering Number of bidders Number of participating bidders is not known
Source: Dorean, 2018; ICB Capital Management Ltd, 2016.
The plant, which operated on Heavy Furness Oil (HFO), is located at a village in
the Manikganj district, around 26 km west of Dhaka (Dorean, 2018).
Financing, guarantees, and agreements
The actual cost of this project was US$ 49 million while the estimated cost was
US$ 45 million (see table 6.10). The project was funded by sponsor equity and by loans
sourced from Investment Promotion and Financing Facility (IPFF) and local commercial
bank at a debt-equity ratio of 75:25. The IPFF is a specialised fund that the World Bank
provides to the central bank, provided term loans to infrastructure development projects
and promoting private sector entrepreneurs in infrastructure development (World Bank,
2017a). As for earlier projects, this project company signed different agreements,
including the Implementation Agreement (ImA), the Power Purchasing Agreement
(PPA), and the Land Lease Agreement with REB (Rural Electrification Board). The
project company itself is responsible for supplying fuel to the plant; this is paid back by
the government as fuel tariff (Dorean, 2018).
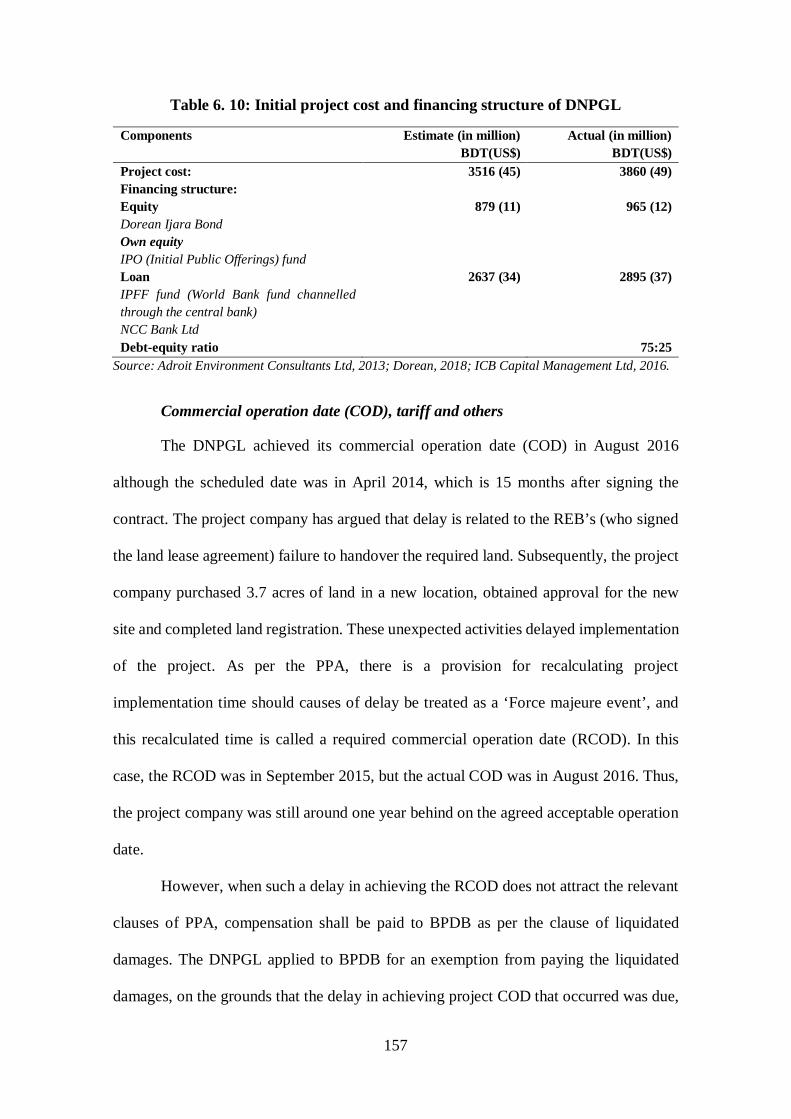
157
Table 6. 10: Initial project cost and financing structure of DNPGL
Components Estimate (in million) BDT(US$)
Actual (in million) BDT(US$)
Project cost: 3516 (45) 3860 (49) Financing structure: Equity 879 (11) 965 (12) Dorean Ijara Bond Own equity IPO (Initial Public Offerings) fund Loan 2637 (34) 2895 (37) IPFF fund (World Bank fund channelled through the central bank)
NCC Bank Ltd Debt-equity ratio 75:25
Source: Adroit Environment Consultants Ltd, 2013; Dorean, 2018; ICB Capital Management Ltd, 2016.
Commercial operation date (COD), tariff and others
The DNPGL achieved its commercial operation date (COD) in August 2016
although the scheduled date was in April 2014, which is 15 months after signing the
contract. The project company has argued that delay is related to the REB’s (who signed
the land lease agreement) failure to handover the required land. Subsequently, the project
company purchased 3.7 acres of land in a new location, obtained approval for the new
site and completed land registration. These unexpected activities delayed implementation
of the project. As per the PPA, there is a provision for recalculating project
implementation time should causes of delay be treated as a ‘Force majeure event’, and
this recalculated time is called a required commercial operation date (RCOD). In this
case, the RCOD was in September 2015, but the actual COD was in August 2016. Thus,
the project company was still around one year behind on the agreed acceptable operation
date.
However, when such a delay in achieving the RCOD does not attract the relevant
clauses of PPA, compensation shall be paid to BPDB as per the clause of liquidated
damages. The DNPGL applied to BPDB for an exemption from paying the liquidated
damages, on the grounds that the delay in achieving project COD that occurred was due,
158
not to the company’s failure, but instead to the REB’s failure to transfer land to them in
due course. The outcome of this exemption application is unclear and so has been
unreported in this document. The initial contracted tariff rate was BDT 6.9898/kWh (US$
0.0896), which represents a similar tariff structure to that applicable to the KPCL (ICB
Capital Management Ltd, 2016).
Risk allocation
Since the DNPGL and DSPGL are similar with respect, for example, to plant
types, ownership, financing source and implementation time, they are considered together
for presenting their risk allocation. The detailed risk allocation matrix (see table 6.4)
provides an overall understanding of the risk allocation. In addition, some other risks
related to land acquisition, currency convertibility and transaction and political force
majeure are discussed later (section 6.3.4). Because the owner of both of these companies
is from Bangladesh, the risk of foreign currency convertibility and transaction is likely to
be less than that associated with the HPL and KPCL projects.
Outcomes in relation to KPAs
The performance objectives in this project have been fulfilled by fewer KPAs
compared to the earlier two projects. The outcomes of this project are presented in table
6.11. The KPAs included ‘tendering’, ‘sustainability of partnerships’, and ‘financing’ in
which the performance objectives were fully achieved in light of the PPP configuration.
The objectives in KPA ‘planning and initiation’, ‘transparency and accountability’,
‘stakeholder satisfaction’, and ‘socioeconomic development’ were only partially
achieved, while the objectives in the ‘construction and operation’ area remained
unfulfilled.
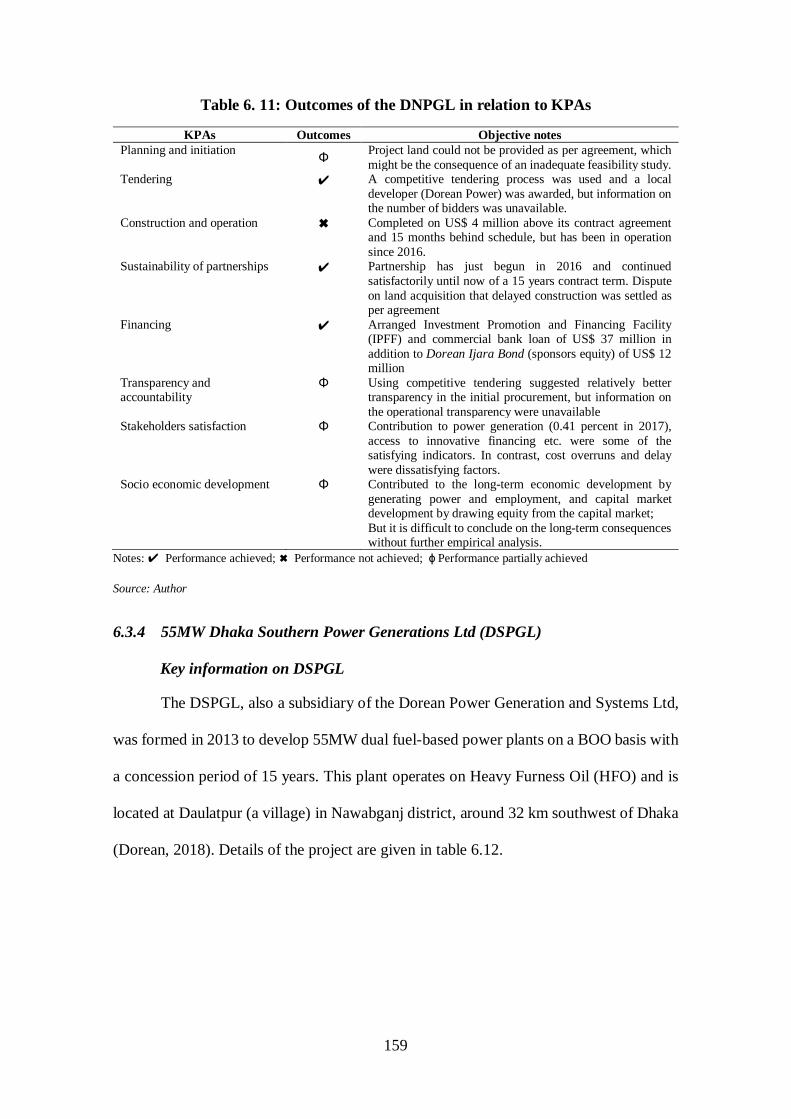
159
Table 6. 11: Outcomes of the DNPGL in relation to KPAs
KPAs Outcomes Objective notes Planning and initiation Φ Project land could not be provided as per agreement, which
might be the consequence of an inadequate feasibility study. Tendering ✔ A competitive tendering process was used and a local
developer (Dorean Power) was awarded, but information on the number of bidders was unavailable.
Construction and operation ✖ Completed on US$ 4 million above its contract agreement and 15 months behind schedule, but has been in operation since 2016.
Sustainability of partnerships ✔ Partnership has just begun in 2016 and continued satisfactorily until now of a 15 years contract term. Dispute on land acquisition that delayed construction was settled as per agreement
Financing ✔ Arranged Investment Promotion and Financing Facility (IPFF) and commercial bank loan of US$ 37 million in addition to Dorean Ijara Bond (sponsors equity) of US$ 12 million
Transparency and accountability
Φ Using competitive tendering suggested relatively better transparency in the initial procurement, but information on the operational transparency were unavailable
Stakeholders satisfaction Φ Contribution to power generation (0.41 percent in 2017), access to innovative financing etc. were some of the satisfying indicators. In contrast, cost overruns and delay were dissatisfying factors.
Socio economic development Φ Contributed to the long-term economic development by generating power and employment, and capital market development by drawing equity from the capital market; But it is difficult to conclude on the long-term consequences without further empirical analysis.
Notes: ✔ Performance achieved; ✖ Performance not achieved; ϕ Performance partially achieved
Source: Author
6.3.4 55MW Dhaka Southern Power Generations Ltd (DSPGL)
Key information on DSPGL
The DSPGL, also a subsidiary of the Dorean Power Generation and Systems Ltd,
was formed in 2013 to develop 55MW dual fuel-based power plants on a BOO basis with
a concession period of 15 years. This plant operates on Heavy Furness Oil (HFO) and is
located at Daulatpur (a village) in Nawabganj district, around 32 km southwest of Dhaka
(Dorean, 2018). Details of the project are given in table 6.12.

160
Table 6. 12: Profile of the DSPGL
1 Project milestones/phases: Date/time estimated: Date achieved: Date tender calling -- -- Contract signing
(ImA/PPA/GSA/LA) -- Jan/2013
Construction begins 15 months from Jan/2013 Not available Year financial closure On or before 15 months from
Jan/2013 Jan/2014
Commercial operation date (COD): Apr/2014 Jun/2016 Jun/2014 (Required COD) Jun/2016 2 Project information: Installed capacity (MW) 55 MW Generation capacity (MW) 55 MW Fuel type/technology Heavy Fuel Oil (HFO) Total investment US$ 47 Million (estimated) Concession period 15 Years from COD Contract type BOO (Build, Own and
Operate)
Sponsor/developer Dhaka Southern Power Generation Ltd (Bangladesh) Project status Operational Buyer type Single buyer (BPDB—Bangladesh Power Development
Board) Contracted levelised tariff US cents 8.96/kWh (BDT 6.9898/kWh) Tariff structure Fuel Tariff (Cost of fuel); Other Monthly Tariff (For
operation, maintenance and capacity payment) Contribution to total generation 0.41% (234 GWh in 2017) Government control Line ministry (MPEMR—Ministry of Power, Energy
and Mineral Resources) 3 Project attributes/features: Implementation agreement (ImA,
with MPEMR) MPEMR guaranteed construction on site and compliance to PPA, and LLA
Power purchasing agreement (PPA, with BPDB)
BPDB is the single off-taker of the energy output
Fuel supply HFO is imported by the project company (Price changes are adjusted time to time)
Land lease agreement (LLA with Rural Electrification Board)
REB provided land.
Indemnity agreement Not available Procurement method Competitive tendering Number of bidders Number of participating bidders is not known
Source: (Dorean, 2018; ICB Capital Management Ltd, 2016).
The project was set up in 7 acres of land provided by the REB as per the LLA
agreement. The land was vacant when the contract was signed and thus there were no
resettlement issues. The project is surrounded by nearby dwellings on two sides and by
agricultural lands on the other two sides. The environmental impact assessment conducted
prior to the COD asserted that there might potentially be adverse environmental impacts
on the surroundings, though those impacts were considered manageable. However, an
environmental impact assessment after implementing the project was suggested to
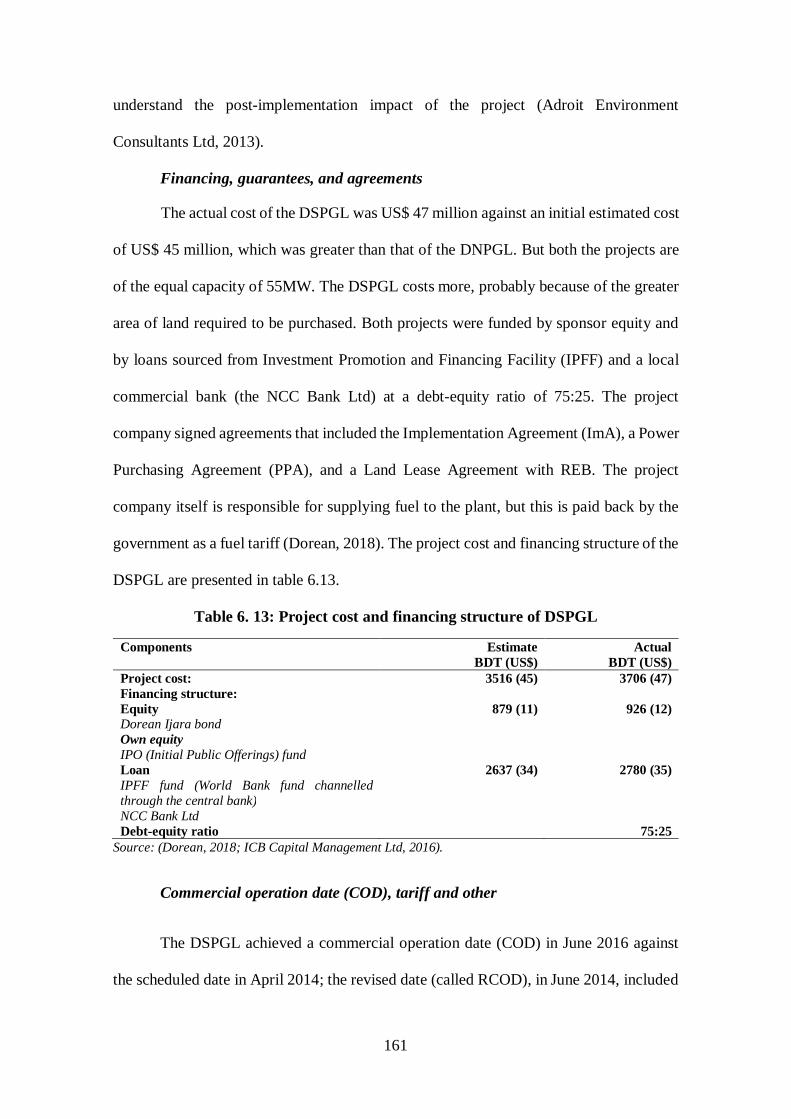
161
understand the post-implementation impact of the project (Adroit Environment
Consultants Ltd, 2013).
Financing, guarantees, and agreements
The actual cost of the DSPGL was US$ 47 million against an initial estimated cost
of US$ 45 million, which was greater than that of the DNPGL. But both the projects are
of the equal capacity of 55MW. The DSPGL costs more, probably because of the greater
area of land required to be purchased. Both projects were funded by sponsor equity and
by loans sourced from Investment Promotion and Financing Facility (IPFF) and a local
commercial bank (the NCC Bank Ltd) at a debt-equity ratio of 75:25. The project
company signed agreements that included the Implementation Agreement (ImA), a Power
Purchasing Agreement (PPA), and a Land Lease Agreement with REB. The project
company itself is responsible for supplying fuel to the plant, but this is paid back by the
government as a fuel tariff (Dorean, 2018). The project cost and financing structure of the
DSPGL are presented in table 6.13.
Table 6. 13: Project cost and financing structure of DSPGL
Components Estimate BDT (US$)
Actual BDT (US$)
Project cost: 3516 (45) 3706 (47) Financing structure: Equity 879 (11) 926 (12) Dorean Ijara bond Own equity IPO (Initial Public Offerings) fund Loan 2637 (34) 2780 (35) IPFF fund (World Bank fund channelled through the central bank)
NCC Bank Ltd Debt-equity ratio 75:25
Source: (Dorean, 2018; ICB Capital Management Ltd, 2016).
Commercial operation date (COD), tariff and other
The DSPGL achieved a commercial operation date (COD) in June 2016 against
the scheduled date in April 2014; the revised date (called RCOD), in June 2014, included
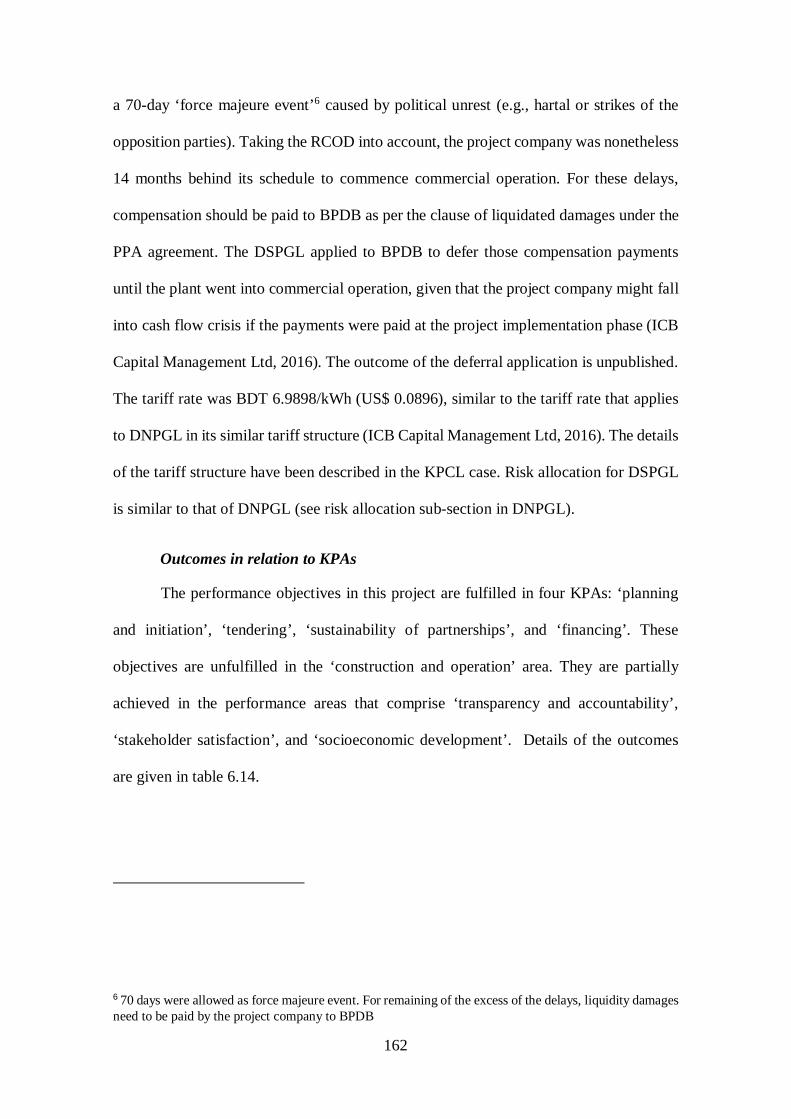
162
a 70-day ‘force majeure event’6 caused by political unrest (e.g., hartal or strikes of the
opposition parties). Taking the RCOD into account, the project company was nonetheless
14 months behind its schedule to commence commercial operation. For these delays,
compensation should be paid to BPDB as per the clause of liquidated damages under the
PPA agreement. The DSPGL applied to BPDB to defer those compensation payments
until the plant went into commercial operation, given that the project company might fall
into cash flow crisis if the payments were paid at the project implementation phase (ICB
Capital Management Ltd, 2016). The outcome of the deferral application is unpublished.
The tariff rate was BDT 6.9898/kWh (US$ 0.0896), similar to the tariff rate that applies
to DNPGL in its similar tariff structure (ICB Capital Management Ltd, 2016). The details
of the tariff structure have been described in the KPCL case. Risk allocation for DSPGL
is similar to that of DNPGL (see risk allocation sub-section in DNPGL).
Outcomes in relation to KPAs
The performance objectives in this project are fulfilled in four KPAs: ‘planning
and initiation’, ‘tendering’, ‘sustainability of partnerships’, and ‘financing’. These
objectives are unfulfilled in the ‘construction and operation’ area. They are partially
achieved in the performance areas that comprise ‘transparency and accountability’,
‘stakeholder satisfaction’, and ‘socioeconomic development’. Details of the outcomes
are given in table 6.14.
6 70 days were allowed as force majeure event. For remaining of the excess of the delays, liquidity damages need to be paid by the project company to BPDB
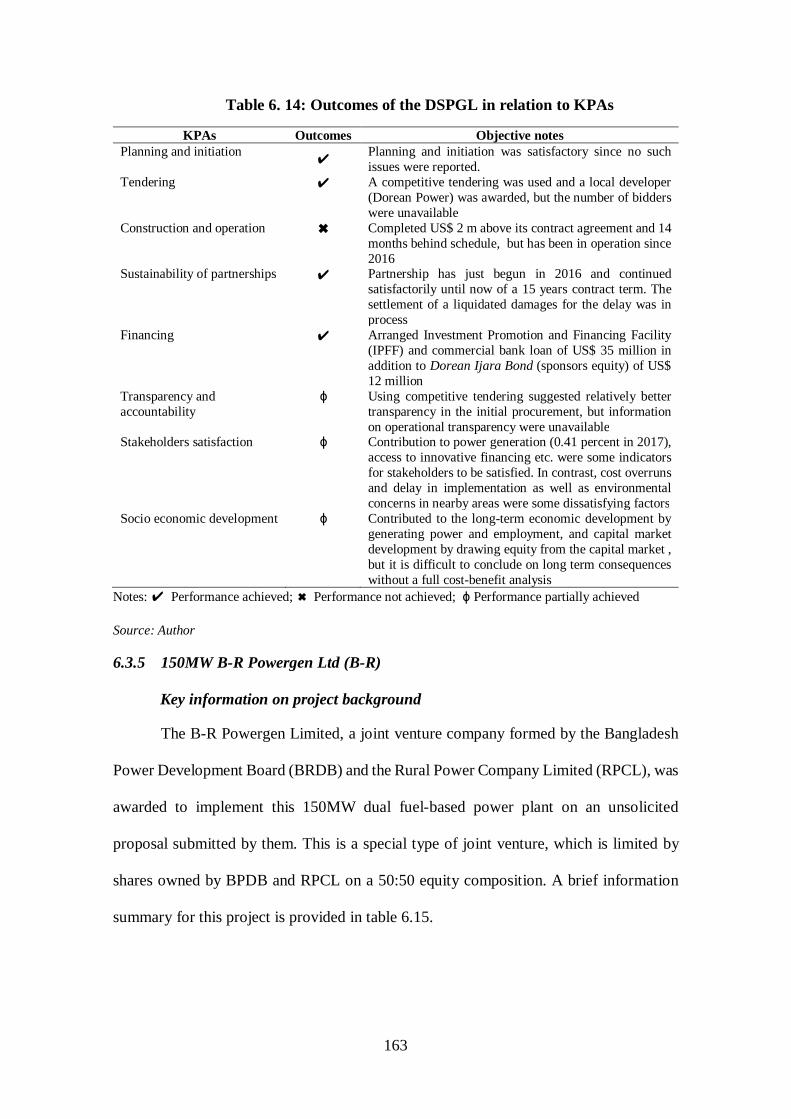
163
Table 6. 14: Outcomes of the DSPGL in relation to KPAs
KPAs Outcomes Objective notes Planning and initiation
✔ Planning and initiation was satisfactory since no such issues were reported.
Tendering ✔ A competitive tendering was used and a local developer (Dorean Power) was awarded, but the number of bidders were unavailable
Construction and operation ✖ Completed US$ 2 m above its contract agreement and 14 months behind schedule, but has been in operation since 2016
Sustainability of partnerships ✔ Partnership has just begun in 2016 and continued satisfactorily until now of a 15 years contract term. The settlement of a liquidated damages for the delay was in process
Financing ✔ Arranged Investment Promotion and Financing Facility (IPFF) and commercial bank loan of US$ 35 million in addition to Dorean Ijara Bond (sponsors equity) of US$ 12 million
Transparency and accountability
ϕ Using competitive tendering suggested relatively better transparency in the initial procurement, but information on operational transparency were unavailable
Stakeholders satisfaction ϕ Contribution to power generation (0.41 percent in 2017), access to innovative financing etc. were some indicators for stakeholders to be satisfied. In contrast, cost overruns and delay in implementation as well as environmental concerns in nearby areas were some dissatisfying factors
Socio economic development ϕ Contributed to the long-term economic development by generating power and employment, and capital market development by drawing equity from the capital market , but it is difficult to conclude on long term consequences without a full cost-benefit analysis
Notes: ✔ Performance achieved; ✖ Performance not achieved; ϕ Performance partially achieved
Source: Author
6.3.5 150MW B-R Powergen Ltd (B-R)
Key information on project background
The B-R Powergen Limited, a joint venture company formed by the Bangladesh
Power Development Board (BRDB) and the Rural Power Company Limited (RPCL), was
awarded to implement this 150MW dual fuel-based power plant on an unsolicited
proposal submitted by them. This is a special type of joint venture, which is limited by
shares owned by BPDB and RPCL on a 50:50 equity composition. A brief information
summary for this project is provided in table 6.15.
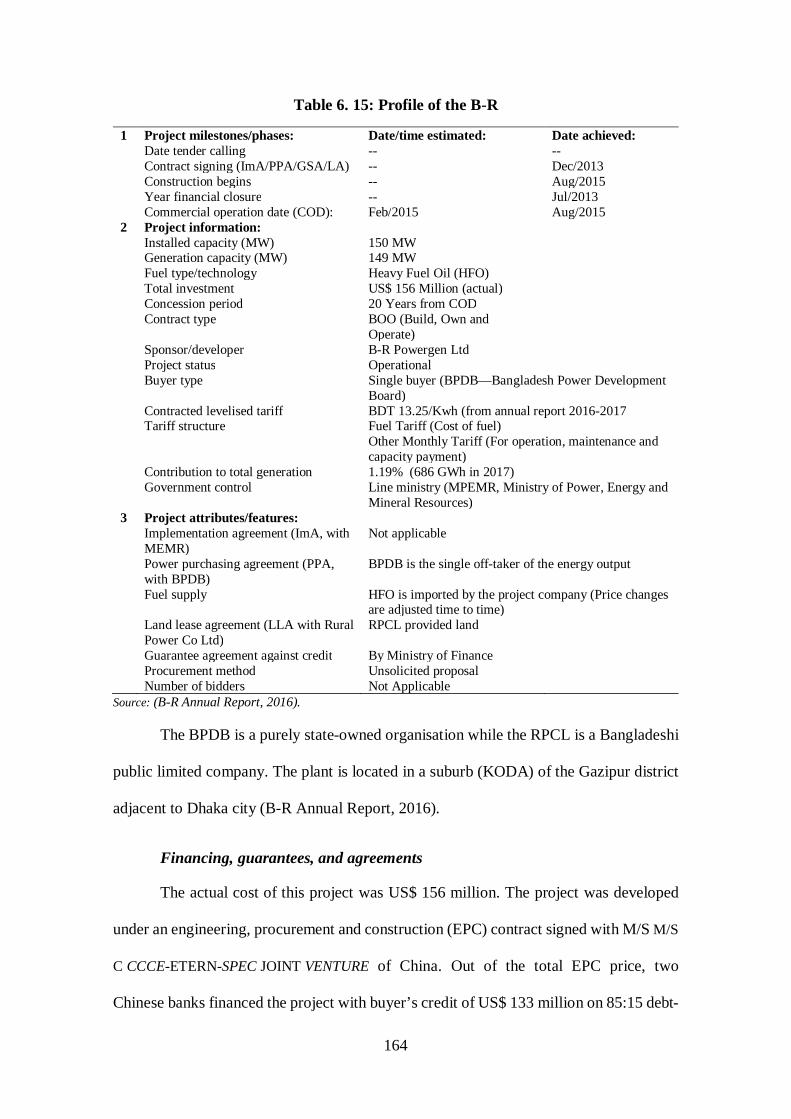
164
Table 6. 15: Profile of the B-R
1 Project milestones/phases: Date/time estimated: Date achieved: Date tender calling -- -- Contract signing (ImA/PPA/GSA/LA) -- Dec/2013 Construction begins -- Aug/2015 Year financial closure -- Jul/2013 Commercial operation date (COD): Feb/2015 Aug/2015 2 Project information: Installed capacity (MW) 150 MW Generation capacity (MW) 149 MW Fuel type/technology Heavy Fuel Oil (HFO) Total investment US$ 156 Million (actual) Concession period 20 Years from COD Contract type BOO (Build, Own and
Operate)
Sponsor/developer B-R Powergen Ltd Project status Operational Buyer type Single buyer (BPDB—Bangladesh Power Development
Board) Contracted levelised tariff BDT 13.25/Kwh (from annual report 2016-2017 Tariff structure Fuel Tariff (Cost of fuel)
Other Monthly Tariff (For operation, maintenance and capacity payment)
Contribution to total generation 1.19% (686 GWh in 2017) Government control Line ministry (MPEMR, Ministry of Power, Energy and
Mineral Resources) 3 Project attributes/features: Implementation agreement (ImA, with
MEMR) Not applicable
Power purchasing agreement (PPA, with BPDB)
BPDB is the single off-taker of the energy output
Fuel supply HFO is imported by the project company (Price changes are adjusted time to time)
Land lease agreement (LLA with Rural Power Co Ltd)
RPCL provided land
Guarantee agreement against credit By Ministry of Finance Procurement method Unsolicited proposal Number of bidders Not Applicable
Source: (B-R Annual Report, 2016).
The BPDB is a purely state-owned organisation while the RPCL is a Bangladeshi
public limited company. The plant is located in a suburb (KODA) of the Gazipur district
adjacent to Dhaka city (B-R Annual Report, 2016).
Financing, guarantees, and agreements
The actual cost of this project was US$ 156 million. The project was developed
under an engineering, procurement and construction (EPC) contract signed with M/S M/S
C CCCE-ETERN-SPEC JOINT VENTURE of China. Out of the total EPC price, two
Chinese banks financed the project with buyer’s credit of US$ 133 million on 85:15 debt-
165
equity ratios (see table 6.16 for). The project company signed a Power Purchasing
Agreement (PPA) with BPDB, as well as a fuel supply agreement with state-owned fuel
companies. The required project land was provided by RPCL as per the land lease
agreement. The government guaranteed to the financiers through a ‘Guarantee Agreement
against Credit’ in case of any repayment defaults by the project company (B-R Annual
Report, 2016).
Table 6. 16: Project cost and financing structure of B-R
Components Estimate BDT (US$)
Actual BDT (US$)
Project cost: 13098 (156) 13098 (156) Financing structure: Equity 1965(23) 1965(23) Buyer’s credit 9988 (133) 9988 (133) Export-import Bank of China Industrial and Commercial Bank of China
Debt-equity ratio 85:15 85:15 Source: B-R Annual Report, 2016.
Commercial operation date (COD), tariff and others
The project was completed on budget, but with a schedule delay of 6 months. The
reasons of the delay were unknown. After starting commercial operation on 16 August,
2015, the plant has successfully been operated for more than one year without any trouble.
The same tariff structure applied to other projects is applicable to this project as well.
However, the tariff rate calculated from the annual report of 2017 of this project was BDT
13.25 /Kwh, including capacity and energy payments, which is higher than that from other
privately owned IPPs (B-R Annual Report, 2016, 2017). The higher tariff rate provided
to state-owned power generation companies created an unfair competitive environment
for private power producers.
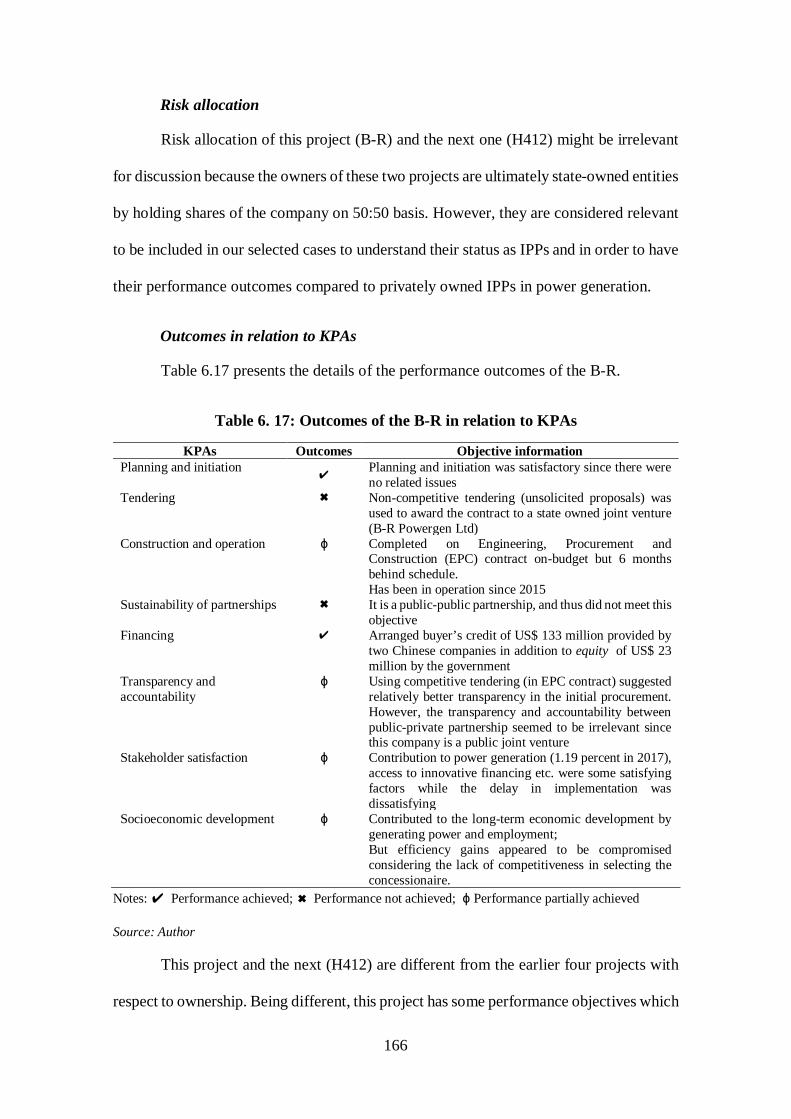
166
Risk allocation
Risk allocation of this project (B-R) and the next one (H412) might be irrelevant
for discussion because the owners of these two projects are ultimately state-owned entities
by holding shares of the company on 50:50 basis. However, they are considered relevant
to be included in our selected cases to understand their status as IPPs and in order to have
their performance outcomes compared to privately owned IPPs in power generation.
Outcomes in relation to KPAs
Table 6.17 presents the details of the performance outcomes of the B-R.
Table 6. 17: Outcomes of the B-R in relation to KPAs
KPAs Outcomes Objective information Planning and initiation
✔ Planning and initiation was satisfactory since there were no related issues
Tendering ✖ Non-competitive tendering (unsolicited proposals) was used to award the contract to a state owned joint venture (B-R Powergen Ltd)
Construction and operation ϕ Completed on Engineering, Procurement and Construction (EPC) contract on-budget but 6 months behind schedule. Has been in operation since 2015
Sustainability of partnerships ✖ It is a public-public partnership, and thus did not meet this objective
Financing ✔ Arranged buyer’s credit of US$ 133 million provided by two Chinese companies in addition to equity of US$ 23 million by the government
Transparency and accountability
ϕ Using competitive tendering (in EPC contract) suggested relatively better transparency in the initial procurement. However, the transparency and accountability between public-private partnership seemed to be irrelevant since this company is a public joint venture
Stakeholder satisfaction ϕ Contribution to power generation (1.19 percent in 2017), access to innovative financing etc. were some satisfying factors while the delay in implementation was dissatisfying
Socioeconomic development ϕ Contributed to the long-term economic development by generating power and employment; But efficiency gains appeared to be compromised considering the lack of competitiveness in selecting the concessionaire.
Notes: ✔ Performance achieved; ✖ Performance not achieved; ϕ Performance partially achieved
Source: Author
This project and the next (H412) are different from the earlier four projects with
respect to ownership. Being different, this project has some performance objectives which
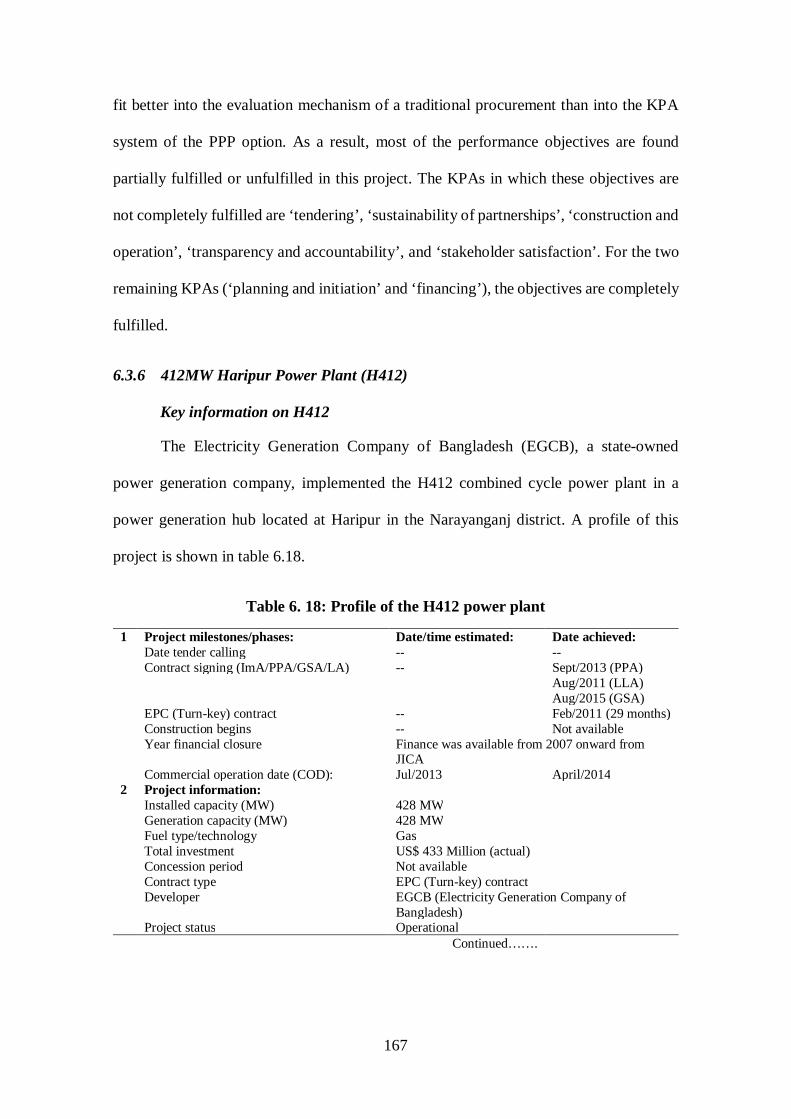
167
fit better into the evaluation mechanism of a traditional procurement than into the KPA
system of the PPP option. As a result, most of the performance objectives are found
partially fulfilled or unfulfilled in this project. The KPAs in which these objectives are
not completely fulfilled are ‘tendering’, ‘sustainability of partnerships’, ‘construction and
operation’, ‘transparency and accountability’, and ‘stakeholder satisfaction’. For the two
remaining KPAs (‘planning and initiation’ and ‘financing’), the objectives are completely
fulfilled.
6.3.6 412MW Haripur Power Plant (H412)
Key information on H412
The Electricity Generation Company of Bangladesh (EGCB), a state-owned
power generation company, implemented the H412 combined cycle power plant in a
power generation hub located at Haripur in the Narayanganj district. A profile of this
project is shown in table 6.18.
Table 6. 18: Profile of the H412 power plant
1 Project milestones/phases: Date/time estimated: Date achieved: Date tender calling -- -- Contract signing (ImA/PPA/GSA/LA) -- Sept/2013 (PPA) Aug/2011 (LLA) Aug/2015 (GSA) EPC (Turn-key) contract -- Feb/2011 (29 months) Construction begins -- Not available Year financial closure Finance was available from 2007 onward from
JICA Commercial operation date (COD): Jul/2013 April/2014 2 Project information: Installed capacity (MW) 428 MW Generation capacity (MW) 428 MW Fuel type/technology Gas Total investment US$ 433 Million (actual) Concession period Not available Contract type EPC (Turn-key) contract Developer EGCB (Electricity Generation Company of
Bangladesh) Project status Operational
Continued…….
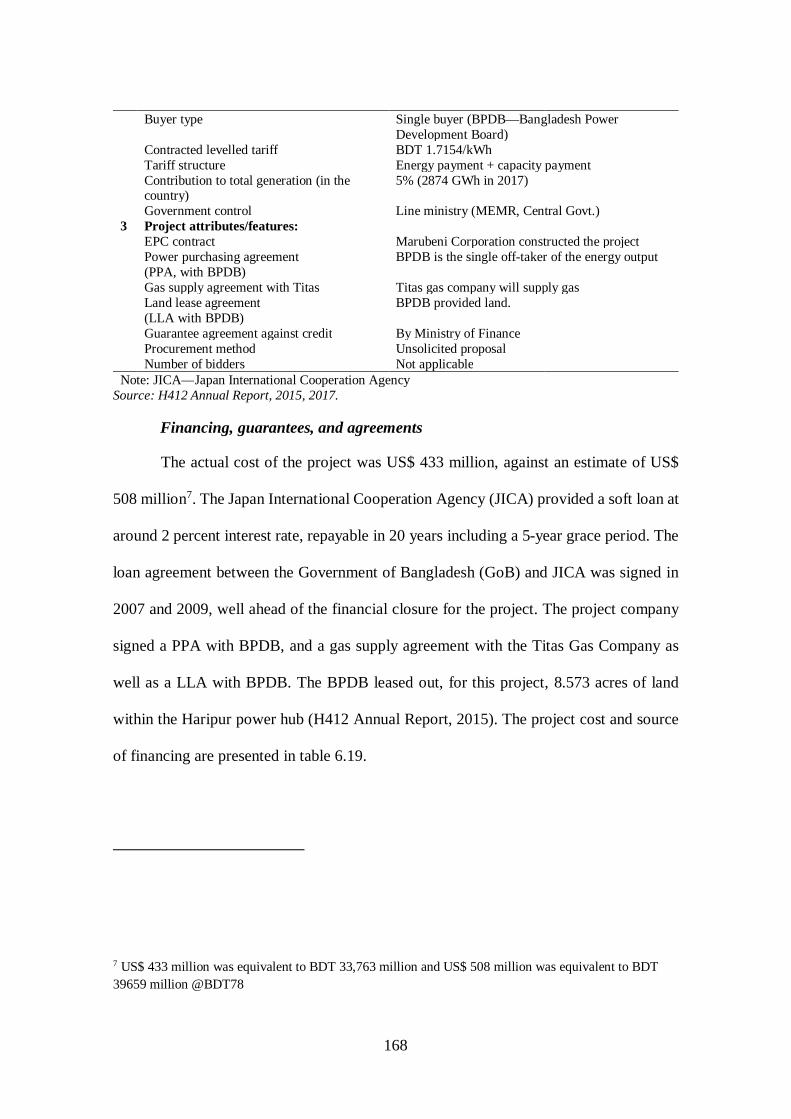
168
Buyer type Single buyer (BPDB—Bangladesh Power
Development Board) Contracted levelled tariff BDT 1.7154/kWh Tariff structure Energy payment + capacity payment Contribution to total generation (in the
country) 5% (2874 GWh in 2017)
Government control Line ministry (MEMR, Central Govt.) 3 Project attributes/features: EPC contract Marubeni Corporation constructed the project Power purchasing agreement
(PPA, with BPDB) BPDB is the single off-taker of the energy output
Gas supply agreement with Titas Titas gas company will supply gas Land lease agreement
(LLA with BPDB) BPDB provided land.
Guarantee agreement against credit By Ministry of Finance Procurement method Unsolicited proposal Number of bidders Not applicable Note: JICA—Japan International Cooperation Agency
Source: H412 Annual Report, 2015, 2017.
Financing, guarantees, and agreements
The actual cost of the project was US$ 433 million, against an estimate of US$
508 million7. The Japan International Cooperation Agency (JICA) provided a soft loan at
around 2 percent interest rate, repayable in 20 years including a 5-year grace period. The
loan agreement between the Government of Bangladesh (GoB) and JICA was signed in
2007 and 2009, well ahead of the financial closure for the project. The project company
signed a PPA with BPDB, and a gas supply agreement with the Titas Gas Company as
well as a LLA with BPDB. The BPDB leased out, for this project, 8.573 acres of land
within the Haripur power hub (H412 Annual Report, 2015). The project cost and source
of financing are presented in table 6.19.
7 US$ 433 million was equivalent to BDT 33,763 million and US$ 508 million was equivalent to BDT 39659 million @BDT78
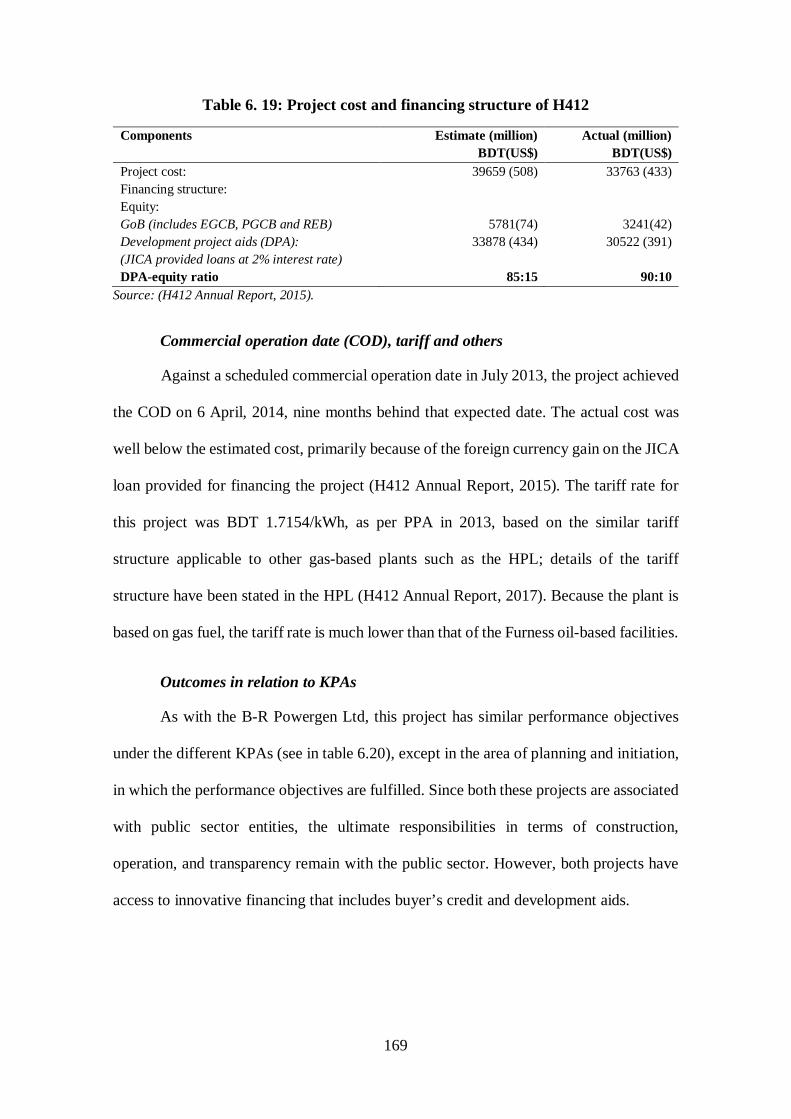
169
Table 6. 19: Project cost and financing structure of H412
Components Estimate (million) BDT(US$)
Actual (million) BDT(US$)
Project cost: 39659 (508) 33763 (433) Financing structure: Equity: GoB (includes EGCB, PGCB and REB) 5781(74) 3241(42) Development project aids (DPA): 33878 (434) 30522 (391) (JICA provided loans at 2% interest rate) DPA-equity ratio 85:15 90:10
Source: (H412 Annual Report, 2015).
Commercial operation date (COD), tariff and others
Against a scheduled commercial operation date in July 2013, the project achieved
the COD on 6 April, 2014, nine months behind that expected date. The actual cost was
well below the estimated cost, primarily because of the foreign currency gain on the JICA
loan provided for financing the project (H412 Annual Report, 2015). The tariff rate for
this project was BDT 1.7154/kWh, as per PPA in 2013, based on the similar tariff
structure applicable to other gas-based plants such as the HPL; details of the tariff
structure have been stated in the HPL (H412 Annual Report, 2017). Because the plant is
based on gas fuel, the tariff rate is much lower than that of the Furness oil-based facilities.
Outcomes in relation to KPAs
As with the B-R Powergen Ltd, this project has similar performance objectives
under the different KPAs (see in table 6.20), except in the area of planning and initiation,
in which the performance objectives are fulfilled. Since both these projects are associated
with public sector entities, the ultimate responsibilities in terms of construction,
operation, and transparency remain with the public sector. However, both projects have
access to innovative financing that includes buyer’s credit and development aids.
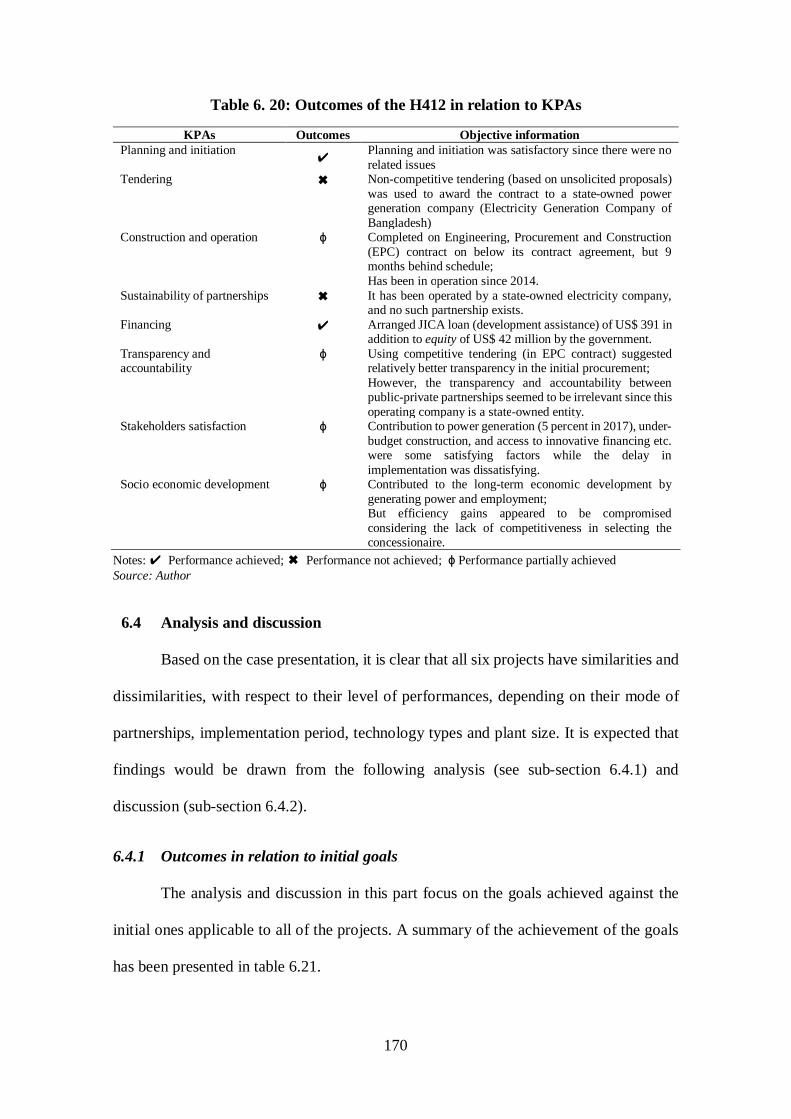
170
Table 6. 20: Outcomes of the H412 in relation to KPAs
KPAs Outcomes Objective information Planning and initiation
✔ Planning and initiation was satisfactory since there were no related issues
Tendering ✖ Non-competitive tendering (based on unsolicited proposals) was used to award the contract to a state-owned power generation company (Electricity Generation Company of Bangladesh)
Construction and operation ϕ Completed on Engineering, Procurement and Construction (EPC) contract on below its contract agreement, but 9 months behind schedule; Has been in operation since 2014.
Sustainability of partnerships ✖ It has been operated by a state-owned electricity company, and no such partnership exists.
Financing ✔ Arranged JICA loan (development assistance) of US$ 391 in addition to equity of US$ 42 million by the government.
Transparency and accountability
ϕ Using competitive tendering (in EPC contract) suggested relatively better transparency in the initial procurement; However, the transparency and accountability between public-private partnerships seemed to be irrelevant since this operating company is a state-owned entity.
Stakeholders satisfaction ϕ Contribution to power generation (5 percent in 2017), under-budget construction, and access to innovative financing etc. were some satisfying factors while the delay in implementation was dissatisfying.
Socio economic development ϕ Contributed to the long-term economic development by generating power and employment; But efficiency gains appeared to be compromised considering the lack of competitiveness in selecting the concessionaire.
Notes: ✔ Performance achieved; ✖ Performance not achieved; ϕ Performance partially achieved Source: Author
6.4 Analysis and discussion
Based on the case presentation, it is clear that all six projects have similarities and
dissimilarities, with respect to their level of performances, depending on their mode of
partnerships, implementation period, technology types and plant size. It is expected that
findings would be drawn from the following analysis (see sub-section 6.4.1) and
discussion (sub-section 6.4.2).
6.4.1 Outcomes in relation to initial goals
The analysis and discussion in this part focus on the goals achieved against the
initial ones applicable to all of the projects. A summary of the achievement of the goals
has been presented in table 6.21.
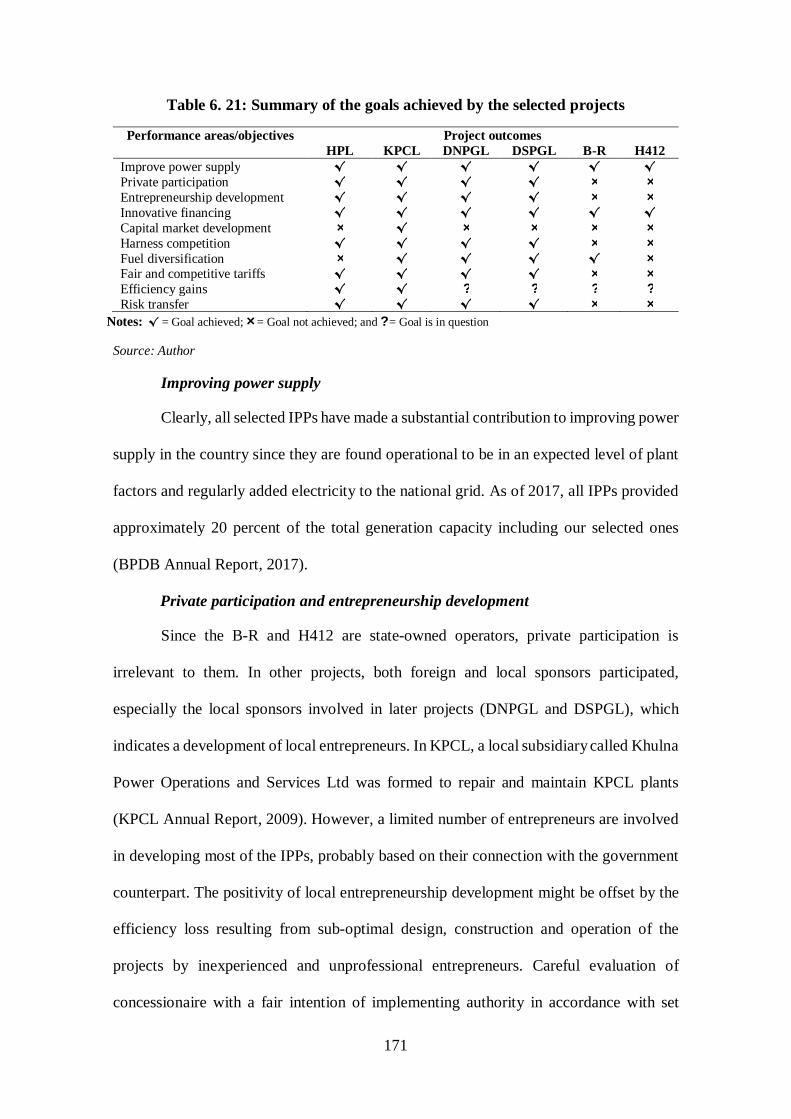
171
Table 6. 21: Summary of the goals achieved by the selected projects
Performance areas/objectives Project outcomes HPL KPCL DNPGL DSPGL B-R H412
Improve power supply √ √ √ √ √ √ Private participation √ √ √ √ × × Entrepreneurship development √ √ √ √ × × Innovative financing √ √ √ √ √ √ Capital market development × √ × × × × Harness competition √ √ √ √ × × Fuel diversification × √ √ √ √ × Fair and competitive tariffs √ √ √ √ × × Efficiency gains √ √ ? ? ? ? Risk transfer √ √ √ √ × ×
Notes: √ = Goal achieved; × = Goal not achieved; and ? = Goal is in question
Source: Author
Improving power supply
Clearly, all selected IPPs have made a substantial contribution to improving power
supply in the country since they are found operational to be in an expected level of plant
factors and regularly added electricity to the national grid. As of 2017, all IPPs provided
approximately 20 percent of the total generation capacity including our selected ones
(BPDB Annual Report, 2017).
Private participation and entrepreneurship development
Since the B-R and H412 are state-owned operators, private participation is
irrelevant to them. In other projects, both foreign and local sponsors participated,
especially the local sponsors involved in later projects (DNPGL and DSPGL), which
indicates a development of local entrepreneurs. In KPCL, a local subsidiary called Khulna
Power Operations and Services Ltd was formed to repair and maintain KPCL plants
(KPCL Annual Report, 2009). However, a limited number of entrepreneurs are involved
in developing most of the IPPs, probably based on their connection with the government
counterpart. The positivity of local entrepreneurship development might be offset by the
efficiency loss resulting from sub-optimal design, construction and operation of the
projects by inexperienced and unprofessional entrepreneurs. Careful evaluation of
concessionaire with a fair intention of implementing authority in accordance with set
172
guidelines and strict coherence could reduce the likelihood of selecting inappropriate
entrepreneurs.
Innovative financing and capital market development
Financing has been perceived to be one of the most important performance areas
of PPPs in Bangladesh (Hossain, Guest, & Smith, 2018b), and scarcity of finances for
undertaking mega power projects has motivated the government in Bangladesh to search
for innovative financing (UNCTAD, 2013). Coming out of the dependency on budgetary
allocation for power project development, the government was initially successful in
attracting the World Bank and other international commercial lenders to invest in power
generation projects (M. Khan et al., 2012). For example, International Finance
Corporation (IFC) provided a loan to Haripur Power Ltd (HPL) and KPCL, and local
investors of the DNPGL and DSPGL arranged commercial loans from a local bank
(NCCBL). Specifically, the B-R and H412 projects were able to have access to truly
innovative financing. The B-R arranged buyer’s credit from two Chinese banks (Export-
import Bank of China and Industrial and Commercial Bank of China) backed by the
government, and the H412 organised finance from JICA in the form of development
project aids (DPA).
However, the local commercial banks are unable to provide large-scale loans
because they have limitations imposed by the central bank. They provide small-sized
loans (57 million US$ is the highest until now), but mega power projects usually require
more than 100 million dollars (World Bank, 2015). Thus, it seems that the involvement
of the World Bank and its associated organisations played an important role for the HPL
and KPCL projects to be successful IPPs in Bangladesh. Other projects appear to be
performing less well, considering, for example, their cost and schedule performance.
173
Harness competition
The competitive and fair bidding process was obviously rewarding in case of HPL
and KPCL. However, it seemed to be inconclusive with respect to DNPGL and DSPGL.
Unsolicited proposals in case of the B-R and H412 limited the scope of competition,
which might act to hamper efficiency gains to be achieved from these projects. In earlier
studies, competitive tendering was considered a pre-requisite to a successful IPP in
Bangladesh and in other countries (M. Khan et al., 2012; T. Liu et al., 2016).
Fuel diversification
Natural gas was the primary fuel for most of the IPPs in the first and second phase
in Bangladesh. But most of the recently developed power plants are based on imported
heavy fuel oil (BPDB Annual Report, 2017). This certainly reduced pressure on primary
fuel and diversified the fuel sources drawn by future plants. However, oil-based power
plants are expensive and in the long run, they may be cost-ineffective (Phadke, 2009). It
is also highly likely that irregularities might take place through showing higher fuel
consumption than the standard amount agreed. For instance, some receivables of the
KPCL remained unpaid by the BPDB (buyer) on the basis of being unhappy with the
higher fuel consumption (KPCL Annual Report, 2017). Additionally, offloading of
imported fuel oil and transporting it to the plant sites seemed to be difficult for all projects
except the HPL project, which operates on gas. This goal is considered to be achieved if
the plant is operated on a fuel other than gas.
Fair and competitive tariff & efficiency gains
The tariff rates for the HPL project were one of the lowest tariffs applicable in the
private sector power generation sector, while the rate for KPCL was relatively higher
because of the use of heavy fuel oil in the plant. The fuel-oil-based IPPs represent a
costlier option than a gas-based one because of the higher price of oil in the international
174
oil market. Furthermore, the rate for DNPGL and DSPGL was even higher since these
were recent power plants procured with relatively higher prices incurred for equipment,
and they operated on an increased cost of fuel oil. The B-R was also provided with a
relatively higher tariff rate of BDT 13/Kwh (levelised tariff) while the H412 was awarded
a rate that was close to the rates of other gas-based IPPs. Clearly, the tariff rate is different
for public and private sector producers based on their ownership, technology types and
contract terms. A competitive tariff of different types is desirable, but inappropriate
pricing might discourage competitors including international bidders. Thus,
benchmarking of the tariff is needed to ensure competitive pricing for both local and
foreign investors.
The government, however, provides subsidies to bridge the gap between
generation cost and selling prices of electricity to ensure affordable and reliable electricity
to all by 2021. The single-buyer option guaranteed the purchase of electricity with no
price shocks and made the investment risk-free in IPPs. Further, the fuel cost of
generating power is also paid back by the government in the form of an energy payment
within the tariff structure. On the other hand, foreign investors seem to be uncomfortable
with the long-term ability of the government to pay for the generated electricity (World
Bank, 2015). Given this, a fair and competitive tariff rate might act as a strong incentive
to gain the confidence of the investors. Gaining their confidence could provide a
foundation for making IPPs cost-effective that would ultimately contribute to efficiency
gains.
Risk allocation
With regards to risk transfer to the IPPs, mixed results are evident. Ideally, risks
related to design and construction, part of the operation and natural force majeure were
transferred to private sponsors in all six projects. Other risks that include the cost of fuel,
175
revenues, political force majeure, land acquisition, and regulatory risk, remained with the
government through various government guarantees and agreements. The justification of
these risks to be with the government might be that private sponsors individually would
be unable to mitigate these risks without the support of the government. However, the
fuel supply risk of all projects, with the exception of the HPL, was with the sponsors since
the fuel oil was directly imported by them from overseas. The HPL is run on gas that is
locally supplied by the state-owned Tits Gas Company.
The case presentation in this chapter reveals that cost overruns and schedule delay
were common features in most of the selected projects while the interest in using the PPP
option in different sectors, including the power sector, has recently expanded in
Bangladesh. Except for the HPL and KPCL, the other four projects missed the deadline
of achieving the pre-specified commercial operation date. The delays ranged from six to
fifteen months in four projects; the highest one being with the DNPGL. Likewise, three
out of the same four projects were completed beyond the estimated cost, but the H412
was completed at less cost than the initial estimate by US$ 75 million, primarily because
of the foreign currency gains from the JICA loan. Cost overruns are generally linked to
the delay of project completion. In earlier reporting, the schedule lapses in completing
airport and transport PPPs in Bangladesh have been documented (ADB, 2017). Similarly,
they are commonly reported in other developing countries as well (Almarri &
Boussabaine, 2017). However, the HPL and KPCL performed satisfactorily, especially
with respect to cost and time considerations.
The analysis and discussion on the experiences of the six projects suggest that
performance objectives (areas) that include improving power supply and innovative
financing are fulfilled in both the public and private sector power projects. Conversely,
the performance areas such as private participation, entrepreneurship development,
176
competition, competitive tariffs, and risk transfer are achieved only in the projects
operated by private sector sponsors, and unfulfilled in the projects operated by public
sector entities. These performance areas are generally unexpected when the public sector
is involved in power generation. Additionally, the participation of foreign investors has
limited the scope of local capital market development, which happened in the case HPL.
Since the HPL is unlisted in the local capital market, it has made no contribution to local
capital market development.
The analysis in this chapter as well as the understanding gained from the related
literature (N. Islam, 2015; M. Khan et al., 2012; S. Khan, 2007) reveal that the public
sector commitment/determination in Bangladesh seems to be more important than the
enactment of legislation for the success of the power sector PPPs. Applying laws depends
on the institutional qualities, which are generally deficient in developing countries
including Bangladesh, as indicated by existing literature (Hammami et al., 2006;
Panayides et al., 2015). The sincerity of the government contributed to making the HPL
and KPCL successful in terms of all aspects of PPP configuration. The public sector
determination seemed to have helped overcome policy hurdles in both these projects,
while their unwillingness could affect any of the performance areas even in the presence
of required policy support from the government. Because of the strong commitment of
the government, foreign companies participated in bidding for the initial IPPs: two
(Applied Energy Services and El Paso) won the contract in a fair and transparent
tendering process, for developing the HPL and KPCL respectively. According to the
World Bank, the government provided sincere support and showed uncompromising
attitudes to any other vested interest to implement these projects. As a result, both the
projects are considered to have achieved value for money and thus efficiency gains
(World Bank, 2014a). However, to understand efficiency gains conclusively in the long
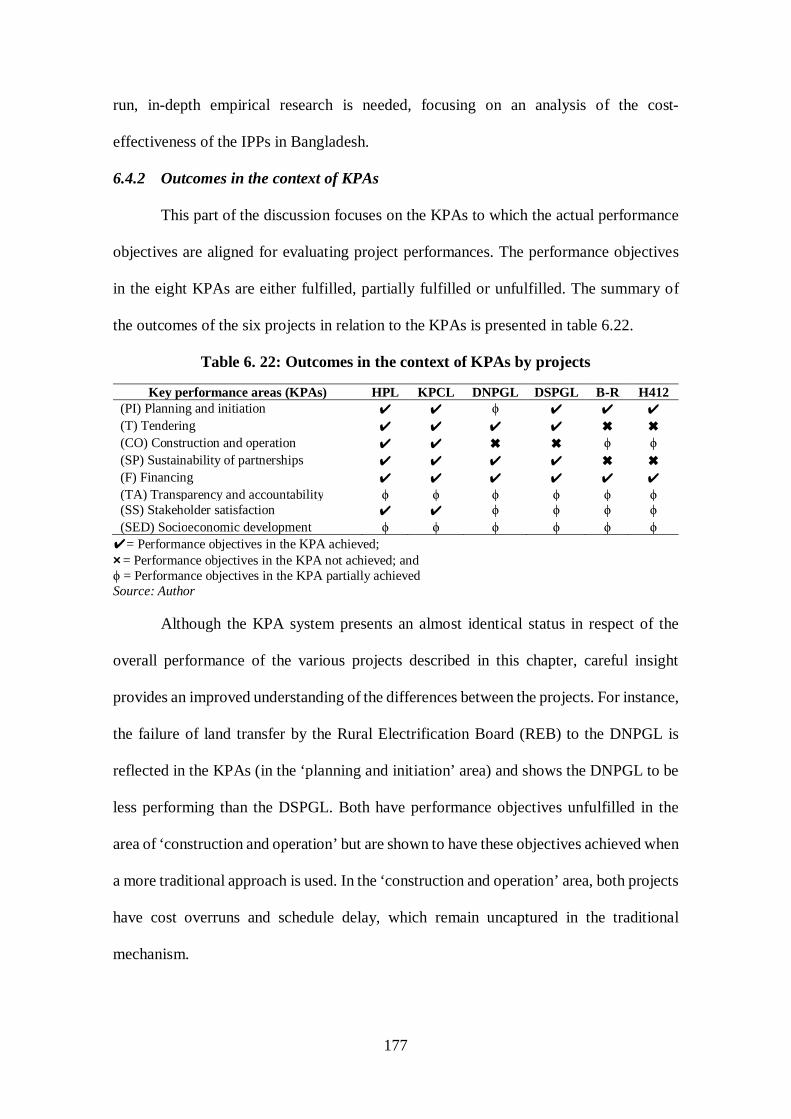
177
run, in-depth empirical research is needed, focusing on an analysis of the cost-
effectiveness of the IPPs in Bangladesh.
6.4.2 Outcomes in the context of KPAs
This part of the discussion focuses on the KPAs to which the actual performance
objectives are aligned for evaluating project performances. The performance objectives
in the eight KPAs are either fulfilled, partially fulfilled or unfulfilled. The summary of
the outcomes of the six projects in relation to the KPAs is presented in table 6.22.
Table 6. 22: Outcomes in the context of KPAs by projects
Key performance areas (KPAs) HPL KPCL DNPGL DSPGL B-R H412 (PI) Planning and initiation ✔ ✔ ϕ ✔ ✔ ✔ (T) Tendering ✔ ✔ ✔ ✔ ✖ ✖ (CO) Construction and operation ✔ ✔ ✖ ✖ ϕ ϕ (SP) Sustainability of partnerships ✔ ✔ ✔ ✔ ✖ ✖ (F) Financing ✔ ✔ ✔ ✔ ✔ ✔ (TA) Transparency and accountability ϕ ϕ ϕ ϕ ϕ ϕ (SS) Stakeholder satisfaction ✔ ✔ ϕ ϕ ϕ ϕ (SED) Socioeconomic development ϕ ϕ ϕ ϕ ϕ ϕ ✔= Performance objectives in the KPA achieved; × = Performance objectives in the KPA not achieved; and ϕ = Performance objectives in the KPA partially achieved Source: Author
Although the KPA system presents an almost identical status in respect of the
overall performance of the various projects described in this chapter, careful insight
provides an improved understanding of the differences between the projects. For instance,
the failure of land transfer by the Rural Electrification Board (REB) to the DNPGL is
reflected in the KPAs (in the ‘planning and initiation’ area) and shows the DNPGL to be
less performing than the DSPGL. Both have performance objectives unfulfilled in the
area of ‘construction and operation’ but are shown to have these objectives achieved when
a more traditional approach is used. In the ‘construction and operation’ area, both projects
have cost overruns and schedule delay, which remain uncaptured in the traditional
mechanism.
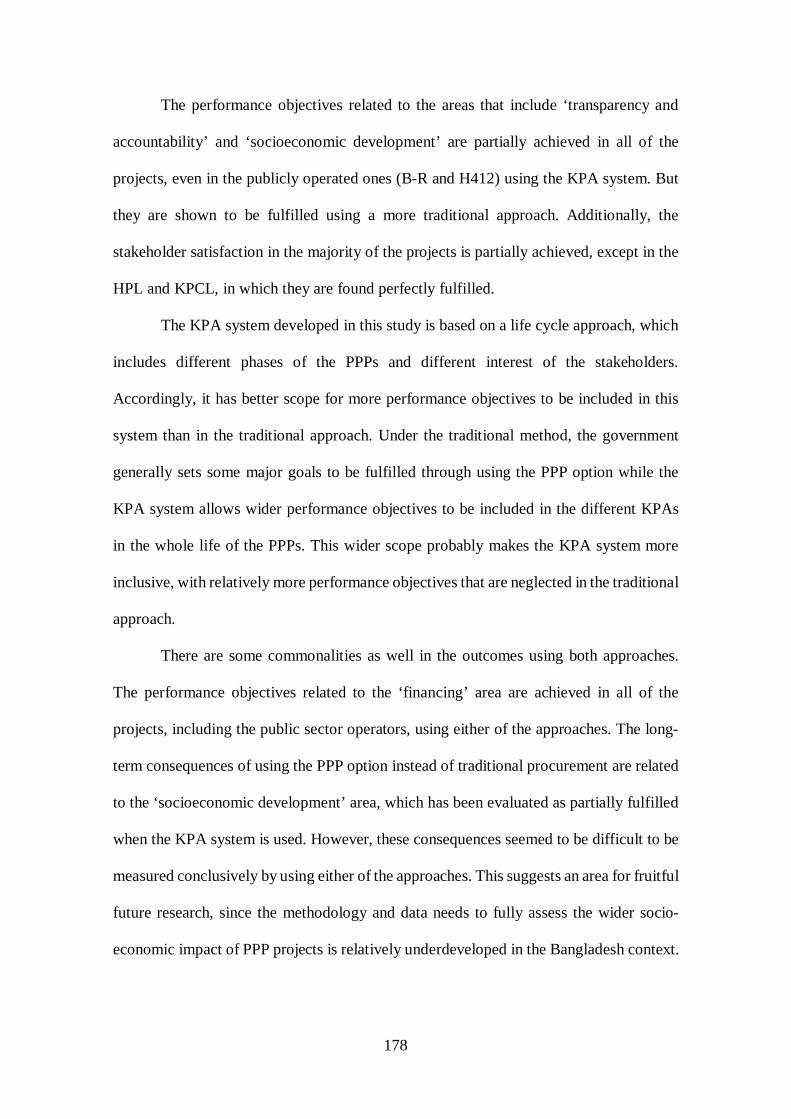
178
The performance objectives related to the areas that include ‘transparency and
accountability’ and ‘socioeconomic development’ are partially achieved in all of the
projects, even in the publicly operated ones (B-R and H412) using the KPA system. But
they are shown to be fulfilled using a more traditional approach. Additionally, the
stakeholder satisfaction in the majority of the projects is partially achieved, except in the
HPL and KPCL, in which they are found perfectly fulfilled.
The KPA system developed in this study is based on a life cycle approach, which
includes different phases of the PPPs and different interest of the stakeholders.
Accordingly, it has better scope for more performance objectives to be included in this
system than in the traditional approach. Under the traditional method, the government
generally sets some major goals to be fulfilled through using the PPP option while the
KPA system allows wider performance objectives to be included in the different KPAs
in the whole life of the PPPs. This wider scope probably makes the KPA system more
inclusive, with relatively more performance objectives that are neglected in the traditional
approach.
There are some commonalities as well in the outcomes using both approaches.
The performance objectives related to the ‘financing’ area are achieved in all of the
projects, including the public sector operators, using either of the approaches. The long-
term consequences of using the PPP option instead of traditional procurement are related
to the ‘socioeconomic development’ area, which has been evaluated as partially fulfilled
when the KPA system is used. However, these consequences seemed to be difficult to be
measured conclusively by using either of the approaches. This suggests an area for fruitful
future research, since the methodology and data needs to fully assess the wider socio-
economic impact of PPP projects is relatively underdeveloped in the Bangladesh context.
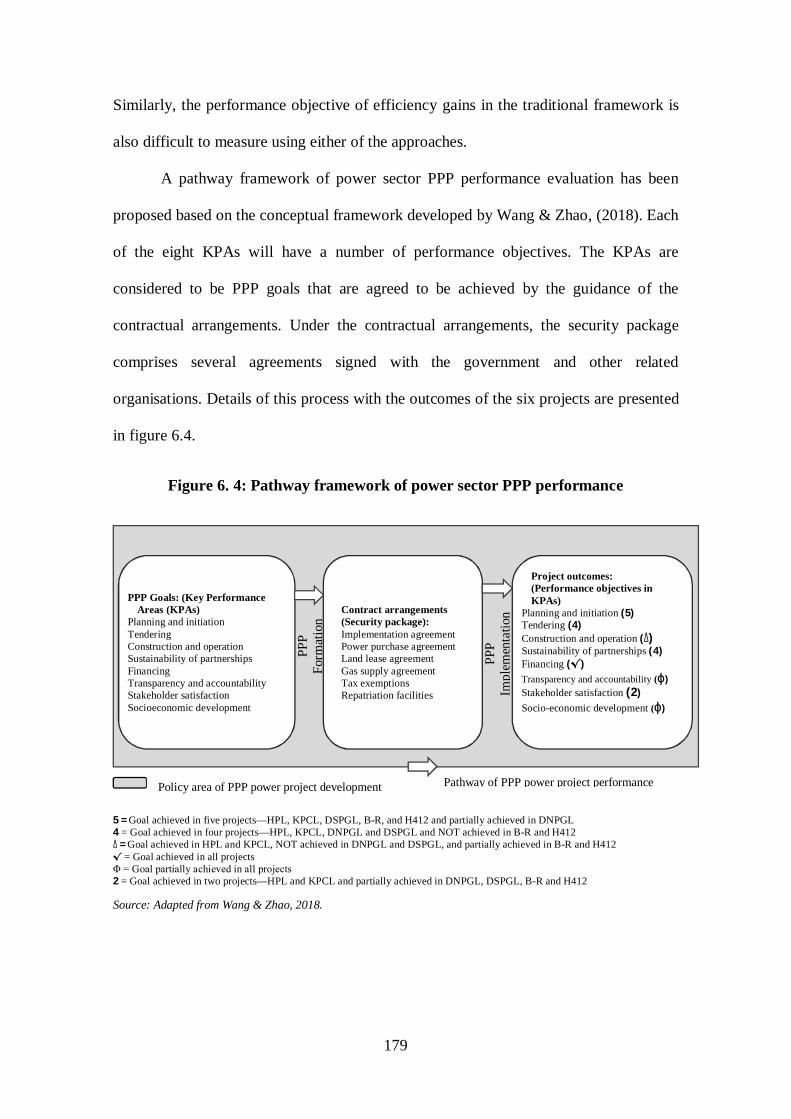
179
Similarly, the performance objective of efficiency gains in the traditional framework is
also difficult to measure using either of the approaches.
A pathway framework of power sector PPP performance evaluation has been
proposed based on the conceptual framework developed by Wang & Zhao, (2018). Each
of the eight KPAs will have a number of performance objectives. The KPAs are
considered to be PPP goals that are agreed to be achieved by the guidance of the
contractual arrangements. Under the contractual arrangements, the security package
comprises several agreements signed with the government and other related
organisations. Details of this process with the outcomes of the six projects are presented
in figure 6.4.
Figure 6. 4: Pathway framework of power sector PPP performance
5 = Goal achieved in five projects—HPL, KPCL, DSPGL, B-R, and H412 and partially achieved in DNPGL 4 = Goal achieved in four projects—HPL, KPCL, DNPGL and DSPGL and NOT achieved in B-R and H412 ∆ = Goal achieved in HPL and KPCL, NOT achieved in DNPGL and DSPGL, and partially achieved in B-R and H412 √ = Goal achieved in all projects Φ = Goal partially achieved in all projects 2 = Goal achieved in two projects—HPL and KPCL and partially achieved in DNPGL, DSPGL, B-R and H412
Source: Adapted from Wang & Zhao, 2018.
PPP
Impl
emen
tatio
n
PPP
Form
atio
n
PPP Goals: (Key Performance Areas (KPAs)
Planning and initiation Tendering Construction and operation Sustainability of partnerships Financing Transparency and accountability Stakeholder satisfaction Socioeconomic development
Contract arrangements (Security package): Implementation agreement Power purchase agreement Land lease agreement Gas supply agreement Tax exemptions Repatriation facilities
Project outcomes: (Performance objectives in KPAs)
Planning and initiation (5) Tendering (4) Construction and operation (∆) Sustainability of partnerships (4) Financing (√) Transparency and accountability (ϕ) Stakeholder satisfaction (2) Socio-economic development (ϕ)
Policy area of PPP power project development Pathway of PPP power project performance
180
6.5 Concluding remarks
The objective of this chapter was to explore the performance areas of power sector
PPPs in Bangladesh using case analysis with the help of relevant conceptual frameworks
and to find differences in the outcomes resulting from using the KPA system. The study,
therefore, proposed a pathway framework of the power sector PPP performance
evaluation based on the Bangladesh experience, and pointed to some differences in the
outcomes using the two different evaluation approaches along with other findings
discussed in sub-section 6.4.1 and 6.4.2.
The next chapter presents an assessment of individual project scores applying the
weights developed in chapter 5. This attempt aims at understanding differences in the
outcomes of performance evaluation made by using case analysis and the weights of the
various performance indicators associated with the same projects.

181
Chapter Seven: Assessment of individual
project scores using developed weights
182
7.1 Introduction
This chapter presents the outcome of the research findings related to RQ4: what
are the actual performance scores of the sample of power sector PPPs applying developed
weights of KPAs and indicators and how do they differ from unweighted scores derived
from industry experts and/or readily available performance assessments? In particular,
details on designing a questionnaire and conducting surveys on the six selected projects
and details on data screening and authentication in relation to this questionnaire are
discussed (Section 7.2 and 7.3). The results of the project performance scores and a
detailed analysis of the weighted and unweighted project scores are presented in section
7.4 and 7.5, followed by a discussion of the results (Section 7.6). Appendix 1 includes
tables A1 to A7.
7.2 Data collection: Questionnaire design and survey conduct
Data collection in this stage is an extension of the data collection of the first phase,
which was for developing the weights for the KPAs and indicators (chapter 5). In this
stage, the same six power projects used for the case study analysis in chapter six are
considered: their performances are assessed by applying the previously developed
weights. The questionnaires are designed to obtain a perception of respondents regarding
specific projects using thirty-seven indicators particularly relevant for the power sector
PPPs in Bangladesh. These indicators have been categorised broadly into eight KPAs,
based on their performance area. Project-specific respondents are asked to score the
performance of their project, based on their personal experiences and on actual
information about the projects, against each of the indicators listed in the questionnaire
(see full questionnaire in the appendix 5). Follow-up discussion with the respondents to
clarify any ambiguous answer allowed modification where necessary. Their perception
of project performance is considered to be acceptable, given that historical information
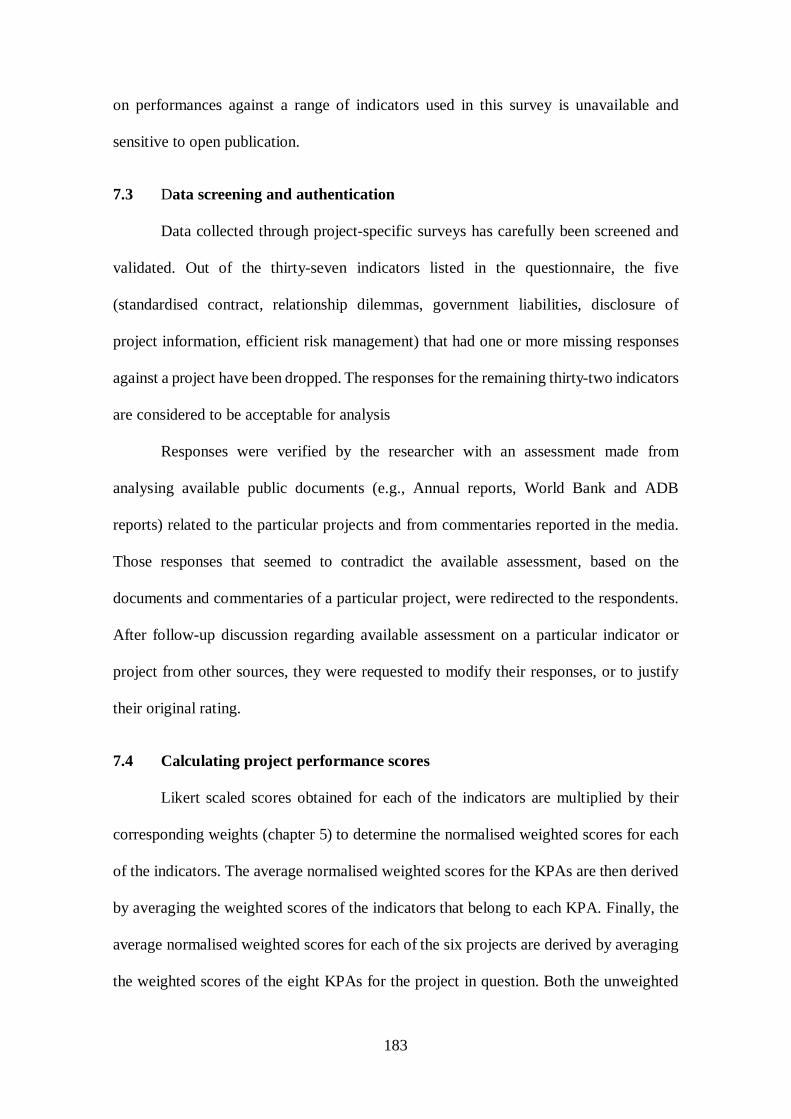
183
on performances against a range of indicators used in this survey is unavailable and
sensitive to open publication.
7.3 Data screening and authentication
Data collected through project-specific surveys has carefully been screened and
validated. Out of the thirty-seven indicators listed in the questionnaire, the five
(standardised contract, relationship dilemmas, government liabilities, disclosure of
project information, efficient risk management) that had one or more missing responses
against a project have been dropped. The responses for the remaining thirty-two indicators
are considered to be acceptable for analysis
Responses were verified by the researcher with an assessment made from
analysing available public documents (e.g., Annual reports, World Bank and ADB
reports) related to the particular projects and from commentaries reported in the media.
Those responses that seemed to contradict the available assessment, based on the
documents and commentaries of a particular project, were redirected to the respondents.
After follow-up discussion regarding available assessment on a particular indicator or
project from other sources, they were requested to modify their responses, or to justify
their original rating.
7.4 Calculating project performance scores
Likert scaled scores obtained for each of the indicators are multiplied by their
corresponding weights (chapter 5) to determine the normalised weighted scores for each
of the indicators. The average normalised weighted scores for the KPAs are then derived
by averaging the weighted scores of the indicators that belong to each KPA. Finally, the
average normalised weighted scores for each of the six projects are derived by averaging
the weighted scores of the eight KPAs for the project in question. Both the unweighted

184
and the weighted scores of the KPAs and indicators are presented in table 7.1. Details of
the individual calculation for each of the six projects are listed in Appendix 1 (see table
A1 to table A6 in Appendix 1).
185
Table 7. 1: Unweighted and weighted scores of six projects by KPAs and indicators
KPA/IND Nw HPL KPCL DNPGL DSPGL B-R H412
UnS WS UnS WS UnS WS UnS WS UnS WS UnS WS PI 0.0404 7.00 0.2825 7.00 0.2825 4.80 0.1949 5.20 0.2108 5.80 0.2355 5.20 0.2133
NA 0.0386 7.00 0.2703 7.00 0.2703 4.00 0.1545 6.00 0.2317 6.00 0.2317 5.00 0.1931 SO 0.0286 7.00 0.2005 7.00 0.2005 4.00 0.1146 5.00 0.1432 6.00 0.1718 6.00 0.1718 IA 0.0395 7.00 0.2764 7.00 0.2764 5.00 0.1974 6.00 0.2369 6.00 0.2369 5.00 0.1974 FA 0.0622 7.00 0.4351 7.00 0.4351 5.00 0.3108 5.00 0.3108 6.00 0.3729 6.00 0.3729 PIT 0.0329 7.00 0.2301 7.00 0.2301 6.00 0.1972 4.00 0.1315 5.00 0.1644 4.00 0.1315
T 0.0341 7.00 0.2386 6.33 0.2149 6.33 0.2160 5.67 0.1922 5.67 0.1942 6.00 0.2046 ECS 0.0310 7.00 0.2167 7.00 0.2167 6.00 0.1857 6.00 0.1857 5.00 0.1548 6.00 0.1857 SCM 0.0370 7.00 0.2588 6.00 0.2218 6.00 0.2218 5.00 0.1849 6.00 0.2218 6.00 0.2218 FT 0.0344 7.00 0.2405 6.00 0.2061 7.00 0.2405 6.00 0.2061 6.00 0.2061 6.00 0.2061
CO 0.0253 6.00 0.1517 6.20 0.1555 5.60 0.1441 5.60 0.1399 5.20 0.1304 4.80 0.1249 C 0.0201 6.00 0.1203 6.00 0.1203 6.00 0.1203 6.00 0.1203 6.00 0.1203 5.00 0.1003 TC 0.0190 6.00 0.1141 7.00 0.1331 5.00 0.0951 5.00 0.0951 5.00 0.0951 5.00 0.0951 Q 0.0399 6.00 0.2393 6.00 0.2393 6.00 0.2393 5.00 0.1994 5.00 0.1994 6.00 0.2393 LCM 0.0281 6.00 0.1689 6.00 0.1689 6.00 0.1689 6.00 0.1689 5.00 0.1407 4.00 0.1126 DS 0.0193 6.00 0.1159 6.00 0.1159 5.00 0.0966 6.00 0.1159 5.00 0.0966 4.00 0.0773
SP 0.0226 6.40 0.1445 6.40 0.1454 5.40 0.1222 5.40 0.1222 5.40 0.1213 5.80 0.1304 TR 0.0177 7.00 0.1236 6.00 0.1060 5.00 0.0883 5.00 0.0883 6.00 0.1060 6.00 0.1060 PrKS 0.0252 6.00 0.1512 7.00 0.1764 6.00 0.1512 6.00 0.1512 5.00 0.1260 5.00 0.1260 PuCC 0.0240 6.00 0.1438 6.00 0.1438 5.00 0.1198 5.00 0.1198 5.00 0.1198 6.00 0.1438 PRR 0.0215 6.00 0.1291 6.00 0.1291 6.00 0.1291 6.00 0.1291 5.00 0.1076 6.00 0.1291 PrS 0.0246 7.00 0.1719 7.00 0.1719 5.00 0.1228 5.00 0.1228 6.00 0.1474 6.00 0.1474
F 0.0497 6.33 0.3146 6.33 0.3130 5.33 0.2670 5.67 0.2834 5.33 0.2648 5.33 0.2610 ORA 0.0557 6.00 0.3342 6.00 0.3342 6.00 0.3342 6.00 0.3342 5.00 0.2785 4.00 0.2228 FC 0.0444 7.00 0.3110 7.00 0.3110 5.00 0.2222 5.00 0.2222 5.00 0.2222 6.00 0.2666 PG 0.0490 6.00 0.2938 6.00 0.2938 5.00 0.2448 6.00 0.2938 6.00 0.2938 6.00 0.2938
TA 0.0533 6.67 0.3556 6.67 0.3529 5.33 0.2866 4.33 0.2302 5.00 0.2665 5.00 0.2705 IL 0.0484 7.00 0.3387 7.00 0.3387 5.00 0.2419 4.00 0.1935 5.00 0.2419 4.00 0.1935 LCEM 0.0605 6.00 0.3627 6.00 0.3627 6.00 0.3627 4.00 0.2418 5.00 0.3023 6.00 0.3627 RC 0.0511 7.00 0.3574 7.00 0.3574 5.00 0.2553 5.00 0.2553 5.00 0.2553 5.00 0.2553
SS 0.0097 6.00 0.0582 6.67 0.0652 5.67 0.0554 6.00 0.0585 6.00 0.0585 6.00 0.0585 MO 0.0095 6.00 0.0568 7.00 0.0662 6.00 0.0568 6.00 0.0568 6.00 0.0568 6.00 0.0568 VFM 0.0106 7.00 0.0745 7.00 0.0745 6.00 0.0639 6.00 0.0639 6.00 0.0639 6.00 0.0639 P 0.0091 5.00 0.0456 6.00 0.0547 5.00 0.0456 6.00 0.0547 6.00 0.0547 6.00 0.0547
186
SED 0.0237 6.80 0.1612 6.20 0.1472 5.00 0.1172 5.00 0.1189 5.80 0.1370 5.60 0.1326 PSD 0.0250 7.00 0.1751 6.00 0.1501 4.00 0.1001 5.00 0.1251 6.00 0.1501 5.00 0.1251 IPS 0.0161 7.00 0.1128 6.00 0.0967 5.00 0.0806 4.00 0.0645 6.00 0.0967 6.00 0.0967 ID 0.0293 7.00 0.2051 6.00 0.1758 4.00 0.1172 4.00 0.1172 6.00 0.1758 6.00 0.1758 EG 0.0223 6.00 0.1340 6.00 0.1340 6.00 0.1340 6.00 0.1340 6.00 0.1340 5.00 0.1116 EF 0.0257 7.00 0.1796 7.00 0.1796 6.00 0.1540 6.00 0.1540 5.00 0.1283 6.00 0.1540 Average score 6.53 0.2059 6.47 0.2028 5.38 0.1677 5.34 0.1641 5.53 0.1710 5.44 0.1684
Notes: Projects in the various columns: HPL—360MW Haripur Power Ltd; KPCL—110MW Khulna Power Company Ltd; DNPGL—55MW Dhaka North Power Generation Ltd; DSPGL—55MW Dhaka South Power Generation Ltd; B-R—150MW B-R Powergen Ltd; H412—412MW Haripur Power Plant. Nw—Normalised weights; UwS—Unweighted scores; WS—Weighted scores. KPAs in the various rows: PI: Planning and initiation; T: Tendering CO: Construction and operation; SP: Sustainability of partnerships F: Financing; TA: Transparency and accountability SS: Stakeholders satisfaction; SED: Socioeconomic development. Indicators in the various rows: NA—Needs assessment; SO—SMART Objectives; IA—Implementability assessment; FA—Feasibility analysis; PIT—Public interest test; ECS—Efficient concessionaire selection; SCM—selection criteria and method; FT—Fairness and transparency; C—Cost consideration; TC—Time consideration; Qs—Quality of assets; LCM—Life cycle maintainability; DS—Dispute settlement; TR—Trust and respect; PrKS—Private sector knowledge and skill; PuCC—Public Sector Capacities and Coordination; PRR—Partners roles and responsibilities; PS—Project sustainability; ORA—Optimum risk allocation; FC—Financial cost; PG—Payment guarantees; IL—Integration of locals; LCEM—Life cycle evaluation and monitoring; RC—Responsiveness of concessionaire; MO—Meeting objectives; VFM—Value for money; P—Profitability; PSD—PPP sector development; IPS—Innovation in public sector; ID—Infrastructure development; EG—Employment generation; EF—Environment friendliness.
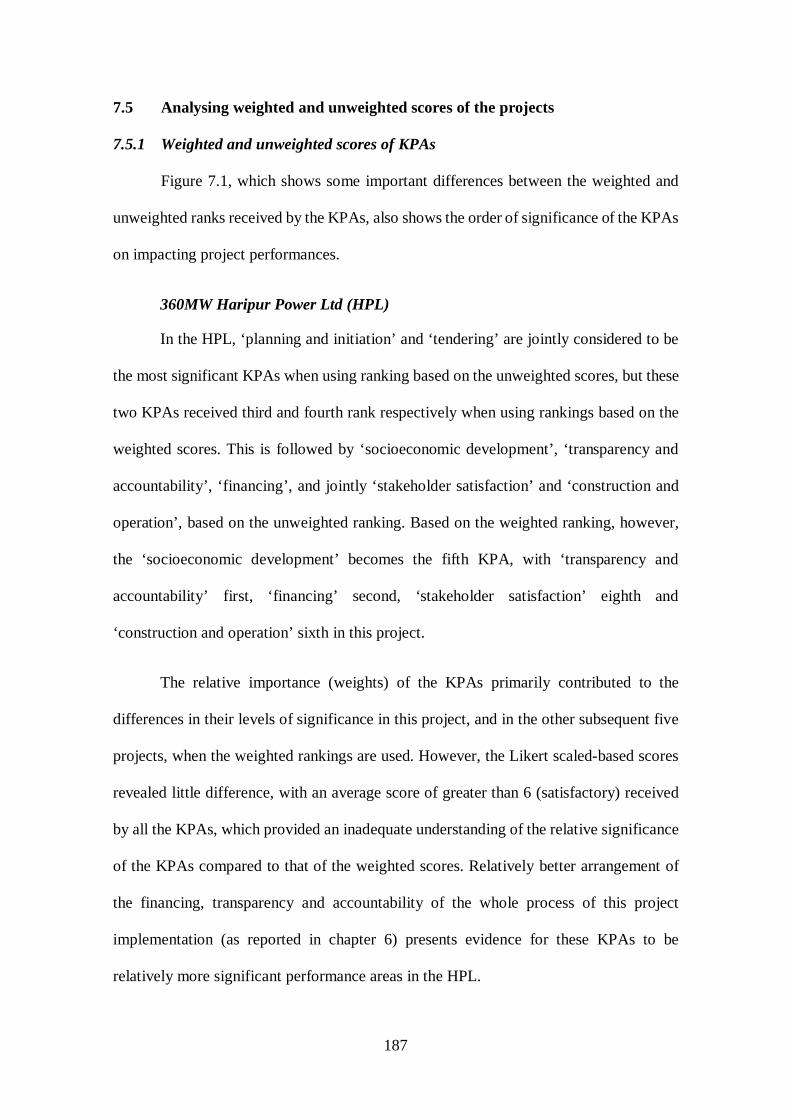
187
7.5 Analysing weighted and unweighted scores of the projects
7.5.1 Weighted and unweighted scores of KPAs
Figure 7.1, which shows some important differences between the weighted and
unweighted ranks received by the KPAs, also shows the order of significance of the KPAs
on impacting project performances.
360MW Haripur Power Ltd (HPL)
In the HPL, ‘planning and initiation’ and ‘tendering’ are jointly considered to be
the most significant KPAs when using ranking based on the unweighted scores, but these
two KPAs received third and fourth rank respectively when using rankings based on the
weighted scores. This is followed by ‘socioeconomic development’, ‘transparency and
accountability’, ‘financing’, and jointly ‘stakeholder satisfaction’ and ‘construction and
operation’, based on the unweighted ranking. Based on the weighted ranking, however,
the ‘socioeconomic development’ becomes the fifth KPA, with ‘transparency and
accountability’ first, ‘financing’ second, ‘stakeholder satisfaction’ eighth and
‘construction and operation’ sixth in this project.
The relative importance (weights) of the KPAs primarily contributed to the
differences in their levels of significance in this project, and in the other subsequent five
projects, when the weighted rankings are used. However, the Likert scaled-based scores
revealed little difference, with an average score of greater than 6 (satisfactory) received
by all the KPAs, which provided an inadequate understanding of the relative significance
of the KPAs compared to that of the weighted scores. Relatively better arrangement of
the financing, transparency and accountability of the whole process of this project
implementation (as reported in chapter 6) presents evidence for these KPAs to be
relatively more significant performance areas in the HPL.
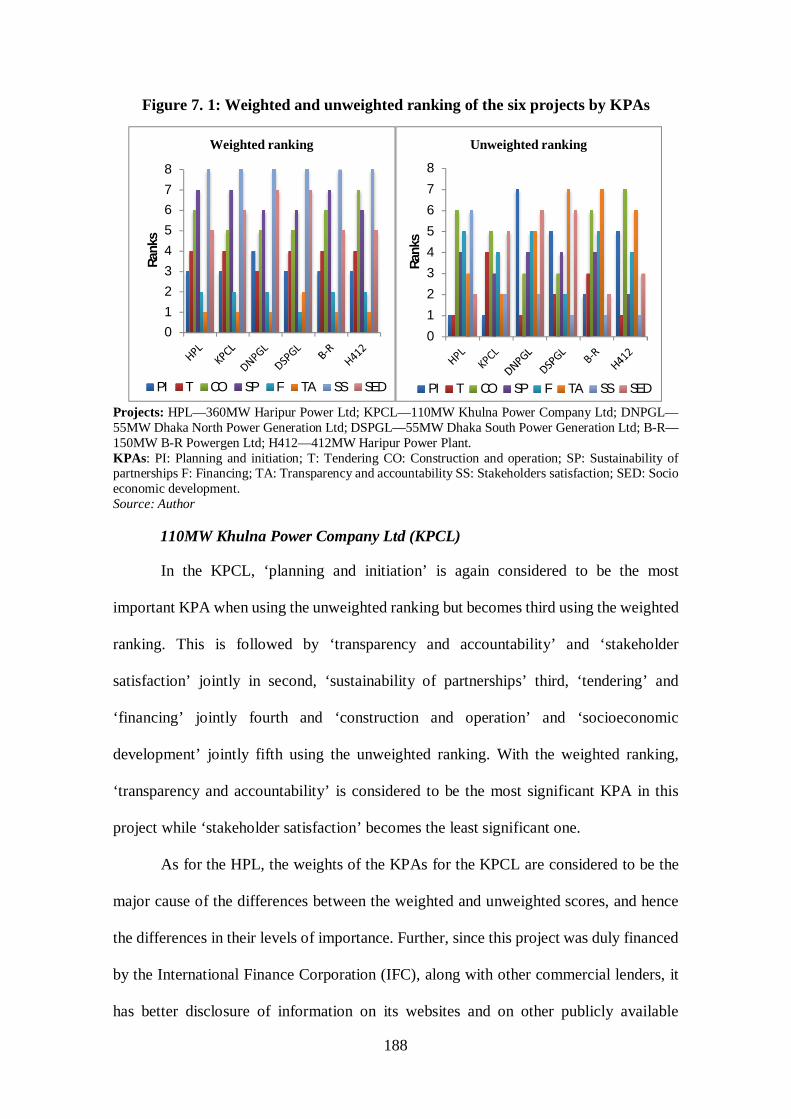
188
Figure 7. 1: Weighted and unweighted ranking of the six projects by KPAs
Projects: HPL—360MW Haripur Power Ltd; KPCL—110MW Khulna Power Company Ltd; DNPGL—55MW Dhaka North Power Generation Ltd; DSPGL—55MW Dhaka South Power Generation Ltd; B-R—150MW B-R Powergen Ltd; H412—412MW Haripur Power Plant. KPAs: PI: Planning and initiation; T: Tendering CO: Construction and operation; SP: Sustainability of partnerships F: Financing; TA: Transparency and accountability SS: Stakeholders satisfaction; SED: Socio economic development. Source: Author
110MW Khulna Power Company Ltd (KPCL)
In the KPCL, ‘planning and initiation’ is again considered to be the most
important KPA when using the unweighted ranking but becomes third using the weighted
ranking. This is followed by ‘transparency and accountability’ and ‘stakeholder
satisfaction’ jointly in second, ‘sustainability of partnerships’ third, ‘tendering’ and
‘financing’ jointly fourth and ‘construction and operation’ and ‘socioeconomic
development’ jointly fifth using the unweighted ranking. With the weighted ranking,
‘transparency and accountability’ is considered to be the most significant KPA in this
project while ‘stakeholder satisfaction’ becomes the least significant one.
As for the HPL, the weights of the KPAs for the KPCL are considered to be the
major cause of the differences between the weighted and unweighted scores, and hence
the differences in their levels of importance. Further, since this project was duly financed
by the International Finance Corporation (IFC), along with other commercial lenders, it
has better disclosure of information on its websites and on other publicly available
012345678
Rank
sWeighted ranking
PI T CO SP F TA SS SED
012345678
Rank
s
Unweighted ranking
PI T CO SP F TA SS SED

189
sources, and was well-planned. These features are associated with the ‘financing’,
‘transparency and accountability’, and ‘planning and initiation’ areas. So they were
ranked with a relatively higher importance. However, the unweighted scores represent an
inaccurate picture of the relative importance of the KPAs, whereas the weighted system
provided an improved understanding of their relative significance.
55MW Dhaka North Power Generation Ltd (DNPGL)
In the DNPGL, ‘tendering’ based on the unweighted ranking is considered to be
the most significant KPA, followed in order by ‘stakeholder satisfaction’, ‘construction
and operation’, ‘sustainability of partnerships’, then jointly ‘financing’ and ‘transparency
and accountability’, then ‘socio economic development’ and lastly ‘planning and
initiation’. Here, ‘tendering’ becomes the third and ‘stakeholder satisfaction’ becomes the
least significant KPA, based on the weighted ranking. The KPA ‘transparency and
accountability’ is perceived to be the most important when using the weighted ranking,
followed by KPA ‘financing’ as the second most important in this project.
Beyond the common reasons (i.e., the weights of the KPAs) contributing to the
differences in the weighted and unweighted rankings of the KPAs, the specific cause was
related to the innovative financing arrangement for this project. The weighted system of
the KPAs provided a better understanding of their relative significance.
55MW Dhaka South Power Generation Ltd (DSPGL)
In the DSPGL, the KPA ‘stakeholder satisfaction’, perceived to be most important
based on the unweighted ranking, is followed by (jointly) ‘tendering’ and ‘financing’,
then (in order) ‘construction and operation’, ‘sustainability of partnerships’, ‘planning
and initiation’, ‘socioeconomic development’, and ‘transparency and accountability’. In
contrast, when the weighted ranking is used, the KPA ‘stakeholder satisfaction’ is
190
considered to be the least important in this project while the KPA ‘financing’ is the most
important.
The causes described for the DNPGL are also applicable in this project to explain
the reasons for the differences between the weighted and unweighted rankings of the
KPAs, because these two projects have commonalities in ownership, size and
implementation period.
150MW B-R Powergen Ltd (B-R)
As with the DSPGL, ‘stakeholder satisfaction’ is the most significant KPA in the
B-R Powergen Ltd, based on the unweighted ranking, but is the least important based on
the weighted ranking. The KPAs ‘planning and initiation’ and ‘socio economic
development’ become equally second most important, followed in order by ‘tendering’,
‘sustainability of partnerships’, ‘financing’, ‘construction and operation’ and
‘transparency and accountability’, based on the unweighted ranking. However, in the
weighted ranking, both KPA ‘planning and initiation’ and ‘socio economic development’
moved downwards, but KPA both ‘financing’ and ‘transparency and accountability’
moved upwards in terms of their significance.
Again, the weights of the KPAs are also the major causes of the differences in the
weighted and unweighted rankings in this project, and the next, which are both operated
by public sector entities. In this project, both the weighted and unweighted rakings gave
an equal level of significance to the ‘construction and operation’ area.
412MW Haripur Power Plant (H412)
Finally, ‘tendering’ and ‘stakeholder satisfaction’, jointly considered to be the
most significant KPAs based on the unweighted ranking; moved downwards with respect
to their significance when using the weighted ranking. ‘Sustainability of partnerships’,
‘socioeconomic development’, ‘financing’, ‘planning and initiation’, ‘transparency and
191
accountability’, and ‘construction and operation’ follow in order of significance, based
on the unweighted ranking. Based on the weighted ranking, the KPAs ‘sustainability of
partnerships’, ‘socioeconomic development’ and ‘construction and operation’ also moved
downward, but the KPAs ‘financing’, ‘planning and initiation’, and ‘transparency and
accountability’ moved upwards with respect to their significance. Accordingly, the KPA
‘transparency and accountability’, based on the weighted ranking, is perceived to be most
important. Followed by ‘financing’ second and ‘planning and initiation’ third in this
project.
The causes already given for B-R Powergen Ltd for the differences in the relative
importance of the KPAs are applicable for this project as well, since both these projects,
which have similar features, are developed and operated by public sector entities.
This analysis suggests that ‘transparency and accountability’ and ‘financing’ are
consistently perceived to be the most significant for measuring performances in all of the
six projects when the weighted ranking is used, but seem to be less significant KPAs in
all projects when the unweighted ranking is used. This is because of the impact of the
weights (relative importance) of the KPAs. The KPAs that include ‘stakeholder
satisfaction’, ‘sustainability of partnerships’, and ‘socioeconomic development’ all
moved downward in order of their significance in all of the projects when the weighted
ranking is used.
The perception based on the Likert scale might lead to a misunderstanding of the
relative significance of the KPAs because the average scores obtained by using the Likert
scale for the KPAs and for all of the projects are in an upper level of this scale. However,
using the weights of the KPAs can offer improved understanding of their relative
importance, as clearly demonstrated in figure 7.2. For example, the KPA ‘stakeholder
satisfaction’ received a score of around 6 using a Likert scale but received a minimum
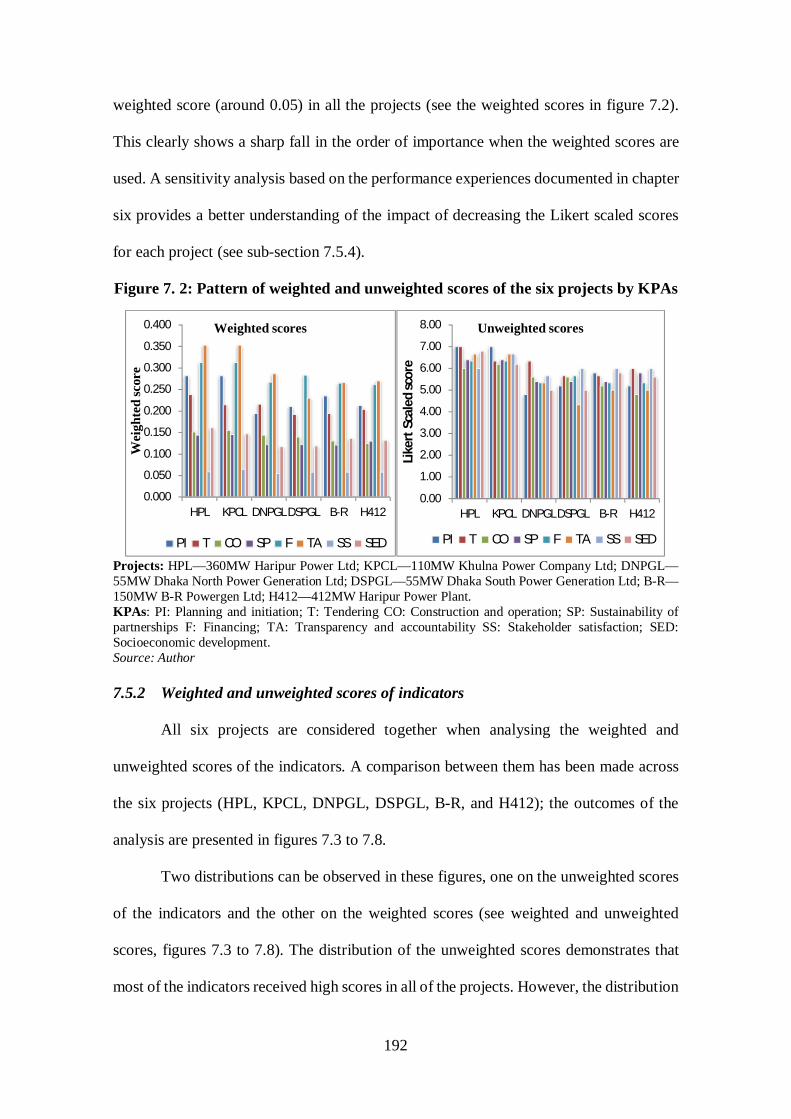
192
weighted score (around 0.05) in all the projects (see the weighted scores in figure 7.2).
This clearly shows a sharp fall in the order of importance when the weighted scores are
used. A sensitivity analysis based on the performance experiences documented in chapter
six provides a better understanding of the impact of decreasing the Likert scaled scores
for each project (see sub-section 7.5.4).
Figure 7. 2: Pattern of weighted and unweighted scores of the six projects by KPAs
Projects: HPL—360MW Haripur Power Ltd; KPCL—110MW Khulna Power Company Ltd; DNPGL—55MW Dhaka North Power Generation Ltd; DSPGL—55MW Dhaka South Power Generation Ltd; B-R—150MW B-R Powergen Ltd; H412—412MW Haripur Power Plant. KPAs: PI: Planning and initiation; T: Tendering CO: Construction and operation; SP: Sustainability of partnerships F: Financing; TA: Transparency and accountability SS: Stakeholder satisfaction; SED: Socioeconomic development. Source: Author 7.5.2 Weighted and unweighted scores of indicators
All six projects are considered together when analysing the weighted and
unweighted scores of the indicators. A comparison between them has been made across
the six projects (HPL, KPCL, DNPGL, DSPGL, B-R, and H412); the outcomes of the
analysis are presented in figures 7.3 to 7.8.
Two distributions can be observed in these figures, one on the unweighted scores
of the indicators and the other on the weighted scores (see weighted and unweighted
scores, figures 7.3 to 7.8). The distribution of the unweighted scores demonstrates that
most of the indicators received high scores in all of the projects. However, the distribution
0.000
0.050
0.100
0.150
0.200
0.250
0.300
0.350
0.400
HPL KPCL DNPGL DSPGL B-R H412
Wei
ghte
d sc
ore
Weighted scores
PI T CO SP F TA SS SED
0.00
1.00
2.00
3.00
4.00
5.00
6.00
7.00
8.00
HPL KPCL DNPGL DSPGL B-R H412
Like
rt S
cale
d sc
ore
Unweighted scores
PI T CO SP F TA SS SED
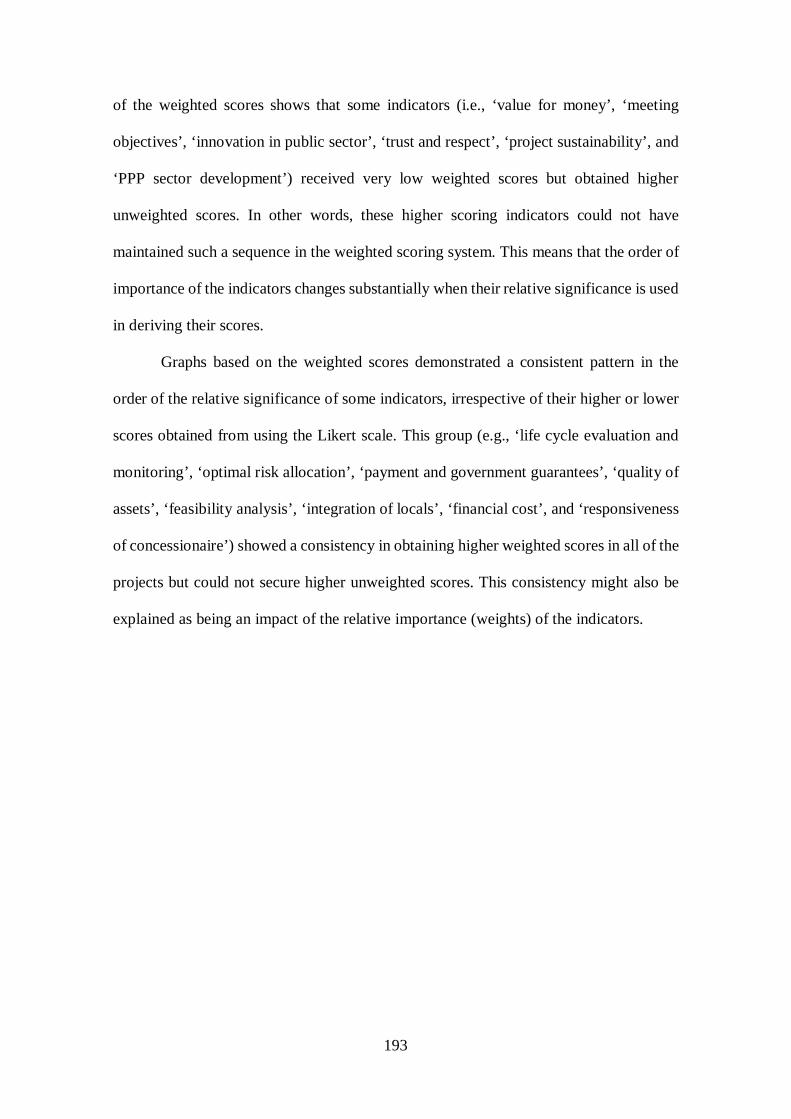
193
of the weighted scores shows that some indicators (i.e., ‘value for money’, ‘meeting
objectives’, ‘innovation in public sector’, ‘trust and respect’, ‘project sustainability’, and
‘PPP sector development’) received very low weighted scores but obtained higher
unweighted scores. In other words, these higher scoring indicators could not have
maintained such a sequence in the weighted scoring system. This means that the order of
importance of the indicators changes substantially when their relative significance is used
in deriving their scores.
Graphs based on the weighted scores demonstrated a consistent pattern in the
order of the relative significance of some indicators, irrespective of their higher or lower
scores obtained from using the Likert scale. This group (e.g., ‘life cycle evaluation and
monitoring’, ‘optimal risk allocation’, ‘payment and government guarantees’, ‘quality of
assets’, ‘feasibility analysis’, ‘integration of locals’, ‘financial cost’, and ‘responsiveness
of concessionaire’) showed a consistency in obtaining higher weighted scores in all of the
projects but could not secure higher unweighted scores. This consistency might also be
explained as being an impact of the relative importance (weights) of the indicators.
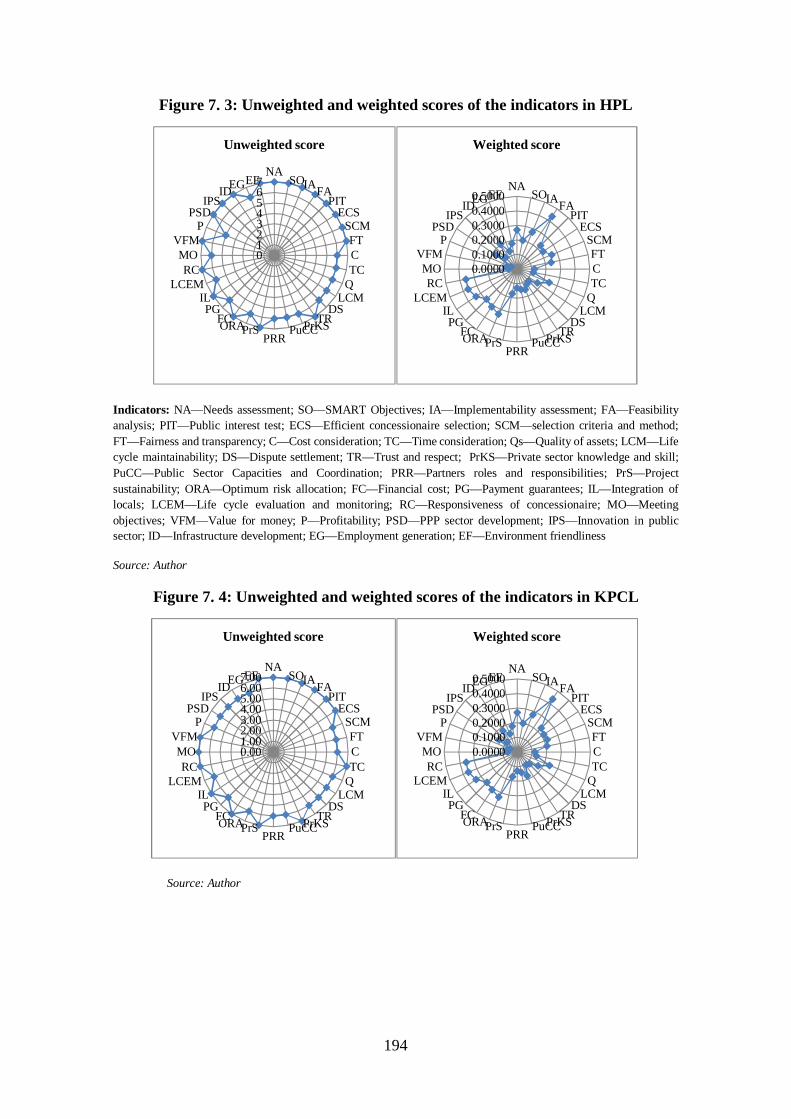
194
Figure 7. 3: Unweighted and weighted scores of the indicators in HPL
Indicators: NA—Needs assessment; SO—SMART Objectives; IA—Implementability assessment; FA—Feasibility analysis; PIT—Public interest test; ECS—Efficient concessionaire selection; SCM—selection criteria and method; FT—Fairness and transparency; C—Cost consideration; TC—Time consideration; Qs—Quality of assets; LCM—Life cycle maintainability; DS—Dispute settlement; TR—Trust and respect; PrKS—Private sector knowledge and skill; PuCC—Public Sector Capacities and Coordination; PRR—Partners roles and responsibilities; PrS—Project sustainability; ORA—Optimum risk allocation; FC—Financial cost; PG—Payment guarantees; IL—Integration of locals; LCEM—Life cycle evaluation and monitoring; RC—Responsiveness of concessionaire; MO—Meeting objectives; VFM—Value for money; P—Profitability; PSD—PPP sector development; IPS—Innovation in public sector; ID—Infrastructure development; EG—Employment generation; EF—Environment friendliness
Source: Author
Figure 7. 4: Unweighted and weighted scores of the indicators in KPCL
Source: Author
01234567
NASOIAFA
PITECS
SCMFTCTC
QLCM
DSTRPrKSPuCC
PRRPrSORAFC
PGIL
LCEMRC
MOVFM
PPSD
IPSIDEGEF
Unweighted score
0.00000.10000.20000.30000.40000.5000
NASOIAFA
PITECS
SCMFTCTC
QLCM
DSTRPrKSPuCC
PRRPrSORAFC
PGIL
LCEMRC
MOVFM
PPSD
IPSIDEGEF
Weighted score
0.001.002.003.004.005.006.007.00
NASOIAFA
PITECS
SCMFTCTC
QLCM
DSTRPrKSPuCC
PRRPrSORAFC
PGIL
LCEMRC
MOVFM
PPSD
IPSIDEGEF
Unweighted score
0.00000.10000.20000.30000.40000.5000
NASOIAFA
PITECS
SCMFTCTC
QLCM
DSTRPrKSPuCC
PRRPrSORAFC
PGIL
LCEMRC
MOVFM
PPSD
IPSIDEGEF
Weighted score
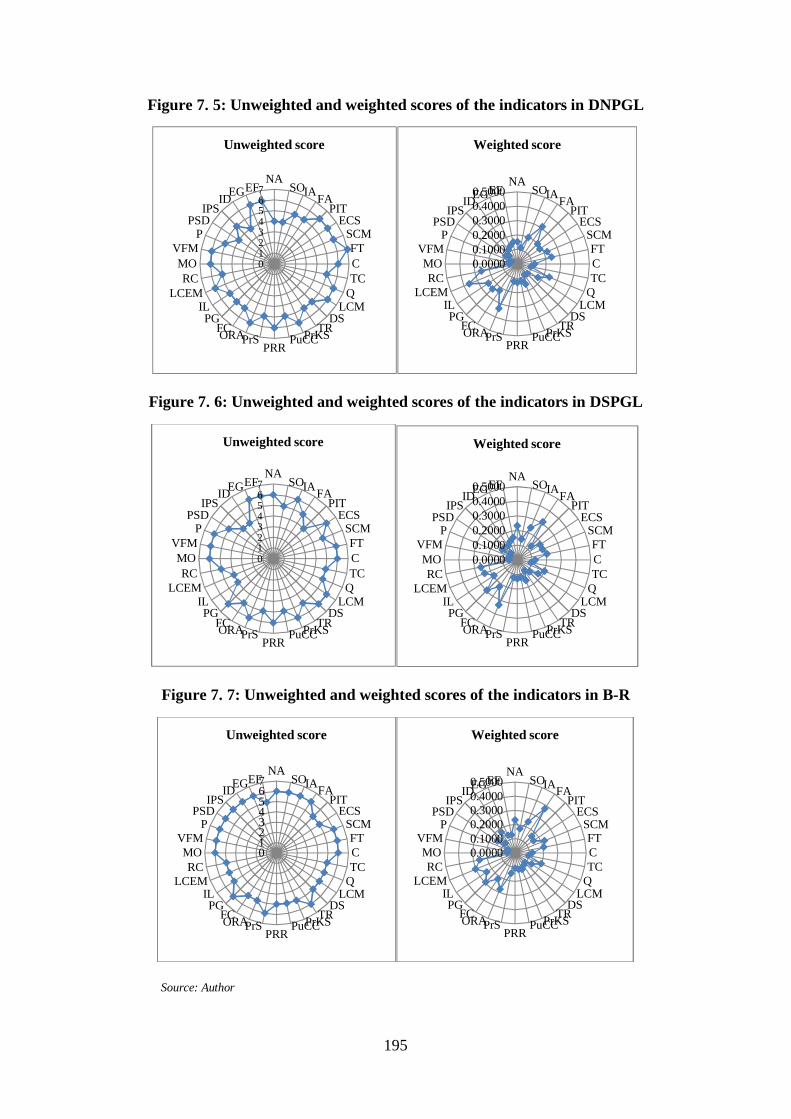
195
Figure 7. 5: Unweighted and weighted scores of the indicators in DNPGL
Figure 7. 6: Unweighted and weighted scores of the indicators in DSPGL
Figure 7. 7: Unweighted and weighted scores of the indicators in B-R
Source: Author
01234567
NASOIAFA
PITECS
SCMFTCTC
QLCM
DSTRPrKSPuCC
PRRPrSORAFC
PGIL
LCEMRC
MOVFM
PPSD
IPSIDEGEF
Unweighted score
0.00000.10000.20000.30000.40000.5000
NASOIAFA
PITECS
SCMFTCTC
QLCM
DSTRPrKSPuCC
PRRPrSORAFC
PGIL
LCEMRC
MOVFM
PPSD
IPSIDEGEF
Weighted score
01234567
NASOIAFA
PITECS
SCMFTCTC
QLCM
DSTRPrKSPuCC
PRRPrSORAFC
PGIL
LCEMRC
MOVFM
PPSD
IPSIDEGEF
Unweighted score
0.00000.10000.20000.30000.40000.5000
NASOIAFA
PITECS
SCMFTCTC
QLCM
DSTRPrKSPuCC
PRRPrSORAFC
PGIL
LCEMRC
MOVFM
PPSD
IPSIDEGEF
Weighted score
01234567
NASOIAFA
PITECS
SCMFTCTC
QLCM
DSTRPrKSPuCC
PRRPrSORAFC
PGIL
LCEMRC
MOVFM
PPSD
IPSIDEGEF
Unweighted score
0.00000.10000.20000.30000.40000.5000
NASOIAFA
PITECS
SCMFTCTC
QLCM
DSTRPrKSPuCC
PRRPrSORAFC
PGIL
LCEMRC
MOVFM
PPSD
IPSIDEGEF
Weighted score
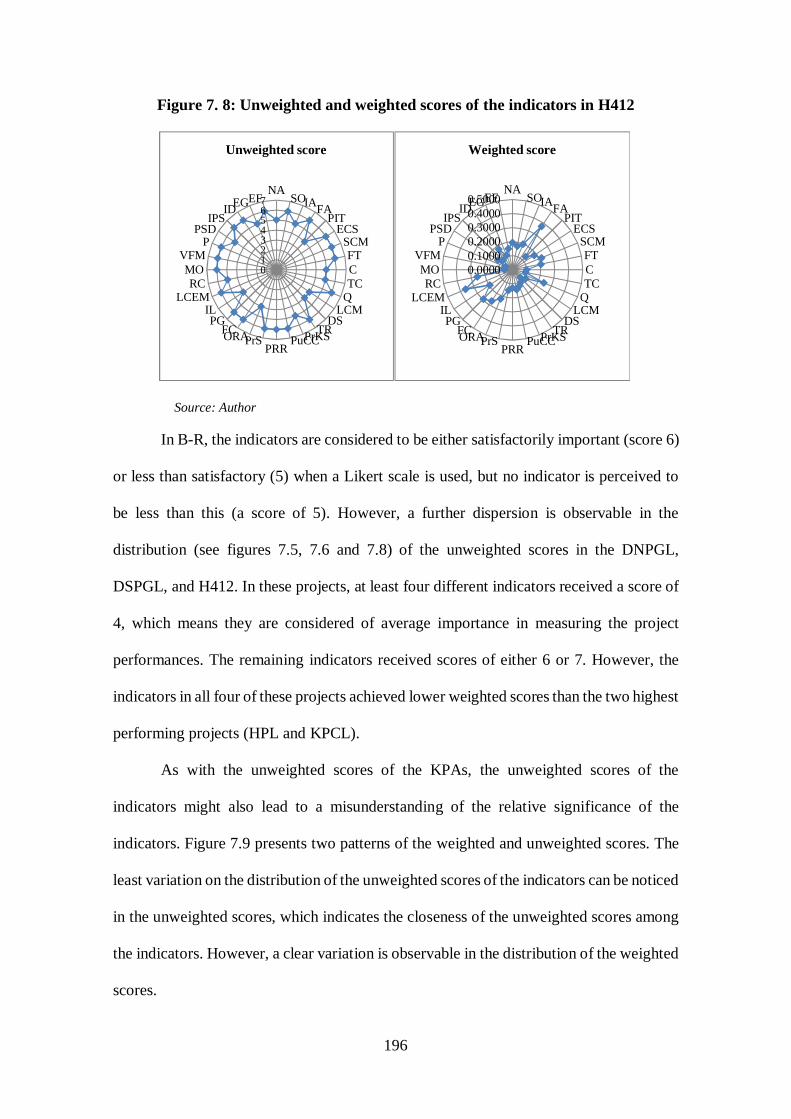
196
Figure 7. 8: Unweighted and weighted scores of the indicators in H412
Source: Author
In B-R, the indicators are considered to be either satisfactorily important (score 6)
or less than satisfactory (5) when a Likert scale is used, but no indicator is perceived to
be less than this (a score of 5). However, a further dispersion is observable in the
distribution (see figures 7.5, 7.6 and 7.8) of the unweighted scores in the DNPGL,
DSPGL, and H412. In these projects, at least four different indicators received a score of
4, which means they are considered of average importance in measuring the project
performances. The remaining indicators received scores of either 6 or 7. However, the
indicators in all four of these projects achieved lower weighted scores than the two highest
performing projects (HPL and KPCL).
As with the unweighted scores of the KPAs, the unweighted scores of the
indicators might also lead to a misunderstanding of the relative significance of the
indicators. Figure 7.9 presents two patterns of the weighted and unweighted scores. The
least variation on the distribution of the unweighted scores of the indicators can be noticed
in the unweighted scores, which indicates the closeness of the unweighted scores among
the indicators. However, a clear variation is observable in the distribution of the weighted
scores.
01234567
NASOIAFA
PITECS
SCMFTCTC
QLCM
DSTRPrKSPuCC
PRRPrSORAFC
PGIL
LCEMRC
MOVFM
PPSD
IPSIDEGEF
Unweighted score
0.00000.10000.20000.30000.40000.5000
NASOIAFA
PITECS
SCMFTCTC
QLCM
DSTRPrKSPuCC
PRRPrSORAFC
PGIL
LCEMRC
MOVFM
PPSD
IPSIDEGEF
Weighted score
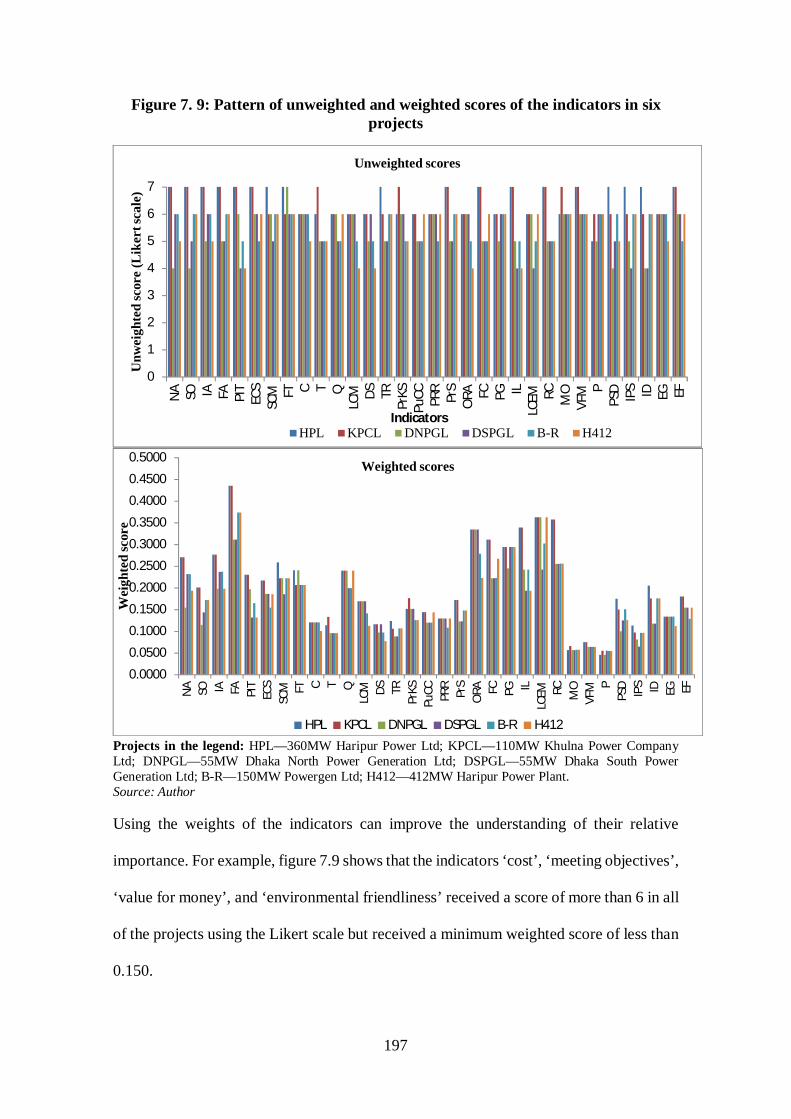
197
Figure 7. 9: Pattern of unweighted and weighted scores of the indicators in six projects
Projects in the legend: HPL—360MW Haripur Power Ltd; KPCL—110MW Khulna Power Company Ltd; DNPGL—55MW Dhaka North Power Generation Ltd; DSPGL—55MW Dhaka South Power Generation Ltd; B-R—150MW Powergen Ltd; H412—412MW Haripur Power Plant. Source: Author
Using the weights of the indicators can improve the understanding of their relative
importance. For example, figure 7.9 shows that the indicators ‘cost’, ‘meeting objectives’,
‘value for money’, and ‘environmental friendliness’ received a score of more than 6 in all
of the projects using the Likert scale but received a minimum weighted score of less than
0.150.
0
1
2
3
4
5
6
7N
A SO IA FA PIT
ECS
SCM FT C T Q
LCM DS TR
PrKS
PuCC PR
RPr
SO
RA FC PG ILLC
EM RC MO
VFM P
PSD IPS ID EG EF
Unw
eigh
ted
scor
e (L
iker
t sca
le)
Indicators
Unweighted scores
HPL KPCL DNPGL DSPGL B-R H412
0.0000
0.0500
0.1000
0.1500
0.2000
0.2500
0.3000
0.3500
0.4000
0.4500
0.5000
NA SO IA FA PIT
ECS
SCM FT C T Q
LCM DS TR
PrKS
PuCC PR
RPr
SO
RA FC PG ILLC
EM RC MO
VFM P
PSD IPS ID EG EF
Wei
ghte
d sc
ore
Weighted scores
HPL KPCL DNPGL DSPGL B-R H412
198
7.5.3 Overall scores of the projects
After the analysis of the KPAs and indicators has been undertaken individually, a
comparative analysis based on the overall project scores is needed to understand the
performance of each of the projects. The HPL and KPCL received higher overall
weighted scores of 0.2059 and 0.2028 respectively. The individual scores of the KPAs
and indicators of these two are also higher, compared to the other four projects (DNPGL,
DSPGL, B-R, and H412). In other words, these two projects seem to be the best
performers out of the six.
Of the remaining four, the B-R and H412 are operated by the public sector
organisations under the same government policies that are applicable to the power sector
PPPs. However, these two (B-R with an overall score of 0.1710; H412, with 0.1684)
appear to be better performers, based on the overall scores of the projects, than the other
two projects (DNPGL and DSPGL), which are operated by purely private sponsors. The
DNPGL has the overall score of 0.1677; the DSPGL has the lowest overall score of
0.1641 among the six. The details of their unweighted and weighted scores can be found
in table 7.1. Although both the weighted and unweighted scores have an identical order
of significance for the six projects, with respect to their performances, the weighted scores
show a significant difference for the KPAs and indicators in their ranking.
7.5.4 Sensitivity analysis:
A sensitivity analysis with a systematic approach was performed to check the
robustness of the results and to better understand the impact of the changes in the Likert
scaled scores for each project. These Likert scores are provided by the project-specific
respondents (representatives of the projects), who are affiliated with the interests of their
particular projects, and who are therefore likely to provide higher scores for the rating of
those projects. Pre-defined criteria (performance objectives) documented in the analysis
199
of the case study in chapter six are used to reduce the Likert scaled scores in order to
explore their sensitivity to the weighted scores that were associated with the KPAs,
indicators and individual projects.
The following two assumptions are made:
(a) Project-specific respondents generally gave higher Likert scaled scores for their
affiliated projects and therefore, these scores are required to be reduced.
(b) Performance objectives/indicators under the KPAs are considered to be either
fulfilled, partially fulfilled or unfulfilled. The objectives fulfilled are not
considered for sensitivity analysis because their fulfilment suggests satisfactory
performances. However, if an objective/indicator in any KPA is unfulfilled, the
corresponding score is fixed at 2 (dissatisfactory) where the worst level is 1
(highly dissatisfactory), and if an objective/indicator is partially fulfilled, the
corresponding score is 4 (average). The highest score in the 1-7 Likert scale used
in this survey is 7 (highly satisfactory).
The KPA-wise performance objectives or indicators in the different projects,
which are based on these assumptions, are summarised in table 7.2. The objectives are
either unfulfilled (x) with a corresponding score of 2 (dissatisfactory) or partially fulfilled
(ϕ) with a corresponding score of 4 (average).
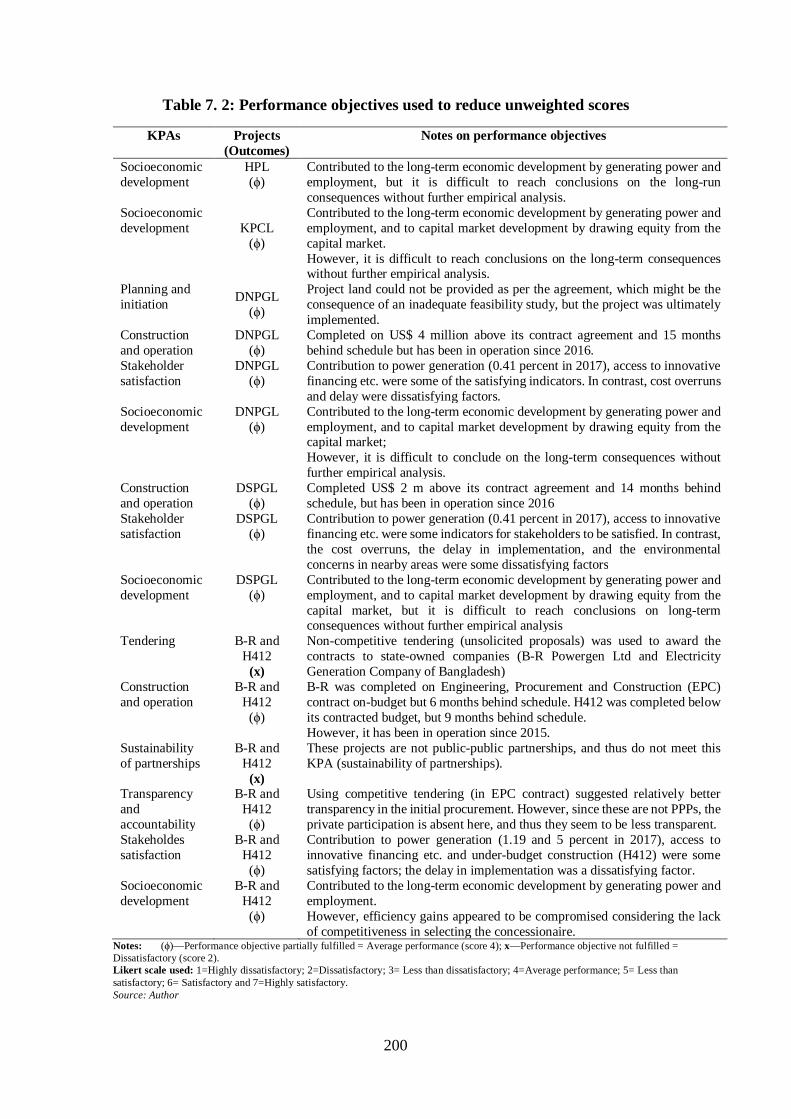
200
Table 7. 2: Performance objectives used to reduce unweighted scores
KPAs Projects (Outcomes)
Notes on performance objectives
Socioeconomic development
HPL (ϕ)
Contributed to the long-term economic development by generating power and employment, but it is difficult to reach conclusions on the long-run consequences without further empirical analysis.
Socioeconomic development
KPCL
(ϕ)
Contributed to the long-term economic development by generating power and employment, and to capital market development by drawing equity from the capital market. However, it is difficult to reach conclusions on the long-term consequences without further empirical analysis.
Planning and initiation DNPGL
(ϕ)
Project land could not be provided as per the agreement, which might be the consequence of an inadequate feasibility study, but the project was ultimately implemented.
Construction and operation
DNPGL (ϕ)
Completed on US$ 4 million above its contract agreement and 15 months behind schedule but has been in operation since 2016.
Stakeholder satisfaction
DNPGL (ϕ)
Contribution to power generation (0.41 percent in 2017), access to innovative financing etc. were some of the satisfying indicators. In contrast, cost overruns and delay were dissatisfying factors.
Socioeconomic development
DNPGL (ϕ)
Contributed to the long-term economic development by generating power and employment, and to capital market development by drawing equity from the capital market; However, it is difficult to conclude on the long-term consequences without further empirical analysis.
Construction and operation
DSPGL (ϕ)
Completed US$ 2 m above its contract agreement and 14 months behind schedule, but has been in operation since 2016
Stakeholder satisfaction
DSPGL (ϕ)
Contribution to power generation (0.41 percent in 2017), access to innovative financing etc. were some indicators for stakeholders to be satisfied. In contrast, the cost overruns, the delay in implementation, and the environmental concerns in nearby areas were some dissatisfying factors
Socioeconomic development
DSPGL (ϕ)
Contributed to the long-term economic development by generating power and employment, and to capital market development by drawing equity from the capital market, but it is difficult to reach conclusions on long-term consequences without further empirical analysis
Tendering B-R and H412
(x)
Non-competitive tendering (unsolicited proposals) was used to award the contracts to state-owned companies (B-R Powergen Ltd and Electricity Generation Company of Bangladesh)
Construction and operation
B-R and H412
(ϕ)
B-R was completed on Engineering, Procurement and Construction (EPC) contract on-budget but 6 months behind schedule. H412 was completed below its contracted budget, but 9 months behind schedule. However, it has been in operation since 2015.
Sustainability of partnerships
B-R and H412
(x)
These projects are not public-public partnerships, and thus do not meet this KPA (sustainability of partnerships).
Transparency and accountability
B-R and H412
(ϕ)
Using competitive tendering (in EPC contract) suggested relatively better transparency in the initial procurement. However, since these are not PPPs, the private participation is absent here, and thus they seem to be less transparent.
Stakeholdes satisfaction
B-R and H412
(ϕ)
Contribution to power generation (1.19 and 5 percent in 2017), access to innovative financing etc. and under-budget construction (H412) were some satisfying factors; the delay in implementation was a dissatisfying factor.
Socioeconomic development
B-R and H412
(ϕ)
Contributed to the long-term economic development by generating power and employment. However, efficiency gains appeared to be compromised considering the lack of competitiveness in selecting the concessionaire.
Notes: (ϕ)—Performance objective partially fulfilled = Average performance (score 4); x—Performance objective not fulfilled = Dissatisfactory (score 2). Likert scale used: 1=Highly dissatisfactory; 2=Dissatisfactory; 3= Less than dissatisfactory; 4=Average performance; 5= Less than satisfactory; 6= Satisfactory and 7=Highly satisfactory. Source: Author
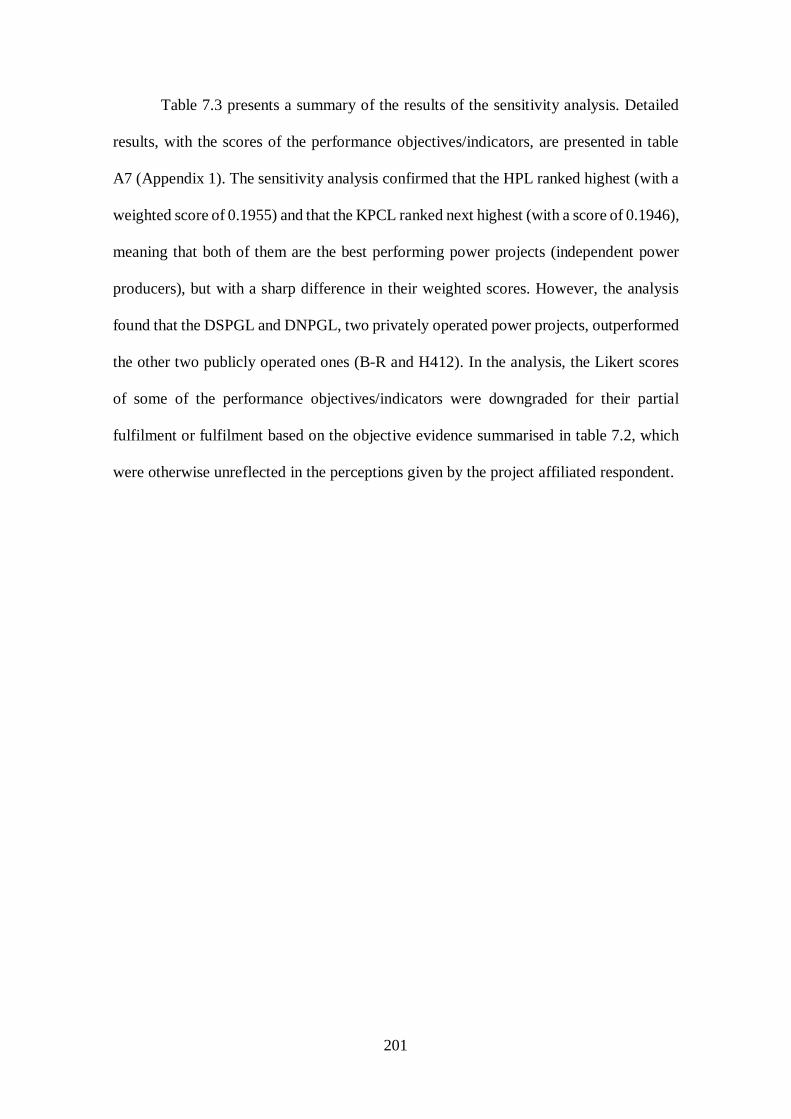
201
Table 7.3 presents a summary of the results of the sensitivity analysis. Detailed
results, with the scores of the performance objectives/indicators, are presented in table
A7 (Appendix 1). The sensitivity analysis confirmed that the HPL ranked highest (with a
weighted score of 0.1955) and that the KPCL ranked next highest (with a score of 0.1946),
meaning that both of them are the best performing power projects (independent power
producers), but with a sharp difference in their weighted scores. However, the analysis
found that the DSPGL and DNPGL, two privately operated power projects, outperformed
the other two publicly operated ones (B-R and H412). In the analysis, the Likert scores
of some of the performance objectives/indicators were downgraded for their partial
fulfilment or fulfilment based on the objective evidence summarised in table 7.2, which
were otherwise unreflected in the perceptions given by the project affiliated respondent.
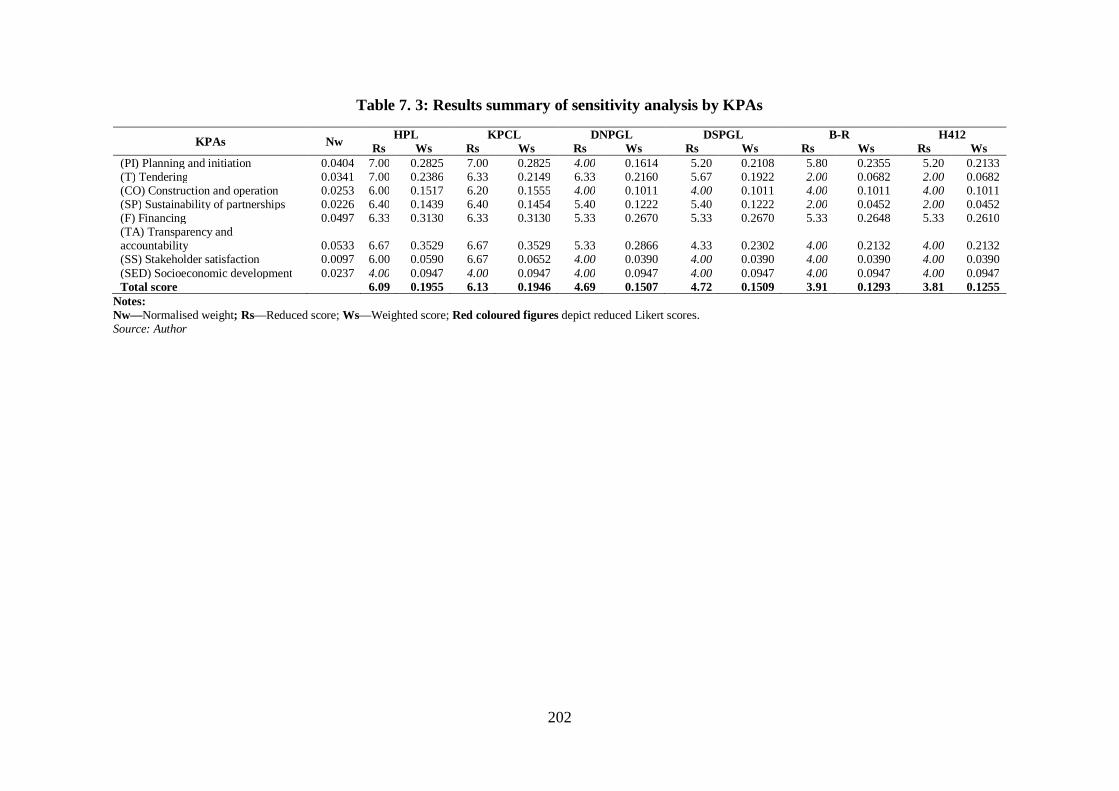
202
Table 7. 3: Results summary of sensitivity analysis by KPAs
KPAs Nw HPL KPCL DNPGL DSPGL B-R H412 Rs Ws Rs Ws Rs Ws Rs Ws Rs Ws Rs Ws
(PI) Planning and initiation 0.0404 7.00 0.2825 7.00 0.2825 4.00 0.1614 5.20 0.2108 5.80 0.2355 5.20 0.2133 (T) Tendering 0.0341 7.00 0.2386 6.33 0.2149 6.33 0.2160 5.67 0.1922 2.00 0.0682 2.00 0.0682 (CO) Construction and operation 0.0253 6.00 0.1517 6.20 0.1555 4.00 0.1011 4.00 0.1011 4.00 0.1011 4.00 0.1011 (SP) Sustainability of partnerships 0.0226 6.40 0.1439 6.40 0.1454 5.40 0.1222 5.40 0.1222 2.00 0.0452 2.00 0.0452 (F) Financing 0.0497 6.33 0.3130 6.33 0.3130 5.33 0.2670 5.33 0.2670 5.33 0.2648 5.33 0.2610 (TA) Transparency and accountability 0.0533 6.67 0.3529 6.67 0.3529 5.33 0.2866 4.33 0.2302 4.00 0.2132 4.00 0.2132 (SS) Stakeholder satisfaction 0.0097 6.00 0.0590 6.67 0.0652 4.00 0.0390 4.00 0.0390 4.00 0.0390 4.00 0.0390 (SED) Socioeconomic development 0.0237 4.00 0.0947 4.00 0.0947 4.00 0.0947 4.00 0.0947 4.00 0.0947 4.00 0.0947 Total score 6.09 0.1955 6.13 0.1946 4.69 0.1507 4.72 0.1509 3.91 0.1293 3.81 0.1255
Notes: Nw—Normalised weight; Rs—Reduced score; Ws—Weighted score; Red coloured figures depict reduced Likert scores. Source: Author
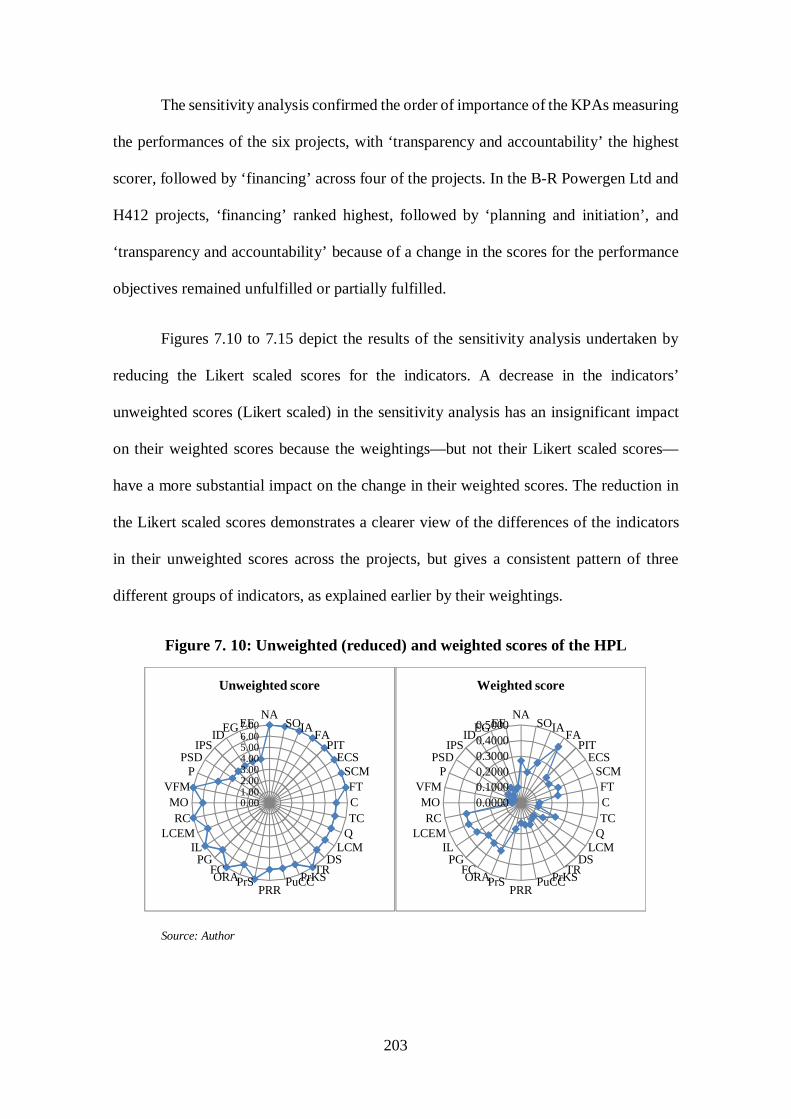
203
The sensitivity analysis confirmed the order of importance of the KPAs measuring
the performances of the six projects, with ‘transparency and accountability’ the highest
scorer, followed by ‘financing’ across four of the projects. In the B-R Powergen Ltd and
H412 projects, ‘financing’ ranked highest, followed by ‘planning and initiation’, and
‘transparency and accountability’ because of a change in the scores for the performance
objectives remained unfulfilled or partially fulfilled.
Figures 7.10 to 7.15 depict the results of the sensitivity analysis undertaken by
reducing the Likert scaled scores for the indicators. A decrease in the indicators’
unweighted scores (Likert scaled) in the sensitivity analysis has an insignificant impact
on their weighted scores because the weightings—but not their Likert scaled scores—
have a more substantial impact on the change in their weighted scores. The reduction in
the Likert scaled scores demonstrates a clearer view of the differences of the indicators
in their unweighted scores across the projects, but gives a consistent pattern of three
different groups of indicators, as explained earlier by their weightings.
Figure 7. 10: Unweighted (reduced) and weighted scores of the HPL
Source: Author
0.001.002.003.004.005.006.007.00
NASOIAFA
PITECS
SCMFTCTC
QLCM
DSTRPrKSPuCC
PRRPrSORAFC
PGIL
LCEMRC
MOVFM
PPSD
IPSIDEGEF
Unweighted score
0.00000.10000.20000.30000.40000.5000
NASOIAFA
PITECS
SCMFTCTC
QLCM
DSTRPrKSPuCC
PRRPrSORAFC
PGIL
LCEMRC
MOVFM
PPSD
IPSIDEGEF
Weighted score
204
Figure 7. 11: Unweighted (reduced) and weighted scores of the KPCL
Source: Author
Figure 7. 12: Unweighted (reduced) and weighted scores of the DNPGL
Figure 7. 13: Unweighted (reduced) and weighted scores of the DSPGL
Source: Author
0.001.002.003.004.005.006.007.00
NASOIAFA
PITECS
SCMFTCTC
QLCM
DSTRPrKSPuCC
PRRPrSORAFC
PGIL
LCEMRC
MOVFM
PPSD
IPSIDEGEF
Unweighted score
0.00000.10000.20000.30000.40000.5000
NASOIAFA
PITECS
SCMFTCTC
QLCM
DSTRPrKSPuCC
PRRPrSORAFC
PGIL
LCEMRC
MOVFM
PPSD
IPSIDEGEF
Weighted score
0.001.002.003.004.005.006.007.00
NASOIAFA
PITECS
SCMFTCTC
QLCM
DSTRPrKSPuCC
PRRPrSORAFC
PGIL
LCEMRC
MOVFM
PPSD
IPSIDEGEF
Unweighted score
0.00000.10000.20000.30000.40000.5000
NASOIAFA
PITECS
SCMFTCTC
QLCM
DSTRPrKSPuCC
PRRPrSORAFC
PGIL
LCEMRC
MOVFM
PPSD
IPSIDEGEF
Weighted score
0.001.002.003.004.005.006.007.00
NASOIAFA
PITECS
SCMFTCTC
QLCM
DSTRPrKSPuCC
PRRPrSORAFC
PGIL
LCEMRC
MOVFM
PPSD
IPSIDEGEF
Unweighted score
0.00000.10000.20000.30000.40000.5000
NASOIAFA
PITECS
SCMFTCTC
QLCM
DSTRPrKSPuCC
PRRPrSORAFC
PGIL
LCEMRC
MOVFM
PPSD
IPSIDEGEF
Weighted score
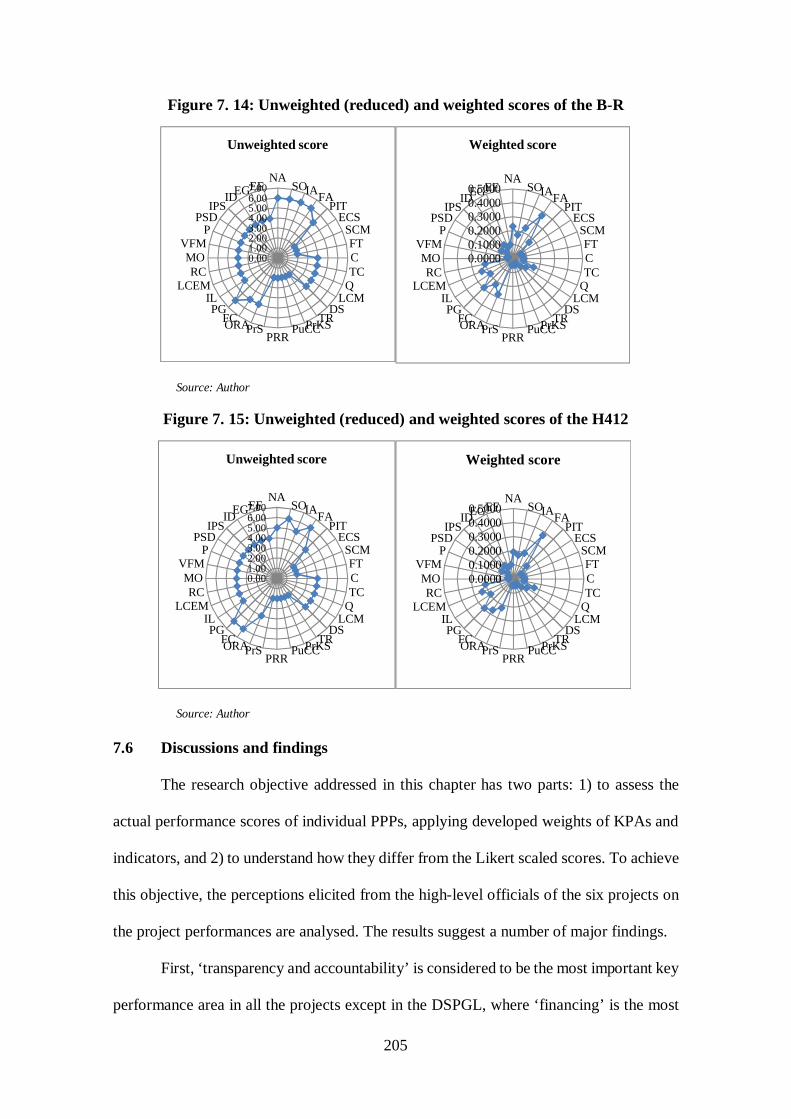
205
Figure 7. 14: Unweighted (reduced) and weighted scores of the B-R
Source: Author
Figure 7. 15: Unweighted (reduced) and weighted scores of the H412
Source: Author
7.6 Discussions and findings
The research objective addressed in this chapter has two parts: 1) to assess the
actual performance scores of individual PPPs, applying developed weights of KPAs and
indicators, and 2) to understand how they differ from the Likert scaled scores. To achieve
this objective, the perceptions elicited from the high-level officials of the six projects on
the project performances are analysed. The results suggest a number of major findings.
First, ‘transparency and accountability’ is considered to be the most important key
performance area in all the projects except in the DSPGL, where ‘financing’ is the most
0.001.002.003.004.005.006.007.00
NASOIAFA
PITECS
SCMFTCTC
QLCM
DSTRPrKSPuCC
PRRPrSORAFC
PGIL
LCEMRC
MOVFM
PPSD
IPSIDEGEF
Unweighted score
0.00000.10000.20000.30000.40000.5000
NASOIAFA
PITECS
SCMFTCTC
QLCM
DSTRPrKSPuCC
PRRPrSORAFC
PGIL
LCEMRC
MOVFM
PPSD
IPSIDEGEF
Weighted score
0.001.002.003.004.005.006.007.00
NASOIAFA
PITECS
SCMFTCTC
QLCM
DSTRPrKSPuCC
PRRPrSORAFC
PGIL
LCEMRC
MOVFM
PPSD
IPSIDEGEF
Unweighted score
0.00000.10000.20000.30000.40000.5000
NASOIAFA
PITECS
SCMFTCTC
QLCM
DSTRPrKSPuCC
PRRPrSORAFC
PGIL
LCEMRC
MOVFM
PPSD
IPSIDEGEF
Weighted score
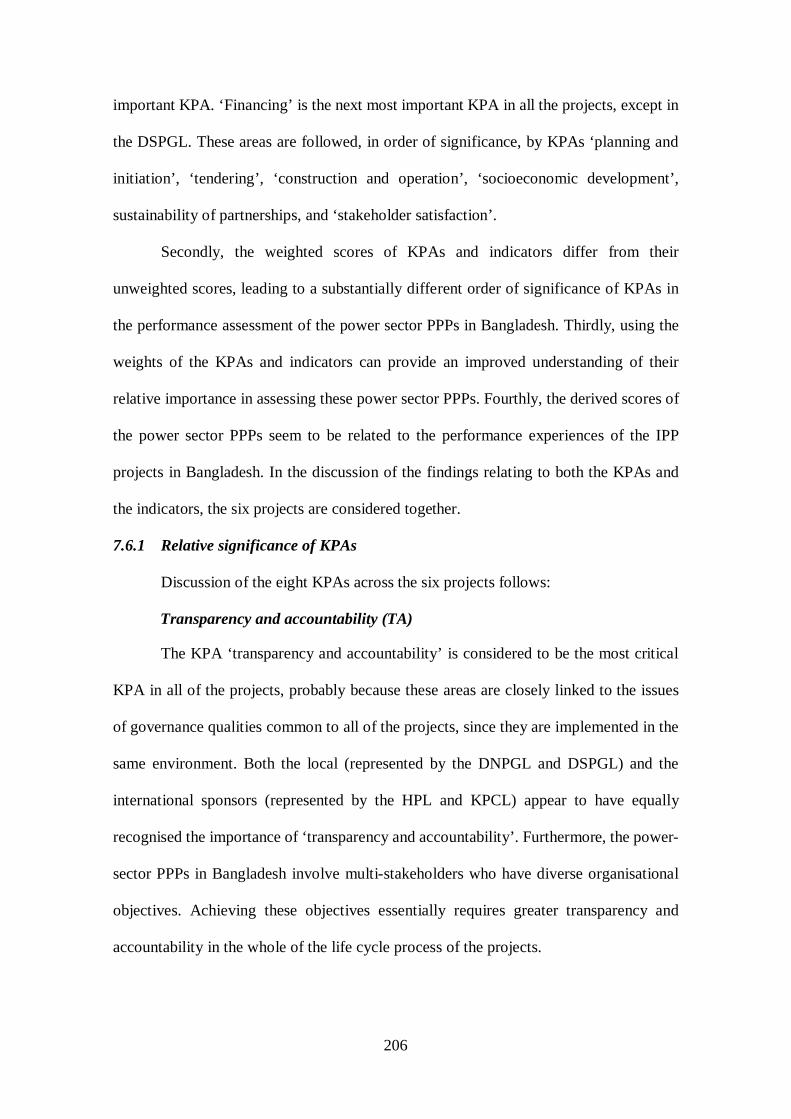
206
important KPA. ‘Financing’ is the next most important KPA in all the projects, except in
the DSPGL. These areas are followed, in order of significance, by KPAs ‘planning and
initiation’, ‘tendering’, ‘construction and operation’, ‘socioeconomic development’,
sustainability of partnerships, and ‘stakeholder satisfaction’.
Secondly, the weighted scores of KPAs and indicators differ from their
unweighted scores, leading to a substantially different order of significance of KPAs in
the performance assessment of the power sector PPPs in Bangladesh. Thirdly, using the
weights of the KPAs and indicators can provide an improved understanding of their
relative importance in assessing these power sector PPPs. Fourthly, the derived scores of
the power sector PPPs seem to be related to the performance experiences of the IPP
projects in Bangladesh. In the discussion of the findings relating to both the KPAs and
the indicators, the six projects are considered together.
7.6.1 Relative significance of KPAs
Discussion of the eight KPAs across the six projects follows:
Transparency and accountability (TA)
The KPA ‘transparency and accountability’ is considered to be the most critical
KPA in all of the projects, probably because these areas are closely linked to the issues
of governance qualities common to all of the projects, since they are implemented in the
same environment. Both the local (represented by the DNPGL and DSPGL) and the
international sponsors (represented by the HPL and KPCL) appear to have equally
recognised the importance of ‘transparency and accountability’. Furthermore, the power-
sector PPPs in Bangladesh involve multi-stakeholders who have diverse organisational
objectives. Achieving these objectives essentially requires greater transparency and
accountability in the whole of the life cycle process of the projects.
207
From the experiences of the six projects, the accountability concern, in the case
of Bangladesh, is evidenced in the DNPGL by the failure of the Rural Electrification
Board (REB) to provide land to the concessionaire as per the land lease agreement (LLA).
As a result, as documented in chapter six, the DNPGL later purchased the required land
(4 acres), which delayed project implementation and escalated the project’s actual cost.
Financing (F)
‘Financing’ is also considered to be a critical KPA for measuring performances in
all of the six projects in Bangladesh. This is reflected in both the weighted and unweighted
scores. Additionally, from the discussion on developing weights of the KPAs in chapter
five, it is found that critical issues in Bangladesh include the missing project deadlines,
the lack of timely finance for PPP projects and the huge demand for investment in
infrastructures (M. Khan et al., 2012; Mamun, 2015). These issues also indicate the
importance of the KPA ‘financing’ in Bangladesh.
However, arrangements of finance for power sector PPPs appear to be relatively
easier. For example, the HPL, which reached financial closure on time, received a
commitment of finances from the World Bank (IFC) and a commercial loan from
international lenders. The involvement of the World Bank in this project might have
provided confidence to the financiers. Similarly, the DNPGL and DSPGL also received
timely financing commitment because of the support from the Investment Promotion and
Financing Facility (IPFF), given by the World Bank. Without such state guarantees and
the back-up from the World Bank, commercial borrowing from local banks to finance
large-scale IPPs seems to be difficult in Bangladesh, as reported in chapter six (World
Bank, 2015).
208
Planning and initiation (PI)
‘Planning and initiation’ is also a relatively important KPA in the selected
projects, but less so than those two just discussed (TA and F). The government has short,
medium and long-term perspective plans on power sector development, including a plan
for engaging private sectors in power generation through the PPP option. Accordingly,
the government has made policies that have substantially supported sponsors to plan and
initiate IPPs. The HPL and KPCL, the two IPPs implemented early, represent ideal cases
of well-planned power plants. Both of them have been developed by foreign companies
from the USA (AES and Coastal Power Corporation) and Finland (Wartsila Corporation).
The perception of the respective project people regarding planning and initiation, as seen
via the Likert scaled scores for the HPL and KPCL on KPA PI, supported this claim of
good planning that could have been made. In contrast, the DNPGL and DSPGL indicated
a lack of feasibility analysis by the failure to transfer the land to the project, as reported
in chapter six.
Tendering (T)
‘Tendering’ is also a moderately significant KPA (fourth in the ranking) in all of
the projects, using both the weighted and unweighted scores. Institutional qualities of the
government have an impact on the qualities of tendering practices (T. Liu et al., 2016),
which are identical in all of the projects. Of the six, four projects (HPL, KPCL, DNPGL,
and DSPGL) were awarded their contract through the process of competitive tendering;
the remaining two (B-R and H412), through unsolicited proposals, as discussed in chapter
six.
Construction and operation (CO), Sustainability of partnerships (SP) and Socio-economic development (SED)
The three KPAs (CO, SP, and SED) have a similar order of significance using
both weighted and unweighted scores, whereas they are unlike with respect to their
209
functionalities. However, the issues that include design innovation, relationship
maintenance and long-term social benefits are related to these KPAs and accordingly they
are more desirable to the developed countries. These complex issues require a
comparatively higher level of expertise that developing countries may not have (De Jong
et al., 2010; Zou et al., 2014). The analysis of the experiences from the selected projects
in chapter six suggests that these issues appear to be less significant in all of the projects.
Bangladesh is a developing country that has relatively fewer experiences of PPPs and
thus it is supposed to have less expertise in handling the advanced issues relating to these
KPAs.
Stakeholder satisfaction (SS)
‘Stakeholder satisfaction’ is considered to be the least significant KPA. Ensuring
stakeholder satisfaction for all parties involved in the selected projects appears very
difficult because of the lack of stakeholder attitudes required for implementing PPPs.
Furthermore, because the scope of the rent capture is higher in Bangladesh (M. Khan et
al., 2012), the project sponsors might be more concerned to win a PPP contract rather
than to be satisfied with the qualities of the tendering procedure. However, the
implementing authority might likewise be satisfied with an achievement of objectives at
a suboptimal level, in anticipation of receiving benefits from the sponsors by providing
sponsors favour in the process of contract approval as well as the post-monitoring phase.
Therefore, stakeholder satisfaction might be relatively less important to the parties
concerned.
7.6.2 Relative significance of indicators
An analysis of the results relating to the indicators suggests that, for three groups
of indicators, the order of significance is sensitive to the weights. The sensitivity analysis
by reducing Likert scaled scores in a systematic manner confirmed this finding along with
210
others. The first group, including indicator ‘value for money’, ‘innovation in public
sector’, ‘trust and respect’, ‘project sustainability’, and ‘PPP sector development’, seem
to be highly sensitive to the weights across all of the projects. This group obtained very
low scores when considering weights, but high scores when using Likert scale
measurement. Hence, it is understandable that extremely low weightings of these
indicators explain the lower weighted scores. Moreover, there is no practice of assessing
value for money in the selected projects; accordingly, stakeholders seem to be less
concerned with the VFM. They also appear to be less aware of the innovation in the public
service, the mutual trust and respect for the partners, the skills of the private sector and
the PPP sector development in the selected projects.
The second group of indicators (‘life cycle evaluation and monitoring’, ‘optimal
risk allocation’, ‘payment and government guarantees’, ‘quality of assets’, ‘feasibility
analysis’, ‘integration of locals’, ‘financial cost’, and ‘responsiveness of concessionaire’)
received consistently higher weighted scores in all of the projects, but relatively lower
unweighted scores compared to the first group. This second group has consistent scores
in both weighted and unweighted measurement approaches. Despite their lower
unweighted scores, this group seems to have higher scores because they have higher
weightings, derived from the perceptions of the related experts in Bangladesh.
In between these two groups, a third one emerges. This includes the remaining 19
indicators8 (P, ID, EF, EG, NA, SO, IA, PIT, ECS, SCM, FT, C, TC, LCM, DS, PrKS,
8 P—Profitability; ID—Infrastructure development; EF—Environmental friendliness; EG—employment generation; NA—Needs assessment; SO—SMART Objectives; IA—Implementability assessment; PIT—Public interest test; ECS—Efficient concessionaire selection; SCM—selection criteria and method; FT—Fairness and transparency; C—Cost consideration; TC—Time consideration; LCM—Life cycle maintainability; DS—Dispute settlement; PrKS—
211
PuCC, PRR, MO) that come from the lowest and mid-level scoring indicators, including
traditionally important performance indicators such as time, cost and private sector
knowledge and skill. The weightings again explain the relative significance of this group
of indicators.
7.7 Concluding remarks
This chapter includes three major findings, which are outlined in the following
paragraphs: 1) the difference between the unweighted and the weighted scores, 2) the
improved understanding of KPAs and indicators, and 3), the inter-project highlights of
the scores.
Difference between unweighted and weighted scores
The weighted scores of KPAs and indicators differ from their unweighted scores,
which changes their order of significance in measuring project performances. The
weighted scores of the KPAs ‘transparency and accountability’ and ‘financing’ have
clearly improved, while those of the KPA ‘stakeholder satisfaction’, ‘sustainability of
partnerships’, and ‘socioeconomic development’ have deteriorated in all of the projects,
relative to the unweighted scores. Likewise, the weighted scores for a group of indicators
(including LCEM, ORA, PG, Q, FA, IL, FC, and RC) became elevated while the weighted
scores of another group (including VFM, IPS, TR, PrS and PSD) dropped. This is
primarily because the higher weightings from that group of indicators resulted from the
perceptions of the relevant PPP experts in Bangladesh.
Private sector knowledge and skill; PuCC—Public Sector Capacities and Coordination; PRR—Partners roles and responsibilities; MO—Meeting objectives;
212
Improved understanding of KPAs and indicators
The weighted process helps to provide an improved understanding of the relative
significance of KPAs and their component indicators. Combining the weights with the
scores may contribute to reducing biases of either perceived Likert scaled scores or only
the weightings. This improved understanding could help project implementers and
regulators by informing relatively more important area of PPP performance for efficient
resource allocation.
Inter-project highlights of the scores
Finally, the findings also suggest that the overall scores of the selected projects,
based on the unweighted and weighted measures, seem to have related to their
performances reported in the publicly available documents and other media reports
(discussed in chapter 6) (Dhaka Stock Exchange, 2010; S. Khan, 2007; World Bank,
2014a). The HPL and KPCL are two widely reported best-performing IPPs in
Bangladesh, considering all aspects of PPPs, particularly in achieving cost and time
performances and in providing low tariff electricity (Dhaka Stock Exchange, 2010; M.
Khan et al., 2012). These experiences support the performance scores derived for them in
this study.
Another two projects, including the DNPGL and DSPGL, perform relatively
poorly compared to the HPL and KPCL. They were delayed in achieving their
commercial operation date because of difficulties relating to land transfer and political
force majeure. They also suffered from cost overrun (ICB Capital Management Ltd,
2016). The difficulties stated above in these projects are consistent with the poor
performance scores for them.
The remaining two projects (B-R and H412) were implemented by public sector
organisations. From the initial analysis, these projects looked better than the DNPGL and
213
DSPGL, but worse than the HPL and KPCL, with respect to their performance scores.
However, the sensitivity analysis showed those projects as performing even worse than
the DNPGL and DSPGL, which is logical and acceptable because the sensitivity test
considered reduced scores for the performance objectives unreflected in the more
traditional analysis. Public sector operated power projects (B-R and H412) are
assumingly exposed to lesser uncertainty, but are privileged with selective tendering
processes (e.g., unsolicited proposals), and thus generally have the scope to show better
performance. The next chapter presents the overall conclusions and policy
recommendations developed from the research.

214
Chapter Eight: Conclusion and policy
recommendations
215
8.1 Introduction
This chapter presents the overall conclusion of the study. Section 8.2 provides a
review of the research questions and presents associated research findings, section 8.3
provides further discussion on the significance and major contributions briefly presented
in chapter one. Section 8.4 provides an overview of the limitations of the study while
details thereon have been discussed in chapter four. Section 8.5 concludes by pointing to
some directions for future research on the major debatable issues revealed in this study.
8.2 Review of the research questions and major findings
The aim of this study was to develop a framework of weighted KPAs and
indicators and subsequently to apply it in measuring and explaining the performance of
public-private partnerships in developing countries. The major outcome of this study is,
therefore, a methodological innovation in developing a weighted indicator system by
using the AHP method and its application to a number of power sector PPPs in
Bangladesh. To achieve the research outcomes, a set of four research questions was
framed, which are as follows:
RQ1. What are the most appropriate indicators and hence key performance areas
(KPAs) of PPPs in developing countries?
RQ2. What are the weights of the different KPAs and indicators of PPP
performance evaluation in developing countries and how do they differ
from those of developed countries?
RQ3. What are the most important performance areas of the power sector PPPs
in Bangladesh using a traditional approach of analysing case experiences?
216
RQ4. What are the actual performance scores of the sample of power sector
PPPs in Bangladesh applying developed weights of KPAs and indicators
and how do they differ from unweighted scores derived from industry
experts and/or readily available performance assessments?
To find the answers to these research questions, a mixed-method approach was
applied. Prior to applying the main methodology (analytical hierarchy process—AHP)
used in this study, a list of forty-one performance indicators was initially identified by an
exhaustive review of the related literature. These indicators were then grouped into eight
KPAs (related to RQ1). The AHP was applied to attach weights to the KPAs and
indicators as the main methodology (RQ2), based on the perceptions elicited from the
PPP experts in Bangladesh by using an appropriately structured questionnaire.
Subsequently, an exploratory case study method was used to examine the experiences of
six power-sector PPPs (independent power producers—IPPs) in Bangladesh (RQ3).
Finally, the developed weights were applied to the selected projects to derive the scores
of individual project performance by interacting them with the Likert scaled scores
obtained through a project-specific questionnaire survey administered in the latter stage
of the study (RQ4).
Major findings
In response to the RQ2, a model/framework of weighted performance indicators
has been developed for evaluating PPP performance in Bangladesh. Unlike developed
countries, a different set of KPAs and indicators are found to be dominant in measuring
PPP performances in the context of the developing countries such as Bangladesh. In
developed countries, for instance, cost, time and quality typically seemed to be the most
important indicators. However, in this study, ‘financing’ ‘planning and initiation’, and
‘transparency and accountability’ are found to be the most significant KPAs in
217
Bangladesh while ‘socioeconomic development’ is perceived to be the least significant
KPA. Regarding indicators, ‘feasibility analysis’ is weighted as the most important one,
followed by ‘life cycle evaluation and monitoring’, ‘optimal risk allocation’, and
‘responsiveness of concessionaire’.
In response to RQ3, our results reveal that the public sector commitment in
Bangladesh is relatively more important than the enactment of legislation for the success
of the power sector PPPs. Applying laws depends on the institutional qualities, but they
are generally deficient in developing countries including Bangladesh, as indicated by
existing literature (Panayides et al., 2015). The results also demonstrate that ‘improving
power supply’ and ‘innovative financing’ are the most achieved performance areas in
power sector PPPs based on the traditional case analysis while ‘financing’, ‘planning and
initiation’ and ‘transparency and accountability’ are the most achieved KPAs based on
our newly developed KPA system.
Using the KPAs, a pathway framework for evaluating the performance of the
power sector PPPs is proposed, in which some differences in the performance outcomes,
based on the two different evaluation approaches, are documented. These differences
draw critical attention to the traditional mechanism that could usefully be replaced by a
comprehensive evaluation mechanism, such as our KPA system, in the developing
countries. Furthermore, cost overruns and schedule delay are some common features in
most of the power sector PPPs in Bangladesh, nevertheless interest in using the PPP
option in the different sectors has expanded recently. This trend inevitably calls for an in-
depth empirical research to understand the real outcomes of the PPPs in terms of
efficiency gains in the long run, focusing on an analysis of the cost-effectiveness of the
IPPs in Bangladesh.
218
The result related to the RQ4 indicates that some power sector projects (HPL and
KPCL) perform well relative to others, based on the involvement of international
developers, financers, ownership type and commitment of the host government in project
implementation. The assessment of the performance scores of individual projects reveals
that the relative importance (weights) of the KPAs and indicators substantially change the
order of their significance in performance evaluation. For example, the order of KPA
‘transparency and accountability’ and ‘financing’ are around somewhere in the mid-level
when the unweighted scores are used, but their order of importance are in the highest
level when the weighted scores are used. This means that the weighted process helps
provide an improved understanding of the relative significance of KPAs and their
component indicators. Further, the overall scores of the selected projects based on the
unweighted and weighted measures relate to their performances reported in the publicly
available documents and other media reports (discussed in chapter 6) (Dhaka Stock
Exchange, 2010; S. Khan, 2007; World Bank, 2014a).
8.3 Value and significance of the study
The study has several contributions. Attaching weights to the KPAs and indicators
of PPPs, and applying those weights to derive individual project scores in a
developing country context, especially in Bangladesh, represents an innovation
and thus a contribution to the PPP performance literature. As a result, this study
represents a unique example which could be used for future reference in other
developing countries, especially in South Asia. Unlike traditional performance
criteria, a prioritised set of performance indicators and KPAs for the PPPs of
Bangladesh has been identified.
The finding related to the public sector determination calls for relatively more
effort that the host government should employ to build confidence in the private
219
sectors that potentially would engage in future PPP projects. The government, for
example, could set standards to enhance institutional qualities related to
implementing projects efficiently. Additionally, a framework for performance
evaluation of power sector PPPs has been proposed, which can be used in
evaluating power sector projects more objectively and systematically in
Bangladesh and other developing countries.
The weighted process (multiplying the weights with the Likert scaled scores)
provided an improved understanding of the relative significance of KPAs and
their component indicators and may contribute to reducing biases of either
perceived Likert scaled scores or only the weightings in PPP performance
evaluation. This research, therefore, adds value to the area of PPP performance
evaluation in a setting of developing countries. In other sectors such as transport,
health and accommodation in Bangladesh and other South Asian countries, the
developed weighted indicator system could usefully be applied for evaluating PPP
performance.
8.4 Limitations of the study
Like any other research, this study has some limitations. Some of these are related
to the methodology used and others are related to the area of study. While details of these
limitations are discussed in chapter four, a brief introduction to them has also been
provided in this section.
Although the AHP is a useful method for developing weights of the
KPAs/indicators, it has some potential limitations. The key components of the AHP
include hierarchy composition, the scale used to measure the intensity of preferences,
potential biases in the respondent selection, and the degree of ambiguity in the questions
asked (Manning et al., 2016). All these issues were carefully addressed to minimise the
220
potential loss of effectiveness from using this method. For example, to minimise the
selection bias, a substantial number of respondents representing major sectors of PPPs in
Bangladesh was selected. Nevertheless, future research could look at alternatives to the
AHP approach for developing KPA weights.
Part of the mixed method used in this study is a case study approach. Use of a case
approach can be argued to lack rigor and objectivity (Rowley, 2002). Findings from the
selected case study might be considered inappropriate for generalisation because of the
likelihood of the loss of important information that could remain uncovered in unattended
projects. However, in this study, the projects were carefully selected based on some pre-
defined criteria to avoid such loss from other projects. A similar selection process was
followed in the related previous study in the context of Indonesia (Atmo et al., 2017).
The actual project information is considered sensitive to public disclosure because
of confidentiality concerns, which might provide an undue advantage to the competitors.
Specifically, the power sector PPPs seem to be relatively more sensitive in developing
countries including Bangladesh. The denial of access to the actual information except
commercial documents appears to be another difficulty to research in the area of PPP
evaluation. Additionally, a lack of databases otherwise creates difficulties in identifying
appropriate KPAs and indicators for a particular type of PPP project. Moreover, project
characteristics and contextual features make indicator analysis a more tedious task.
Another limitation is related to the project-specific questionnaire survey. This
survey was designed to obtain scores of project performance, in which a spokesperson
for each project was asked to provide a score for their project. This person might be biased
in scoring positively for his project because of his affiliation with that project. However,
obtaining perceptions of the project-specific individuals was considered appropriate and
the only possible way of obtaining the information, especially where objective
221
information on performance is unavailable because of their sensitivity to the disclosure,
with the exception of project annual reports. Such annual reports were fully utilised for
documenting case experiences, but they needed to be supplemented by subjective
assessments of key project personnel relating to a number of performance indicators not
included in these annual reports.
PPP related literature is untied to a specific discipline, rather it is a blend of several
areas of studies that include project management, engineering, public governance,
contract management, and development economics. Furthermore, the literature related to
PPP performance evaluation focusing on the developing countries is found to be
inadequate. Nevertheless, a comprehensive review of PPP related literature as well as the
World Bank and other agency documents helped to develop an understanding of the
required literature to be studied and cited.
8.5 Policy recommendations and future research directions
A discussion on some critical policy issues together with the directions to future
research is as follows:
The developed model of weighted performance indicators based on the
perceptions of the experts specialised in PPPs in Bangladesh has been applied to
six power sector PPPs in Bangladesh to derive performance scores for those
projects. However, the model needs to be tested to a larger number of cases in a
different country or region. Future research could usefully do this and test for the
sensitivity of the results to differences in weights. A wider set of respondents from
more developing countries might be beneficial to allow for comparison of KPA
weights and overall project scores between the Bangladesh and other national
contexts.
222
For practical use of the developed method in evaluating PPPs, a long
questionnaire is required consisting of the many indicators, which may limit the
usefulness of this method in practice due to low response rates. Moreover, project
characteristics and contextual features make indicator selection a tedious task.
However, some of the indicators may be highly correlated which means that most
of the information in the indicators can be captured by a smaller subset of
indicators. Therefore, future research could also usefully focus on shortening this
long list of performance indicators and establishing an empirical relationship
between the KPAs and indicators by using, for instance, structural equation
modelling. Establishing such a relationship could potentially contribute to
focusing on the most significant and short-listed indicators.
The improved understanding of the relative significance of KPAs and their
component indicators could help project implementers and regulators in power
sector PPPs by informing them of the relatively more important performance
areas, for which special attention should be paid in relation to enhanced resource
allocation to those areas. This research, therefore, adds value to the area of PPP
performance evaluation in a setting of developing countries. In other sectors such
as transport, health and accommodation in Bangladesh and other South Asian
countries, the developed weighted indicator system could usefully be applied for
evaluating PPP performance.
In this research (in chapter 5, 6 & 7), the ‘transparency and accountability’ KPA
has been perceived by the respondents both in the general and project-specific
survey to be one of the pressing areas for evaluating PPP performance in
Bangladesh. In the case study in chapter six, information on the number of bidders
participated in the tendering process in the DNPGL and DSPGL are publicly
223
unavailable, and unsolicited proposals were used for awarding the contract in the
B-R and H412. The previous study documented a similar finding that a small
number of bidders might be an evidence of a limited transparency in the PPP
procurement process in Bangladesh (M. Khan et al., 2012). Given this, the
transparency and accountability in PPPs, especially in the context of the
developing countries, might be an interesting research endeavour to find any link
of public and financial sector corruption to this area.
PPP projects are often considered as a strategic governance tool by the
government relative to their usefulness, which demotivates concerned authorities
to the disclosure of necessary information for research and development (Hodge
& Greve, 2005, 2017). In addition, the actual project information is considered
sensitive to disclosure as discussed in the previous section. Given this, a regulated
form of the disclosure, however, might be of interest for PPP sector development
in Bangladesh and other developing countries, particularly because the PPPs,
unlike traditional projects, involve multi-stakeholder interest that could be better
protected and improved by utilising the lessons drawn from the review of and
research on the ex-post information of the PPP projects.
The long-term consequences of using the PPP option instead of traditional
procurement seemed to be difficult to be measured conclusively by using KPA
system or any other traditional approaches. This suggests an area for fruitful future
research since the methodology and data needed to fully assess the wider socio-
economic impact of PPP projects is relatively underdeveloped in the Bangladesh
context. Similarly, the performance objective of efficiency gains in the traditional
framework is also difficult to measure and assess by the approaches used in this
224
research. Future research can also empirically address the issue of efficiency gains
promised by the PPPs.
Specifically, the government of Bangladesh may also consider an in-depth study
on the effectiveness of private power generation (especially independent power
producers) relative to the public sector generation by including all projects with
the actual information on their performances. This study might consider long-term
consequences of the private generation, such as the issues related to the ownership
transfer and long-term liabilities of the government. The study could also suggest
the efficient use of natural gas, coal and imported fuels and explore the potential
of the alternative source of energy such as renewable energy.
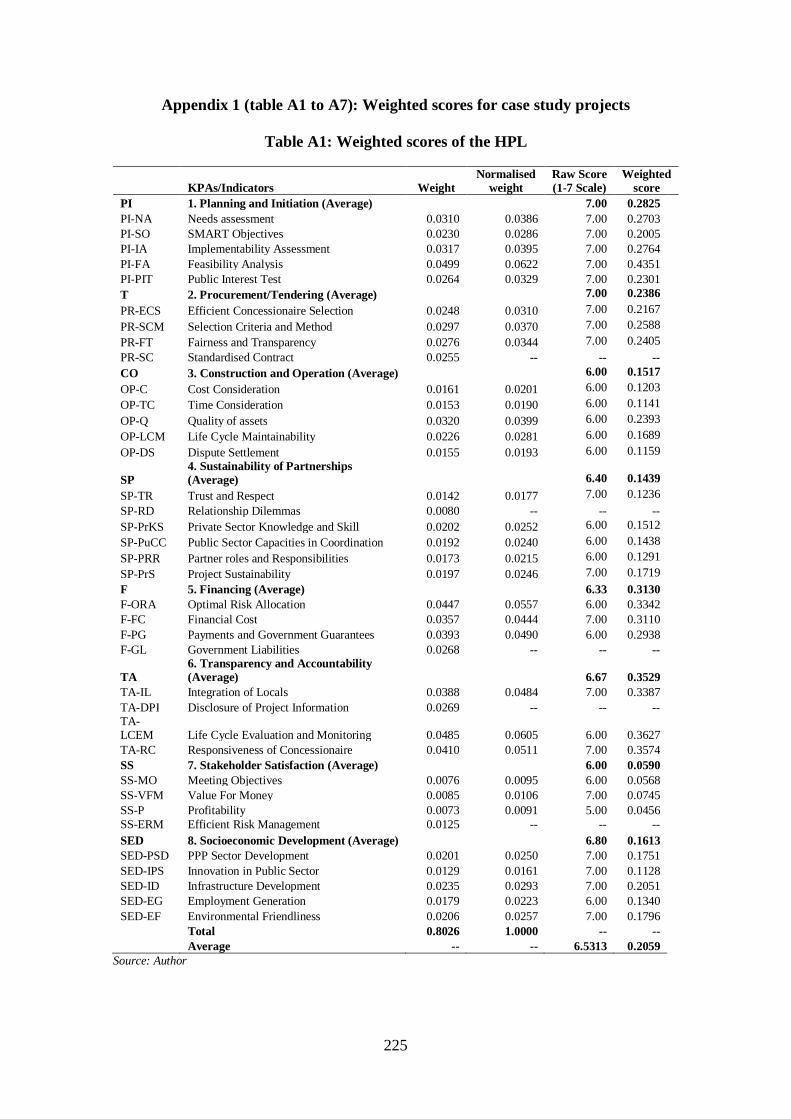
225
Appendix 1 (table A1 to A7): Weighted scores for case study projects
Table A1: Weighted scores of the HPL
KPAs/Indicators Weight
Normalised weight
Raw Score (1-7 Scale)
Weighted score
PI 1. Planning and Initiation (Average) 7.00 0.2825 PI-NA Needs assessment 0.0310 0.0386 7.00 0.2703 PI-SO SMART Objectives 0.0230 0.0286 7.00 0.2005 PI-IA Implementability Assessment 0.0317 0.0395 7.00 0.2764 PI-FA Feasibility Analysis 0.0499 0.0622 7.00 0.4351 PI-PIT Public Interest Test 0.0264 0.0329 7.00 0.2301 T 2. Procurement/Tendering (Average) 7.00 0.2386 PR-ECS Efficient Concessionaire Selection 0.0248 0.0310 7.00 0.2167 PR-SCM Selection Criteria and Method 0.0297 0.0370 7.00 0.2588 PR-FT Fairness and Transparency 0.0276 0.0344 7.00 0.2405 PR-SC Standardised Contract 0.0255 -- -- -- CO 3. Construction and Operation (Average) 6.00 0.1517 OP-C Cost Consideration 0.0161 0.0201 6.00 0.1203 OP-TC Time Consideration 0.0153 0.0190 6.00 0.1141 OP-Q Quality of assets 0.0320 0.0399 6.00 0.2393 OP-LCM Life Cycle Maintainability 0.0226 0.0281 6.00 0.1689 OP-DS Dispute Settlement 0.0155 0.0193 6.00 0.1159
SP 4. Sustainability of Partnerships (Average) 6.40 0.1439
SP-TR Trust and Respect 0.0142 0.0177 7.00 0.1236 SP-RD Relationship Dilemmas 0.0080 -- -- -- SP-PrKS Private Sector Knowledge and Skill 0.0202 0.0252 6.00 0.1512 SP-PuCC Public Sector Capacities in Coordination 0.0192 0.0240 6.00 0.1438 SP-PRR Partner roles and Responsibilities 0.0173 0.0215 6.00 0.1291 SP-PrS Project Sustainability 0.0197 0.0246 7.00 0.1719 F 5. Financing (Average) 6.33 0.3130 F-ORA Optimal Risk Allocation 0.0447 0.0557 6.00 0.3342 F-FC Financial Cost 0.0357 0.0444 7.00 0.3110 F-PG Payments and Government Guarantees 0.0393 0.0490 6.00 0.2938 F-GL Government Liabilities 0.0268 -- -- --
TA 6. Transparency and Accountability (Average) 6.67 0.3529
TA-IL Integration of Locals 0.0388 0.0484 7.00 0.3387 TA-DPI Disclosure of Project Information 0.0269 -- -- -- TA-LCEM Life Cycle Evaluation and Monitoring 0.0485 0.0605 6.00 0.3627 TA-RC Responsiveness of Concessionaire 0.0410 0.0511 7.00 0.3574 SS 7. Stakeholder Satisfaction (Average) 6.00 0.0590 SS-MO Meeting Objectives 0.0076 0.0095 6.00 0.0568 SS-VFM Value For Money 0.0085 0.0106 7.00 0.0745 SS-P Profitability 0.0073 0.0091 5.00 0.0456 SS-ERM Efficient Risk Management 0.0125 -- -- -- SED 8. Socioeconomic Development (Average) 6.80 0.1613 SED-PSD PPP Sector Development 0.0201 0.0250 7.00 0.1751 SED-IPS Innovation in Public Sector 0.0129 0.0161 7.00 0.1128 SED-ID Infrastructure Development 0.0235 0.0293 7.00 0.2051 SED-EG Employment Generation 0.0179 0.0223 6.00 0.1340 SED-EF Environmental Friendliness 0.0206 0.0257 7.00 0.1796 Total 0.8026 1.0000 -- -- Average -- -- 6.5313 0.2059
Source: Author
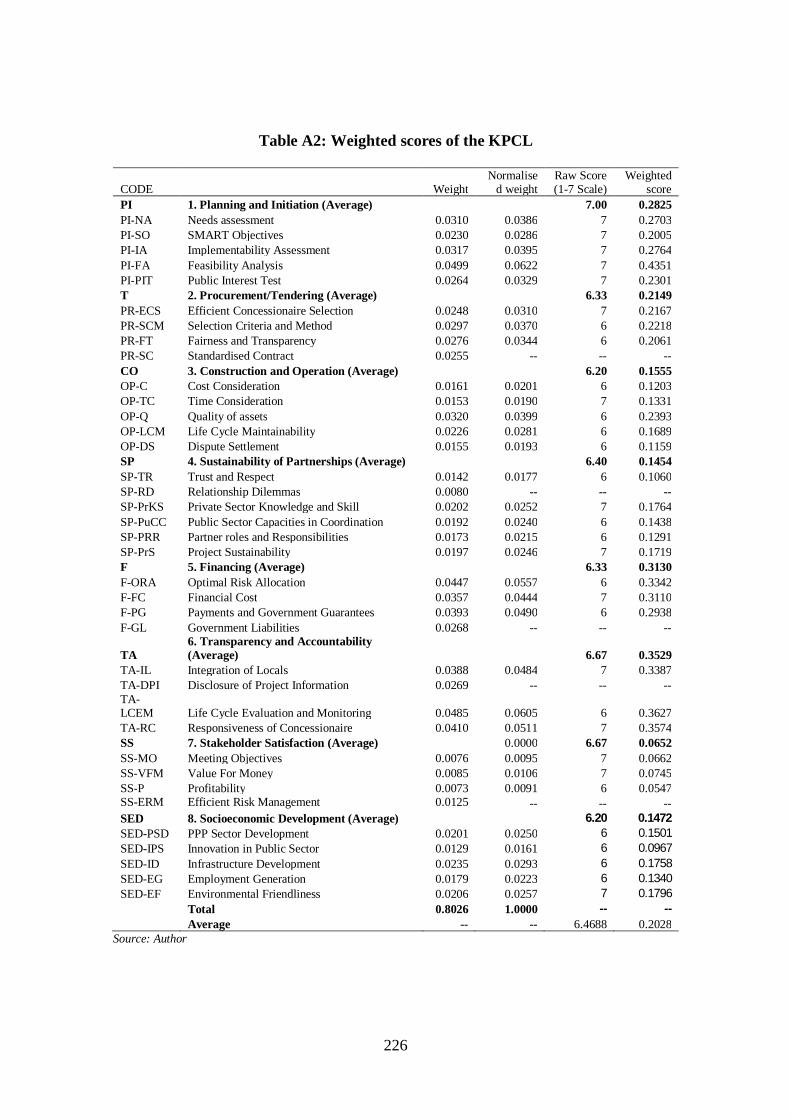
226
Table A2: Weighted scores of the KPCL
CODE Weight Normalise
d weight Raw Score (1-7 Scale)
Weighted score
PI 1. Planning and Initiation (Average) 7.00 0.2825 PI-NA Needs assessment 0.0310 0.0386 7 0.2703 PI-SO SMART Objectives 0.0230 0.0286 7 0.2005 PI-IA Implementability Assessment 0.0317 0.0395 7 0.2764 PI-FA Feasibility Analysis 0.0499 0.0622 7 0.4351 PI-PIT Public Interest Test 0.0264 0.0329 7 0.2301 T 2. Procurement/Tendering (Average) 6.33 0.2149 PR-ECS Efficient Concessionaire Selection 0.0248 0.0310 7 0.2167 PR-SCM Selection Criteria and Method 0.0297 0.0370 6 0.2218 PR-FT Fairness and Transparency 0.0276 0.0344 6 0.2061 PR-SC Standardised Contract 0.0255 -- -- -- CO 3. Construction and Operation (Average) 6.20 0.1555 OP-C Cost Consideration 0.0161 0.0201 6 0.1203 OP-TC Time Consideration 0.0153 0.0190 7 0.1331 OP-Q Quality of assets 0.0320 0.0399 6 0.2393 OP-LCM Life Cycle Maintainability 0.0226 0.0281 6 0.1689 OP-DS Dispute Settlement 0.0155 0.0193 6 0.1159 SP 4. Sustainability of Partnerships (Average) 6.40 0.1454 SP-TR Trust and Respect 0.0142 0.0177 6 0.1060 SP-RD Relationship Dilemmas 0.0080 -- -- -- SP-PrKS Private Sector Knowledge and Skill 0.0202 0.0252 7 0.1764 SP-PuCC Public Sector Capacities in Coordination 0.0192 0.0240 6 0.1438 SP-PRR Partner roles and Responsibilities 0.0173 0.0215 6 0.1291 SP-PrS Project Sustainability 0.0197 0.0246 7 0.1719 F 5. Financing (Average) 6.33 0.3130 F-ORA Optimal Risk Allocation 0.0447 0.0557 6 0.3342 F-FC Financial Cost 0.0357 0.0444 7 0.3110 F-PG Payments and Government Guarantees 0.0393 0.0490 6 0.2938 F-GL Government Liabilities 0.0268 -- -- --
TA 6. Transparency and Accountability (Average) 6.67 0.3529
TA-IL Integration of Locals 0.0388 0.0484 7 0.3387 TA-DPI Disclosure of Project Information 0.0269 -- -- -- TA-LCEM Life Cycle Evaluation and Monitoring 0.0485 0.0605 6 0.3627 TA-RC Responsiveness of Concessionaire 0.0410 0.0511 7 0.3574 SS 7. Stakeholder Satisfaction (Average) 0.0000 6.67 0.0652 SS-MO Meeting Objectives 0.0076 0.0095 7 0.0662 SS-VFM Value For Money 0.0085 0.0106 7 0.0745 SS-P Profitability 0.0073 0.0091 6 0.0547 SS-ERM Efficient Risk Management 0.0125 -- -- -- SED 8. Socioeconomic Development (Average) 6.20 0.1472 SED-PSD PPP Sector Development 0.0201 0.0250 6 0.1501 SED-IPS Innovation in Public Sector 0.0129 0.0161 6 0.0967 SED-ID Infrastructure Development 0.0235 0.0293 6 0.1758 SED-EG Employment Generation 0.0179 0.0223 6 0.1340 SED-EF Environmental Friendliness 0.0206 0.0257 7 0.1796 Total 0.8026 1.0000 -- -- Average -- -- 6.4688 0.2028
Source: Author
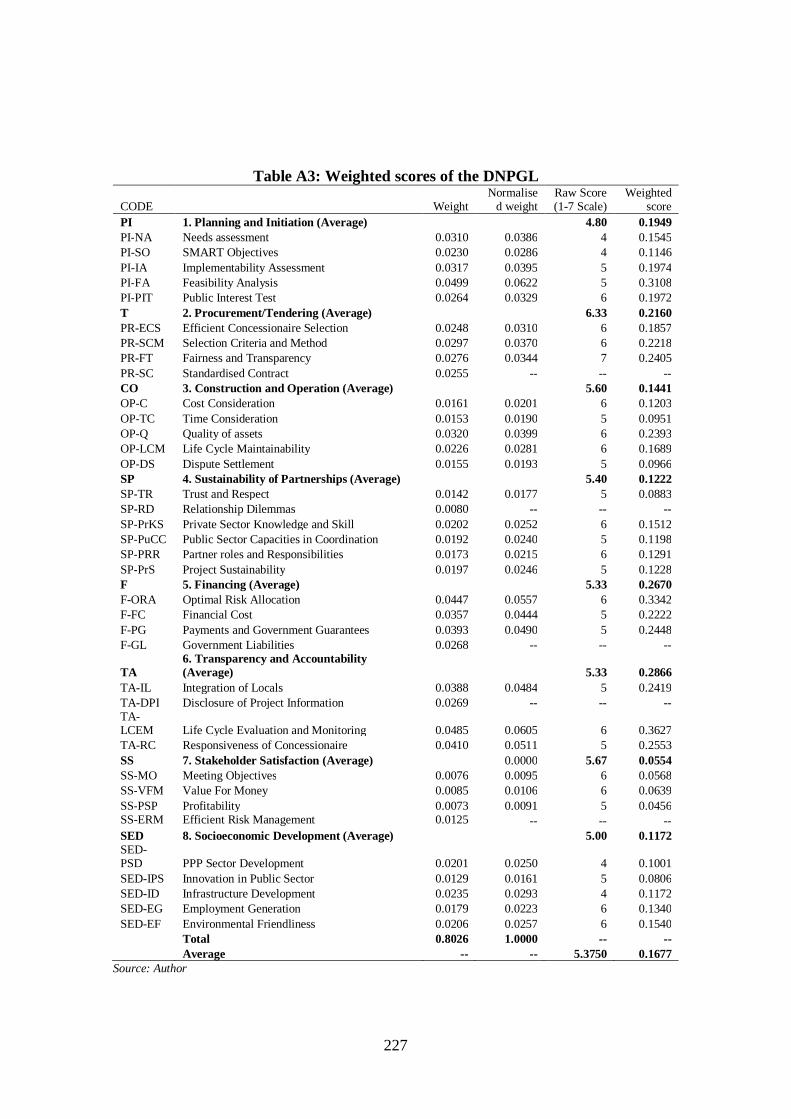
227
Table A3: Weighted scores of the DNPGL
CODE Weight Normalise
d weight Raw Score (1-7 Scale)
Weighted score
PI 1. Planning and Initiation (Average) 4.80 0.1949 PI-NA Needs assessment 0.0310 0.0386 4 0.1545 PI-SO SMART Objectives 0.0230 0.0286 4 0.1146 PI-IA Implementability Assessment 0.0317 0.0395 5 0.1974 PI-FA Feasibility Analysis 0.0499 0.0622 5 0.3108 PI-PIT Public Interest Test 0.0264 0.0329 6 0.1972 T 2. Procurement/Tendering (Average) 6.33 0.2160 PR-ECS Efficient Concessionaire Selection 0.0248 0.0310 6 0.1857 PR-SCM Selection Criteria and Method 0.0297 0.0370 6 0.2218 PR-FT Fairness and Transparency 0.0276 0.0344 7 0.2405 PR-SC Standardised Contract 0.0255 -- -- -- CO 3. Construction and Operation (Average) 5.60 0.1441 OP-C Cost Consideration 0.0161 0.0201 6 0.1203 OP-TC Time Consideration 0.0153 0.0190 5 0.0951 OP-Q Quality of assets 0.0320 0.0399 6 0.2393 OP-LCM Life Cycle Maintainability 0.0226 0.0281 6 0.1689 OP-DS Dispute Settlement 0.0155 0.0193 5 0.0966 SP 4. Sustainability of Partnerships (Average) 5.40 0.1222 SP-TR Trust and Respect 0.0142 0.0177 5 0.0883 SP-RD Relationship Dilemmas 0.0080 -- -- -- SP-PrKS Private Sector Knowledge and Skill 0.0202 0.0252 6 0.1512 SP-PuCC Public Sector Capacities in Coordination 0.0192 0.0240 5 0.1198 SP-PRR Partner roles and Responsibilities 0.0173 0.0215 6 0.1291 SP-PrS Project Sustainability 0.0197 0.0246 5 0.1228 F 5. Financing (Average) 5.33 0.2670 F-ORA Optimal Risk Allocation 0.0447 0.0557 6 0.3342 F-FC Financial Cost 0.0357 0.0444 5 0.2222 F-PG Payments and Government Guarantees 0.0393 0.0490 5 0.2448 F-GL Government Liabilities 0.0268 -- -- --
TA 6. Transparency and Accountability (Average) 5.33 0.2866
TA-IL Integration of Locals 0.0388 0.0484 5 0.2419 TA-DPI Disclosure of Project Information 0.0269 -- -- -- TA-LCEM Life Cycle Evaluation and Monitoring 0.0485 0.0605 6 0.3627 TA-RC Responsiveness of Concessionaire 0.0410 0.0511 5 0.2553 SS 7. Stakeholder Satisfaction (Average) 0.0000 5.67 0.0554 SS-MO Meeting Objectives 0.0076 0.0095 6 0.0568 SS-VFM Value For Money 0.0085 0.0106 6 0.0639 SS-PSP Profitability 0.0073 0.0091 5 0.0456 SS-ERM Efficient Risk Management 0.0125 -- -- -- SED 8. Socioeconomic Development (Average) 5.00 0.1172 SED-PSD PPP Sector Development 0.0201 0.0250 4 0.1001 SED-IPS Innovation in Public Sector 0.0129 0.0161 5 0.0806 SED-ID Infrastructure Development 0.0235 0.0293 4 0.1172 SED-EG Employment Generation 0.0179 0.0223 6 0.1340 SED-EF Environmental Friendliness 0.0206 0.0257 6 0.1540 Total 0.8026 1.0000 -- -- Average -- -- 5.3750 0.1677
Source: Author
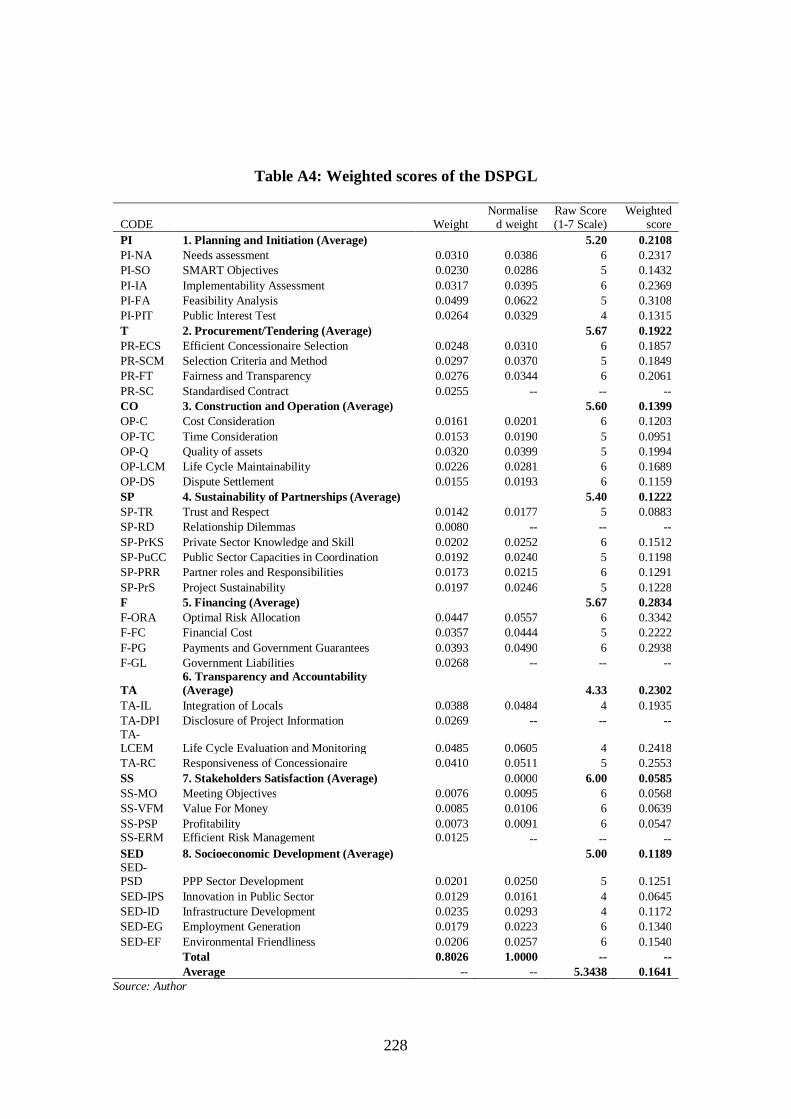
228
Table A4: Weighted scores of the DSPGL
CODE Weight Normalise
d weight Raw Score (1-7 Scale)
Weighted score
PI 1. Planning and Initiation (Average) 5.20 0.2108 PI-NA Needs assessment 0.0310 0.0386 6 0.2317 PI-SO SMART Objectives 0.0230 0.0286 5 0.1432 PI-IA Implementability Assessment 0.0317 0.0395 6 0.2369 PI-FA Feasibility Analysis 0.0499 0.0622 5 0.3108 PI-PIT Public Interest Test 0.0264 0.0329 4 0.1315 T 2. Procurement/Tendering (Average) 5.67 0.1922 PR-ECS Efficient Concessionaire Selection 0.0248 0.0310 6 0.1857 PR-SCM Selection Criteria and Method 0.0297 0.0370 5 0.1849 PR-FT Fairness and Transparency 0.0276 0.0344 6 0.2061 PR-SC Standardised Contract 0.0255 -- -- -- CO 3. Construction and Operation (Average) 5.60 0.1399 OP-C Cost Consideration 0.0161 0.0201 6 0.1203 OP-TC Time Consideration 0.0153 0.0190 5 0.0951 OP-Q Quality of assets 0.0320 0.0399 5 0.1994 OP-LCM Life Cycle Maintainability 0.0226 0.0281 6 0.1689 OP-DS Dispute Settlement 0.0155 0.0193 6 0.1159 SP 4. Sustainability of Partnerships (Average) 5.40 0.1222 SP-TR Trust and Respect 0.0142 0.0177 5 0.0883 SP-RD Relationship Dilemmas 0.0080 -- -- -- SP-PrKS Private Sector Knowledge and Skill 0.0202 0.0252 6 0.1512 SP-PuCC Public Sector Capacities in Coordination 0.0192 0.0240 5 0.1198 SP-PRR Partner roles and Responsibilities 0.0173 0.0215 6 0.1291 SP-PrS Project Sustainability 0.0197 0.0246 5 0.1228 F 5. Financing (Average) 5.67 0.2834 F-ORA Optimal Risk Allocation 0.0447 0.0557 6 0.3342 F-FC Financial Cost 0.0357 0.0444 5 0.2222 F-PG Payments and Government Guarantees 0.0393 0.0490 6 0.2938 F-GL Government Liabilities 0.0268 -- -- --
TA 6. Transparency and Accountability (Average) 4.33 0.2302
TA-IL Integration of Locals 0.0388 0.0484 4 0.1935 TA-DPI Disclosure of Project Information 0.0269 -- -- -- TA-LCEM Life Cycle Evaluation and Monitoring 0.0485 0.0605 4 0.2418 TA-RC Responsiveness of Concessionaire 0.0410 0.0511 5 0.2553 SS 7. Stakeholders Satisfaction (Average) 0.0000 6.00 0.0585 SS-MO Meeting Objectives 0.0076 0.0095 6 0.0568 SS-VFM Value For Money 0.0085 0.0106 6 0.0639 SS-PSP Profitability 0.0073 0.0091 6 0.0547 SS-ERM Efficient Risk Management 0.0125 -- -- -- SED 8. Socioeconomic Development (Average) 5.00 0.1189 SED-PSD PPP Sector Development 0.0201 0.0250 5 0.1251 SED-IPS Innovation in Public Sector 0.0129 0.0161 4 0.0645 SED-ID Infrastructure Development 0.0235 0.0293 4 0.1172 SED-EG Employment Generation 0.0179 0.0223 6 0.1340 SED-EF Environmental Friendliness 0.0206 0.0257 6 0.1540 Total 0.8026 1.0000 -- -- Average -- -- 5.3438 0.1641
Source: Author
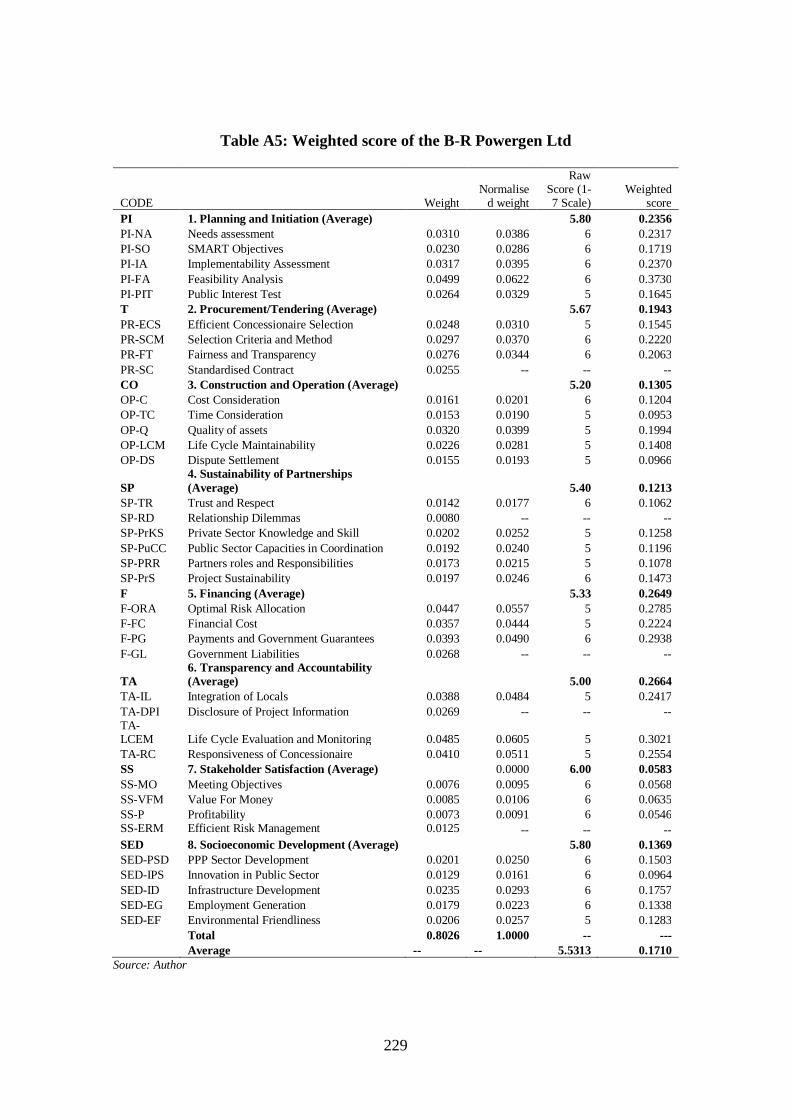
229
Table A5: Weighted score of the B-R Powergen Ltd
CODE Weight Normalise
d weight
Raw Score (1-7 Scale)
Weighted score
PI 1. Planning and Initiation (Average) 5.80 0.2356 PI-NA Needs assessment 0.0310 0.0386 6 0.2317 PI-SO SMART Objectives 0.0230 0.0286 6 0.1719 PI-IA Implementability Assessment 0.0317 0.0395 6 0.2370 PI-FA Feasibility Analysis 0.0499 0.0622 6 0.3730 PI-PIT Public Interest Test 0.0264 0.0329 5 0.1645 T 2. Procurement/Tendering (Average) 5.67 0.1943 PR-ECS Efficient Concessionaire Selection 0.0248 0.0310 5 0.1545 PR-SCM Selection Criteria and Method 0.0297 0.0370 6 0.2220 PR-FT Fairness and Transparency 0.0276 0.0344 6 0.2063 PR-SC Standardised Contract 0.0255 -- -- -- CO 3. Construction and Operation (Average) 5.20 0.1305 OP-C Cost Consideration 0.0161 0.0201 6 0.1204 OP-TC Time Consideration 0.0153 0.0190 5 0.0953 OP-Q Quality of assets 0.0320 0.0399 5 0.1994 OP-LCM Life Cycle Maintainability 0.0226 0.0281 5 0.1408 OP-DS Dispute Settlement 0.0155 0.0193 5 0.0966
SP 4. Sustainability of Partnerships (Average) 5.40 0.1213
SP-TR Trust and Respect 0.0142 0.0177 6 0.1062 SP-RD Relationship Dilemmas 0.0080 -- -- -- SP-PrKS Private Sector Knowledge and Skill 0.0202 0.0252 5 0.1258 SP-PuCC Public Sector Capacities in Coordination 0.0192 0.0240 5 0.1196 SP-PRR Partners roles and Responsibilities 0.0173 0.0215 5 0.1078 SP-PrS Project Sustainability 0.0197 0.0246 6 0.1473 F 5. Financing (Average) 5.33 0.2649 F-ORA Optimal Risk Allocation 0.0447 0.0557 5 0.2785 F-FC Financial Cost 0.0357 0.0444 5 0.2224 F-PG Payments and Government Guarantees 0.0393 0.0490 6 0.2938 F-GL Government Liabilities 0.0268 -- -- --
TA 6. Transparency and Accountability (Average) 5.00 0.2664
TA-IL Integration of Locals 0.0388 0.0484 5 0.2417 TA-DPI Disclosure of Project Information 0.0269 -- -- -- TA-LCEM Life Cycle Evaluation and Monitoring 0.0485 0.0605 5 0.3021 TA-RC Responsiveness of Concessionaire 0.0410 0.0511 5 0.2554 SS 7. Stakeholder Satisfaction (Average) 0.0000 6.00 0.0583 SS-MO Meeting Objectives 0.0076 0.0095 6 0.0568 SS-VFM Value For Money 0.0085 0.0106 6 0.0635 SS-P Profitability 0.0073 0.0091 6 0.0546 SS-ERM Efficient Risk Management 0.0125 -- -- -- SED 8. Socioeconomic Development (Average) 5.80 0.1369 SED-PSD PPP Sector Development 0.0201 0.0250 6 0.1503 SED-IPS Innovation in Public Sector 0.0129 0.0161 6 0.0964 SED-ID Infrastructure Development 0.0235 0.0293 6 0.1757 SED-EG Employment Generation 0.0179 0.0223 6 0.1338 SED-EF Environmental Friendliness 0.0206 0.0257 5 0.1283 Total 0.8026 1.0000 -- --- Average -- -- 5.5313 0.1710
Source: Author
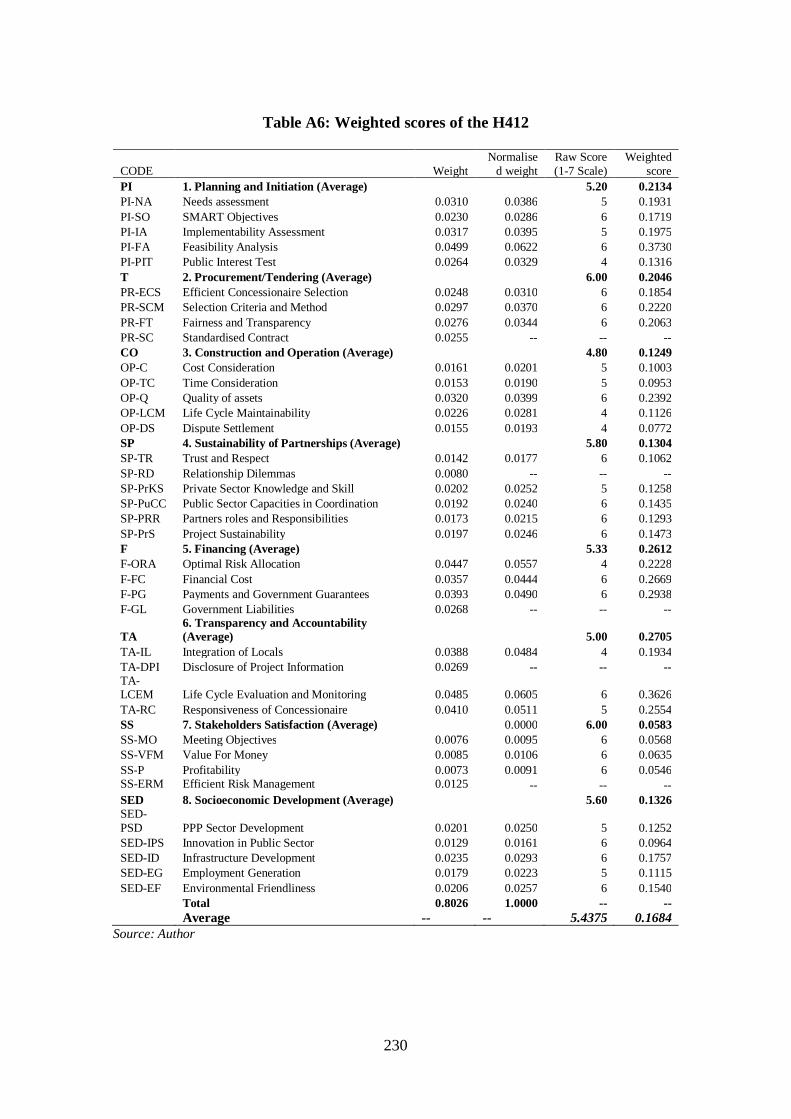
230
Table A6: Weighted scores of the H412
CODE Weight Normalise
d weight Raw Score (1-7 Scale)
Weighted score
PI 1. Planning and Initiation (Average) 5.20 0.2134 PI-NA Needs assessment 0.0310 0.0386 5 0.1931 PI-SO SMART Objectives 0.0230 0.0286 6 0.1719 PI-IA Implementability Assessment 0.0317 0.0395 5 0.1975 PI-FA Feasibility Analysis 0.0499 0.0622 6 0.3730 PI-PIT Public Interest Test 0.0264 0.0329 4 0.1316 T 2. Procurement/Tendering (Average) 6.00 0.2046 PR-ECS Efficient Concessionaire Selection 0.0248 0.0310 6 0.1854 PR-SCM Selection Criteria and Method 0.0297 0.0370 6 0.2220 PR-FT Fairness and Transparency 0.0276 0.0344 6 0.2063 PR-SC Standardised Contract 0.0255 -- -- -- CO 3. Construction and Operation (Average) 4.80 0.1249 OP-C Cost Consideration 0.0161 0.0201 5 0.1003 OP-TC Time Consideration 0.0153 0.0190 5 0.0953 OP-Q Quality of assets 0.0320 0.0399 6 0.2392 OP-LCM Life Cycle Maintainability 0.0226 0.0281 4 0.1126 OP-DS Dispute Settlement 0.0155 0.0193 4 0.0772 SP 4. Sustainability of Partnerships (Average) 5.80 0.1304 SP-TR Trust and Respect 0.0142 0.0177 6 0.1062 SP-RD Relationship Dilemmas 0.0080 -- -- -- SP-PrKS Private Sector Knowledge and Skill 0.0202 0.0252 5 0.1258 SP-PuCC Public Sector Capacities in Coordination 0.0192 0.0240 6 0.1435 SP-PRR Partners roles and Responsibilities 0.0173 0.0215 6 0.1293 SP-PrS Project Sustainability 0.0197 0.0246 6 0.1473 F 5. Financing (Average) 5.33 0.2612 F-ORA Optimal Risk Allocation 0.0447 0.0557 4 0.2228 F-FC Financial Cost 0.0357 0.0444 6 0.2669 F-PG Payments and Government Guarantees 0.0393 0.0490 6 0.2938 F-GL Government Liabilities 0.0268 -- -- --
TA 6. Transparency and Accountability (Average) 5.00 0.2705
TA-IL Integration of Locals 0.0388 0.0484 4 0.1934 TA-DPI Disclosure of Project Information 0.0269 -- -- -- TA-LCEM Life Cycle Evaluation and Monitoring 0.0485 0.0605 6 0.3626 TA-RC Responsiveness of Concessionaire 0.0410 0.0511 5 0.2554 SS 7. Stakeholders Satisfaction (Average) 0.0000 6.00 0.0583 SS-MO Meeting Objectives 0.0076 0.0095 6 0.0568 SS-VFM Value For Money 0.0085 0.0106 6 0.0635 SS-P Profitability 0.0073 0.0091 6 0.0546 SS-ERM Efficient Risk Management 0.0125 -- -- -- SED 8. Socioeconomic Development (Average) 5.60 0.1326 SED-PSD PPP Sector Development 0.0201 0.0250 5 0.1252 SED-IPS Innovation in Public Sector 0.0129 0.0161 6 0.0964 SED-ID Infrastructure Development 0.0235 0.0293 6 0.1757 SED-EG Employment Generation 0.0179 0.0223 5 0.1115 SED-EF Environmental Friendliness 0.0206 0.0257 6 0.1540 Total 0.8026 1.0000 -- -- Average -- -- 5.4375 0.1684
Source: Author
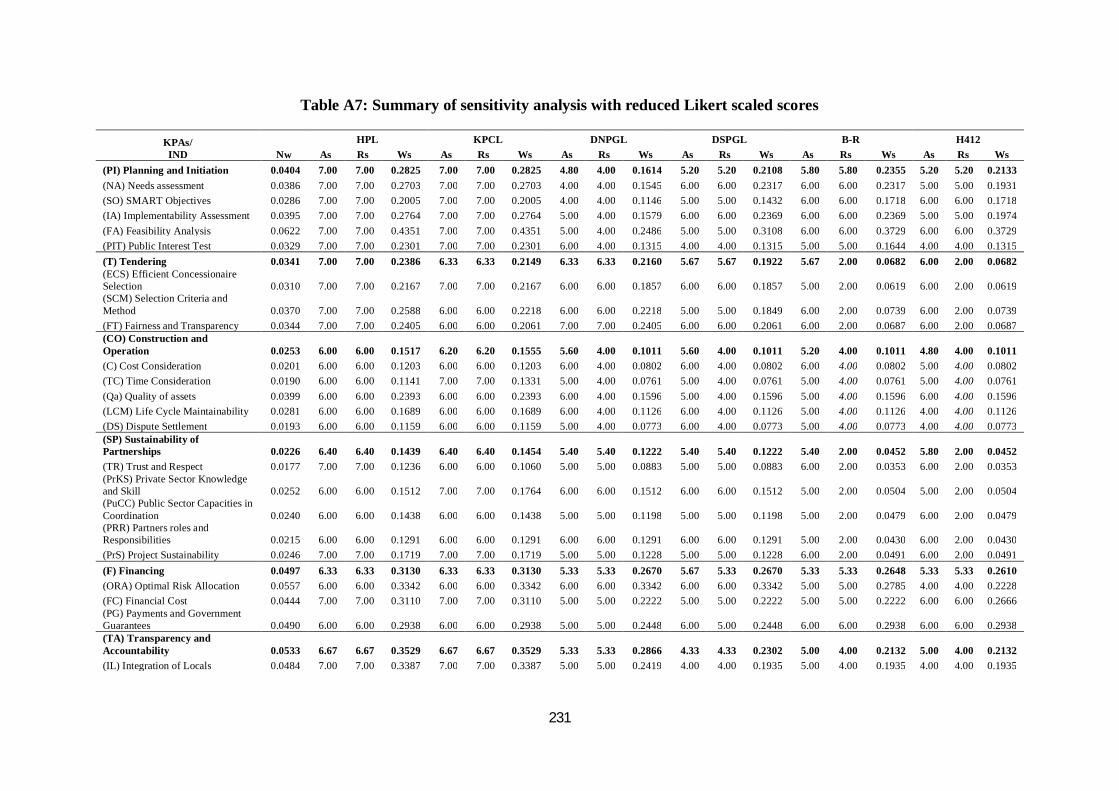
231
Table A7: Summary of sensitivity analysis with reduced Likert scaled scores
KPAs/ IND Nw
HPL KPCL DNPGL DSPGL B-R H412 As Rs Ws As Rs Ws As Rs Ws As Rs Ws As Rs Ws As Rs Ws
(PI) Planning and Initiation 0.0404 7.00 7.00 0.2825 7.00 7.00 0.2825 4.80 4.00 0.1614 5.20 5.20 0.2108 5.80 5.80 0.2355 5.20 5.20 0.2133 (NA) Needs assessment 0.0386 7.00 7.00 0.2703 7.00 7.00 0.2703 4.00 4.00 0.1545 6.00 6.00 0.2317 6.00 6.00 0.2317 5.00 5.00 0.1931 (SO) SMART Objectives 0.0286 7.00 7.00 0.2005 7.00 7.00 0.2005 4.00 4.00 0.1146 5.00 5.00 0.1432 6.00 6.00 0.1718 6.00 6.00 0.1718 (IA) Implementability Assessment 0.0395 7.00 7.00 0.2764 7.00 7.00 0.2764 5.00 4.00 0.1579 6.00 6.00 0.2369 6.00 6.00 0.2369 5.00 5.00 0.1974 (FA) Feasibility Analysis 0.0622 7.00 7.00 0.4351 7.00 7.00 0.4351 5.00 4.00 0.2486 5.00 5.00 0.3108 6.00 6.00 0.3729 6.00 6.00 0.3729 (PIT) Public Interest Test 0.0329 7.00 7.00 0.2301 7.00 7.00 0.2301 6.00 4.00 0.1315 4.00 4.00 0.1315 5.00 5.00 0.1644 4.00 4.00 0.1315 (T) Tendering 0.0341 7.00 7.00 0.2386 6.33 6.33 0.2149 6.33 6.33 0.2160 5.67 5.67 0.1922 5.67 2.00 0.0682 6.00 2.00 0.0682 (ECS) Efficient Concessionaire Selection 0.0310 7.00 7.00 0.2167 7.00 7.00 0.2167 6.00 6.00 0.1857 6.00 6.00 0.1857 5.00 2.00 0.0619 6.00 2.00 0.0619 (SCM) Selection Criteria and Method 0.0370 7.00 7.00 0.2588 6.00 6.00 0.2218 6.00 6.00 0.2218 5.00 5.00 0.1849 6.00 2.00 0.0739 6.00 2.00 0.0739 (FT) Fairness and Transparency 0.0344 7.00 7.00 0.2405 6.00 6.00 0.2061 7.00 7.00 0.2405 6.00 6.00 0.2061 6.00 2.00 0.0687 6.00 2.00 0.0687 (CO) Construction and Operation 0.0253 6.00 6.00 0.1517 6.20 6.20 0.1555 5.60 4.00 0.1011 5.60 4.00 0.1011 5.20 4.00 0.1011 4.80 4.00 0.1011 (C) Cost Consideration 0.0201 6.00 6.00 0.1203 6.00 6.00 0.1203 6.00 4.00 0.0802 6.00 4.00 0.0802 6.00 4.00 0.0802 5.00 4.00 0.0802 (TC) Time Consideration 0.0190 6.00 6.00 0.1141 7.00 7.00 0.1331 5.00 4.00 0.0761 5.00 4.00 0.0761 5.00 4.00 0.0761 5.00 4.00 0.0761 (Qa) Quality of assets 0.0399 6.00 6.00 0.2393 6.00 6.00 0.2393 6.00 4.00 0.1596 5.00 4.00 0.1596 5.00 4.00 0.1596 6.00 4.00 0.1596 (LCM) Life Cycle Maintainability 0.0281 6.00 6.00 0.1689 6.00 6.00 0.1689 6.00 4.00 0.1126 6.00 4.00 0.1126 5.00 4.00 0.1126 4.00 4.00 0.1126 (DS) Dispute Settlement 0.0193 6.00 6.00 0.1159 6.00 6.00 0.1159 5.00 4.00 0.0773 6.00 4.00 0.0773 5.00 4.00 0.0773 4.00 4.00 0.0773 (SP) Sustainability of Partnerships 0.0226 6.40 6.40 0.1439 6.40 6.40 0.1454 5.40 5.40 0.1222 5.40 5.40 0.1222 5.40 2.00 0.0452 5.80 2.00 0.0452 (TR) Trust and Respect 0.0177 7.00 7.00 0.1236 6.00 6.00 0.1060 5.00 5.00 0.0883 5.00 5.00 0.0883 6.00 2.00 0.0353 6.00 2.00 0.0353 (PrKS) Private Sector Knowledge and Skill 0.0252 6.00 6.00 0.1512 7.00 7.00 0.1764 6.00 6.00 0.1512 6.00 6.00 0.1512 5.00 2.00 0.0504 5.00 2.00 0.0504 (PuCC) Public Sector Capacities in Coordination 0.0240 6.00 6.00 0.1438 6.00 6.00 0.1438 5.00 5.00 0.1198 5.00 5.00 0.1198 5.00 2.00 0.0479 6.00 2.00 0.0479 (PRR) Partners roles and Responsibilities 0.0215 6.00 6.00 0.1291 6.00 6.00 0.1291 6.00 6.00 0.1291 6.00 6.00 0.1291 5.00 2.00 0.0430 6.00 2.00 0.0430 (PrS) Project Sustainability 0.0246 7.00 7.00 0.1719 7.00 7.00 0.1719 5.00 5.00 0.1228 5.00 5.00 0.1228 6.00 2.00 0.0491 6.00 2.00 0.0491 (F) Financing 0.0497 6.33 6.33 0.3130 6.33 6.33 0.3130 5.33 5.33 0.2670 5.67 5.33 0.2670 5.33 5.33 0.2648 5.33 5.33 0.2610 (ORA) Optimal Risk Allocation 0.0557 6.00 6.00 0.3342 6.00 6.00 0.3342 6.00 6.00 0.3342 6.00 6.00 0.3342 5.00 5.00 0.2785 4.00 4.00 0.2228 (FC) Financial Cost 0.0444 7.00 7.00 0.3110 7.00 7.00 0.3110 5.00 5.00 0.2222 5.00 5.00 0.2222 5.00 5.00 0.2222 6.00 6.00 0.2666 (PG) Payments and Government Guarantees 0.0490 6.00 6.00 0.2938 6.00 6.00 0.2938 5.00 5.00 0.2448 6.00 5.00 0.2448 6.00 6.00 0.2938 6.00 6.00 0.2938 (TA) Transparency and Accountability 0.0533 6.67 6.67 0.3529 6.67 6.67 0.3529 5.33 5.33 0.2866 4.33 4.33 0.2302 5.00 4.00 0.2132 5.00 4.00 0.2132 (IL) Integration of Locals 0.0484 7.00 7.00 0.3387 7.00 7.00 0.3387 5.00 5.00 0.2419 4.00 4.00 0.1935 5.00 4.00 0.1935 4.00 4.00 0.1935
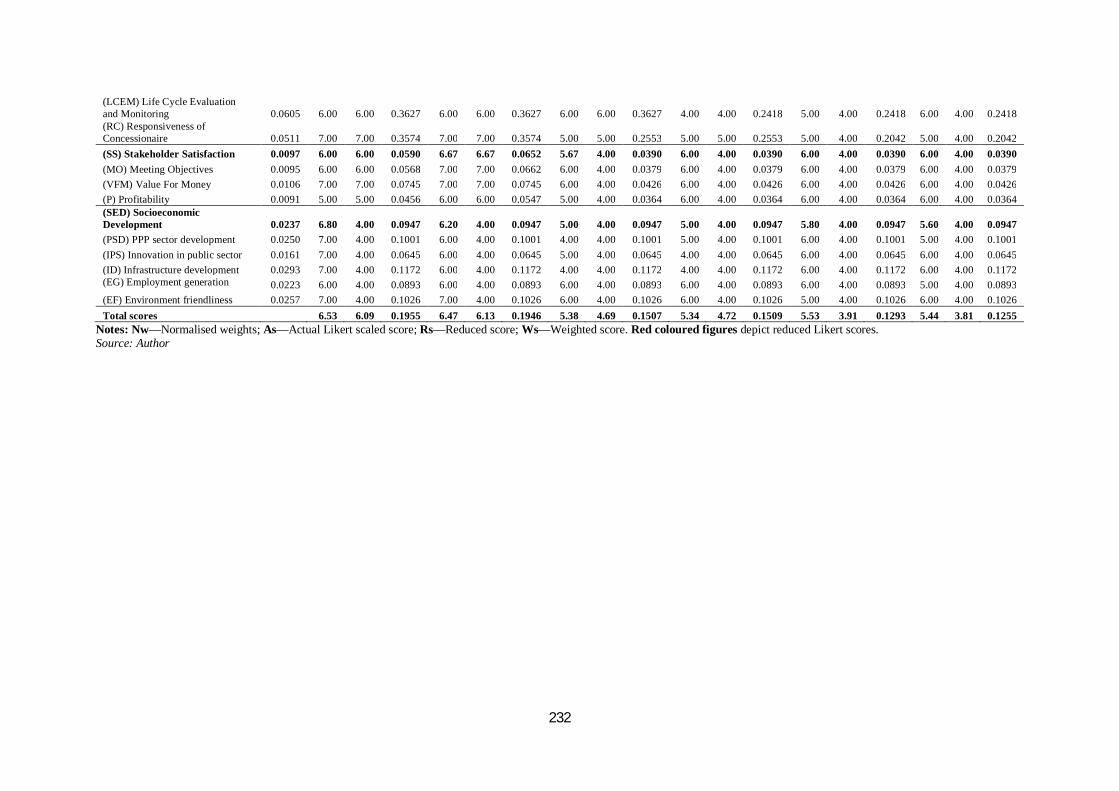
232
(LCEM) Life Cycle Evaluation and Monitoring 0.0605 6.00 6.00 0.3627 6.00 6.00 0.3627 6.00 6.00 0.3627 4.00 4.00 0.2418 5.00 4.00 0.2418 6.00 4.00 0.2418 (RC) Responsiveness of Concessionaire 0.0511 7.00 7.00 0.3574 7.00 7.00 0.3574 5.00 5.00 0.2553 5.00 5.00 0.2553 5.00 4.00 0.2042 5.00 4.00 0.2042 (SS) Stakeholder Satisfaction 0.0097 6.00 6.00 0.0590 6.67 6.67 0.0652 5.67 4.00 0.0390 6.00 4.00 0.0390 6.00 4.00 0.0390 6.00 4.00 0.0390 (MO) Meeting Objectives 0.0095 6.00 6.00 0.0568 7.00 7.00 0.0662 6.00 4.00 0.0379 6.00 4.00 0.0379 6.00 4.00 0.0379 6.00 4.00 0.0379 (VFM) Value For Money 0.0106 7.00 7.00 0.0745 7.00 7.00 0.0745 6.00 4.00 0.0426 6.00 4.00 0.0426 6.00 4.00 0.0426 6.00 4.00 0.0426 (P) Profitability 0.0091 5.00 5.00 0.0456 6.00 6.00 0.0547 5.00 4.00 0.0364 6.00 4.00 0.0364 6.00 4.00 0.0364 6.00 4.00 0.0364 (SED) Socioeconomic Development 0.0237 6.80 4.00 0.0947 6.20 4.00 0.0947 5.00 4.00 0.0947 5.00 4.00 0.0947 5.80 4.00 0.0947 5.60 4.00 0.0947 (PSD) PPP sector development 0.0250 7.00 4.00 0.1001 6.00 4.00 0.1001 4.00 4.00 0.1001 5.00 4.00 0.1001 6.00 4.00 0.1001 5.00 4.00 0.1001 (IPS) Innovation in public sector 0.0161 7.00 4.00 0.0645 6.00 4.00 0.0645 5.00 4.00 0.0645 4.00 4.00 0.0645 6.00 4.00 0.0645 6.00 4.00 0.0645 (ID) Infrastructure development 0.0293 7.00 4.00 0.1172 6.00 4.00 0.1172 4.00 4.00 0.1172 4.00 4.00 0.1172 6.00 4.00 0.1172 6.00 4.00 0.1172 (EG) Employment generation 0.0223 6.00 4.00 0.0893 6.00 4.00 0.0893 6.00 4.00 0.0893 6.00 4.00 0.0893 6.00 4.00 0.0893 5.00 4.00 0.0893 (EF) Environment friendliness 0.0257 7.00 4.00 0.1026 7.00 4.00 0.1026 6.00 4.00 0.1026 6.00 4.00 0.1026 5.00 4.00 0.1026 6.00 4.00 0.1026 Total scores 6.53 6.09 0.1955 6.47 6.13 0.1946 5.38 4.69 0.1507 5.34 4.72 0.1509 5.53 3.91 0.1293 5.44 3.81 0.1255
Notes: Nw—Normalised weights; As—Actual Likert scaled score; Rs—Reduced score; Ws—Weighted score. Red coloured figures depict reduced Likert scores. Source: Author
233
Appendix 2: Invitation and survey questionnaire
Research Team:
Professor Ross Guest Principal Supervisor
Professor Christine Smith
Associate Supervisor
Mohammad Hossain PhD Candidate
Dear Sir/Madam,
Thank you for agreeing to participate in this important survey.
I am a doctoral student in the Department of Accounting, Finance and Economics at
Griffith Business School of the Griffith University, and currently carrying out research
on Performance Evaluation of Public Private Partnerships in Developing Countries:
A Case Study of Bangladesh. This research aims to develop an ideal and inclusive index
of PPP performance indicators with their relative weighting. It is expected that the
research finding will contribute to the understanding and design of performance
evaluation mechanisms of PPPs in developing countries.
We are collecting data for this research through a structured questionnaire. I would like
you to complete the attached questionnaire, which will take around 30 to 40 minutes to
answer all the questions. Alternatively, this link
(https://prodsurvey.rcs.griffith.edu.au/prodls190/index.php?sid=69984&lang=en) can be
followed to answer the survey questions on-line. Please be assured that all answers you

234
give will be confidential. Survey data will only be used for research purposes. Your
candid response is highly valuable for this research endeavour. We would appreciate if
you would hand over the completed questionnaire to me or to my representative or send
it to: [email protected].
Please feel free to contact to the Manager, Research Ethics of the Griffith University
Human Research Ethics Committee on +61 xxxxxxxxx or at research-
[email protected], if you have any concern or compliant about the research. For any
general question about the research or questionnaires, please contact me on
+880xxxxxxxxx or at [email protected] or Syed Mohammad
Aminur Rahman, our independent local contact person on our behalf, on +8801xxxxxxxx.
By completing this Questionnaire it is assumed that you consent to participate in this
research.
We would be grateful for your valuable time and contribution to this research effort. Have
a happy and prosperous life.
Yours sincerely,
Mohammad Hossain PhD Candidate Department of Accounting, Finance and Economics Griffith Business School Griffith University Australia.
235
Survey Questionnaire
Section A: Background Information
A1. Which type of organisation do you work in currently? Choose one of the following answers
Public sector organisation
Private sector organisation
Research organisation/university
Financier
Consultancy firm
Other: A2. What is your current position in the organisation?
Choose one of the following answers
Top level
Mid-level
Lower level
Other: A3. What is your primary role in the current organisation?
Choose one of the following answers
Public sector official or agent
Private sector employees
Researcher
Contractor/operator
Consultant
Other: A4. How many years of experience in total do you have in a PPP or related organisation?
Choose one of the following answers
Less than 1 year
1 to 2 years
3 to 5 years
6 to 10 years
11 to 15 years
16 to 20 years
Above 20 years A5. What type of PPP or related organisations have you worked for, including the current one?
Check any that apply
Transportation
236
Power and energy
Education
Housing and accommodation
Commercial zone
Hospital
Other: A6. What is your gender?
Choose one of the following answers
Male
Female A7. What is your age?
Choose one of the following answers
Under 26 years
26 to 35 years
36 to 45 years
46 to 55 years
Above 55 years Section B: Comparison of PPP Performance Indicators
We identified eight key performance areas (KPAs) that are important in evaluating
performance of public-private partnership (PPP) projects. We would like you to make a
comparison of the performance areas listed in “Column A” (in Part One) with the areas
listed in “Column C” (in Part One) in evaluating performance of PPP arrangements.
For example: If ‘Planning and Initiation’ in column A is ‘much more important’ in
measuring performance, compared to ‘tendering” (Column C), then you might choose to
circle 5 on the left side of the middle column (B) in the box, or if it is ‘very much more
important’ you might circle 7, as illustrated below:
9 8 7 6 5 4 3 2 1 2 3 4 5 6 7 8 9
237
If “tendering” (Column C) is ‘very much more important’ in measuring performance
compared to ‘planning and initiation’ (Column A), then you might choose to circle 7 on
right side of the middle column (B) in the box, as illustrated below:
9 8 7 6 5 4 3 2 1 2 3 4 5 6 7 8 9 Similarly, you are requested to compare every row item (Column A) with the respective
row item (Column C) in Part One
Please Circle:
1 for equal importance in evaluating performance
3 for somewhat more important in evaluating performance;
5 for much more important in evaluating performance;
7 for very much more important in evaluating performance;
9 for absolutely more important in evaluating performance;
2, 4, 6 & 8 = When the above values are not appropriate.
Part One: Functional areas
Column A: KPAs Column B: Scale of Importance Column C: KPAs Planning and initiation9 9 8 7 6 5 4 3 2 1 2 3 4 5 6 7 8 9 Tendering Planning and initiation 9 8 7 6 5 4 3 2 1 2 3 4 5 6 7 8 9 Operation Planning and initiation 9 8 7 6 5 4 3 2 1 2 3 4 5 6 7 8 9 Sustainability of partnerships Planning and initiation 9 8 7 6 5 4 3 2 1 2 3 4 5 6 7 8 9 Financing Planning and initiation 9 8 7 6 5 4 3 2 1 2 3 4 5 6 7 8 9 Transparency and accountability Planning and initiation 9 8 7 6 5 4 3 2 1 2 3 4 5 6 7 8 9 Stakeholder’s satisfaction Planning and initiation 9 8 7 6 5 4 3 2 1 2 3 4 5 6 7 8 9 Socio economic development Tendering10 9 8 7 6 5 4 3 2 1 2 3 4 5 6 7 8 9 Operation Tendering 9 8 7 6 5 4 3 2 1 2 3 4 5 6 7 8 9 Sustainability of partnerships Tendering 9 8 7 6 5 4 3 2 1 2 3 4 5 6 7 8 9 Financing Tendering 9 8 7 6 5 4 3 2 1 2 3 4 5 6 7 8 9 Transparency and accountability
9 Planning and initiation refers to a plan and initiative for undertaking a PPP project. 10 Tendering refers to a process of an acquisition of the assets/facilities for the project.
238
Tendering 9 8 7 6 5 4 3 2 1 2 3 4 5 6 7 8 9 Stakeholder’s satisfaction Tendering 9 8 7 6 5 4 3 2 1 2 3 4 5 6 7 8 9 Socio economic development Operation11 9 8 7 6 5 4 3 2 1 2 3 4 5 6 7 8 9 Sustainability of partnerships Operation 9 8 7 6 5 4 3 2 1 2 3 4 5 6 7 8 9 Financing Operation 9 8 7 6 5 4 3 2 1 2 3 4 5 6 7 8 9 Transparency and accountability Operation 9 8 7 6 5 4 3 2 1 2 3 4 5 6 7 8 9 Stakeholder’s satisfaction Operation 9 8 7 6 5 4 3 2 1 2 3 4 5 6 7 8 9 Socio economic development Sustainability of partnerships12 9 8 7 6 5 4 3 2 1 2 3 4 5 6 7 8 9 Financing Sustainability of partnerships 9 8 7 6 5 4 3 2 1 2 3 4 5 6 7 8 9 Transparency and accountability Sustainability of partnerships 9 8 7 6 5 4 3 2 1 2 3 4 5 6 7 8 9 Stakeholder’s satisfaction Sustainability of partnerships 9 8 7 6 5 4 3 2 1 2 3 4 5 6 7 8 9 Socio economic development Financing13 9 8 7 6 5 4 3 2 1 2 3 4 5 6 7 8 9 Transparency and accountability Financing 9 8 7 6 5 4 3 2 1 2 3 4 5 6 7 8 9 Stakeholder’s satisfaction Financing 9 8 7 6 5 4 3 2 1 2 3 4 5 6 7 8 9 Socio economic development Transparency and accountability14
9 8 7 6 5 4 3 2 1 2 3 4 5 6 7 8 9 Stakeholder’s satisfaction
Transparency and accountability 9 8 7 6 5 4 3 2 1 2 3 4 5 6 7 8 9 Socio economic development Stakeholder’s satisfaction15 9 8 7 6 5 4 3 2 1 2 3 4 5 6 7 8 9 Socio economic development16
Under the KPAs, there are forty-one indicators in total. These indicators are considered
responsible for measuring the performance of Public Private Partnership (PPP) projects
in developing countries. We would like you to make a comparison of the indicators listed
in “Column A” with the indicators listed in “Column C”.
For example: If ‘Need assessment’ (in column A) is ‘much more important’ in measuring
performance, compared to ‘SMART objectives’ (in Column C), then you might circle 5
on the left side of the middle column (1) in the box, or if it is ‘very much more important’
you might circle 7, as illustrated below:
9 8 7 6 5 4 3 2 1 2 3 4 5 6 7 8 9
11 Operation refers to a commercial starting of the operation of the project and operates until the end of the contract. 12 Sustainability of partnerships refers to a durability of partnership in terms of its effectiveness and attainment of collective project goals. 13 Financing refers to an arrangement of investment and government guarantees for the project; 14 Transparency and accountability refers to a degree of disclosure to the project activities and commitment to the people the project targets. 15 Stakeholder’s satisfaction refers to the satisfaction of the partners and end users. 16 Socio economic development refers to an ultimate benefit of the project for the economy and society.
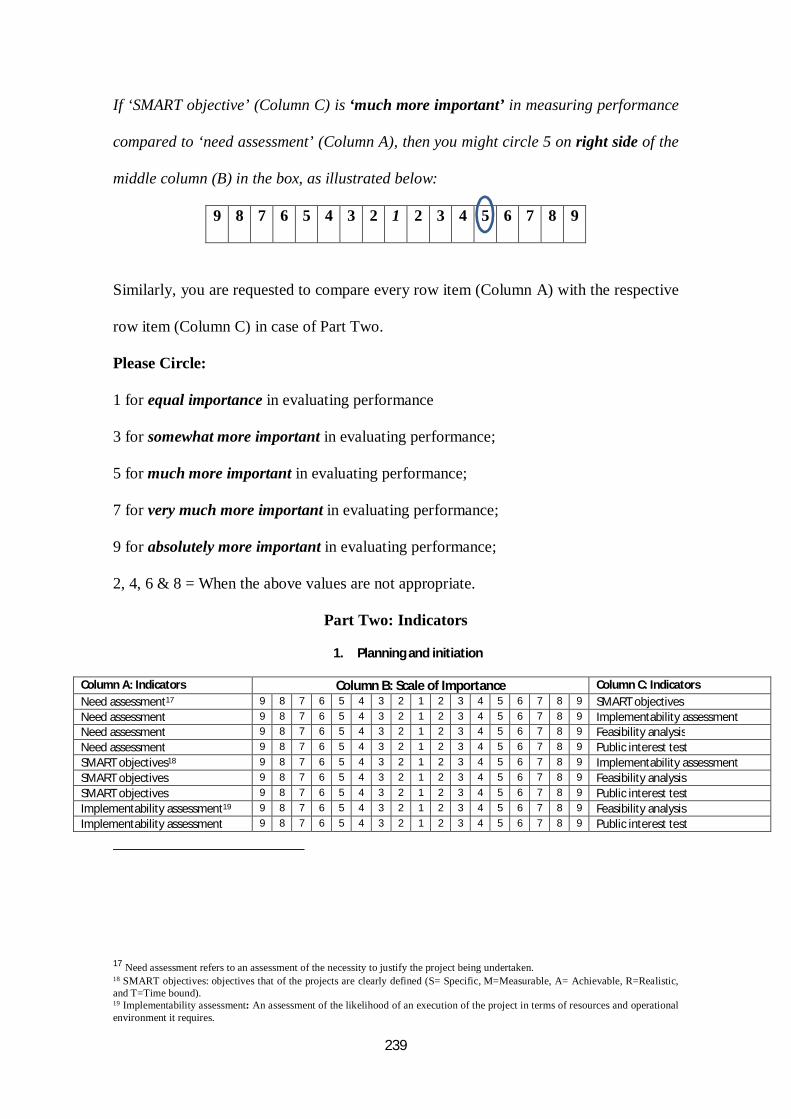
239
If ‘SMART objective’ (Column C) is ‘much more important’ in measuring performance
compared to ‘need assessment’ (Column A), then you might circle 5 on right side of the
middle column (B) in the box, as illustrated below:
9 8 7 6 5 4 3 2 1 2 3 4 5 6 7 8 9
Similarly, you are requested to compare every row item (Column A) with the respective
row item (Column C) in case of Part Two.
Please Circle:
1 for equal importance in evaluating performance
3 for somewhat more important in evaluating performance;
5 for much more important in evaluating performance;
7 for very much more important in evaluating performance;
9 for absolutely more important in evaluating performance;
2, 4, 6 & 8 = When the above values are not appropriate.
Part Two: Indicators
1. Planning and initiation
Column A: Indicators Column B: Scale of Importance Column C: Indicators Need assessment17 9 8 7 6 5 4 3 2 1 2 3 4 5 6 7 8 9 SMART objectives Need assessment 9 8 7 6 5 4 3 2 1 2 3 4 5 6 7 8 9 Implementability assessment Need assessment 9 8 7 6 5 4 3 2 1 2 3 4 5 6 7 8 9 Feasibility analysis Need assessment 9 8 7 6 5 4 3 2 1 2 3 4 5 6 7 8 9 Public interest test SMART objectives18 9 8 7 6 5 4 3 2 1 2 3 4 5 6 7 8 9 Implementability assessment SMART objectives 9 8 7 6 5 4 3 2 1 2 3 4 5 6 7 8 9 Feasibility analysis SMART objectives 9 8 7 6 5 4 3 2 1 2 3 4 5 6 7 8 9 Public interest test Implementability assessment19 9 8 7 6 5 4 3 2 1 2 3 4 5 6 7 8 9 Feasibility analysis Implementability assessment 9 8 7 6 5 4 3 2 1 2 3 4 5 6 7 8 9 Public interest test
17 Need assessment refers to an assessment of the necessity to justify the project being undertaken. 18 SMART objectives: objectives that of the projects are clearly defined (S= Specific, M=Measurable, A= Achievable, R=Realistic, and T=Time bound). 19 Implementability assessment: An assessment of the likelihood of an execution of the project in terms of resources and operational environment it requires.
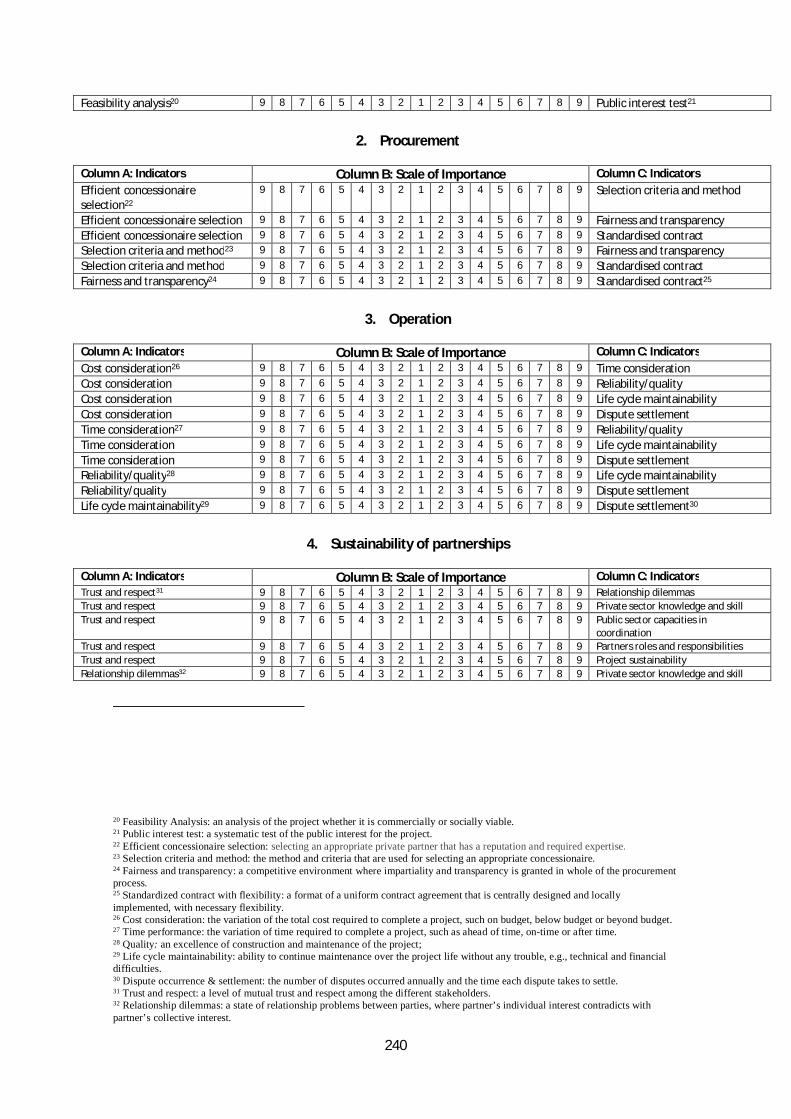
240
Feasibility analysis20 9 8 7 6 5 4 3 2 1 2 3 4 5 6 7 8 9 Public interest test21
2. Procurement
Column A: Indicators Column B: Scale of Importance Column C: Indicators Efficient concessionaire selection22
9 8 7 6 5 4 3 2 1 2 3 4 5 6 7 8 9 Selection criteria and method
Efficient concessionaire selection 9 8 7 6 5 4 3 2 1 2 3 4 5 6 7 8 9 Fairness and transparency Efficient concessionaire selection 9 8 7 6 5 4 3 2 1 2 3 4 5 6 7 8 9 Standardised contract Selection criteria and method23 9 8 7 6 5 4 3 2 1 2 3 4 5 6 7 8 9 Fairness and transparency Selection criteria and method 9 8 7 6 5 4 3 2 1 2 3 4 5 6 7 8 9 Standardised contract Fairness and transparency24 9 8 7 6 5 4 3 2 1 2 3 4 5 6 7 8 9 Standardised contract25
3. Operation
Column A: Indicators Column B: Scale of Importance Column C: Indicators Cost consideration26 9 8 7 6 5 4 3 2 1 2 3 4 5 6 7 8 9 Time consideration Cost consideration 9 8 7 6 5 4 3 2 1 2 3 4 5 6 7 8 9 Reliability/quality Cost consideration 9 8 7 6 5 4 3 2 1 2 3 4 5 6 7 8 9 Life cycle maintainability Cost consideration 9 8 7 6 5 4 3 2 1 2 3 4 5 6 7 8 9 Dispute settlement Time consideration27 9 8 7 6 5 4 3 2 1 2 3 4 5 6 7 8 9 Reliability/quality Time consideration 9 8 7 6 5 4 3 2 1 2 3 4 5 6 7 8 9 Life cycle maintainability Time consideration 9 8 7 6 5 4 3 2 1 2 3 4 5 6 7 8 9 Dispute settlement Reliability/quality28 9 8 7 6 5 4 3 2 1 2 3 4 5 6 7 8 9 Life cycle maintainability Reliability/quality 9 8 7 6 5 4 3 2 1 2 3 4 5 6 7 8 9 Dispute settlement Life cycle maintainability29 9 8 7 6 5 4 3 2 1 2 3 4 5 6 7 8 9 Dispute settlement30
4. Sustainability of partnerships
Column A: Indicators Column B: Scale of Importance Column C: Indicators Trust and respect31 9 8 7 6 5 4 3 2 1 2 3 4 5 6 7 8 9 Relationship dilemmas Trust and respect 9 8 7 6 5 4 3 2 1 2 3 4 5 6 7 8 9 Private sector knowledge and skill Trust and respect 9 8 7 6 5 4 3 2 1 2 3 4 5 6 7 8 9 Public sector capacities in
coordination Trust and respect 9 8 7 6 5 4 3 2 1 2 3 4 5 6 7 8 9 Partners roles and responsibilities Trust and respect 9 8 7 6 5 4 3 2 1 2 3 4 5 6 7 8 9 Project sustainability Relationship dilemmas32 9 8 7 6 5 4 3 2 1 2 3 4 5 6 7 8 9 Private sector knowledge and skill
20 Feasibility Analysis: an analysis of the project whether it is commercially or socially viable. 21 Public interest test: a systematic test of the public interest for the project. 22 Efficient concessionaire selection: selecting an appropriate private partner that has a reputation and required expertise. 23 Selection criteria and method: the method and criteria that are used for selecting an appropriate concessionaire. 24 Fairness and transparency: a competitive environment where impartiality and transparency is granted in whole of the procurement process. 25 Standardized contract with flexibility: a format of a uniform contract agreement that is centrally designed and locally implemented, with necessary flexibility. 26 Cost consideration: the variation of the total cost required to complete a project, such on budget, below budget or beyond budget. 27 Time performance: the variation of time required to complete a project, such as ahead of time, on-time or after time. 28 Quality: an excellence of construction and maintenance of the project; 29 Life cycle maintainability: ability to continue maintenance over the project life without any trouble, e.g., technical and financial difficulties. 30 Dispute occurrence & settlement: the number of disputes occurred annually and the time each dispute takes to settle. 31 Trust and respect: a level of mutual trust and respect among the different stakeholders. 32 Relationship dilemmas: a state of relationship problems between parties, where partner’s individual interest contradicts with partner’s collective interest.
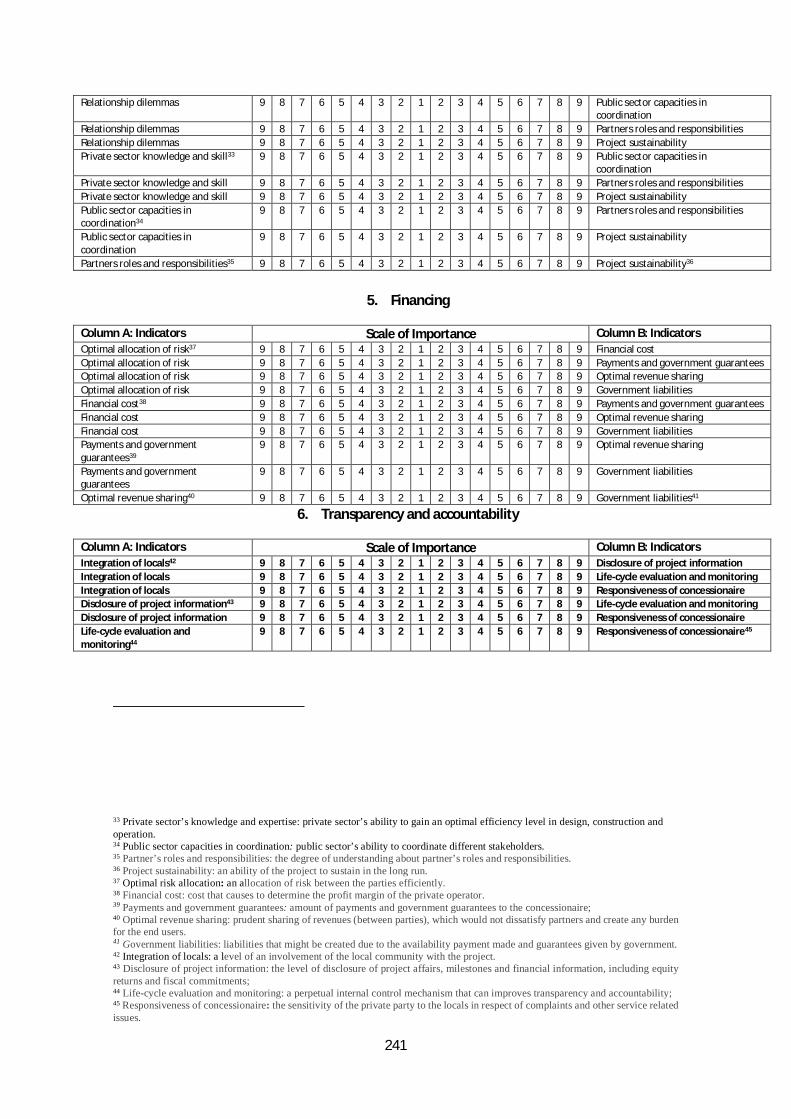
241
Relationship dilemmas 9 8 7 6 5 4 3 2 1 2 3 4 5 6 7 8 9 Public sector capacities in coordination
Relationship dilemmas 9 8 7 6 5 4 3 2 1 2 3 4 5 6 7 8 9 Partners roles and responsibilities Relationship dilemmas 9 8 7 6 5 4 3 2 1 2 3 4 5 6 7 8 9 Project sustainability Private sector knowledge and skill33 9 8 7 6 5 4 3 2 1 2 3 4 5 6 7 8 9 Public sector capacities in
coordination Private sector knowledge and skill 9 8 7 6 5 4 3 2 1 2 3 4 5 6 7 8 9 Partners roles and responsibilities Private sector knowledge and skill 9 8 7 6 5 4 3 2 1 2 3 4 5 6 7 8 9 Project sustainability Public sector capacities in coordination34
9 8 7 6 5 4 3 2 1 2 3 4 5 6 7 8 9 Partners roles and responsibilities
Public sector capacities in coordination
9 8 7 6 5 4 3 2 1 2 3 4 5 6 7 8 9 Project sustainability
Partners roles and responsibilities35 9 8 7 6 5 4 3 2 1 2 3 4 5 6 7 8 9 Project sustainability36
5. Financing
Column A: Indicators Scale of Importance Column B: Indicators Optimal allocation of risk37 9 8 7 6 5 4 3 2 1 2 3 4 5 6 7 8 9 Financial cost Optimal allocation of risk 9 8 7 6 5 4 3 2 1 2 3 4 5 6 7 8 9 Payments and government guarantees Optimal allocation of risk 9 8 7 6 5 4 3 2 1 2 3 4 5 6 7 8 9 Optimal revenue sharing Optimal allocation of risk 9 8 7 6 5 4 3 2 1 2 3 4 5 6 7 8 9 Government liabilities Financial cost38 9 8 7 6 5 4 3 2 1 2 3 4 5 6 7 8 9 Payments and government guarantees Financial cost 9 8 7 6 5 4 3 2 1 2 3 4 5 6 7 8 9 Optimal revenue sharing Financial cost 9 8 7 6 5 4 3 2 1 2 3 4 5 6 7 8 9 Government liabilities Payments and government guarantees39
9 8 7 6 5 4 3 2 1 2 3 4 5 6 7 8 9 Optimal revenue sharing
Payments and government guarantees
9 8 7 6 5 4 3 2 1 2 3 4 5 6 7 8 9 Government liabilities
Optimal revenue sharing40 9 8 7 6 5 4 3 2 1 2 3 4 5 6 7 8 9 Government liabilities41
6. Transparency and accountability
Column A: Indicators Scale of Importance Column B: Indicators Integration of locals42 9 8 7 6 5 4 3 2 1 2 3 4 5 6 7 8 9 Disclosure of project information Integration of locals 9 8 7 6 5 4 3 2 1 2 3 4 5 6 7 8 9 Life-cycle evaluation and monitoring Integration of locals 9 8 7 6 5 4 3 2 1 2 3 4 5 6 7 8 9 Responsiveness of concessionaire Disclosure of project information43 9 8 7 6 5 4 3 2 1 2 3 4 5 6 7 8 9 Life-cycle evaluation and monitoring Disclosure of project information 9 8 7 6 5 4 3 2 1 2 3 4 5 6 7 8 9 Responsiveness of concessionaire Life-cycle evaluation and monitoring44
9 8 7 6 5 4 3 2 1 2 3 4 5 6 7 8 9 Responsiveness of concessionaire45
33 Private sector’s knowledge and expertise: private sector’s ability to gain an optimal efficiency level in design, construction and operation. 34 Public sector capacities in coordination: public sector’s ability to coordinate different stakeholders. 35 Partner’s roles and responsibilities: the degree of understanding about partner’s roles and responsibilities. 36 Project sustainability: an ability of the project to sustain in the long run. 37 Optimal risk allocation: an allocation of risk between the parties efficiently. 38 Financial cost: cost that causes to determine the profit margin of the private operator. 39 Payments and government guarantees: amount of payments and government guarantees to the concessionaire; 40 Optimal revenue sharing: prudent sharing of revenues (between parties), which would not dissatisfy partners and create any burden for the end users. 41 Government liabilities: liabilities that might be created due to the availability payment made and guarantees given by government. 42 Integration of locals: a level of an involvement of the local community with the project. 43 Disclosure of project information: the level of disclosure of project affairs, milestones and financial information, including equity returns and fiscal commitments; 44 Life-cycle evaluation and monitoring: a perpetual internal control mechanism that can improves transparency and accountability; 45 Responsiveness of concessionaire: the sensitivity of the private party to the locals in respect of complaints and other service related issues.
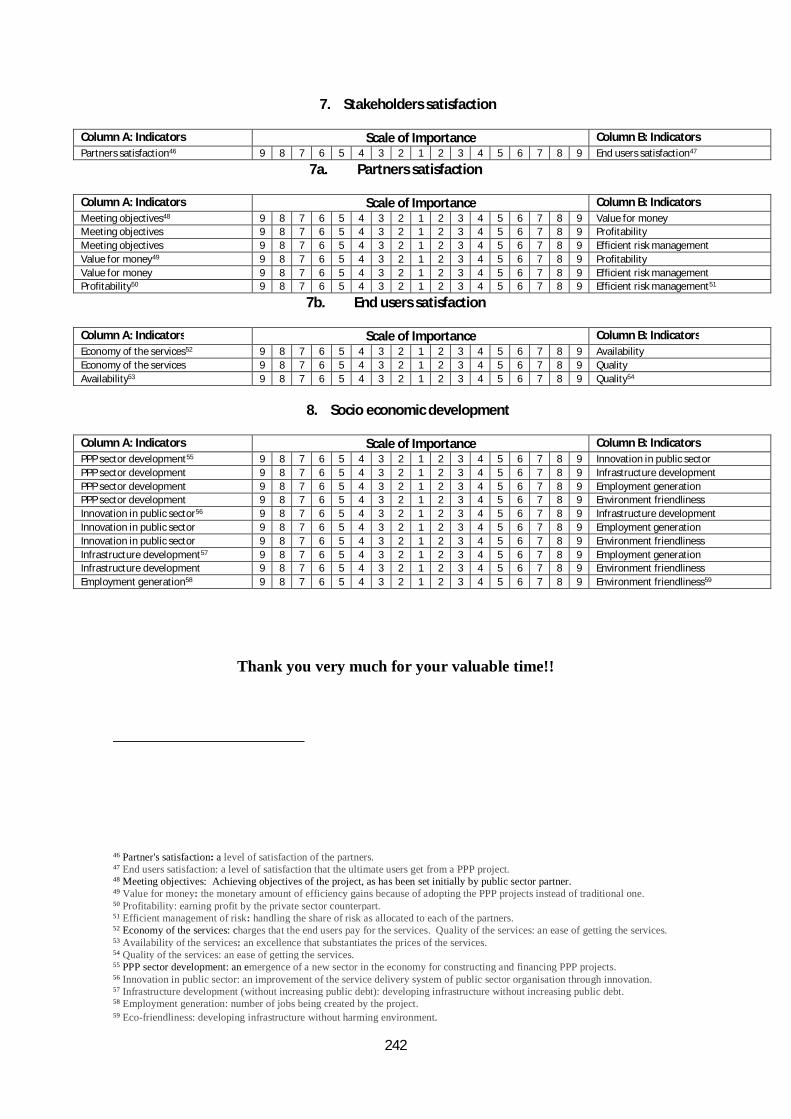
242
7. Stakeholders satisfaction
Column A: Indicators Scale of Importance Column B: Indicators Partners satisfaction46 9 8 7 6 5 4 3 2 1 2 3 4 5 6 7 8 9 End users satisfaction47
7a. Partners satisfaction
Column A: Indicators Scale of Importance Column B: Indicators Meeting objectives48 9 8 7 6 5 4 3 2 1 2 3 4 5 6 7 8 9 Value for money Meeting objectives 9 8 7 6 5 4 3 2 1 2 3 4 5 6 7 8 9 Profitability Meeting objectives 9 8 7 6 5 4 3 2 1 2 3 4 5 6 7 8 9 Efficient risk management Value for money49 9 8 7 6 5 4 3 2 1 2 3 4 5 6 7 8 9 Profitability Value for money 9 8 7 6 5 4 3 2 1 2 3 4 5 6 7 8 9 Efficient risk management Profitability50 9 8 7 6 5 4 3 2 1 2 3 4 5 6 7 8 9 Efficient risk management51
7b. End users satisfaction
Column A: Indicators Scale of Importance Column B: Indicators Economy of the services52 9 8 7 6 5 4 3 2 1 2 3 4 5 6 7 8 9 Availability Economy of the services 9 8 7 6 5 4 3 2 1 2 3 4 5 6 7 8 9 Quality Availability53 9 8 7 6 5 4 3 2 1 2 3 4 5 6 7 8 9 Quality54
8. Socio economic development
Column A: Indicators Scale of Importance Column B: Indicators PPP sector development55 9 8 7 6 5 4 3 2 1 2 3 4 5 6 7 8 9 Innovation in public sector PPP sector development 9 8 7 6 5 4 3 2 1 2 3 4 5 6 7 8 9 Infrastructure development PPP sector development 9 8 7 6 5 4 3 2 1 2 3 4 5 6 7 8 9 Employment generation PPP sector development 9 8 7 6 5 4 3 2 1 2 3 4 5 6 7 8 9 Environment friendliness Innovation in public sector56 9 8 7 6 5 4 3 2 1 2 3 4 5 6 7 8 9 Infrastructure development Innovation in public sector 9 8 7 6 5 4 3 2 1 2 3 4 5 6 7 8 9 Employment generation Innovation in public sector 9 8 7 6 5 4 3 2 1 2 3 4 5 6 7 8 9 Environment friendliness Infrastructure development57 9 8 7 6 5 4 3 2 1 2 3 4 5 6 7 8 9 Employment generation Infrastructure development 9 8 7 6 5 4 3 2 1 2 3 4 5 6 7 8 9 Environment friendliness Employment generation58 9 8 7 6 5 4 3 2 1 2 3 4 5 6 7 8 9 Environment friendliness59
Thank you very much for your valuable time!!
46 Partner's satisfaction: a level of satisfaction of the partners. 47 End users satisfaction: a level of satisfaction that the ultimate users get from a PPP project. 48 Meeting objectives: Achieving objectives of the project, as has been set initially by public sector partner. 49 Value for money: the monetary amount of efficiency gains because of adopting the PPP projects instead of traditional one. 50 Profitability: earning profit by the private sector counterpart. 51 Efficient management of risk: handling the share of risk as allocated to each of the partners. 52 Economy of the services: charges that the end users pay for the services. Quality of the services: an ease of getting the services. 53 Availability of the services: an excellence that substantiates the prices of the services. 54 Quality of the services: an ease of getting the services. 55 PPP sector development: an emergence of a new sector in the economy for constructing and financing PPP projects. 56 Innovation in public sector: an improvement of the service delivery system of public sector organisation through innovation. 57 Infrastructure development (without increasing public debt): developing infrastructure without increasing public debt. 58 Employment generation: number of jobs being created by the project. 59 Eco-friendliness: developing infrastructure without harming environment.
243
Appendix 3: Request letter to Secretary of Power Division, GoB
The Secretary Power Division Ministry of Power, Energy and Mineral Resources Government of the People’s Republic of Bangladesh Bangladesh, Dhaka-1000
Request for supporting Mr. Hossain’s field survey and data collection for his PhD
program
Ethical Approval: GU ref no: 2016/718
Dear Sir,
I wish to confirm that Mr Mohammad Hossain is currently a full time doctoral student in
the Department of Accounting, Finance and Economics at Griffith Business School,
Griffith University and under the supervision of myself and Prof Christine Smith. Mr
Hossain’s doctoral research focuses on “Performance Evaluation of Public Private
Partnerships in Developing Countries: A Case Study of Bangladesh”. The research aims
to develop an index of PPP performance indicators with weights derived from survey
data. It is expected that the research finding will contribute to the understanding and
design of performance evaluation mechanisms of PPPs in Bangladesh.
The survey data is essential in order to construct the index of PPP performance. For this
purpose Mr. Hossain is proposing a survey of the employees/executives of the
organisations/units that are involved in planning, designing, financing and implementing
PPP projects in Bangladesh. He will mention the names of the specific organisations that

244
he intends to visit. Therefore, I would be very grateful if you could provide necessary
cooperation, and advise organisations that he intends to visit for conducting a survey.
Your support would contribute critically to the success of his research work.
Your kind consideration regarding this matter is highly appreciated.
Thank you very much.
Yours sincerely,
Professor Ross Guest
Dean (Learning and Teaching) and
Principal Supervisor
Griffith Business School
Griffith University
245
Appendix 4: Research Information sheet for respondent
Research Team:
Professor Ross Guest Principal Supervisor
Professor Christine Smith
Associate Supervisor
Mohammad Hossain PhD Candidate
Research Project Information Sheet
Ethical Approval: GU ref no: 2016/718
What is the title of the research?
Performance Evaluation of Public Private Partnerships (PPPs) in Developing Countries:
A case study of Bangladesh
Why is this research for?
The research is a part of the doctoral program being undertaken by Mohammad Hossain,
a PhD candidate in Griffith Business School at Griffith University. The purpose of the
research is to develop an ideal and inclusive index of indicators with their relative
weighting and apply such index of indicators in assessing the performance of the PPP
projects to be selected from developing countries.
What do the participants have to do?

246
The participants will be requested to complete a structured questionnaire where they
compare indicators in terms of their importance (1-9 scale) in assessing the performance
of the PPP projects. The participants are expected to answer all the questions which will
take 30 to 40 minutes.
Who are the target participants?
The target participants will be the people who have a background and interest in PPP
arrangements in order to elicit their judgement on the priority of the selective performance
indicators. These people include private sector practitioners, public sector officials and
interested research groups working in PPP organisations in Bangladesh context. A
purposive sampling technique will be used.
What are the expected contributions?
The list of indicators to be presented to the participants for making a comparison has been
identified in an exhaustive literature review, so the individual participant will have an
opportunity to enrich their experiences through an exposure to the performance
indicators. Moreover, participants can get a summary of the research results in a plain
language on an email request. Broadly, the research effort will result in the development
of an index of performance indicators and an application of such indicators in assessing
the performance of PPP projects in the developing world.
Is there any risk to the participants?
There are no foreseeable risks associated with participation in this research.
Is participant’s identity confidential?
The identity of the participant will be completely confidential, as a de-identification
process will be applied to make data anonymous. After analyzing the coded data, the
247
findings will be published in an academic journal, conference presentations and PhD
thesis, with no identification of the participants. Data will be securely stored in a password
protected electronic file or locked cabinet at the Griffith University for period of five
years.
Is participation voluntary?
Yes, participation in this survey is voluntary. Participants can withdraw from the survey
any time if they like, with no difficulties. Participants are encouraged to answer all the
questions.
What is the mode of conducting survey?
The respondents will be requested to complete the survey questionnaire in the way most
convenient to them, including filling in the hard copy questionnaire, filling in on-line, and
sending us the completed questionnaire through email.
What is the ethical code of conduct?
Griffith University follows the principles of ethics as stated in the National Statement on
Ethical Conduct in Human Research. Participants can feel free to contact, if they have
any concern, the Manager of Research Ethics of the Griffith University Human Research
Ethics Committee on +61 7 3735 4375 or at [email protected]. Ethical
Approval number is GU ref no: 2016/718.
What is the Privacy Policy?
The personal information of the participants will not be disclosed to third parties without
the participants’ consent, except to meet the requirements of the government, legal or
other regulatory authorities. After data collection, they will be stored in the research

248
storage service of Griffith University. Only the researcher can be able to download the
data from the University storage system and export them in a de-identification process to
use in the software program such as Expert Choice, AHP software and Excel. Data will
be securely stored in a password protected electronic file or locked cabinet at the Griffith
University for period of five years. A de-identified copy of this data may be used for other
research purposes. However, your anonymity will at all times be safeguarded. For further
information on privacy policy, Griffith University’s Privacy Plan may be consulted at
https://www.griffith.edu.au/about-griffith/governance/plans-publications/griffith-
university-privacy-plan.
249
Appendix 5: Questionnaire for project-specific survey
Research Team:
Professor Ross Guest Principal Supervisor
Professor Christine Smith
Principal Supervisor
Mohammad Hossain PhD Candidate
Dear Sir/Madam,
Thank you for agreeing to participate in this important survey.
I am a doctoral student in the Department of Accounting, Finance and Economics at
Griffith Business School of the Griffith University, and currently carrying out research
on Performance Evaluation of Public Private Partnerships in Developing Countries:
A Case Study of Bangladesh. This research aims to assess actual performance of PPPs
and their key determinants in Bangladesh. It is expected that the research findings will
contribute to the understanding and design of performance evaluation mechanisms of
PPPs in developing countries.
We are collecting data for this research through a structured/semi-structured
questionnaire. I would be grateful if you would complete the attached questionnaire in
the following page, which will take around 50 to 60 minutes to answer all the questions.
Please be assured that all answers you give will be confidential. Survey data will only
be used for research purposes. Your candid response is highly valuable for this research
250
endeavour. We would appreciate if you would send it to:
Please feel free to contact to the Manager, Research Ethics of the Griffith University
Human Research Ethics Committee on +61 7 3735 4375 or at research-
[email protected], if you have any concern or compliant about the research. By
completing this Questionnaire it is assumed that you consent to participate in this
research.
We thank you for your valuable time and contribution to this research effort.
Yours sincerely,
Mohammad Hossain PhD Candidate Department of Accounting, Finance and Economics Griffith Business School Griffith University Australia.
251
Project specific survey questionnaire
Name of the IPP (Independent power producer) project:
Physical address of the project:
Project capacity (in MW):
Rated capacity (MW): Actual capacity (MW):
Part One: Key Performance Areas (KPAs) and Indicators
The following thirty seven indicators have been identified in the literature as relevant in
measuring the performance of power sector PPP projects in developing countries. The
indicators have been categorised broadly into eight key performance areas (KPAs) (listed
as A, B, C and so on) based on performance area they belong to.
Based on your personal experience and actual information of your project, please give a
score for the performance of your PPP (IPP) project against each of the KPAs and
indicators listed below. For each of the KPAs and indicators, please circle (or tick)
one number (from 1 to 7) that best represents the level of the performance of this
IPP project.

252
KPAs/Indicators Measurement Criteria
Hig
hly
diss
atis
fact
ory
Dis
satis
fact
ory
Le
ss th
an
diss
atis
fact
ory
Ave
rage
Le
ss th
an
satis
fact
ory
Satis
fact
ory
Hig
hly
satis
fact
ory
A Planning and initiation
1 Needs assessment How prudently was the needs assessment of the project done? 1 2 3 4 5 6 7
2 SMART objectives How SMART was the project objectives? (S=Specific, M=Measurable, A=Achievable, R=Realistic, and T=Time bound)
1 2 3 4 5 6 7
3 Implementability assessment
How carefully was the execution likelihood of the project assessed in terms of resources and operational environment it requires?
1 2 3 4 5 6 7
4 Feasibility Analysis How rigorously was the feasibility analysis of the project done? 1 2 3 4 5 6 7
5 Public interest test (if any)
Was public interest of this project tested? If yes, how systematically was it done? 1 2 3 4 5 6 7
B Tendering 6 Efficient
concessionaire selection
What do you think the level of reputation and expertise of the selected IPP sponsor? 1 2 3 4 5 6 7
7 Selection criteria and method of procurement
How practical was the criteria and method in selecting this IPP sponsor? 1 2 3 4 5 6 7
8 Fairness and transparency
How impartial and transparent was the tendering process to win the bid of this project?
1 2 3 4 5 6 7
9 Standardized contract (if any)
Has the contract signed with govt. counterpart been standardised? If yes, how effective is this? Please provide a rating.
1 2 3 4 5 6 7
C Construction and Operation
10 Cost performance What is the level of cost performance in constructing this project? 1 2 3 4 5 6 7
11 Time/schedule performance
What is the level of time performance in constructing this project? 1 2 3 4 5 6 7
12 Quality of assets Please rate the quality of the construction and assets. 1 2 3 4 5 6 7
13 Life cycle maintainability
How smoothly maintenance was/is being done without any trouble, e.g., technical difficulties etc.?
1 2 3 4 5 6 7
14 Dispute settlement (if any)
How efficiently and promptly are disputes settled, if any? 1 2 3 4 5 6 7
D Sustainability of partnerships
15 Trust and respect Please rate the mutual trust and respect among the different stakeholders of the project.
1 2 3 4 5 6 7
16 Relationship conflict
How good is the relationship between you and govt. counterpart in collective interest of the project?
1 2 3 4 5 6 7
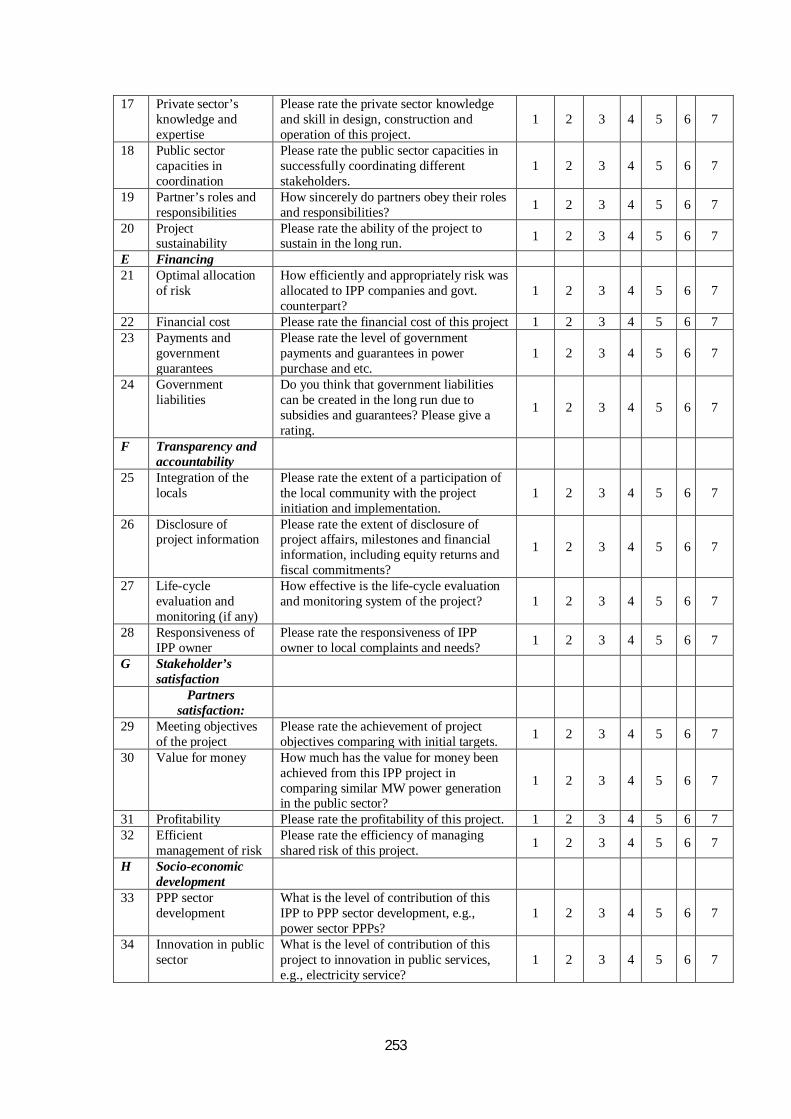
253
17 Private sector’s knowledge and expertise
Please rate the private sector knowledge and skill in design, construction and operation of this project.
1 2 3 4 5 6 7
18 Public sector capacities in coordination
Please rate the public sector capacities in successfully coordinating different stakeholders.
1 2 3 4 5 6 7
19 Partner’s roles and responsibilities
How sincerely do partners obey their roles and responsibilities? 1 2 3 4 5 6 7
20 Project sustainability
Please rate the ability of the project to sustain in the long run. 1 2 3 4 5 6 7
E Financing 21 Optimal allocation
of risk How efficiently and appropriately risk was allocated to IPP companies and govt. counterpart?
1 2 3 4 5 6 7
22 Financial cost Please rate the financial cost of this project 1 2 3 4 5 6 7 23 Payments and
government guarantees
Please rate the level of government payments and guarantees in power purchase and etc.
1 2 3 4 5 6 7
24 Government liabilities
Do you think that government liabilities can be created in the long run due to subsidies and guarantees? Please give a rating.
1 2 3 4 5 6 7
F Transparency and accountability
25 Integration of the locals
Please rate the extent of a participation of the local community with the project initiation and implementation.
1 2 3 4 5 6 7
26 Disclosure of project information
Please rate the extent of disclosure of project affairs, milestones and financial information, including equity returns and fiscal commitments?
1 2 3 4 5 6 7
27 Life-cycle evaluation and monitoring (if any)
How effective is the life-cycle evaluation and monitoring system of the project? 1 2 3 4 5 6 7
28 Responsiveness of IPP owner
Please rate the responsiveness of IPP owner to local complaints and needs? 1 2 3 4 5 6 7
G Stakeholder’s satisfaction
Partners satisfaction:
29 Meeting objectives of the project
Please rate the achievement of project objectives comparing with initial targets. 1 2 3 4 5 6 7
30 Value for money How much has the value for money been achieved from this IPP project in comparing similar MW power generation in the public sector?
1 2 3 4 5 6 7
31 Profitability Please rate the profitability of this project. 1 2 3 4 5 6 7 32 Efficient
management of risk Please rate the efficiency of managing shared risk of this project. 1 2 3 4 5 6 7
H Socio-economic development
33 PPP sector development
What is the level of contribution of this IPP to PPP sector development, e.g., power sector PPPs?
1 2 3 4 5 6 7
34 Innovation in public sector
What is the level of contribution of this project to innovation in public services, e.g., electricity service?
1 2 3 4 5 6 7
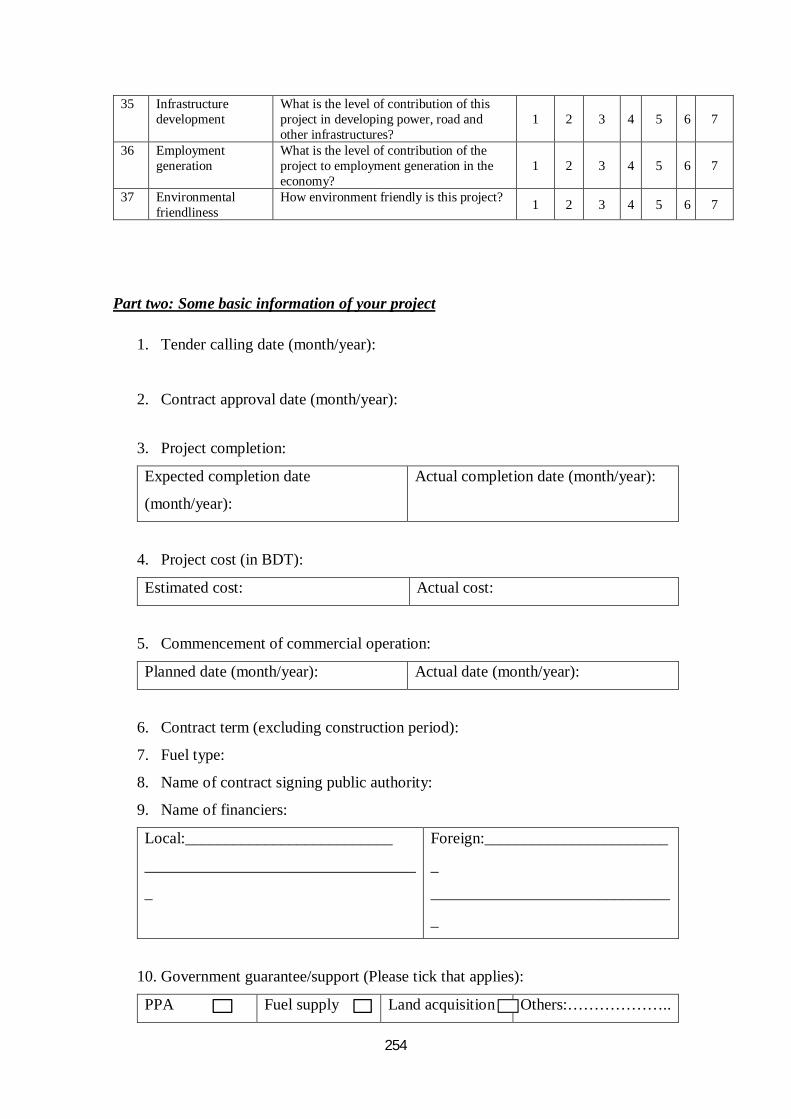
254
35 Infrastructure development
What is the level of contribution of this project in developing power, road and other infrastructures?
1 2 3 4 5 6 7
36 Employment generation
What is the level of contribution of the project to employment generation in the economy?
1 2 3 4 5 6 7
37 Environmental friendliness
How environment friendly is this project? 1 2 3 4 5 6 7
Part two: Some basic information of your project
1. Tender calling date (month/year):
2. Contract approval date (month/year):
3. Project completion:
Expected completion date
(month/year):
Actual completion date (month/year):
4. Project cost (in BDT):
Estimated cost: Actual cost:
5. Commencement of commercial operation:
Planned date (month/year): Actual date (month/year):
6. Contract term (excluding construction period):
7. Fuel type:
8. Name of contract signing public authority:
9. Name of financiers:
Local:__________________________
__________________________________
_
Foreign:_______________________
_
______________________________
_
10. Government guarantee/support (Please tick that applies):
PPA Fuel supply Land acquisition Others:………………..

255
Part three: Performance measurement system in your project
Q1. Is there any specific performance measurement tool/approach that is currently being
used to measure overall performances in your project? If yes, please briefly mention how
you measure performances. What are the key performance areas/indicators?
Q2. What do you consider to be the limitations of existing performance measurement system in your project?
Q3. What is your suggestion to improve the existing performance measurement system
in your project?
Q4. Do you think that some areas/indicators are more important than others in measuring
PPP (IPP) performances in your project? If yes, please list some areas and/indicators in
order of their importance.
Q5. Any other comments/suggestions relating to performance measurement approach of power PPPs (IPPs) in Bangladesh.

256
Name and signature of the participant: Date:
Seal
Thank you very much!!!!!
257
References
ADB. (2016). Bangladesh: Consolidating Export-led Growth - Country Diagnostic
Study. Retrieved from Manila:
https://www.adb.org/sites/default/files/publication/190610/ban-export-led-
growth-cds.pdf
ADB. (2017). Public Private Partnership Monitor. Retrieved from Manila:
https://www.adb.org/sites/default/files/publication/381681/ppp-monitor.pdf
Adighibe, C. N. (2015). Public private partnership infrastructure delivery: Benefits and
costs for society. (PhD Dissertation), Queensland University of Technology,
Brisbane. Retrieved from https://eprints.qut.edu.au/83942/
Adroit Environment Consultants Ltd. (2013). Environmental & Social Impact Assessment
of Dhaka Southern Power Generations Limited (DSPGL). Retrieved from Dhaka:
http://www.doreenpower.com/pdf/dhakasouthern/1.DSPGL%20ESIA%20Repor
t.pdf
Ahamad, M., & Tanin, F. (2013). Next power generation-mix for Bangladesh: Outlook
and policy priorities. Energy Policy, 60(2013), 272-283.
Alam, H. (2013, November 8). Increased toll creates chaos. The Daily Star. Retrieved
from https://www.thedailystar.net
Ali, Z. M., Ibrahim, N. A., Mengersen, K., Shitan, M., & Juahir, H. (2013, 17-19 Dec).
Robust principal component analysis in water quality index development. Paper
presented at the AIP Conference Proceedings, Kuala Lumpur.
Almarri, K., & Boussabaine, H. (2017). Interdependency of the critical success factors
and ex-post performance indicators of PPP projects. Built Environment Project
and Asset Management, 7(5), 546-556. doi:10.1108/BEPAM-05-2017-0031
258
Ameyaw, E. E., & Chan, A. P. C. (2015). Risk allocation in public-private partnership
water supply projects in Ghana. Construction Management and Economics, 33(3),
187-208. doi:10.1080/01446193.2015.1031148
Aslan, C., & Duarte, D. (2014). How do countries measure, manage, and monitor fiscal
risks generated by public-private partnerships? Chile, Peru, South Africa, Turkey.
Retrieved from Washington DC:
https://openknowledge.worldbank.org/handle/10986/20375
Atmo, G. U., & Duffield, C. (2014). Improving investment sustainability for PPP power
projects in emerging economies: Value for money framework. Built Environment
Project and Asset Management, 4(4), 335-351. doi:10.1108/BEPAM-10-2013-
0051
Atmo, G. U., Duffield, C., Zhang, L., & Wilson, D. I. (2017). Comparative performance
of PPPs and traditional procurement projects in Indonesia. International Journal
of Public Sector Management, 30(2), 118-136. doi:10.1108/IJPSM-02-2016-0047
Azad, J. (2002). IDA guarantee catalyses private finance for Haripur Power Project in
Bangladesh (English) (35897). Retrieved from Washington DC:
http://documents.worldbank.org/curated/en/415041468199790222/IDA-
guarantee-catalyses-private-finance-for-Haripur-Power-Project-in-Bangladesh
B-R Annual Report. (2016). Annual Report 2015-16. Retrieved from Dhaka:
http://brpowergen.org.bd/wp-content/uploads/2017/04/Annual-Report-of-B-R-
Powergen-Ltd-2015-2016.pdf
B-R Annual Report. (2017). Annual Report 2016-2017. Retrieved from Dhaka:
http://brpowergen.org.bd/
Babatunde, S. O., Perera, S., Zhou, L., & Udeaja, C. (2015). Barriers to public private
partnership projects in developing countries a case of Nigeria. Engineering,
259
Construction and Architectural Management, 22(6), 669-691.
doi:10.1108/ECAM-12-2014-0159
Baker, N. B. (2016). Transaction Costs in Public-Private Partnerships: The Weight of
Institutional Quality in Developing Countries Revisited. Public Performance &
Management Review, 40(2), 431-455. doi:10.1080/15309576.2016.1244092
Ball, R., Heafey, M., & King, D. (2007). The Private Finance Initiative in the UK: A
value for money and economic analysis. Public Management Review, 9(2), 289-
310. doi:10.1080/14719030701340507
Barzilai, J., & Golany, B. (1994). AHP rank reversal, normalization and aggregation
rules. INFOR: Information Systems and Operational Research, 32(2), 57-64.
Basu, K. (2018). This is what you need to know about Bangladesh's remarkable economic
rise. Retrieved from https://www.weforum.org/agenda/2018/04/why-is-
bangladesh-booming/
Bhattacharya, D., & Tahsina, T. (2008). Chapter 4: Macroeconomic Challenges for the
Growth of the Energy Sector Bangladesh in the context of Regional Integration.
In New Energy Frontier: The Bay of Bengal Region (pp. 61-89). Singapore:
ISEAS- Yusof Ishak Institute.
Bhattacharyya, S. (2010). Independent power projects in developing countries: legal and
consequences for development International Journal of Energy Sector
Management, 4(2), 303-306. doi:10.1108/17506221011058759
Boston, A. (2013). Delivering a secure electricity supply on a low carbon pathway.
Energy Policy, 52(2013), 55-59. doi:10.1016/j.enpol.2012.02.004
BPDB Annual Report. (2017). Annual Report 2016-2017. Dhaka: Bangladesh Power
Development Board, GoB.
260
Bruns, W. (1998). Profit as a performance measure: powerful concept, insufficient
measure. Paper presented at the Performance Measurement-Theory and Practice:
the First International Conference on Performance Measurement, Cambridge.
Budescu, D. V., Zwick, R., & Rapoport, A. J. (1986). A comparison of the eigenvalue
method and the geometric mean procedure for ratio scaling. Applied
psychological measurement, 10(1), 69-78.
Cao, D., Leung, L. C., & Law, J. (2008). Modifying inconsistent comparison matrix in
analytic hierarchy process: A heuristic approach. Decision Support Systems,
44(4), 944-953.
Chong, S., & Poole, E. (2013). Financing Infrastructure: A Spectrum of Country
Approaches. In R. B. o. Australia (Ed.), RBA Bulletin, September (Vol. September
quarter, pp. 65-76). Sydney: Reserve Bank of Australia.
Crawford, G., & Williams, C. (1985). A note on the analysis of subjective judgment
matrices. Journal of mathematical psychology, 29(4), 387-405.
Daniels, R. J., & Trebilcock, M. J. (1996). Private provision of public infrastructure: An
organizational analysis of the next privatization frontier. University of Toronto
Law Journal, 46(3), 375-426.
De Jong, M., Mu, R., Stead, D., Ma, Y., & Xi, B. (2010). Introducing public–private
partnerships for metropolitan subways in China: what is the evidence? Journal of
Transport Geography, 18(2), 301-313.
DeCorla-Souza, P., Ham, M., & Timothy, D. (2016). Illustration of a Framework for
Benefit–Cost Evaluation of Highway Concession Proposals. Transportation
Research Record: Journal of the Transportation Research Board, 2597(n.a), 52-
59. doi:10.3141/2597-07
261
Delmon, J. (2015). Creating a Framework for Public-Private Partnership Programs: A
Practical Guide for Decision-makers. Washington DC: World Bank.
Dhaka Stock Exchange. (2010). Khulna Power Compnay Ltd: At a glance. Retrieved
from http://dse.com.bd/direct_listing/KPCL_Fundamental.pdf
Dong, Y., Zhang, G., Hong, W.-C., & Xu, Y. (2010). Consensus models for AHP group
decision making under row geometric mean prioritization method. Decision
Support Systems, 49(3), 281-289.
Dorean. (2018). Dorean Power House and Technologies Ltd. Retrieved from
http://doreen.com.bd/enterprise/doreen-power-house-technologies-ltd/
Elwakil, E. (2017). Integrating analytical hierarchy process and regression for assessing
construction organizations’ performance. International Journal of Construction
Management, 17(1), 76-88.
Engel, E., Fischer, R., & Galetovic, A. (2014a). Finance and Public-Private
Partnerships. Retrieved from Stanford CA:
https://globalpoverty.stanford.edu/sites/default/files/publications/496wp.pdf
Engel, E., Fischer, R., & Galetovic, A. (2014b). Renegotiations in public-private
partnerships: Theory and evidence. Washington DC.
EPEC. (2015). A Programme Approach to PPPs: Lessons from the European experience.
Retrieved from Luxembourg:
file:///C:/Users/s2974391/Downloads/epec_programme_approach_to_ppps_en.p
df
European Investment Bank. (2011). The Guide to Guidance: How to Prepare, Procure
And Deliver PPP projects. In. Luxembourg: European Investment Bank.
262
Forman, E. H., & Peniwati, K. (1998). Aggregating individual judgments and priorities
with the analytic hierarchy process. European Journal of Operational Research,
108(1), 165-169.
Forrer, J., Kee, J. E., Newcomer, K. E., & Boyer, E. (2010). Public–private partnerships
and the public accountability question. Public Administration Review, 70(3), 475-
484.
Franklin, K. K., & Hart, J. K. (2007). Idea generation and exploration: Benefits and
limitations of the policy Delphi research method. Innovative Higher Education,
31(4), 237-246.
Gaffey, D. W. (2010). Outsourcing infrastructure: expanding the use of public-private
partnerships in the United States. Public Contract Law Journal, 39(2), 351-372.
Geddes, R. R., & Wagner, B. L. (2013). Why do US states adopt public–private
partnership enabling legislation? Journal of Urban Economics, 78(2013), 30-41.
Gorane, S., & Kant, R. (2016). A case study for predicting the success possibility of
supply chain practices implementation using AHP approach. Journal of Business
& Industrial Marketing, 31(2), 137-151.
Grimsey, D., & Lewis, M. (2007). Public Private Partnerships and Public Procurement.
Agenda: A Journal of Policy Analysis and Reform, 14(2), 171-188.
Grimsey, D., & Lewis, M. K. (2002). Evaluating the risks of public private partnerships
for infrastructure projects. International Journal of Project Management, 20(2),
107-118.
Grimsey, D., & Lewis, M. K. (2005). Are Public Private Partnerships value for money?:
Evaluating alternative approaches and comparing academic and practitioner
views. Accounting Forum, 29(4), 345-378.
263
Guasch, J. L., Laffont, J. J., & Straub, S. (2007). Concessions of infrastructure in Latin
America: Government‐led renegotiation. Journal of Applied Econometrics, 22(7),
1267-1294.
H412 Annual Report. (2015). Annual Report 2014-2015. Retrieved from Dhaka:
http://www.egcb.com.bd/welcome/view_report
H412 Annual Report. (2017). Annual Report 2016-2017. Retrieved from Dhaka:
http://www.egcb.com.bd/welcome/view_report
Hammami, M., Ruhashyankiko, J.-F., & Yehoue, E. B. (2006). Determinants of public-
private partnerships in infrastructure (Vol. WP/06/99.). Washington, DC:
International Monetary Fund.
Haponava, T., & Al-Jibouri, S. (2009). Identifying key performance indicators for use in
control of pre-project stage process in construction. International Journal of
Productivity and Performance Management, 58(2), 160-173.
doi:10.1108/17410400910928743
Haponava, T., & Al-Jibouri, S. (2012). Proposed system for measuring project
performance using process-based key performance indicators. Journal of
Management in Engineering, 28(2), 140-149.
Harker, P. T., & Vargas, L. G. (1987). The theory of ratio scale estimation: Saaty's
analytic hierarchy process. Management science, 33(11), 1383-1403.
Higgins, C. D., & Huque, A. S. (2014). Public Money and Mickey Mouse: Evaluating
performance and accountability in the Hong Kong Disneyland joint venture
public–private partnership. Public Management Review, 17(8), 1103-1123.
Hodge, G. A., & Greve, C. (2005). The challenge of public-private partnerships:
Learning from international experience. London: Edward Elgar Publishing.
264
Hodge, G. A., & Greve, C. (2007). Public–private partnerships: an international
performance review. Public Administration Review, 67(3), 545-558.
Hodge, G. A., & Greve, C. (2017). On Public–Private Partnership Performance A
Contemporary Review. Public Works Management & Policy, 22(1), 55-78.
Homkes, R. (2011). Analysing the role of Public-private partnerships in global
governance: Institutional dynamics, variation and effects. (PhD Dissertation),
London School of Economics and Political Science (LSE), London.
Hossain, M., Guest, R., & Smith, C. (2018a). Developing weights for performance
indicators of public-private partnerships (PPPs) in emerging countries: An
application of analytical hierarchy process (AHP). Paper presented at the 4th
2018 Academy of Business and Emerging Markets (ABEM) Conference, Manila,
Philiphine
Hossain, M., Guest, R., & Smith, C. (2018b). Performance Indicators of Public Private
Partnership in Bangladesh: An Implication for Developing Countries.
International Journal of Productivity and Performance Management (In press).
Hueskes, M., Verhoest, K., & Block, T. (2017). Governing public–private partnerships
for sustainability: An analysis of procurement and governance practices of PPP
infrastructure projects. International Journal of Project Management, 35(6),
1184-1195.
Hutcheson, G. D., & Sofroniou, N. (1999). The multivariate social scientist: Introductory
statistics using generalized linear models. London: Sage.
ICB Capital Management Ltd. (2016). Prospectus of Dorean Power Generation and
Systems Ltd. In B. S. a. E. Commission (Ed.). Dhaka: Bangladesh Securities and
Exchange Commission.
265
IMF. (2006). Public-Private Partnerships, Government Guarantees, and Fiscal Risk.
Retrieved from Washington DC: file:///C:/Users/s2974391/Downloads/_ppp.pdf
Iossa, E., & Martimort, D. (2015). The Simple Microeconomics of Public-Private
Partnerships. Journal of Public Economic Theory, 17(1), 4-48.
doi:10.1111/jpet.12114
Ishizaka, A., Balkenborg, D., & Kaplan, T. R. (2009). Influence of aggregation and
measurement scale on ranking a compromise alternative in AHP. Journal of the
Operational Research Society, 62(4), 700-710.
Islam, N. (2015). Infrastructure Development in Bangladesh: Future Prospects and
Challenges. Paper presented at the Continuing Professional development on
Infrastructure Development in Bangladesh: Future Prospects and Challenges,
Dhaka.
https://www.academia.edu/15362813/Pen_Portrait_of_KEYNOTE_SPEAKER_
Nazrul_Islam_Managing_Director_Infrastructure_Investment_Facilitation_Com
pany
Islam, S. (2017). A Review of Energy Sector of Bangladesh. Energy procedia, 110(2017),
611-618.
Izaguirre, A. K. (2000). Private participation in energy. Retrieved from Washington DC:
https://openknowledge.worldbank.org/bitstream/handle/10986/11430/multi_pag
e.pdf?sequence=1
Javed, A. A. (2013). A model of output specifications for public-private partnership
projects. (PhD Dissertation), The Hong Kong Polytechnic University, Hong
Kong.
Javed, A. A., Lam, P. T., & Chan, A. P. C. (2014). Change negotiation in public-private
partnership projects through output specifications: an experimental approach
266
based on game theory. Construction Management and Economics, 32(4), 323-
348.
Javed, A. A., Lam, P. T., & Zou, P. X. W. (2013). Output-based specifications for PPP
projects: lessons for facilities management from Australia. Journal of Facilities
Management, 11(1), 5-30. doi:10.1108/14725961311301448
Jeffares, S., Sullivan, H., & Bovaird, T. (2009). Beyond the contract-The challenge of
evaluating the performance (s) of public-private partnerships. Paper presented at
the Paper for the annual conference of International Research Society for Public
Management,(IRSPM), Copenhagen, Denmark.
Johnson, H. T. (1983). The search for gain in markets and firms: a review of the historical
emergence of management accounting systems. Accounting, Organizations and
Society, 8(2), 139-146.
Jordan, Z. S. (2015). Institutional Investment in Infrastructure: A view from the bridge of
a development agency. Retrieved from
http://blogs.worldbank.org/psd/institutional-investment-infrastructure-view-
bridge-development-agency
Joseph, L. (1998). IFC invests US$55.2 million in Bangladesh power project [Press
release]. Retrieved from
https://ifcextapps.ifc.org/IFCExt/Pressroom/IFCPressRoom.nsf/0/9AB942054A
CFC8428525697C004AD5D3?OpenDocument
Kaplan, R. S., & Norton, D. P. (1992). Balanced scorecard--measures that drive
performance. Harvard business review, 70(1), 71-79.
Kennerley, M., & Neely, A. (2003). Measuring performance in a changing business
environment. International journal of operations & production management,
23(2), 213-229.
267
Khan, M., Riley, T., & Wescott, C. G. (2012). Public-Private Partnerships in
Bangladesh's Power Sector: Risks and Opportunities. Retrieved from Washington
DC:
http://documents.worldbank.org/curated/en/550271468209052051/pdf/860780W
P0Bangl00Box382147B00PUBLIC0.pdf
Khan, S. (2007). Honesty = Success, Dishonesty = Failure An overview of power sector
unbundling in Bangladesh (1996-2006). Forum, 2(1). Retrieved from Forum: A
monthly publication of the Daily Star website:
http://archive.thedailystar.net/forum/2007/january/honesty.htm
Kivleniece, I., & Quelin, B. V. (2012). Creating and capturing value in public-private ties:
A private actor's perspective. Academy of Management Review, 37(2), 272-299.
Klein, M. U. (2015). Public-private partnerships: promise and hype. Retrieved from
Washington DC:
http://documents.worldbank.org/curated/en/319751468179082260/Public-
private-partnerships-promise-and-hype
Klijn, E. H., & Koppenjan, J. (2016). The impact of contract characteristics on the
performance of public–private partnerships (PPPs). Public Money &
Management, 36(6), 455-462.
Kotler, P. (1984). Marketing Management Analysis, Planning and Control. NJ: Prentice-
Hall.
KPCL Annual Report. (2009). Annual report 2009. Retrieved from Dhaka:
http://www.khulnapower.com/wp-content/uploads/2015/12/Annual-Report-
2009.pdf
268
KPCL Annual Report. (2017). Annual Report, 2016-2017. Retrieved from Dhaka:
http://www.khulnapower.com/wp-content/uploads/2015/12/Annual-Report-
2016-2017.pdf
KPMG. (2010). PPP Procurement, Review of Barriers to Competition and Efficiency in
the Procurement of PPP Projects. Retrieved from Australia:
http://infrastructureaustralia.gov.au/policy-
publications/publications/files/PC_Submission_Attachment_J.pdf
Kwak, Y. H., Chih, Y., & Ibbs, C. W. (2009). Towards a comprehensive understanding
of public private partnerships for infrastructure development. California
Management Review, 51(2), 51-78.
Kweun, J. Y. (2018). Evaluating highway public-private partnerships: Evidence from
U.S. value for money studies. Transport Policy, 62(2018), 12-20.
doi:10.1016/j.tranpol.2017.03.009
Lam, P. T., & Javed, A. A. (2015). Comparative Study on the Use of Output
Specifications for Australian and UK PPP/PFI Projects. Journal of Performance
of Constructed Facilities, 29(2), 04014061. doi:10.1061/(asce)cf.1943-
5509.0000554
Lawther, W. C., & Martin, L. (2014). Availability payments and key performance
indicators: Challenges for effective implementation of performance management
systems in transportation public-private partnerships. Public Works Management
and Policy, 19(3), 219-234. doi:10.1177/1087724X14528476
Li, J., & Zou, P. X. W. (2011). Fuzzy AHP-Based Risk Assessment Methodology for PPP
Projects. Journal of construction engineering and management, 137(12), 1205-
1209. doi:10.1061/(ASCE)CO.1943-7862.0000362
269
Liu, J., Love, P. E. D., Carey, B., Smith, J., & Regan, M. (2015). Ex-ante evaluation of
public-private partnerships: Macroeconomic analysis. Journal of Infrastructure
Systems, 21(2), 04014038. doi:10.1061/(ASCE)IS.1943-555X.0000228
Liu, J., Love, P. E. D., Davis, P. R., Smith, J., & Regan, M. (2015). Conceptual framework
for the performance measurement of public-private partnerships. Journal of
Infrastructure Systems, 21(1), 04014023. doi:10.1061/(ASCE)IS.1943-
555X.0000210
Liu, J., Love, P. E. D., Sing, M. C. P., Smith, J., & Matthews, J. (2017). PPP social
infrastructure procurement: Examining the feasibility of a lifecycle performance
measurement framework. Journal of Infrastructure Systems, 23(3), 04016041.
doi:10.1061/(ASCE)IS.1943-555X.0000347
Liu, J., Love, P. E. D., Smith, J., Matthews, J., & Sing, C. P. (2016). Praxis of
Performance Measurement in Public-Private Partnerships: Moving beyond the
Iron Triangle. Journal of Management in Engineering, 32(4), 04016004.
doi:10.1061/(ASCE)ME.1943-5479.0000433
Liu, J., Love, P. E. D., Smith, J., Regan, M., & Palaneeswaran, E. (2015). Review of
performance measurement: implications for public–private partnerships. Built
Environment Project and Asset Management, 5(1), 35-51.
Liu, J., Love, P. E. D., Smith, J., Regan, M., & Sutrisna, M. (2014). Public-Private
Partnerships: a review of theory and practice of performance measurement.
International Journal of Productivity and Performance Management, 63(4), 499-
512.
Liu, T., Wang, Y., & Wilkinson, S. (2016). Identifying critical factors affecting the
effectiveness and efficiency of tendering processes in Public–Private Partnerships
270
(PPPs): A comparative analysis of Australia and China. International Journal of
Project Management, 34(4), 701-716.
Liyanage, C., & Villalba-Romero, F. (2015). Measuring Success of PPP Transport
Projects: A Cross-Case Analysis of Toll Roads. Transport Reviews, 35(2), 140-
161.
Love, P. E., Liu, J., Matthews, J., Sing, C.-P., & Smith, J. (2015). Future proofing PPPs:
Life-cycle performance measurement and Building Information Modelling.
Automation in Construction, 56(2015), 26-35.
Mahoney, J. T., McGahan, A. M., & Pitelis, C. N. (2009). Perspective-the
interdependence of private and public interests. Organization Science, 20(6),
1034-1052.
Mamun, S. (2015, March 31). Elevated expressway work to begin after 3 missed
deadlines. Dhaka Tribune. Retrieved from
http://www.dhakatribune.com/bangladesh/2015/03/31/elevated-expressway-
work-to-begin-after-3-missed-deadlines/
Manning, M. (2008). Economic evaluation of the effects of early childhood intervention
on adolescent outcomes. (PhD Dissertation), Griffith University, Brisbane.
Manning, M., Ransley, J., Smith, C., Mazerolle, L., & Cook, A. (2013). Policing
methamphetamine problems: a framework for synthesising expert opinion and
evaluating alternative policy options. Journal of Public Policy, 33(03), 371-396.
Manning, M., Wong, G. T., Ransley, J., & Smith, C. (2016). Analysing
pseudoephedrine/methamphetamine policy options in Australia using multi-
criteria decision modelling. International Journal of Drug Policy, 32(2016), 85-
92.
271
Marin, P. (2009). Public-private partnerships for urban water utilities: a review of
experiences in developing countries (Vol. 8). Washington DC: World Bank
Publications.
McCarter, M. W., & Kamal, D. F. (2013). Recognizing and Resolving Social Dilemmas
in Supply Chain Public-Private Partnerships. Journal of Business Logistics, 34(4),
360-372. doi:Doi 10.1111/Jbl.12033
Mladenovic, G., Vajdic, N., Wündsch, B., & Temeljotov-Salaj, A. (2013). Use of key
performance indicators for PPP transport projects to meet stakeholders'
performance objectives. Built Environment Project and Asset Management, 3(2),
228-249. doi:10.1108/BEPAM-05-2012-0026
Morallos, D., & Amekudzi, A. (2008). The State of the Practice of Value for Money
Analysis in Comparing Public Private Partnerships to Traditional Procurements.
Public Works Management & Policy, 13(2), 114-125.
doi:10.1177/1087724X08326176
Moszoro, M. W., Araya, G., Ruiz Nunez, F., & Schwartz, J. (2014). Institutional and
Political Determinants of Private Participation in Infrastructure (2014-15).
Retrieved from Paris:
https://www.econstor.eu/bitstream/10419/109166/1/818310596.pdf
Neely, A., Gregory, M., & Platts, K. (2005). Performance measurement system design: a
literature review and research agenda. International journal of operations &
production management, 25(12), 1228-1263.
OECD. (2008). Public-Private Partnerships: In Pursuit of Risk Sharing and Value for
Money. Paris: OECD Publishing.
Osborne, D. (1993). Reinventing government. Public productivity & management
Review, 16(4), 349-356.
272
Osei-Kyei, R. (2017). A best practice framework for public-private partnership
implementation for infrastructure development in Ghana. (PhD Dissertation), The
Hong Kong Polytechnic University, Hong Kong.
Osei-Kyei, R., & Chan, A. P. C. (2017a). Developing a project success index for public-
private partnership projects in developing countries. Journal of Infrastructure
Systems, 23(4), 04017028. doi:10.1061/(ASCE)IS.1943-555X.0000388
Osei-Kyei, R., & Chan, A. P. C. (2017b). Implementation constraints in public-private
partnership: Empirical comparison between developing and developed
economies/countries. Journal of Facilities Management, 15(1), 90-106.
doi:10.1108/JFM-07-2016-0032
Osei-Kyei, R., & Chan, A. P. C. (2018). Stakeholders’ perspectives on the success criteria
for public-private partnership projects. International Journal of Strategic
Property Management, 22(2), 131-142. doi:10.3846/ijspm.2018.444
Osei-Kyei, R., Chan, A. P. C., Javed, A. A., & Ameyaw, E. E. (2017). Critical success
criteria for public-private partnership projects: international experts’ opinion.
International Journal of Strategic Property Management, 21(1), 87-100.
doi:10.3846/1648715X.2016.1246388
Oyedele, L. O. (2013). Avoiding performance failure payment deductions in PFI/PPP
projects: Model of critical success factors. Journal of Performance of Constructed
Facilities, 27(3), 283-294.
PA Consulting Group. (2008). ADB TA 4626-BAN: Corporatization of Bangladesh
Power Development Board. Dhaka: Government of Bangladesh Retrieved from
https://www.adb.org/sites/default/files/project-document/68020/39141-ban-
tacr.pdf.
273
Panayides, P. M., Parola, F., & Lam Jasmine, S. L. (2015). The effect of institutional
factors on public–private partnership success in ports. Transportation Research
Part A: Policy and Practice, 71(2015), 110-127. doi:10.1016/j.tra.2014.11.006
Percoco, M. (2014). Quality of institutions and private participation in transport
infrastructure investment: Evidence from developing countries. Transportation
Research Part A: Policy and Practice, 70(2014), 50-58.
doi:10.1016/j.tra.2014.10.004
Phadke, A. (2009). How many Enrons? Mark-ups in the stated capital cost of independent
power producers' (IPPs') power projects in developing countries. Energy, 34(11),
1917-1924. doi:10.1016/j.energy.2009.07.043
Planning Commission GoB. (2012). Perspective Plan of Bangladesh 2010-2021. Dhaka:
Government of Bangladesh Retrieved from
http://www.plancomm.gov.bd/upload/2014/Perspective%20Plan/Perspective%2
0Plan_Final.pdf.
Planning Commission GoB. (2016). Seventh Five Year Plan 2016-2020. Dhaka:
Government of Bangladesh.
Power Cell. (2006). Bangladesh Power Sector Data Book. Dhaka: Government of
Bangladesh Retrieved from https://www.cems-
solarexpo.com/SOLOARBD/Bangladesh%20Power%20Data.pdf.
Power Division. (1996). Private Sector Power Generation Policy of Bangladesh 1996.
Dhaka: Government of Bangladesh.
Power Division. (2008). Policy guidelines for enhancement of private participation in the
power sector, 2008. Dhaka: Government of Bangladesh.
Power Division. (2016). Power System Master Plan. Dhaka: Government of Bangladesh.
274
Power Division. (2018). Power Division: Government of the People's Republic of
Bangladesh. Retrieved from https://powerdivision.gov.bd/
PPP Authority. (2016). Your guide to public private partnership in Bangladesh. Dhaka:
Government of Bangladesh Retrieved from
http://www.pppo.gov.bd/download/ppp_office/Your-Guide-to-PPP-in-
Bangladesh.pdf.
PPP Authority. (2017). PPP Programme Update: Development and Challenges. The
Latest Development of the PPP Programme. Retrieved from
http://www.pppo.gov.bd/download/ppp_office/Priorities_Services_to_be_simpli
fied.pdf
PPP Authority. (2018). PPP Projects. Retrieved from
http://www.pppo.gov.bd/projects.php
Raisbeck, P., Duffield, C., & Xu, M. (2010). Comparative performance of PPPs and
traditional procurement in Australia. Construction Management and Economics,
28(4), 345-359.
Raisbeck, P., & Tang, L. C. (2013). Identifying design development factors in Australian
PPP projects using an AHP framework. Construction Management and
Economics, 31(1), 20-39.
Ramanathan, R., & Ganesh, L. (1994). Group preference aggregation methods employed
in AHP: An evaluation and an intrinsic process for deriving members' weightages.
European Journal of Operational Research, 79(2), 249-265.
Regan, M., Smith, J., & Love, P. E. (2011). Infrastructure procurement: Learning from
private-public partnership experiences' down under'. Environment and Planning
C: Government and Policy, 29(2), 363-378.
275
Reinhardt, W. (2011) The role of private investment in meeting US transportation
infrastructure needs. In T. D. Foundation (Series Ed.): Vol. 260. Public Works
Financing (pp. 1-31). Wshington DC: Transportation Development Foundation.
Rowley, J. (2002). Using case studies in research. Management research news, 25(1), 16-
27.
Ruiz-Nuñez, F., & Wei, Z. (2015). Infrastructure Investment Demands in Emerging
Markets and Developing Economies (W. B. Group Ed.). Washington DC: World
Bank Group.
Saaty, T. L. (1980). The analytic hierarchy process. New York: McGraw-Hill.
Saaty, T. L. (1990). Decision making for leaders: the analytic hierarchy process for
decisions in a complex world. Pittsburgh PA: RWS publications.
Saaty, T. L. (2001). The seven pillars of the analytic hierarchy process. In Multiple
Criteria Decision Making in the New Millennium (pp. 15-37). Berlin, Heidelberg:
Springer.
Saaty, T. L. (2008). Decision making with the analytic hierarchy process. International
journal of services sciences, 1(1), 83-98.
Saaty, T. L. (2013). The modern science of multicriteria decision making and its practical
applications: The AHP/ANP approach. Operations research, 61(5), 1101-1118.
Saeed, A. M., Duffield, C., & Hui Felix Kin, P. (2018). An enhanced framework for
assessing the operational performance of public-private partnership school
projects. Built Environment Project and Asset Management, 8(2), 194-214.
doi:10.1108/BEPAM-07-2017-0041
Sanghi, A., Sundakov, A., & Hankinson, D. (2007). Designing and using public-private
partnership units in infrastructure: lessons from case studies around the world.
Retrieved from Washington DC:
276
http://documents.worldbank.org/curated/en/369881468340138106/Designing-
and-using-public-private-partnership-units-in-infrastructure-Lessons-from-case-
studies-around-the-world
Shan, L., Garvin, M. J., & Kumar, R. (2010). Collar options to manage revenue risks in
real toll public‐private partnership transportation projects. Construction
Management and Economics, 28(10), 1057-1069.
Shaoul, J., Stafford, A., & Stapleton, P. (2006). Highway Robbery? A Financial Analysis
of Design, Build, Finance and Operate (DBFO) in UK Roads. Transport Reviews,
26(3), 257-274. doi:10.1080/01441640500415243
Shen, L., Muduli, K., & Barve, A. (2015). Developing a sustainable development
framework in the context of mining industries: AHP approach. Resources Policy,
46(2015), 15-26.
Slack, N. (1991). The manufacturing advantage: achieving competitive manufacturing
operations. London: Mercury.
Sutadian, A. D., Muttil, N., Yilmaz, A. G., & Perera, B. (2017). Using the Analytic
Hierarchy Process to identify parameter weights for developing a water quality
index. Ecological Indicators, 75(2017), 220-233.
The National Parliament GoB. (2016). Budget Speech 2015-16. Dhaka: Government of
Bangladesh.
Transparency International Bangladesh. (n.d). Performance of the Power Sector of
Bangladesh: Governance Failures and Remedial Measures. Retrieved from
Dhaka: https://www.ti-bangladesh.org/beta3/index.php/en/research-policy/92-
diagnostic-study/501-performance-of-the-power-sector-of-bangladesh-
governance-failures-and-remedial-measures
277
Trebilcock, M., & Rosenstock, M. (2015). Infrastructure Public–Private Partnerships in
the Developing World: Lessons from Recent Experience. The Journal of
Development Studies, 51(4), 335-354. doi:10.1080/00220388.2014.959935
Tsunoda, J., & Islam, M. T. (2014). Use of Credit Rating Information of Domestic Credit
Rating Agencies for Public–Private Partnership Projects in Infrastructure in
Bangladesh. Retrieved from Manila:
https://www.adb.org/sites/default/files/publication/41520/south-asia-wp-023.pdf
Uddin, H. A. (2015). PPPs: Making a real difference in delivering public services in
Bangladesh. Retrieved from http://blogs.worldbank.org/ppps/node/679
UNCTAD. (2013). Investment policy review: Bangladesh. Retrieved from New York and
Geneva: http://unctad.org/en/PublicationsLibrary/diaepcb2013d4_en.pdf
US Department of Transportation. (2017). Model Public-Private Partnerships Core Toll
Concessions Contract Guide. Retrieved from Washington DC:
https://www.fhwa.dot.gov/ipd/pdfs/p3/model_p3_core_toll_concessions.pdf
Van Den Hurk, M., & Verhoest, K. (2016). The challenge of using standard contracts in
public–private partnerships. Public Management Review, 18(2), 278-299.
doi:10.1080/14719037.2014.984623
Van Lange, P. A., Joireman, J., Parks, C. D., & Van Dijk, E. (2013). The psychology of
social dilemmas: A review. Organizational Behavior and Human Decision
Processes, 120(2), 125-141.
Vining, A. R., & Weimer, D. L. (2016). The challenges of fractionalized property rights
in public‐private hybrid organizations: The good, the bad, and the ugly.
Regulation & Governance, 10(2), 161-178. doi:10.1111/rego.12086
278
Wang, Y., & Zhao, Z. J. (2018). Performance of Public-Private Partnerships and the
Influence of Contractual Arrangements. Public Performance & Management
Review, 41(1), 177-200. doi:10.1080/15309576.2017.1400989
Willems, T. (2014). Democratic accountability in public–private partnerships: the curious
case of Flemish school infrastructure. Public Administration, 92(2), 340-358.
Willems, T., & Van Dooren, W. (2016). (De) Politicization Dynamics in Public–Private
Partnerships (PPPs): Lessons from a comparison between UK and Flemish PPP
policy. Public Management Review, 18(2), 199-220.
Willems, T., Verhoest, K., Voets, J., Coppens, T., Van Dooren, W., & Van den Hurk, M.
(2017). Ten Lessons from Ten Years PPP Experience in Belgium. Australian
journal of public administration, 76(3), 316-329. doi:10.1111/1467-8500.12207
World Bank. (2000a). Bangladesh- Haripur Power Project (English) (20224). Retrieved
from Washington DC:
http://documents.worldbank.org/curated/en/706541468767964781/pdf/multi-
page.pdf
World Bank. (2000b). Bangladesh - Haripur Risk Guarantee (Power Plant) Project
(English) (PID7295). Retrieved from Washington DC:
http://documents.worldbank.org/curated/en/408341468768006501/Bangladesh-
Haripur-Risk-Guarantee-Power-Plant-Project
World Bank. (2014a). Bangladesh-Haripur Power Project (English). Retrieved from
Wasshington DC:
http://documents.worldbank.org/curated/en/729841468003313250/pdf/888760I
CR0P0651310Box385255B00OUO090.pdf

279
World Bank. (2014b). Public private partnerships: Reference Guide, version 2.0.
Retrieved from Washington DC: https://ppp.worldbank.org/public-private-
partnership/library/public-private-partnerships-reference-guide-version-20
World Bank. (2015). Impact of the global financial crisis on investments in South Asia’s
electric power infrastructure (56849-SAS). Retrieved from Washington DC:
http://documents.worldbank.org/curated/en/859531468114883143/pdf/568490E
SW0Whit1011065681web1version.pdf
World Bank. (2017a). Bangladesh - BD: Invst Promotion Financing Facility (English).
Retrieved from Washington DC:
http://documents.worldbank.org/curated/en/796341508510538170/Bangladesh-
BD-Invst-Promotion-Financing-Facility
World Bank. (2017b). Benchmarking Public-Private Partnerships Procurement 2017.
Retrieved from https://openknowledge.worldbank.org/handle/10986/25089
World Bank. (2017c). Mini Grids in Bangladesh : A Case Study of an Incipient Market.
Retrieved from Washington DC:
http://documents.worldbank.org/curated/en/669331512390210193/Mini-grids-
in-Bangladesh-a-case-study-of-an-incipient-market
World Bank. (2017d). Public Private Partnerships (PPPs): Reference Guide 3.0.
Retrieved from Washington Dc: https://ppp.worldbank.org/public-private-
partnership/library/ppp-reference-guide-3-0
World Bank. (2018). Public private partnerships Legal Resource Centre. Retrieved from
https://ppp.worldbank.org/public-private-partnership/overview/what-are-public-
private-partnerships
280
World Bank PPI Database. (2018). Private participation in Infrastructure Database.
Retrieved February 28, 2018, from World Bank Group
https://ppi.worldbank.org/customquery
Yang, Y., Hou, Y., & Wang, Y. (2013). On the development of public–private
partnerships in transitional economies: An explanatory framework. Public
Administration Review, 73(2), 301-310.
Yescombe, E. R. (2007). Public Private Partenrships: Principles of Policy and Finance.
London: Elsevier.
Yescombe, E. R. (2011). Public-private partnerships: principles of policy and finance.
London: Elsevier.
Yeung, J. F., Chan, A. P., Chan, D. W., Chiang, Y., & Yang, H. (2012). Developing a
benchmarking model for construction projects in Hong Kong. Journal of
construction engineering and management, 139(6), 705-716.
Yeung, J. F., Chan, A. P., Chan, D. W., & Li, L. K. (2007). Development of a partnering
performance index (PPI) for construction projects in Hong Kong: a Delphi study.
Construction Management and Economics, 25(12), 1219-1237.
Yin, R. K. (2014). Case study research: design and methods (Fifth ed.). Los Angeles:
Sage.
Yuan, J., Guang, M., Wang Xiaoxiao, Li Qiming, & Skibniewski, M. J. (2012).
Quantitative SWOT analysis of public housing delivery by public–private
partnerships in China based on the perspective of the public sector. Journal of
Management in Engineering, 28(4), 407-420.
Yuan, J., Li Wei, Zheng Xiaodan, & Skibniewski, M. J. (2018). Improving Operation
Performance of Public Rental Housing Delivery by PPPs in China. Journal of
281
Management in Engineering, 34(4), 04018015. doi:10.1061/(ASCE)ME.1943-
5479.0000615
Yuan, J., Skibniewski, M. J., Li Qiming, & Zheng Lei. (2010). Performance objectives
selection model in public-private partnership projects based on the perspective of
stakeholders. Journal of Management in Engineering, 26(2), 89-104.
doi:10.1061/(ASCE)ME.1943-5479.0000011
Yuan, J., Wang, C., Skibniewski, M. J., & Li Qiming. (2012). Developing key
performance indicators for public-private partnership projects: Questionnaire
survey and analysis. Journal of Management in Engineering, 28(3), 252-264.
doi:10.1061/(ASCE)ME.1943-5479.0000113
Yuan, J., Zeng, A. Y., Skibniewski, M. J., & Li, Q. (2009). Selection of performance
objectives and key performance indicators in public–private partnership projects
to achieve value for money. Construction Management and Economics, 27(3),
253-270.
Zhang, X. (2005). Critical Success Factors for Public Private Partnerships in
Infrastructure Development. Journal of construction engineering and
management, 131(1), 3-14. doi:10.1061/(ASCE)0733-9364(2005)131:1(3)
Zhou, L., Keivani, R., & Kurul, E. (2013). Sustainability performance measurement
framework for PFI projects in the UK. Journal of Financial Management of
Property and Construction, 18(3), 232-250. doi:10.1108/JFMPC-08-2012-0032
Zou, W., Kumaraswamy, M., Chung, J., & Wong, J. (2014). Identifying the critical
success factors for relationship management in PPP projects. International
Journal of Project Management, 32(2), 265-274.
doi:10.1016/j.ijproman.2013.05.004
Related Documents