Japan Advanced Institute of Science and Technology JAIST Repository https://dspace.jaist.ac.jp/ Title Performance Evaluation of a Green Scheduling Algorithm for Energy Savings in Cloud Computing Author(s) Duy, Truong Vinh Truong; Sato, Yukinori; Inoguchi, Yasushi Citation 2010 IEEE International Symposium on Parallel & Distributed Processing, Workshops and Phd Forum (IPDPSW): 1-8 Issue Date 2010-04 Type Conference Paper Text version publisher URL http://hdl.handle.net/10119/9575 Rights Copyright (C) 2010 IEEE. Reprinted from 2010 IEEE International Symposium on Parallel & Distributed Processing, Workshops and Phd Forum (IPDPSW), , 2010, 1-8. This material is posted here with permission of the IEEE. Such permission of the IEEE does not in any way imply IEEE endorsement of any of JAIST's products or services. Internal or personal use of this material is permitted. However, permission to reprint/republish this material for advertising or promotional purposes or for creating new collective works for resale or redistribution must be obtained from the IEEE by writing to [email protected]. By choosing to view this document, you agree to all provisions of the copyright laws protecting it. Description

Welcome message from author
This document is posted to help you gain knowledge. Please leave a comment to let me know what you think about it! Share it to your friends and learn new things together.
Transcript
Japan Advanced Institute of Science and Technology
JAIST Repositoryhttps://dspace.jaist.ac.jp/
TitlePerformance Evaluation of a Green Scheduling
Algorithm for Energy Savings in Cloud Computing
Author(s)Duy, Truong Vinh Truong; Sato, Yukinori;
Inoguchi, Yasushi
Citation
2010 IEEE International Symposium on Parallel &
Distributed Processing, Workshops and Phd Forum
(IPDPSW): 1-8
Issue Date 2010-04
Type Conference Paper
Text version publisher
URL http://hdl.handle.net/10119/9575
Rights
Copyright (C) 2010 IEEE. Reprinted from 2010 IEEE
International Symposium on Parallel & Distributed
Processing, Workshops and Phd Forum (IPDPSW), ,
2010, 1-8. This material is posted here with
permission of the IEEE. Such permission of the
IEEE does not in any way imply IEEE endorsement
of any of JAIST's products or services. Internal
or personal use of this material is permitted.
However, permission to reprint/republish this
material for advertising or promotional purposes
or for creating new collective works for resale
or redistribution must be obtained from the IEEE
by writing to [email protected]. By
choosing to view this document, you agree to all
provisions of the copyright laws protecting it.
Description
Performance Evaluation of a Green Scheduling Algorithm for Energy Savings in Cloud Computing
Truong Vinh Truong Duy Graduate School of Information Science
Japan Advanced Institute of Science and Technology 1-1 Asahidai, Nomi, Ishikawa, 923-1292 Japan
Yukinori Sato and Yasushi Inoguchi Center for Information Science
Japan Advanced Institute of Science and Technology 1-1 Asahidai, Nomi, Ishikawa, 923-1292 Japan
[yukinori, inoguchi]@jaist.ac.jp
Abstract— With energy shortages and global climate change leading our concerns these days, the power consumption of datacenters has become a key issue. Obviously, a substantial reduction in energy consumption can be made by powering down servers when they are not in use. This paper aims at designing, implementing and evaluating a Green Scheduling Algorithm integrating a neural network predictor for optimizing server power consumption in Cloud computing. We employ the predictor to predict future load demand based on historical demand. According to the prediction, the algorithm turns off unused servers and restarts them to minimize the number of running servers, thus minimizing the energy use at the points of consumption to benefit all other levels. For evaluation, we perform simulations with two load traces. The results show that the PP20 mode can save up to 46.3% of power consumption with a drop rate of 0.03% on one load trace, and a drop rate of 0.12% with a power reduction rate of 46.7% on the other.
Keywords- energy savings; green scheduling; neural predictor; Cloud computing; datacenters
I. INTRODUCTION Cloud computing [1] has emerged as a new business
model of computation and storage resources based on on-demand access to potentially significant amounts of remote datacenter capabilities. As the field matures together with the nonstop growth of the Internet and the world’s businesses, it is expected that more Cloud providers will appear and provide a more diverse selection of different resources and services. However, the deployment of datacenters in Clouds has put more and more computers in use each year, increasing energy consumption and negative pressure on the environment. Research shows that running a single 300-watt server during a year can cost about $338, and more importantly, can emit as much as 1,300 kg CO2, without mentioning the cooling equipment [2]. A recent report has estimated the datacenters in the US consumed approximately 1.5% of the total electricity consumption in 2006 and this number is projected to double in 2011 [3]. It is even said that the costs to operate servers will exceed the costs to purchase server hardware by 2015 [4].
The existing techniques for energy savings in the area of enterprise power management at a server farm can roughly be divided into two categories: dynamic voltage/frequency
management inside a server and shutting down servers when not in use. In the former, power savings are gained by adjusting the operating clock to scale down the supply voltages for the circuits. Although this approach can provide a significant reduction in power consumption, it depends on the hardware components’ settings to perform scaling tasks. On the other hand, the latter promises most power savings, as it ensures near-zero electricity consumed by being-turned-off servers. However, previous works which took this approach had difficulties to assure service-level agreement due to the lack of a reliable tool for predicting future demand to assist the turning off/on decision- making process.
In this paper, we aim to design, implement and evaluate a Green Scheduling Algorithm integrating a neural network predictor for optimizing server power consumption in Cloud computing environments by shutting down unused servers. The neural network predictor which we had developed earlier has been proven to have a highly accurate prediction ability with low overhead to fit in dynamic real time settings [5]. The use of this predictor is thought to help the algorithm cleverly make appropriate turning off/on decisions, and to make the approach more practical. As virtual machines are spawned on demand to meet the user's needs in Clouds, the neural predictor is employed to predict future load demand on servers based on historical demand.
Our scheduling algorithm works as follows. According to the prediction, the algorithm first estimates required dynamic workload on the servers. Then unnecessary servers are turned off in order to minimize the number of running servers, thus minimizing the energy use at the points of consumption to provide benefits to all other levels. Also, several servers are added to help assure service-level agreement. The bottom line is to protect the environment and to reduce the total cost of ownership while ensuring quality of service.
To evaluate the algorithm, we perform simulations with four different running modes and parameters. Evaluation results show that in the optimal mode, the power consumption reduction rate can be significantly achieved, up to 72.2% compared to the conventional mode, without affecting performance. The prediction mode can save energy even more, up to 79.5%, although the drop rate is quite high. Lastly, the mode running prediction plus 20% additional servers offers the best combination: a drop rate of 0.03% and a power reduction rate of 46.3%.
978-1-4244-6534-7/10/$26.00 ©2010 IEEE
The remainder of this paper is organized as follows. Section 2 introduces background information and related work. The power consumption of servers is examined in Section 3. Section 4 presents the system model, the neural predictor and the algorithm. Section 5 analyzes simulator descriptions and simulation results. Finally, we conclude our study in Section 6.
II. RELATED WORK Many papers have studied the dynamic voltage/frequency
scaling technique for managing energy and server resources in clusters and data/hosting centers [6, 7, 8]. The work in [6] has mainly focused on a single server setting and its energy consumption is reduced by adaptive algorithms for frequency scaling. In [7], a cluster-level power controller has been proposed, although the actual power reduction is gained at processor level also by adjusting their frequency. An intensive work was introduced in [8] to find the specific relationship between power and frequency for optimal power allocation at the level of server farms. Even though frequency scaling technique offers substantial power savings, it relies on the settings of hardware components to perform scaling tasks.
A recent trend is to define special states of servers which can provide energy savings while being able to perform some pre-defined tasks. In [9], PowerNap was proposed as an approach to energy conservation, where the server moves rapidly between an active state and a near-zero-power idle state, called “nap” state, in response to load. Another special state of server, called “Somniloquy”, was presented in [10] to augment network interfaces and enable a server to respond to network traffic such as remote desktop and VoIP in the S3 state for saving energy. [11] introduced a similar barely-alive state, that allows remote accesses to a server’s main memory even when many of its other components have been turned off. This approach has a downside, however, as it requires additional specially designed hardware to implement the special state.
We believe that a software-based approach that takes advantage of currently available server’s states would be more cost-efficient and easier for datacenters deployment. To this end, workload concentration and temporary server turnoff promise the most power savings. A power aware
request distribution scheme for server clusters was introduced in [12], where energy reduction is obtained by turning off some servers when the current load can be served by fewer servers. Health et al. [13] designed servers for a heterogeneous cluster that employs modeling and optimization to minimize energy consumption. Recently, the energy-aware consolidation problem for Clouds was investigated in [14] to show the performance-energy trade-offs and the existence of an optimal point. In this paper, we design a green scheduling algorithm that also concentrates workload on a subset of servers and then turns off the others. In contrast to previous work, we employ a highly accurate neural network predictor for predicting user’s demand to turn on/off servers, considering the predicted demand and server’s restart delay.
Neural networks have been applied to modeling nonlinear time series in various areas, for example, stock market [15], sports results [16], road surface temperature [17], and scheduling problems [18]. Neural networks have many important advantages over the traditional statistical models, most notably the nonlinear generalization ability. With this remarkable ability, they can learn from data examples and capture the underlying functional relationships between input and output values. In [18], a NARX neural network based load prediction was presented to define data mappings appropriate for dynamic resources with the aim of improving the scheduling decision in grid environments.
There are several major differences between their approach and our approach. First, it utilized a recurrent network while our neural predictor employed feedforward networks for the purpose of ensuring both high performance and low overhead. Second, and more important, their work, as well as other previous works, merely focused on performance, in particular the execution time of application running in the proposed method. In contrast, not only did we improve the performance, but we also considered the cost, namely the cost for training, validating and testing, to examine if such a neural network based solution is feasible in dynamic real-time settings. This is very important because the solution may not be applicable for real-time applications if it takes hours or days for training.
Figure 1. CPU utilization and power consumption.
Figure 2. State transition of the Linux machine.
III. UNDERSTANDING POWER CONSUMPTION Understanding the relationship between power
consumption, CPU utilization and the transition delay between different server’s states is essential to design efficient strategies for energy savings. We examined this relationship by measuring power consumption of typical machines in different states. The machines we used include a Linux machine with AMD Phenom™ 9500 Quad-Core Processor 2.2GHz, and a Windows machine with AMD Athlon™ 64 X2 Dual-Core Processor 5000+ 2.6GHz. They were connected to a System Artware SHW3A watt-hour meter at the power plug to record power consumption of the whole machines.
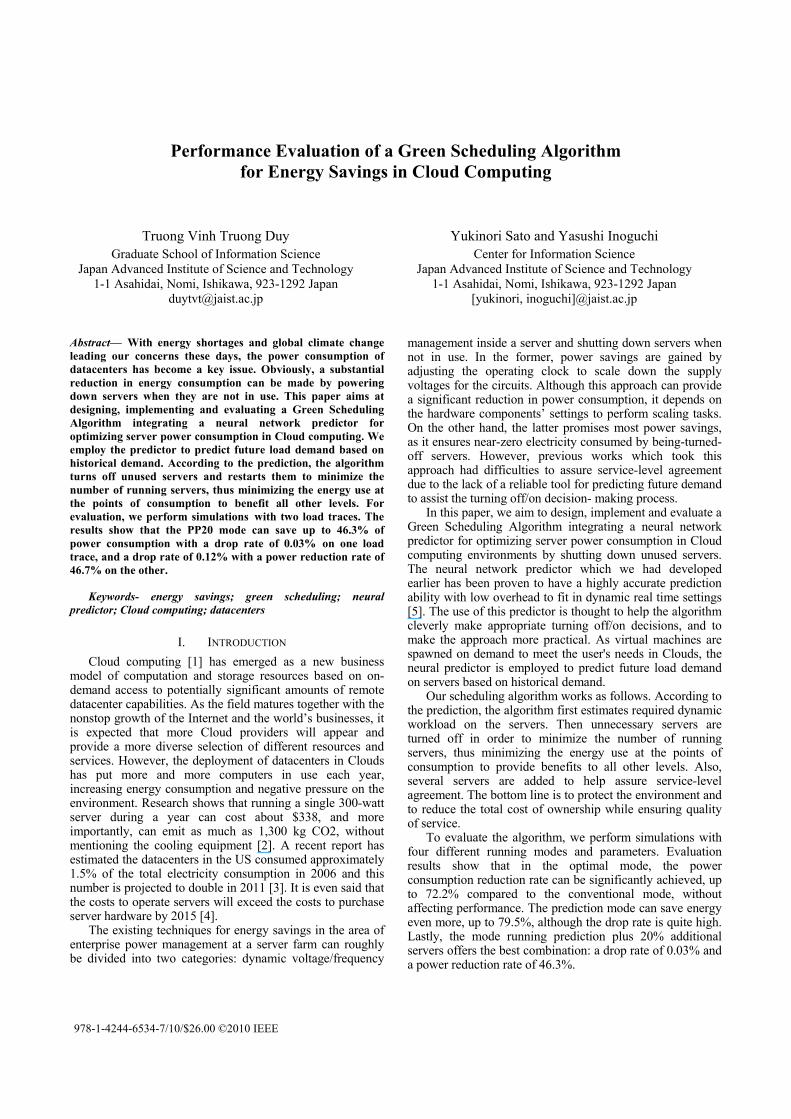
Figure 1 shows power consumption of the two machines in the idle state and different CPU utilization levels, ranging from 10% to 100%. In the Linux machine, the CPU load is generated using the lookbusy load generator to attempt to keep the CPUs at a chosen utilization level, while in the Windows machine, load is generated by a simple loop written in C#. To obtain more accurate data, the CPU utilization is maintained at a stable state for 5 minutes, and the average recorded power consumption over the period is reported. The power consumption appears to be almost linear with CPU utilization. An increase of 10% in CPU utilization leads to an increase of approximately 6.5% and 3% in power consumption in the quad-core and dual-core machines, respectively. Besides, we observe that the idle state consumes a substantial amount of energy, as much as 62%, in case of the quad-core machine, and 78% in the case of the dual-core machine, of the peak power. This observation implies that there is room for power conservation and hence, a large power reduction can be achieved by sending idling servers to a lower power state.
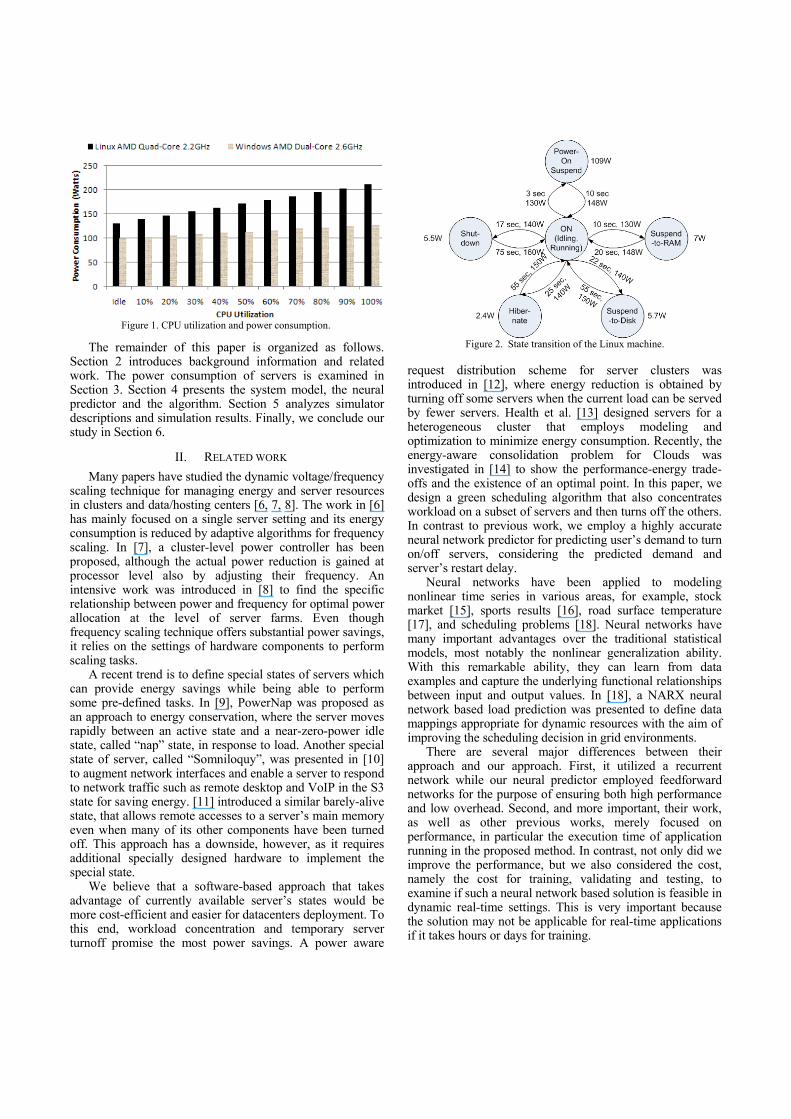
We also measured power consumption of pre-defined low power states, including shutdown, hibernate, suspend-to-disk, suspend-to-RAM, power-on-suspend with the Linux machine, and shutdown, hibernate, standby with the Windows machine. Figures 2 and 3 display the power consumption of these states in the Linux and Windows machines respectively, alongside transition delays from the idle state to each state and vice versa (in seconds), and the peak power incurred over the transition period. In the Linux machine, suspend-to-RAM seems to be the best state, in
terms of both power consumption and transition delay, as it needs only 10 seconds to come to this state from the idle state, and 20 seconds for the opposite direction. The peak power incurred during the transition is equivalent to roughly 30% CPU utilization. Similarly, the standby state is a good candidate to replace the idle state for saving energy in Windows machines. It consumes only 3.7W, and takes as little as 5 and 10 seconds for transition delays.
IV. THE SYSTEM MODEL, THE NEURAL PREDICTOR AND THE ALGORITHM
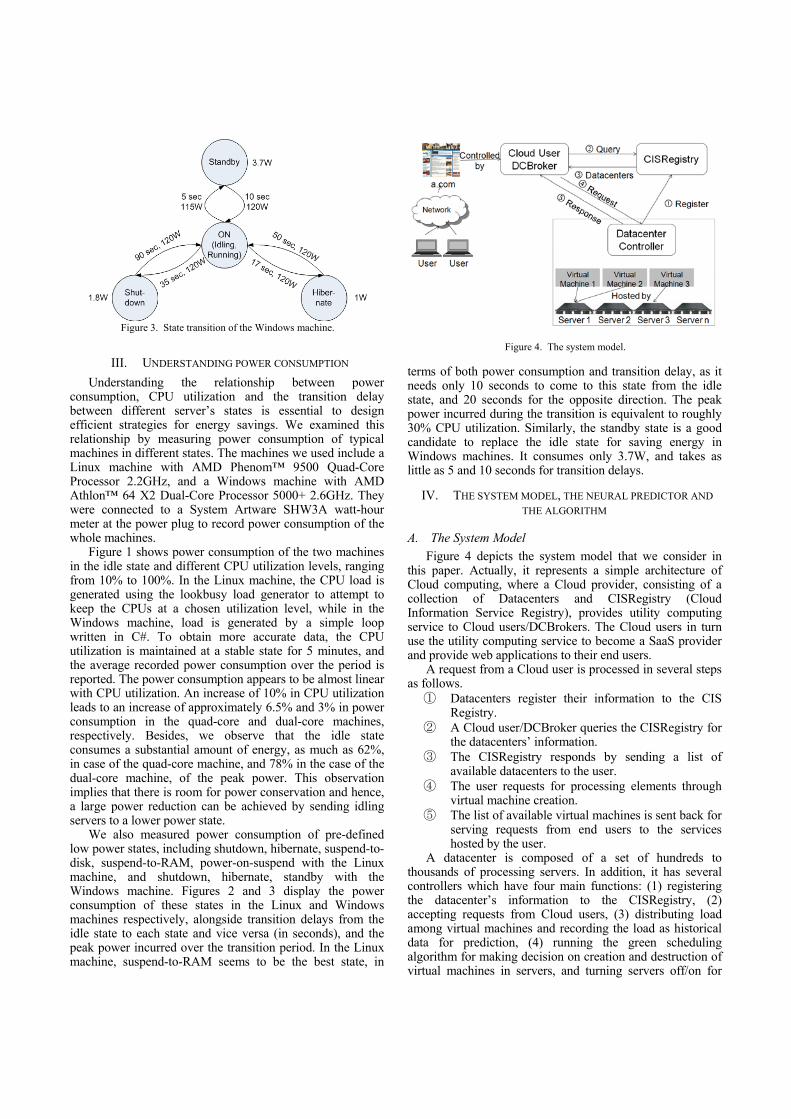
A. The System Model Figure 4 depicts the system model that we consider in
this paper. Actually, it represents a simple architecture of Cloud computing, where a Cloud provider, consisting of a collection of Datacenters and CISRegistry (Cloud Information Service Registry), provides utility computing service to Cloud users/DCBrokers. The Cloud users in turn use the utility computing service to become a SaaS provider and provide web applications to their end users.
A request from a Cloud user is processed in several steps as follows.
① Datacenters register their information to the CIS Registry.
② A Cloud user/DCBroker queries the CISRegistry for the datacenters’ information.
③ The CISRegistry responds by sending a list of available datacenters to the user.
④ The user requests for processing elements through virtual machine creation.
⑤ The list of available virtual machines is sent back for serving requests from end users to the services hosted by the user.
A datacenter is composed of a set of hundreds to thousands of processing servers. In addition, it has several controllers which have four main functions: (1) registering the datacenter’s information to the CISRegistry, (2) accepting requests from Cloud users, (3) distributing load among virtual machines and recording the load as historical data for prediction, (4) running the green scheduling algorithm for making decision on creation and destruction of virtual machines in servers, and turning servers off/on for
Figure 3. State transition of the Windows machine.
Figure 4. The system model.
energy savings. A server is responsible for managing virtual machines it is hosting. A server can host multiple virtual machines at the same time, but one virtual machine can be hosted in only one server. Virtual machines appear as processing elements from the viewpoint of Cloud users.
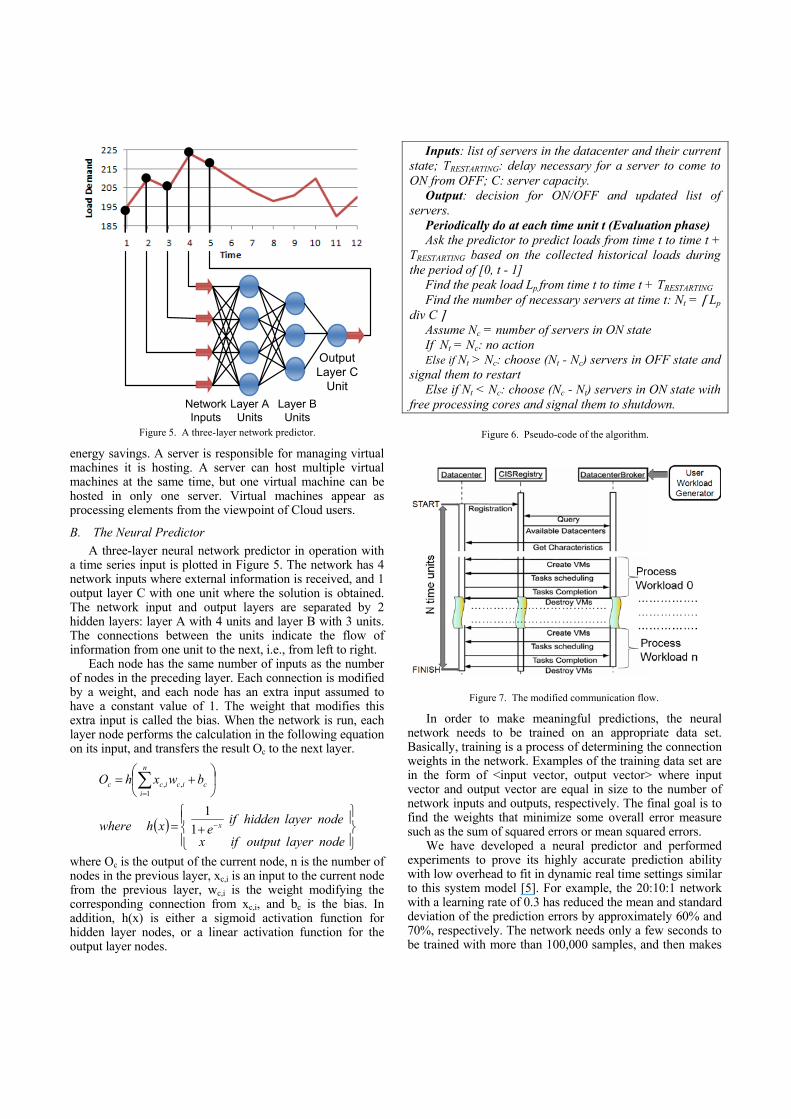
B. The Neural Predictor A three-layer neural network predictor in operation with
a time series input is plotted in Figure 5. The network has 4 network inputs where external information is received, and 1 output layer C with one unit where the solution is obtained. The network input and output layers are separated by 2 hidden layers: layer A with 4 units and layer B with 3 units. The connections between the units indicate the flow of information from one unit to the next, i.e., from left to right.
Each node has the same number of inputs as the number of nodes in the preceding layer. Each connection is modified by a weight, and each node has an extra input assumed to have a constant value of 1. The weight that modifies this extra input is called the bias. When the network is run, each layer node performs the calculation in the following equation on its input, and transfers the result Oc to the next layer.
where Oc is the output of the current node, n is the number of nodes in the previous layer, xc,i is an input to the current node from the previous layer, wc,i is the weight modifying the corresponding connection from xc,i, and bc is the bias. In addition, h(x) is either a sigmoid activation function for hidden layer nodes, or a linear activation function for the output layer nodes.
In order to make meaningful predictions, the neural network needs to be trained on an appropriate data set. Basically, training is a process of determining the connection weights in the network. Examples of the training data set are in the form of <input vector, output vector> where input vector and output vector are equal in size to the number of network inputs and outputs, respectively. The final goal is to find the weights that minimize some overall error measure such as the sum of squared errors or mean squared errors.
We have developed a neural predictor and performed experiments to prove its highly accurate prediction ability with low overhead to fit in dynamic real time settings similar to this system model [5]. For example, the 20:10:1 network with a learning rate of 0.3 has reduced the mean and standard deviation of the prediction errors by approximately 60% and 70%, respectively. The network needs only a few seconds to be trained with more than 100,000 samples, and then makes
Network Inputs
Layer A Units
Layer B Units
Output Layer C
Unit
Figure 5. A three-layer network predictor.
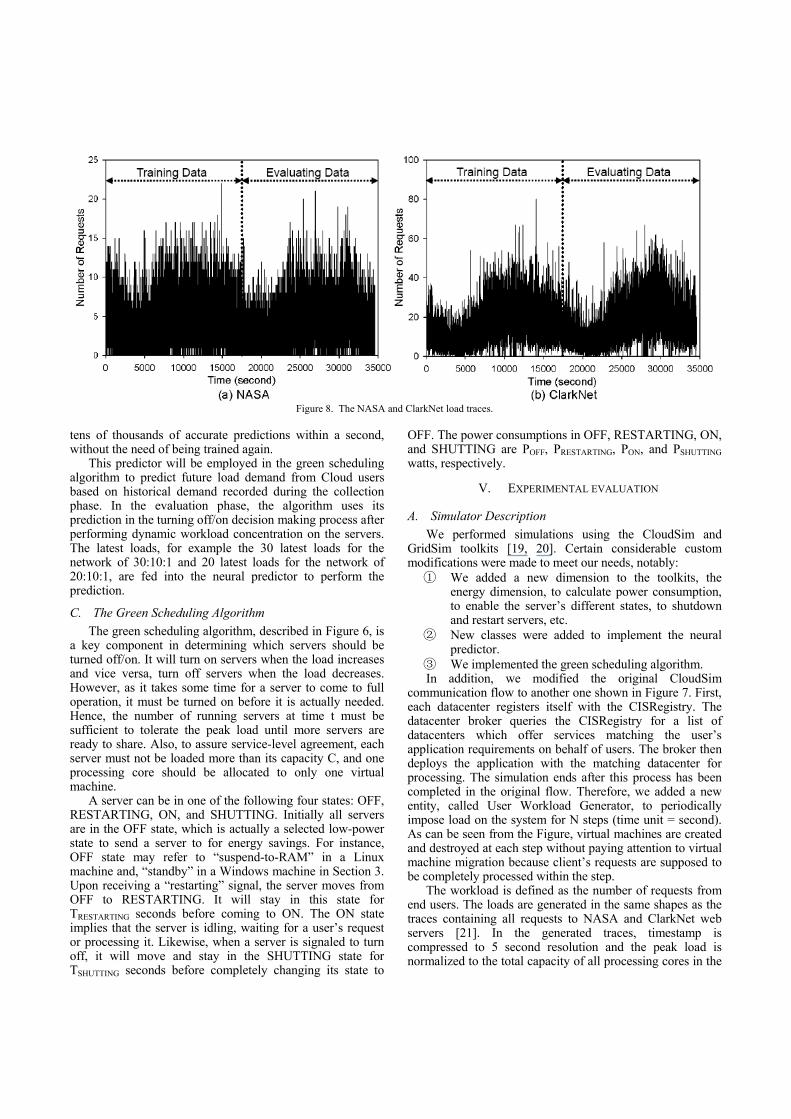
Inputs: list of servers in the datacenter and their current state; TRESTARTING: delay necessary for a server to come to ON from OFF; C: server capacity.
Output: decision for ON/OFF and updated list of servers.
Periodically do at each time unit t (Evaluation phase) Ask the predictor to predict loads from time t to time t +
TRESTARTING based on the collected historical loads during the period of [0, t - 1]
Find the peak load Lp from time t to time t + TRESTARTING Find the number of necessary servers at time t: Nt = Lp
div C Assume Nc = number of servers in ON state If Nt = Nc: no action Else if Nt > Nc: choose (Nt - Nc) servers in OFF state and
signal them to restart Else if Nt < Nc: choose (Nc - Nt) servers in ON state with
free processing cores and signal them to shutdown.
Figure 6. Pseudo-code of the algorithm.
Figure 7. The modified communication flow.
( )⎪⎭
⎪⎬⎫
⎪⎩
⎪⎨⎧
+=
⎟⎠
⎞⎜⎝
⎛+=
−
=∑
nodelayeroutputifx
nodelayerhiddenifexhwhere
bwxhO
x
c
n
iicicc
11
1,,
tens of thousands of accurate predictions within a second, without the need of being trained again.
This predictor will be employed in the green scheduling algorithm to predict future load demand from Cloud users based on historical demand recorded during the collection phase. In the evaluation phase, the algorithm uses its prediction in the turning off/on decision making process after performing dynamic workload concentration on the servers. The latest loads, for example the 30 latest loads for the network of 30:10:1 and 20 latest loads for the network of 20:10:1, are fed into the neural predictor to perform the prediction.
C. The Green Scheduling Algorithm The green scheduling algorithm, described in Figure 6, is
a key component in determining which servers should be turned off/on. It will turn on servers when the load increases and vice versa, turn off servers when the load decreases. However, as it takes some time for a server to come to full operation, it must be turned on before it is actually needed. Hence, the number of running servers at time t must be sufficient to tolerate the peak load until more servers are ready to share. Also, to assure service-level agreement, each server must not be loaded more than its capacity C, and one processing core should be allocated to only one virtual machine.
A server can be in one of the following four states: OFF, RESTARTING, ON, and SHUTTING. Initially all servers are in the OFF state, which is actually a selected low-power state to send a server to for energy savings. For instance, OFF state may refer to “suspend-to-RAM” in a Linux machine and, “standby” in a Windows machine in Section 3. Upon receiving a “restarting” signal, the server moves from OFF to RESTARTING. It will stay in this state for TRESTARTING seconds before coming to ON. The ON state implies that the server is idling, waiting for a user’s request or processing it. Likewise, when a server is signaled to turn off, it will move and stay in the SHUTTING state for TSHUTTING seconds before completely changing its state to
OFF. The power consumptions in OFF, RESTARTING, ON, and SHUTTING are POFF, PRESTARTING, PON, and PSHUTTING watts, respectively.
V. EXPERIMENTAL EVALUATION
A. Simulator Description We performed simulations using the CloudSim and
GridSim toolkits [19, 20]. Certain considerable custom modifications were made to meet our needs, notably:
① We added a new dimension to the toolkits, the energy dimension, to calculate power consumption, to enable the server’s different states, to shutdown and restart servers, etc.
② New classes were added to implement the neural predictor.
③ We implemented the green scheduling algorithm. In addition, we modified the original CloudSim
communication flow to another one shown in Figure 7. First, each datacenter registers itself with the CISRegistry. The datacenter broker queries the CISRegistry for a list of datacenters which offer services matching the user’s application requirements on behalf of users. The broker then deploys the application with the matching datacenter for processing. The simulation ends after this process has been completed in the original flow. Therefore, we added a new entity, called User Workload Generator, to periodically impose load on the system for N steps (time unit = second). As can be seen from the Figure, virtual machines are created and destroyed at each step without paying attention to virtual machine migration because client’s requests are supposed to be completely processed within the step.
The workload is defined as the number of requests from end users. The loads are generated in the same shapes as the traces containing all requests to NASA and ClarkNet web servers [21]. In the generated traces, timestamp is compressed to 5 second resolution and the peak load is normalized to the total capacity of all processing cores in the
Figure 8. The NASA and ClarkNet load traces.
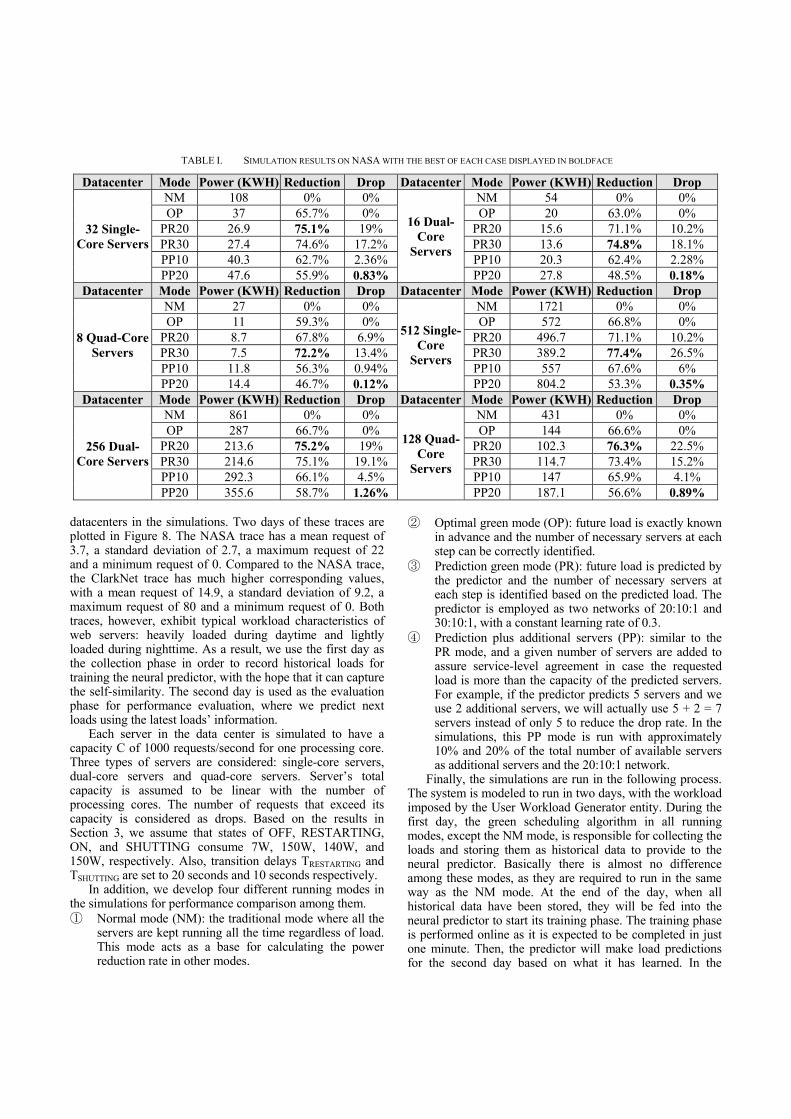
datacenters in the simulations. Two days of these traces are plotted in Figure 8. The NASA trace has a mean request of 3.7, a standard deviation of 2.7, a maximum request of 22 and a minimum request of 0. Compared to the NASA trace, the ClarkNet trace has much higher corresponding values, with a mean request of 14.9, a standard deviation of 9.2, a maximum request of 80 and a minimum request of 0. Both traces, however, exhibit typical workload characteristics of web servers: heavily loaded during daytime and lightly loaded during nighttime. As a result, we use the first day as the collection phase in order to record historical loads for training the neural predictor, with the hope that it can capture the self-similarity. The second day is used as the evaluation phase for performance evaluation, where we predict next loads using the latest loads’ information.
Each server in the data center is simulated to have a capacity C of 1000 requests/second for one processing core. Three types of servers are considered: single-core servers, dual-core servers and quad-core servers. Server’s total capacity is assumed to be linear with the number of processing cores. The number of requests that exceed its capacity is considered as drops. Based on the results in Section 3, we assume that states of OFF, RESTARTING, ON, and SHUTTING consume 7W, 150W, 140W, and 150W, respectively. Also, transition delays TRESTARTING and TSHUTTING are set to 20 seconds and 10 seconds respectively.
In addition, we develop four different running modes in the simulations for performance comparison among them. ① Normal mode (NM): the traditional mode where all the
servers are kept running all the time regardless of load. This mode acts as a base for calculating the power reduction rate in other modes.
② Optimal green mode (OP): future load is exactly known in advance and the number of necessary servers at each step can be correctly identified.
③ Prediction green mode (PR): future load is predicted by the predictor and the number of necessary servers at each step is identified based on the predicted load. The predictor is employed as two networks of 20:10:1 and 30:10:1, with a constant learning rate of 0.3.
④ Prediction plus additional servers (PP): similar to the PR mode, and a given number of servers are added to assure service-level agreement in case the requested load is more than the capacity of the predicted servers. For example, if the predictor predicts 5 servers and we use 2 additional servers, we will actually use 5 + 2 = 7 servers instead of only 5 to reduce the drop rate. In the simulations, this PP mode is run with approximately 10% and 20% of the total number of available servers as additional servers and the 20:10:1 network.
Finally, the simulations are run in the following process. The system is modeled to run in two days, with the workload imposed by the User Workload Generator entity. During the first day, the green scheduling algorithm in all running modes, except the NM mode, is responsible for collecting the loads and storing them as historical data to provide to the neural predictor. Basically there is almost no difference among these modes, as they are required to run in the same way as the NM mode. At the end of the day, when all historical data have been stored, they will be fed into the neural predictor to start its training phase. The training phase is performed online as it is expected to be completed in just one minute. Then, the predictor will make load predictions for the second day based on what it has learned. In the
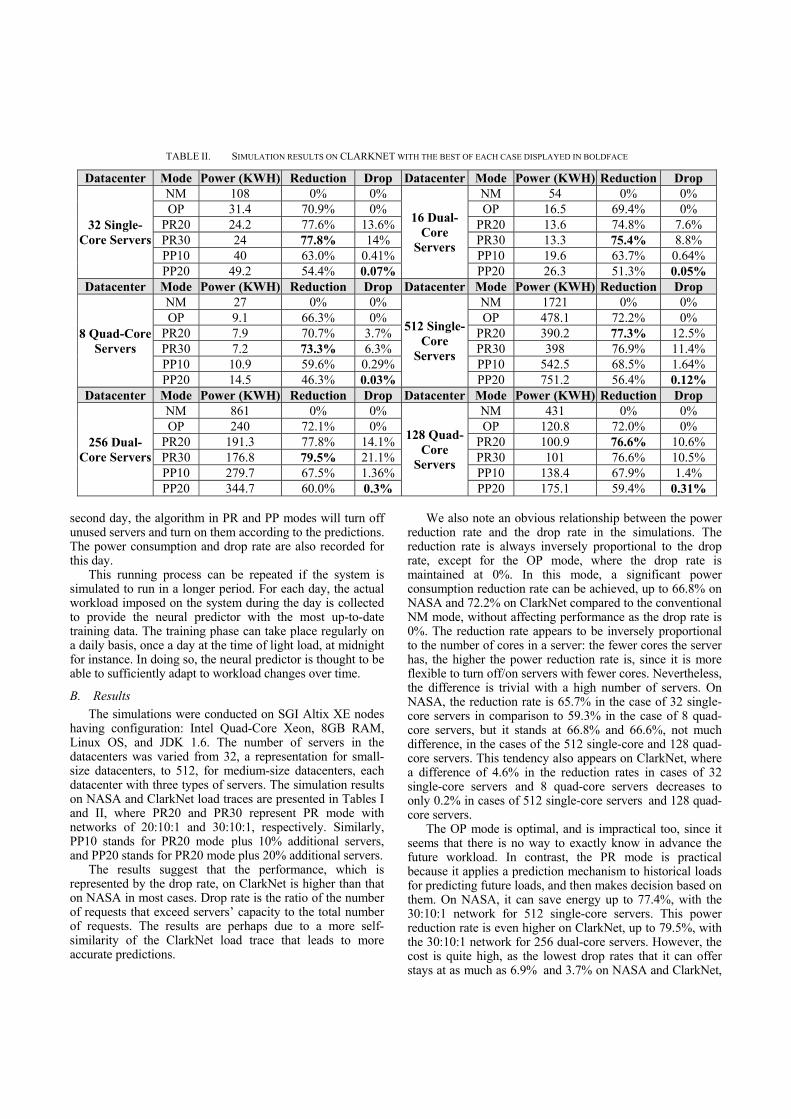
TABLE I. SIMULATION RESULTS ON NASA WITH THE BEST OF EACH CASE DISPLAYED IN BOLDFACE
Datacenter Mode Power (KWH) Reduction Drop Datacenter Mode Power (KWH) Reduction Drop
32 Single-Core Servers
NM 108 0% 0%
16 Dual-Core
Servers
NM 54 0% 0% OP 37 65.7% 0% OP 20 63.0% 0%
PR20 26.9 75.1% 19% PR20 15.6 71.1% 10.2% PR30 27.4 74.6% 17.2% PR30 13.6 74.8% 18.1% PP10 40.3 62.7% 2.36% PP10 20.3 62.4% 2.28% PP20 47.6 55.9% 0.83% PP20 27.8 48.5% 0.18%
Datacenter Mode Power (KWH) Reduction Drop Datacenter Mode Power (KWH) Reduction Drop
8 Quad-Core Servers
NM 27 0% 0%
512 Single-Core
Servers
NM 1721 0% 0% OP 11 59.3% 0% OP 572 66.8% 0%
PR20 8.7 67.8% 6.9% PR20 496.7 71.1% 10.2% PR30 7.5 72.2% 13.4% PR30 389.2 77.4% 26.5% PP10 11.8 56.3% 0.94% PP10 557 67.6% 6% PP20 14.4 46.7% 0.12% PP20 804.2 53.3% 0.35%
Datacenter Mode Power (KWH) Reduction Drop Datacenter Mode Power (KWH) Reduction Drop
256 Dual-Core Servers
NM 861 0% 0%
128 Quad-Core
Servers
NM 431 0% 0% OP 287 66.7% 0% OP 144 66.6% 0%
PR20 213.6 75.2% 19% PR20 102.3 76.3% 22.5% PR30 214.6 75.1% 19.1% PR30 114.7 73.4% 15.2% PP10 292.3 66.1% 4.5% PP10 147 65.9% 4.1% PP20 355.6 58.7% 1.26% PP20 187.1 56.6% 0.89%
second day, the algorithm in PR and PP modes will turn off unused servers and turn on them according to the predictions. The power consumption and drop rate are also recorded for this day.
This running process can be repeated if the system is simulated to run in a longer period. For each day, the actual workload imposed on the system during the day is collected to provide the neural predictor with the most up-to-date training data. The training phase can take place regularly on a daily basis, once a day at the time of light load, at midnight for instance. In doing so, the neural predictor is thought to be able to sufficiently adapt to workload changes over time.
B. Results The simulations were conducted on SGI Altix XE nodes
having configuration: Intel Quad-Core Xeon, 8GB RAM, Linux OS, and JDK 1.6. The number of servers in the datacenters was varied from 32, a representation for small-size datacenters, to 512, for medium-size datacenters, each datacenter with three types of servers. The simulation results on NASA and ClarkNet load traces are presented in Tables I and II, where PR20 and PR30 represent PR mode with networks of 20:10:1 and 30:10:1, respectively. Similarly, PP10 stands for PR20 mode plus 10% additional servers, and PP20 stands for PR20 mode plus 20% additional servers.
The results suggest that the performance, which is represented by the drop rate, on ClarkNet is higher than that on NASA in most cases. Drop rate is the ratio of the number of requests that exceed servers’ capacity to the total number of requests. The results are perhaps due to a more self-similarity of the ClarkNet load trace that leads to more accurate predictions.
We also note an obvious relationship between the power reduction rate and the drop rate in the simulations. The reduction rate is always inversely proportional to the drop rate, except for the OP mode, where the drop rate is maintained at 0%. In this mode, a significant power consumption reduction rate can be achieved, up to 66.8% on NASA and 72.2% on ClarkNet compared to the conventional NM mode, without affecting performance as the drop rate is 0%. The reduction rate appears to be inversely proportional to the number of cores in a server: the fewer cores the server has, the higher the power reduction rate is, since it is more flexible to turn off/on servers with fewer cores. Nevertheless, the difference is trivial with a high number of servers. On NASA, the reduction rate is 65.7% in the case of 32 single-core servers in comparison to 59.3% in the case of 8 quad-core servers, but it stands at 66.8% and 66.6%, not much difference, in the cases of the 512 single-core and 128 quad-core servers. This tendency also appears on ClarkNet, where a difference of 4.6% in the reduction rates in cases of 32 single-core servers and 8 quad-core servers decreases to only 0.2% in cases of 512 single-core servers and 128 quad-core servers.
The OP mode is optimal, and is impractical too, since it seems that there is no way to exactly know in advance the future workload. In contrast, the PR mode is practical because it applies a prediction mechanism to historical loads for predicting future loads, and then makes decision based on them. On NASA, it can save energy up to 77.4%, with the 30:10:1 network for 512 single-core servers. This power reduction rate is even higher on ClarkNet, up to 79.5%, with the 30:10:1 network for 256 dual-core servers. However, the cost is quite high, as the lowest drop rates that it can offer stays at as much as 6.9% and 3.7% on NASA and ClarkNet,
TABLE II. SIMULATION RESULTS ON CLARKNET WITH THE BEST OF EACH CASE DISPLAYED IN BOLDFACE
Datacenter Mode Power (KWH) Reduction Drop Datacenter Mode Power (KWH) Reduction Drop
32 Single-Core Servers
NM 108 0% 0%
16 Dual-Core
Servers
NM 54 0% 0% OP 31.4 70.9% 0% OP 16.5 69.4% 0%
PR20 24.2 77.6% 13.6% PR20 13.6 74.8% 7.6% PR30 24 77.8% 14% PR30 13.3 75.4% 8.8% PP10 40 63.0% 0.41% PP10 19.6 63.7% 0.64%PP20 49.2 54.4% 0.07% PP20 26.3 51.3% 0.05%
Datacenter Mode Power (KWH) Reduction Drop Datacenter Mode Power (KWH) Reduction Drop
8 Quad-Core Servers
NM 27 0% 0%
512 Single-Core
Servers
NM 1721 0% 0% OP 9.1 66.3% 0% OP 478.1 72.2% 0%
PR20 7.9 70.7% 3.7% PR20 390.2 77.3% 12.5%PR30 7.2 73.3% 6.3% PR30 398 76.9% 11.4%PP10 10.9 59.6% 0.29% PP10 542.5 68.5% 1.64%PP20 14.5 46.3% 0.03% PP20 751.2 56.4% 0.12%
Datacenter Mode Power (KWH) Reduction Drop Datacenter Mode Power (KWH) Reduction Drop
256 Dual-Core Servers
NM 861 0% 0%
128 Quad-Core
Servers
NM 431 0% 0%OP 240 72.1% 0% OP 120.8 72.0% 0%
PR20 191.3 77.8% 14.1% PR20 100.9 76.6% 10.6%PR30 176.8 79.5% 21.1% PR30 101 76.6% 10.5%PP10 279.7 67.5% 1.36% PP10 138.4 67.9% 1.4%PP20 344.7 60.0% 0.3% PP20 175.1 59.4% 0.31%
respectively. Both networks of 20:10:1 and 30:10:1 exhibit similar performance behavior.
Lastly, the PP mode proves to be the most practical solution. The more additional servers we have, the more we reduce the drop rate. In the case of 8 quad-core servers with approximately 20% = 2 additional servers, it provides a drop rate of 0.12%, and a power reduction rate of 46.7% on NASA, and a drop rate of as low as 0.03% with a power reduction rate of 46.3% on ClarkNet. It is expected that the drop rate can be reduced further, to a near-zero level, when more additional servers are added.
VI. CONCLUSION This paper has presented a Green Scheduling Algorithm
which makes use of a neural network based predictor for energy savings in Cloud computing. The predictor is exploited to predict future load demand based on collected historical demand. The algorithm uses the prediction in making turning off/on decisions to minimize the number of running servers. In order to demonstrate the algorithm, we have performed simulations with different parameters and running modes. From the results, we have concluded the best configuration is the prediction plus 20% additional servers for assuring service level. It can offer 46.3% power reduction while maintaining the drop rate at as low as 0.03% on ClarkNet, and a power reduction rate of 46.7% with a drop rate of 0.12% on NASA.
In future work, we plan to compare the algorithm with other power management schemes which employ different load prediction mechanisms. The system model should be extended to deal with a more diversity of workloads and application services, as well as architectures of datacenters for a better simulation of cloud environments. A deployment of the algorithm in real server farms to show its efficiency in a real setting is also worth considering.
ACKNOWLEDGMENT We would like to thank Prof. Rajkumar Buyya and his
group at The University of Melbourne for generously providing the CloudSim and GridSim toolkits with the associated source, examples and documents, on which these experiments were based.
REFERENCES [1] M. Armbrust et al., “Above the Clouds: A Berkeley View of
Cloud computing”, Technical Report No. UCB/EECS-2009-28, University of California at Berkley, 2009.
[2] R. Bianchini and R. Rajamony, “Power and energy management for server systems,” IEEE Computer, vol. 37, no. 11, pp. 68–74, 2004.
[3] EPA Datacenter Report Congress, http://www. energystar.gov/ia/partners/prod_development/downloads/EPA_Datacenter_Report_Congress_Final1.pdf.
[4] Microsoft Environment – The Green Grid Consortium, http://www.microsoft.com/environment/ our_commitment/articles/green_grid.aspx.
[5] T.V.T. Duy, Y. Sato, and Y. Inoguchi, “Improving Accuracy of Host Load Predictions on Computational Grids by
Artificial Neural Networks”, Proc. of the 11th Workshop on Advances in Parallel and Distributed Computational Models, held in conjunction with the 23rd IEEE International Parallel and Distributed Processing Symposium, 2009.
[6] V. Sharma, A. Thomas, T. Abdelzaher, and K. Skadron, “Power-aware QoS Management in Web Servers”, Proc. of the Real-Time Systems Symposium, 2003.
[7] X. Wang and M. Chen, "Cluster-level feedback power control for performance optimization", Proc. of the IEEE 14th International Symposium on High Performance Computer Architecture, 2008.
[8] A. Gandhi, M. Harchol-Balter, R. Das, and C. Lefurgy, "Optimal Power Allocation in Server Farms", Proc. of SIGMETRICS Conference on Measurement and Modeling of Computer Systems, 2009.
[9] D. Meisner, B. T. Gold, and T. F. Wenisch, “PowerNap: Eliminating Server Idle Power”, Proc. of ASPLOS, 2009.
[10] Y. Agarwal et al., “Somniloquy: Augmenting Network Interfaces to Reduce PC Energy Usage”, Proc. of NSDI, 2009.
[11] V. Anagnostopoulou, S. Biswas, A. Savage, R. Bianchini, T. Yang, and F. T. Chong, “Energy Conservation in Datacenters Through Cluster Memory Management and Barely-Alive Memory Servers", Proc. of the Workshop on Energy-Efficient Design, 2009.
[12] K. Rajamani and C. Lefurgy, "On Evaluating Request-Distribution Schemes for Saving Energy in Server Clusters", Proc. of IEEE International Symposium on Performance Analysis of Systems and Software, 2003.
[13] T. Heath, B. Diniz, E.V. Carrera, W. Meira Jr., and R. Bianchini, “Energy Conservation in Heterogeneous Server Clusters”, Proc. of the 10th Symp. on Principles and Practice of Parallel Programming, pp. 186-195, 2005.
[14] S. Srikantaiah, A. Kansal, and F. Zhao, “Energy Aware Consolidation for Cloud Computing”, Proc. of the Workshop on Power-Aware Computing and Systems, 2008.
[15] B. W. Wah, and M. L. Qian, “Constrained formulations and algorithms for predicting stock prices by recurrent FIR neural networks”, International Journal of Information Technology & Decision Making, Vol.5, No. 4 (2006), pp. 639-658.
[16] B. G. Aslan, and M. M. Inceoglu, “A Comparative Study on Neural Network based Soccer Result Prediction”, Proc. of The Seventh International Conference on Intelligent Systems Design and Applications, 2007.
[17] F. Liping, H. Behzad, F. Yumei, and K. Valeri, “Forecasting of Road Surface Temperature Using Time Series, Artificial Neural Networks, and Linear Regression Models”, Transportation Research Board 87th Annual Meeting, 2008.
[18] J. Huang, H. Jin, X. Xie, and Q. Zhang, “Using NARX Neural Network based Load Prediction to Improve Scheduling Decision in Grid Environments”, Proc. of The Third International Conference on Natural Computation, 2007.
[19] R. Buyya, R. Ranjan and R.N. Calheiros, “Modeling and Simulation of Scalable Cloud Computing Environments and the CloudSim Toolkit: Challenges and Opportunities”, Proc. of the 7th High Performance Computing and Simulation Conference, 2009.
[20] R. Buyya and M. Murshed, “GridSim: A Toolkit for the Modeling and Simulation of Distributed Resource Management and Scheduling for Grid Computing”, The Journal of Concurrency and Computation: Practice and Experience (CCPE), Volume 14, Issue 13-15, Wiley Press, 2002.
[21] Traces in the Internet Traffic Archive, http://ita.ee.lbl.gov/html/traces.html
Related Documents