Performance Evaluation for Voice Conversion Systems Todor Ganchev, Alexandros Lazaridis, Iosif Mporas, Nikos Fakotakis Wire Communications Laboratory, Dept. of Electrical and Computer Engineering, University of Patras, 26500, Rion-Patras, Greece [email protected], {alaza, mporas, fakotaki}@upatras.gr Abstract. In the present work, we introduce a new performance evaluation measure for assessing the capacity of voice conversion systems to modify the speech of one speaker (source) so that it sounds as if it was uttered by another speaker (target). This measure relies on a GMM-UBM-based likelihood estimator that estimates the degree of proximity between an utterance of the converted voice and the predefined models of the source and target voices. The proposed approach allows the formulation of an objective criterion, which is applicable for both evaluation of the virtue of a single system and for direct comparison (benchmarking) among different voice conversion systems. To illustrate the functionality and the practical usefulness of the proposed measure, we contrast it with four well-known objective evaluation criteria. Key words: performance evaluation, voice conversion, speaker identification 1 Introduction The automatic modification of the speech signal originating from one speaker (source) so that it sounds as pronounced by another speaker (target) is referred to as voice conversion (VC). The VC process utilizes a small amount of training data from the source and target speakers to create a set of conversion rules. Subsequently, these rules are used to transform other speech, originating from the source speaker, to sound like produced by target speaker [1]. Over the past years various VC methods have been introduced. The separate conversion of the spectral envelope (vocal tract) and the spectral detail (excitation-residual signal) is the most commonly used approach. Research in the field of speaker recognition has shown that, in order to recognize a speaker, the spectral envelope alone contains enough information. In addition, the use of spectral detail in VC systems provides a much more natural sounding speech. Different VC approaches offer different trade-offs. Various subjective and objective evaluation tests have been developed for measuring the VC performance. By using these evaluation measures, either the sound quality of the converted speech or the capacity of a system to convert the identity of the source speaker to the target one, can be assessed. These tests are implemented as subjective listening evaluations (time consuming - expensive) or as objective evaluations (often not accounting for the perceptual quality, not intuitive). Two subjective tests are most often used to evaluate the performance of VC systems. The first one is the force-choice ABX test [2], which assesses the VC

Welcome message from author
This document is posted to help you gain knowledge. Please leave a comment to let me know what you think about it! Share it to your friends and learn new things together.
Transcript
Performance Evaluation for Voice Conversion Systems
Todor Ganchev, Alexandros Lazaridis, Iosif Mporas, Nikos Fakotakis
Wire Communications Laboratory, Dept. of Electrical and Computer Engineering, University of Patras, 26500, Rion-Patras, Greece
[email protected], {alaza, mporas, fakotaki}@upatras.gr
Abstract. In the present work, we introduce a new performance evaluation measure for assessing the capacity of voice conversion systems to modify the speech of one speaker (source) so that it sounds as if it was uttered by another speaker (target). This measure relies on a GMM-UBM-based likelihood estimator that estimates the degree of proximity between an utterance of the converted voice and the predefined models of the source and target voices. The proposed approach allows the formulation of an objective criterion, which is applicable for both evaluation of the virtue of a single system and for direct comparison (benchmarking) among different voice conversion systems. To illustrate the functionality and the practical usefulness of the proposed measure, we contrast it with four well-known objective evaluation criteria.
Key words: performance evaluation, voice conversion, speaker identification
1 Introduction
The automatic modification of the speech signal originating from one speaker (source) so that it sounds as pronounced by another speaker (target) is referred to as voice conversion (VC). The VC process utilizes a small amount of training data from the source and target speakers to create a set of conversion rules. Subsequently, these rules are used to transform other speech, originating from the source speaker, to sound like produced by target speaker [1]. Over the past years various VC methods have been introduced. The separate conversion of the spectral envelope (vocal tract) and the spectral detail (excitation-residual signal) is the most commonly used approach. Research in the field of speaker recognition has shown that, in order to recognize a speaker, the spectral envelope alone contains enough information. In addition, the use of spectral detail in VC systems provides a much more natural sounding speech.
Different VC approaches offer different trade-offs. Various subjective and objective evaluation tests have been developed for measuring the VC performance. By using these evaluation measures, either the sound quality of the converted speech or the capacity of a system to convert the identity of the source speaker to the target one, can be assessed. These tests are implemented as subjective listening evaluations (time consuming - expensive) or as objective evaluations (often not accounting for the perceptual quality, not intuitive).
Two subjective tests are most often used to evaluate the performance of VC systems. The first one is the force-choice ABX test [2], which assesses the VC
2 Todor Ganchev, Alexandros Lazaridis, Iosif Mporas, Nikos Fakotakis
capacity of a system. In this test listeners are presented with stimuli A, B and X and are asked to judge if X sounds closer to A or to B. The second one is the mean opinion score (MOS) test [3], by which the sound quality of the converted speech is evaluated in a 5-point scale (5: excellent, 4: good, 3: fair, 2: poor, 1: bad).
In addition, there are various objective performance metrics, which estimate the differences among the source, target and converted speech signals. Two of the most frequently used measures are the signal-to-noise ratio (SNR) and the relative spectral distortion (SD). The SNR estimates the ratio between the energy of the transformed speech and the energy of the difference between the transformed and the target speech. The latter one measures the distance between the converted speech and the target speech in contrast to the distance between the source speech and the target speech. This objective error has been used with different interpretations, such as: log spectral distance, magnitude spectral distance or spectral distance between feature vectors (e.g. Mel-Frequency Cepstral Coefficients).
In the present work, we introduce a new objective measure for the assessment of the capacity of VC systems. Based on GMM-UBM estimator, the proposed approach defines a normalized performance evaluation metric. Using the proposed evaluation measure, assessment of the performance of a single VC system or a direct comparison (benchmarking) among multiple systems can be performed.
Our work bears some resemblance with [4], in which a speaker identification (SID) approach is used so as to evaluate the quality of the converted voice. However, in the present development the speaker models are built and used in a different manner, which results in a more appropriate and intuitive performance estimation measure.
2 Related Work
A common evaluation measure in the area of speech processing is the signal-to-noise ratio (SNR). The segmental SNR is defined as the ratio between the energy of the target signal and the energy of the difference between the converted and target signals for the m th frame. Measured on a dB-scale, the SNR is defined as:
( )( )
2
2 2
2
110 2
1
( )
( ) ( ), 10log
j
j j
N m n Ntn
N m n N m n Nc tn
H e
H e H eSNR t c
π
π π
=
=
=−
∑∑
(1)
where N is the size of the Fourier transform 2( )j n NH e π , t is the original target speech signal and c is the converted speech signal. Higher values for the SNR indicate a better VC system.
One of the most commonly used objective error measures is the spectral distortion (SD) between two speech signals. The spectral distortion error ( , )SDE A B between the spectra of two signals A and B is defined as:
( )2
2 210 10
1 1
1 1( , ) 20log ( ) 20log ( )M N
m j n N m j n NSD A B
m nE A B H e H e
M Nπ π
= == −∑ ∑ . (2)
Here M is the number of frames and N is the size of the Fourier transform 2( )j n NH e π
Performance Evaluation for Voice Conversion Systems 3
computed for each segment m of the signal. In order to fulfil the need of having a normalized error across different speaker
combinations, Kain [5] established an error metric referred to as performance index, SDP , which is defined as:
( )( )
( ), ( )1
( ), ( )SD
SDSD
E t n c nP
E t n s n= − (3)
Here ( , )SDE t c is the spectral distortion error (2) between the target and the converted speech, and ( , )SDE t s is the spectral distortion error between the target and the source speech.
In [4], the author employed a SID system to assess the outcome of VC. Specifically, the author assumed that if a SID system can select the target over the source speaker it means that the VC is successful. According to [4], for a given input utterance X, the log-likelihood ratio of the target speaker to the source speaker is estimated as:
( )( ) ( ) ( )|
log log | log ||
tst t s
s
p Xp X p X
p Xλ
θ λ λλ
= = − (4)
Here tλ and sλ are the target and the source speaker models, respectively. A good VC system is characterized by positive values of stθ , and a negative value of stθ indicates a poor VC system.
3 The Proposed Performance Measure
Following the operation logic of the subjective force choice ABX test [2], we propose a related objective evaluation of the VC capacity that we refer to as objective ABX test. Specifically, by estimating the degree of match between the predefined speaker models and samples of the converted (X), source (A) and target (B) voices, we are able to assess the degree of success in the transformation from voice A to B. This scheme allows evaluating the capacity of a single VC system, or comparing the VC performance among different systems (i.e. benchmarking of VC systems.)
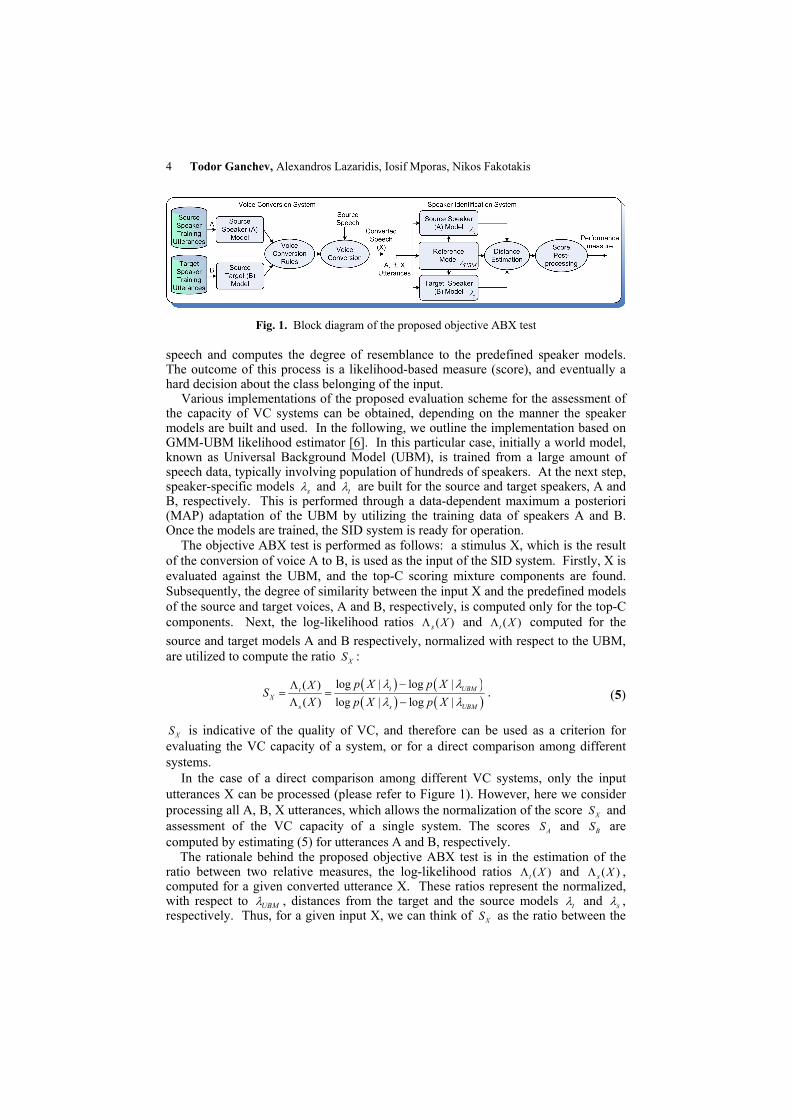
The overall idea of the proposed objective ABX test is presented in Figure 1. Specifically, the left part of the figure illustrates the VC process and the right one the SID process. During the training phase, the VC system builds models for the source and target speakers which serve for deriving the VC rules. During the operation of the VC system, these rules are utilized for the transformation of the source speech, which results to the converted speech X. For a good VC system it is expected that the characteristics of speech utterance X will match those of the target speaker B.
The SID process relies on predefined speaker models A, B and a reference model that are built during the training phase. The reference model, which represents the world of all speakers, is trained from large speech corpora (hundreds or thousands of speakers) and should be general enough not to interfere with the individual models of the target speakers. The speaker-specific individual models can be trained from the same training datasets, once used for training the models of the VC system or from another representative dataset. During operation, the SID system processes the input
4 Todor Ganchev, Alexandros Lazaridis, Iosif Mporas, Nikos Fakotakis
speech and computes the degree of resemblance to the predefined speaker models. The outcome of this process is a likelihood-based measure (score), and eventually a hard decision about the class belonging of the input.
Various implementations of the proposed evaluation scheme for the assessment of the capacity of VC systems can be obtained, depending on the manner the speaker models are built and used. In the following, we outline the implementation based on GMM-UBM likelihood estimator [6]. In this particular case, initially a world model, known as Universal Background Model (UBM), is trained from a large amount of speech data, typically involving population of hundreds of speakers. At the next step, speaker-specific models sλ and tλ are built for the source and target speakers, A and B, respectively. This is performed through a data-dependent maximum a posteriori (MAP) adaptation of the UBM by utilizing the training data of speakers A and B. Once the models are trained, the SID system is ready for operation.
The objective ABX test is performed as follows: a stimulus X, which is the result of the conversion of voice A to B, is used as the input of the SID system. Firstly, X is evaluated against the UBM, and the top-C scoring mixture components are found. Subsequently, the degree of similarity between the input X and the predefined models of the source and target voices, A and B, respectively, is computed only for the top-C components. Next, the log-likelihood ratios ( )Λs X and ( )Λt X computed for the source and target models A and B respectively, normalized with respect to the UBM, are utilized to compute the ratio XS :
( ) ( )( ) ( )
log | log |( )( ) log | log |
t UBMtX
s s UBM
p X p XXSX p X p X
λ λλ λ
−Λ= =Λ −
. (5)
XS is indicative of the quality of VC, and therefore can be used as a criterion for evaluating the VC capacity of a system, or for a direct comparison among different systems.
In the case of a direct comparison among different VC systems, only the input utterances X can be processed (please refer to Figure 1). However, here we consider processing all A, B, X utterances, which allows the normalization of the score XS and assessment of the VC capacity of a single system. The scores AS and BS are computed by estimating (5) for utterances A and B, respectively.
The rationale behind the proposed objective ABX test is in the estimation of the ratio between two relative measures, the log-likelihood ratios ( )t XΛ and ( )s XΛ , computed for a given converted utterance X. These ratios represent the normalized, with respect to UBMλ , distances from the target and the source models tλ and sλ , respectively. Thus, for a given input X, we can think of XS as the ratio between the
Fig. 1. Block diagram of the proposed objective ABX test
Performance Evaluation for Voice Conversion Systems 5
distances to the target and source models. Evaluating (5) for a large number of utterances X allows improving the robustness
of the performance estimation. Computing the mean value and the standard deviation of the resulting XS scores provides the ground for fair judgment of the VC capacity for a given method or for comparison among methods. Normalizing the distance between the means of the XS distributions for the target and converted utterances with respect to the distance between the centres of the distributions for the source and target utterances leads to a more intuitive performance measure, which we have named NORMD :
t XNORM
t s
D µ µµ µ−
=−
. (6)
Here sµ , tµ and Xµ are the mean values of the distributions for the scores AS , BS and XS , respectively. [0, 1]NORMD ∈ , where value 0NORMD = means a very good VC system (the distribution of XS scores for the converted voice has the same mean value as the one for the target voice). In opposite, value 1NORMD = indicates useless VC system – the transformed voice has the same mean value of the score distribution as the source voice.
4 Experimental Setup
The proposed evaluation methodology is illustrated by experimenting with two voice conversion algorithms, namely, the (i) vocal tract length normalization (VTLN) [7] and (ii) spectral envelope GMM mapping [8] in combination with residual prediction model [9]. These methods were chosen as they are illustrative for the VC capacity of two different VC approaches. The first method is based on VTLN approach performed in the frequency domain (FD-VTLN), which aims at warping the frequency axis of the phase and magnitude spectrum. The second one is based on a probabilistic approach using GMM, describing and mapping the source and target feature distributions. In the remaining of this work, we will refer to these algorithms as to voice conversion system 1 (VC system 1) and voice conversion system 2 (VC system 2), respectively.
In the present experimental setup, we consider male-to-male VC. Specifically, utilizing the CMU Arctic database [10], we performed conversion from voice bdl to voice rms. The VC models were trained with 25 sentences from each speaker. Once the two VC systems were trained, we processed another 100 files for each of the two VC algorithms. These datasets served as the test sentences, X, during the evaluation process.
The speech parameterization for the SID process is based on a frame size of 40 milliseconds. The feature vector consists of 40 MFCC coefficients [11], log-energy, and the minlog( )f f− . Here f is the fundamental frequency estimated through the autocorrelation-based algorithm [12], and the constant fmin =55 Hz is the smallest value of the fundamental frequency that the pitch estimation algorithm can detect for the specified frame size. The speech parameters were estimated 100 times per second.
For the SID systems, we have built the UBMλ model from all utterances of the first 100 male speakers from the training set of the TIMIT [13] database. The speaker-
6 Todor Ganchev, Alexandros Lazaridis, Iosif Mporas, Nikos Fakotakis
specific models sλ and tλ were obtained through MAP adaptation on the UBM. In both cases the MAP adaptation was performed by using the same 25 sentences that were used earlier for training the VC systems. The size of the training dataset was found to affect the quality of the models, but no influence from the actual selection of training utterances was observed.
The UBMλ and the speaker-specific models sλ and tλ have size of 256 components. After the evaluation of the input utterance against the entire UBM, only the indexes of the top-5 components (C=5) were fed to the speaker-specific models.
5 Experiments and Results
In order to contrast the operation of the proposed objective ABX test with other objective evaluation measures, we firstly compare it to the SID method used in [4]. Afterwards, we perform a comparison to other widely-used objective quality assessment measures, presented in Section 2. In all experimentations we employ the two VC systems mentioned in Section 4, namely VC systems 1 and 2, and use the same sets of one hundred test utterances A, B and X.
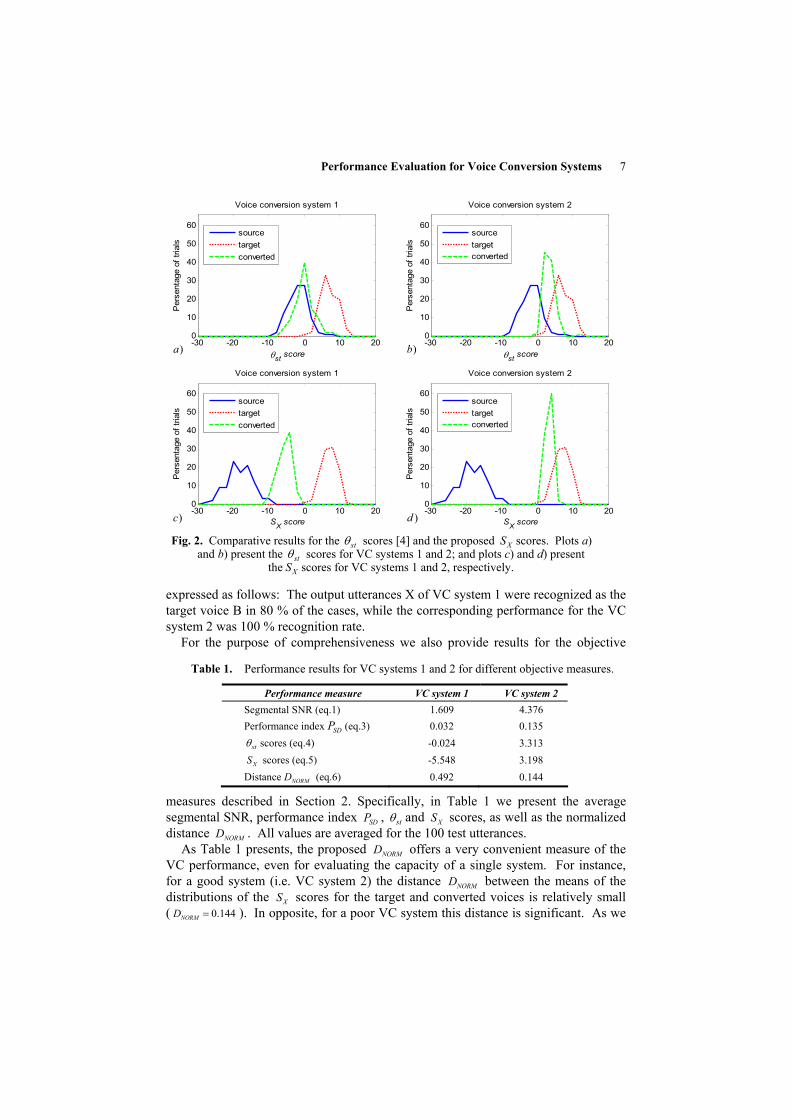
In Figure 2 we present performance comparison between the two VC systems of interest in terms of the stθ scores [4] and the proposed XS measure. Specifically, in Figure 2 a) and b) we present the distributions of the stθ scores for the converted speech X (dashed green line) for the two VC systems, 1 and 2, respectively. Although a direct comparison of the VC capacity of the two systems can be performed solely on the basis of the distributions obtained for the X utterances, for the purpose of better illustration we also present the distributions for the source and target utterances, A and B, respectively, when scored against the model built for the target voice B. In Figure 2 a) and b) these are plotted with solid blue line for the source A and dotted red line for the target B, respectively. As plots 2 a) and 2 b) present, the VC system 2 has distribution of the stθ scores closer to that of the target, and therefore it demonstrates higher VC capacity. However, since the distributions of scores for the source and target voices overlap, the resolution of this setup is not advantageous, and the stθ scores are not very intuitive.
In Figure 2 c) and 2 d) we present the distributions of the XS scores obtained for all X utterances for the VC systems 1 and 2, respectively. Again although the VC capacity of these systems can be judged directly by comparing the distributions of the
XS scores (dashed green line), we present also the distributions obtained for the source and target utterances, A and B, respectively. As plots 2 c) and 2 d) present the distributions of scores for the source and target utterances do not overlap. This is due to the advantage that the reference model UBMλ provides. Specifically, instead of computing the ratio between the likelihoods obtained for models sλ and tλ (as it is done in [4]), in the proposed method we compute the ratio between the normalized, with respect to UBMλ log-likelihood, ratios. This permits better resolution of the experimental setup, and therefore, better resolution of the measure of the VC capacity.
As plots 2 c) and 2 d) present the VC system 2 offers significantly better performance, when compared to VC system 1. In terms of SID performance this is
Performance Evaluation for Voice Conversion Systems 7
expressed as follows: The output utterances X of VC system 1 were recognized as the target voice B in 80 % of the cases, while the corresponding performance for the VC system 2 was 100 % recognition rate.
For the purpose of comprehensiveness we also provide results for the objective
measures described in Section 2. Specifically, in Table 1 we present the average segmental SNR, performance index SDP , stθ and XS scores, as well as the normalized distance NORMD . All values are averaged for the 100 test utterances.
As Table 1 presents, the proposed NORMD offers a very convenient measure of the VC performance, even for evaluating the capacity of a single system. For instance, for a good system (i.e. VC system 2) the distance NORMD between the means of the distributions of the XS scores for the target and converted voices is relatively small ( 0.144=NORMD ). In opposite, for a poor VC system this distance is significant. As we
Table 1. Performance results for VC systems 1 and 2 for different objective measures.
Performance measure VC system 1 VC system 2 Segmental SNR (eq.1) 1.609 4.376 Performance index SDP (eq.3) 0.032 0.135
stθ scores (eq.4) -0.024 3.313
XS scores (eq.5) -5.548 3.198 Distance NORMD (eq.6) 0.492 0.144
-30 -20 -10 0 10 200
10
20
30
40
50
60
Voice conversion system 2
θst score
Per
sent
age
of tr
ials
-30 -20 -10 0 10 200
10
20
30
40
50
60
Voice conversion system 1
θst score
Per
sent
age
of tr
ials
-30 -20 -10 0 10 200
10
20
30
40
50
60
Voice conversion system 2
SX score
Per
sent
age
of tr
ials
-30 -20 -10 0 10 200
10
20
30
40
50
60
Voice conversion system 1
SX score
Per
sent
age
of tr
ials
sourcetargetconverted
sourcetargetconverted
sourcetargetconverted
sourcetargetconverted
)a )b
)c )d Fig. 2. Comparative results for the stθ scores [4] and the proposed XS scores. Plots a)
and b) present the stθ scores for VC systems 1 and 2; and plots c) and d) present the XS scores for VC systems 1 and 2, respectively.
8 Todor Ganchev, Alexandros Lazaridis, Iosif Mporas, Nikos Fakotakis
can see in Figure 2 c), the distribution of the XS scores for VC system 1 is midway ( 0.492NORMD = ) the distance between the distributions of the source and target. Thus, VC system 1 preserves much of the characteristics of the source voice.
6 Conclusion
We proposed a new methodology for objective evaluation of the capacity of VC systems referred to as objective ABX test. This method resulted in an intuitive performance measure NORMD that represents the normalized distance between the distributions of the XS scores for the target and converted voices. The NORMD measure is convenient for evaluating the capacity of a single voice conversion system, or for direct comparison among different systems. Acknowledgments. This work was supported by the PlayMancer project (FP7-ICT-215839-2007), which is funded by the European Commission.
References
1. Abe, M., Nakamura, S., Shikano, K., Kuwabara, H.: VC through vector quantization, In: Proc. ICASSP1988, USA, 655--658, (1988). 2. Kreiman, J., Papcun, G.: Comparing, discrimination and recognition of unfamiliar voices. Speech Communication, 10, 3, 265--275, (1991). 3. Methods for subjective determination of transmission quality, Tech. Rep. ITU-T Recommendation P.800, ITU, Switzerland, (1996). 4. Arslan, L.M.: Speaker transformation algorithm using segmental codebooks (STASC). Speech Communication, 28, 3, 211--226, (1999). 5. Kain, A.: High resolution voice transformation. Ph.D. dissertation, OGI, Portland, USA, (2001). 6. Reynolds, D.A., Quatieri, T.F., Dunn, R.B.: Speaker verification using adapted Gaussian mixture models. Digital Signal Processing, 10, 1-3, 19--41, (2000). 7. Sündermann, D., Ney, H., Höge, H.: VTLN-based cross-language voice conversion, In: Proc. ASRU 2003, USA, 676--681, (2003). 8. Stylianou, Y., Cappé, O., Moulines, E.: Continuous probabilistic transform for voice conversion. IEEE Trans. Speech and Audio Processing, 6, 2, 131--142, (1998). 9. Sündermann, D., Bonafonte, A., Ney, H., Höge, H.: A study on residual prediction techniques for voice conversion. In: Proc. ICASSP 2005, USA, Vol. 1, 13--16, (2005). 10. Kominek, J., Black, A.: The CMU ARCTIC speech databases for speech synthesis research. Technical Report CMU-LTI-03-177, Carnegie Mellon University, Pittsburgh, PA, (2003). 11. Slaney, M.: Auditory toolbox. Version 2. Technical Report #1998-010, Interval Research Corporation, (1998). 12. Rabiner, L.R., Cheng, M.J., Rosenberg, A.E., McGonegal, C.A.: A comparative performance study of several pitch detection algorithms. IEEE Trans. Acoust. Speech & Signal Proc., 24, 5, 399--418, (1976). 13. Garofolo, J.: Getting started with the DARPA-TIMIT CD-ROM: An acoustic phonetic continuous speech database. National Institute of Standards and Technology (NIST), USA, (1998).
Related Documents