1 Performance Comparison of Cray X1 and Cray Opteron Cluster with Other Leading Platforms Using HPCC and IMB Benchmarks Rolf Rabenseifner Subhash Saini 1 , Rolf Rabenseifner 3 , Brian T. N. Gunney 2 , Thomas E. Spelce 2 , Alice Koniges 2 , Don Dossa 2 , Panagiotis Adamidis 3 , Robert Ciotti 1 , Sunil R. Tiyyagura 3 , Matthias Müller 4 , and Rod Fatoohi 5 1 NASA Advanced Supercomputing (NAS) Division NASA Ames Research Center, Moffett Field, California 2 Lawrence Livermore National Laboratory 3 High Performance Computing Center Stuttgart (HLRS) 4 ZIH, TU Dresden; 5 San Jose State University CUG 2006, May 2006 2 / 47 Outline Computing platforms Columbia System (NASA, USA) Cray Opteron Cluster (NASA, USA) Dell POWER EDGE (NCSA, USA) NEC SX-8 (HLRS, Germany) Cray X1 (NASA, USA) IBM Blue Gene/L Benchmarks HPCC Benchmark suite (measurements on 1 st four platforms) IMB Benchmarks (measurements on 1 st five platforms) Balance analysis based on publicly available HPCC data Summary

Welcome message from author
This document is posted to help you gain knowledge. Please leave a comment to let me know what you think about it! Share it to your friends and learn new things together.
Transcript
1
Performance Comparison of Cray X1 and Cray Opteron Cluster with Other Leading
Platforms Using HPCC and IMB Benchmarks
Rolf RabenseifnerSubhash Saini1, Rolf Rabenseifner3, Brian T. N. Gunney2, Thomas E. Spelce2,
Alice Koniges2, Don Dossa2, Panagiotis Adamidis3, Robert Ciotti1, Sunil R. Tiyyagura3, Matthias Müller4, and Rod Fatoohi5
1NASA Advanced Supercomputing (NAS) DivisionNASA Ames Research Center, Moffett Field, California
2Lawrence Livermore National Laboratory3High Performance Computing Center Stuttgart (HLRS)
4ZIH, TU Dresden; 5San Jose State University
CUG 2006, May 2006
2 / 47
Outline
� Computing platforms� Columbia System (NASA, USA)� Cray Opteron Cluster (NASA, USA) � Dell POWER EDGE (NCSA, USA)� NEC SX-8 (HLRS, Germany)� Cray X1 (NASA, USA)� IBM Blue Gene/L
� Benchmarks� HPCC Benchmark suite (measurements on 1st four platforms)� IMB Benchmarks (measurements on 1st five platforms)� Balance analysis based on publicly available HPCC data
� Summary
2
3 / 47
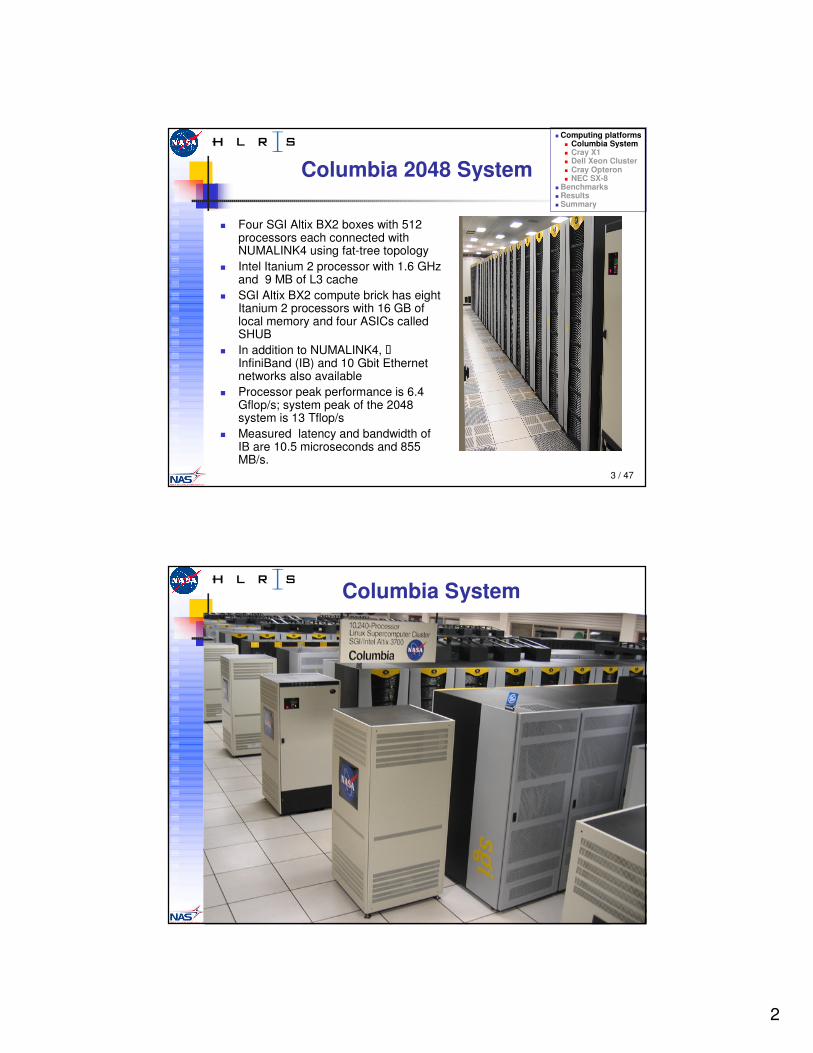
Columbia 2048 System
� Four SGI Altix BX2 boxes with 512 processors each connected with NUMALINK4 using fat-tree topology
� Intel Itanium 2 processor with 1.6 GHz and 9 MB of L3 cache
� SGI Altix BX2 compute brick has eight Itanium 2 processors with 16 GB of local memory and four ASICs called SHUB
� In addition to NUMALINK4, �InfiniBand (IB) and 10 Gbit Ethernet networks also available
� Processor peak performance is 6.4 Gflop/s; system peak of the 2048 system is 13 Tflop/s
� Measured latency and bandwidth of IB are 10.5 microseconds and 855 MB/s.
� Computing platforms� Columbia System� Cray X1 � Dell Xeon Cluster � Cray Opteron � NEC SX-8
� Benchmarks� Results� Summary
4 / 47
Columbia System
3
5 / 47
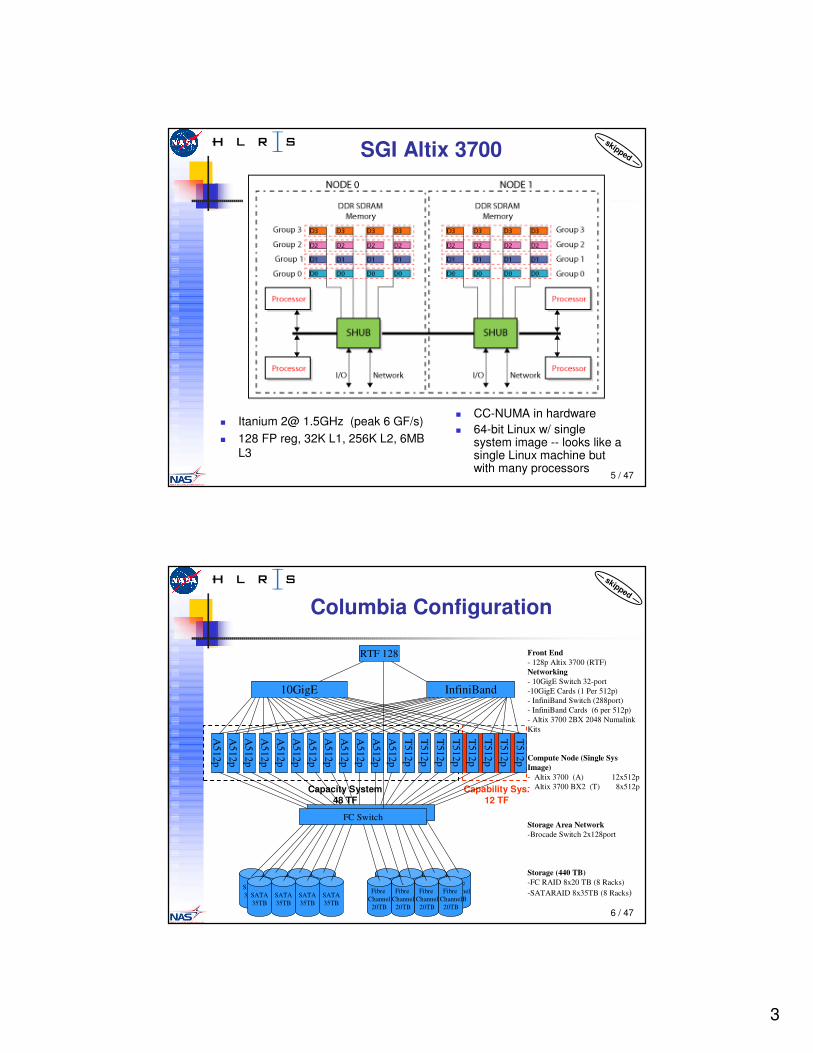
SGI Altix 3700
� Itanium 2@ 1.5GHz (peak 6 GF/s) � 128 FP reg, 32K L1, 256K L2, 6MB
L3
� CC-NUMA in hardware � 64-bit Linux w/ single
system image -- looks like a single Linux machine but with many processors
—skipped —
6 / 47
Columbia Configuration
Capability Sys.12 TF
Capacity System48 TF
T512p
Front End- 128p Altix 3700 (RTF)Networking- 10GigE Switch 32-port-10GigE Cards (1 Per 512p)- InfiniBand Switch (288port)- InfiniBand Cards (6 per 512p)- Altix 3700 2BX 2048 Numalink Kits
Compute Node (Single Sys Image)- Altix 3700 (A) 12x512p - Altix 3700 BX2 (T) 8x512p
Storage Area Network-Brocade Switch 2x128port
Storage (440 TB)-FC RAID 8x20 TB (8 Racks)-SATARAID 8x35TB (8 Racks)
A512p
A512p
A512p
A512p
A512p
A512p
A512p
A512p
A512p
A512p
A512p
A512p
T512pT512pT512pT512pT512p
T512pT512p
RTF 128
SATA35TB
Fibre Channel
20TB
SATA35TB
SATA35TB
SATA35TBSATA
35TBSATA35TB
SATA35TB
SATA35TB
FC Switch 128pFC Switch
Fibre Channel
20TB
Fibre Channel
20TB
Fibre Channel
20TBFibre
Channel20TB
Fibre Channel
20TB
Fibre Channel
20TB
Fibre Channel
20TB
InfiniBand10GigE
—skipped —
4
7 / 47
• New Cray Vector Instruction Set Architecture (ISA) • 64- and 32-bit operations, IEEE floating-point
Each Stream:• 2 vector pipes
(32 vector regs.of 64 element ea)
• 64 A & S regs.• Instruction &
data cache
MSP:• 4 x P-chips• 4 x E-chips (cache)
Single-streamingprocessor
#1
2 MB E-cache
Bandwidth per CPU• Up to 76.8 GB/sec read/write to cache• Up to 34.1 GB/sec read/write to memory
Single-streamingprocessor
#2
Single-streamingprocessor
#3
Single-streamingprocessor
#4
Cray X1 CPU: Multistreaming Processor
� Computing platforms� Columbia System� Cray X1 � Dell Xeon Cluster� Cray Opteron � NEC SX-8
� Benchmarks� Results� Summary
8 / 47
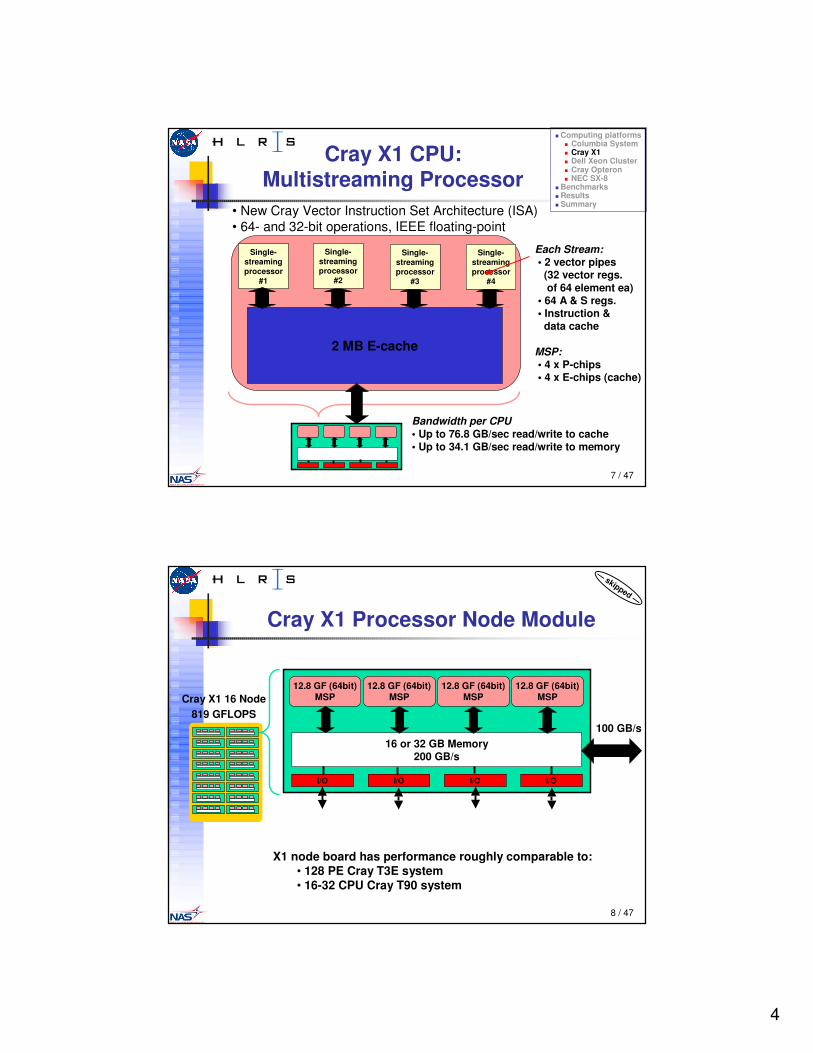
Cray X1 Processor Node Module
16 or 32 GB Memory200 GB/s
12.8 GF (64bit)MSP
I/O I/O I/O I/O
X1 node board has performance roughly comparable to: • 128 PE Cray T3E system • 16-32 CPU Cray T90 system
100 GB/s
12.8 GF (64bit)MSP
12.8 GF (64bit)MSP
12.8 GF (64bit)MSPCray X1 16 Node
819 GFLOPS
—skipped —

5
9 / 47
Cray X1 Node - 51.2 Gflop/s
Interconnect network2 ports/M-chip1.6 GB/s/port peak in each direction
= 102.4 GB/s to the network
Local memoryPeak BW = 16 sections x 12.8 GB/s/section = 204.8 GB/sCapacity = 16, 32 or 64 GB
2x2x1.6 GB/s ���� 102.4 GB/s
12.8 GF (64bit)MSP CPU
12.8 GF (64bit)MSP CPU
12.8 GF (64bit)MSP CPU
Local Memory (Up to 64 GB, 16 sections)
M0 M10 M15M14M13M12M11M1 M2 M3 M4 M5 M6 M7 M8 M9
Cache 2.0 MB
Cache 2.0 MB
12.8 GF (64bit)MSP CPU
Cache 2.0 MB
Cache 2.0 MB
10 / 47
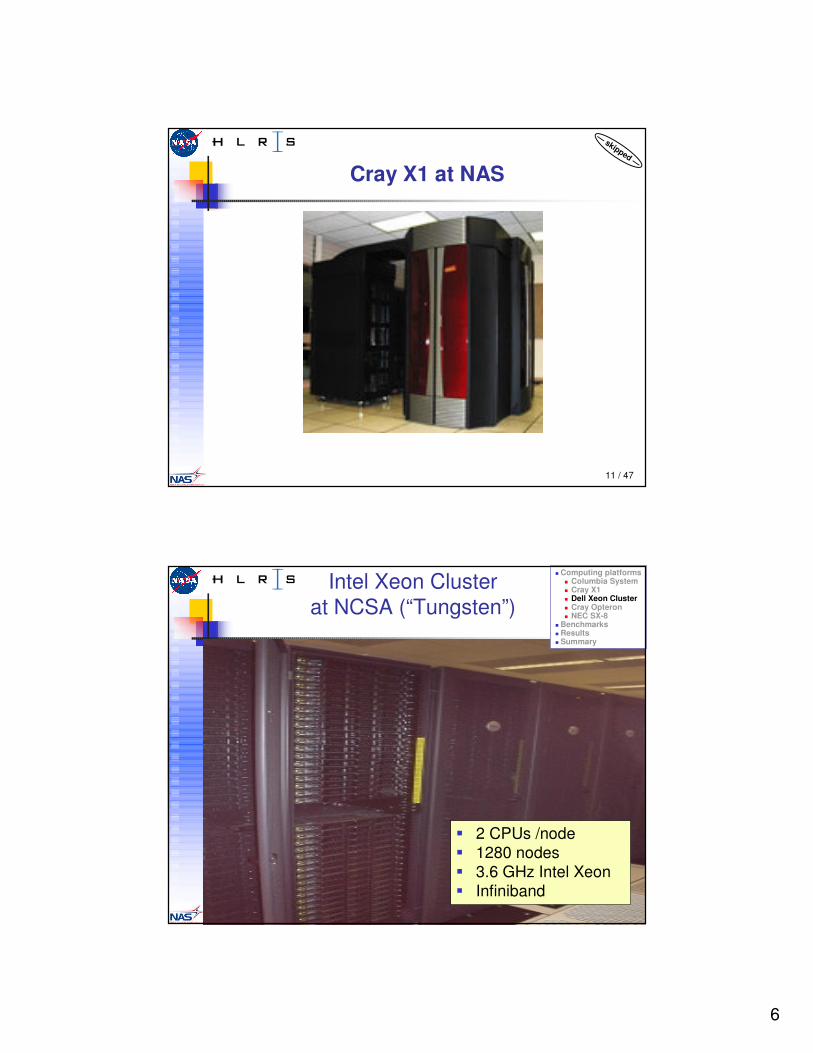
Cray X1 at NAS
� Architecture� 4 nodes, 16 MSPs (64 SSPs)� 1 node reserved for system;
3 nodes usable for user codes� 1 MSP: 4 SSPs at 800 MHz, 2 MB ECache
12.8 Gflops/s peak� 64 GB main memory;
4 TB FC RAID
� Operating Environment� Unicos MP 2.4.3.4� Cray Fortran and C 5.2� PBSPro job scheduler
QuickTime™ and aTIFF (Uncompressed) decompressor
are needed to see this picture.
6
11 / 47
Cray X1 at NAS
—skipped —
12 / 47
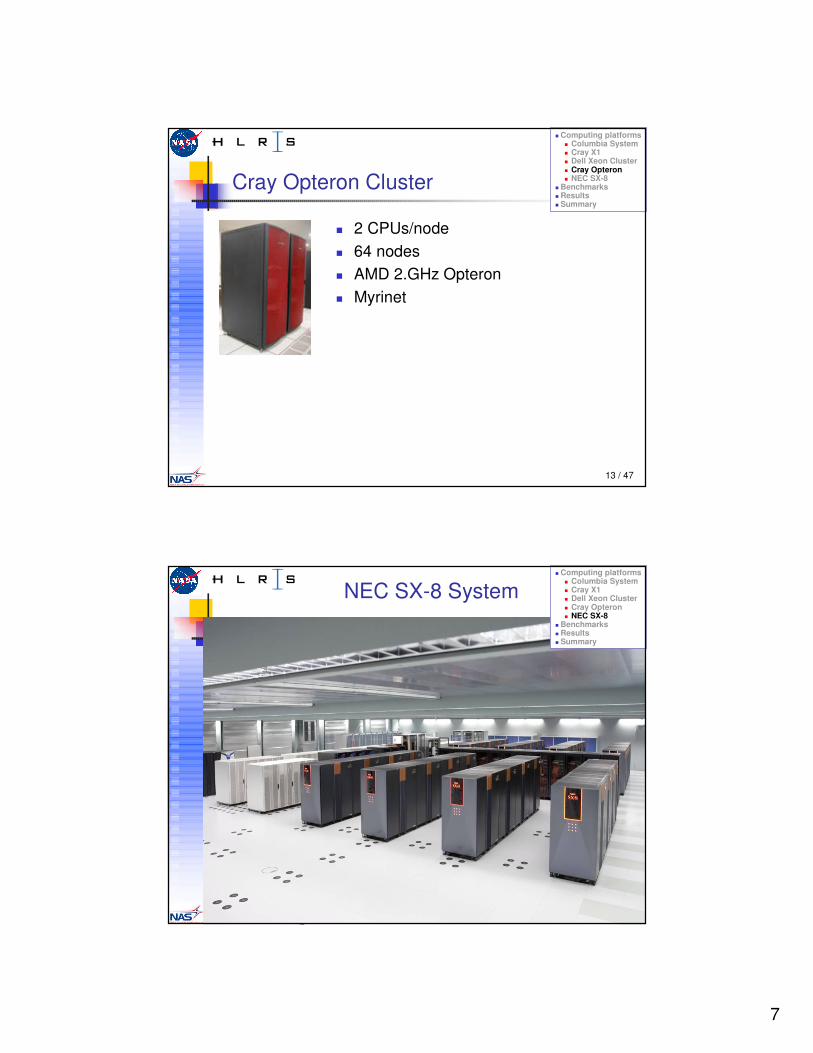
Intel Xeon Cluster at NCSA (“Tungsten”)
� 2 CPUs /node� 1280 nodes� 3.6 GHz Intel Xeon� Infiniband
� Computing platforms� Columbia System� Cray X1 � Dell Xeon Cluster� Cray Opteron � NEC SX-8
� Benchmarks� Results� Summary
7
13 / 47
Cray Opteron Cluster
� 2 CPUs/node� 64 nodes� AMD 2.GHz Opteron� Myrinet
� Computing platforms� Columbia System� Cray X1 � Dell Xeon Cluster� Cray Opteron� NEC SX-8
� Benchmarks� Results� Summary
14 / 47
NEC SX-8 System� Computing platforms
� Columbia System� Cray X1 � Dell Xeon Cluster� Cray Opteron � NEC SX-8
� Benchmarks� Results� Summary
8
15 / 47
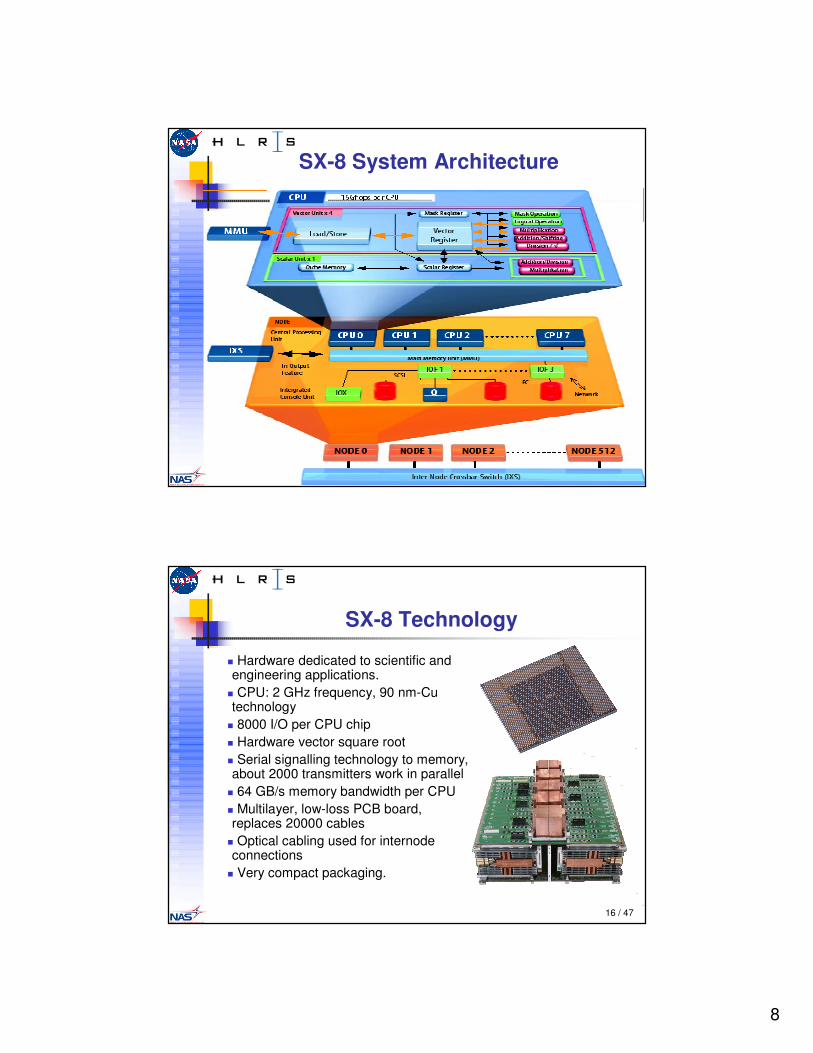
SX-8 System Architecture
16 / 47
SX-8 Technology
� Hardware dedicated to scientific and engineering applications.
� CPU: 2 GHz frequency, 90 nm-Cu technology
� 8000 I/O per CPU chip � Hardware vector square root� Serial signalling technology to memory, about 2000 transmitters work in parallel
� 64 GB/s memory bandwidth per CPU� Multilayer, low-loss PCB board, replaces 20000 cables
� Optical cabling used for internode connections
� Very compact packaging.
9
17 / 47
SX-8 specifications
� 16 GF / CPU (vector)� 64 GB/s memory bandwidth
per CPU� 8 CPUs / node� 512 GB/s memory bandwidth per node� Maximum 512 nodes� Maximum 4096 CPUs,
max 65 TFLOPS � Internode crossbar Switch� 16 GB/s (bi-directional) interconnect
bandwidth per node� @ HLRS: 72 nodes = 576 CPUs = 9 Tflop/s (vector)
(12 Tflop/s (total peak)
18 / 47
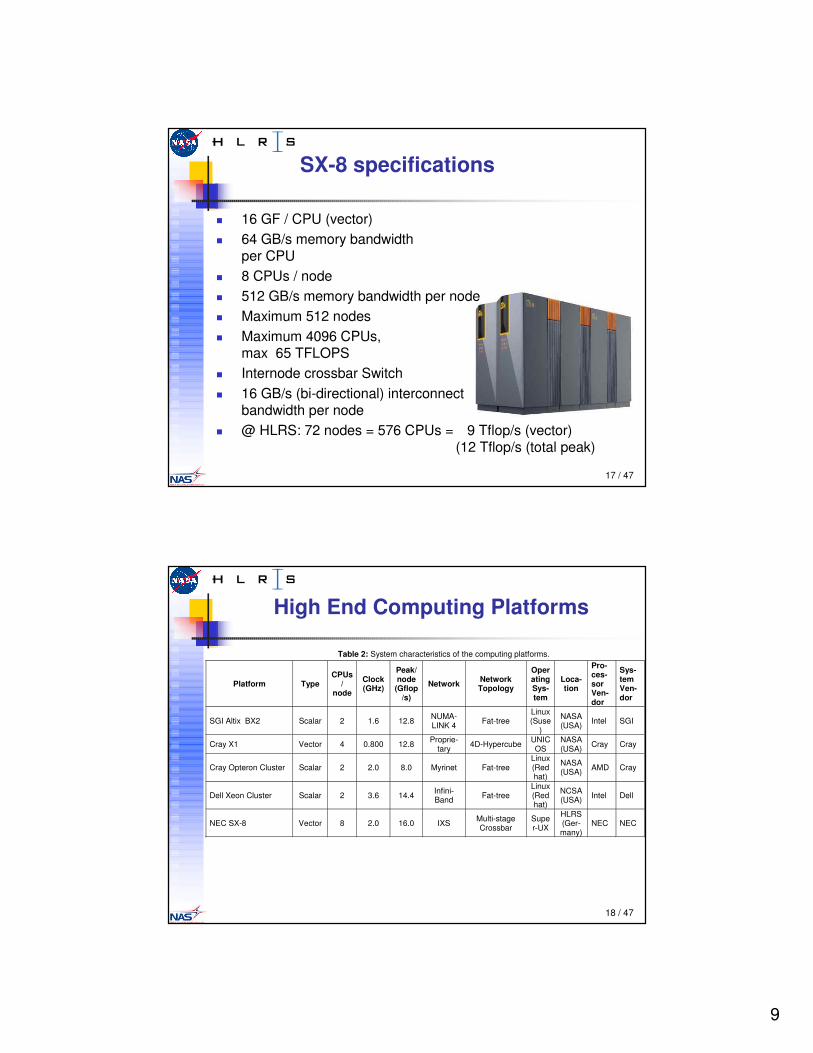
High End Computing Platforms
Table 2: System characteristics of the computing platforms.
Platform Type CPUs
/ node
Clock (GHz)
Peak/node
(Gflop/s)
Network Network Topology
Operating Sys-tem
Loca-tion
Pro-ces-sor Ven-dor
Sys-tem Ven-dor
SGI Altix BX2 Scalar 2 1.6 12.8 NUMA-LINK 4 Fat-tree
Linux (Suse
)
NASA (USA) Intel SGI
Cray X1 Vector 4 0.800 12.8 Proprie-tary 4D-Hypercube UNIC
OS NASA (USA) Cray Cray
Cray Opteron Cluster Scalar 2 2.0 8.0 Myrinet Fat-tree Linux (Redhat)
NASA (USA) AMD Cray
Dell Xeon Cluster Scalar 2 3.6 14.4 Infini-Band Fat-tree
Linux (Redhat)
NCSA (USA) Intel Dell
NEC SX-8 Vector 8 2.0 16.0 IXS Multi-stage Crossbar
Super-UX
HLRS (Ger-many)
NEC NEC
10
19 / 47
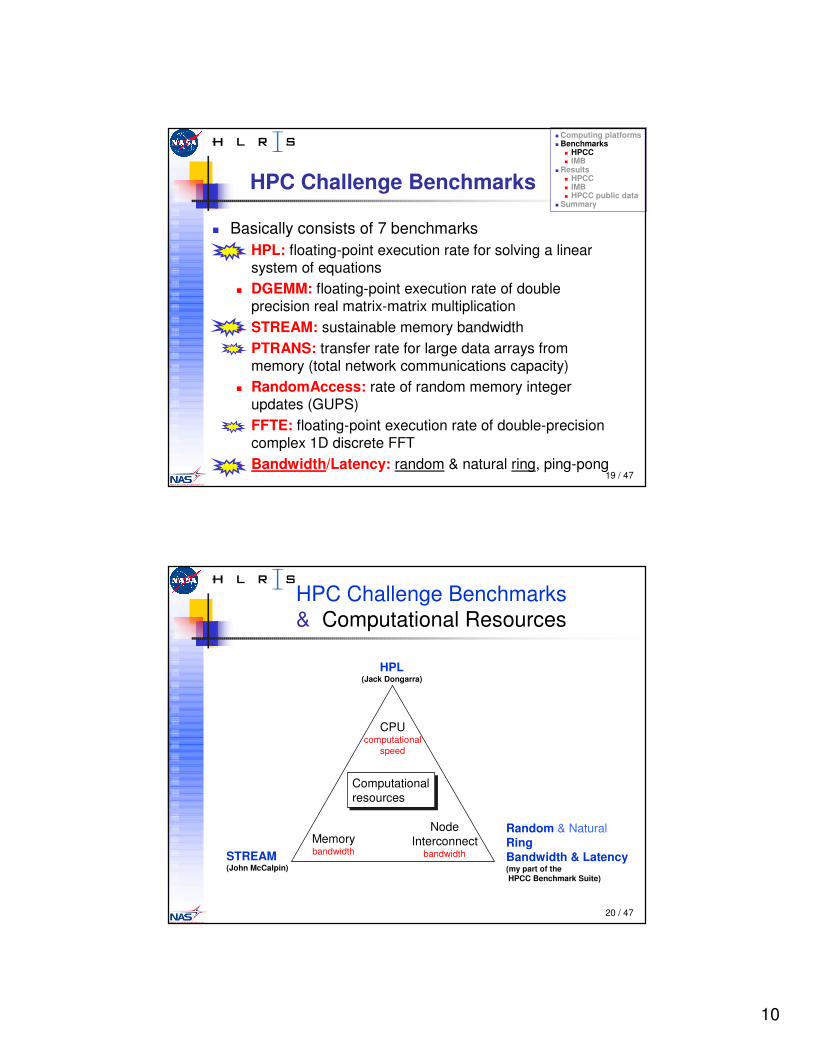
HPC Challenge Benchmarks
� Basically consists of 7 benchmarks� HPL: floating-point execution rate for solving a linear
system of equations� DGEMM: floating-point execution rate of double
precision real matrix-matrix multiplication � STREAM: sustainable memory bandwidth� PTRANS: transfer rate for large data arrays from
memory (total network communications capacity)� RandomAccess: rate of random memory integer
updates (GUPS)� FFTE: floating-point execution rate of double-precision
complex 1D discrete FFT� Bandwidth/Latency: random & natural ring, ping-pong
� Computing platforms� Benchmarks
� HPCC � IMB
� Results� HPCC � IMB� HPCC public data
� Summary
20 / 47
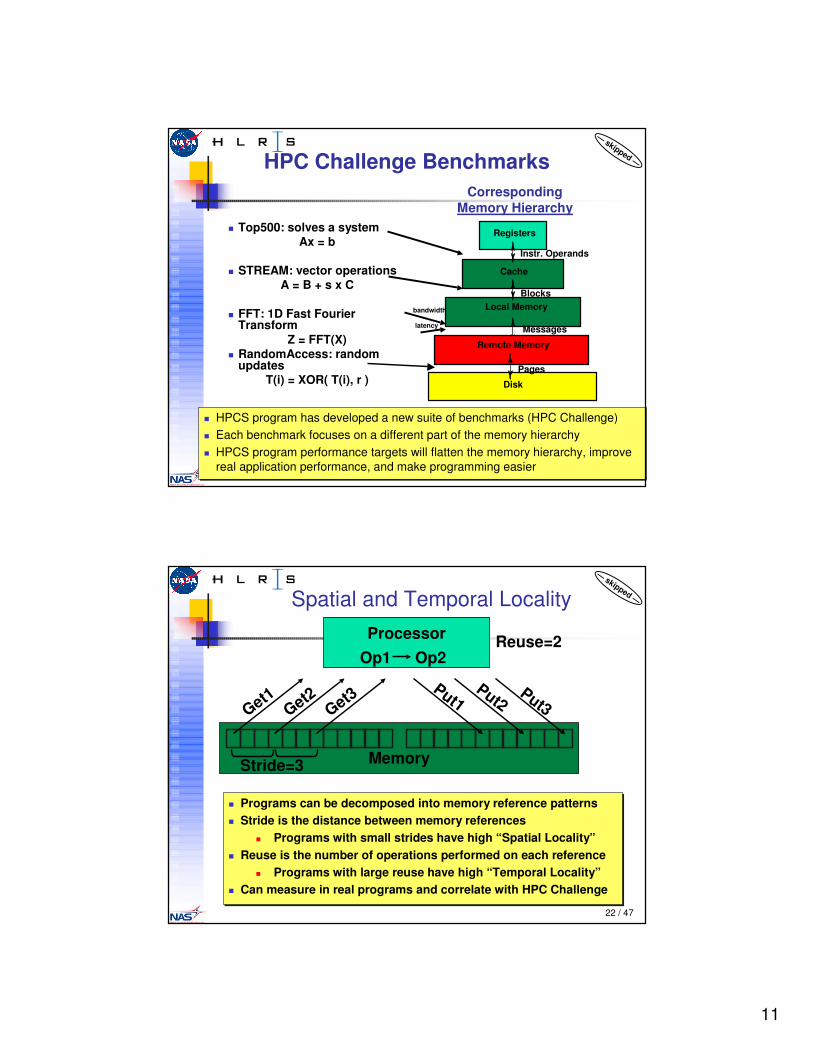
HPC Challenge Benchmarks& Computational Resources
Computational resourcesComputational resources
CPUcomputational
speed
Memorybandwidth
NodeInterconnect
bandwidth
HPL(Jack Dongarra)
STREAM(John McCalpin)
Random & NaturalRing Bandwidth & Latency(my part of theHPCC Benchmark Suite)
11
21 / 47
HPC Challenge Benchmarks
Registers
Cache
Local Memory
Disk
Instr. Operands
Blocks
Pages
Remote Memory
Messages
CorrespondingMemory Hierarchy
bandwidth
latency
� HPCS program has developed a new suite of benchmarks (HPC Challenge)� Each benchmark focuses on a different part of the memory hierarchy� HPCS program performance targets will flatten the memory hierarchy, improve
real application performance, and make programming easier
� HPCS program has developed a new suite of benchmarks (HPC Challenge)� Each benchmark focuses on a different part of the memory hierarchy� HPCS program performance targets will flatten the memory hierarchy, improve
real application performance, and make programming easier
� Top500: solves a systemAx = b
� STREAM: vector operationsA = B + s x C
� FFT: 1D Fast Fourier Transform
Z = FFT(X)� RandomAccess: random
updatesT(i) = XOR( T(i), r )
—skipped —
22 / 47
Spatial and Temporal LocalityProcessor
Memory
Get1Get2
Get3
Op1 Op2
Put1Put2
Put3
Stride=3
Reuse=2
� Programs can be decomposed into memory reference patterns� Stride is the distance between memory references
� Programs with small strides have high “Spatial Locality”� Reuse is the number of operations performed on each reference
� Programs with large reuse have high “Temporal Locality”� Can measure in real programs and correlate with HPC Challenge
—skipped —
12
23 / 47
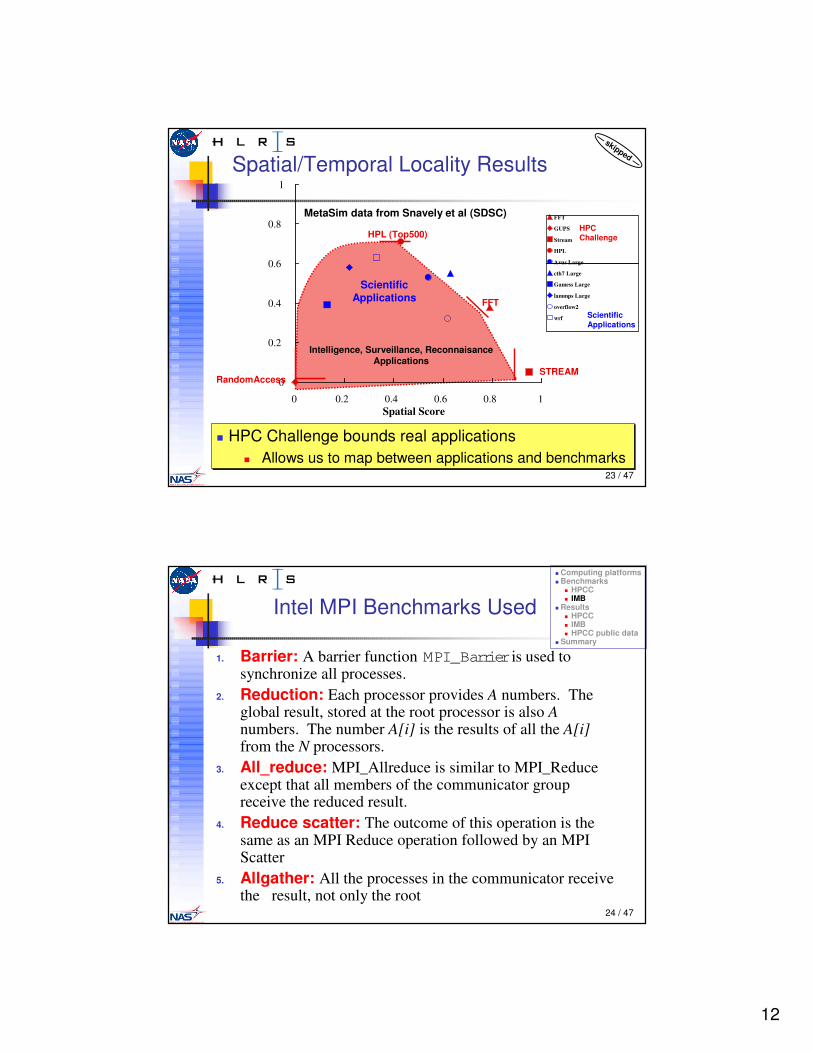
Spatial/Temporal Locality Results
� HPC Challenge bounds real applications� Allows us to map between applications and benchmarks
� HPC Challenge bounds real applications� Allows us to map between applications and benchmarks
0
0.2
0.4
0.6
0.8
1
0 0.2 0.4 0.6 0.8 1Spatial Score
FFT
GUPS
Stream
HPL
Avus Large
cth7 Large
Gamess Large
lammps Large
overflow2
wrf
MetaSim data from Snavely et al (SDSC)
HPL (Top500)
FFT
STREAMRandomAccess
ScientificApplications
HPCChallenge
ScientificApplications
Intelligence, Surveillance, ReconnaisanceApplications
—skipped —
24 / 47
Intel MPI Benchmarks Used
1. Barrier: A barrier function MPI_Barrieris used to synchronize all processes.
2. Reduction: Each processor provides A numbers. The global result, stored at the root processor is also Anumbers. The number A[i] is the results of all the A[i]from the N processors.
3. All_reduce: MPI_Allreduce is similar to MPI_Reduce except that all members of the communicator group receive the reduced result.
4. Reduce scatter: The outcome of this operation is the same as an MPI Reduce operation followed by an MPI Scatter
5. Allgather: All the processes in the communicator receive the result, not only the root
� Computing platforms� Benchmarks
� HPCC � IMB
� Results� HPCC � IMB� HPCC public data
� Summary
13
25 / 47
Intel MPI Benchmarks Used
1. Allgatherv: it is vector variant of MPI_ALLgather.2. All_to_All: Every process inputs A*N bytes and receives
A*N bytes (A bytes for each process), where N is number of processes.
3. Send_recv: Here each process sends a message to the right and receives from the left in the chain.
4. Exchange: Here process exchanges data with both left and right in the chain
5. Broadcast: Broadcast from one processor to all members of the communicator.
26 / 47
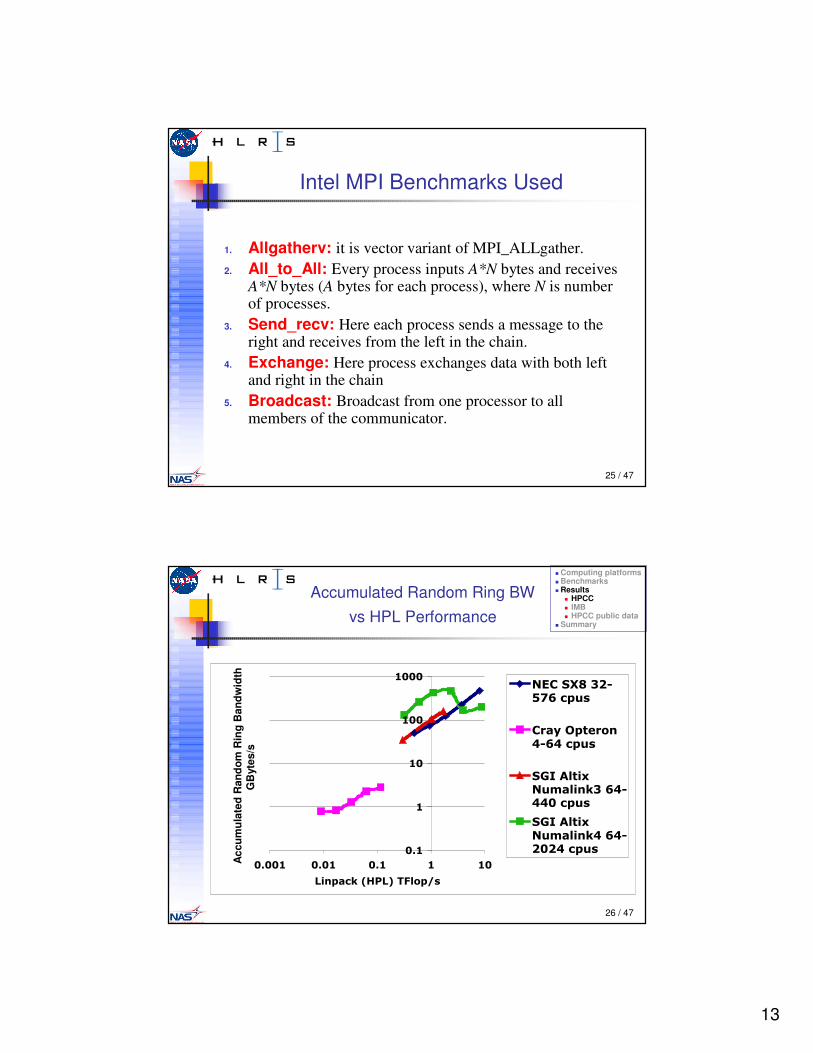
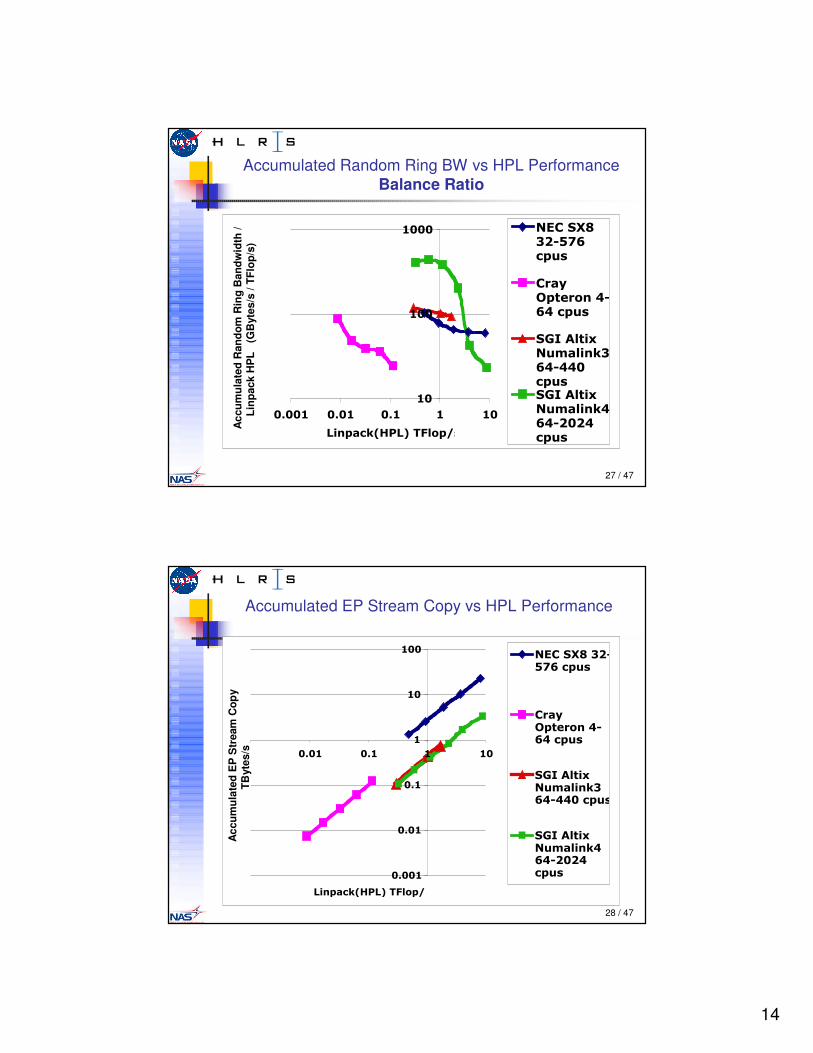
Accumulated Random Ring BWvs HPL Performance
���
�
��
���
����
����� ���� ��� � ��
������� �����������
������������ !��"�
�#�$�%�&'#��(�!(��"�
�)*�+�&�,�"-������!(�((���"�
�)*�+�&�,�"-����(�!(����(��"�
Acc
umul
ated
Ran
dom
Rin
g B
andw
idth
GB
ytes
/s
� Computing platforms� Benchmarks� Results
� HPCC � IMB� HPCC public data
� Summary
14
27 / 47
Accumulated Random Ring BW vs HPL PerformanceBalance Ratio
��
���
����
����� ���� ��� � ��
������ �����������
����������� !�"�
�#�$%�&'#���(�!(��"�
�)*�+�&�,�"-�����!(�((��"��)*�+�&�,�"-����(!(����(�"�
Acc
umul
ated
Ran
dom
Rin
g B
andw
idth
/Li
npac
k H
PL
(G
Byt
es/s
/ TF
lop/
s)
28 / 47
Accumulated EP Stream Copy vs HPL Performance
�����
����
���
�
��
���
����� ���� ��� � ��
������ �����������
������������ !��"�
�#�$%�&'#���(�!(��"�
�)*�+�&�,�"-�����!(�((���"�
�)*�+�&�,�"-����(!(����(�"�
Acc
umul
ated
EP
Str
eam
Cop
yTB
ytes
/s
15
29 / 47
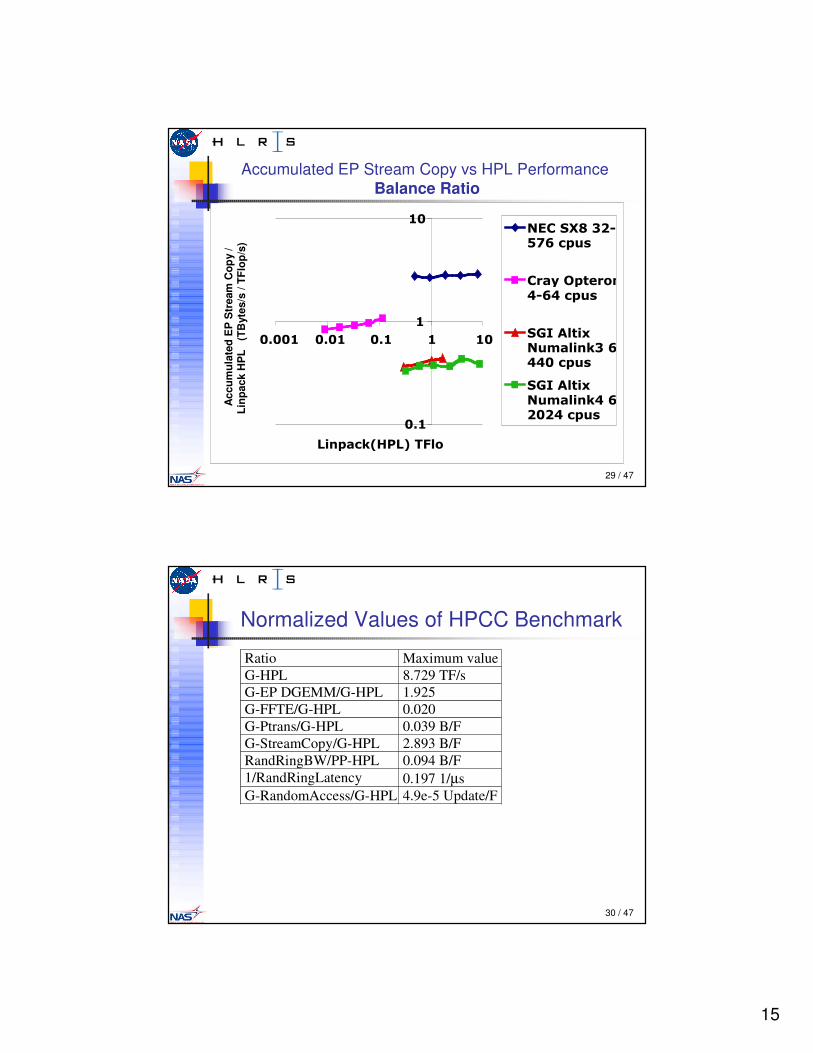
Accumulated EP Stream Copy vs HPL PerformanceBalance Ratio
���
�
��
����� ���� ��� � ��
������ �����������
������������ !��"�
�#�$�%�&'#��(�!(��"�
�)*�+�&�,�"-������!(�((���"�
�)*�+�&�,�"-����(�!(����(��"�
Acc
umul
ated
EP
Str
eam
Cop
y /
Linp
ack
HP
L (
TByt
es/s
/ TF
lop/
s)
30 / 47
Normalized Values of HPCC Benchmark
Ratio Maximum value G-HPL 8.729 TF/s G-EP DGEMM/G-HPL 1.925 G-FFTE/G-HPL 0.020 G-Ptrans/G-HPL 0.039 B/F G-StreamCopy/G-HPL 2.893 B/F RandRingBW/PP-HPL 0.094 B/F 1/RandRingLatency 0.197 1/µs G-RandomAccess/G-HPL 4.9e-5 Update/F
16
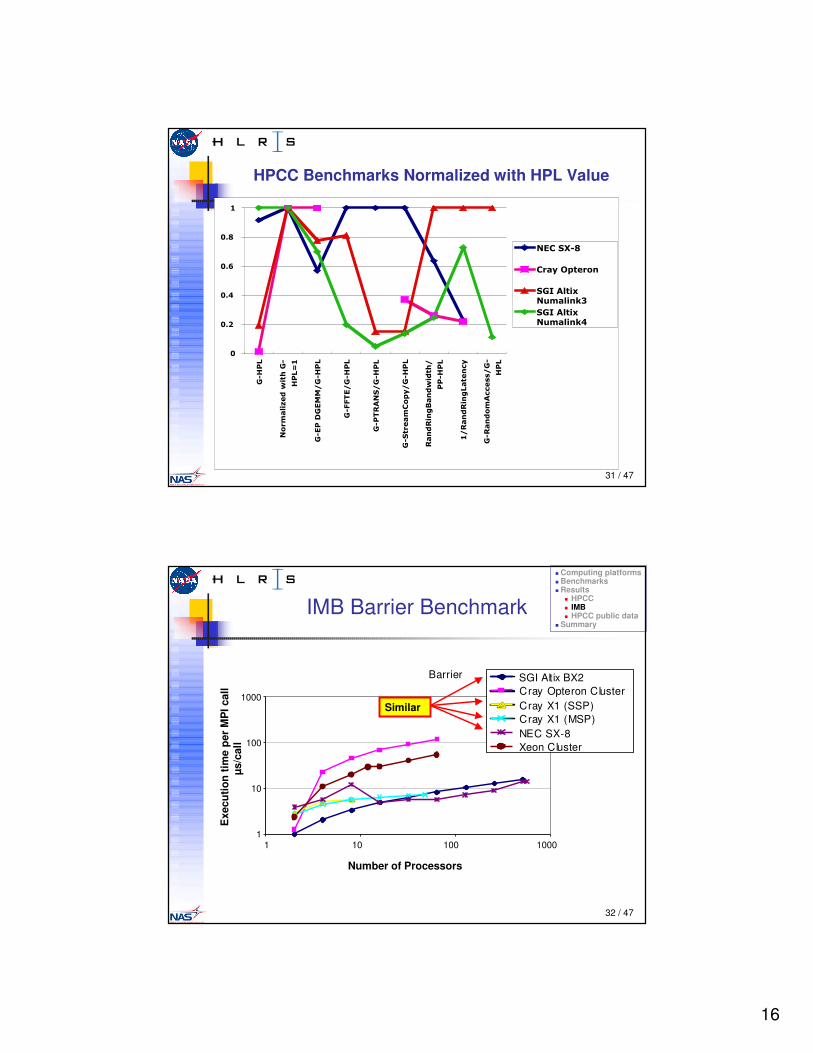
31 / 47
HPCC Benchmarks Normalized with HPL Value
�
���
��(
��!
���
�
)� ��
��#-���.'/�0�&1�)�
��2�
)����3)�44�)� ��
)������)� ��
)���5+���)� ��
)��&#'�-���$�)� ��
5��/5��67��/0�/&1�
��� ��
��5��/5��6��&'�$
)�5��/�-+'���)�
��
��������
�#�$�%�&'#��
�)*�+�&�,�"-�����
�)*�+�&�,�"-����(
32 / 47
IMB Barrier Benchmark
Exe
cutio
n tim
e pe
r M
PI c
all
µs/c
all
Barrier SGI Altix BX2Cray Opteron ClusterCray X1 (SSP)Cray X1 (MSP)NEC SX-8Xeon Cluster
1000
100
10
11 10 100 1000
Number of Processors
Similar
� Computing platforms� Benchmarks� Results
� HPCC � IMB� HPCC public data
� Summary
17
33 / 47
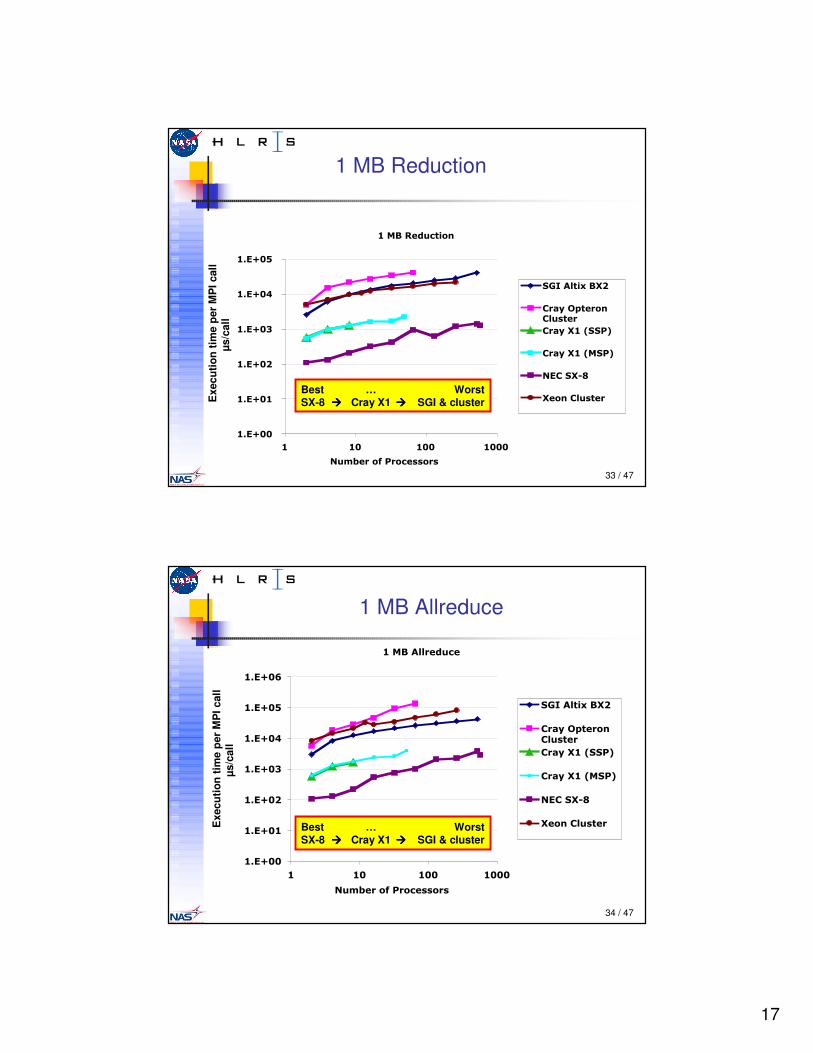
1 MB Reduction
��47�5'/"&���
���8��
���8��
���8��
���8��
���8�(
���8��
� �� ��� ����
�"-9'#��:��#�'���#�
�)*�+�&�,�7��
�#�$�%�&'#����"�&'#
�#�$���������
�#�$�����4���
��������
�'�����"�&'#Exe
cutio
n tim
e pe
r M
PI c
all
µs/c
all
Best … WorstSX-8 ���� Cray X1 ���� SGI & cluster
34 / 47
1 MB Allreduce
��47�+��#'/"'
���8��
���8��
���8��
���8��
���8�(
���8��
���8�!
� �� ��� ����
�"-9'#��:��#�'���#�
�)*�+�&�,�7��
�#�$�%�&'#����"�&'#
�#�$���������
�#�$�����4���
��������
�'�����"�&'#Exe
cutio
n tim
e pe
r M
PI c
all
µs/c
all
Best … WorstSX-8 ���� Cray X1 ���� SGI & cluster
18
35 / 47
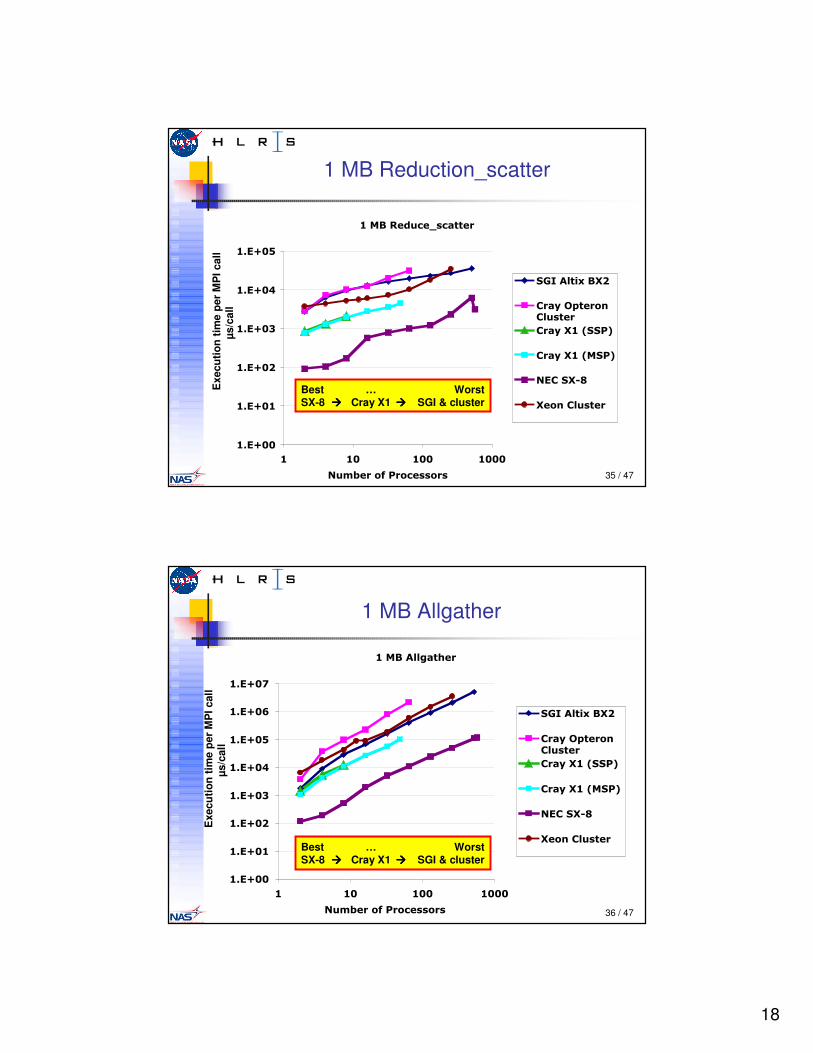
1 MB Reduction_scatter
��47�5'/"';��&&'#
���8��
���8��
���8��
���8��
���8�(
���8��
� �� ��� ����
�"-9'#��:��#�'���#�
�)*�+�&�,�7��
�#�$�%�&'#����"�&'#
�#�$���������
�#�$�����4���
��������
�'�����"�&'#
Exe
cutio
n tim
e pe
r M
PI c
all
µs/c
all
Best … WorstSX-8 ���� Cray X1 ���� SGI & cluster
36 / 47
1 MB Allgather
��47�+��6�&1'#
���8��
���8��
���8��
���8��
���8�(
���8��
���8�!
���8�
� �� ��� ����
�"-9'#��:��#�'���#�
�)*�+�&�,�7��
�#�$�%�&'#����"�&'#
�#�$���������
�#�$�����4���
��������
�'�����"�&'#
Exe
cutio
n tim
e pe
r M
PI c
all
µs/c
all
Best … WorstSX-8 ���� Cray X1 ���� SGI & cluster
19
37 / 47
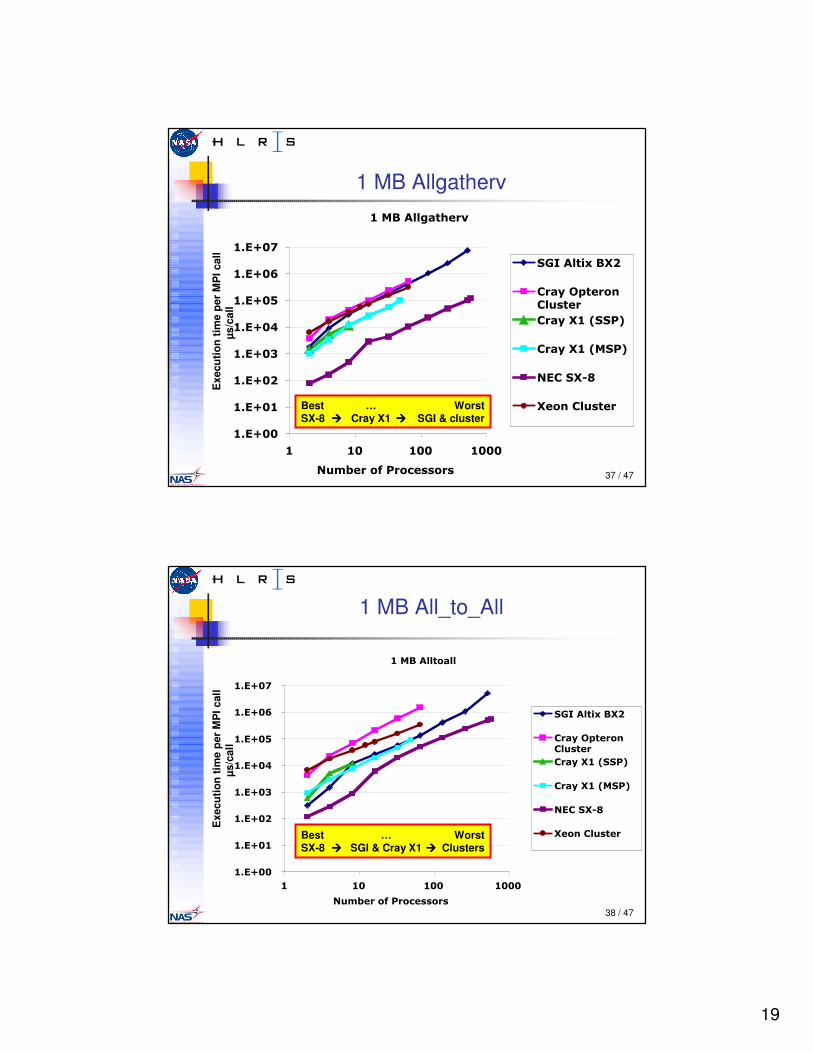
1 MB Allgatherv��47�+��6�&1'#<
���8��
���8��
���8��
���8��
���8�(
���8��
���8�!
���8�
� �� ��� ����
�"-9'#��:��#�'���#�
�)*�+�&�,�7��
�#�$�%�&'#����"�&'#
�#�$���������
�#�$�����4���
��������
�'�����"�&'#
Exe
cutio
n tim
e pe
r M
PI c
all
µs/c
all
Best … WorstSX-8 ���� Cray X1 ���� SGI & cluster
38 / 47
1 MB All_to_All
��47�+��&����
���8��
���8��
���8��
���8��
���8�(
���8��
���8�!
���8�
� �� ��� ����
�"-9'#��:��#�'���#�
�)*�+�&�,�7��
�#�$�%�&'#����"�&'#
�#�$���������
�#�$�����4���
��������
�'�����"�&'#
Exe
cutio
n tim
e pe
r M
PI c
all
µs/c
all
Best … WorstSX-8 ���� SGI & Cray X1 ���� Clusters
20
39 / 47
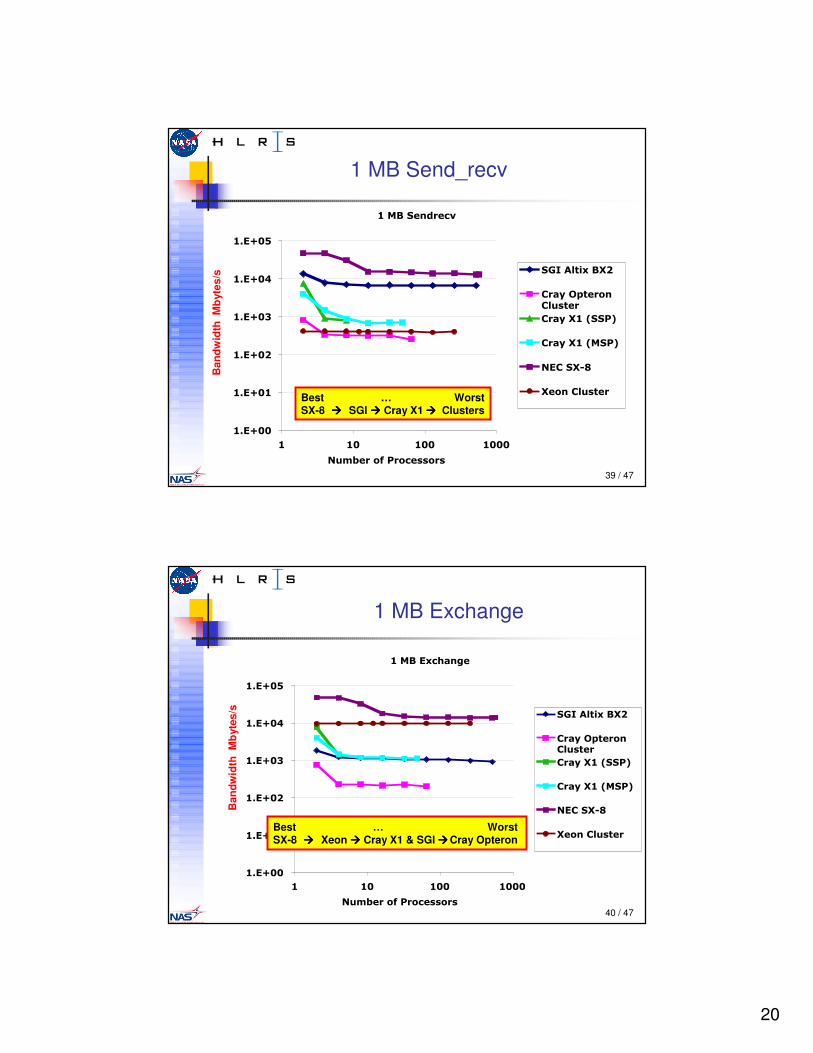
1 MB Send_recv
��47��'�/#'<
���8��
���8��
���8��
���8��
���8�(
���8��
� �� ��� ����
�"-9'#��:��#�'���#�
�)*�+�&�,�7��
�#�$�%�&'#����"�&'#
�#�$���������
�#�$�����4���
��������
�'�����"�&'#
Ban
dwid
th M
byte
s/s
Best … WorstSX-8 ���� SGI ���� Cray X1 ���� Clusters
40 / 47
1 MB Exchange
��47��,1��6'
���8��
���8��
���8��
���8��
���8�(
���8��
� �� ��� ����
�"-9'#��:��#�'���#�
�)*�+�&�,�7��
�#�$�%�&'#����"�&'#
�#�$���������
�#�$�����4���
��������
�'�����"�&'#
Ban
dwid
th M
byte
s/s
Best … WorstSX-8 ���� Xeon ���� Cray X1 & SGI ����Cray Opteron
21
41 / 47
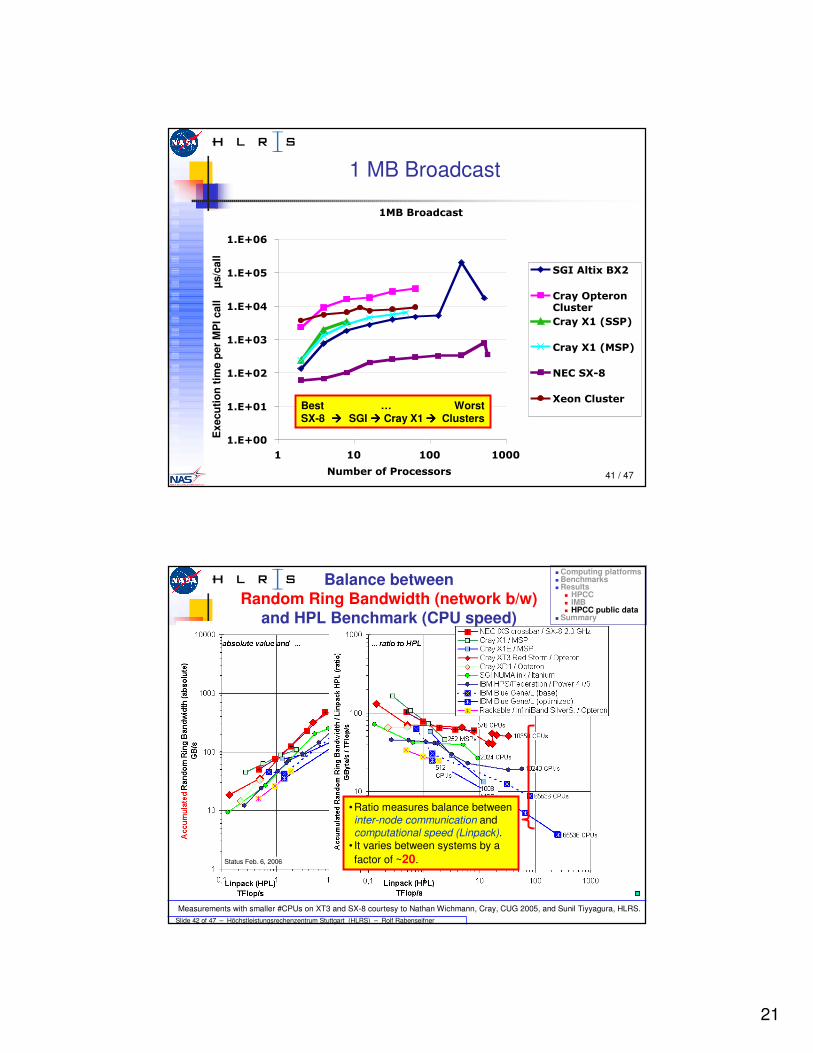
1 MB Broadcast
�47�7#��/��&
���8��
���8��
���8��
���8��
���8�(
���8��
���8�!
� �� ��� ����
�"-9'#��:��#�'���#�
�)*�+�&�,�7��
�#�$�%�&'#����"�&'#
�#�$���������
�#�$�����4���
��������
�'�����"�&'#
Exe
cutio
n tim
e pe
r M
PI c
all
µs/
call
Best … WorstSX-8 ���� SGI ���� Cray X1 ���� Clusters
42 / 47
Balance between Random Ring Bandwidth (network b/w)
and HPL Benchmark (CPU speed)
• Ratio measures balance between inter-node communication and computational speed (Linpack).
• It varies between systems by a factor of ~20.
Slide 42 of 47 – Höchstleistungsrechenzentrum Stuttgart (HLRS) – Rolf Rabenseifner
Measurements with smaller #CPUs on XT3 and SX-8 courtesy to Nathan Wichmann, Cray, CUG 2005, and Sunil Tiyyagura, HLRS.
Status Feb. 6, 2006
� Computing platforms� Benchmarks� Results
� HPCC � IMB� HPCC public data
� Summary
22
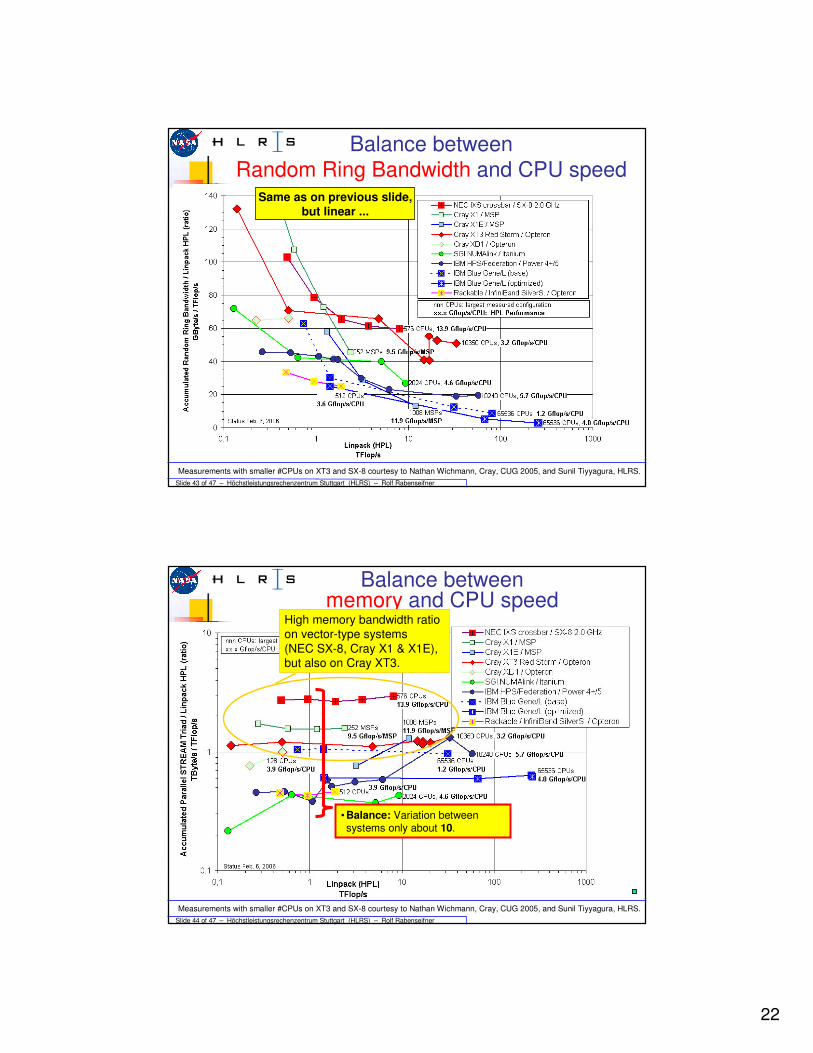
43 / 47
Balance between Random Ring Bandwidth and CPU speed
Same as on previous slide,but linear ...
Measurements with smaller #CPUs on XT3 and SX-8 courtesy to Nathan Wichmann, Cray, CUG 2005, and Sunil Tiyyagura, HLRS.Slide 43 of 47 – Höchstleistungsrechenzentrum Stuttgart (HLRS) – Rolf Rabenseifner
44 / 47
Balance between memory and CPU speed
High memory bandwidth ratio on vector-type systems (NEC SX-8, Cray X1 & X1E),but also on Cray XT3.
Slide 44 of 47 – Höchstleistungsrechenzentrum Stuttgart (HLRS) – Rolf Rabenseifner
Measurements with smaller #CPUs on XT3 and SX-8 courtesy to Nathan Wichmann, Cray, CUG 2005, and Sunil Tiyyagura, HLRS.
• Balance: Variation between systems only about 10.
23
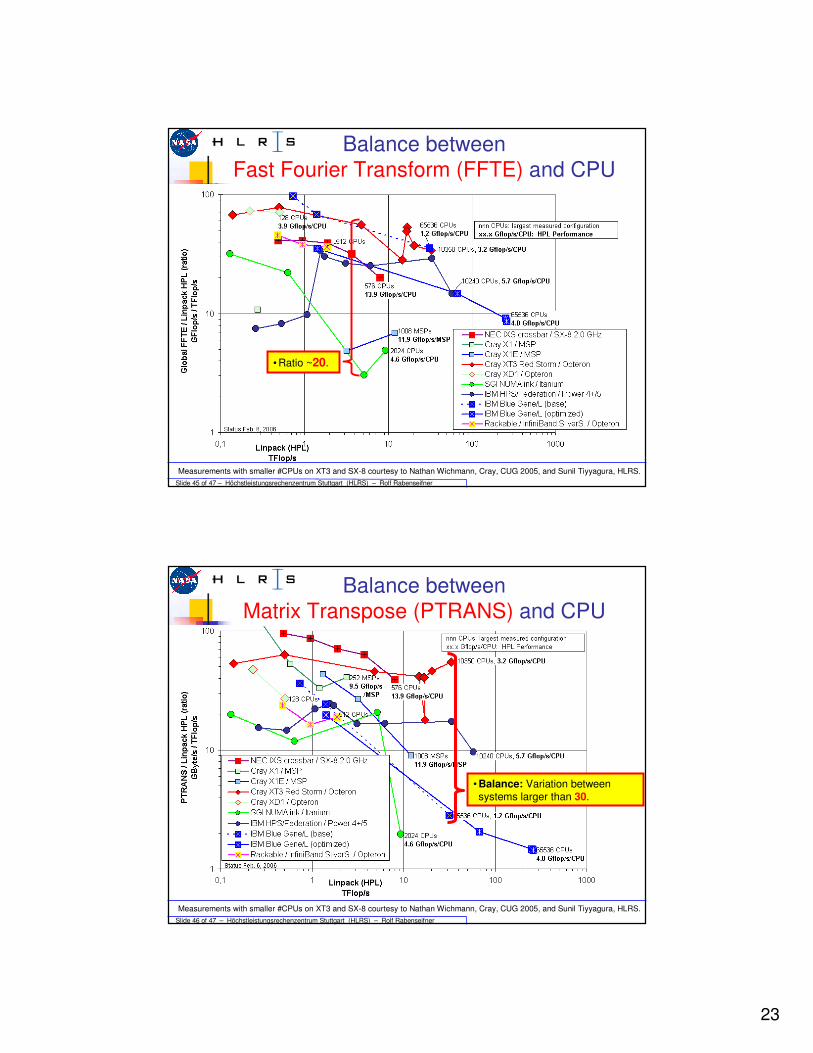
45 / 47
Balance between Fast Fourier Transform (FFTE) and CPU
Measurements with smaller #CPUs on XT3 and SX-8 courtesy to Nathan Wichmann, Cray, CUG 2005, and Sunil Tiyyagura, HLRS.Slide 45 of 47 – Höchstleistungsrechenzentrum Stuttgart (HLRS) – Rolf Rabenseifner
• Ratio ~20.
46 / 47
Balance between Matrix Transpose (PTRANS) and CPU
Measurements with smaller #CPUs on XT3 and SX-8 courtesy to Nathan Wichmann, Cray, CUG 2005, and Sunil Tiyyagura, HLRS.Slide 46 of 47 – Höchstleistungsrechenzentrum Stuttgart (HLRS) – Rolf Rabenseifner
• Balance: Variation between systems larger than 30.
24
47 / 47
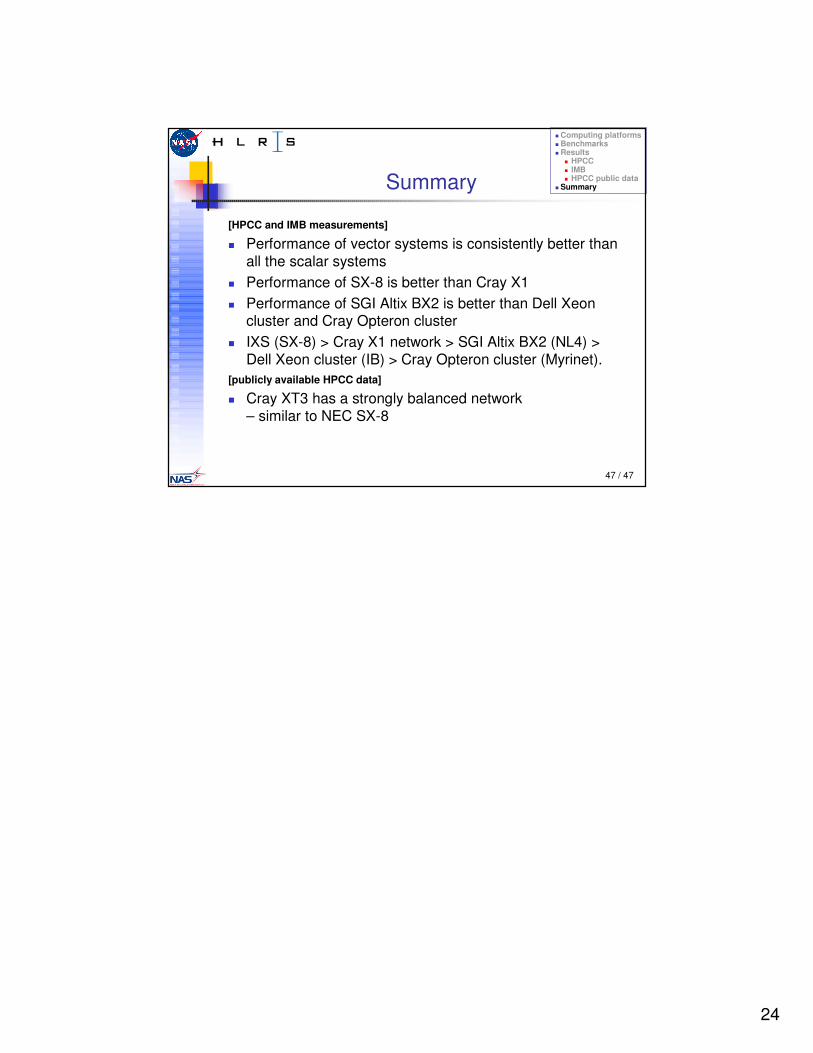
Summary
[HPCC and IMB measurements]
� Performance of vector systems is consistently better than all the scalar systems
� Performance of SX-8 is better than Cray X1� Performance of SGI Altix BX2 is better than Dell Xeon
cluster and Cray Opteron cluster� IXS (SX-8) > Cray X1 network > SGI Altix BX2 (NL4) >
Dell Xeon cluster (IB) > Cray Opteron cluster (Myrinet).[publicly available HPCC data]
� Cray XT3 has a strongly balanced network – similar to NEC SX-8
� Computing platforms� Benchmarks� Results
� HPCC � IMB� HPCC public data
� Summary
Related Documents