Original Investigations Performance Comparison of 1.5-T Endorectal Coil MRI with 3.0-T Nonendorectal Coil MRI in Patients with Prostate Cancer Zarine K. Shah, MD, Saba N. Elias, MS, Ronney Abaza, MD, Debra L. Zynger, MD, Lawrence A. DeRenne, MD, Michael V. Knopp, MD, PhD, Beibei Guo, PhD, Ryan Schurr, BS, Steven B. Heymsfield, MD, Guang Jia, PhD Rationale and Objectives: To compare prostate morphology, image quality, and diagnostic performance of 1.5-T endorectal coil mag- netic resonance (MR) imaging (MRI) and 3.0-T nonendorectal coil MRI in patients with prostate cancer. Materials and Methods: MR images obtained of 83 patients with prostate cancer using 1.5-T MRI systems with an endorectal coil were compared to images collected from 83 patients with a 3.0-T MRI system. Prostate diameters were measured, and image quality was eval- uated by one American Board of Radiology (ABR)–certified radiologist (reader 1) and one ABR-certified diagnostic medical physicist (reader 2). The likelihood of the presence of peripheral zone cancer in each sextant and local extent was rated and compared to histopath- ologic findings. Results: Prostate anterior–posterior diameter measured by both readers was significantly shorter with 1.5-T endorectal MRI than with 3.0- T MRI. The overall image quality score difference was significant only for reader 1. Both readers found that the two MRI systems provided a similar diagnostic accuracy in cancer localization, extraprostatic extension, and seminal vesicle involvement. Conclusions: Nonendorectal coil 3.0-T MRI provides prostate images that are natural in shape and that have comparable image quality to those obtained at 1.5 T with an endorectal coil, but not superior diagnostic performance. These findings suggest an opportunity exists for improving technical aspects of the 3.0-T prostate MRI. Key Words: Prostate cancer; magnetic resonance imaging; image quality; endorectal coil; tumor localization; tumor staging. ªAUR, 2015 P rostate cancer is the second most common cause of cancer death among American men. The American Cancer Society estimated that 233,000 new cases of prostate cancer would be diagnosed in 2014, and approxi- mately 29,480 men would die of the disease (1). Magnetic resonance (MR) imaging (MRI), with excellent soft-tissue contrast, provides high resolution images of the pelvis for use in prostate cancer management (2). The use of an endorectal coil is an essential part of the prostate 1.5-T MRI protocol in the clinical diagnosis of prostate cancer (3). An endorectal coil is inserted tightly against the prostate during the MRI examination to increase image resolution and improve staging accuracy (4). How- ever, the endorectal coil leads to deformity in the prostate contour, and the anatomic distortion resulting from it can potentially hinder the diagnosis and pathology correlation (5). The changes in prostate shape and volume after the introduction of an endorectal coil may cause difficulties in MRI–computed tomography fusion and radiotherapy plan- ning (6,7). Another limitation is that patients with rectal stenosis or immediately after surgery or radiotherapy may not be good candidates for the use of the endorectal coil during MR examination (8). MRI at 3.0 T is increasingly being used for routine clinical examinations (9). 3.0-T MRI has a nearly two-fold increase in Acad Radiol 2015; -:1–8 From the Department of Radiology, The Ohio State University, Columbus, Ohio (Z.K.S., S.N.E., M.V.K.); OhioHealth Dublin Methodist Hospital, Dublin, Ohio (R.A.); Department of Pathology, The Ohio State University, Columbus, Ohio (D.L.Z., L.A.D.); Department of Experimental Statistics, Louisiana State University, Baton Rouge, Louisiana (B.G.); Department of Physics and Astronomy, Louisiana State University, Baton Rouge, Louisiana 70803 (R.S., G.J.); and Pennington Biomedical Research Center, Baton Rouge, Louisiana (S.B.H., G.J.). Received February 11, 2014; accepted November 10, 2014. Financial Support: This study was supported in part by a grant from the National Institutes of Health (U01CA080098-14, American College of Radiology Imaging Network Young Investigator Initiative Project Subaward #1117), a grant from the National Institutes of Health (R21CA156945), and a grant from the American Urological Association Foundation Research Scholars Program and EUSA Pharma (USA), Inc. Address correspondence to: G.J. e-mail: [email protected] ªAUR, 2015 http://dx.doi.org/10.1016/j.acra.2014.11.007 1

Welcome message from author
This document is posted to help you gain knowledge. Please leave a comment to let me know what you think about it! Share it to your friends and learn new things together.
Transcript
Original Investigations
Performance Comparison of 1.5-TEndorectal Coil MRI with 3.0-T
Nonendorectal Coil MRI in Patientswith Prostate Cancer
Zarine K. Shah, MD, Saba N. Elias, MS, Ronney Abaza, MD, Debra L. Zynger, MD,Lawrence A. DeRenne, MD, Michael V. Knopp, MD, PhD, Beibei Guo, PhD, Ryan Schurr, BS,
Steven B. Heymsfield, MD, Guang Jia, PhD
Rationale and Objectives: To compare prostate morphology, image quality, and diagnostic performance of 1.5-T endorectal coil mag-
netic resonance (MR) imaging (MRI) and 3.0-T nonendorectal coil MRI in patients with prostate cancer.
Materials and Methods: MR images obtained of 83 patients with prostate cancer using 1.5-T MRI systems with an endorectal coil werecompared to images collected from 83 patients with a 3.0-T MRI system. Prostate diameters were measured, and image quality was eval-
uated by one American Board of Radiology (ABR)–certified radiologist (reader 1) and one ABR-certified diagnostic medical physicist
(reader 2). The likelihood of the presence of peripheral zone cancer in each sextant and local extent was rated and compared to histopath-ologic findings.
Results: Prostate anterior–posterior diametermeasured by both readers was significantly shorter with 1.5-T endorectal MRI thanwith 3.0-
TMRI. The overall image quality score differencewas significant only for reader 1. Both readers found that the twoMRI systems provided asimilar diagnostic accuracy in cancer localization, extraprostatic extension, and seminal vesicle involvement.
Conclusions: Nonendorectal coil 3.0-TMRI provides prostate images that are natural in shape and that have comparable image quality to
those obtained at 1.5 T with an endorectal coil, but not superior diagnostic performance. These findings suggest an opportunity exists for
improving technical aspects of the 3.0-T prostate MRI.
Key Words: Prostate cancer; magnetic resonance imaging; image quality; endorectal coil; tumor localization; tumor staging.
ªAUR, 2015
Prostate cancer is the second most common cause of
cancer death among American men. The American
Cancer Society estimated that 233,000 new cases of
prostate cancer would be diagnosed in 2014, and approxi-
mately 29,480 men would die of the disease (1). Magnetic
Acad Radiol 2015; -:1–8
From the Department of Radiology, TheOhio State University, Columbus, Ohio(Z.K.S., S.N.E., M.V.K.); OhioHealth Dublin Methodist Hospital, Dublin, Ohio(R.A.); Department of Pathology, The Ohio State University, Columbus, Ohio(D.L.Z., L.A.D.); Department of Experimental Statistics, Louisiana StateUniversity, Baton Rouge, Louisiana (B.G.); Department of Physics andAstronomy, Louisiana State University, Baton Rouge, Louisiana 70803 (R.S.,G.J.); and Pennington Biomedical Research Center, Baton Rouge, Louisiana(S.B.H., G.J.). Received February 11, 2014; accepted November 10, 2014.Financial Support: This study was supported in part by a grant from theNational Institutes of Health (U01CA080098-14, American College ofRadiology Imaging Network Young Investigator Initiative Project Subaward#1117), a grant from the National Institutes of Health (R21CA156945), and agrant from the American Urological Association Foundation ResearchScholars Program and EUSA Pharma (USA), Inc. Address correspondenceto: G.J. e-mail: [email protected]
ªAUR, 2015http://dx.doi.org/10.1016/j.acra.2014.11.007
resonance (MR) imaging (MRI), with excellent soft-tissue
contrast, provides high resolution images of the pelvis for
use in prostate cancer management (2).
The use of an endorectal coil is an essential part of the
prostate 1.5-T MRI protocol in the clinical diagnosis of
prostate cancer (3). An endorectal coil is inserted tightly
against the prostate during the MRI examination to increase
image resolution and improve staging accuracy (4). How-
ever, the endorectal coil leads to deformity in the prostate
contour, and the anatomic distortion resulting from it can
potentially hinder the diagnosis and pathology correlation
(5). The changes in prostate shape and volume after the
introduction of an endorectal coil may cause difficulties in
MRI–computed tomography fusion and radiotherapy plan-
ning (6,7). Another limitation is that patients with rectal
stenosis or immediately after surgery or radiotherapy may
not be good candidates for the use of the endorectal coil
during MR examination (8).
MRI at 3.0 T is increasingly being used for routine clinical
examinations (9). 3.0-TMRI has a nearly two-fold increase in
1
SHAH ET AL Academic Radiology, Vol -, No -, - 2015
signal-to-noise ratio (SNR) compared to 1.5 T, with
improved spatial resolution or shortened acquisition time
(10). It is hypothesized that 3.0-T MRI of the prostate
without the use of an endorectal coil may have the image
quality and diagnostic accuracy equivalent to 1.5-Tendorectal
MRI (11,12) while evaluating the prostate gland without
anatomic distortion or compression (13).
The purpose of this study is to evaluate the effectiveness of
3.0-T MRI compared to 1.5-T endorectal MRI in assessing
prostate morphology, image quality, and diagnostic perfor-
mance in patients with prostate cancer.
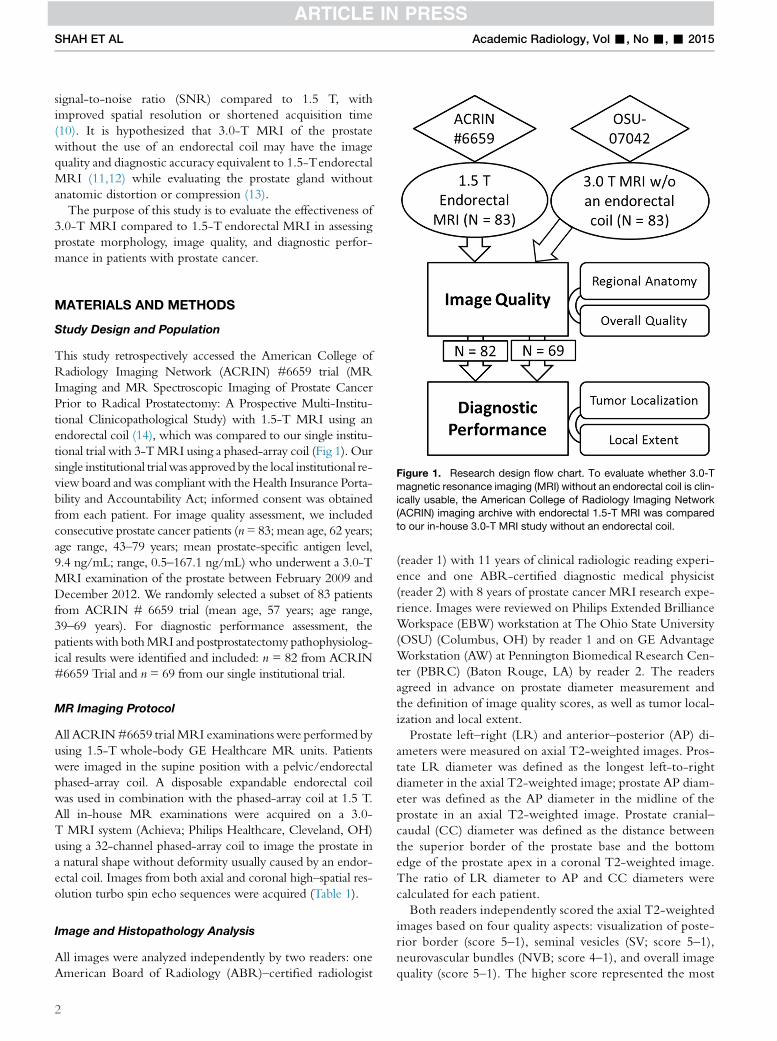
Figure 1. Research design flow chart. To evaluate whether 3.0-T
magnetic resonance imaging (MRI) without an endorectal coil is clin-
ically usable, the American College of Radiology Imaging Network(ACRIN) imaging archive with endorectal 1.5-T MRI was compared
to our in-house 3.0-T MRI study without an endorectal coil.
MATERIALS AND METHODS
Study Design and Population
This study retrospectively accessed the American College of
Radiology Imaging Network (ACRIN) #6659 trial (MR
Imaging and MR Spectroscopic Imaging of Prostate Cancer
Prior to Radical Prostatectomy: A Prospective Multi-Institu-
tional Clinicopathological Study) with 1.5-T MRI using an
endorectal coil (14), which was compared to our single institu-
tional trial with 3-TMRI using a phased-array coil (Fig 1). Our
single institutional trialwas approved by the local institutional re-
view board andwas compliant with theHealth Insurance Porta-
bility and Accountability Act; informed consent was obtained
from each patient. For image quality assessment, we included
consecutive prostate cancer patients (n= 83; mean age, 62 years;
age range, 43–79 years; mean prostate-specific antigen level,
9.4 ng/mL; range, 0.5–167.1 ng/mL) who underwent a 3.0-T
MRI examination of the prostate between February 2009 and
December 2012. We randomly selected a subset of 83 patients
from ACRIN # 6659 trial (mean age, 57 years; age range,
39–69 years). For diagnostic performance assessment, the
patientswith bothMRI and postprostatectomy pathophysiolog-
ical results were identified and included: n = 82 from ACRIN
#6659 Trial and n = 69 from our single institutional trial.
MR Imaging Protocol
All ACRIN#6659 trial MRI examinationswere performed by
using 1.5-T whole-body GE Healthcare MR units. Patients
were imaged in the supine position with a pelvic/endorectal
phased-array coil. A disposable expandable endorectal coil
was used in combination with the phased-array coil at 1.5 T.
All in-house MR examinations were acquired on a 3.0-
T MRI system (Achieva; Philips Healthcare, Cleveland, OH)
using a 32-channel phased-array coil to image the prostate in
a natural shape without deformity usually caused by an endor-
ectal coil. Images from both axial and coronal high–spatial res-
olution turbo spin echo sequences were acquired (Table 1).
Image and Histopathology Analysis
All images were analyzed independently by two readers: one
American Board of Radiology (ABR)–certified radiologist
2
(reader 1) with 11 years of clinical radiologic reading experi-
ence and one ABR-certified diagnostic medical physicist
(reader 2) with 8 years of prostate cancer MRI research expe-
rience. Images were reviewed on Philips Extended Brilliance
Workspace (EBW) workstation at The Ohio State University
(OSU) (Columbus, OH) by reader 1 and on GE Advantage
Workstation (AW) at Pennington Biomedical Research Cen-
ter (PBRC) (Baton Rouge, LA) by reader 2. The readers
agreed in advance on prostate diameter measurement and
the definition of image quality scores, as well as tumor local-
ization and local extent.
Prostate left–right (LR) and anterior–posterior (AP) di-
ameters were measured on axial T2-weighted images. Pros-
tate LR diameter was defined as the longest left-to-right
diameter in the axial T2-weighted image; prostate AP diam-
eter was defined as the AP diameter in the midline of the
prostate in an axial T2-weighted image. Prostate cranial–
caudal (CC) diameter was defined as the distance between
the superior border of the prostate base and the bottom
edge of the prostate apex in a coronal T2-weighted image.
The ratio of LR diameter to AP and CC diameters were
calculated for each patient.
Both readers independently scored the axial T2-weighted
images based on four quality aspects: visualization of poste-
rior border (score 5–1), seminal vesicles (SV; score 5–1),
neurovascular bundles (NVB; score 4–1), and overall image
quality (score 5–1). The higher score represented the most
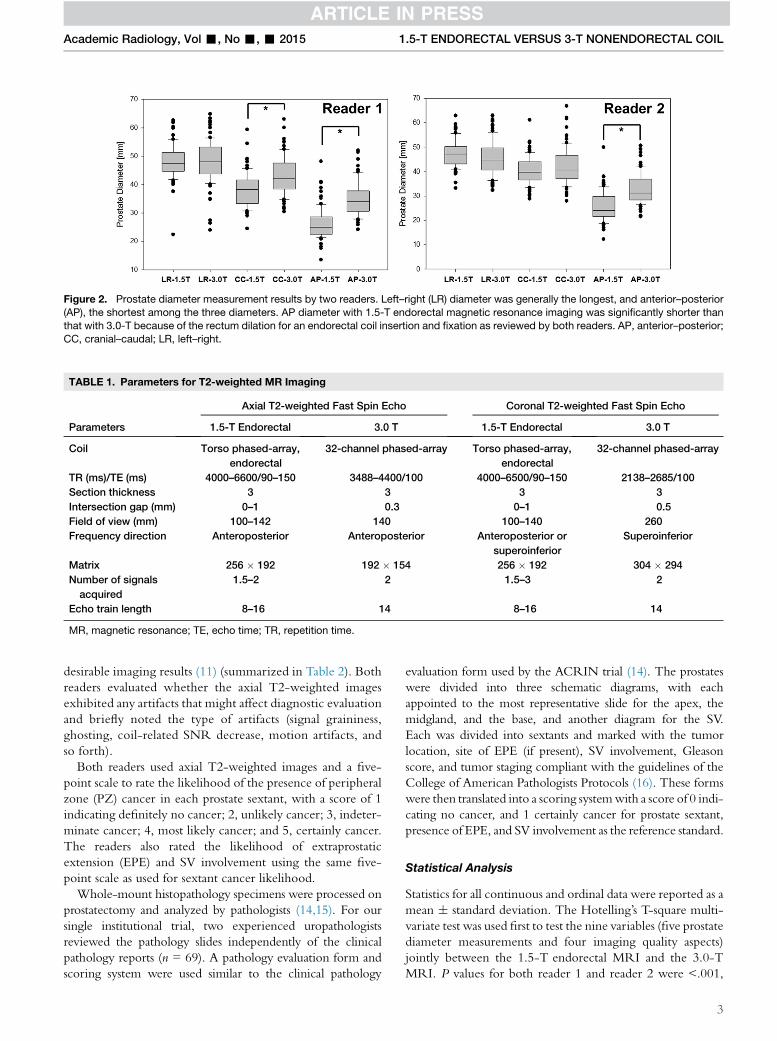
TABLE 1. Parameters for T2-weighted MR Imaging
Parameters
Axial T2-weighted Fast Spin Echo Coronal T2-weighted Fast Spin Echo
1.5-T Endorectal 3.0 T 1.5-T Endorectal 3.0 T
Coil Torso phased-array,
endorectal
32-channel phased-array Torso phased-array,
endorectal
32-channel phased-array
TR (ms)/TE (ms) 4000–6600/90–150 3488–4400/100 4000–6500/90–150 2138–2685/100
Section thickness 3 3 3 3
Intersection gap (mm) 0–1 0.3 0–1 0.5
Field of view (mm) 100–142 140 100–140 260
Frequency direction Anteroposterior Anteroposterior Anteroposterior or
superoinferior
Superoinferior
Matrix 256 � 192 192 � 154 256 � 192 304 � 294
Number of signals
acquired
1.5–2 2 1.5–3 2
Echo train length 8–16 14 8–16 14
MR, magnetic resonance; TE, echo time; TR, repetition time.
Figure 2. Prostate diameter measurement results by two readers. Left–right (LR) diameter was generally the longest, and anterior–posterior
(AP), the shortest among the three diameters. AP diameter with 1.5-T endorectal magnetic resonance imaging was significantly shorter than
that with 3.0-T because of the rectum dilation for an endorectal coil insertion and fixation as reviewed by both readers. AP, anterior–posterior;
CC, cranial–caudal; LR, left–right.
Academic Radiology, Vol -, No -, - 2015 1.5-T ENDORECTAL VERSUS 3-T NONENDORECTAL COIL
desirable imaging results (11) (summarized in Table 2). Both
readers evaluated whether the axial T2-weighted images
exhibited any artifacts that might affect diagnostic evaluation
and briefly noted the type of artifacts (signal graininess,
ghosting, coil-related SNR decrease, motion artifacts, and
so forth).
Both readers used axial T2-weighted images and a five-
point scale to rate the likelihood of the presence of peripheral
zone (PZ) cancer in each prostate sextant, with a score of 1
indicating definitely no cancer; 2, unlikely cancer; 3, indeter-
minate cancer; 4, most likely cancer; and 5, certainly cancer.
The readers also rated the likelihood of extraprostatic
extension (EPE) and SV involvement using the same five-
point scale as used for sextant cancer likelihood.
Whole-mount histopathology specimens were processed on
prostatectomy and analyzed by pathologists (14,15). For our
single institutional trial, two experienced uropathologists
reviewed the pathology slides independently of the clinical
pathology reports (n = 69). A pathology evaluation form and
scoring system were used similar to the clinical pathology
evaluation form used by the ACRIN trial (14). The prostates
were divided into three schematic diagrams, with each
appointed to the most representative slide for the apex, the
midgland, and the base, and another diagram for the SV.
Each was divided into sextants and marked with the tumor
location, site of EPE (if present), SV involvement, Gleason
score, and tumor staging compliant with the guidelines of the
College of American Pathologists Protocols (16). These forms
were then translated into a scoring systemwith a score of 0 indi-
cating no cancer, and 1 certainly cancer for prostate sextant,
presence of EPE, and SV involvement as the reference standard.
Statistical Analysis
Statistics for all continuous and ordinal data were reported as a
mean � standard deviation. The Hotelling’s T-square multi-
variate test was used first to test the nine variables (five prostate
diameter measurements and four imaging quality aspects)
jointly between the 1.5-T endorectal MRI and the 3.0-T
MRI. P values for both reader 1 and reader 2 were <.001,
3
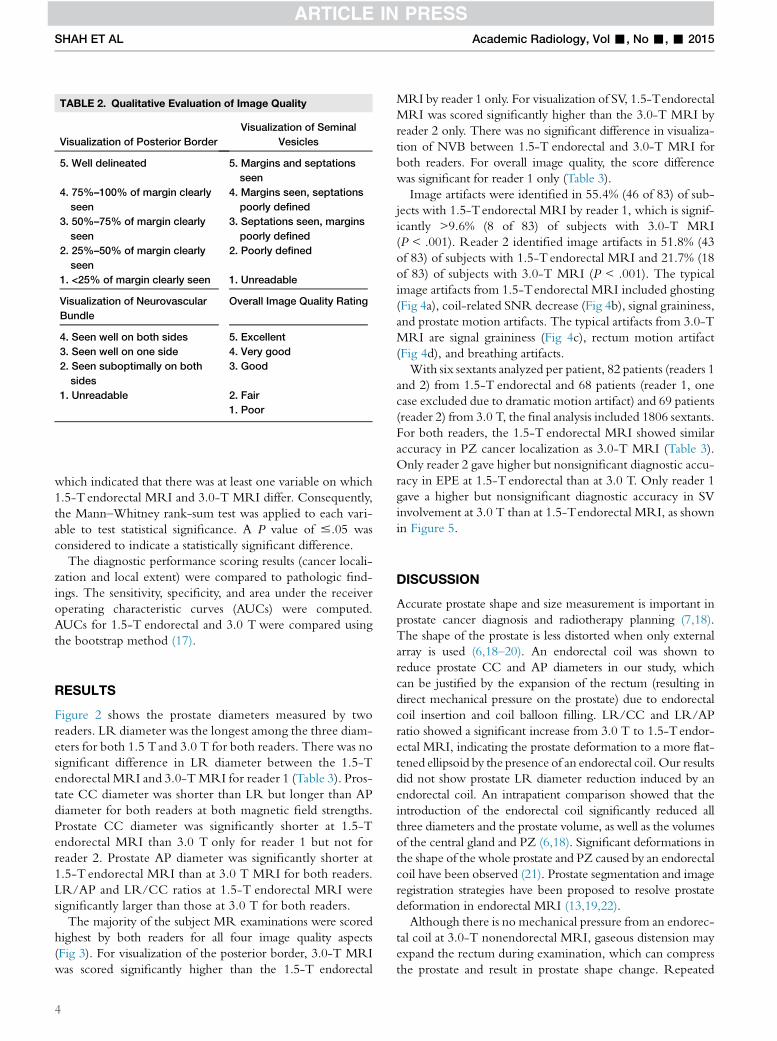
TABLE 2. Qualitative Evaluation of Image Quality
Visualization of Posterior Border
Visualization of Seminal
Vesicles
5. Well delineated 5. Margins and septations
seen
4. 75%–100% of margin clearly
seen
4. Margins seen, septations
poorly defined
3. 50%–75% of margin clearly
seen
3. Septations seen, margins
poorly defined
2. 25%–50% of margin clearly
seen
2. Poorly defined
1. <25% of margin clearly seen 1. Unreadable
Visualization of Neurovascular
Bundle
Overall Image Quality Rating
4. Seen well on both sides 5. Excellent
3. Seen well on one side 4. Very good
2. Seen suboptimally on both
sides
3. Good
1. Unreadable 2. Fair
1. Poor
SHAH ET AL Academic Radiology, Vol -, No -, - 2015
which indicated that there was at least one variable on which
1.5-Tendorectal MRI and 3.0-T MRI differ. Consequently,
the Mann–Whitney rank-sum test was applied to each vari-
able to test statistical significance. A P value of #.05 was
considered to indicate a statistically significant difference.
The diagnostic performance scoring results (cancer locali-
zation and local extent) were compared to pathologic find-
ings. The sensitivity, specificity, and area under the receiver
operating characteristic curves (AUCs) were computed.
AUCs for 1.5-T endorectal and 3.0 T were compared using
the bootstrap method (17).
RESULTS
Figure 2 shows the prostate diameters measured by two
readers. LR diameter was the longest among the three diam-
eters for both 1.5 Tand 3.0 T for both readers. There was no
significant difference in LR diameter between the 1.5-T
endorectal MRI and 3.0-TMRI for reader 1 (Table 3). Pros-
tate CC diameter was shorter than LR but longer than AP
diameter for both readers at both magnetic field strengths.
Prostate CC diameter was significantly shorter at 1.5-T
endorectal MRI than 3.0 T only for reader 1 but not for
reader 2. Prostate AP diameter was significantly shorter at
1.5-T endorectal MRI than at 3.0 T MRI for both readers.
LR/AP and LR/CC ratios at 1.5-T endorectal MRI were
significantly larger than those at 3.0 T for both readers.
The majority of the subject MR examinations were scored
highest by both readers for all four image quality aspects
(Fig 3). For visualization of the posterior border, 3.0-T MRI
was scored significantly higher than the 1.5-T endorectal
4
MRI by reader 1 only. For visualization of SV, 1.5-Tendorectal
MRI was scored significantly higher than the 3.0-T MRI by
reader 2 only. There was no significant difference in visualiza-
tion of NVB between 1.5-T endorectal and 3.0-T MRI for
both readers. For overall image quality, the score difference
was significant for reader 1 only (Table 3).
Image artifacts were identified in 55.4% (46 of 83) of sub-
jects with 1.5-Tendorectal MRI by reader 1, which is signif-
icantly >9.6% (8 of 83) of subjects with 3.0-T MRI
(P < .001). Reader 2 identified image artifacts in 51.8% (43
of 83) of subjects with 1.5-Tendorectal MRI and 21.7% (18
of 83) of subjects with 3.0-T MRI (P < .001). The typical
image artifacts from 1.5-Tendorectal MRI included ghosting
(Fig 4a), coil-related SNR decrease (Fig 4b), signal graininess,
and prostate motion artifacts. The typical artifacts from 3.0-T
MRI are signal graininess (Fig 4c), rectum motion artifact
(Fig 4d), and breathing artifacts.
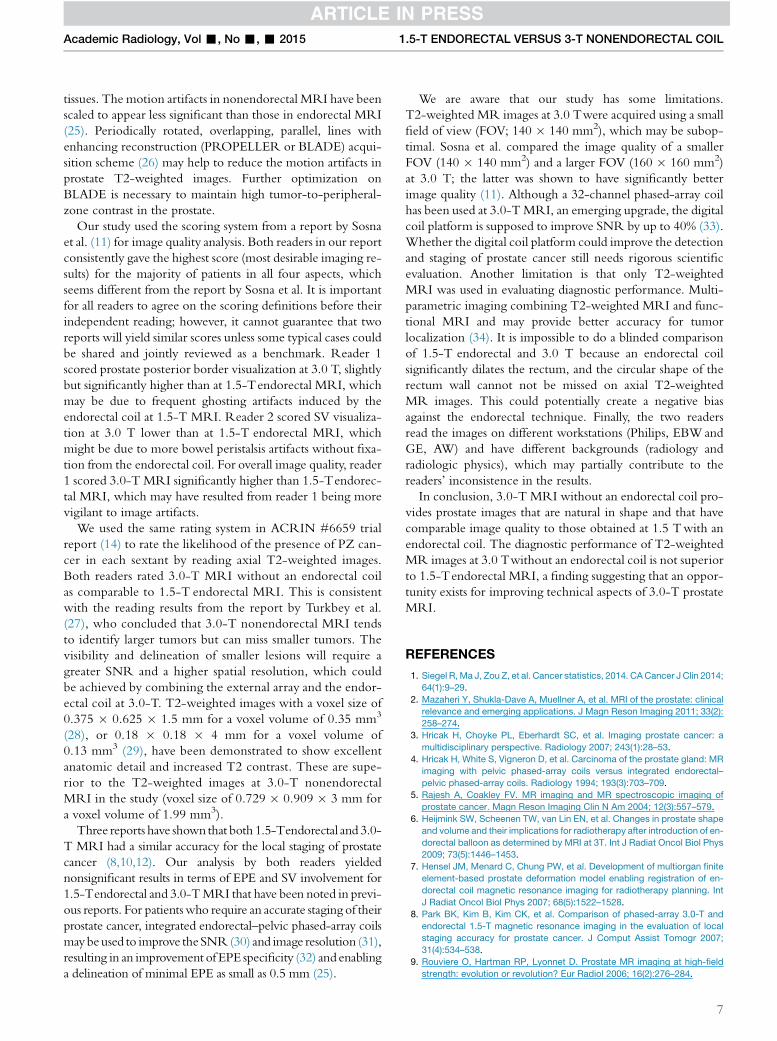
With six sextants analyzed per patient, 82 patients (readers 1
and 2) from 1.5-T endorectal and 68 patients (reader 1, one
case excluded due to dramatic motion artifact) and 69 patients
(reader 2) from 3.0 T, the final analysis included 1806 sextants.
For both readers, the 1.5-T endorectal MRI showed similar
accuracy in PZ cancer localization as 3.0-T MRI (Table 3).
Only reader 2 gave higher but nonsignificant diagnostic accu-
racy in EPE at 1.5-Tendorectal than at 3.0 T. Only reader 1
gave a higher but nonsignificant diagnostic accuracy in SV
involvement at 3.0 T than at 1.5-Tendorectal MRI, as shown
in Figure 5.
DISCUSSION
Accurate prostate shape and size measurement is important in
prostate cancer diagnosis and radiotherapy planning (7,18).
The shape of the prostate is less distorted when only external
array is used (6,18–20). An endorectal coil was shown to
reduce prostate CC and AP diameters in our study, which
can be justified by the expansion of the rectum (resulting in
direct mechanical pressure on the prostate) due to endorectal
coil insertion and coil balloon filling. LR/CC and LR/AP
ratio showed a significant increase from 3.0 T to 1.5-Tendor-
ectal MRI, indicating the prostate deformation to a more flat-
tened ellipsoid by the presence of an endorectal coil. Our results
did not show prostate LR diameter reduction induced by an
endorectal coil. An intrapatient comparison showed that the
introduction of the endorectal coil significantly reduced all
three diameters and the prostate volume, as well as the volumes
of the central gland and PZ (6,18). Significant deformations in
the shape of the whole prostate and PZ caused by an endorectal
coil have been observed (21). Prostate segmentation and image
registration strategies have been proposed to resolve prostate
deformation in endorectal MRI (13,19,22).
Although there is no mechanical pressure from an endorec-
tal coil at 3.0-T nonendorectal MRI, gaseous distension may
expand the rectum during examination, which can compress
the prostate and result in prostate shape change. Repeated
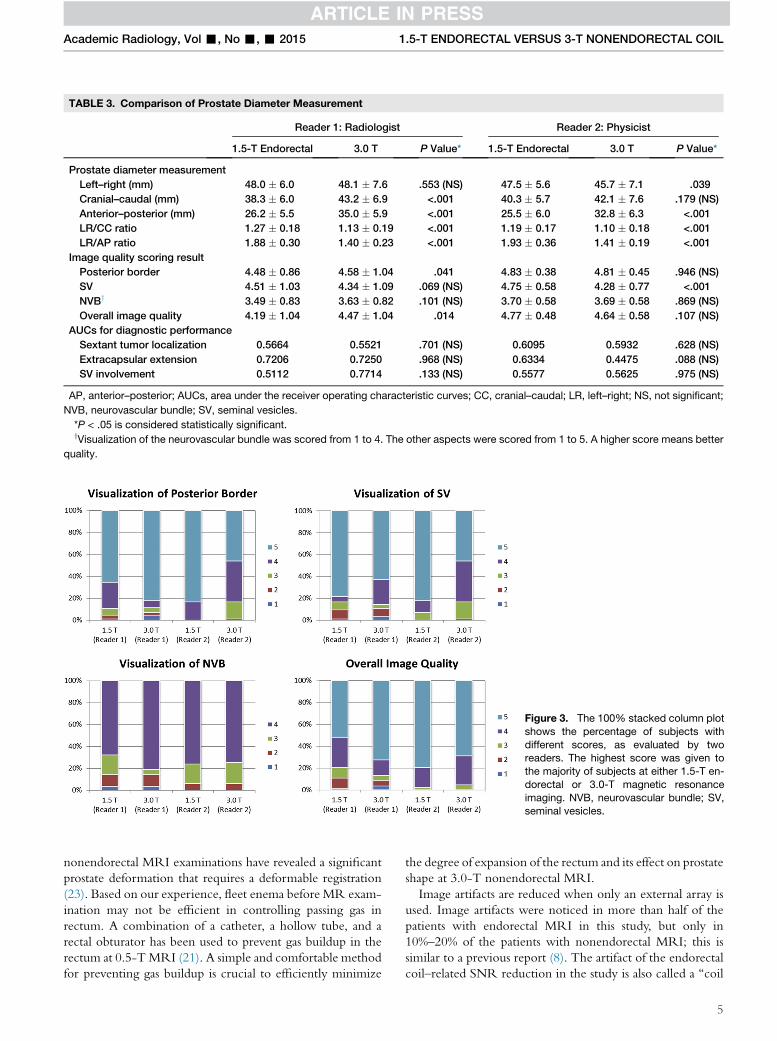
TABLE 3. Comparison of Prostate Diameter Measurement
Reader 1: Radiologist Reader 2: Physicist
1.5-T Endorectal 3.0 T P Value* 1.5-T Endorectal 3.0 T P Value*
Prostate diameter measurement
Left–right (mm) 48.0 � 6.0 48.1 � 7.6 .553 (NS) 47.5 � 5.6 45.7 � 7.1 .039
Cranial–caudal (mm) 38.3 � 6.0 43.2 � 6.9 <.001 40.3 � 5.7 42.1 � 7.6 .179 (NS)
Anterior–posterior (mm) 26.2 � 5.5 35.0 � 5.9 <.001 25.5 � 6.0 32.8 � 6.3 <.001
LR/CC ratio 1.27 � 0.18 1.13 � 0.19 <.001 1.19 � 0.17 1.10 � 0.18 <.001
LR/AP ratio 1.88 � 0.30 1.40 � 0.23 <.001 1.93 � 0.36 1.41 � 0.19 <.001
Image quality scoring result
Posterior border 4.48 � 0.86 4.58 � 1.04 .041 4.83 � 0.38 4.81 � 0.45 .946 (NS)
SV 4.51 � 1.03 4.34 � 1.09 .069 (NS) 4.75 � 0.58 4.28 � 0.77 <.001
NVBy 3.49 � 0.83 3.63 � 0.82 .101 (NS) 3.70 � 0.58 3.69 � 0.58 .869 (NS)
Overall image quality 4.19 � 1.04 4.47 � 1.04 .014 4.77 � 0.48 4.64 � 0.58 .107 (NS)
AUCs for diagnostic performance
Sextant tumor localization 0.5664 0.5521 .701 (NS) 0.6095 0.5932 .628 (NS)
Extracapsular extension 0.7206 0.7250 .968 (NS) 0.6334 0.4475 .088 (NS)
SV involvement 0.5112 0.7714 .133 (NS) 0.5577 0.5625 .975 (NS)
AP, anterior–posterior; AUCs, area under the receiver operating characteristic curves; CC, cranial–caudal; LR, left–right; NS, not significant;
NVB, neurovascular bundle; SV, seminal vesicles.
*P < .05 is considered statistically significant.yVisualization of the neurovascular bundle was scored from 1 to 4. The other aspects were scored from 1 to 5. A higher score means better
quality.
Figure 3. The 100% stacked column plot
shows the percentage of subjects with
different scores, as evaluated by tworeaders. The highest score was given to
the majority of subjects at either 1.5-T en-
dorectal or 3.0-T magnetic resonance
imaging. NVB, neurovascular bundle; SV,seminal vesicles.
Academic Radiology, Vol -, No -, - 2015 1.5-T ENDORECTAL VERSUS 3-T NONENDORECTAL COIL
nonendorectal MRI examinations have revealed a significant
prostate deformation that requires a deformable registration
(23). Based on our experience, fleet enema before MR exam-
ination may not be efficient in controlling passing gas in
rectum. A combination of a catheter, a hollow tube, and a
rectal obturator has been used to prevent gas buildup in the
rectum at 0.5-TMRI (21). A simple and comfortable method
for preventing gas buildup is crucial to efficiently minimize
the degree of expansion of the rectum and its effect on prostate
shape at 3.0-T nonendorectal MRI.
Image artifacts are reduced when only an external array is
used. Image artifacts were noticed in more than half of the
patients with endorectal MRI in this study, but only in
10%–20% of the patients with nonendorectal MRI; this is
similar to a previous report (8). The artifact of the endorectal
coil–related SNR reduction in the study is also called a ‘‘coil
5
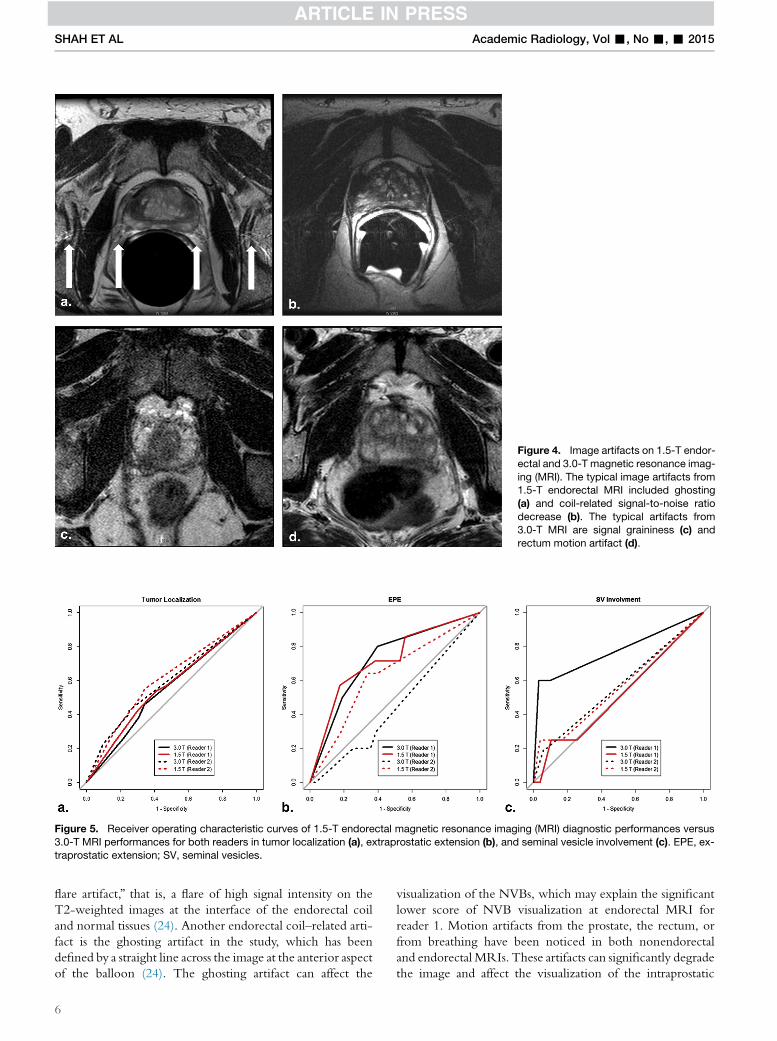
Figure 4. Image artifacts on 1.5-T endor-
ectal and 3.0-T magnetic resonance imag-
ing (MRI). The typical image artifacts from1.5-T endorectal MRI included ghosting
(a) and coil-related signal-to-noise ratio
decrease (b). The typical artifacts from3.0-T MRI are signal graininess (c) and
rectum motion artifact (d).
Figure 5. Receiver operating characteristic curves of 1.5-T endorectal magnetic resonance imaging (MRI) diagnostic performances versus
3.0-T MRI performances for both readers in tumor localization (a), extraprostatic extension (b), and seminal vesicle involvement (c). EPE, ex-traprostatic extension; SV, seminal vesicles.
SHAH ET AL Academic Radiology, Vol -, No -, - 2015
flare artifact,’’ that is, a flare of high signal intensity on the
T2-weighted images at the interface of the endorectal coil
and normal tissues (24). Another endorectal coil–related arti-
fact is the ghosting artifact in the study, which has been
defined by a straight line across the image at the anterior aspect
of the balloon (24). The ghosting artifact can affect the
6
visualization of the NVBs, which may explain the significant
lower score of NVB visualization at endorectal MRI for
reader 1. Motion artifacts from the prostate, the rectum, or
from breathing have been noticed in both nonendorectal
and endorectal MRIs. These artifacts can significantly degrade
the image and affect the visualization of the intraprostatic
Academic Radiology, Vol -, No -, - 2015 1.5-T ENDORECTAL VERSUS 3-T NONENDORECTAL COIL
tissues. The motion artifacts in nonendorectal MRI have been
scaled to appear less significant than those in endorectal MRI
(25). Periodically rotated, overlapping, parallel, lines with
enhancing reconstruction (PROPELLER or BLADE) acqui-
sition scheme (26) may help to reduce the motion artifacts in
prostate T2-weighted images. Further optimization on
BLADE is necessary to maintain high tumor-to-peripheral-
zone contrast in the prostate.
Our study used the scoring system from a report by Sosna
et al. (11) for image quality analysis. Both readers in our report
consistently gave the highest score (most desirable imaging re-
sults) for the majority of patients in all four aspects, which
seems different from the report by Sosna et al. It is important
for all readers to agree on the scoring definitions before their
independent reading; however, it cannot guarantee that two
reports will yield similar scores unless some typical cases could
be shared and jointly reviewed as a benchmark. Reader 1
scored prostate posterior border visualization at 3.0 T, slightly
but significantly higher than at 1.5-Tendorectal MRI, which
may be due to frequent ghosting artifacts induced by the
endorectal coil at 1.5-T MRI. Reader 2 scored SV visualiza-
tion at 3.0 T lower than at 1.5-T endorectal MRI, which
might be due to more bowel peristalsis artifacts without fixa-
tion from the endorectal coil. For overall image quality, reader
1 scored 3.0-T MRI significantly higher than 1.5-Tendorec-
tal MRI, which may have resulted from reader 1 being more
vigilant to image artifacts.
We used the same rating system in ACRIN #6659 trial
report (14) to rate the likelihood of the presence of PZ can-
cer in each sextant by reading axial T2-weighted images.
Both readers rated 3.0-T MRI without an endorectal coil
as comparable to 1.5-T endorectal MRI. This is consistent
with the reading results from the report by Turkbey et al.
(27), who concluded that 3.0-T nonendorectal MRI tends
to identify larger tumors but can miss smaller tumors. The
visibility and delineation of smaller lesions will require a
greater SNR and a higher spatial resolution, which could
be achieved by combining the external array and the endor-
ectal coil at 3.0-T. T2-weighted images with a voxel size of
0.375 � 0.625 � 1.5 mm for a voxel volume of 0.35 mm3
(28), or 0.18 � 0.18 � 4 mm for a voxel volume of
0.13 mm3 (29), have been demonstrated to show excellent
anatomic detail and increased T2 contrast. These are supe-
rior to the T2-weighted images at 3.0-T nonendorectal
MRI in the study (voxel size of 0.729 � 0.909 � 3 mm for
a voxel volume of 1.99 mm3).
Three reports have shown that both 1.5-Tendorectal and 3.0-
T MRI had a similar accuracy for the local staging of prostate
cancer (8,10,12). Our analysis by both readers yielded
nonsignificant results in terms of EPE and SV involvement for
1.5-Tendorectal and 3.0-TMRI that have been noted in previ-
ous reports. For patientswho require an accurate staging of their
prostate cancer, integrated endorectal–pelvic phased-array coils
may beused to improve theSNR(30) and image resolution (31),
resulting in an improvement of EPE specificity (32) and enabling
a delineation of minimal EPE as small as 0.5 mm (25).
We are aware that our study has some limitations.
T2-weighted MR images at 3.0 Twere acquired using a small
field of view (FOV; 140 � 140 mm2), which may be subop-
timal. Sosna et al. compared the image quality of a smaller
FOV (140 � 140 mm2) and a larger FOV (160 � 160 mm2)
at 3.0 T; the latter was shown to have significantly better
image quality (11). Although a 32-channel phased-array coil
has been used at 3.0-TMRI, an emerging upgrade, the digital
coil platform is supposed to improve SNR by up to 40% (33).
Whether the digital coil platform could improve the detection
and staging of prostate cancer still needs rigorous scientific
evaluation. Another limitation is that only T2-weighted
MRI was used in evaluating diagnostic performance. Multi-
parametric imaging combining T2-weighted MRI and func-
tional MRI and may provide better accuracy for tumor
localization (34). It is impossible to do a blinded comparison
of 1.5-T endorectal and 3.0 T because an endorectal coil
significantly dilates the rectum, and the circular shape of the
rectum wall cannot not be missed on axial T2-weighted
MR images. This could potentially create a negative bias
against the endorectal technique. Finally, the two readers
read the images on different workstations (Philips, EBWand
GE, AW) and have different backgrounds (radiology and
radiologic physics), which may partially contribute to the
readers’ inconsistence in the results.
In conclusion, 3.0-T MRI without an endorectal coil pro-
vides prostate images that are natural in shape and that have
comparable image quality to those obtained at 1.5 Twith an
endorectal coil. The diagnostic performance of T2-weighted
MR images at 3.0 Twithout an endorectal coil is not superior
to 1.5-Tendorectal MRI, a finding suggesting that an oppor-
tunity exists for improving technical aspects of 3.0-T prostate
MRI.
REFERENCES
1. Siegel R,Ma J, Zou Z, et al. Cancer statistics, 2014. CACancer J Clin 2014;
64(1):9–29.
2. Mazaheri Y, Shukla-Dave A, Muellner A, et al. MRI of the prostate: clinical
relevance and emerging applications. J Magn Reson Imaging 2011; 33(2):
258–274.
3. Hricak H, Choyke PL, Eberhardt SC, et al. Imaging prostate cancer: a
multidisciplinary perspective. Radiology 2007; 243(1):28–53.
4. Hricak H, White S, Vigneron D, et al. Carcinoma of the prostate gland: MR
imaging with pelvic phased-array coils versus integrated endorectal–
pelvic phased-array coils. Radiology 1994; 193(3):703–709.
5. Rajesh A, Coakley FV. MR imaging and MR spectroscopic imaging of
prostate cancer. Magn Reson Imaging Clin N Am 2004; 12(3):557–579.
6. Heijmink SW, Scheenen TW, van Lin EN, et al. Changes in prostate shape
and volume and their implications for radiotherapy after introduction of en-
dorectal balloon as determined by MRI at 3T. Int J Radiat Oncol Biol Phys
2009; 73(5):1446–1453.
7. Hensel JM, Menard C, Chung PW, et al. Development of multiorgan finite
element-based prostate deformation model enabling registration of en-
dorectal coil magnetic resonance imaging for radiotherapy planning. Int
J Radiat Oncol Biol Phys 2007; 68(5):1522–1528.
8. Park BK, Kim B, Kim CK, et al. Comparison of phased-array 3.0-T and
endorectal 1.5-T magnetic resonance imaging in the evaluation of local
staging accuracy for prostate cancer. J Comput Assist Tomogr 2007;
31(4):534–538.
9. Rouviere O, Hartman RP, Lyonnet D. Prostate MR imaging at high-field
strength: evolution or revolution? Eur Radiol 2006; 16(2):276–284.
7
SHAH ET AL Academic Radiology, Vol -, No -, - 2015
10. Beyersdorff D, Taymoorian K, Knosel T, et al. MRI of prostate cancer at 1.5
and 3.0 T: comparison of image quality in tumor detection and staging. Am
J Roentgenol 2005; 185(5):1214–1220.
11. Sosna J, Pedrosa I, Dewolf WC, et al. MR imaging of the prostate at 3
Tesla: comparison of an external phased-array coil to imaging with an en-
dorectal coil at 1.5 Tesla. Acad Radiol 2004; 11(8):857–862.
12. Torricelli P, Cinquantini F, Ligabue G, et al. Comparative evaluation be-
tween external phased array coil at 3 T and endorectal coil at 1.5 T: prelim-
inary results. J Comput Assist Tomogr 2006; 30(3):355–361.
13. Tahmasebi AM, Sharifi R, Agarwal HK, et al. A statistical model-based tech-
nique for accounting for prostateglanddeformation in endorectal coil-based
MR imaging. Conf Proc IEEE Eng Med Biol Soc 2012; 2012:5412–5415.
14. Weinreb JC, Blume JD, Coakley FV, et al. Prostate cancer: sextant local-
ization at MR imaging and MR spectroscopic imaging before prostatec-
tomy–results of ACRIN prospective multi-institutional clinicopathologic
study. Radiology 2009; 251(1):122–133.
15. Jia G, Abaza R, Williams JD, et al. Amide proton transfer MR imaging of
prostate cancer: a preliminary study. J Magn Reson Imaging 2011; 33(3):
647–654.
16. Pantanowitz L, Sinard JH, Henricks WH, et al. Validating whole slide imag-
ing for diagnostic purposes in pathology: guideline from the College of
American Pathologists Pathology and Laboratory Quality Center. Arch
Pathol Lab Med 2013; 137(12):1710–1722.
17. RobinX, TurckN,HainardA, et al. pROC: anopen-source package for R and
S+ to analyze and compare ROC curves. Bmc Bioinformatics 2011; 12:77.
18. Wu X, Dibiase SJ, Gullapalli R, et al. Deformable image registration for the
use of magnetic resonance spectroscopy in prostate treatment planning.
Int J Radiat Oncol Biol Phys 2004; 58(5):1577–1583.
19. Bharatha A, Hirose M, Hata N, et al. Evaluation of three-dimensional finite
element-based deformable registration of pre- and intraoperative prostate
imaging. Med Phys 2001; 28(12):2551–2560.
20. Pursley J, Risholm P, Fedorov A, et al. A Bayesian nonrigid registration
method to enhance intraoperative target definition in image-guided
prostate procedures through uncertainty characterization. Med Phys
2012; 39(11):6858–6867.
21. Hirose M, Bharatha A, Hata N, et al. Quantitative MR imaging assessment
of prostate gland deformation before and during MR imaging-guided
brachytherapy. Acad Radiol 2002; 9(8):906–912.
22. Schreibmann E, Xing L. Narrow band deformable registration of prostate
magnetic resonance imaging, magnetic resonance spectroscopic
8
imaging, and computed tomography studies. Int J Radiat Oncol Biol
Phys 2005; 62(2):595–605.
23. Brock KK, Nichol AM, Menard C, et al. Accuracy and sensitivity of finite
element model-based deformable registration of the prostate. Med Phys
2008; 35(9):4019–4025.
24. Husband JE, Padhani AR, MacVicar AD, et al. Magnetic resonance imag-
ing of prostate cancer: comparison of image quality using endorectal and
pelvic phased array coils. Clin Radiol 1998; 53(9):673–681.
25. Heijmink SW, Futterer JJ, Hambrock T, et al. Prostate cancer: body-array
versus endorectal coil MR imaging at 3 T–comparison of image quality,
localization, and staging performance. Radiology 2007; 244(1):184–195.
26. Rosenkrantz AB, Bennett GL, Doshi A, et al. T2-weighted imaging of the
prostate: impact of the BLADE technique on image quality and tumor
assessment. Abdom Imaging 2014.
27. Turkbey B, Merino MJ, Gallardo EC, et al. Comparison of endorectal coil
and nonendorectal coil T2W and diffusion-weighted MRI at 3 Tesla for
localizing prostate cancer: correlation with whole-mount histopathology.
J Magn Reson Imaging 2013.
28. Bloch BN, Rofsky NM, Baroni RH, et al. 3 Tesla magnetic resonance imag-
ing of the prostate with combined pelvic phased-array and endorectal
coils: initial experience. Acad Radiol 2004; 11(8):863–867.
29. Futterer JJ, Scheenen TW, Huisman HJ, et al. Initial experience of 3 tesla
endorectal coil magnetic resonance imaging and 1H-spectroscopic imag-
ing of the prostate. Invest Radiol 2004; 39(11):671–680.
30. Kim DY, Schnall MD, Rosen MA, et al. Prostate MR imaging at 3T with a
longitudinal array endorectal surface coil and phased array body coil. J
Magn Reson Imaging 2008; 27(6):1327–1330.
31. Futterer JJ, Heijmink SW, Scheenen TW, et al. Prostate cancer localization
with dynamic contrast-enhanced MR imaging and proton MR spectro-
scopic imaging. Radiology 2006; 241(2):449–458.
32. Futterer JJ, Engelbrecht MR, Jager GJ, et al. Prostate cancer: comparison
of local staging accuracy of pelvic phased-array coil alone versus inte-
grated endorectal-pelvic phased-array coils. Local staging accuracy of
prostate cancer using endorectal coil MR imaging. EurRadiol 2007;
17(4):1055–1065.
33. Serai SD, Merrow AC, Kline-Fath BM. Fetal MRI on a multi-element digital
coil platform. Pediatr Radiol 2013; 43(9):1213–1217.
34. Dickinson L, Ahmed HU, Allen C, et al. Magnetic resonance imaging for the
detection, localisation, and characterisation of prostate cancer: recommen-
dations from a European consensus meeting. Eur Urol 2011; 59(4):477–494.
Related Documents