Performance comparison between Islamic and conventional stocks: evidence from Pakistan’s equity market Munazza Jabeen International Institute of Islamic Economics, International Islamic University, Islamabad, Pakistan, and Saba Kausar Management Science, International Islamic University, Islamabad, Pakistan Abstract Purpose – This paper aims to examine the performance of Islamic and conventional stocks listed at the Pakistan Stock Exchange by using both parametric and non-parametric approaches. The motivation is to do risk-return analysis of Islamic stock prices and conventional stock prices. Design/methodology/approach – It uses various measures of performance, e.g. Sharpe ratio, Treynor ratio, Jensen’s alpha, beta, generalized auto-regressive conditional heteroskedasticity and stochastic dominance. Using the Karachi Meezan Index-30 (KMI-30) and the Karachi Stock Exchange Index-30 (KSE-30) as proxies for Islamic and conventional stock prices, respectively, it examines the performance of Islamic and conventional stocks. The daily data of KMI-30 and KSE-30, covering period from June 9, 2009 to June 20, 2020 are used. Findings – The results show that the overall KMI-30 outperforms the KSE-30. The returns of the KMI-30 are greater than the KSE-30. However, the risk and volatility of the KMI-30 and KSE-30 are similar. Further, the KMI-30 has higher excess returns per unit of total risk than the KSE-30. But both indexes have similar excess returns per unit of systematic risk. Moreover, the KMI-30 returns have stochastically dominance over the KSE- 30 returns. These results reveal that the Islamic index performs better than the conventional index. Practical implications – The findings provide several practical implications in financial and investment decisions making by investors, managers and policymakers such as strategies for asset allocation and investment. Further, in risk management, it provides guidance for allocating portfolios and managing risk. The investment in Islamic stocks may mitigate potential risk within asset portfolios. Originality/value – This research is unique in its approach to the analysis of the performance comparison of conventional and Islamic stock by using comprehensive parametric and non-parametric estimation techniques. Such research has not been undertaken in the Pakistan’s equity market since. Keywords Conventional index, Islamic index, GARCH, Performance measures, Stochastic dominance (SD), Stock performance Paper type Research paper Introduction Islamic equity markets have seen significant growth and progress during the past decade. The main reason for this growth and progress is that there is an increasing number of Islamic and conventional stocks 59 © Munazza Jabeen and Saba Kausar. Published in ISRA International Journal of Islamic Finance. Published by Emerald Publishing Limited. This article is published under the Creative Commons Attribution (CC BY 4.0) licence. Anyone may reproduce, distribute, translate and create derivative works of this article (for both commercial and non-commercial purposes), subject to full attribution to the original publication and authors. The full terms of this licence maybe seen at http://creativecommons. org/licences/by/4.0/legalcode. This article is based on an earlier version of the paper titled “a comparison between Islamic and conventional stock prices performance: evidence from Pakistan’s equity market,” which was presented at the 6th International Conference on Islam and Liberty, Islamabad held on November 14–15, 2018. The current issue and full text archive of this journal is available on Emerald Insight at: https://www.emerald.com/insight/0128-1976.htm Received 19 July 2020 Revised 4 October 2020 10 June 2021 15 September 2021 5 October 2021 Accepted 25 October 2021 ISRA International Journal of Islamic Finance Vol. 14 No. 1, 2022 pp. 59-72 Emerald Publishing Limited e-ISSN: 2289-4365 p-ISSN: 0128-1976 DOI 10.1108/IJIF-07-2020-0150

Welcome message from author
This document is posted to help you gain knowledge. Please leave a comment to let me know what you think about it! Share it to your friends and learn new things together.
Transcript

Performance comparison betweenIslamic and conventional stocks:
evidence from Pakistan’sequity market
Munazza JabeenInternational Institute of Islamic Economics, International Islamic University,
Islamabad, Pakistan, and
Saba KausarManagement Science, International Islamic University, Islamabad, Pakistan
Abstract
Purpose – This paper aims to examine the performance of Islamic and conventional stocks listed at thePakistan Stock Exchange by using both parametric and non-parametric approaches. The motivation is to dorisk-return analysis of Islamic stock prices and conventional stock prices.Design/methodology/approach – It uses variousmeasures of performance, e.g. Sharpe ratio, Treynor ratio,Jensen’s alpha, beta, generalized auto-regressive conditional heteroskedasticity and stochastic dominance.Using the KarachiMeezan Index-30 (KMI-30) and the Karachi Stock Exchange Index-30 (KSE-30) as proxies forIslamic and conventional stock prices, respectively, it examines the performance of Islamic and conventionalstocks. The daily data of KMI-30 and KSE-30, covering period from June 9, 2009 to June 20, 2020 are used.Findings – The results show that the overall KMI-30 outperforms the KSE-30. The returns of the KMI-30 aregreater than the KSE-30. However, the risk and volatility of the KMI-30 and KSE-30 are similar. Further, theKMI-30 has higher excess returns per unit of total risk than the KSE-30. But both indexes have similar excessreturns per unit of systematic risk. Moreover, the KMI-30 returns have stochastically dominance over the KSE-30 returns. These results reveal that the Islamic index performs better than the conventional index.Practical implications – The findings provide several practical implications in financial and investmentdecisions making by investors, managers and policymakers such as strategies for asset allocation andinvestment. Further, in riskmanagement, it provides guidance for allocating portfolios andmanaging risk. Theinvestment in Islamic stocks may mitigate potential risk within asset portfolios.Originality/value –This research is unique in its approach to the analysis of the performance comparison ofconventional and Islamic stock by using comprehensive parametric and non-parametric estimation techniques.Such research has not been undertaken in the Pakistan’s equity market since.
Keywords Conventional index, Islamic index, GARCH, Performance measures, Stochastic dominance (SD),
Stock performance
Paper type Research paper
IntroductionIslamic equity markets have seen significant growth and progress during the past decade.The main reason for this growth and progress is that there is an increasing number of
Islamic andconventional
stocks
59
© Munazza Jabeen and Saba Kausar. Published in ISRA International Journal of Islamic Finance.Published by Emerald Publishing Limited. This article is published under the Creative CommonsAttribution (CCBY4.0) licence. Anyonemay reproduce, distribute, translate and create derivativeworksof this article (for both commercial and non-commercial purposes), subject to full attribution to theoriginal publication and authors. The full terms of this licence maybe seen at http://creativecommons.org/licences/by/4.0/legalcode.
This article is based on an earlier version of the paper titled “a comparison between Islamic andconventional stock prices performance: evidence from Pakistan’s equity market,” which was presentedat the 6th International Conference on Islam and Liberty, Islamabad held on November 14–15, 2018.
The current issue and full text archive of this journal is available on Emerald Insight at:
https://www.emerald.com/insight/0128-1976.htm
Received 19 July 2020Revised 4 October 2020
10 June 202115 September 2021
5 October 2021Accepted 25 October 2021
ISRA International Journal ofIslamic Finance
Vol. 14 No. 1, 2022pp. 59-72
Emerald Publishing Limitede-ISSN: 2289-4365p-ISSN: 0128-1976
DOI 10.1108/IJIF-07-2020-0150

investors seeking investment in Shar�ıʿah-compliant financial instruments. The Shar�ıʿah(Islamic law) principles relating to the prohibition of rib�a (interest), gharar (excessiveuncertainty), maysir (speculation) and engagement in unethical financial transactions formthe foundation of Islamic equity markets (Shanmugam and Zahari, 2009). Under thisframework, investments in equity capital are consistent with ethically oriented and sociallyresponsible investments. These characteristics distinguish Islamic equity markets from theirconventional counterparts.
Compared to studies on conventional stockmarkets, empirical studies on Shar�ıʿah-compliantstocks are still scarce, despite the growth of the Islamic equity market. Empirical research onstock markets tends to focus on risk-return analysis and performance in diverse markets toinvestigate key features of stockprices (Rana andAkhter, 2015; Bahloul et al., 2017; BayramandOthman, 2019; Trabelsi et al., 2020). The majority of studies evaluate the performancecomparison of different stock indexes by using parametric approaches such as the capital assetpricing model (CAPM) statistics and non-parametric approaches such as generalized auto-regressive conditional heteroskedasticity (GARCH) and stochastic dominance (SD) (Al-Khazaliet al., 2014; Jawadi et al., 2014; Rana and Akhter, 2015; Shah et al., 2017; Abduh, 2020).
The parametric approach such as CAPM is based on the assumption of normality. It reliesonly on the first two moments of the returns distribution to test the performance of stocks. Itdepends on quadratic utility functions and is, therefore, not adequate for non-normaldistributions or non-quadratic investors’ utility functions. The non-parametric approachessuch as GARCH and SD incorporate the non-normality in returns distribution and could leadto different conclusions compared to the parametric approach. The SD approach does notrequire an explicit specification of utility of the investor or constraints on the probabilitydistribution function. Instead, it is based on “general assumptions about non-satiety and riskpreferences of investors” and takes the cumulative distribution of returns into account, notjust the first two moments (Kuosmanen, 2001, p. 1,394).
The studies on the performance comparison of Islamic and conventional stocks showmixed results. Some studies conclude that, based on both return and risk performance,Islamic stocks perform better than conventional stocks (Al-Zoubi and Maghyereh, 2007;Al-Khazali et al., 2014; Jawadi et al., 2014; Abduh, 2020). Some other studies report that Islamicstocks underperform conventional stocks (Hayat andKraeussl, 2011; Rana andAkhter, 2015).However, Albaity andAhmad (2008), Abbes (2012), Bayram andOthman (2019), andTrabelsiet al. (2020) found that no substantial difference exists between Islamic and traditional stocks’performance. The main reason behind these mixed results is that these studies use “eitherparametric (CAPM statistics) or non-parametric (GARCH, SD) approaches to compare theperformance of conventional and Islamic stocks” (Jabeen et al., 2018, p. 2).
Keeping in view the different techniques being used in the literature for comparison ofIslamic and conventional stocks and their underlying assumptions about the utility function,nature of distribution and other aspects, this paper refers to a wider range of approaches tocompare the performance of Islamic and conventional stocks to get more robust results.
For this purpose, this paper aims to examine the performance of Islamic and conventionalstocks listed on the Pakistan Stock Exchange (PSX) by using both parametric and non-parametric approaches to compare the results. The motivation is to perform risk-returnanalysis of Islamic and conventional stocks by considering higher moments of stock pricesand the characteristics of their distribution to investigate the following research question: doIslamic stocks perform better than conventional stocks based on risk-return analysis?
This paper empirically studies the performance comparison of the stocks by usingdifferent non-risk- and risk-adjusted performance measures. The Karachi Meezan Index-30(KMI-30) and the Karachi Stock Exchange Index-30 (KSE-30) are used as proxies for Islamicstock prices and conventional stock prices, respectively. To evaluate the risk-returnperformance of the KMI-30 and KSE-30, various performance measures such as Treynor
IJIF14,1
60

ratio, Sharpe ratio, beta, GARCH, Jensen’s alpha and the SD approach are used by consideringdata ranging from June 9, 2009 to June 20, 2020.
This paperwill contribute to the Islamic finance literature by analyzing the combination ofboth parametric and non-parametric approaches to test the performance comparison ofIslamic and conventional stocks with respect to returns and risks in the context of Pakistan.The findings of this paper would be useful for individuals, investors, managers andpolicymakers in making investment decisions and devising investment strategies.
The layout of the paper is as follows: the next section reviews the relevant literature; it isfollowed by a description of the data andmethods used in the research; the next section providesthe empirical findings and a discussion thereof; and the last section concludes the study.
Literature reviewResearch on the performance comparison of Islamic and conventional stocks finds mixedresults in the literature. Studies focus on risk-return analysis and performance of stocks indifferent markets to investigate key features of stocks. They analyze performancecomparison based on both return and risk performance measures by using parametricmethodologies and non-parametric approaches.
Several studies compare return and risk performance by using the CAPM and CAPMstatistics. On the one hand, some studies find that the Islamic index outperforms theconventional index. For example, comparing the return performance of Islamic andconventional stock indexes, Hakim and Rashidian (2004) find that the Dow Jones IslamicMarket Index (DJIM) performs relatively well in comparison to the Dow Jones Global Index(DJ Global) and underperforms in comparison to Dow Jones SustainabilityWorld Index (DJSIWorld). Also, Hussein (2004) concludes that FTSE-Global Islamic Index performs better thanFTSE All-World Index in terms of returns. Similarly, Albaity and Ahmad (2008) show thatKuala Lumpur Composite Index (KLCI) significantly outperforms Kuala Lumpur ShariahIndex (KLSI). Alam and Ansari (2020) also find that the returns of Islamic stock indexesprovide superior performance to conventional stock indexes in India.
On the other hand, Girard and Hassan (2005) find no difference in returns between Islamicand non-Islamic indexes while examining the comparative performance of DJIMwith its non-Islamic counterparts. Ata and Bu�gan (2015) also conclude that there is no significantdifference between the return performance of Islamic and conventional Dow Jones Turkey(DJTR) and Morgan Stanley indexes (MSCI) for Turkey. Similarly, while comparing theperformance of KATILIM 50 and BIST 100 indexes in Turkey’s stock market, Bayram andOthman (2019) find no significant difference between the performance of the KATILIM 50index and BIST 100 index. The findings of Abbes (2012), Trabelsi et al. (2020) and Aarif et al.(2021) support the previous studies that there is no substantial difference in returnperformance between Islamic and conventional stocks in developed and emerging stockmarkets. In another study, Hussein and Omran (2005) find that DJIM outperforms itscounterpart indexes over the bull period and underperforms its counterpart indexes over thebear period. But, Liu and Chang (2021) discover that Islamic stockmarkets exhibit dominanceover conventional stock markets in bearish periods.
Analyzing the performance of relative risk of DJIM and DJ Global, Al-Zoubi andMaghyereh (2007) conclude that the Islamic index outperforms the Global index on the basisof risk. DJIM has lower risk than DJ Global because of the profit-and-loss-sharing principle.On the other hand, Rana andAkhter (2015) show that KMI-30 underperforms KSE-100 on thebasis of risk. The reasons for the low performance of the Islamic stocks are high monitoringcosts and smaller investment magnitude.
Analyzing risk and return through CAPM–GARCH, Abu-Alkheil et al. (2020) compare theperformance of Islamic and conventional stock indexes of DJ Global, MSCI, FTSE, Standard &
Islamic andconventional
stocks
61
Poor’s (S&P) and Jakarta Islamic Index (JII). Their findings reveal that Islamic stock indexes areless responsive to averagemarket changes than conventional stock indexes having similar risk.The Islamic stock indexes underperform conventional stock indexes. However, through CAPMstatistics, Suryadi et al. (2021) find that the JII has larger excess returns while having the samerisk as compared to its conventional counterparts in Indonesia. Asutay et al. (2021), using theCAPM–EGARCH model, undertake performance comparison between Islamic andconventional indices based on four main markets: worldwide, the USA, Europe and Asia–Pacific. Their finding shows that Islamic indexes yield higher average returns and lower risksin comparison to conventional indexes.
Through the CAPM–GARCH model, Jawadi et al. (2014) conclude that before the globalfinancial crisis (GFC) of 2008, conventional indexes outperform Islamic indexes, whereasIslamic indexes outperform conventional indexes after the GFC of 2008. Asutay et al. (2021),using the CAPM–EGARCH model, find that Islamic indexes outperformed conventionalindexes during the GFC period and the post-crisis phase, particularly in the European andAsia–Pacific markets. Using the SD methodology, Al-Khazali et al. (2014) compareconventional Dow Jones indexes to Islamic Dow Jones indexes. They discover that allconventional stock indexes stochastically dominate Islamic stock indexes. In a study, Abduh(2020) analyzes the effect of the GFC on the performance of stocks in Malaysia and concludesthat the performance of Islamic stocks is high, and they are less volatile in the time of financialcrises as compared to conventional stocks. Also, Liu and Chang (2021) find that Islamic stockmarkets have emerged as a superior investment alternative since the GFC.
Comparing the performance of conventional and Islamic foreign portfolios, Hendranastitiand Asutay (2016) compare the portfolio performance of Shar�ıʿah portfolios and thecounterpart portfolios in the UK. They conclude that the Shar�ıʿah portfolios have higher riskthan the counterpart portfolios. Abu-Alkheil et al. (2017), Bahloul et al. (2017) andAbu-Alkheilet al. (2017) conclude that Islamic indexes are better hedging investments and betteralternative investments in the time of financial downturns. Hence, they are a good substitutefor conventional stocks. Similarly, Gonz�alez et al. (2019) find that Islamic sector portfoliosoutperform conventional sector portfolios on all performance measures. Empirical resultsfrom Ben Rejeb and Arfaoui (2019), on the basis of informational efficiency and risk, indicatethat Islamic stock indexes are more efficient and volatile than their conventional stockindexes. Hoque et al. (2020) compare the performance of Islamic and conventional stockportfolios in Malaysia. They find that, according to CAPM statistics, Islamic stock portfoliosgenerate a higher return while having a lower systematic risk than conventional stockportfolios. According to the SD approach, Islamic stock portfolios outperform conventionalstock portfolios in terms of portfolio returns. Overall, the risk-sharing Islamic stock portfoliosoutperform the risk-bearing conventional stock portfolios in terms of returns.
The preceding literature shows different conclusions on the performance comparison ofconventional and Islamic stocks. Several researchers have found that Islamic stocksoutperform conventional stocks. However, some research show that conventional stocksoutperform their counterparts. This finding varies from developed countries to emergingcounties, before and after the GFC of 2008, and from parametric and non-parametricmethodologies. However, there is a need to study the performance comparison ofconventional and Islamic stocks in terms of both returns and risk by employing acombination of both non-parametric and parametric approaches.
DataThis paper uses the price data of KMI-30 and KSE-30 as proxies for Islamic stock prices andconventional stock prices, respectively. The market index is the KSE-100. It also uses theT-bill rate of six months for measuring the risk-free rate. The daily stock price data from the
IJIF14,1
62

period June 9, 2009 to June 30, 2020, for each index and the six-month T-bills rate are used forthe analysis. The KMI-30 was launched in 2009, while the KSE-30 was launched in 2006;therefore, for the performance comparison, their data from June 2009 is taken for analysis.The sources of data are the PSX and International Financial Statistics (IFS).
Karachi Meezan Index-30 and the Karachi Stock Exchange Index-30The KMI-30 is a Shar�ıʿah-compliant stock index comprising the top 30 qualifying companieslisted on the PSX,while the KSE-30 is a conventional stock index of 30 companies listed on thePSX. Both indexes are generated using the free-float market capitalization technique.According to the PSX, the KMI-30 level reflects the free-float market value of 30 Shar�ıʿah-compliant companies’ shares over the base period, while the KSE-30 level reflects the free-float market value of 30 conventional companies’ shares over the base period.
MethodologyFor the performance comparison between Islamic and conventional indexes in Pakistan’sequity market, this paper examines the return and risk characteristics of each index. It alsoinvestigates the risk-adjusted performance of each index.
The autoregressivemoving average (ARMA) (p, q) GARCH (p, q) model is used to comparethe return and volatility performance of Islamic and conventional stock indexes. The ARMA(p, q) GARCH (p, q) model is specified as follows:
Ri;t ¼ ci þXpl¼1
δi;lRi; t−l þXqm¼1
wi;mεi;t−m þ εi;t (1)
hi;t ¼ ωi þXpj¼1
θi;jε2t−j þXqk¼1
∅i;kht−k (2)
whereRi;t is the return of an index i, and hi;t is a conditional variance of the return of an index i,which denotes stock price volatility. Moreover, ωi > 0, θi;j ≥ 0 and∅i;j ≥ 0. For the estimationof the GARCH model, the maximum likelihood (MLE) method is used.
In addition to examining the first two moments, this paper also examines third-ordermoments of the index series. For this, the SD non-parametric test statistic is used to check thedominance of any pair of the returns series. The three SD approach rules, named first-orderSD (FSD), second-order SD (SSD) and third-order SD (TSD), are based on a utility function,which is given by Hadar and Russell (1969). To check the SD, the Kolmogorov–Smirnov (KS)type test by Barrett and Donald (2003) is used. The description of the KS type test is asfollows:
Let fLig, where i 5 1, 2,. . . . . ., N is a random sample drawn from a population withcumulative distribution function (CDF), be denoted by FLðaÞ of KSE-30 returns, and thenotationDs
LðaÞ is the function that integrates FLðaÞ to sthSD orders, where a> 0 for all cases.The following rules explain the three orders of SD:
D1LðaÞ ¼ FLðaÞ For FSD (3)
D2LðaÞ ¼
Z a
0
FLðuÞdu ¼Z a
0
D1LðuÞdu For SSD (4)
D3LðaÞ ¼
ZZ a
0
FLðυÞdυdu ¼Z a
0
D2LðuÞdu For TSD (5)
Islamic andconventional
stocks
63
In the same way, suppose fMig, i5 1,2,. . ., N, is a random sample drawn from a populationwith CDF denoted by FM ðaÞ of KMI-30 returns and the notation Ds
M ðaÞ is the function thatintegrates FM ðaÞ to sth SD orders.
The null hypothesis states that the returns series (KSE-30) named “L” stochasticallydominates over the return series of KMI-30 returns named “M”. The alternative hypothesis,on the other hand, suggests that distribution M stochastically outperforms distribution L.The null and alternative hypotheses for testing the SD order of returns “L” over asset “M” areas follows:
Hs0 : D
sLðaÞ≤Ds
MðaÞ for all a ðstock returnsÞHs
1 : DsLðaÞ≤Ds
MðaÞ for all a ðstock returnsÞThe following KS test by Barrett and Donald (2003) is used to test the null hypothesis ðHs
0Þ:
Ks ¼ N 2
2N
!1=2
sup
a$�D−s
L ðaÞ � D−sM ðaÞ � (6)
This test is used for SD of the second (s5 2) or higher orders (s> 2). The simulation approachis used to derive p-values for the underlying null hypothesis to determine the value of thesuprema of test statistics, Ks.
The risk-adjusted returns of Islamic and conventional stock indexes are computed fromCAPM statistics such as Sharpe ratio, Treynor ratio (TR) and Jensen’s alpha for performancecomparison. The daily returns series of an index i, Ri;t is constructed as logarithmic firstdifference of closing prices over the period ½t; t þ 1�. The standard deviation of returns of anindex i, σðRi;tÞ is used for the total risk for returns of an index i. The returns and standarddeviation of the returns and CAPM statistics are commonly employed to evaluate stockperformance.
The Sharpe ratio, which measures the average risk premium per unit of total risk, iscomputed as follows:
SR ¼ Ri;t – Rf ;t
σðRi;tÞ (7)
where Ri;t is the return of an index i, Rf ;t is the risk-free return and σðRi;tÞ is the standarddeviation of return of an index i.
The Sharpe ratio indicates that an index with a greater sharp ratio (SR) has largerexcess returns with the same risk. As a result, its financial performance has improved. Inaddition, if the SR is positive (negative), it signifies that an index i outperforms(underperforms) risk-free assets.
The Treynor ratio, which measures the average risk premium per unit of systematic risk,is computed as follows:
TR ¼ Ri;t � Rf ;t
βi; βi ¼
Cov ðRi;t ; RM ;tÞσ2M ;t
(8)
where βi is the market beta of return of an index i. It is computed as the ratio of thecovariance between the return Ri;t and the market return RM ;t to the variance of the marketreturn σ2M ;t.
The Treynor ratio illustrates that an index with a greater TR has larger excess returnswith the same systematic risk. As a result, its financial performance has improved.
IJIF14,1
64

Jensen’s alpha measures the performance of risk-adjusted returns and is computed fromthe CAPM as follows:
Ri;t � Rf ;t ¼ αþ βðRM ;t � Rf ;tÞ (9)
where α is the Jensen alpha, Ri;t − Rf ;t is the excess return of an index i and RM ;t − Rf ;t
is the excess market return toward risk-free return.
Empirical findingsNon-risk-adjusted returns characteristicsThe plot of daily prices of the KMI-30 and KSE-30 over the sample period is given in Figure 1.It shows that the prices of the KMI-30 are larger than the prices of the KSE-30 in Pakistan’sequity market. Abbes (2012) reports similar findings for emerging markets.
The plots of daily returns of the KMI-30 and KSE-30 over the sample period are given inFigure 2. The returns show no discernible trend. The figure shows that index returns quicklyreturn to their mean. It also shows that index returns’ variances fluctuate over time andvolatility tends to cluster.
Table 1 presents descriptive statistics for KMI-30 and KSE-30 returns. The KMI-30 andKSE-30 returns are positive on average. The daily mean return of KMI-30 is 0.061% and0.025% for KSE-30. Thus, the KMI-30 has higher returns than the KSE-30. It implies Islamicstocks have higher returns as compared to conventional stocks. The standard deviation,which measures unconditional volatility, shows variations across returns of KMI-30 andKSE-30. As a measure of total risk, the values of standard deviation also show KMI-30 andKSE-30 having similar risks, about 1.2%. It implies that Islamic and conventional stocks havesimilar risk. Both KMI-30 and KSE-30 are negatively skewed because the mean is lower thanthe median and mode. Both KMI-30 and KSE-30 series show excess kurtosis, indicatingheavy-tailed and leptokurtic distribution of the daily stock returns. Both the KMI-30 and
Figure 1.Daily prices of KSE-30
and KMI-30
Islamic andconventional
stocks
65

KSE-30 reveal non-normality in distributions, as indicated by the significant Jarque–Bera teststatistic. Using the augmented Dickey–Fuller (ADF) test, KMI-30 and KSE-30 showstationarity in the first difference form. The Ljung–Box–PierceQ-statistic andQ2-statistic atlags 10 indicate the presence of serial correlation in residuals and squared residuals, andLagrange multiplier (LM) test statistic at lags 1 to 10 shows evidence of ARCH effect.
The descriptive analysis shows mean reverting, stationarity, non-normality and volatilityclustering characteristics of each index return. This finding is consistent with the studies ofJawadi et al. (2014), Rana and Akhter (2015) and Abu-Alkheil et al. (2020). This descriptiveanalysis exhibits stocks returns are positive and have similar risk. The stock returns havenon-normal distribution. The past shocks to returns affect the current period returns.
Volatility characteristicsFor the KMI-30 and KSE-30 returns, Table 2 displays the estimated ARMA (1,0)-GARCH (1,1)(1,1) model. The conditional mean equation demonstrates that both the KMI-30 and KSE-30have positive average daily returns. However, the KMI-30 has larger returns than theKSE-30.This finding shows better performance of Islamic stocks in terms of returns. The ARCH andGARCH coefficients are significant, according to the estimated parameters of GARCH (1,1)
Daily returns
KMI-30 KSE-30Mean 0.00061 0.00025Standard deviation 0.01190 0.01179Skewness �0.40542** �0.41001**Excess kurtosis 4.0990** 3.6839**Jarque–Bera 1994.0** 1626.8**ADF test statistic (with intercept) �29.5448** (2) �28.9141** (2)LM–ARCH 1-2 175.69** (0.0000) 174.04** (0.0000)LM–ARCH 1-5 109.32** (0.0000) 113.85** (0.0000)LM–ARCH 1-10 65.358** (0.0000) 67.357** (0.0000)LB-Q(10) 37.9867** (0.0000) 50.1622** (0.0000)LB-Q(10)2 1443.61** (0.0000) 1395.83** (0.0000)
Note(s): p-values are in parentheses, ** indicates significance at 1%Source(s): Authors’ own
Figure 2.Daily returns of KSE-30 and KMI-30
Table 1.Descriptive statisticsand diagnostic checksof daily returns of KMI-30 and KSE-30
IJIF14,1
66

for KMI-30 and KSE-30 returns. It implies the current variance of both KMI-30 and KSE-30returns strongly depends on past shocks and past variances. The estimates of the conditionalvariance equation exhibit volatility persistence. These findings are consistent with thestudies of Jawadi et al. (2014), Rana and Akhter (2015), and Abu-Alkheil et al. (2020).
The adequacy of the GARCHmodel is checked through diagnostic tests. The Jarque–Berastatistics, Ljung–Box–Pierce Q-statistic and Q2-statistic and LM–ARCH tests show non-normality, no serial autocorrelation and heteroskedasticity in stock returns. This implies thatthe GARCH (1,1) model can capture the serial autocorrelation in returns and squared returns.The GARCH (1,1) model adequately captures the volatility dynamics in stock returns.Furthermore, though the GARCH (1,1) model captures the non-normality in returns up tosome extent, the excess skewness and kurtosis are still present. The goodness of fit tests showthat the data are fitted to the model well.
Table 3 presents conditional means and conditional variances estimated from GARCH(1,1) for KMI-30 and KSE-30 returns. The conditional means show the KMI-30 and KSE-30have positive daily average returns, but the returns of the KMI-30 are higher than the KSE-30.It implies higher performance in terms of returns for Islamic stocks. However, the conditionalvariances of both the KMI-30 and KSE-30 are similar.
Parameters Daily returnsKMI-30 KSE-30
Mean equationc (constant) 0.0012** (0.0000) 0.0007** (0.0000)δ1 (AR(1)) 0.1345** (0.0000) 0.1538** (0.0000)
Variance equationω(constant) 0.0584** (0.0000) 0.0534** (0.0000)θ1 ARCH-Co 0.1312** (0.0000) 0.1290** (0.0000)f1 GARCH-Co 0.8279** (0.0000) 0.8338** (0.0000)θ1 þ f1 0.95920 0.96289AIC �6.2506 �6.2530SIC �6.2398 �6.2422Log-likelihood 8,571.488 8,574.836Skewness �0.1936 �0.1542Excess kurtosis 1.4717 1.2247Jarque–Bera 264.51** 182.17**LM–ARCH 1-2 0.2962 (0.7436) 1.0057 (0.3659)LM–ARCH 1-5 0.9341 (0.4576) 0.9883 (0.4232)LM–ARCH 1-10 0.7136 (0.7124) 0.9195 (0.5139)LB-Q(10) 7.2824 (0.6077) 7.7686 (0.5576)LB-Q(10)2 7.4008 (0.4941) 9.5886 (0.2951)χ2(40) 120.0142** (0.0000) 108.8358** (0.0000)
Note(s): p-values are in parentheses, ** indicates significance at 1% and * significance at 5%Source(s): Authors’ own
Parameters KMI-30 KSE-30
Conditional mean 0.0011 0.0007Conditional variance 0.00014 0.00013
Source(s): Authors’ own
Table 2.ARMA (1,1) - GARCH
(1,1) model
Table 3.Conditional means and
variances of KMI-30and KSE-30
Islamic andconventional
stocks
67
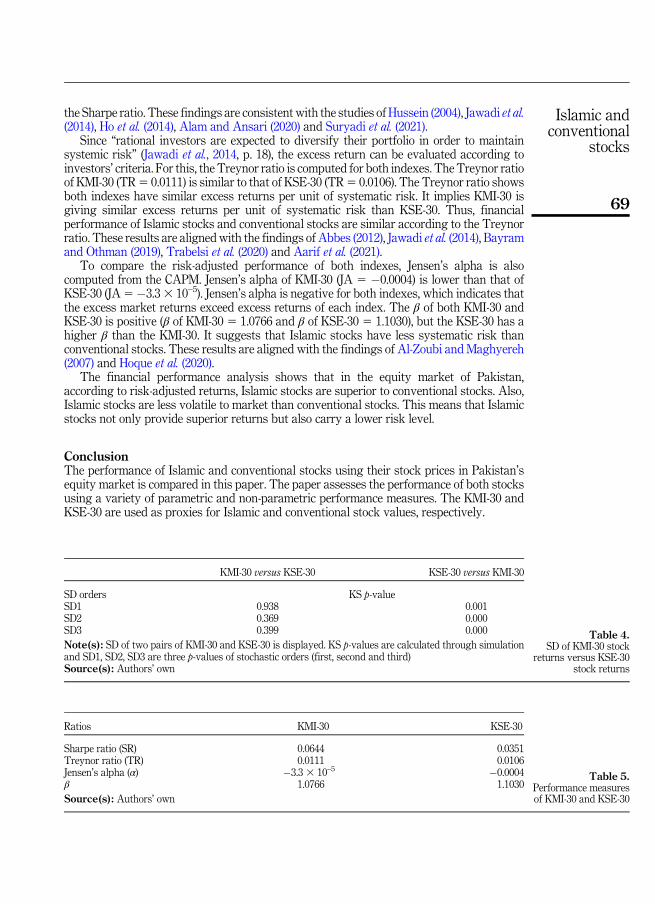
The plots of the daily volatility of KMI-30 and KSE-30 series show that the volatility ofKMI-30 and KSE-30 are similar. This implies volatility patterns of both the Islamic andconventional indexes are similar.
This risk and return analysis shows positive and volatile returns produced in the equitymarket in Pakistan. High volatility persistence exists in stock returns.
Stochastic dominance approachFigure 3 shows that the CDF of KMI-30 returns is on the right side of the CDF of KSE-30returns. This means that the KMI-30 returns outperform its counterpart KSE-30 returns interms of SD.
Table 4 displays the results of the SD test using theKS test. The p-values of theKS test of nullhypotheses are also shown in the table. The first column of the table shows the SD orders, thenthe secondand third columns present the p-values of theKS test. All three SDorders’KS p-valuesaremore than any acceptable significance level. This implies that theKMI-30 returns outperformthe KSE-30 returns in all three SD orders. By contrast, the p-values under the heading of KSE-30returns against the KMI-30 returns show that KSE-30 returns do not perform better at any SDorder. These findings contradict those of Al-Khazali et al. (2014), who found that conventionalequities have a stochastically superior return compared to Islamic stocks.
Risk-adjusted returns characteristicsTable 5 reports different performance measures of KMI-30 and KSE-30 by using CAPMstatistics. The Sharpe ratio of KMI-30 (SR5 0.0644) is higher than KSE-30 (SR5 0.0351). TheSharpe ratio shows that the KMI-30 has higher excess returns per unit of total risk than theKSE-30. It implies KMI-30 is giving better excess returns per unit of total risk than KSE-30.Thus, financial performance of Islamic stocks is better than conventional stocks according to
Note(s): This figure shows the cumulative distribution function of KMI-30 index returns (dashed line) and KSE-30 index returns (solid line) Source(s): Authors’ own
0.2
.4.6
.81
0daily_return
c_Return_KSE30 c_Return_KMI30
–0.05 0.05
Figure 3.SD of KMI-30 returnsover KSE-30 returns
IJIF14,1
68
the Sharpe ratio. These findings are consistent with the studies of Hussein (2004), Jawadi et al.(2014), Ho et al. (2014), Alam and Ansari (2020) and Suryadi et al. (2021).
Since “rational investors are expected to diversify their portfolio in order to maintainsystemic risk” (Jawadi et al., 2014, p. 18), the excess return can be evaluated according toinvestors’ criteria. For this, the Treynor ratio is computed for both indexes. The Treynor ratioof KMI-30 (TR5 0.0111) is similar to that of KSE-30 (TR5 0.0106). The Treynor ratio showsboth indexes have similar excess returns per unit of systematic risk. It implies KMI-30 isgiving similar excess returns per unit of systematic risk than KSE-30. Thus, financialperformance of Islamic stocks and conventional stocks are similar according to the Treynorratio. These results are aligned with the findings of Abbes (2012), Jawadi et al. (2014), Bayramand Othman (2019), Trabelsi et al. (2020) and Aarif et al. (2021).
To compare the risk-adjusted performance of both indexes, Jensen’s alpha is alsocomputed from the CAPM. Jensen’s alpha of KMI-30 (JA 5 �0.0004) is lower than that ofKSE-30 (JA5�3.33 10–5). Jensen’s alpha is negative for both indexes, which indicates thatthe excess market returns exceed excess returns of each index. The β of both KMI-30 andKSE-30 is positive (β of KMI-30 5 1.0766 and β of KSE-30 5 1.1030), but the KSE-30 has ahigher β than the KMI-30. It suggests that Islamic stocks have less systematic risk thanconventional stocks. These results are aligned with the findings of Al-Zoubi and Maghyereh(2007) and Hoque et al. (2020).
The financial performance analysis shows that in the equity market of Pakistan,according to risk-adjusted returns, Islamic stocks are superior to conventional stocks. Also,Islamic stocks are less volatile to market than conventional stocks. This means that Islamicstocks not only provide superior returns but also carry a lower risk level.
ConclusionThe performance of Islamic and conventional stocks using their stock prices in Pakistan’sequity market is compared in this paper. The paper assesses the performance of both stocksusing a variety of parametric and non-parametric performance measures. The KMI-30 andKSE-30 are used as proxies for Islamic and conventional stock values, respectively.
Ratios KMI-30 KSE-30
Sharpe ratio (SR) 0.0644 0.0351Treynor ratio (TR) 0.0111 0.0106Jensen’s alpha (α) �3.3 3 10–5 �0.0004β 1.0766 1.1030
Source(s): Authors’ own
KMI-30 versus KSE-30 KSE-30 versus KMI-30
SD orders KS p-valueSD1 0.938 0.001SD2 0.369 0.000SD3 0.399 0.000
Note(s): SD of two pairs of KMI-30 and KSE-30 is displayed. KS p-values are calculated through simulationand SD1, SD2, SD3 are three p-values of stochastic orders (first, second and third)Source(s): Authors’ own
Table 5.Performance measuresof KMI-30 and KSE-30
Table 4.SD of KMI-30 stock
returns versus KSE-30stock returns
Islamic andconventional
stocks
69
According to the findings, the overall KMI-30 outperforms the KSE-30. The KMI-30particularly outperforms the KSE-30 in terms of returns. The KMI-30 and KSE-30, on theother hand, have similar risk and volatility levels. Furthermore, the KMI-30 has higher excessreturns per unit of total risk than the KSE-30. However, both indexes have similar excessreturns per unit of systematic risk. Moreover, the KMI-30 returns have SD over the KSE-30returns. As a result, the Islamic index outperforms the conventional index. Based on thefindings, it is observed that profit-and-loss sharing, comparatively lower risk, limits on shortselling, and other factors contribute to Islamic stocks’ superior performance overconventional stocks. These findings are especially intriguing in terms of diversificationand investment opportunities for the investment in stocks. Controlling the risk associatedwith stocks may benefit investors.
Because of religious concerns, many people in Pakistan prefer to invest in ḥal�al businesses(Islamic products) rather than Shar�ıʿah non-compliant businesses (conventional products).Therefore, from the religious and ethical perspectives, Islamic stocks are a better investmentopportunity that can bring new diversification benefits to investors. Due to reduceduncertainty and speculation, returns on the Islamic stocks are superior to conventionalstocks. This reveals that investors can invest in Islamic stocks as they provide higher returnsand are less volatile.
The findings provide several practical implications in financial and investment decision-making by investors, managers and policymakers such as in the development of strategiesfor asset allocation and investment. Furthermore, in risk management, this study providesguidance for allocating portfolios and managing risk. The investment in Islamic stocks maymitigate potential risk within asset portfolios.
The results of this study can be used for the development of a stable, inclusive andsustainable equity market in Pakistan. The managers of the equity market should makeefforts in efficient utilization of investment for better returns and risk reduction. Theregulatory authorities need to take corrective actions for strengthening and stabilizing theequity market, which includes education and protection of investors, transparency andreforms. They should develop structures and standards to make the equity market efficientand stable.
References
Aarif, M.B.H., Rafiq, M.R.I. and Wahid, A.N.M. (2021), “Do Shariah indices surpass conventionalindices? A study on Dhaka stock exchange”, International Journal of Islamic and MiddleEastern Finance and Management, Vol. 14 No. 1, pp. 94-113.
Abbes, M.B. (2012), “Risk and return of Islamic and conventional indices”, International Journal ofEuro-Mediterranean Studies, Vol. 5 No. 1, pp. 1-23.
Abduh, M. (2020), “Volatility of Malaysian conventional and Islamic indices: does financial crisismatter?”, Journal of Islamic Accounting and Business Research, Vol. 11 No. 1, pp. 1-11.
Abu-Alkheil, A., Khan, W.A., Parikh, B. and Mohanty, S.K. (2017), “Dynamic co-integration andportfolio diversification of Islamic and conventional indices: global evidence”, The QuarterlyReview of Economics and Finance, Vol. 66 No. C, pp. 212-224.
Abu-Alkheil, A., Khan, W.A. and Parikh, B. (2020), “Risk-reward trade-off and volatility performanceof Islamic versus conventional stock indices: global evidence”, Review of Pacific Basin FinancialMarkets and Policies, Vol. 23 No. 1, pp. 1-23.
Al-Khazali, O., Lean, H.H. and Samet, A. (2014), “Do Islamic stock indexes outperform conventionalstock indexes? A stochastic dominance approach”, Pacific-Basin Finance Journal, Vol. 28 No. C,pp. 29-46.
IJIF14,1
70
Al-Zoubi, H.A. and Maghyereh, A.I. (2007), “The relative risk performance of Islamic finance: a newguide to less risky investments”, International Journal of Theoretical and Applied Finance,Vol. 10 No. 2, pp. 235-249.
Alam, M. and Ansari, V.A. (2020), “Are Islamic indices a viable investment avenue? An empiricalstudy of Islamic and conventional indices in India”, International Journal of Islamic and MiddleEastern Finance and Management, Vol. 13 No. 3, pp. 503-518.
Albaity, M. and Ahmad, R. (2008), “Performance of Syariah and composite indices: evidence fromBursa Malaysia”, Asian Academy of Management Journal of Accounting and Finance, Vol. 4No. 1, pp. 23-43.
Asutay, M., Wang, Y. and Avdukic, A. (2021), “Examining the performance of Islamic andconventional stock indices: a comparative analysis”, Asia-Pacific Financial Markets, Springer.doi: 10.1007/s10690-021-09351-7.
Ata, H.A. and Bu�gan, M.F. (2015), “Comparison of the performances Islamic and conventional marketindices and their causal relationship”, International Journal of Business Management andEconomic Research, Vol. 6 No. 6, pp. 455-462.
Bahloul, S., Mroua, M. and Naifar, N. (2017), “The impact of macroeconomic and conventional stockmarket variables on Islamic index returns under regime switching”, Borsa Istanbul Review,Vol. 17 No. 1, pp. 62-74.
Barrett, G.F. and Donald, S.G. (2003), “Consistent tests for stochastic dominance”, Econometrica,Vol. 71 No. 1, pp. 71-104.
Bayram, K. and Othman, A.H.A. (2019), “Islamic versus conventional stock market indicatesperformance: empirical evidence from Turkey”, Iqtishadia: Jurnal Kajian Ekonomi dan BisnisIslam, Vol. 12 No. 1, pp. 74-86.
Ben Rejeb, A. and Arfaoui, M. (2019), “Do Islamic stock indexes outperform conventional stockindexes? A state space modeling approach”, European Journal of Management and BusinessEconomics, Vol. 28 No. 3, pp. 301-322.
Girard, E. and Hassan, M.K. (2005), Faith-based Investing: The Case of Dow Jones Islamic IndicesReexamined, University of New Orleans Working Paper, New Orleans, LA.
Gonz�alez, M.D.L.O., Jare~no, F. and El Haddouti, C. (2019), “Sector portfolio performancecomparison between Islamic and conventional stock markets”, Sustainability, Vol. 11No. 17, pp. 1-23.
Hadar, J. and Russell, W.R. (1969), “Rules for ordering uncertain prospects”, American EconomicReview, Vol. 59 No. 1, pp. 25-34.
Hakim, S. and Rashidian, M. (2004), “How costly is investor’s compliance to Sharia?”, Paper Presentedat the 11th Economic Research Forum Annual Conference, Sharjah, the United Arab Emirates.
Hayat, R. and Kraeussl, R. (2011), “Risk and return characteristics of Islamic equity funds”, EmergingMarkets Review, Vol. 12 No. 2, pp. 189-203.
Hendranastiti, N.D. and Asutay, M. (2016), “Shari’ah and SRI portfolio performance in the UK: effect ofoil price decline”, Islamic Economic Studies, Vol. 24 No. 2, pp. 77-103.
Ho, C.S.F., Abd Rahman, N.A., Yusuf, N.H.M. and Zamzamin, Z. (2014), “Performance of global Islamicversus conventional share indices: international evidence”, Pacific-Basin Finance Journal,Vol. 28 No. C, pp. 110-121.
Hoque, A., Rakhi, S., Hassan, K. and Le, T. (2020), “The performance of stock portfolios: evidence fromanalysing Malaysia case and implication for open innovation”, Journal of Open Innovation:Technology, Market, and Complexity, Vol. 6 No. 4, pp. 1-13.
Hussein, K.A. (2004), “Ethical investment: empirical evidence from FTSE Islamic index”, IslamicEconomic Studies, Vol. 12 No. 1, pp. 1-22.
Hussein, K. and Omran, M. (2005), “Ethical investment revisited: evidence from Dow Jones Islamicindexes”, The Journal of Investing, Vol. 14 No. 2, pp. 105-126.
Islamic andconventional
stocks
71

Jabeen, M., Kausar, S. and Ihsan, H. (2018), “A comparison between Islamic and conventional stockprices performance: evidence from Pakistan’s equity market”, Paper Presented at the 6thInternational Conference on Islam and Liberty, Islamabad, 14‒15 November 2018.
Jawadi, F., Jawadi, N. and Louhichi, W. (2014), “Conventional and Islamic stock price performance: anempirical investigation”, International Economics, Vol. 137 No. 1, pp. 73-87.
Kuosmanen, T. (2001), Stochastic Dominance Efficiency Tests under Diversification, Helsinki School ofEconomics and Business Administration, Citeseer.
Liu, W.H. and Chang, J.R. (2021), “Revisiting and refining the comparison of conventional and Islamicmarkets’ performance”, Applied Economics, Vol. 53 No. 38, pp. 1-15.
Rana, M.E. and Akhter, W. (2015), “Performance of Islamic and conventional stockindices: empirical evidence from an emerging economy”, Financial Innovation, Vol. 1No. 1, pp. 1-15.
Shah, A.D., Gull, S. and Parvez, G.S. (2017), “Comparative performance analysis of selected Islamicand conventional mutual funds of Pakistan”, Asian Journal of Islamic Finance, Vol. 2 No. 1,pp. 14-29.
Shanmugam, B. and Zahari, Z.R. (2009), A Primer on Islamic Finance, Research Foundation of CFAInstitute, Charlottesville, VA.
Suryadi, S., Endri, E. and Yasid, M. (2021), “Risk and return of Islamic and conventional indices on theIndonesia stock exchange”, The Journal of Asian Finance, Economics and Business, Vol. 8 No. 3,pp. 23-30.
Trabelsi, L., Bahloul, S. and Mathlouthi, F. (2020), “Performance analysis of Islamic andconventional portfolios: the emerging markets case”, Borsa Istanbul Review, Vol. 20 No. 1,pp. 48-54.
About the authorsMunazza Jabeen, PhD, is associated with the International Institute of Islamic Economics, InternationalIslamic University, Islamabad, Pakistan. Munazza Jabeen is the corresponding author and can becontacted at: [email protected]
Saba Kausar, PhD, is a scholar at the Faculty of Management Sciences, International IslamicUniversity, Islamabad, Pakistan. She also obtained a Masters in Economics and Finance from theInstitute of Islamic Economics at International Islamic University, Islamabad.
For instructions on how to order reprints of this article, please visit our website:www.emeraldgrouppublishing.com/licensing/reprints.htmOr contact us for further details: [email protected]
IJIF14,1
72
Related Documents