UNCORRECTED PROOF 1 2 Performance benchmarking of wireless Web servers q 3 Guangwei Bai, Kehinde Oladosu, Carey Williamson * 4 Department of Computer Science, University of Calgary, 2500 University Drive NW, Calgary, AB, Canada T2N 1N4 5 Received 9 September 2004; received in revised form 17 July 2005; accepted 10 January 2006 6 7 Abstract 8 The advent of mobile computers and wireless networks enables the deployment of wireless Web servers and clients in 9 short-lived ad hoc network environments, such as classroom area networks. The purpose of this paper is to benchmark the 10 performance capabilities of wireless Web servers in such an environment. Network traffic measurements are conducted on 11 an in-building IEEE 802.11b wireless ad hoc network, using a wireless-enabled Apache Web server, several wireless clients, 12 and a wireless network traffic analyzer. The experiments focus on the HTTP transaction rate and end-to-end throughput 13 achievable in such an ad hoc network environment, and the impacts of factors such as Web object size, number of clients, 14 and persistent HTTP connections. The results show that the wireless network bottleneck manifests itself in several ways: 15 inefficient HTTP performance, client-side packet losses, server-side packet losses, network thrashing, and unfairness 16 among Web clients. Persistent HTTP connections offer up to 350% improvement in HTTP transaction rate and user-level 17 throughput, while also improving fairness for mobile clients accessing content from a wireless Web server. 18 Ó 2006 Elsevier B.V. All rights reserved. 19 Keywords: Ad hoc networks; Network traffic measurement; IEEE 802.11b WLAN; Web performance 20 21 1. Introduction 22 Two of the most exciting and fastest-growing 23 Internet technologies from the past 10 years are 24 the World Wide Web and wireless networks. The 25 Web has made the Internet available to the masses, 26 through its TCP/IP protocol stack and the principle 27 of layering. Wireless technologies have revolutional- 28 ized the way people think about networks, by offer- 29 ing users freedom from the constraints of physical 30 wires. Mobile users are interested in exploiting the 31 full functionality of the technology at their finger- 32 tips, as wireless networks bring closer the ‘‘any- 33 thing, anytime, anywhere’’ promise of mobile 34 networking. 35 A natural step in the wireless Internet evolution 36 is the convergence of these technologies to form 37 the ‘‘wireless Web’’: the wireless classroom, the 38 wireless campus, the wireless office, and the wireless 39 home. In fact, the same technology that allows Web 40 clients to be mobile (i.e., wireless network inter- 41 faces) also enables the deployment of wireless Web 42 servers. 1570-8705/$ - see front matter Ó 2006 Elsevier B.V. All rights reserved. doi:10.1016/j.adhoc.2006.01.001 q This paper is a significantly extended version of prior work published at MWAN’04 [1]. This current version (July 2005) has been revised and updated according to the journal reviewer comments received on March 23, 2005. * Corresponding author. Tel.: +1 403 220 6780; fax: +1 403 284 4707. E-mail address: [email protected] (C. Williamson). Ad Hoc Networks xxx (2006) xxx–xxx www.elsevier.com/locate/adhoc ADHOC 156 No. of Pages 21, Model 3+ 13 February 2006; Disk Used ARTICLE IN PRESS

Welcome message from author
This document is posted to help you gain knowledge. Please leave a comment to let me know what you think about it! Share it to your friends and learn new things together.
Transcript
1
2
3
4
56
7
89
101112131415161718
1920
21
222324252627
ADHOC 156 No. of Pages 21, Model 3+
13 February 2006; Disk UsedARTICLE IN PRESS
Ad Hoc Networks xxx (2006) xxx–xxx
www.elsevier.com/locate/adhoc
OOFPerformance benchmarking of wireless Web servers q
Guangwei Bai, Kehinde Oladosu, Carey Williamson *
Department of Computer Science, University of Calgary, 2500 University Drive NW, Calgary, AB, Canada T2N 1N4
Received 9 September 2004; received in revised form 17 July 2005; accepted 10 January 2006
ECTEDPRAbstract
The advent of mobile computers and wireless networks enables the deployment of wireless Web servers and clients inshort-lived ad hoc network environments, such as classroom area networks. The purpose of this paper is to benchmark theperformance capabilities of wireless Web servers in such an environment. Network traffic measurements are conducted onan in-building IEEE 802.11b wireless ad hoc network, using a wireless-enabled Apache Web server, several wireless clients,and a wireless network traffic analyzer. The experiments focus on the HTTP transaction rate and end-to-end throughputachievable in such an ad hoc network environment, and the impacts of factors such as Web object size, number of clients,and persistent HTTP connections. The results show that the wireless network bottleneck manifests itself in several ways:inefficient HTTP performance, client-side packet losses, server-side packet losses, network thrashing, and unfairnessamong Web clients. Persistent HTTP connections offer up to 350% improvement in HTTP transaction rate and user-levelthroughput, while also improving fairness for mobile clients accessing content from a wireless Web server.� 2006 Elsevier B.V. All rights reserved.
Keywords: Ad hoc networks; Network traffic measurement; IEEE 802.11b WLAN; Web performance
2829303132333435
CORR1. Introduction
Two of the most exciting and fastest-growingInternet technologies from the past 10 years arethe World Wide Web and wireless networks. TheWeb has made the Internet available to the masses,through its TCP/IP protocol stack and the principleof layering. Wireless technologies have revolutional-
UN 36
373839404142
1570-8705/$ - see front matter � 2006 Elsevier B.V. All rights reserved
doi:10.1016/j.adhoc.2006.01.001
q This paper is a significantly extended version of prior workpublished at MWAN’04 [1]. This current version (July 2005) hasbeen revised and updated according to the journal reviewercomments received on March 23, 2005.* Corresponding author. Tel.: +1 403 220 6780; fax: +1 403 284
4707.E-mail address: [email protected] (C. Williamson).
ized the way people think about networks, by offer-ing users freedom from the constraints of physicalwires. Mobile users are interested in exploiting thefull functionality of the technology at their finger-tips, as wireless networks bring closer the ‘‘any-thing, anytime, anywhere’’ promise of mobilenetworking.
A natural step in the wireless Internet evolutionis the convergence of these technologies to formthe ‘‘wireless Web’’: the wireless classroom, thewireless campus, the wireless office, and the wirelesshome. In fact, the same technology that allows Webclients to be mobile (i.e., wireless network inter-faces) also enables the deployment of wireless Webservers.
.
T
434445464748495051525354555657585960616263646566676869707172737475767778798081828384858687888990919293
949596979899100101102103104105106107108109110111112113114115
116
117
118119120121122123124125126127128129130131132133134135136137138139140141
2 G. Bai et al. / Ad Hoc Networks xxx (2006) xxx–xxx
ADHOC 156 No. of Pages 21, Model 3+
13 February 2006; Disk UsedARTICLE IN PRESS
UNCORREC
Wireless Web servers play a useful role in short-
lived networks. A short-lived or portable network iscreated spontaneously, in an ad hoc fashion, at aparticular location in response to some event, eitherscheduled or unscheduled. The network operates forsome short time period (minutes to hours), beforebeing disassembled, moved, and reconstitutedelsewhere.
There are several distinguishing characteristics ofa portable short-lived network. Often, the locationof the needed network is not known a priori. Theremay not be any existing network infrastructure,either wired or wireless, at the needed location. Inaddition, the time at which the network is neededmay not be known. Deployment may need to bespontaneous, with unknown (but often bounded)operating duration. The number of users for the net-work is typically small (e.g., 10–100), bandwidthrequirements are moderate, and the geographic cov-erage area for the network is limited. More impor-tantly, there is often a need for either datadissemination or data collection at the site of thenetwork. In most cases, the data access requirementis for a ‘‘closed’’ set of specialized content, ratherthan general Internet content.
Examples of deployment scenarios for short-livednetworks are sporting events, press conferences,conventions and trade shows, disaster recoverysites, and classroom area networks. The potentialfor entertainment applications (e.g., media stream-ing, home networking, multi-player gaming) is alsohigh. In many of these contexts, an ad hoc wirelessnetwork with a wireless Web server as an informa-tion repository provides a suitable solution.
In this paper, we explore the feasibility of wirelessWeb server deployment in classroom area networks.The paper starts with empirical measurements fromwireless Web server usage in a classroom environ-ment to show the practicality of its operation. Thesemeasurements are then augmented with laboratorytests to determine experimentally the upper boundson achievable performance. In particular, we focuson the performance capabilities of an Apache Webserver running on a laptop computer with an IEEE802.11b wireless LAN interface. We study in-build-ing Web performance for wireless Web clients. Allmobile computers are configured in ad hoc mode,since no existing network infrastructure is assumed.The clients download content from the wireless Webserver. A wireless network analyzer is used to collectand analyze traces from the experiments, with traffic
142
EDPROOF
analysis spanning from the Medium Access Control(MAC) layer to HTTP at the application layer.
Our experiments focus on the HTTP transactionrate and end-to-end throughput achievable in an adhoc wireless network environment, and the impactsof factors such as number of clients, Web objectsize, and persistent HTTP connections. The resultsshow the impacts of the wireless network bottle-neck, either at the client or the server, dependingon the Web workload. Persistent HTTP connectionsoffer significant improvements both in throughputand in fairness for mobile clients accessing contentfrom a wireless Web server.
The remainder of this paper is organized as fol-lows. Section 2 provides background informationon IEEE 802.11b, TCP, and HTTP. Section 3 pre-sents an overview of the classroom measurementsfrom our study. Section 4 describes the experimentalmethodology for lab-based measurements. Section 5presents the measurement results and analyses.Finally, Section 6 summarizes the paper anddescribes ongoing work.
2. Background and related work
2.1. The Web and Web performance
TheWeb relies primarily on three communicationprotocols: IP, TCP, and HTTP. The Internet Proto-col (IP) is a connection-less network-layer protocolthat provides global addressing and routing on theInternet. The Transmission Control Protocol(TCP) is a connection-oriented transport-layer pro-tocol that provides end-to-end data delivery acrossthe Internet [2]. Among its many functions, TCPhas flow control, congestion control, and errorrecovery mechanisms to provide reliable data trans-mission between sources and destinations. Therobustness of TCP allows it to operate in many net-work environments. Finally, the Hyper-Text Trans-fer Protocol (HTTP) is a request–responseapplication-layer protocol layered on top of TCP.HTTP is used to transfer Web documents betweenWeb servers and Web clients. Currently, HTTP/1.0[3] and HTTP/1.1 [4] are widely used on the Internet.
The overall performance of the Web depends onthe performance of Web clients, the Web server,and the network in between. The primary challengein the context of wireless ad hoc networking is thewireless channel, which is often characterized by lim-ited bandwidth, high error rates, and interferencefrom other users on the shared channel. The obvious
T
143144
145
146147148149150151152153154155156157158159160161162163164165166167168169170
171
172173174175176177178179180181182183184185186187188189190
191192193194195196197198199
200
201202203204205206207208209210211212213214215216217218219220221222223224225226227228229230231232233234235236237238239
G. Bai et al. / Ad Hoc Networks xxx (2006) xxx–xxx 3
ADHOC 156 No. of Pages 21, Model 3+
13 February 2006; Disk UsedARTICLE IN PRESS
UNCORREC
concern is that TCP and HTTP may suffer degradedperformance over wireless ad hoc networks.
2.2. Wireless Internet and IEEE 802.11b WLANs
Wireless technologies are playing an increasinglyprominent role in the global Internet infrastructure.One of the popular technologies in the wirelessLAN market is the IEEE 802.11b standard. This‘‘WiFi’’ (Wireless Fidelity) technology provideslow-cost wireless Internet capability for end users,with up to 11 Mbps data transmission rate at thephysical layer.
The IEEE 802.11b standard defines the channelaccess protocol used at the MAC layer, namely Car-rier Sense Multiple Access with Collision Avoidance(CSMA/CA). It also defines the frame formats usedat the data link layer: 128-bit preamble, 16-bit Start-of-Frame delimiter, 48-bit PLCP (Physical LayerConvergence Protocol) header, followed by a 24-byte MAC-layer header and variable size payload,which can be used for carrying IP packets.
In ad hoc mode, frames are addressed directlyfrom the sender to the intended receiver using thecorresponding MAC address in the frame header.Frames that are correctly received over the sharedwireless channel are acknowledged almost immedi-ately by the receiver. Unacknowledged frames areretransmitted by the sender after a short timeout(e.g., 1–10 ms), using the same MAC protocol.
2.3. Related work
There is growing literature on wireless trafficmeasurement and Internet protocol performanceover wireless networks [5–12]. For example, Tangand Baker [11,12] discuss wireless network measure-ments from two different environments: a local areanetwork, and a metropolitan area network. Morerecently, Balachandran et al. [5] report on networkperformance and user behaviour for general Inter-net access by several hundred wireless LAN usersduring the ACM SIGCOMM conference in SanDiego in 2001. They find that for this set of technol-ogy-literate users a wide range of Internet applica-tions are used, user behaviours are diverse, andoverall bandwidth demands are moderate. Kotzand Essien [13] characterize campus-wide wirelessnetwork usage at Dartmouth College, but focusonly on infrastructure mode using access points.
Our work differs from these in that we considerboth a Web server and Web clients in the same wire-
EDPROOF
less ad hoc network environment. The ad hoc sce-nario is of greater interest to us than theinfrastructure-based scenario because of the ‘‘anytime, any where’’ property for deployment, andthe opportunity for peer-to-peer interaction in class-room, entertainment, and gaming applications. Tothe best of our knowledge, our work is the first toevaluate a wireless Web server in a short-lived wire-less ad hoc network.
3. Empirical measurements
In January 2003, one of the authors (Williamson)was assigned to teach a graduate-level networkingcourse in a ‘‘legacy classroom’’ environment thathad neither wired nor wireless Internet access. Sincemuch of the course content was provided on theWeb (see http://www.cpsc.ucalgary.ca/~carey/CPSC601.38/archive/2003/), the solution was tocreate a mirrored copy of the course content andmake it available in the classroom using a wirelessWeb server. The prototype was tested in the class-room in February 2003, during the course moduleson wireless networking and network traffic measure-ment. Students were provided wireless laptops andPDAs for use in the classroom at this time.
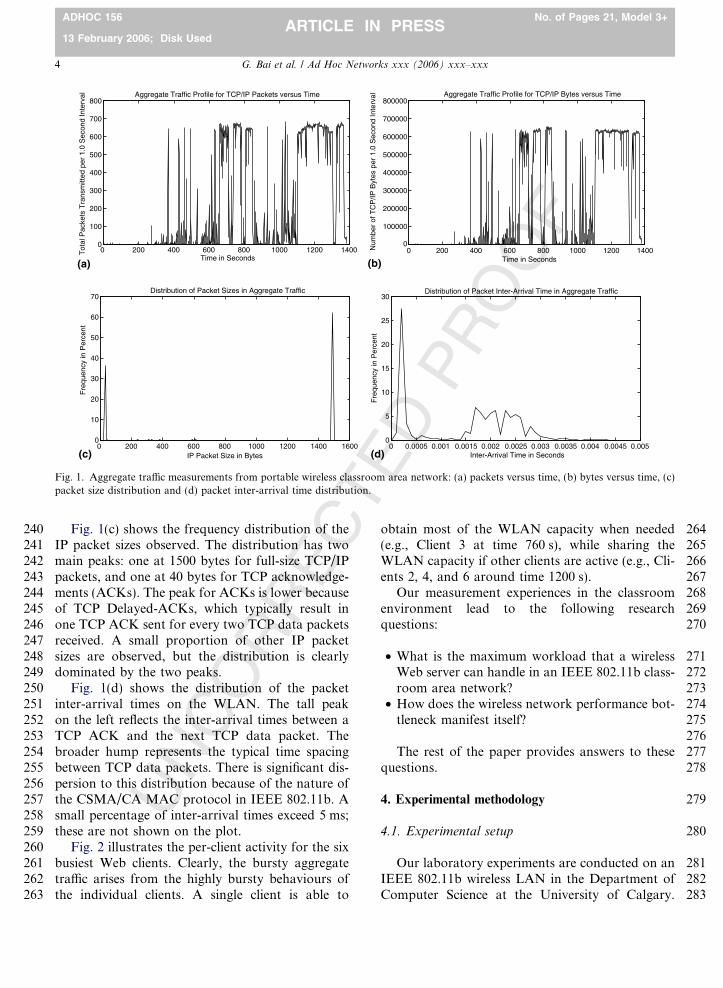
Fig. 1 shows an example of the network trafficmeasurements from the classroom environment.Following the introductory part of the lecture thatexplained the experimental setup, the 14 students(sharing eight laptops and two PDAs) were allowedto download course content, review prior lecturenotes, and begin preliminary work on a courseassignment involving a 6 MB trace file. The graphsin Fig. 1 show the wireless network activity for a 25-min portion of the classroom measurements.
Fig. 1(a) shows the total number of TCP/IP pack-ets transmitted on the wireless LAN per one-secondinterval during the trace. The traffic is bursty, witha high peak-to-mean ratio. The peak traffic rateapproaches 700 packets per second. All packetexchanges take place directly between theWeb clientsand theWeb server, over the sharedWLAN. There isno multi-hop forwarding required in the classroomenvironment, and very limited host mobility.
Fig. 1(b) shows the total number of TCP/IP bytesexchanged across the WLAN, which correlatesstrongly with the number of packets exchanged.The peak data rate achieved is approximately5.0 Mbps. This user-level throughput is typical foran IEEE 802.11b WLAN.
TEDPROOF
240241242243244245246247248249250251252253254255256257258259260261262263
264265266267268269270
271272273274275276277278
279
280
281282283
0
100
200
300
400
500
600
700
800
0 200 400 600 800 1000 1200 1400Tot
al P
acke
ts T
rans
mitt
ed p
er 1
.0 S
econ
d In
terv
al
Time in Seconds
Aggregate Traffic Profile for TCP/IP Packets versus Time
0
100000
200000
300000
400000
500000
600000
700000
800000
0 200 400 600 800 1000 1200 1400Num
ber
of T
CP
/IP B
ytes
per
1.0
Sec
ond
Inte
rval
Time in Seconds
Aggregate Traffic Profile for TCP/IP Bytes versus Time
(a) (b)
0
10
20
30
40
50
60
70
0 200 400 600 800 1000 1200 1400 1600
Fre
quen
cy in
Per
cent
IP Packet Size in Bytes
Distribution of Packet Sizes in Aggregate Traffic
0
5
10
15
20
25
30
0 0.0005 0.001 0.0015 0.002 0.0025 0.003 0.0035 0.004 0.0045 0.005
Fre
quen
cy in
Per
cent
Inter-Arrival Time in Seconds
Distribution of Packet Inter-Arrival Time in Aggregate Traffic
(c) (d)
Fig. 1. Aggregate traffic measurements from portable wireless classroom area network: (a) packets versus time, (b) bytes versus time, (c)packet size distribution and (d) packet inter-arrival time distribution.
4 G. Bai et al. / Ad Hoc Networks xxx (2006) xxx–xxx
ADHOC 156 No. of Pages 21, Model 3+
13 February 2006; Disk UsedARTICLE IN PRESS
UNCORRECFig. 1(c) shows the frequency distribution of the
IP packet sizes observed. The distribution has twomain peaks: one at 1500 bytes for full-size TCP/IPpackets, and one at 40 bytes for TCP acknowledge-ments (ACKs). The peak for ACKs is lower becauseof TCP Delayed-ACKs, which typically result inone TCP ACK sent for every two TCP data packetsreceived. A small proportion of other IP packetsizes are observed, but the distribution is clearlydominated by the two peaks.
Fig. 1(d) shows the distribution of the packetinter-arrival times on the WLAN. The tall peakon the left reflects the inter-arrival times between aTCP ACK and the next TCP data packet. Thebroader hump represents the typical time spacingbetween TCP data packets. There is significant dis-persion to this distribution because of the nature ofthe CSMA/CA MAC protocol in IEEE 802.11b. Asmall percentage of inter-arrival times exceed 5 ms;these are not shown on the plot.
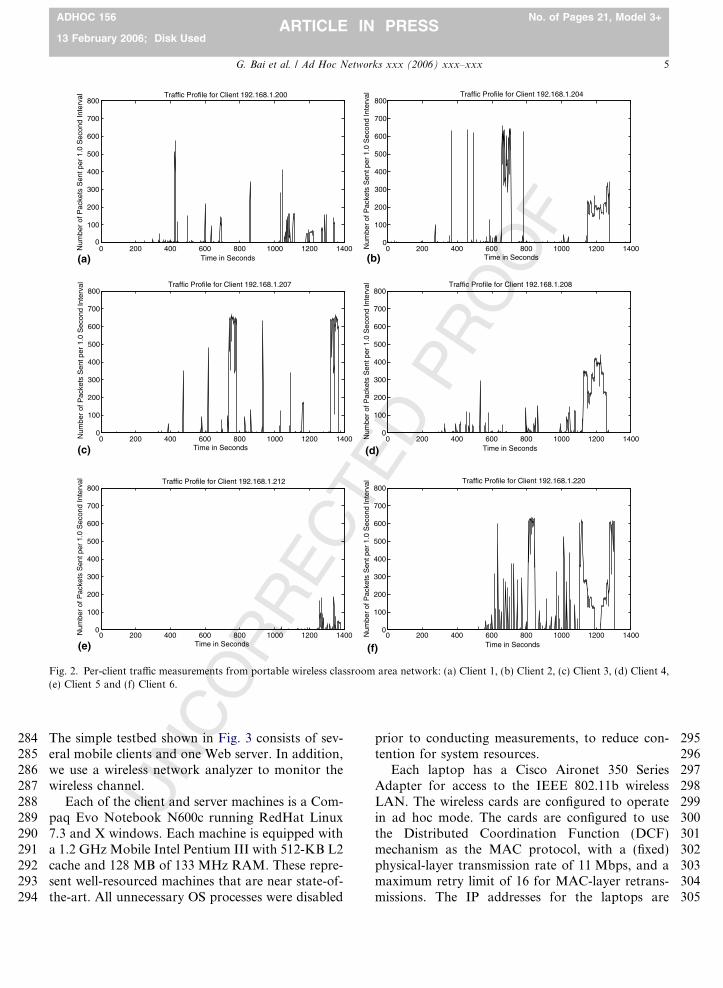
Fig. 2 illustrates the per-client activity for the sixbusiest Web clients. Clearly, the bursty aggregatetraffic arises from the highly bursty behaviours ofthe individual clients. A single client is able to
obtain most of the WLAN capacity when needed(e.g., Client 3 at time 760 s), while sharing theWLAN capacity if other clients are active (e.g., Cli-ents 2, 4, and 6 around time 1200 s).
Our measurement experiences in the classroomenvironment lead to the following researchquestions:
• What is the maximum workload that a wirelessWeb server can handle in an IEEE 802.11b class-room area network?
• How does the wireless network performance bot-tleneck manifest itself?
The rest of the paper provides answers to thesequestions.
4. Experimental methodology
4.1. Experimental setup
Our laboratory experiments are conducted on anIEEE 802.11b wireless LAN in the Department ofComputer Science at the University of Calgary.
ORRECTEDPROOF
284285286287288289290291292293294
295296297298299300301302303304305
0
100
200
300
400
500
600
700
800
0 200 400 600 800 1000 1200 1400Num
ber
of P
acke
ts S
ent p
er 1
.0 S
econ
d In
terv
al
Time in Seconds
Traffic Profile for Client 192.168.1.200
0
100
200
300
400
500
600
700
800
0 200 400 600 800 1000 1200 1400Num
ber
of P
acke
ts S
ent p
er 1
.0 S
econ
d In
terv
al
Time in Seconds
Traffic Profile for Client 192.168.1.204
(a) (b)
0
100
200
300
400
500
600
700
800
0 200 400 600 800 1000 1200 1400Num
ber
of P
acke
ts S
ent p
er 1
.0 S
econ
d In
terv
al
Time in Seconds
Traffic Profile for Client 192.168.1.207
0
100
200
300
400
500
600
700
800
0 200 400 600 800 1000 1200 1400Num
ber
of P
acke
ts S
ent p
er 1
.0 S
econ
d In
terv
al
Time in Seconds
Traffic Profile for Client 192.168.1.208
(c) (d)
0
100
200
300
400
500
600
700
800
0 200 400 600 800 1000 1200 1400Num
ber
of P
acke
ts S
ent p
er 1
.0 S
econ
d In
terv
al
Time in Seconds
Traffic Profile for Client 192.168.1.212
0
100
200
300
400
500
600
700
800
0 200 400 600 800 1000 1200 1400Num
ber
of P
acke
ts S
ent p
er 1
.0 S
econ
d In
terv
al
Time in Seconds
Traffic Profile for Client 192.168.1.220
(e) (f)
Fig. 2. Per-client traffic measurements from portable wireless classroom area network: (a) Client 1, (b) Client 2, (c) Client 3, (d) Client 4,(e) Client 5 and (f) Client 6.
G. Bai et al. / Ad Hoc Networks xxx (2006) xxx–xxx 5
ADHOC 156 No. of Pages 21, Model 3+
13 February 2006; Disk UsedARTICLE IN PRESS
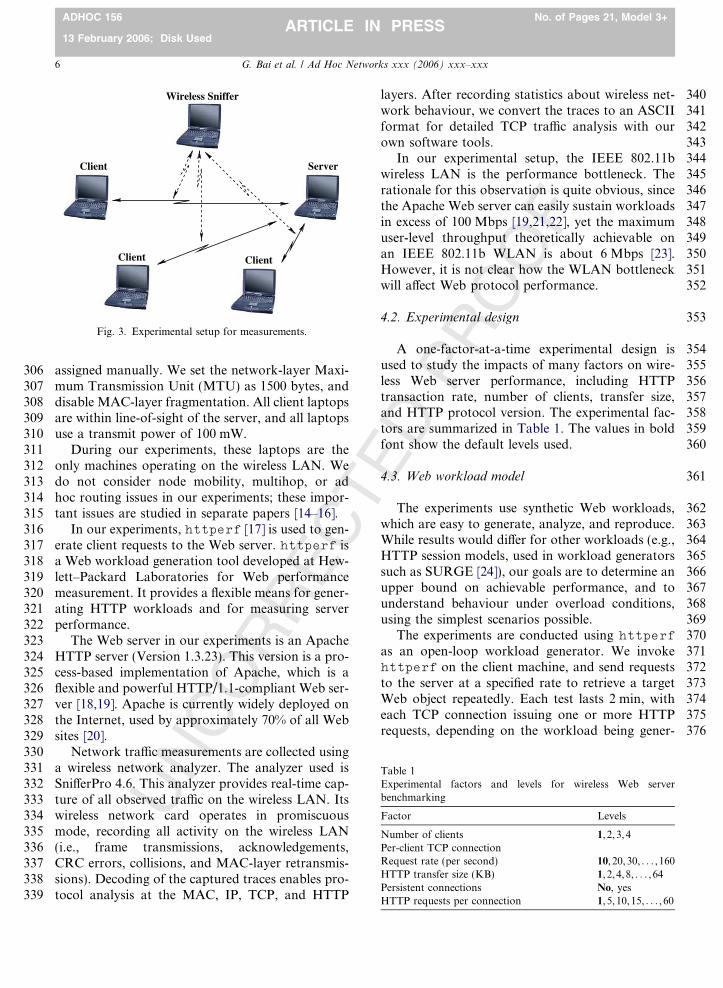
UNCThe simple testbed shown in Fig. 3 consists of sev-
eral mobile clients and one Web server. In addition,we use a wireless network analyzer to monitor thewireless channel.
Each of the client and server machines is a Com-paq Evo Notebook N600c running RedHat Linux7.3 and X windows. Each machine is equipped witha 1.2 GHz Mobile Intel Pentium III with 512-KB L2cache and 128 MB of 133 MHz RAM. These repre-sent well-resourced machines that are near state-of-the-art. All unnecessary OS processes were disabled
prior to conducting measurements, to reduce con-tention for system resources.
Each laptop has a Cisco Aironet 350 SeriesAdapter for access to the IEEE 802.11b wirelessLAN. The wireless cards are configured to operatein ad hoc mode. The cards are configured to usethe Distributed Coordination Function (DCF)mechanism as the MAC protocol, with a (fixed)physical-layer transmission rate of 11 Mbps, and amaximum retry limit of 16 for MAC-layer retrans-missions. The IP addresses for the laptops are
T306307308309310311312313314315316317318319320321322323324325326327328329330331332333334335336337338339
340341342343344345346347348349350351352
353
354355356357358359360
361
362363364365366367368369370371372373374375376
Client
ServerClient
Wireless Sniffer
Client
Fig. 3. Experimental setup for measurements.
Table 1Experimental factors and levels for wireless Web serverbenchmarking
Factor Levels
Number of clients 1, 2,3,4Per-client TCP connectionRequest rate (per second) 10, 20,30, . . . ,160HTTP transfer size (KB) 1, 2,4,8, . . . , 64Persistent connections No, yesHTTP requests per connection 1, 5,10,15, . . . , 60
6 G. Bai et al. / Ad Hoc Networks xxx (2006) xxx–xxx
ADHOC 156 No. of Pages 21, Model 3+
13 February 2006; Disk UsedARTICLE IN PRESS
UNCORREC
assigned manually. We set the network-layer Maxi-mum Transmission Unit (MTU) as 1500 bytes, anddisable MAC-layer fragmentation. All client laptopsare within line-of-sight of the server, and all laptopsuse a transmit power of 100 mW.
During our experiments, these laptops are theonly machines operating on the wireless LAN. Wedo not consider node mobility, multihop, or adhoc routing issues in our experiments; these impor-tant issues are studied in separate papers [14–16].
In our experiments, httperf [17] is used to gen-erate client requests to the Web server. httperf isa Web workload generation tool developed at Hew-lett–Packard Laboratories for Web performancemeasurement. It provides a flexible means for gener-ating HTTP workloads and for measuring serverperformance.
The Web server in our experiments is an ApacheHTTP server (Version 1.3.23). This version is a pro-cess-based implementation of Apache, which is aflexible and powerful HTTP/1.1-compliant Web ser-ver [18,19]. Apache is currently widely deployed onthe Internet, used by approximately 70% of all Websites [20].
Network traffic measurements are collected usinga wireless network analyzer. The analyzer used isSnifferPro 4.6. This analyzer provides real-time cap-ture of all observed traffic on the wireless LAN. Itswireless network card operates in promiscuousmode, recording all activity on the wireless LAN(i.e., frame transmissions, acknowledgements,CRC errors, collisions, and MAC-layer retransmis-sions). Decoding of the captured traces enables pro-tocol analysis at the MAC, IP, TCP, and HTTP
EDPROOF
layers. After recording statistics about wireless net-work behaviour, we convert the traces to an ASCIIformat for detailed TCP traffic analysis with ourown software tools.
In our experimental setup, the IEEE 802.11bwireless LAN is the performance bottleneck. Therationale for this observation is quite obvious, sincethe Apache Web server can easily sustain workloadsin excess of 100 Mbps [19,21,22], yet the maximumuser-level throughput theoretically achievable onan IEEE 802.11b WLAN is about 6 Mbps [23].However, it is not clear how the WLAN bottleneckwill affect Web protocol performance.
4.2. Experimental design
A one-factor-at-a-time experimental design isused to study the impacts of many factors on wire-less Web server performance, including HTTPtransaction rate, number of clients, transfer size,and HTTP protocol version. The experimental fac-tors are summarized in Table 1. The values in boldfont show the default levels used.
4.3. Web workload model
The experiments use synthetic Web workloads,which are easy to generate, analyze, and reproduce.While results would differ for other workloads (e.g.,HTTP session models, used in workload generatorssuch as SURGE [24]), our goals are to determine anupper bound on achievable performance, and tounderstand behaviour under overload conditions,using the simplest scenarios possible.
The experiments are conducted using httperf
as an open-loop workload generator. We invokehttperf on the client machine, and send requeststo the server at a specified rate to retrieve a targetWeb object repeatedly. Each test lasts 2 min, witheach TCP connection issuing one or more HTTPrequests, depending on the workload being gener-
T
377378379380381382383384
385
386387388389390391392393394395396397398399400
401
402403404405406407408409410411412413414415416417418419420421422423424
425426427428429430431432433434435436437438439440441442443444445446447448449450451452453454455456
457
458459460
461
462463464465466467468469470471472
G. Bai et al. / Ad Hoc Networks xxx (2006) xxx–xxx 7
ADHOC 156 No. of Pages 21, Model 3+
13 February 2006; Disk UsedARTICLE IN PRESS
UNCORREC
ated. The ‘‘user abort’’ timeout in httperf is set to5 s. This timeout value is used when establishing aTCP connection, when sending an HTTP request,when waiting for a reply, and when receiving areply. If no forward progress is made on any ofthese activities during the allotted time, the clientaborts the corresponding call and reports it as anerror.
4.4. Performance metrics and instrumentation
Performance data in our experiments come pri-marily from httperf and the wireless networkanalyzer, though we also collect some performancedata, such as netstat information, on client andserver machines as well. The httperf tool reportsapplication-layer statistics on HTTP behaviours(e.g., reply rate, throughput, response time, errorrate). These statistics are used for a high-level over-view of the performance results. Detailed perfor-mance data are available from the wirelessnetwork analyzer, enabling traffic analysis fromthe MAC layer to the HTTP layer. These tracesare used to assess wireless channel contention,TCP protocol behaviours, and HTTP transactionperformance.
4.5. Validation
Since our experiments record both application-layer and network-layer measurements, it is possibleto do a sanity check on the data to ensure properinterpretation of the experimental results.
The first validation test checked the timestampson the TCP SYN requests to ensure that httperfwas generating workloads at the specified requestrate. For example, at a rate of 10 connections persecond, a new TCP SYN request should appearon the network every 0.1 s. This property was veri-fied for the Cisco Aironet 350 wireless networkcards used in our experiments.
The second validation test compared networkpacket traces collected using the wireless networkanalyzer with those collected using tcpdump. Thiscomparison identified a subtle but important point:traces collected using the wireless network analyzerrepresent the analyzer’s view of the activity on thewireless channel, which is not necessarily the same
as those of the client or the server. Because thereceive antenna for each machine operates indepen-dently, the received signals could differ for eachdevice. One machine could interpret a received
EDPROOF
frame as successful, while another could reject itas a ‘‘Bad CRC’’. In other words, ‘‘what you seeat the Sniffer is not necessarily what you got at theclient or server’’.
This measurement artifact manifests itself in sev-eral ways: successful TCP connections for whicheither the client’s opening SYN or the server’sSYN ACK was not seen; MAC-layer retransmis-sions of frames that were already received perfectly;and TCP acknowledgements for segments that werenever sent. We have quantified this anomaly asaffecting fewer than 1% of the TCP connectionsstudied, and thus have not made efforts to filter thisartifact from the measurements with pre-processing.Pre-processing would involve inserting some pack-ets with unknown timestamps into the trace, andremoving other packets from the trace. Runningtcpdump on the client and the server is one wayto avoid this problem, since it only records packetsthat actually traverse the TCP/IP protocol stack.However, the tcpdump overhead would affect themeasurement results.
While tcpdump was not run for the experimentsshown in the paper, it was used extensively to helpunderstand system behaviour during preliminarytests. We also used netperf [25] to determine themaximum user-level throughput achievable betweenclient and server for large transfers on our wirelessLAN. Throughput is typically 5–6 Mbps, dependingon the TCP transfer size, socket buffer size, operat-ing system, MTU, wireless card, and driver configu-ration used [26].
5. Experimental results
This section presents selected measurementresults from our experiments with a wireless Webserver in a wireless ad hoc network.
5.1. Experiment 1: request rate
The purpose of the first experiment is to deter-mine the maximum sustainable load for the wirelessWeb server. In this experiment, only a single Webclient machine is used. The client, server, and Snifferlaptops are all less than 1 m apart. The wirelesschannel is assumed to be excellent. The size of theWeb object retrieved from the server is 1 kilobyte(KB). The experiments start with a request rate of10 requests per second, using non-persistent connec-tions. That is, there is exactly one HTTP ‘‘GET’’request per TCP connection; ‘‘TCP connection
T
473474475476477478479480481482483484485486487488489490491492493494495496497498499
500501502503504505506507508509510511512513514515516517518519520521522523524525
8 G. Bai et al. / Ad Hoc Networks xxx (2006) xxx–xxx
ADHOC 156 No. of Pages 21, Model 3+
13 February 2006; Disk UsedARTICLE IN PRESS
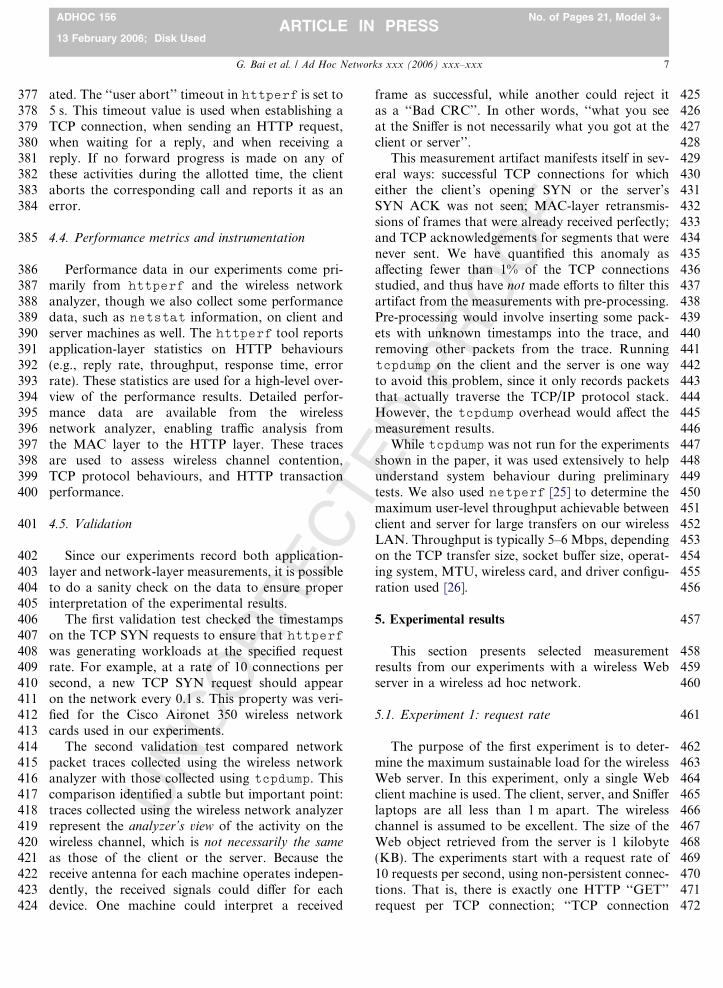
rate’’ and ‘‘HTTP transaction rate’’ are thus synon-ymous for this experiment. When one test is com-plete, the test is repeated with the next higherHTTP transaction rate, from 10 to 160 requestsper second. Each HTTP/1.0 transaction generates10 TCP packets (six sent by the client, four by theserver), as shown in Fig. 4(a). Each TCP packetrequires access to the IEEE 802.11b WLAN forthe transmission of the frame and its correspondingMAC-layer acknowledgement.
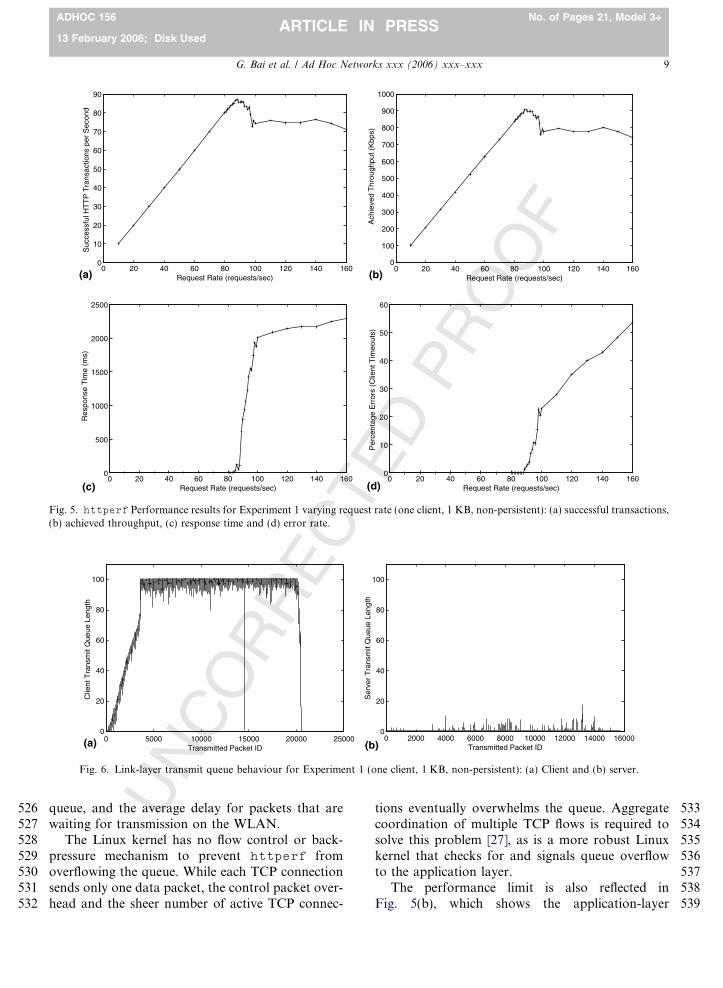
Fig. 5 shows the application-layer performanceresults reported by httperf for this experiment.The plots show the successful HTTP transactionrate in Fig. 5(a), the achieved user-level throughputin Fig. 5(b), the user-perceived response time inFig. 5(c), and the ‘‘user abort’’ error rate inFig. 5(d). In all four graphs, there are two regimes:the ‘‘normal’’ operating regime for feasible loads,and the ‘‘overload’’ regime generated by the open-loop workload.
Fig. 5(a) shows the successful HTTP transactionrate as the offered load increases. The HTTP trans-action rate increases linearly at first with offeredload (as expected), up to about 85 requests per sec-ond. Beyond this point, there is some instability,and a drop to a lower plateau. Qualitatively similarresults are observed in experiments with the same
UNCORREC
0.002710
0.001564
0.000000
0.000722
0.003419
0.006260
0.006792
ACK
GET
DATA
FIN/ACK
FIN
0.009165
0.007575
0.008169
Client Server
ACK
SYN
SYN/ACK
ACK
ACK
C
(a)
Fig. 4. Example of HTTP transactions using TCP: (a) non-pers
EDPROOF
client and server laptops in a 10 Mbps wired-Ether-net LAN, though the peak HTTP transaction ratein an Ethernet LAN is 380 requests per second,higher by more than a factor of 4. Clearly, the chan-nel access overhead in the wireless ad hoc networklimits the performance.
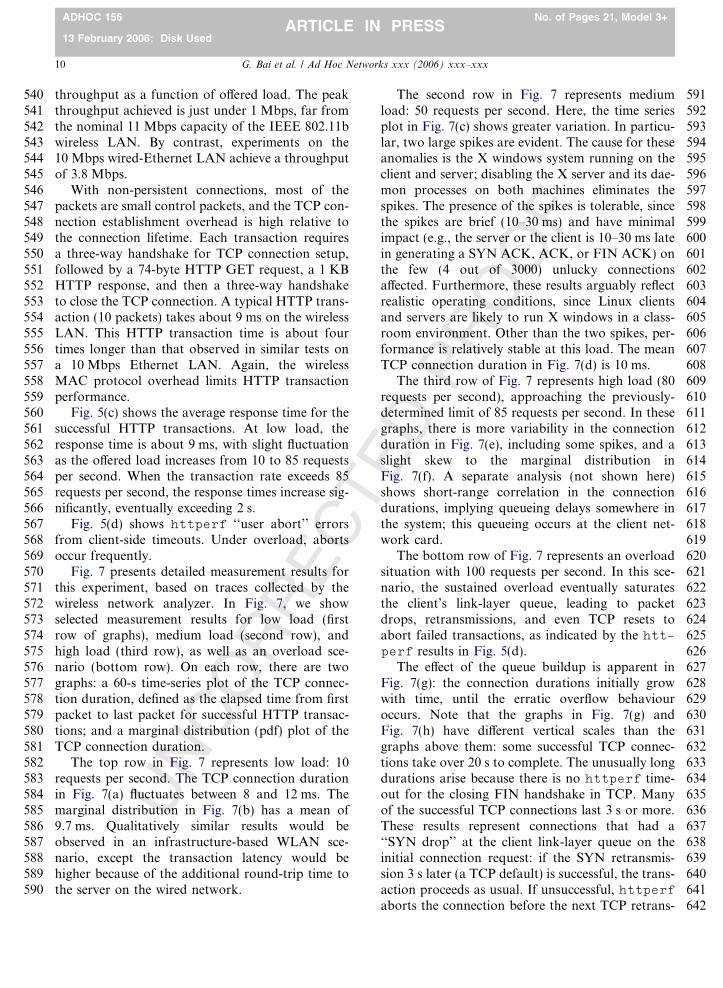
The low HTTP transaction rate in the wireless adhoc network is explained by the bottleneck at theclient network interface, where packets wait at thelink-layer queue for medium access on the WLAN.Fig. 6 shows this behaviour for high load on a spe-cially instrumented Linux kernel; the client queue inFig. 6(a) fills in about 10 s.
With the default queue size setting of 100 in theLinux kernel, many packet drops occur from thislink-layer queue, even before the packets make itto the network. The server does not receive enoughrequests to keep it busy, so its queue in Fig. 6(b)does not fill.
Increasing the client queue size limit is pointless,since the packet arrival rate to the queue exceeds thepacket service rate from the queue. We have verifiedthis experimentally with other (larger) settings forthe queue size. The steady-state packet loss rate isthe same, regardless of the queue size limit. The onlythings that change are the time required to fill the
SYN/ACKACK
GET
DATAACK
GET
...
lient Server
DATA/ACK
GET/ACK
DATA/ACK
GET/ACK
DATA/ACK
FIN
FIN/ACK
ACK
ACK
SYN
(b)
istent (e.g., HTTP/1.0) and (b) persistent (e.g., HTTP/1.1).
NCORRECTEDPROOF
526527528529530531532
533534535536537538539
0
10
20
30
40
50
60
70
80
90
0 20 40 60 80 100 120 140 160
Suc
cess
ful H
TT
P T
rans
actio
ns p
er S
econ
d
Request Rate (requests/sec)
0
100
200
300
400
500
600
700
800
900
1000
0 20 40 60 80 100 120 140 160
Ach
ieve
d T
hrou
ghpu
t (K
bps)
Request Rate (requests/sec)(a) (b)
0
500
1000
1500
2000
2500
0 20 40 60 80 100 120 140 160
Res
pons
e T
ime
(ms)
Request Rate (requests/sec)
0
10
20
30
40
50
60
0 20 40 60 80 100 120 140 160
Per
cent
age
Err
ors
(Clie
nt T
imeo
uts)
Request Rate (requests/sec)(c) (d)
Fig. 5. httperf Performance results for Experiment 1 varying request rate (one client, 1 KB, non-persistent): (a) successful transactions,(b) achieved throughput, (c) response time and (d) error rate.
0
20
40
60
80
100
0 5000 10000 15000 20000 25000
Clie
nt T
rans
mit
Que
ue L
engt
h
Transmitted Packet ID
0
20
40
60
80
100
0 2000 4000 6000 8000 10000 12000 14000 16000
Ser
ver
Tra
nsm
it Q
ueue
Len
gth
Transmitted Packet ID(a) (b)
Fig. 6. Link-layer transmit queue behaviour for Experiment 1 (one client, 1 KB, non-persistent): (a) Client and (b) server.
G. Bai et al. / Ad Hoc Networks xxx (2006) xxx–xxx 9
ADHOC 156 No. of Pages 21, Model 3+
13 February 2006; Disk UsedARTICLE IN PRESS
Uqueue, and the average delay for packets that arewaiting for transmission on the WLAN.
The Linux kernel has no flow control or back-pressure mechanism to prevent httperf fromoverflowing the queue. While each TCP connectionsends only one data packet, the control packet over-head and the sheer number of active TCP connec-
tions eventually overwhelms the queue. Aggregatecoordination of multiple TCP flows is required tosolve this problem [27], as is a more robust Linuxkernel that checks for and signals queue overflowto the application layer.
The performance limit is also reflected inFig. 5(b), which shows the application-layer
T
540541542543544545546547548549550551552553554555556557558559560561562563564565566567568569570571572573574575576577578579580581582583584585586587588589590
591592593594595596597598599600601602603604605606607608609610611612613614615616617618619620621622623624625626627628629630631632633634635636637638639640641
10 G. Bai et al. / Ad Hoc Networks xxx (2006) xxx–xxx
ADHOC 156 No. of Pages 21, Model 3+
13 February 2006; Disk UsedARTICLE IN PRESS
UNCORREC
throughput as a function of offered load. The peakthroughput achieved is just under 1 Mbps, far fromthe nominal 11 Mbps capacity of the IEEE 802.11bwireless LAN. By contrast, experiments on the10 Mbps wired-Ethernet LAN achieve a throughputof 3.8 Mbps.
With non-persistent connections, most of thepackets are small control packets, and the TCP con-nection establishment overhead is high relative tothe connection lifetime. Each transaction requiresa three-way handshake for TCP connection setup,followed by a 74-byte HTTP GET request, a 1 KBHTTP response, and then a three-way handshaketo close the TCP connection. A typical HTTP trans-action (10 packets) takes about 9 ms on the wirelessLAN. This HTTP transaction time is about fourtimes longer than that observed in similar tests ona 10 Mbps Ethernet LAN. Again, the wirelessMAC protocol overhead limits HTTP transactionperformance.
Fig. 5(c) shows the average response time for thesuccessful HTTP transactions. At low load, theresponse time is about 9 ms, with slight fluctuationas the offered load increases from 10 to 85 requestsper second. When the transaction rate exceeds 85requests per second, the response times increase sig-nificantly, eventually exceeding 2 s.
Fig. 5(d) shows httperf ‘‘user abort’’ errorsfrom client-side timeouts. Under overload, abortsoccur frequently.
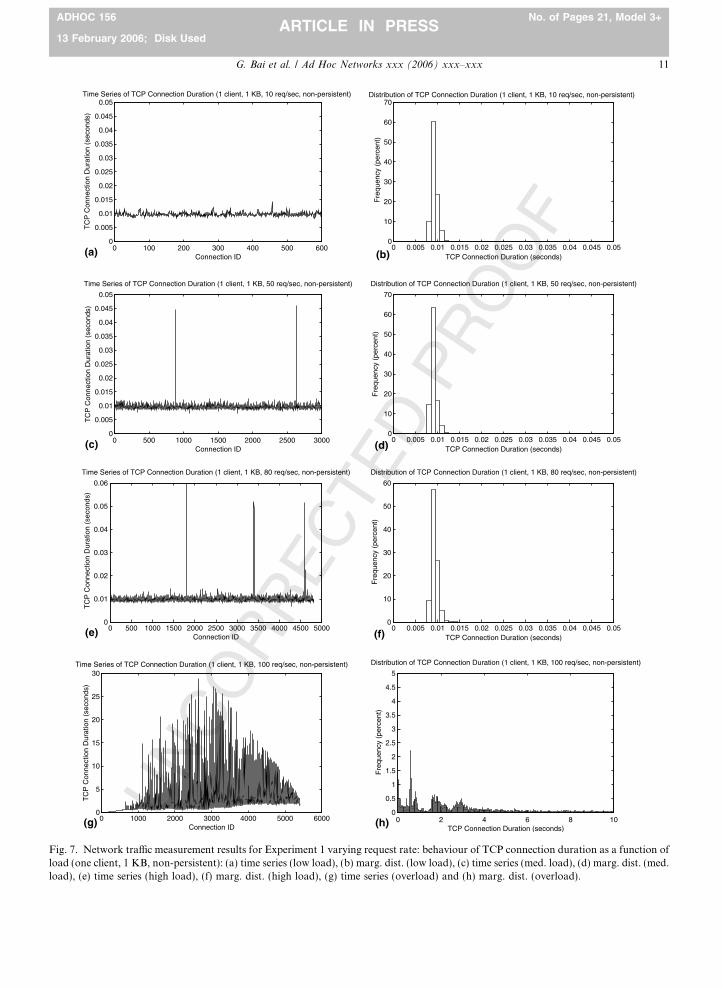
Fig. 7 presents detailed measurement results forthis experiment, based on traces collected by thewireless network analyzer. In Fig. 7, we showselected measurement results for low load (firstrow of graphs), medium load (second row), andhigh load (third row), as well as an overload sce-nario (bottom row). On each row, there are twographs: a 60-s time-series plot of the TCP connec-tion duration, defined as the elapsed time from firstpacket to last packet for successful HTTP transac-tions; and a marginal distribution (pdf) plot of theTCP connection duration.
The top row in Fig. 7 represents low load: 10requests per second. The TCP connection durationin Fig. 7(a) fluctuates between 8 and 12 ms. Themarginal distribution in Fig. 7(b) has a mean of9.7 ms. Qualitatively similar results would beobserved in an infrastructure-based WLAN sce-nario, except the transaction latency would behigher because of the additional round-trip time tothe server on the wired network.
642
EDPROOF
The second row in Fig. 7 represents mediumload: 50 requests per second. Here, the time seriesplot in Fig. 7(c) shows greater variation. In particu-lar, two large spikes are evident. The cause for theseanomalies is the X windows system running on theclient and server; disabling the X server and its dae-mon processes on both machines eliminates thespikes. The presence of the spikes is tolerable, sincethe spikes are brief (10–30 ms) and have minimalimpact (e.g., the server or the client is 10–30 ms latein generating a SYN ACK, ACK, or FIN ACK) onthe few (4 out of 3000) unlucky connectionsaffected. Furthermore, these results arguably reflectrealistic operating conditions, since Linux clientsand servers are likely to run X windows in a class-room environment. Other than the two spikes, per-formance is relatively stable at this load. The meanTCP connection duration in Fig. 7(d) is 10 ms.
The third row of Fig. 7 represents high load (80requests per second), approaching the previously-determined limit of 85 requests per second. In thesegraphs, there is more variability in the connectionduration in Fig. 7(e), including some spikes, and aslight skew to the marginal distribution inFig. 7(f). A separate analysis (not shown here)shows short-range correlation in the connectiondurations, implying queueing delays somewhere inthe system; this queueing occurs at the client net-work card.
The bottom row of Fig. 7 represents an overloadsituation with 100 requests per second. In this sce-nario, the sustained overload eventually saturatesthe client’s link-layer queue, leading to packetdrops, retransmissions, and even TCP resets toabort failed transactions, as indicated by the htt-
perf results in Fig. 5(d).The effect of the queue buildup is apparent in
Fig. 7(g): the connection durations initially growwith time, until the erratic overflow behaviouroccurs. Note that the graphs in Fig. 7(g) andFig. 7(h) have different vertical scales than thegraphs above them: some successful TCP connec-tions take over 20 s to complete. The unusually longdurations arise because there is no httperf time-out for the closing FIN handshake in TCP. Manyof the successful TCP connections last 3 s or more.These results represent connections that had a‘‘SYN drop’’ at the client link-layer queue on theinitial connection request: if the SYN retransmis-sion 3 s later (a TCP default) is successful, the trans-action proceeds as usual. If unsuccessful, httperfaborts the connection before the next TCP retrans-
UNCORRECTEDPROOF
0
0.005
0.01
0.015
0.02
0.025
0.03
0.035
0.04
0.045
0.05
0 100 200 300 400 500 600
TC
P C
onne
ctio
n D
urat
ion
(sec
onds
)
Connection ID
Time Series of TCP Connection Duration (1 client, 1 KB, 10 req/sec, non-persistent)
0
10
20
30
40
50
60
70
0 0.005 0.01 0.015 0.02 0.025 0.03 0.035 0.04 0.045 0.05
Fre
quen
cy (
perc
ent)
TCP Connection Duration (seconds)
Distribution of TCP Connection Duration (1 client, 1 KB, 10 req/sec, non-persistent)
(a) (b)
0
0.005
0.01
0.015
0.02
0.025
0.03
0.035
0.04
0.045
0.05
0 500 1000 1500 2000 2500 3000
TC
P C
onne
ctio
n D
urat
ion
(sec
onds
)
Connection ID
Time Series of TCP Connection Duration (1 client, 1 KB, 50 req/sec, non-persistent)
0
10
20
30
40
50
60
70
0 0.005 0.01 0.015 0.02 0.025 0.03 0.035 0.04 0.045 0.05
Fre
quen
cy (
perc
ent)
TCP Connection Duration (seconds)
Distribution of TCP Connection Duration (1 client, 1 KB, 50 req/sec, non-persistent)
(c) (d)
0
0.01
0.02
0.03
0.04
0.05
0.06
0 500 1000 1500 2000 2500 3000 3500 4000 4500 5000
TC
P C
onne
ctio
n D
urat
ion
(sec
onds
)
Connection ID
Time Series of TCP Connection Duration (1 client, 1 KB, 80 req/sec, non-persistent)
0
10
20
30
40
50
60
0 0.005 0.01 0.015 0.02 0.025 0.03 0.035 0.04 0.045 0.05
Fre
quen
cy (
perc
ent)
TCP Connection Duration (seconds)
Distribution of TCP Connection Duration (1 client, 1 KB, 80 req/sec, non-persistent)
(e) (f)
0
5
10
15
20
25
30
0 1000 2000 3000 4000 5000 6000
TC
P C
onne
ctio
n D
urat
ion
(sec
onds
)
Connection ID
Time Series of TCP Connection Duration (1 client, 1 KB, 100 req/sec, non-persistent)
0
0.5
1
1.5
2
2.5
3
3.5
4
4.5
5
0 2 4 6 8 10
Fre
quen
cy (
perc
ent)
TCP Connection Duration (seconds)
Distribution of TCP Connection Duration (1 client, 1 KB, 100 req/sec, non-persistent)
(g) (h)
Fig. 7. Network traffic measurement results for Experiment 1 varying request rate: behaviour of TCP connection duration as a function ofload (one client, 1 KB, non-persistent): (a) time series (low load), (b) marg. dist. (low load), (c) time series (med. load), (d) marg. dist. (med.load), (e) time series (high load), (f) marg. dist. (high load), (g) time series (overload) and (h) marg. dist. (overload).
G. Bai et al. / Ad Hoc Networks xxx (2006) xxx–xxx 11
ADHOC 156 No. of Pages 21, Model 3+
13 February 2006; Disk UsedARTICLE IN PRESS
643644
645
646647648649650651652653654655656657658659660661
662663664665666667668669670671672673674675676677678679680681682
12 G. Bai et al. / Ad Hoc Networks xxx (2006) xxx–xxx
ADHOC 156 No. of Pages 21, Model 3+
13 February 2006; Disk UsedARTICLE IN PRESS
mission (6 s later), because of the 5-s timeout for cli-ent aborts.
5.2. Experiment 2: multiple clients
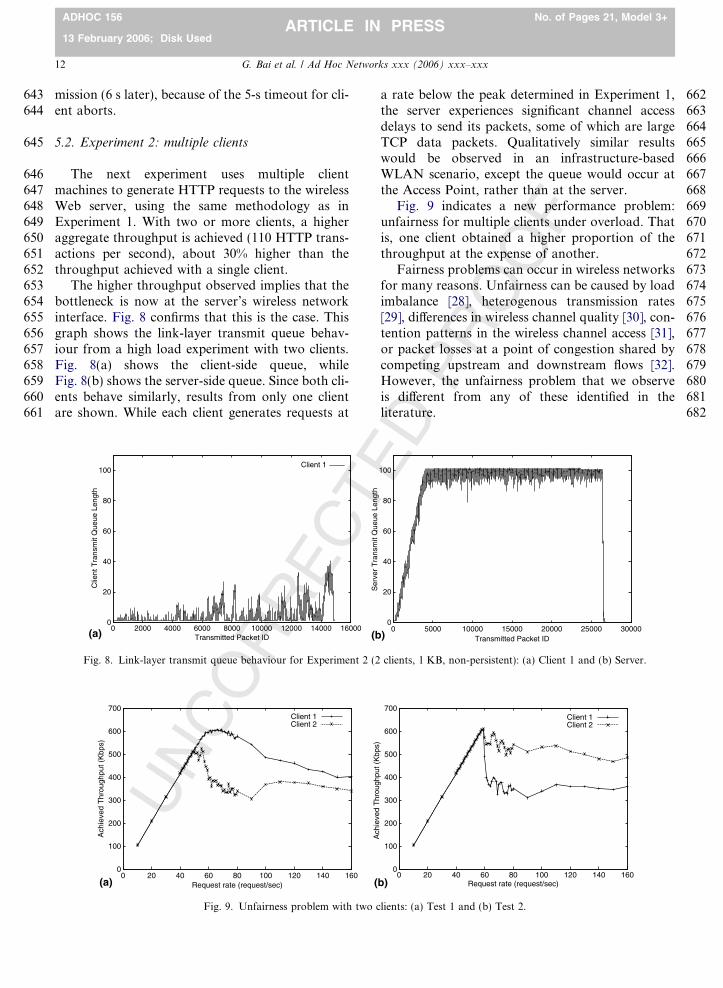
The next experiment uses multiple clientmachines to generate HTTP requests to the wirelessWeb server, using the same methodology as inExperiment 1. With two or more clients, a higheraggregate throughput is achieved (110 HTTP trans-actions per second), about 30% higher than thethroughput achieved with a single client.
The higher throughput observed implies that thebottleneck is now at the server’s wireless networkinterface. Fig. 8 confirms that this is the case. Thisgraph shows the link-layer transmit queue behav-iour from a high load experiment with two clients.Fig. 8(a) shows the client-side queue, whileFig. 8(b) shows the server-side queue. Since both cli-ents behave similarly, results from only one clientare shown. While each client generates requests at
UNCORRECT
0
20
40
60
80
100
0 2000 4000 6000 8000 10000 12000 14000 16000
Clie
nt T
rans
mit
Que
ue L
engt
h
Transmitted Packet ID
Client 1
(a) (b
Fig. 8. Link-layer transmit queue behaviour for Experiment 2 (2
0
100
200
300
400
500
600
700
0 20 40 60 80 100 120 140 160
Ach
ieve
d T
hrou
ghpu
t (K
bps)
Request rate (request/sec)
Client 1Client 2
(a) (
Fig. 9. Unfairness problem with two c
PROOF
a rate below the peak determined in Experiment 1,the server experiences significant channel accessdelays to send its packets, some of which are largeTCP data packets. Qualitatively similar resultswould be observed in an infrastructure-basedWLAN scenario, except the queue would occur atthe Access Point, rather than at the server.
Fig. 9 indicates a new performance problem:unfairness for multiple clients under overload. Thatis, one client obtained a higher proportion of thethroughput at the expense of another.
Fairness problems can occur in wireless networksfor many reasons. Unfairness can be caused by loadimbalance [28], heterogenous transmission rates[29], differences in wireless channel quality [30], con-tention patterns in the wireless channel access [31],or packet losses at a point of congestion shared bycompeting upstream and downstream flows [32].However, the unfairness problem that we observeis different from any of these identified in theliterature.
ED
0
20
40
60
80
100
0 5000 10000 15000 20000 25000 30000
Ser
ver
Tra
nsm
it Q
ueue
Len
gth
Transmitted Packet ID)
clients, 1 KB, non-persistent): (a) Client 1 and (b) Server.
0
100
200
300
400
500
600
700
0 20 40 60 80 100 120 140 160
Ach
ieve
d T
hrou
ghpu
t (K
bps)
Request rate (request/sec)
Client 1Client 2
b)
lients: (a) Test 1 and (b) Test 2.
683684685686687688689690691692693694695696697698
699700701702703704705706707708709710711712713714
G. Bai et al. / Ad Hoc Networks xxx (2006) xxx–xxx 13
ADHOC 156 No. of Pages 21, Model 3+
13 February 2006; Disk UsedARTICLE IN PRESS
A careful investigation of the traces shows thatthe relative phasing (i.e., synchronization) betweenthe client machines is an important issue. Becauseeach client generates requests deterministically atthe same rate using identical hardware and soft-ware, the relative phasing of clients at startup deter-mines the relative ordering of requests in the serverqueue. While the relative phasing may change eachtime the experiment is run (see Fig. 9), we haveobserved the unfairness problem repeatedly in ouroverload experiments with two clients and withthree clients.
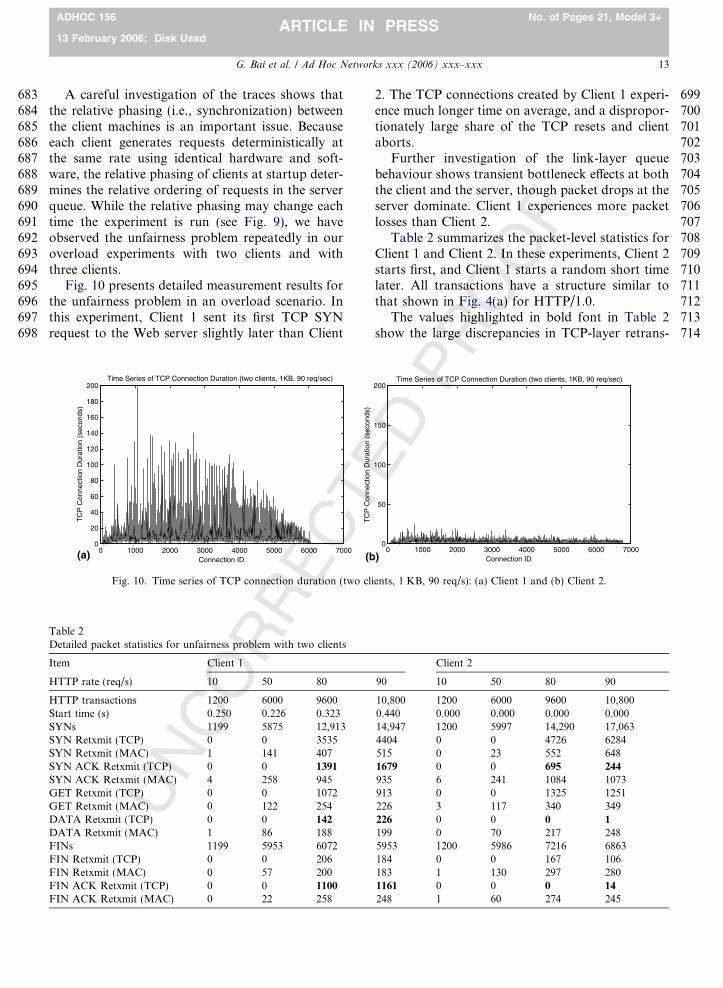
Fig. 10 presents detailed measurement results forthe unfairness problem in an overload scenario. Inthis experiment, Client 1 sent its first TCP SYNrequest to the Web server slightly later than Client
UNCORRECT
0
20
40
60
80
100
120
140
160
180
200
0 1000 2000 3000 4000 5000 6000 7000
TC
P C
onne
ctio
n D
urat
ion
(sec
onds
)
Connection ID
Time Series of TCP Connection Duration (two clients, 1KB, 90 req/sec)
TC
P C
onne
ctio
n D
urat
ion
(sec
onds
)
(a) (b
Fig. 10. Time series of TCP connection duration (two cl
Table 2Detailed packet statistics for unfairness problem with two clients
Item Client 1
HTTP rate (req/s) 10 50 80
HTTP transactions 1200 6000 9600Start time (s) 0.250 0.226 0.323SYNs 1199 5875 12,913SYN Retxmit (TCP) 0 0 3535SYN Retxmit (MAC) 1 141 407SYN ACK Retxmit (TCP) 0 0 1391
SYN ACK Retxmit (MAC) 4 258 945GET Retxmit (TCP) 0 0 1072GET Retxmit (MAC) 0 122 254DATA Retxmit (TCP) 0 0 142
DATA Retxmit (MAC) 1 86 188FINs 1199 5953 6072FIN Retxmit (TCP) 0 0 206FIN Retxmit (MAC) 0 57 200FIN ACK Retxmit (TCP) 0 0 1100
FIN ACK Retxmit (MAC) 0 22 258
OOF
2. The TCP connections created by Client 1 experi-ence much longer time on average, and a dispropor-tionately large share of the TCP resets and clientaborts.
Further investigation of the link-layer queuebehaviour shows transient bottleneck effects at boththe client and the server, though packet drops at theserver dominate. Client 1 experiences more packetlosses than Client 2.
Table 2 summarizes the packet-level statistics forClient 1 and Client 2. In these experiments, Client 2starts first, and Client 1 starts a random short timelater. All transactions have a structure similar tothat shown in Fig. 4(a) for HTTP/1.0.
The values highlighted in bold font in Table 2show the large discrepancies in TCP-layer retrans-
EDPR
0
50
100
150
200
0 1000 2000 3000 4000 5000 6000 7000Connection ID
Time Series of TCP Connection Duration (two clients, 1KB, 90 req/sec)
)
ients, 1 KB, 90 req/s): (a) Client 1 and (b) Client 2.
Client 2
90 10 50 80 90
10,800 1200 6000 9600 10,8000.440 0.000 0.000 0.000 0.00014,947 1200 5997 14,290 17,0634404 0 0 4726 6284515 0 23 552 6481679 0 0 695 244
935 6 241 1084 1073913 0 0 1325 1251226 3 117 340 349226 0 0 0 1
199 0 70 217 2485953 1200 5986 7216 6863184 0 0 167 106183 1 130 297 2801161 0 0 0 14
248 1 60 274 245
715716717718719720721722723724725726727728729730731732733734735
736737738739740741742743744
745
746747748749750751752753754
14 G. Bai et al. / Ad Hoc Networks xxx (2006) xxx–xxx
ADHOC 156 No. of Pages 21, Model 3+
13 February 2006; Disk UsedARTICLE IN PRESS
missions experienced by the two clients (e.g., 1161FIN ACK retransmissions for Client 1, versus 14for Client 2). These large differences all occur intable rows for server-generated TCP packets in theHTTP transactions, and the differences manifestthemselves at the TCP layer, rather than at theMAC layer. Client 2 experienced much better per-formance than Client 1.
The easiest way to explain this phenomenon is tothink of the server as sending a pair of back-to-backpackets to the link-layer queue, where the firstpacket is from Client 2, and the second packet isfrom Client 1. If the queue has ample room, thenboth packets will be accepted. If the queue is full,then both packets will be accepted. However, ifthe queue has room for just 1 packet, then thepacket for Client 2 will be queued for transmission,while the packet for Client 1 will be dropped. Thestatistics in Table 2 indicate that the latter case hap-pens quite frequently, especially for SYN ACK andFIN ACK packets.
UNCORRECT
0
50
100
150
200
250
300
350
0 10 20 30 40 50 60
Suc
cess
ful H
TT
P T
rans
actio
ns p
er S
econ
d
HTTP Requests per TCP Connection(a) (
0
50
100
150
200
250
300
350
400
450
500
0 10 20 30 40 50 60
Res
pons
e T
ime
(ms)
HTTP Requests per TCP Connection(c) (
Fig. 11. httperf Performance results for Experiment 3 with persisuccessful transactions, (b) achieved throughput, (c) response time and
PROOF
For the synthetic httperf workloads, the rela-tive phasing of sources has an important impacton TCP fairness and overall Web performance.While these phasing effects are unlikely to occur inhuman-generated Web client workloads, we specu-late that heterogenous client hardware (e.g., fastversus slow) could lead to similar unfairness prob-lems. Randomization may be required to break upthese phasing effects.
5.3. Experiment 3: persistent HTTP connections
The next experiment considers persistent HTTPconnections. With a persistent connection, multipleHTTP transactions can be sent on the same TCPconnection, prior to it being closed [4]. Thisapproach amortizes the TCP overhead across multi-ple HTTP transactions, and improves HTTP serverperformance [33,34].
In this experiment, the TCP connection rate is 10requests per second, and the transfer size is 1 KB.
ED
0
500
1000
1500
2000
2500
3000
3500
0 10 20 30 40 50 60
Ach
ieve
d T
hrou
ghpu
t (K
bps)
HTTP Requests per TCP Connectionb)
0
5
10
15
20
25
30
35
40
0 10 20 30 40 50 60
Per
cent
age
Err
ors
(Clie
nt T
imeo
uts)
HTTP Requests per TCP Connectiond)
stent connections (one client, 1 KB, 10 conn/s, persistent): (a)(d) error rate.
755756757758759760761762763764765766767768769770771772773774775776
777778779780781782783784785786787788789790791792793794795796797798
G. Bai et al. / Ad Hoc Networks xxx (2006) xxx–xxx 15
ADHOC 156 No. of Pages 21, Model 3+
13 February 2006; Disk UsedARTICLE IN PRESS
The number of HTTP transactions per TCP connec-tion is varied.
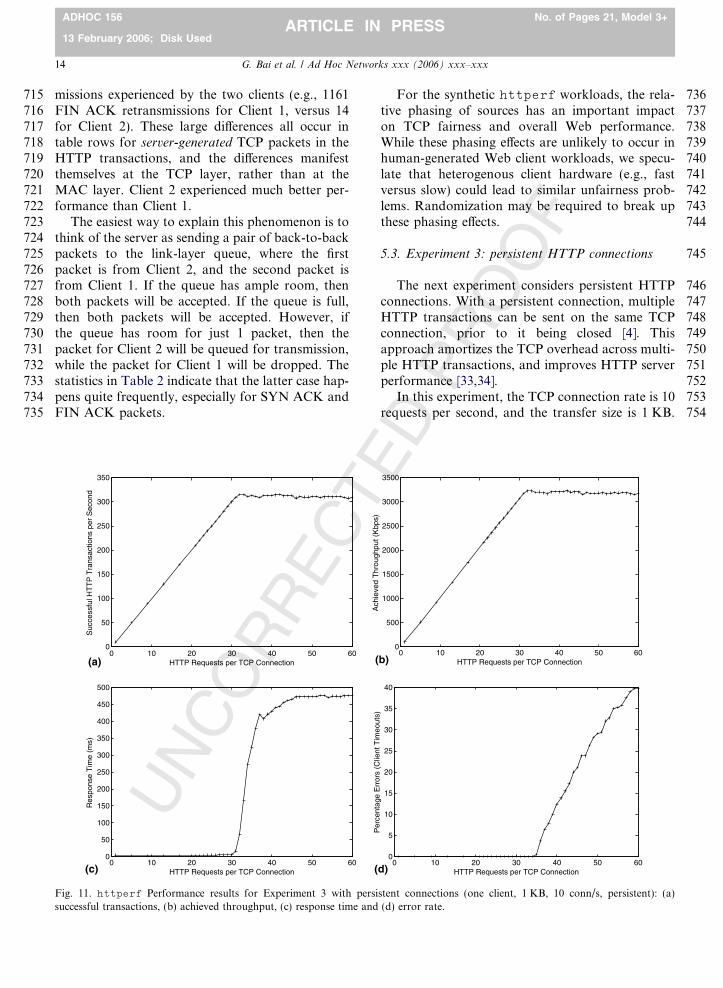
Fig. 11 shows the application-layer performanceresults reported by httperf for this experiment.Fig. 11(a) shows that the successful transaction rateincreases as the number of HTTP requests per con-nection is increased. The highest rate achieved is 320HTTP transactions per second. User-level through-put in Fig. 11(b) reaches a peak of 3.2 Mbps with 32HTTP transactions per TCP connection. Beyondthat point, server throughput is relatively stable,though the average HTTP response time inFig. 11(c) increases sharply.
These results show that persistent connectionsoffer a 350% improvement in performance overnon-persistent connections. Compared to the resultsin Fig. 5(b), the maximum throughput has increasedfrom 900 Kbps to 3.2 Mbps. In the 10 Mbps wired-Ethernet experiments, persistent connections doublethe performance from 380 to 760 HTTP transac-tions per second. The user-level throughput reaches7.8 Mbps.
UNCORRECT
0
20
40
60
80
100
120
140
160
180
0 5 10 15 20 25 30
Suc
cess
ful H
TT
P T
rans
actio
ns p
er S
econ
d
HTTP Requests per TCP Connection
Client 1Client 2
Ach
ieve
d T
hrou
ghpu
t (K
bps)
(a) (b
0
100
200
300
400
500
600
0 5 10 15 20 25 30
Res
pons
e T
ime
(ms)
HTTP Requests per TCP Connection
Client 1Client 2
Per
cent
age
Err
ors
(Clie
nt T
imeo
uts)
(c) (d
Fig. 12. httperf Performance results for Experiment 3 with persissuccessful transactions, (b) achieved throughput, (c) response time and
PROOF
Clearly, persistent connections offer many advan-tages: fewer control packets (TCP SYN and FIN)on the network, and amortization of the TCP hand-shakes over many HTTP transactions. These advan-tages apply to any network environment, wired orwireless, but they are particularly important whenthe wireless LAN is the bottleneck.
While the performance advantages of persistentconnections are generally well-known, their primarybenefit on the Internet is in reducing the number ofround-trip times (RTTs) between client and server.In the wireless ad hoc network scenario, the RTTis negligible, yet persistent connections are stillhighly beneficial.
The primary benefit is the reduction in the num-ber of WLAN packet transmissions. With persistentconnections (see Fig. 4(b)), the first HTTP transac-tion inside the TCP connection requires only fourTCP packets (GET, ACK, DATA, ACK) insteadof 10, while subsequent HTTP transactions in thesame TCP connection typically require only twopackets, since TCP can piggyback ACKs on out-
ED
0
200
400
600
800
1000
1200
1400
1600
1800
0 5 10 15 20 25 30HTTP Requests per TCP Connection
Client 1Client 2
)
0
5
10
15
20
25
30
35
40
45
0 5 10 15 20 25 30HTTP Requests per TCP Connection
Client 1Client 2
)
tent connections (two clients, 1 KB, 10 conn/s, persistent): (a)(d) error rate.
UNCORRECTEDPROOF0
0.05
0.1
0.15
0.2
0 100 200 300 400 500 600
TC
P C
onne
ctio
n D
urat
ion
(sec
onds
)
Connection ID
Time Series of TCP Connection Duration (1 client, 8 KB, 10 req/sec, non-persistent)
0
5
10
15
20
25
30
35
40
0 0.05 0.1 0.15 0.2
Fre
quen
cy (
perc
ent)
TCP Connection Duration (seconds)
Distribution of TCP Connection Duration (1 client, 8 KB, 10 req/sec, non-persistent)
(a) (b)
0
0.05
0.1
0.15
0.2
0 100 200 300 400 500 600
TC
P C
onne
ctio
n D
urat
ion
(sec
onds
)
Connection ID
Time Series of TCP Connection Duration (1 client, 32 KB, 10 req/sec, non-persistent)
0
5
10
15
20
25
0 0.05 0.1 0.15 0.2
Fre
quen
cy (
perc
ent)
TCP Connection Duration (seconds)
Distribution of TCP Connection Duration (1 client, 32 KB, 10 req/sec, non-persistent)
(c) (d)
0
0.05
0.1
0.15
0.2
0 100 200 300 400 500 600
TC
P C
onne
ctio
n D
urat
ion
(sec
onds
)
Connection ID
Time Series of TCP Connection Duration (1 client, 48 KB, 10 req/sec, non-persistent)
0
2
4
6
8
10
12
14
16
0 0.05 0.1 0.15 0.2
Fre
quen
cy (
perc
ent)
TCP Connection Duration (seconds)
Distribution of TCP Connection Duration (1 client, 48 KB, 10 req/sec, non-persistent)
(e) (f)
0
2
4
6
8
10
0 50 100 150 200 250
TC
P C
onne
ctio
n D
urat
ion
(sec
onds
)
Connection ID
Time Series of TCP Connection Duration (1 client, 64 KB, 10 req/sec, non-persistent)
0
0.5
1
1.5
2
2.5
3
3.5
4
4.5
5
0 2 4 6 8 10
Fre
quen
cy (
perc
ent)
TCP Connection Duration (seconds)
Distribution of TCP Connection Duration (1 client, 64 KB, 10 req/sec, non-persistent)
(g) (h)
Fig. 13. Network traffic measurement results for Experiment 4: behaviour of TCP connection duration as a function of HTTP transfer size(1 client, 10 req/s, non-persistent): (a) time series (8 KB), (b) marg. dist. (8 KB), (c) time series (32 KB), (d) marg. dist. (32 KB), (e) timeseries (48 KB), (f) marg. dist. (48 KB), (g) time series (64 KB) and (h) marg. dist. (64 KB).
16 G. Bai et al. / Ad Hoc Networks xxx (2006) xxx–xxx
ADHOC 156 No. of Pages 21, Model 3+
13 February 2006; Disk UsedARTICLE IN PRESS
T
OOF
799800801802803804805806807808809810811812813814815
816
817818819820821822823824825826827828829830831832833
834835836837838839840841842843844845846847848849850851852853854855856857858859860861862863864865866
0
20
40
60
80
100
0 2000 4000 6000 8000 10000 12000 14000 16000
Clie
nt T
rans
mit
Que
ue L
engt
h
Transmitted Packet ID
0
20
40
60
80
100
0 2000 4000 6000 8000 10000 12000 14000 16000 18000
Ser
ver
Tra
nsm
it Q
ueue
Len
gth
Transmitted Packet ID(a) (b)
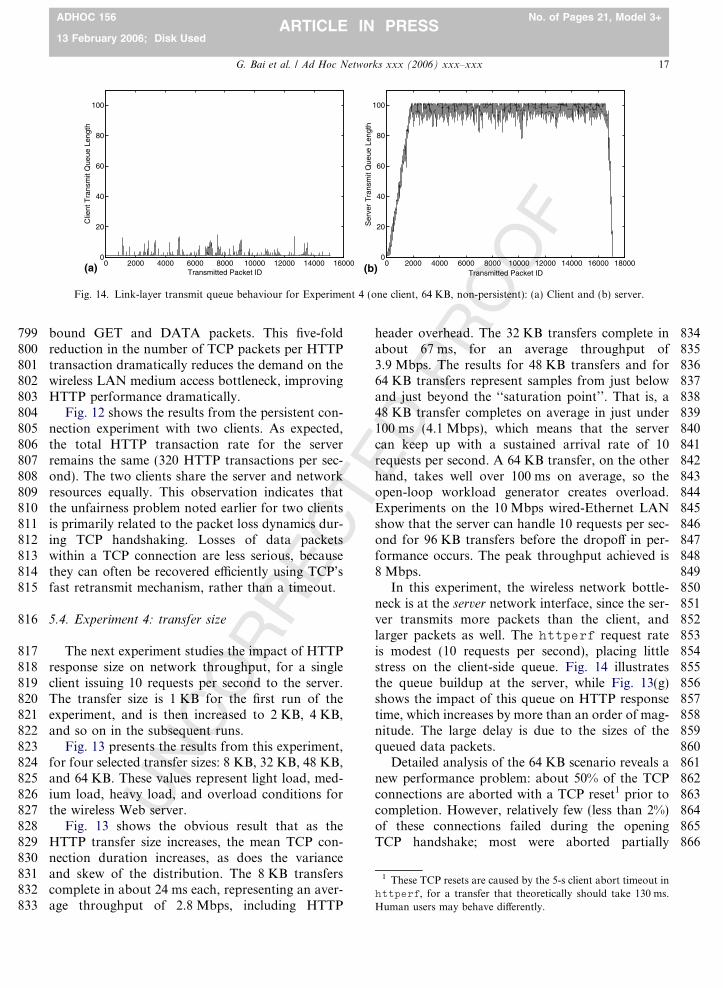
Fig. 14. Link-layer transmit queue behaviour for Experiment 4 (one client, 64 KB, non-persistent): (a) Client and (b) server.
1 These TCP resets are caused by the 5-s client abort timeout inhttperf, for a transfer that theoretically should take 130 ms.Human users may behave differently.
G. Bai et al. / Ad Hoc Networks xxx (2006) xxx–xxx 17
ADHOC 156 No. of Pages 21, Model 3+
13 February 2006; Disk UsedARTICLE IN PRESS
UNCORREC
bound GET and DATA packets. This five-foldreduction in the number of TCP packets per HTTPtransaction dramatically reduces the demand on thewireless LAN medium access bottleneck, improvingHTTP performance dramatically.
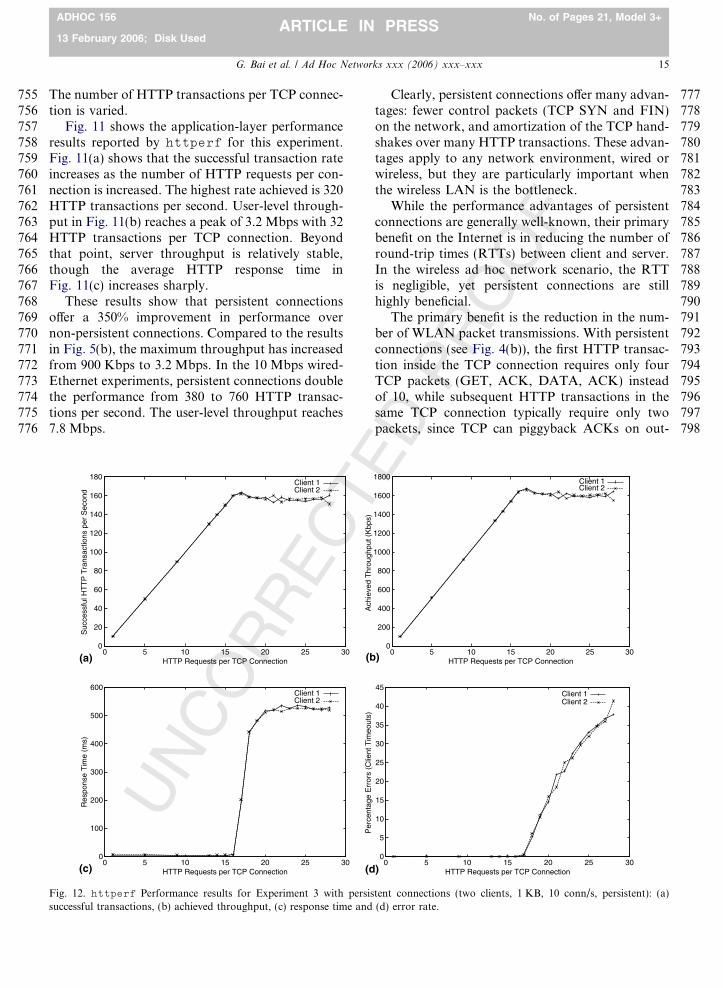
Fig. 12 shows the results from the persistent con-nection experiment with two clients. As expected,the total HTTP transaction rate for the serverremains the same (320 HTTP transactions per sec-ond). The two clients share the server and networkresources equally. This observation indicates thatthe unfairness problem noted earlier for two clientsis primarily related to the packet loss dynamics dur-ing TCP handshaking. Losses of data packetswithin a TCP connection are less serious, becausethey can often be recovered efficiently using TCP’sfast retransmit mechanism, rather than a timeout.
5.4. Experiment 4: transfer size
The next experiment studies the impact of HTTPresponse size on network throughput, for a singleclient issuing 10 requests per second to the server.The transfer size is 1 KB for the first run of theexperiment, and is then increased to 2 KB, 4 KB,and so on in the subsequent runs.
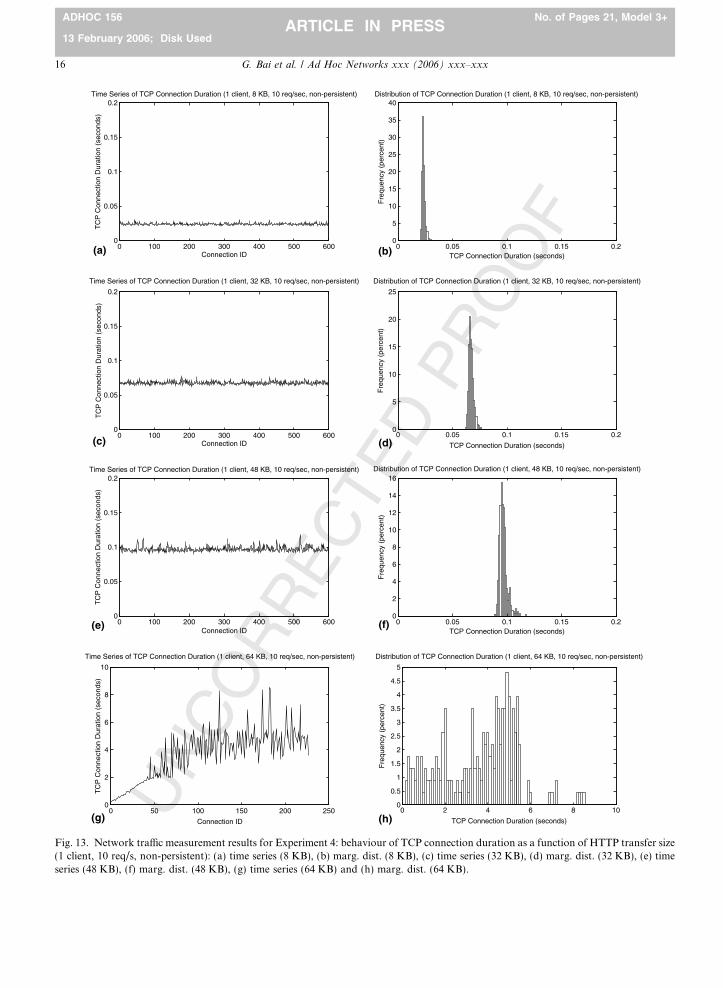
Fig. 13 presents the results from this experiment,for four selected transfer sizes: 8 KB, 32 KB, 48 KB,and 64 KB. These values represent light load, med-ium load, heavy load, and overload conditions forthe wireless Web server.
Fig. 13 shows the obvious result that as theHTTP transfer size increases, the mean TCP con-nection duration increases, as does the varianceand skew of the distribution. The 8 KB transferscomplete in about 24 ms each, representing an aver-age throughput of 2.8 Mbps, including HTTP
EDPRheader overhead. The 32 KB transfers complete in
about 67 ms, for an average throughput of3.9 Mbps. The results for 48 KB transfers and for64 KB transfers represent samples from just belowand just beyond the ‘‘saturation point’’. That is, a48 KB transfer completes on average in just under100 ms (4.1 Mbps), which means that the servercan keep up with a sustained arrival rate of 10requests per second. A 64 KB transfer, on the otherhand, takes well over 100 ms on average, so theopen-loop workload generator creates overload.Experiments on the 10 Mbps wired-Ethernet LANshow that the server can handle 10 requests per sec-ond for 96 KB transfers before the dropoff in per-formance occurs. The peak throughput achieved is8 Mbps.
In this experiment, the wireless network bottle-neck is at the server network interface, since the ser-ver transmits more packets than the client, andlarger packets as well. The httperf request rateis modest (10 requests per second), placing littlestress on the client-side queue. Fig. 14 illustratesthe queue buildup at the server, while Fig. 13(g)shows the impact of this queue on HTTP responsetime, which increases by more than an order of mag-nitude. The large delay is due to the sizes of thequeued data packets.
Detailed analysis of the 64 KB scenario reveals anew performance problem: about 50% of the TCPconnections are aborted with a TCP reset1 prior tocompletion. However, relatively few (less than 2%)of these connections failed during the openingTCP handshake; most were aborted partially
867868869870871872873874875876877878879880881
882
883884885886
887888889890891892893894895896897898899900901902903904905906907908
18 G. Bai et al. / Ad Hoc Networks xxx (2006) xxx–xxx
ADHOC 156 No. of Pages 21, Model 3+
13 February 2006; Disk UsedARTICLE IN PRESS
through the transfer. On average, each of the resetconnections sent 68 packets and 47 KB of data.
Network bandwidth is the scarce resource in thisexperiment. The main concern is ‘‘network thrash-ing’’: a large portion of the wireless channel band-width is consumed by TCP connections thateventually abort (i.e., partial transfers). While theaverage throughput at the network layer exceeds5 Mbps, the effective user-level goodput is about2.2 Mbps.
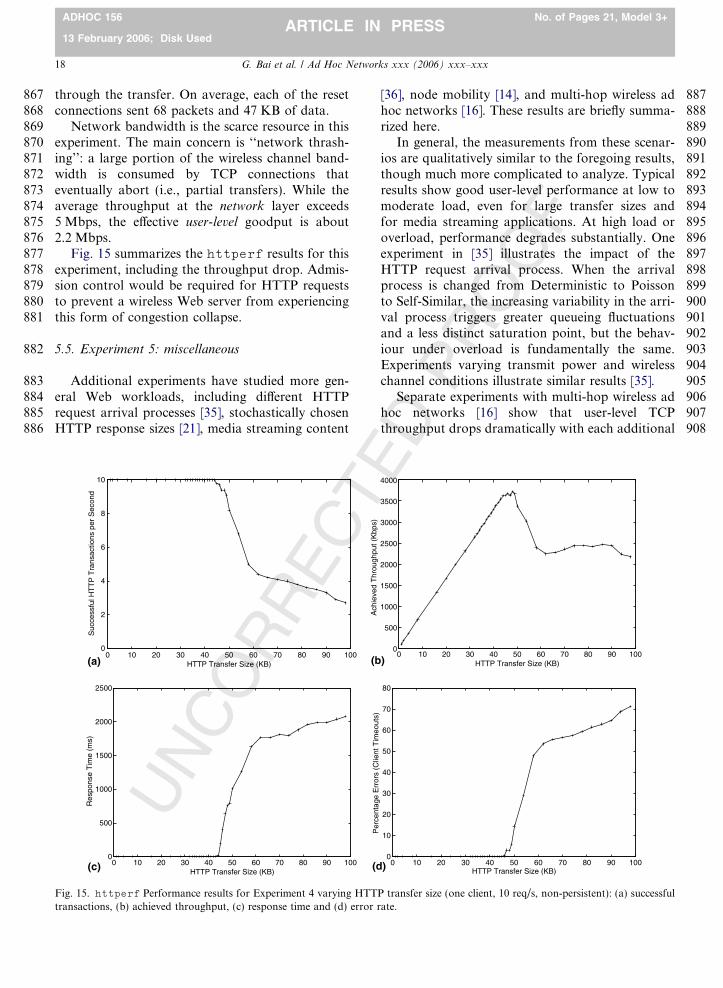
Fig. 15 summarizes the httperf results for thisexperiment, including the throughput drop. Admis-sion control would be required for HTTP requeststo prevent a wireless Web server from experiencingthis form of congestion collapse.
5.5. Experiment 5: miscellaneous
Additional experiments have studied more gen-eral Web workloads, including different HTTPrequest arrival processes [35], stochastically chosenHTTP response sizes [21], media streaming content
UNCORRECT
0
2
4
6
8
10
0 10 20 30 40 50 60 70 80 90 100
Suc
cess
ful H
TT
P T
rans
actio
ns p
er S
econ
d
HTTP Transfer Size (KB)
Ach
ieve
d T
hrou
ghpu
t (K
bps)
(a) (b
0
500
1000
1500
2000
2500
0 10 20 30 40 50 60 70 80 90 100
Res
pons
e T
ime
(ms)
HTTP Transfer Size (KB)(c) (d
Fig. 15. httperf Performance results for Experiment 4 varying HTTtransactions, (b) achieved throughput, (c) response time and (d) error
PROOF
[36], node mobility [14], and multi-hop wireless adhoc networks [16]. These results are briefly summa-rized here.
In general, the measurements from these scenar-ios are qualitatively similar to the foregoing results,though much more complicated to analyze. Typicalresults show good user-level performance at low tomoderate load, even for large transfer sizes andfor media streaming applications. At high load oroverload, performance degrades substantially. Oneexperiment in [35] illustrates the impact of theHTTP request arrival process. When the arrivalprocess is changed from Deterministic to Poissonto Self-Similar, the increasing variability in the arri-val process triggers greater queueing fluctuationsand a less distinct saturation point, but the behav-iour under overload is fundamentally the same.Experiments varying transmit power and wirelesschannel conditions illustrate similar results [35].
Separate experiments with multi-hop wireless adhoc networks [16] show that user-level TCPthroughput drops dramatically with each additional
ED
0
500
1000
1500
2000
2500
3000
3500
4000
0 10 20 30 40 50 60 70 80 90 100HTTP Transfer Size (KB))
0
10
20
30
40
50
60
70
80
0 10 20 30 40 50 60 70 80 90 100
Per
cent
age
Err
ors
(Clie
nt T
imeo
uts)
HTTP Transfer Size (KB))
P transfer size (one client, 10 req/s, non-persistent): (a) successfulrate.
T
909910911912913914915916917918919920921922923924925926927928929930931932933934935936937938939940941942943944945946947948949950
951
952953954955956957958
9599609619629639649659669679689699709719729739749759769779789799809819829839849859869879889899909919929939949959969979989991000
1001
1002100310041005100610071008
G. Bai et al. / Ad Hoc Networks xxx (2006) xxx–xxx 19
ADHOC 156 No. of Pages 21, Model 3+
13 February 2006; Disk UsedARTICLE IN PRESS
UNCORREC
hop in the routing path. The drop in throughputoccurs primarily because of the contention for theshared wireless channel at each routing hop, andthe bidirectional nature of the network traffic flows.Additional factors are the overhead of the ad hocrouting protocol, and the non-deterministic behav-iours of the MAC-layer protocols.
Additional experiments have considered wirelessmedia streaming performance in a single-hop wire-less ad hoc network [36]. Empirical measurementresults show that the IEEE 802.11b wireless adhoc network can support up to eight concurrent uni-cast MPEG-4 streams, each with 400 Kbps videoand 128 Kbps audio. Adding one more streamdestroys the quality of service for all clients, becauseof packet losses at the server’s wireless networkinterface.
Node mobility in the ad hoc network can cause a‘‘bad apple’’ phenomenon [14], wherein the aggre-gate network performance effectively degrades tothat of the client with the worst wireless channelquality. In particular, one client with poor or tran-sient wireless connectivity can degrade throughputand cause packet losses for all clients in the network[14,36]. The problem arises because of a transientHead of Line (HOL) blocking problem: when thepacket at the front of the server’s link-layer queueundergoes excessive retransmissions to the ‘‘badapple’’ client, the queue fills and overflows, drop-ping packets for all clients.
Other researchers have confirmed the presence ofthese types of performance anomalies in (54 Mbps)IEEE 802.11g wireless networks as well [30]. Theseauthors have considered TCP, UDP, and mediastreaming workloads in an infrastructure-basedIEEE 802.11g WLAN, finding dramatic perfor-mance differences depending on the wireless channelquality for each of the clients.
Separate papers in our own research group haveused simulation to evaluate the efficacy of novelMAC-layer protocols to solve these types of prob-lems [15,37].
6. Summary and conclusions
This paper studies the performance of a wirelessWeb server in a short-lived wireless ad hoc network,such as a classroom area network. Application-layerand network-layer measurements are used to assessperformance capabilities and limitations. In particu-lar, the experiments focus on HTTP transaction rateand user-level throughput, as a function of request
EDPROOF
rate, number of clients, transfer size, and HTTPprotocol features. Measurements were conductedon an IEEE 802.11b wireless LAN, using a wire-less-enabled Apache Web server, several wireless cli-ent laptops, and a wireless network analyzer.
Our experiments show that wireless Web serverscan provide 1 KB HTTP transaction rates of 110connections per second for non-persistent HTTPand 320 HTTP transactions per second for persis-tent connections, with throughputs ranging from 1to 3 Mbps. Several interesting performance prob-lems are observed: a bottleneck at the wireless net-work interface for either the client or the server,depending on the workload; unfairness amongst cli-ents due to packet losses during TCP connectionhandshaking; and a network thrashing problemfor large HTTP transfers under overload. The useof persistent HTTP connections can overcome theinefficiencies of the IEEE 802.11b MAC protocol,tripling the effective HTTP transaction rate, whilealso improving fairness for clients accessing thewireless Web server.
Simulation models have been used to reproducemany of the behaviours observed in our experi-ments, and to predict performance for up to 100 cli-ents [38]. Few of the performance problemsidentified in this paper (e.g., packet loss, phasingeffects, unfairness, network thrashing) are seen inthe classroom environment with human clients,because of the lower average workloads generated(i.e., due to think times, randomization, low requestrates, and browser caching effects). Nevertheless,our study is valuable in identifying the performanceproblems that must be overcome to make the wire-less Web server solution scale well (e.g., in under-graduate classrooms with 150 students, or sportsvenues with thousands of spectators).
Experiments with a 54 Mbps IEEE 802.11a wire-less LAN remain for future work. We suspect thatmany of the performance problems observed in thispaper apply equally well to 802.11a ad hocnetworks.
Acknowledgements
Financial support for this research was providedby iCORE (Informatics Circle of Research Excel-lence) in the Province of Alberta, the Natural Sci-ences and Engineering Research Council (NSERC)of Canada, and the Canada Foundation for Innova-tion (CFI). The authors are grateful to Martin Ar-litt, Tianbo Kuang, and Nayden Markatchev for
T
10091010
1011
1012101310141015101610171018101910201021102210231024102510261027102810291030103110321033103410351036103710381039104010411042104310441045104610471048104910501051105210531054105510561057105810591060106110621063106410651066
1067106810691070107110721073107410751076107710781079108010811082108310841085108610871088108910901091109210931094109510961097109810991100110111021103110411051106110711081109111011111112111311141115111611171118111911201121112211231124112511261127
20 G. Bai et al. / Ad Hoc Networks xxx (2006) xxx–xxx
ADHOC 156 No. of Pages 21, Model 3+
13 February 2006; Disk UsedARTICLE IN PRESS
UNCORREC
their technical support and contributions to thiswork.
References
[1] G. Bai, K. Oladosu, C. Williamson, Performance issues forwireless Web servers, in: Proceedings of InternationalWorkshop on Mobile and Wireless Ad Hoc Networking(MWAN), Las Vegas, NV, June 2004, pp. 59–65.
[2] W. Stevens, TCP/IP Illustrated, Volume 1: The Protocols,Addison-Wesley, 1994.
[3] RFC 1945: Hypertext Transfer Protocol—HTTP/1.0. Avail-able from: <http://www.ietf.org/rfc/rfc1945.txt>.
[4] RFC 2616: Hypertext Transfer Protocol—HTTP/1.1. Avail-able from: <http://www.ietf.org/rfc/rfc2616.txt>.
[5] A. Balachandran, G. Voelker, P. Bahl, P. Rangan, Charac-terizing user behavior and network performance in a publicwireless LAN, in: Proceedings of ACM SIGMETRICS,Marina Del Rey, CA, June 2002, pp. 195–205.
[6] B. Bennington, C. Bartel, Wireless Andrew: experiencebuilding a high speed, campus-wide wireless data network,in: Proceedings of ACM MOBICOM, Budapest, Hungary,September 1997, pp. 55–65.
[7] T. Hansen, P. Yalamanchili, H.-W. Braun, Wireless mea-surement and analysis on HPWREN, in: Proceedings ofPassive and Active Measurement Workshop, Fort Collins,Co, 2002, pp. 222–229.
[8] R. Krashinsky, H. Balakrishnan, Minimizing energy forwireless Web access using bounded slowdown, in: Proceed-ings of ACM MOBICOM, Atlanta, GA, September 2002.
[9] B. Noble, M. Satyanarayanan, G. Nguyen, R. Katz, Tracebased mobile network emulation, in: Proceedings of ACMSIGCOMM, Cannes, France, September 1997, pp. 51–61.
[10] H. Singh, P. Singh, Energy consumption of TCP Reno, TCPNewReno, and SACK in multihop wireless networks, in:Proceedings of ACM SIGMETRICS, Marina Del Rey, CA,June 2002, pp. 206–216.
[11] D. Tang, M. Baker, Analysis of a metropolitan-area wirelessnetwork, in: Proceedings of ACMMOBICOM, Seattle, WA,August 1999, pp. 13–23.
[12] D. Tang, M. Baker, Analysis of a local-area wirelessnetwork, in: Proceedings of ACM MOBICOM, Boston,MA, August 2000, pp. 1–10.
[13] D. Kotz, K. Essien, Analysis of a campus-wide wirelessnetwork, in: Proceedings of ACM MOBICOM, Atlanta,GA, September 2002.
[14] G. Bai, C. Williamson, The effects of mobility on wirelessmedia streaming performance, in: Proceedings of WirelessNetworks and Emerging Technologies (WNET), Banff, AB,Canada, July 2004, pp. 596–601.
[15] T. Kuang, C. Williamson, A bidirectional multi-channelMAC protocol for improving TCP performance on multihopwireless ad hoc networks, in: Proceedings of 7th ACMInternational Symposium on the Modeling and Simulationof Wireless and Mobile Systems (MSWiM), Venice, Italy,October 2004, pp. 301–310.
[16] A. Gupta, I. Wormsbecker, C. Williamson, Experimentalevaluation of TCP performance on multihop wireless ad hocnetworks, in: Proceedings of 12th IEEE Symposium onModeling, Analysis, and Simulation of Computers and
1128
EDPROOF
Telecommunication Systems (MASCOTS), Volendam,Netherlands, October 2004, pp. 3–11.
[17] D. Mosberger, T. Jin, Httperf—a tool for measuring Webserver performance, ACM Performance Evaluation Review26 (3) (1998) 31–37.
[18] Y. Hu, A. Nanda, Q. Yang, Measurement, analysis, andperformance improvement of the apache Web server, Inter-national Journal of Computers and Their Applications 8 (4)(2001).
[19] E. Nahum, M. Rosu, S. Seshan, J. Almeida, The effects ofwide-area conditions on WWW server performance, in:Proceedings of ACM SIGMETRICS Conference, Cam-bridge, MA, June 2001, pp. 257–267.
[20] Available from: <http://www.netcraft.com/survey>.[21] C. Williamson, R. Simmonds, M. Arlitt, A case study of
Web server benchmarking using parallel WAN emulation,Performance Evaluation 49 (1–4) (2002) 111–127.
[22] M. Arlitt, C. Williamson, Understanding Web server con-figuration issues, Software: Practice and Experience 34 (2)(2004) 163–186.
[23] J. Jun, P. Peddabachagari, M. Sichitiu, Theoretical maxi-mum throughput of IEEE 802.11 and its applications, in:Proceedings of the 2nd IEEE International Symposium onNetwork Computing and Applications (NCA’03), Cam-bridge, MA, April 2003, pp. 249–256.
[24] P. Barford, M. Crovella, Generating representative Webworkloads for network and server performance evaluation,in: Proceedings of ACM SIGMETRICS Conference, Mad-ison, WI, June 1998, pp. 151–160.
[25] Netperf: a network performance benchmark. Availablefrom: <http://www.netperf.org>.
[26] T. Kuang, F. Xiao, C. Williamson, Wireless TCP perfor-mance problems: a case study, in: Proceedings of SCSSymposium on Performance Evaluation of Computer andTelecommunication Systems (SPECTS), Montreal, PQ,Canada, July 2003, pp. 176–185.
[27] L. Eggert, J. Heidemann, J. Touch, Effects of ensemble-TCP,ACM Computer Communication Review 30 (1) (2000) 15–29.
[28] Y. Bejerano, S. Han, L. Li, Fairness and load balancing inwireless LANs using association control, in: Proceedings ofACM/IEEE MOBICOM’04’, Philadelphia, PA, September2004, pp. 315–329.
[29] M. Heusse, F. Rousseau, G. Berge-Dabbatel, A. Duda,Performance anomaly of 802.11b, in: Proceedings of IEEEINFOCOM’03, San Francisco, CA, March 2003, pp. 836–843.
[30] J. Gretarsson, F. Li, M. Li, A. Samant, H. Wu, M. Claypool,R. Kinicki, Performance analysis of the intertwined effectsbetween network layers for 802.11g transmissions, TechnicalReport WPI-CS-TR-05–09, Computer Science Department,Worcester Polytechnic Institute, May 2005.
[31] Z. Fu, P. Zerfos, H. Luo, S. Lu, L. Zhang, M. Gerla, Theimpact of multihop wireless channel on TCP throughput andloss, in: Proceedings of IEEE INFOCOM, San Francisco,CA, March 2003.
[32] S. Pilosof, R. Ramjee, D. Raz, Y. Shavitt, P. Sinha,Understanding TCP fairness over wireless LAN, in: Pro-ceedings of IEEE INFOCOM, San Francisco, CA, March2003.
[33] V. Padmanabhan, J. Mogul, Improving HTTP latency,Computer Networks and ISDN Systems 28 (1995) 25–35.
T
1129113011311132113311341135113611371138113911401141114211431144114511461147114811491150
11521152
1153115411551156115711581159116011611162116311641165
1166116711681169117011711172
11741174
117511761177117811791180118111821183118411851186
1187
11891189
119011911192119311941195119611971198119912001201
G. Bai et al. / Ad Hoc Networks xxx (2006) xxx–xxx 21
ADHOC 156 No. of Pages 21, Model 3+
13 February 2006; Disk UsedARTICLE IN PRESS
C
[34] S. Spero, Analysis of HTTP performance problems. Avail-able from: <http://sunsite.unc.edu/mdma-release/http-prob.html>.
[35] K. Oladosu, Performance and robustness testing of wirelessWeb servers, M.Sc. Thesis, Department of ComputerScience, University of Calgary, August 2003.
[36] X. Cao, G. Bai, C. Williamson, Media streaming perfor-mance in a portable wireless classroom network, in: Pro-ceedings of IASTED European Conference on InternetMultimedia Systems and Applications, Grindelwald, Swit-zerland, February 2005, pp. 246–252.
[37] T. Kuang, Q. Wu, C. Williamson, MRMC: a multi-ratemulti-channel MAC protocol for multi-radio wireless LANs,in: Proceedings of 1st International Workshop on WirelessNetworks and Communication Systems (WiNCS), Philadel-phia, PA, July 2005.
[38] G. Bai, C. Williamson, Simulation evaluation of wirelessWeb performance in an IEEE 802.11b classroom areanetwork, in: Proceedings of 3rd IEEE International Work-shop on Wireless Local Networks (WLN), Bonn, Germany,October 2003, pp. 663–672.
Guangwei Bai is currently an AssociateProfessor in the Department of Com-puter Science at the Nanjing Universityof Technology in China. He previouslyworked as a Research Associate in theDepartment of Computer Science at theUniversity of Calgary in Canada. Hereceived his B.Eng. and M.Eng. from theXi’an Jiaotong University in China, bothin Computer Engineering. He receivedhis Ph.D. in Computer Science from the
University of Hamburg in Germany. He worked at the GMD—German National Research Center for Information Technology,
UNCORRE
ROOF
Germany, as a Research Scientist, from 1999 to 2001. Since 2001,he has been working at the University of Calgary, Canada, as aResearch Associate. His research interests are in traffic mea-surement and modeling, workload characterization and perfor-mance analysis of the Internet, wireless networks, and multimediacommunication systems.
Kehinde Oladosu is a Ph.D. student in theDepartment of Computer Science at theUniversity of Western Ontario. He holdsa B.Sc. (Honours) in Computer Engi-neering from Ladoke Akintola Univer-sity of Technology, Nigeria, and anM.Sc. in Computer Science from theUniversity of Calgary, Canada. Hisresearch interests include network trafficmeasurement, network simulation, Webserver performance, grid computing, and
high performance computing.
EDP Carey Williamson is an iCORE Professor
in the Department of Computer Scienceat the University of Calgary, specializingin Broadband Wireless Networks, Pro-tocols, Applications, and Performance.He holds a B.Sc.(Honours) in ComputerScience from the University of Sas-katchewan, and a Ph.D. in ComputerScience from Stanford University. Hisresearch interests include Internet pro-tocols, wireless networks, network traffic
measurement, network simulation, and Web server performance.
1202
Related Documents