MicroVention, Inc. Worldwide Headquarters PH +1.714.247.8000 1311 Valencia Avenue Tustin, CA 92780 USA MicroVention UK Limited PH +44 (0) 191 258 6777 MicroVention Europe, S.A.R.L. PH +33 (1) 39 21 77 46 MicroVention Deutschland GmbH PH +49 211 210 798-0 Ischemic Stroke and Carotid Artery Disease Solutions Neurovascular Malformation Solutions For more information or a product demonstration, contact your local MicroVention representative: Performance Based Solutions

Welcome message from author
This document is posted to help you gain knowledge. Please leave a comment to let me know what you think about it! Share it to your friends and learn new things together.
Transcript
MicroVention, Inc.Worldwide Headquarters PH +1.714.247.80001311 Valencia AvenueTustin, CA 92780 USAMicroVention UK Limited PH +44 (0) 191 258 6777MicroVention Europe, S.A.R.L. PH +33 (1) 39 21 77 46MicroVention Deutschland GmbH PH +49 211 210 798-0
Ischemic Stroke and Carotid Artery Disease Solutions
Neurovascular Malformation Solutions
For more information or a product demonstration,contact your local MicroVention representative:
Performance Based Solutions
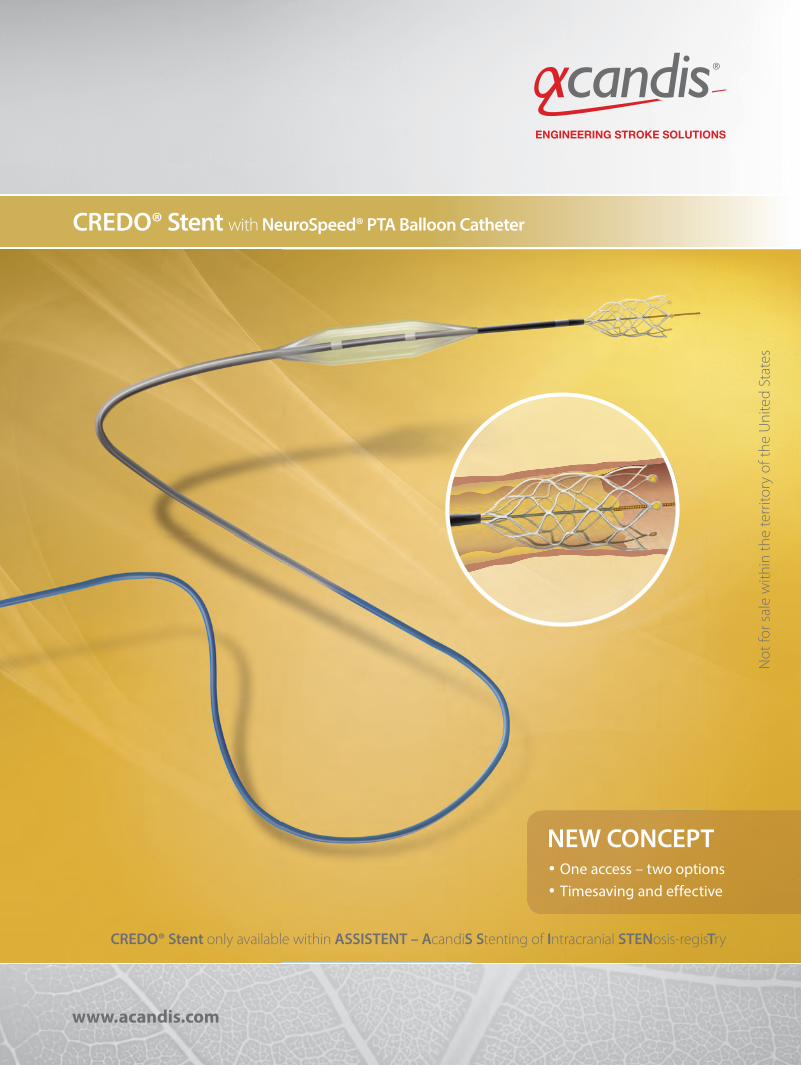
CREDO® Stent with NeuroSpeed® PTA Balloon Catheter
NEW CONCEPT One access – two options Timesaving and effective
www.acandis.com
CREDO® Stent only available within ASSISTENT – AcandiS Stenting of Intracranial STENosis-regisTry
Not
for s
ale
with
in th
e te
rrito
ry o
f the
Uni
ted
Stat
es

MKTG-060 Rev. A
The Barricade Coil System is intended for the endovascular embolization of intracranial aneurysms and other neurovascular abnormalities such as arteriovenous malformations and arteriovenous fistulae. The System is also intended for vascular occlusion of blood vessels within the neurovascular system to permanently obstruct blood flow to an aneurysm or other vascular malformation and for arterial and venous embolizations in the peripheral vasculature. Refer to the instructions for use for complete product information.
WWW.BLOCKADEMEDICAL.COM18 TECHNOLOGY DRIVE #169, IRVINE CA 92618 | p: 949.788.1443 | f: 949.788.1444
* Estimated savings in this case, data on file.
COILS THAT
PERFORM
Images courtesy of Timothy Malisch, M.D.
COILS THAT
SAVE $ BARRICADE COILS
SAVED $6,710*
Treatment and 10 Month Follow-up of Right ICA Terminus Aneurysm and Left Pcom Aneurysm
10 MONTH FOLLOW-UP
PRE-TREATMENT RIGHT ICA POST-TREATMENT RIGHT ICA
POST-TREATMENT LEFT PCOMPRE-TREATMENT LEFT PCOM
“ The Barricade Coil System provided great versatility in treating these two aneurysms with diverse
morphologies. I am impressed with the stable and complete occlusion of both aneurysms at follow-up.”-Timothy Malisch, M.D.

www.rapid-medical.com > tigertriever
The b
rain at yo
ur fin
gertip
s

Copyright © 2016 StrykerNV00018669.AA
Target Detachable Coils deliver consistently smooth deployment and exceptional microcatheter stability. Designed to work seamlessly together for framing, fi lling and fi nishing. Target Coils deliver the high performance you demand. For more information, please visit www.strykerneurovascular.com/Target or contact your local Stryker Neurovascular sales representative.
Smooth and stable.

Penumbra System®
®
www.penumbrainc.com
®®
Copyright ©2016 Penumbra, Inc. All rights reserved. Thee Penumbra logo, Penumbra System, ACE, and Penumbra SMART COIL are registered trademarks or traademarks of Penumbra, Inc. in the USA andother countries. 11071, Rev. A 09/16 USA
Caution: Federal (USA) law restricts the device to sale by or on the order of a physician. Prior to use, please refer to the Instructions for Usee for Penumbra System, Pump MAX and Penumbra SMART COIL System for complete prodduct indications, contraindications, warnings, precautions, potential adverse events and deetailed instructions for use. Product availability varies by country.
ONE SYSTEMUltimate Tracking


Come to the beach! Please join us in Long Beach, California, April 22-27, 2017, for the 55th Annual Meeting of the ASNR. Known for its 5.5 miles of Pacific Ocean waterfront, this southern California beach resort boasts a blend of city sophistication and seaside serenity. ASNR is delighted to provide a “4D” focus for this meeting, as depicted by our meeting logo: Discovery and Didactics for The Foundation of the ASNR Symposium 2017: Diagnosis and Delivery for the ensuing Annual Meeting Program.
Centered on Discovery and Didactics, the symposium will feature sessions on “What’s New?” in the role neuroimaging plays defining CNS disease mechanisms and how to best prepare for “What’s Next?” for our subspecialty in terms of training, teaching, and leading the process of lifelong learning. The annual meeting programming will address best practices in Diagnosis and Delivery, as we strive to provide value, promote quality in better health and care and consider cost. Our discussions will consider how to navigate the changing landscape of healthcare reform and reimbursement as subspecialists in a field that is changing at an equally “fast forward” pace!
Jacqueline A. Bello, MD, FACR ASNR 2017 Program Chair/President-ElectProgramming developed in cooperation with and appreciation of the…American Society of Functional Neuroradiology (ASFNR)Kirk M. Welker, MDAmerican Society of Head and Neck Radiology (ASHNR)Rebecca S. Cornelius, MD, FACRAmerican Society of Pediatric Neuroradiology (ASPNR)Susan Palasis, MDAmerican Society of Spine Radiology (ASSR)Joshua A. Hirsch, MD, FACR, FSIRSociety of NeuroInterventional Surgery (SNIS)Blaise W. Baxter, MDAmerican Society of Neuroradiology (ASNR) Health Policy CommitteeRobert M. Barr, MD, FACRComputer Sciences & Informatics (CSI) CommitteeJohn L. Go, MD, FACRResearch Scientist CommitteeDikoma C. Shungu, PhD and Timothy, P.L. Roberts, PhDThe International Hydrocephalus Imaging Working Group (IHIWG)/CSF Flow GroupWilliam G. Bradley, Jr., MD, PhD, Harold L. Rekate, MD and Bryn A. Martin, PhD
The Foundation of the ASNR Symposium 2017: Discovery and Didactics April 22-23, 2017
ASNR 55th Annual Meeting: Diagnosis and Delivery April 24-27, 2017
ASNR 55th Annual Meetingc/o American Society of Neuroradiology800 Enterprise Drive, Suite 205 • Oak Brook, Illinois 60523-4216Phone: 630-574-0220 • Fax: 630 574-0661 • 2017.asnr.org Hyatt Regency Long Beach
© Hyatt Regency Long Beach
Long Beach Convention & Entertainment Center © Long Beach Convention & Visitors Bureau
Westin Long Beach © The Westin Long Beach
Abstract Deadline: Friday, December 9, 2016Please visit 2017.asnr.org for more information

The evidence is so clear.
EBSCO Health
Sign up today at
DynaMedPlusAMAOffer.com
DynaMed Plus® is a member benefit for AMA individual members and JAMA Network individual registered users
The American Medical Association and DynaMed Plus are joining forces. Now, AMA individual members
and JAMA Network individual registered users get complimentary access to the most current clinical
evidence available with DynaMed Plus, the next-generation clinical information resource.
Target® Detachable Coil See package insert for complete indications, contraindications, warnings and instructions for use.
INTENDED USE / INDICATIONS FOR USETarget Detachable Coils are intended to endovascularly obstruct or occlude blood flow in vascular abnormalities of the neurovascular and peripheral vessels.Target Detachable Coils are indicated for endovascular embolization of:• Intracranial aneurysms• Other neurovascular abnormalities such as arteriovenous
malformations and arteriovenous fistulae• Arterial and venous embolizations in the peripheral
vasculature
CONTRAINDICATIONSNone known.
POTENTIAL ADVERSE EVENTSPotential complications include, but are not limited to: allergic reaction, aneurysm perforation and rupture, arrhythmia, death, edema, embolus, headache, hemorrhage, infection, ischemia, neurological/intracranial sequelae, post-embolization syndrome (fever, increased white blood cell count, discomfort), TIA/stroke, vasospasm, vessel occlusion or closure, vessel perforation, dissection, trauma or damage, vessel rupture, vessel thrombosis. Other procedural complications including but not limited to: anesthetic and contrast media risks, hypotension, hypertension, access site complications.
WARNINGS• Contents supplied STERILE using an ethylene oxide (EO)
process. Do not use if sterile barrier is damaged. If damage is found, call your Stryker Neurovascular representative.
• For single use only. Do not reuse, reprocess or resterilize. Reuse, reprocessing or resterilization may compromise the structural integrity of the device and/or lead to device failure which, in turn, may result in patient injury, illness or death. Reuse, reprocessing or resterilization may also create a risk of contamination of the device and/or cause patient infection or cross-infection, including, but not limited to, the transmission of infectious disease(s) from one patient to another. Contamination of the device may lead to injury, illness or death of the patient.
• After use, dispose of product and packaging in accordance with hospital, administrative and/or local government policy.
• This device should only be used by physicians who have received appropriate training in interventional neuroradiology or interventional radiology and preclinical training on the use of this device as established by Stryker Neurovascular.
• Patients with hypersensitivity to 316LVM stainless steel may suffer an allergic reaction to this implant.
• MR temperature testing was not conducted in peripheral vasculature, arteriovenous malformations or fistulae models.
• The safety and performance characteristics of the Target Detachable Coil System (Target Detachable Coils, InZone Detachment Systems, delivery systems and accessories) have not been demonstrated with other manufacturer’s devices (whether coils, coil delivery devices, coil detachment systems, catheters, guidewires, and/or other accessories). Due to the potential incompatibility of non Stryker Neurovascular devices with the Target Detachable Coil System, the use of other manufacturer’s device(s) with the Target Detachable Coil System is not recommended.
• To reduce risk of coil migration, the diameter of the first and second coil should never be less than the width of the ostium.
• In order to achieve optimal performance of the Target Detachable Coil System and to reduce the risk of thromboembolic complications, it is critical that a continuous infusion of appropriate flush solution be maintained between a) the femoral sheath and guiding catheter, b) the 2-tip microcatheter and guiding catheters, and c) the 2-tip microcatheter and Stryker Neurovascular guidewire and delivery wire. Continuous flush also reduces the potential for thrombus formation on, and crystallization of infusate around, the detachment zone of the Target Detachable Coil.
• Do not use the product after the “Use By” date specified on the package.
• Reuse of the flush port/dispenser coil or use with any coil other than the original coil may result in contamination of, or damage to, the coil.
• Utilization of damaged coils may affect coil delivery to, and stability inside, the vessel or aneurysm, possibly resulting in coil migration and/or stretching.
• The fluoro-saver marker is designed for use with a Rotating Hemostatic Valve (RHV). If used without an RHV, the distal end of the coil may be beyond the alignment marker when the fluoro-saver marker reaches the microcatheter hub.
• If the fluoro-saver marker is not visible, do not advance the coil without fluoroscopy.
• Do not rotate delivery wire during or after delivery of the
coil. Rotating the Target Detachable Coil delivery wire may result in a stretched coil or premature detachment of the coil from the delivery wire, which could result in coil migration.
• Verify there is no coil loop protrusion into the parent vessel after coil placement and prior to coil detachment. Coil loop protrusion after coil placement may result in thromboembolic events if the coil is detached.
• Verify there is no movement of the coil after coil placement and prior to coil detachment. Movement of the coil after coil placement may indicate that the coil could migrate once it is detached.
• Failure to properly close the RHV compression fitting over the delivery wire before attaching the InZone® Detachment System could result in coil movement, aneurysm rupture or vessel perforation.
• Verify repeatedly that the distal shaft of the catheter is not under stress before detaching the Target Detachable Coil. Axial compression or tension forces could be stored in the 2-tip microcatheter causing the tip to move during coil delivery. Microcatheter tip movement could cause the aneurysm or vessel to rupture.
• Advancing the delivery wire beyond the microcatheter tip once the coil has been detached involves risk of aneurysm or vessel perforation.
• The long term effect of this product on extravascular tissues has not been established so care should be taken to retain this device in the intravascular space.
Damaged delivery wires may cause detachment failures, vessel injury or unpredictable distal tip response during coil deployment. If a delivery wire is damaged at any point during the procedure, do not attempt to straighten or otherwise repair it. Do not proceed with deployment or detachment. Remove the entire coil and replace with undamaged product.
• After use, dispose of product and packaging in accordance with hospital, administrative and/or local government policy.
CAUTIONS / PRECAUTIONS• Federal Law (USA) restricts this device to sale by or on
the order of a physician.• Besides the number of InZone Detachment System units
needed to complete the case, there must be an extra InZone Detachment System unit as back up.
• Removing the delivery wire without grasping the introducer sheath and delivery wire together may result in the detachable coil sliding out of the introducer sheath.
• Failure to remove the introducer sheath after inserting the delivery wire into the RHV of the microcatheter will
interrupt normal infusion of flush solution and allow back flow of blood into the microcatheter.
• Some low level overhead light near or adjacent to the patient is required to visualize the fluoro-saver marker; monitor light alone will not allow sufficient visualization of the fluoro-saver marker.
• Advance and retract the Target Detachable Coil carefully and smoothly without excessive force. If unusual friction is noticed, slowly withdraw the Target Detachable Coil and examine for damage. If damage is present, remove and use a new Target Detachable Coil. If friction or resistance is still noted, carefully remove the Target Detachable Coil and microcatheter and examine the microcatheter for damage.
• If it is necessary to reposition the Target Detachable Coil, verify under fluoroscopy that the coil moves with a one-to-one motion. If the coil does not move with a one-to-one motion or movement is difficult, the coil may have stretched and could possibly migrate or break. Gently remove both the coil and microcatheter and replace with new devices.
• Increased detachment times may occur when:
– Other embolic agents are present.
– Delivery wire and microcatheter markers are not properly aligned.
– Thrombus is present on the coil detachment zone.• Do not use detachment systems other than the InZone
Detachment System.• Increased detachment times may occur when delivery
wire and microcatheter markers are not properly aligned.• Do not use detachment systems other than the InZone
Detachment System.
Stryker Neurovascular47900 Bayside ParkwayFremont, CA 94538
strykerneurovascular.com
Date of Release: MAR/2016
EX_EN_USCopyright © 2016 StrykerNV00018669.AB
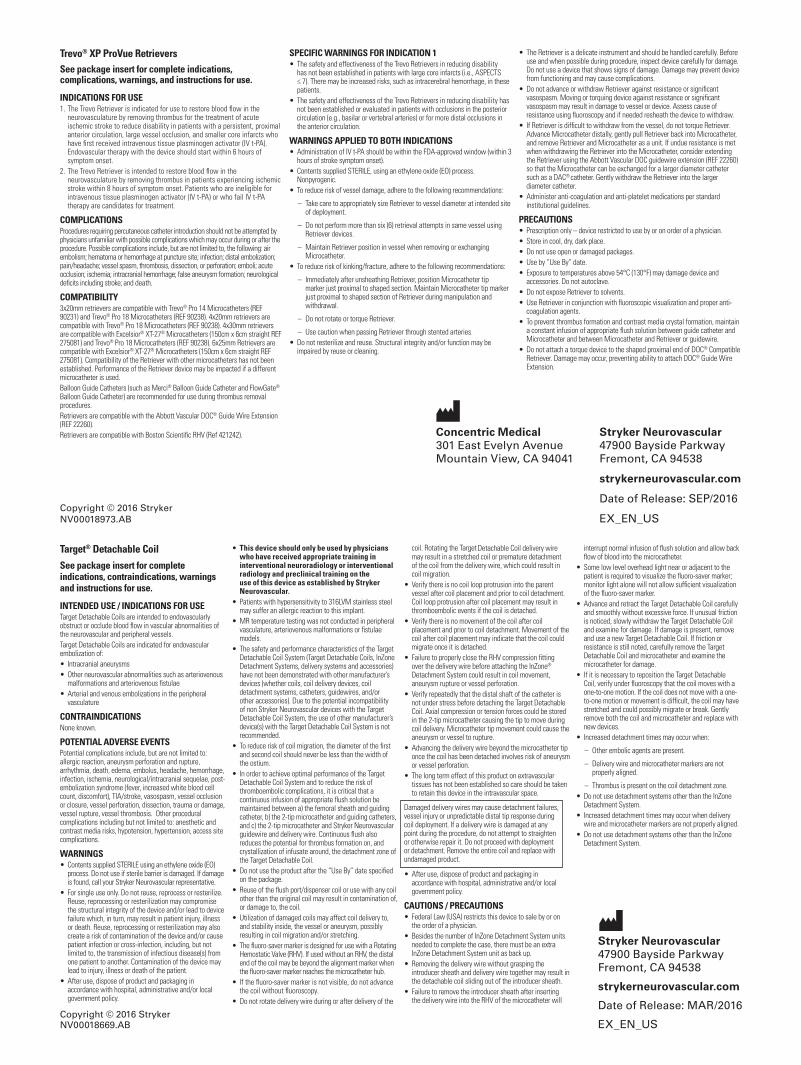
Trevo® XP ProVue Retrievers See package insert for complete indications, complications, warnings, and instructions for use.
INDICATIONS FOR USE1. The Trevo Retriever is indicated for use to restore blood flow in the
neurovasculature by removing thrombus for the treatment of acute ischemic stroke to reduce disability in patients with a persistent, proximal anterior circulation, large vessel occlusion, and smaller core infarcts who have first received intravenous tissue plasminogen activator (IV t-PA). Endovascular therapy with the device should start within 6 hours of symptom onset.
2. The Trevo Retriever is intended to restore blood flow in the neurovasculature by removing thrombus in patients experiencing ischemic stroke within 8 hours of symptom onset. Patients who are ineligible for intravenous tissue plasminogen activator (IV t-PA) or who fail IV t-PA therapy are candidates for treatment.
COMPLICATIONSProcedures requiring percutaneous catheter introduction should not be attempted by physicians unfamiliar with possible complications which may occur during or after the procedure. Possible complications include, but are not limited to, the following: air embolism; hematoma or hemorrhage at puncture site; infection; distal embolization; pain/headache; vessel spasm, thrombosis, dissection, or perforation; emboli; acute occlusion; ischemia; intracranial hemorrhage; false aneurysm formation; neurological deficits including stroke; and death.
COMPATIBILITY3x20mm retrievers are compatible with Trevo® Pro 14 Microcatheters (REF 90231) and Trevo® Pro 18 Microcatheters (REF 90238). 4x20mm retrievers are compatible with Trevo® Pro 18 Microcatheters (REF 90238). 4x30mm retrievers are compatible with Excelsior® XT-27® Microcatheters (150cm x 6cm straight REF 275081) and Trevo® Pro 18 Microcatheters (REF 90238). 6x25mm Retrievers are compatible with Excelsior® XT-27® Microcatheters (150cm x 6cm straight REF 275081). Compatibility of the Retriever with other microcatheters has not been established. Performance of the Retriever device may be impacted if a different microcatheter is used.Balloon Guide Catheters (such as Merci® Balloon Guide Catheter and FlowGate® Balloon Guide Catheter) are recommended for use during thrombus removal procedures.Retrievers are compatible with the Abbott Vascular DOC® Guide Wire Extension (REF 22260).Retrievers are compatible with Boston Scientific RHV (Ref 421242).
SPECIFIC WARNINGS FOR INDICATION 1• The safety and effectiveness of the Trevo Retrievers in reducing disability
has not been established in patients with large core infarcts (i.e., ASPECTS ≤ 7). There may be increased risks, such as intracerebral hemorrhage, in these patients.
• The safety and effectiveness of the Trevo Retrievers in reducing disability has not been established or evaluated in patients with occlusions in the posterior circulation (e.g., basilar or vertebral arteries) or for more distal occlusions in the anterior circulation.
WARNINGS APPLIED TO BOTH INDICATIONS• Administration of IV t-PA should be within the FDA-approved window (within 3
hours of stroke symptom onset). • Contents supplied STERILE, using an ethylene oxide (EO) process.
Nonpyrogenic.• To reduce risk of vessel damage, adhere to the following recommendations:
– Take care to appropriately size Retriever to vessel diameter at intended site of deployment.
– Do not perform more than six (6) retrieval attempts in same vessel using Retriever devices.
– Maintain Retriever position in vessel when removing or exchanging Microcatheter.
• To reduce risk of kinking/fracture, adhere to the following recommendations:
– Immediately after unsheathing Retriever, position Microcatheter tip marker just proximal to shaped section. Maintain Microcatheter tip marker just proximal to shaped section of Retriever during manipulation and withdrawal.
– Do not rotate or torque Retriever.
– Use caution when passing Retriever through stented arteries.• Do not resterilize and reuse. Structural integrity and/or function may be
impaired by reuse or cleaning.
• The Retriever is a delicate instrument and should be handled carefully. Before use and when possible during procedure, inspect device carefully for damage. Do not use a device that shows signs of damage. Damage may prevent device from functioning and may cause complications.
• Do not advance or withdraw Retriever against resistance or significant vasospasm. Moving or torquing device against resistance or significant vasospasm may result in damage to vessel or device. Assess cause of resistance using fluoroscopy and if needed resheath the device to withdraw.
• If Retriever is difficult to withdraw from the vessel, do not torque Retriever. Advance Microcatheter distally, gently pull Retriever back into Microcatheter, and remove Retriever and Microcatheter as a unit. If undue resistance is met when withdrawing the Retriever into the Microcatheter, consider extending the Retriever using the Abbott Vascular DOC guidewire extension (REF 22260) so that the Microcatheter can be exchanged for a larger diameter catheter such as a DAC® catheter. Gently withdraw the Retriever into the larger diameter catheter.
• Administer anti-coagulation and anti-platelet medications per standard institutional guidelines.
PRECAUTIONS• Prescription only – device restricted to use by or on order of a physician.• Store in cool, dry, dark place.• Do not use open or damaged packages.• Use by “Use By” date.• Exposure to temperatures above 54°C (130°F) may damage device and
accessories. Do not autoclave.• Do not expose Retriever to solvents.• Use Retriever in conjunction with fluoroscopic visualization and proper anti-
coagulation agents.• To prevent thrombus formation and contrast media crystal formation, maintain
a constant infusion of appropriate flush solution between guide catheter and Microcatheter and between Microcatheter and Retriever or guidewire.
• Do not attach a torque device to the shaped proximal end of DOC® Compatible Retriever. Damage may occur, preventing ability to attach DOC® Guide Wire Extension.
Concentric Medical301 East Evelyn AvenueMountain View, CA 94041
Stryker Neurovascular47900 Bayside ParkwayFremont, CA 94538
strykerneurovascular.com
Date of Release: SEP/2016
EX_EN_USCopyright © 2016 StrykerNV00018973.AB

microvention.com MICROVENTION is a registered trademark of MicroVention, Inc. Refer to Instructions for Use for additional information. © 2016 MicroVention, Inc. 08/16
WaWaWaWaay We e ththetthLLeaa taadddiiinnng ttLLLLeaeadularr Therappyyr Therapr cusscssscscsssovaassiinn NNeNeuu en vassurroooenendooovva
A 360-Degree Approach to
AneurysmTherapy Solutions
Copyright © 2016 StrykerNV00018973.AB
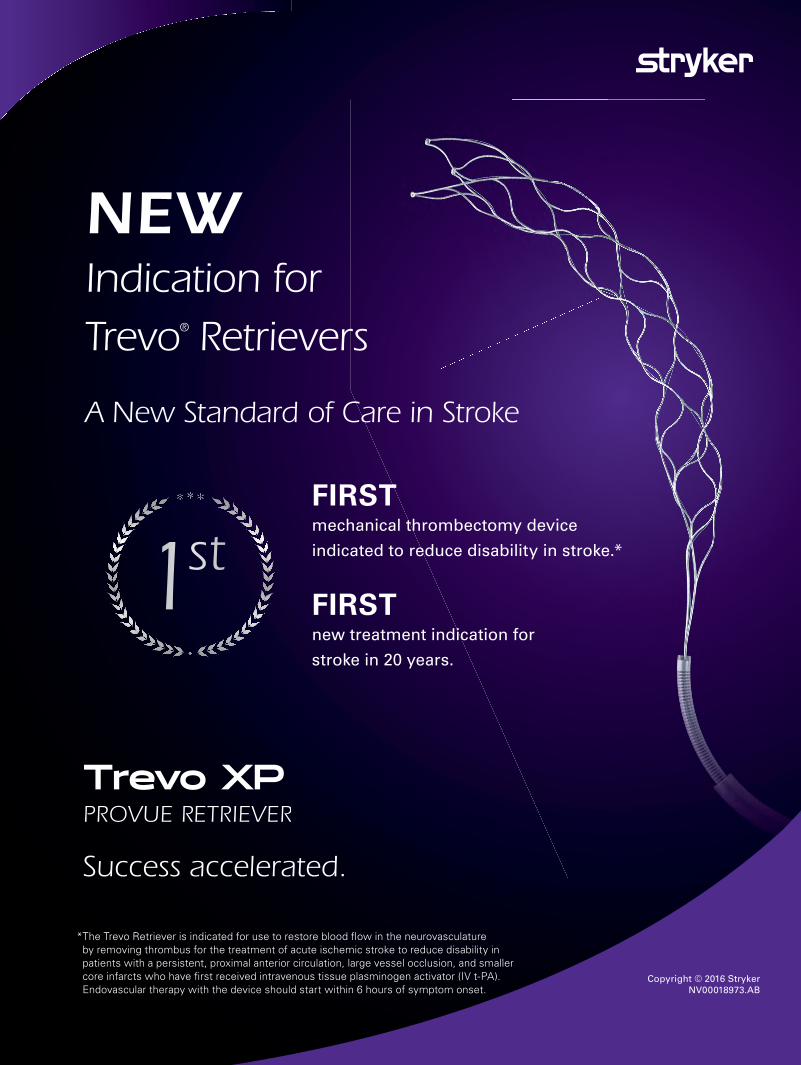
* The Trevo Retriever is indicated for use to restore blood fl ow in the neurovasculature by removing thrombus for the treatment of acute ischemic stroke to reduce disability in patients with a persistent, proximal anterior circulation, large vessel occlusion, and smaller core infarcts who have fi rst received intravenous tissue plasminogen activator (IV t-PA). Endovascular therapy with the device should start within 6 hours of symptom onset.
NEW Indication for Trevo® Retrievers
A New Standard of Care in Stroke
1stFIRST mechanical thrombectomy device
indicated to reduce disability in stroke.*
FIRSTnew treatment indication for
stroke in 20 years.
1000-025-340 Rev C
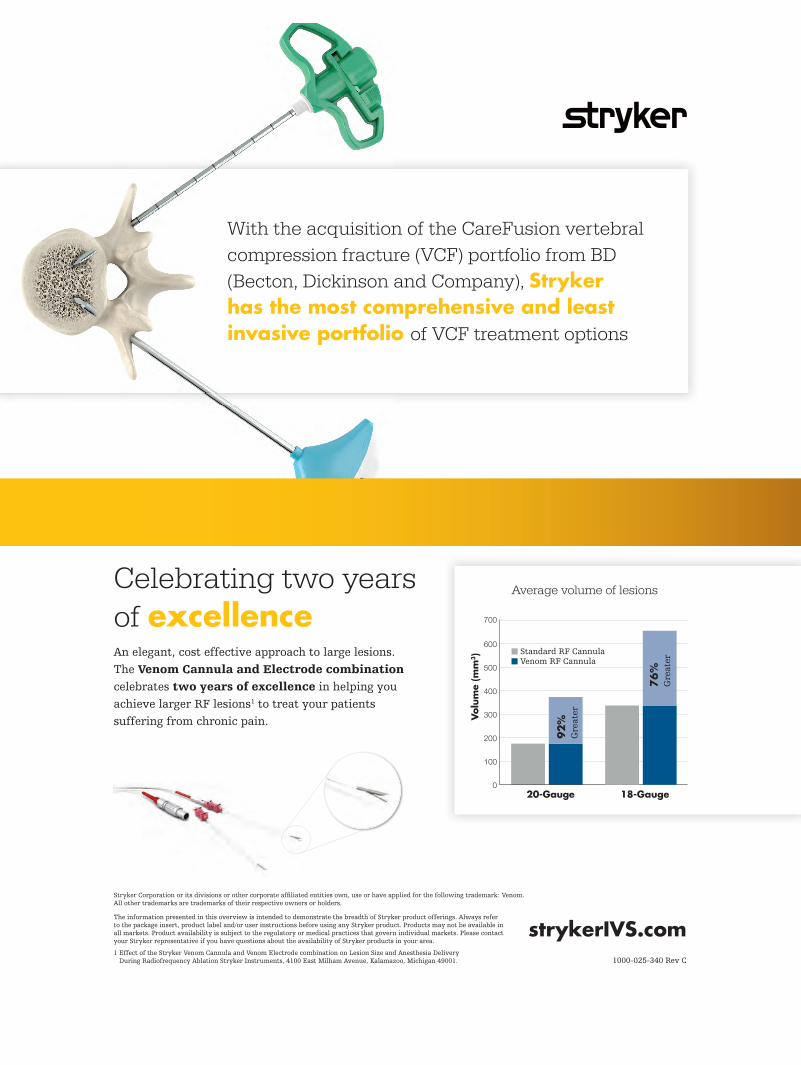
strykerIVS.com
Celebrating two years of excellenceThe Venom Cannula and Electrode combination
two years of excellence1
With the acquisition of the CareFusion vertebral compression fracture (VCF) portfolio from BD (Becton, Dickinson and Company), Stryker has the most comprehensive and least invasive portfolio of VCF treatment options
Average volume of lesions
Vol
ume
(mm
3)
20-Gauge
18-Gauge
92%
Gre
ater
76%
Gre
ater
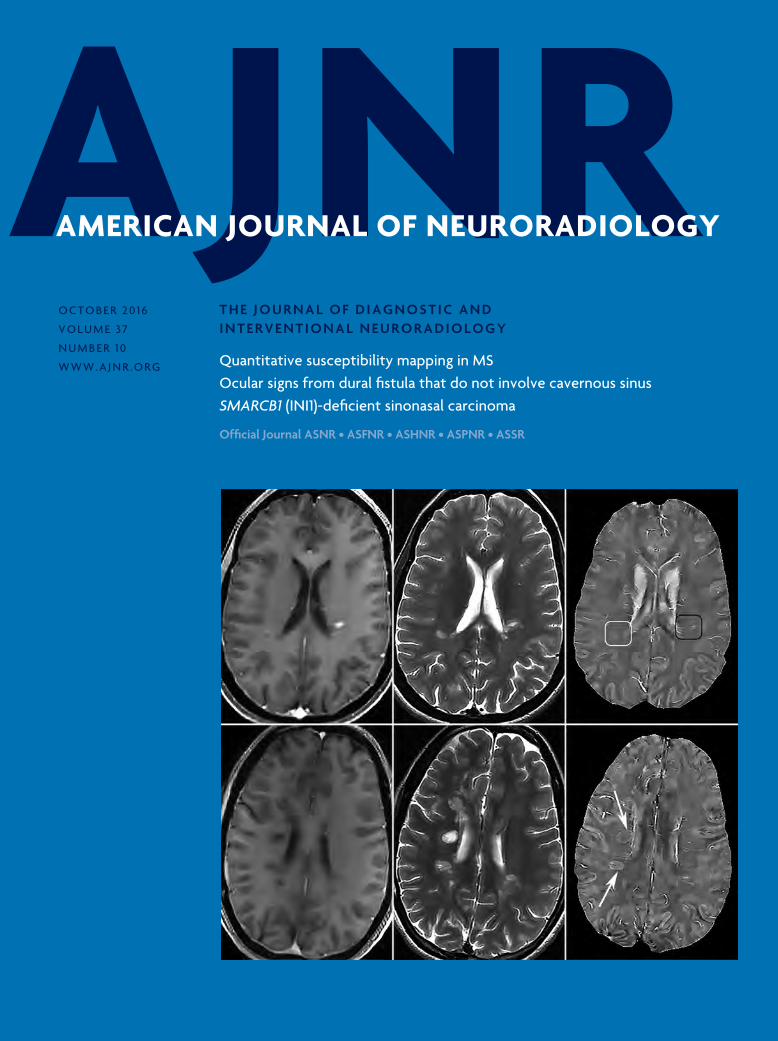
Quantitative susceptibility mapping in MSOcular signs from dural fistula that do not involve cavernous sinusSMARCB1 (INI1)-deficient sinonasal carcinoma
Official Journal ASNR • ASFNR • ASHNR • ASPNR • ASSR
O C T O B E R 2 0 1 6
V O L U M E 3 7
N U M B E R 1 0
W W W . A J N R . O R G
T H E J O U R N A L O F D I A G N O S T I C A N DI N T E R V E N T I O N A L N E U R O R A D I O L O G Y

1763 PERSPECTIVES S. Mukherjee
EDITORIAL
1764 Neuroimaging Findings in Congenital Zika Syndrome A. Poretti, et al.
REVIEW ARTICLE
1766 Brain Perfusion Imaging in Neonates: An Overview M. Proisy, et al. PEDIATRICS
PATIENT SAFETY
1774 Cerebral CTA with Low Tube Voltage and Low Contrast MaterialVolume for Detection of Intracranial Aneurysms Q.Q. Ni, et al.
ADULT BRAIN
GENERAL CONTENTS
1781 Effect of CTA Tube Current on Spot Sign Detection and Accuracy forPrediction of Intracerebral Hemorrhage Expansion A. Morotti, et al.
ADULT BRAIN
1787 Discordant Observation of Brain Injury by MRI and MalignantElectroencephalography Patterns in Comatose Survivors of CardiacArrest following Therapeutic Hypothermia J.M. Mettenburg, et al.
ADULT BRAIN
1794 Magnetic Susceptibility from Quantitative Susceptibility Mapping CanDifferentiate New Enhancing from Nonenhancing Multiple SclerosisLesions without Gadolinium Injection Y. Zhang, et al.
ADULT BRAIN
1800 Regional Frontal Perfusion Deficits in Relapsing-Remitting MultipleSclerosis with Cognitive Decline R. Vitorino, et al.
ADULT BRAIN
1808 In Vivo 7T MR Quantitative Susceptibility Mapping Reveals OppositeSusceptibility Contrast between Cortical and White Matter Lesions inMultiple Sclerosis W. Bian, et al.
ADULT BRAIN
1816 Improved Automatic Detection of New T2 Lesions in Multiple SclerosisUsing Deformation Fields M. Cabezas, et al.
ADULT BRAIN
1824 White Matter Hyperintensity Volume and Cerebral Perfusion inOlder Individuals with Hypertension Using Arterial Spin-LabelingJ.W. van Dalen, et al.
ADULT BRAIN
1831 High-Convexity Tightness Predicts the Shunt Response in IdiopathicNormal Pressure Hydrocephalus W. Narita, et al.
ADULT BRAIN
A JNRAMERICAN JOURNAL OF NEURORADIOLOGYO C T O B E R 2 0 1 6V O L U M E 3 7N U M B E R 1 0W W W . A J N R . O R G
Publication Preview at www.ajnr.org features articles released in advance of print.Visit www.ajnrblog.org to comment on AJNR content and chat with colleaguesand AJNR’s News Digest at http://ajnrdigest.org to read the stories behind thelatest research in neuroimaging.
AJNR (Am J Neuroradiol ISSN 0195– 6108) is a journal published monthly, owned and published by the American Society of Neuroradiology (ASNR),800 Enterprise Drive, Suite 205, Oak Brook, IL 60523. Annual dues for the ASNR include $170.00 for journal subscription. The journal is printed byCadmus Journal Services, 5457 Twin Knolls Road, Suite 200, Columbia, MD 21045; Periodicals postage paid at Oak Brook, IL and additional mailingoffices. Printed in the U.S.A. POSTMASTER: Please send address changes to American Journal of Neuroradiology, P.O. Box 3000, Denville, NJ 07834,U.S.A. Subscription rates: nonmember $390 ($460 foreign) print and online, $310 online only; institutions $450 ($520 foreign) print and basic online,$895 ($960 foreign) print and extended online, $370 online only (basic), extended online $805; single copies are $35 each ($40 foreign). Indexed byPubMed/Medline, BIOSIS Previews, Current Contents (Clinical Medicine and Life Sciences), EMBASE, Google Scholar, HighWire Press, Q-Sensei,RefSeek, Science Citation Index, and SCI Expanded. Copyright © American Society of Neuroradiology.

1838 Dynamic Susceptibility Contrast-Enhanced MR Perfusion Imagingin Assessing Recurrent Glioblastoma Response to SuperselectiveIntra-Arterial Bevacizumab Therapy R. Singh, et al.
ADULT BRAIN
1844 Differentiating Hemangioblastomas from Brain Metastases UsingDiffusion-Weighted Imaging and Dynamic Susceptibility Contrast-Enhanced Perfusion-Weighted MR Imaging D. She, et al.
ADULT BRAIN
1851 Shear Stiffness of 4 Common Intracranial Tumors Measured Using MRElastography: Comparison with Intraoperative Consistency GradingN. Sakai, et al.
ADULT BRAIN
1860 A Direct Aspiration, First Pass Technique (ADAPT) versus StentRetrievers for Acute Stroke Therapy: An Observational ComparativeStudy B. Lapergue, et al.
INTERVENTIONAL
1866 Flow Diversion for Ophthalmic Artery Aneurysms A.M. Burrows, et al. INTERVENTIONAL
1870 Ocular Signs Caused by Dural Arteriovenous Fistula withoutInvolvement of the Cavernous Sinus: A Case Series with Review of theLiterature T. Robert, et al.
INTERVENTIONAL
1876 Computational Modeling of Venous Sinus Stenosis in IdiopathicIntracranial Hypertension M.R. Levitt, et al.
INTERVENTIONAL
1883 Peritherapeutic Hemodynamic Changes of Carotid Stenting Evaluated withQuantitative DSA in Patients with Carotid Stenosis M.M.H. Teng, et al.
INTERVENTIONALEXTRACRANIALVASCULAR
1889 Intervention versus Aggressive Medical Therapy for Cognition in SevereAsymptomatic Carotid Stenosis C.-J. Lin, et al.
EXTRACRANIALVASCULAR
1898 Clinical Significance of the Champagne Bottle Neck Sign in theExtracranial Carotid Arteries of Patients with Moyamoya DiseaseC. Yasuda, et al.
EXTRACRANIALVASCULAR
1903 Blood-Labyrinth Barrier Permeability in Meniere Disease and IdiopathicSudden Sensorineural Hearing Loss: Findings on Delayed Postcontrast3D-FLAIR MRI M.N. Pakdaman, et al.
HEAD & NECK
1909 Evaluating Instantaneous Perfusion Responses of Parotid Glands toGustatory Stimulation Using High-Temporal-Resolution Echo-PlanarDiffusion-Weighted Imaging T.-W. Chiu, et al.
HEAD & NECK
1916 The CT Prevalence of Arrested Pneumatization of the Sphenoid Sinus inPatients with Sickle Cell Disease A.V. Prabhu, et al.
HEAD & NECK
1920 High-Resolution MRI Findings following Trigeminal RhizotomyB.G. Northcutt, et al.
HEAD & NECK
1925 Imaging Appearance of SMARCB1 (INI1)-Deficient Sinonasal Carcinoma:A Newly Described Sinonasal Malignancy D.R. Shatzkes, et al.
HEAD & NECK
1930 MRI Evaluation of Non-Necrotic T2-Hyperintense Foci in PediatricDiffuse Intrinsic Pontine Glioma O. Clerk-Lamalice, et al.
PEDIATRICS
1938 Volumetric Description of Brain Atrophy in Neuronal CeroidLipofuscinosis 2: Supratentorial Gray Matter Shows Uniform DiseaseProgression U. Lobel, et al.
PEDIATRICS
1944 MR Imaging of the Cervical Spine in Nonaccidental Trauma: A TertiaryInstitution Experience R. Jacob, et al.
PEDIATRICSSPINE
1951 CT Fluoroscopy–Guided Blood Patching of Ventral CSF Leaks by DirectNeedle Placement in the Ventral Epidural Space Using a TransforaminalApproach T.J. Amrhein, et al.
SPINE
1957 Automated Quantitation of Spinal CSF Volume and Measurement ofCraniospinal CSF Redistribution following Lumbar Withdrawal inIdiopathic Intracranial Hypertension N. Alperin, et al.
SPINE
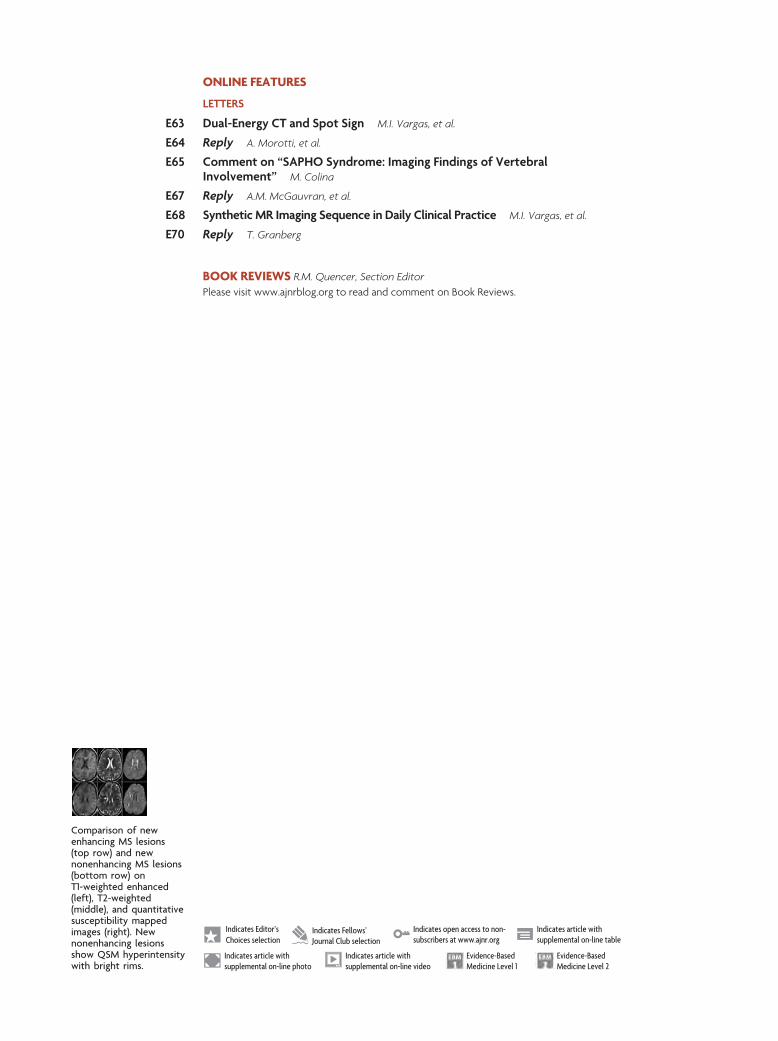
ONLINE FEATURES
LETTERS
E63 Dual-Energy CT and Spot Sign M.I. Vargas, et al.
E64 Reply A. Morotti, et al.
E65 Comment on “SAPHO Syndrome: Imaging Findings of VertebralInvolvement” M. Colina
E67 Reply A.M. McGauvran, et al.
E68 Synthetic MR Imaging Sequence in Daily Clinical Practice M.I. Vargas, et al.
E70 Reply T. Granberg
BOOK REVIEWS R.M. Quencer, Section EditorPlease visit www.ajnrblog.org to read and comment on Book Reviews.
Comparison of newenhancing MS lesions(top row) and newnonenhancing MS lesions(bottom row) onT1-weighted enhanced(left), T2-weighted(middle), and quantitativesusceptibility mappedimages (right). Newnonenhancing lesionsshow QSM hyperintensitywith bright rims.
Indicates Editor’sChoices selection
Indicates Fellows’Journal Club selection
Indicates open access to non-subscribers at www.ajnr.org
Indicates article withsupplemental on-line table
Indicates article withsupplemental on-line photo
Indicates article withsupplemental on-line video
Evidence-BasedMedicine Level 1
Evidence-BasedMedicine Level 2

AJNR AMERICAN JOURNAL OF NEURORADIOLOGYPublication Preview at www.ajnr.org features articles released in advance of print.Visit www.ajnrblog.org to comment on AJNR content and chat with colleaguesand AJNR’s News Digest at http://ajnrdigest.org to read the stories behind thelatest research in neuroimaging.
OCTOBER 2016 • VOLUME 37 • NUMBER 10 • WWW.AJNR.ORG
Official Journal:American Society of Neuroradiology
American Society of Functional NeuroradiologyAmerican Society of Head and Neck Radiology
American Society of Pediatric NeuroradiologyAmerican Society of Spine Radiology
EDITOR-IN-CHIEF
Jeffrey S. Ross, MDProfessor of Radiology, Department of Radiology,
Mayo Clinic College of Medicine, Phoenix, AZ
SENIOR EDITORS
Harry J. Cloft, MD, PhDProfessor of Radiology and Neurosurgery,
Department of Radiology, Mayo Clinic College ofMedicine, Rochester, MN
Thierry A.G.M. Huisman, MDProfessor of Radiology, Pediatrics, Neurology, and
Neurosurgery, Chairman, Department of Imagingand Imaging Science, Johns Hopkins Bayview,
Director, Pediatric Radiology and PediatricNeuroradiology, Johns Hopkins Hospital,
Baltimore, MD
C.D. Phillips, MD, FACRProfessor of Radiology, Weill Cornell MedicalCollege, Director of Head and Neck Imaging,New York-Presbyterian Hospital, New York, NY
Pamela W. Schaefer, MDClinical Director of MRI and Associate Director ofNeuroradiology, Massachusetts General Hospital,
Boston, Massachusetts, Associate Professor,Radiology, Harvard Medical School, Cambridge, MA
Charles M. Strother, MDProfessor of Radiology, Emeritus, University of
Wisconsin, Madison, WI
Jody Tanabe, MDProfessor of Radiology and Psychiatry,
Chief of Neuroradiology,University of Colorado, Denver, CO
STATISTICAL SENIOR EDITOR
Bryan A. Comstock, MSSenior Biostatistician,
Department of Biostatistics,University of Washington, Seattle, WA
EDITORIAL BOARDAshley H. Aiken, Atlanta, GALea M. Alhilali, Phoenix, AZJohn D. Barr, Dallas, TXAri Blitz, Baltimore, MDBarton F. Branstetter IV, Pittsburgh, PAJonathan L. Brisman, Lake Success, NYJulie Bykowski, San Diego, CAKeith Cauley, Danville, PAAsim F. Choudhri, Memphis, TNAlessandro Cianfoni, Lugano, SwitzerlandJ. Matthew Debnam, Houston, TXSeena Dehkharghani, New York, NYColin Derdeyn, Iowa City, IARahul S. Desikan, San Francisco, CAYonghong Ding, Rochester, MNClifford J. Eskey, Hanover, NHSaeed Fakhran, Phoenix, AZMassimo Filippi, Milan, ItalyAllan J. Fox, Toronto, Ontario, CanadaWende N. Gibbs, Los Angeles, CAChristine M. Glastonbury, San Francisco, CAJohn L. Go, Los Angeles, CAAllison Grayev, Madison, WIBrent Griffith, Detroit, MIWan-Yuo Guo, Taipei, TaiwanAjay Gupta, New York, NYRakesh K. Gupta, Lucknow, IndiaLotfi Hacein-Bey, Sacramento, CAChristopher P. Hess, San Francisco, CAAndrei Holodny, New York, NYBenjamin Huang, Chapel Hill, NCGeorge J. Hunter, Boston, MAMahesh V. Jayaraman, Providence, RIValerie Jewells, Chapel Hill, NCChristof Karmonik, Houston, TXTimothy J. Kaufmann, Rochester, MNHillary R. Kelly, Boston, MAToshibumi Kinoshita, Akita, JapanKennith F. Layton, Dallas, TXMichael M. Lell, Nurnberg, GermanyMichael Lev, Boston, MAKarl-Olof Lovblad, Geneva, SwitzerlandFranklin A. Marden, Chicago, ILM. Gisele Matheus, Charleston, SCJoseph C. McGowan, Merion Station, PAStephan Meckel, Freiburg, GermanyChristopher J. Moran, St. Louis, MOTakahisa Mori, Kamakura City, JapanSuresh Mukherji, Ann Arbor, MIAmanda Murphy, Toronto, Ontario, CanadaAlexander J. Nemeth, Chicago, ILSasan Partovi, Cleveland, OHLaurent Pierot, Reims, FranceJay J. Pillai, Baltimore, MDWhitney B. Pope, Los Angeles, CA
Andrea Poretti, Baltimore, MDM. Judith Donovan Post, Miami, FLTina Young Poussaint, Boston, MAJoana Ramalho, Lisbon, PortugalOtto Rapalino, Boston, MAAlex Rovira-Canellas, Barcelona, SpainPaul M. Ruggieri, Cleveland, OHZoran Rumboldt, Rijeka, CroatiaAmit M. Saindane, Atlanta, GAErin Simon Schwartz, Philadelphia, PALubdha M. Shah, Salt Lake City, UTAseem Sharma, St. Louis, MOJ. Keith Smith, Chapel Hill, NCMaria Vittoria Spampinato, Charleston, SCGordon K. Sze, New Haven, CTKrishnamoorthy Thamburaj, Hershey, PACheng Hong Toh, Taipei, TaiwanThomas A. Tomsick, Cincinnati, OHAquilla S. Turk, Charleston, SCWillem Jan van Rooij, Tilburg, NetherlandsArastoo Vossough, Philadelphia, PAElysa Widjaja, Toronto, Ontario, CanadaMax Wintermark, Stanford, CARonald L. Wolf, Philadelphia, PAKei Yamada, Kyoto, JapanCarlos Zamora, Chapel Hill, NC
EDITORIAL FELLOWDaniel S. Chow, San Francisco, CA
SPECIAL CONSULTANTS TO THE EDITORAJNR Blog EditorNeil Lall, Denver, COCase of the Month EditorNicholas Stence, Aurora, COCase of the Week EditorsJuan Pablo Cruz, Santiago, ChileSapna Rawal, Toronto, Ontario, CanadaClassic Case EditorSandy Cheng-Yu Chen, Taipei, TaiwanFacebook EditorPeter Yi Shen, Sacramento, CAHealth Care and Socioeconomics EditorPina C. Sanelli, New York, NYPhysics EditorGreg Zaharchuk, Stanford, CAPodcast EditorYvonne Lui, New York, NYTwitter EditorRyan Fitzgerald, Little Rock, AR
YOUNG PROFESSIONALSADVISORY COMMITTEEAsim K. Bag, Birmingham, ALAnna E. Nidecker, Sacramento, CAPeter Yi Shen, Sacramento, CA
Founding EditorJuan M. TaverasEditors Emeriti
Mauricio Castillo, Robert I. Grossman,Michael S. Huckman, Robert M. Quencer
Managing EditorKaren HalmAssistant Managing EditorLaura WilhelmExecutive Director, ASNRJames B. GantenbergDirector of Communications, ASNRAngelo Artemakis
PERSPECTIVES
Title: Ying and Yang, Death Valley National Park, California. Death Valley is a place of incredible diversity in landscapes. The Mesquite Flat Sand Dunes represent an endlessopportunity in capturing the ephemeral interplay of light and patterns.
Sugoto Mukherjee, Associate Professor, Division of Neuroradiology, Department of Radiology and Medical Imaging, University of Virginia Health System, Charlottesville,Virginia
AJNR Am J Neuroradiol 37:1763 Oct 2016 www.ajnr.org 1763
EDITORIAL
Neuroimaging Findings in CongenitalZika SyndromeX A. Poretti and X T.A.G.M. Huisman
Since the early 2015 outbreak of the Zika virus, an arbovirus
originally identified in Africa and Asia-Pacific and transmit-
ted by Aedes aegypti mosquitoes, the virus has spread rapidly from
Pernambuco State throughout Brazil and the Americas. In Brazil,
more than 30,000 clinical cases have been reported so far.1 While
the total number of infected individuals is unknown, it is expected
to reach more than 1 million in the next year.2 In addition, the
virus has been disseminated outside Brazil, and cases of Zika virus
infection have been reported in 25 countries in the Americas,
Africa, and Asia. The outbreak of Zika virus infection in Brazil was
associated with an increase in congenital microcephaly by a factor
of 20.2 The suspected causal relationship between prenatal Zika
virus infection and microcephaly has now been confirmed.3 This
confirmation was evidenced by several observations, including
the following: 1) Zika virus infection during prenatal develop-
ment at times that were consistent with the defects observed; 2) a
specific, rare phenotype involving microcephaly and associated
brain anomalies in fetuses or infants with presumed or confirmed
congenital Zika virus infection, and 3) data that strongly support
the biologic plausibility, including the identification of Zika virus
in the brain tissue of affected fetuses and infants.3-5 In addition,
Zika virus infection has been associated with approximately 50
cases of Guillain-Barre syndrome,2 suggesting that the disease is
less benign than initially thought, making Zika a “public health
emergency of international concern.” In 2016, more than 700
scientific articles have been published on the Zika virus. Rarely
before have scientists tackled a new research topic with such a
sense of urgency. Finally, the major global impact of Zika virus has
been shown by various discussions about the need to delay or
relocate the 2016 Rio de Janeiro Olympic Games because of public
health concerns over the risk of Zika virus infection for the Olym-
pic community.
For neuroradiologists, a detailed knowledge of the potential
neuroimaging findings in children with congenital Zika syn-
drome is needed to accurately make the diagnosis. Head CT stud-
ies have revealed intracranial calcifications in most patients with
microcephaly.6-8 Calcifications are typically located at the corti-
comedullary junction and involve mostly the frontal and parietal
lobes. In about half of patients, calcifications may be seen in the
basal ganglia and/or thalami, while calcifications within the
periventricular white matter are less common. Calcifications
within the cerebellum, brain stem, and spinal cord have been
reported in only a few patients.6,7 The calcifications are typically
punctuate, but in some patients, they may be linear or bandlike
(particularly at the corticomedullary junction) or coarse (espe-
cially within the basal ganglia and thalami). In addition, head CT
studies showed cortical hypogyration in all patients.6-8 Cortical
hypogyration is typically severe (with only the Sylvian fissure ob-
viously present) and can be better delineated with MR imaging. In
children who underwent MR imaging, the main cortical abnor-
mality included a simplified gyral pattern (normal cortical thick-
ness) associated with areas of polymicrogyria or pachygyria (thick
cortex) predominantly located in the frontal lobes.6 In a few chil-
dren, hemimegalencephaly and periventricular heterotopia have
been reported.6 Ventriculomegaly is an additional consistent
finding seen on head CT and brain MR imaging studies.6-8 Ven-
triculomegaly is usually moderate or severe, may involve the
whole ventricular system or only the lateral ventricles with pre-
dominant enlargement of the trigones and posterior horns, and is
most likely secondary to the thin cortical mantle and decreased
white matter volume. An enlargement of the subarachnoid spaces
is seen in most patients.6,8 On head CT, diffusely abnormal hy-
podensity of the white matter is seen in most infants.7 MR imag-
ing studies revealed that the white matter hypodensity seen on CT
represents, most likely, areas of dysmyelination or delayed myeli-
nation with secondary thinning of the corpus callosum.6,8 Poste-
rior fossa involvement may include global or unilateral cerebellar
hypoplasia, brain stem hypoplasia, and mega-cisterna magna in
some patients.6-8 Finally, enlargement of the choroid plexus and
intraventricular septations have also been reported in select pa-
tients.8 Most of these findings (particularly intracranial calcifica-
tions and ventriculomegaly) may be detected prenatally by fetal
sonography from 19 weeks of gestation.4,9,10 Fetal MR imaging
may provide additional information about cortical abnormalities
and posterior fossa involvement.10
Abnormal cortical development and global cerebellar hyp-
oplasia suggest an underlying disruptive pathomechanism caused
by congenital Zika virus infection. Recently, experimental studies
have shed more light on the neuropathogenesis of the congenital
Zika virus syndrome and support a disruptive pathogenesis. In
experimental models, Zika virus was shown to target human brain
cells, reducing their viability and growth.11-13 These results sug-
gest that Zika virus abrogates neurogenesis during human brain
development. In addition, Zika virus infection causes a down-
regulation of genes involved in cell cycle pathways, dysregulation
of cell proliferation, and upregulation of genes involved in apo-
ptotic pathways, resulting in cell death.12
In congenital Zika syndrome, the skull is also affected and has
a pointed occiput with overriding bones mainly in the frontal and
occipital regions.8,14 The skull deformity seems to be secondary to
the extensive brain abnormalities, but a primary involvement of
the skull bones is not excluded. Ongoing studies should solve this
hypothesis.
Many questions about Zika virus infection and congenital
Zika syndrome need to be answered. For some of these open ques-
tions (eg, the most susceptible period of the fetus to the Zika virus
infection, the risk and incidence of fetal microcephaly when the
mother is infected with Zika virus, and the risk of developing
motor and intellectual disabilities from brain abnormalities due
to Zika virus infection), neuroimaging may be of great help in
providing the answers and in better understanding the congenital
Zika syndrome.http://dx.doi.org/10.3174/ajnr.A4924
1764 Editorial Oct 2016 www.ajnr.org
REFERENCES1. Faria NR, Azevedo Rdo S, Kraemer MU, et al. Zika virus in the
Americas: early epidemiological and genetic findings. Science 2016;352:345– 49 CrossRef Medline
2. Araujo AQ, Silva MT, Araujo AP. Zika virus-associated neurologicaldisorders: a review. Brain 2016 Jun 29. [Epub ahead of print]Medline
3. Rasmussen SA, Jamieson DJ, Honein MA, et al. Zika virus and birthdefects: reviewing the evidence for causality. N Engl J Med 2016;374:1981– 87 CrossRef Medline
4. Mlakar J, Korva M, Tul N, et al. Zika virus associated with micro-cephaly. N Engl J Med 2016;374:951–58 CrossRef Medline
5. Calvet G, Aguiar RS, Melo AS, et al. Detection and sequencing ofZika virus from amniotic fluid of fetuses with microcephaly inBrazil: a case study. Lancet Infect Dis 2016;16:653– 60 CrossRefMedline
6. de Fatima Vasco Aragao M, van der Linden V, Brainer-Lima AM, et al.Clinical features and neuroimaging (CT and MRI) findings in pre-sumed Zika virus related congenital infection and microcephaly:retrospective case series study. BMJ 2016;353:i1901 CrossRefMedline
7. Hazin AN, Poretti A, Turchi Martelli CM, et al. Computed tomo-graphic findings in microcephaly associated with Zika virus. N EnglJ Med 2016;374:2193–95 CrossRef Medline
8. Cavalheiro S, Lopez A, Serra S, et al. Microcephaly and Zika virus:neonatal neuroradiological aspects. Childs Nerv Syst 2016;32:1057– 60 CrossRef Medline
9. Oliveira Melo AS, Malinger G, Ximenes R, et al. Zika virus intrauter-ine infection causes fetal brain abnormality and microcephaly: tipof the iceberg? Ultrasound Obstet Gynecol 2016;47:6 –7 CrossRefMedline
10. Driggers RW, Ho CY, Korhonen EM, et al. Zika virus infection withprolonged maternal viremia and fetal brain abnormalities. N Engl
J Med 2016;374:2142–51 CrossRef Medline
11. Garcez PP, Loiola EC, Madeiro da Costa R, et al. Zika virus impairsgrowth in human neurospheres and brain organoids. Science 2016;
352:816 –18 CrossRef Medline
12. Tang H, Hammack C, Ogden SC, et al. Zika virus infects humancortical neural progenitors and attenuates their growth. Cell Stem
Cell 2016;18:587–90 CrossRef Medline
13. Qian X, Nguyen HN, Song MM, et al. Brain-region-specific or-ganoids using mini-bioreactors for modeling ZIKV exposure. Cell
2016;165:1238 –54 CrossRef Medline14. Dain Gandelman Horovitz D, da Silva Pone MV, Moura Pone S,
et al. Cranial bone collapse in microcephalic infants prenatallyexposed to Zika virus infection. Neurology 2016;87:118 –19CrossRef Medline
AJNR Am J Neuroradiol 37:1764 – 65 Oct 2016 www.ajnr.org 1765
REVIEW ARTICLE
Brain Perfusion Imaging in Neonates: An OverviewX M. Proisy, X S. Mitra, X C. Uria-Avellana, X M. Sokolska, X N.J. Robertson, X F. Le Jeune, and X J.-C. Ferre
ABSTRACTSUMMARY: The development of cognitive function in children has been related to a regional metabolic increase and an increase inregional brain perfusion. Moreover, brain perfusion plays an important role in the pathogenesis of brain damage in high-risk neonates, bothpreterm and full-term asphyxiated infants. In this article, we will review and discuss several existing imaging techniques for assessingneonatal brain perfusion.
ABBREVIATIONS: ASL � arterial spin-labeling; HIE � hypoxic-ischemic encephalopathy; NIRS � near-infrared spectroscopy
Brain perfusion can be assessed by a number of imaging tech-
niques that have been developed in recent decades. These in-
clude PET, SPECT, perfusion CT, diffuse optical spectroscopy,
DSC–MR imaging, arterial spin-labeling (ASL), and sonography.
The physiology of perfusion can be characterized by many param-
eters such as CBF (whole-brain or regional CBF to �1 anatomic
region), CBV, and MTT. Some of these parameters may be ob-
tained depending on the perfusion technique and type of tracer
used.1 The results of brain perfusion imaging techniques are usu-
ally expressed as CBF. Most of these techniques rely on the use of
endogenous or exogenous tracers and involve different technical
requirements and mathematic models.2-4 Wintermark et al5 pub-
lished a literature review of brain perfusion imaging techniques in
adults and addressed the feasibility of applying the techniques to
children. However, in view of the features of neonatal physiology
and pathology, the advantages and disadvantages may differ be-
tween adults and children. For example, bedside techniques are an
advantage for high-risk neonates. Noninvasive and nonradiating
methods that have been recently developed owing to advances in
medical imaging techniques are highly suitable for neonates.6,7
However, given the smaller head size and lower physiologic brain
perfusion compared with older children and adults, noninvasive
MR perfusion imaging is still challenging.
Neonatal encephalopathy secondary to hypoxic-ischemic in-
jury around birth is an important problem worldwide. Diagnosis
is based on clinical, electroencephalographic, and MR imaging
findings. Hypoxic-ischemic encephalopathy (HIE) is a major
cause of perinatal mortality and morbidity.8 For a few years, in-
duced hypothermia has been used as neuroprotective treatment
for neonatal HIE, reducing the extent of neurologic damage and
improving outcome.9,10 However, a considerable number of in-
fants still have an abnormal outcome. Several preclinical research
studies are also being conducted on drugs that may act synergis-
tically or additively with hypothermia.11,12 Transfontanellar ul-
trasound and MR imaging provide invaluable information about
neonates with HIE for determining positive findings and differ-
ential diagnoses, predicting neuromotor outcome, and helping to
counsel parents about long-term outcome.13 Moreover, MRI is an
effective biomarker for treatment response.14 In addition to con-
ventional MR imaging scoring,15 some quantitative biomarkers
could provide more objective information, such as DWI with
regional ADC measurements,16 1H-MR spectroscopy, and 31P-
MR spectroscopy.17
Brain perfusion plays an important role in the pathogenesis of
brain damage in high-risk neonates, both preterm and full-term
asphyxiated neonates.18,19 Hypoxic-ischemic injury leads to re-
duced blood flow to the brain followed by restoration of blood
flow and the initiation of a cascade of pathways. The neurotoxic
biochemical cascade of lesions after reperfusion, known as “rep-
erfusion injury,” is the primary target for neuroprotective inter-
From the Department of Radiology (M.P., J.-C.F.), Rennes University Hospital,France; Department of Neonatology (M.P., S.M., C.U.-A., N.J.R.), University CollegeLondon Hospital, Institute for Women’s Health, University College of London,London, UK; Inserm VisAGeS Unit U746 (M.P., J.-C.F.), Inria, Rennes 1 University,Rennes, France; Institute of Neurology (M.S.), University College of London, Lon-don, UK; and Department of Nuclear Medicine (F.L.J.), Centre Eugene Marquis,Rennes, France.
This work was performed with the support of the Societe Francaise de Radiologie(2012 Research Grant).
Please address correspondence to Maïa Proisy, MD, Department of Radiology,Pediatric Imaging, Rennes University Hospital, 16 Boulevard de Bulgarie, BP 90347,35203 Rennes Cedex 2, France; e-mail: [email protected]
Indicates open access to non-subscribers at www.ajnr.org
Indicates article with supplemental on-line table.
http://dx.doi.org/10.3174/ajnr.A4778
1766 Proisy Oct 2016 www.ajnr.org
ventions.10,12 In preterm infants, white matter injury is a major
cause of cerebral palsy, which is also assumed to be mainly due to
a lack of blood flow and oxygen delivery.20
It is critical to understand the development of early changes in
the injured neonatal brain. A better understanding of the pattern
of perfusion and the relationship with other therapeutic and out-
come biomarkers would serve as a decision aid to improve sup-
port for high-risk neonates.
In this article, we will review and discuss several existing im-
aging techniques for assessing neonatal brain perfusion (On-line
Table).
Practical Aspects of Data Acquisition in NeonatesThere is no consensus regarding the practical aspects of data ac-
quisition, and each institution may have its own practice. Often,
infants younger than 3 months of age are imaged without sedation
unless they are receiving sedative medication for clinical indica-
tions. We use the “feed and bundle” method to perform nonse-
dated neonatal MR imaging. Ventilated infants in the intensive
care unit are usually sedated with morphine. Moreover, depend-
ing on the clinical condition, additional drugs may be given, an-
tiepileptic drugs or vasopressors. In infants older than 3–5
months of age, sedation may be required. Sedation status remains
an important consideration in pediatric imaging. Indeed, seda-
tion may have an impact on cerebral perfusion. There are few data
in the literature about how sedation or general anesthesia may
alter perfusion.21,22
Without sedation, a rigid head stabilization (head lightly
fixed) is required to perform most imaging (MR imaging, PET,
SPECT, CTP). The longer the examination, the longer the im-
mobilization is required. Near-infrared spectroscopy (NIRS)
does not require rigid head stabilization because the optical
fibers are embedded in a “cap” attached to the infant’s head.
Brain Perfusion Measurements by Using Nuclear MedicineMethodsNuclear medicine methods were the first ones used to assess
CBF in adults and neonates.23,24 Correlation with structural
information (CT or MR imaging) is highly desirable for accu-
rate interpretation.
Positron-Emission Tomography. The PET technique measures
radiopharmaceuticals labeled with positron emitters using a PET
scanner. PET is used to assess regional CBF by using injected H2O
or inhaled CO2 labeled with the isotope oxygen 15 (15O). PET
with 15O water provides an accurate and reproducible quantita-
tive measurement of CBF and is considered the criterion standard
method. However, 15O-PET uses ionizing radiation, and the tech-
nique is not widely available (there is a need for close proximity to
a cyclotron) because the tracer has an extremely short half-life.
Moreover, PET is not available at the bedside or for emergencies.
Data processing to obtain maps is automatically generated by the
workstation; then the results can be visually interpreted on a com-
puter screen. The underlying mathematic model for data postpro-
cessing is the Kety-Schmidt model.5
In 1983, Volpe et al23 conducted the first study demonstrating
the use of PET for determining regional CBF in neonates. Altman
et al25 measured mean CBF in 16 preterm infants (CBF � 4.9 –23
mL/100 g/min) and 14 term infants (CBF � 9.0 –73 mL/100
g/min). Volpe et al18 studied regional CBF in 17 asphyxiated term
infants during the acute stage of their illness and showed a sym-
metric decrease in CBF to the parasagittal regions, more marked
posteriorly than anteriorly. Those findings explain the ischemic
lesions related to impaired cerebral perfusion in the watershed
regions.
PET by using 18F-fluorodeoxyglucose evaluates the regional
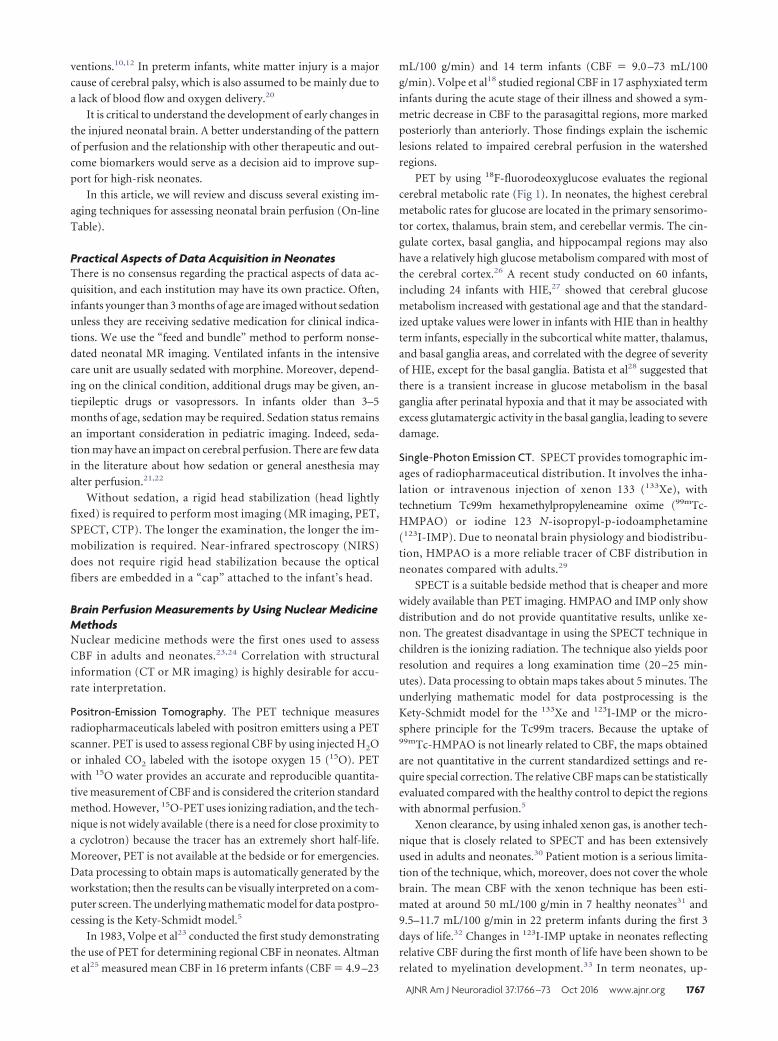
cerebral metabolic rate (Fig 1). In neonates, the highest cerebral
metabolic rates for glucose are located in the primary sensorimo-
tor cortex, thalamus, brain stem, and cerebellar vermis. The cin-
gulate cortex, basal ganglia, and hippocampal regions may also
have a relatively high glucose metabolism compared with most of
the cerebral cortex.26 A recent study conducted on 60 infants,
including 24 infants with HIE,27 showed that cerebral glucose
metabolism increased with gestational age and that the standard-
ized uptake values were lower in infants with HIE than in healthy
term infants, especially in the subcortical white matter, thalamus,
and basal ganglia areas, and correlated with the degree of severity
of HIE, except for the basal ganglia. Batista et al28 suggested that
there is a transient increase in glucose metabolism in the basal
ganglia after perinatal hypoxia and that it may be associated with
excess glutamatergic activity in the basal ganglia, leading to severe
damage.
Single-Photon Emission CT. SPECT provides tomographic im-
ages of radiopharmaceutical distribution. It involves the inha-
lation or intravenous injection of xenon 133 (133Xe), with
technetium Tc99m hexamethylpropyleneamine oxime (99mTc-
HMPAO) or iodine 123 N-isopropyl-p-iodoamphetamine
(123I-IMP). Due to neonatal brain physiology and biodistribu-
tion, HMPAO is a more reliable tracer of CBF distribution in
neonates compared with adults.29
SPECT is a suitable bedside method that is cheaper and more
widely available than PET imaging. HMPAO and IMP only show
distribution and do not provide quantitative results, unlike xe-
non. The greatest disadvantage in using the SPECT technique in
children is the ionizing radiation. The technique also yields poor
resolution and requires a long examination time (20 –25 min-
utes). Data processing to obtain maps takes about 5 minutes. The
underlying mathematic model for data postprocessing is the
Kety-Schmidt model for the 133Xe and 123I-IMP or the micro-
sphere principle for the Tc99m tracers. Because the uptake of99mTc-HMPAO is not linearly related to CBF, the maps obtained
are not quantitative in the current standardized settings and re-
quire special correction. The relative CBF maps can be statistically
evaluated compared with the healthy control to depict the regions
with abnormal perfusion.5
Xenon clearance, by using inhaled xenon gas, is another tech-
nique that is closely related to SPECT and has been extensively
used in adults and neonates.30 Patient motion is a serious limita-
tion of the technique, which, moreover, does not cover the whole
brain. The mean CBF with the xenon technique has been esti-
mated at around 50 mL/100 g/min in 7 healthy neonates31 and
9.5–11.7 mL/100 g/min in 22 preterm infants during the first 3
days of life.32 Changes in 123I-IMP uptake in neonates reflecting
relative CBF during the first month of life have been shown to be
related to myelination development.33 In term neonates, up-
AJNR Am J Neuroradiol 37:1766 –73 Oct 2016 www.ajnr.org 1767
take was predominantly located in the thalami, brain stem, and
central cerebellum, with relatively less cortical activity, except
in the perirolandic cortex. Moreover, Pryds and Greisen32
showed that an intraindividual variation in CBF was positively
related to changes in partial pressure of carbon dioxide in ar-
terial blood and inversely related to changes in hemoglobin
concentration.
Brain Perfusion Measurements by Using Perfusion CTPerfusion CT has been widely used in adults and can be per-
formed easily and rapidly. This technique provides a reliable
quantitative estimation of CBF, CBV, and MTT by using a
first-pass tracer methodology after intravenous injection of a
bolus of iodinated contrast material. It involves very rapid data
acquisition that is feasible in emergency situations.34,35 How-
ever, due to its invasive nature and radiation dose, very few
studies have included neonates. Data processing requires per-
fusion CT software using either rate-of-upslope estimation of
CBF or deconvolution analysis.5 Images of CBF, CBV, and
MTT maps are interpreted on a workstation with visual assess-
ment and quantitative analysis with ROIs. Wintermark et al36
assessed age-related variations in quantitative brain perfusion
CT in children from 7 days to 18 years of age without brain
abnormality, including 10 patients younger than 12 months
of age. The rCBF findings were consistent with other tech-
niques and showed age-specific variations with a peak at 2– 4
years of age. The variation in CBF estimates was due to more
pronounced age-related changes in MTT than in CBV.
Brain Perfusion Measurements by UsingNear-Infrared SpectroscopyNear-infrared spectroscopy, described first by Jobsis in 1977,37
can be used as a continuous noninvasive real-time monitoring
tool for assessment of cerebral oxygenation and hemodynamics.
The principles of NIRS are based on the relative transparency of
biologic tissues to light in the near-infrared spectrum (700 –1000
nm) and different absorption of light by different chromophores
in this spectrum (eg, hemoglobin and cytochrome C oxidase).
NIRS measures the concentration changes of oxy- and deoxyhe-
moglobin, which can be used to derive changes in total hemoglo-
bin (an indicator of cerebral blood volume) and hemoglobin
difference (indicates cerebral oxygenation).38 Using spatially
resolved spectroscopy, NIRS measures regional oxygenation sat-
uration and reflects the balance of tissue oxygen supply and de-
mand. In comparison with other techniques, application of NIRS
is relatively easier. Improved NIRS probes are now available in
different sizes to cover premature infants to term neonates. Al-
though NIRS monitors have been used in adult neurointensive
care units and theaters for some time now, the introduction of
these monitors into neonatal intensive care has been slow. In re-
cent years, several NICUs have started using this as part of the
routine decision-making process, particularly for the preterm
population.
Edwards et al39 first described the measurement of cerebral
blood flow, and Meek et al40 showed that low CBF on the first
day of life is a risk factor for severe intraventricular hemor-
rhage. Diffuse correlation spectroscopy is a newer NIRS tech-
FIG 1. Coronal (A) and axial (B) cerebral 18F-FDG PET images of a 9-month-old infant with tuberous sclerosis show multiple hypometabolic areasin the frontal and temporal cortex. Courtesy of Prof. Eric Guedj, CHU Timone, Marseille, France.
1768 Proisy Oct 2016 www.ajnr.org
nique that offers a direct and continuous monitoring of micro-
vascular cerebral blood flow.41 Using hemoglobin difference as
an indicator of CBF, Tsuji el al42 described a high coherence
between CBF and mean arterial blood pressure and a strong
association of the loss of cerebral autoregulation with an in-
creased incidence of severe germinal matrix–intraventricular
hemorrhage or periventricular leukomalacia. The loss of auto-
regulation in the very preterm population was strongly related
to mortality.43
Following perinatal hypoxia-ischemia in term infants, CBF
and CBV were elevated and were associated with low oxygen
extraction and the loss of reactivity to CO2.44 This loss of the
autoregulatory mechanism with loss of cerebrovascular tone
happens during the first 24 hours after the insult before sec-
ondary energy failure ensues. In a recent study, regional oxy-
genation saturation increased and fractional tissue oxygen ex-
traction decreased after 24 hours in 18 neonates with poor
outcome following HIE.45 High tissue oxygenation values were
noted on day 1 following perinatal hypoxia and were signifi-
cantly higher in the group with abnormal 1-year outcome.46
These findings were further supported by a combined NIRS-
ASL study47: a strong correlation was noted between NIRS-
measured regional cerebral oxygen saturation and CBF mea-
sured by ASL in infants with severe encephalopathy. Specific
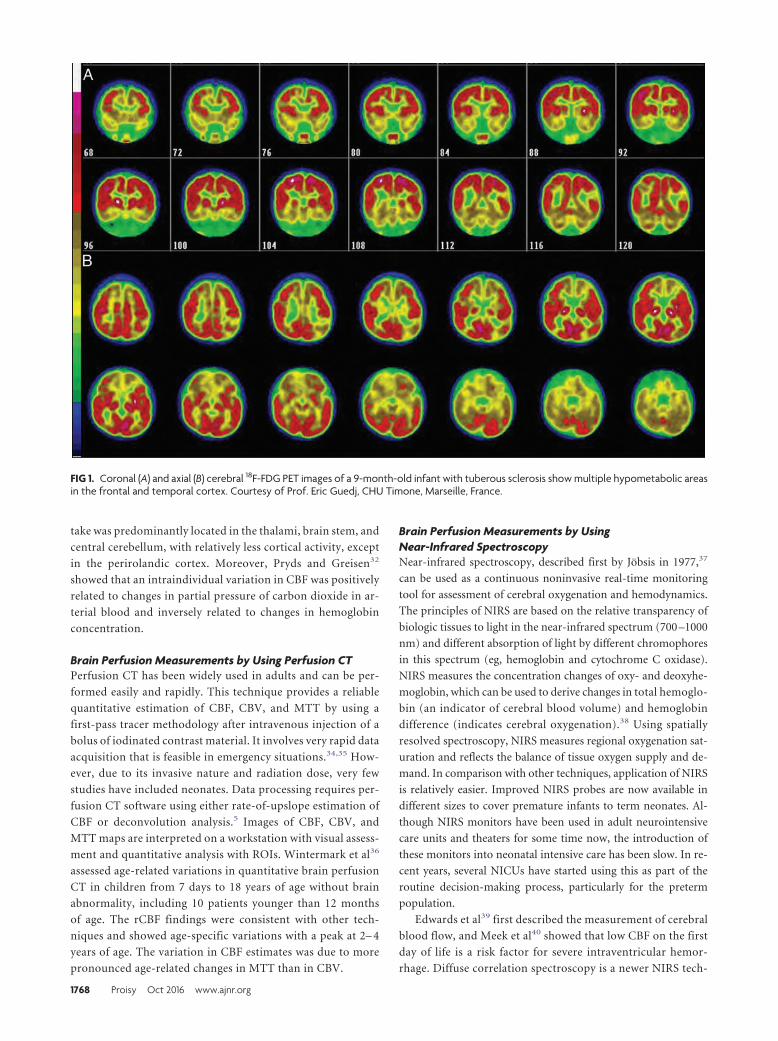
changes in cortical hemodynamics and oxygenation were de-
scribed in previous NIRS studies during and after neonatal
seizures (Fig 2).48
Brain Perfusion MeasurementsUsing SonographyKehrer et al49,50 have shown the feasi-
bility of measuring CBF volume with
Doppler sonography of the extracranial
cerebral arteries in infants. Another way
to assess overall CBF is to measure the
total blood flow to the brain (sum of
blood flow in the internal carotid arter-
ies and basilar artery) and to divide it by
the brain volume. Doppler sonography
is noninvasive, lacking radiation expo-
sure, innocuous, and suitable for bed-
side follow-up and has good interob-
server reproducibility.51 However, the
disadvantages include the absence of re-
gional CBF measurements, the use of an
estimated brain weight, the need for the
patient to be motionless for about 20
minutes, and strict compliance with a
standardized study protocol/meticulous
examination to achieve accurate and re-
liable measurements.50 In healthy term
neonates, the velocities in the ICAs and
basilar artery are between 15 and 35
cm/s.52 As shown with other techniques,
the values of CBF volume increased with
postmenstrual age from 33 mL/min at
34 weeks to 85 mL/min at 42 weeks.49
Approximate CBF (mL/100 g/min) was calculated by using an es-
timated brain weight (the equation was based on head circumfer-
ence measurements). CBF also increases from 21 to 23 mL/100
g/min after birth to 46 –53 mL/100 g/min at 6 months of age and
remains stable from 6 to 30 months of age, reflecting rising met-
abolic demand.53
Microbubble ultrasound is a new and reliable cerebral perfu-
sion imaging technique that provides a qualitative estimation of
cerebral perfusion and has been described in healthy adults and
patients with stroke.54 Yet, to our knowledge, no study has been
conducted on neonates, mainly because microbubble ultrasound
is not licensed for use in children.
Brain Perfusion Measurements by Using MR ImagingRegarding practical aspects of MR imaging, one of the main ad-
vantages is that perfusion imaging is a part of the whole examina-
tion. The perfusion sequence could be added at the end of the
morphologic MR imaging, which is usually clinically required.
Dynamic-Susceptibility Contrast MR Imaging. The dynamic-sus-
ceptibility contrast MR imaging technique measures the T2 or
T2* decrease during the first pass of an exogenous endovascular
susceptibility contrast agent. DSC–MR imaging is a nonradiating
procedure, with high SNR and a higher spatial resolution than
PET and SPECT, in addition to offering fast acquisition times.
Regional hemodynamic changes can be assumed and different
parameters such as CBV, TTP, and MTT can be estimated to
calculate CBF. Parameters are calculated in a few minutes
FIG 2. Reconstructed images showing the changes in cerebral blood volume (�HbT) in thedorsal and left and right lateral views during a seizure in a neonate with hypoxic-ischemicencephalopathy. The upper axes show the changes in hemoglobin concentration spatiallyaveraged across the gray matter surface. Seven distinct time points are identified. All data arechanges relative to a baseline, defined as the mean of the period between 60 and 30 secondsbefore the electrographic seizure onset. Reproduced from Singh et al.48
AJNR Am J Neuroradiol 37:1766 –73 Oct 2016 www.ajnr.org 1769
by using commercially available software. However, the maps
provide only relative measurements. Quantification of CBF by
DSC is controversial, mainly due to the nonlinear relationship
between signal intensity and gadolinium concentration.55 Maps
can be interpreted visually or semiquantitatively by calculating
the ratio between the values in an ROI placed in the abnormal area
and an ROI placed in the contralateral area considered a normal
reference. Longitudinal studies involving repeated measurements
during a single scanning session are not possible due to the lack of
reliable absolute quantification. Despite the above-mentioned
advantages, DSC–MR imaging can be difficult to perform in in-
fants due to gadolinium administration. There have been fewer
studies of DSC–MR imaging in children, and particularly neo-
nates, than in adults.56-59 Hand injections are preferred over
power injections in infants, with less reproducibility. Wintermark
et al58 were the first to assess PWI in 5 term neonates with HIE on
early (days 2– 4) and late MR imaging (days 9 –11). On the early
MR imaging, a hyperperfusion pattern was detected in areas of
hypoxic-ischemic brain damage, corresponding to the reperfu-
sion phase. On the late scans, hyperperfusion persisted in the cor-
tical gray matter.
Phase-Contrast MR Imaging. One other noninvasive, accurate,
and reproducible MR imaging method has been reported in a
small number of studies.60,61 The blood flow in the internal ca-
rotid arteries and basilar artery at the base of the skull is measured
by using phase-contrast MR imaging, and the brain volume is
measured by using segmentation of anatomic MR images. Data
processing consists of multiplying the mean velocity across an
ROI (measured by the phase-contrast MR imaging sequence) by
the vessel area. Flow to the brain is computed as the sum of flow in
the 2 internal carotid arteries and the basilar artery. Brain volume
is estimated by using segmentation software by using a dedicated
neonatal brain segmentation algorithm. Mean CBF is computed
by dividing the total flow to the brain by the brain volume.
In the study by Varela et al,60 the results for 21 infants showed
good agreement with literature data, with a rapid increase during
the first year of life, from 25– 60 mL/100 mL of tissue/min. The
mean velocities (over the cardiac cycle, the area of each vessel andall 3 arteries) were �20 cm/s in term neonates and rose to 30 cm/s
at 50 weeks. However, only mean overallCBF can be assessed with this method.
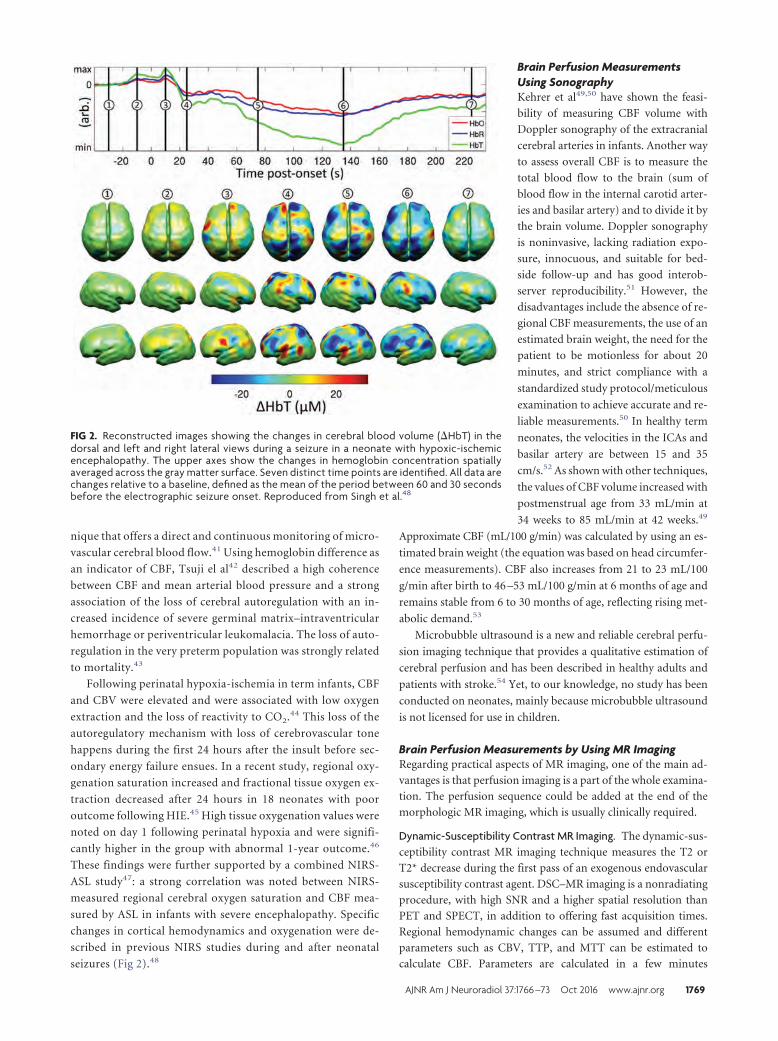
Arterial Spin-Labeling. Brain perfusionimaging by using arterial spin-labeling isa noninvasive technique that uses en-dogenous blood water as a freely diffus-ible tracer. Arterial blood protons aremagnetically labeled with a radiofre-quency inversion pulse applied belowthe imaging section in the neck vessels(Fig 1). Several labeling methods exist,including continuous ASL, pulsed ASL,and pseudocontinuous ASL.62 In con-tinuous ASL, a long flow-induced inver-sion pulse is applied. In pulsed ASL, ashort inversion pulse is applied to a
larger region of the neck. Pseudocon-
tinuous ASL is a hybrid method that uses
a train of short radiofrequency pulses to mimic the effects of con-
tinuous ASL (Fig 3). The best recommended ASL method is the
pseudocontinuous ASL labeling method, mainly because of a
higher SNR and less labeling artifacts.63,64 However, there is a lack
of data in the literature regarding the specific neonatal popula-
tion, and more study is needed.
A labeled image is acquired after a sufficient time to allow
the labeled spins to reach the imaging section, known as the
postlabeling delay. A control image is acquired without label-
ing. Subtraction of the 2 images yields a perfusion-weighted
image. Because the signal difference is only 0.5%–1.5% of the
full signal, multiple repetitions are needed to improve the sig-
nal-to-noise ratio. Subsequently, to obtain a quantitative per-
fusion map, a quantitative model is required to calculate the
relationship between the perfusion-weighted image and CBF.
Certain technical adjustments to the imaging parameters are
required to account for the fundamental differences between the
pediatric and adult populations.65,66 It is challenging to perform
ASL MR imaging in neonates due to the low baseline CBF com-
pared with children and adults, coupled with the low SNR of the
method. As an example, velocities are lower in neonates than in
children, increasing with postmenstrual age,67 and the optimum
postlabeling delay for contrast-to-noise ratio has been correlated
with the mean velocity in the carotid arteries.68
Moreover, in children and neonates, there is a physiologic
improvement in the SNR compared with healthy adults due to
a longer tissue T1, longer blood T1, and the higher blood-brain
partition coefficient of water.65 Blood T1 variations have a
greater effect on perfusion than tissue T1 variations.69 Varela
et al70 established a linear correlation between the inverse of
blood T1 and hematocrit in 12 neonates. This may offer the
possibility of blood T1 estimations from recent hematocrit
measurements.
Measuring CBF in neonates by using ASL therefore requires
several adaptations of acquisition and related parameters
used for quantification. Another point is the lack of standard-
ization of image-processing methods. In clinical practice, CBF
maps are generally automatically generated by the manufac-
FIG 3. Schematic diagram of ASL shows the labeling plane (red box) in the neck and the imagingvolume (green box). A, Acquisition of labeled image after a delay to allow the labeled blood toflow into the brain tissue. B, Acquisition of the control image.
1770 Proisy Oct 2016 www.ajnr.org
turer workstation with assumed or measured quantification
parameters.
A few studies have been conducted in neonates by using ASL.
Miranda et al71 were the first to show the feasibility of pulsed ASL
at 1.5T in 29 unsedated healthy preterm infants at term-equiva-
lent age and in term neonates. Other studies in healthy children
show that ASL appears sensitive to regional and age-related dif-
ferences in CBF in preterm, term neonates, and infants at 3
months72 and from 3 to 5 months of age.73 These results are con-
sistent with previous studies demonstrating regional variation in
brain maturation. Some studies have been conducted in asphyx-
iated neonates, showing early hyperperfusion in brain areas sub-
sequently exhibiting injury,74 and that regions with low ADC in-
tensity are highly correlated with co-located regions of increased
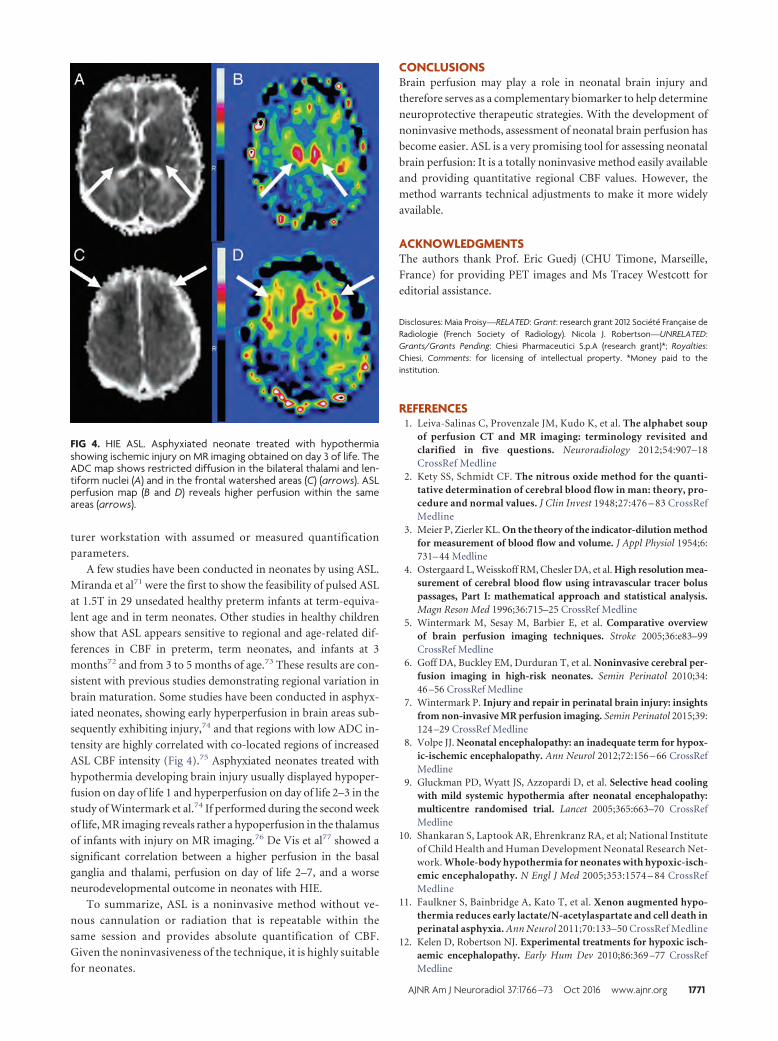
ASL CBF intensity (Fig 4).75 Asphyxiated neonates treated with
hypothermia developing brain injury usually displayed hypoper-
fusion on day of life 1 and hyperperfusion on day of life 2–3 in the
study of Wintermark et al.74 If performed during the second week
of life, MR imaging reveals rather a hypoperfusion in the thalamus
of infants with injury on MR imaging.76 De Vis et al77 showed a
significant correlation between a higher perfusion in the basal
ganglia and thalami, perfusion on day of life 2–7, and a worse
neurodevelopmental outcome in neonates with HIE.
To summarize, ASL is a noninvasive method without ve-
nous cannulation or radiation that is repeatable within the
same session and provides absolute quantification of CBF.
Given the noninvasiveness of the technique, it is highly suitable
for neonates.
CONCLUSIONSBrain perfusion may play a role in neonatal brain injury and
therefore serves as a complementary biomarker to help determine
neuroprotective therapeutic strategies. With the development of
noninvasive methods, assessment of neonatal brain perfusion has
become easier. ASL is a very promising tool for assessing neonatal
brain perfusion: It is a totally noninvasive method easily available
and providing quantitative regional CBF values. However, the
method warrants technical adjustments to make it more widely
available.
ACKNOWLEDGMENTSThe authors thank Prof. Eric Guedj (CHU Timone, Marseille,
France) for providing PET images and Ms Tracey Westcott for
editorial assistance.
Disclosures: Maïa Proisy—RELATED: Grant: research grant 2012 Societe Francaise deRadiologie (French Society of Radiology). Nicola J. Robertson—UNRELATED:Grants/Grants Pending: Chiesi Pharmaceutici S.p.A (research grant)*; Royalties:Chiesi, Comments: for licensing of intellectual property. *Money paid to theinstitution.
REFERENCES1. Leiva-Salinas C, Provenzale JM, Kudo K, et al. The alphabet soup
of perfusion CT and MR imaging: terminology revisited andclarified in five questions. Neuroradiology 2012;54:907–18CrossRef Medline
2. Kety SS, Schmidt CF. The nitrous oxide method for the quanti-tative determination of cerebral blood flow in man: theory, pro-cedure and normal values. J Clin Invest 1948;27:476 – 83 CrossRefMedline
3. Meier P, Zierler KL. On the theory of the indicator-dilution methodfor measurement of blood flow and volume. J Appl Physiol 1954;6:731– 44 Medline
4. Ostergaard L, Weisskoff RM, Chesler DA, et al. High resolution mea-surement of cerebral blood flow using intravascular tracer boluspassages, Part I: mathematical approach and statistical analysis.Magn Reson Med 1996;36:715–25 CrossRef Medline
5. Wintermark M, Sesay M, Barbier E, et al. Comparative overviewof brain perfusion imaging techniques. Stroke 2005;36:e83–99CrossRef Medline
6. Goff DA, Buckley EM, Durduran T, et al. Noninvasive cerebral per-fusion imaging in high-risk neonates. Semin Perinatol 2010;34:46 –56 CrossRef Medline
7. Wintermark P. Injury and repair in perinatal brain injury: insightsfrom non-invasive MR perfusion imaging. Semin Perinatol 2015;39:124 –29 CrossRef Medline
8. Volpe JJ. Neonatal encephalopathy: an inadequate term for hypox-ic-ischemic encephalopathy. Ann Neurol 2012;72:156 – 66 CrossRefMedline
9. Gluckman PD, Wyatt JS, Azzopardi D, et al. Selective head coolingwith mild systemic hypothermia after neonatal encephalopathy:multicentre randomised trial. Lancet 2005;365:663–70 CrossRefMedline
10. Shankaran S, Laptook AR, Ehrenkranz RA, et al; National Instituteof Child Health and Human Development Neonatal Research Net-work. Whole-body hypothermia for neonates with hypoxic-isch-emic encephalopathy. N Engl J Med 2005;353:1574 – 84 CrossRefMedline
11. Faulkner S, Bainbridge A, Kato T, et al. Xenon augmented hypo-thermia reduces early lactate/N-acetylaspartate and cell death inperinatal asphyxia. Ann Neurol 2011;70:133–50 CrossRef Medline
12. Kelen D, Robertson NJ. Experimental treatments for hypoxic isch-aemic encephalopathy. Early Hum Dev 2010;86:369 –77 CrossRefMedline
FIG 4. HIE ASL. Asphyxiated neonate treated with hypothermiashowing ischemic injury on MR imaging obtained on day 3 of life. TheADC map shows restricted diffusion in the bilateral thalami and len-tiform nuclei (A) and in the frontal watershed areas (C) (arrows). ASLperfusion map (B and D) reveals higher perfusion within the sameareas (arrows).
AJNR Am J Neuroradiol 37:1766 –73 Oct 2016 www.ajnr.org 1771
13. Rutherford M, Malamateniou C, McGuinness A, et al. Magnetic res-onance imaging in hypoxic-ischaemic encephalopathy. Early HumDev 2010;86:351– 60 CrossRef Medline
14. Rutherford M, Ramenghi LA, Edwards AD, et al. Assessment ofbrain tissue injury after moderate hypothermia in neonates withhypoxic-ischaemic encephalopathy: a nested substudy of a ran-domised controlled trial. Lancet Neurol 2010;9:39 – 45 CrossRefMedline
15. Barkovich AJ, Hajnal BL, Vigneron D, et al. Prediction of neuromo-tor outcome in perinatal asphyxia: evaluation of MR scoring sys-tems. AJNR Am J Neuroradiol 1998;19:143– 49 Medline
16. Alderliesten T, de Vries LS, Benders MJ, et al. MR imaging and out-come of term neonates with perinatal asphyxia: value of diffusion-weighted MR imaging and 1H MR spectroscopy. Radiology 2011;261:235– 42 CrossRef Medline
17. Cheong JL, Cady EB, Penrice J, et al. Proton MR spectroscopy inneonates with perinatal cerebral hypoxic-ischemic injury: metabo-lite peak-area ratios, relaxation times, and absolute concentrations.AJNR Am J Neuroradiol 2006;27:1546 –54 Medline
18. Volpe JJ, Herscovitch P, Perlman JM, et al. Positron emissiontomography in the asphyxiated term newborn: parasagittal im-pairment of cerebral blood flow. Ann Neurol 1985;17:287–96CrossRef Medline
19. Greisen G. Autoregulation of cerebral blood flow in newborn ba-bies. Early Hum Dev 2005;81:423–28 CrossRef Medline
20. Back SA, Han BH, Luo NL, et al. Selective vulnerability of late oligo-dendrocyte progenitors to hypoxia-ischemia. J Neurosci 2002;22:455– 63 Medline
21. Todd MM, Weeks J. Comparative effects of propofol, pentobarbital,and isoflurane on cerebral blood flow and blood volume. J Neuro-surg Anesthesiol 1996;8:296 –303 CrossRef Medline
22. Harreld JH, Helton KJ, Kaddoum RN, et al. The effects of propofolon cerebral perfusion MRI in children. Neuroradiology 2013;55:1049 –56 CrossRef Medline
23. Volpe JJ, Herscovitch P, Perlman JM, et al. Positron emissiontomography in the newborn: extensive impairment of regionalcerebral blood flow with intraventricular hemorrhage and hem-orrhagic intracerebral involvement. Pediatrics 1983;72:589 – 601Medline
24. Fockele DS, Baumann RJ, Shih WJ, et al. Tc-99m HMPAO SPECT ofthe brain in the neonate. Clin Nucl Med 1990;15:175–77 CrossRefMedline
25. Altman DI, Powers WJ, Perlman JM, et al. Cerebral blood flow re-quirement for brain viability in newborn infants is lower than inadults. Ann Neurol 1988;24:218 –26 CrossRef Medline
26. Chugani HT. A critical period of brain development: studies of ce-rebral glucose utilization with PET. Prev Med 1998;27:184 – 88CrossRef Medline
27. Shi Y, Zhao JN, Liu L, et al. Changes of positron emission tomogra-phy in newborn infants at different gestational ages, and neonatalhypoxic-ischemic encephalopathy. Pediatr Neurol 2012;46:116 –23CrossRef Medline
28. Batista CE, Chugani HT, Juhasz C, et al. Transient hypermetabolismof the basal ganglia following perinatal hypoxia. Pediatr Neurol2007;36:330 –33 CrossRef Medline
29. Børch K, Greisen G. 99mTc-HMPAO as a tracer of cerebral bloodflow in newborn infants. J Cereb Blood Flow Metab 1997;17:448 –54Medline
30. Greisen G. Cerebral blood flow in preterm infants during the firstweek of life. Acta Paediatr Scand 1986;75:43–51 CrossRef Medline
31. Chiron C, Raynaud C, Maziere B, et al. Changes in regional cerebralblood flow during brain maturation in children and adolescents.J Nucl Med 1992;33:696 –703 Medline
32. Pryds O, Greisen G. Effect of PaCO2 and haemoglobin concentra-tion on day to day variation of CBF in preterm neonates. Acta Pae-diatr Scand Suppl 1989;360:33–36 Medline
33. Tokumaru AM, Barkovich AJ, O’uchi T, et al. The evolution of cere-bral blood flow in the developing brain: evaluation with iodine-123
iodoamphetamine SPECT and correlation with MR imaging. AJNRAm J Neuroradiol 1999;20:845–52 Medline
34. Eastwood JD, Lev MH, Provenzale JM. Perfusion CT with iodinatedcontrast material. AJR Am J Roentgenol 2003;180:3–12 CrossRefMedline
35. Wintermark M, Cotting J, Roulet E, et al. Acute brain perfusiondisorders in children assessed by quantitative perfusion computedtomography in the emergency setting. Pediatr Emerg Care 2005;21:149 – 60 Medline
36. Wintermark M, Lepori D, Cotting J, et al. Brain perfusion inchildren: evolution with age assessed by quantitative perfusioncomputed tomography. Pediatrics 2004;113:1642–52 CrossRefMedline
37. Jobsis FF. Noninvasive, infrared monitoring of cerebral and myo-cardial oxygen sufficiency and circulatory parameters. Science 1977;198:1264 – 67 CrossRef Medline
38. Wyatt JS, Cope M, Delpy DT, et al. Quantification of cerebral oxy-genation and haemodynamics in sick newborn infants by near in-frared spectrophotometry. Lancet 1986;2:1063– 66 Medline
39. Edwards AD, Wyatt JS, Richardson C, et al. Cotside measurement ofcerebral blood flow in ill newborn infants by near infrared spec-troscopy. Lancet 1988;2:770 –71 Medline
40. Meek JH, Tyszczuk L, Elwell CE, et al. Low cerebral blood flow is arisk factor for severe intraventricular haemorrhage. Arch Dis ChildFetal Neonatal Ed 1999;81:F15–18 CrossRef Medline
41. Roche-Labarbe N, Carp SA, Surova A, et al. Noninvasive opticalmeasures of CBV, StO(2), CBF index, and rCMRO(2) in human pre-mature neonates’ brains in the first six weeks of life. Hum BrainMapp 2010;31:341–52 CrossRef Medline
42. Tsuji M, Saul JP, du Plessis A, et al. Cerebral intravascular oxygen-ation correlates with mean arterial pressure in critically ill prema-ture infants. Pediatrics 2000;106:625–32 CrossRef Medline
43. Wong FY, Leung TS, Austin T, et al. Impaired autoregulation inpreterm infants identified by using spatially resolved spectroscopy.Pediatrics 2008;121:e604 –11 CrossRef Medline
44. Meek JH, Elwell CE, McCormick DC, et al. Abnormal cerebral hae-modynamics in perinatally asphyxiated neonates related to out-come. Arch Dis Child Fetal Neonatal Ed 1999;81:F110 –15 CrossRefMedline
45. Toet MC, Lemmers PM, van Schelven LJ, et al. Cerebral oxygenationand electrical activity after birth asphyxia: their relation to out-come. Pediatrics 2006;117:333–39 CrossRef Medline
46. Zaramella P, Saraceni E, Freato F, et al. Can tissue oxygenation index(TOI) and cotside neurophysiological variables predict outcome indepressed/asphyxiated newborn infants? Early Hum Dev 2007;83:483– 89 CrossRef Medline
47. Wintermark P, Hansen A, Warfield SK, et al. Near-infrared spectros-copy versus magnetic resonance imaging to study brain perfusionin newborns with hypoxic-ischemic encephalopathy treated withhypothermia. Neuroimage 2014;85:287–93 CrossRef Medline
48. Singh H, Cooper RJ, Wai Lee C, et al. Mapping cortical haemody-namics during neonatal seizures using diffuse optical tomography:a case study. Neuroimage Clin 2014;5:256 – 65 CrossRef Medline
49. Kehrer M, Krageloh-Mann I, Goelz R, et al. The development ofcerebral perfusion in healthy preterm and term neonates. Neurope-diatrics 2003;34:281– 86 CrossRef Medline
50. Kehrer M, Goelz R, Krageloh-Mann I, et al. Measurement of volumeof cerebral blood flow in healthy preterm and term neonates withultrasound. Lancet 2002;360:1749 –50 CrossRef Medline
51. Ehehalt S, Kehrer M, Goelz R, et al. Cerebral blood flow volumemeasurements with ultrasound: interobserver reproducibility inpreterm and term neonates. Ultrasound Med Biol 2005;31:191–96CrossRef Medline
52. Ilves P, Lintrop M, Talvik I, et al. Developmental changes in cerebraland visceral blood flow velocity in healthy neonates and infants. JUltrasound Med 2008;27:199 –207 Medline
53. Kehrer M, Schoning M. A longitudinal study of cerebral blood flow
1772 Proisy Oct 2016 www.ajnr.org
over the first 30 months. Pediatr Res 2009;66:560 – 64 CrossRefMedline
54. Eyding J, Wilkening W, Postert T. Brain perfusion and ultrasonicimaging techniques. Eur J Ultrasound 2002;16:91–104 CrossRefMedline
55. Kiselev VG. On the theoretical basis of perfusion measurements bydynamic susceptibility contrast MRI. Magn Reson Med 2001;46:1113–22 CrossRef Medline
56. Huisman TA, Sorensen AG. Perfusion-weighted magnetic reso-nance imaging of the brain: techniques and application in children.Eur Radiol 2004;14:59 –72 CrossRef Medline
57. Tanner SF, Cornette L, Ramenghi LA, et al. Cerebral perfusion ininfants and neonates: preliminary results obtained using dy-namic susceptibility contrast enhanced magnetic resonance im-aging. Arch Dis Child Fetal Neonatal Ed 2003;88:F525–30 CrossRefMedline
58. Wintermark P, Moessinger AC, Gudinchet F, et al. Perfusion-weighted magnetic resonance imaging patterns of hypoxic-isch-emic encephalopathy in term neonates. J Magn Reson Imaging 2008;28:1019 –25 CrossRef Medline
59. Wintermark P, Moessinger AC, Gudinchet F, et al. Temporal evolu-tion of MR perfusion in neonatal hypoxic-ischemic encephalopa-thy. J Magn Reson Imaging 2008;27:1229 –34 CrossRef Medline
60. Varela M, Groves AM, Arichi T, et al. Mean cerebral blood flowmeasurements using phase contrast MRI in the first year of life.NMR Biomed 2012;25:1063–72 CrossRef Medline
61. Benders MJ, Hendrikse J, De Vries LS, et al. Phase-contrast mag-netic resonance angiography measurements of global cerebralblood flow in the neonate. Pediatr Res 2011;69:544 – 47 CrossRefMedline
62. Ferre JC, Bannier E, Raoult H, et al. Arterial spin labeling (ASL)perfusion: techniques and clinical use. Diagn Interv Imaging 2013;94:1211–23 CrossRef Medline
63. Alsop DC, Detre JA, Golay X, et al. Recommended implementationof arterial spin-labeled perfusion MRI for clinical applications: aconsensus of the ISMRM perfusion study group and the Europeanconsortium for ASL in dementia. Magn Reson Med 2015;73:102–16CrossRef Medline
64. Boudes E, Gilbert G, Leppert IR, et al. Measurement of brain perfu-sion in newborns: pulsed arterial spin labeling (PASL) versus pseu-do-continuous arterial spin labeling (pCASL). Neuroimage Clin2014;6:126 –33 CrossRef Medline
65. Wang J, Licht DJ, Jahng G-H, et al. Pediatric perfusion imaging us-ing pulsed arterial spin labeling. J Magn Reson Imaging 2003;18:404 –13 CrossRef Medline
66. Madan N, Grant PE. MR perfusion imaging in pediatrics. In:Barker PB, Golay X, Zaharchuk G, eds. Clinical Perfusion MRI:Techniques and Applications. Cambridge: Cambridge UniversityPress; 2013:326 – 48
67. Kehrer M, Blumenstock G, Ehehalt S, et al. Development of cerebralblood flow volume in preterm neonates during the first two weeksof life. Pediatr Res 2005;58:927–30 CrossRef Medline
68. Ferre JC, Petr J, Barillot C, et al. Optimal individual inversion time inbrain arterial spin labeling perfusion magnetic resonance imaging:correlation with carotid hemodynamics measured with cine phase-contrast magnetic resonance imaging. J Comput Assist Tomogr 2013;37:247–51 CrossRef Medline
69. Wu WC, St. Lawrence KS, Licht DJ, et al. Quantification issues inarterial spin labeling perfusion magnetic resonance imaging. TopMagn Reson Imaging 2010;21:65–73 CrossRef Medline
70. Varela M, Hajnal JV, Petersen ET, et al. A method for rapid in vivomeasurement of blood T1. NMR Biomed 2011;24:80 – 88 CrossRefMedline
71. Miranda MJ, Olofsson K, Sidaros K. Noninvasive measurements ofregional cerebral perfusion in preterm and term neonates by mag-netic resonance arterial spin labeling. Pediatr Res 2006;60:359 – 63CrossRef Medline
72. De Vis JB, Petersen ET, de Vries LS, et al. Regional changes in brainperfusion during brain maturation measured non-invasively witharterial spin labeling MRI in neonates. Eur J Radiol 2013;82:538 – 43CrossRef Medline
73. Duncan AF, Caprihan A, Montague EQ, et al. Regional cerebralblood flow in children from 3 to 5 months of age. AJNR Am J Neu-roradiol 2014;35:593–98 CrossRef Medline
74. Wintermark P, Hansen A, Gregas MC, et al. Brain perfusion in as-phyxiated newborns treated with therapeutic hypothermia. AJNRAm J Neuroradiol 2011;32:2023–29 CrossRef Medline
75. Pienaar R, Paldino MJ, Madan N, et al. A quantitative method forcorrelating observations of decreased apparent diffusion coeffi-cient with elevated cerebral blood perfusion in newborns pre-senting cerebral ischemic insults. Neuroimage 2012;63:1510 –18CrossRef Medline
76. Massaro AN, Bouyssi-Kobar M, Chang T, et al. Brain perfusion inencephalopathic newborns after therapeutic hypothermia. AJNRAm J Neuroradiol 2013;34:1649 –55 CrossRef Medline
77. De Vis JB, Hendrikse J, Petersen ET, et al. Arterial spin-labellingperfusion MRI and outcome in neonates with hypoxic-ischemicencephalopathy. Eur Radiol 2015;25:113–21 CrossRef Medline
AJNR Am J Neuroradiol 37:1766 –73 Oct 2016 www.ajnr.org 1773
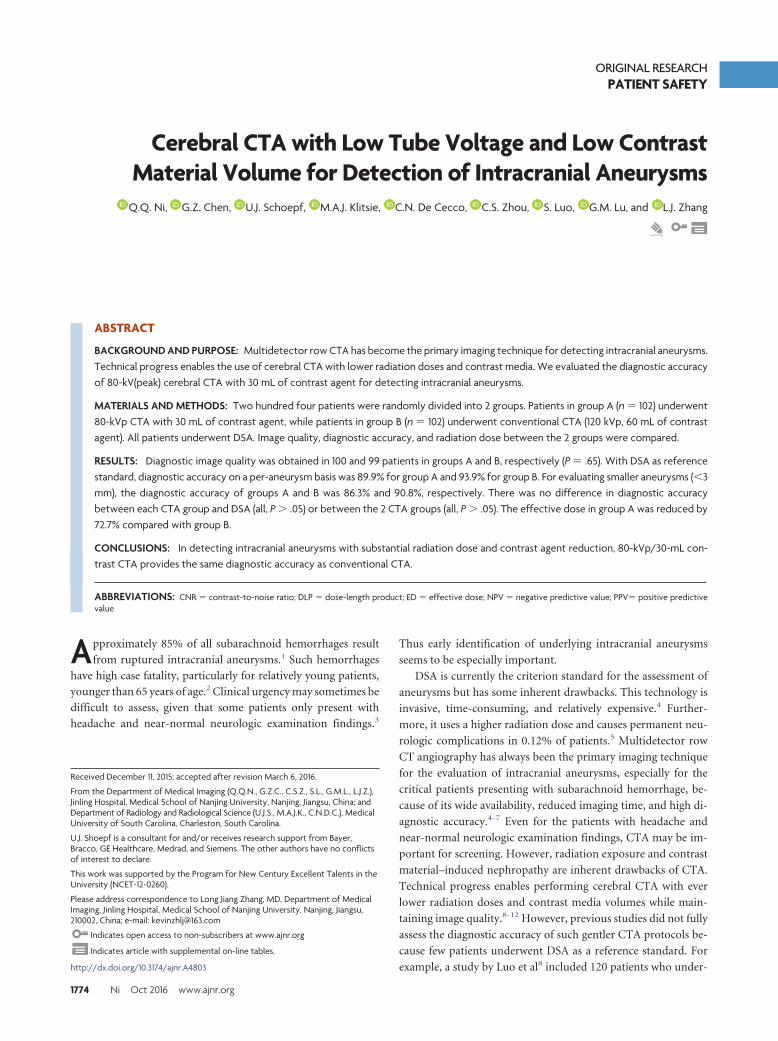
ORIGINAL RESEARCHPATIENT SAFETY
Cerebral CTA with Low Tube Voltage and Low ContrastMaterial Volume for Detection of Intracranial Aneurysms
X Q.Q. Ni, X G.Z. Chen, X U.J. Schoepf, X M.A.J. Klitsie, X C.N. De Cecco, X C.S. Zhou, X S. Luo, X G.M. Lu, and X L.J. Zhang
ABSTRACT
BACKGROUND AND PURPOSE: Multidetector row CTA has become the primary imaging technique for detecting intracranial aneurysms.Technical progress enables the use of cerebral CTA with lower radiation doses and contrast media. We evaluated the diagnostic accuracyof 80-kV(peak) cerebral CTA with 30 mL of contrast agent for detecting intracranial aneurysms.
MATERIALS AND METHODS: Two hundred four patients were randomly divided into 2 groups. Patients in group A (n � 102) underwent80-kVp CTA with 30 mL of contrast agent, while patients in group B (n � 102) underwent conventional CTA (120 kVp, 60 mL of contrastagent). All patients underwent DSA. Image quality, diagnostic accuracy, and radiation dose between the 2 groups were compared.
RESULTS: Diagnostic image quality was obtained in 100 and 99 patients in groups A and B, respectively (P � .65). With DSA as referencestandard, diagnostic accuracy on a per-aneurysm basis was 89.9% for group A and 93.9% for group B. For evaluating smaller aneurysms (�3mm), the diagnostic accuracy of groups A and B was 86.3% and 90.8%, respectively. There was no difference in diagnostic accuracybetween each CTA group and DSA (all, P � .05) or between the 2 CTA groups (all, P � .05). The effective dose in group A was reduced by72.7% compared with group B.
CONCLUSIONS: In detecting intracranial aneurysms with substantial radiation dose and contrast agent reduction, 80-kVp/30-mL con-trast CTA provides the same diagnostic accuracy as conventional CTA.
ABBREVIATIONS: CNR � contrast-to-noise ratio; DLP � dose-length product; ED � effective dose; NPV � negative predictive value; PPV� positive predictivevalue
Approximately 85% of all subarachnoid hemorrhages result
from ruptured intracranial aneurysms.1 Such hemorrhages
have high case fatality, particularly for relatively young patients,
younger than 65 years of age.2 Clinical urgency may sometimes be
difficult to assess, given that some patients only present with
headache and near-normal neurologic examination findings.3
Thus early identification of underlying intracranial aneurysms
seems to be especially important.
DSA is currently the criterion standard for the assessment of
aneurysms but has some inherent drawbacks. This technology is
invasive, time-consuming, and relatively expensive.4 Further-
more, it uses a higher radiation dose and causes permanent neu-
rologic complications in 0.12% of patients.5 Multidetector row
CT angiography has always been the primary imaging technique
for the evaluation of intracranial aneurysms, especially for the
critical patients presenting with subarachnoid hemorrhage, be-
cause of its wide availability, reduced imaging time, and high di-
agnostic accuracy.4-7 Even for the patients with headache and
near-normal neurologic examination findings, CTA may be im-
portant for screening. However, radiation exposure and contrast
material–induced nephropathy are inherent drawbacks of CTA.
Technical progress enables performing cerebral CTA with ever
lower radiation doses and contrast media volumes while main-
taining image quality.8-12 However, previous studies did not fully
assess the diagnostic accuracy of such gentler CTA protocols be-
cause few patients underwent DSA as a reference standard. For
example, a study by Luo et al8 included 120 patients who under-
Received December 11, 2015; accepted after revision March 6, 2016.
From the Department of Medical Imaging (Q.Q.N., G.Z.C., C.S.Z., S.L., G.M.L., L.J.Z.),Jinling Hospital, Medical School of Nanjing University, Nanjing, Jiangsu, China; andDepartment of Radiology and Radiological Science (U.J.S., M.A.J.K., C.N.D.C.), MedicalUniversity of South Carolina, Charleston, South Carolina.
U.J. Shoepf is a consultant for and/or receives research support from Bayer,Bracco, GE Healthcare, Medrad, and Siemens. The other authors have no conflictsof interest to declare.
This work was supported by the Program for New Century Excellent Talents in theUniversity (NCET-12-0260).
Please address correspondence to Long Jiang Zhang, MD, Department of MedicalImaging, Jinling Hospital, Medical School of Nanjing University, Nanjing, Jiangsu,210002, China; e-mail: [email protected]
Indicates open access to non-subscribers at www.ajnr.org
Indicates article with supplemental on-line tables.
http://dx.doi.org/10.3174/ajnr.A4803
1774 Ni Oct 2016 www.ajnr.org
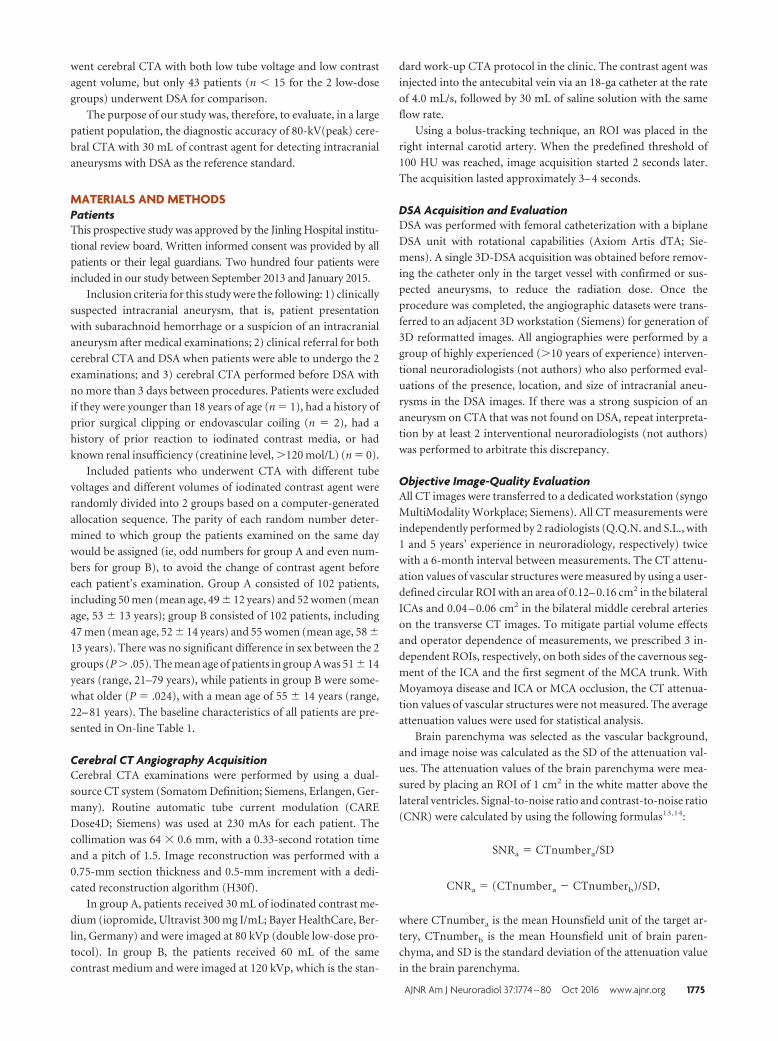
went cerebral CTA with both low tube voltage and low contrast
agent volume, but only 43 patients (n � 15 for the 2 low-dose
groups) underwent DSA for comparison.
The purpose of our study was, therefore, to evaluate, in a large
patient population, the diagnostic accuracy of 80-kV(peak) cere-
bral CTA with 30 mL of contrast agent for detecting intracranial
aneurysms with DSA as the reference standard.
MATERIALS AND METHODSPatientsThis prospective study was approved by the Jinling Hospital institu-
tional review board. Written informed consent was provided by all
patients or their legal guardians. Two hundred four patients were
included in our study between September 2013 and January 2015.
Inclusion criteria for this study were the following: 1) clinically
suspected intracranial aneurysm, that is, patient presentation
with subarachnoid hemorrhage or a suspicion of an intracranial
aneurysm after medical examinations; 2) clinical referral for both
cerebral CTA and DSA when patients were able to undergo the 2
examinations; and 3) cerebral CTA performed before DSA with
no more than 3 days between procedures. Patients were excluded
if they were younger than 18 years of age (n � 1), had a history of
prior surgical clipping or endovascular coiling (n � 2), had a
history of prior reaction to iodinated contrast media, or had
known renal insufficiency (creatinine level, �120 mol/L) (n � 0).
Included patients who underwent CTA with different tube
voltages and different volumes of iodinated contrast agent were
randomly divided into 2 groups based on a computer-generated
allocation sequence. The parity of each random number deter-
mined to which group the patients examined on the same day
would be assigned (ie, odd numbers for group A and even num-
bers for group B), to avoid the change of contrast agent before
each patient’s examination. Group A consisted of 102 patients,
including 50 men (mean age, 49 � 12 years) and 52 women (mean
age, 53 � 13 years); group B consisted of 102 patients, including
47 men (mean age, 52 � 14 years) and 55 women (mean age, 58 �
13 years). There was no significant difference in sex between the 2
groups (P � .05). The mean age of patients in group A was 51 � 14
years (range, 21–79 years), while patients in group B were some-
what older (P � .024), with a mean age of 55 � 14 years (range,
22– 81 years). The baseline characteristics of all patients are pre-
sented in On-line Table 1.
Cerebral CT Angiography AcquisitionCerebral CTA examinations were performed by using a dual-
source CT system (Somatom Definition; Siemens, Erlangen, Ger-
many). Routine automatic tube current modulation (CARE
Dose4D; Siemens) was used at 230 mAs for each patient. The
collimation was 64 � 0.6 mm, with a 0.33-second rotation time
and a pitch of 1.5. Image reconstruction was performed with a
0.75-mm section thickness and 0.5-mm increment with a dedi-
cated reconstruction algorithm (H30f).
In group A, patients received 30 mL of iodinated contrast me-
dium (iopromide, Ultravist 300 mg I/mL; Bayer HealthCare, Ber-
lin, Germany) and were imaged at 80 kVp (double low-dose pro-
tocol). In group B, the patients received 60 mL of the same
contrast medium and were imaged at 120 kVp, which is the stan-
dard work-up CTA protocol in the clinic. The contrast agent was
injected into the antecubital vein via an 18-ga catheter at the rate
of 4.0 mL/s, followed by 30 mL of saline solution with the same
flow rate.
Using a bolus-tracking technique, an ROI was placed in the
right internal carotid artery. When the predefined threshold of
100 HU was reached, image acquisition started 2 seconds later.
The acquisition lasted approximately 3– 4 seconds.
DSA Acquisition and EvaluationDSA was performed with femoral catheterization with a biplane
DSA unit with rotational capabilities (Axiom Artis dTA; Sie-
mens). A single 3D-DSA acquisition was obtained before remov-
ing the catheter only in the target vessel with confirmed or sus-
pected aneurysms, to reduce the radiation dose. Once the
procedure was completed, the angiographic datasets were trans-
ferred to an adjacent 3D workstation (Siemens) for generation of
3D reformatted images. All angiographies were performed by a
group of highly experienced (�10 years of experience) interven-
tional neuroradiologists (not authors) who also performed eval-
uations of the presence, location, and size of intracranial aneu-
rysms in the DSA images. If there was a strong suspicion of an
aneurysm on CTA that was not found on DSA, repeat interpreta-
tion by at least 2 interventional neuroradiologists (not authors)
was performed to arbitrate this discrepancy.
Objective Image-Quality EvaluationAll CT images were transferred to a dedicated workstation (syngo
MultiModality Workplace; Siemens). All CT measurements were
independently performed by 2 radiologists (Q.Q.N. and S.L., with
1 and 5 years’ experience in neuroradiology, respectively) twice
with a 6-month interval between measurements. The CT attenu-
ation values of vascular structures were measured by using a user-
defined circular ROI with an area of 0.12– 0.16 cm2 in the bilateral
ICAs and 0.04 – 0.06 cm2 in the bilateral middle cerebral arteries
on the transverse CT images. To mitigate partial volume effects
and operator dependence of measurements, we prescribed 3 in-
dependent ROIs, respectively, on both sides of the cavernous seg-
ment of the ICA and the first segment of the MCA trunk. With
Moyamoya disease and ICA or MCA occlusion, the CT attenua-
tion values of vascular structures were not measured. The average
attenuation values were used for statistical analysis.
Brain parenchyma was selected as the vascular background,
and image noise was calculated as the SD of the attenuation val-
ues. The attenuation values of the brain parenchyma were mea-
sured by placing an ROI of 1 cm2 in the white matter above the
lateral ventricles. Signal-to-noise ratio and contrast-to-noise ratio
(CNR) were calculated by using the following formulas13,14:
SNRa � CTnumbera/SD
CNRa � (CTnumbera � CTnumberb)/SD,
where CTnumbera is the mean Hounsfield unit of the target ar-
tery, CTnumberb is the mean Hounsfield unit of brain paren-
chyma, and SD is the standard deviation of the attenuation value
in the brain parenchyma.
AJNR Am J Neuroradiol 37:1774 – 80 Oct 2016 www.ajnr.org 1775
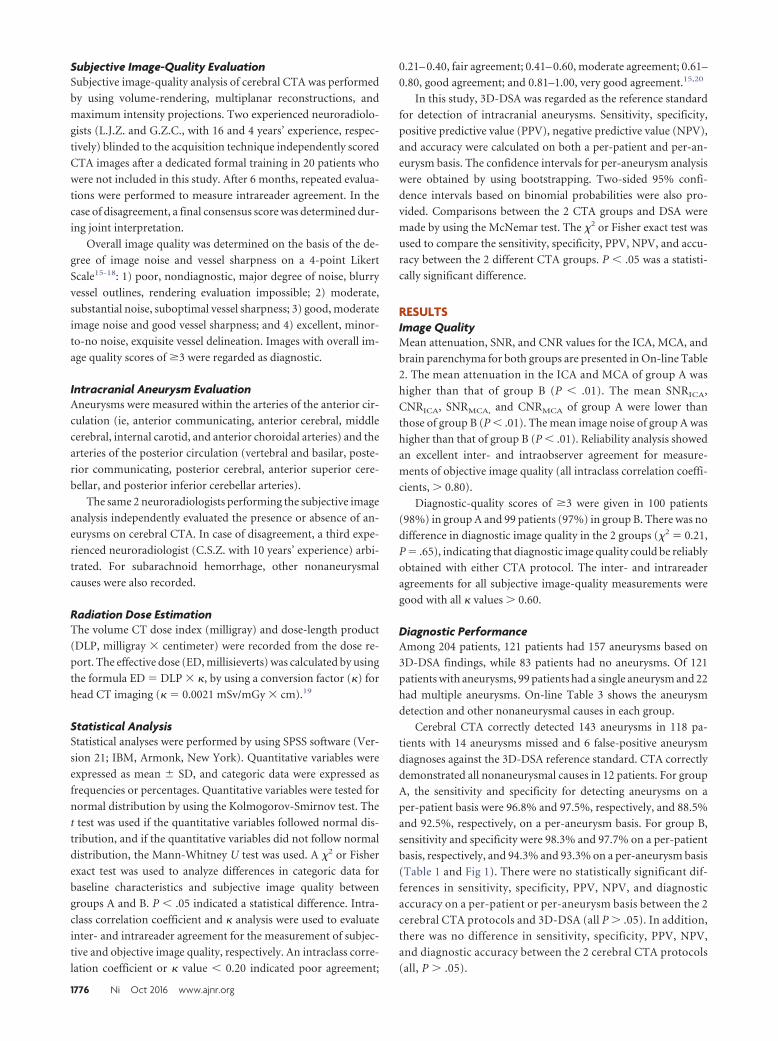
Subjective Image-Quality EvaluationSubjective image-quality analysis of cerebral CTA was performed
by using volume-rendering, multiplanar reconstructions, and
maximum intensity projections. Two experienced neuroradiolo-
gists (L.J.Z. and G.Z.C., with 16 and 4 years’ experience, respec-
tively) blinded to the acquisition technique independently scored
CTA images after a dedicated formal training in 20 patients who
were not included in this study. After 6 months, repeated evalua-
tions were performed to measure intrareader agreement. In the
case of disagreement, a final consensus score was determined dur-
ing joint interpretation.
Overall image quality was determined on the basis of the de-
gree of image noise and vessel sharpness on a 4-point Likert
Scale15-18: 1) poor, nondiagnostic, major degree of noise, blurry
vessel outlines, rendering evaluation impossible; 2) moderate,
substantial noise, suboptimal vessel sharpness; 3) good, moderate
image noise and good vessel sharpness; and 4) excellent, minor-
to-no noise, exquisite vessel delineation. Images with overall im-
age quality scores of �3 were regarded as diagnostic.
Intracranial Aneurysm EvaluationAneurysms were measured within the arteries of the anterior cir-
culation (ie, anterior communicating, anterior cerebral, middle
cerebral, internal carotid, and anterior choroidal arteries) and the
arteries of the posterior circulation (vertebral and basilar, poste-
rior communicating, posterior cerebral, anterior superior cere-
bellar, and posterior inferior cerebellar arteries).
The same 2 neuroradiologists performing the subjective image
analysis independently evaluated the presence or absence of an-
eurysms on cerebral CTA. In case of disagreement, a third expe-
rienced neuroradiologist (C.S.Z. with 10 years’ experience) arbi-
trated. For subarachnoid hemorrhage, other nonaneurysmal
causes were also recorded.
Radiation Dose EstimationThe volume CT dose index (milligray) and dose-length product
(DLP, milligray � centimeter) were recorded from the dose re-
port. The effective dose (ED, millisieverts) was calculated by using
the formula ED � DLP � �, by using a conversion factor (�) for
head CT imaging (� � 0.0021 mSv/mGy � cm).19
Statistical AnalysisStatistical analyses were performed by using SPSS software (Ver-
sion 21; IBM, Armonk, New York). Quantitative variables were
expressed as mean � SD, and categoric data were expressed as
frequencies or percentages. Quantitative variables were tested for
normal distribution by using the Kolmogorov-Smirnov test. The
t test was used if the quantitative variables followed normal dis-
tribution, and if the quantitative variables did not follow normal
distribution, the Mann-Whitney U test was used. A �2 or Fisher
exact test was used to analyze differences in categoric data for
baseline characteristics and subjective image quality between
groups A and B. P � .05 indicated a statistical difference. Intra-
class correlation coefficient and � analysis were used to evaluate
inter- and intrareader agreement for the measurement of subjec-
tive and objective image quality, respectively. An intraclass corre-
lation coefficient or � value � 0.20 indicated poor agreement;
0.21– 0.40, fair agreement; 0.41– 0.60, moderate agreement; 0.61–
0.80, good agreement; and 0.81–1.00, very good agreement.15,20
In this study, 3D-DSA was regarded as the reference standard
for detection of intracranial aneurysms. Sensitivity, specificity,
positive predictive value (PPV), negative predictive value (NPV),
and accuracy were calculated on both a per-patient and per-an-
eurysm basis. The confidence intervals for per-aneurysm analysis
were obtained by using bootstrapping. Two-sided 95% confi-
dence intervals based on binomial probabilities were also pro-
vided. Comparisons between the 2 CTA groups and DSA were
made by using the McNemar test. The �2 or Fisher exact test was
used to compare the sensitivity, specificity, PPV, NPV, and accu-
racy between the 2 different CTA groups. P � .05 was a statisti-
cally significant difference.
RESULTSImage QualityMean attenuation, SNR, and CNR values for the ICA, MCA, and
brain parenchyma for both groups are presented in On-line Table
2. The mean attenuation in the ICA and MCA of group A was
higher than that of group B (P � .01). The mean SNRICA,
CNRICA, SNRMCA, and CNRMCA of group A were lower than
those of group B (P � .01). The mean image noise of group A was
higher than that of group B (P � .01). Reliability analysis showed
an excellent inter- and intraobserver agreement for measure-
ments of objective image quality (all intraclass correlation coeffi-
cients, � 0.80).
Diagnostic-quality scores of �3 were given in 100 patients
(98%) in group A and 99 patients (97%) in group B. There was no
difference in diagnostic image quality in the 2 groups (�2 � 0.21,
P � .65), indicating that diagnostic image quality could be reliably
obtained with either CTA protocol. The inter- and intrareader
agreements for all subjective image-quality measurements were
good with all � values � 0.60.
Diagnostic PerformanceAmong 204 patients, 121 patients had 157 aneurysms based on
3D-DSA findings, while 83 patients had no aneurysms. Of 121
patients with aneurysms, 99 patients had a single aneurysm and 22
had multiple aneurysms. On-line Table 3 shows the aneurysm
detection and other nonaneurysmal causes in each group.
Cerebral CTA correctly detected 143 aneurysms in 118 pa-
tients with 14 aneurysms missed and 6 false-positive aneurysm
diagnoses against the 3D-DSA reference standard. CTA correctly
demonstrated all nonaneurysmal causes in 12 patients. For group
A, the sensitivity and specificity for detecting aneurysms on a
per-patient basis were 96.8% and 97.5%, respectively, and 88.5%
and 92.5%, respectively, on a per-aneurysm basis. For group B,
sensitivity and specificity were 98.3% and 97.7% on a per-patient
basis, respectively, and 94.3% and 93.3% on a per-aneurysm basis
(Table 1 and Fig 1). There were no statistically significant dif-
ferences in sensitivity, specificity, PPV, NPV, and diagnostic
accuracy on a per-patient or per-aneurysm basis between the 2
cerebral CTA protocols and 3D-DSA (all P � .05). In addition,
there was no difference in sensitivity, specificity, PPV, NPV,
and diagnostic accuracy between the 2 cerebral CTA protocols
(all, P � .05).
1776 Ni Oct 2016 www.ajnr.org
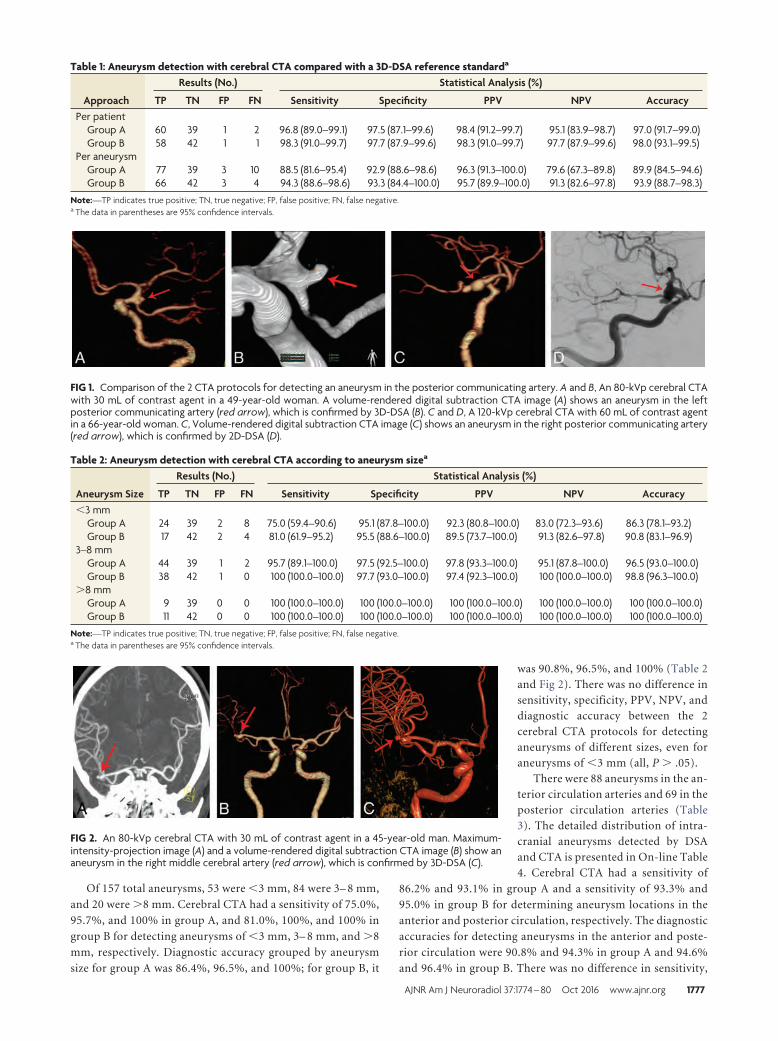
Of 157 total aneurysms, 53 were �3 mm, 84 were 3– 8 mm,
and 20 were �8 mm. Cerebral CTA had a sensitivity of 75.0%,
95.7%, and 100% in group A, and 81.0%, 100%, and 100% in
group B for detecting aneurysms of �3 mm, 3– 8 mm, and �8
mm, respectively. Diagnostic accuracy grouped by aneurysm
size for group A was 86.4%, 96.5%, and 100%; for group B, it
was 90.8%, 96.5%, and 100% (Table 2and Fig 2). There was no difference insensitivity, specificity, PPV, NPV, anddiagnostic accuracy between the 2cerebral CTA protocols for detectinganeurysms of different sizes, even foraneurysms of �3 mm (all, P � .05).
There were 88 aneurysms in the an-terior circulation arteries and 69 in theposterior circulation arteries (Table3). The detailed distribution of intra-cranial aneurysms detected by DSAand CTA is presented in On-line Table4. Cerebral CTA had a sensitivity of
86.2% and 93.1% in group A and a sensitivity of 93.3% and
95.0% in group B for determining aneurysm locations in the
anterior and posterior circulation, respectively. The diagnostic
accuracies for detecting aneurysms in the anterior and poste-
rior circulation were 90.8% and 94.3% in group A and 94.6%
and 96.4% in group B. There was no difference in sensitivity,
FIG 1. Comparison of the 2 CTA protocols for detecting an aneurysm in the posterior communicating artery. A and B, An 80-kVp cerebral CTAwith 30 mL of contrast agent in a 49-year-old woman. A volume-rendered digital subtraction CTA image (A) shows an aneurysm in the leftposterior communicating artery (red arrow), which is confirmed by 3D-DSA (B). C and D, A 120-kVp cerebral CTA with 60 mL of contrast agentin a 66-year-old woman. C, Volume-rendered digital subtraction CTA image (C) shows an aneurysm in the right posterior communicating artery(red arrow), which is confirmed by 2D-DSA (D).
FIG 2. An 80-kVp cerebral CTA with 30 mL of contrast agent in a 45-year-old man. Maximum-intensity-projection image (A) and a volume-rendered digital subtraction CTA image (B) show ananeurysm in the right middle cerebral artery (red arrow), which is confirmed by 3D-DSA (C).
Table 1: Aneurysm detection with cerebral CTA compared with a 3D-DSA reference standarda
Approach
Results (No.) Statistical Analysis (%)
TP TN FP FN Sensitivity Specificity PPV NPV AccuracyPer patient
Group A 60 39 1 2 96.8 (89.0–99.1) 97.5 (87.1–99.6) 98.4 (91.2–99.7) 95.1 (83.9–98.7) 97.0 (91.7–99.0)Group B 58 42 1 1 98.3 (91.0–99.7) 97.7 (87.9–99.6) 98.3 (91.0–99.7) 97.7 (87.9–99.6) 98.0 (93.1–99.5)
Per aneurysmGroup A 77 39 3 10 88.5 (81.6–95.4) 92.9 (88.6–98.6) 96.3 (91.3–100.0) 79.6 (67.3–89.8) 89.9 (84.5–94.6)Group B 66 42 3 4 94.3 (88.6–98.6) 93.3 (84.4–100.0) 95.7 (89.9–100.0) 91.3 (82.6–97.8) 93.9 (88.7–98.3)
Note:—TP indicates true positive; TN, true negative; FP, false positive; FN, false negative.a The data in parentheses are 95% confidence intervals.
Table 2: Aneurysm detection with cerebral CTA according to aneurysm sizea
Aneurysm Size
Results (No.) Statistical Analysis (%)
TP TN FP FN Sensitivity Specificity PPV NPV Accuracy�3 mm
Group A 24 39 2 8 75.0 (59.4–90.6) 95.1 (87.8–100.0) 92.3 (80.8–100.0) 83.0 (72.3–93.6) 86.3 (78.1–93.2)Group B 17 42 2 4 81.0 (61.9–95.2) 95.5 (88.6–100.0) 89.5 (73.7–100.0) 91.3 (82.6–97.8) 90.8 (83.1–96.9)
3–8 mmGroup A 44 39 1 2 95.7 (89.1–100.0) 97.5 (92.5–100.0) 97.8 (93.3–100.0) 95.1 (87.8–100.0) 96.5 (93.0–100.0)Group B 38 42 1 0 100 (100.0–100.0) 97.7 (93.0–100.0) 97.4 (92.3–100.0) 100 (100.0–100.0) 98.8 (96.3–100.0)
�8 mmGroup A 9 39 0 0 100 (100.0–100.0) 100 (100.0–100.0) 100 (100.0–100.0) 100 (100.0–100.0) 100 (100.0–100.0)Group B 11 42 0 0 100 (100.0–100.0) 100 (100.0–100.0) 100 (100.0–100.0) 100 (100.0–100.0) 100 (100.0–100.0)
Note:—TP indicates true positive; TN, true negative; FP, false positive; FN, false negative.a The data in parentheses are 95% confidence intervals.
AJNR Am J Neuroradiol 37:1774 – 80 Oct 2016 www.ajnr.org 1777
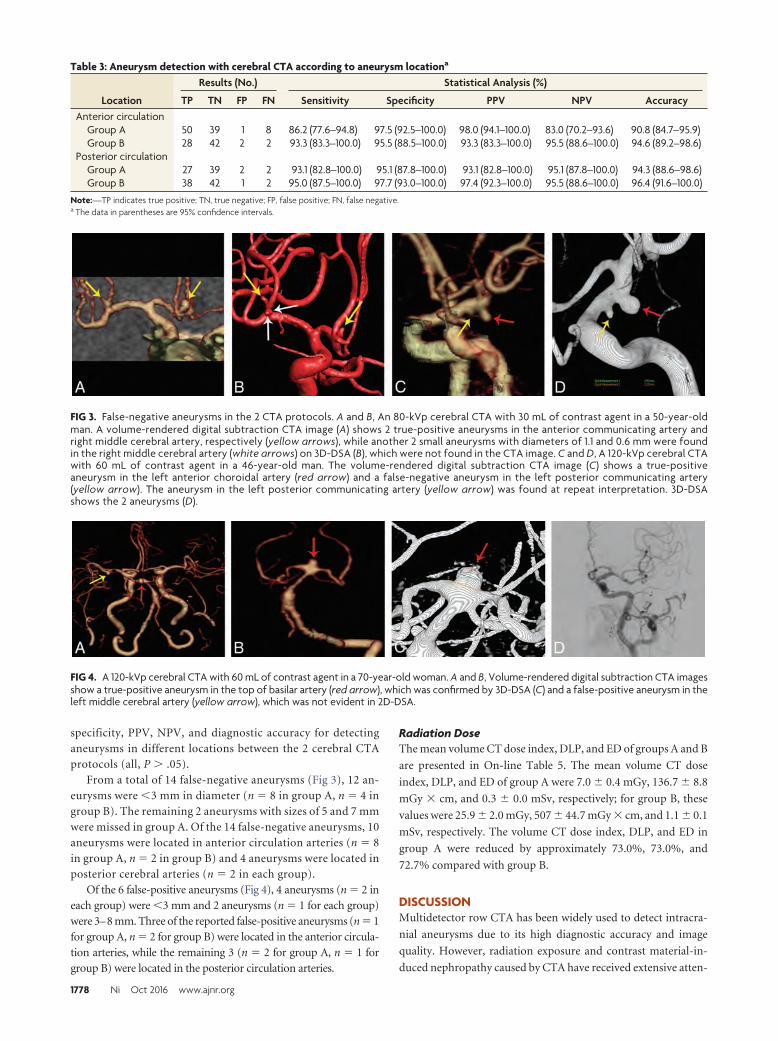
specificity, PPV, NPV, and diagnostic accuracy for detectinganeurysms in different locations between the 2 cerebral CTAprotocols (all, P � .05).
From a total of 14 false-negative aneurysms (Fig 3), 12 an-eurysms were �3 mm in diameter (n � 8 in group A, n � 4 ingroup B). The remaining 2 aneurysms with sizes of 5 and 7 mmwere missed in group A. Of the 14 false-negative aneurysms, 10aneurysms were located in anterior circulation arteries (n � 8in group A, n � 2 in group B) and 4 aneurysms were located inposterior cerebral arteries (n � 2 in each group).
Of the 6 false-positive aneurysms (Fig 4), 4 aneurysms (n � 2 ineach group) were �3 mm and 2 aneurysms (n � 1 for each group)were 3–8 mm. Three of the reported false-positive aneurysms (n � 1for group A, n � 2 for group B) were located in the anterior circula-tion arteries, while the remaining 3 (n � 2 for group A, n � 1 forgroup B) were located in the posterior circulation arteries.
Radiation DoseThe mean volume CT dose index, DLP, and ED of groups A and B
are presented in On-line Table 5. The mean volume CT dose
index, DLP, and ED of group A were 7.0 � 0.4 mGy, 136.7 � 8.8
mGy � cm, and 0.3 � 0.0 mSv, respectively; for group B, these
values were 25.9 � 2.0 mGy, 507 � 44.7 mGy � cm, and 1.1 � 0.1
mSv, respectively. The volume CT dose index, DLP, and ED in
group A were reduced by approximately 73.0%, 73.0%, and
72.7% compared with group B.
DISCUSSIONMultidetector row CTA has been widely used to detect intracra-
nial aneurysms due to its high diagnostic accuracy and image
quality. However, radiation exposure and contrast material-in-
duced nephropathy caused by CTA have received extensive atten-
FIG 3. False-negative aneurysms in the 2 CTA protocols. A and B, An 80-kVp cerebral CTA with 30 mL of contrast agent in a 50-year-oldman. A volume-rendered digital subtraction CTA image (A) shows 2 true-positive aneurysms in the anterior communicating artery andright middle cerebral artery, respectively (yellow arrows), while another 2 small aneurysms with diameters of 1.1 and 0.6 mm were foundin the right middle cerebral artery (white arrows) on 3D-DSA (B), which were not found in the CTA image. C and D, A 120-kVp cerebral CTAwith 60 mL of contrast agent in a 46-year-old man. The volume-rendered digital subtraction CTA image (C) shows a true-positiveaneurysm in the left anterior choroidal artery (red arrow) and a false-negative aneurysm in the left posterior communicating artery(yellow arrow). The aneurysm in the left posterior communicating artery (yellow arrow) was found at repeat interpretation. 3D-DSAshows the 2 aneurysms (D).
FIG 4. A 120-kVp cerebral CTA with 60 mL of contrast agent in a 70-year-old woman. A and B, Volume-rendered digital subtraction CTA imagesshow a true-positive aneurysm in the top of basilar artery (red arrow), which was confirmed by 3D-DSA (C) and a false-positive aneurysm in theleft middle cerebral artery (yellow arrow), which was not evident in 2D-DSA.
Table 3: Aneurysm detection with cerebral CTA according to aneurysm locationa
Location
Results (No.) Statistical Analysis (%)
TP TN FP FN Sensitivity Specificity PPV NPV AccuracyAnterior circulation
Group A 50 39 1 8 86.2 (77.6–94.8) 97.5 (92.5–100.0) 98.0 (94.1–100.0) 83.0 (70.2–93.6) 90.8 (84.7–95.9)Group B 28 42 2 2 93.3 (83.3–100.0) 95.5 (88.5–100.0) 93.3 (83.3–100.0) 95.5 (88.6–100.0) 94.6 (89.2–98.6)
Posterior circulationGroup A 27 39 2 2 93.1 (82.8–100.0) 95.1 (87.8–100.0) 93.1 (82.8–100.0) 95.1 (87.8–100.0) 94.3 (88.6–98.6)Group B 38 42 1 2 95.0 (87.5–100.0) 97.7 (93.0–100.0) 97.4 (92.3–100.0) 95.5 (88.6–100.0) 96.4 (91.6–100.0)
Note:—TP indicates true positive; TN, true negative; FP, false positive; FN, false negative.a The data in parentheses are 95% confidence intervals.
1778 Ni Oct 2016 www.ajnr.org
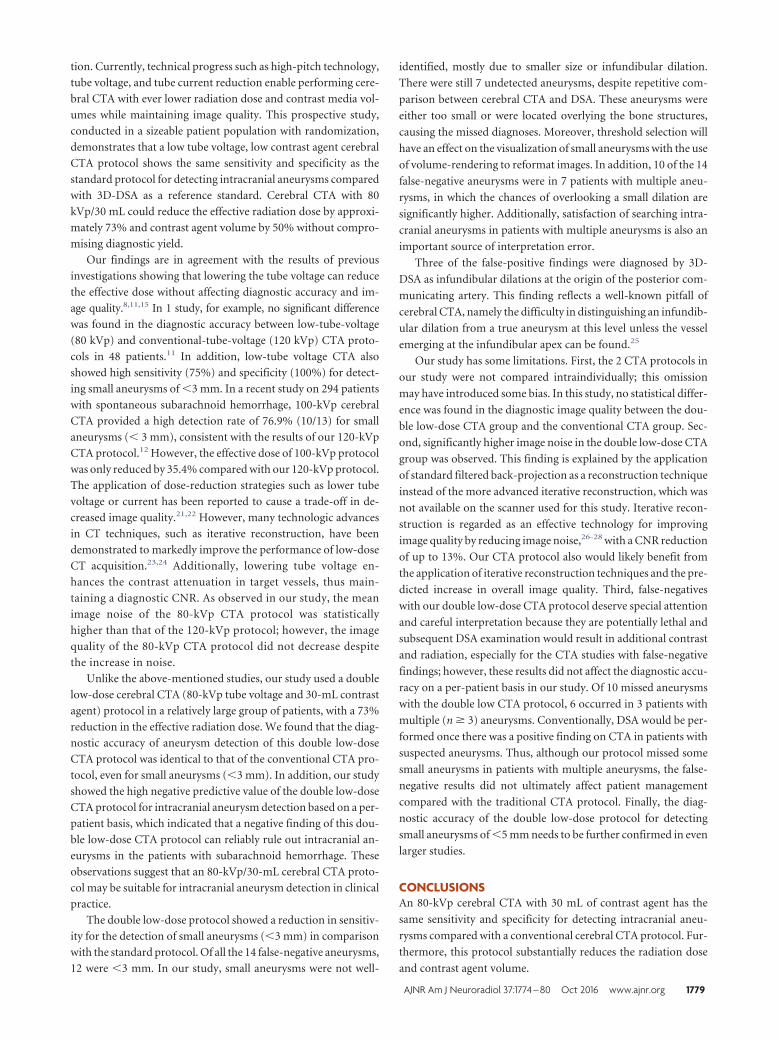
tion. Currently, technical progress such as high-pitch technology,
tube voltage, and tube current reduction enable performing cere-
bral CTA with ever lower radiation dose and contrast media vol-
umes while maintaining image quality. This prospective study,
conducted in a sizeable patient population with randomization,
demonstrates that a low tube voltage, low contrast agent cerebral
CTA protocol shows the same sensitivity and specificity as the
standard protocol for detecting intracranial aneurysms compared
with 3D-DSA as a reference standard. Cerebral CTA with 80
kVp/30 mL could reduce the effective radiation dose by approxi-
mately 73% and contrast agent volume by 50% without compro-
mising diagnostic yield.
Our findings are in agreement with the results of previous
investigations showing that lowering the tube voltage can reduce
the effective dose without affecting diagnostic accuracy and im-
age quality.8,11,15 In 1 study, for example, no significant difference
was found in the diagnostic accuracy between low-tube-voltage
(80 kVp) and conventional-tube-voltage (120 kVp) CTA proto-
cols in 48 patients.11 In addition, low-tube voltage CTA also
showed high sensitivity (75%) and specificity (100%) for detect-
ing small aneurysms of �3 mm. In a recent study on 294 patients
with spontaneous subarachnoid hemorrhage, 100-kVp cerebral
CTA provided a high detection rate of 76.9% (10/13) for small
aneurysms (� 3 mm), consistent with the results of our 120-kVp
CTA protocol.12 However, the effective dose of 100-kVp protocol
was only reduced by 35.4% compared with our 120-kVp protocol.
The application of dose-reduction strategies such as lower tube
voltage or current has been reported to cause a trade-off in de-
creased image quality.21,22 However, many technologic advances
in CT techniques, such as iterative reconstruction, have been
demonstrated to markedly improve the performance of low-dose
CT acquisition.23,24 Additionally, lowering tube voltage en-
hances the contrast attenuation in target vessels, thus main-
taining a diagnostic CNR. As observed in our study, the mean
image noise of the 80-kVp CTA protocol was statistically
higher than that of the 120-kVp protocol; however, the image
quality of the 80-kVp CTA protocol did not decrease despite
the increase in noise.
Unlike the above-mentioned studies, our study used a double
low-dose cerebral CTA (80-kVp tube voltage and 30-mL contrast
agent) protocol in a relatively large group of patients, with a 73%
reduction in the effective radiation dose. We found that the diag-
nostic accuracy of aneurysm detection of this double low-dose
CTA protocol was identical to that of the conventional CTA pro-
tocol, even for small aneurysms (�3 mm). In addition, our study
showed the high negative predictive value of the double low-dose
CTA protocol for intracranial aneurysm detection based on a per-
patient basis, which indicated that a negative finding of this dou-
ble low-dose CTA protocol can reliably rule out intracranial an-
eurysms in the patients with subarachnoid hemorrhage. These
observations suggest that an 80-kVp/30-mL cerebral CTA proto-
col may be suitable for intracranial aneurysm detection in clinical
practice.
The double low-dose protocol showed a reduction in sensitiv-
ity for the detection of small aneurysms (�3 mm) in comparison
with the standard protocol. Of all the 14 false-negative aneurysms,
12 were �3 mm. In our study, small aneurysms were not well-
identified, mostly due to smaller size or infundibular dilation.
There were still 7 undetected aneurysms, despite repetitive com-
parison between cerebral CTA and DSA. These aneurysms were
either too small or were located overlying the bone structures,
causing the missed diagnoses. Moreover, threshold selection will
have an effect on the visualization of small aneurysms with the use
of volume-rendering to reformat images. In addition, 10 of the 14
false-negative aneurysms were in 7 patients with multiple aneu-
rysms, in which the chances of overlooking a small dilation are
significantly higher. Additionally, satisfaction of searching intra-
cranial aneurysms in patients with multiple aneurysms is also an
important source of interpretation error.
Three of the false-positive findings were diagnosed by 3D-
DSA as infundibular dilations at the origin of the posterior com-
municating artery. This finding reflects a well-known pitfall of
cerebral CTA, namely the difficulty in distinguishing an infundib-
ular dilation from a true aneurysm at this level unless the vessel
emerging at the infundibular apex can be found.25
Our study has some limitations. First, the 2 CTA protocols in
our study were not compared intraindividually; this omission
may have introduced some bias. In this study, no statistical differ-
ence was found in the diagnostic image quality between the dou-
ble low-dose CTA group and the conventional CTA group. Sec-
ond, significantly higher image noise in the double low-dose CTA
group was observed. This finding is explained by the application
of standard filtered back-projection as a reconstruction technique
instead of the more advanced iterative reconstruction, which was
not available on the scanner used for this study. Iterative recon-
struction is regarded as an effective technology for improving
image quality by reducing image noise,26-28 with a CNR reduction
of up to 13%. Our CTA protocol also would likely benefit from
the application of iterative reconstruction techniques and the pre-
dicted increase in overall image quality. Third, false-negatives
with our double low-dose CTA protocol deserve special attention
and careful interpretation because they are potentially lethal and
subsequent DSA examination would result in additional contrast
and radiation, especially for the CTA studies with false-negative
findings; however, these results did not affect the diagnostic accu-
racy on a per-patient basis in our study. Of 10 missed aneurysms
with the double low CTA protocol, 6 occurred in 3 patients with
multiple (n � 3) aneurysms. Conventionally, DSA would be per-
formed once there was a positive finding on CTA in patients with
suspected aneurysms. Thus, although our protocol missed some
small aneurysms in patients with multiple aneurysms, the false-
negative results did not ultimately affect patient management
compared with the traditional CTA protocol. Finally, the diag-
nostic accuracy of the double low-dose protocol for detecting
small aneurysms of �5 mm needs to be further confirmed in even
larger studies.
CONCLUSIONSAn 80-kVp cerebral CTA with 30 mL of contrast agent has the
same sensitivity and specificity for detecting intracranial aneu-
rysms compared with a conventional cerebral CTA protocol. Fur-
thermore, this protocol substantially reduces the radiation dose
and contrast agent volume.
AJNR Am J Neuroradiol 37:1774 – 80 Oct 2016 www.ajnr.org 1779
Disclosures: U. Joseph Schoepf—UNRELATED: Consultancy: Guerbet; Grants/Grants Pending: Astellas Pharma,* Bayer Schering Pharma,* Bracco,* GE Healthcare,*Medrad,* Siemens*; Royalties: Springer, Meetings-by-Mail. *Money paid to theinstitution.
REFERENCES1. van Gijn J, Kerr RS, Rinkel GJ. Subarachnoid haemorrhage. Lancet
2007;369:306 –18 CrossRef Medline2. Vlak MH, Algra A, Brandenburg R, et al. Prevalence of unruptured
intracranial aneurysms, with emphasis on sex, age, comorbidity,country, and time period: a systematic review and meta-analysis.Lancet Neurol 2011;10:626 –36 CrossRef Medline
3. Rabinstein AA, Lanzino G, Wijdicks EF. Multidisciplinary manage-ment and emerging therapeutic strategies in aneurysmal subarach-noid haemorrhage. Lancet Neurol 2010;9:504 –19 CrossRef Medline
4. Lu L, Zhang LJ, Poon CS, et al. Digital subtraction CT angiographyfor detection of intracranial aneurysms: comparison with three-dimensional digital subtraction angiography. Radiology 2012;262:605–12 CrossRef Medline
5. Moran CJ. Aneurysmal subarachnoid hemorrhage: DSA versus CTangiography—is the answer available? Radiology 2011;258:15–17CrossRef Medline
6. Chen W, Xing W, Peng Y, et al. Cerebral aneurysms: accuracy of320-detector row nonsubtracted and subtracted volumetric CTangiography for diagnosis. Radiology 2013;269:841– 49 CrossRefMedline
7. Westerlaan HE, van Dijk J, Jansen-van der Weide MC, et al. Intracra-nial aneurysms in patients with subarachnoid hemorrhage: CT an-giography as a primary examination tool for diagnosis—systematicreview and meta-analysis. Radiology 2011;258:134 – 45 CrossRefMedline
8. Luo S, Zhang LJ, Meinel FG, et al. Low tube voltage and low contrastmaterial volume cerebral CT angiography. Eur Radiol 2014;24:1677– 85 CrossRef Medline
9. Millon D, Derelle AL, Omoumi P, et al. Nontraumatic subarachnoidhemorrhage management: evaluation with reduced iodine volumeat CT angiography. Radiology 2012;264:203– 09 CrossRef Medline
10. Ramgren B, Bjorkman-Burtscher IM, Holtås S, et al. CT angiographyof intracranial arterial vessels: impact of tube voltage and contrastmedia concentration on image quality. Acta Radiol 2012;53:929 –34CrossRef Medline
11. Sun G, Ding J, Lu Y, et al. Comparison of standard-and low-tubevoltage 320-detector row volume CT angiography in detection ofintracranial aneurysms with digital subtraction angiography asgold standard. Acad Radiol 2012;19:281– 88 CrossRef Medline
12. Tang K, Li R, Lin J, et al. The value of cerebral CT angiography withlow tube voltage in detection of intracranial aneurysms. Biomed ResInt 2015;2015:876796 CrossRef Medline
13. Cho ES, Chung TS, Oh DK, et al. Cerebral computed tomographyangiography using a low tube voltage (80 kVp) and a moderate con-centration of iodine contrast material: a quantitative and qualita-tive comparison with conventional computed tomography angiog-raphy. Invest Radiol 2012;47:142– 47 CrossRef Medline
14. Furtado A, Adraktas D, Brasic N, et al. The triple rule-out for acute
ischemic stroke: imaging the brain, carotid arteries, aorta, andheart. AJNR Am J Neuroradiol 2010;31:1290 –96 CrossRef Medline
15. Chen GZ, Zhang LJ, Schoepf UJ, et al. Radiation dose and imagequality of 70 kVp cerebral CT angiography with optimized sino-gram-affirmed iterative reconstruction: comparison with 120 kVpcerebral CT angiography. Eur Radiol 2015;25:1453– 63 CrossRefMedline
16. Soderman M, Holmin S, Andersson T, et al. Image noise reductionalgorithm for digital subtraction angiography: clinical results. Ra-diology 2013;269:553– 60 CrossRef Medline
17. Szucs-Farkas Z, Bensler S, Torrente JC, et al. Nonlinear three-dimen-sional noise filter with low-dose CT angiography: effect on the de-tection of small high-contrast objects in a phantom model. Radiol-ogy 2011;258:261– 69 CrossRef Medline
18. Zhang WL, Li M, Zhang B, et al. CT angiography of the head-and-neck vessels acquired with low tube voltage, low iodine, and itera-tive image reconstruction: clinical evaluation of radiation dose andimage quality. PLoS One 2013;8:e81486 CrossRef Medline
19. McCollough CH, Primak AN, Braun N, et al. Strategies for reducingradiation dose in CT. Radiol Clin North Am 2009;47:27– 40 CrossRefMedline
20. Zhao H, Wang J, Liu X, et al. Assessment of carotid artery athero-sclerotic disease by using three-dimensional fast black-bloodMR imaging: comparison with DSA. Radiology 2015;274:508 –16CrossRef Medline
21. Smith AB, Dillon WP, Gould R, et al. Radiation dose reduction strat-egies for neuroradiology CT protocols. AJNR Am J Neuroradiol2007;28:1628 –32 CrossRef Medline
22. Graser A, Wintersperger BJ, Suess C, et al. Dose reduction and imagequality in MDCT colonography using tube current modulation.AJR Am J Roentgenol 2006;187:695–701 CrossRef Medline
23. Herin E, Gardavaud F, Chiaradia M, et al. Use of Model-Based Iter-ative Reconstruction (MBIR) in reduced-dose CT for routine fol-low-up of patients with malignant lymphoma: dose savings, imagequality and phantom study. Eur Radiol 2015;25:2362–70 CrossRefMedline
24. Geyer LL, Schoepf UJ, Meinel FG, et al. State of the art: iterative CTreconstruction techniques. Radiology 2015;276:339 –57 CrossRefMedline
25. Pereira BJA, Holanda VM, de Holanda CVM, et al. Intracranial an-eurysm arising from infundibular dilation. BMJ Case Rep 2013;2013:pii: bcr2013200115 CrossRef Medline
26. Donmez H, Serifov E, Kahriman G, et al. Comparison of 16-rowmultislice CT angiography with conventional angiography for de-tection and evaluation of intracranial aneurysms. Eur J Radiol 2011;80:455– 61 CrossRef Medline
27. Korn A, Bender B, Fenchel M, et al. Sinogram affirmed iterativereconstruction in head CT: improvement of objective and subjec-tive image quality with concomitant radiation dose reduction. Eur JRadiol 2013;82:1431–35 CrossRef Medline
28. Moscariello A, Takx RA, Schoepf UJ, et al. Coronary CTangiography: image quality, diagnostic accuracy, and potential forradiation dose reduction using a novel iterative image reconstruc-tion technique— comparison with traditional filtered back projec-tion. Eur Radiol 2011;21:2130 –38 CrossRef Medline
1780 Ni Oct 2016 www.ajnr.org
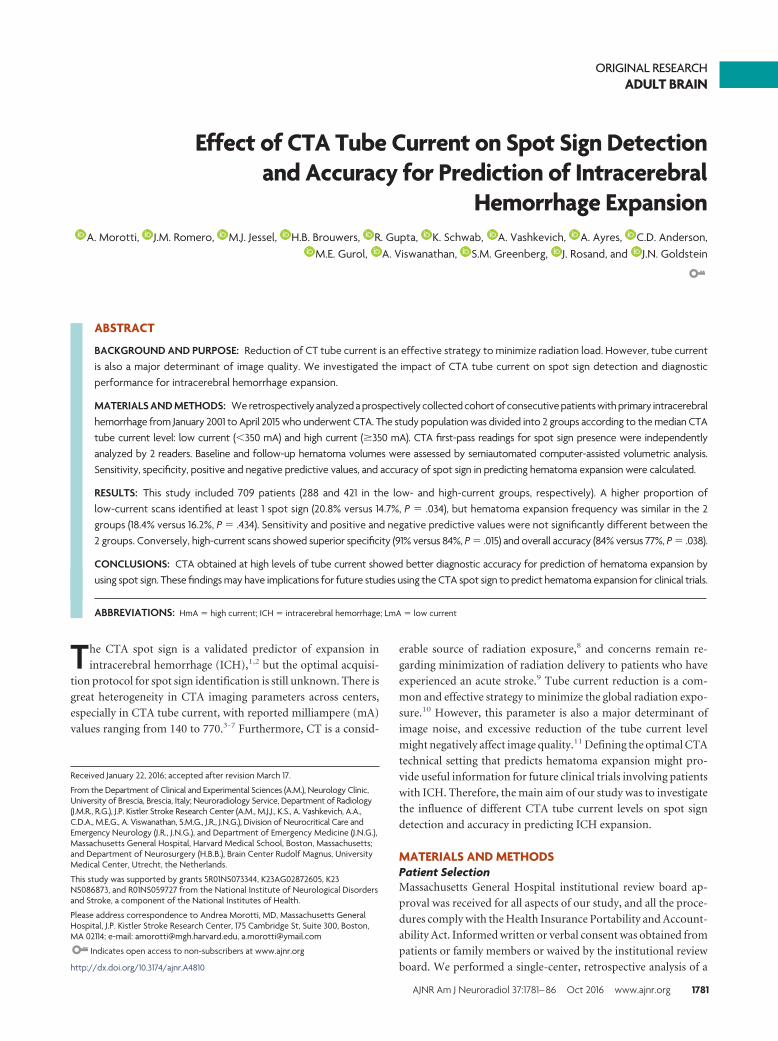
ORIGINAL RESEARCHADULT BRAIN
Effect of CTA Tube Current on Spot Sign Detectionand Accuracy for Prediction of Intracerebral
Hemorrhage ExpansionX A. Morotti, X J.M. Romero, X M.J. Jessel, X H.B. Brouwers, X R. Gupta, X K. Schwab, X A. Vashkevich, X A. Ayres, X C.D. Anderson,
X M.E. Gurol, X A. Viswanathan, X S.M. Greenberg, X J. Rosand, and X J.N. Goldstein
ABSTRACT
BACKGROUND AND PURPOSE: Reduction of CT tube current is an effective strategy to minimize radiation load. However, tube currentis also a major determinant of image quality. We investigated the impact of CTA tube current on spot sign detection and diagnosticperformance for intracerebral hemorrhage expansion.
MATERIALS AND METHODS: We retrospectively analyzed a prospectively collected cohort of consecutive patients with primary intracerebralhemorrhage from January 2001 to April 2015 who underwent CTA. The study population was divided into 2 groups according to the median CTAtube current level: low current (�350 mA) and high current (�350 mA). CTA first-pass readings for spot sign presence were independentlyanalyzed by 2 readers. Baseline and follow-up hematoma volumes were assessed by semiautomated computer-assisted volumetric analysis.Sensitivity, specificity, positive and negative predictive values, and accuracy of spot sign in predicting hematoma expansion were calculated.
RESULTS: This study included 709 patients (288 and 421 in the low- and high-current groups, respectively). A higher proportion oflow-current scans identified at least 1 spot sign (20.8% versus 14.7%, P � .034), but hematoma expansion frequency was similar in the 2groups (18.4% versus 16.2%, P � .434). Sensitivity and positive and negative predictive values were not significantly different between the2 groups. Conversely, high-current scans showed superior specificity (91% versus 84%, P � .015) and overall accuracy (84% versus 77%, P � .038).
CONCLUSIONS: CTA obtained at high levels of tube current showed better diagnostic accuracy for prediction of hematoma expansion byusing spot sign. These findings may have implications for future studies using the CTA spot sign to predict hematoma expansion for clinical trials.
ABBREVIATIONS: HmA � high current; ICH � intracerebral hemorrhage; LmA � low current
The CTA spot sign is a validated predictor of expansion in
intracerebral hemorrhage (ICH),1,2 but the optimal acquisi-
tion protocol for spot sign identification is still unknown. There is
great heterogeneity in CTA imaging parameters across centers,
especially in CTA tube current, with reported milliampere (mA)
values ranging from 140 to 770.3-7 Furthermore, CT is a consid-
erable source of radiation exposure,8 and concerns remain re-
garding minimization of radiation delivery to patients who have
experienced an acute stroke.9 Tube current reduction is a com-
mon and effective strategy to minimize the global radiation expo-
sure.10 However, this parameter is also a major determinant of
image noise, and excessive reduction of the tube current level
might negatively affect image quality.11 Defining the optimal CTA
technical setting that predicts hematoma expansion might pro-
vide useful information for future clinical trials involving patients
with ICH. Therefore, the main aim of our study was to investigate
the influence of different CTA tube current levels on spot sign
detection and accuracy in predicting ICH expansion.
MATERIALS AND METHODSPatient SelectionMassachusetts General Hospital institutional review board ap-
proval was received for all aspects of our study, and all the proce-
dures comply with the Health Insurance Portability and Account-
ability Act. Informed written or verbal consent was obtained from
patients or family members or waived by the institutional review
board. We performed a single-center, retrospective analysis of a
Received January 22, 2016; accepted after revision March 17.
From the Department of Clinical and Experimental Sciences (A.M.), Neurology Clinic,University of Brescia, Brescia, Italy; Neuroradiology Service, Department of Radiology(J.M.R., R.G.), J.P. Kistler Stroke Research Center (A.M., M.J.J., K.S., A. Vashkevich, A.A.,C.D.A., M.E.G., A. Viswanathan, S.M.G., J.R., J.N.G.), Division of Neurocritical Care andEmergency Neurology (J.R., J.N.G.), and Department of Emergency Medicine (J.N.G.),Massachusetts General Hospital, Harvard Medical School, Boston, Massachusetts;and Department of Neurosurgery (H.B.B.), Brain Center Rudolf Magnus, UniversityMedical Center, Utrecht, the Netherlands.
This study was supported by grants 5R01NS073344, K23AG02872605, K23NS086873, and R01NS059727 from the National Institute of Neurological Disordersand Stroke, a component of the National Institutes of Health.
Please address correspondence to Andrea Morotti, MD, Massachusetts GeneralHospital, J.P. Kistler Stroke Research Center, 175 Cambridge St, Suite 300, Boston,MA 02114; e-mail: [email protected], [email protected]
Indicates open access to non-subscribers at www.ajnr.org
http://dx.doi.org/10.3174/ajnr.A4810
AJNR Am J Neuroradiol 37:1781– 86 Oct 2016 www.ajnr.org 1781
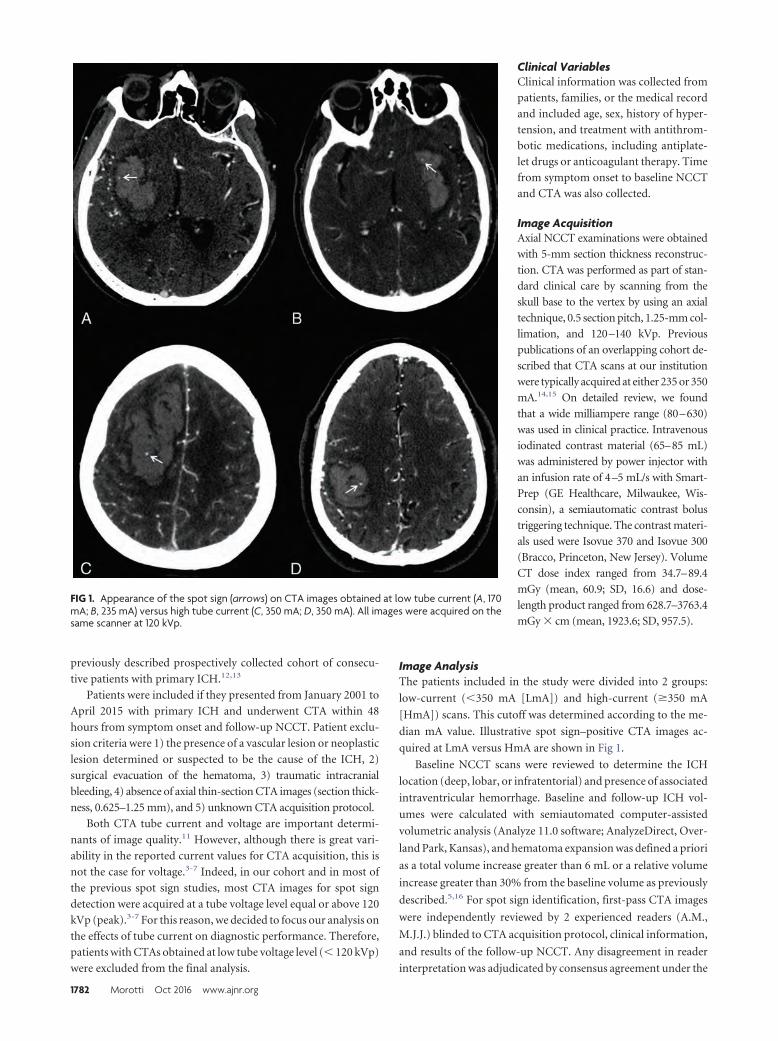
previously described prospectively collected cohort of consecu-
tive patients with primary ICH.12,13
Patients were included if they presented from January 2001 to
April 2015 with primary ICH and underwent CTA within 48
hours from symptom onset and follow-up NCCT. Patient exclu-
sion criteria were 1) the presence of a vascular lesion or neoplastic
lesion determined or suspected to be the cause of the ICH, 2)
surgical evacuation of the hematoma, 3) traumatic intracranial
bleeding, 4) absence of axial thin-section CTA images (section thick-
ness, 0.625–1.25 mm), and 5) unknown CTA acquisition protocol.
Both CTA tube current and voltage are important determi-
nants of image quality.11 However, although there is great vari-
ability in the reported current values for CTA acquisition, this is
not the case for voltage.3-7 Indeed, in our cohort and in most of
the previous spot sign studies, most CTA images for spot sign
detection were acquired at a tube voltage level equal or above 120
kVp (peak).3-7 For this reason, we decided to focus our analysis on
the effects of tube current on diagnostic performance. Therefore,
patients with CTAs obtained at low tube voltage level (� 120 kVp)
were excluded from the final analysis.
Clinical VariablesClinical information was collected from
patients, families, or the medical record
and included age, sex, history of hyper-
tension, and treatment with antithrom-
botic medications, including antiplate-
let drugs or anticoagulant therapy. Time
from symptom onset to baseline NCCT
and CTA was also collected.
Image AcquisitionAxial NCCT examinations were obtained
with 5-mm section thickness reconstruc-
tion. CTA was performed as part of stan-
dard clinical care by scanning from the
skull base to the vertex by using an axial
technique, 0.5 section pitch, 1.25-mm col-
limation, and 120–140 kVp. Previous
publications of an overlapping cohort de-
scribed that CTA scans at our institution
were typically acquired at either 235 or 350
mA.14,15 On detailed review, we found
that a wide milliampere range (80–630)
was used in clinical practice. Intravenous
iodinated contrast material (65–85 mL)
was administered by power injector with
an infusion rate of 4–5 mL/s with Smart-
Prep (GE Healthcare, Milwaukee, Wis-
consin), a semiautomatic contrast bolus
triggering technique. The contrast materi-
als used were Isovue 370 and Isovue 300
(Bracco, Princeton, New Jersey). Volume
CT dose index ranged from 34.7–89.4
mGy (mean, 60.9; SD, 16.6) and dose-
length product ranged from 628.7–3763.4
mGy � cm (mean, 1923.6; SD, 957.5).
Image AnalysisThe patients included in the study were divided into 2 groups:
low-current (�350 mA [LmA]) and high-current (�350 mA
[HmA]) scans. This cutoff was determined according to the me-
dian mA value. Illustrative spot sign–positive CTA images ac-
quired at LmA versus HmA are shown in Fig 1.
Baseline NCCT scans were reviewed to determine the ICH
location (deep, lobar, or infratentorial) and presence of associated
intraventricular hemorrhage. Baseline and follow-up ICH vol-
umes were calculated with semiautomated computer-assisted
volumetric analysis (Analyze 11.0 software; AnalyzeDirect, Over-
land Park, Kansas), and hematoma expansion was defined a priori
as a total volume increase greater than 6 mL or a relative volume
increase greater than 30% from the baseline volume as previously
described.5,16 For spot sign identification, first-pass CTA images
were independently reviewed by 2 experienced readers (A.M.,
M.J.J.) blinded to CTA acquisition protocol, clinical information,
and results of the follow-up NCCT. Any disagreement in reader
interpretation was adjudicated by consensus agreement under the
FIG 1. Appearance of the spot sign (arrows) on CTA images obtained at low tube current (A, 170mA; B, 235 mA) versus high tube current (C, 350 mA; D, 350 mA). All images were acquired on thesame scanner at 120 kVp.
1782 Morotti Oct 2016 www.ajnr.org
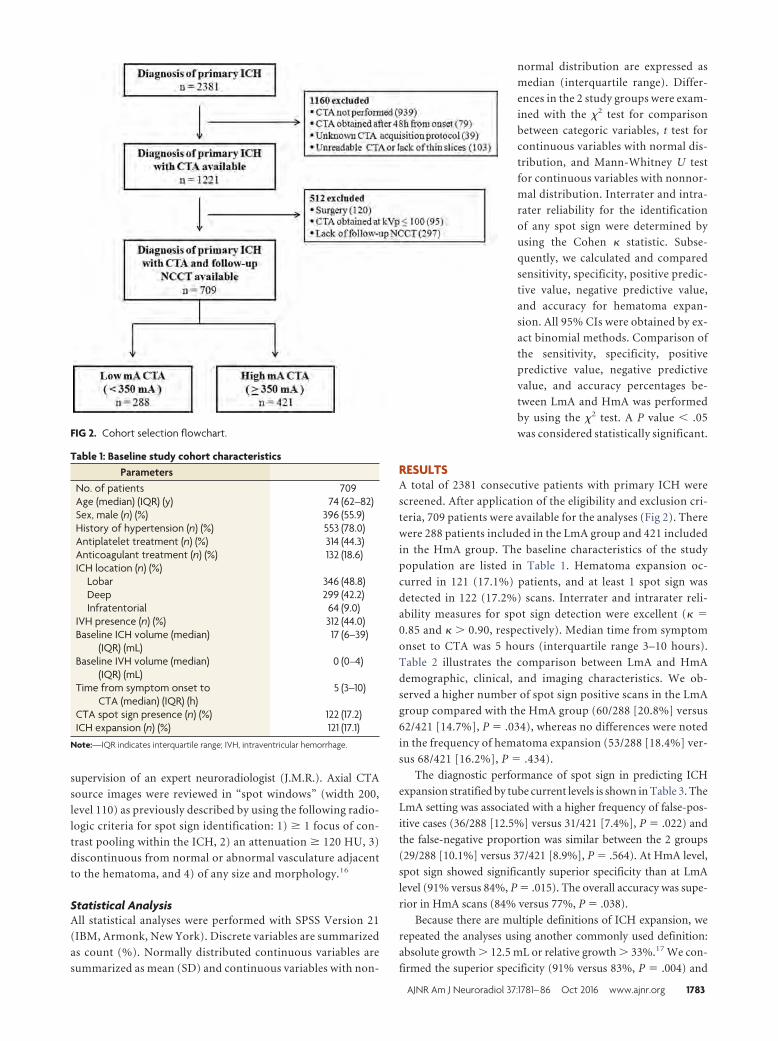
supervision of an expert neuroradiologist (J.M.R.). Axial CTA
source images were reviewed in “spot windows” (width 200,
level 110) as previously described by using the following radio-
logic criteria for spot sign identification: 1) � 1 focus of con-
trast pooling within the ICH, 2) an attenuation � 120 HU, 3)
discontinuous from normal or abnormal vasculature adjacent
to the hematoma, and 4) of any size and morphology.16
Statistical AnalysisAll statistical analyses were performed with SPSS Version 21
(IBM, Armonk, New York). Discrete variables are summarized
as count (%). Normally distributed continuous variables are
summarized as mean (SD) and continuous variables with non-
normal distribution are expressed as
median (interquartile range). Differ-
ences in the 2 study groups were exam-
ined with the �2 test for comparison
between categoric variables, t test for
continuous variables with normal dis-
tribution, and Mann-Whitney U test
for continuous variables with nonnor-
mal distribution. Interrater and intra-
rater reliability for the identification
of any spot sign were determined by
using the Cohen � statistic. Subse-
quently, we calculated and compared
sensitivity, specificity, positive predic-
tive value, negative predictive value,
and accuracy for hematoma expan-
sion. All 95% CIs were obtained by ex-
act binomial methods. Comparison of
the sensitivity, specificity, positive
predictive value, negative predictive
value, and accuracy percentages be-
tween LmA and HmA was performed
by using the �2 test. A P value � .05
was considered statistically significant.
RESULTSA total of 2381 consecutive patients with primary ICH were
screened. After application of the eligibility and exclusion cri-
teria, 709 patients were available for the analyses (Fig 2). There
were 288 patients included in the LmA group and 421 included
in the HmA group. The baseline characteristics of the study
population are listed in Table 1. Hematoma expansion oc-
curred in 121 (17.1%) patients, and at least 1 spot sign was
detected in 122 (17.2%) scans. Interrater and intrarater reli-
ability measures for spot sign detection were excellent (� �
0.85 and � � 0.90, respectively). Median time from symptom
onset to CTA was 5 hours (interquartile range 3–10 hours).
Table 2 illustrates the comparison between LmA and HmA
demographic, clinical, and imaging characteristics. We ob-
served a higher number of spot sign positive scans in the LmA
group compared with the HmA group (60/288 [20.8%] versus
62/421 [14.7%], P � .034), whereas no differences were noted
in the frequency of hematoma expansion (53/288 [18.4%] ver-
sus 68/421 [16.2%], P � .434).
The diagnostic performance of spot sign in predicting ICH
expansion stratified by tube current levels is shown in Table 3. The
LmA setting was associated with a higher frequency of false-pos-
itive cases (36/288 [12.5%] versus 31/421 [7.4%], P � .022) and
the false-negative proportion was similar between the 2 groups
(29/288 [10.1%] versus 37/421 [8.9%], P � .564). At HmA level,
spot sign showed significantly superior specificity than at LmA
level (91% versus 84%, P � .015). The overall accuracy was supe-
rior in HmA scans (84% versus 77%, P � .038).
Because there are multiple definitions of ICH expansion, we
repeated the analyses using another commonly used definition:
absolute growth � 12.5 mL or relative growth � 33%.17 We con-
firmed the superior specificity (91% versus 83%, P � .004) and
FIG 2. Cohort selection flowchart.
Table 1: Baseline study cohort characteristicsParameters
No. of patients 709Age (median) (IQR) (y) 74 (62–82)Sex, male (n) (%) 396 (55.9)History of hypertension (n) (%) 553 (78.0)Antiplatelet treatment (n) (%) 314 (44.3)Anticoagulant treatment (n) (%) 132 (18.6)ICH location (n) (%)
Lobar 346 (48.8)Deep 299 (42.2)Infratentorial 64 (9.0)
IVH presence (n) (%) 312 (44.0)Baseline ICH volume (median)
(IQR) (mL)17 (6–39)
Baseline IVH volume (median)(IQR) (mL)
0 (0–4)
Time from symptom onset toCTA (median) (IQR) (h)
5 (3–10)
CTA spot sign presence (n) (%) 122 (17.2)ICH expansion (n) (%) 121 (17.1)
Note:—IQR indicates interquartile range; IVH, intraventricular hemorrhage.
AJNR Am J Neuroradiol 37:1781– 86 Oct 2016 www.ajnr.org 1783
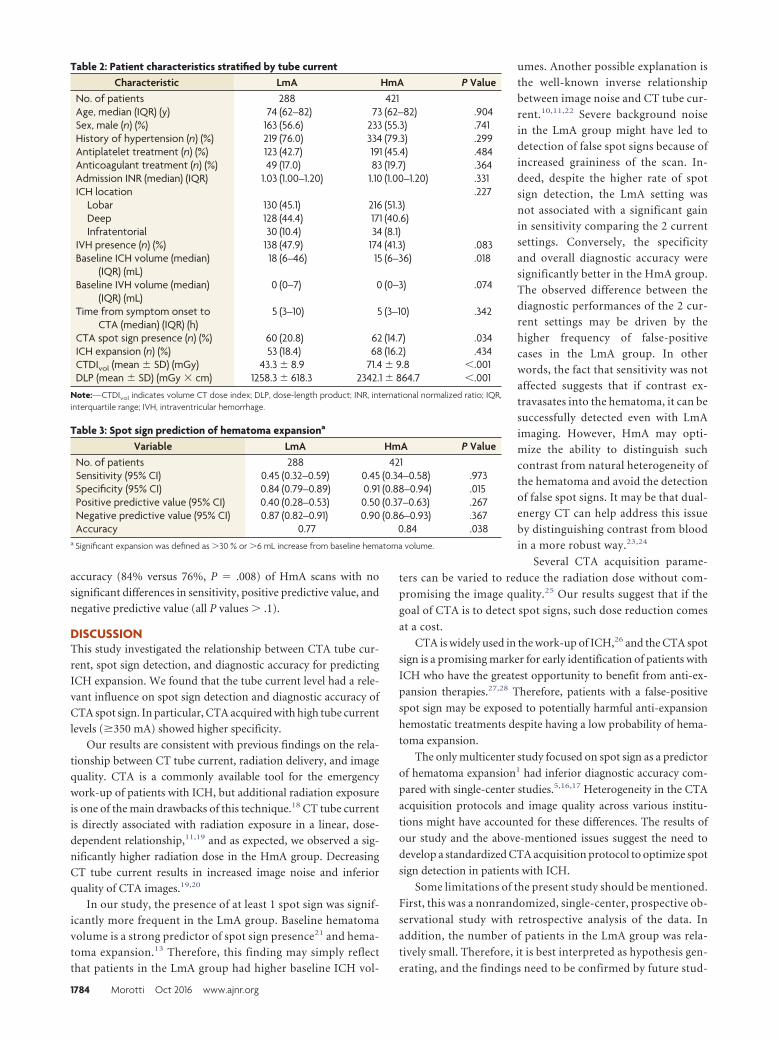
accuracy (84% versus 76%, P � .008) of HmA scans with no
significant differences in sensitivity, positive predictive value, and
negative predictive value (all P values � .1).
DISCUSSIONThis study investigated the relationship between CTA tube cur-
rent, spot sign detection, and diagnostic accuracy for predicting
ICH expansion. We found that the tube current level had a rele-
vant influence on spot sign detection and diagnostic accuracy of
CTA spot sign. In particular, CTA acquired with high tube current
levels (�350 mA) showed higher specificity.
Our results are consistent with previous findings on the rela-
tionship between CT tube current, radiation delivery, and image
quality. CTA is a commonly available tool for the emergency
work-up of patients with ICH, but additional radiation exposure
is one of the main drawbacks of this technique.18 CT tube current
is directly associated with radiation exposure in a linear, dose-
dependent relationship,11,19 and as expected, we observed a sig-
nificantly higher radiation dose in the HmA group. Decreasing
CT tube current results in increased image noise and inferior
quality of CTA images.19,20
In our study, the presence of at least 1 spot sign was signif-
icantly more frequent in the LmA group. Baseline hematoma
volume is a strong predictor of spot sign presence21 and hema-
toma expansion.13 Therefore, this finding may simply reflect
that patients in the LmA group had higher baseline ICH vol-
umes. Another possible explanation is
the well-known inverse relationship
between image noise and CT tube cur-
rent.10,11,22 Severe background noise
in the LmA group might have led to
detection of false spot signs because of
increased graininess of the scan. In-
deed, despite the higher rate of spot
sign detection, the LmA setting was
not associated with a significant gain
in sensitivity comparing the 2 current
settings. Conversely, the specificity
and overall diagnostic accuracy were
significantly better in the HmA group.
The observed difference between the
diagnostic performances of the 2 cur-
rent settings may be driven by the
higher frequency of false-positive
cases in the LmA group. In other
words, the fact that sensitivity was not
affected suggests that if contrast ex-
travasates into the hematoma, it can be
successfully detected even with LmA
imaging. However, HmA may opti-
mize the ability to distinguish such
contrast from natural heterogeneity of
the hematoma and avoid the detection
of false spot signs. It may be that dual-
energy CT can help address this issue
by distinguishing contrast from blood
in a more robust way.23,24
Several CTA acquisition parame-
ters can be varied to reduce the radiation dose without com-
promising the image quality.25 Our results suggest that if the
goal of CTA is to detect spot signs, such dose reduction comes
at a cost.
CTA is widely used in the work-up of ICH,26 and the CTA spot
sign is a promising marker for early identification of patients with
ICH who have the greatest opportunity to benefit from anti-ex-
pansion therapies.27,28 Therefore, patients with a false-positive
spot sign may be exposed to potentially harmful anti-expansion
hemostatic treatments despite having a low probability of hema-
toma expansion.
The only multicenter study focused on spot sign as a predictor
of hematoma expansion1 had inferior diagnostic accuracy com-
pared with single-center studies.5,16,17 Heterogeneity in the CTA
acquisition protocols and image quality across various institu-
tions might have accounted for these differences. The results of
our study and the above-mentioned issues suggest the need to
develop a standardized CTA acquisition protocol to optimize spot
sign detection in patients with ICH.
Some limitations of the present study should be mentioned.
First, this was a nonrandomized, single-center, prospective ob-
servational study with retrospective analysis of the data. In
addition, the number of patients in the LmA group was rela-
tively small. Therefore, it is best interpreted as hypothesis gen-
erating, and the findings need to be confirmed by future stud-
Table 2: Patient characteristics stratified by tube currentCharacteristic LmA HmA P Value
No. of patients 288 421Age, median (IQR) (y) 74 (62–82) 73 (62–82) .904Sex, male (n) (%) 163 (56.6) 233 (55.3) .741History of hypertension (n) (%) 219 (76.0) 334 (79.3) .299Antiplatelet treatment (n) (%) 123 (42.7) 191 (45.4) .484Anticoagulant treatment (n) (%) 49 (17.0) 83 (19.7) .364Admission INR (median) (IQR) 1.03 (1.00–1.20) 1.10 (1.00–1.20) .331ICH location .227
Lobar 130 (45.1) 216 (51.3)Deep 128 (44.4) 171 (40.6)Infratentorial 30 (10.4) 34 (8.1)
IVH presence (n) (%) 138 (47.9) 174 (41.3) .083Baseline ICH volume (median)
(IQR) (mL)18 (6–46) 15 (6–36) .018
Baseline IVH volume (median)(IQR) (mL)
0 (0–7) 0 (0–3) .074
Time from symptom onset toCTA (median) (IQR) (h)
5 (3–10) 5 (3–10) .342
CTA spot sign presence (n) (%) 60 (20.8) 62 (14.7) .034ICH expansion (n) (%) 53 (18.4) 68 (16.2) .434CTDIvol (mean � SD) (mGy) 43.3 � 8.9 71.4 � 9.8 �.001DLP (mean � SD) (mGy � cm) 1258.3 � 618.3 2342.1 � 864.7 �.001
Note:—CTDIvol indicates volume CT dose index; DLP, dose-length product; INR, international normalized ratio; IQR,interquartile range; IVH, intraventricular hemorrhage.
Table 3: Spot sign prediction of hematoma expansiona
Variable LmA HmA P ValueNo. of patients 288 421Sensitivity (95% CI) 0.45 (0.32–0.59) 0.45 (0.34–0.58) .973Specificity (95% CI) 0.84 (0.79–0.89) 0.91 (0.88–0.94) .015Positive predictive value (95% CI) 0.40 (0.28–0.53) 0.50 (0.37–0.63) .267Negative predictive value (95% CI) 0.87 (0.82–0.91) 0.90 (0.86–0.93) .367Accuracy 0.77 0.84 .038
a Significant expansion was defined as �30 % or �6 mL increase from baseline hematoma volume.
1784 Morotti Oct 2016 www.ajnr.org
ies. Second, the most relevant change in our institution’s CTA
protocol was the introduction of 90-second-delayed CTA im-
ages. Such images are known to capture additional spot signs,29
and it may be that the influence of current on spot sign detec-
tion is different when such images are taken into account.
Third, image noise and quality were not objectively measured,
so we can only speculate that image graininess and increased
background noise are the mechanisms responsible for lower
accuracy observed in the LmA group. Fourth, CTA tube cur-
rent is not the only determinant of image quality, and other
factors not considered in this study, such as different scanner
models and contrast types, also may influence diagnostic accu-
racy. Finally, our study was designed to explore the possibility
that excessive lowering of tube current reduces the diagnostic
accuracy of spot sign rather than to define the optimal balance
between radiation exposure, image quality, and clinical out-
come. Therefore, we are not able to evaluate the clinical impact
of improving CTA specificity and accuracy.
CONCLUSIONSCTA acquisition protocol influences spot sign detection and
accuracy in predicting hematoma expansion. If confirmed, our
findings may have important implications for future studies
using the CTA spot sign to predict hematoma expansion. Fur-
ther investigations are needed to establish the optimal balance
between radiation delivery, image quality, and diagnostic
performance.
Disclosures: Andrea Morotti—RELATED: Grant: National Institute of NeurologicalDisorders and Stroke (5R01NS073344).* Anastasia Vashkevich—RELATED: Grant: Na-tional Institutes of Health.* Christopher Anderson—RELATED: Grant: National Insti-tute of Neurological Disorders and Stroke (K23 NS086873)*; UNRELATED: Grants/Grants Pending: National Institute of Neurological Disorders and Stroke (K23NS086873).* Anand Viswanathan—RELATED: Grant: National Institutes of Health(R01AG047975-02, K23 AG028726-05)*; UNRELATED: Consultancy: Roche Pharma-ceuticals (served on Data Safety Monitoring Board as a consultant). Jonathan Ro-sand—RELATED: Grant: National Institutes of Health*; UNRELATED: Grants/GrantsPending: National Institutes of Health.* Joshua Goldstein—RELATED: Grant: Na-tional Institute of Neurological Disorders and Stroke*; Support for Travel to Meet-ings for the Study or Other Purposes: National Institute of Neurological Disordersand Stroke*; UNRELATED: Consultancy: CSL Behring, Boehringer Ingelheim; Grants/Grants Pending: National Institute of Neurological Disorders and Stroke.* *Moneypaid to the institution.
REFERENCES1. Demchuk AM, Dowlatshahi D, Rodriguez-Luna D, et al. Prediction
of haematoma growth and outcome in patients with intracerebralhaemorrhage using the CT-angiography spot sign (PREDICT): aprospective observational study. Lancet Neurol 2012;11:307–14CrossRef Medline
2. Brouwers HB, Goldstein JN, Romero JM, et al. Clinical applicationsof the computed tomography angiography spot sign in acute intra-cerebral hemorrhage: a review. Stroke 2012;43:3427–32 CrossRefMedline
3. Havsteen I, Ovesen C, Christensen AF, et al. Showing no spot sign isa strong predictor of independent living after intracerebral haem-orrhage. Cerebrovasc Dis 2014;37:164 –70 CrossRef Medline
4. Huynh TJ, Demchuk AM, Dowlatshahi D, et al. Spot sign number isthe most important spot sign characteristic for predictinghematoma expansion using first-pass computed tomographyangiography: analysis from the PREDICT study. Stroke 2013;44:972–77 CrossRef Medline
5. Wada R, Aviv RI, Fox AJ, et al. CT angiography “spot sign” predictshematoma expansion in acute intracerebral hemorrhage. Stroke2007;38:1257– 62 CrossRef Medline
6. Romero JM, Brouwers HB, Lu J, et al. Prospective validation of thecomputed tomographic angiography spot sign score for intracere-bral hemorrhage. Stroke 2013;44:3097–102 CrossRef Medline
7. Goldstein JN, Fazen LE, Snider R, et al. Contrast extravasation on CTangiography predicts hematoma expansion in intracerebral hem-orrhage. Neurology 2007;68:889 –94 CrossRef Medline
8. Brenner DJ, Hall EJ. Computed tomography–an increasing sourceof radiation exposure. N Engl J Med 2007;357:2277– 84 CrossRefMedline
9. Mnyusiwalla A, Aviv RI, Symons SP. Radiation dose from multide-tector row CT imaging for acute stroke. Neuroradiology 2009;51:635– 40 CrossRef Medline
10. Cohnen M, Fischer H, Hamacher J, et al. CT of the head by use ofreduced current and kilovoltage: relationship between image qual-ity and dose reduction. AJNR Am J Neuroradiol 2000;21:1654 – 60Medline
11. Smith AB, Dillon WP, Gould R, et al. Radiation dose-reductionstrategies for neuroradiology CT protocols. AJNR Am J Neuroradiol2007;28:1628 –32 CrossRef Medline
12. Biffi A, Cortellini L, Nearnberg CM, et al. Body mass index andetiology of intracerebral hemorrhage. Stroke 2011;42:2526 –30CrossRef Medline
13. Brouwers HB, Chang Y, Falcone GJ, et al. Predicting hematoma ex-pansion after primary intracerebral hemorrhage. JAMA Neurol2014;71:158 – 64 CrossRef Medline
14. Delgado Almandoz JE, Yoo AJ, Stone MJ, et al. The spot sign score inprimary intracerebral hemorrhage identifies patients at highestrisk of in-hospital mortality and poor outcome among survivors.Stroke 2010;41:54 – 60 CrossRef Medline
15. Delgado Almandoz JE, Kelly HR, Schaefer PW, et al. CT angiographyspot sign predicts in-hospital mortality in patients with secondaryintracerebral hemorrhage. J Neurointerv Surg 2012;4:442– 47CrossRef Medline
16. Delgado Almandoz JE, Yoo AJ, Stone MJ, et al. Systematic character-ization of the computed tomography angiography spot sign in pri-mary intracerebral hemorrhage identifies patients at highest riskfor hematoma expansion: the spot sign score. Stroke 2009;40:2994 –3000 CrossRef Medline
17. Li N, Wang Y, Wang W, et al. Contrast extravasation on computedtomography angiography predicts clinical outcome in primary in-tracerebral hemorrhage: a prospective study of 139 cases. Stroke2011;42:3441– 46 CrossRef Medline
18. Macellari F, Paciaroni M, Agnelli G, et al. Neuroimaging in intrace-rebral hemorrhage. Stroke 2014;45:903– 08 CrossRef Medline
19. Kumamaru KK, Hoppel BE, Mather RT, et al. CT angiography: cur-rent technology and clinical use. Radiol Clin North Am 2010;48:213–35 CrossRef Medline
20. Waaijer A, Prokop M, Velthuis BK, et al. Circle of Willis at CTangiography: dose reduction and image quality–reducing tubevoltage and increasing tube current settings. Radiology 2007;242:832–39 CrossRef Medline
21. Radmanesh F, Falcone GJ, Anderson CD, et al. Risk factors for com-puted tomography angiography spot sign in deep and lobar intra-cerebral hemorrhage are shared. Stroke 2014;45:1833–35 CrossRefMedline
22. Solomon JB, Li X, Samei E. Relating noise to image quality indica-tors in CT examinations with tube current modulation. AJR Am JRoentgenol 2013;200:592– 600 CrossRef Medline
23. Gupta R, Phan CM, Leidecker C, et al. Evaluation of dual-energy CTfor differentiating intracerebral hemorrhage from iodinatedcontrast material staining. Radiology 2010;257:205–11 CrossRefMedline
AJNR Am J Neuroradiol 37:1781– 86 Oct 2016 www.ajnr.org 1785

24. Won SY, Schlunk F, Dinkel J, et al. Imaging of contrast mediumextravasation in anticoagulation-associated intracerebral hemor-rhage with dual-energy computed tomography. Stroke 2013;44:2883–90 CrossRef Medline
25. Raman SP, Mahesh M, Blasko RV, et al. CT scan parameters andradiation dose: practical advice for radiologists. J Am Coll Radiol2013;10:840 – 46 CrossRef Medline
26. Khosravani H, Mayer SA, Demchuk A, et al. Emergency noninvasiveangiography for acute intracerebral hemorrhage. AJNR Am J Neu-roradiol 2013;34:1481– 87 CrossRef
27. Goldstein J, Brouwers H, Romero J, et al. SCORE-IT: the Spot Sign
score in restricting ICH growth—an Atach-II ancillary study. J VascInterv Neurol 2012;5:20 –25
28. Meretoja A, Churilov L, Campbell BC, et al. The spot sign andtranexamic acid on preventing ICH growth–AUStralasia Trial(STOP-AUST): protocol of a phase II randomized, placebo-con-trolled, double-blind, multicenter trial. Int J Stroke 2014;9:519 –24CrossRef Medline
29. Ciura VA., Brouwers HB, Pizzolato R, et al. Spot sign on 90-seconddelayed computed tomography angiography improves sensitivityfor hematoma expansion and mortality: prospective study. Stroke2014;45:3293–97 CrossRef Medline
1786 Morotti Oct 2016 www.ajnr.org
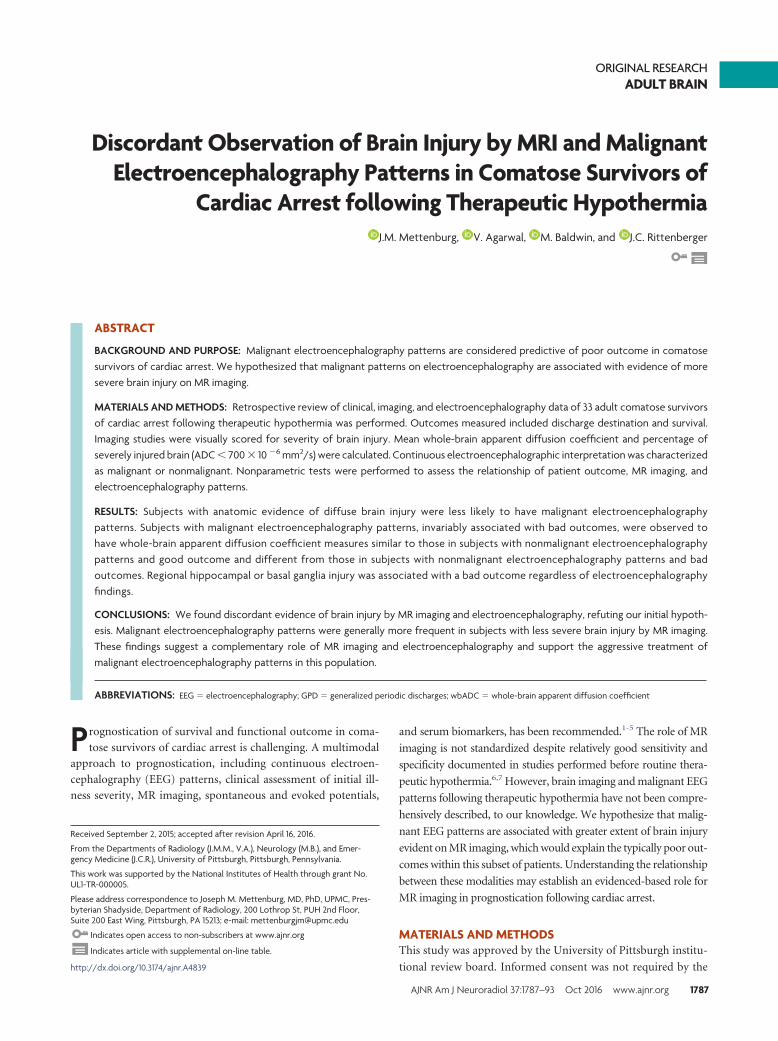
ORIGINAL RESEARCHADULT BRAIN
Discordant Observation of Brain Injury by MRI and MalignantElectroencephalography Patterns in Comatose Survivors of
Cardiac Arrest following Therapeutic HypothermiaX J.M. Mettenburg, X V. Agarwal, X M. Baldwin, and X J.C. Rittenberger
ABSTRACT
BACKGROUND AND PURPOSE: Malignant electroencephalography patterns are considered predictive of poor outcome in comatosesurvivors of cardiac arrest. We hypothesized that malignant patterns on electroencephalography are associated with evidence of moresevere brain injury on MR imaging.
MATERIALS AND METHODS: Retrospective review of clinical, imaging, and electroencephalography data of 33 adult comatose survivorsof cardiac arrest following therapeutic hypothermia was performed. Outcomes measured included discharge destination and survival.Imaging studies were visually scored for severity of brain injury. Mean whole-brain apparent diffusion coefficient and percentage ofseverely injured brain (ADC � 700 � 10 �6 mm2/s) were calculated. Continuous electroencephalographic interpretation was characterizedas malignant or nonmalignant. Nonparametric tests were performed to assess the relationship of patient outcome, MR imaging, andelectroencephalography patterns.
RESULTS: Subjects with anatomic evidence of diffuse brain injury were less likely to have malignant electroencephalographypatterns. Subjects with malignant electroencephalography patterns, invariably associated with bad outcomes, were observed tohave whole-brain apparent diffusion coefficient measures similar to those in subjects with nonmalignant electroencephalographypatterns and good outcome and different from those in subjects with nonmalignant electroencephalography patterns and badoutcomes. Regional hippocampal or basal ganglia injury was associated with a bad outcome regardless of electroencephalographyfindings.
CONCLUSIONS: We found discordant evidence of brain injury by MR imaging and electroencephalography, refuting our initial hypoth-esis. Malignant electroencephalography patterns were generally more frequent in subjects with less severe brain injury by MR imaging.These findings suggest a complementary role of MR imaging and electroencephalography and support the aggressive treatment ofmalignant electroencephalography patterns in this population.
ABBREVIATIONS: EEG � electroencephalography; GPD � generalized periodic discharges; wbADC � whole-brain apparent diffusion coefficient
Prognostication of survival and functional outcome in coma-
tose survivors of cardiac arrest is challenging. A multimodal
approach to prognostication, including continuous electroen-
cephalography (EEG) patterns, clinical assessment of initial ill-
ness severity, MR imaging, spontaneous and evoked potentials,
and serum biomarkers, has been recommended.1-5 The role of MR
imaging is not standardized despite relatively good sensitivity and
specificity documented in studies performed before routine thera-
peutic hypothermia.6,7 However, brain imaging and malignant EEG
patterns following therapeutic hypothermia have not been compre-
hensively described, to our knowledge. We hypothesize that malig-
nant EEG patterns are associated with greater extent of brain injury
evident on MR imaging, which would explain the typically poor out-
comes within this subset of patients. Understanding the relationship
between these modalities may establish an evidenced-based role for
MR imaging in prognostication following cardiac arrest.
MATERIALS AND METHODSThis study was approved by the University of Pittsburgh institu-
tional review board. Informed consent was not required by the
Received September 2, 2015; accepted after revision April 16, 2016.
From the Departments of Radiology (J.M.M., V.A.), Neurology (M.B.), and Emer-gency Medicine (J.C.R.), University of Pittsburgh, Pittsburgh, Pennsylvania.
This work was supported by the National Institutes of Health through grant No.UL1-TR-000005.
Please address correspondence to Joseph M. Mettenburg, MD, PhD, UPMC, Pres-byterian Shadyside, Department of Radiology, 200 Lothrop St, PUH 2nd Floor,Suite 200 East Wing, Pittsburgh, PA 15213; e-mail: [email protected]
Indicates open access to non-subscribers at www.ajnr.org
Indicates article with supplemental on-line table.
http://dx.doi.org/10.3174/ajnr.A4839
AJNR Am J Neuroradiol 37:1787–93 Oct 2016 www.ajnr.org 1787
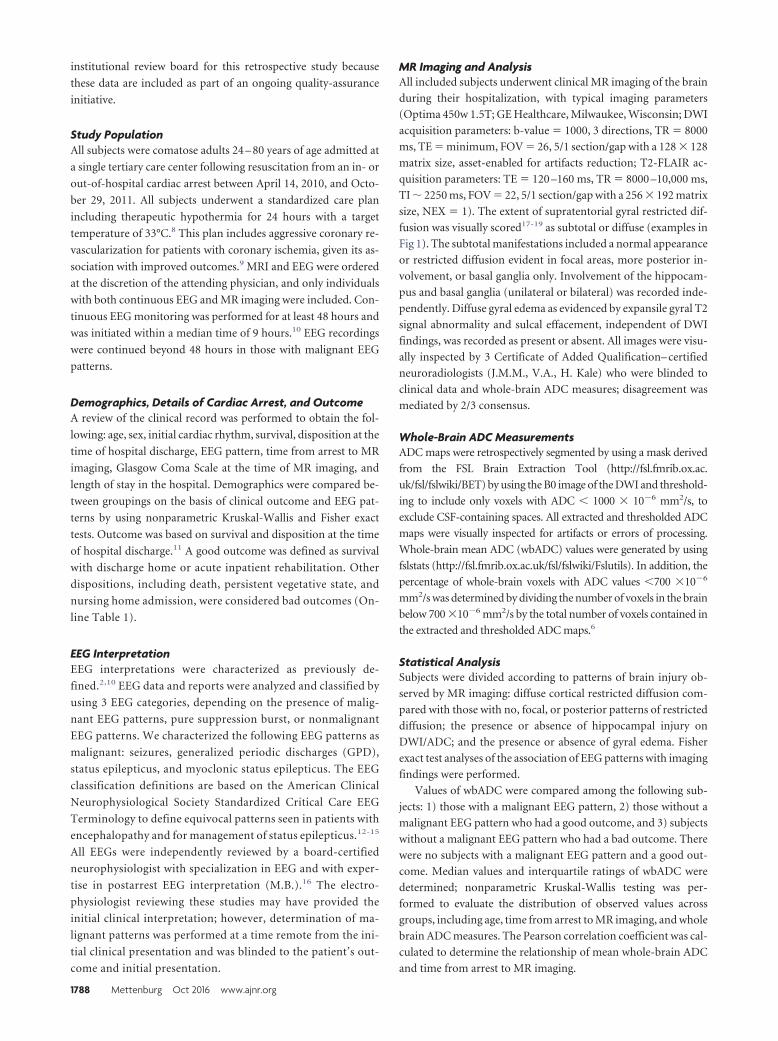
institutional review board for this retrospective study because
these data are included as part of an ongoing quality-assurance
initiative.
Study PopulationAll subjects were comatose adults 24 – 80 years of age admitted at
a single tertiary care center following resuscitation from an in- or
out-of-hospital cardiac arrest between April 14, 2010, and Octo-
ber 29, 2011. All subjects underwent a standardized care plan
including therapeutic hypothermia for 24 hours with a target
temperature of 33°C.8 This plan includes aggressive coronary re-
vascularization for patients with coronary ischemia, given its as-
sociation with improved outcomes.9 MRI and EEG were ordered
at the discretion of the attending physician, and only individuals
with both continuous EEG and MR imaging were included. Con-
tinuous EEG monitoring was performed for at least 48 hours and
was initiated within a median time of 9 hours.10 EEG recordings
were continued beyond 48 hours in those with malignant EEG
patterns.
Demographics, Details of Cardiac Arrest, and OutcomeA review of the clinical record was performed to obtain the fol-
lowing: age, sex, initial cardiac rhythm, survival, disposition at the
time of hospital discharge, EEG pattern, time from arrest to MR
imaging, Glasgow Coma Scale at the time of MR imaging, and
length of stay in the hospital. Demographics were compared be-
tween groupings on the basis of clinical outcome and EEG pat-
terns by using nonparametric Kruskal-Wallis and Fisher exact
tests. Outcome was based on survival and disposition at the time
of hospital discharge.11 A good outcome was defined as survival
with discharge home or acute inpatient rehabilitation. Other
dispositions, including death, persistent vegetative state, and
nursing home admission, were considered bad outcomes (On-
line Table 1).
EEG InterpretationEEG interpretations were characterized as previously de-
fined.2,10 EEG data and reports were analyzed and classified by
using 3 EEG categories, depending on the presence of malig-
nant EEG patterns, pure suppression burst, or nonmalignant
EEG patterns. We characterized the following EEG patterns as
malignant: seizures, generalized periodic discharges (GPD),
status epilepticus, and myoclonic status epilepticus. The EEG
classification definitions are based on the American Clinical
Neurophysiological Society Standardized Critical Care EEG
Terminology to define equivocal patterns seen in patients with
encephalopathy and for management of status epilepticus.12-15
All EEGs were independently reviewed by a board-certified
neurophysiologist with specialization in EEG and with exper-
tise in postarrest EEG interpretation (M.B.).16 The electro-
physiologist reviewing these studies may have provided the
initial clinical interpretation; however, determination of ma-
lignant patterns was performed at a time remote from the ini-
tial clinical presentation and was blinded to the patient’s out-
come and initial presentation.
MR Imaging and AnalysisAll included subjects underwent clinical MR imaging of the brain
during their hospitalization, with typical imaging parameters
(Optima 450w 1.5T; GE Healthcare, Milwaukee, Wisconsin; DWI
acquisition parameters: b-value � 1000, 3 directions, TR � 8000
ms, TE � minimum, FOV � 26, 5/1 section/gap with a 128 � 128
matrix size, asset-enabled for artifacts reduction; T2-FLAIR ac-
quisition parameters: TE � 120 –160 ms, TR � 8000 –10,000 ms,
TI � 2250 ms, FOV � 22, 5/1 section/gap with a 256 � 192 matrix
size, NEX � 1). The extent of supratentorial gyral restricted dif-
fusion was visually scored17-19 as subtotal or diffuse (examples in
Fig 1). The subtotal manifestations included a normal appearance
or restricted diffusion evident in focal areas, more posterior in-
volvement, or basal ganglia only. Involvement of the hippocam-
pus and basal ganglia (unilateral or bilateral) was recorded inde-
pendently. Diffuse gyral edema as evidenced by expansile gyral T2
signal abnormality and sulcal effacement, independent of DWI
findings, was recorded as present or absent. All images were visu-
ally inspected by 3 Certificate of Added Qualification– certified
neuroradiologists (J.M.M., V.A., H. Kale) who were blinded to
clinical data and whole-brain ADC measures; disagreement was
mediated by 2/3 consensus.
Whole-Brain ADC MeasurementsADC maps were retrospectively segmented by using a mask derived
from the FSL Brain Extraction Tool (http://fsl.fmrib.ox.ac.
uk/fsl/fslwiki/BET) by using the B0 image of the DWI and threshold-
ing to include only voxels with ADC � 1000 � 10�6 mm2/s, to
exclude CSF-containing spaces. All extracted and thresholded ADC
maps were visually inspected for artifacts or errors of processing.
Whole-brain mean ADC (wbADC) values were generated by using
fslstats (http://fsl.fmrib.ox.ac.uk/fsl/fslwiki/Fslutils). In addition, the
percentage of whole-brain voxels with ADC values �700 �10�6
mm2/s was determined by dividing the number of voxels in the brain
below 700 �10�6 mm2/s by the total number of voxels contained in
the extracted and thresholded ADC maps.6
Statistical AnalysisSubjects were divided according to patterns of brain injury ob-
served by MR imaging: diffuse cortical restricted diffusion com-
pared with those with no, focal, or posterior patterns of restricted
diffusion; the presence or absence of hippocampal injury on
DWI/ADC; and the presence or absence of gyral edema. Fisher
exact test analyses of the association of EEG patterns with imaging
findings were performed.
Values of wbADC were compared among the following sub-
jects: 1) those with a malignant EEG pattern, 2) those without a
malignant EEG pattern who had a good outcome, and 3) subjects
without a malignant EEG pattern who had a bad outcome. There
were no subjects with a malignant EEG pattern and a good out-
come. Median values and interquartile ratings of wbADC were
determined; nonparametric Kruskal-Wallis testing was per-
formed to evaluate the distribution of observed values across
groups, including age, time from arrest to MR imaging, and whole
brain ADC measures. The Pearson correlation coefficient was cal-
culated to determine the relationship of mean whole-brain ADC
and time from arrest to MR imaging.
1788 Mettenburg Oct 2016 www.ajnr.org
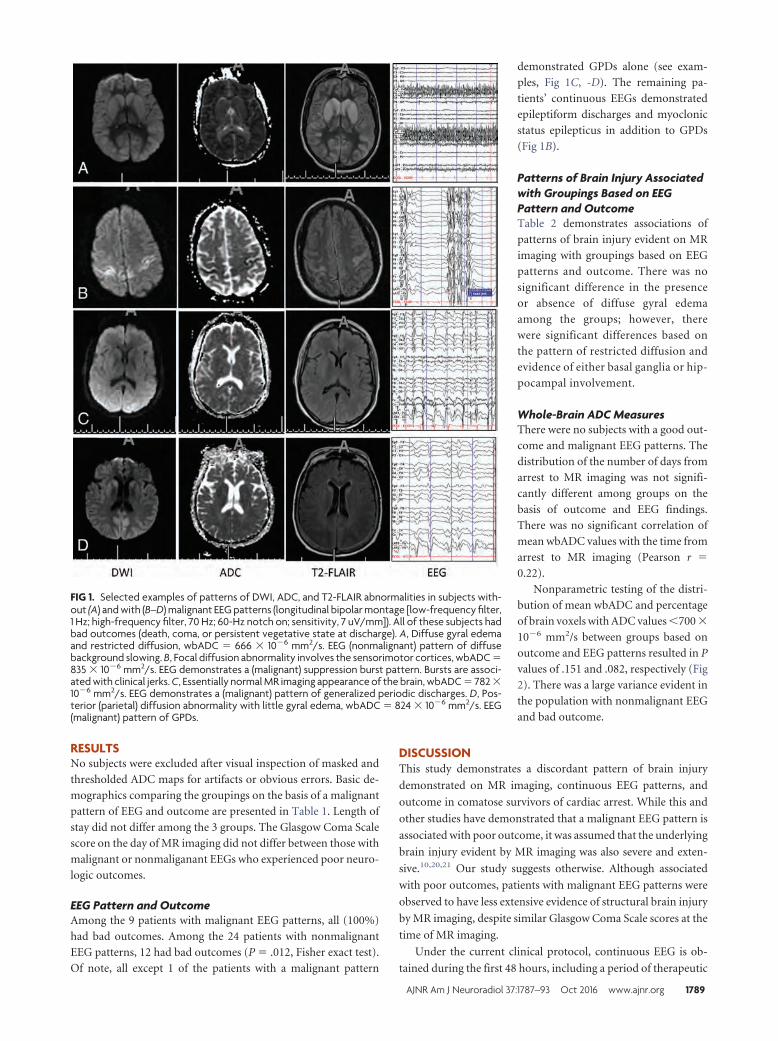
RESULTSNo subjects were excluded after visual inspection of masked and
thresholded ADC maps for artifacts or obvious errors. Basic de-
mographics comparing the groupings on the basis of a malignant
pattern of EEG and outcome are presented in Table 1. Length of
stay did not differ among the 3 groups. The Glasgow Coma Scale
score on the day of MR imaging did not differ between those with
malignant or nonmaliganant EEGs who experienced poor neuro-
logic outcomes.
EEG Pattern and OutcomeAmong the 9 patients with malignant EEG patterns, all (100%)
had bad outcomes. Among the 24 patients with nonmalignant
EEG patterns, 12 had bad outcomes (P � .012, Fisher exact test).
Of note, all except 1 of the patients with a malignant pattern
demonstrated GPDs alone (see exam-
ples, Fig 1C, -D). The remaining pa-
tients’ continuous EEGs demonstrated
epileptiform discharges and myoclonic
status epilepticus in addition to GPDs
(Fig 1B).
Patterns of Brain Injury Associatedwith Groupings Based on EEGPattern and OutcomeTable 2 demonstrates associations of
patterns of brain injury evident on MR
imaging with groupings based on EEG
patterns and outcome. There was no
significant difference in the presence
or absence of diffuse gyral edema
among the groups; however, there
were significant differences based on
the pattern of restricted diffusion and
evidence of either basal ganglia or hip-
pocampal involvement.
Whole-Brain ADC MeasuresThere were no subjects with a good out-
come and malignant EEG patterns. The
distribution of the number of days from
arrest to MR imaging was not signifi-
cantly different among groups on the
basis of outcome and EEG findings.
There was no significant correlation of
mean wbADC values with the time from
arrest to MR imaging (Pearson r �
0.22).
Nonparametric testing of the distri-
bution of mean wbADC and percentage
of brain voxels with ADC values �700 �
10�6 mm2/s between groups based on
outcome and EEG patterns resulted in P
values of .151 and .082, respectively (Fig
2). There was a large variance evident in
the population with nonmalignant EEG
and bad outcome.
DISCUSSIONThis study demonstrates a discordant pattern of brain injury
demonstrated on MR imaging, continuous EEG patterns, and
outcome in comatose survivors of cardiac arrest. While this and
other studies have demonstrated that a malignant EEG pattern is
associated with poor outcome, it was assumed that the underlying
brain injury evident by MR imaging was also severe and exten-
sive.10,20,21 Our study suggests otherwise. Although associated
with poor outcomes, patients with malignant EEG patterns were
observed to have less extensive evidence of structural brain injury
by MR imaging, despite similar Glasgow Coma Scale scores at the
time of MR imaging.
Under the current clinical protocol, continuous EEG is ob-
tained during the first 48 hours, including a period of therapeutic
FIG 1. Selected examples of patterns of DWI, ADC, and T2-FLAIR abnormalities in subjects with-out (A) and with (B–D) malignant EEG patterns (longitudinal bipolar montage [low-frequency filter,1 Hz; high-frequency filter, 70 Hz; 60-Hz notch on; sensitivity, 7 uV/mm]). All of these subjects hadbad outcomes (death, coma, or persistent vegetative state at discharge). A, Diffuse gyral edemaand restricted diffusion, wbADC � 666 � 10�6 mm2/s. EEG (nonmalignant) pattern of diffusebackground slowing. B, Focal diffusion abnormality involves the sensorimotor cortices, wbADC �835 � 10�6 mm2/s. EEG demonstrates a (malignant) suppression burst pattern. Bursts are associ-ated with clinical jerks. C, Essentially normal MR imaging appearance of the brain, wbADC � 782 �10�6 mm2/s. EEG demonstrates a (malignant) pattern of generalized periodic discharges. D, Pos-terior (parietal) diffusion abnormality with little gyral edema, wbADC � 824 � 10�6 mm2/s. EEG(malignant) pattern of GPDs.
AJNR Am J Neuroradiol 37:1787–93 Oct 2016 www.ajnr.org 1789
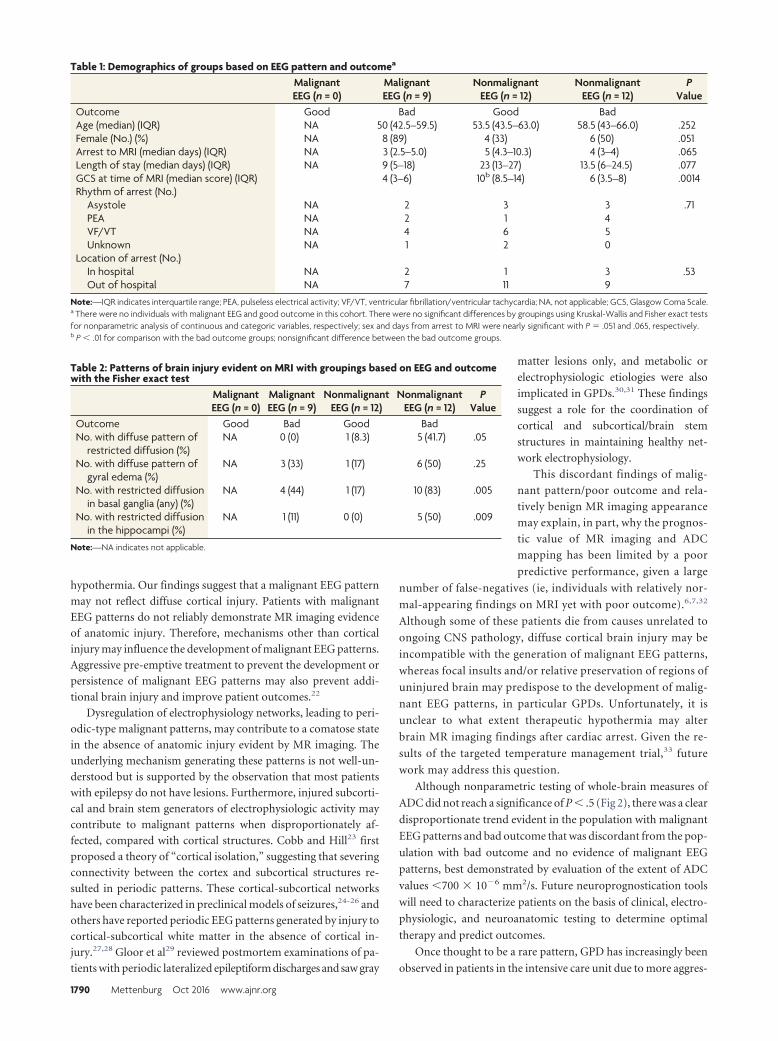
hypothermia. Our findings suggest that a malignant EEG pattern
may not reflect diffuse cortical injury. Patients with malignant
EEG patterns do not reliably demonstrate MR imaging evidence
of anatomic injury. Therefore, mechanisms other than cortical
injury may influence the development of malignant EEG patterns.
Aggressive pre-emptive treatment to prevent the development or
persistence of malignant EEG patterns may also prevent addi-
tional brain injury and improve patient outcomes.22
Dysregulation of electrophysiology networks, leading to peri-
odic-type malignant patterns, may contribute to a comatose state
in the absence of anatomic injury evident by MR imaging. The
underlying mechanism generating these patterns is not well-un-
derstood but is supported by the observation that most patients
with epilepsy do not have lesions. Furthermore, injured subcorti-
cal and brain stem generators of electrophysiologic activity may
contribute to malignant patterns when disproportionately af-
fected, compared with cortical structures. Cobb and Hill23 first
proposed a theory of “cortical isolation,” suggesting that severing
connectivity between the cortex and subcortical structures re-
sulted in periodic patterns. These cortical-subcortical networks
have been characterized in preclinical models of seizures,24-26 and
others have reported periodic EEG patterns generated by injury to
cortical-subcortical white matter in the absence of cortical in-
jury.27,28 Gloor et al29 reviewed postmortem examinations of pa-
tients with periodic lateralized epileptiform discharges and saw gray
matter lesions only, and metabolic or
electrophysiologic etiologies were also
implicated in GPDs.30,31 These findings
suggest a role for the coordination of
cortical and subcortical/brain stem
structures in maintaining healthy net-
work electrophysiology.
This discordant findings of malig-
nant pattern/poor outcome and rela-
tively benign MR imaging appearance
may explain, in part, why the prognos-
tic value of MR imaging and ADC
mapping has been limited by a poor
predictive performance, given a large
number of false-negatives (ie, individuals with relatively nor-
mal-appearing findings on MRI yet with poor outcome).6,7,32
Although some of these patients die from causes unrelated to
ongoing CNS pathology, diffuse cortical brain injury may be
incompatible with the generation of malignant EEG patterns,
whereas focal insults and/or relative preservation of regions of
uninjured brain may predispose to the development of malig-
nant EEG patterns, in particular GPDs. Unfortunately, it is
unclear to what extent therapeutic hypothermia may alter
brain MR imaging findings after cardiac arrest. Given the re-
sults of the targeted temperature management trial,33 future
work may address this question.
Although nonparametric testing of whole-brain measures of
ADC did not reach a significance of P � .5 (Fig 2), there was a clear
disproportionate trend evident in the population with malignant
EEG patterns and bad outcome that was discordant from the pop-
ulation with bad outcome and no evidence of malignant EEG
patterns, best demonstrated by evaluation of the extent of ADC
values �700 � 10�6 mm2/s. Future neuroprognostication tools
will need to characterize patients on the basis of clinical, electro-
physiologic, and neuroanatomic testing to determine optimal
therapy and predict outcomes.
Once thought to be a rare pattern, GPD has increasingly been
observed in patients in the intensive care unit due to more aggres-
Table 2: Patterns of brain injury evident on MRI with groupings based on EEG and outcomewith the Fisher exact test
MalignantEEG (n = 0)
MalignantEEG (n = 9)
NonmalignantEEG (n = 12)
NonmalignantEEG (n = 12)
PValue
Outcome Good Bad Good BadNo. with diffuse pattern of
restricted diffusion (%)NA 0 (0) 1 (8.3) 5 (41.7) .05
No. with diffuse pattern ofgyral edema (%)
NA 3 (33) 1 (17) 6 (50) .25
No. with restricted diffusionin basal ganglia (any) (%)
NA 4 (44) 1 (17) 10 (83) .005
No. with restricted diffusionin the hippocampi (%)
NA 1 (11) 0 (0) 5 (50) .009
Note:—NA indicates not applicable.
Table 1: Demographics of groups based on EEG pattern and outcomea
MalignantEEG (n = 0)
MalignantEEG (n = 9)
NonmalignantEEG (n = 12)
NonmalignantEEG (n = 12)
PValue
Outcome Good Bad Good BadAge (median) (IQR) NA 50 (42.5–59.5) 53.5 (43.5–63.0) 58.5 (43–66.0) .252Female (No.) (%) NA 8 (89) 4 (33) 6 (50) .051Arrest to MRI (median days) (IQR) NA 3 (2.5–5.0) 5 (4.3–10.3) 4 (3–4) .065Length of stay (median days) (IQR) NA 9 (5–18) 23 (13–27) 13.5 (6–24.5) .077GCS at time of MRI (median score) (IQR) 4 (3–6) 10b (8.5–14) 6 (3.5–8) .0014Rhythm of arrest (No.)
Asystole NA 2 3 3 .71PEA NA 2 1 4VF/VT NA 4 6 5Unknown NA 1 2 0
Location of arrest (No.)In hospital NA 2 1 3 .53Out of hospital NA 7 11 9
Note:—IQR indicates interquartile range; PEA, pulseless electrical activity; VF/VT, ventricular fibrillation/ventricular tachycardia; NA, not applicable; GCS, Glasgow Coma Scale.a There were no individuals with malignant EEG and good outcome in this cohort. There were no significant differences by groupings using Kruskal-Wallis and Fisher exact testsfor nonparametric analysis of continuous and categoric variables, respectively; sex and days from arrest to MRI were nearly significant with P � .051 and .065, respectively.b P � .01 for comparison with the bad outcome groups; nonsignificant difference between the bad outcome groups.
1790 Mettenburg Oct 2016 www.ajnr.org
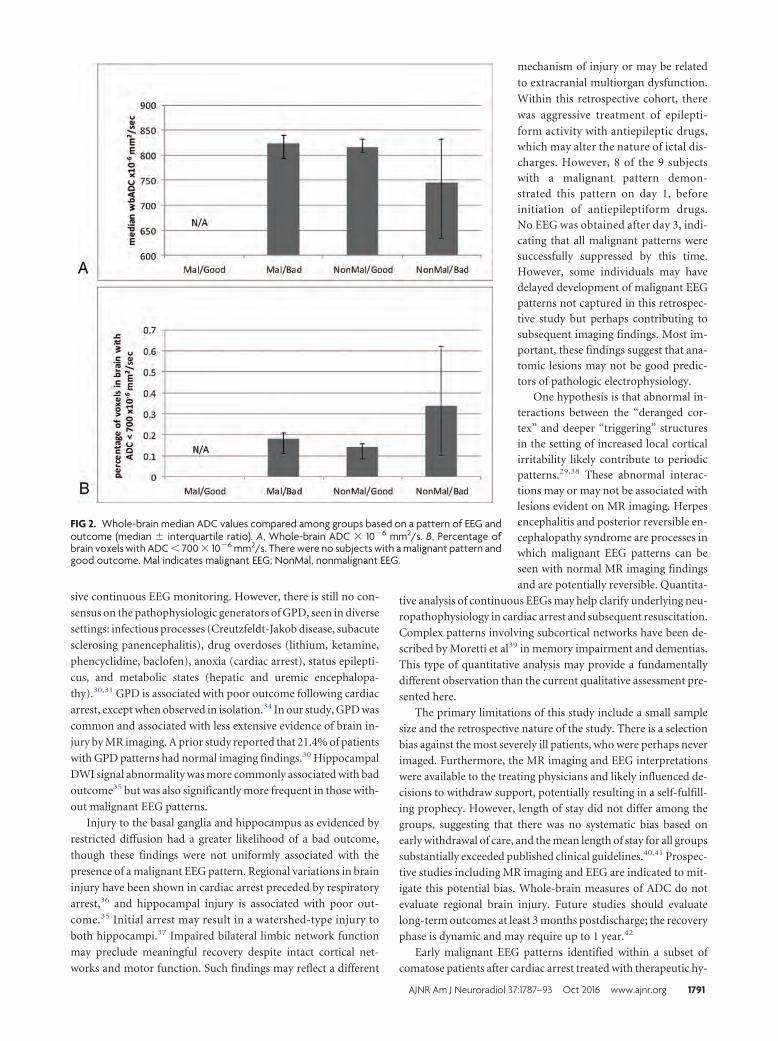
sive continuous EEG monitoring. However, there is still no con-
sensus on the pathophysiologic generators of GPD, seen in diverse
settings: infectious processes (Creutzfeldt-Jakob disease, subacute
sclerosing panencephalitis), drug overdoses (lithium, ketamine,
phencyclidine, baclofen), anoxia (cardiac arrest), status epilepti-
cus, and metabolic states (hepatic and uremic encephalopa-
thy).30,31 GPD is associated with poor outcome following cardiac
arrest, except when observed in isolation.34 In our study, GPD was
common and associated with less extensive evidence of brain in-
jury by MR imaging. A prior study reported that 21.4% of patients
with GPD patterns had normal imaging findings.30 Hippocampal
DWI signal abnormality was more commonly associated with bad
outcome35 but was also significantly more frequent in those with-
out malignant EEG patterns.
Injury to the basal ganglia and hippocampus as evidenced by
restricted diffusion had a greater likelihood of a bad outcome,
though these findings were not uniformly associated with the
presence of a malignant EEG pattern. Regional variations in brain
injury have been shown in cardiac arrest preceded by respiratory
arrest,36 and hippocampal injury is associated with poor out-
come.35 Initial arrest may result in a watershed-type injury to
both hippocampi.37 Impaired bilateral limbic network function
may preclude meaningful recovery despite intact cortical net-
works and motor function. Such findings may reflect a different
mechanism of injury or may be related
to extracranial multiorgan dysfunction.
Within this retrospective cohort, there
was aggressive treatment of epilepti-
form activity with antiepileptic drugs,which may alter the nature of ictal dis-charges. However, 8 of the 9 subjectswith a malignant pattern demon-strated this pattern on day 1, beforeinitiation of antiepileptiform drugs.No EEG was obtained after day 3, indi-cating that all malignant patterns weresuccessfully suppressed by this time.However, some individuals may havedelayed development of malignant EEGpatterns not captured in this retrospec-tive study but perhaps contributing tosubsequent imaging findings. Most im-portant, these findings suggest that ana-tomic lesions may not be good predic-tors of pathologic electrophysiology.
One hypothesis is that abnormal in-teractions between the “deranged cor-tex” and deeper “triggering” structuresin the setting of increased local corticalirritability likely contribute to periodicpatterns.29,38 These abnormal interac-tions may or may not be associated withlesions evident on MR imaging. Herpesencephalitis and posterior reversible en-cephalopathy syndrome are processes inwhich malignant EEG patterns can beseen with normal MR imaging findings
and are potentially reversible. Quantita-
tive analysis of continuous EEGs may help clarify underlying neu-
ropathophysiology in cardiac arrest and subsequent resuscitation.
Complex patterns involving subcortical networks have been de-
scribed by Moretti et al39 in memory impairment and dementias.
This type of quantitative analysis may provide a fundamentally
different observation than the current qualitative assessment pre-
sented here.
The primary limitations of this study include a small sample
size and the retrospective nature of the study. There is a selection
bias against the most severely ill patients, who were perhaps never
imaged. Furthermore, the MR imaging and EEG interpretations
were available to the treating physicians and likely influenced de-
cisions to withdraw support, potentially resulting in a self-fulfill-
ing prophecy. However, length of stay did not differ among the
groups, suggesting that there was no systematic bias based on
early withdrawal of care, and the mean length of stay for all groups
substantially exceeded published clinical guidelines.40,41 Prospec-
tive studies including MR imaging and EEG are indicated to mit-
igate this potential bias. Whole-brain measures of ADC do not
evaluate regional brain injury. Future studies should evaluate
long-term outcomes at least 3 months postdischarge; the recovery
phase is dynamic and may require up to 1 year.42
Early malignant EEG patterns identified within a subset of
comatose patients after cardiac arrest treated with therapeutic hy-
FIG 2. Whole-brain median ADC values compared among groups based on a pattern of EEG andoutcome (median � interquartile ratio). A, Whole-brain ADC � 10�6 mm2/s. B, Percentage ofbrain voxels with ADC � 700 � 10�6 mm2/s. There were no subjects with a malignant pattern andgood outcome. Mal indicates malignant EEG; NonMal, nonmalignant EEG.
AJNR Am J Neuroradiol 37:1787–93 Oct 2016 www.ajnr.org 1791
pothermia are not associated with more extensive evidence ofbrain injury on MR imaging. The prevalent recording of globalperiodic discharges in this cohort suggests a possible metabolic orreversible etiology for the periodic pattern, or intact cortex sal-vageable if further injury is prevented. Regional injury to hip-pocampal or basal ganglia structures may predict poor outcomeirrespective of EEG findings, potentially reflecting differentmechanisms of arrest. These findings demonstrate the impor-tance of considering both EEG and MR imaging data for comatosesurvivors of cardiac arrest and support aggressive treatment ofmalignant patterns.
CONCLUSIONSPatients with malignant EEG patterns were observed to have less
MR imaging evidence of brain injury yet remained associated with
poor outcome in this retrospective study. GPD, a pattern that was
previously considered rare, was the most common malignant pat-
tern observed. This electrophysiologic pattern may be more com-
mon in the posttherapeutic hypothermia era and may represent a
reversible injury. These findings demonstrate the importance of
integrating both EEG and MR imaging data when evaluating co-
matose survivors of cardiac arrest. Aggressive pre-emptive treat-
ment to prevent the development, persistence, or progression of
malignant EEG patterns may prevent additional brain injury and
improve patient outcomes.
ACKNOWLEDGMENTSWe are appreciative of the excellent clinical care and data collec-
tion by the Post Cardiac Arrest Service at the University of Pitts-
burgh Medical Center. Special thanks are extended to Dr Hri-
shikesh Kale for his contribution to the imaging analysis.
Disclosures: Jon M. Rittenberger—UNRELATED: Grants/Grants Pending: NationalInstitutes of Health funding, American Heart Association Grant-in-Aid, and LaerdalFoundation for Acute Medicine, Comments: grant support for other projects ger-mane to anoxic brain injury.
REFERENCES1. Bouwes A, Binnekade JM, Verbaan BW, et al. Predictive value of
neurological examination for early cortical responses to somato-sensory evoked potentials in patients with postanoxic coma. J Neu-rol 2012;259;537– 41 CrossRef Medline
2. Coppler PJ, Elmer J, Calderon L, et al; Post Cardiac Arrest Service.Validation of the Pittsburgh Cardiac Arrest Category illness sever-ity score. Resuscitation 2015;89:86 –92 CrossRef Medline
3. Levy DE, Caronna JJ, Singer BH, et al. Predicting outcome fromhypoxic-ischemic coma. JAMA 1985;253:1420 –26 Medline
4. Taccone F, Cronberg T, Friberg H, et al. How to assess prognosisafter cardiac arrest and therapeutic hypothermia. Crit Care 2014;18:202 CrossRef Medline
5. Young GB. Clinical practice: neurologic prognosis after cardiac ar-rest. N Engl J Med 2009;361:605–11 CrossRef Medline
6. Wijman CA, Mlynash M, Caulfield AF, et al. Prognostic value ofbrain diffusion-weighted imaging after cardiac arrest. Ann Neurol2009;65:394 – 402 CrossRef Medline
7. Choi SP, Park KN, Park HK, et al. Diffusion-weighted magnetic res-onance imaging for predicting the clinical outcome of comatosesurvivors after cardiac arrest: a cohort study. Crit Care 2010;14:R17CrossRef Medline
8. Rittenberger JC, Guyette FX, Tisherman SA, et al. Outcomes of ahospital-wide plan to improve care of comatose survivors of car-diac arrest. Resuscitation 2008;79:198 –204 CrossRef Medline
9. Reynolds JC, Callaway CW, El Khoudary SR, et al. Coronary angiog-raphy predicts improved outcome following cardiac arrest: pro-pensity-adjusted analysis. J Intensive Care Med 2009;24:179 – 86CrossRef Medline
10. Rittenberger JC, Popescu A, Brenner RP, et al. Frequency and timingof nonconvulsive status epilepticus in comatose post-cardiac arrestsubjects treated with hypothermia. Neurocrit Care 2012;16:114 –22CrossRef Medline
11. Rittenberger JC, Tisherman SA, Holm MB, et al. An early, novel ill-ness severity score to predict outcome after cardiac arrest. Resusci-tation 2011;82:1399 – 404 CrossRef Medline
12. Chong DJ, Hirsch LJ. Which EEG patterns warrant treatment in thecritically ill? Reviewing the evidence for treatment of periodic epi-leptiform discharges and related patterns. J Clin Neurophysiol 2005;22:79 –91 CrossRef Medline
13. Hirsch LJ, LaRoche SM, Gaspard N, et al. American Clinical Neuro-physiology Society’s Standardized Critical Care EEG Terminology:2012 version. J Clin Neurophysiol 2013;30:1–27 CrossRef Medline
14. Westhall E, Rosen I, Rossetti AO, et al. Interrater variability of EEGinterpretation in comatose cardiac arrest patients. Clin Neuro-physiol 2015;126:2397– 404 CrossRef Medline
15. Brophy GM, Bell R, Claassen J, et al; Neurocritical Care Society StatusEpilepticus Guideline Writing Committee. Guidelines for the evalu-ation and management of status epilepticus. Neurocrit Care 2012;17:3–23 CrossRef Medline
16. Amorim E, Rittenberger JC, Baldwin ME, et al; Post Cardiac ArrestService. Malignant EEG patterns in cardiac arrest patients treatedwith targeted temperature management who survive to hospitaldischarge. Resuscitation 2015;90:127–32 CrossRef Medline
17. Arbelaez A, Castillo M, Mukherji SK. Diffusion-weighted MR imag-ing of global cerebral anoxia. AJNR Am J Neuroradiol 1999;20:999 –1007 Medline
18. Wijdicks EF, Campeau NG, Miller GM. MR imaging in comatosesurvivors of cardiac resuscitation. AJNR Am J Neuroradiol 2001;22:1561– 65 Medline
19. Singhal AB, Topcuoglu MA, Koroshetz WJ. Diffusion MRI in threetypes of anoxic encephalopathy. J Neurol Sci 2002;196:37– 40Medline
20. Knight WA, Hart KW, Adeoye OM, et al. The incidence of seizures inpatients undergoing therapeutic hypothermia after resuscitationfrom cardiac arrest. Epilepsy Res 2013;106:396 – 402 CrossRefMedline
21. Sadaka F, Doerr D, Hindia J, et al. Continuous electroencephalo-gram in comatose postcardiac arrest syndrome patients treatedwith therapeutic hypothermia: outcome prediction study. J Inten-sive Care Med 2015;30:292–96 CrossRef Medline
22. Brain Resuscitation Clinical Trial I Study Group. Randomized clini-cal study of thiopental loading in comatose survivors of cardiacarrest. N Engl J Med 1986;314:397– 403 CrossRef Medline
23. Cobb W, Hill D. Electroencephalogram in subacute progressive en-cephalitis. Brain 1950;73:392– 404 CrossRef Medline
24. Avoli M, Kostopoulos G. Participation of corticothalamic cells inpenicillin-induced generalized spike and wave discharges. Brain Res1982;247:159 – 63 CrossRef Medline
25. Gioanni Y, Gioanni H, Mitrovic N. Seizures can be triggered by stim-ulating non-cortical structures in the quaking mutant mouse. Epi-lepsy Res 1991;9:19 –31 Medline
26. Gloor P. Generalized epilepsy with bilateral synchronous spike andwave discharge: new findings concerning its physiological mecha-nisms. Electroencephalogr Clin Neurophysiol Suppl 1978;(34):245– 49Medline
27. Vercueil L, Hirsch E. Seizures and the basal ganglia: a review of theclinical data. Epileptic Disord 2002;4(suppl 3):S47–54 Medline
28. Badawy RA, Lai A, Vogrin SJ, et al. Subcortical epilepsy? Neurology2013;80:1901– 07 Medline
29. Gloor P, Kalabay O, Giard N. The electroencephalogram in diffuseencephalopathies: electroencephalographic correlates of grey andwhite matter lesions. Brain 1968;91:779 – 802 CrossRef
1792 Mettenburg Oct 2016 www.ajnr.org
30. Yemisci M, Gurer G, Saygi S, et al. Generalised periodic epileptiformdischarges: clinical features, neuroradiological evaluation and prog-nosis in 37 adult patients. Seizure 2003;12:465–72 CrossRef Medline
31. Janati A, Chesser MZ, Husain MM. Periodic lateralized epileptiformdischarges (PLEDs): a possible role for metabolic factors in patho-genesis. Clin Electroencephalogr 1986;17:36 – 43 Medline
32. Greer D, Scripko P, Bartscher J, et al. Clinical MRI interpretation foroutcome prediction in cardiac arrest. Neurocrit Care 2012;17:240 – 44 CrossRef Medline
33. Nielsen N, Wetterslev J, Cronberg T, et al; TTM Trial Investigators.Targeted temperature management at 33°C versus 36°C after car-diac arrest. N Engl J Med 2013;369:2197–206 CrossRef Medline
34. Foreman B, Claassen J, Abou Khaled K, et al. Generalized periodicdischarges in the critically ill: a case-control study of 200 patients.Neurology 2012;79:1951– 60 CrossRef Medline
35. Greer DM, Scripko PD, Wu O, et al. Hippocampal magnetic reso-nance imaging abnormalities in cardiac arrest are associated withpoor outcome. J Stroke Cerebrovasc Dis 2013;22:899 –905 CrossRefMedline
36. Drabek T, Foley LM, Janata A, et al. Global and regional differencesin cerebral blood flow after asphyxial versus ventricular fibrillationcardiac arrest in rats using ASL-MRI. Resuscitation 2014;85:964 –71CrossRef Medline
37. Walha K, Ricolfi F, Bejot Y, et al. Hippocampus: a “forgotten” bor-der zone of brain ischemia. J Neuroimaging 2013;23:98 –101CrossRef Medline
38. Brenner RP, Schaul N. Periodic EEG patterns: classification, clinicalcorrelation, and pathophysiology. J Clin Neurophysiol 1990;7:249 – 67 CrossRef Medline
39. Moretti DV, Paternico D, Binetti G, et al. Analysis of grey matter inthalamus and basal ganglia based on EEG �3/�2 frequency ratioreveals specific changes in subjects with mild cognitive impair-ment. ASN Neuro 2012;4:e00103 CrossRef Medline
40. Callaway CW, Donnino MW, Fink EL, et al. Part 8: Post-CardiacArrest Care—2015 American Heart Association Guidelines Updatefor Cardiopulmonary Resuscitation and Emergency Cardiovascu-lar Care. Circulation 2015;132:S465– 82 CrossRef Medline
41. Peberdy MA, Callaway CW, Neumar RW, et al; American Heart As-sociation. Part 9: Post-Cardiac Arrest Care—2010 American HeartAssociation Guidelines for Cardiopulmonary Resuscitation andEmergency Cardiovascular Care. Circulation 2010;122:S768 – 86CrossRef Medline
42. Raina KD, Rittenberger JC, Holm MB, et al. Functional outcomes:one year after a cardiac arrest. Biomed Res Int 2015;2015:283608CrossRef Medline
AJNR Am J Neuroradiol 37:1787–93 Oct 2016 www.ajnr.org 1793
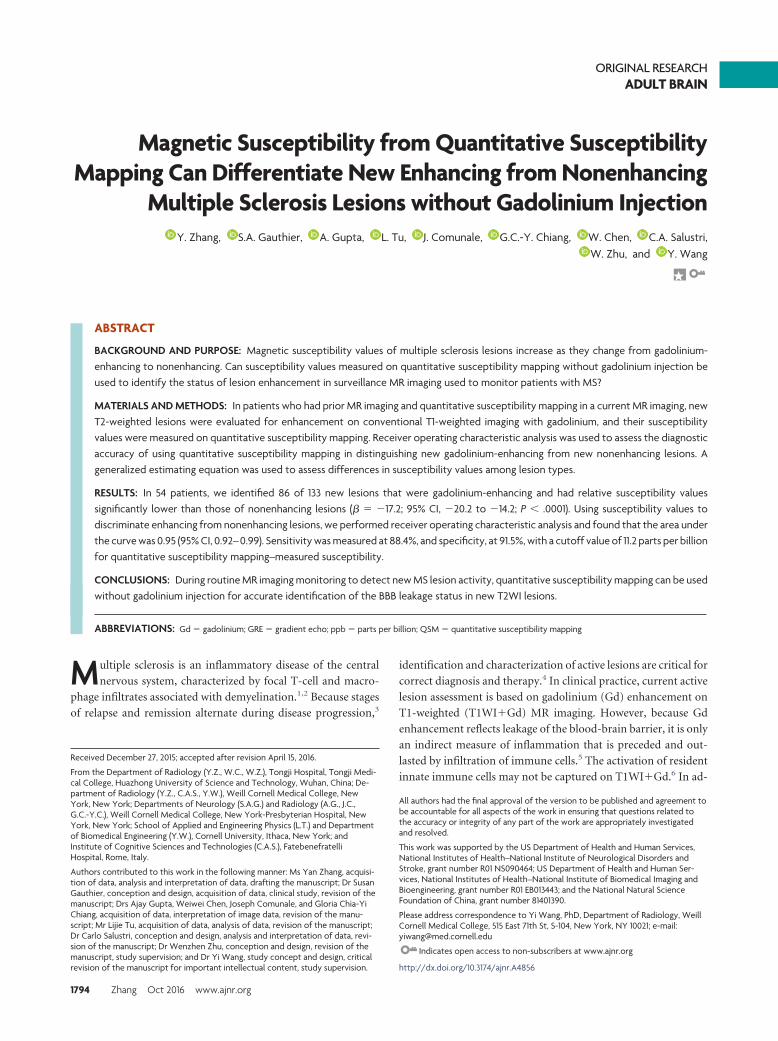
ORIGINAL RESEARCHADULT BRAIN
Magnetic Susceptibility from Quantitative SusceptibilityMapping Can Differentiate New Enhancing from Nonenhancing
Multiple Sclerosis Lesions without Gadolinium InjectionX Y. Zhang, X S.A. Gauthier, X A. Gupta, X L. Tu, X J. Comunale, X G.C.-Y. Chiang, X W. Chen, X C.A. Salustri,
X W. Zhu, and X Y. Wang
ABSTRACT
BACKGROUND AND PURPOSE: Magnetic susceptibility values of multiple sclerosis lesions increase as they change from gadolinium-enhancing to nonenhancing. Can susceptibility values measured on quantitative susceptibility mapping without gadolinium injection beused to identify the status of lesion enhancement in surveillance MR imaging used to monitor patients with MS?
MATERIALS AND METHODS: In patients who had prior MR imaging and quantitative susceptibility mapping in a current MR imaging, newT2-weighted lesions were evaluated for enhancement on conventional T1-weighted imaging with gadolinium, and their susceptibilityvalues were measured on quantitative susceptibility mapping. Receiver operating characteristic analysis was used to assess the diagnosticaccuracy of using quantitative susceptibility mapping in distinguishing new gadolinium-enhancing from new nonenhancing lesions. Ageneralized estimating equation was used to assess differences in susceptibility values among lesion types.
RESULTS: In 54 patients, we identified 86 of 133 new lesions that were gadolinium-enhancing and had relative susceptibility valuessignificantly lower than those of nonenhancing lesions (� � �17.2; 95% CI, �20.2 to �14.2; P � .0001). Using susceptibility values todiscriminate enhancing from nonenhancing lesions, we performed receiver operating characteristic analysis and found that the area underthe curve was 0.95 (95% CI, 0.92– 0.99). Sensitivity was measured at 88.4%, and specificity, at 91.5%, with a cutoff value of 11.2 parts per billionfor quantitative susceptibility mapping–measured susceptibility.
CONCLUSIONS: During routine MR imaging monitoring to detect new MS lesion activity, quantitative susceptibility mapping can be usedwithout gadolinium injection for accurate identification of the BBB leakage status in new T2WI lesions.
ABBREVIATIONS: Gd � gadolinium; GRE � gradient echo; ppb � parts per billion; QSM � quantitative susceptibility mapping
Multiple sclerosis is an inflammatory disease of the central
nervous system, characterized by focal T-cell and macro-
phage infiltrates associated with demyelination.1,2 Because stages
of relapse and remission alternate during disease progression,3
identification and characterization of active lesions are critical for
correct diagnosis and therapy.4 In clinical practice, current active
lesion assessment is based on gadolinium (Gd) enhancement on
T1-weighted (T1WI�Gd) MR imaging. However, because Gd
enhancement reflects leakage of the blood-brain barrier, it is only
an indirect measure of inflammation that is preceded and out-
lasted by infiltration of immune cells.5 The activation of resident
innate immune cells may not be captured on T1WI�Gd.6 In ad-
Received December 27, 2015; accepted after revision April 15, 2016.
From the Department of Radiology (Y.Z., W.C., W.Z.), Tongji Hospital, Tongji Medi-cal College, Huazhong University of Science and Technology, Wuhan, China; De-partment of Radiology (Y.Z., C.A.S., Y.W.), Weill Cornell Medical College, NewYork, New York; Departments of Neurology (S.A.G.) and Radiology (A.G., J.C.,G.C.-Y.C.), Weill Cornell Medical College, New York-Presbyterian Hospital, NewYork, New York; School of Applied and Engineering Physics (L.T.) and Departmentof Biomedical Engineering (Y.W.), Cornell University, Ithaca, New York; andInstitute of Cognitive Sciences and Technologies (C.A.S.), FatebenefratelliHospital, Rome, Italy.
Authors contributed to this work in the following manner: Ms Yan Zhang, acquisi-tion of data, analysis and interpretation of data, drafting the manuscript; Dr SusanGauthier, conception and design, acquisition of data, clinical study, revision of themanuscript; Drs Ajay Gupta, Weiwei Chen, Joseph Comunale, and Gloria Chia-YiChiang, acquisition of data, interpretation of image data, revision of the manu-script; Mr Lijie Tu, acquisition of data, analysis of data, revision of the manuscript;Dr Carlo Salustri, conception and design, analysis and interpretation of data, revi-sion of the manuscript; Dr Wenzhen Zhu, conception and design, revision of themanuscript, study supervision; and Dr Yi Wang, study concept and design, criticalrevision of the manuscript for important intellectual content, study supervision.
All authors had the final approval of the version to be published and agreement tobe accountable for all aspects of the work in ensuring that questions related tothe accuracy or integrity of any part of the work are appropriately investigatedand resolved.
This work was supported by the US Department of Health and Human Services,National Institutes of Health–National Institute of Neurological Disorders andStroke, grant number R01 NS090464; US Department of Health and Human Ser-vices, National Institutes of Health–National Institute of Biomedical Imaging andBioengineering, grant number R01 EB013443; and the National Natural ScienceFoundation of China, grant number 81401390.
Please address correspondence to Yi Wang, PhD, Department of Radiology, WeillCornell Medical College, 515 East 71th St, S-104, New York, NY 10021; e-mail:[email protected]
Indicates open access to non-subscribers at www.ajnr.org
http://dx.doi.org/10.3174/ajnr.A4856
1794 Zhang Oct 2016 www.ajnr.org
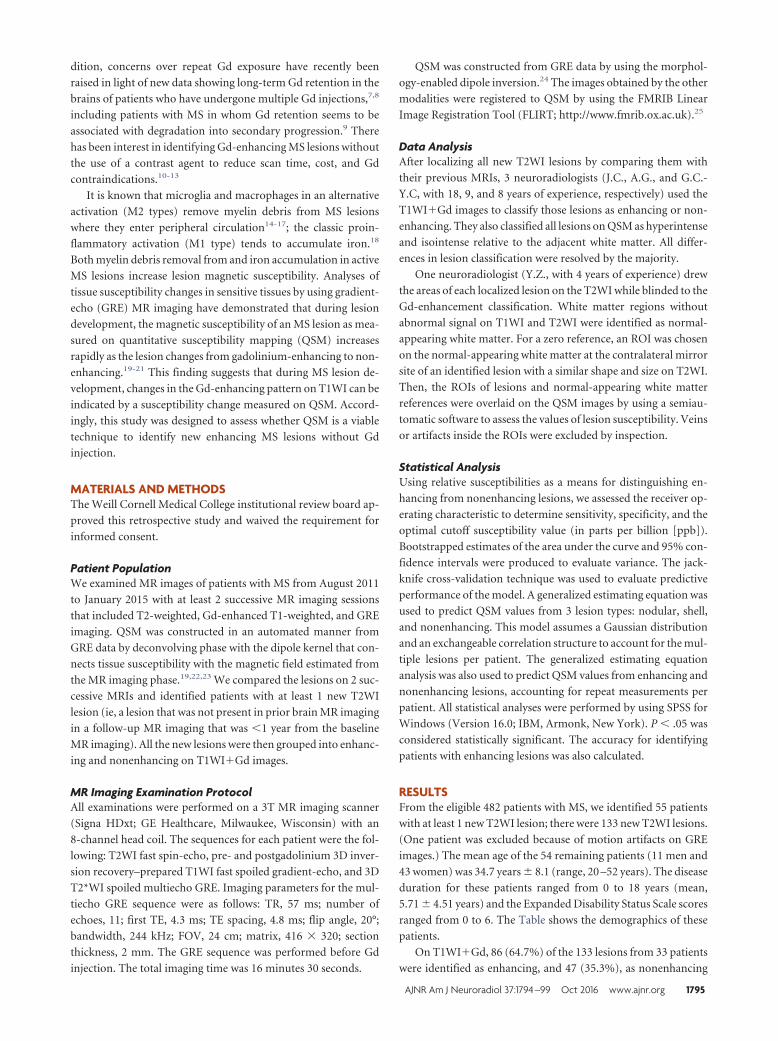
dition, concerns over repeat Gd exposure have recently been
raised in light of new data showing long-term Gd retention in the
brains of patients who have undergone multiple Gd injections,7,8
including patients with MS in whom Gd retention seems to be
associated with degradation into secondary progression.9 There
has been interest in identifying Gd-enhancing MS lesions without
the use of a contrast agent to reduce scan time, cost, and Gd
contraindications.10-13
It is known that microglia and macrophages in an alternative
activation (M2 types) remove myelin debris from MS lesions
where they enter peripheral circulation14-17; the classic proin-
flammatory activation (M1 type) tends to accumulate iron.18
Both myelin debris removal from and iron accumulation in active
MS lesions increase lesion magnetic susceptibility. Analyses of
tissue susceptibility changes in sensitive tissues by using gradient-
echo (GRE) MR imaging have demonstrated that during lesion
development, the magnetic susceptibility of an MS lesion as mea-
sured on quantitative susceptibility mapping (QSM) increases
rapidly as the lesion changes from gadolinium-enhancing to non-
enhancing.19-21 This finding suggests that during MS lesion de-
velopment, changes in the Gd-enhancing pattern on T1WI can be
indicated by a susceptibility change measured on QSM. Accord-
ingly, this study was designed to assess whether QSM is a viable
technique to identify new enhancing MS lesions without Gd
injection.
MATERIALS AND METHODSThe Weill Cornell Medical College institutional review board ap-
proved this retrospective study and waived the requirement for
informed consent.
Patient PopulationWe examined MR images of patients with MS from August 2011
to January 2015 with at least 2 successive MR imaging sessions
that included T2-weighted, Gd-enhanced T1-weighted, and GRE
imaging. QSM was constructed in an automated manner from
GRE data by deconvolving phase with the dipole kernel that con-
nects tissue susceptibility with the magnetic field estimated from
the MR imaging phase.19,22,23 We compared the lesions on 2 suc-
cessive MRIs and identified patients with at least 1 new T2WI
lesion (ie, a lesion that was not present in prior brain MR imaging
in a follow-up MR imaging that was �1 year from the baseline
MR imaging). All the new lesions were then grouped into enhanc-
ing and nonenhancing on T1WI�Gd images.
MR Imaging Examination ProtocolAll examinations were performed on a 3T MR imaging scanner
(Signa HDxt; GE Healthcare, Milwaukee, Wisconsin) with an
8-channel head coil. The sequences for each patient were the fol-
lowing: T2WI fast spin-echo, pre- and postgadolinium 3D inver-
sion recovery–prepared T1WI fast spoiled gradient-echo, and 3D
T2*WI spoiled multiecho GRE. Imaging parameters for the mul-
tiecho GRE sequence were as follows: TR, 57 ms; number of
echoes, 11; first TE, 4.3 ms; TE spacing, 4.8 ms; flip angle, 20°;
bandwidth, 244 kHz; FOV, 24 cm; matrix, 416 � 320; section
thickness, 2 mm. The GRE sequence was performed before Gd
injection. The total imaging time was 16 minutes 30 seconds.
QSM was constructed from GRE data by using the morphol-
ogy-enabled dipole inversion.24 The images obtained by the other
modalities were registered to QSM by using the FMRIB Linear
Image Registration Tool (FLIRT; http://www.fmrib.ox.ac.uk).25
Data AnalysisAfter localizing all new T2WI lesions by comparing them with
their previous MRIs, 3 neuroradiologists (J.C., A.G., and G.C.-
Y.C, with 18, 9, and 8 years of experience, respectively) used the
T1WI�Gd images to classify those lesions as enhancing or non-
enhancing. They also classified all lesions on QSM as hyperintense
and isointense relative to the adjacent white matter. All differ-
ences in lesion classification were resolved by the majority.
One neuroradiologist (Y.Z., with 4 years of experience) drew
the areas of each localized lesion on the T2WI while blinded to the
Gd-enhancement classification. White matter regions without
abnormal signal on T1WI and T2WI were identified as normal-
appearing white matter. For a zero reference, an ROI was chosen
on the normal-appearing white matter at the contralateral mirror
site of an identified lesion with a similar shape and size on T2WI.
Then, the ROIs of lesions and normal-appearing white matter
references were overlaid on the QSM images by using a semiau-
tomatic software to assess the values of lesion susceptibility. Veins
or artifacts inside the ROIs were excluded by inspection.
Statistical AnalysisUsing relative susceptibilities as a means for distinguishing en-
hancing from nonenhancing lesions, we assessed the receiver op-
erating characteristic to determine sensitivity, specificity, and the
optimal cutoff susceptibility value (in parts per billion [ppb]).
Bootstrapped estimates of the area under the curve and 95% con-
fidence intervals were produced to evaluate variance. The jack-
knife cross-validation technique was used to evaluate predictive
performance of the model. A generalized estimating equation was
used to predict QSM values from 3 lesion types: nodular, shell,
and nonenhancing. This model assumes a Gaussian distribution
and an exchangeable correlation structure to account for the mul-
tiple lesions per patient. The generalized estimating equation
analysis was also used to predict QSM values from enhancing and
nonenhancing lesions, accounting for repeat measurements per
patient. All statistical analyses were performed by using SPSS for
Windows (Version 16.0; IBM, Armonk, New York). P � .05 was
considered statistically significant. The accuracy for identifying
patients with enhancing lesions was also calculated.
RESULTSFrom the eligible 482 patients with MS, we identified 55 patients
with at least 1 new T2WI lesion; there were 133 new T2WI lesions.
(One patient was excluded because of motion artifacts on GRE
images.) The mean age of the 54 remaining patients (11 men and
43 women) was 34.7 years � 8.1 (range, 20 –52 years). The disease
duration for these patients ranged from 0 to 18 years (mean,
5.71 � 4.51 years) and the Expanded Disability Status Scale scores
ranged from 0 to 6. The Table shows the demographics of these
patients.
On T1WI�Gd, 86 (64.7%) of the 133 lesions from 33 patients
were identified as enhancing, and 47 (35.3%), as nonenhancing
AJNR Am J Neuroradiol 37:1794 –99 Oct 2016 www.ajnr.org 1795
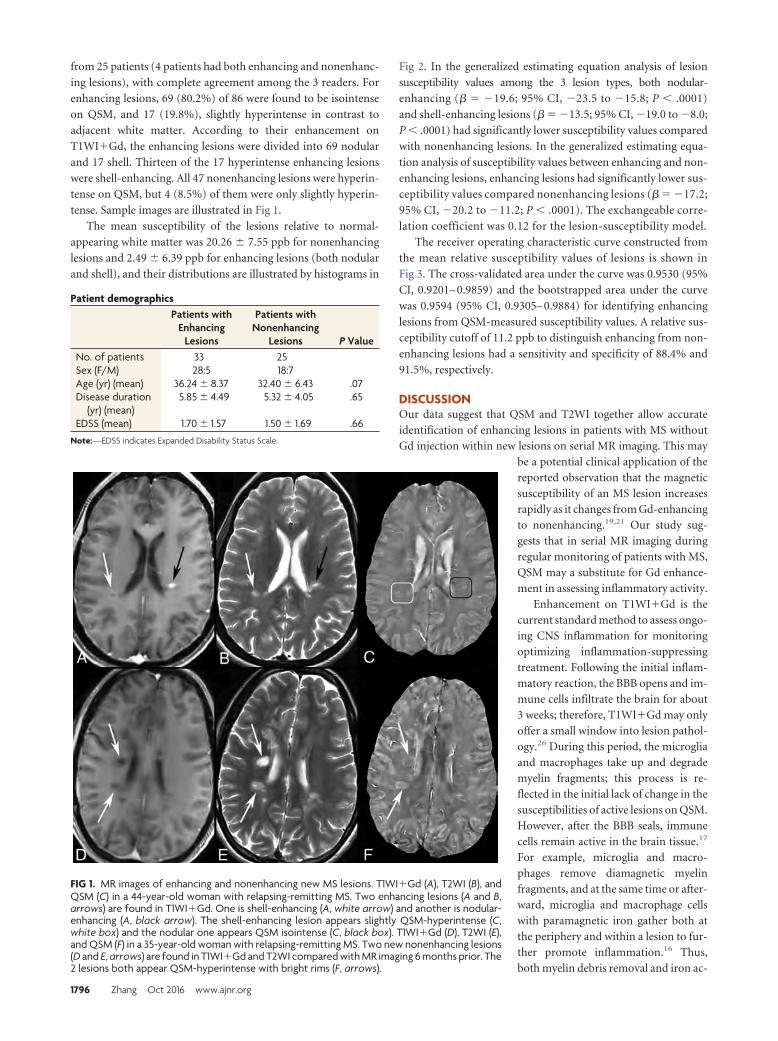
from 25 patients (4 patients had both enhancing and nonenhanc-
ing lesions), with complete agreement among the 3 readers. For
enhancing lesions, 69 (80.2%) of 86 were found to be isointense
on QSM, and 17 (19.8%), slightly hyperintense in contrast to
adjacent white matter. According to their enhancement on
T1WI�Gd, the enhancing lesions were divided into 69 nodular
and 17 shell. Thirteen of the 17 hyperintense enhancing lesions
were shell-enhancing. All 47 nonenhancing lesions were hyperin-
tense on QSM, but 4 (8.5%) of them were only slightly hyperin-
tense. Sample images are illustrated in Fig 1.
The mean susceptibility of the lesions relative to normal-
appearing white matter was 20.26 � 7.55 ppb for nonenhancing
lesions and 2.49 � 6.39 ppb for enhancing lesions (both nodular
and shell), and their distributions are illustrated by histograms in
Fig 2. In the generalized estimating equation analysis of lesion
susceptibility values among the 3 lesion types, both nodular-
enhancing (� � �19.6; 95% CI, �23.5 to �15.8; P � .0001)
and shell-enhancing lesions (� � �13.5; 95% CI, �19.0 to �8.0;
P � .0001) had significantly lower susceptibility values compared
with nonenhancing lesions. In the generalized estimating equa-
tion analysis of susceptibility values between enhancing and non-
enhancing lesions, enhancing lesions had significantly lower sus-
ceptibility values compared nonenhancing lesions (� � �17.2;
95% CI, �20.2 to �11.2; P � .0001). The exchangeable corre-
lation coefficient was 0.12 for the lesion-susceptibility model.
The receiver operating characteristic curve constructed from
the mean relative susceptibility values of lesions is shown in
Fig 3. The cross-validated area under the curve was 0.9530 (95%
CI, 0.9201– 0.9859) and the bootstrapped area under the curve
was 0.9594 (95% CI, 0.9305– 0.9884) for identifying enhancing
lesions from QSM-measured susceptibility values. A relative sus-
ceptibility cutoff of 11.2 ppb to distinguish enhancing from non-
enhancing lesions had a sensitivity and specificity of 88.4% and
91.5%, respectively.
DISCUSSIONOur data suggest that QSM and T2WI together allow accurateidentification of enhancing lesions in patients with MS withoutGd injection within new lesions on serial MR imaging. This may
be a potential clinical application of thereported observation that the magneticsusceptibility of an MS lesion increasesrapidly as it changes from Gd-enhancingto nonenhancing.19,21 Our study sug-gests that in serial MR imaging duringregular monitoring of patients with MS,QSM may a substitute for Gd enhance-ment in assessing inflammatory activity.
Enhancement on T1WI�Gd is thecurrent standard method to assess ongo-ing CNS inflammation for monitoringoptimizing inflammation-suppressingtreatment. Following the initial inflam-matory reaction, the BBB opens and im-mune cells infiltrate the brain for about3 weeks; therefore, T1WI�Gd may onlyoffer a small window into lesion pathol-ogy.26 During this period, the microgliaand macrophages take up and degrademyelin fragments; this process is re-flected in the initial lack of change in thesusceptibilities of active lesions on QSM.However, after the BBB seals, immunecells remain active in the brain tissue.17
For example, microglia and macro-phages remove diamagnetic myelinfragments, and at the same time or after-ward, microglia and macrophage cellswith paramagnetic iron gather both atthe periphery and within a lesion to fur-ther promote inflammation.16 Thus,both myelin debris removal and iron ac-
FIG 1. MR images of enhancing and nonenhancing new MS lesions. T1WI�Gd (A), T2WI (B), andQSM (C) in a 44-year-old woman with relapsing-remitting MS. Two enhancing lesions (A and B,arrows) are found in T1WI�Gd. One is shell-enhancing (A, white arrow) and another is nodular-enhancing (A, black arrow). The shell-enhancing lesion appears slightly QSM-hyperintense (C,white box) and the nodular one appears QSM isointense (C, black box). T1WI�Gd (D), T2WI (E),and QSM (F) in a 35-year-old woman with relapsing-remitting MS. Two new nonenhancing lesions(D and E, arrows) are found in T1WI�Gd and T2WI compared with MR imaging 6 months prior. The2 lesions both appear QSM-hyperintense with bright rims (F, arrows).
Patient demographicsPatients with
EnhancingLesions
Patients withNonenhancing
Lesions P ValueNo. of patients 33 25Sex (F/M) 28:5 18:7Age (yr) (mean) 36.24 � 8.37 32.40 � 6.43 .07Disease duration
(yr) (mean)5.85 � 4.49 5.32 � 4.05 .65
EDSS (mean) 1.70 � 1.57 1.50 � 1.69 .66
Note:—EDSS indicates Expanded Disability Status Scale.
1796 Zhang Oct 2016 www.ajnr.org
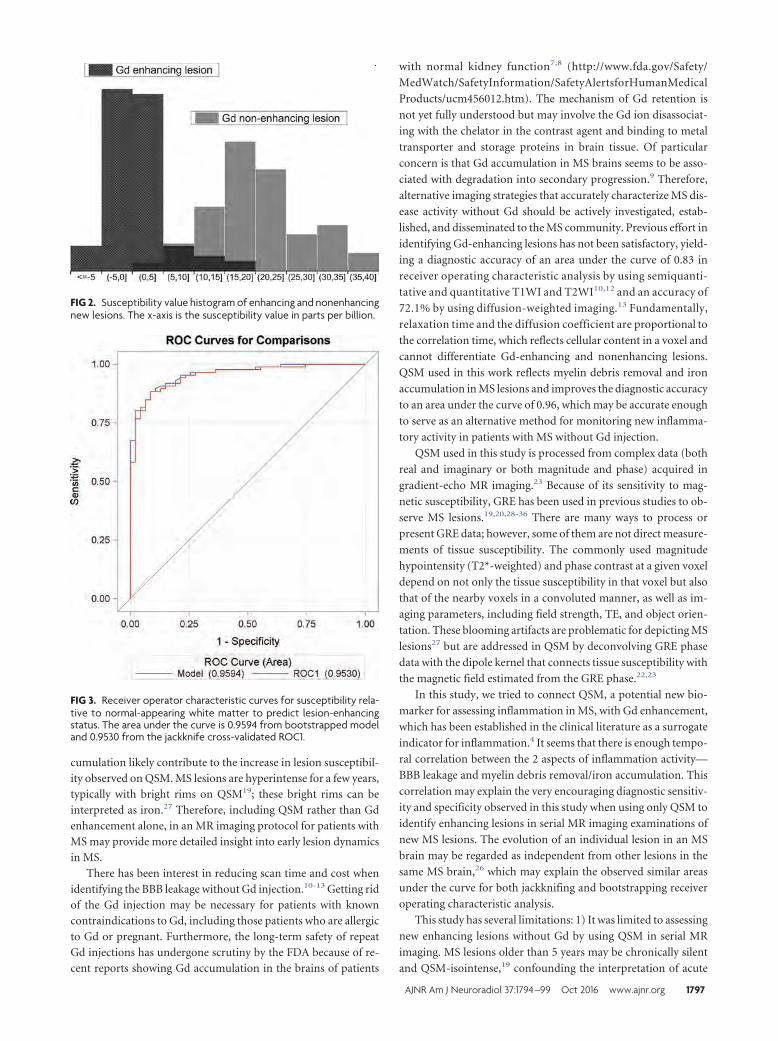
cumulation likely contribute to the increase in lesion susceptibil-ity observed on QSM. MS lesions are hyperintense for a few years,typically with bright rims on QSM19; these bright rims can beinterpreted as iron.27 Therefore, including QSM rather than Gdenhancement alone, in an MR imaging protocol for patients withMS may provide more detailed insight into early lesion dynamicsin MS.
There has been interest in reducing scan time and cost whenidentifying the BBB leakage without Gd injection.10-13 Getting ridof the Gd injection may be necessary for patients with knowncontraindications to Gd, including those patients who are allergicto Gd or pregnant. Furthermore, the long-term safety of repeatGd injections has undergone scrutiny by the FDA because of re-cent reports showing Gd accumulation in the brains of patients
with normal kidney function7,8 (http://www.fda.gov/Safety/
MedWatch/SafetyInformation/SafetyAlertsforHumanMedical
Products/ucm456012.htm). The mechanism of Gd retention is
not yet fully understood but may involve the Gd ion disassociat-
ing with the chelator in the contrast agent and binding to metal
transporter and storage proteins in brain tissue. Of particular
concern is that Gd accumulation in MS brains seems to be asso-
ciated with degradation into secondary progression.9 Therefore,
alternative imaging strategies that accurately characterize MS dis-
ease activity without Gd should be actively investigated, estab-
lished, and disseminated to the MS community. Previous effort in
identifying Gd-enhancing lesions has not been satisfactory, yield-
ing a diagnostic accuracy of an area under the curve of 0.83 in
receiver operating characteristic analysis by using semiquanti-
tative and quantitative T1WI and T2WI10,12 and an accuracy of
72.1% by using diffusion-weighted imaging.13 Fundamentally,
relaxation time and the diffusion coefficient are proportional to
the correlation time, which reflects cellular content in a voxel and
cannot differentiate Gd-enhancing and nonenhancing lesions.
QSM used in this work reflects myelin debris removal and iron
accumulation in MS lesions and improves the diagnostic accuracy
to an area under the curve of 0.96, which may be accurate enough
to serve as an alternative method for monitoring new inflamma-
tory activity in patients with MS without Gd injection.
QSM used in this study is processed from complex data (both
real and imaginary or both magnitude and phase) acquired in
gradient-echo MR imaging.23 Because of its sensitivity to mag-
netic susceptibility, GRE has been used in previous studies to ob-
serve MS lesions.19,20,28-36 There are many ways to process or
present GRE data; however, some of them are not direct measure-
ments of tissue susceptibility. The commonly used magnitude
hypointensity (T2*-weighted) and phase contrast at a given voxel
depend on not only the tissue susceptibility in that voxel but also
that of the nearby voxels in a convoluted manner, as well as im-
aging parameters, including field strength, TE, and object orien-
tation. These blooming artifacts are problematic for depicting MS
lesions27 but are addressed in QSM by deconvolving GRE phase
data with the dipole kernel that connects tissue susceptibility with
the magnetic field estimated from the GRE phase.22,23
In this study, we tried to connect QSM, a potential new bio-
marker for assessing inflammation in MS, with Gd enhancement,
which has been established in the clinical literature as a surrogate
indicator for inflammation.4 It seems that there is enough tempo-
ral correlation between the 2 aspects of inflammation activity—
BBB leakage and myelin debris removal/iron accumulation. This
correlation may explain the very encouraging diagnostic sensitiv-
ity and specificity observed in this study when using only QSM to
identify enhancing lesions in serial MR imaging examinations of
new MS lesions. The evolution of an individual lesion in an MS
brain may be regarded as independent from other lesions in the
same MS brain,26 which may explain the observed similar areas
under the curve for both jackknifing and bootstrapping receiver
operating characteristic analysis.
This study has several limitations: 1) It was limited to assessing
new enhancing lesions without Gd by using QSM in serial MR
imaging. MS lesions older than 5 years may be chronically silent
and QSM-isointense,19 confounding the interpretation of acute
FIG 2. Susceptibility value histogram of enhancing and nonenhancingnew lesions. The x-axis is the susceptibility value in parts per billion.
FIG 3. Receiver operator characteristic curves for susceptibility rela-tive to normal-appearing white matter to predict lesion-enhancingstatus. The area under the curve is 0.9594 from bootstrapped modeland 0.9530 from the jackknife cross-validated ROC1.
AJNR Am J Neuroradiol 37:1794 –99 Oct 2016 www.ajnr.org 1797
lesions that are also QSM isointense on the first or a single MRimaging. This outcome would limit the role of QSM to monitor-ing new lesions in serial or longitudinal MR imaging. This seriouslimitation requires us to continue seeking other non-contrastagent MR imaging features that differentiate old chronic lesionsfrom new enhancing ones. Alternatively, because T1WI�Gd re-flects the BBB leakage and QSM reflects myelin debris removaland iron accumulation, it may be useful to integrate T1WI�Gdand QSM information to form a comprehensive score to charac-terize acute MS lesion activity. 2) The sensitivity was not perfectbecause some new enhancing lesions demonstrated moderate hy-perintensity on QSM, most of which (82.3%,14/17) were shell-enhancing on T1WI�Gd instead of the common nodular-enhancing type. Shell-enhancing lesions may be considered in thelate stage of enhancing lesions,26,37,38 when myelin debris withnegative susceptibility is being removed from the lesion and en-ters the peripheral circulation.16,17 3) While QSM data are ac-quired by using the widely available 3D gradient-echo sequenceand are processed in an automated manner, MS lesion suscepti-bility value measurement required manually drawing an ROI,which is laborious and may be alleviated by automated or semi-automated MS lesion ROI drawing tools. 4) This study is limitedin sample size. Future studies should include applying the suscep-tibility cutoff value identified here to a larger cohort of patientswith MS for evaluating the diagnostic accuracy in identifying newenhancing lesions.
CONCLUSIONSQSM can be used in routine serial MR imaging monitoring of
patients with MS to accurately identify the BBB leakage of new
T2WI lesions without the use of a gadolinium contrast agent.
Disclosures: Susan A. Gauthier—UNRELATED: Consultancy: Biogen, Genentech,Genzyme; Grants/Grants Pending: Biogen,* Genzyme,* Mallincrodt,* Novartis,*EMD Serono.* Ajay Gupta—UNRELATED: Grants/Grants Pending: Foundation ofthe American Society of Neuroradiology Scholar Award,* AUR-Radiology ResearchAcademic Fellowship award.* Weiwei Chen—RELATED: Grant: This study is partlysupported by the National Natural Science Foundation of China (grant number81401390).* Yi Wang—RELATED: Grant: National Institutes of Health (R01EB013443,R01NS090464)*; UNRELATED: Patents (planned, pending or issued): Cornell Univer-sity,* Comments: I am one of the inventors on the QSM patent. No money has beenpaid yet; Stock/Stock Options: Medimagemetric, Comments: partner ownership ofMedimagemetric LLC, which is interested in QSM commercialization. No moneypaid. *Money paid to the institution.
REFERENCES1. Trapp BD, Peterson J, Ransohoff RM, et al. Axonal transection in the
lesions of multiple sclerosis. N Engl J Med 1998;338:278 – 85CrossRef Medline
2. McFarland HF, Martin R. Multiple sclerosis: a complicated pictureof autoimmunity. Nat Immunol 2007;8:913–19 CrossRef Medline
3. Lublin FD, Reingold SC. Defining the clinical course of multiplesclerosis: results of an international survey: National Multiple Scle-rosis Society (USA) Advisory Committee on Clinical Trials of NewAgents in Multiple Sclerosis. Neurology 1996;46:907–11 CrossRefMedline
4. Polman CH, Reingold SC, Banwell B, et al. Diagnostic criteria formultiple sclerosis: 2010 revisions to the McDonald criteria. AnnNeurol 2011;69:292–302 CrossRef Medline
5. Vellinga MM, Oude Engberink RD, Seewann A, et al. Pluriformity ofinflammation in multiple sclerosis shown by ultra-small iron oxideparticle enhancement. Brain 2008;131:800 – 07 CrossRef Medline
6. Ladewig G, Jestaedt L, Misselwitz B, et al. Spatial diversity of blood-
brain barrier alteration and macrophage invasion in experimentalautoimmune encephalomyelitis: a comparative MRI study. ExpNeurol 2009;220:207–11 CrossRef Medline
7. Kanda T, Osawa M, Oba H, et al. High signal intensity in dentatenucleus on unenhanced T1-weighted MR images: association withlinear versus macrocyclic gadolinium chelate administration. Ra-diology 2015;275:803– 09 CrossRef Medline
8. Radbruch A, Weberling LD, Kieslich PJ, et al. Gadolinium retentionin the dentate nucleus and globus pallidus is dependent on the classof contrast agent. Radiology 2015;275:783–91 CrossRef Medline
9. Roccatagliata L, Vuolo L, Bonzano L, et al. Multiple sclerosis: hyper-intense dentate nucleus on unenhanced T1-weighted MR images isassociated with the secondary progressive subtype. Radiology 2009;251:503–10 CrossRef Medline
10. Shinohara RT, Goldsmith J, Mateen FJ, et al. Predicting breakdownof the blood-brain barrier in multiple sclerosis without contrastagents. AJNR Am J Neuroradiol 2012;33:1586 –90 CrossRef Medline
11. Treaba CA, Balasa R, Podeanu DM, et al. Cerebral lesions of multiplesclerosis: is gadolinium always irreplaceable in assessing lesion ac-tivity? Diagn Interv Radiol 2014;20:178 – 84 CrossRef Medline
12. Blystad I, Håkansson I, Tisell A, et al. Quantitative MRI for analysisof active multiple sclerosis lesions without gadolinium-based con-trast agent. AJNR Am J Neuroradiol 2016;37:94 –100 CrossRefMedline
13. Lo CP, Kao HW, Chen SY, et al. Comparison of diffusion-weightedimaging and contrast-enhanced T1-weighted imaging on a singlebaseline MRI for demonstrating dissemination in time in multiplesclerosis. BMC Neurol 2014;14:100 CrossRef Medline
14. Lee SC, Moore GR, Golenwsky G, et al. Multiple sclerosis: a role forastroglia in active demyelination suggested by class II MHC expres-sion and ultrastructural study. J Neuropathol Exp Neurol 1990;49:122–36 CrossRef Medline
15. Bruck W, Porada P, Poser S, et al. Monocyte/macrophage differen-tiation in early multiple sclerosis lesions. Ann Neurol 1995;38:788 –96 CrossRef Medline
16. Mehta V, Pei W, Yang G, et al. Iron is a sensitive biomarker forinflammation in multiple sclerosis lesions. PLoS One 2013;8:e57573CrossRef Medline
17. Kutzelnigg A, Lassmann H. Pathology of multiple sclerosis and re-lated inflammatory demyelinating diseases. Handb Clin Neurol2014;122:15–58 CrossRef Medline
18. Cairo G, Recalcati S, Mantovani A, et al. Iron trafficking and metab-olism in macrophages: contribution to the polarized phenotype.Trends Immunol 2011;32:241– 47 CrossRef Medline
19. Chen W, Gauthier SA, Gupta A, et al. Quantitative susceptibilitymapping of multiple sclerosis lesions at various ages. Radiology2014;271:183–92 CrossRef Medline
20. Wiggermann V, Hernandez Torres E, Vavasour IM, et al. Magneticresonance frequency shifts during acute MS lesion formation. Neu-rology 2013;81:211–18 CrossRef Medline
21. Zhang Y, Gauthier SA, Gupta A, et al. Longitudinal change in mag-netic susceptibility of new enhanced multiple sclerosis (MS) lesionsmeasured on serial quantitative susceptibility mapping (QSM).J Magn Reson Imaging 2016 Jan 22. [Epub ahead of print] CrossRefMedline
22. de Rochefort L, Liu T, Kressler B, et al. Quantitative susceptibility mapreconstruction from MR phase data using Bayesian regularization:validation and application to brain imaging. Magn Reson Med 2010;63:194–206 CrossRef Medline
23. Wang Y, Liu T. Quantitative susceptibility mapping (QSM): decod-ing MRI data for a tissue magnetic biomarker. Magn Reson Med2015;73:82–101 CrossRef Medline
24. Liu J, Liu T, de Rochefort L, et al. Morphology enabled dipole inver-sion for quantitative susceptibility mapping using structural con-sistency between the magnitude image and the susceptibility map.Neuroimage 2012;59:2560 – 68 CrossRef Medline
25. Jenkinson M, Bannister P, Brady M, et al. Improved optimization for
1798 Zhang Oct 2016 www.ajnr.org
the robust and accurate linear registration and motion correctionof brain images. Neuroimage 2002;17:825– 41 CrossRef Medline
26. Gaitan MI, Shea CD, Evangelou IE, et al. Evolution of the blood-brain barrier in newly forming multiple sclerosis lesions. Ann Neu-rol 2011;70:22–29 CrossRef Medline
27. Wisnieff C, Ramanan S, Olesik J, et al. Quantitative susceptibilitymapping (QSM) of white matter multiple sclerosis lesions: inter-preting positive susceptibility and the presence of iron. Magn ResonMed 2015;74:564 –70 CrossRef Medline
28. Haacke EM, Makki M, Ge Y, et al. Characterizing iron deposition inmultiple sclerosis lesions using susceptibility weighted imaging.J Magn Reson Imaging 2009;29:537– 44 CrossRef Medline
29. Khalil M, Enzinger C, Langkammer C, et al. Quantitative assessmentof brain iron by R(2)* relaxometry in patients with clinically iso-lated syndrome and relapsing-remitting multiple sclerosis. MultScler 2009;15:1048 –54 CrossRef Medline
30. Ropele S, de Graaf W, Khalil M, et al. MRI assessment of iron depo-sition in multiple sclerosis. J Magn Reson Imaging 2011;34:13–21CrossRef Medline
31. Khalil M, Langkammer C, Ropele S, et al. Determinants of brain ironin multiple sclerosis: a quantitative 3T MRI study. Neurology 2011;77:1691–97 CrossRef Medline
32. Hagemeier J, Heininen-Brown M, Poloni GU, et al. Iron depositionin multiple sclerosis lesions measured by susceptibility-weightedimaging filtered phase: a case control study. J Magn Reson Imaging2012;36:73– 83 CrossRef Medline
33. Paling D, Tozer D, Wheeler-Kingshott C, et al. Reduced R2� in mul-tiple sclerosis normal appearing white matter and lesions may re-flect decreased myelin and iron content. J Neurol Neurosurg Psychi-atry 2012;83:785–92 CrossRef Medline
34. Bagnato F, Hametner S, Welch EB. Visualizing iron in multiple scle-rosis. Magn Reson Imaging 2013;31:376 – 84 CrossRef Medline
35. Bian W, Harter K, Hammond-Rosenbluth KE, et al. A serial in vivo7T magnetic resonance phase imaging study of white matter lesionsin multiple sclerosis. Mult Scler 2013;19:69 –75 CrossRef Medline
36. Absinta M, Sati P, Gaitan MI, et al. Seven-Tesla phase imaging ofacute multiple sclerosis lesions: a new window into the inflamma-tory process. Ann Neurol 2013;74:669 –78 CrossRef Medline
37. Cotton F, Weiner HL, Jolesz FA, et al. MRI contrast uptake in newlesions in relapsing-remitting MS followed at weekly intervals.Neurology 2003;60:640 – 46 CrossRef Medline
38. Guttmann CR, Ahn SS, Hsu L, et al. The evolution of multiple scle-rosis lesions on serial MR. AJNR Am J Neuroradiol 1995;16:1481–91Medline
AJNR Am J Neuroradiol 37:1794 –99 Oct 2016 www.ajnr.org 1799
ORIGINAL RESEARCHADULT BRAIN
Regional Frontal Perfusion Deficits in Relapsing-RemittingMultiple Sclerosis with Cognitive Decline
X R. Vitorino, X S.-P. Hojjat, X C.G. Cantrell, X A. Feinstein, X L. Zhang, X L. Lee, X P. O’Connor, X T.J. Carroll, and X R.I. Aviv
ABSTRACT
BACKGROUND AND PURPOSE: Cortical dysfunction, quantifiable by cerebral perfusion techniques, is prevalent in patients with MS,contributing to cognitive impairment. We sought to localize perfusion distribution differences in patients with relapsing-remitting MS withand without cognitive impairment and healthy controls.
MATERIALS AND METHODS: Thirty-nine patients with relapsing-remitting MS (20 cognitively impaired, 19 nonimpaired) and 19 age- andsex-matched healthy controls underwent a neurocognitive battery and MR imaging. Voxel-based analysis compared regional deep andcortical GM perfusion and volume among the cohorts.
RESULTS: After we adjusted for localized volumetric differences in the right frontal, temporal, and occipital lobes, progressive CBF andCBV deficits were present in the left middle frontal cortex for all cohorts and in the left superior frontal gyrus for patients with cognitiveimpairment compared with patients without impairment and controls. Compared with healthy controls, reduced CBF was present in thelimbic regions of patients with cognitive impairment, and reduced CBV was present in the right middle frontal gyrus in patients withcognitive impairment and in the temporal gyrus of relapsing-remitting MS patients without cognitive impairment.
CONCLUSIONS: Consistent regional frontal cortical perfusion deficits are present in patients with relapsing-remitting MS, with morewidespread hypoperfusion in those with cognitive impairment, independent of structural differences, indicating that cortical perfusionmay be a useful biomarker of cortical dysfunction and cognitive impairment in MS.
ABBREVIATIONS: BA � Brodmann area; DARTEL � Diffeomorphic Anatomical Registration Through Exponentiated Lie Algebra; HC � healthy controls; MNI �Montreal Neurological Institute; qCBF � quantitative cerebral blood flow; qCBV � quantitative cerebral blood volume; RRMS � relapsing-remitting multiple sclerosis;VBM � voxel-based morphometry
MS is traditionally considered a demyelinating-inflammatory
WM disorder; however, GM involvement is recognized in
50%–93% of patients,1,2 contributing to cognitive impairment,
which is present in 40%– 68% of cases.3,4 Patients with MS may
display deficits in several cognitive domains, including working
memory, learning and memory retrieval, executive function, and
especially information-processing speed.2,5
Multiple studies have quantified the relative contributions of
WM T2 hyperintense lesions and, to a lesser extent, GM cortical
lesions to cognition in MS. The relationship between WM T2
hyperintense lesion burden and cognitive impairment is modest,6
and GM and WM damage may occur interdependently,1 with
cortical abnormalities reported in the absence of WM disease.7
Both atrophy and cortical lesion load are important predictors of
cognitive deficits in patients with MS5; nevertheless, cortical le-
sion burden is increasingly reported as a stronger and indepen-
dent predictor of cognitive performance in comparison with cor-
tical volume.8
Current clinical imaging techniques used for cortical lesion
detection, such as double inversion recovery, detect few lesions
(around 18%) compared with histopathologic studies.9 Several
studies have proposed new strategies to detect cortical abnormal-
ities, including cortical lesion volume or more subtle ultrastruc-
tural (magnetization transfer ratio10,11 and DTI12,13) or perfusion
Received January 6, 2016; accepted after revision March 17.
From the Departments of Psychiatry (A.F.), Neurology (L.L.), and Medical Imaging(R.V., S.-P.H., L.Z., R.I.A.), Sunnybrook Health Sciences Centre, Toronto, Ontario,Canada; Departments of Medicine (L.L., P.O.), Psychiatry (A.F.), and Medical Imaging(S.-P.H., R.I.A.), University of Toronto, Toronto, Ontario, Canada; and Departmentsof Biomedical Engineering (C.G.C., T.J.C) and Radiology (T.J.C.), Northwestern Uni-versity, Chicago, Illinois.
Dr. Aviv was supported by Canadian Institutes of Health Research operating grant(130366). Drs. Aviv and Hojjat are supported by a Biogen Fellowship Funding Award.Charles Cantrell is supported by the American Heart Association (14PRE20380310).Dr. Carroll is supported by the US National Institutes of Health(1R21EB017928-01A1).
Please address correspondence to Rita Vitorino, BSc, Sunnybrook Health SciencesCentre, 2075 Bayview Ave, Room AB204, Toronto, Ontario, Canada M4N 3M5;e-mail: [email protected]
Indicates open access to non-subscribers at www.ajnr.org
http://dx.doi.org/10.3174/ajnr.A4824
1800 Vitorino Oct 2016 www.ajnr.org
abnormalities, in the clinical setting. GM is inherently sensitive to
perfusion changes caused by both physiologic and pathologic al-
terations, due to its high vascularity and metabolic activity. Cor-
tical perfusion can be evaluated with multiple imaging tech-
niques, including fMRI, arterial spin-labeling, and gadolinium-
based MR imaging techniques, such as DSC, which is the most
widely performed clinical perfusion technique. By using pre- and
postgadolinium scans to calibrate DSC, the bookend technique
offers accurate cerebral perfusion quantification with high PET
correlation and interobserver reliability.14,15
Previous perfusion studies have shown that regardless of MS
clinical subtype, cerebral hypoperfusion is an early and integral
occurrence,16,17 including in early relapsing-remitting MS
(RRMS), in which reduction may be seen in the absence of struc-
tural differences compared with healthy controls (HC).18 Studies
explicitly exploring cognitive impairment in both RRMS and sec-
ondary-progressive MS describe significant and focal frontal cor-
tical correlations between CBV and CBF reductions and cognitive
deficits.16,19-21
In the present study, we sought to localize CBF and CBV in HC
and RRMS patients with and without cognitive impairment to
determine whether a similar pattern of involvement is present
compared with that previously reported for secondary-progres-
sive multiple sclerosis. We hypothesized that patients with RRMS
with cognitive impairment similarly exhibit localized frontal
cerebral CBF and CBV reduction in functionally consistent
brain regions, compared with patients without impairment
and HC. We further evaluated the consistency of the localized
findings before and after accounting for any structural group
differences.
MATERIALS AND METHODSPatient CohortThirty-nine patients with RRMS (modified McDonald criteria,
201022) were prospectively recruited during a 1-year period from
2 tertiary referral MS clinics at Sunnybrook and St. Michael’s
hospitals. Initially, 20 patients with cognitive impairment were
recruited followed by the remaining patients without impairment
and 19 HC (with no previous history of neurologic disorders)
who were selected to reflect the overall distribution of sex and age
of the impaired cohort. Charts of potential patients were reviewed
by a senior neurologist (20 years’ experience) before recruitment.
Exclusion criteria included relapse or corticosteroid use within
the past 3 months; history of drug/alcohol abuse; premorbid (pre-
MS) psychiatric history; head injury, including loss of conscious-
ness; concurrent morbidity; and MR imaging/gadolinium contra-
indications. All study participants were purposely recruited for
this study. At the time of consent, the small potential risks asso-
ciated with gadolinium injection were discussed, referencing
American College of Radiology and FDA communications. Con-
sent was obtained following confirmation of MR imaging (and
gadolinium) eligibility on the basis of a standardized MR imaging
contraindication questionnaire and glomerular filtration rate
determination. The study was approved by the research ethics
board of both Sunnybrook Health Sciences Centre and St. Mi-
chael’s Hospital, and informed consent was obtained from all
participants.
Neurocognitive TestingAll patients underwent clinical assessments within 1 week of im-
age acquisition, documenting demographic data and medical his-
tory, including relapse history. Disability was assessed by using
the Expanded Disability Status Scale.23 All participants were
tested by using the Minimal Assessment of Cognitive Function in
Multiple Sclerosis battery covering 5 cognitive domains: working
memory and processing speed (Paced Auditory Serial Addition
Test; Symbol Digit Modalities Test); learning and memory (Brief
Visual Memory Test-Revised; California Verbal Learning Test-
II); executive function (Delis-Kaplan Executive Function Sys-
tem); verbal fluency (Controlled Word Association Test); and
visuospatial perception (Judgment of Line Orientations).24 Raw
scores of each individual test were converted to z scores by using
widely available normative data, which correct for age and sex.
Norms for 3 of the key components of the neurocognitive battery
(Paced Auditory Serial Addition Test; Symbol Digit Modalities
Test; Controlled Word Association Test) also correct for educa-
tion. Patients scoring 1.5 SDs below normative data on �2 cog-
nitive tests were considered cognitively impaired.25 The Hospital
Anxiety and Depression Scale was also administered.
MR Imaging AcquisitionAll scans were acquired on a 3T MR imaging system (Achieva;
Philips Healthcare, Best, the Netherlands) with an 8-channel
phased array head coil receiver. Conventional MR imaging se-
quences were acquired for structural and lesion characterization,
including axial volumetric TSE T1 (TR/TE/flip angle � 9.5/2.3
ms/12°; FOV � 24 cm; acquisition matrix � 256 � 219; section
thickness � 1.2 mm); axial proton-density/T2 (TR/TE/flip an-
gle � 2500/10.7 ms/90°; FOV � 23 cm; acquisition matrix �
256 � 263; section thickness � 3 mm); axial phase-sensitive
inversion recovery (TR/TE � 3374/15 ms; FOV � 23 cm; acqui-
sition matrix � 400 � 255; section thickness � 3 mm); and axial
field-echo echo-planar DSC (TR/TE/flip angle � 1633/30 ms/60°;
FOV � 22 cm; acquisition matrix � 96 � 93; section thickness �
4 mm; no gap; signal bandwidth � 1260 Hz/pixel; sections � 24).
A segmented inversion recovery Look-Locker EPI sequence was
performed immediately before and after the axial DSC sequence
(TR/TE/flip angle � 29/14 ms/20°; TI � 15.8 ms; FOV � 22 cm;
acquisition matrix � 128 � 126; 15 lines in k-space per acquisi-
tion; section thickness � 4 mm; 60 time points). Ten milliliters of
1 mmol/mL concentration of gadobutrol (Gadovist; Bayer Scher-
ing Pharma, Berlin, Germany) was administered by power injec-
tor at a rate of 5 mL/s, followed by a 25-mL bolus of saline at 5
mL/s. Sixty images were acquired at 1.6-second intervals with the
injection occurring at the fifth volume. A 3-second delay was
placed after the last imaging time point to facilitate longitudinal
magnetization recovery.
Image Processing
Perfusion Maps. Quantitative CBF (qCBF) and CBV (qCBV)
maps were generated from the DSC and Look-Locker echo-planar
images (T1-weighted pre- and postgadolinium reference scans)
by using the bookend technique.15 Briefly, these Look-Locker EPI
scans allow DSC calibration, independent of an arterial input
function, by quantifying WM T1 signal changes relative to the
AJNR Am J Neuroradiol 37:1800 – 07 Oct 2016 www.ajnr.org 1801
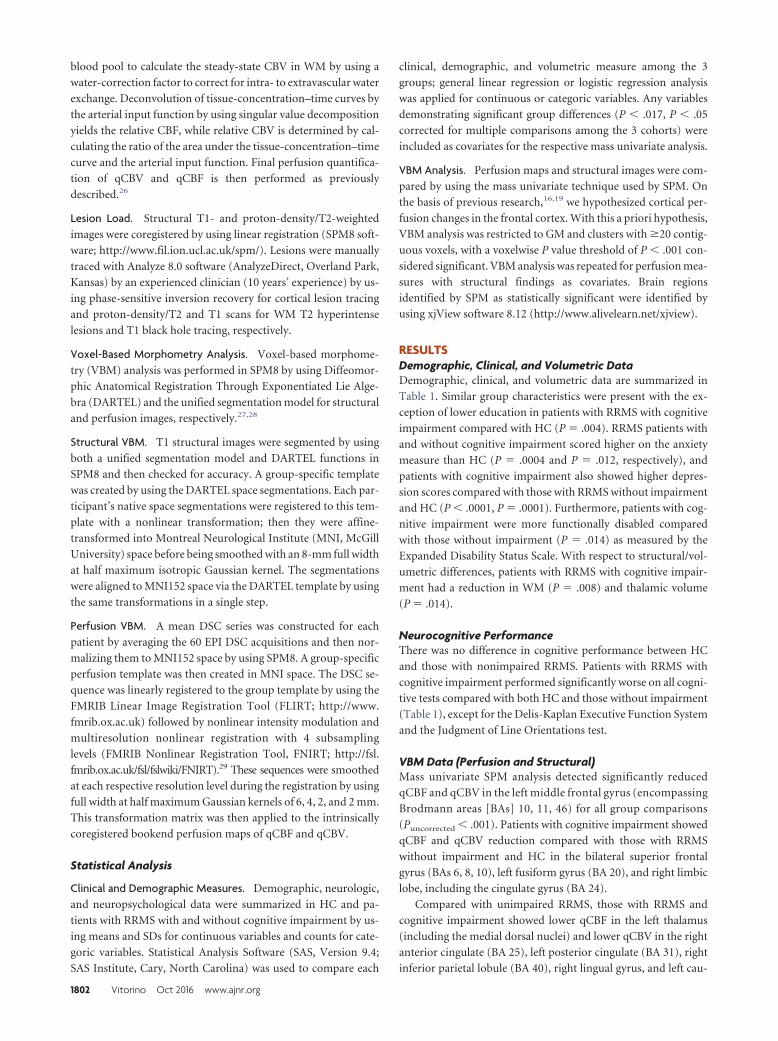
blood pool to calculate the steady-state CBV in WM by using a
water-correction factor to correct for intra- to extravascular water
exchange. Deconvolution of tissue-concentration–time curves by
the arterial input function by using singular value decomposition
yields the relative CBF, while relative CBV is determined by cal-
culating the ratio of the area under the tissue-concentration–time
curve and the arterial input function. Final perfusion quantifica-
tion of qCBV and qCBF is then performed as previously
described.26
Lesion Load. Structural T1- and proton-density/T2-weighted
images were coregistered by using linear registration (SPM8 soft-
ware; http://www.fil.ion.ucl.ac.uk/spm/). Lesions were manually
traced with Analyze 8.0 software (AnalyzeDirect, Overland Park,
Kansas) by an experienced clinician (10 years’ experience) by us-
ing phase-sensitive inversion recovery for cortical lesion tracing
and proton-density/T2 and T1 scans for WM T2 hyperintense
lesions and T1 black hole tracing, respectively.
Voxel-Based Morphometry Analysis. Voxel-based morphome-
try (VBM) analysis was performed in SPM8 by using Diffeomor-
phic Anatomical Registration Through Exponentiated Lie Alge-
bra (DARTEL) and the unified segmentation model for structural
and perfusion images, respectively.27,28
Structural VBM. T1 structural images were segmented by using
both a unified segmentation model and DARTEL functions in
SPM8 and then checked for accuracy. A group-specific template
was created by using the DARTEL space segmentations. Each par-
ticipant’s native space segmentations were registered to this tem-
plate with a nonlinear transformation; then they were affine-
transformed into Montreal Neurological Institute (MNI, McGill
University) space before being smoothed with an 8-mm full width
at half maximum isotropic Gaussian kernel. The segmentations
were aligned to MNI152 space via the DARTEL template by using
the same transformations in a single step.
Perfusion VBM. A mean DSC series was constructed for each
patient by averaging the 60 EPI DSC acquisitions and then nor-
malizing them to MNI152 space by using SPM8. A group-specific
perfusion template was then created in MNI space. The DSC se-
quence was linearly registered to the group template by using the
FMRIB Linear Image Registration Tool (FLIRT; http://www.
fmrib.ox.ac.uk) followed by nonlinear intensity modulation and
multiresolution nonlinear registration with 4 subsampling
levels (FMRIB Nonlinear Registration Tool, FNIRT; http://fsl.
fmrib.ox.ac.uk/fsl/fslwiki/FNIRT).29 These sequences were smoothed
at each respective resolution level during the registration by using
full width at half maximum Gaussian kernels of 6, 4, 2, and 2 mm.
This transformation matrix was then applied to the intrinsically
coregistered bookend perfusion maps of qCBF and qCBV.
Statistical Analysis
Clinical and Demographic Measures. Demographic, neurologic,
and neuropsychological data were summarized in HC and pa-
tients with RRMS with and without cognitive impairment by us-
ing means and SDs for continuous variables and counts for cate-
goric variables. Statistical Analysis Software (SAS, Version 9.4;
SAS Institute, Cary, North Carolina) was used to compare each
clinical, demographic, and volumetric measure among the 3
groups; general linear regression or logistic regression analysis
was applied for continuous or categoric variables. Any variables
demonstrating significant group differences (P � .017, P � .05
corrected for multiple comparisons among the 3 cohorts) were
included as covariates for the respective mass univariate analysis.
VBM Analysis. Perfusion maps and structural images were com-
pared by using the mass univariate technique used by SPM. On
the basis of previous research,16,19 we hypothesized cortical per-
fusion changes in the frontal cortex. With this a priori hypothesis,
VBM analysis was restricted to GM and clusters with �20 contig-
uous voxels, with a voxelwise P value threshold of P � .001 con-
sidered significant. VBM analysis was repeated for perfusion mea-
sures with structural findings as covariates. Brain regions
identified by SPM as statistically significant were identified by
using xjView software 8.12 (http://www.alivelearn.net/xjview).
RESULTSDemographic, Clinical, and Volumetric DataDemographic, clinical, and volumetric data are summarized in
Table 1. Similar group characteristics were present with the ex-
ception of lower education in patients with RRMS with cognitive
impairment compared with HC (P � .004). RRMS patients with
and without cognitive impairment scored higher on the anxiety
measure than HC (P � .0004 and P � .012, respectively), and
patients with cognitive impairment also showed higher depres-
sion scores compared with those with RRMS without impairment
and HC (P � .0001, P � .0001). Furthermore, patients with cog-
nitive impairment were more functionally disabled compared
with those without impairment (P � .014) as measured by the
Expanded Disability Status Scale. With respect to structural/vol-
umetric differences, patients with RRMS with cognitive impair-
ment had a reduction in WM (P � .008) and thalamic volume
(P � .014).
Neurocognitive PerformanceThere was no difference in cognitive performance between HC
and those with nonimpaired RRMS. Patients with RRMS with
cognitive impairment performed significantly worse on all cogni-
tive tests compared with both HC and those without impairment
(Table 1), except for the Delis-Kaplan Executive Function System
and the Judgment of Line Orientations test.
VBM Data (Perfusion and Structural)Mass univariate SPM analysis detected significantly reduced
qCBF and qCBV in the left middle frontal gyrus (encompassing
Brodmann areas [BAs] 10, 11, 46) for all group comparisons
(Puncorrected � .001). Patients with cognitive impairment showed
qCBF and qCBV reduction compared with those with RRMS
without impairment and HC in the bilateral superior frontal
gyrus (BAs 6, 8, 10), left fusiform gyrus (BA 20), and right limbic
lobe, including the cingulate gyrus (BA 24).
Compared with unimpaired RRMS, those with RRMS and
cognitive impairment showed lower qCBF in the left thalamus
(including the medial dorsal nuclei) and lower qCBV in the right
anterior cingulate (BA 25), left posterior cingulate (BA 31), right
inferior parietal lobule (BA 40), right lingual gyrus, and left cau-
1802 Vitorino Oct 2016 www.ajnr.org
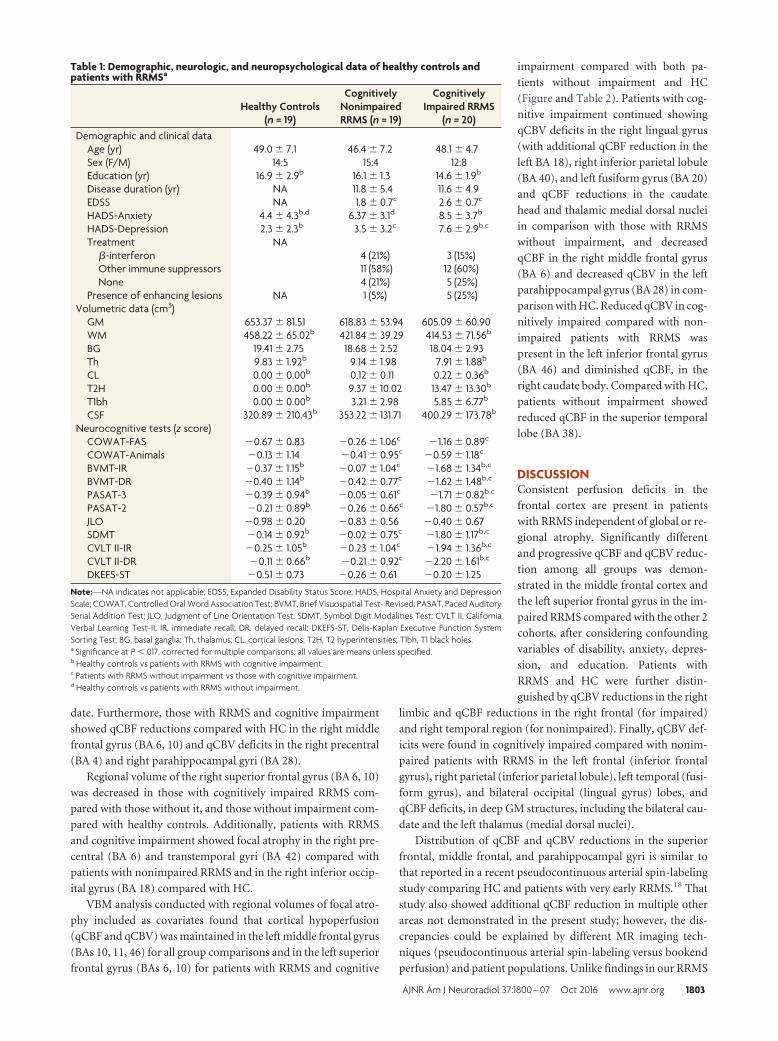
date. Furthermore, those with RRMS and cognitive impairment
showed qCBF reductions compared with HC in the right middle
frontal gyrus (BA 6, 10) and qCBV deficits in the right precentral
(BA 4) and right parahippocampal gyri (BA 28).
Regional volume of the right superior frontal gyrus (BA 6, 10)
was decreased in those with cognitively impaired RRMS com-
pared with those without it, and those without impairment com-
pared with healthy controls. Additionally, patients with RRMS
and cognitive impairment showed focal atrophy in the right pre-
central (BA 6) and transtemporal gyri (BA 42) compared with
patients with nonimpaired RRMS and in the right inferior occip-
ital gyrus (BA 18) compared with HC.
VBM analysis conducted with regional volumes of focal atro-
phy included as covariates found that cortical hypoperfusion
(qCBF and qCBV) was maintained in the left middle frontal gyrus
(BAs 10, 11, 46) for all group comparisons and in the left superior
frontal gyrus (BAs 6, 10) for patients with RRMS and cognitive
impairment compared with both pa-
tients without impairment and HC
(Figure and Table 2). Patients with cog-
nitive impairment continued showing
qCBV deficits in the right lingual gyrus
(with additional qCBF reduction in the
left BA 18), right inferior parietal lobule
(BA 40), and left fusiform gyrus (BA 20)
and qCBF reductions in the caudate
head and thalamic medial dorsal nuclei
in comparison with those with RRMS
without impairment, and decreased
qCBF in the right middle frontal gyrus
(BA 6) and decreased qCBV in the left
parahippocampal gyrus (BA 28) in com-
parison with HC. Reduced qCBV in cog-
nitively impaired compared with non-
impaired patients with RRMS was
present in the left inferior frontal gyrus
(BA 46) and diminished qCBF, in the
right caudate body. Compared with HC,
patients without impairment showed
reduced qCBF in the superior temporal
lobe (BA 38).
DISCUSSIONConsistent perfusion deficits in the
frontal cortex are present in patients
with RRMS independent of global or re-
gional atrophy. Significantly different
and progressive qCBF and qCBV reduc-
tion among all groups was demon-
strated in the middle frontal cortex and
the left superior frontal gyrus in the im-
paired RRMS compared with the other 2
cohorts, after considering confounding
variables of disability, anxiety, depres-
sion, and education. Patients with
RRMS and HC were further distin-
guished by qCBV reductions in the right
limbic and qCBF reductions in the right frontal (for impaired)
and right temporal region (for nonimpaired). Finally, qCBV def-
icits were found in cognitively impaired compared with nonim-
paired patients with RRMS in the left frontal (inferior frontal
gyrus), right parietal (inferior parietal lobule), left temporal (fusi-
form gyrus), and bilateral occipital (lingual gyrus) lobes, and
qCBF deficits, in deep GM structures, including the bilateral cau-
date and the left thalamus (medial dorsal nuclei).
Distribution of qCBF and qCBV reductions in the superior
frontal, middle frontal, and parahippocampal gyri is similar to
that reported in a recent pseudocontinuous arterial spin-labeling
study comparing HC and patients with very early RRMS.18 That
study also showed additional qCBF reduction in multiple other
areas not demonstrated in the present study; however, the dis-
crepancies could be explained by different MR imaging tech-
niques (pseudocontinuous arterial spin-labeling versus bookend
perfusion) and patient populations. Unlike findings in our RRMS
Table 1: Demographic, neurologic, and neuropsychological data of healthy controls andpatients with RRMSa
Healthy Controls(n = 19)
CognitivelyNonimpairedRRMS (n = 19)
CognitivelyImpaired RRMS
(n = 20)Demographic and clinical data
Age (yr) 49.0 � 7.1 46.4 � 7.2 48.1 � 4.7Sex (F/M) 14:5 15:4 12:8Education (yr) 16.9 � 2.9b 16.1 � 1.3 14.6 � 1.9b
Disease duration (yr) NA 11.8 � 5.4 11.6 � 4.9EDSS NA 1.8 � 0.7c 2.6 � 0.7c
HADS-Anxiety 4.4 � 4.3b,d 6.37 � 3.1d 8.5 � 3.7b
HADS-Depression 2.3 � 2.3b 3.5 � 3.2c 7.6 � 2.9b,c
Treatment NA�-interferon 4 (21%) 3 (15%)Other immune suppressors 11 (58%) 12 (60%)None 4 (21%) 5 (25%)
Presence of enhancing lesions NA 1 (5%) 5 (25%)Volumetric data (cm3)
GM 653.37 � 81.51 618.83 � 53.94 605.09 � 60.90WM 458.22 � 65.02b 421.84 � 39.29 414.53 � 71.56b
BG 19.41 � 2.75 18.68 � 2.52 18.04 � 2.93Th 9.83 � 1.92b 9.14 � 1.98 7.91 � 1.88b
CL 0.00 � 0.00b 0.12 � 0.11 0.22 � 0.36b
T2H 0.00 � 0.00b 9.37 � 10.02 13.47 � 13.30b
T1bh 0.00 � 0.00b 3.21 � 2.98 5.85 � 6.77b
CSF 320.89 � 210.43b 353.22 � 131.71 400.29 � 173.78b
Neurocognitive tests (z score)COWAT-FAS �0.67 � 0.83 �0.26 � 1.06c �1.16 � 0.89c
COWAT-Animals �0.13 � 1.14 �0.41 � 0.95c �0.59 � 1.18c
BVMT-IR �0.37 � 1.15b �0.07 � 1.04c �1.68 � 1.34b,c
BVMT-DR �0.40 � 1.14b �0.42 � 0.77c �1.62 � 1.48b,c
PASAT-3 �0.39 � 0.94b �0.05 � 0.61c �1.71 � 0.82b,c
PASAT-2 �0.21 � 0.89b �0.26 � 0.66c �1.80 � 0.57b,c
JLO �0.98 � 0.20 �0.83 � 0.56 �0.40 � 0.67SDMT �0.14 � 0.92b �0.02 � 0.75c �1.80 � 1.17b,c
CVLT II-IR �0.25 � 1.05b �0.23 � 1.04c �1.94 � 1.36b,c
CVLT II-DR �0.11 � 0.66b �0.21 � 0.92c �2.20 � 1.61b,c
DKEFS-ST �0.51 � 0.73 �0.26 � 0.61 �0.20 � 1.25
Note:—NA indicates not applicable; EDSS, Expanded Disability Status Score; HADS, Hospital Anxiety and DepressionScale; COWAT, Controlled Oral Word Association Test; BVMT, Brief Visuospatial Test- Revised; PASAT, Paced AuditorySerial Addition Test; JLO, Judgment of Line Orientation Test; SDMT, Symbol Digit Modalities Test; CVLT II, CaliforniaVerbal Learning Test-II; IR, immediate recall; DR, delayed recall; DKEFS-ST, Delis-Kaplan Executive Function SystemSorting Test; BG, basal ganglia; Th, thalamus; CL, cortical lesions; T2H, T2 hyperintensities; T1bh, T1 black holes.a Significance at P �.017, corrected for multiple comparisons; all values are means unless specified.b Healthy controls vs patients with RRMS with cognitive impairment..c Patients with RRMS without impairment vs those with cognitive impairment.d Healthy controls vs patients with RRMS without impairment.
AJNR Am J Neuroradiol 37:1800 – 07 Oct 2016 www.ajnr.org 1803
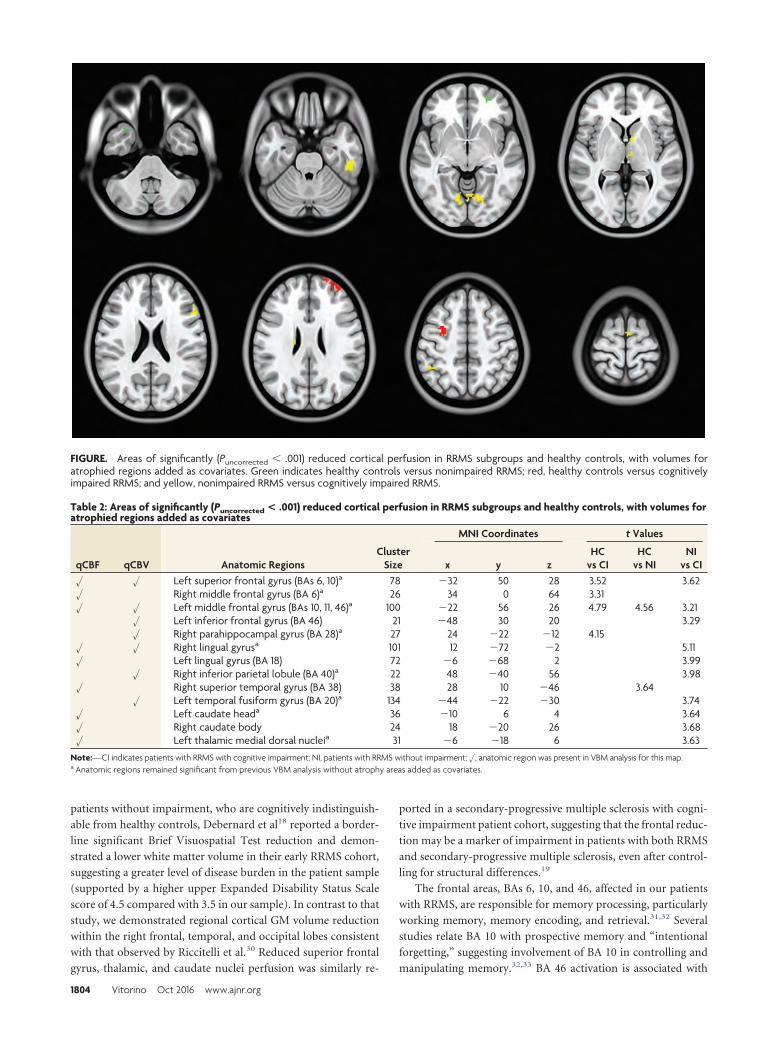
patients without impairment, who are cognitively indistinguish-
able from healthy controls, Debernard et al18 reported a border-
line significant Brief Visuospatial Test reduction and demon-
strated a lower white matter volume in their early RRMS cohort,
suggesting a greater level of disease burden in the patient sample
(supported by a higher upper Expanded Disability Status Scale
score of 4.5 compared with 3.5 in our sample). In contrast to that
study, we demonstrated regional cortical GM volume reduction
within the right frontal, temporal, and occipital lobes consistent
with that observed by Riccitelli et al.30 Reduced superior frontal
gyrus, thalamic, and caudate nuclei perfusion was similarly re-
ported in a secondary-progressive multiple sclerosis with cogni-
tive impairment patient cohort, suggesting that the frontal reduc-
tion may be a marker of impairment in patients with both RRMS
and secondary-progressive multiple sclerosis, even after control-
ling for structural differences.19
The frontal areas, BAs 6, 10, and 46, affected in our patients
with RRMS, are responsible for memory processing, particularly
working memory, memory encoding, and retrieval.31,32 Several
studies relate BA 10 with prospective memory and “intentional
forgetting,” suggesting involvement of BA 10 in controlling and
manipulating memory.32,33 BA 46 activation is associated with
FIGURE. Areas of significantly (Puncorrected � .001) reduced cortical perfusion in RRMS subgroups and healthy controls, with volumes foratrophied regions added as covariates. Green indicates healthy controls versus nonimpaired RRMS; red, healthy controls versus cognitivelyimpaired RRMS; and yellow, nonimpaired RRMS versus cognitively impaired RRMS.
Table 2: Areas of significantly (Puncorrected < .001) reduced cortical perfusion in RRMS subgroups and healthy controls, with volumes foratrophied regions added as covariates
qCBF qCBV Anatomic RegionsCluster
Size
MNI Coordinates t Values
x y zHC
vs CIHC
vs NINI
vs CI� � Left superior frontal gyrus (BAs 6, 10)a 78 �32 50 28 3.52 3.62� Right middle frontal gyrus (BA 6)a 26 34 0 64 3.31� � Left middle frontal gyrus (BAs 10, 11, 46)a 100 �22 56 26 4.79 4.56 3.21
� Left inferior frontal gyrus (BA 46) 21 �48 30 20 3.29� Right parahippocampal gyrus (BA 28)a 27 24 �22 �12 4.15
� � Right lingual gyrusa 101 12 �72 �2 5.11� Left lingual gyrus (BA 18) 72 �6 �68 2 3.99
� Right inferior parietal lobule (BA 40)a 22 48 �40 56 3.98� Right superior temporal gyrus (BA 38) 38 28 10 �46 3.64
� Left temporal fusiform gyrus (BA 20)a 134 �44 �22 �30 3.74� Left caudate heada 36 �10 6 4 3.64� Right caudate body 24 18 �20 26 3.68� Left thalamic medial dorsal nucleia 31 �6 �18 6 3.63
Note:—CI indicates patients with RRMS with cognitive impairment; NI, patients with RRMS without impairment; �, anatomic region was present in VBM analysis for this map.a Anatomic regions remained significant from previous VBM analysis without atrophy areas added as covariates.
1804 Vitorino Oct 2016 www.ajnr.org
working memory processes and memory manipulation.31,33 It has
been assumed that working memory is involved in a diversity of
cognitive processes, including planning,34 reasoning,35 and prob-
lem-solving.36 On the other hand, involvement of BA 6 in mem-
ory and attention may be due to the activation of an extended
brain network in which the middle frontal gyrus has a fundamen-
tal task in memory strategy organization and memory control.37
Hypoperfusion (qCBF and qCBV) in the left middle frontal and
right superior temporal gyri with preservation of perfusion within
the remaining medial prefrontal cortex in patients with RRMS
who are nonimpaired compared with those who are cognitively
impaired likely reflects increased cortical plasticity, because the
medial prefrontal cortex has been previously shown to adaptively
compensate for functional impairment in patients with MS.38 Pa-
tients with RRMS and secondary-progressive multiple sclerosis
performing a processing speed and attention task (Counting
Stroop Task) were found to have activation predominantly in the
left medial frontal region (left middle frontal gyrus/superior fron-
tal sulcus and bilateral superior frontal gyri, corresponding to BAs
8, 9, 10), while HC had greater right frontal activation (inferior
frontal gyrus, BA 45; and right basal ganglia).38
Last, BAs 28 and 38 are also implicated in memory, particu-
larly nonverbal memory (right parahippocampal gyrus)39 and
multimodal memory retrieval (superior temporal gyrus).40 Sup-
porting the validity of the structural and progressive perfusion
differences in patients with RRMS with cognitive impairment
described above, significant impairment in working memory
(Paced Auditory Serial Addition Test and Symbol Digit Mo-
dalities Test), visual and verbal learning, and memory retrieval
(Brief Visual Memory Test-Revised and California Verbal
Learning Test-II) was present compared with patients who
were nonimpaired and HC.
Our VBM analysis by necessity controlled for a number of
important potential confounding covariates; for example, the ef-
fect of depression was accounted for by the inclusion of Hosptial
Anxiety and Depression Scale. Differing educational levels among
cohorts was accounted for by the “normalization” of raw neuro-
cognitive battery scores against representative population data-
sets. Cortical lesions and, to a lesser extent, T2 hyperintense lesion
burden are both implicated in cognitive impairment of patients
with MS. Comparisons between patient groups and HC included
lesion volumes as covariates in our VBM analysis. However, no
significant difference in lesion burden was present between MS
groups, precluding a quid pro quo comparison.
Cerebral blood volume (amount of blood in 100 g of brain
tissue) and blood flow (amount of blood flowing through 100 g of
brain tissue per minute) abnormalities are found in a number of
neurologic conditions such as stroke, characterized by ischemia.
The physiopathology leading to cerebral hypoperfusion is un-
known and may be multifactorial. While evidence does not sup-
port a primary neuronal loss mechanism given multiple findings
of reduced cortical perfusion in the absence of GM volume
loss,16,18,19 mitochondrial disturbances and vascular abnormali-
ties have been implicated in cerebral hypoperfusion in MS. Mito-
chondrial dysfunction can contribute to cerebral hypoperfusion
in the form of a diminished mitochondrial capacity resulting from
reductions in gene products specific for the mitochondrial elec-
tron transport chain41 or due to intra-axonal mitochondrial pa-
thology triggered by macrophage-derived reactive oxygen and ni-
trogen species, which may precede axonal damage.42 Cerebral
hypoperfusion can also be secondary to vascular abnormalities.
Increased levels of endothelin-1, a potent vasoconstrictive pep-
tide, are found in patients with MS, suggesting that cerebral blood
flow reductions are mediated by elevated levels of this peptide.43
Astrocytes of patients with MS are deficient in the �2-adrenergic
receptor, resulting in cellular metabolic dysfunction affecting po-
tassium uptake after synaptic activity and its subsequent release to
the perivascular space, thus reducing arteriolar vasodilation.44
Venous changes are also well-described in MS; and given that
venous capacitance accounts for approximately 70% of CBV, pa-
thologies that decrease venous capacitance should greatly impact
qCBV. For example, Ge et al45 demonstrated reduced visibility of
periventricular venous vasculature in patients with MS by using
susceptibility-weighted imaging. The authors suggested that this
reduction could be attributable to decreased vein number or size
secondary to venous occlusion and perivenular inflammation.
Such pathology could also be driven by obliterative vasculitis,
which preferentially disrupts venous changes.46,47 Additionally,
intrastriatal injections of proinflammatory cytokine tumor ne-
crosis factor-�, found elevated in MS brains,48 in rat models re-
sulted in significant reductions of cerebral blood flow.49 Cerebral
hypoperfusion is characterized by both blood flow and volume
changes, and these perfusion metrics may be differentially af-
fected by the physiopathologic methods proposed. Additional
studies should be conducted to explore the differences in cerebral
blood flow and volume and their relation to physiopathology.
Limitations include the need for contrast agent injection re-
quired for DSC perfusion, precluding its use in patients with con-
traindications such as renal impairment. DSC is a relatively low-
resolution technique in comparison with structural imaging but
comparable with other functional techniques such as diffusion
tensor and arterial spin-labeling techniques, which were previ-
ously applied to MS. DSC enables whole-brain scanning in ap-
proximately 2 minutes, therefore, minimally prolonging scanning
time with higher signal-to-noise than arterial spin-labeling. Be-
cause the classes of disease-modifying drugs were evenly repre-
sented in both cognitively impaired and nonimpaired groups, we
did not adjust for this factor. However, given that the effects of
such treatments on cortical perfusion abnormalities are unclear, it
would be prudent to adjust for disease-modifying drugs in future
studies if difference occurs. Similarly, fatigue, experienced by
78%–90% of patients with MS,50 may be associated with impaired
cognitive function and should be accounted for in future stud-
ies.51 Despite the relatively small sample size, consistent frontal
perfusion deficits were demonstrated in our RRMS sample. Ac-
cording to our a priori hypothesis, this comparison was uncor-
rected but included several confounders. These results should be
validated in a larger patient cohort. Longitudinal studies would
also be helpful in determining whether perfusion measurements
are sensitive to disease progression.
CONCLUSIONSConsistent regional frontal cortical perfusion deficits are found in
patients with RRMS, with more widespread hypoperfusion in
AJNR Am J Neuroradiol 37:1800 – 07 Oct 2016 www.ajnr.org 1805
cognitively impaired RRMS, independent of structural differ-
ences. Our findings suggest a potential role for cortical perfusion
as a useful biomarker of cortical dysfunction and cognitive im-
pairment in MS.
Disclosures: Charles G. Cantrell—RELATED: Grant: American Heart Association(14PRE20380810).* Liesly Lee—UNRELATED: Consultancy: Biogen Canada, NovartisCanada, Genyzme Canada, Teva Neurosciences, Serono Canada, Comments: advi-sory board member; Payment for Manuscript Preparation: Biogen Canada, Com-ments: publication of review article; Travel/Accommodations/Meeting ExpensesUnrelated to Activities Listed: Biogen Canada, Novartis Canada, Comments: travel toconferences and advisory boards; OTHER: Biogen Canada,* Novartis Canada,* TevaNeurosciences,* Comments: clinical trial funding. Timothy J. Carroll—RELATED:Grant: National Institutes of Health,* Comments: I hold a National Institutes ofHealth research grant related to cerebral perfusion; UNRELATED: Grants/GrantsPending: National Institutes of Health,* American Hospital Association,* Comments:In addition to the National Institutes of Health and American Hospital Associationgrants that support this work, I have research grants that are independent of thework presented in this article. Richard I. Aviv—RELATED: Grant: Canadian Institutesof Health Research,* Biogen.* *Money paid to the institution.
REFERENCES1. Calabrese M, De Stefano N, Atzori M, et al. Detection of cortical
inflammatory lesions by double inversion recovery magnetic reso-nance imaging in patients with multiple sclerosis. Arch Neurol 2007;64:1416 –22 CrossRef Medline
2. Calabrese M, Rocca MA, Atzori M, et al. A 3-year magnetic reso-nance imaging study of cortical lesions in relapse-onset multiplesclerosis. Ann Neurol 2010;67:376 – 83 CrossRef Medline
3. Deloire MS, Salort E, Bonnet M, et al. Cognitive impairment asmarker of diffuse brain abnormalities in early relapsing remittingmultiple sclerosis. J Neurol Neurosurg Psychiatry 2005;76:519 –26CrossRef Medline
4. Heaton RK, Nelson LM, Thompson DS, et al. Neuropsychologicalfindings in relapsing-remitting and chronic-progressive multiplesclerosis. J Consult Clin Psychol 1985;53:103–10 CrossRef Medline
5. Calabrese M, Agosta F, Rinaldi F, et al. Cortical lesions and atrophyassociated with cognitive impairment in relapsing-remitting mul-tiple sclerosis. Arch Neurol 2009;66:1144 –50 Medline
6. Rao SM, Leo GJ, Bernardin L, et al. Cognitive dysfunction in multi-ple sclerosis, I: frequency, patterns, and prediction. Neurology 1991;41:685–91 CrossRef Medline
7. Calabrese M, Gallo P. Magnetic resonance evidence of cortical onsetof multiple sclerosis. Mult Scler 2009;15:933– 41 CrossRef Medline
8. Calabrese M, Poretto V, Favaretto A, et al. Cortical lesion load asso-ciates with progression of disability in multiple sclerosis. Brain2012;135(pt 10):2952– 61 CrossRef Medline
9. Seewann A, Enzinger C, Filippi M, et al. MRI characteristics of atyp-ical idiopathic inflammatory demyelinating lesions of the brain: areview of reported findings. J Neurol 2008;255:1–10 Medline
10. Tardif CL, Bedell BJ, Eskildsen SF, et al. Quantitative magnetic res-onance imaging of cortical multiple sclerosis pathology. Mult SclerInt 2012;2012:742018 CrossRef Medline
11. Chen JT, Easley K, Schneider C, et al. Clinically feasible MTR is sen-sitive to cortical demyelination in MS. Neurology 2013;80:246 –52CrossRef Medline
12. Poonawalla AH, Hasan KM, Gupta RK, et al. Diffusion-tensor MRimaging of cortical lesions in multiple sclerosis: initial findings. Ra-diology 2008;246:880 – 86 CrossRef Medline
13. Calabrese M, Rinaldi F, Seppi D, et al. Cortical diffusion-tensor im-aging abnormalities in multiple sclerosis: a 3-year longitudinalstudy. Radiology 2011;261:891–98 CrossRef Medline
14. Shin W, Horowitz S, Ragin A, et al. Quantitative cerebral perfusionusing dynamic susceptibility contrast MRI: evaluation of reproduc-ibility and age- and gender-dependence with fully automatic imagepostprocessing algorithm. Magn Reson Med 2007;58:1232– 41CrossRef Medline
15. Vakil P, Lee JJ, Mouannes-Srour JJ, et al. Cerebrovascular occlusive
disease: quantitative cerebral blood flow using dynamic suscepti-bility contrast MR imaging correlates with quantitative H2[15O]PET. Radiology 2013;266:879 – 86 CrossRef Medline
16. Aviv RI, Francis PL, Tenenbein R, et al. Decreased frontal lobe graymatter perfusion in cognitively impaired patients with secondary-progressive multiple sclerosis detected by the bookend technique.AJNR Am J Neuroradiol 2012;33:1779 – 85 CrossRef Medline
17. Rashid W, Parkes LM, Ingle GT, et al. Abnormalities of cerebralperfusion in multiple sclerosis. J Neurol Neurosurg Psychiatry 2004;75:1288 –93 CrossRef Medline
18. Debernard L, Melzer TR, Van Stockum S, et al. Reduced grey matterperfusion without volume loss in early relapsing-remitting multi-ple sclerosis. J Neurol Neurosurg Psychiatry 2014;85:544 –51 CrossRefMedline
19. Francis PL, Jakubovic R, O’Connor P, et al. Robust perfusion deficitsin cognitively impaired patients with secondary-progressive multi-ple sclerosis. AJNR Am J Neuroradiol 2013;34:62– 67 CrossRefMedline
20. Hojjat SP CC, Vitorino R, Feinstein A, et al. Regional reduction incortical blood flow among cognitively impaired adults with relaps-ing-remitting multiple sclerosis patients. Mult Scler 2016 Jan 11.[Epub ahead of print] Medline
21. Hojjat SP CC, Carroll TJ, Vitorino R, et al. Perfusion reduction in theabsence of structural differences in cognitively impaired versus un-impaired RRMS patients. Mult Sclel 2016 Feb 4. [Epub ahead ofprint] Medline
22. Polman CH, Reingold SC, Banwell B, et al. Diagnostic criteria formultiple sclerosis: 2010 revisions to the McDonald criteria. AnnNeurol 2011;69:292–302 CrossRef Medline
23. Kurtzke JF. Rating neurologic impairment in multiple sclerosis: anexpanded disability status scale (EDSS). Neurology 1983;33:1444 –52CrossRef Medline
24. Benedict RH, Fischer JS, Archibald CJ, et al. Minimal neuropsycho-logical assessment of MS patients: a consensus approach. Clin Neu-ropsychol 2002;16:381–97 CrossRef Medline
25. Benedict RH, Bruce JM, Dwyer MG, et al. Neocortical atrophy, thirdventricular width, and cognitive dysfunction in multiple sclerosis.Arch Neurol 2006;63:1301– 06 CrossRef Medline
26. Shah MK, Shin W, Parikh VS, et al. Quantitative cerebral MR perfu-sion imaging: preliminary results in stroke. J Magn Reson Imaging2010;32:796 – 802 CrossRef Medline
27. Ashburner J, Friston KJ. Unified segmentation. Neuroimage 2005;26:839 –51 CrossRef Medline
28. Ashburner J. A fast diffeomorphic image registration algorithm.Neuroimage 2007;38:95–113 CrossRef Medline
29. Jenkinson M, Beckmann CF, Behrens TE, et al. FSL. Neuroimage2012;62:782–90 CrossRef Medline
30. Riccitelli G, Rocca MA, Pagani E, et al. Mapping regional grey andwhite matter atrophy in relapsing-remitting multiple sclerosis.Mult Scler 2012;18:1027–37 CrossRef Medline
31. Ranganath C, Johnson MK, D’Esposito M. Prefrontal activity asso-ciated with working memory and episodic long-term memory.Neuropsychologia 2003;41:378 – 89 CrossRef Medline
32. Leung HC, Gore JC, Goldman-Rakic PS. Sustained mnemonic re-sponse in the human middle frontal gyrus during on-line storage ofspatial memoranda. J Cogn Neurosci 2002;14:659 –71 CrossRefMedline
33. Zhang JX, Leung HC, Johnson MK. Frontal activations associatedwith accessing and evaluating information in working memory: anfMRI study. Neuroimage 2003;20:1531–39 CrossRef Medline
34. Law AS, Trawley SL, Brown LA, et al. The impact of working memoryload on task execution and online plan adjustment during multi-tasking in a virtual environment. Q J Exp Psychol (Hove) 2013;66:1241–58 CrossRef Medline
35. Suss HM, Oberauer K, Wittmann WW, et al. Working-memory ca-pacity explains reasoning ability—and a little bit more. Intelligence2002;30:161–288 CrossRef
1806 Vitorino Oct 2016 www.ajnr.org
36. Wiley J, Jarosz AF. Working memory capacity, attentional focus,and problem solving. Curr Dir Psychol Sci 2012;21:258 – 62 CrossRef
37. Haxby JV, Petit L, Ungerleider LG, et al. Distinguishing the functionalroles of multiple regions in distributed neural systems for visual work-ing memory. Neuroimage 2000;11(5 pt 1):380–91 CrossRef Medline
38. Parry AM, Scott RB, Palace J, et al. Potentially adaptive functionalchanges in cognitive processing for patients with multiple sclerosisand their acute modulation by rivastigmine. Brain 2003;126(pt 12):2750 – 60 CrossRef Medline
39. Kohler S, Black SE, Sinden M, et al. Memory impairments associatedwith hippocampal versus parahippocampal-gyrus atrophy: an MRvolumetry study in Alzheimer’s disease. Neuropsychologia 1998;36:901–14 CrossRef Medline
40. Takashima A, Nieuwenhuis IL, Rijpkema M, et al. Memory tracestabilization leads to large-scale changes in the retrieval network: afunctional MRI study on associative memory. Learn Mem 2007;14:472–79 CrossRef Medline
41. Dutta R, McDonough J, Yin X, et al. Mitochondrial dysfunction as acause of axonal degeneration in multiple sclerosis patients. AnnNeurol 2006;59:478 – 89 CrossRef Medline
42. Nikic I, Merkler D, Sorbara C, et al. A reversible form of axon dam-age in experimental autoimmune encephalomyelitis and multiplesclerosis. Nat Med 2011;17:495–99 CrossRef Medline
43. D’Haeseleer M, Hostenbach S, Peeters I, et al. Cerebral hy-poperfusion: a new pathophysiologic concept in multiple sclerosis?J Cereb Blood Flow Metab 2015;35:1406 –10 CrossRef Medline
44. De Keyser J, Steen C, Mostert JP, et al. Hypoperfusion of the cerebralwhite matter in multiple sclerosis: possible mechanisms and patho-physiological significance. J Cereb Blood Flow Metab 2008;28:1645–51 CrossRef Medline
45. Ge Y, Zohrabian VM, Osa EO, et al. Diminished visibility of cerebralvenous vasculature in multiple sclerosis by susceptibility-weightedimaging at 3.0 Tesla. J Magn Reson Imaging 2009;29:1190 –94CrossRef Medline
46. Tanaka R, Iwasaki Y, Koprowski H. Ultrastructural studies ofperivascular cuffing cells in multiple sclerosis brain. Am J Pathol1975;81:467–78 Medline
47. Adams CW, Poston RN, Buk SJ, et al. Inflammatory vasculitis inmultiple sclerosis. J Neurol Sci 1985;69:269 – 83 CrossRef Medline
48. Woodroofe MN, Cuzner ML. Cytokine mRNA expression in inflam-matory multiple sclerosis lesions: detection by non-radioactive insitu hybridization. Cytokin 1993;5:583– 88 Medline
49. Sibson NR, Blamire AM, Perry VH, et al. TNF-alpha reduces cerebralblood volume and disrupts tissue homeostasis via an endothelin-and TNFR2-dependent pathway. Brain 2002;125(pt 11):2446 –59CrossRef Medline
50. Fisk JD, Pontefract A, Ritvo PG, et al. The impact of fatigue on pa-tients with multiple sclerosis. Can J Neurol Sci 1994;21:9 –14CrossRef Medline
51. Krupp LB, Elkins LE. Fatigue and declines in cognitive functioningin multiple sclerosis. Neurology 2000;55:934 –39 CrossRef Medline
AJNR Am J Neuroradiol 37:1800 – 07 Oct 2016 www.ajnr.org 1807
ORIGINAL RESEARCHADULT BRAIN
In Vivo 7T MR Quantitative Susceptibility Mapping RevealsOpposite Susceptibility Contrast between Cortical and White
Matter Lesions in Multiple SclerosisX W. Bian, X E. Tranvinh, X T. Tourdias, X M. Han, X T. Liu, X Y. Wang, X B. Rutt, and X M.M. Zeineh
ABSTRACT
BACKGROUND AND PURPOSE: Magnetic susceptibility measured with quantitative susceptibility mapping has been proposed as abiomarker for demyelination and inflammation in patients with MS, but investigations have mostly been on white matter lesions. Adetailed characterization of cortical lesions has not been performed. The purpose of this study was to evaluate magnetic susceptibility inboth cortical and WM lesions in MS by using quantitative susceptibility mapping.
MATERIALS AND METHODS: Fourteen patients with MS were scanned on a 7T MR imaging scanner with T1-, T2-, and T2*-weightedsequences. The T2*-weighted sequence was used to perform quantitative susceptibility mapping and generate tissue susceptibility maps.The susceptibility contrast of a lesion was quantified as the relative susceptibility between the lesion and its adjacent normal-appearingparenchyma. The susceptibility difference between cortical and WM lesions was assessed by using a t test.
RESULTS: The mean relative susceptibility was significantly negative for cortical lesions (P � 10�7) but positive for WM lesions (P � 10�22).A similar pattern was also observed in the cortical (P � .054) and WM portions (P � .043) of mixed lesions.
CONCLUSIONS: The negative susceptibility in cortical lesions suggests that iron loss dominates the susceptibility contrast in corticallesions. The opposite susceptibility contrast between cortical and WM lesions may reflect both their structural (degree of myelination) andpathologic (degree of inflammation) differences, in which the latter may lead to a faster release of iron in cortical lesions.
ABBREVIATIONS: MPFLAIR � magnetization-prepared fluid-attenuated inversion recovery; QSM � quantitative susceptibility mapping
Multiple sclerosis is a debilitating chronic inflammatory
disorder of the central nervous system. MS pathogenesis
is not fully understood and is thought to involve the whole
brain. While previous MS imaging studies have been largely
focused on white matter, recent investigations have focused on
the importance of cortical gray matter damage,1 because cor-
tical lesions may be more relevant to physical and cognitive
disability in patients than WM lesions.2 This difference raises
questions about the various underlying pathologic aspects of
cortical and WM lesions. Histochemical staining has shown
that cortical lesions have a lower degree of inflammation3 and
blood-brain barrier damage than WM lesions,4 implying that
the cortical lesion may be partly independent of inflamma-
tion.5 Because it is useful to evaluate cortical and WM lesions
in vivo across the whole brain, MR imaging is an important
tool that complements histochemical staining.
While traditional water content– and proton mobility– based
MR imaging modalities show similar abnormalities for both cor-
tical and WM lesions, advanced high-field-strength MR imaging
with susceptibility-weighted contrasts such as R2*/T2* mapping
and quantitative susceptibility mapping (QSM) may have the po-
tential to discriminate features of cortical and WM lesions. In
active and chronic WM lesions, 7T MR imaging studies have
shown that regions with decreased R2* and increased magnetic
susceptibility correspond to histologically verified regions with
demyelination- and/or inflammation-associated iron accumula-
tion.6-9 More recently, R2*/T2* mapping at 7T has shown de-
Received December 21, 2015; accepted after revision April 4, 2016.
From the Departments of Radiology (W.B., E.T., B.R., M.M.Z.) and Neurology (M.H.),Stanford University School of Medicine, Palo Alto, California; Service de NeuroIm-agerie Diagnostique et Therapeutique (T.T.), Centre Hospitalier Universitaire deBordeaux, Bordeaux Cedex, France; Institut National de la Sante et de la RechercheMedicale U 862 (T.T.), Universite de Bordeaux, Bordeaux Cedex, France; and De-partment of Radiology (T.L., Y.W.), Weill Medical College of Cornell University,New York, New York.
This work was supported by GE Healthcare (B.R. and M.M.Z.); National Institutes ofHealth grants P41EB015891 (B.R. and M.M.Z), S10RR026351 (B.R. and M.M.Z), andRO1NS090464 (Y.W.); and grants from Association pour l’aide a la Recherche con-tre la Sclerose en Plaques and Translational Advanced Imaging Laboratory (T.T).
Please address correspondence to M.M. Zeineh, MD, PhD, Department of Radiol-ogy, Stanford University School of Medicine, Lucas Center for Imaging, Room P271,1201 Welch Rd, Stanford, CA 94305-5488; e-mail: [email protected]
Indicates open access to non-subscribers at www.ajnr.org
http://dx.doi.org/10.3174/ajnr.A4830
1808 Bian Oct 2016 www.ajnr.org
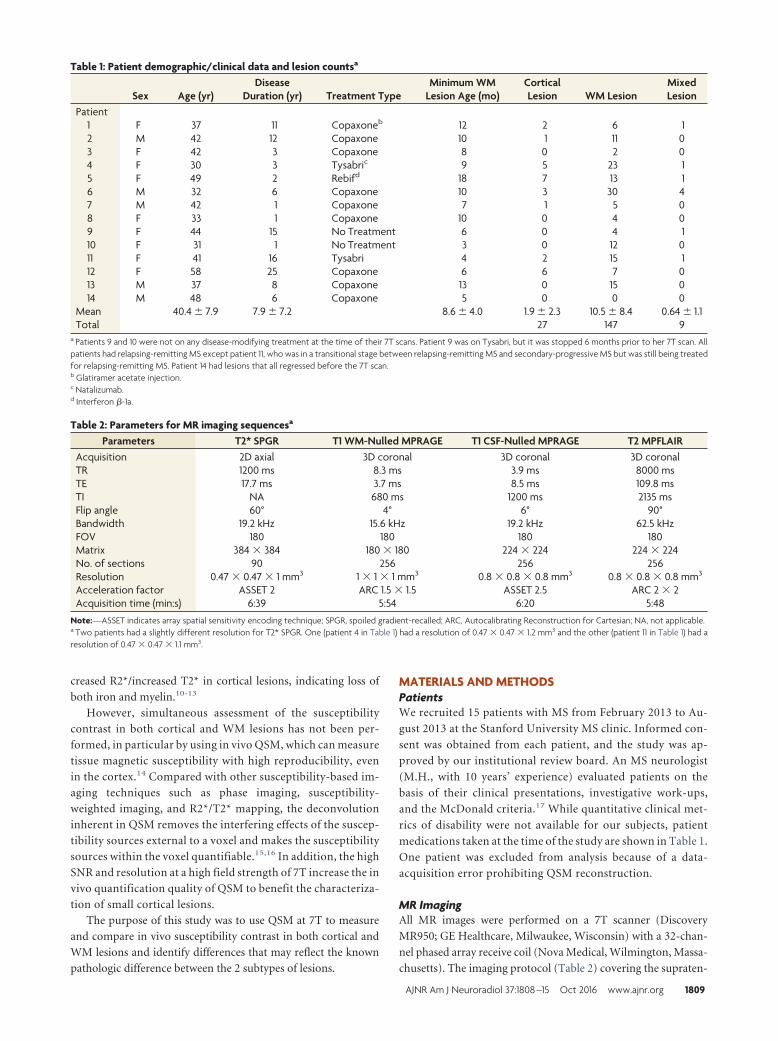
creased R2*/increased T2* in cortical lesions, indicating loss of
both iron and myelin.10-13
However, simultaneous assessment of the susceptibility
contrast in both cortical and WM lesions has not been per-
formed, in particular by using in vivo QSM, which can measure
tissue magnetic susceptibility with high reproducibility, even
in the cortex.14 Compared with other susceptibility-based im-
aging techniques such as phase imaging, susceptibility-
weighted imaging, and R2*/T2* mapping, the deconvolution
inherent in QSM removes the interfering effects of the suscep-
tibility sources external to a voxel and makes the susceptibility
sources within the voxel quantifiable.15,16 In addition, the high
SNR and resolution at a high field strength of 7T increase the in
vivo quantification quality of QSM to benefit the characteriza-
tion of small cortical lesions.
The purpose of this study was to use QSM at 7T to measure
and compare in vivo susceptibility contrast in both cortical and
WM lesions and identify differences that may reflect the known
pathologic difference between the 2 subtypes of lesions.
MATERIALS AND METHODSPatientsWe recruited 15 patients with MS from February 2013 to Au-
gust 2013 at the Stanford University MS clinic. Informed con-
sent was obtained from each patient, and the study was ap-
proved by our institutional review board. An MS neurologist
(M.H., with 10 years’ experience) evaluated patients on the
basis of their clinical presentations, investigative work-ups,
and the McDonald criteria.17 While quantitative clinical met-
rics of disability were not available for our subjects, patient
medications taken at the time of the study are shown in Table 1.
One patient was excluded from analysis because of a data-
acquisition error prohibiting QSM reconstruction.
MR ImagingAll MR images were performed on a 7T scanner (Discovery
MR950; GE Healthcare, Milwaukee, Wisconsin) with a 32-chan-
nel phased array receive coil (Nova Medical, Wilmington, Massa-
chusetts). The imaging protocol (Table 2) covering the supraten-
Table 1: Patient demographic/clinical data and lesion countsa
Sex Age (yr)Disease
Duration (yr) Treatment TypeMinimum WM
Lesion Age (mo)CorticalLesion WM Lesion
MixedLesion
Patient1 F 37 11 Copaxoneb 12 2 6 12 M 42 12 Copaxone 10 1 11 03 F 42 3 Copaxone 8 0 2 04 F 30 3 Tysabric 9 5 23 15 F 49 2 Rebifd 18 7 13 16 M 32 6 Copaxone 10 3 30 47 M 42 1 Copaxone 7 1 5 08 F 33 1 Copaxone 10 0 4 09 F 44 15 No Treatment 6 0 4 110 F 31 1 No Treatment 3 0 12 011 F 41 16 Tysabri 4 2 15 112 F 58 25 Copaxone 6 6 7 013 M 37 8 Copaxone 13 0 15 014 M 48 6 Copaxone 5 0 0 0
Mean 40.4 � 7.9 7.9 � 7.2 8.6 � 4.0 1.9 � 2.3 10.5 � 8.4 0.64 � 1.1Total 27 147 9
a Patients 9 and 10 were not on any disease-modifying treatment at the time of their 7T scans. Patient 9 was on Tysabri, but it was stopped 6 months prior to her 7T scan. Allpatients had relapsing-remitting MS except patient 11, who was in a transitional stage between relapsing-remitting MS and secondary-progressive MS but was still being treatedfor relapsing-remitting MS. Patient 14 had lesions that all regressed before the 7T scan.b Glatiramer acetate injection.c Natalizumab.d Interferon �-1a.
Table 2: Parameters for MR imaging sequencesa
Parameters T2* SPGR T1 WM-Nulled MPRAGE T1 CSF-Nulled MPRAGE T2 MPFLAIRAcquisition 2D axial 3D coronal 3D coronal 3D coronalTR 1200 ms 8.3 ms 3.9 ms 8000 msTE 17.7 ms 3.7 ms 8.5 ms 109.8 msTI NA 680 ms 1200 ms 2135 msFlip angle 60° 4° 6° 90°Bandwidth 19.2 kHz 15.6 kHz 19.2 kHz 62.5 kHzFOV 180 180 180 180Matrix 384 � 384 180 � 180 224 � 224 224 � 224No. of sections 90 256 256 256Resolution 0.47 � 0.47 � 1 mm3 1 � 1 � 1 mm3 0.8 � 0.8 � 0.8 mm3 0.8 � 0.8 � 0.8 mm3
Acceleration factor ASSET 2 ARC 1.5 � 1.5 ASSET 2.5 ARC 2 � 2Acquisition time (min:s) 6:39 5:54 6:20 5:48
Note:—ASSET indicates array spatial sensitivity encoding technique; SPGR, spoiled gradient-recalled; ARC, Autocalibrating Reconstruction for Cartesian; NA, not applicable.a Two patients had a slightly different resolution for T2* SPGR. One (patient 4 in Table 1) had a resolution of 0.47 � 0.47 � 1.2 mm3 and the other (patient 11 in Table 1) had aresolution of 0.47 � 0.47 � 1.1 mm3.
AJNR Am J Neuroradiol 37:1808 –15 Oct 2016 www.ajnr.org 1809
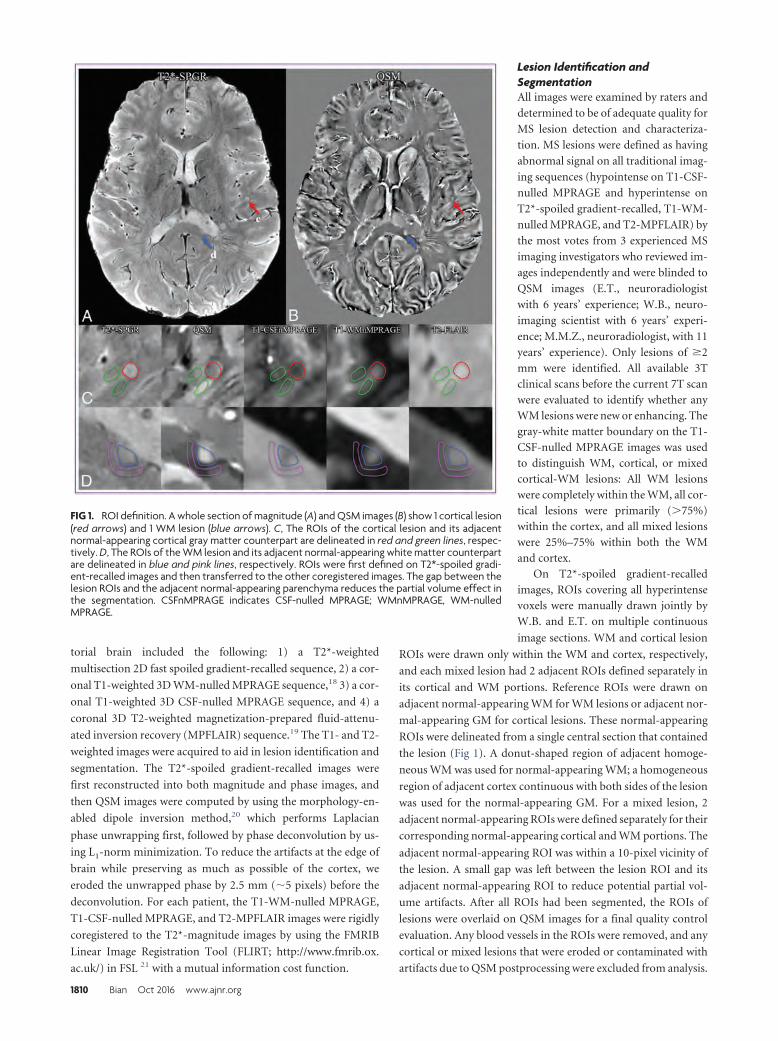
torial brain included the following: 1) a T2*-weighted
multisection 2D fast spoiled gradient-recalled sequence, 2) a cor-
onal T1-weighted 3D WM-nulled MPRAGE sequence,18 3) a cor-
onal T1-weighted 3D CSF-nulled MPRAGE sequence, and 4) a
coronal 3D T2-weighted magnetization-prepared fluid-attenu-
ated inversion recovery (MPFLAIR) sequence.19 The T1- and T2-
weighted images were acquired to aid in lesion identification and
segmentation. The T2*-spoiled gradient-recalled images were
first reconstructed into both magnitude and phase images, and
then QSM images were computed by using the morphology-en-
abled dipole inversion method,20 which performs Laplacian
phase unwrapping first, followed by phase deconvolution by us-
ing L1-norm minimization. To reduce the artifacts at the edge of
brain while preserving as much as possible of the cortex, we
eroded the unwrapped phase by 2.5 mm (�5 pixels) before the
deconvolution. For each patient, the T1-WM-nulled MPRAGE,
T1-CSF-nulled MPRAGE, and T2-MPFLAIR images were rigidly
coregistered to the T2*-magnitude images by using the FMRIB
Linear Image Registration Tool (FLIRT; http://www.fmrib.ox.
ac.uk/) in FSL 21 with a mutual information cost function.
Lesion Identification andSegmentationAll images were examined by raters and
determined to be of adequate quality for
MS lesion detection and characteriza-
tion. MS lesions were defined as having
abnormal signal on all traditional imag-
ing sequences (hypointense on T1-CSF-
nulled MPRAGE and hyperintense on
T2*-spoiled gradient-recalled, T1-WM-
nulled MPRAGE, and T2-MPFLAIR) by
the most votes from 3 experienced MS
imaging investigators who reviewed im-
ages independently and were blinded to
QSM images (E.T., neuroradiologist
with 6 years’ experience; W.B., neuro-
imaging scientist with 6 years’ experi-
ence; M.M.Z., neuroradiologist, with 11
years’ experience). Only lesions of �2mm were identified. All available 3Tclinical scans before the current 7T scanwere evaluated to identify whether anyWM lesions were new or enhancing. Thegray-white matter boundary on the T1-CSF-nulled MPRAGE images was usedto distinguish WM, cortical, or mixedcortical-WM lesions: All WM lesionswere completely within the WM, all cor-tical lesions were primarily (�75%)within the cortex, and all mixed lesionswere 25%–75% within both the WMand cortex.
On T2*-spoiled gradient-recalledimages, ROIs covering all hyperintensevoxels were manually drawn jointly byW.B. and E.T. on multiple continuous
image sections. WM and cortical lesion
ROIs were drawn only within the WM and cortex, respectively,
and each mixed lesion had 2 adjacent ROIs defined separately in
its cortical and WM portions. Reference ROIs were drawn on
adjacent normal-appearing WM for WM lesions or adjacent nor-
mal-appearing GM for cortical lesions. These normal-appearing
ROIs were delineated from a single central section that contained
the lesion (Fig 1). A donut-shaped region of adjacent homoge-
neous WM was used for normal-appearing WM; a homogeneous
region of adjacent cortex continuous with both sides of the lesion
was used for the normal-appearing GM. For a mixed lesion, 2
adjacent normal-appearing ROIs were defined separately for their
corresponding normal-appearing cortical and WM portions. The
adjacent normal-appearing ROI was within a 10-pixel vicinity of
the lesion. A small gap was left between the lesion ROI and its
adjacent normal-appearing ROI to reduce potential partial vol-
ume artifacts. After all ROIs had been segmented, the ROIs of
lesions were overlaid on QSM images for a final quality control
evaluation. Any blood vessels in the ROIs were removed, and any
cortical or mixed lesions that were eroded or contaminated with
artifacts due to QSM postprocessing were excluded from analysis.
FIG 1. ROI definition. A whole section of magnitude (A) and QSM images (B) show 1 cortical lesion(red arrows) and 1 WM lesion (blue arrows). C, The ROIs of the cortical lesion and its adjacentnormal-appearing cortical gray matter counterpart are delineated in red and green lines, respec-tively. D, The ROIs of the WM lesion and its adjacent normal-appearing white matter counterpartare delineated in blue and pink lines, respectively. ROIs were first defined on T2*-spoiled gradi-ent-recalled images and then transferred to the other coregistered images. The gap between thelesion ROIs and the adjacent normal-appearing parenchyma reduces the partial volume effect inthe segmentation. CSFnMPRAGE indicates CSF-nulled MPRAGE; WMnMPRAGE, WM-nulledMPRAGE.
1810 Bian Oct 2016 www.ajnr.org
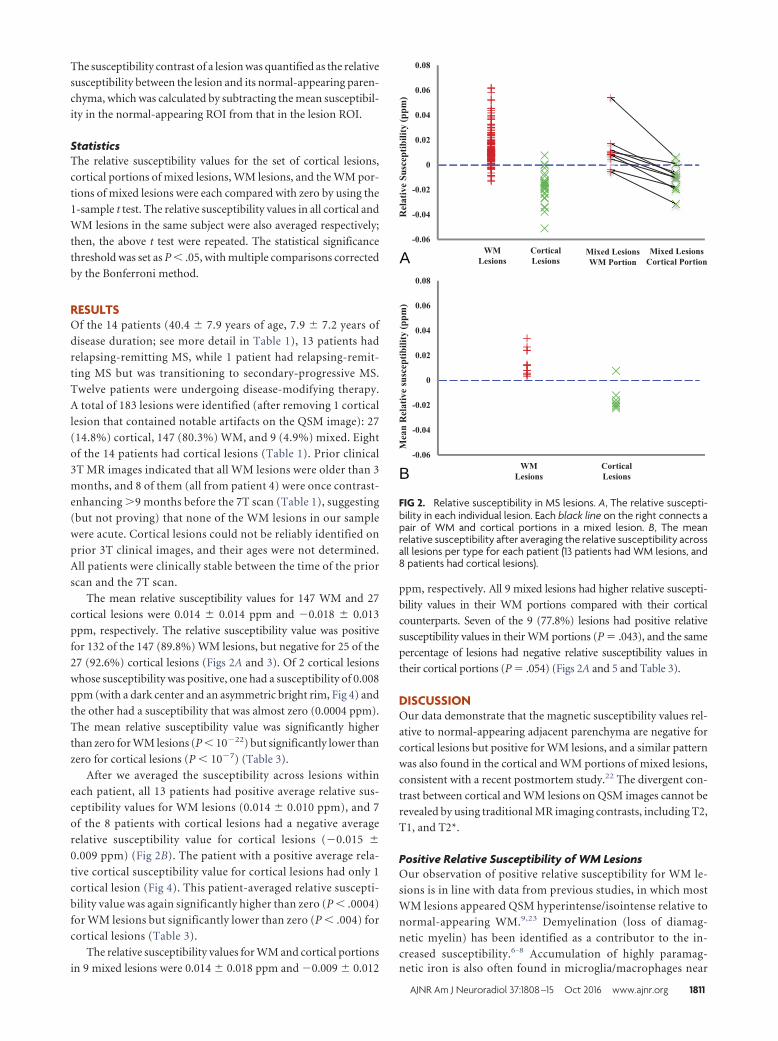
The susceptibility contrast of a lesion was quantified as the relative
susceptibility between the lesion and its normal-appearing paren-
chyma, which was calculated by subtracting the mean susceptibil-
ity in the normal-appearing ROI from that in the lesion ROI.
StatisticsThe relative susceptibility values for the set of cortical lesions,
cortical portions of mixed lesions, WM lesions, and the WM por-
tions of mixed lesions were each compared with zero by using the
1-sample t test. The relative susceptibility values in all cortical and
WM lesions in the same subject were also averaged respectively;
then, the above t test were repeated. The statistical significance
threshold was set as P � .05, with multiple comparisons corrected
by the Bonferroni method.
RESULTSOf the 14 patients (40.4 � 7.9 years of age, 7.9 � 7.2 years of
disease duration; see more detail in Table 1), 13 patients had
relapsing-remitting MS, while 1 patient had relapsing-remit-
ting MS but was transitioning to secondary-progressive MS.
Twelve patients were undergoing disease-modifying therapy.
A total of 183 lesions were identified (after removing 1 cortical
lesion that contained notable artifacts on the QSM image): 27
(14.8%) cortical, 147 (80.3%) WM, and 9 (4.9%) mixed. Eight
of the 14 patients had cortical lesions (Table 1). Prior clinical
3T MR images indicated that all WM lesions were older than 3
months, and 8 of them (all from patient 4) were once contrast-
enhancing �9 months before the 7T scan (Table 1), suggesting
(but not proving) that none of the WM lesions in our sample
were acute. Cortical lesions could not be reliably identified on
prior 3T clinical images, and their ages were not determined.
All patients were clinically stable between the time of the prior
scan and the 7T scan.
The mean relative susceptibility values for 147 WM and 27
cortical lesions were 0.014 � 0.014 ppm and �0.018 � 0.013
ppm, respectively. The relative susceptibility value was positive
for 132 of the 147 (89.8%) WM lesions, but negative for 25 of the
27 (92.6%) cortical lesions (Figs 2A and 3). Of 2 cortical lesions
whose susceptibility was positive, one had a susceptibility of 0.008
ppm (with a dark center and an asymmetric bright rim, Fig 4) and
the other had a susceptibility that was almost zero (0.0004 ppm).
The mean relative susceptibility value was significantly higher
than zero for WM lesions (P � 10�22) but significantly lower than
zero for cortical lesions (P � 10�7) (Table 3).
After we averaged the susceptibility across lesions within
each patient, all 13 patients had positive average relative sus-
ceptibility values for WM lesions (0.014 � 0.010 ppm), and 7
of the 8 patients with cortical lesions had a negative average
relative susceptibility value for cortical lesions (�0.015 �
0.009 ppm) (Fig 2B). The patient with a positive average rela-
tive cortical susceptibility value for cortical lesions had only 1
cortical lesion (Fig 4). This patient-averaged relative suscepti-
bility value was again significantly higher than zero (P � .0004)
for WM lesions but significantly lower than zero (P � .004) for
cortical lesions (Table 3).
The relative susceptibility values for WM and cortical portions
in 9 mixed lesions were 0.014 � 0.018 ppm and �0.009 � 0.012
ppm, respectively. All 9 mixed lesions had higher relative suscepti-
bility values in their WM portions compared with their cortical
counterparts. Seven of the 9 (77.8%) lesions had positive relative
susceptibility values in their WM portions (P � .043), and the same
percentage of lesions had negative relative susceptibility values in
their cortical portions (P � .054) (Figs 2A and 5 and Table 3).
DISCUSSIONOur data demonstrate that the magnetic susceptibility values rel-
ative to normal-appearing adjacent parenchyma are negative for
cortical lesions but positive for WM lesions, and a similar pattern
was also found in the cortical and WM portions of mixed lesions,
consistent with a recent postmortem study.22 The divergent con-
trast between cortical and WM lesions on QSM images cannot be
revealed by using traditional MR imaging contrasts, including T2,
T1, and T2*.
Positive Relative Susceptibility of WM LesionsOur observation of positive relative susceptibility for WM le-
sions is in line with data from previous studies, in which most
WM lesions appeared QSM hyperintense/isointense relative to
normal-appearing WM.9,23 Demyelination (loss of diamag-
netic myelin) has been identified as a contributor to the in-
creased susceptibility.6-8 Accumulation of highly paramag-netic iron is also often found in microglia/macrophages near
A
B
FIG 2. Relative susceptibility in MS lesions. A, The relative suscepti-bility in each individual lesion. Each black line on the right connects apair of WM and cortical portions in a mixed lesion. B, The meanrelative susceptibility after averaging the relative susceptibility acrossall lesions per type for each patient (13 patients had WM lesions, and8 patients had cortical lesions).
AJNR Am J Neuroradiol 37:1808 –15 Oct 2016 www.ajnr.org 1811
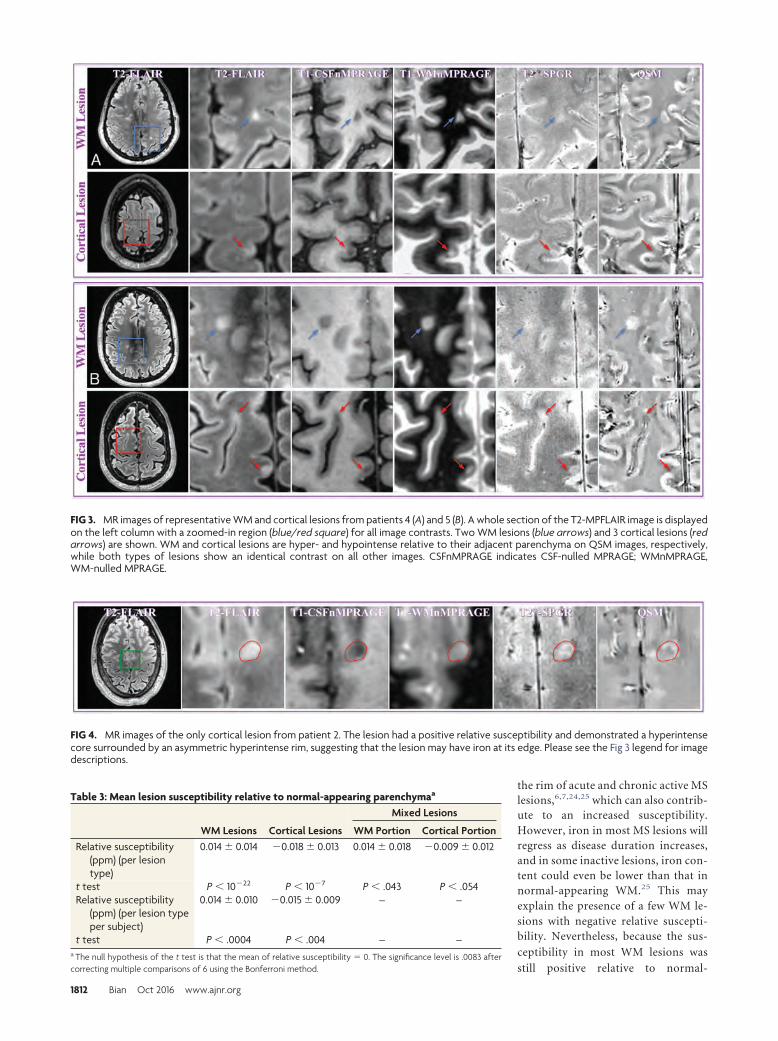
the rim of acute and chronic active MSlesions,6,7,24,25 which can also contrib-ute to an increased susceptibility.However, iron in most MS lesions willregress as disease duration increases,and in some inactive lesions, iron con-tent could even be lower than that innormal-appearing WM.25 This mayexplain the presence of a few WM le-sions with negative relative suscepti-bility. Nevertheless, because the sus-
ceptibility in most WM lesions was
still positive relative to normal-
FIG 3. MR images of representative WM and cortical lesions from patients 4 (A) and 5 (B). A whole section of the T2-MPFLAIR image is displayedon the left column with a zoomed-in region (blue/red square) for all image contrasts. Two WM lesions (blue arrows) and 3 cortical lesions (redarrows) are shown. WM and cortical lesions are hyper- and hypointense relative to their adjacent parenchyma on QSM images, respectively,while both types of lesions show an identical contrast on all other images. CSFnMPRAGE indicates CSF-nulled MPRAGE; WMnMPRAGE,WM-nulled MPRAGE.
FIG 4. MR images of the only cortical lesion from patient 2. The lesion had a positive relative susceptibility and demonstrated a hyperintensecore surrounded by an asymmetric hyperintense rim, suggesting that the lesion may have iron at its edge. Please see the Fig 3 legend for imagedescriptions.
Table 3: Mean lesion susceptibility relative to normal-appearing parenchymaa
WM Lesions Cortical Lesions
Mixed Lesions
WM Portion Cortical PortionRelative susceptibility
(ppm) (per lesiontype)
0.014 � 0.014 �0.018 � 0.013 0.014 � 0.018 �0.009 � 0.012
t test P � 10�22 P � 10�7 P � .043 P � .054Relative susceptibility
(ppm) (per lesion typeper subject)
0.014 � 0.010 �0.015 � 0.009 – –
t test P � .0004 P � .004 – –a The null hypothesis of the t test is that the mean of relative susceptibility � 0. The significance level is .0083 aftercorrecting multiple comparisons of 6 using the Bonferroni method.
1812 Bian Oct 2016 www.ajnr.org
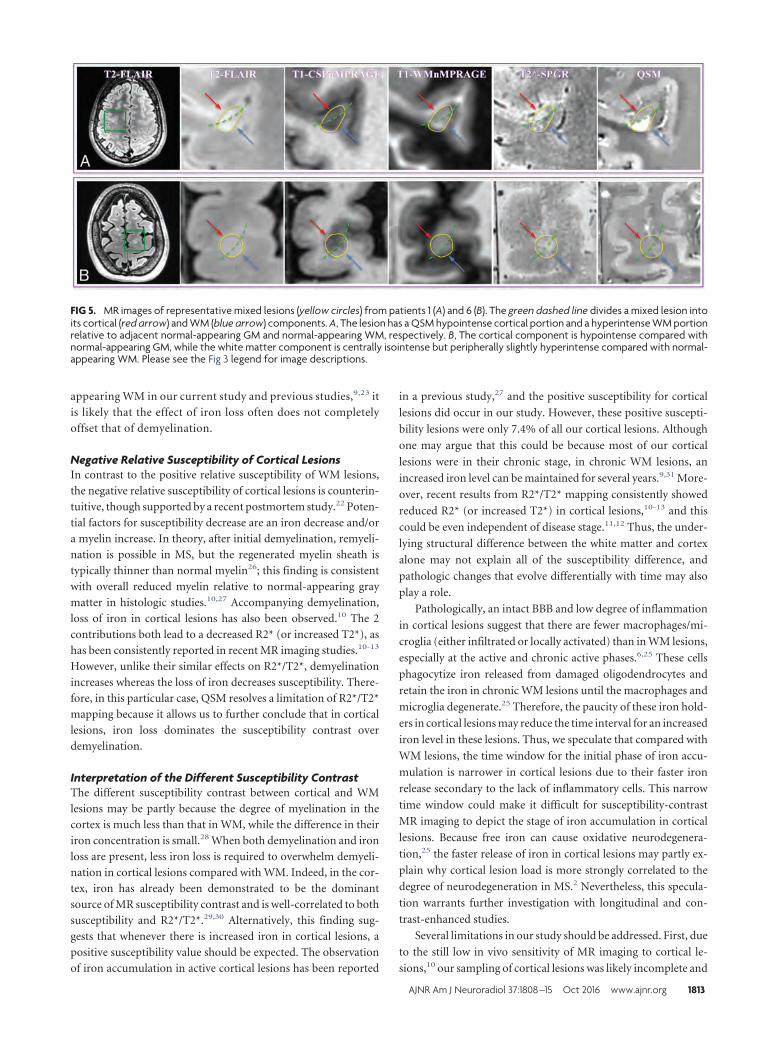
appearing WM in our current study and previous studies,9,23 it
is likely that the effect of iron loss often does not completely
offset that of demyelination.
Negative Relative Susceptibility of Cortical LesionsIn contrast to the positive relative susceptibility of WM lesions,
the negative relative susceptibility of cortical lesions is counterin-
tuitive, though supported by a recent postmortem study.22 Poten-
tial factors for susceptibility decrease are an iron decrease and/or
a myelin increase. In theory, after initial demyelination, remyeli-
nation is possible in MS, but the regenerated myelin sheath is
typically thinner than normal myelin26; this finding is consistent
with overall reduced myelin relative to normal-appearing gray
matter in histologic studies.10,27 Accompanying demyelination,
loss of iron in cortical lesions has also been observed.10 The 2
contributions both lead to a decreased R2* (or increased T2*), as
has been consistently reported in recent MR imaging studies.10-13
However, unlike their similar effects on R2*/T2*, demyelination
increases whereas the loss of iron decreases susceptibility. There-
fore, in this particular case, QSM resolves a limitation of R2*/T2*
mapping because it allows us to further conclude that in cortical
lesions, iron loss dominates the susceptibility contrast over
demyelination.
Interpretation of the Different Susceptibility ContrastThe different susceptibility contrast between cortical and WM
lesions may be partly because the degree of myelination in the
cortex is much less than that in WM, while the difference in their
iron concentration is small.28 When both demyelination and iron
loss are present, less iron loss is required to overwhelm demyeli-
nation in cortical lesions compared with WM. Indeed, in the cor-
tex, iron has already been demonstrated to be the dominant
source of MR susceptibility contrast and is well-correlated to both
susceptibility and R2*/T2*.29,30 Alternatively, this finding sug-
gests that whenever there is increased iron in cortical lesions, a
positive susceptibility value should be expected. The observation
of iron accumulation in active cortical lesions has been reported
in a previous study,27 and the positive susceptibility for cortical
lesions did occur in our study. However, these positive suscepti-
bility lesions were only 7.4% of all our cortical lesions. Although
one may argue that this could be because most of our cortical
lesions were in their chronic stage, in chronic WM lesions, an
increased iron level can be maintained for several years.9,31 More-
over, recent results from R2*/T2* mapping consistently showed
reduced R2* (or increased T2*) in cortical lesions,10-13 and this
could be even independent of disease stage.11,12 Thus, the under-
lying structural difference between the white matter and cortex
alone may not explain all of the susceptibility difference, and
pathologic changes that evolve differentially with time may also
play a role.
Pathologically, an intact BBB and low degree of inflammation
in cortical lesions suggest that there are fewer macrophages/mi-
croglia (either infiltrated or locally activated) than in WM lesions,
especially at the active and chronic active phases.6,25 These cells
phagocytize iron released from damaged oligodendrocytes and
retain the iron in chronic WM lesions until the macrophages and
microglia degenerate.25 Therefore, the paucity of these iron hold-
ers in cortical lesions may reduce the time interval for an increased
iron level in these lesions. Thus, we speculate that compared with
WM lesions, the time window for the initial phase of iron accu-
mulation is narrower in cortical lesions due to their faster iron
release secondary to the lack of inflammatory cells. This narrow
time window could make it difficult for susceptibility-contrast
MR imaging to depict the stage of iron accumulation in cortical
lesions. Because free iron can cause oxidative neurodegenera-
tion,25 the faster release of iron in cortical lesions may partly ex-
plain why cortical lesion load is more strongly correlated to the
degree of neurodegeneration in MS.2 Nevertheless, this specula-
tion warrants further investigation with longitudinal and con-
trast-enhanced studies.
Several limitations in our study should be addressed. First, due
to the still low in vivo sensitivity of MR imaging to cortical le-
sions,10 our sampling of cortical lesions was likely incomplete and
FIG 5. MR images of representative mixed lesions (yellow circles) from patients 1 (A) and 6 (B). The green dashed line divides a mixed lesion intoits cortical (red arrow) and WM (blue arrow) components. A, The lesion has a QSM hypointense cortical portion and a hyperintense WM portionrelative to adjacent normal-appearing GM and normal-appearing WM, respectively. B, The cortical component is hypointense compared withnormal-appearing GM, while the white matter component is centrally isointense but peripherally slightly hyperintense compared with normal-appearing WM. Please see the Fig 3 legend for image descriptions.
AJNR Am J Neuroradiol 37:1808 –15 Oct 2016 www.ajnr.org 1813
could be biased. The number of cortical lesions that can be ana-
lyzed can be further reduced after QSM reconstruction. Second,
although we examined the lesion age by looking at the most recent
clinically available contrast-enhanced 3T MR imaging, this can be
imprecise for white matter and offers no information for cortical
lesions. Given the lack of prior 7T imaging and/or concurrent
gadolinium contrast administration, the acute nature of each in-
dividual lesion was not definitively ascertainable. Third, the rele-
vance of the presumed iron loss in cortical lesions to clinical dis-
ability was not quantified. Last, QSM alone cannot distinguish the
contribution of demyelination from that of an iron increase,
which would often be seen at the acute phase of both cortical and
WM lesions because QSM exhibits a positive sign in both cases,
while R2* will decrease for demyelination and increase for iron
deposition. To completely distinguish the susceptibility contribu-
tions from myelin and iron, our future studies will combine in-
formation from both QSM and R2* mapping.
CONCLUSIONSQSM reveals an average negative magnetic susceptibility in corti-
cal lesions and an average positive magnetic susceptibility in WM
lesions, relative to their adjacent normal-appearing parenchyma.
The negative susceptibility in cortical lesions suggests that iron
loss dominates their susceptibility contrast. The different suscep-
tibility contrast between cortical and WM lesions may reflect both
their structural (degree of myelination) and pathologic (degree of
inflammation) differences, in which the latter may lead to a faster
release of iron in cortical lesions.
ACKNOWLEDGMENTSThe authors thank Dr Maged Goubran for his insightful discus-
sion and suggestions in the preparation of the manuscript. We
also extend our gratitude to the editor and 2 anonymous review-
ers for their constructive comments, which greatly helped us im-
prove the final version of the manuscript.
Disclosures: Thomas Tourdias—RELATED: Grant: Association pour la Recherche surla Sclerose En Plaques, Labex Translational Research and Advanced Imaging Labora-tory. May Han—UNRELATED: Consultancy: Pfizer. Yi Wang—RELATED: Grant: Na-tional Institutes of Health (R01NS090464)*; UNRELATED: Patents (planned, pendingor issued): Cornell University,* Comments: one of the inventors on the QSM patent;OTHER RELATIONSHIPS: in discussion with Cornell regarding QSM technology–based startup. Brian Rutt—RELATED: Grant: GE Healthcare.* Michael M. Zeineh—UNRELATED: Grants/Grants Pending: Doris Duke Charitable Foundation,* DanaFoundation,* Radiological Society of North America,* Other: GE Healthcare, Com-ments: some research support.* *Money paid to the institution.
REFERENCES1. Calabrese M, Filippi M, Gallo P. Cortical lesions in multiple sclero-
sis. Nat Rev Neurol 2010;6:438 – 44 CrossRef Medline2. Harrison DM, Roy S, Oh J, et al. Association of cortical lesion bur-
den on 7-T magnetic resonance imaging with cognition and disabil-ity in multiple sclerosis. JAMA Neurol 2015;72:1004 –12 CrossRefMedline
3. Peterson JW, Bo L, Mork S, et al. Transected neurites, apoptoticneurons, and reduced inflammation in cortical multiple sclerosislesions. Ann Neurol 2001;50:389 – 400 CrossRef Medline
4. van Horssen J, Brink BP, de Vries HE, et al. The blood-brain barrierin cortical multiple sclerosis lesions. J Neuropathol Exp Neurol 2007;66:321–28 CrossRef Medline
5. Louapre C, Lubetzki C. Neurodegeneration in multiple sclerosis is aprocess separate from inflammation: yes. Mult Scler 2015;21:1626 –28 CrossRef Medline
6. Bagnato F, Hametner S, Yao B, et al. Tracking iron in multiplesclerosis: a combined imaging and histopathological study at 7Tesla. Brain 2011;134:3602–15 CrossRef Medline
7. Yao B, Bagnato F, Matsuura E, et al. Chronic multiple sclerosislesions: characterization with high-field-strength MR imaging. Ra-diology 2012;262:206 –15 CrossRef Medline
8. Wisnieff C, Ramanan S, Olesik J, et al. Quantitative susceptibilitymapping (QSM) of white matter multiple sclerosis lesions: inter-preting positive susceptibility and the presence of iron. Magn ResonMed 2015;74:564 –70 CrossRef Medline
9. Chen W, Gauthier SA, Gupta A, et al. Quantitative susceptibilitymapping of multiple sclerosis lesions at various ages. Radiology2014;271:183–92 CrossRef Medline
10. Yao B, Hametner S, van Gelderen P, et al. 7 Tesla magnetic resonanceimaging to detect cortical pathology in multiple sclerosis. PLoS One2014;9:e108863 CrossRef Medline
11. Mainero C, Louapre C, Govindarajan ST, et al. A gradient in corticalpathology in multiple sclerosis by in vivo quantitative 7 T imaging.Brain 2015;138:932– 45 CrossRef Medline
12. Louapre C, Govindarajan ST, Gianni C, et al. Beyond focal corticallesions in MS: an in vivo quantitative and spatial imaging study at7T. Neurology 2015;85:1702– 09 CrossRef Medline
13. Jonkman LE, Fleysher L, Steenwijk MD, et al. Ultra-high field MTRand qR2* differentiates subpial cortical lesions from normal-ap-pearing gray matter in multiple sclerosis. Mult Scler 2015 Dec 16.[Epub ahead of print] Medline
14. Deh K, Nguyen TD, Eskreis-Winkler S, et al. Reproducibility ofquantitative susceptibility mapping in the brain at two fieldstrengths from two vendors. J Magn Reson Imaging 2015;42:1592–600 CrossRef Medline
15. Wang Y, Liu T. Quantitative susceptibility mapping (QSM): decod-ing MRI data for a tissue magnetic biomarker. Magn Reson Med2015;73:82–101 CrossRef Medline
16. Liu C, Li W, Tong KA, et al. Susceptibility-weighted imaging andquantitative susceptibility mapping in the brain. J Magn Reson Im-aging 2015;42:23– 41 CrossRef Medline
17. McDonald WI, Compston A, Edan G, et al. Recommended diagnos-tic criteria for multiple sclerosis: guidelines from the InternationalPanel on the Diagnosis of Multiple Sclerosis. Ann Neurol 2001;50:121–27 CrossRef Medline
18. Saranathan M, Tourdias T, Bayram E, et al. Optimization of white-matter-nulled magnetization prepared rapid gradient echo (MP-RAGE) imaging. Magn Reson Med 2015;73:1786 –94 CrossRefMedline
19. Saranathan M, Tourdias T, Kerr AB, et al. Optimization of magneti-zation-prepared 3-dimensional fluid attenuated inversion recoveryimaging for lesion detection at 7 T. Invest Radiol 2014;49:290 –98CrossRef Medline
20. Liu J, Liu T, de Rochefort L, et al. Morphology enabled dipole inver-sion for quantitative susceptibility mapping using structural con-sistency between the magnitude image and the susceptibility map.Neuroimage 2012;59:2560 – 68 CrossRef Medline
21. Smith SM, Jenkinson M, Woolrich MW, et al. Advances in functionaland structural MR image analysis and implementation as FSL. Neu-roimage 2004;23(suppl 1):S208 –19 CrossRef Medline
22. Wisnieff C, Ryan R, Pitt D, et al. Investigation of susceptibilitycontrast in grey and white matter multiple sclerosis lesions. In:Proceedings of the Annual Scientific Meeting of the InternationalSociety for Magnetic Resonance in Medicine, Milan, Italy. May 10 –16, 2014
23. Li X, Harrison DM, Liu H, et al. Magnetic susceptibility contrastvariations in multiple sclerosis lesions. J Magn Reson Imaging 2016;43:463–73 CrossRef Medline
24. Mehta V, Pei W, Yang G, et al. Iron is a sensitive biomarker for
1814 Bian Oct 2016 www.ajnr.org

inflammation in multiple sclerosis lesions. PLoS One 2013;8:e57573CrossRef Medline
25. Hametner S, Wimmer I, Haider L, et al. Iron and neurodegenerationin the multiple sclerosis brain. Ann Neurol 2013;74:848 – 61CrossRef Medline
26. Chari DM. Remyelination in multiple sclerosis. Int Rev Neurobiol2007;79:589 – 620 CrossRef Medline
27. Pitt D, Boster A, Pei W, et al. Imaging cortical lesions in multiplesclerosis with ultra-high-field magnetic resonance imaging. ArchNeurol 2010;67:812–18 CrossRef Medline
28. Haacke EM, Cheng NY, House MJ, et al. Imaging iron stores in the
brain using magnetic resonance imaging. Magn Reson Imaging 2005;23:1–25 CrossRef Medline
29. Fukunaga M, Li TQ, van Gelderen P, et al. Layer-specific variation ofiron content in cerebral cortex as a source of MRI contrast. Proc NatlAcad Sci U S A 2010;107:3834 –39 CrossRef Medline
30. Langkammer C, Krebs N, Goessler W, et al. Susceptibility inducedgray-white matter MRI contrast in the human brain. Neuroimage2012;59:1413–19 CrossRef Medline
31. Bian W, Harter K, Hammond-Rosenbluth KE, et al. A serial in vivo7T magnetic resonance phase imaging study of white matter lesionsin multiple sclerosis. Mult Scler 2013;19:69 –75 CrossRef Medline
AJNR Am J Neuroradiol 37:1808 –15 Oct 2016 www.ajnr.org 1815
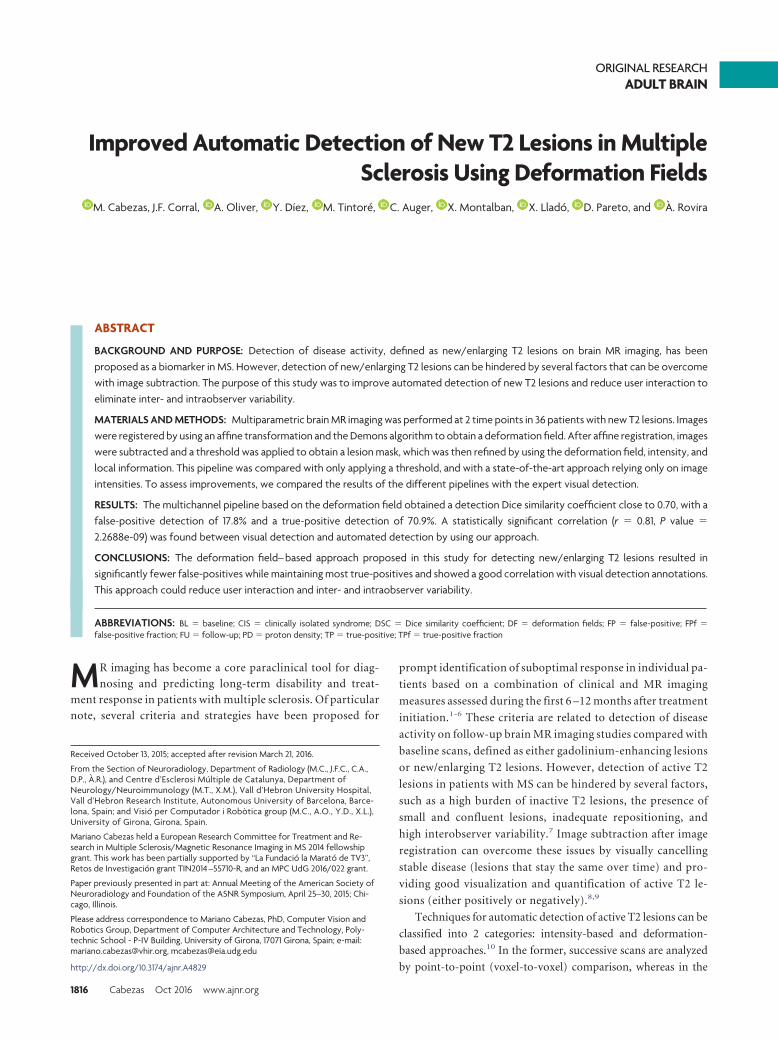
ORIGINAL RESEARCHADULT BRAIN
Improved Automatic Detection of New T2 Lesions in MultipleSclerosis Using Deformation Fields
X M. Cabezas, J.F. Corral, X A. Oliver, X Y. Díez, X M. Tintore, X C. Auger, X X. Montalban, X X. Llado, X D. Pareto, and X A. Rovira
ABSTRACT
BACKGROUND AND PURPOSE: Detection of disease activity, defined as new/enlarging T2 lesions on brain MR imaging, has beenproposed as a biomarker in MS. However, detection of new/enlarging T2 lesions can be hindered by several factors that can be overcomewith image subtraction. The purpose of this study was to improve automated detection of new T2 lesions and reduce user interaction toeliminate inter- and intraobserver variability.
MATERIALS AND METHODS: Multiparametric brain MR imaging was performed at 2 time points in 36 patients with new T2 lesions. Imageswere registered by using an affine transformation and the Demons algorithm to obtain a deformation field. After affine registration, imageswere subtracted and a threshold was applied to obtain a lesion mask, which was then refined by using the deformation field, intensity, andlocal information. This pipeline was compared with only applying a threshold, and with a state-of-the-art approach relying only on imageintensities. To assess improvements, we compared the results of the different pipelines with the expert visual detection.
RESULTS: The multichannel pipeline based on the deformation field obtained a detection Dice similarity coefficient close to 0.70, with afalse-positive detection of 17.8% and a true-positive detection of 70.9%. A statistically significant correlation (r � 0.81, P value �
2.2688e-09) was found between visual detection and automated detection by using our approach.
CONCLUSIONS: The deformation field– based approach proposed in this study for detecting new/enlarging T2 lesions resulted insignificantly fewer false-positives while maintaining most true-positives and showed a good correlation with visual detection annotations.This approach could reduce user interaction and inter- and intraobserver variability.
ABBREVIATIONS: BL � baseline; CIS � clinically isolated syndrome; DSC � Dice similarity coefficient; DF � deformation fields; FP � false-positive; FPf �false-positive fraction; FU � follow-up; PD � proton density; TP � true-positive; TPf � true-positive fraction
MR imaging has become a core paraclinical tool for diag-
nosing and predicting long-term disability and treat-
ment response in patients with multiple sclerosis. Of particular
note, several criteria and strategies have been proposed for
prompt identification of suboptimal response in individual pa-
tients based on a combination of clinical and MR imaging
measures assessed during the first 6 –12 months after treatment
initiation.1-6 These criteria are related to detection of disease
activity on follow-up brain MR imaging studies compared with
baseline scans, defined as either gadolinium-enhancing lesions
or new/enlarging T2 lesions. However, detection of active T2
lesions in patients with MS can be hindered by several factors,
such as a high burden of inactive T2 lesions, the presence of
small and confluent lesions, inadequate repositioning, and
high interobserver variability.7 Image subtraction after image
registration can overcome these issues by visually cancelling
stable disease (lesions that stay the same over time) and pro-
viding good visualization and quantification of active T2 le-
sions (either positively or negatively).8,9
Techniques for automatic detection of active T2 lesions can be
classified into 2 categories: intensity-based and deformation-
based approaches.10 In the former, successive scans are analyzed
by point-to-point (voxel-to-voxel) comparison, whereas in the
Received October 13, 2015; accepted after revision March 21, 2016.
From the Section of Neuroradiology, Department of Radiology (M.C., J.F.C., C.A.,D.P., A.R.), and Centre d’Esclerosi Multiple de Catalunya, Department ofNeurology/Neuroimmunology (M.T., X.M.), Vall d’Hebron University Hospital,Vall d’Hebron Research Institute, Autonomous University of Barcelona, Barce-lona, Spain; and Visio per Computador i Robòtica group (M.C., A.O., Y.D., X.L.),University of Girona, Girona, Spain.
Mariano Cabezas held a European Research Committee for Treatment and Re-search in Multiple Sclerosis/Magnetic Resonance Imaging in MS 2014 fellowshipgrant. This work has been partially supported by “La Fundacio la Marato de TV3”,Retos de Investigacion grant TIN2014 –55710-R, and an MPC UdG 2016/022 grant.
Paper previously presented in part at: Annual Meeting of the American Society ofNeuroradiology and Foundation of the ASNR Symposium, April 25–30, 2015; Chi-cago, Illinois.
Please address correspondence to Mariano Cabezas, PhD, Computer Vision andRobotics Group, Department of Computer Architecture and Technology, Poly-technic School - P-IV Building, University of Girona, 17071 Girona, Spain; e-mail:[email protected], [email protected]
http://dx.doi.org/10.3174/ajnr.A4829
1816 Cabezas Oct 2016 www.ajnr.org
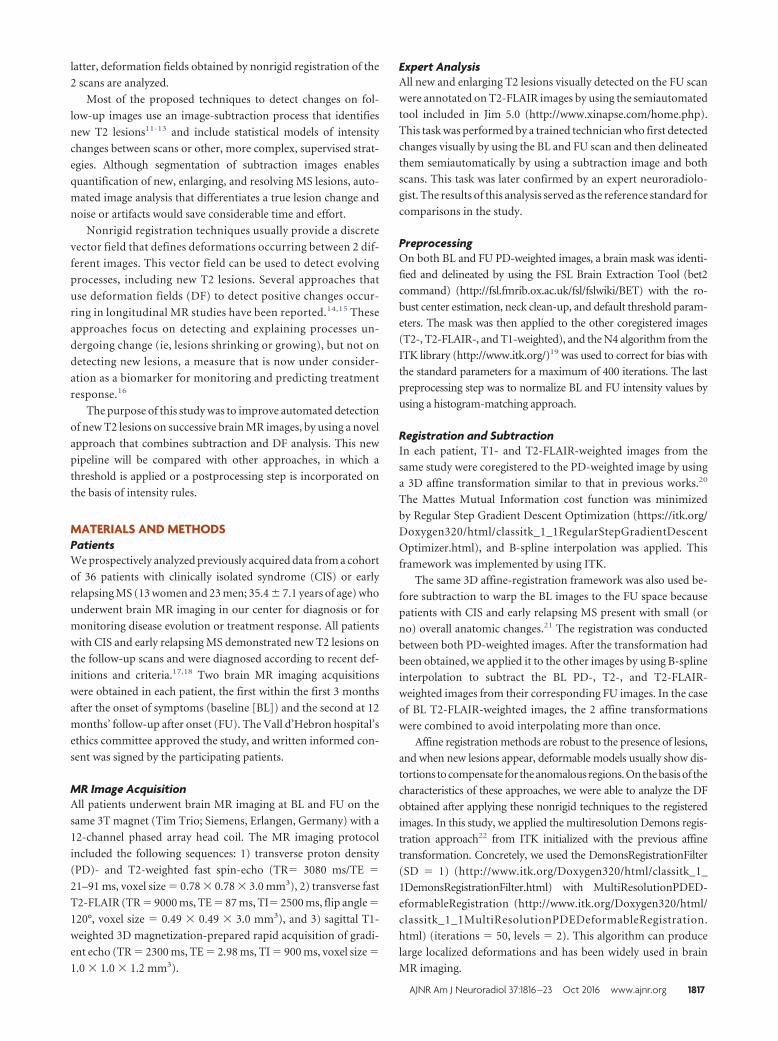
latter, deformation fields obtained by nonrigid registration of the
2 scans are analyzed.
Most of the proposed techniques to detect changes on fol-
low-up images use an image-subtraction process that identifies
new T2 lesions11-13 and include statistical models of intensity
changes between scans or other, more complex, supervised strat-
egies. Although segmentation of subtraction images enables
quantification of new, enlarging, and resolving MS lesions, auto-
mated image analysis that differentiates a true lesion change and
noise or artifacts would save considerable time and effort.
Nonrigid registration techniques usually provide a discrete
vector field that defines deformations occurring between 2 dif-
ferent images. This vector field can be used to detect evolving
processes, including new T2 lesions. Several approaches that
use deformation fields (DF) to detect positive changes occur-
ring in longitudinal MR studies have been reported.14,15 These
approaches focus on detecting and explaining processes un-
dergoing change (ie, lesions shrinking or growing), but not on
detecting new lesions, a measure that is now under consider-
ation as a biomarker for monitoring and predicting treatment
response.16
The purpose of this study was to improve automated detection
of new T2 lesions on successive brain MR images, by using a novel
approach that combines subtraction and DF analysis. This new
pipeline will be compared with other approaches, in which a
threshold is applied or a postprocessing step is incorporated on
the basis of intensity rules.
MATERIALS AND METHODSPatientsWe prospectively analyzed previously acquired data from a cohort
of 36 patients with clinically isolated syndrome (CIS) or early
relapsing MS (13 women and 23 men; 35.4 � 7.1 years of age) who
underwent brain MR imaging in our center for diagnosis or for
monitoring disease evolution or treatment response. All patients
with CIS and early relapsing MS demonstrated new T2 lesions on
the follow-up scans and were diagnosed according to recent def-
initions and criteria.17,18 Two brain MR imaging acquisitions
were obtained in each patient, the first within the first 3 months
after the onset of symptoms (baseline [BL]) and the second at 12
months’ follow-up after onset (FU). The Vall d’Hebron hospital’s
ethics committee approved the study, and written informed con-
sent was signed by the participating patients.
MR Image AcquisitionAll patients underwent brain MR imaging at BL and FU on the
same 3T magnet (Tim Trio; Siemens, Erlangen, Germany) with a
12-channel phased array head coil. The MR imaging protocol
included the following sequences: 1) transverse proton density
(PD)- and T2-weighted fast spin-echo (TR� 3080 ms/TE �
21–91 ms, voxel size � 0.78 � 0.78 � 3.0 mm3), 2) transverse fast
T2-FLAIR (TR � 9000 ms, TE � 87 ms, TI� 2500 ms, flip angle �
120°, voxel size � 0.49 � 0.49 � 3.0 mm3), and 3) sagittal T1-
weighted 3D magnetization-prepared rapid acquisition of gradi-
ent echo (TR � 2300 ms, TE � 2.98 ms, TI � 900 ms, voxel size �
1.0 � 1.0 � 1.2 mm3).
Expert AnalysisAll new and enlarging T2 lesions visually detected on the FU scan
were annotated on T2-FLAIR images by using the semiautomated
tool included in Jim 5.0 (http://www.xinapse.com/home.php).
This task was performed by a trained technician who first detected
changes visually by using the BL and FU scan and then delineated
them semiautomatically by using a subtraction image and both
scans. This task was later confirmed by an expert neuroradiolo-
gist. The results of this analysis served as the reference standard for
comparisons in the study.
PreprocessingOn both BL and FU PD-weighted images, a brain mask was identi-
fied and delineated by using the FSL Brain Extraction Tool (bet2
command) (http://fsl.fmrib.ox.ac.uk/fsl/fslwiki/BET) with the ro-
bust center estimation, neck clean-up, and default threshold param-
eters. The mask was then applied to the other coregistered images
(T2-, T2-FLAIR-, and T1-weighted), and the N4 algorithm from the
ITK library (http://www.itk.org/)19 was used to correct for bias with
the standard parameters for a maximum of 400 iterations. The last
preprocessing step was to normalize BL and FU intensity values by
using a histogram-matching approach.
Registration and SubtractionIn each patient, T1- and T2-FLAIR-weighted images from the
same study were coregistered to the PD-weighted image by using
a 3D affine transformation similar to that in previous works.20
The Mattes Mutual Information cost function was minimized
by Regular Step Gradient Descent Optimization (https://itk.org/
Doxygen320/html/classitk_1_1RegularStepGradientDescent
Optimizer.html), and B-spline interpolation was applied. This
framework was implemented by using ITK.
The same 3D affine-registration framework was also used be-
fore subtraction to warp the BL images to the FU space because
patients with CIS and early relapsing MS present with small (or
no) overall anatomic changes.21 The registration was conducted
between both PD-weighted images. After the transformation had
been obtained, we applied it to the other images by using B-spline
interpolation to subtract the BL PD-, T2-, and T2-FLAIR-
weighted images from their corresponding FU images. In the case
of BL T2-FLAIR-weighted images, the 2 affine transformations
were combined to avoid interpolating more than once.
Affine registration methods are robust to the presence of lesions,
and when new lesions appear, deformable models usually show dis-
tortions to compensate for the anomalous regions. On the basis of the
characteristics of these approaches, we were able to analyze the DF
obtained after applying these nonrigid techniques to the registered
images. In this study, we applied the multiresolution Demons regis-
tration approach22 from ITK initialized with the previous affine
transformation. Concretely, we used the DemonsRegistrationFilter
(SD � 1) (http://www.itk.org/Doxygen320/html/classitk_1_
1DemonsRegistrationFilter.html) with MultiResolutionPDED-
eformableRegistration (http://www.itk.org/Doxygen320/html/
classitk_1_1MultiResolutionPDEDeformableRegistration.
html) (iterations � 50, levels � 2). This algorithm can produce
large localized deformations and has been widely used in brain
MR imaging.
AJNR Am J Neuroradiol 37:1816 –23 Oct 2016 www.ajnr.org 1817
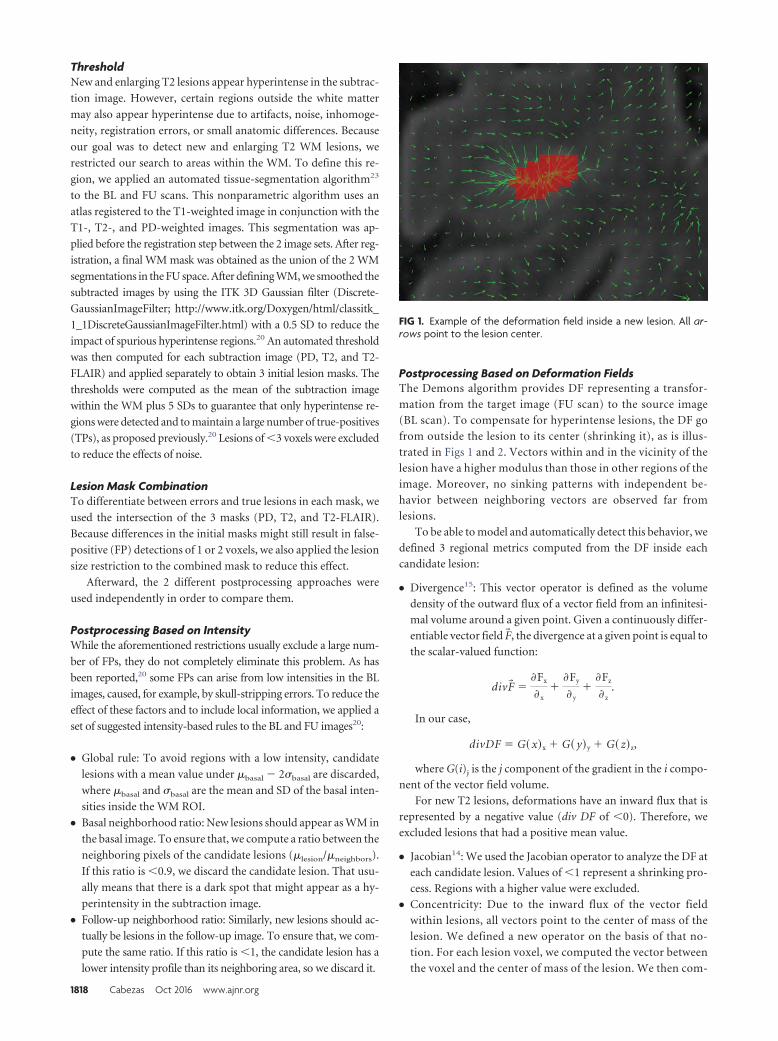
ThresholdNew and enlarging T2 lesions appear hyperintense in the subtrac-
tion image. However, certain regions outside the white matter
may also appear hyperintense due to artifacts, noise, inhomoge-
neity, registration errors, or small anatomic differences. Because
our goal was to detect new and enlarging T2 WM lesions, we
restricted our search to areas within the WM. To define this re-
gion, we applied an automated tissue-segmentation algorithm23
to the BL and FU scans. This nonparametric algorithm uses an
atlas registered to the T1-weighted image in conjunction with the
T1-, T2-, and PD-weighted images. This segmentation was ap-
plied before the registration step between the 2 image sets. After reg-
istration, a final WM mask was obtained as the union of the 2 WM
segmentations in the FU space. After defining WM, we smoothed the
subtracted images by using the ITK 3D Gaussian filter (Discrete-
GaussianImageFilter; http://www.itk.org/Doxygen/html/classitk_
1_1DiscreteGaussianImageFilter.html) with a 0.5 SD to reduce the
impact of spurious hyperintense regions.20 An automated threshold
was then computed for each subtraction image (PD, T2, and T2-
FLAIR) and applied separately to obtain 3 initial lesion masks. The
thresholds were computed as the mean of the subtraction image
within the WM plus 5 SDs to guarantee that only hyperintense re-
gions were detected and to maintain a large number of true-positives
(TPs), as proposed previously.20 Lesions of �3 voxels were excluded
to reduce the effects of noise.
Lesion Mask CombinationTo differentiate between errors and true lesions in each mask, we
used the intersection of the 3 masks (PD, T2, and T2-FLAIR).
Because differences in the initial masks might still result in false-
positive (FP) detections of 1 or 2 voxels, we also applied the lesion
size restriction to the combined mask to reduce this effect.
Afterward, the 2 different postprocessing approaches were
used independently in order to compare them.
Postprocessing Based on IntensityWhile the aforementioned restrictions usually exclude a large num-
ber of FPs, they do not completely eliminate this problem. As has
been reported,20 some FPs can arise from low intensities in the BL
images, caused, for example, by skull-stripping errors. To reduce the
effect of these factors and to include local information, we applied a
set of suggested intensity-based rules to the BL and FU images20:
● Global rule: To avoid regions with a low intensity, candidate
lesions with a mean value under �basal � 2�basal are discarded,
where �basal and �basal are the mean and SD of the basal inten-
sities inside the WM ROI.
● Basal neighborhood ratio: New lesions should appear as WM in
the basal image. To ensure that, we compute a ratio between the
neighboring pixels of the candidate lesions (�lesion/�neighbors).
If this ratio is �0.9, we discard the candidate lesion. That usu-
ally means that there is a dark spot that might appear as a hy-
perintensity in the subtraction image.
● Follow-up neighborhood ratio: Similarly, new lesions should ac-
tually be lesions in the follow-up image. To ensure that, we com-
pute the same ratio. If this ratio is �1, the candidate lesion has a
lower intensity profile than its neighboring area, so we discard it.
Postprocessing Based on Deformation FieldsThe Demons algorithm provides DF representing a transfor-
mation from the target image (FU scan) to the source image
(BL scan). To compensate for hyperintense lesions, the DF go
from outside the lesion to its center (shrinking it), as is illus-
trated in Figs 1 and 2. Vectors within and in the vicinity of the
lesion have a higher modulus than those in other regions of the
image. Moreover, no sinking patterns with independent be-
havior between neighboring vectors are observed far from
lesions.
To be able to model and automatically detect this behavior, we
defined 3 regional metrics computed from the DF inside each
candidate lesion:
● Divergence15: This vector operator is defined as the volume
density of the outward flux of a vector field from an infinitesi-
mal volume around a given point. Given a continuously differ-
entiable vector field F�, the divergence at a given point is equal to
the scalar-valued function:
divF� ��Fx
�x�
�Fy
�y�
�Fz
�z.
In our case,
divDF � G� x�x � G� y�y � G� z�z,
where G(i)j is the j component of the gradient in the i compo-
nent of the vector field volume.
For new T2 lesions, deformations have an inward flux that is
represented by a negative value (div DF of �0). Therefore, we
excluded lesions that had a positive mean value.
● Jacobian14: We used the Jacobian operator to analyze the DF at
each candidate lesion. Values of �1 represent a shrinking pro-
cess. Regions with a higher value were excluded.
● Concentricity: Due to the inward flux of the vector field
within lesions, all vectors point to the center of mass of the
lesion. We defined a new operator on the basis of that no-
tion. For each lesion voxel, we computed the vector between
the voxel and the center of mass of the lesion. We then com-
FIG 1. Example of the deformation field inside a new lesion. All ar-rows point to the lesion center.
1818 Cabezas Oct 2016 www.ajnr.org
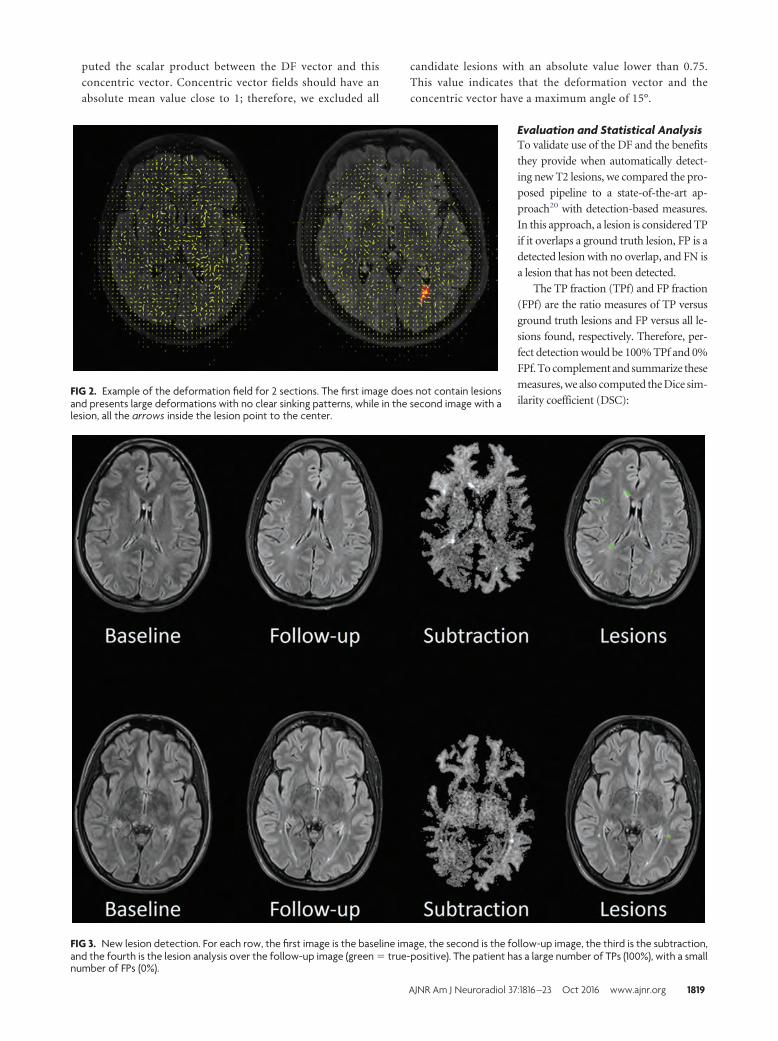
puted the scalar product between the DF vector and this
concentric vector. Concentric vector fields should have an
absolute mean value close to 1; therefore, we excluded all
candidate lesions with an absolute value lower than 0.75.
This value indicates that the deformation vector and the
concentric vector have a maximum angle of 15°.
Evaluation and Statistical AnalysisTo validate use of the DF and the benefits
they provide when automatically detect-
ing new T2 lesions, we compared the pro-
posed pipeline to a state-of-the-art ap-
proach20 with detection-based measures.
In this approach, a lesion is considered TP
if it overlaps a ground truth lesion, FP is a
detected lesion with no overlap, and FN is
a lesion that has not been detected.
The TP fraction (TPf) and FP fraction
(FPf) are the ratio measures of TP versus
ground truth lesions and FP versus all le-
sions found, respectively. Therefore, per-
fect detection would be 100% TPf and 0%
FPf. To complement and summarize these
measures, we also computed the Dice sim-
ilarity coefficient (DSC):FIG 2. Example of the deformation field for 2 sections. The first image does not contain lesionsand presents large deformations with no clear sinking patterns, while in the second image with alesion, all the arrows inside the lesion point to the center.
FIG 3. New lesion detection. For each row, the first image is the baseline image, the second is the follow-up image, the third is the subtraction,and the fourth is the lesion analysis over the follow-up image (green � true-positive). The patient has a large number of TPs (100%), with a smallnumber of FPs (0%).
AJNR Am J Neuroradiol 37:1816 –23 Oct 2016 www.ajnr.org 1819
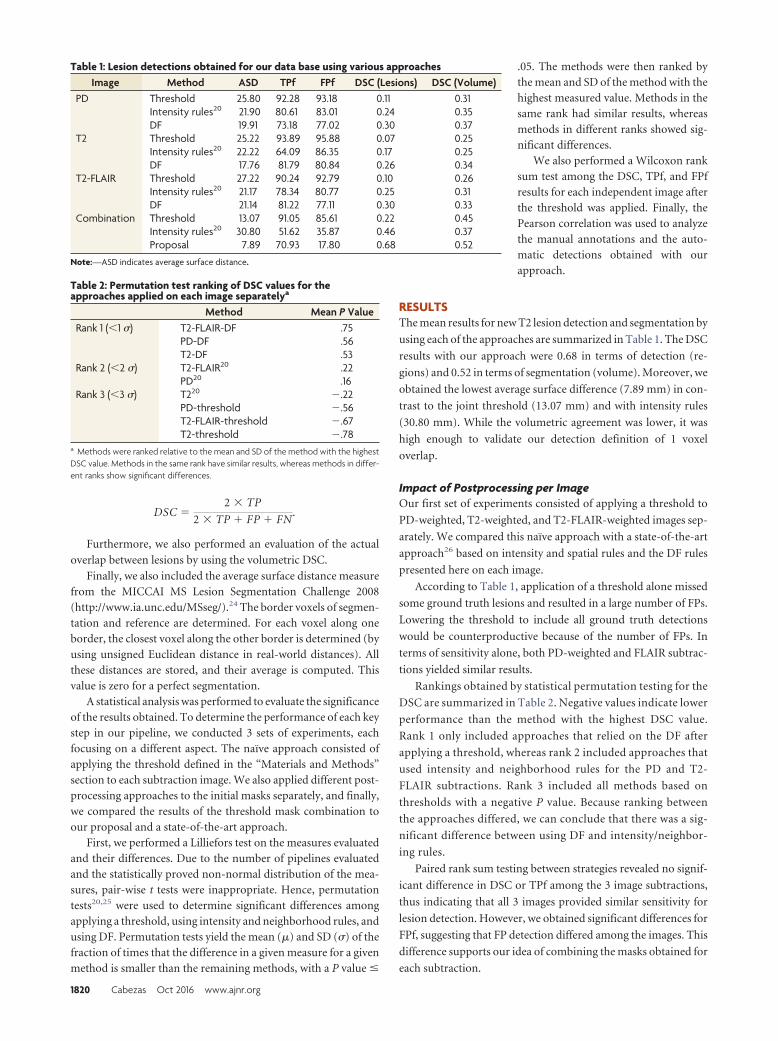
DSC �2 � TP
2 � TP � FP � FN.
Furthermore, we also performed an evaluation of the actual
overlap between lesions by using the volumetric DSC.
Finally, we also included the average surface distance measurefrom the MICCAI MS Lesion Segmentation Challenge 2008(http://www.ia.unc.edu/MSseg/).24 The border voxels of segmen-tation and reference are determined. For each voxel along oneborder, the closest voxel along the other border is determined (byusing unsigned Euclidean distance in real-world distances). Allthese distances are stored, and their average is computed. Thisvalue is zero for a perfect segmentation.
A statistical analysis was performed to evaluate the significanceof the results obtained. To determine the performance of each keystep in our pipeline, we conducted 3 sets of experiments, eachfocusing on a different aspect. The naïve approach consisted ofapplying the threshold defined in the “Materials and Methods”section to each subtraction image. We also applied different post-processing approaches to the initial masks separately, and finally,we compared the results of the threshold mask combination toour proposal and a state-of-the-art approach.
First, we performed a Lilliefors test on the measures evaluatedand their differences. Due to the number of pipelines evaluatedand the statistically proved non-normal distribution of the mea-sures, pair-wise t tests were inappropriate. Hence, permutationtests20,25 were used to determine significant differences amongapplying a threshold, using intensity and neighborhood rules, andusing DF. Permutation tests yield the mean (�) and SD (�) of thefraction of times that the difference in a given measure for a givenmethod is smaller than the remaining methods, with a P value �
.05. The methods were then ranked bythe mean and SD of the method with thehighest measured value. Methods in thesame rank had similar results, whereasmethods in different ranks showed sig-nificant differences.
We also performed a Wilcoxon ranksum test among the DSC, TPf, and FPfresults for each independent image afterthe threshold was applied. Finally, thePearson correlation was used to analyzethe manual annotations and the auto-matic detections obtained with ourapproach.
RESULTSThe mean results for new T2 lesion detection and segmentation by
using each of the approaches are summarized in Table 1. The DSC
results with our approach were 0.68 in terms of detection (re-
gions) and 0.52 in terms of segmentation (volume). Moreover, we
obtained the lowest average surface difference (7.89 mm) in con-
trast to the joint threshold (13.07 mm) and with intensity rules
(30.80 mm). While the volumetric agreement was lower, it was
high enough to validate our detection definition of 1 voxel
overlap.
Impact of Postprocessing per ImageOur first set of experiments consisted of applying a threshold to
PD-weighted, T2-weighted, and T2-FLAIR-weighted images sep-
arately. We compared this naïve approach with a state-of-the-art
approach26 based on intensity and spatial rules and the DF rules
presented here on each image.
According to Table 1, application of a threshold alone missed
some ground truth lesions and resulted in a large number of FPs.
Lowering the threshold to include all ground truth detections
would be counterproductive because of the number of FPs. In
terms of sensitivity alone, both PD-weighted and FLAIR subtrac-
tions yielded similar results.
Rankings obtained by statistical permutation testing for the
DSC are summarized in Table 2. Negative values indicate lower
performance than the method with the highest DSC value.
Rank 1 only included approaches that relied on the DF after
applying a threshold, whereas rank 2 included approaches that
used intensity and neighborhood rules for the PD and T2-
FLAIR subtractions. Rank 3 included all methods based on
thresholds with a negative P value. Because ranking between
the approaches differed, we can conclude that there was a sig-
nificant difference between using DF and intensity/neighbor-
ing rules.
Paired rank sum testing between strategies revealed no signif-
icant difference in DSC or TPf among the 3 image subtractions,
thus indicating that all 3 images provided similar sensitivity for
lesion detection. However, we obtained significant differences for
FPf, suggesting that FP detection differed among the images. This
difference supports our idea of combining the masks obtained for
each subtraction.
Table 1: Lesion detections obtained for our data base using various approachesImage Method ASD TPf FPf DSC (Lesions) DSC (Volume)
PD Threshold 25.80 92.28 93.18 0.11 0.31Intensity rules20 21.90 80.61 83.01 0.24 0.35DF 19.91 73.18 77.02 0.30 0.37
T2 Threshold 25.22 93.89 95.88 0.07 0.25Intensity rules20 22.22 64.09 86.35 0.17 0.25DF 17.76 81.79 80.84 0.26 0.34
T2-FLAIR Threshold 27.22 90.24 92.79 0.10 0.26Intensity rules20 21.17 78.34 80.77 0.25 0.31DF 21.14 81.22 77.11 0.30 0.33
Combination Threshold 13.07 91.05 85.61 0.22 0.45Intensity rules20 30.80 51.62 35.87 0.46 0.37Proposal 7.89 70.93 17.80 0.68 0.52
Note:—ASD indicates average surface distance.
Table 2: Permutation test ranking of DSC values for theapproaches applied on each image separatelya
Method Mean P ValueRank 1 (�1 �) T2-FLAIR-DF .75
PD-DF .56T2-DF .53
Rank 2 (�2 �) T2-FLAIR20 .22PD20 .16
Rank 3 (�3 �) T220 �.22PD-threshold �.56T2-FLAIR-threshold �.67T2-threshold �.78
a Methods were ranked relative to the mean and SD of the method with the highestDSC value. Methods in the same rank have similar results, whereas methods in differ-ent ranks show significant differences.
1820 Cabezas Oct 2016 www.ajnr.org
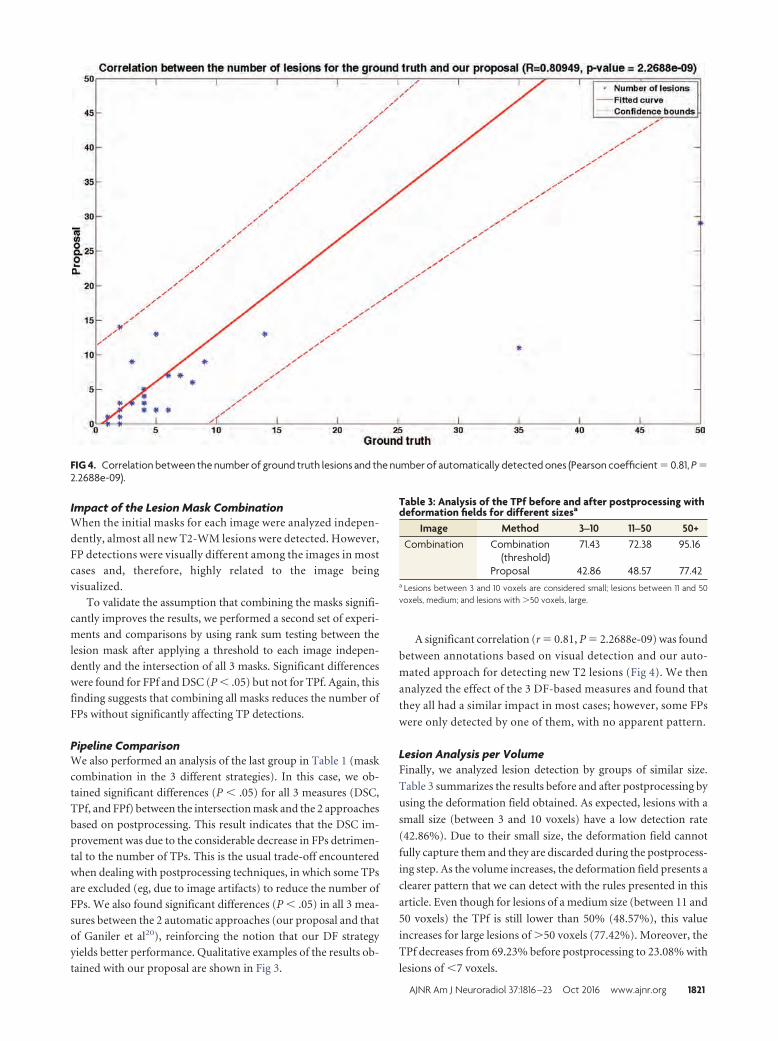
Impact of the Lesion Mask CombinationWhen the initial masks for each image were analyzed indepen-
dently, almost all new T2-WM lesions were detected. However,
FP detections were visually different among the images in most
cases and, therefore, highly related to the image being
visualized.
To validate the assumption that combining the masks signifi-
cantly improves the results, we performed a second set of experi-
ments and comparisons by using rank sum testing between the
lesion mask after applying a threshold to each image indepen-
dently and the intersection of all 3 masks. Significant differences
were found for FPf and DSC (P � .05) but not for TPf. Again, this
finding suggests that combining all masks reduces the number of
FPs without significantly affecting TP detections.
Pipeline ComparisonWe also performed an analysis of the last group in Table 1 (mask
combination in the 3 different strategies). In this case, we ob-
tained significant differences (P � .05) for all 3 measures (DSC,
TPf, and FPf) between the intersection mask and the 2 approaches
based on postprocessing. This result indicates that the DSC im-
provement was due to the considerable decrease in FPs detrimen-
tal to the number of TPs. This is the usual trade-off encountered
when dealing with postprocessing techniques, in which some TPs
are excluded (eg, due to image artifacts) to reduce the number of
FPs. We also found significant differences (P � .05) in all 3 mea-
sures between the 2 automatic approaches (our proposal and that
of Ganiler et al20), reinforcing the notion that our DF strategy
yields better performance. Qualitative examples of the results ob-
tained with our proposal are shown in Fig 3.
A significant correlation (r � 0.81, P � 2.2688e-09) was found
between annotations based on visual detection and our auto-
mated approach for detecting new T2 lesions (Fig 4). We then
analyzed the effect of the 3 DF-based measures and found that
they all had a similar impact in most cases; however, some FPs
were only detected by one of them, with no apparent pattern.
Lesion Analysis per VolumeFinally, we analyzed lesion detection by groups of similar size.
Table 3 summarizes the results before and after postprocessing by
using the deformation field obtained. As expected, lesions with a
small size (between 3 and 10 voxels) have a low detection rate
(42.86%). Due to their small size, the deformation field cannot
fully capture them and they are discarded during the postprocess-
ing step. As the volume increases, the deformation field presents a
clearer pattern that we can detect with the rules presented in this
article. Even though for lesions of a medium size (between 11 and
50 voxels) the TPf is still lower than 50% (48.57%), this value
increases for large lesions of 50 voxels (77.42%). Moreover, the
TPf decreases from 69.23% before postprocessing to 23.08% with
lesions of �7 voxels.
FIG 4. Correlation between the number of ground truth lesions and the number of automatically detected ones (Pearson coefficient � 0.81, P �2.2688e-09).
Table 3: Analysis of the TPf before and after postprocessing withdeformation fields for different sizesa
Image Method 3–10 11–50 50+Combination Combination
(threshold)71.43 72.38 95.16
Proposal 42.86 48.57 77.42a Lesions between 3 and 10 voxels are considered small; lesions between 11 and 50voxels, medium; and lesions with 50 voxels, large.
AJNR Am J Neuroradiol 37:1816 –23 Oct 2016 www.ajnr.org 1821
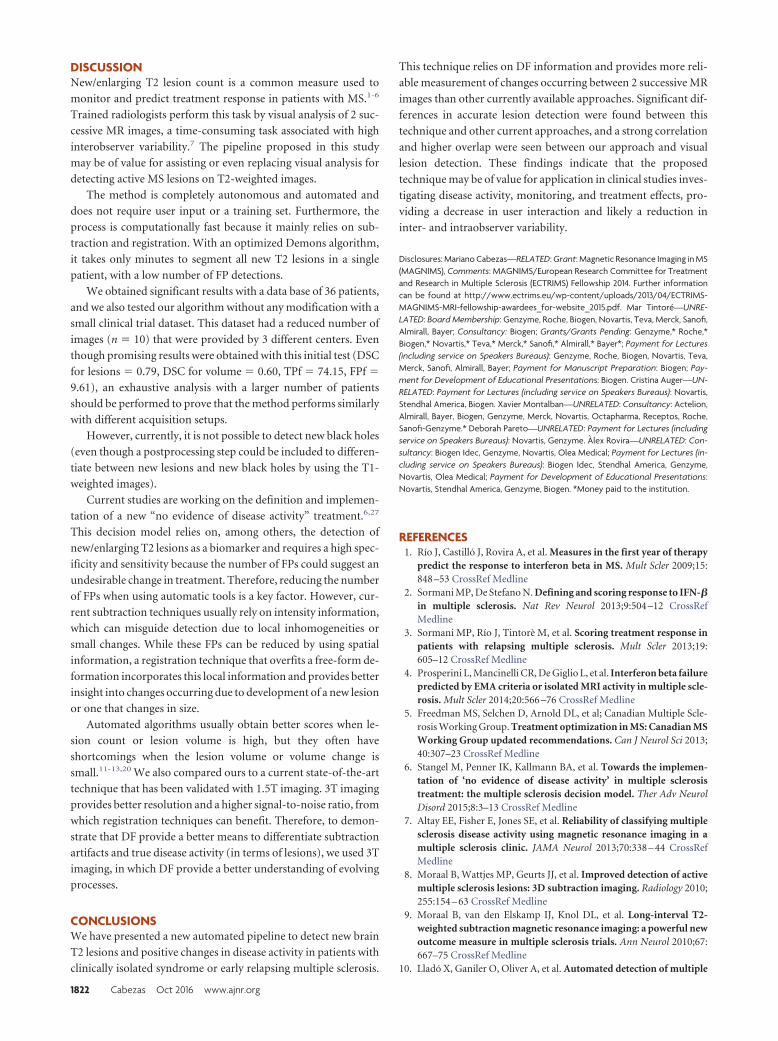
DISCUSSIONNew/enlarging T2 lesion count is a common measure used to
monitor and predict treatment response in patients with MS.1-6
Trained radiologists perform this task by visual analysis of 2 suc-
cessive MR images, a time-consuming task associated with high
interobserver variability.7 The pipeline proposed in this study
may be of value for assisting or even replacing visual analysis for
detecting active MS lesions on T2-weighted images.
The method is completely autonomous and automated and
does not require user input or a training set. Furthermore, the
process is computationally fast because it mainly relies on sub-
traction and registration. With an optimized Demons algorithm,
it takes only minutes to segment all new T2 lesions in a single
patient, with a low number of FP detections.
We obtained significant results with a data base of 36 patients,
and we also tested our algorithm without any modification with a
small clinical trial dataset. This dataset had a reduced number of
images (n � 10) that were provided by 3 different centers. Even
though promising results were obtained with this initial test (DSC
for lesions � 0.79, DSC for volume � 0.60, TPf � 74.15, FPf �
9.61), an exhaustive analysis with a larger number of patients
should be performed to prove that the method performs similarly
with different acquisition setups.
However, currently, it is not possible to detect new black holes
(even though a postprocessing step could be included to differen-
tiate between new lesions and new black holes by using the T1-
weighted images).
Current studies are working on the definition and implemen-
tation of a new “no evidence of disease activity” treatment.6,27
This decision model relies on, among others, the detection of
new/enlarging T2 lesions as a biomarker and requires a high spec-
ificity and sensitivity because the number of FPs could suggest an
undesirable change in treatment. Therefore, reducing the number
of FPs when using automatic tools is a key factor. However, cur-
rent subtraction techniques usually rely on intensity information,
which can misguide detection due to local inhomogeneities or
small changes. While these FPs can be reduced by using spatial
information, a registration technique that overfits a free-form de-
formation incorporates this local information and provides better
insight into changes occurring due to development of a new lesion
or one that changes in size.
Automated algorithms usually obtain better scores when le-
sion count or lesion volume is high, but they often have
shortcomings when the lesion volume or volume change is
small.11-13,20 We also compared ours to a current state-of-the-art
technique that has been validated with 1.5T imaging. 3T imaging
provides better resolution and a higher signal-to-noise ratio, from
which registration techniques can benefit. Therefore, to demon-
strate that DF provide a better means to differentiate subtraction
artifacts and true disease activity (in terms of lesions), we used 3T
imaging, in which DF provide a better understanding of evolving
processes.
CONCLUSIONSWe have presented a new automated pipeline to detect new brain
T2 lesions and positive changes in disease activity in patients with
clinically isolated syndrome or early relapsing multiple sclerosis.
This technique relies on DF information and provides more reli-
able measurement of changes occurring between 2 successive MR
images than other currently available approaches. Significant dif-
ferences in accurate lesion detection were found between this
technique and other current approaches, and a strong correlation
and higher overlap were seen between our approach and visual
lesion detection. These findings indicate that the proposed
technique may be of value for application in clinical studies inves-
tigating disease activity, monitoring, and treatment effects, pro-
viding a decrease in user interaction and likely a reduction in
inter- and intraobserver variability.
Disclosures: Mariano Cabezas—RELATED: Grant: Magnetic Resonance Imaging in MS(MAGNIMS), Comments: MAGNIMS/European Research Committee for Treatmentand Research in Multiple Sclerosis (ECTRIMS) Fellowship 2014. Further informationcan be found at http://www.ectrims.eu/wp-content/uploads/2013/04/ECTRIMS-MAGNIMS-MRI-fellowship-awardees_for-website_2015.pdf. Mar Tintore—UNRE-LATED: Board Membership: Genzyme, Roche, Biogen, Novartis, Teva, Merck, Sanofi,Almirall, Bayer; Consultancy: Biogen; Grants/Grants Pending: Genzyme,* Roche,*Biogen,* Novartis,* Teva,* Merck,* Sanofi,* Almirall,* Bayer*; Payment for Lectures(including service on Speakers Bureaus): Genzyme, Roche, Biogen, Novartis, Teva,Merck, Sanofi, Almirall, Bayer; Payment for Manuscript Preparation: Biogen; Pay-ment for Development of Educational Presentations: Biogen. Cristina Auger—UN-RELATED: Payment for Lectures (including service on Speakers Bureaus): Novartis,Stendhal America, Biogen. Xavier Montalban—UNRELATED: Consultancy: Actelion,Almirall, Bayer, Biogen, Genzyme, Merck, Novartis, Octapharma, Receptos, Roche,Sanofi-Genzyme.* Deborah Pareto—UNRELATED: Payment for Lectures (includingservice on Speakers Bureaus): Novartis, Genzyme. Alex Rovira—UNRELATED: Con-sultancy: Biogen Idec, Genzyme, Novartis, Olea Medical; Payment for Lectures (in-cluding service on Speakers Bureaus): Biogen Idec, Stendhal America, Genzyme,Novartis, Olea Medical; Payment for Development of Educational Presentations:Novartis, Stendhal America, Genzyme, Biogen. *Money paid to the institution.
REFERENCES1. Río J, Castillo J, Rovira A, et al. Measures in the first year of therapy
predict the response to interferon beta in MS. Mult Scler 2009;15:848 –53 CrossRef Medline
2. Sormani MP, De Stefano N. Defining and scoring response to IFN-�in multiple sclerosis. Nat Rev Neurol 2013;9:504 –12 CrossRefMedline
3. Sormani MP, Río J, Tintore M, et al. Scoring treatment response inpatients with relapsing multiple sclerosis. Mult Scler 2013;19:605–12 CrossRef Medline
4. Prosperini L, Mancinelli CR, De Giglio L, et al. Interferon beta failurepredicted by EMA criteria or isolated MRI activity in multiple scle-rosis. Mult Scler 2014;20:566 –76 CrossRef Medline
5. Freedman MS, Selchen D, Arnold DL, et al; Canadian Multiple Scle-rosis Working Group. Treatment optimization in MS: Canadian MSWorking Group updated recommendations. Can J Neurol Sci 2013;40:307–23 CrossRef Medline
6. Stangel M, Penner IK, Kallmann BA, et al. Towards the implemen-tation of ‘no evidence of disease activity’ in multiple sclerosistreatment: the multiple sclerosis decision model. Ther Adv NeurolDisord 2015;8:3–13 CrossRef Medline
7. Altay EE, Fisher E, Jones SE, et al. Reliability of classifying multiplesclerosis disease activity using magnetic resonance imaging in amultiple sclerosis clinic. JAMA Neurol 2013;70:338 – 44 CrossRefMedline
8. Moraal B, Wattjes MP, Geurts JJ, et al. Improved detection of activemultiple sclerosis lesions: 3D subtraction imaging. Radiology 2010;255:154 – 63 CrossRef Medline
9. Moraal B, van den Elskamp IJ, Knol DL, et al. Long-interval T2-weighted subtraction magnetic resonance imaging: a powerful newoutcome measure in multiple sclerosis trials. Ann Neurol 2010;67:667–75 CrossRef Medline
10. Llado X, Ganiler O, Oliver A, et al. Automated detection of multiple
1822 Cabezas Oct 2016 www.ajnr.org
sclerosis lesions in serial brain MRI. Neuroradiology 2012;54:787–807 CrossRef Medline
11. Battaglini M, Rossi F, Grove RA, et al. Automated identification ofbrain new lesions in multiple sclerosis using subtraction images.J Magn Reson Imaging 2014;39:1543– 49 Medline
12. Elliott C, Arnold DL, Collins DL, et al. Temporally consistent prob-abilistic detection of new multiple sclerosis lesions in brain MRI.IEEE Trans Med Imaging 2013;32:1490 –503 CrossRef Medline
13. Sweeney EM, Shinohara RT, Shea CD, et al. Automatic lesion inci-dence estimation and detection in multiple sclerosis using multi-sequence longitudinal MRI. AJNR Am J Neuroradiol 2013;34:68 –73CrossRef Medline
14. Rey D, Subsol G, Delingette H, et al. Automatic detection and seg-mentation of evolving processes in 3D medical images: applicationto multiple sclerosis. Med Image Anal 2002;6:163–79 CrossRefMedline
15. Thirion JP, Calmon G. Deformation analysis to detect and quantifyactive lesions in three-dimensional medical image sequences. IEEETrans Med Imaging 1999;18:429 – 41 CrossRef Medline
16. Vrenken H, Jenkinson M, Horsfield MA, et al; MAGNIMS StudyGroup. Recommendations to improve imaging and analysis ofbrain lesion load and atrophy in longitudinal studies of multiplesclerosis. J Neurol 2013;260:2458 –71 CrossRef Medline
17. Lublin FD, Reingold SC, Cohen JA, et al. Defining the clinical courseof multiple sclerosis: the 2013 revisions. Neurology 2014;83:278 – 86CrossRef Medline
18. Polman CH, Reingold SC, Banwell B, et al. Diagnostic criteria for
multiple sclerosis: 2010 revisions to the McDonald criteria. AnnNeurol 2011;69:292–302 CrossRef Medline
19. Tustison NJ, Avants BB, Cook PA, et al. N4ITK: improved N3 biascorrection. IEEE Trans Med Imaging 2010;29:1310 –20 CrossRefMedline
20. Ganiler O, Oliver A, Diez Y, et al. A subtraction pipeline for auto-matic detection of new appearing multiple sclerosis lesions in lon-gitudinal studies. Neuroradiology 2014;56:363–74 CrossRef Medline
21. Diez Y, Oliver A, Cabezas M, et al. Intensity based methods for brainMRI longitudinal registration: a study in multiple sclerosis pa-tients. Neuroinformatics 2014;12:365–79 CrossRef Medline
22. Thirion JP. Image matching as a diffusion process: an analogy withMaxwell’s demons. Med Image Anal 1998;2:243– 60 CrossRefMedline
23. Cabezas M, Oliver A, Roura E, et al. Automatic multiple sclerosislesion detection in brain MRI by FLAIR thresholding. ComputMethods Programs Biomed 2014;115:147– 61 CrossRef Medline
24. Styner M, Lee J, Chin B, et al. 3D segmentation in the clinic: a grandchallenge II: MS lesion segmentation. MIDAS J 2008;1– 6
25. Menke J, Martinez TR. Using permutations instead of Student’s tdistribution for p-values in paired-difference algorithm compari-sons. In: Proceedings of the 2004 IEEE International Joint Conference ofNeural Networks, Budapest, Hungary. July 25–29, 2004
26. Dancey C, Reidy J. Statistics without Maths for Psychology: Using SPSSfor Windows. New York: Prentice Hall; 2004
27. Tintore M, Rovira A, Río J, et al. Defining high, medium and lowimpact prognostic factors for developing multiple sclerosis. Brain2015;138(pt 7):1863–74 CrossRef Medline
AJNR Am J Neuroradiol 37:1816 –23 Oct 2016 www.ajnr.org 1823
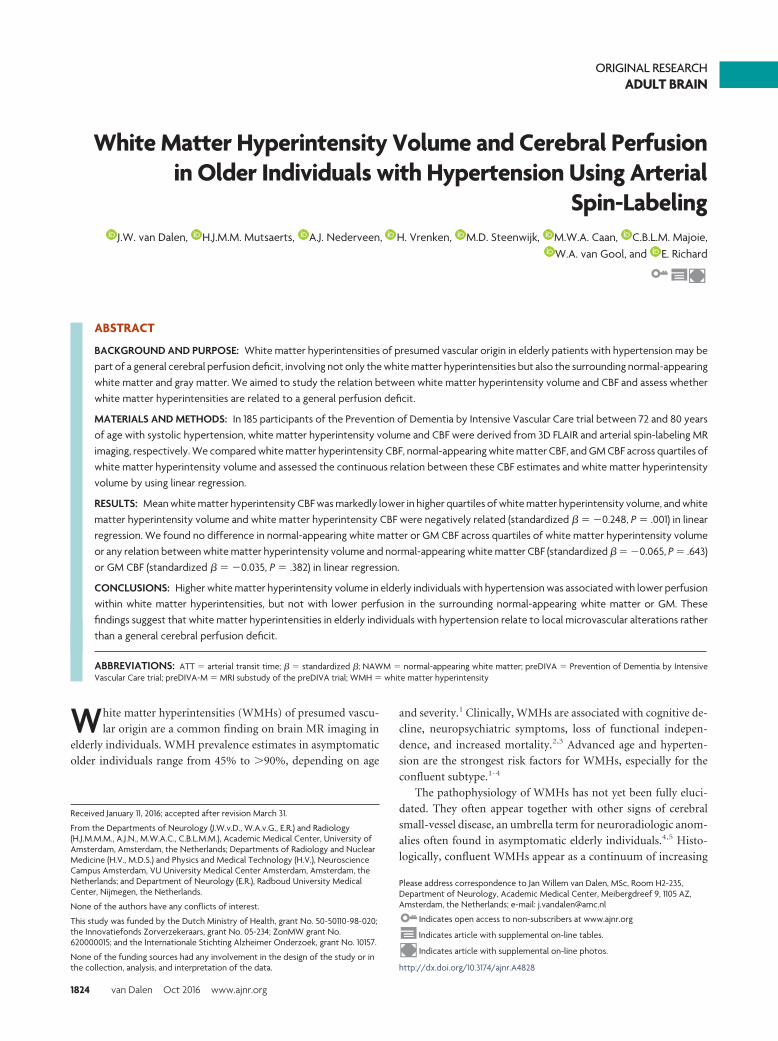
ORIGINAL RESEARCHADULT BRAIN
White Matter Hyperintensity Volume and Cerebral Perfusionin Older Individuals with Hypertension Using Arterial
Spin-LabelingX J.W. van Dalen, X H.J.M.M. Mutsaerts, X A.J. Nederveen, X H. Vrenken, X M.D. Steenwijk, X M.W.A. Caan, X C.B.L.M. Majoie,
X W.A. van Gool, and X E. Richard
ABSTRACT
BACKGROUND AND PURPOSE: White matter hyperintensities of presumed vascular origin in elderly patients with hypertension may bepart of a general cerebral perfusion deficit, involving not only the white matter hyperintensities but also the surrounding normal-appearingwhite matter and gray matter. We aimed to study the relation between white matter hyperintensity volume and CBF and assess whetherwhite matter hyperintensities are related to a general perfusion deficit.
MATERIALS AND METHODS: In 185 participants of the Prevention of Dementia by Intensive Vascular Care trial between 72 and 80 yearsof age with systolic hypertension, white matter hyperintensity volume and CBF were derived from 3D FLAIR and arterial spin-labeling MRimaging, respectively. We compared white matter hyperintensity CBF, normal-appearing white matter CBF, and GM CBF across quartiles ofwhite matter hyperintensity volume and assessed the continuous relation between these CBF estimates and white matter hyperintensityvolume by using linear regression.
RESULTS: Mean white matter hyperintensity CBF was markedly lower in higher quartiles of white matter hyperintensity volume, and whitematter hyperintensity volume and white matter hyperintensity CBF were negatively related (standardized � � �0.248, P � .001) in linearregression. We found no difference in normal-appearing white matter or GM CBF across quartiles of white matter hyperintensity volumeor any relation between white matter hyperintensity volume and normal-appearing white matter CBF (standardized � � �0.065, P � .643)or GM CBF (standardized � � �0.035, P � .382) in linear regression.
CONCLUSIONS: Higher white matter hyperintensity volume in elderly individuals with hypertension was associated with lower perfusionwithin white matter hyperintensities, but not with lower perfusion in the surrounding normal-appearing white matter or GM. Thesefindings suggest that white matter hyperintensities in elderly individuals with hypertension relate to local microvascular alterations ratherthan a general cerebral perfusion deficit.
ABBREVIATIONS: ATT � arterial transit time; � � standardized �; NAWM � normal-appearing white matter; preDIVA � Prevention of Dementia by IntensiveVascular Care trial; preDIVA-M � MRI substudy of the preDIVA trial; WMH � white matter hyperintensity
White matter hyperintensities (WMHs) of presumed vascu-
lar origin are a common finding on brain MR imaging in
elderly individuals. WMH prevalence estimates in asymptomatic
older individuals range from 45% to �90%, depending on age
and severity.1 Clinically, WMHs are associated with cognitive de-
cline, neuropsychiatric symptoms, loss of functional indepen-
dence, and increased mortality.2,3 Advanced age and hyperten-
sion are the strongest risk factors for WMHs, especially for the
confluent subtype.1-4
The pathophysiology of WMHs has not yet been fully eluci-
dated. They often appear together with other signs of cerebral
small-vessel disease, an umbrella term for neuroradiologic anom-
alies often found in asymptomatic elderly individuals.4,5 Histo-
logically, confluent WMHs appear as a continuum of increasing
Received January 11, 2016; accepted after revision March 31.
From the Departments of Neurology (J.W.v.D., W.A.v.G., E.R.) and Radiology(H.J.M.M.M., A.J.N., M.W.A.C., C.B.L.M.M.), Academic Medical Center, University ofAmsterdam, Amsterdam, the Netherlands; Departments of Radiology and NuclearMedicine (H.V., M.D.S.) and Physics and Medical Technology (H.V.), NeuroscienceCampus Amsterdam, VU University Medical Center Amsterdam, Amsterdam, theNetherlands; and Department of Neurology (E.R.), Radboud University MedicalCenter, Nijmegen, the Netherlands.
None of the authors have any conflicts of interest.
This study was funded by the Dutch Ministry of Health, grant No. 50-50110-98-020;the Innovatiefonds Zorverzekeraars, grant No. 05-234; ZonMW grant No.620000015; and the Internationale Stichting Alzheimer Onderzoek, grant No. 10157.
None of the funding sources had any involvement in the design of the study or inthe collection, analysis, and interpretation of the data.
Please address correspondence to Jan Willem van Dalen, MSc, Room H2-235,Department of Neurology, Academic Medical Center, Meibergdreef 9, 1105 AZ,Amsterdam, the Netherlands; e-mail: [email protected]
Indicates open access to non-subscribers at www.ajnr.org
Indicates article with supplemental on-line tables.
Indicates article with supplemental on-line photos.
http://dx.doi.org/10.3174/ajnr.A4828
1824 van Dalen Oct 2016 www.ajnr.org
tissue damage resembling chronic low-grade ischemia.1,5 There-
fore, WMHs may be the result of chronic low-grade white matter
hypoperfusion.1,5,6 In agreement, CBF within WMHs is lower
compared with normal-appearing WM (NAWM).7-14
Whether WMHs are associated with a lower cerebral perfusion
in general, also involving the surrounding NAWM and gray mat-
ter, is unclear. Some findings suggest that WMHs may relate to
lower whole-brain or GM perfusion,7,11,15,16 and WMHs have
been associated with reduced blood flow velocity in the large in-
tracranial arteries, outside the WM.17-19 On a broader level, the
association between WMHs and chronic cardiac disease also hints
at a relation with general perfusion.20 WMHs primarily originate
in physiologically poorly perfused areas (ie, the periventricular
and deep WM), explaining how even a slight cerebral perfusion
deficit could provoke low-grade ischemia in those regions associ-
ated with WMHs.21,22 Low perfusion in NAWM has also been
associated with subsequent WMH development.23 While these
findings seem to suggest that WMHs are related to a perfusion
deficit extending beyond the WMHs, current evidence remains
circumstantial.
In this study, we address the hypothesis that WMHs are asso-
ciated with lower cerebral perfusion, not only within the WMHs
but also in the surrounding NAWM and GM. If so, this could be a
first step in determining why WMHs form in elderly individuals
and toward preventive treatment. Because age and hypertension
are the strongest risk factors for asymptomatic WMHs, we tested
this hypothesis in a large cohort of community-dwelling elderly
with hypertension, by using noninvasive arterial spin-labeling
MR imaging. Arterial spin-labeling was chosen because this
method of perfusion measurement allows noninvasive (ie, with-
out contrast) MR imaging measurement of CBF within a scanning
time of as little as 4 minutes, facilitating large-scale CBF mea-
surement in research settings and eventually enabling clinical
application.
MATERIALS AND METHODSParticipantsThis study was approved by the Academic Medical Centre insti-
tutional review board in accordance with the Declaration of Hel-
sinki and the ethical standards of the institution. All participants
provided written informed consent before MR imaging. Partici-
pants were recruited from the Prevention of Dementia by Inten-
sive Vascular Care trial (preDIVA). This is an ongoing random-
ized controlled trial in community-dwelling elderly individuals
without dementia to study the efficacy of a nurse-led intervention
aimed at vascular risk factor modification to prevent dementia.24
A random subset of participants with systolic hypertension (�140
mm Hg) at baseline without dementia and any other severe med-
ical conditions likely to impede 4-year follow-up (eg, terminal
illness, late-stage heart failure, and chronic obstructive pulmo-
nary disease) were invited to participate in the preDIVA-MR im-
aging (preDIVA-M) substudy. In total, 195 participated in pre-
DIVA-M, equally distributed across intervention (n � 96) and
control (n � 99) groups of the preDIVA trial. Because the pre-
DIVA trial intervention, consisting of rigorous implementation of
normal cardiovascular health guidelines, is unlikely to affect the
relation between WMHs and CBF, for the current analyses, the
group was considered as a single cohort irrespective of treatment
allocation. MR imaging was performed after the second preDIVA
clinical assessment took place, between 2 and 4 years after the
preDIVA baseline assessment. Clinical data used in this study
were derived from this second assessment. The median time be-
tween clinical assessment and MR imaging was 238 days (inter-
quartile range, 147– 429 days). Collected data included the pres-
ence of vascular risk factors (systolic and diastolic blood pressure,
smoking status [current, former, never], and body mass index).
Medical history was obtained through self-reporting, cross-refer-
enced with the general practitioner’s medical records, and in-
cluded diabetes mellitus, stroke, TIA, and cardiovascular disease,
comprising angina pectoris, myocardial infarction, and periph-
eral arterial disease.
MR Imaging AcquisitionAll imaging was performed on a 3T Intera scanner (Philips
Healthcare, Best, the Netherlands) with a sensitivity encoding
8-channel head coil. Foam padding was used to restrict head mo-
tion. An isotropic 1-mm3 3D T1-weighted sequence (TR, 6.6 ms;
TE, 3.1 ms; flip angle, 9°; FOV, 270 � 270 mm2; 170 sagittal
sections; 1.2-mm section thickness; 1.1 � 1.1 mm2 in-plane res-
olution) and an isotropic 1-mm3 3D FLAIR sequence (TR/TE,
4800/355 ms; TI, 1650 ms; FOV, 250 � 250 mm2; 160 sagittal
sections; 1.12-mm thickness, interpolated to 0.56-mm thick
[overcontiguous] sections during reconstruction; 1.1 � 1.1 mm2
in-plane resolution) were performed. Consecutively, 2 gradient-
echo single-shot echo-planar imaging pseudocontinuous arterial
spin-labeling sequences (matrix, 64 � 64; TR/TE, 4000/17 ms; flip
angle, 90°; FOV, 240 � 240 mm; 17 axial sections; no gap; 7-mm
section thickness; sensitivity encoding, 2.5; postlabel delay, 1525–
2120 ms; labeling duration, 1650 ms) were obtained: one with
flow-crushing diffusion gradients in 3 directions (CBF crushed,
b-value � 0.6 s/mm2, velocity-encoding 50 mm/s) and one with-
out (CBF noncrushed, b-value � 0 s/mm2). Twenty dynamics
were acquired for each scan, resulting in a total scan duration of
2 � 160 � 320 seconds. Background suppression was imple-
mented with 2 inversion pulses, respectively, 1710 and 2860 ms
after a prelabeling saturation pulse. The labeling plane was posi-
tioned parallel to the imaging volume, 9 cm inferior to the center
of the imaging volume.25
Image ProcessingAn overview of image processing is provided in On-line Fig 1.
WMH segmentation was performed by using a k-Nearest-Neigh-
bors algorithm with tissue-type priors, described and validated
previously.26 In total, 194 scans were automatically segmented.
MR imaging data were further processed by using the Statisti-
cal Parametric Mapping 8 toolbox (SPM8; http://www.fil.ion.
ucl.ac.uk/spm/software/) and custom scripts in Matlab 7.12.0
(MathWorks, Natick, Massachusetts). Arterial spin-labeling data
processing and quantification were performed by H.J.M.M.M.
(postdoctoral researcher, 6 years of experience) and are described
in more detail elsewhere.27 In short, T1-weighted images were
segmented into GM and WM probability maps. After motion
correction, 2 � 20 pairs of arterial spin-labeled and control im-
ages were pair-wise subtracted and subsequently averaged to gen-
AJNR Am J Neuroradiol 37:1824 –30 Oct 2016 www.ajnr.org 1825
erate perfusion-weighted maps, which were converted to millili-
ter/100 g/min by using a single compartment model.28,29 No
distinction was made between the quantification of GM and WM
voxels. After quantification, the CBF crushed maps were rigid-
body registered to the CBF noncrushed maps. For the main anal-
yses, CBF was derived from the crushed CBF maps.
MR Imaging Outcome MeasuresWMH volume was calculated from the automatic segmentation
maps and was logarithmically transformed to approach a normal
distribution. This logarithmically transformed WMH volume was
used for all statistical analyses.
Median CBF estimates were taken for the segmented GM,
WM, WMHs, and NAWM, operationalized as the WM outside
the WMHs. Although extreme values, or outliers, of CBF mea-
surements would be less representative of the study population,
they could have a disproportionally large influence on linear re-
gression results. To avoid the strong influence of outliers on the
main analyses, we excluded participants with median GM, WM,
NAWM, and WMH CBF values differing �3 SDs from the group
mean.
Atrophy and arterial transit times were considered as MR im-
aging– derived parameters, potentially confounding the correla-
tion between WMH and CBF. As a proxy for atrophy, which is a
longitudinal measure and thus could not be measured, the brain
parenchymal fraction was calculated as the ratio (GM � WM
volume)/(intracranial volume). Arterial transit time (ATT),
which represents the mean arterial transit time from the labeling
plane at the level of the cervical arteries to the GM tissue arterioles
(On-line Fig 2), was calculated from crushed and noncrushed
CBF values by using the flow encoding arterial spin tagging equa-
tion,28 as published previously.27
Computations were performed by using Matlab 7.12.0; SPM8
8; the Oxford Centre for Functional MR Imaging of the Brain
Software Library, Version 5.030 (FSL; http://www.fmrib.ox.ac.uk/
fsl); and SPSS statistics, Versions 20 and 21 (IBM, Armonk, New
York) by H.J.M.M.M. (postdoctoral researcher, 6 years of experi-
ence) and J.W.v.D. (researcher, 4 years of experience) with the
support of M.W.A.C. (postdoctoral researcher, 10 years of
experience).
Statistical AnalysisSignificance for P values was set at �.05. Two-tailed paired sam-
ple t tests were used to compare GM CBF with WM CBF and
NAWM CBF with WMH CBF. Differences in mean CBF between
quartiles of WMH volume were compared by using 1-way analy-
sis of variance followed by Tukey post hoc testing to identify
which quartiles differed significantly from each other.
The relation between WMH volume and CBF in the WMHs,
NAWM, and GM was assessed in separate linear regression anal-
yses. In model 1, these analyses were adjusted for total brain vol-
ume. In model 2, analyses were additionally adjusted for potential
confounders. To identify which confounders to include in model
2, we performed separate linear regression analyses for age, sex,
brain parenchymal fraction, ATT, smoking status (current, for-
mer, never), history of stroke (including transient ischemic at-
tack), history of other cardiovascular diseases (peripheral arterial
disease, angina pectoris, myocardial infarction), diabetes melli-
tus, body mass index, antihypertensive drug use, systolic blood
pressure, and diastolic blood pressure, because these could all
potentially affect both CBF and WMH volumes.1,4,5,31,32 Any of
these variables individually associated with WMH volume ad-
justed for total brain volume with a P value � .1 were included as
potential confounders in model 2.
Finally, 3 post hoc sensitivity analyses were performed. First,
because previous findings suggested that CBF in WMHs, NAWM,
and GM may only decrease from a certain minimum threshold of
WMH volume,33 the above-mentioned analyses were repeated
with exclusion of the participants in the lowest quartile of WMH
volume. Second, to assess the influence of excluding participants
with CBF values differing �3 SDs from the mean from the main
analyses, we repeated the main analyses without excluding these
participants. Third, because different mechanisms for WMH for-
mations may occur in participants with and without cerebrovas-
cular disease, we performed a sensitivity analysis in which we ex-
cluded participants with a history of cerebrovascular disease or
lacunar infarcts on MR imaging. For the sensitivity analyses, the
outcomes of the adjusted model (model 2) are shown in the “Re-
sults” section.
RESULTSDescriptivesThe mean age of the population was 77 � 2 years, and 53% were
women. At the most recent clinical assessment before scanning,
26% of participants’ hypertension was under control; 41% had
grade I hypertension according to World Health Organization
standards; 21%, grade II hypertension; and 11%, grade III hyper-
tension. Other participant characteristics are listed in Table 1.
Data of 10 participants were discarded because of processing er-
Table 1: General characteristicsa
Characteristics (n = 181)Age (yr) 77 (2)Female 96 (53%)MMSE 29 (28–30)BMI (kg/m2) 26 (24–28)History of stroke or TIA 19 (11%)History of cardiovascular disease 41 (23%)Diabetes mellitus 20 (11%)Smoking status
Never 82 (45%)Former 88 (49%)Current 11 (6%)
Antihypertensive drug use 108 (60%)World Health Organization
hypertension grade:Normotension 47 (26%)Grade I hypertension 73 (41%)Grade II hypertension 38 (21%)Grade III hypertension 20 (11%)
Systolic blood pressure (mm Hg) 148 (138–165)Diastolic blood pressure (mm Hg) 81 (74–90)Brain parenchymal fraction 0.61 (0.025)WMH volume (mL) 6.5 (3.6–11.2)
Note:—MMSE indicates Mini-Mental State Examination; BMI, body mass index.a Reported are means and SDs, numbers and valid percentages, or medians withinterquartile range. Cardiovascular disease comprises peripheral arterial disease, an-gina pectoris, and myocardial infarction. Brain parenchymal fraction � (total cerebralvolume)/total intracranial volume.
1826 van Dalen Oct 2016 www.ajnr.org
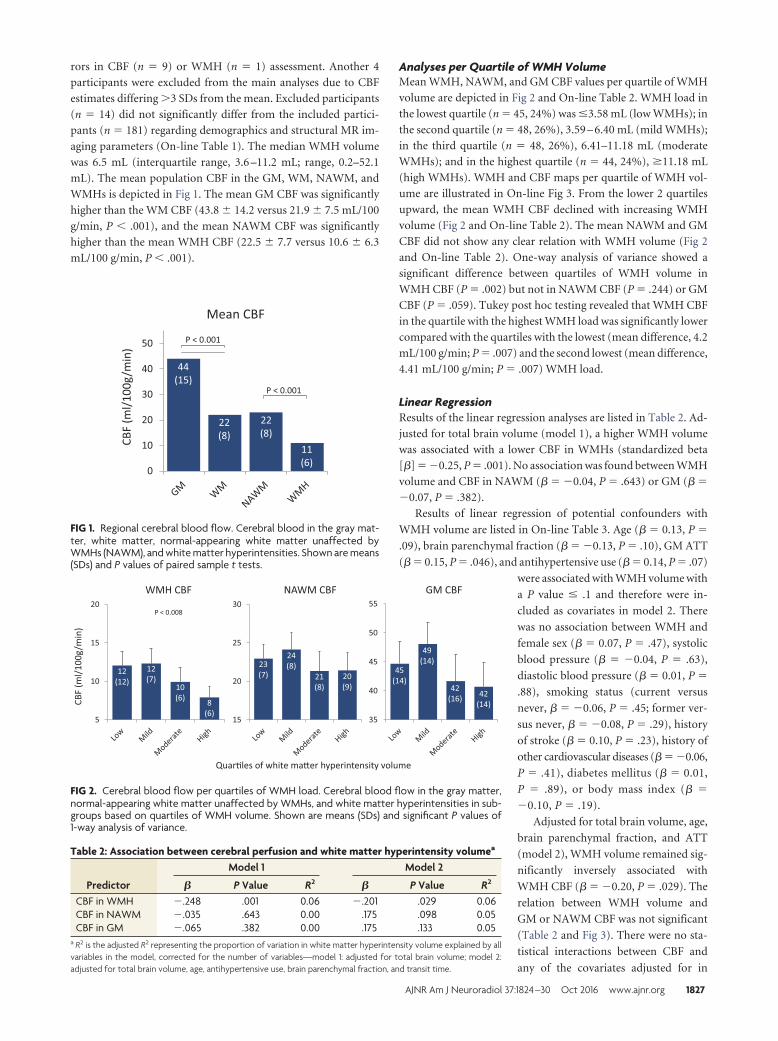
rors in CBF (n � 9) or WMH (n � 1) assessment. Another 4
participants were excluded from the main analyses due to CBF
estimates differing �3 SDs from the mean. Excluded participants
(n � 14) did not significantly differ from the included partici-
pants (n � 181) regarding demographics and structural MR im-
aging parameters (On-line Table 1). The median WMH volume
was 6.5 mL (interquartile range, 3.6 –11.2 mL; range, 0.2–52.1
mL). The mean population CBF in the GM, WM, NAWM, and
WMHs is depicted in Fig 1. The mean GM CBF was significantly
higher than the WM CBF (43.8 � 14.2 versus 21.9 � 7.5 mL/100
g/min, P � .001), and the mean NAWM CBF was significantly
higher than the mean WMH CBF (22.5 � 7.7 versus 10.6 � 6.3
mL/100 g/min, P � .001).
Analyses per Quartile of WMH VolumeMean WMH, NAWM, and GM CBF values per quartile of WMH
volume are depicted in Fig 2 and On-line Table 2. WMH load in
the lowest quartile (n � 45, 24%) was �3.58 mL (low WMHs); in
the second quartile (n � 48, 26%), 3.59 – 6.40 mL (mild WMHs);
in the third quartile (n � 48, 26%), 6.41–11.18 mL (moderate
WMHs); and in the highest quartile (n � 44, 24%), �11.18 mL
(high WMHs). WMH and CBF maps per quartile of WMH vol-
ume are illustrated in On-line Fig 3. From the lower 2 quartiles
upward, the mean WMH CBF declined with increasing WMH
volume (Fig 2 and On-line Table 2). The mean NAWM and GM
CBF did not show any clear relation with WMH volume (Fig 2
and On-line Table 2). One-way analysis of variance showed a
significant difference between quartiles of WMH volume in
WMH CBF (P � .002) but not in NAWM CBF (P � .244) or GM
CBF (P � .059). Tukey post hoc testing revealed that WMH CBF
in the quartile with the highest WMH load was significantly lower
compared with the quartiles with the lowest (mean difference, 4.2
mL/100 g/min; P � .007) and the second lowest (mean difference,
4.41 mL/100 g/min; P � .007) WMH load.
Linear RegressionResults of the linear regression analyses are listed in Table 2. Ad-
justed for total brain volume (model 1), a higher WMH volume
was associated with a lower CBF in WMHs (standardized beta
[�] � �0.25, P � .001). No association was found between WMH
volume and CBF in NAWM (� � �0.04, P � .643) or GM (� �
�0.07, P � .382).
Results of linear regression of potential confounders with
WMH volume are listed in On-line Table 3. Age (� � 0.13, P �
.09), brain parenchymal fraction (� � �0.13, P � .10), GM ATT
(� � 0.15, P � .046), and antihypertensive use (� � 0.14, P � .07)
were associated with WMH volume with
a P value � .1 and therefore were in-
cluded as covariates in model 2. There
was no association between WMH and
female sex (� � 0.07, P � .47), systolic
blood pressure (� � �0.04, P � .63),
diastolic blood pressure (� � 0.01, P �
.88), smoking status (current versus
never, � � �0.06, P � .45; former ver-
sus never, � � �0.08, P � .29), history
of stroke (� � 0.10, P � .23), history of
other cardiovascular diseases (� � �0.06,
P � .41), diabetes mellitus (� � 0.01,
P � .89), or body mass index (� �
�0.10, P � .19).
Adjusted for total brain volume, age,
brain parenchymal fraction, and ATT
(model 2), WMH volume remained sig-
nificantly inversely associated with
WMH CBF (� � �0.20, P � .029). The
relation between WMH volume and
GM or NAWM CBF was not significant
(Table 2 and Fig 3). There were no sta-
tistical interactions between CBF and
any of the covariates adjusted for in
0
10
20
30
40
50
Mean CBF
CBF
(ml/
100g
/min
)
44(15)
22(8)
22(8)
11(6)
P < 0.001
P < 0.001
FIG 1. Regional cerebral blood flow. Cerebral blood in the gray mat-ter, white matter, normal-appearing white matter unaffected byWMHs (NAWM), and white matter hyperintensities. Shown are means(SDs) and P values of paired sample t tests.
35
40
45
50
55
15
20
25
30
5
10
15
20
GM CBFNAWM CBFWMH CBF
CBF
(ml/
100g
/min
)
Quar�les of white ma�er hyperintensity volume
12(12)
12(7)
10(6)
8(6)
23(7)
24(8)
21(8)
20(9)
45(14)
49(14)
42(16) 42
(14)
P < 0.008
FIG 2. Cerebral blood flow per quartiles of WMH load. Cerebral blood flow in the gray matter,normal-appearing white matter unaffected by WMHs, and white matter hyperintensities in sub-groups based on quartiles of WMH volume. Shown are means (SDs) and significant P values of1-way analysis of variance.
Table 2: Association between cerebral perfusion and white matter hyperintensity volumea
Predictor
Model 1 Model 2
� P Value R2 � P Value R2
CBF in WMH �.248 .001 0.06 �.201 .029 0.06CBF in NAWM �.035 .643 0.00 .175 .098 0.05CBF in GM �.065 .382 0.00 .175 .133 0.05
a R2 is the adjusted R2 representing the proportion of variation in white matter hyperintensity volume explained by allvariables in the model, corrected for the number of variables—model 1: adjusted for total brain volume; model 2:adjusted for total brain volume, age, antihypertensive use, brain parenchymal fraction, and transit time.
AJNR Am J Neuroradiol 37:1824 –30 Oct 2016 www.ajnr.org 1827
model 2, indicating that the statistical relation between CBF and
WMH volume was independent of any of these covariates. The
sensitivity analysis without participants in the lowest quartile of
WMH volume (n � 132) yielded similar results for the relation
between WMH volume and WMH CBF (� � �0.25, P � .02),
NAWM CBF (� � 0.05, P � .69), and GM CBF (� � �0.02, P �
.74). The sensitivity analysis, which included participants whose
mean CBF values deviated �3 SDs from the mean, gave somewhat
inflated results for the relation between WMH volume and WMH
CBF (� � �0.34, P � .001), but similar results for NAWM CBF
(� � 0.18, P � .09) and GM CBF (� � 0.18, P � .11). The
sensitivity analysis in participants without a history of stroke or
lacunar infarcts on the MR imaging (n � 150) attenuated results
for the relation between WMH volume and WMH CBF (� �
�0.178, P � .09) but yielded similar results for NAWM CBF (� �
0.20, P � .10) and GM CBF (� � 0.18, P � .16).
DISCUSSIONIn a cohort of community-dwelling elderly individuals with hy-
pertension, we found that CBF within WMHs is lower than CBF
in NAWM and that WMH CBF decreases with increasing WMH
volume. Contrary to our hypothesis, we did not find any indica-
tions that CBF in the NAWM or GM is also lower in patients with
WMHs. These results suggest that WMHs in elderly individuals
with hypertension are not related to a general decrease of cerebral
perfusion. Higher GM ATT was also associated with higher WMH
volume.
Because the surrounding NAWM does not seem to be affected,
hypoperfusion within WMHs may be a direct consequence of
local extensive tissue damage and obliteration of capillaries.5,6
Recent findings link WMHs to an accumulation of tiny infarc-
tions,34 which could cause such tissue damage. However, WMHs
primarily develop in regions with low perfusion, suggesting that
low perfusion is involved in WMH conception.21,22 Conceivably,
tiny infarctions interact with low-grade hypoperfusion, for exam-
ple, originating when perfusion in a small area drops below a
certain threshold. Such low-grade hypoperfusion could be too
small to measure with current techniques and only becomes ap-
parent after WMHs develop due to tissue damage.5,6,35 Microvas-
cular alterations associated with aging and exacerbated by hyper-
tension (luminal narrowing, vessel wall stiffening) may impede
sufficient perfusion, especially distally in the WM where perfu-
sion pressure is the lowest (On-line Fig 2).5,6 A similar mechanism
could operate in diseases associated with cerebral perfusion defi-
cits in which hypertension exacerbates WMH development, for
example, heart failure and Alzheimer disease.14,20,36
GM perfusion does seem altered in patients with WMHs, in
the sense that higher GM ATT was associated with higher WMH
volume. Interpretation of this finding is not straightforward. ATT
depends on the length of the blood flow trajectory from the cer-
vical arteries to the cerebral capillaries and on the blood flow
velocity along this trajectory.32 WMHs have been associated with
reduced blood flow velocity in the large intracranial arteries, of
which longer ATT could be a proxy.17-19 This velocity reduction
could be caused by increased resistance due to large-vessel athero-
sclerosis or small-vessel arteriolosclerosis, which are both associ-
ated with WMHs.6,37,38 The association between antihypertensive
medication use and a higher WMH volume may be due to anti-
hypertensive use being associated with more chronic and severe
hypertension. Hypothetically antihypertensive drugs may lead to
hypoperfusion, aggravating WMHs, but recent study findings
make that possibility unlikely.39,40 Although our study was con-
ducted in an elderly population with hypertension in the Nether-
lands, approximately 70% in this age range have hypertension,41
suggesting that our findings may apply to a large part of the gen-
eral population. Findings of similar studies were in small or se-
lected populations,7,10,11,15 and may be less readily translatable to
the general elderly community.
Our finding that CBF values within WMHs are lower in
participants with higher WMH volume is in line with previous
findings.13 This lower CBF within WMH may be caused by the
increase in tissue damage and disturbance of the microvascular
blood supply to the center of WMHs as they increase in size.13
The absence of a relation between WMH volume and NAWM
or GM CBF is somewhat surprising because results of other
studies have hinted at such a relation.7,11,15 Our findings may
be because CBF in GM and NAWM only diminishes with in-
creasing WMH volume from a certain threshold of WMH vol-
ume.33 However, our sensitivity analysis in which this possi-
bility was evaluated did not alter our findings. Another reason
may lie in the differences between study populations. Studies
linking WMHs to lower overall cerebral or GM perfusion were
p p p
FIG 3. Scatterplots of relations between CBF and WMH volume, adjusted for total brain volume. Lines denote the regression line with 95% CI.Log WMH volume is logarithmically transformed.
1828 van Dalen Oct 2016 www.ajnr.org
performed in mixed populations, including patients with mild
cognitive impairment and Alzheimer disease.7,11,15 Mild cog-
nitive impairment and Alzheimer disease are themselves asso-
ciated with alterations in CBF.37 These perfusion alterations
may be linked to WMH formation in these conditions by di-
minishing the blood supply to WM already susceptible to de-
veloping WMHs.14 Recent reports that a negative correlation
between GM CBF and WMHs does exist in patients with
Alzheimer disease but not in patients in a memory clinic with-
out mild cognitive impairment or dementia support this
explanation.15
This study has some limitations. The variance in CBF ex-
plained in our regression models was small, and the cross-sec-
tional nature of our analysis prohibits inferences about any tem-
poral or causal relation between CBF and WMHs. In addition,
WMHs are associated with slight perfusion deficits in the NAWM
and GM. The physiologic variability of CBF may be too great to
reveal such small differences among participants. ATT may be less
physiologically variable and thereby a more sensitive marker of
these slight differences.27 Furthermore, because in arterial spin-
labeling, longer ATT may cause lower CBF estimates, especially
distally, the association between ATT and WMH volume may
have affected our WMH CBF estimates.32 However, adjustment
for ATT alone did not much affect the association between WMH
CBF and WMH volume.
Another limitation is that it is uncertain whether the signal-
to-noise ratio of WM perfusion by using arterial spin-labeling is
sufficient to accurately estimate WM CBF within our short scan-
ning time.42,43 However, although current arterial spin-labeling
techniques may be unable to measure WM CBF with high accu-
racy on a voxel-level, on an ROI level, as used in this study, it has
been shown that WM CBF can be measured within a scanning
time of as little as 5 minutes.44-46 Our measurements were precise
enough to measure significant differences in CBF between the
NAWM and WMH and between the whole WM and the NAWM
only. Moreover, the reliability of our findings is supported by the
ratios between the GM, WM, NAWM, and WMH CBF, which are
similar to those reported in studies in which exogenous contrast
agents were used.9,13,14 Finally, as a more general limitation,
WMH volume may be linked to impaired autoregulation.47,48
Because in MR imaging, CBF is measured with the patient in the
supine position, in patients with impaired cerebral autoregula-
tion, regional CBF differences that occur while the patient is up-
right may be obscured.
Future studies using arterial spin-labeling to compare
WMHs, NAWM, and GM CBF may benefit from new develop-
ments that increase signal-to-noise ratios and spatial resolu-
tion. In addition, they may be conducted in a more general
population of elderly individuals with hypertension. Our pop-
ulation was a somewhat healthy selection because hyperten-
sion was under control in 26% and those with relatively severe
medical conditions were excluded. In addition, it may be valu-
able to compare CBF estimates in patients with hypertension
and WMHs with elderly individuals with asymptomatic
WMHs without hypertension to discern potentially different
etiologies and to chart the longitudinal relation between ap-
parent perfusion deficits and WMH development.
CONCLUSIONSHigher WMH volume in elderly patients with hypertension was
associated with lower perfusion within WMHs, but not with
lower perfusion in the surrounding NAWM or GM. These results
suggest that WMH formation in these patients is associated with
hypoperfusion locally in the WMHs, rejecting our hypothesis that
WMHs in this population are the result of a general perfusion
deficit. Our findings may contribute to the understanding of the
pathophysiology of WMHs in advanced age and hypertension,
potentially helping to develop better targeted prevention and
treatment strategies for WMHs and their clinical correlates.
ACKNOWLEDGMENTSWe are much indebted to C.E. Miedema and I.M. Steinman for
planning and logistics and Dr F.E. de Leeuw for his critical review
of the manuscript.
Disclosures: Hugo Vrenken—UNRELATED: Grants/Grants Pending: Novartis,* Teva,*Merck Serono,* Comments: research grants in multiple sclerosis brain imaging; Pat-ents (planned, pending or issued): VU University Medical Center,* Comments:planned patent on brain atrophy measurement. Charles Majoie—UNRELATED: Pay-ment for Lectures (including service on Speakers Bureaus): Stryker.* *Money paid tothe institution.
REFERENCES1. Schmidt R, Schmidt H, Haybaeck J, et al. Heterogeneity in age-re-
lated white matter changes. Acta Neuropathol 2011;122:171– 85CrossRef Medline
2. Debette S, Markus HS. The clinical importance of white matter hy-perintensities on brain magnetic resonance imaging: systematic re-view and meta-analysis. BMJ 2010;341:c3666 CrossRef Medline
3. Schmahmann JD, Smith EE, Eichler FS, et al. Cerebral white matter:neuroanatomy, clinical neurology, and neurobehavioral corre-lates. Ann N Y Acad Sci 2008;1142:266 –309 CrossRef Medline
4. Moran C, Phan TG, Srikanth VK. Cerebral small vessel disease: areview of clinical, radiological, and histopathological phenotypes.Int J Stroke 2012;7:36 – 46 CrossRef Medline
5. Pantoni L. Cerebral small vessel disease: from pathogenesis andclinical characteristics to therapeutic challenges. Lancet Neurol2010;9:689 –701 CrossRef Medline
6. Brown WR, Thore CR. Review: cerebral microvascular pathology inageing and neurodegeneration. Neuropathol Appl Neurobiol 2011;37:56 –74 CrossRef Medline
7. Bastos-Leite AJ, Kuijer JP, Rombouts SA, et al. Cerebral blood flowby using pulsed arterial spin-labeling in elderly subjects with whitematter hyperintensities. AJNR Am J Neuroradiol 2008;29:1296 –301CrossRef Medline
8. Markus HS. Reduced cerebral blood flow in white matter in isch-aemic leukoaraiosis demonstrated using quantitative exogenouscontrast based perfusion MRI. J Neurol Neurosurg Psychiatry 2000;69:48 –53 CrossRef Medline
9. O’Sullivan M, Lythgoe DJ, Pereira AC, et al. Patterns of cerebralblood flow reduction in patients with ischemic leukoaraiosis. Neu-rology 2002;59:321–26 CrossRef Medline
10. Brickman AM, Zahra A, Muraskin J, et al. Reduction in cerebralblood flow in areas appearing as white matter hyperintensities onmagnetic resonance imaging. Psychiatry Res 2009;172:117–20CrossRef Medline
11. Zhang Q, Stafford RB, Wang Z, et al. Microvascular perfusion basedon arterial spin labeled perfusion MRI as a measure of vascular riskin Alzheimer’s disease. J Alzheimers Dis 2012;32:677– 87 CrossRefMedline
12. Marstrand JR, Garde E, Rostrup E, et al. Cerebral perfusion andcerebrovascular reactivity are reduced in white matter hyperinten-sities. Stroke 2002;33:972–76 CrossRef Medline
AJNR Am J Neuroradiol 37:1824 –30 Oct 2016 www.ajnr.org 1829
13. Sachdev P, Wen W, Shnier R, et al. Cerebral blood volume in T2-weighted white matter hyperintensities using exogenous contrastbased perfusion MRI. J Neuropsychiatry Clin Neurosci 2004;16:83–92Medline
14. Makedonov I, Black SE, MacIntosh BJ. Cerebral small vessel diseasein aging and Alzheimer’s disease: a comparative study using MRIand SPECT. Eur J Neurol 2013;20:243–50 CrossRef Medline
15. Benedictus MR, Binnewijzend MA, Kuijer JP, et al. Brain volume andwhite matter hyperintensities as determinants of cerebral bloodflow in Alzheimer’s disease. Neurobiol Aging 2014;35:2665–70CrossRef Medline
16. Crane DE, Black SE, Ganda A, et al. Gray matter blood flow andvolume are reduced in association with white matter hyperinten-sity lesion burden: a cross-sectional MRI study. Front Aging Neurosci2015;7:131 CrossRef Medline
17. Tzourio C, Levy C, Dufouil C, et al. Low cerebral blood flow velocityand risk of white matter hyperintensities. Ann Neurol 2001;49:411–14 CrossRef Medline
18. Novak V, Last D, Alsop DC, et al. Cerebral blood flow velocity andperiventricular white matter hyperintensities in type 2 diabetes. Di-abetes Care 2006;29:1529 –34 CrossRef Medline
19. Heliopoulos I, Artemis D, Vadikolias K, et al. Association of ultra-sonographic parameters with subclinical white-matter hyperinten-sities in hypertensive patients. Cardiovasc Psychiatry Neurol 2012;2012:1– 8 CrossRef Medline
20. Alosco ML, Brickman AM, Spitznagel MB, et al. Independent andinteractive effects of blood pressure and cardiac function on brainvolume and white matter hyperintensities in heart failure. J Am SocHypertens 2013;7:336 – 43 CrossRef Medline
21. Holland CM, Smith EE, Csapo I, et al. Spatial distribution of white-matter hyperintensities in Alzheimer disease, cerebral amyloid an-giopathy, and healthy aging. Stroke 2008;39:1127–33 CrossRefMedline
22. Ten Dam VH, van den Heuvel DM, de Craen AJ, et al. Decline in totalcerebral blood flow is linked with increase in periventricular butnot deep white matter hyperintensities. Radiology 2007;243:198 –203 CrossRef Medline
23. Promjunyakul N, Lahna D, Kaye JA, et al. Characterizing the whitematter hyperintensity penumbra with cerebral blood flow mea-sures. Neuroimage Clin 2015;8:224 –29 CrossRef Medline
24. Richard E, Van den Heuvel E, Moll van Charante EP, et al. Preventionof dementia by intensive vascular care (PreDIVA): a cluster-ran-domized trial in progress. Alzheimer Dis Assoc Disord 2009;23:198 –204 CrossRef Medline
25. Alsop DC, Dai W, Grossman M, et al. Arterial spin labeling bloodflow MRI: its role in the early characterization of Alzheimer’s dis-ease. J Alzheimers Dis 2010;20:871– 80 CrossRef Medline
26. Steenwijk MD, Pouwels PJ, Daams M, et al. Accurate white matterlesion segmentation by k nearest neighbor classification with tissuetype priors (kNN-TTPs). Neuroimage Clin 2013;3:462– 69 CrossRefMedline
27. Mutsaerts HJ, van Dalen JW, Heijtel DF, et al. Cerebral perfusionmeasurements in elderly with hypertension using arterial spin la-beling. PLoS One 2015;10:e0133717 CrossRef Medline
28. Wang J, Alsop DC, Song HK, et al. Arterial transit time imaging withflow encoding arterial spin tagging (FEAST). Magn Reson Med 2003;50:599 – 607 CrossRef Medline
29. Buxton RB, Frank LR, Wong EC, et al. A general kinetic model forquantitative perfusion imaging with arterial spin labeling. MagnReson Med 1998;40:383–96 CrossRef Medline
30. Jenkinson M, Beckmann CF, Behrens TE, et al. FSL. Neuroimage2012;62:782–90 CrossRef Medline
31. Gouw AA, Seewann A, van der Flier WM, et al. Heterogeneity ofsmall vessel disease: a systematic review of MRI and histopathologycorrelations. J Neurol Neurosurg Psychiatry 2011;82:126 –35 CrossRefMedline
32. Yang Y, Engelien W, Xu S, et al. Transit time, trailing time, andcerebral blood flow during brain activation: measurement usingmultislice, pulsed spin-labeling perfusion imaging. Magn ResonMed 2000;44:680 – 85 Medline
33. Wen W, Sachdev P, Shnier R, et al. Effect of white matter hyperin-tensities on cortical cerebral blood volume using perfusion MRI.Neuroimage 2004;21:1350 –56 CrossRef Medline
34. Conklin J, Silver FL, Mikulis DJ, et al. Are acute infarcts the cause ofleukoaraiosis? Brain mapping for 16 consecutive weeks. Ann Neurol2014;76:899 –904 CrossRef Medline
35. Qureshi AI, Caplan LR. Intracranial atherosclerosis. Lancet 2014;383:984 –98 CrossRef Medline
36. Benedictus MR, Goos JD, Binnewijzend MA, et al. Specific risk fac-tors for microbleeds and white matter hyperintensities in Alzhei-mer’s disease. Neurobiol Aging 2013;34:2488 –94 CrossRef Medline
37. de la Torre JC. Cerebral hemodynamics and vascular risk factors:setting the stage for Alzheimer’s disease. J Alzheimers Dis 2012;32:553– 67 CrossRef Medline
38. Macintosh BJ, Marquardt L, Schulz UG, et al. Hemodynamic altera-tions in vertebrobasilar large artery disease assessed by arterialspin-labeling MR imaging. AJNR Am J Neuroradiol 2012;33:1939 – 44 CrossRef Medline
39. Tryambake D, He J, Firbank MJ, et al. Intensive blood pressure low-ering increases cerebral blood flow in older subjects with hyperten-sion. Hypertension 2013;61:1309 –15 CrossRef Medline
40. Muller M, van der Graaf Y, Visseren FL, et al. Blood pressure, cere-bral blood flow, and brain volumes: the SMART-MR study. J Hyper-tens 2010;28:1498 –505 CrossRef Medline
41. The Netherlands National Institute for Health and the Environment(RIVM) blood pressure statistics (Dutch). https://www.volksgezondheidenzorg.info/onderwerp/bloeddruk/cijfers-context/huidige-situatie#!node-verhoogde-bloeddruk-naar-leeftijd. Accessed November 26,2015
42. van Gelderen P, de Zwart JA, Duyn JH. Pittfalls of MRI measurementof white matter perfusion based on arterial spin labeling. MagnReson Med 2008;59:788 –95 CrossRef Medline
43. Petersen ET, Zimine I, Ho YC, et al. Non-invasive measurement ofperfusion: a critical review of arterial spin labelling techniques. Br JRadiol 2006;79:688 –701 CrossRef Medline
44. Mutsaerts HJ, Richard E, Heijtel DF, et al. Gray matter contamina-tion in arterial spin labeling white matter perfusion measurementsin patients with dementia. Neuroimage Clin 2014;4:139 – 44 CrossRefMedline
45. Wu WC, Lin SC, Wang DJ, et al. Measurement of cerebral whitematter perfusion using pseudocontinuous arterial spin labeling 3Tmagnetic resonance imaging: an experimental and theoretical in-vestigation of feasibility. PLoS One 2013;8:e82679 CrossRef Medline
46. van Osch MJ, Teeuwisse WM, van Walderveen MA, et al. Can arterialspin labeling detect white matter perfusion signal? Magn Reson Med2009;62:165–73 CrossRef Medline
47. Brickman AM, Guzman VA, Gonzalez-Castellon M, et al. Cerebralautoregulation, beta amyloid, and white matter hyperintensitiesare interrelated. Neurosci Lett 2015;592:54 –58 CrossRef Medline
48. Birns J, Jarosz J, Markus HS, et al. Cerebrovascular reactivity anddynamic autoregulation in ischaemic subcortical white matter dis-ease. J Neurol Neurosurg Psychiatry 2009;80:1093–98 CrossRefMedline
1830 van Dalen Oct 2016 www.ajnr.org
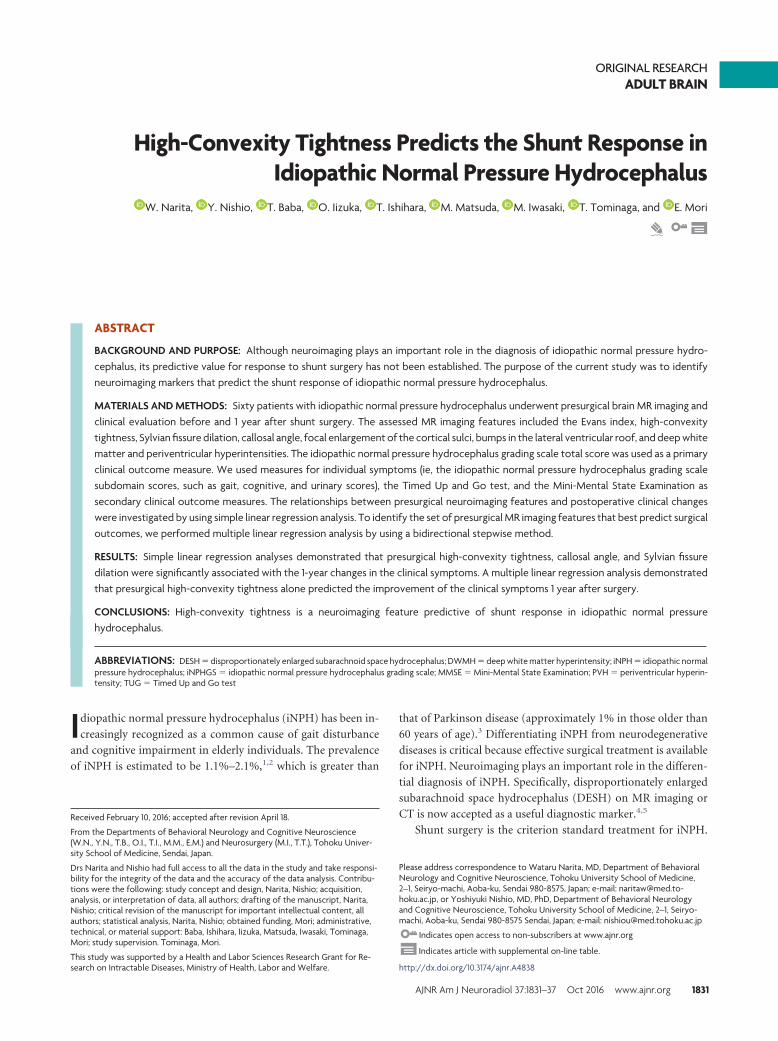
ORIGINAL RESEARCHADULT BRAIN
High-Convexity Tightness Predicts the Shunt Response inIdiopathic Normal Pressure Hydrocephalus
X W. Narita, X Y. Nishio, X T. Baba, X O. Iizuka, X T. Ishihara, X M. Matsuda, X M. Iwasaki, X T. Tominaga, and X E. Mori
ABSTRACT
BACKGROUND AND PURPOSE: Although neuroimaging plays an important role in the diagnosis of idiopathic normal pressure hydro-cephalus, its predictive value for response to shunt surgery has not been established. The purpose of the current study was to identifyneuroimaging markers that predict the shunt response of idiopathic normal pressure hydrocephalus.
MATERIALS AND METHODS: Sixty patients with idiopathic normal pressure hydrocephalus underwent presurgical brain MR imaging andclinical evaluation before and 1 year after shunt surgery. The assessed MR imaging features included the Evans index, high-convexitytightness, Sylvian fissure dilation, callosal angle, focal enlargement of the cortical sulci, bumps in the lateral ventricular roof, and deep whitematter and periventricular hyperintensities. The idiopathic normal pressure hydrocephalus grading scale total score was used as a primaryclinical outcome measure. We used measures for individual symptoms (ie, the idiopathic normal pressure hydrocephalus grading scalesubdomain scores, such as gait, cognitive, and urinary scores), the Timed Up and Go test, and the Mini-Mental State Examination assecondary clinical outcome measures. The relationships between presurgical neuroimaging features and postoperative clinical changeswere investigated by using simple linear regression analysis. To identify the set of presurgical MR imaging features that best predict surgicaloutcomes, we performed multiple linear regression analysis by using a bidirectional stepwise method.
RESULTS: Simple linear regression analyses demonstrated that presurgical high-convexity tightness, callosal angle, and Sylvian fissuredilation were significantly associated with the 1-year changes in the clinical symptoms. A multiple linear regression analysis demonstratedthat presurgical high-convexity tightness alone predicted the improvement of the clinical symptoms 1 year after surgery.
CONCLUSIONS: High-convexity tightness is a neuroimaging feature predictive of shunt response in idiopathic normal pressurehydrocephalus.
ABBREVIATIONS: DESH � disproportionately enlarged subarachnoid space hydrocephalus; DWMH � deep white matter hyperintensity; iNPH � idiopathic normalpressure hydrocephalus; iNPHGS � idiopathic normal pressure hydrocephalus grading scale; MMSE � Mini-Mental State Examination; PVH � periventricular hyperin-tensity; TUG � Timed Up and Go test
Idiopathic normal pressure hydrocephalus (iNPH) has been in-
creasingly recognized as a common cause of gait disturbance
and cognitive impairment in elderly individuals. The prevalence
of iNPH is estimated to be 1.1%–2.1%,1,2 which is greater than
that of Parkinson disease (approximately 1% in those older than
60 years of age).3 Differentiating iNPH from neurodegenerative
diseases is critical because effective surgical treatment is available
for iNPH. Neuroimaging plays an important role in the differen-
tial diagnosis of iNPH. Specifically, disproportionately enlarged
subarachnoid space hydrocephalus (DESH) on MR imaging or
CT is now accepted as a useful diagnostic marker.4,5
Shunt surgery is the criterion standard treatment for iNPH.Received February 10, 2016; accepted after revision April 18.
From the Departments of Behavioral Neurology and Cognitive Neuroscience(W.N., Y.N., T.B., O.I., T.I., M.M., E.M.) and Neurosurgery (M.I., T.T.), Tohoku Univer-sity School of Medicine, Sendai, Japan.
Drs Narita and Nishio had full access to all the data in the study and take responsi-bility for the integrity of the data and the accuracy of the data analysis. Contribu-tions were the following: study concept and design, Narita, Nishio; acquisition,analysis, or interpretation of data, all authors; drafting of the manuscript, Narita,Nishio; critical revision of the manuscript for important intellectual content, allauthors; statistical analysis, Narita, Nishio; obtained funding, Mori; administrative,technical, or material support: Baba, Ishihara, Iizuka, Matsuda, Iwasaki, Tominaga,Mori; study supervision. Tominaga, Mori.
This study was supported by a Health and Labor Sciences Research Grant for Re-search on Intractable Diseases, Ministry of Health, Labor and Welfare.
Please address correspondence to Wataru Narita, MD, Department of BehavioralNeurology and Cognitive Neuroscience, Tohoku University School of Medicine,2–1, Seiryo-machi, Aoba-ku, Sendai 980-8575, Japan; e-mail: [email protected], or Yoshiyuki Nishio, MD, PhD, Department of Behavioral Neurologyand Cognitive Neuroscience, Tohoku University School of Medicine, 2–1, Seiryo-machi, Aoba-ku, Sendai 980-8575 Sendai, Japan; e-mail: [email protected]
Indicates open access to non-subscribers at www.ajnr.org
Indicates article with supplemental on-line table.
http://dx.doi.org/10.3174/ajnr.A4838
AJNR Am J Neuroradiol 37:1831–37 Oct 2016 www.ajnr.org 1831
Although symptomatic improvement following shunt surgery is
observed in up to 70% of patients, the effectiveness varies from
patient to patient.6,7 Although predictive markers for surgical
outcomes are necessary for decision-making regarding the surgi-
cal indications, this need is currently unmet. For example, the
sensitivity and specificity of the CSF tap tests, which have been
widely used to predict shunt response in clinical practice,1,8 re-
main at 42%–93% and 20%–100%, respectively.9-12 A previous
study demonstrated that elevated overnight intracranial pressure
pulse amplitude and CSF pulse amplitude during lumbar infusion
predicted better shunt response.13 However, these procedures are
invasive and not widely available. To explore an easily available
marker predictive of shunt response, the current study investi-
gated presurgical neuroimaging features associated with better
surgical outcome in iNPH.
MATERIALS AND METHODSThis study was conducted in accordance with the Declaration of
Helsinki, and the protocol was approved by the ethics committee
of the Tohoku University Hospital. Written informed consent
was obtained from all participants.
Diagnosis of iNPHAlthough several diagnostic criteria for iNPH have been pro-
posed, there is still lack of consensus on how to diagnose iNPH
preoperatively.8,14 It is indispensable to determine the presence or
absence of comorbid neurologic diseases, such as Alzheimer dis-
ease, Parkinson disease, and cerebrovascular diseases and their
contributions to clinical symptoms, to select appropriate candi-
dates for shunt surgery. The presence of DESH alone is not infor-
mative enough to know whether hydrocephalus is the primary
pathology associated with clinical symptoms because �60% of
those who have DESH on MR imaging do not have any of the triad
of symptoms.15 Thus, we made the diagnosis of iNPH on the basis
of comprehensive symptomatic and neuroimaging investigations.
Our diagnostic procedures were as follows:
1) All patients who were referred to the Department of Behav-
ioral Neurology and Cognitive Neuroscience of Tohoku Univer-
sity Hospital due to progressive cognitive impairment and/or gait
disturbance underwent neurologic and neuropsychological ex-
aminations, routine laboratory testing, brain MR imaging, and/or
CT. When patients exhibited �1 of the triad of symptoms and
neuroimaging features of DESH, they were diagnosed as having
probable iNPH1,14 and were invited for inpatient evaluation.
2) The patients who were admitted to the Department of Be-
havioral Neurology and Cognitive Neuroscience were given com-
prehensive neurologic and neuropsychological assessments by
behavioral neurologists and speech-language pathologists, and
they underwent 3D volumetric MR imaging or CT, single-photon
emission CT, and a CSF tap test.
3) If patients exhibited clinical and/or neuroimaging features
pathognomonic of neurologic disease other than iNPH (eg, severe
and dissociated amnesia suggestive of Alzheimer disease and se-
vere sympathetic denervation on iodine 123 metaiodobenzylgua-
nidine myocardial scintigraphy indicative of Parkinson disease or
dementia with Lewy bodies), they were excluded as candidates for
surgical intervention.
4) Given the insufficient sensitivity of the CSF tap test, we
recommended shunt surgery to patients with clinical and neu-
roimaging features suggestive of iNPH without comorbid neu-
rologic diseases regardless of the response to the tap test.
5) Patients with previous histories of subarachnoid hemor-
rhage, meningitis, or head injury and those with neuroimaging
evidence of aqueductal stenosis or a Blake pouch cyst were diag-
nosed as having secondary normal pressure hydrocephalus and
were not included in the study.
Selection of Surgical MethodsIn the earlier part of this study, ventriculoperitoneal shunt was
preferentially performed in our institution. In the last half of
the study, we performed lumboperitoneal shunt unless contra-
indications were present or patients requested ventriculo-
peritoneal shunt. The contraindications for lumboperitoneal
shunt included severe spinal canal stenosis or lumbar spine
deformity, which was diagnosed on the basis of neurologic
examination, spinal MR imaging, and observations on lumbar
puncture.
SubjectsWe identified 103 consecutive patients with iNPH who were ad-
mitted to the Department of Behavioral Neurology and Cognitive
Neuroscience and underwent shunt surgery between December
19, 2005, and May 13, 2013. Of these 103 consecutive patients, we
retrospectively selected 60 patients who underwent presurgical
MR imaging evaluation and completed 1-year postsurgical fol-
low-up. The demographic and clinical profiles of the patients are
summarized in Table 1. Forty-three patients were excluded from
the study for the following reasons: Two patients died, 4 devel-
oped shunt system problems, 2 developed pneumonia, 1 devel-
oped a femoral fracture, 1 developed a cerebral infarction, 16
moved to hospitals that were nearer to their homes, 13 did not
return for follow-up visits for other reasons, and 4 were excluded
Table 1: Presurgical clinical characteristics of patients (n � 60)a
CharacteristicsAge (yr) 76.4 (3.8)Sex, male 34 (57%)Education (yr) 10.2 (3.0)Duration of symptoms (yr) 3.3 (1.6)LP shunt 23 (38%)Medical history
Hypertension 36 (60%)Diabetes 18 (30%)Lipid disorder 18 (30%)Current smoker 6 (10%)
Prevalence of symptomsb
Triad (all 3 symptoms) 27 (45%)Gait and cognitive 21 (35%)Gait and urinary 3 (5%)Cognitive and urinary 1 (2%)Gait only 5 (8%)Cognitive only 2 (3%)Urinary only 0
Note:—LP indicates lumboperitoneal.a Age, education, and the duration of symptoms are indicated as the means (SDs). Theother variables are indicated as the number of patients (%).b Each symptom was regarded as positive when the corresponding score of the iNPHgrading scale was �2.
1832 Narita Oct 2016 www.ajnr.org
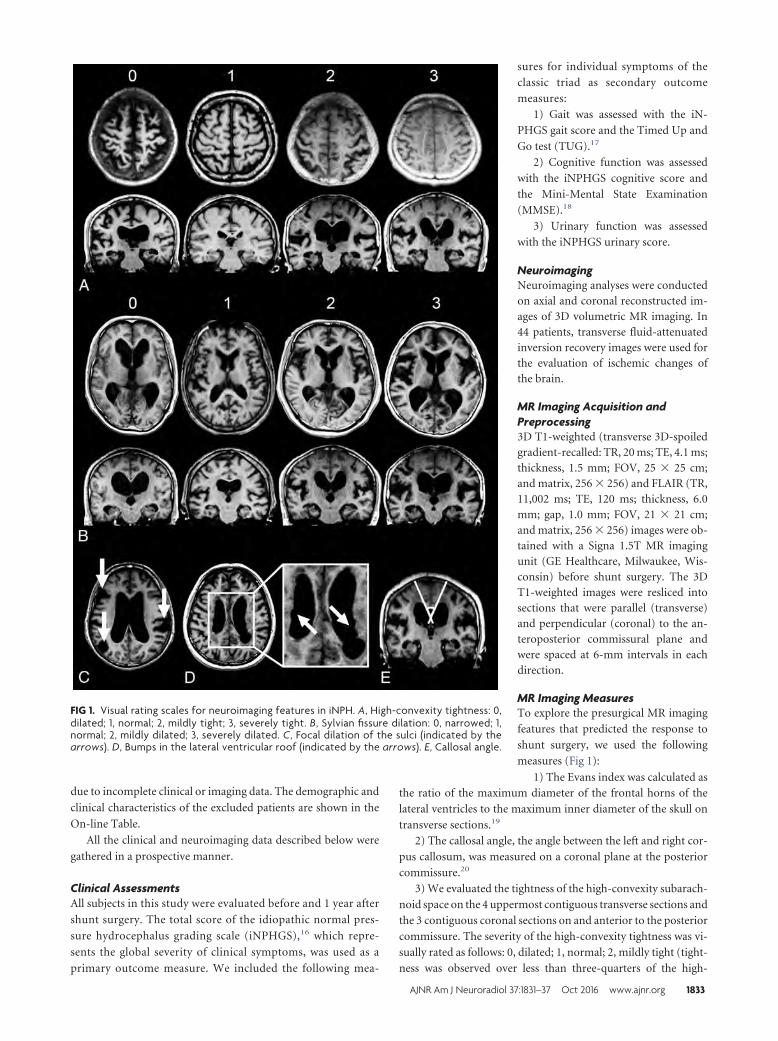
due to incomplete clinical or imaging data. The demographic and
clinical characteristics of the excluded patients are shown in the
On-line Table.
All the clinical and neuroimaging data described below were
gathered in a prospective manner.
Clinical AssessmentsAll subjects in this study were evaluated before and 1 year after
shunt surgery. The total score of the idiopathic normal pres-
sure hydrocephalus grading scale (iNPHGS),16 which repre-
sents the global severity of clinical symptoms, was used as a
primary outcome measure. We included the following mea-
sures for individual symptoms of the
classic triad as secondary outcome
measures:
1) Gait was assessed with the iN-
PHGS gait score and the Timed Up and
Go test (TUG).17
2) Cognitive function was assessed
with the iNPHGS cognitive score and
the Mini-Mental State Examination
(MMSE).18
3) Urinary function was assessed
with the iNPHGS urinary score.
NeuroimagingNeuroimaging analyses were conductedon axial and coronal reconstructed im-ages of 3D volumetric MR imaging. In44 patients, transverse fluid-attenuatedinversion recovery images were used forthe evaluation of ischemic changes ofthe brain.
MR Imaging Acquisition andPreprocessing3D T1-weighted (transverse 3D-spoiledgradient-recalled: TR, 20 ms; TE, 4.1 ms;thickness, 1.5 mm; FOV, 25 � 25 cm;and matrix, 256 � 256) and FLAIR (TR,11,002 ms; TE, 120 ms; thickness, 6.0mm; gap, 1.0 mm; FOV, 21 � 21 cm;and matrix, 256 � 256) images were ob-tained with a Signa 1.5T MR imagingunit (GE Healthcare, Milwaukee, Wis-consin) before shunt surgery. The 3DT1-weighted images were resliced intosections that were parallel (transverse)and perpendicular (coronal) to the an-teroposterior commissural plane andwere spaced at 6-mm intervals in eachdirection.
MR Imaging MeasuresTo explore the presurgical MR imaging
features that predicted the response to
shunt surgery, we used the following
measures (Fig 1):
1) The Evans index was calculated asthe ratio of the maximum diameter of the frontal horns of the
lateral ventricles to the maximum inner diameter of the skull on
transverse sections.19
2) The callosal angle, the angle between the left and right cor-
pus callosum, was measured on a coronal plane at the posterior
commissure.20
3) We evaluated the tightness of the high-convexity subarach-
noid space on the 4 uppermost contiguous transverse sections and
the 3 contiguous coronal sections on and anterior to the posterior
commissure. The severity of the high-convexity tightness was vi-
sually rated as follows: 0, dilated; 1, normal; 2, mildly tight (tight-
ness was observed over less than three-quarters of the high-
FIG 1. Visual rating scales for neuroimaging features in iNPH. A, High-convexity tightness: 0,dilated; 1, normal; 2, mildly tight; 3, severely tight. B, Sylvian fissure dilation: 0, narrowed; 1,normal; 2, mildly dilated; 3, severely dilated. C, Focal dilation of the sulci (indicated by thearrows). D, Bumps in the lateral ventricular roof (indicated by the arrows). E, Callosal angle.
AJNR Am J Neuroradiol 37:1831–37 Oct 2016 www.ajnr.org 1833
convexity space); and 3, severely tight (tightness was observedover three-quarters or more of the high-convexity space).
4) The width of the Sylvian fissure was assessed on transversesections. We used the following visual rating scale: 0, narrowed; 1,normal; 2, mildly dilated; and 3, severely dilated on the axialimages.
5) The presence (rated as 1) and absence (rated as 0) of focalenlargement of the cortical sulci were visually evaluated on transversesections.
6) Bumps in the lateral ventricular roof, which are often observedin patients with iNPH,21 were visually assessed on transverse sectionsabove the top of the thalamus and rated as present (1) or absent (0).
7) Deep white matter hyperintensities (DWMHs) and periven-tricular hyperintensities (PVHs) were assessed according to Fazekaset al.22
Visual ratings 3–7 were independently evaluated by 2 raters(W.N. and Y.N.) who were blinded to the clinical profiles and surgi-cal outcomes of the patients. The interrater reliability was calculatedby using linearly weighted � coefficients. The mean scores of the 2raters were used for the subsequent analyses.
Statistical AnalysisThe Wilcoxon signed rank test was used to analyze 1-year changes
in clinical scores. Simple linear regression analysis was performed
to investigate relationships between presurgical neuroimaging
features and 1-year changes in the clinical scores (ie, iNPHGS,
TUG, and MMSE). Given the exploratory nature of the analysis,
no multiple comparison corrections were used.
To identify the set of presurgical MR imaging features that best
predicts surgical outcomes, we performed multiple linear regres-
sion analysis by using a bidirectional (forward/backward) step-
wise method. The outcome variables were 1-year changes of
iNPHGS total score (primary outcome measure) and subdomain
(gait, cognition, and urinary function) scores (secondary out-
come measures). The explanatory variables were the Evans index,
high-convexity tightness, Sylvian fissure dilation, and callosal an-
gle on MR imaging. Sex and age were included as nuisance vari-
ables. The cutoff P value for inclusion was set at �.05 and for
exclusion, �.10. Statistical analysis was performed by using SPSS
version 22.0 (IBM, Armonk, New York).
RESULTSChanges in Clinical Symptoms 1 Year after Shunt SurgeryThe results of the clinical assessments before and 1 year after shunt
surgery are shown in Table 2. Overall, all clinical measures were
significantly improved (Wilcoxon signed rank test, P � .05). Sev-
enty-five percent of the patients were improved on the iNPHGS
total score; 53%, on the gait score; 33%, on the cognitive score;
and 48%, on the urinary score. Improvement of �3 points on the
MMSE was noted in 32% of patients.
Presurgical Neuroimaging CharacteristicsThe presurgical MR imaging findings are summarized in Table 3.
The linearly weighted � coefficients for the visual rating scale were
0.27– 0.71. All of the ratings, with the exception of the focal en-
largement of the cortical sulci, exhibited moderate-to-substantial
agreement.
High-convexity tightness (rated as �2) and Sylvian fissure di-
lation (rated as �2) were observed in 92% and 100% of patients,
respectively. Focal enlargement of the cortical sulci and bumps in
the lateral ventricular roof were present in 32% and 60% of the
patients, respectively. Severe DWMHs and PVHs (rated as 3) were
noted in 36% and 39% of the patients, respectively. The Evans
indices were �0.3 in 82% of the patients. The callosal angles were
�90° in 63% of patients.
Presurgical Neuroimaging Findings that Predict theShunt ResponseThe results of the simple and multiple linear regression analyses
are shown in Tables 4 and 5. Simple linear regression analysis
demonstrated that presurgical high-convexity tightness was sig-
nificantly associated with the 1-year changes in the iNPHGS total
score (regression coefficient [B] � 1.23, coefficient of determina-
tion [R2] � 0.13, P � .004), the 1-year changes in the iNPHGS gait
score (B � 0.59, R2 � 0.16, P � .002), and the 1-year changes in
the MMSE (B � 2.56, R2 � 0.17, P � .001). There were significant
associations between the presurgical callosal angle and the 1-year
Table 2: Changes in the clinical symptoms at 1 yeara
Presurgical Score Postsurgical Score Difference Postsurgical Changes (No.) (%)
No. Median (IQR) No. Median (IQR) Median (IQR) P Valueb Improved Stable DeterioratediNPHGS total [12] 60 6.0 (5.0–8.0) 60 5.0 (3.0–6.0) 1.0 (0.5–3.0) �.001 45 (75) 10 (17) 5 (8)iNPHGS gait [4] 60 2.0 (2.0–3.0) 60 2.0 (1.0–3.0) 1.0 (0.5–1.0) �.001 32 (53) 24 (40) 4 (7)iNPHGS cognitive [4] 60 2.0 (2.0–3.0) 60 2.0 (1.3–3.0) 0 (0–1.0) .001 20 (33) 36 (60) 4 (7)iNPHGS urinary [4] 60 2.5 (1.0–3.0) 60 1.0 (0–1.0) 0 (0–1.0) �.001 29 (48) 24 (40) 7 (12)TUG 55 15.1 (11.0–20.6) 53 11.5 (9.2–14.5) 2.5 (0.8–4.2) �.001 35 (66) 13 (25) 5 (9)MMSE [30] 60 22.0 (20.0–24.8) 59 23.0 (21.0–27.0) 1 (�1–3.0) .014 19 (32) 32 (54) 8 (14)
Note:—IQR indicates interquartile range.a Clinical improvement and deterioration were defined as �1-point improvement or deterioration on the iNPHGS, �10% reduction or increase in TUG time, and �3 pointsgained or lost on the MMSE. The numbers in square brackets refer to the maximum scores for the tests.b Wilcoxon signed rank test for pre- and postsurgery comparisons.
Table 3: Presurgical neuroimaging featuresScorea
(Median [IQR])Reliability
(�w)High-convexity tightness 2.5 (2.0–3.0) 0.68Sylvian fissure dilation 3.0 (2.5–3.0) 0.50Focal enlargement of
cortical sulci0.5 (0–1.0) 0.27
Bumps in the lateralventricular roof
1.0 (0.1–1.0) 0.66
DWMHsb 2.0 (2.0–3.0) 0.71PVHsb 2.5 (2.0–3.0) 0.64Evans index 0.32 (0.31–0.36 –Callosal angle 79.7 (65.5–100.1) –
Note:—IQR indicates interquartile range; �w, linear weighted � coefficient.a The visual rating scores indicate the mean scores of the 2 raters.b The DWMHs and PVHs were obtained from 44 patients.
1834 Narita Oct 2016 www.ajnr.org
changes in the MMSE (B � �0.04, R2 � 0.08, P � .035) and
between presurgical Sylvian fissure dilation and the 1-year
changes in the iNPHGS gait (B � 0.59, R2 � 0.08, P � .029).
A multiple linear regression analysis demonstrated that pre-
surgical high-convexity tightness alone predicted the 1-year
changes in the iNPHGS total score (B � 0.99, R2 � 0.24, P � .017)
and the gait score (B � 0.52, R2 � 0.21, P � .006).
DISCUSSIONThe primary focus of neuroimaging studies of hydrocephalus
has been the differentiation of hydrocephalus from other neu-
rologic diseases. Although ventriculomegaly is a primary mor-
phologic feature of hydrocephalus, it is also observed in brain
atrophy. Earlier studies claimed that the absence of Sylvian
fissure dilation is a neuroimaging feature that differentiates
hydrocephalus from brain atrophy.23,24 However, later studies
suggested that Sylvian fissure dilation is present in most pa-
tients with iNPH. Thus, high-convexity tightness was subse-
quently proposed as an alternative feature for differentiating
iNPH from brain atrophy.25 The combination of high-convex-
ity tightness, Sylvian fissure dilation, and ventriculomegaly has
been termed “disproportionately enlarged subarachnoid space
hydrocephalus,” and it has been increasingly recognized as a
neuroimaging hallmark of iNPH.26 The value of DESH in dif-
ferentiating iNPH from other neurologic diseases has been
confirmed by several studies.27-30
Several diagnostic criteria for iNPH have recently been pro-
posed.1,8 One recent study reported that the effectiveness of shunt
surgery for patients who were diagnosed according to one of these
guidelines remained at 62.7% in terms of the mRS.31 The incor-
poration of neuroimaging features that are predictive of surgical
outcomes into the diagnostic criteria would thus improve the ef-
ficacy of shunt surgery. However, this issue has been systemati-
cally investigated in only a few studies. The current study demon-
strates that high-convexity tightness, which is a component of
DESH, is the most predictive neuroimaging feature. Additionally,
Sylvian fissure dilation and a small callosal angle were associated
with better shunt responses.
The shunt response in patients with iNPH is governed by 2
factors: namely, reversibility and comorbidity. Previous studies
have demonstrated that symptomatic improvements following
shunt surgery are associated with less severe symptoms and
shorter disease duration, which suggest that reversibility declines
as the disease progresses. The relationship between shunt re-
sponse and brain tissue resilience is also supported by a previous
neuroimaging study in which volume decreases of the lateral ven-
tricle were found to be significantly correlated with symptomatic
improvement.32 In agreement with these findings, recent studies
have suggested that delayed shunt surgery is associated with
poorer symptomatic improvement.31,33,34
In addition to reversibility, other neurologic comorbid dis-
eases have a significant influence on shunt response. A recent
positron-emission tomography study demonstrated that patients
with significant cortical amyloid deposits exhibit less cognitive
improvement following shunt surgery.35 High-convexity tight-
ness or DESH is probably more strongly related to comorbidity
than to reversibility. Elderly individuals who exhibit DESH on
MR imaging can be asymptomatic for 5 or more years,36 which
suggests that DESH is not well-correlated with pathophysiologic
severity and reversibility. On the other hand, DESH or high-con-
vexity tightness may be associated with the purity of iNPH pathol-
ogy. Patients who exhibited weak typicality of DESH or mild high-
convexity tightness may have comorbid pathologies with higher
probabilities compared with those with typical DESH or severe
high-convexity tightness. The results of our study may reflect this
“typicality” effect.
Virhammar et al21 recently investigated the neuroimaging fea-
tures predictive of shunt responses in 108 patients with iNPH.
These authors demonstrated that DESH and a small callosal angle,
not high-convexity tightness or Sylvian fissure dilation, were as-
sociated with better shunt responses. Although the study of Vir-
hammar et al and our own agree about the importance of DESH,
the studies also differ in some ways. Several factors may be asso-
ciated with these discrepancies. First, the studies differed in their
neuroimaging inclusion criteria. Virhammar et al used only
ventriculomegaly for study inclusion, whereas the current study
used high-convexity tightness, Sylvian fissure dilation, and
ventriculomegaly. Because the pathophysiology of iNPH is pre-
sumably heterogeneous, these differ-
ences in the inclusion criteria may have
led to a substantial bias. Second, the dif-
ferences in the statistical procedures
used in these studies should be noted.
Univariate logistic regression with a di-
chotomous outcome measure (ie, the
presence or absence of shunt response)
was used in the study by Virhammar et
al, whereas our study used multiple lin-
ear regression with ordinary outcome
measures. Whether patients whose
symptoms remain unchanged before
Table 4: Results of simple linear regression analysis for presurgical neuroimaging featuresassociated with surgical outcome: 1-year changes
Neuroimaging Findings
iNPHGS
TUG MMSETotal Gait Cognitive UrinaryEvans Index 7.34 1.00 0.97 5.37 60.96 9.22Callosal angle �0.02 �0.01 �0.01 �0.01 �0.12 �0.04a
High-convexity tightness 1.23b 0.59b 0.22 0.42 �3.17 2.56b
Sylvian fissure dilation 1.03 0.59a �0.09 0.53 �2.65 1.00Focal enlargement of cortical sulci 0.71 0.19 0.00 0.53 �2.25 1.19Bumps in the lateral ventricle 0.47 0.31 0.11 0.05 2.20 1.20DWMHs �0.20 �0.07 0.01 �0.14 0.53 0.10PVHs �0.33 �0.05 �0.10 �0.19 3.19 �0.25
a P � .05.b P � .01.
Table 5: Results of stepwise multiple linear regression analysis1-Year Changes Neuroimaging Findings B SE B 95% CI B � R2 P ValueiNPHGS total High-convexity tightness 0.99 0.40 0.18–1.80 0.29 0.24 .017iNPHGS gait High-convexity tightness 0.52 0.18 0.16–0.88 0.35 0.21 .006
Note:—B indicates regression coefficient; �, standardized regression coefficient; R2, coefficient of determination; SE B, standard error of the regression coefficient.
AJNR Am J Neuroradiol 37:1831–37 Oct 2016 www.ajnr.org 1835
and after surgery are assigned to the “responsive” or “unrespon-
sive” group may have a significant impact on results. We argue
that the lack of symptomatic deterioration for �1-year observa-
tion probably should be interpreted as “responsive” because pre-
vious studies have demonstrated that conditions of patients with
iNPH who did not receive surgical intervention deteriorated
within a year.37,38
The current study has several limitations. First, patients with
large cerebrovascular lesions and those strongly suspected of hav-
ing neurodegenerative diseases were excluded from this study.
Thus, the applicability of our findings to patients with other co-
morbid neurologic diseases is unknown. Second, the visual rating
scale for the morphologic features of iNPH used in the current
study has not been validated. Although we chose a visual inspec-
tion method because of its clinical utility, our rating system may
be suboptimal. The validity of our findings should be examined in
comparison with those based on other neuroimaging methods,
such as MR imaging volumetry. Finally, this study was conducted
in a single center and used a single MR imaging scanner. Future
multicenter studies are needed to further verify the neuroimaging
features that predict surgical outcome in iNPH.
CONCLUSIONSWe investigated the predictive values of neuroimaging features
frequently observed in iNPH, including the Evans index, high-
convexity tightness, Sylvian fissure dilation, callosal angle, focal
enlargement of the cortical sulci, bumps in the lateral ventricular
roof, and deep white matter and periventricular hyperintensities,
for response to shunt surgery. Among them, high-convexity tight-
ness was the best predictor of shunt response in iNPH.
Disclosures: Yoshiyuki Nishio—UNRELATED: Grants/Grants Pending: Ministry ofEducation, Culture, Sports, Science and Technology Japan,* Comments: researchgrant for a study on cognitive problems in patients with epilepsy; Payment forDevelopment of Educational Presentations: Eisai, Comments: educational lectureson dementia with Lewy bodies and other dementias. Toru Baba—UNRELATED: Pay-ment for Lectures (including service on Speakers Bureaus): Boehringer Ingelheim,Novartis Pharmaceuticals, Eisai, Daiichi Sankyo, Kyowa Hakko Kirin, Dainippon Sumi-tomo Pharma. Etsuro Mori—RELATED: Grant: Ministry of Health, Labour and Wel-fare, Japan, Comments: Health and Labor Sciences Research Grants for Research onIntractable Diseases; UNRELATED: Payment for Lectures (including service onSpeakers Bureaus): Johnson & Johnson, Medtronic, Toshiba, Nihon Medi-Physics,Comments: Honoraria. *Money paid to the institution.
REFERENCES1. Mori E, Ishikawa M, Kato T, et al. Guidelines for management of
idiopathic normal pressure hydrocephalus: second edition. NeurolMed Chir (Tokyo) 2012;52:775– 809 CrossRef Medline
2. Jaraj D, Rabiei K, Marlow T, et al. Prevalence of idiopathic normal-pressure hydrocephalus. Neurology 2014;82:1449 –54 CrossRefMedline
3. de Lau LM, Breteler MM. Epidemiology of Parkinson’s disease. Lan-cet Neurol 2006;5:525–35 CrossRef Medline
4. Malm J, Graff-Radford NR, Ishikawa M, et al. Influence of comor-bidities in idiopathic normal pressure hydrocephalus: research andclinical care—a report of the ISHCSF task force on comorbidities inINPH. Fluids Barriers CNS 2013;10:22 CrossRef Medline
5. Williams MA, Relkin NR. Diagnosis and management of idiopathicnormal-pressure hydrocephalus. Neurol Clin Pract 2013;3:375– 85CrossRef Medline
6. Hebb AO, Cusimano MD. Idiopathic normal pressure hydro-cephalus: a systematic review of diagnosis and outcome. Neurosur-gery 2001;49:1166 – 84; discussion 1184 – 86 CrossRef Medline
7. Klinge P, Hellstrom P, Tans J, et al; European iNPH MulticentreStudy Group. One-year outcome in the European multicentre studyon iNPH. Acta Neurol Scand 2012;126:145–53 CrossRef Medline
8. Relkin N, Marmarou A, Klinge P, et al. Diagnosing idiopathic nor-mal-pressure hydrocephalus. Neurosurgery 2005;57:S4 –16; discus-sion ii–v Medline
9. Kahlon B, Sundbarg G, Rehncrona S. Comparison between the lum-bar infusion and CSF tap tests to predict outcome after shunt sur-gery in suspected normal pressure hydrocephalus. J Neurol Neuro-surg Psychiatry 2002;73:721–26 CrossRef Medline
10. Sand T, Bovim G, Grimse R, et al. Idiopathic normal pressurehydrocephalus: the CSF tap-test may predict the clinical responseto shunting. Acta Neurol Scand 1994;89:311–16 Medline
11. Walchenbach R, Geiger E, Thomeer RT, et al. The value of temporaryexternal lumbar CSF drainage in predicting the outcome of shunt-ing on normal pressure hydrocephalus. J Neurol Neurosurg Psychia-try 2002;72:503– 06 Medline
12. Ishikawa M, Hashimoto M, Mori E, et al. The value of the cerebro-spinal fluid tap test for predicting shunt effectiveness in idiopathicnormal pressure hydrocephalus. Fluids Barriers CNS 2012;9:1CrossRef Medline
13. Eide PK, Brean A. Cerebrospinal fluid pulse pressure amplitudeduring lumbar infusion in idiopathic normal pressure hydroceph-alus can predict response to shunting. Cerebrospinal Fluid Res 2010;7:5 CrossRef Medline
14. Ishikawa M, Hashimoto M, Kuwana N, et al. Guidelines for manage-ment of idiopathic normal pressure hydrocephalus. Neurol MedChir (Tokyo) 2008;48(suppl):S1–23 CrossRef Medline
15. Iseki C, Kawanami T, Nagasawa H, et al. Asymptomatic ventriculo-megaly with features of idiopathic normal pressure hydrocephaluson MRI (AVIM) in the elderly: a prospective study in a Japanesepopulation. J Neurol Sci 2009;277:54 –57 CrossRef Medline
16. Kubo Y, Kazui H, Yoshida T, et al. Validation of grading scale forevaluating symptoms of idiopathic normal-pressure hydrocepha-lus. Dement Geriatr Cogn Disord 2008;25:37– 45 CrossRef Medline
17. Podsiadlo D, Richardson S. The timed “Up & Go”: a test of basicfunctional mobility for frail elderly persons. J Am Geriatr Soc 1991;39:142– 48 CrossRef Medline
18. Mori E, Mitani Y, Yamadori A. Usefulness of Japanese version of theMini-Mental State Examination in neurological patients [in Japa-nese]. Jpn J Neuropsychol 1985;1:82–90
19. Evans WA. An encephalographic ratio for estimating ventricularenlargement and cerebral atrophy. Arch NeurPsych 1942;47:931–37CrossRef
20. Ishii K, Kanda T, Harada A, et al. Clinical impact of the callosal anglein the diagnosis of idiopathic normal pressure hydrocephalus. EurRadiol 2008;18:2678 – 83 CrossRef Medline
21. Virhammar J, Laurell K, Cesarini KG, et al. Preoperative prognosticvalue of MRI findings in 108 patients with idiopathic normal pres-sure hydrocephalus. AJNR Am J Neuroradiol 2014;35:2311–18CrossRef Medline
22. Fazekas F, Chawluk JB, Alavi A, et al. MR signal abnormalities at 1.5T in Alzheimer’s dementia and normal aging. AJR Am J Roentgenol1987;149:351–56 CrossRef Medline
23. Gunasekera L, Richardson AE. Computerized axial tomographyin idiopathic hydrocephalus. Brain 1977;100:749 –54 CrossRefMedline
24. Benzel EC, Pelletier AL, Levy PG. Communicating hydrocephalus inadults: prediction of outcome after ventricular shunting proce-dures. Neurosurgery 1990;26:655– 60 CrossRef Medline
25. Kitagaki H, Mori E, Ishii K, et al. CSF spaces in idiopathic normalpressure hydrocephalus: morphology and volumetry. AJNR Am JNeuroradiol 1998;19:1277– 84 Medline
26. Hashimoto M, Ishikawa M, Mori E, et al; Study of INPH on neurologicalimprovement (SINPHONI). Diagnosis of idiopathic normal pressurehydrocephalus is supported by MRI-based scheme: a prospective co-hort study. Cerebrospinal Fluid Res 2010;7:18 CrossRef Medline
27. Yamashita F, Sasaki M, Takahashi S, et al. Detection of changes in
1836 Narita Oct 2016 www.ajnr.org
cerebrospinal fluid space in idiopathic normal pressure hydro-cephalus using voxel-based morphometry. Neuroradiology 2010;52:381– 86 CrossRef Medline
28. Yamashita F, Sasaki M, Saito M, et al. Voxel-based morphometry ofdisproportionate cerebrospinal fluid space distribution for the dif-ferential diagnosis of idiopathic normal pressure hydrocephalus.J Neuroimaging 2014;24:359 – 65 CrossRef Medline
29. Ishii K, Soma T, Shimada K, et al. Automatic volumetry of the cere-brospinal fluid space in idiopathic normal pressure hydrocephalus.Dement Geriatr Cogn Dis Extra 2013;3:489 –96 CrossRef Medline
30. Kojoukhova M, Koivisto AM, Korhonen R, et al. Feasibility of radio-logical markers in idiopathic normal pressure hydrocephalus. ActaNeurochir (Wien) 2015;157:1709 –18; discussion 1719 CrossRefMedline
31. Kazui H, Miyajima M, Mori E, et al; SINPHONI-2 Investigators.Lumboperitoneal shunt surgery for idiopathic normal pressurehydrocephalus (SINPHONI-2): an open-label randomised trial.Lancet Neurol 2015;14:585–94 CrossRef Medline
32. Hiraoka K, Yamasaki H, Takagi M, et al. Changes in the volumes ofthe brain and cerebrospinal fluid spaces after shunt surgery in id-iopathic normal-pressure hydrocephalus. J Neurol Sci 2010;296:7–12 CrossRef Medline
33. Caruso R, Cervoni L, Vitale AM, et al. Idiopathic normal-pressurehydrocephalus in adults: result of shunting correlated with clinicalfindings in 18 patients and review of the literature. Neurosurg Rev1997;20:104 – 07 CrossRef Medline
34. Andren K, Wikkelso C, Tisell M, et al. Natural course of idiopathicnormal pressure hydrocephalus. J Neurol Neurosurg Psychiatry 2014;85:806 –10 CrossRef Medline
35. Hiraoka K, Narita W, Kikuchi H, et al. Amyloid deposits and re-sponse to shunt surgery in idiopathic normal-pressure hydroceph-alus. J Neurol Sci 2015;356:124 –28 CrossRef Medline
36. Iseki C, Takahashi Y, Wada M, et al. Incidence of idiopathic normalpressure hydrocephalus (iNPH): a 10-year follow-up study of a ru-ral community in Japan. J Neurol Sci 2014;339:108 –12 CrossRefMedline
37. Razay G, Vreugdenhil A, Liddell J. A prospective study of ventriculo-peritoneal shunting for idiopathic normal pressure hydrocephalus.J Clin Neurosci 2009;16:1180 – 83 CrossRef Medline
38. Scollato A, Tenenbaum R, Bahl G, et al. Changes in aqueductal CSFstroke volume and progression of symptoms in patients with uns-hunted idiopathic normal pressure hydrocephalus. AJNR Am JNeuroradiol 2008;29:192–97 CrossRef Medline
AJNR Am J Neuroradiol 37:1831–37 Oct 2016 www.ajnr.org 1837
ORIGINAL RESEARCHADULT BRAIN
Dynamic Susceptibility Contrast-Enhanced MR PerfusionImaging in Assessing Recurrent Glioblastoma Response to
Superselective Intra-Arterial Bevacizumab TherapyX R. Singh, X K. Kesavabhotla, X S.A. Kishore, X Z. Zhou, X A.J. Tsiouris, X C.G. Filippi, X J.A. Boockvar, and X I. Kovanlikaya
ABSTRACT
BACKGROUND AND PURPOSE: Recurrent glioblastoma currently has no established standard of care. We evaluated the response ofrecurrent glioblastoma to superselective intra-arterial cerebral infusion of bevacizumab by using dynamic susceptibility contrast-en-hanced MR perfusion imaging. We hypothesized that treatment response would be associated with decreased relative CBV and relativeCBF.
MATERIALS AND METHODS: Patients were accrued for this study from larger ongoing serial Phase I/II trials. Twenty-five patients (14 men,11 women; median age, 55 years) were analyzed. Four distinct ROIs were chosen: 1) normal-appearing white matter on the contralateral side,2) the location of the highest T1 enhancement in the lesion (maximum enhancing), 3) the location of highest relative CBV in the lesion(maximum relative CBV), and 4) nonenhancing T2 hyperintense signal abnormality surrounding the tumor (nonenhancing T2hyperintensity).
RESULTS: There was a statistically significant median percentage change of �32.34% (P � .001) in relative CBV in areas of maximum relativeCBV following intra-arterial bevacizumab therapy. There was also a statistically significant median percentage decrease in relative CBF of�30.67 (P � .001) and �27.25 (P � .037) in areas of maximum relative CBV and maximum tumor enhancement, respectively. Last, a trendtoward statistical significance for increasing relative CBV in nonenhancing T2 hyperintense areas (median percent change, 30.04; P � .069)was noted.
CONCLUSIONS: Dynamic susceptibility contrast-enhanced MR perfusion imaging demonstrated a significant decrease in tumor perfu-sion metrics within recurrent glioblastomas in response to superselective intra-arterial cerebral infusion of bevacizumab; however, thesechanges did not correlate with time to progression or overall survival.
ABBREVIATIONS: BV � bevacizumab; DSC-MRP � dynamic susceptibility contrast-enhanced MR perfusion; GBM � glioblastoma; max � maximum; NAWM �normal-appearing white matter; OS � overall survival; RANO � Response Assessment in Neuro-Oncology; rCBF � relative cerebral blood flow; rCBV � relative cerebralblood volume; SIACI � superselective intra-arterial cerebral infusion; TTP � time to progression
Glioblastoma (GBM) is the most common and lethal primary
malignancy of the central nervous system. Despite a
3-pronged intervention consisting of surgical resection followed
by radiation with both concurrent and adjuvant temozolomide
chemotherapy, the 5-year overall survival rate of patients remains
approximately 10%.1
While there is no established standard of care for recurrent
GBM, bevacizumab (BV, Avastin) has emerged as a potential
treatment option for recurrent GBM. BV is a humanized mono-
clonal antibody that exerts antineoplastic effects by inhibiting the
angiogenic effects of vascular endothelial growth factor-A.2,3 Our
group has used superselective intra-arterial cerebral infusion
(SIACI) following blood-brain barrier disruption to improve BV
delivery.4 Recently published studies from our group have shown
promising results on the safety and efficacy of using SIACI deliv-
ery for BV.5,6
Although treatment with BV produces a dramatic decrease in
MR imaging contrast enhancement, the degree to which these
findings reflect actual antitumor effects remains unclear.7 BV re-
Received November 9, 2015; accepted after revision March 30, 2016.
From the Departments of Neurological Surgery (R.S., Z.Z.) and Radiology (S.A.K.,A.J.T., I.K.), Weill Cornell Medical College, New York, New York; Department ofNeurological Surgery (K.K.), Northwestern University Feinberg School of Medicine,Chicago, Illinois; and Departments of Radiology (C.G.F.) and Neurological Surgery(J.A.B.), Lenox Hill Hospital, Hofstra–North Shore-LIJ School of Medicine,New York, New York.
This work was partly supported by the Carolyn L. Kuckein Student Research Fel-lowship (R.S.), the Radiological Society of North America Research Medical Stu-dent Grant (K.K.), and National Cancer Institute grant No. CA130985 (J.A.B.).
Please address correspondence to Ilhami Kovanlikaya, MD, 515 71 E St Room S-119,New York, NY 10021; e-mail: [email protected]
Indicates open access to non-subscribers at www.ajnr.org
Indicates article with supplemental on-line tables.
http://dx.doi.org/10.3174/ajnr.A4823
1838 Singh Oct 2016 www.ajnr.org
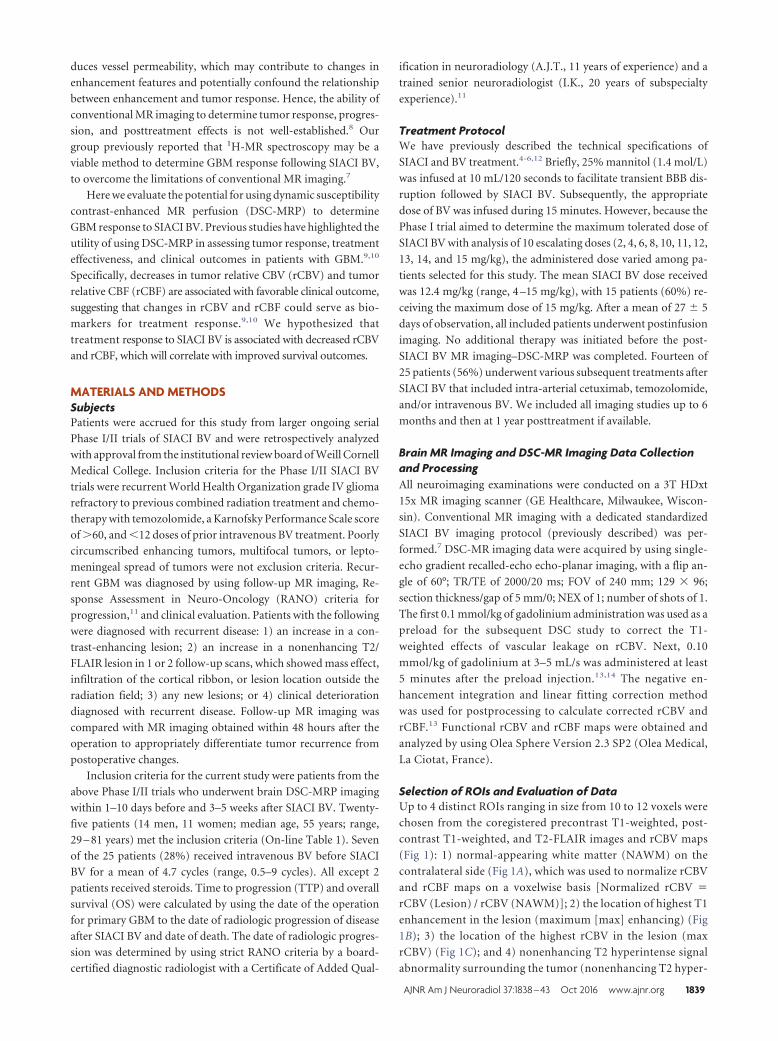
duces vessel permeability, which may contribute to changes in
enhancement features and potentially confound the relationship
between enhancement and tumor response. Hence, the ability of
conventional MR imaging to determine tumor response, progres-
sion, and posttreatment effects is not well-established.8 Our
group previously reported that 1H-MR spectroscopy may be a
viable method to determine GBM response following SIACI BV,
to overcome the limitations of conventional MR imaging.7
Here we evaluate the potential for using dynamic susceptibility
contrast-enhanced MR perfusion (DSC-MRP) to determine
GBM response to SIACI BV. Previous studies have highlighted the
utility of using DSC-MRP in assessing tumor response, treatment
effectiveness, and clinical outcomes in patients with GBM.9,10
Specifically, decreases in tumor relative CBV (rCBV) and tumor
relative CBF (rCBF) are associated with favorable clinical outcome,
suggesting that changes in rCBV and rCBF could serve as bio-
markers for treatment response.9,10 We hypothesized that
treatment response to SIACI BV is associated with decreased rCBV
and rCBF, which will correlate with improved survival outcomes.
MATERIALS AND METHODSSubjectsPatients were accrued for this study from larger ongoing serial
Phase I/II trials of SIACI BV and were retrospectively analyzed
with approval from the institutional review board of Weill Cornell
Medical College. Inclusion criteria for the Phase I/II SIACI BV
trials were recurrent World Health Organization grade IV glioma
refractory to previous combined radiation treatment and chemo-
therapy with temozolomide, a Karnofsky Performance Scale score
of �60, and �12 doses of prior intravenous BV treatment. Poorly
circumscribed enhancing tumors, multifocal tumors, or lepto-
meningeal spread of tumors were not exclusion criteria. Recur-
rent GBM was diagnosed by using follow-up MR imaging, Re-
sponse Assessment in Neuro-Oncology (RANO) criteria for
progression,11 and clinical evaluation. Patients with the following
were diagnosed with recurrent disease: 1) an increase in a con-
trast-enhancing lesion; 2) an increase in a nonenhancing T2/
FLAIR lesion in 1 or 2 follow-up scans, which showed mass effect,
infiltration of the cortical ribbon, or lesion location outside the
radiation field; 3) any new lesions; or 4) clinical deterioration
diagnosed with recurrent disease. Follow-up MR imaging was
compared with MR imaging obtained within 48 hours after the
operation to appropriately differentiate tumor recurrence from
postoperative changes.
Inclusion criteria for the current study were patients from the
above Phase I/II trials who underwent brain DSC-MRP imaging
within 1–10 days before and 3–5 weeks after SIACI BV. Twenty-
five patients (14 men, 11 women; median age, 55 years; range,
29 – 81 years) met the inclusion criteria (On-line Table 1). Seven
of the 25 patients (28%) received intravenous BV before SIACI
BV for a mean of 4.7 cycles (range, 0.5–9 cycles). All except 2
patients received steroids. Time to progression (TTP) and overall
survival (OS) were calculated by using the date of the operation
for primary GBM to the date of radiologic progression of disease
after SIACI BV and date of death. The date of radiologic progres-
sion was determined by using strict RANO criteria by a board-
certified diagnostic radiologist with a Certificate of Added Qual-
ification in neuroradiology (A.J.T., 11 years of experience) and a
trained senior neuroradiologist (I.K., 20 years of subspecialty
experience).11
Treatment ProtocolWe have previously described the technical specifications of
SIACI and BV treatment.4-6,12 Briefly, 25% mannitol (1.4 mol/L)
was infused at 10 mL/120 seconds to facilitate transient BBB dis-
ruption followed by SIACI BV. Subsequently, the appropriate
dose of BV was infused during 15 minutes. However, because the
Phase I trial aimed to determine the maximum tolerated dose of
SIACI BV with analysis of 10 escalating doses (2, 4, 6, 8, 10, 11, 12,
13, 14, and 15 mg/kg), the administered dose varied among pa-
tients selected for this study. The mean SIACI BV dose received
was 12.4 mg/kg (range, 4 –15 mg/kg), with 15 patients (60%) re-
ceiving the maximum dose of 15 mg/kg. After a mean of 27 � 5
days of observation, all included patients underwent postinfusion
imaging. No additional therapy was initiated before the post-
SIACI BV MR imaging–DSC-MRP was completed. Fourteen of
25 patients (56%) underwent various subsequent treatments after
SIACI BV that included intra-arterial cetuximab, temozolomide,
and/or intravenous BV. We included all imaging studies up to 6
months and then at 1 year posttreatment if available.
Brain MR Imaging and DSC-MR Imaging Data Collectionand ProcessingAll neuroimaging examinations were conducted on a 3T HDxt
15x MR imaging scanner (GE Healthcare, Milwaukee, Wiscon-
sin). Conventional MR imaging with a dedicated standardized
SIACI BV imaging protocol (previously described) was per-
formed.7 DSC-MR imaging data were acquired by using single-
echo gradient recalled-echo echo-planar imaging, with a flip an-
gle of 60°; TR/TE of 2000/20 ms; FOV of 240 mm; 129 � 96;
section thickness/gap of 5 mm/0; NEX of 1; number of shots of 1.
The first 0.1 mmol/kg of gadolinium administration was used as a
preload for the subsequent DSC study to correct the T1-
weighted effects of vascular leakage on rCBV. Next, 0.10
mmol/kg of gadolinium at 3–5 mL/s was administered at least
5 minutes after the preload injection.13,14 The negative en-
hancement integration and linear fitting correction method
was used for postprocessing to calculate corrected rCBV and
rCBF.13 Functional rCBV and rCBF maps were obtained and
analyzed by using Olea Sphere Version 2.3 SP2 (Olea Medical,
La Ciotat, France).
Selection of ROIs and Evaluation of DataUp to 4 distinct ROIs ranging in size from 10 to 12 voxels were
chosen from the coregistered precontrast T1-weighted, post-
contrast T1-weighted, and T2-FLAIR images and rCBV maps
(Fig 1): 1) normal-appearing white matter (NAWM) on the
contralateral side (Fig 1A), which was used to normalize rCBV
and rCBF maps on a voxelwise basis [Normalized rCBV �
rCBV (Lesion) / rCBV (NAWM)]; 2) the location of highest T1
enhancement in the lesion (maximum [max] enhancing) (Fig
1B); 3) the location of the highest rCBV in the lesion (max
rCBV) (Fig 1C); and 4) nonenhancing T2 hyperintense signal
abnormality surrounding the tumor (nonenhancing T2 hyper-
AJNR Am J Neuroradiol 37:1838 – 43 Oct 2016 www.ajnr.org 1839
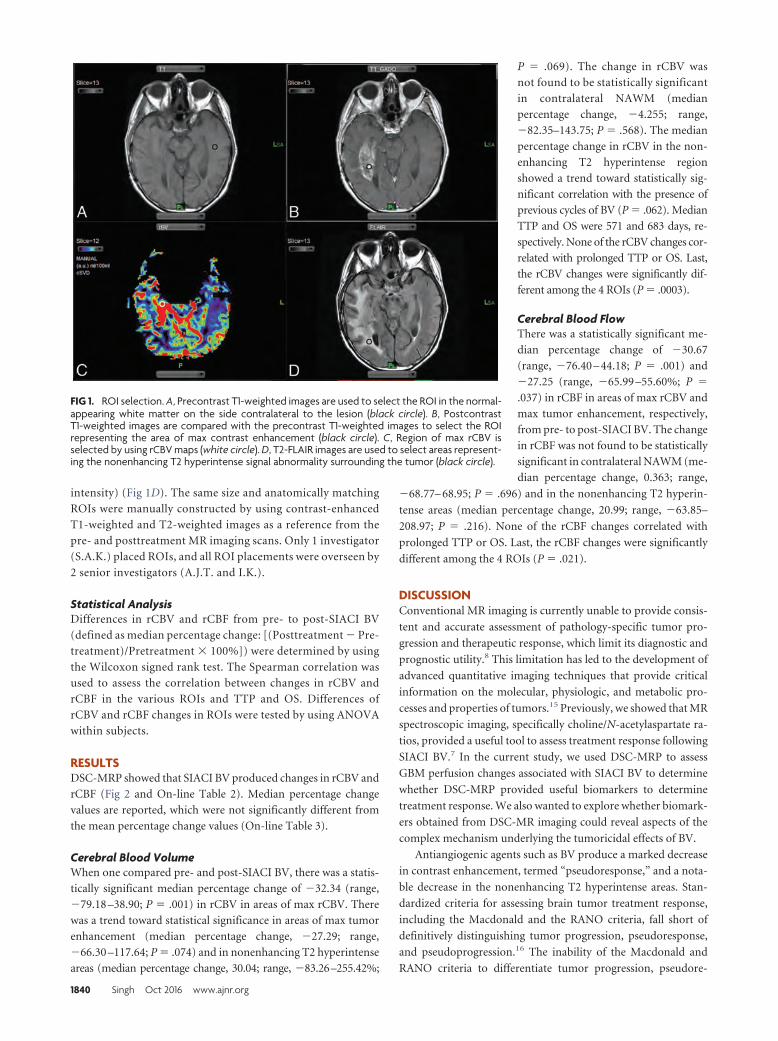
intensity) (Fig 1D). The same size and anatomically matching
ROIs were manually constructed by using contrast-enhanced
T1-weighted and T2-weighted images as a reference from the
pre- and posttreatment MR imaging scans. Only 1 investigator
(S.A.K.) placed ROIs, and all ROI placements were overseen by
2 senior investigators (A.J.T. and I.K.).
Statistical AnalysisDifferences in rCBV and rCBF from pre- to post-SIACI BV
(defined as median percentage change: [(Posttreatment � Pre-
treatment)/Pretreatment � 100%]) were determined by using
the Wilcoxon signed rank test. The Spearman correlation was
used to assess the correlation between changes in rCBV and
rCBF in the various ROIs and TTP and OS. Differences of
rCBV and rCBF changes in ROIs were tested by using ANOVA
within subjects.
RESULTSDSC-MRP showed that SIACI BV produced changes in rCBV and
rCBF (Fig 2 and On-line Table 2). Median percentage change
values are reported, which were not significantly different from
the mean percentage change values (On-line Table 3).
Cerebral Blood VolumeWhen one compared pre- and post-SIACI BV, there was a statis-
tically significant median percentage change of �32.34 (range,
�79.18 –38.90; P � .001) in rCBV in areas of max rCBV. There
was a trend toward statistical significance in areas of max tumor
enhancement (median percentage change, �27.29; range,
�66.30 –117.64; P � .074) and in nonenhancing T2 hyperintense
areas (median percentage change, 30.04; range, �83.26–255.42%;
P � .069). The change in rCBV was
not found to be statistically significant
in contralateral NAWM (median
percentage change, �4.255; range,
�82.35–143.75; P � .568). The median
percentage change in rCBV in the non-
enhancing T2 hyperintense region
showed a trend toward statistically sig-
nificant correlation with the presence of
previous cycles of BV (P � .062). Median
TTP and OS were 571 and 683 days, re-
spectively. None of the rCBV changes cor-
related with prolonged TTP or OS. Last,
the rCBV changes were significantly dif-
ferent among the 4 ROIs (P � .0003).
Cerebral Blood FlowThere was a statistically significant me-
dian percentage change of �30.67
(range, �76.40 – 44.18; P � .001) and
�27.25 (range, �65.99 –55.60%; P �
.037) in rCBF in areas of max rCBV and
max tumor enhancement, respectively,
from pre- to post-SIACI BV. The change
in rCBF was not found to be statistically
significant in contralateral NAWM (me-
dian percentage change, 0.363; range,
�68.77– 68.95; P � .696) and in the nonenhancing T2 hyperin-
tense areas (median percentage change, 20.99; range, �63.85–
208.97; P � .216). None of the rCBF changes correlated with
prolonged TTP or OS. Last, the rCBF changes were significantly
different among the 4 ROIs (P � .021).
DISCUSSIONConventional MR imaging is currently unable to provide consis-
tent and accurate assessment of pathology-specific tumor pro-
gression and therapeutic response, which limit its diagnostic and
prognostic utility.8 This limitation has led to the development of
advanced quantitative imaging techniques that provide critical
information on the molecular, physiologic, and metabolic pro-
cesses and properties of tumors.15 Previously, we showed that MR
spectroscopic imaging, specifically choline/N-acetylaspartate ra-
tios, provided a useful tool to assess treatment response following
SIACI BV.7 In the current study, we used DSC-MRP to assess
GBM perfusion changes associated with SIACI BV to determine
whether DSC-MRP provided useful biomarkers to determine
treatment response. We also wanted to explore whether biomark-
ers obtained from DSC-MR imaging could reveal aspects of the
complex mechanism underlying the tumoricidal effects of BV.
Antiangiogenic agents such as BV produce a marked decrease
in contrast enhancement, termed “pseudoresponse,” and a nota-
ble decrease in the nonenhancing T2 hyperintense areas. Stan-
dardized criteria for assessing brain tumor treatment response,
including the Macdonald and the RANO criteria, fall short of
definitively distinguishing tumor progression, pseudoresponse,
and pseudoprogression.16 The inability of the Macdonald and
RANO criteria to differentiate tumor progression, pseudore-
FIG 1. ROI selection. A, Precontrast T1-weighted images are used to select the ROI in the normal-appearing white matter on the side contralateral to the lesion (black circle). B, PostcontrastT1-weighted images are compared with the precontrast T1-weighted images to select the ROIrepresenting the area of max contrast enhancement (black circle). C, Region of max rCBV isselected by using rCBV maps (white circle). D, T2-FLAIR images are used to select areas represent-ing the nonenhancing T2 hyperintense signal abnormality surrounding the tumor (black circle).
1840 Singh Oct 2016 www.ajnr.org
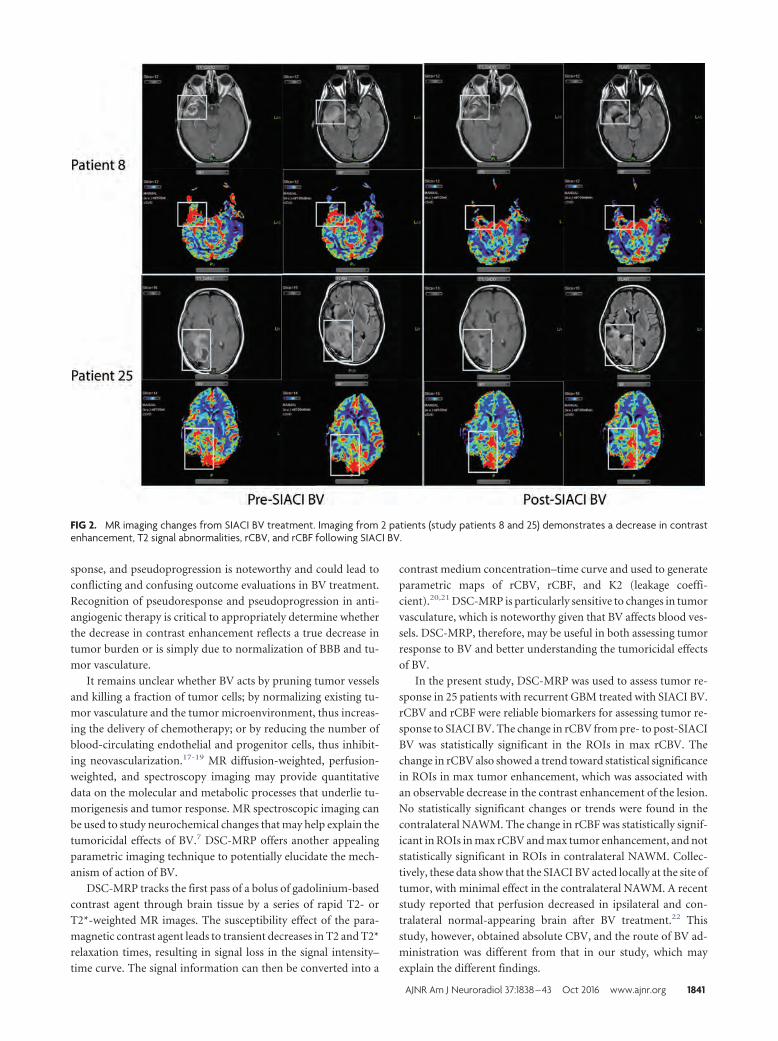
sponse, and pseudoprogression is noteworthy and could lead to
conflicting and confusing outcome evaluations in BV treatment.
Recognition of pseudoresponse and pseudoprogression in anti-
angiogenic therapy is critical to appropriately determine whether
the decrease in contrast enhancement reflects a true decrease in
tumor burden or is simply due to normalization of BBB and tu-
mor vasculature.
It remains unclear whether BV acts by pruning tumor vessels
and killing a fraction of tumor cells; by normalizing existing tu-
mor vasculature and the tumor microenvironment, thus increas-
ing the delivery of chemotherapy; or by reducing the number of
blood-circulating endothelial and progenitor cells, thus inhibit-
ing neovascularization.17-19 MR diffusion-weighted, perfusion-
weighted, and spectroscopy imaging may provide quantitative
data on the molecular and metabolic processes that underlie tu-
morigenesis and tumor response. MR spectroscopic imaging can
be used to study neurochemical changes that may help explain the
tumoricidal effects of BV.7 DSC-MRP offers another appealing
parametric imaging technique to potentially elucidate the mech-
anism of action of BV.
DSC-MRP tracks the first pass of a bolus of gadolinium-based
contrast agent through brain tissue by a series of rapid T2- or
T2*-weighted MR images. The susceptibility effect of the para-
magnetic contrast agent leads to transient decreases in T2 and T2*
relaxation times, resulting in signal loss in the signal intensity–
time curve. The signal information can then be converted into a
contrast medium concentration–time curve and used to generate
parametric maps of rCBV, rCBF, and K2 (leakage coeffi-
cient).20,21 DSC-MRP is particularly sensitive to changes in tumor
vasculature, which is noteworthy given that BV affects blood ves-
sels. DSC-MRP, therefore, may be useful in both assessing tumor
response to BV and better understanding the tumoricidal effects
of BV.
In the present study, DSC-MRP was used to assess tumor re-
sponse in 25 patients with recurrent GBM treated with SIACI BV.
rCBV and rCBF were reliable biomarkers for assessing tumor re-
sponse to SIACI BV. The change in rCBV from pre- to post-SIACI
BV was statistically significant in the ROIs in max rCBV. The
change in rCBV also showed a trend toward statistical significance
in ROIs in max tumor enhancement, which was associated with
an observable decrease in the contrast enhancement of the lesion.
No statistically significant changes or trends were found in the
contralateral NAWM. The change in rCBF was statistically signif-
icant in ROIs in max rCBV and max tumor enhancement, and not
statistically significant in ROIs in contralateral NAWM. Collec-
tively, these data show that the SIACI BV acted locally at the site of
tumor, with minimal effect in the contralateral NAWM. A recent
study reported that perfusion decreased in ipsilateral and con-
tralateral normal-appearing brain after BV treatment.22 This
study, however, obtained absolute CBV, and the route of BV ad-
ministration was different from that in our study, which may
explain the different findings.
FIG 2. MR imaging changes from SIACI BV treatment. Imaging from 2 patients (study patients 8 and 25) demonstrates a decrease in contrastenhancement, T2 signal abnormalities, rCBV, and rCBF following SIACI BV.
AJNR Am J Neuroradiol 37:1838 – 43 Oct 2016 www.ajnr.org 1841
In our patients, SIACI BV produced a marked decrease in
rCBV and rCBF in the max rCBV and max tumor-enhancing
regions on DSC-MRP imaging. Most interesting, we also ob-
served a trend toward statistical significance in rCBV increase in
the nonenhancing T2 hyperintense areas surrounding the lesion.
This may suggest that while the contrast-enhancing region within
the tumor may reflect the treatment response to SIACI BV, it may
not adequately reflect tumor burden, treatment effect, or tumor
progression during or after SIACI BV treatment. It is unclear
whether the increase in rCBV in the nonenhancing T2 hyperin-
tense region reflects an increase in tumor volume or perhaps an
increase in tumor invasiveness. Because several preclinical and
clinical studies have reported that antiangiogenic therapy in-
creases tumor invasiveness,23-25 the increased rCBV in the non-
enhancing T2 hyperintense region approximately 1 month after
SIACI BV in our study may be reflective of this phenomenon.
However, increased T2 hyperintensity occurs more commonly
after long-term IV BV exposure and histologically represents a
low-grade infiltrative phenotype. In our study, there was no sta-
tistically significant difference in TTP and OS among patients
who received intravenous BV before SIACI BV compared with
those who did not. Combined radiologic and pathologic correla-
tive studies are needed to better understand the imaging biomark-
ers of tumor invasiveness, especially as they pertain to antiangio-
genic therapy.
Post-SIACI BV changes in MRP biomarkers did not corre-
late with prolonged TTP and OS. It is difficult to conclusively
state whether this was due to lack of treatment effect or other
confounding variables. The sample size was small and clinical
heterogeneity in patients selected for inclusion in the Phase I/II
SIACI BV trials should be considered. Notably, more than a
quarter of our patients were exposed to BV before enrolling in
SIACI BV clinical trials, and not every patient received the
maximum dose of SIACI BV. Furthermore, more than half of
our patients received subsequent treatment after SIACI BV,
making it difficult to accurately assess the true implications of
this potential treatment. Given the design, the study had limi-
tations inherent in all retrospective reviews: Namely, our re-
sults demonstrate correlation and not causation. The subjec-
tivity in selecting matching ROIs on pre- and posttreatment
scans may have introduced sampling error. To minimize this,
only one investigator (K.K.) placed ROIs, and all ROI place-
ments were overseen by 2 senior investigators (A.J.T. and I.K.).
Another limitation was that histologic specimens were not
available to confirm the diagnosis of recurrent disease. While it
is ideal to obtain histologic specimens of recurrent disease, it is
not realistic to expect patients to agree to an additional surgical
procedure for open biopsy. Furthermore, even if a biopsy is
obtained, correlation with posttreatment MRP changes may
not be feasible because the exact site of biopsy is often not
known or identifiable after biopsy, making it difficult to cor-
relate MRP changes with histopathologic examination. Future
studies by using SIACI BV should attempt to obtain biopsy
specimens of recurrent disease by using specified coordinates
and match these coordinates voxel-by-voxel to post–SIACI BV
treatment MRP scans.
CONCLUSIONSThis study suggests that GBM response to SIACI BV can be as-
sessed by comparing pre- and posttreatment rCBV and rCBF
changes in regions of the tumor with max rCBV and max en-
hancement. However, there was no correlation between these sig-
nificant MRP biomarker changes, TTP, and OS.
Disclosures: Christopher G. Filippi—UNRELATED: Consultancy: Syntactx, Guerbet,Comments: review of brain MR images for a clinical research trial; attended AdvisoryBoard Meeting for Guerbet in Boston as a consultant; Grants/Grants Pending: KatzInstitute for Women’s Health (KIWH),* Coulter,* Comments: KIWH grant, coinvesti-gator, funded from September 2015 to October 2016 for grant determining optimumimaging strategy for women with acute stroke; and Coulter grant, Principal Investi-gator, on the development of a novel semiautomated computer software algorithmfor core infarct detection. *Money paid to the institution.
REFERENCES1. Stupp R, Hegi ME, Mason WP, et al; European Organisation for Re-
search and Treatment of Cancer Brain Tumour and Radiation Oncol-ogy Groups, National Cancer Institute of Canada Clinical TrialsGroup. Effects of radiotherapy with concomitant and adjuvant te-mozolomide versus radiotherapy alone on survival in glioblastomain a randomised phase III study: 5-year analysis of the EORTC-NCIC trial. Lancet Oncol 2009;10:459 – 66 CrossRef Medline
2. Chinot OL. Bevacizumab-based therapy in relapsed glioblastoma:rationale and clinical experience to date. Expert Rev Anticancer Ther2012;12:1413–27 CrossRef Medline
3. Mukherji SK. Bevacizumab (Avastin). AJNR Am J Neuroradiol 2010;31:235–36 CrossRef Medline
4. Riina HA, Fraser JF, Fralin S, et al. Superselective intraarterial cerebralinfusion of bevacizumab: a revival of interventional neuro-oncologyfor malignant glioma. J Exp Ther Oncol 2009;8:145–50 Medline
5. Boockvar JA, Tsiouris AJ, Hofstetter CP, et al. Safety and maximumtolerated dose of superselective intraarterial cerebral infusion ofbevacizumab after osmotic blood-brain barrier disruption for re-current malignant glioma: clinical article. J Neurosurg 2011;114:624 –32 CrossRef Medline
6. Burkhardt JK, Riina H, Shin BJ, et al. Intra-arterial delivery of bev-acizumab after blood-brain barrier disruption for the treatment ofrecurrent glioblastoma: progression-free survival and overall sur-vival. World Neurosurg 2012;77:130 –34 CrossRef Medline
7. Jeon JY, Kovanlikaya I, Boockvar JA, et al. Metabolic response ofglioblastoma to superselective intra-arterial cerebral infusion ofbevacizumab: a proton MR spectroscopic imaging study. AJNRAm J Neuroradiol 2012;33:2095–102 CrossRef Medline
8. Upadhyay N, Waldman AD. Conventional MRI evaluation of glio-mas. Br J Radiol 2011;84(Spec No 2):S107–11 CrossRef Medline
9. Kickingereder P, Wiestler B, Burth S, et al. Relative cerebral bloodvolume is a potential predictive imaging biomarker of bevaci-zumab efficacy in recurrent glioblastoma. Neuro Oncol 2015;17:1139 – 47 CrossRef Medline
10. Schmainda KM, Zhang Z, Prah M, et al. Dynamic susceptibility con-trast MRI measures of relative cerebral blood volume as a prognos-tic marker for overall survival in recurrent glioblastoma: resultsfrom the ACRIN 6677/RTOG 0625 multicenter trial. Neuro Oncol2015;17:1148 –56 CrossRef Medline
11. Wen PY, Macdonald DR, Reardon DA, et al. Updated response assess-ment criteria for high-grade gliomas: response assessment in neuro-oncology working group. J Clin Oncol 2010;28:1963–72 CrossRef Medline
12. Shin BJ, Burkhardt JK, Riina HA, et al. Superselective intra-arterialcerebral infusion of novel agents after blood-brain disruption forthe treatment of recurrent glioblastoma multiforme: a technicalcase series. Neurosurg Clin N Am 2012;23:323–29, ix–x CrossRefMedline
13. Boxerman JL, Schmainda KM, Weisskoff RM. Relative cerebralblood volume maps corrected for contrast agent extravasation sig-
1842 Singh Oct 2016 www.ajnr.org
nificantly correlate with glioma tumor grade, whereas uncorrectedmaps do not. AJNR Am J Neuroradiol 2006;27:859 – 67 Medline
14. Paulson ES, Schmainda KM. Comparison of dynamic susceptibility-weighted contrast-enhanced MR methods: recommendations formeasuring relative cerebral blood volume in brain tumors. Radiol-ogy 2008;249:601–13 CrossRef Medline
15. Kalpathy-Cramer J, Gerstner ER, Emblem KE, et al. Advanced mag-netic resonance imaging of the physical processes in human glio-blastoma. Cancer Res 2014;74:4622–37 CrossRef Medline
16. Huang RY, Neagu MR, Reardon DA, et al. Pitfalls in the neuroimag-ing of glioblastoma in the era of antiangiogenic and immuno/tar-geted therapy: detecting illusive disease, defining response. FrontNeurol 2015;6:33 CrossRef Medline
17. Falk AT, Barriere J, Francois E, et al. Bevacizumab: a dose review. CritRev Oncol Hematol 2015;94:311–22 CrossRef Medline
18. Jain RK, Duda DG, Clark JW, et al. Lessons from phase III clinicaltrials on anti-VEGF therapy for cancer. Nat Clin Pract Oncol 2006;3:24 – 40 CrossRef Medline
19. Okonogi N, Shirai K, Oike T, et al. Topics in chemotherapy, molec-ular-targeted therapy, and immunotherapy for newly-diagnosedglioblastoma multiforme. Anticancer Res 2015;35:1229 –35 Medline
20. Essig M, Shiroishi MS, Nguyen TB, et al. Perfusion MRI: the fivemost frequently asked technical questions. AJR Am J Roentgenol2013;200:24 –34 CrossRef Medline
21. Jahng GH, Li KL, Ostergaard L, et al. Perfusion magnetic resonanceimaging: a comprehensive update on principles and techniques.Korean J Radiol 2014;15:554 –77 CrossRef Medline
22. Stadlbauer A, Pichler P, Karl M, et al. Quantification of serialchanges in cerebral blood volume and metabolism in patients withrecurrent glioblastoma undergoing antiangiogenic therapy. Eur JRadiol 2015;84:1128 –36 CrossRef Medline
23. de Groot JF, Fuller G, Kumar AJ, et al. Tumor invasion after treat-ment of glioblastoma with bevacizumab: radiographic and patho-logic correlation in humans and mice. Neuro Oncol 2010;12:233– 42CrossRef Medline
24. Iwamoto FM, Abrey LE, Beal K, et al. Patterns of relapse and prog-nosis after bevacizumab failure in recurrent glioblastoma. Neurol-ogy 2009;73:1200 – 06 CrossRef Medline
25. Keunen O, Johansson M, Oudin A, et al. Anti-VEGF treatmentreduces blood supply and increases tumor cell invasion in glio-blastoma. Proc Natl Acad Sci U S A 2011;108:3749 –54 CrossRefMedline
AJNR Am J Neuroradiol 37:1838 – 43 Oct 2016 www.ajnr.org 1843
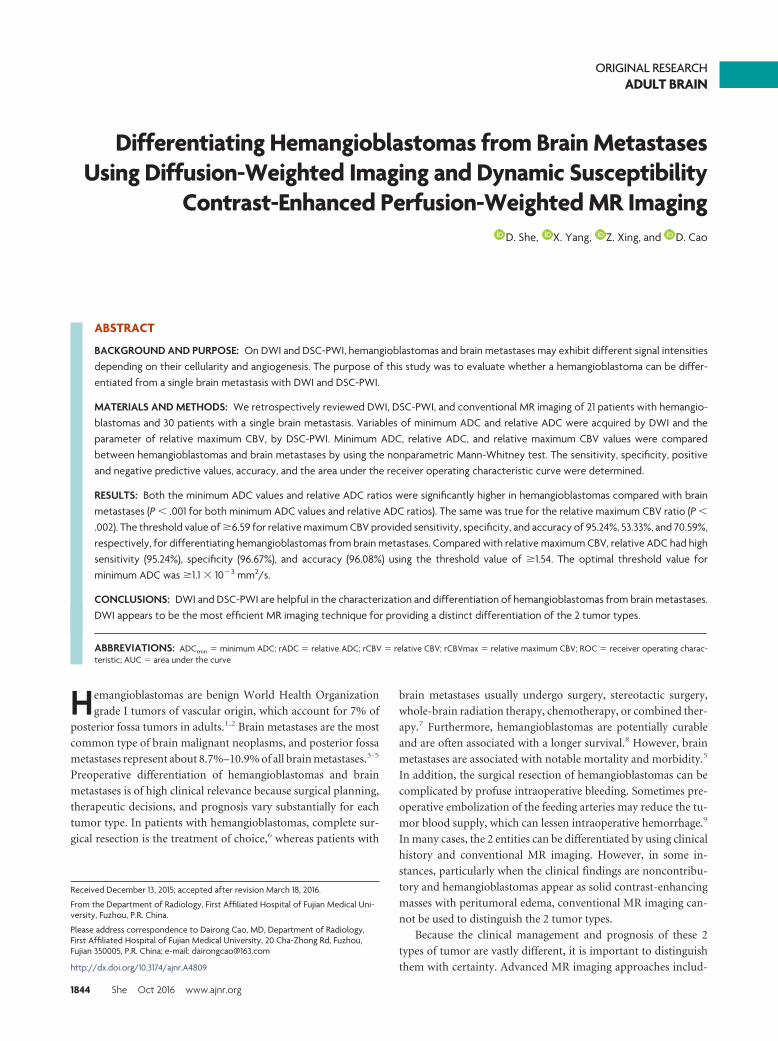
ORIGINAL RESEARCHADULT BRAIN
Differentiating Hemangioblastomas from Brain MetastasesUsing Diffusion-Weighted Imaging and Dynamic Susceptibility
Contrast-Enhanced Perfusion-Weighted MR ImagingX D. She, X X. Yang, X Z. Xing, and X D. Cao
ABSTRACT
BACKGROUND AND PURPOSE: On DWI and DSC-PWI, hemangioblastomas and brain metastases may exhibit different signal intensitiesdepending on their cellularity and angiogenesis. The purpose of this study was to evaluate whether a hemangioblastoma can be differ-entiated from a single brain metastasis with DWI and DSC-PWI.
MATERIALS AND METHODS: We retrospectively reviewed DWI, DSC-PWI, and conventional MR imaging of 21 patients with hemangio-blastomas and 30 patients with a single brain metastasis. Variables of minimum ADC and relative ADC were acquired by DWI and theparameter of relative maximum CBV, by DSC-PWI. Minimum ADC, relative ADC, and relative maximum CBV values were comparedbetween hemangioblastomas and brain metastases by using the nonparametric Mann-Whitney test. The sensitivity, specificity, positiveand negative predictive values, accuracy, and the area under the receiver operating characteristic curve were determined.
RESULTS: Both the minimum ADC values and relative ADC ratios were significantly higher in hemangioblastomas compared with brainmetastases (P � .001 for both minimum ADC values and relative ADC ratios). The same was true for the relative maximum CBV ratio (P �
.002). The threshold value of �6.59 for relative maximum CBV provided sensitivity, specificity, and accuracy of 95.24%, 53.33%, and 70.59%,respectively, for differentiating hemangioblastomas from brain metastases. Compared with relative maximum CBV, relative ADC had highsensitivity (95.24%), specificity (96.67%), and accuracy (96.08%) using the threshold value of �1.54. The optimal threshold value forminimum ADC was �1.1 � 10�3 mm2/s.
CONCLUSIONS: DWI and DSC-PWI are helpful in the characterization and differentiation of hemangioblastomas from brain metastases.DWI appears to be the most efficient MR imaging technique for providing a distinct differentiation of the 2 tumor types.
ABBREVIATIONS: ADCmin � minimum ADC; rADC � relative ADC; rCBV � relative CBV; rCBVmax � relative maximum CBV; ROC � receiver operating charac-teristic; AUC � area under the curve
Hemangioblastomas are benign World Health Organization
grade I tumors of vascular origin, which account for 7% of
posterior fossa tumors in adults.1,2 Brain metastases are the most
common type of brain malignant neoplasms, and posterior fossa
metastases represent about 8.7%–10.9% of all brain metastases.3-5
Preoperative differentiation of hemangioblastomas and brain
metastases is of high clinical relevance because surgical planning,
therapeutic decisions, and prognosis vary substantially for each
tumor type. In patients with hemangioblastomas, complete sur-
gical resection is the treatment of choice,6 whereas patients with
brain metastases usually undergo surgery, stereotactic surgery,
whole-brain radiation therapy, chemotherapy, or combined ther-
apy.7 Furthermore, hemangioblastomas are potentially curable
and are often associated with a longer survival.8 However, brain
metastases are associated with notable mortality and morbidity.5
In addition, the surgical resection of hemangioblastomas can be
complicated by profuse intraoperative bleeding. Sometimes pre-
operative embolization of the feeding arteries may reduce the tu-
mor blood supply, which can lessen intraoperative hemorrhage.9
In many cases, the 2 entities can be differentiated by using clinical
history and conventional MR imaging. However, in some in-
stances, particularly when the clinical findings are noncontribu-
tory and hemangioblastomas appear as solid contrast-enhancing
masses with peritumoral edema, conventional MR imaging can-
not be used to distinguish the 2 tumor types.
Because the clinical management and prognosis of these 2
types of tumor are vastly different, it is important to distinguish
them with certainty. Advanced MR imaging approaches includ-
Received December 13, 2015; accepted after revision March 18, 2016.
From the Department of Radiology, First Affiliated Hospital of Fujian Medical Uni-versity, Fuzhou, P.R. China.
Please address correspondence to Dairong Cao, MD, Department of Radiology,First Affiliated Hospital of Fujian Medical University, 20 Cha-Zhong Rd, Fuzhou,Fujian 350005, P.R. China; e-mail: [email protected]
http://dx.doi.org/10.3174/ajnr.A4809
1844 She Oct 2016 www.ajnr.org
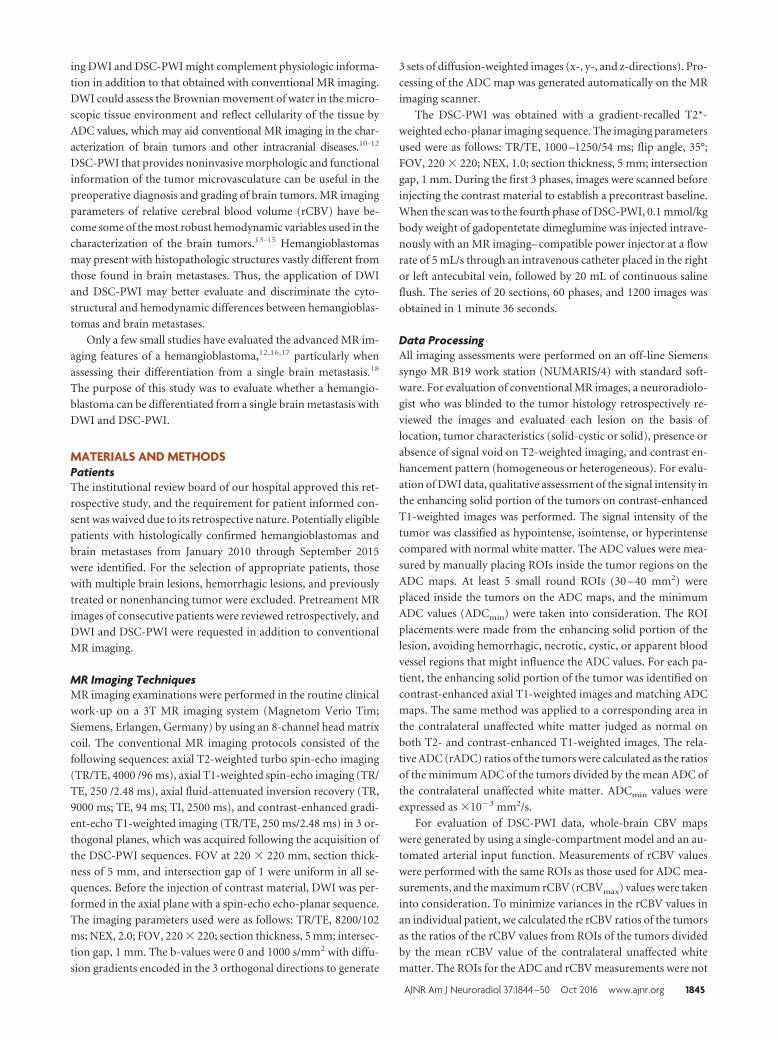
ing DWI and DSC-PWI might complement physiologic informa-
tion in addition to that obtained with conventional MR imaging.
DWI could assess the Brownian movement of water in the micro-
scopic tissue environment and reflect cellularity of the tissue by
ADC values, which may aid conventional MR imaging in the char-
acterization of brain tumors and other intracranial diseases.10-12
DSC-PWI that provides noninvasive morphologic and functional
information of the tumor microvasculature can be useful in the
preoperative diagnosis and grading of brain tumors. MR imaging
parameters of relative cerebral blood volume (rCBV) have be-
come some of the most robust hemodynamic variables used in the
characterization of the brain tumors.13-15 Hemangioblastomas
may present with histopathologic structures vastly different from
those found in brain metastases. Thus, the application of DWI
and DSC-PWI may better evaluate and discriminate the cyto-
structural and hemodynamic differences between hemangioblas-
tomas and brain metastases.
Only a few small studies have evaluated the advanced MR im-
aging features of a hemangioblastoma,12,16,17 particularly when
assessing their differentiation from a single brain metastasis.18
The purpose of this study was to evaluate whether a hemangio-
blastoma can be differentiated from a single brain metastasis with
DWI and DSC-PWI.
MATERIALS AND METHODSPatientsThe institutional review board of our hospital approved this ret-
rospective study, and the requirement for patient informed con-
sent was waived due to its retrospective nature. Potentially eligible
patients with histologically confirmed hemangioblastomas and
brain metastases from January 2010 through September 2015
were identified. For the selection of appropriate patients, those
with multiple brain lesions, hemorrhagic lesions, and previously
treated or nonenhancing tumor were excluded. Pretreament MR
images of consecutive patients were reviewed retrospectively, and
DWI and DSC-PWI were requested in addition to conventional
MR imaging.
MR Imaging TechniquesMR imaging examinations were performed in the routine clinical
work-up on a 3T MR imaging system (Magnetom Verio Tim;
Siemens, Erlangen, Germany) by using an 8-channel head matrix
coil. The conventional MR imaging protocols consisted of the
following sequences: axial T2-weighted turbo spin-echo imaging
(TR/TE, 4000 /96 ms), axial T1-weighted spin-echo imaging (TR/
TE, 250 /2.48 ms), axial fluid-attenuated inversion recovery (TR,
9000 ms; TE, 94 ms; TI, 2500 ms), and contrast-enhanced gradi-
ent-echo T1-weighted imaging (TR/TE, 250 ms/2.48 ms) in 3 or-
thogonal planes, which was acquired following the acquisition of
the DSC-PWI sequences. FOV at 220 � 220 mm, section thick-
ness of 5 mm, and intersection gap of 1 were uniform in all se-
quences. Before the injection of contrast material, DWI was per-
formed in the axial plane with a spin-echo echo-planar sequence.
The imaging parameters used were as follows: TR/TE, 8200/102
ms; NEX, 2.0; FOV, 220 � 220; section thickness, 5 mm; intersec-
tion gap, 1 mm. The b-values were 0 and 1000 s/mm2 with diffu-
sion gradients encoded in the 3 orthogonal directions to generate
3 sets of diffusion-weighted images (x-, y-, and z-directions). Pro-
cessing of the ADC map was generated automatically on the MR
imaging scanner.
The DSC-PWI was obtained with a gradient-recalled T2*-
weighted echo-planar imaging sequence. The imaging parameters
used were as follows: TR/TE, 1000 –1250/54 ms; flip angle, 35°;
FOV, 220 � 220; NEX, 1.0; section thickness, 5 mm; intersection
gap, 1 mm. During the first 3 phases, images were scanned before
injecting the contrast material to establish a precontrast baseline.
When the scan was to the fourth phase of DSC-PWI, 0.1 mmol/kg
body weight of gadopentetate dimeglumine was injected intrave-
nously with an MR imaging– compatible power injector at a flow
rate of 5 mL/s through an intravenous catheter placed in the right
or left antecubital vein, followed by 20 mL of continuous saline
flush. The series of 20 sections, 60 phases, and 1200 images was
obtained in 1 minute 36 seconds.
Data ProcessingAll imaging assessments were performed on an off-line Siemens
syngo MR B19 work station (NUMARIS/4) with standard soft-
ware. For evaluation of conventional MR images, a neuroradiolo-
gist who was blinded to the tumor histology retrospectively re-
viewed the images and evaluated each lesion on the basis of
location, tumor characteristics (solid-cystic or solid), presence or
absence of signal void on T2-weighted imaging, and contrast en-
hancement pattern (homogeneous or heterogeneous). For evalu-
ation of DWI data, qualitative assessment of the signal intensity in
the enhancing solid portion of the tumors on contrast-enhanced
T1-weighted images was performed. The signal intensity of the
tumor was classified as hypointense, isointense, or hyperintense
compared with normal white matter. The ADC values were mea-
sured by manually placing ROIs inside the tumor regions on the
ADC maps. At least 5 small round ROIs (30 – 40 mm2) were
placed inside the tumors on the ADC maps, and the minimum
ADC values (ADCmin) were taken into consideration. The ROI
placements were made from the enhancing solid portion of the
lesion, avoiding hemorrhagic, necrotic, cystic, or apparent blood
vessel regions that might influence the ADC values. For each pa-
tient, the enhancing solid portion of the tumor was identified on
contrast-enhanced axial T1-weighted images and matching ADC
maps. The same method was applied to a corresponding area in
the contralateral unaffected white matter judged as normal on
both T2- and contrast-enhanced T1-weighted images. The rela-
tive ADC (rADC) ratios of the tumors were calculated as the ratios
of the minimum ADC of the tumors divided by the mean ADC of
the contralateral unaffected white matter. ADCmin values were
expressed as �10�3 mm2/s.
For evaluation of DSC-PWI data, whole-brain CBV maps
were generated by using a single-compartment model and an au-
tomated arterial input function. Measurements of rCBV values
were performed with the same ROIs as those used for ADC mea-
surements, and the maximum rCBV (rCBVmax) values were taken
into consideration. To minimize variances in the rCBV values in
an individual patient, we calculated the rCBV ratios of the tumors
as the ratios of the rCBV values from ROIs of the tumors divided
by the mean rCBV value of the contralateral unaffected white
matter. The ROIs for the ADC and rCBV measurements were not
AJNR Am J Neuroradiol 37:1844 –50 Oct 2016 www.ajnr.org 1845
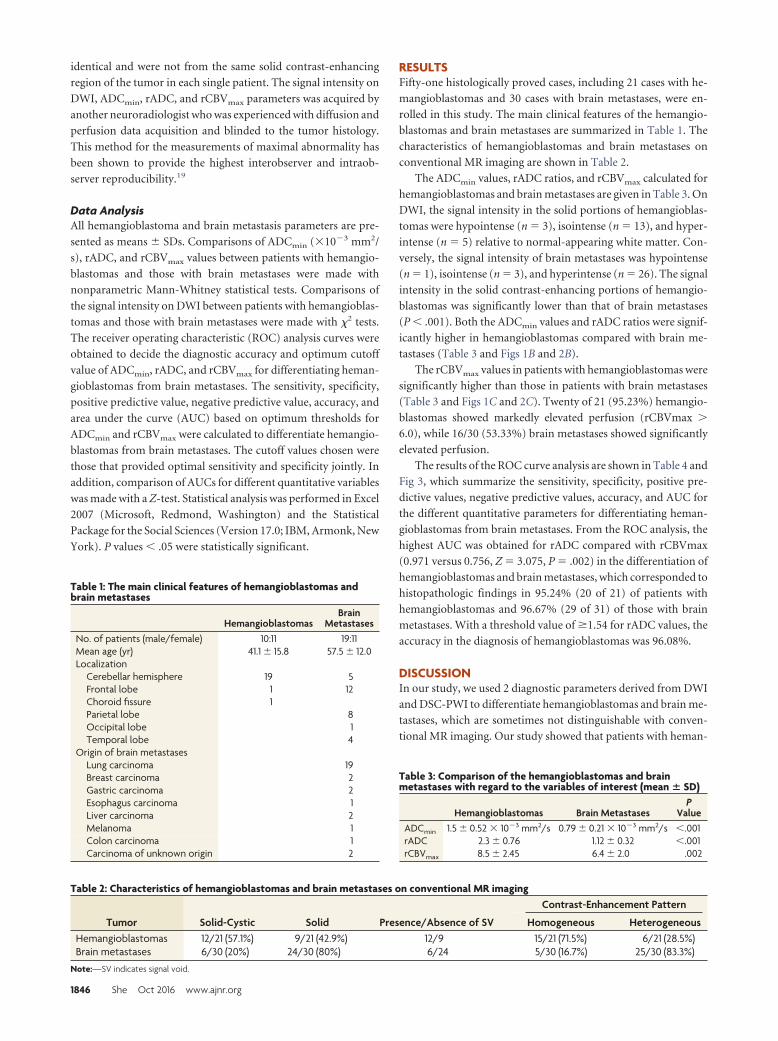
identical and were not from the same solid contrast-enhancing
region of the tumor in each single patient. The signal intensity on
DWI, ADCmin, rADC, and rCBVmax parameters was acquired by
another neuroradiologist who was experienced with diffusion and
perfusion data acquisition and blinded to the tumor histology.
This method for the measurements of maximal abnormality has
been shown to provide the highest interobserver and intraob-
server reproducibility.19
Data AnalysisAll hemangioblastoma and brain metastasis parameters are pre-
sented as means � SDs. Comparisons of ADCmin (�10�3 mm2/
s), rADC, and rCBVmax values between patients with hemangio-
blastomas and those with brain metastases were made with
nonparametric Mann-Whitney statistical tests. Comparisons of
the signal intensity on DWI between patients with hemangioblas-
tomas and those with brain metastases were made with �2 tests.
The receiver operating characteristic (ROC) analysis curves were
obtained to decide the diagnostic accuracy and optimum cutoff
value of ADCmin, rADC, and rCBVmax for differentiating heman-
gioblastomas from brain metastases. The sensitivity, specificity,
positive predictive value, negative predictive value, accuracy, and
area under the curve (AUC) based on optimum thresholds for
ADCmin and rCBVmax were calculated to differentiate hemangio-
blastomas from brain metastases. The cutoff values chosen were
those that provided optimal sensitivity and specificity jointly. In
addition, comparison of AUCs for different quantitative variables
was made with a Z-test. Statistical analysis was performed in Excel
2007 (Microsoft, Redmond, Washington) and the Statistical
Package for the Social Sciences (Version 17.0; IBM, Armonk, New
York). P values � .05 were statistically significant.
RESULTSFifty-one histologically proved cases, including 21 cases with he-
mangioblastomas and 30 cases with brain metastases, were en-
rolled in this study. The main clinical features of the hemangio-
blastomas and brain metastases are summarized in Table 1. The
characteristics of hemangioblastomas and brain metastases on
conventional MR imaging are shown in Table 2.
The ADCmin values, rADC ratios, and rCBVmax calculated for
hemangioblastomas and brain metastases are given in Table 3. On
DWI, the signal intensity in the solid portions of hemangioblas-
tomas were hypointense (n � 3), isointense (n � 13), and hyper-
intense (n � 5) relative to normal-appearing white matter. Con-
versely, the signal intensity of brain metastases was hypointense
(n � 1), isointense (n � 3), and hyperintense (n � 26). The signal
intensity in the solid contrast-enhancing portions of hemangio-
blastomas was significantly lower than that of brain metastases
(P � .001). Both the ADCmin values and rADC ratios were signif-
icantly higher in hemangioblastomas compared with brain me-
tastases (Table 3 and Figs 1B and 2B).
The rCBVmax values in patients with hemangioblastomas were
significantly higher than those in patients with brain metastases
(Table 3 and Figs 1C and 2C). Twenty of 21 (95.23%) hemangio-
blastomas showed markedly elevated perfusion (rCBVmax �
6.0), while 16/30 (53.33%) brain metastases showed significantly
elevated perfusion.
The results of the ROC curve analysis are shown in Table 4 and
Fig 3, which summarize the sensitivity, specificity, positive pre-
dictive values, negative predictive values, accuracy, and AUC for
the different quantitative parameters for differentiating heman-
gioblastomas from brain metastases. From the ROC analysis, the
highest AUC was obtained for rADC compared with rCBVmax
(0.971 versus 0.756, Z � 3.075, P � .002) in the differentiation of
hemangioblastomas and brain metastases, which corresponded to
histopathologic findings in 95.24% (20 of 21) of patients with
hemangioblastomas and 96.67% (29 of 31) of those with brain
metastases. With a threshold value of �1.54 for rADC values, the
accuracy in the diagnosis of hemangioblastomas was 96.08%.
DISCUSSIONIn our study, we used 2 diagnostic parameters derived from DWI
and DSC-PWI to differentiate hemangioblastomas and brain me-
tastases, which are sometimes not distinguishable with conven-
tional MR imaging. Our study showed that patients with heman-
Table 1: The main clinical features of hemangioblastomas andbrain metastases
HemangioblastomasBrain
MetastasesNo. of patients (male/female) 10:11 19:11Mean age (yr) 41.1 � 15.8 57.5 � 12.0Localization
Cerebellar hemisphere 19 5Frontal lobe 1 12Choroid fissure 1Parietal lobe 8Occipital lobe 1Temporal lobe 4
Origin of brain metastasesLung carcinoma 19Breast carcinoma 2Gastric carcinoma 2Esophagus carcinoma 1Liver carcinoma 2Melanoma 1Colon carcinoma 1Carcinoma of unknown origin 2
Table 2: Characteristics of hemangioblastomas and brain metastases on conventional MR imaging
Tumor Solid-Cystic Solid Presence/Absence of SV
Contrast-Enhancement Pattern
Homogeneous HeterogeneousHemangioblastomas 12/21 (57.1%) 9/21 (42.9%) 12/9 15/21 (71.5%) 6/21 (28.5%)Brain metastases 6/30 (20%) 24/30 (80%) 6/24 5/30 (16.7%) 25/30 (83.3%)
Note:—SV indicates signal void.
Table 3: Comparison of the hemangioblastomas and brainmetastases with regard to the variables of interest (mean � SD)
Hemangioblastomas Brain MetastasesP
ValueADCmin 1.5 � 0.52 � 10�3 mm2/s 0.79 � 0.21 � 10�3 mm2/s �.001rADC 2.3 � 0.76 1.12 � 0.32 �.001rCBVmax 8.5 � 2.45 6.4 � 2.0 .002
1846 She Oct 2016 www.ajnr.org
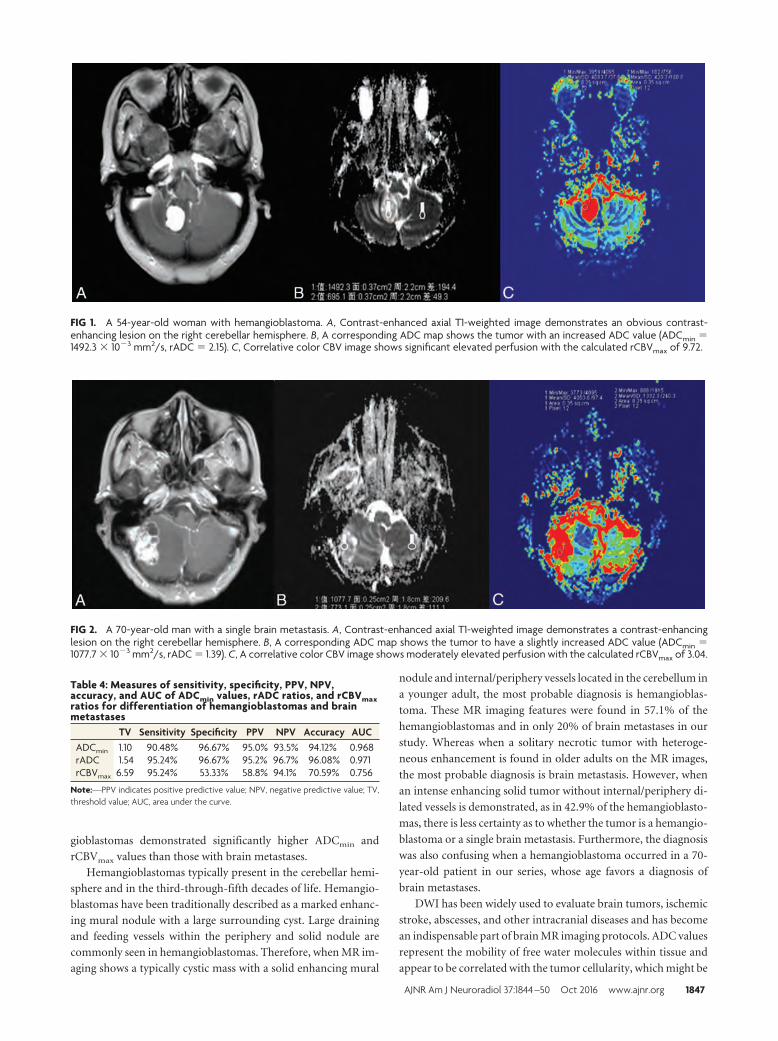
gioblastomas demonstrated significantly higher ADCmin and
rCBVmax values than those with brain metastases.
Hemangioblastomas typically present in the cerebellar hemi-
sphere and in the third-through-fifth decades of life. Hemangio-
blastomas have been traditionally described as a marked enhanc-
ing mural nodule with a large surrounding cyst. Large draining
and feeding vessels within the periphery and solid nodule are
commonly seen in hemangioblastomas. Therefore, when MR im-
aging shows a typically cystic mass with a solid enhancing mural
nodule and internal/periphery vessels located in the cerebellum in
a younger adult, the most probable diagnosis is hemangioblas-
toma. These MR imaging features were found in 57.1% of the
hemangioblastomas and in only 20% of brain metastases in our
study. Whereas when a solitary necrotic tumor with heteroge-
neous enhancement is found in older adults on the MR images,
the most probable diagnosis is brain metastasis. However, when
an intense enhancing solid tumor without internal/periphery di-
lated vessels is demonstrated, as in 42.9% of the hemangioblasto-
mas, there is less certainty as to whether the tumor is a hemangio-
blastoma or a single brain metastasis. Furthermore, the diagnosis
was also confusing when a hemangioblastoma occurred in a 70-
year-old patient in our series, whose age favors a diagnosis of
brain metastases.
DWI has been widely used to evaluate brain tumors, ischemic
stroke, abscesses, and other intracranial diseases and has become
an indispensable part of brain MR imaging protocols. ADC values
represent the mobility of free water molecules within tissue and
appear to be correlated with the tumor cellularity, which might be
FIG 1. A 54-year-old woman with hemangioblastoma. A, Contrast-enhanced axial T1-weighted image demonstrates an obvious contrast-enhancing lesion on the right cerebellar hemisphere. B, A corresponding ADC map shows the tumor with an increased ADC value (ADCmin �1492.3 � 10�3 mm2/s, rADC � 2.15). C, Correlative color CBV image shows significant elevated perfusion with the calculated rCBVmax of 9.72.
FIG 2. A 70-year-old man with a single brain metastasis. A, Contrast-enhanced axial T1-weighted image demonstrates a contrast-enhancinglesion on the right cerebellar hemisphere. B, A corresponding ADC map shows the tumor to have a slightly increased ADC value (ADCmin �1077.7 � 10�3 mm2/s, rADC � 1.39). C, A correlative color CBV image shows moderately elevated perfusion with the calculated rCBVmax of 3.04.
Table 4: Measures of sensitivity, specificity, PPV, NPV,accuracy, and AUC of ADCmin values, rADC ratios, and rCBVmaxratios for differentiation of hemangioblastomas and brainmetastases
TV Sensitivity Specificity PPV NPV Accuracy AUCADCmin 1.10 90.48% 96.67% 95.0% 93.5% 94.12% 0.968rADC 1.54 95.24% 96.67% 95.2% 96.7% 96.08% 0.971rCBVmax 6.59 95.24% 53.33% 58.8% 94.1% 70.59% 0.756
Note:—PPV indicates positive predictive value; NPV, negative predictive value; TV,threshold value; AUC, area under the curve.
AJNR Am J Neuroradiol 37:1844 –50 Oct 2016 www.ajnr.org 1847
a useful adjunct in the preoperative management of patients with
common brain tumors, including cerebellar tumors. There are
few studies in the literature regarding the DWI findings of heman-
gioblastomas. In a small group study of 22 cerebellar tumors,
Quadery and Okamoto12 reported that the ADC values were in-
creased (�1.27 � 0.14 � 10�3 mm2/s) in 10 hemangioblastomas,
while other tumors, including 3 metastatic tumors, had lower or
similar ADC values compared with those of cerebellar paren-
chyma (without statistical analysis).20 In this study, we found that
the signal intensity in the solid contrast-enhancing portions of
hemangioblastomas tended to be hypointense or isointense rela-
tive to normal-appearing white matter on DWI. In addition, they
had significantly lower signal intensity than brain metastases. Fur-
thermore, the ADC values of solid contrast-enhancing areas in
this study were higher than those of normal brain parenchyma in
all hemangioblastomas, consistent with previous findings.12 To
the best of our knowledge, the application of ADC values obtained
from DWI in distinguishing hemangioblastomas from brain me-
tastases has not been studied previously. This study also revealed
that the rate of water diffusion of hemangioblastomas, as reflected
by ADC values, was significantly higher than that of brain metas-
tases (P � .001). Several studies have reported that calculated
ADC values were inversely related to tumor cellular attenuation
and tumor nucleus/cytoplasm ratios in terms of water diffusivity
within intracranial tumors.21,22
Densely packed tumor cells can inhibit effective movement of
free water molecules and can, therefore, restrict diffusion. Low
diffusion could translate into high signal intensity on DWI, with
low values on ADC maps. Histopathologically, hemangioblasto-
mas are World Health Organization grade I tumors characterized
by stromal cells with plump foamy cytoplasm and an abundant
capillary network.20 Lower signal intensity on DWI combined
with higher ADC values in hemangioblastomas may reflect the
lower cellular attenuation and nucleus/cytoplasm ratios com-
pared with metastatic tumors. Furthermore, high vascular spaces
in hemangioblastomas may also result from low signal on DWI
with increased ADC values.12 In a study of 26 metastatic brain
lesions, Hayashida et al23 found that the signal intensity of well-
differentiated adenocarcinomas on DWI tended to be signifi-
cantly lower than that of poorly differentiated adenocarcinomas
and lesions other than adenocarcinomas. They reported that the
ADC values of the solid portions of brain metastases were corre-
lated with tumor cellularity and that the signal intensity on DWI
may predict the histology of brain metastases.23 Therefore, our
findings suggest that preoperative determination of the ADC val-
ues of the cerebellar tumors in adults may aid in the differential
diagnosis of hemangioblastomas and brain metastases.
rCBV measurement derived from DSC-PWI is a useful param-
eter to evaluate tumor angiogenesis and to differentiate various
types of the brain tumors because it adds functional information
not available with conventional MR imaging.13-15 In vivo mea-
surement of rCBV has been shown to correlate with tumor vas-
cularity and serve as an indicator of tumor grade.14,24 In addition,
rCBV has also been demonstrated to strongly correlate with vas-
cular endothelial growth factor expression in nonenhancing glio-
mas.25 A maximum rCBV value of 9.4 � 2.37 or 7.7 � 1.0 for
hemangioblastomas has been identified in 2 different studies.16,26
Hakyemez et al18 showed that the rCBV ratios of 6 hemangioblas-
tomas were significantly higher than those of 25 brain metastases
(11.4 � 4.40 versus 5.3 � 3.22, P � .05). In our group of heman-
gioblastomas, the rCBVmax value calculated from the solid con-
trast-enhancing portion was 8.5 � 2.45, significantly higher than
that of brain metastases (6.4 � 2.0). The rCBVmax value for he-
mangioblastomas or metastases is in good agreement with values
reported previously.16,18,26
Hemangioblastomas have abundant tumor vessels within tu-
mors due to overexpression of vascular endothelial growth fac-
tor,20,27 which causes significantly increased rCBV. However, the
histopathologic features of brain metastatic tumor vessels have
not been established because of a variety of macroscopic and mi-
croscopic features connected to the histopathologic characteris-
tics of the primary tumor. Tsougos et al28 demonstrated that the
rCBV value of metastases was 10.80 � 5.13 in a study consisting of
6 lung and 8 breast primary tumors. Gaudino et al29 showed that
the rCBV value in lesions was higher (3.30 � 1.59) than that of
white matter in a series of 59 solitary brain metastases. Our study
showed that the rCBV value of brain metastases was 5.3 � 3.22,
which is not consistent with that in previous studies, probably due
to the heterogeneity of brain metastases of different primary tu-
mors. Thus, brain metastases originating from melanoma or
breast carcinoma, which are highly vascular, may present with
higher rCBV than those from lung cancer, known to be less
vascular.
In this study, the rCBV values in lesions were found to be
markedly high (�7.5) in 2 breast carcinomas and 1 melanoma.
More defined rCBV values in brain metastases are worth further
investigation with larger sample size. Regardless, our results sug-
gest that high rCBVmax appears to be indicative of hemangioblas-
tomas, whereas a low rCBVmax is suggestive of brain metastases.
One could assume that when an intense-enhancing solid tumor in
the posterior fossa presents with a marked increase of rCBV, the
most probable diagnosis is hemangioblastoma. In this case, pre-
operative embolization should be considered to control inacces-
sible arterial supply and reduce the tumor vascularity, which
could aid in the resection of the hemangioblastoma. This ap-
proach is often used in spinal hemangioblastoma to reduce the
FIG 3. Comparison of ROC curves of ADCmin, rADC, and rCBVmax inthe contrast-enhancing lesions for differentiating hemangioblasto-mas from brain metastases.
1848 She Oct 2016 www.ajnr.org
operative complication rates and intraoperative bleeding.9,30,31
Therefore, DSC-PWI may be helpful for both accurate preopera-
tive diagnosis of hemangioblastomas and postembolization
follow-up.
All 3 MR imaging parameters were significant for contrast-
enhancing tumoral regions to differentiate hemangioblastomas
from brain metastases. However, from the ROC analysis, the sen-
sitivity, specificity, and accuracy levels were significantly higher
for diffusion parameters (accuracy for rADC, 96.08%) than for
perfusion parameters (accuracy for rCBVmax, 70.59%). In addi-
tion, there was moderate overlap of the rCBVmax parameter for
differentiating hemangioblastomas and brain metastases, with a
specificity of only 53.33%. Thus, this study indicated that rADC is
a robust parameter with high sensitivity (95.24%) and specificity
(96.67%), which may be helpful in differentiating hemangioblas-
tomas from brain metastases. As a part of a multiparametric MR
imaging protocol, MR spectroscopy may allow further character-
ization of intracranial tumor by providing metabolic information
about the tumor tissue.32,33 It has been widely reported that Cho
levels correlate with the degree of malignancy in brain tumor and
are linearly correlated with cell density.33 To our knowledge, no
study has evaluated the ability of MR spectroscopy in the differ-
entiation of hemangioblastomas from brain metastases.
There are some limitations to our study. The most significant
one was its retrospective nature, which may have led to bias in case
selection. Another potential limitation was that the number of the
metastatic tumors originating from primary sites other than lung
were few. Further prospective studies with a larger number of
metastatic tumors are required. Third, we could not exclude the
presence of tiny intratumoral hemorrhage within lesions that may
result in susceptibility blooming, and in turn interfere with DWI
and PWI evaluation, though there was no obvious evidence of
hemorrhage on conventional MR imaging and DWI. It is also
recognized that the lack of a susceptibility sequence in the MR
imaging protocol was also a limitation because that would have
been helpful in excluding hemorrhagic metastasis.
CONCLUSIONSThis study demonstrates that DWI and DSC-PWI MR imaging
measurements in the contrast-enhancing tumoral region allow
differentiation of hemangioblastomas from brain metastases. On
DWI, higher rADC and ADCmin values in hemangioblastomas
than in the brain metastases were the most consistent finding in
our study. Therefore, DWI appears to be an efficient MR imaging
technique for the possible differentiation of hemangioblastomas
from brain metastases.
REFERENCES1. Louis DN, Ohgaki H, Wiestler OD, et al. The 2007 WHO classifica-
tion of tumours of the central nervous system. Acta Neuropathol2007;114:97–109 CrossRef Medline
2. Young S, Richardson AE. Solid haemangioblastomas of the poste-rior fossa: radiological features and results of surgery. J Neurol Neu-rosurg Psychiatry 1987;50:155–58 CrossRef Medline
3. Yoshida S, Takahashi H. Cerebellar metastases in patients with can-cer. Surg Neurol 2009;71:184 – 87; discussion 187 CrossRef Medline
4. Kanner AA, Suh JH, Siomin VE, et al. Posterior fossa metastases:aggressive treatment improves survival. Stereotact Funct Neurosurg2003;81:18 –23 CrossRef Medline
5. Alexandru D, Bota DA, Linskey ME. Epidemiology of central ner-vous system metastases. Prog Neurol Surg 2012;25:13–29 CrossRefMedline
6. Brundl E, Schodel P, Ullrich OW, et al. Surgical resection of sporadicand hereditary hemangioblastoma: our 10-year experience and aliterature review. Surg Neurol Int 2014;5:138 CrossRef Medline
7. Tabei Y, Miyamoto S, Suzuki I. Multidisciplinary approach to man-agement of patients with brain metastases [in Japanese]. Gan ToKagaku Ryoho 2013;40:1288 –94 Medline
8. Le Reste PJ, Henaux PL, Morandi X, et al. Sporadic intracranialhaemangioblastomas: surgical outcome in a single institutionseries. Acta Neurochir (Wien) 2013;155:1003– 09; discussion 1009CrossRef Medline
9. Sakamoto N, Ishikawa E, Nakai Y, et al. Preoperative endovascularembolization for hemangioblastoma in the posterior fossa. NeurolMed Chir (Tokyo) 2012;52:878 – 84 CrossRef Medline
10. Schaefer PW, Grant PE, Gonzalez RG. Diffusion-weighted MR im-aging of the brain. Radiology 2000;217:331– 45 CrossRef Medline
11. Kang Y, Choi SH, Kim YJ, et al. Gliomas: histogram analysis of ap-parent diffusion coefficient maps with standard- or high-b-valuediffusion-weighted MR imaging– correlation with tumor grade.Radiology 2011;261:882–90 CrossRef Medline
12. Quadery FA, Okamoto K. Diffusion-weighted MRI of haemangio-blastomas and other cerebellar tumours. Neuroradiology 2003;45:212–19 Medline
13. Kickingereder P, Wiestler B, Sahm F, et al. Primary central nervoussystem lymphoma and atypical glioblastoma: multiparametric dif-ferentiation by using diffusion-, perfusion-, and susceptibility-weighted MR imaging. Radiology 2014;272:843–50 CrossRef Medline
14. Guzman-De-Villoria JA, Mateos-Perez JM, Fernandez-García P, et al.Added value of advanced over conventional magnetic resonanceimaging in grading gliomas and other primary brain tumors. Can-cer Imaging 2014;14:35 CrossRef Medline
15. Ho CY, Cardinal JS, Kamer AP, et al. Relative cerebral blood volumefrom dynamic susceptibility contrast perfusion in the grading ofpediatric primary brain tumors. Neuroradiology 2015;57:299 –306CrossRef Medline
16. Kumar VA, Knopp EA, Zagzag D. Magnetic resonance dynamic sus-ceptibility-weighted contrast-enhanced perfusion imaging in thediagnosis of posterior fossa hemangioblastomas and pilocyticastrocytomas: initial results. J Comput Assist Tomogr 2010;34:825–29CrossRef Medline
17. She DJ, Xing Z, Zeng Z, et al. Differentiation of hemangioblastomasfrom pilocytic astrocytomas using 3-T magnetic resonance perfu-sion-weighted imaging and MR spectroscopy. Neuroradiology 2015;57:275– 81 CrossRef Medline
18. Hakyemez B, Erdogan C, Bolca N, et al. Evaluation of different cere-bral mass lesions by perfusion-weighted MR imaging. J Magn ResonImaging 2006;24:817–24 CrossRef Medline
19. Wetzel SG, Cha S, Johnson G, et al. Relative cerebral blood volumemeasurements in intracranial mass lesions: interobserver andintraobserver reproducibility study. Radiology 2002;224:797– 803CrossRef Medline
20. Cuccurullo L, Prudente ME, Maffia S, et al. An ultrastructural studyof the histogenesis of haemangioblastoma. Pathologica 2009;101:1–5 Medline
21. Guo AC, Cummings TJ, Dash RC, et al. Lymphomas and high-gradeastrocytomas: comparison of water diffusibility and histologiccharacteristics. Radiology 2002;224:177– 83 CrossRef Medline
22. Barajas RF Jr, Rubenstein JL, Chang JS, et al. Diffusion-weighted MRimaging derived apparent diffusion coefficient is predictive of clin-ical outcome in primary central nervous system lymphoma. AJNRAm J Neuroradiol 2010;31:60 – 66 CrossRef Medline
23. Hayashida Y, Hirai T, Morishita S, et al. Diffusion-weighted imagingof metastatic brain tumors: comparison with histologic type andtumor cellularity. AJNR Am J Neuroradiol 2006;27:1419 –25 Medline
24. Jain R, Gutierrez J, Narang J, et al. In vivo correlation of tumor bloodvolume and permeability with histologic and molecular angiogenic
AJNR Am J Neuroradiol 37:1844 –50 Oct 2016 www.ajnr.org 1849
markers in gliomas. AJNR Am J Neuroradiol 2011;32:388 –94CrossRef Medline
25. Maia AC Jr, Malheiros SM, da Rocha AJ, et al. MR cerebral bloodvolume maps correlated with vascular endothelial growth factorexpression and tumor grade in nonenhancing gliomas. AJNR Am JNeuroradiol 2005;26:777– 83 Medline
26. Bing F, Kremer S, Lamalle L, et al. Value of perfusion MRI in thestudy of pilocytic astrocytoma and hemangioblastoma: prelimi-nary findings [in French]. J Neuroradiol 2009;36:82– 87 CrossRefMedline
27. Hussein MR. Central nervous system capillary haemangio-blastoma: the pathologist’s viewpoint. Int J Exp Pathol 2007;88:311–24 CrossRef Medline
28. Tsougos I, Svolos P, Kousi E, et al. Differentiation of glioblastomamultiforme from metastatic brain tumor using proton magneticresonance spectroscopy, diffusion and perfusion metrics at 3 T.Cancer Imaging 2012;12:423–36 CrossRef Medline
29. Gaudino S, Di Lella GM, Russo R, et al. Magnetic resonance imagingof solitary brain metastases: main findings of nonmorphologicalsequences. Radiol Med 2012;117:1225– 41 CrossRef Medline
30. Biondi A, Ricciardi GK, Faillot T, et al. Hemangioblastomas of thelower spinal region: report of four cases with preoperative emboli-zation and review of the literature. AJNR Am J Neuroradiol 2005;26:936 – 45 Medline
31. Chu BC, Terae S, Hida K, et al. MR findings in spinalhemangioblastoma: correlation with symptoms and with angio-graphic and surgical findings. AJNR Am J Neuroradiol 2001;22:206 –17 Medline
32. Horska A, Barker PB. Imaging of brain tumors: MR spectroscopyand metabolic imaging. Neuroimaging Clin N Am 2010;20:293–310CrossRef Medline
33. Brandao LA, Castillo M. Adult brain tumors: clinical applications ofmagnetic resonance spectroscopy. Neuroimaging Clin N Am 2013;23:527–55 CrossRef Medline
1850 She Oct 2016 www.ajnr.org
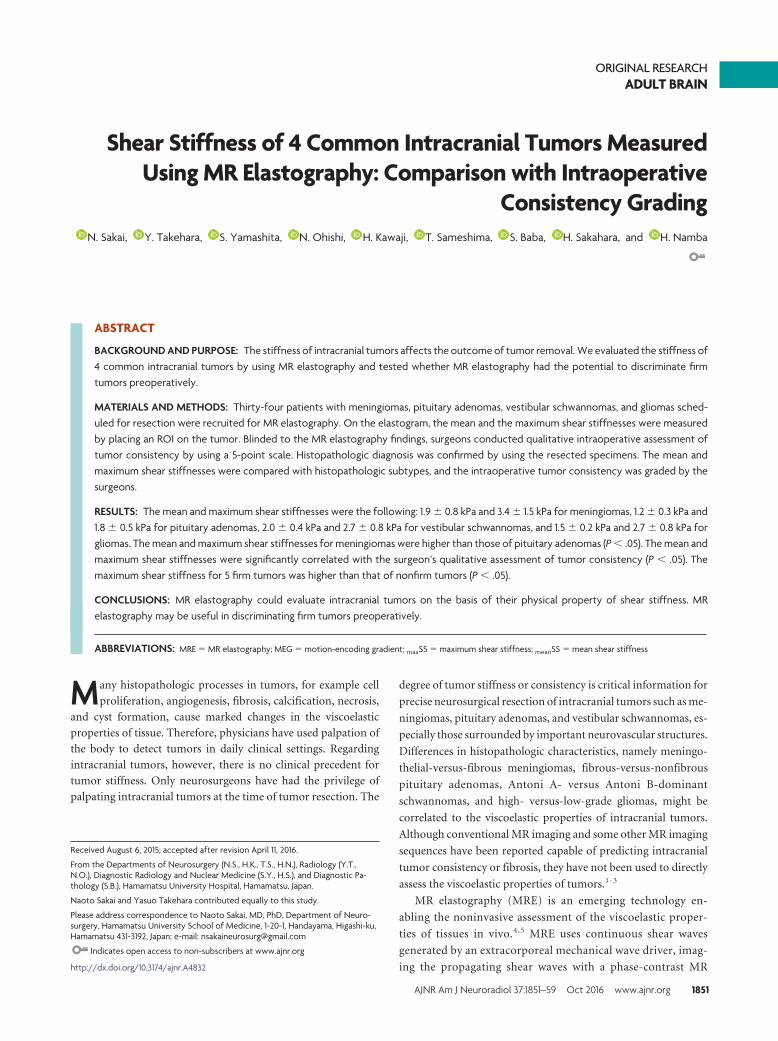
ORIGINAL RESEARCHADULT BRAIN
Shear Stiffness of 4 Common Intracranial Tumors MeasuredUsing MR Elastography: Comparison with Intraoperative
Consistency GradingX N. Sakai, X Y. Takehara, X S. Yamashita, X N. Ohishi, X H. Kawaji, X T. Sameshima, X S. Baba, X H. Sakahara, and X H. Namba
ABSTRACT
BACKGROUND AND PURPOSE: The stiffness of intracranial tumors affects the outcome of tumor removal. We evaluated the stiffness of4 common intracranial tumors by using MR elastography and tested whether MR elastography had the potential to discriminate firmtumors preoperatively.
MATERIALS AND METHODS: Thirty-four patients with meningiomas, pituitary adenomas, vestibular schwannomas, and gliomas sched-uled for resection were recruited for MR elastography. On the elastogram, the mean and the maximum shear stiffnesses were measuredby placing an ROI on the tumor. Blinded to the MR elastography findings, surgeons conducted qualitative intraoperative assessment oftumor consistency by using a 5-point scale. Histopathologic diagnosis was confirmed by using the resected specimens. The mean andmaximum shear stiffnesses were compared with histopathologic subtypes, and the intraoperative tumor consistency was graded by thesurgeons.
RESULTS: The mean and maximum shear stiffnesses were the following: 1.9 � 0.8 kPa and 3.4 � 1.5 kPa for meningiomas, 1.2 � 0.3 kPa and1.8 � 0.5 kPa for pituitary adenomas, 2.0 � 0.4 kPa and 2.7 � 0.8 kPa for vestibular schwannomas, and 1.5 � 0.2 kPa and 2.7 � 0.8 kPa forgliomas. The mean and maximum shear stiffnesses for meningiomas were higher than those of pituitary adenomas (P � .05). The mean andmaximum shear stiffnesses were significantly correlated with the surgeon’s qualitative assessment of tumor consistency (P � .05). Themaximum shear stiffness for 5 firm tumors was higher than that of nonfirm tumors (P � .05).
CONCLUSIONS: MR elastography could evaluate intracranial tumors on the basis of their physical property of shear stiffness. MRelastography may be useful in discriminating firm tumors preoperatively.
ABBREVIATIONS: MRE � MR elastography; MEG � motion-encoding gradient; maxSS � maximum shear stiffness; meanSS � mean shear stiffness
Many histopathologic processes in tumors, for example cell
proliferation, angiogenesis, fibrosis, calcification, necrosis,
and cyst formation, cause marked changes in the viscoelastic
properties of tissue. Therefore, physicians have used palpation of
the body to detect tumors in daily clinical settings. Regarding
intracranial tumors, however, there is no clinical precedent for
tumor stiffness. Only neurosurgeons have had the privilege of
palpating intracranial tumors at the time of tumor resection. The
degree of tumor stiffness or consistency is critical information for
precise neurosurgical resection of intracranial tumors such as me-
ningiomas, pituitary adenomas, and vestibular schwannomas, es-
pecially those surrounded by important neurovascular structures.
Differences in histopathologic characteristics, namely meningo-
thelial-versus-fibrous meningiomas, fibrous-versus-nonfibrous
pituitary adenomas, Antoni A- versus Antoni B-dominant
schwannomas, and high- versus-low-grade gliomas, might be
correlated to the viscoelastic properties of intracranial tumors.
Although conventional MR imaging and some other MR imaging
sequences have been reported capable of predicting intracranial
tumor consistency or fibrosis, they have not been used to directly
assess the viscoelastic properties of tumors.1-3
MR elastography (MRE) is an emerging technology en-
abling the noninvasive assessment of the viscoelastic proper-
ties of tissues in vivo.4,5 MRE uses continuous shear waves
generated by an extracorporeal mechanical wave driver, imag-
ing the propagating shear waves with a phase-contrast MR
Received August 6, 2015; accepted after revision April 11, 2016.
From the Departments of Neurosurgery (N.S., H.K., T.S., H.N.), Radiology (Y.T.,N.O.), Diagnostic Radiology and Nuclear Medicine (S.Y., H.S.), and Diagnostic Pa-thology (S.B.), Hamamatsu University Hospital, Hamamatsu, Japan.
Naoto Sakai and Yasuo Takehara contributed equally to this study.
Please address correspondence to Naoto Sakai, MD, PhD, Department of Neuro-surgery, Hamamatsu University School of Medicine, 1-20-1, Handayama, Higashi-ku,Hamamatsu 431-3192, Japan; e-mail: [email protected]
Indicates open access to non-subscribers at www.ajnr.org
http://dx.doi.org/10.3174/ajnr.A4832
AJNR Am J Neuroradiol 37:1851–59 Oct 2016 www.ajnr.org 1851
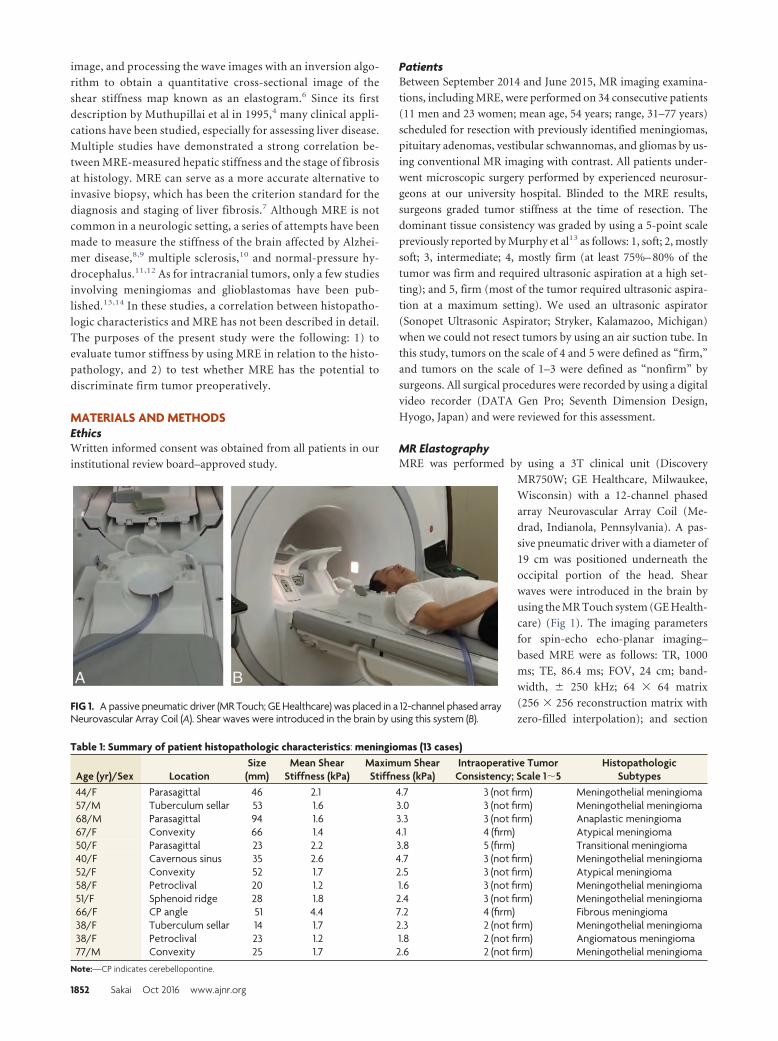
image, and processing the wave images with an inversion algo-
rithm to obtain a quantitative cross-sectional image of the
shear stiffness map known as an elastogram.6 Since its first
description by Muthupillai et al in 1995,4 many clinical appli-
cations have been studied, especially for assessing liver disease.
Multiple studies have demonstrated a strong correlation be-
tween MRE-measured hepatic stiffness and the stage of fibrosis
at histology. MRE can serve as a more accurate alternative to
invasive biopsy, which has been the criterion standard for the
diagnosis and staging of liver fibrosis.7 Although MRE is not
common in a neurologic setting, a series of attempts have been
made to measure the stiffness of the brain affected by Alzhei-
mer disease,8,9 multiple sclerosis,10 and normal-pressure hy-
drocephalus.11,12 As for intracranial tumors, only a few studies
involving meningiomas and glioblastomas have been pub-
lished.13,14 In these studies, a correlation between histopatho-
logic characteristics and MRE has not been described in detail.
The purposes of the present study were the following: 1) to
evaluate tumor stiffness by using MRE in relation to the histo-
pathology, and 2) to test whether MRE has the potential to
discriminate firm tumor preoperatively.
MATERIALS AND METHODSEthicsWritten informed consent was obtained from all patients in our
institutional review board–approved study.
PatientsBetween September 2014 and June 2015, MR imaging examina-
tions, including MRE, were performed on 34 consecutive patients
(11 men and 23 women; mean age, 54 years; range, 31–77 years)
scheduled for resection with previously identified meningiomas,
pituitary adenomas, vestibular schwannomas, and gliomas by us-
ing conventional MR imaging with contrast. All patients under-
went microscopic surgery performed by experienced neurosur-
geons at our university hospital. Blinded to the MRE results,
surgeons graded tumor stiffness at the time of resection. The
dominant tissue consistency was graded by using a 5-point scale
previously reported by Murphy et al13 as follows: 1, soft; 2, mostly
soft; 3, intermediate; 4, mostly firm (at least 75%– 80% of the
tumor was firm and required ultrasonic aspiration at a high set-
ting); and 5, firm (most of the tumor required ultrasonic aspira-
tion at a maximum setting). We used an ultrasonic aspirator
(Sonopet Ultrasonic Aspirator; Stryker, Kalamazoo, Michigan)
when we could not resect tumors by using an air suction tube. In
this study, tumors on the scale of 4 and 5 were defined as “firm,”
and tumors on the scale of 1–3 were defined as “nonfirm” by
surgeons. All surgical procedures were recorded by using a digital
video recorder (DATA Gen Pro; Seventh Dimension Design,
Hyogo, Japan) and were reviewed for this assessment.
MR ElastographyMRE was performed by using a 3T clinical unit (Discovery
MR750W; GE Healthcare, Milwaukee,
Wisconsin) with a 12-channel phased
array Neurovascular Array Coil (Me-
drad, Indianola, Pennsylvania). A pas-
sive pneumatic driver with a diameter of
19 cm was positioned underneath the
occipital portion of the head. Shear
waves were introduced in the brain by
using the MR Touch system (GE Health-
care) (Fig 1). The imaging parameters
for spin-echo echo-planar imaging–
based MRE were as follows: TR, 1000
ms; TE, 86.4 ms; FOV, 24 cm; band-
width, � 250 kHz; 64 � 64 matrix
(256 � 256 reconstruction matrix with
zero-filled interpolation); and sectionFIG 1. A passive pneumatic driver (MR Touch; GE Healthcare) was placed in a 12-channel phased arrayNeurovascular Array Coil (A). Shear waves were introduced in the brain by using this system (B).
Table 1: Summary of patient histopathologic characteristics: meningiomas (13 cases)
Age (yr)/Sex LocationSize
(mm)Mean Shear
Stiffness (kPa)Maximum ShearStiffness (kPa)
Intraoperative TumorConsistency; Scale 1�5
HistopathologicSubtypes
44/F Parasagittal 46 2.1 4.7 3 (not firm) Meningothelial meningioma57/M Tuberculum sellar 53 1.6 3.0 3 (not firm) Meningothelial meningioma68/M Parasagittal 94 1.6 3.3 3 (not firm) Anaplastic meningioma67/F Convexity 66 1.4 4.1 4 (firm) Atypical meningioma50/F Parasagittal 23 2.2 3.8 5 (firm) Transitional meningioma40/F Cavernous sinus 35 2.6 4.7 3 (not firm) Meningothelial meningioma52/F Convexity 52 1.7 2.5 3 (not firm) Atypical meningioma58/F Petroclival 20 1.2 1.6 3 (not firm) Meningothelial meningioma51/F Sphenoid ridge 28 1.8 2.4 3 (not firm) Meningothelial meningioma66/F CP angle 51 4.4 7.2 4 (firm) Fibrous meningioma38/F Tuberculum sellar 14 1.7 2.3 2 (not firm) Meningothelial meningioma38/F Petroclival 23 1.2 1.8 2 (not firm) Angiomatous meningioma77/M Convexity 25 1.7 2.6 2 (not firm) Meningothelial meningioma
Note:—CP indicates cerebellopontine.
1852 Sakai Oct 2016 www.ajnr.org
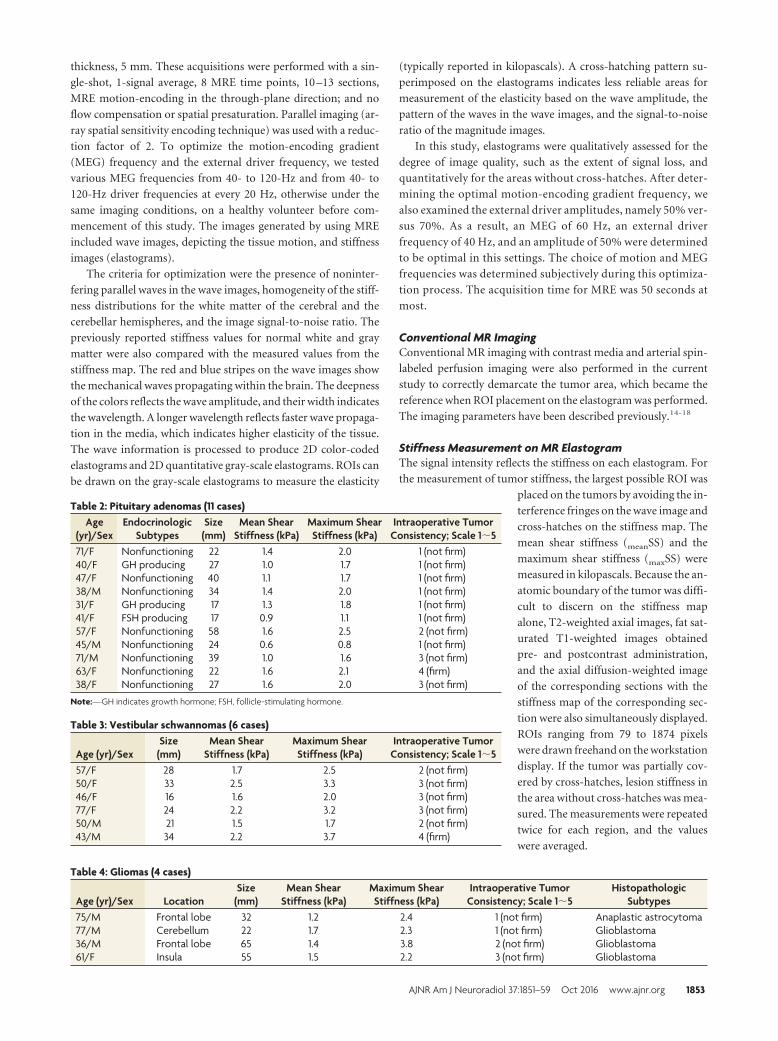
thickness, 5 mm. These acquisitions were performed with a sin-
gle-shot, 1-signal average, 8 MRE time points, 10 –13 sections,
MRE motion-encoding in the through-plane direction; and no
flow compensation or spatial presaturation. Parallel imaging (ar-
ray spatial sensitivity encoding technique) was used with a reduc-
tion factor of 2. To optimize the motion-encoding gradient
(MEG) frequency and the external driver frequency, we tested
various MEG frequencies from 40- to 120-Hz and from 40- to
120-Hz driver frequencies at every 20 Hz, otherwise under the
same imaging conditions, on a healthy volunteer before com-
mencement of this study. The images generated by using MRE
included wave images, depicting the tissue motion, and stiffness
images (elastograms).
The criteria for optimization were the presence of noninter-
fering parallel waves in the wave images, homogeneity of the stiff-
ness distributions for the white matter of the cerebral and the
cerebellar hemispheres, and the image signal-to-noise ratio. The
previously reported stiffness values for normal white and gray
matter were also compared with the measured values from the
stiffness map. The red and blue stripes on the wave images show
the mechanical waves propagating within the brain. The deepness
of the colors reflects the wave amplitude, and their width indicates
the wavelength. A longer wavelength reflects faster wave propaga-
tion in the media, which indicates higher elasticity of the tissue.
The wave information is processed to produce 2D color-coded
elastograms and 2D quantitative gray-scale elastograms. ROIs can
be drawn on the gray-scale elastograms to measure the elasticity
(typically reported in kilopascals). A cross-hatching pattern su-
perimposed on the elastograms indicates less reliable areas for
measurement of the elasticity based on the wave amplitude, the
pattern of the waves in the wave images, and the signal-to-noise
ratio of the magnitude images.
In this study, elastograms were qualitatively assessed for the
degree of image quality, such as the extent of signal loss, and
quantitatively for the areas without cross-hatches. After deter-
mining the optimal motion-encoding gradient frequency, we
also examined the external driver amplitudes, namely 50% ver-
sus 70%. As a result, an MEG of 60 Hz, an external driver
frequency of 40 Hz, and an amplitude of 50% were determined
to be optimal in this settings. The choice of motion and MEG
frequencies was determined subjectively during this optimiza-
tion process. The acquisition time for MRE was 50 seconds at
most.
Conventional MR ImagingConventional MR imaging with contrast media and arterial spin-
labeled perfusion imaging were also performed in the current
study to correctly demarcate the tumor area, which became the
reference when ROI placement on the elastogram was performed.
The imaging parameters have been described previously.14-18
Stiffness Measurement on MR ElastogramThe signal intensity reflects the stiffness on each elastogram. For
the measurement of tumor stiffness, the largest possible ROI was
placed on the tumors by avoiding the in-
terference fringes on the wave image and
cross-hatches on the stiffness map. The
mean shear stiffness (meanSS) and the
maximum shear stiffness (maxSS) were
measured in kilopascals. Because the an-
atomic boundary of the tumor was diffi-
cult to discern on the stiffness map
alone, T2-weighted axial images, fat sat-
urated T1-weighted images obtained
pre- and postcontrast administration,
and the axial diffusion-weighted image
of the corresponding sections with the
stiffness map of the corresponding sec-
tion were also simultaneously displayed.
ROIs ranging from 79 to 1874 pixels
were drawn freehand on the workstation
display. If the tumor was partially cov-
ered by cross-hatches, lesion stiffness in
the area without cross-hatches was mea-
sured. The measurements were repeated
twice for each region, and the values
were averaged.
Table 2: Pituitary adenomas (11 cases)Age
(yr)/SexEndocrinologic
SubtypesSize
(mm)Mean Shear
Stiffness (kPa)Maximum ShearStiffness (kPa)
Intraoperative TumorConsistency; Scale 1�5
71/F Nonfunctioning 22 1.4 2.0 1 (not firm)40/F GH producing 27 1.0 1.7 1 (not firm)47/F Nonfunctioning 40 1.1 1.7 1 (not firm)38/M Nonfunctioning 34 1.4 2.0 1 (not firm)31/F GH producing 17 1.3 1.8 1 (not firm)41/F FSH producing 17 0.9 1.1 1 (not firm)57/F Nonfunctioning 58 1.6 2.5 2 (not firm)45/M Nonfunctioning 24 0.6 0.8 1 (not firm)71/M Nonfunctioning 39 1.0 1.6 3 (not firm)63/F Nonfunctioning 22 1.6 2.1 4 (firm)38/F Nonfunctioning 27 1.6 2.0 3 (not firm)
Note:—GH indicates growth hormone; FSH, follicle-stimulating hormone.
Table 3: Vestibular schwannomas (6 cases)
Age (yr)/SexSize
(mm)Mean Shear
Stiffness (kPa)Maximum ShearStiffness (kPa)
Intraoperative TumorConsistency; Scale 1�5
57/F 28 1.7 2.5 2 (not firm)50/F 33 2.5 3.3 3 (not firm)46/F 16 1.6 2.0 3 (not firm)77/F 24 2.2 3.2 3 (not firm)50/M 21 1.5 1.7 2 (not firm)43/M 34 2.2 3.7 4 (firm)
Table 4: Gliomas (4 cases)
Age (yr)/Sex LocationSize
(mm)Mean Shear
Stiffness (kPa)Maximum ShearStiffness (kPa)
Intraoperative TumorConsistency; Scale 1�5
HistopathologicSubtypes
75/M Frontal lobe 32 1.2 2.4 1 (not firm) Anaplastic astrocytoma77/M Cerebellum 22 1.7 2.3 1 (not firm) Glioblastoma36/M Frontal lobe 65 1.4 3.8 2 (not firm) Glioblastoma61/F Insula 55 1.5 2.2 3 (not firm) Glioblastoma
AJNR Am J Neuroradiol 37:1851–59 Oct 2016 www.ajnr.org 1853
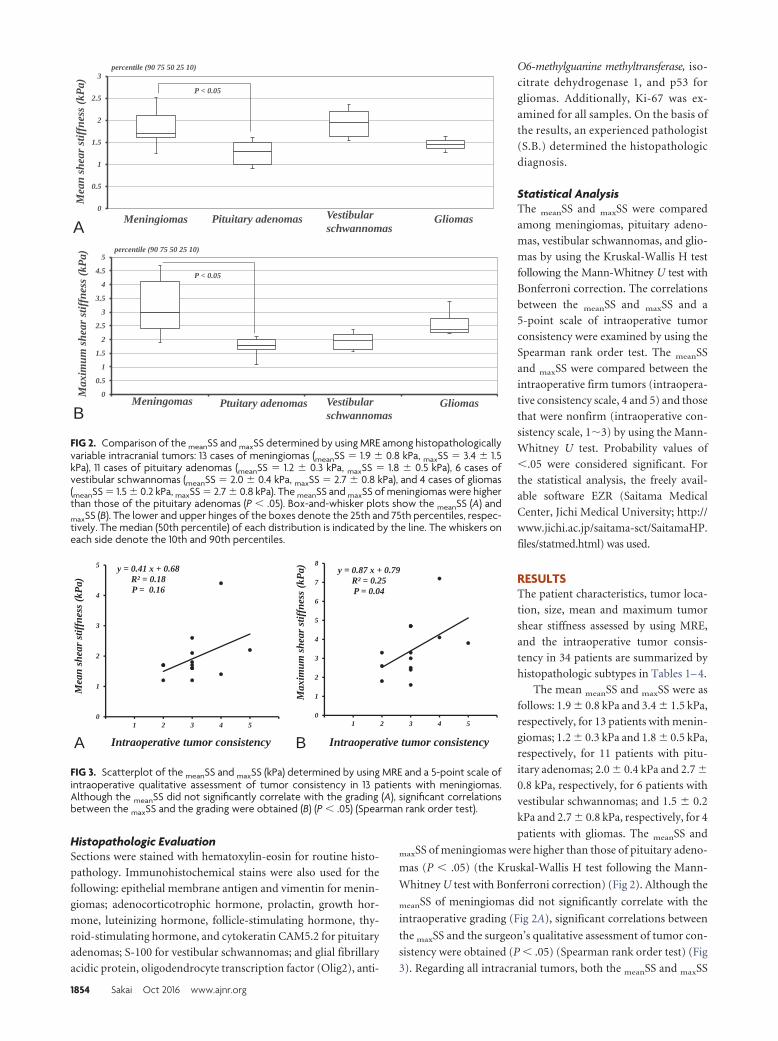
Histopathologic EvaluationSections were stained with hematoxylin-eosin for routine histo-
pathology. Immunohistochemical stains were also used for the
following: epithelial membrane antigen and vimentin for menin-
giomas; adenocorticotrophic hormone, prolactin, growth hor-
mone, luteinizing hormone, follicle-stimulating hormone, thy-
roid-stimulating hormone, and cytokeratin CAM5.2 for pituitary
adenomas; S-100 for vestibular schwannomas; and glial fibrillary
acidic protein, oligodendrocyte transcription factor (Olig2), anti-
O6-methylguanine methyltransferase, iso-
citrate dehydrogenase 1, and p53 for
gliomas. Additionally, Ki-67 was ex-
amined for all samples. On the basis of
the results, an experienced pathologist
(S.B.) determined the histopathologic
diagnosis.
Statistical AnalysisThe meanSS and maxSS were compared
among meningiomas, pituitary adeno-
mas, vestibular schwannomas, and glio-
mas by using the Kruskal-Wallis H test
following the Mann-Whitney U test with
Bonferroni correction. The correlations
between the meanSS and maxSS and a
5-point scale of intraoperative tumor
consistency were examined by using the
Spearman rank order test. The meanSS
and maxSS were compared between the
intraoperative firm tumors (intraopera-
tive consistency scale, 4 and 5) and those
that were nonfirm (intraoperative con-
sistency scale, 1�3) by using the Mann-
Whitney U test. Probability values of
�.05 were considered significant. For
the statistical analysis, the freely avail-
able software EZR (Saitama Medical
Center, Jichi Medical University; http://
www.jichi.ac.jp/saitama-sct/SaitamaHP.
files/statmed.html) was used.
RESULTSThe patient characteristics, tumor loca-
tion, size, mean and maximum tumor
shear stiffness assessed by using MRE,
and the intraoperative tumor consis-
tency in 34 patients are summarized by
histopathologic subtypes in Tables 1– 4.
The mean meanSS and maxSS were as
follows: 1.9 � 0.8 kPa and 3.4 � 1.5 kPa,
respectively, for 13 patients with menin-
giomas; 1.2 � 0.3 kPa and 1.8 � 0.5 kPa,
respectively, for 11 patients with pitu-
itary adenomas; 2.0 � 0.4 kPa and 2.7 �
0.8 kPa, respectively, for 6 patients with
vestibular schwannomas; and 1.5 � 0.2
kPa and 2.7 � 0.8 kPa, respectively, for 4
patients with gliomas. The meanSS and
maxSS of meningiomas were higher than those of pituitary adeno-
mas (P � .05) (the Kruskal-Wallis H test following the Mann-
Whitney U test with Bonferroni correction) (Fig 2). Although the
meanSS of meningiomas did not significantly correlate with the
intraoperative grading (Fig 2A), significant correlations between
the maxSS and the surgeon’s qualitative assessment of tumor con-
sistency were obtained (P � .05) (Spearman rank order test) (Fig
3). Regarding all intracranial tumors, both the meanSS and maxSS
0
0.5
1
1.5
2
2.5
3
0 0 0 0
percentile (90 75 50 25 10)
P < 0.05
0
0.5
1
1.5
2
2.5
3
3.5
4
4.5
5
0 0 0 0
percentile (90 75 50 25 10)
P < 0.05
Meningiomas Pituitary adenomas Vestibularschwannomas
Gliomas
Meningomas Ptuitary adenomas Vestibularschwannomas
Gliomas
Mea
n sh
ear s
tiffn
ess (
kPa)
M
axim
um sh
ear s
tiffn
ess (
kPa)
A
B
FIG 2. Comparison of the meanSS and maxSS determined by using MRE among histopathologicallyvariable intracranial tumors: 13 cases of meningiomas (meanSS � 1.9 � 0.8 kPa, maxSS � 3.4 � 1.5kPa), 11 cases of pituitary adenomas (meanSS � 1.2 � 0.3 kPa, maxSS � 1.8 � 0.5 kPa), 6 cases ofvestibular schwannomas (meanSS � 2.0 � 0.4 kPa, maxSS � 2.7 � 0.8 kPa), and 4 cases of gliomas(meanSS � 1.5 � 0.2 kPa, maxSS � 2.7 � 0.8 kPa). The meanSS and maxSS of meningiomas were higherthan those of the pituitary adenomas (P � .05). Box-and-whisker plots show the meanSS (A) andmaxSS (B). The lower and upper hinges of the boxes denote the 25th and 75th percentiles, respec-tively. The median (50th percentile) of each distribution is indicated by the line. The whiskers oneach side denote the 10th and 90th percentiles.
y = 0.87 x + 0.79 R² = 0.25 P = 0.04
0
1
2
3
4
5
6
7
8
1 2 3 4 5
y = 0.41 x + 0.68 R² = 0.18 P = 0.16
0
1
2
3
4
5
1 2 3 4 5
Mea
n sh
ear s
tiffn
ess (
kPa)
Intraoperative tumor consistency
Max
imum
shea
r stif
fnes
s (kP
a)
Intraoperative tumor consistencyA B
FIG 3. Scatterplot of the meanSS and maxSS (kPa) determined by using MRE and a 5-point scale ofintraoperative qualitative assessment of tumor consistency in 13 patients with meningiomas.Although the meanSS did not significantly correlate with the grading (A), significant correlationsbetween the maxSS and the grading were obtained (B) (P � .05) (Spearman rank order test).
1854 Sakai Oct 2016 www.ajnr.org
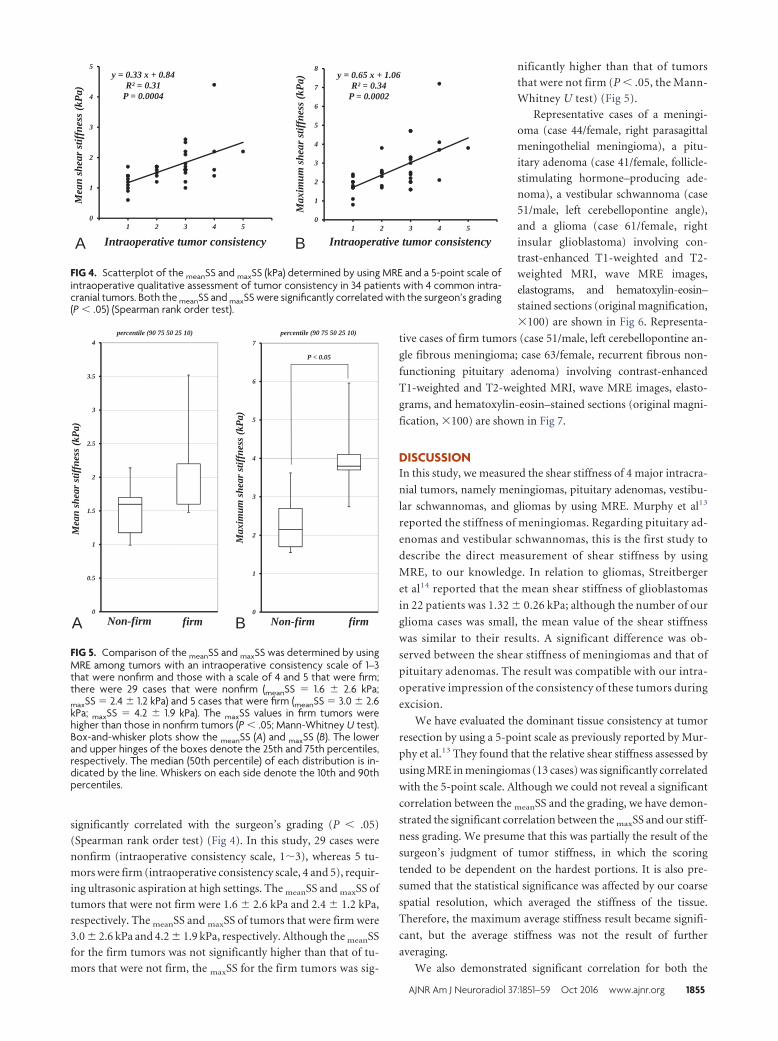
significantly correlated with the surgeon’s grading (P � .05)
(Spearman rank order test) (Fig 4). In this study, 29 cases were
nonfirm (intraoperative consistency scale, 1�3), whereas 5 tu-
mors were firm (intraoperative consistency scale, 4 and 5), requir-
ing ultrasonic aspiration at high settings. The meanSS and maxSS of
tumors that were not firm were 1.6 � 2.6 kPa and 2.4 � 1.2 kPa,
respectively. The meanSS and maxSS of tumors that were firm were
3.0 � 2.6 kPa and 4.2 � 1.9 kPa, respectively. Although the meanSS
for the firm tumors was not significantly higher than that of tu-
mors that were not firm, the maxSS for the firm tumors was sig-
nificantly higher than that of tumors
that were not firm (P � .05, the Mann-
Whitney U test) (Fig 5).
Representative cases of a meningi-
oma (case 44/female, right parasagittal
meningothelial meningioma), a pitu-
itary adenoma (case 41/female, follicle-
stimulating hormone–producing ade-
noma), a vestibular schwannoma (case
51/male, left cerebellopontine angle),
and a glioma (case 61/female, right
insular glioblastoma) involving con-
trast-enhanced T1-weighted and T2-
weighted MRI, wave MRE images,
elastograms, and hematoxylin-eosin–
stained sections (original magnification,
�100) are shown in Fig 6. Representa-
tive cases of firm tumors (case 51/male, left cerebellopontine an-
gle fibrous meningioma; case 63/female, recurrent fibrous non-
functioning pituitary adenoma) involving contrast-enhanced
T1-weighted and T2-weighted MRI, wave MRE images, elasto-
grams, and hematoxylin-eosin–stained sections (original magni-
fication, �100) are shown in Fig 7.
DISCUSSIONIn this study, we measured the shear stiffness of 4 major intracra-
nial tumors, namely meningiomas, pituitary adenomas, vestibu-
lar schwannomas, and gliomas by using MRE. Murphy et al13
reported the stiffness of meningiomas. Regarding pituitary ad-
enomas and vestibular schwannomas, this is the first study to
describe the direct measurement of shear stiffness by using
MRE, to our knowledge. In relation to gliomas, Streitberger
et al14 reported that the mean shear stiffness of glioblastomas
in 22 patients was 1.32 � 0.26 kPa; although the number of our
glioma cases was small, the mean value of the shear stiffness
was similar to their results. A significant difference was ob-
served between the shear stiffness of meningiomas and that of
pituitary adenomas. The result was compatible with our intra-
operative impression of the consistency of these tumors during
excision.
We have evaluated the dominant tissue consistency at tumor
resection by using a 5-point scale as previously reported by Mur-
phy et al.13 They found that the relative shear stiffness assessed by
using MRE in meningiomas (13 cases) was significantly correlated
with the 5-point scale. Although we could not reveal a significant
correlation between the meanSS and the grading, we have demon-
strated the significant correlation between the maxSS and our stiff-
ness grading. We presume that this was partially the result of the
surgeon’s judgment of tumor stiffness, in which the scoring
tended to be dependent on the hardest portions. It is also pre-
sumed that the statistical significance was affected by our coarse
spatial resolution, which averaged the stiffness of the tissue.
Therefore, the maximum average stiffness result became signifi-
cant, but the average stiffness was not the result of further
averaging.
We also demonstrated significant correlation for both the
y = 0.65 x + 1.06 R² = 0.34
P = 0.0002
0
1
2
3
4
5
6
7
8
1 2 3 4 5
Mea
n sh
ear s
tiffn
ess (
kPa)
Max
imum
shea
r stif
fnes
s (kP
a)
Intraoperative tumor consistency Intraoperative tumor consistency
y = 0.33 x + 0.84 R² = 0.31
P = 0.0004
0
1
2
3
4
5
1 2 3 4 5
A B
FIG 4. Scatterplot of the meanSS and maxSS (kPa) determined by using MRE and a 5-point scale ofintraoperative qualitative assessment of tumor consistency in 34 patients with 4 common intra-cranial tumors. Both the meanSS and maxSS were significantly correlated with the surgeon’s grading(P � .05) (Spearman rank order test).
0
0.5
1
1.5
2
2.5
3
3.5
4percentile (90 75 50 25 10)
0
1
2
3
4
5
6
7percentile (90 75 50 25 10)
Mea
n sh
ear s
tiffn
ess (
kPa)
Max
imum
shea
r stif
fnes
s (kP
a)
Non-firm firm firmNon-firm
P < 0.05
A B
FIG 5. Comparison of the meanSS and maxSS was determined by usingMRE among tumors with an intraoperative consistency scale of 1–3that were nonfirm and those with a scale of 4 and 5 that were firm;there were 29 cases that were nonfirm (meanSS � 1.6 � 2.6 kPa;maxSS � 2.4 � 1.2 kPa) and 5 cases that were firm (meanSS � 3.0 � 2.6kPa; maxSS � 4.2 � 1.9 kPa). The maxSS values in firm tumors werehigher than those in nonfirm tumors (P � .05; Mann-Whitney U test).Box-and-whisker plots show the meanSS (A) and maxSS (B). The lowerand upper hinges of the boxes denote the 25th and 75th percentiles,respectively. The median (50th percentile) of each distribution is in-dicated by the line. Whiskers on each side denote the 10th and 90thpercentiles.
AJNR Am J Neuroradiol 37:1851–59 Oct 2016 www.ajnr.org 1855
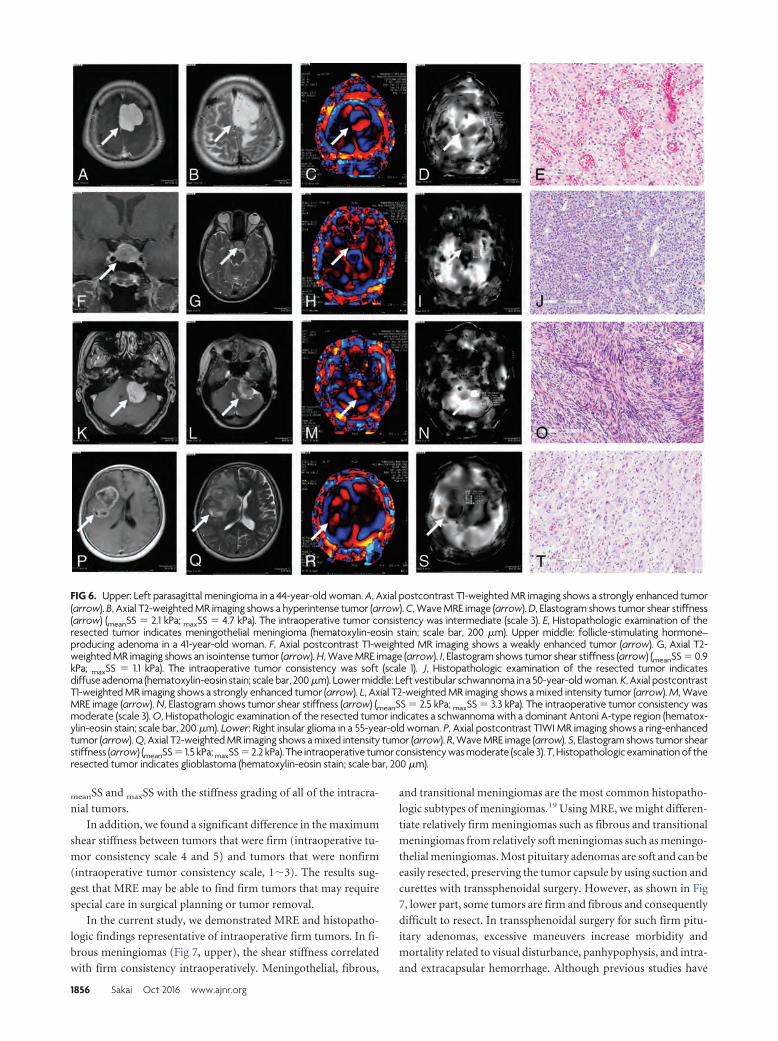
meanSS and maxSS with the stiffness grading of all of the intracra-
nial tumors.
In addition, we found a significant difference in the maximum
shear stiffness between tumors that were firm (intraoperative tu-
mor consistency scale 4 and 5) and tumors that were nonfirm
(intraoperative tumor consistency scale, 1�3). The results sug-
gest that MRE may be able to find firm tumors that may require
special care in surgical planning or tumor removal.
In the current study, we demonstrated MRE and histopatho-
logic findings representative of intraoperative firm tumors. In fi-
brous meningiomas (Fig 7, upper), the shear stiffness correlated
with firm consistency intraoperatively. Meningothelial, fibrous,
and transitional meningiomas are the most common histopatho-
logic subtypes of meningiomas.19 Using MRE, we might differen-
tiate relatively firm meningiomas such as fibrous and transitional
meningiomas from relatively soft meningiomas such as meningo-
thelial meningiomas. Most pituitary adenomas are soft and can be
easily resected, preserving the tumor capsule by using suction and
curettes with transsphenoidal surgery. However, as shown in Fig
7, lower part, some tumors are firm and fibrous and consequently
difficult to resect. In transsphenoidal surgery for such firm pitu-
itary adenomas, excessive maneuvers increase morbidity and
mortality related to visual disturbance, panhypophysis, and intra-
and extracapsular hemorrhage. Although previous studies have
FIG 6. Upper: Left parasagittal meningioma in a 44-year-old woman. A, Axial postcontrast T1-weighted MR imaging shows a strongly enhanced tumor(arrow). B, Axial T2-weighted MR imaging shows a hyperintense tumor (arrow). C, Wave MRE image (arrow). D, Elastogram shows tumor shear stiffness(arrow) (meanSS � 2.1 kPa; maxSS � 4.7 kPa). The intraoperative tumor consistency was intermediate (scale 3). E, Histopathologic examination of theresected tumor indicates meningothelial meningioma (hematoxylin-eosin stain; scale bar, 200 �m). Upper middle: follicle-stimulating hormone–producing adenoma in a 41-year-old woman. F, Axial postcontrast T1-weighted MR imaging shows a weakly enhanced tumor (arrow). G, Axial T2-weighted MR imaging shows an isointense tumor (arrow). H, Wave MRE image (arrow). I, Elastogram shows tumor shear stiffness (arrow) (meanSS � 0.9kPa; maxSS � 1.1 kPa). The intraoperative tumor consistency was soft (scale 1). J, Histopathologic examination of the resected tumor indicatesdiffuse adenoma (hematoxylin-eosin stain; scale bar, 200 �m). Lower middle: Left vestibular schwannoma in a 50-year-old woman. K, Axial postcontrastT1-weighted MR imaging shows a strongly enhanced tumor (arrow). L, Axial T2-weighted MR imaging shows a mixed intensity tumor (arrow). M, WaveMRE image (arrow). N, Elastogram shows tumor shear stiffness (arrow) (meanSS � 2.5 kPa; maxSS � 3.3 kPa). The intraoperative tumor consistency wasmoderate (scale 3). O, Histopathologic examination of the resected tumor indicates a schwannoma with a dominant Antoni A-type region (hematox-ylin-eosin stain; scale bar, 200 �m). Lower: Right insular glioma in a 55-year-old woman. P, Axial postcontrast T1WI MR imaging shows a ring-enhancedtumor (arrow). Q, Axial T2-weighted MR imaging shows a mixed intensity tumor (arrow). R, Wave MRE image (arrow). S, Elastogram shows tumor shearstiffness (arrow) (meanSS � 1.5 kPa; maxSS � 2.2 kPa). The intraoperative tumor consistency was moderate (scale 3). T, Histopathologic examination of theresected tumor indicates glioblastoma (hematoxylin-eosin stain; scale bar, 200 �m).
1856 Sakai Oct 2016 www.ajnr.org
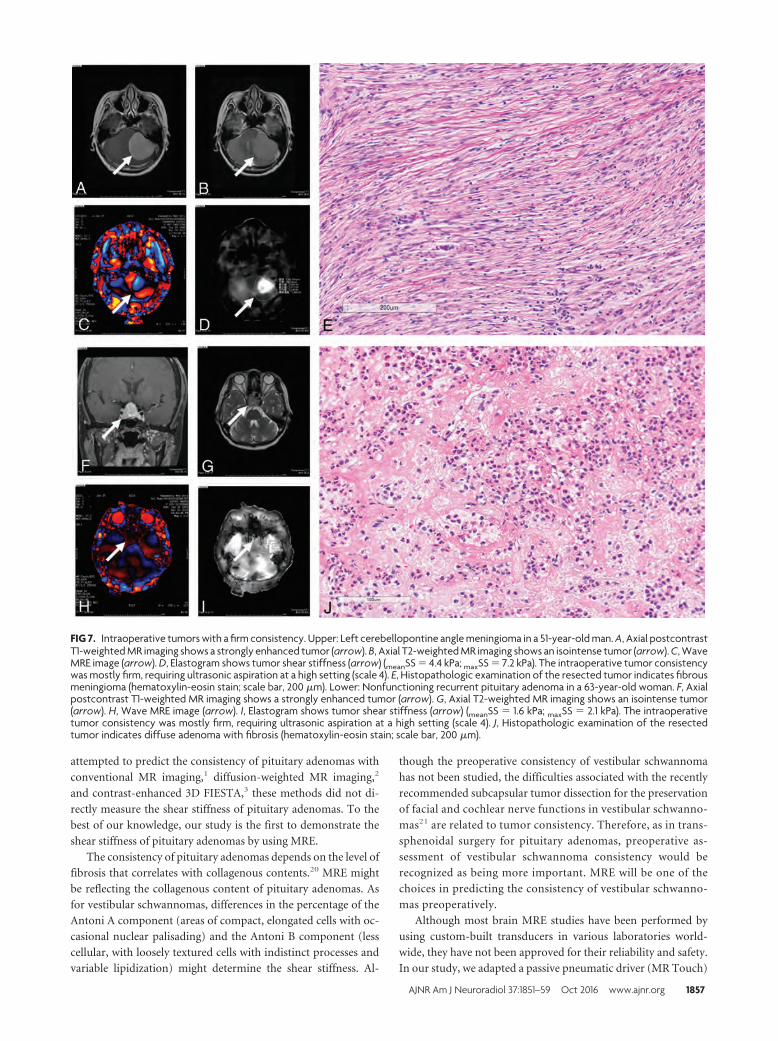
attempted to predict the consistency of pituitary adenomas with
conventional MR imaging,1 diffusion-weighted MR imaging,2
and contrast-enhanced 3D FIESTA,3 these methods did not di-
rectly measure the shear stiffness of pituitary adenomas. To the
best of our knowledge, our study is the first to demonstrate the
shear stiffness of pituitary adenomas by using MRE.
The consistency of pituitary adenomas depends on the level of
fibrosis that correlates with collagenous contents.20 MRE mightbe reflecting the collagenous content of pituitary adenomas. As
for vestibular schwannomas, differences in the percentage of the
Antoni A component (areas of compact, elongated cells with oc-
casional nuclear palisading) and the Antoni B component (less
cellular, with loosely textured cells with indistinct processes and
variable lipidization) might determine the shear stiffness. Al-
though the preoperative consistency of vestibular schwannoma
has not been studied, the difficulties associated with the recently
recommended subcapsular tumor dissection for the preservation
of facial and cochlear nerve functions in vestibular schwanno-
mas21 are related to tumor consistency. Therefore, as in trans-
sphenoidal surgery for pituitary adenomas, preoperative as-
sessment of vestibular schwannoma consistency would be
recognized as being more important. MRE will be one of the
choices in predicting the consistency of vestibular schwanno-
mas preoperatively.
Although most brain MRE studies have been performed by
using custom-built transducers in various laboratories world-
wide, they have not been approved for their reliability and safety.
In our study, we adapted a passive pneumatic driver (MR Touch)
FIG 7. Intraoperative tumors with a firm consistency. Upper: Left cerebellopontine angle meningioma in a 51-year-old man. A, Axial postcontrastT1-weighted MR imaging shows a strongly enhanced tumor (arrow). B, Axial T2-weighted MR imaging shows an isointense tumor (arrow). C, WaveMRE image (arrow). D, Elastogram shows tumor shear stiffness (arrow) (meanSS � 4.4 kPa; maxSS � 7.2 kPa). The intraoperative tumor consistencywas mostly firm, requiring ultrasonic aspiration at a high setting (scale 4). E, Histopathologic examination of the resected tumor indicates fibrousmeningioma (hematoxylin-eosin stain; scale bar, 200 �m). Lower: Nonfunctioning recurrent pituitary adenoma in a 63-year-old woman. F, Axialpostcontrast T1-weighted MR imaging shows a strongly enhanced tumor (arrow). G, Axial T2-weighted MR imaging shows an isointense tumor(arrow). H, Wave MRE image (arrow). I, Elastogram shows tumor shear stiffness (arrow) (meanSS � 1.6 kPa; maxSS � 2.1 kPa). The intraoperativetumor consistency was mostly firm, requiring ultrasonic aspiration at a high setting (scale 4). J, Histopathologic examination of the resectedtumor indicates diffuse adenoma with fibrosis (hematoxylin-eosin stain; scale bar, 200 �m).
AJNR Am J Neuroradiol 37:1851–59 Oct 2016 www.ajnr.org 1857
originally designed for abdominal MRE for introducing shear
waves into the brain. Indeed, this was the only commercially avail-
able system that could be used for patients in Japan during this
study. A higher motion frequency may be useful for superficial
tumors, and a lower motion frequency may be useful for deep
tumors. In the preliminary study with volunteers, we used the
same MEG (60 Hz) and external driver frequency (60 Hz) re-
ported by Murphy et al.13 However, we found that an external
driver frequency of 60 Hz was not adequate for our system be-
cause the shear waves did not reach the center of the brain. This
might be caused by the loose contact between the head and the
external driver in our system. With reference to the cross-hatch-
ing area, we found that an MEG of 60 Hz, an external driver
frequency of 40 Hz, and an amplitude of 50% were optimal in this
system. The precise reason why a MEG frequency that is not equal
to the external driver frequency works better is unclear; however,
this technique has been widely used in the MRE literature as a
means to reduce TE22 or to create broadband sensitivity for mul-
tifrequency MRE.23-26
Although the spatial resolution in our system was very low
because of the low external driver frequency and limited matrix
size, the shear stiffness of healthy regions of the brain such as the
cerebellum was consistent among patients. Therefore, we used
absolute values for both for the mean and maximum shear stiff-
ness (kilopascal) in this study. We speculated that the region with
the maximum shear stiffness indicated the region with firm
consistency in tumors. However, we observed a case of glioma
in which the region with maximum shear stiffness was the
center of the cyst in the tumor. Our review of the published
literature revealed that the stiffness of the glioma cyst has not
been previously reported. The reason for the center of the cyst
showing maximum shear stiffness was unclear. Although it is
more likely artifacts than anything related to the intracystic
pressure, it may be partially explained as follows: Because fluid
is a less viscoelastic material, the shear stiffness of the cyst is
increased when the intracyst fluid is tensely filled with fluid.
Actually, in neurosurgical practice, the tense cyst in tumors is
firmer than the surrounding normal brain tissue until it is
opened; additionally, when obstructive hydrocephalus is pres-
ent, the brain surface is firm until ventricular drainage is
performed.
The current study had several limitations. First, the spatial
resolution of the voxels (3.75 mm in-plane and 5 mm through-
plane) used in our study was so coarse that the stiffness presented
might include not only tumor tissue but also other surrounding
tissue, including brain tissue, bone, and CSF. In a recent study by
Murphy et al,23 the use of 2-mm, or at most 3-mm, voxels, with
the exclusion of the edge pixels from the analysis in ROIs, was
recommended because of errors associated with estimating spatial
derivatives in the inversion algorithm and also for the minimiza-
tion of partial-volume effects.
A higher spatial resolution would allow shear stiffness mea-
surements in smaller tumors and provide more accurate regional
shear stiffness measurements in large tumors with heterogeneous
consistency. To overcome the low spatial resolution of MRE at the
single harmonic driver frequency that we used, Sack et al27 at
Charite established a multifrequency MRE to generate high-reso-
lution elastograms.10,11,14,24
The recent development of a 3D multislab, multishot acquisi-
tion for whole-brain MRE could achieve high signal-to-noise
efficacy.25-29 3D analysis could improve the results if the wave
propagation is complicated, especially if there is through-
plane oblique wave propagation that a 2D analysis would not
visualize correctly.
Second, the scaling of tumor consistency in our study involved
a qualitative assessment by surgeons at the time of resection; a
quantitative assessment of tumor consistency would be prefera-
ble. Third, because of the small sample size, we could not examine
the histopathologic components corresponding to tumor consis-
tency in detail. The correlation between shear stiffness measured
by using MRE and meningioma subtypes, collagenous contents in
pituitary adenomas, and heterogeneity of the Antoni pattern in
vestibular schwannomas should be investigated in the future.
CONCLUSIONSThe shear stiffness measured by MRE could be used to evaluate
histopathologic subtypes of intracranial tumors. MRE may be
useful in the preoperative discrimination of firm tumors.
ACKNOWLEDGMENTSThe authors thank Masanori Kawate and Kenichi Terashima for
their technical assistance.
Disclosures: Naoto Sakai—RELATED: Grant: JSPS KAKENHI (grant No. 15K10359).
REFERENCES1. Iuchi T, Saeki N, Tanaka M, et al. MRI prediction of fibrous pituitary
adenomas. Acta Neurochir (Wien) 1998;140:779 – 86 CrossRefMedline
2. Pierallini A, Caramia F, Falcone C, et al. Pituitary macroadenomas:preoperative evaluation of consistency with diffusion-weightedMR imaging—initial experience. Radiology 2006;239:223–31CrossRef Medline
3. Yamamoto J, Kakeda S, Shimajiri S, et al. Tumor consistency of pi-tuitary macroadenomas: predictive analysis on the basis of imagingfeatures with contrast-enhanced 3D FIESTA at 3T. AJNR Am J Neu-roradiol 2014;35:297–303 CrossRef Medline
4. Muthupillai R, Lomas DJ, Rossman PJ, et al. Magnetic resonanceelastography by direct visualization of propagating acoustic strainwaves. Science 1995;269:1854 –57 CrossRef Medline
5. Muthupillai R, Ehman RL. Magnetic resonance elastography. NatMed 1996;2:601– 03 CrossRef Medline
6. Kruse SA, Rose GH, Glaser KJ, et al. Magnetic resonance elastogra-phy of the brain. Neuroimage 2008;39:231–37 CrossRef Medline
7. Venkatesh SK, Yin M, Ehman RL. Magnetic resonance elastographyof liver: technique, analysis, and clinical applications. J Magn ResonImaging 2013;37:544 –55 CrossRef Medline
8. Murphy MC, Huston J 3rd, Jack CR Jr, et al. Decreased brain stiff-ness in Alzheimer’s disease determined by magnetic resonanceelastography. J Magn Reson Imaging 2011;34:494 –98 CrossRefMedline
9. Murphy MC, Curran GL, Glaser KJ, et al. Magnetic resonanceelastography of the brain in a mouse model of Alzheimer’sdisease: initial results. Magn Reson Imaging 2012;30:535–39CrossRef Medline
10. Streitberger KJ, Sack I, Krefting D, et al. Brain viscoelasticity altera-tion in chronic-progressive multiple sclerosis. PLoS One 2012;7:e29888 CrossRef Medline
11. Streitberger KJ, Wiener E, Hoffmann J, et al. In vivo viscoelastic
1858 Sakai Oct 2016 www.ajnr.org
properties of the brain in normal pressure hydrocephalus. NMRBiomed 2011;24:385–92 CrossRef Medline
12. Freimann FB, Streitberger KJ, Klatt D, et al. Alteration of brain vis-coelasticity after shunt treatment in normal pressure hydrocepha-lus. Neuroradiology 2012;54:189 –96 CrossRef Medline
13. Murphy MC, Huston J 3rd, Glaser KJ, et al. Preoperative assessmentof meningioma stiffness using magnetic resonance elastography.J Neurosurg 2013;118:643– 48 CrossRef Medline
14. Streitberger KJ, Reiss-Zimmermann M, Freimann FB, et al. High-resolution mechanical imaging of glioblastoma by multifrequencymagnetic resonance elastography. PLoS One 2014;9:e110588CrossRef Medline
15. Kawaji H, Koizumi S, Sakai N, et al. Evaluation of tumor blood flowafter feeder embolization in meningiomas by arterial spin-labelingperfusion magnetic resonance imaging. J Neuroradiol 2013;40:303– 06 CrossRef Medline
16. Sakai N, Koizumi S, Yamashita S, et al. Arterial spin-labeled per-fusion imaging reflects vascular density in nonfunctioning pitu-itary macroadenomas. AJNR Am J Neuroradiol 2013;34:2139 – 43CrossRef Medline
17. Sakai N, Yamashita S, Takehara Y, et al. Evaluation of the antiangio-genic effects of octreotide on growth hormone-producing pituitaryadenoma using arterial spin-labeling perfusion imaging. MagnReson Med Sci 2015;14:73–76 CrossRef Medline
18. Koizumi S, Sakai N, Kawaji H, et al. Pseudo-continuous arterial spinlabeling reflects vascular density and differentiates angiomatousmeningiomas from non-angiomatous meningiomas. Neurooncol2015;121:549 –56 CrossRef Medline
19. Louis DN, Ohgaki H, Wiestler OD, et al. The 2007 WHO classifica-tion of tumours of the central nervous system. Acta Neuropathol2007;114:97–109 CrossRef Medline
20. Naganuma H, Satoh E, Nukui H. Technical considerations of trans-sphenoidal removal of fibrous pituitary adenomas and evaluation
of collagen content and subtype in the adenomas. Neurol Med Chir(Tokyo) 2002;42:202–12 CrossRef Medline
21. Sasaki T, Shono T, Hashiguchi K, et al. Histological considerationsof the cleavage plane for preservation of facial and cochlear nervefunctions in vestibular schwannoma surgery. J Neurosurg 2009;110:648 –55 CrossRef Medline
22. Shinagawa Y, Mitsufuji T, Morimoto S, et al. Optimization of scan-ning parameters for MR elastography at 3.0 T clinical unit: volun-teer study. Japan J Radiol 2014;32:441– 46 CrossRef Medline
23. Murphy MC, Huston J 3rd, Jack CR Jr, et al. Measuring the charac-teristic topography of brain stiffness with magnetic resonance elas-tography. PLoS One 2013;8:e81668 CrossRef Medline
24. Dittmann F, Hirsch S, Tzschatzsch H, et al. In vivo wideband multi-frequency MR elastography of the human brain and liver. MagnReson Med 2015 Oct 20. [Epub ahead of print] CrossRef Medline
25. Garteiser P, Sahebjavaher RS, Ter Beek LC, et al. Rapid acquisition ofmultifrequency, multislice and multidirectional MR elastographydata with a fractionally encoded gradient echo sequence. NMRBiomed 2013;26:1326 –35 CrossRef Medline
26. Rump J, Klatt D, Braun J, et al. Fractional encoding of harmonicmotions in MR elastography. Magn Reson Med 2007;57:388 –95CrossRef Medline
27. Sack I, Beierbach B, Hamhaber U, et al. Non-invasive measurementof brain viscoelasticity using magnetic resonance elastography.NMR Biomed 2008;21:265–71 CrossRef Medline
28. Yin Z, Kearney SP, Magin RL, et al. Concurrent 3D acquisition ofdiffusion tensor imaging and magnetic resonance elastographydisplacement data (DTI-MRE): theory and in vivo application.Magn Reson Med 2016 Jan 20. [Epub ahead of print] CrossRefMedline
29. Johnson CL, Holtrop JL, McGarry MD, et al. 3D multislab, multishotacquisition for fast, whole-brain MR elastography with high signal-to-noise efficiency. Magn Reson Med 2014;71:477– 85 CrossRefMedline
AJNR Am J Neuroradiol 37:1851–59 Oct 2016 www.ajnr.org 1859
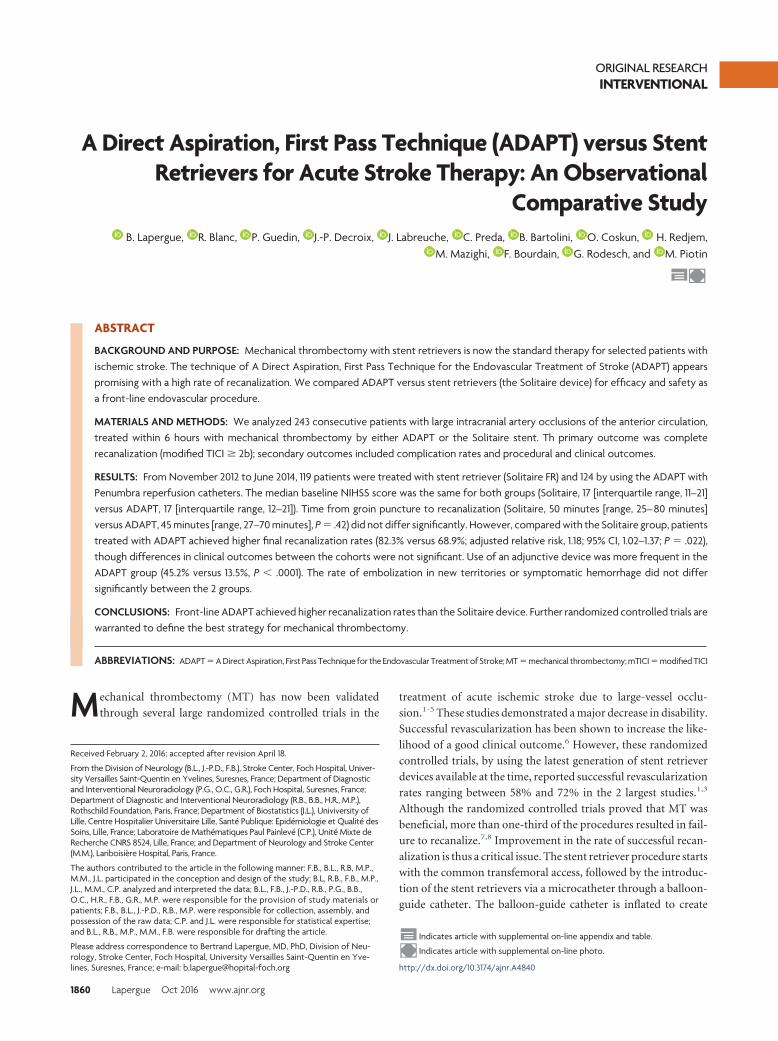
ORIGINAL RESEARCHINTERVENTIONAL
A Direct Aspiration, First Pass Technique (ADAPT) versus StentRetrievers for Acute Stroke Therapy: An Observational
Comparative StudyX B. Lapergue, X R. Blanc, X P. Guedin, X J.-P. Decroix, X J. Labreuche, X C. Preda, X B. Bartolini, X O. Coskun, X H. Redjem,
X M. Mazighi, X F. Bourdain, X G. Rodesch, and X M. Piotin
ABSTRACT
BACKGROUND AND PURPOSE: Mechanical thrombectomy with stent retrievers is now the standard therapy for selected patients withischemic stroke. The technique of A Direct Aspiration, First Pass Technique for the Endovascular Treatment of Stroke (ADAPT) appearspromising with a high rate of recanalization. We compared ADAPT versus stent retrievers (the Solitaire device) for efficacy and safety asa front-line endovascular procedure.
MATERIALS AND METHODS: We analyzed 243 consecutive patients with large intracranial artery occlusions of the anterior circulation,treated within 6 hours with mechanical thrombectomy by either ADAPT or the Solitaire stent. Th primary outcome was completerecanalization (modified TICI � 2b); secondary outcomes included complication rates and procedural and clinical outcomes.
RESULTS: From November 2012 to June 2014, 119 patients were treated with stent retriever (Solitaire FR) and 124 by using the ADAPT withPenumbra reperfusion catheters. The median baseline NIHSS score was the same for both groups (Solitaire, 17 [interquartile range, 11–21]versus ADAPT, 17 [interquartile range, 12–21]). Time from groin puncture to recanalization (Solitaire, 50 minutes [range, 25– 80 minutes]versus ADAPT, 45 minutes [range, 27–70 minutes], P � .42) did not differ significantly. However, compared with the Solitaire group, patientstreated with ADAPT achieved higher final recanalization rates (82.3% versus 68.9%; adjusted relative risk, 1.18; 95% CI, 1.02–1.37; P � .022),though differences in clinical outcomes between the cohorts were not significant. Use of an adjunctive device was more frequent in theADAPT group (45.2% versus 13.5%, P � .0001). The rate of embolization in new territories or symptomatic hemorrhage did not differsignificantly between the 2 groups.
CONCLUSIONS: Front-line ADAPT achieved higher recanalization rates than the Solitaire device. Further randomized controlled trials arewarranted to define the best strategy for mechanical thrombectomy.
ABBREVIATIONS: ADAPT � A Direct Aspiration, First Pass Technique for the Endovascular Treatment of Stroke; MT � mechanical thrombectomy; mTICI � modified TICI
Mechanical thrombectomy (MT) has now been validated
through several large randomized controlled trials in the
treatment of acute ischemic stroke due to large-vessel occlu-
sion.1-5 These studies demonstrated a major decrease in disability.
Successful revascularization has been shown to increase the like-
lihood of a good clinical outcome.6 However, these randomized
controlled trials, by using the latest generation of stent retriever
devices available at the time, reported successful revascularization
rates ranging between 58% and 72% in the 2 largest studies.1,3
Although the randomized controlled trials proved that MT was
beneficial, more than one-third of the procedures resulted in fail-
ure to recanalize.7,8 Improvement in the rate of successful recan-
alization is thus a critical issue. The stent retriever procedure starts
with the common transfemoral access, followed by the introduc-
tion of the stent retrievers via a microcatheter through a balloon-
guide catheter. The balloon-guide catheter is inflated to create
Received February 2, 2016; accepted after revision April 18.
From the Division of Neurology (B.L., J.-P.D., F.B.), Stroke Center, Foch Hospital, Univer-sity Versailles Saint-Quentin en Yvelines, Suresnes, France; Department of Diagnosticand Interventional Neuroradiology (P.G., O.C., G.R.), Foch Hospital, Suresnes, France;Department of Diagnostic and Interventional Neuroradiology (R.B., B.B., H.R., M.P.),Rothschild Foundation, Paris, France; Department of Biostatistics (J.L.), Univiversity ofLille, Centre Hospitalier Universitaire Lille, Sante Publique: Epidemiologie et Qualite desSoins, Lille, France; Laboratoire de Mathematiques Paul Painleve (C.P.), Unite Mixte deRecherche CNRS 8524, Lille, France; and Department of Neurology and Stroke Center(M.M.), Lariboisiere Hospital, Paris, France.
The authors contributed to the article in the following manner: F.B., B.L., R.B, M.P.,M.M., J.L. participated in the conception and design of the study; B.L, R.B., F.B., M.P.,J.L., M.M., C.P. analyzed and interpreted the data; B.L., F.B., J.-P.D., R.B., P.G., B.B.,O.C., H.R., F.B., G.R., M.P. were responsible for the provision of study materials orpatients; F.B., B.L., J.-P.D., R.B., M.P. were responsible for collection, assembly, andpossession of the raw data; C.P. and J.L. were responsible for statistical expertise;and B.L., R.B., M.P., M.M., F.B. were responsible for drafting the article.
Please address correspondence to Bertrand Lapergue, MD, PhD, Division of Neu-rology, Stroke Center, Foch Hospital, University Versailles Saint-Quentin en Yve-lines, Suresnes, France; e-mail: [email protected]
Indicates article with supplemental on-line appendix and table.
Indicates article with supplemental on-line photo.
http://dx.doi.org/10.3174/ajnr.A4840
1860 Lapergue Oct 2016 www.ajnr.org
flow arrest while retrieving the stent retrievers. Another approach
is A Direct Aspiration, First Pass Technique for the Endovascular
Treatment of Stroke (ADAPT),9 which involves using front-line
aspiration alone to remove the thrombus through a highly track-
able, atraumatic, large-bore aspiration catheter. Its success is
based on using the largest catheter permitted by the vessel, ensur-
ing greater aspiration power for thrombus extraction. In case of
failure with the front-line ADAPT approach, the large-bore aspi-
ration catheter can be used as a conduit for introducing a stent
retriever or another adjunctive device; the system is thus versatile.
We aimed to compare the recanalization efficiency, clinical
outcome, and complication rate of ADAPT and stent retrievers, 2
strategies of mechanical thrombectomy.
MATERIALS AND METHODSA prospective clinical registry was used to consecutively identify
and analyze patients with acute ischemic stroke treated at 2 com-
prehensive stroke centers between November 2012 and June 2014
(EFFECTS Registry, Endovascular Treatment at Foch Hospital-
Rothschild Foundation in Ischemic Stroke). All patients were as-
sessed for the presence of large intracranial artery occlusions of
the anterior circulation and received front-line MT by using ei-
ther the Solitaire (Covidien, Irvine, California) device or ADAPT
by using the 5MAX or 5MAX ACE Reperfusion Catheter (Pen-
umbra, Alameda, California) (On-line Appendix). Most patients
underwent brain MR imaging in the acute phase. In cases of MR
imaging contraindications, brain CT and CT angiography were
performed.
Standard Protocol ApprovalsLocally ethics committees and French Data Protection Agency
approved the use of patient data for this retrospective analysis.
Inclusion and Exclusion CriteriaThe following criteria were required for inclusion in this study:
● Proximal middle cerebral artery occlusion or intracranial inter-
nal carotid artery occlusion, without associated cervical inter-
nal carotid artery occlusion/critical stenosis, was present. Pa-
tients referred for acute ischemic stroke with cervical internal
carotid occlusion/critical stenosis and basilar occlusion were
excluded from this study to decrease bias due to the heteroge-
neity of patients and endovascular approaches.
● Patients were eligible if they were treatable by MT within 6 hours of
stroke onset, with bridging therapy (previous IV rtPA) or stand-
alone thrombectomy. The interventional neuroradiologist could,
in the case of recanalization failure (modified TICI [mTICI] � 2b)
with the ADAPT or the Solitaire system, use another thrombec-
tomy device of the operator’s choice (rescue therapy).
Data Collection and DefinitionsInformation on patient characteristics, medical history, labora-
tory and imaging findings, vital signs before treatment, severity of
ischemic stroke, and clinical outcome was collected prospectively
by using the same structured questionnaire. The severity of the
ischemic stroke was assessed by using the NIHSS score at admis-
sion and 24 hours later. We defined early neurologic improve-
ment as an NIHSS score of 0 –1 at 24 hours or a decrease of at least
4 points in the NIHSS score. Good functional outcome was de-
fined as a 90-day mRS score of �2. Excellent outcome was defined
as a 90-day mRS score of �1. All patients underwent a CT or MR
imaging 24 hours after treatment to assess hemorrhagic compli-
cations. Symptomatic intracranial hemorrhage was defined ac-
cording to the ECASS-II (European Co-operative Acute Stroke
Study-II) definition: any intracerebral hemorrhage with an in-
crease of at least 4 NIHSS points within 24 hours, or resulting in
death. Symptomatic intracranial hemorrhage was assessed in a
blinded manner by noninvolved senior neuroradiologists (R.B.,
H.R.) and vascular neurologists (B.L., J.-P.D.). The blinded as-
sessment of symptomatic intracranial hemorrhage was specifi-
cally performed for this study to assess both aspects of mechanical
thrombectomy (successful recanalization rate and hemorrhage
complications). During the MT procedure, the presence of em-
bolization in a new territory (defined as an angiographic occlu-
sion in a previously unaffected vascular territory observed on the
angiogram after clot removal), the time from symptom onset to
groin puncture and from groin puncture to maximal mTICI, and
the mTICI score were also monitored. The modified Rankin Scale
score at 90 days was assessed by trained research nurses unaware
of the study group assignments, during face-to-face interviews or
via telephone conversations.
Endovascular Procedure
ADAPT Group. Patients received aspiration thrombectomy by
ADAPT by using the 5MAX ACE (Penumbra) as front-line ther-
apy. The detailed technical procedure has been published previ-
ously.9 In brief, access was achieved through the femoral artery in
compliance with the standard of care. Large-bore catheters were
placed distally into the internal carotid artery to provide access for
the 5MAX ACE aspiration catheter. Adhering to the instructions
for use, the 5MAX ACE catheter was advanced to the level of the
occlusion over a microcatheter and a microguidewire. Continu-
ous aspiration was then performed by using the Penumbra aspi-
ration pump for at least 90 seconds in all cases. After engagement
of the thrombus with the aspiration catheter, the catheter was
allowed to aspirate for at least 30 seconds before its withdrawal
with the engaged thrombus. Angiography was performed follow-
ing recovery to evaluate the flow rate. The preceding steps were
repeated until successful revascularization to mTICI 2b–3 was
achieved, while adhering to the admissible treatment window (�6
hours from stroke onset).The interventional neuroradiologist
could, in the case of recanalization failure (mTICI � 2b) with
ADAPT, use another thrombectomy device of the operator’s
choice (rescue therapy).
Solitaire Group. All MT procedures were performed by using the
Solitaire FR (Covidien) via the femoral artery approach. Follow-
ing the instructions for use of the Solitaire FR, a balloon catheter
was positioned within the internal carotid artery to allow flow
arrest during thrombus retrieval. The Solitaire FR device was de-
livered through a microcatheter and deployed inside the throm-
bus. A control angiogram was performed to determine the imme-
diate reperfusion status, and the device was left deployed for a
minimum of 3 minutes. Before retrieval of the stent retriever, the
AJNR Am J Neuroradiol 37:1860 – 65 Oct 2016 www.ajnr.org 1861
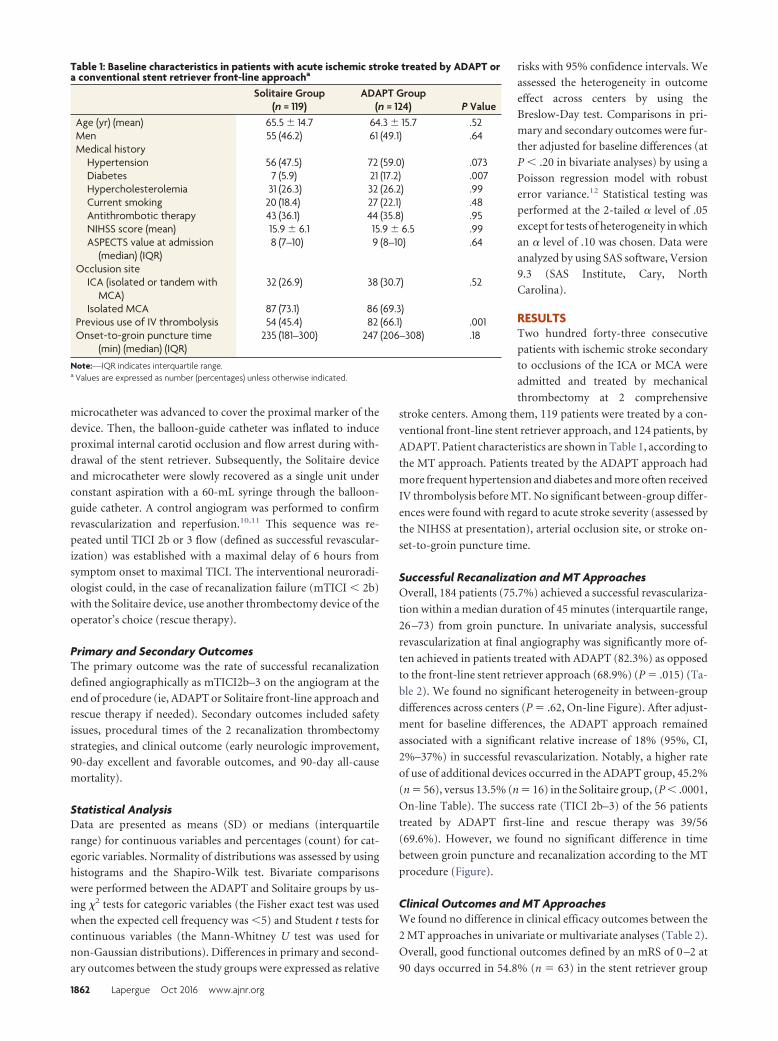
microcatheter was advanced to cover the proximal marker of the
device. Then, the balloon-guide catheter was inflated to induce
proximal internal carotid occlusion and flow arrest during with-
drawal of the stent retriever. Subsequently, the Solitaire device
and microcatheter were slowly recovered as a single unit under
constant aspiration with a 60-mL syringe through the balloon-
guide catheter. A control angiogram was performed to confirm
revascularization and reperfusion.10,11 This sequence was re-
peated until TICI 2b or 3 flow (defined as successful revascular-
ization) was established with a maximal delay of 6 hours from
symptom onset to maximal TICI. The interventional neuroradi-
ologist could, in the case of recanalization failure (mTICI � 2b)
with the Solitaire device, use another thrombectomy device of the
operator’s choice (rescue therapy).
Primary and Secondary OutcomesThe primary outcome was the rate of successful recanalization
defined angiographically as mTICI2b–3 on the angiogram at the
end of procedure (ie, ADAPT or Solitaire front-line approach and
rescue therapy if needed). Secondary outcomes included safety
issues, procedural times of the 2 recanalization thrombectomy
strategies, and clinical outcome (early neurologic improvement,
90-day excellent and favorable outcomes, and 90-day all-cause
mortality).
Statistical AnalysisData are presented as means (SD) or medians (interquartile
range) for continuous variables and percentages (count) for cat-
egoric variables. Normality of distributions was assessed by using
histograms and the Shapiro-Wilk test. Bivariate comparisons
were performed between the ADAPT and Solitaire groups by us-
ing �2 tests for categoric variables (the Fisher exact test was used
when the expected cell frequency was �5) and Student t tests for
continuous variables (the Mann-Whitney U test was used for
non-Gaussian distributions). Differences in primary and second-
ary outcomes between the study groups were expressed as relative
risks with 95% confidence intervals. We
assessed the heterogeneity in outcome
effect across centers by using the
Breslow-Day test. Comparisons in pri-
mary and secondary outcomes were fur-
ther adjusted for baseline differences (at
P � .20 in bivariate analyses) by using a
Poisson regression model with robust
error variance.12 Statistical testing was
performed at the 2-tailed � level of .05
except for tests of heterogeneity in which
an � level of .10 was chosen. Data were
analyzed by using SAS software, Version
9.3 (SAS Institute, Cary, North
Carolina).
RESULTSTwo hundred forty-three consecutive
patients with ischemic stroke secondary
to occlusions of the ICA or MCA were
admitted and treated by mechanical
thrombectomy at 2 comprehensive
stroke centers. Among them, 119 patients were treated by a con-
ventional front-line stent retriever approach, and 124 patients, by
ADAPT. Patient characteristics are shown in Table 1, according to
the MT approach. Patients treated by the ADAPT approach had
more frequent hypertension and diabetes and more often received
IV thrombolysis before MT. No significant between-group differ-
ences were found with regard to acute stroke severity (assessed by
the NIHSS at presentation), arterial occlusion site, or stroke on-
set-to-groin puncture time.
Successful Recanalization and MT ApproachesOverall, 184 patients (75.7%) achieved a successful revasculariza-
tion within a median duration of 45 minutes (interquartile range,
26 –73) from groin puncture. In univariate analysis, successful
revascularization at final angiography was significantly more of-
ten achieved in patients treated with ADAPT (82.3%) as opposed
to the front-line stent retriever approach (68.9%) (P � .015) (Ta-
ble 2). We found no significant heterogeneity in between-group
differences across centers (P � .62, On-line Figure). After adjust-
ment for baseline differences, the ADAPT approach remained
associated with a significant relative increase of 18% (95%, CI,
2%–37%) in successful revascularization. Notably, a higher rate
of use of additional devices occurred in the ADAPT group, 45.2%
(n � 56), versus 13.5% (n � 16) in the Solitaire group, (P � .0001,
On-line Table). The success rate (TICI 2b–3) of the 56 patients
treated by ADAPT first-line and rescue therapy was 39/56
(69.6%). However, we found no significant difference in time
between groin puncture and recanalization according to the MT
procedure (Figure).
Clinical Outcomes and MT ApproachesWe found no difference in clinical efficacy outcomes between the
2 MT approaches in univariate or multivariate analyses (Table 2).
Overall, good functional outcomes defined by an mRS of 0 –2 at
90 days occurred in 54.8% (n � 63) in the stent retriever group
Table 1: Baseline characteristics in patients with acute ischemic stroke treated by ADAPT ora conventional stent retriever front-line approacha
Solitaire Group(n = 119)
ADAPT Group(n = 124) P Value
Age (yr) (mean) 65.5 � 14.7 64.3 � 15.7 .52Men 55 (46.2) 61 (49.1) .64Medical history
Hypertension 56 (47.5) 72 (59.0) .073Diabetes 7 (5.9) 21 (17.2) .007Hypercholesterolemia 31 (26.3) 32 (26.2) .99Current smoking 20 (18.4) 27 (22.1) .48Antithrombotic therapy 43 (36.1) 44 (35.8) .95NIHSS score (mean) 15.9 � 6.1 15.9 � 6.5 .99ASPECTS value at admission
(median) (IQR)8 (7–10) 9 (8–10) .64
Occlusion siteICA (isolated or tandem with
MCA)32 (26.9) 38 (30.7) .52
Isolated MCA 87 (73.1) 86 (69.3)Previous use of IV thrombolysis 54 (45.4) 82 (66.1) .001Onset-to-groin puncture time
(min) (median) (IQR)235 (181–300) 247 (206–308) .18
Note:—IQR indicates interquartile range.a Values are expressed as number (percentages) unless otherwise indicated.
1862 Lapergue Oct 2016 www.ajnr.org
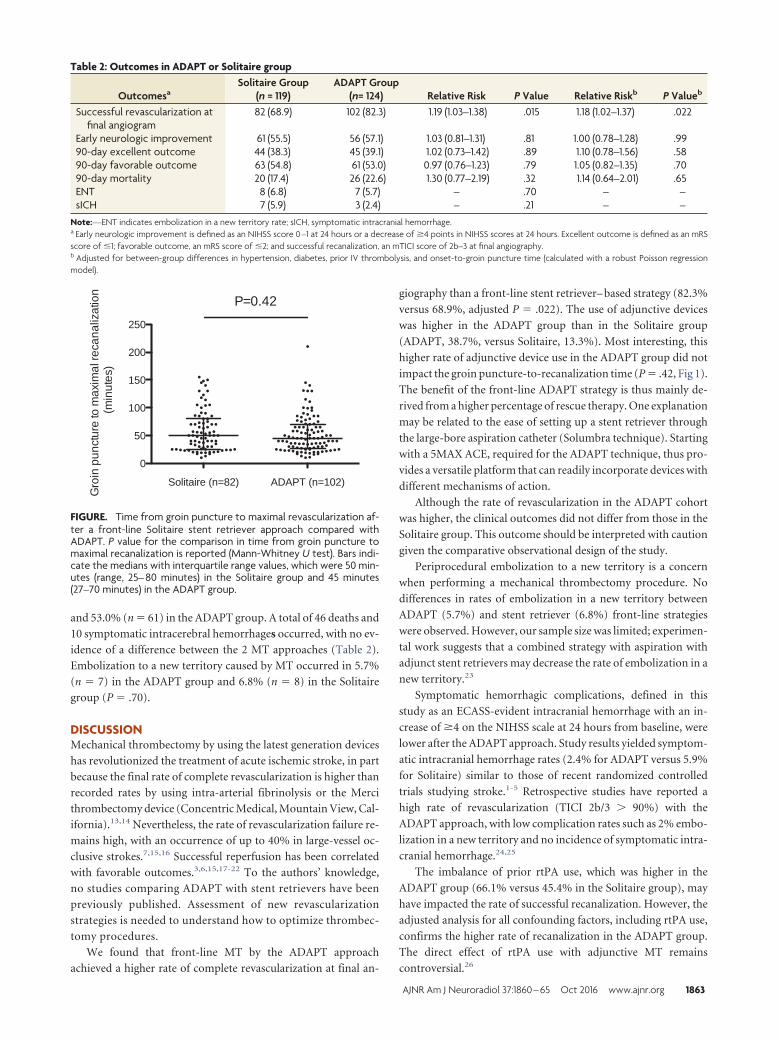
and 53.0% (n � 61) in the ADAPT group. A total of 46 deaths and
10 symptomatic intracerebral hemorrhages occurred, with no ev-
idence of a difference between the 2 MT approaches (Table 2).
Embolization to a new territory caused by MT occurred in 5.7%
(n � 7) in the ADAPT group and 6.8% (n � 8) in the Solitaire
group (P � .70).
DISCUSSIONMechanical thrombectomy by using the latest generation devices
has revolutionized the treatment of acute ischemic stroke, in part
because the final rate of complete revascularization is higher than
recorded rates by using intra-arterial fibrinolysis or the Merci
thrombectomy device (Concentric Medical, Mountain View, Cal-
ifornia).13,14 Nevertheless, the rate of revascularization failure re-
mains high, with an occurrence of up to 40% in large-vessel oc-
clusive strokes.7,15,16 Successful reperfusion has been correlated
with favorable outcomes.3,6,15,17-22 To the authors’ knowledge,
no studies comparing ADAPT with stent retrievers have been
previously published. Assessment of new revascularization
strategies is needed to understand how to optimize thrombec-
tomy procedures.
We found that front-line MT by the ADAPT approach
achieved a higher rate of complete revascularization at final an-
giography than a front-line stent retriever– based strategy (82.3%
versus 68.9%, adjusted P � .022). The use of adjunctive devices
was higher in the ADAPT group than in the Solitaire group
(ADAPT, 38.7%, versus Solitaire, 13.3%). Most interesting, this
higher rate of adjunctive device use in the ADAPT group did not
impact the groin puncture-to-recanalization time (P � .42, Fig 1).
The benefit of the front-line ADAPT strategy is thus mainly de-
rived from a higher percentage of rescue therapy. One explanation
may be related to the ease of setting up a stent retriever through
the large-bore aspiration catheter (Solumbra technique). Starting
with a 5MAX ACE, required for the ADAPT technique, thus pro-
vides a versatile platform that can readily incorporate devices with
different mechanisms of action.
Although the rate of revascularization in the ADAPT cohort
was higher, the clinical outcomes did not differ from those in the
Solitaire group. This outcome should be interpreted with caution
given the comparative observational design of the study.
Periprocedural embolization to a new territory is a concern
when performing a mechanical thrombectomy procedure. No
differences in rates of embolization in a new territory between
ADAPT (5.7%) and stent retriever (6.8%) front-line strategies
were observed. However, our sample size was limited; experimen-
tal work suggests that a combined strategy with aspiration with
adjunct stent retrievers may decrease the rate of embolization in a
new territory.23
Symptomatic hemorrhagic complications, defined in this
study as an ECASS-evident intracranial hemorrhage with an in-
crease of �4 on the NIHSS scale at 24 hours from baseline, were
lower after the ADAPT approach. Study results yielded symptom-
atic intracranial hemorrhage rates (2.4% for ADAPT versus 5.9%
for Solitaire) similar to those of recent randomized controlled
trials studying stroke.1-5 Retrospective studies have reported a
high rate of revascularization (TICI 2b/3 � 90%) with the
ADAPT approach, with low complication rates such as 2% embo-
lization in a new territory and no incidence of symptomatic intra-
cranial hemorrhage.24,25
The imbalance of prior rtPA use, which was higher in the
ADAPT group (66.1% versus 45.4% in the Solitaire group), may
have impacted the rate of successful recanalization. However, the
adjusted analysis for all confounding factors, including rtPA use,
confirms the higher rate of recanalization in the ADAPT group.
The direct effect of rtPA use with adjunctive MT remains
controversial.26
Table 2: Outcomes in ADAPT or Solitaire group
OutcomesaSolitaire Group
(n = 119)ADAPT Group
(n= 124) Relative Risk P Value Relative Riskb P Valueb
Successful revascularization atfinal angiogram
82 (68.9) 102 (82.3) 1.19 (1.03–1.38) .015 1.18 (1.02–1.37) .022
Early neurologic improvement 61 (55.5) 56 (57.1) 1.03 (0.81–1.31) .81 1.00 (0.78–1.28) .9990-day excellent outcome 44 (38.3) 45 (39.1) 1.02 (0.73–1.42) .89 1.10 (0.78–1.56) .5890-day favorable outcome 63 (54.8) 61 (53.0) 0.97 (0.76–1.23) .79 1.05 (0.82–1.35) .7090-day mortality 20 (17.4) 26 (22.6) 1.30 (0.77–2.19) .32 1.14 (0.64–2.01) .65ENT 8 (6.8) 7 (5.7) – .70 – –sICH 7 (5.9) 3 (2.4) – .21 – –
Note:—ENT indicates embolization in a new territory rate; sICH, symptomatic intracranial hemorrhage.a Early neurologic improvement is defined as an NIHSS score 0 –1 at 24 hours or a decrease of �4 points in NIHSS scores at 24 hours. Excellent outcome is defined as an mRSscore of �1; favorable outcome, an mRS score of �2; and successful recanalization, an mTICI score of 2b–3 at final angiography.b Adjusted for between-group differences in hypertension, diabetes, prior IV thrombolysis, and onset-to-groin puncture time (calculated with a robust Poisson regressionmodel).
P=0.42
Solitaire (n=82) ADAPT (n=102)
0
50
100
150
200
250
Gro
in p
unct
ure
to m
axim
al re
cana
lizat
ion
(m
inut
es)
FIGURE. Time from groin puncture to maximal revascularization af-ter a front-line Solitaire stent retriever approach compared withADAPT. P value for the comparison in time from groin puncture tomaximal recanalization is reported (Mann-Whitney U test). Bars indi-cate the medians with interquartile range values, which were 50 min-utes (range, 25– 80 minutes) in the Solitaire group and 45 minutes(27–70 minutes) in the ADAPT group.
AJNR Am J Neuroradiol 37:1860 – 65 Oct 2016 www.ajnr.org 1863
The present findings are derived from observational analyses,
which are subject to well-known limitations. The first is the po-
tential for confounding by measured or unmeasured variables,
which cannot be ruled out, even after adjustment for baseline
between-group differences. The second concerns the potential
evaluation bias in clinical outcomes in the absence of blinded
evaluation. In addition, no formal study sample size was calcu-
lated, and we could not exclude some differences being over-
looked due to the lack of adequate statistical power. In a posterior
power calculation (not taking into account the adjustment), we
calculated the smallest significant between-group difference (ex-
pressed as effect size by using relative risk) that our study sample
size allowed us to detect with a power of 80%. Assuming an inci-
dence of good outcome of 10% and 50% in the reference group
(Solitaire), we could respectively detect a relative risk of 2.34 and
1.35 (or 0.43 and 0.74 for a detrimental effect).
We suggest that future studies follow a randomized controlled
trial with core imaging performed by an independent neurointer-
ventionalist to further support those findings.
We are currently starting the Interest of Direct Aspiration First
Pass Technique (ADAPT) for Thrombectomy Revascularisation
of Large Vessel Occlusion in Acute Ischaemic Stroke trial, a
randomized, controlled, multicentric, blinded-end-point study
(ClinicalTrials.gov, NCT02523261).
CONCLUSIONSFront-line ADAPT as an MT strategy achieved higher recanaliza-
tion rates compared with the Solitaire device, though ADAPT
requires higher rates of rescue therapy. Further randomized con-
trolled trials are warranted to define the best strategy for mechan-
ical thrombectomy.
ACKNOWLEDGMENTSWe thank Mary Osborne-Pellegrin for help in editing the final
draft of the manuscript.
Disclosures: Bertrand Lapergue—RELATED: Grant: An institutional grant has beenprovided by Penumbra for ASTER TRIAL (ADAPT versus stent retriever in acuteischemic stroke); Support for Travel to meetings for the study or other purposes:travel support by Medtronic; Payment for lectures (including service of SpeakersBureaus): speaker’s honoraria from Penumbra. Bruno Bartolini—UNRELATED:Consultancy: Stryker Neurovascular. Mikael Mazighi—UNRELATED: Consultancy:Servier, Comments: honoraria for teaching engagements as a consultant; Paymentfor Lectures (including service on Speakers Bureaus): Covidien; Travel/Accommo-dations/Meeting Expenses Unrelated to Activities Listed: Bayer A.G., BoehringerIngelheim, Covidien. Michel Piotin—UNRELATED: Consultancy: Medtronic,*Stryker,* MicroVention,* Penumbra*; Payment for Lectures (including service onSpeakers Bureaus): Medtronic,* Penumbra*; Grants/grants pending: institutionalgrants from Stryker, Medtronic, MicroVention, Balt; OTHER: institutional grant fromMedtronic for training and proctoring physicians using Pipeline. Raphael Blanc—UNRELATED: Grants/grants pending: institutional grants from Stryker, Medtronic,MicroVention, Balt; OTHER: institutional grant from Medtronic for training and proc-toring physicians using Pipeline. *Money paid to the institution.
REFERENCES1. Berkhemer OA, Fransen PSS, Beumer D, et al. A randomized trial of
intraarterial treatment for acute ischemic stroke. N Engl J Med 2015;372:11–20 CrossRef Medline
2. Jovin TG, Chamorro A, Cobo E, et al; REVASCAT Trial Investigators.Thrombectomy within 8 hours after symptom onset in ischemicstroke. N Engl J Med 2015;372:2296 –306 CrossRef Medline
3. Goyal M, Demchuk AM, Menon BK, et al; ESCAPE Trial Investi-
gators. Randomized assessment of rapid endovascular treatmentof ischemic stroke. N Engl J Med 2015;372:1019 –30 CrossRefMedline
4. Campbell BC, Mitchell PJ, Kleinig TJ, et al; EXTEND-IA Investi-gators. Endovascular therapy for ischemic stroke with perfu-sion-imaging selection. N Engl J Med 2015;372:1009 –18 CrossRefMedline
5. Saver JL, Goyal M, Bonafe A, et al.; SWIFT PRIME Investigators.Stent-retriever thrombectomy after intravenous t-PA vs. t-PAalone in stroke. N Engl J Med 2015;372:2285–95 CrossRef Medline
6. Khatri P, Yeatts SD, Mazighi M, et al; IMS III Trialists. Time to an-giographic reperfusion and clinical outcome after acute ischaemicstroke: an analysis of data from the Interventional Management ofStroke (IMS III) phase 3 trial. Lancet Neurol 2014;13:567–74CrossRef Medline
7. Smith WS, Sung G, Saver J, et al. Mechanical thrombectomy foracute ischemic stroke: final results of the Multi MERCI trial. Stroke2008;39:1205–12 CrossRef Medline
8. Kidwell CS, Jahan R. Endovascular treatment of acute ischemicstroke. Neurol Clin 2015;33:401–20 CrossRef Medline
9. Turk AS, Spiotta A, Frei D, et al. Initial clinical experience with theADAPT technique: a direct aspiration first pass technique forstroke thrombectomy. J Neurointerv Surg 2014;6:231–37 CrossRefMedline
10. Yoo AJ, Simonsen CZ, Prabhakaran S, et al; Cerebral Angiographic Re-vascularization Grading Collaborators. Refining angiographic bio-markers of revascularization: improving outcome prediction after in-tra-arterial therapy. Stroke 2013;44:2509–12 CrossRef Medline
11. Zaidat OO, Yoo AJ, Khatri P, et al; Angiographic RevascularizationGrading (CARG) Collaborators, STIR Revascularization workinggroup, STIR Thrombolysis in Cerebral Infarction (TICI) Task Force.Recommendations on angiographic revascularization gradingstandards for acute ischemic stroke: a consensus statement. Stroke2013;44:2650 – 63 CrossRef Medline
12. Zou G. A modified Poisson regression approach to prospectivestudies with binary data. Am J Epidemiol 2004;159:702– 06 CrossRefMedline
13. Song D, Kim BM, Kim DJ, et al. Comparison of stent retriever andintra-arterial fibrinolysis in patients with acute ischaemic stroke.Eur J Neurol 2014;21:779 – 84 CrossRef Medline
14. Broussalis E, Trinka E, Hitzl W, et al. Comparison of stent-retrieverdevices versus the Merci retriever for endovascular treatment ofacute stroke. AJNR Am J Neuroradiol 2013;34:366 –72 CrossRefMedline
15. Rha JH, Saver JL. The impact of recanalization on ischemic strokeoutcome: a meta-analysis. Stroke 2007;38:967–73 CrossRef Medline
16. Smith WS, Sung G, Starkman S, et al; MERCI Trial Investigators.Safety and efficacy of mechanical embolectomy in acute ischemicstroke: results of the MERCI Trial. Stroke 2005;36:1432–38 CrossRefMedline
17. Campbell BC, Donnan GA, Lees KR, et al. Endovascular stentthrombectomy: the new standard of care for large vessel ischaemicstroke. Lancet Neurol 2015;14:846 –54 CrossRef Medline
18. Khatri P, Hacke W, Fiehler J, et al; VISTA-Endovascular Collabora-tion. State of acute endovascular therapy: report from the 12ththrombolysis, thrombectomy, and acute stroke therapy confer-ence. Stroke 2015;46:1727–34 CrossRef Medline
19. Saver JL, Jahan R, Levy EI, et al; SWIFT Trialists. Solitaire flow res-toration device versus the Merci retriever in patients with acuteischaemic stroke (SWIFT): a randomised, parallel-group, non-infe-riority trial. Lancet 2012;380:1241– 49 CrossRef Medline
20. Nogueira RG, Lutsep HL, Gupta R, et al; TREVO 2 Trialists. Trevoversus Merci retrievers for thrombectomy revascularisation oflarge vessel occlusions in acute ischaemic stroke (TREVO 2): a ran-domised trial. Lancet 2012;380:1231– 40 CrossRef Medline
21. Tomsick T, Broderick J, Carrozella J, et al; Interventional Manage-ment of Stroke II Investigators. Revascularization results in the In-
1864 Lapergue Oct 2016 www.ajnr.org

terventional Management of Stroke II Trial. AJNR Am J Neuroradiol2008;29:582– 87 CrossRef Medline
22. Sarraj A, Gupta R. Endovascular treatment for ischemic strokeswith large vessel occlusion: proven therapy and bright future. Stroke2015;46:1431–32 CrossRef Medline
23. Chueh JY, Puri AS, Wakhloo AK, et al. Risk of distal embolizationwith stent retriever thrombectomy and ADAPT. J Neurointerv Surg2016;8:197–202 CrossRef Medline
24. Turk AS, Frei D, Fiorella D, et al. ADAPT FAST study: a direct aspi-
ration first pass technique for acute stroke thrombectomy. J Neuro-interv Surg 2014;6:260 – 64 CrossRef Medline
25. KowollA, WeberA, Mpotsaris A, et al. Direct aspiration first passtechnique for the treatment of acute ischemic stroke: initial experi-ence at a European stroke center. J Neurointerv Surg 2016;8:230 –34CrossRef Medline
26. Guedin P, Larcher A, Decroix JP, et al. Prior IV thrombolysis facili-tates mechanical thrombectomy in acute ischemic stroke. J StrokeCerebrovasc Dis 2015;24:952–57 CrossRef Medline
AJNR Am J Neuroradiol 37:1860 – 65 Oct 2016 www.ajnr.org 1865
CLINICAL REPORTINTERVENTIONAL
Flow Diversion for Ophthalmic Artery AneurysmsX A.M. Burrows, X W. Brinjikji, X R.C. Puffer, X H. Cloft, X D.F. Kallmes, and X G. Lanzino
ABSTRACTSUMMARY: Endovascular treatments of ophthalmic segment aneurysms are commonly used but visual outcomes remain a concern. Weperformed a retrospective review of patients with carotid-ophthalmic aneurysms treated with flow diversion from June 2009 to June 2015.The following outcomes were studied through chart review: visual outcomes, complications, postoperative stroke and intraparenchymalhemorrhage, and clinical outcomes. Angiographic outcomes were studied with angiography and MRA at 6 months, 1 year, and 3 years. Weevaluated 50 carotid-ophthalmic aneurysms in 48 patients, among whom 44 patients with 46 aneurysms underwent treatment. The mean clinicalfollow-up was 29 � 22 months (range, 0–65 months). There were no permanent adverse visual outcomes. There was 1 death because of lateintraparenchymal hemorrhage (2.2%). Six-month angiography showed complete occlusion in 24 of 37 patients (64.9%), and 3-year angiographyresults showed occlusion in 24 of 25 patients (96%). In conclusion, flow diversion is a safe and effective treatment for carotid-ophthalmicaneurysms in carefully selected patients. The risk of adverse visual outcomes is low, and most aneurysms progress to complete occlusion.
ABBREVIATION: PED � Pipeline Embolization Device
Flow-diverting stents work by directing blood flow away from
the aneurysm into the parent vessel, leading to stasis of blood
flow within the aneurysm, thrombosis, and, ultimately, complete
exclusion of the aneurysm from circulation via endothelial pro-
liferation along the struts of the device.1-3 Initial preclinical stud-
ies suggested that branch vessels covered by the device remain
patent because the flow gradient at the branch vessel takeoff in-
hibits endothelial proliferation.2-5 In practice, flow diverters have
been shown to lead to aneurysm occlusion rates ranging from
69%–94% at 6 months, increasing to 86.8%–95% at 1 year.6-10
These initial series also reported a wide range of postprocedure
morbidity and mortality up to 19%.6-10 Recently, several series
have been published on the specific treatment of paraclinoid an-
eurysms with the Pipeline Embolization Device (PED; Covidien,
Irvine, California) and Surpass Device (Stryker Neurovascular,
Kalamazoo, Michigan), reporting complete or near-complete oc-
clusion rates of 75%–92.1% at final angiographic follow-up with
very low rates of postprocedure morbidity.11-14 Many of these
series were relatively small, with short angiographic follow-up,
and included vastly diverse aneurysms with a common denomi-
nator of involvement of the paraclinoid ICA. In this study, we
reported on a large series of patients with carotid-ophthalmic ar-
tery aneurysms, focusing on periprocedural complications as well
as mid- and long-term angiographic and clinical outcomes, in-
cluding visual outcomes.
MATERIALS AND METHODSPatient PopulationConsecutive prospectively collected data on 175 patients evalu-
ated for treatment with PED or, more recently, with Surpass flow
diversion were retrospectively analyzed. Patients with carotid-
ophthalmic artery aneurysms were identified and analyzed. Ca-
rotid-ophthalmic aneurysms were defined as those aneurysms
arising from the proximal supraclinoid ICA at the takeoff of the
ophthalmic artery with a superior orientation of the aneurysm
sac. Information prospectively collected as part of an internal
quality assurance project included patient demographics; aneu-
rysm location, classification, and size; symptomatic or asymp-
tomatic status; type and number of devices used; adjunctive coil-
ing; periprocedural technical and clinical complications; length of
hospital stay; and angiographic and clinical follow-up.
Procedure DetailsPatients undergoing placement of the PED were premedicated
with aspirin and clopidogrel for a minimum of 5 days, and the
device was placed while the patient was under full anticoagulation
Received November 25, 2015; accepted after revision March 23, 2016.
From the Departments of Neurologic Surgery (A.M.B., R.C.P., G.L.) and Radiology(W.B., H.C., D.F.K., G.L.), Mayo Clinic, Rochester, Minnesota.
Please address correspondence to Waleed Brinjikji, MD, Mayo Clinic, Department ofRadiology, 200 First St SW, Rochester, MN 55905; e-mail: [email protected];@wbrinjikji
http://dx.doi.org/10.3174/ajnr.A4835
1866 Burrows Oct 2016 www.ajnr.org
(activated clotting time of 250 –300 seconds). After the procedure,
patients were maintained on dual antiplatelet therapy for 3
months. After 3 months, clopidogrel was discontinued and aspi-
rin was continued indefinitely. The antiplatelet regimen was the
same in all patients. No patient underwent testing for clopidogrel
response except for the lone patient treated with the Surpass de-
vice who underwent the genetic test for CYP219 as part of the
prospective study under which they were treated. All of the pro-
cedures were performed with the patient under general endotra-
cheal anesthesia. A bi- or triaxial access technique was used to
obtain distal access past the segment of the vessel with the targeted
aneurysm. PEDs were sized to match the maximum diameter of
the target vessel. At the discretion of the operators, 1 or multiple
devices were used to maximize the chance of complete aneurysm
occlusion and/or to ensure adequate coverage of the aneurysm
neck and of a segment of parent artery proximal and distal to it
(usually at least 5 mm). DSA was performed at 2 frames per sec-
ond before and after placement of the flow diverter. The lone
patient treated with the Surpass device was treated in accordance
with the Surpass Study Group protocol,11 which was functionally
similar to the operative technique for placement of the PED.
Study OutcomesStudied outcomes included new visual symptoms (including vi-
sion loss and cranial nerve palsy), angiographic occlusion, pa-
tency of the ophthalmic artery at previous angiographic follow-
up, perioperative complications, delayed rupture, postoperative
stroke and intraparenchymal hemorrhage, and long-term clinical
outcomes. All angiographic outcomes were assessed by 1 of 3 se-
nior neurointerventionalists/endovascular neurosurgeons.
Statistical AnalysisNo comparative statistical analysis was performed. Continuous
variables are reported as mean and standard deviation. Categoric
variables are reported as n (%). All analyses were performed by
using JMP 10.0 (SAS Institute, Cary, North Carolina).
RESULTSWe evaluated 50 aneurysms in 48 patients. Flow diversion was
attempted but not deployed in 4 patients (8%) because of vessel
tortuosity in 3 and aneurysm perforation in 1. In total, 46 carotid-
ophthalmic aneurysms were treated in 44 patients, of whom 2
were treated for mirror aneurysms. The mean patient age was
52 � 14 years, and 41 aneurysms (93%) were found in women.
Recurrence after previous non–stent-assisted coiling in patients
with prior SAH was the presenting symptom in 4 of 46 aneurysms
(8.7%). Of all 46 aneurysms, 10 (21.7%) were symptomatic un-
ruptured aneurysms (including 5 causing vision loss or diplopia)
and 32 (69.6%) were asymptomatic unruptured aneurysms.
Of the 46 aneurysms, 24 (52%) were 10 mm or smaller (range,
3.5–10 mm), 21 (45.7%) were large (10 –25 mm), and 1 (2.3%)
was giant (25 mm). Twelve (26.1%) of the aneurysms had been
previously coiled and were treated with the PED for aneurysm
recurrence or as a planned staged procedure. One aneurysm was
treated with the Surpass device and 45 were treated with PED.
Most aneurysms (32 [69.6%]) were treated with 1 device, 9
(19.6%) were treated with 2 devices, and 5 (10.8%) were treated
with 3 devices.
The mean clinical follow-up was 29 � 22 months (range,
0 – 65) and no patient was lost to clinical follow-up. At 12 days, 1
patient with a 21-mm aneurysm died of a delayed distal intrapa-
renchymal hemorrhage not related to aneurysm rupture (proce-
dure related mortality, 2.2%), and 3 patients died of newly diag-
nosed (after the treatment) metastatic cancer at a mean of 40.7
months (range, 31–53 months). There were no delayed aneurysm
ruptures. At 3 months, 1 patient experienced transient peripheral
vision loss, possibly related to ipsilateral embolism from the de-
vice based upon MRI, which showed several small foci of re-
stricted diffusion. She did not experience permanent vision loss.
At 3 and 6 months after PED placement, 2 patients experienced
possible amaurosis fugax that resolved after reestablishing dual
antiplatelet therapy. The ophthalmic artery remained patent in all
these patients. No other ophthalmologic complications were
noted, and aside from the patient who suffered distal intraparen-
chymal hemorrhage, no other patient suffered a permanent neu-
rologic deterioration because of the immediate or delayed effect of
the procedure.
Among the 46 aneurysms, 37 (80.4%) had 6-month angio-
graphic follow-up, which showed complete occlusion in 24
(64.9%) and persistent filling in 13 (35.1%) based on strict angio-
graphic criteria. Exclusion from 6-month angiography was found
for the following reasons: death (1 patient), and refusal (2 pa-
tients). Six patients have not had angiographic follow-up due to
the fact that they were less than 6 months out from the procedure
at the time of this study. At 1 year, 29 of these 37 aneurysms
(78.4%) were completely occluded and 8 (21.6%) showed persis-
tent filling. At 3-year follow-up, 24 of 25 aneurysms (96%) were
occluded (Figure). No aneurysms shown to be occluded were
found to have recanalized on later angiography. Among patients
with angiographic follow-up, the ophthalmic artery was patent in
29 (78.4%). Among the 8 patients in whom ophthalmic artery
occlusion was noted, all had reconstitution of the ophthalmic
artery through collaterals. In 7 patients, this occurred through
external carotid artery collaterals, and in 1 patient, it occurred
through the inferolateral trunk.
DISCUSSIONOur study of 44 patients with 46 ophthalmic segment aneurysms
treated with flow diversion demonstrated high rates of angio-
graphic occlusion with low rates of clinical adverse events, which
included worsening of visual function. Rates of complete occlu-
sion at 6 months, 1 year, and 3 years were 65%, 78%, and 96%,
respectively. Only 1 patient experienced procedure-related mor-
bidity or mortality, and no patients had permanent loss of visual
function after treatment of ophthalmic segment aneurysms. Of 37
aneurysms that had 6-month angiography, there were 8 cases of
ophthalmic artery occlusion after treatment, which were all
asymptomatic. These findings are important because they suggest
that flow diversion of ophthalmic segment aneurysms is safe and
effective. In our opinion, flow diversion is now the treatment of
choice for these aneurysms.
Several recent studies have reported series of patients with
carotid-ophthalmic aneurysms treated by flow diversion. In a
AJNR Am J Neuroradiol 37:1866 – 69 Oct 2016 www.ajnr.org 1867
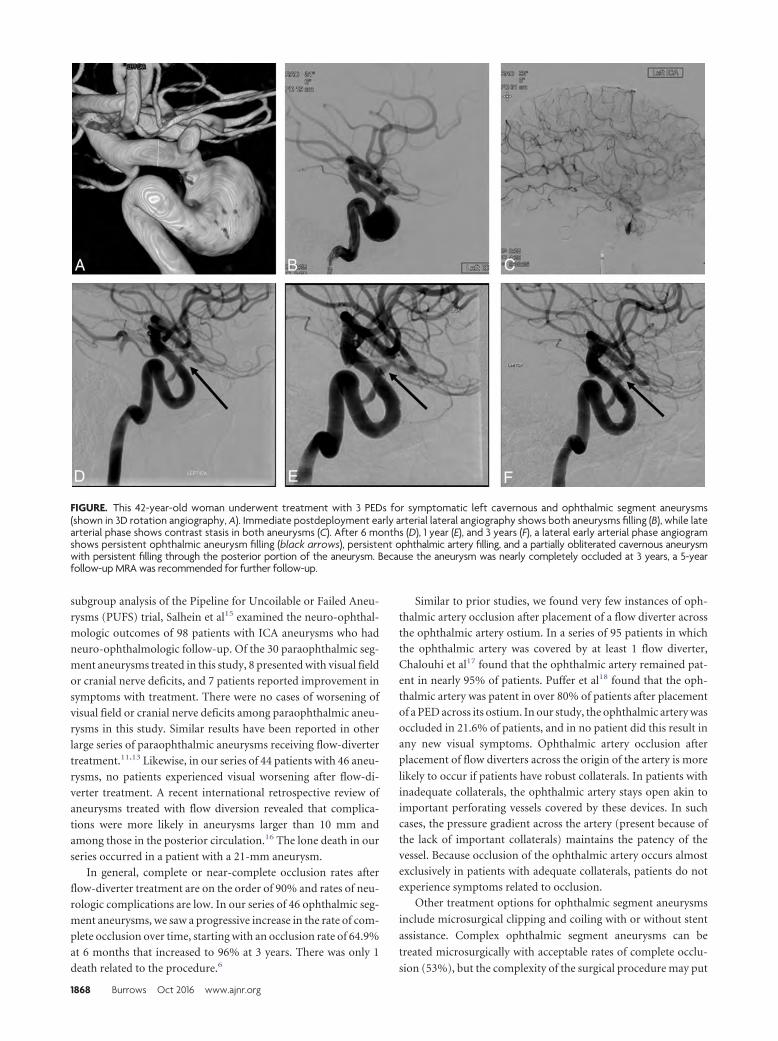
subgroup analysis of the Pipeline for Uncoilable or Failed Aneu-
rysms (PUFS) trial, Salhein et al15 examined the neuro-ophthal-
mologic outcomes of 98 patients with ICA aneurysms who had
neuro-ophthalmologic follow-up. Of the 30 paraophthalmic seg-
ment aneurysms treated in this study, 8 presented with visual field
or cranial nerve deficits, and 7 patients reported improvement in
symptoms with treatment. There were no cases of worsening of
visual field or cranial nerve deficits among paraophthalmic aneu-
rysms in this study. Similar results have been reported in other
large series of paraophthalmic aneurysms receiving flow-diverter
treatment.11,13 Likewise, in our series of 44 patients with 46 aneu-
rysms, no patients experienced visual worsening after flow-di-
verter treatment. A recent international retrospective review of
aneurysms treated with flow diversion revealed that complica-
tions were more likely in aneurysms larger than 10 mm and
among those in the posterior circulation.16 The lone death in our
series occurred in a patient with a 21-mm aneurysm.
In general, complete or near-complete occlusion rates after
flow-diverter treatment are on the order of 90% and rates of neu-
rologic complications are low. In our series of 46 ophthalmic seg-
ment aneurysms, we saw a progressive increase in the rate of com-
plete occlusion over time, starting with an occlusion rate of 64.9%
at 6 months that increased to 96% at 3 years. There was only 1
death related to the procedure.6
Similar to prior studies, we found very few instances of oph-thalmic artery occlusion after placement of a flow diverter acrossthe ophthalmic artery ostium. In a series of 95 patients in whichthe ophthalmic artery was covered by at least 1 flow diverter,Chalouhi et al17 found that the ophthalmic artery remained pat-ent in nearly 95% of patients. Puffer et al18 found that the oph-thalmic artery was patent in over 80% of patients after placementof a PED across its ostium. In our study, the ophthalmic artery wasoccluded in 21.6% of patients, and in no patient did this result inany new visual symptoms. Ophthalmic artery occlusion afterplacement of flow diverters across the origin of the artery is more
likely to occur if patients have robust collaterals. In patients withinadequate collaterals, the ophthalmic artery stays open akin toimportant perforating vessels covered by these devices. In suchcases, the pressure gradient across the artery (present because ofthe lack of important collaterals) maintains the patency of thevessel. Because occlusion of the ophthalmic artery occurs almostexclusively in patients with adequate collaterals, patients do notexperience symptoms related to occlusion.
Other treatment options for ophthalmic segment aneurysms
include microsurgical clipping and coiling with or without stent
assistance. Complex ophthalmic segment aneurysms can be
treated microsurgically with acceptable rates of complete occlu-
sion (53%), but the complexity of the surgical procedure may put
FIGURE. This 42-year-old woman underwent treatment with 3 PEDs for symptomatic left cavernous and ophthalmic segment aneurysms(shown in 3D rotation angiography, A). Immediate postdeployment early arterial lateral angiography shows both aneurysms filling (B), while latearterial phase shows contrast stasis in both aneurysms (C). After 6 months (D), 1 year (E), and 3 years (F), a lateral early arterial phase angiogramshows persistent ophthalmic aneurysm filling (black arrows), persistent ophthalmic artery filling, and a partially obliterated cavernous aneurysmwith persistent filling through the posterior portion of the aneurysm. Because the aneurysm was nearly completely occluded at 3 years, a 5-yearfollow-up MRA was recommended for further follow-up.
1868 Burrows Oct 2016 www.ajnr.org
the patient at risk of worsened visual symptoms postoperatively
(with up to 21% of patients with preoperative visual symptoms
having postoperative worsening in some series).19 Conventional
endovascular coiling for ophthalmic segment aneurysms carries
low risk based on published series (1.4% morbidity, 0% mortal-
ity), but 12% of patients treated via conventional endovascular
coiling required retreatment.20,21
LimitationsOur study is limited by the retrospective nature of the review,
despite the prospectively maintained data base. The data base
used for this study included patients treated with flow diversion
over several years, and procedural techniques as well as aneurysm
morphology deemed amenable to flow diversion have likely
changed over that time. It is unclear what effect these changes
would have on the analysis, but this still should be noted. Visual
field testing was not performed in all patients, and thus, true def-
icits may be underrepresented. Finally, the 1 patient treated with
the Surpass device precludes flow-diverter comparison. Despite
these limitations, our series provides a contemporary snapshot of
results for a specific subset of aneurysms (true carotid-ophthal-
mic aneurysms) in an institution where flow diversion has been
considered the treatment of choice since its inception.
CONCLUSIONSEndovascular flow diversion is a viable treatment option for oph-
thalmic segment aneurysms, resulting in a high rate of complete
or near-complete occlusion and a low rate of complications (spe-
cifically, no permanent visual field deficits). Further studies
examining neuro-opthalmalolgic outcomes after flow-diverter
treatment of paraophthalmic aneurysms would be helpful to con-
firm these findings.
Disclosures: David F. Kallmes—UNRELATED: Board Membership: GE Healthcare(Cost effectiveness board)*; Consultancy: Medtronic,* Comments: Planning and im-plementing clinical trials; Grants/Grants Pending: Microvention,* Medtronic,* Cod-man,* Surmodics,* Sequent,* Neurosigma,* Comments: Preclinical research and clin-ical trials; Travel/Accommodations/Meeting Expenses Unrelated to ActivitiesListed: Medtronic,* Comments: Presentation at FDA panel meeting. GiuseppeLanzino—UNRELATED: Consultancy: Covidien/Medtronic.* *Money paid to theinstitution.
REFERENCES1. D’Urso PI, Lanzino G, Cloft HJ, et al. Flow diversion for intracranial
aneurysms: a review. Stroke 2011;42:2363– 68 CrossRef Medline2. Fang S, Lanzino G. Paraclinoid aneurysms: is there a new endovas-
cular standard? Neurol Res 2014;36:314 –22 CrossRef Medline3. Wakhloo AK, Tio FO, Lieber BB, et al. Self-expanding nitinol stents
in canine vertebral arteries: hemodynamics and tissue response.AJNR Am J Neuroradiol 1995;16:1043–51 Medline
4. Kallmes DF, Ding YH, Dai D, et al. A new endoluminal, flow-dis-rupting device for treatment of saccular aneurysms. Stroke 2007;38:2346 –52 CrossRef Medline
5. Trager AL, Sadasivan C, Seong J, et al. Correlation between angio-
graphic and particle image velocimetry quantifications of flow di-verters in an in vitro model of elastase-induced rabbit aneurysms.J Biomech Eng 2009;131:034506 CrossRef Medline
6. Becske T, Kallmes DF, Saatci I, et al. Pipeline for uncoilable or failedaneurysms: results from a multicenter clinical trial. Radiology 2013;267:858 – 68 CrossRef Medline
7. Lubicz B, Collignon L, Raphaeli G, et al. Pipeline flow-diverter stentfor endovascular treatment of intracranial aneurysms: preliminaryexperience in 20 patients with 27 aneurysms. World Neurosurg 2011;76:114 –19 CrossRef Medline
8. Lylyk P, Miranda C, Ceratto R, et al. Curative endovascular recon-struction of cerebral aneurysms with the Pipeline embolizationdevice: the Buenos Aires experience. Neurosurgery 2009;64:632– 42;discussion 642– 43 CrossRef Medline
9. Nelson PK, Lylyk P, Szikora I, et al. The Pipeline embolization devicefor the intracranial treatment of aneurysms trial. AJNR Am J Neu-roradiol 2011;32:34 – 40 CrossRef Medline
10. Szikora I, Berentei Z, Kulcsar Z, et al. Treatment of intracranial an-eurysms by functional reconstruction of the parent artery: the Bu-dapest experience with the Pipeline embolization device. AJNRAm J Neuroradiol 2010;31:1139 – 47 CrossRef Medline
11. Wakhloo AK, Lylyk P, de Vries J, et al. Surpass flow diverter in thetreatment of intracranial aneurysms: a prospective multicenterstudy. AJNR Am J Neuroradiol 2015;36:98 –107 CrossRef Medline
12. Moon K, Albuquerque FC, Ducruet AF, et al. Treatment of ophthal-mic segment carotid aneurysms using the Pipeline embolizationdevice: clinical and angiographic follow-up. Neurol Res 2014;36:344 –50 CrossRef Medline
13. Zanaty M, Chalouhi N, Barros G, et al. Flow-diversion for ophthal-mic segment aneurysms. Neurosurgery 2015;76:286 – 89 CrossRefMedline
14. Burrows AM, Cloft H, Kallmes DF, et al. Periprocedural and mid-term technical and clinical events after flow diversion for intracra-nial aneurysms. J Neurointerv Surg 2015;7:646 –51 CrossRef Medline
15. Sahlein DH, Fouladvand M, Becske T, et al. Neuroophthalmologicaloutcomes associated with use of the Pipeline embolization device:analysis of the PUFS trial results. J Neurosurg 2015;123:897–905CrossRef Medline
16. Kallmes DF, Hanel R, Lopes D, et al. International retrospectivestudy of the Pipeline embolization device: a multicenter aneurysmtreatment study. AJNR Am J Neuroradiol 2015;36:108 –15 CrossRefMedline
17. Chalouhi N, Daou B, Kung D, et al. Fate of the ophthalmic arteryafter treatment with the Pipeline embolization device. Neurosurgery2015;77:581– 84; discussion 584 CrossRef Medline
18. Puffer RC, Kallmes DF, Cloft HJ, et al. Patency of the ophthalmicartery after flow diversion treatment of paraclinoid aneurysms.J Neurosurg 2012;116:892–96 CrossRef Medline
19. Mattingly T, Kole MK, Nicolle D, et al. Visual outcomes for surgicaltreatment of large and giant carotid ophthalmic segmentaneurysms: a case series utilizing retrograde suction decompres-sion (the “Dallas technique”). J Neurosurg 2013;118:937– 46CrossRef Medline
20. Lai LT, Morgan MK. Outcomes for unruptured ophthalmic seg-ment aneurysm surgery. J Clin Neurosci 2013;20:1127–33 CrossRefMedline
21. Yadla S, Campbell PG, Grobelny B, et al. Open and endovasculartreatment of unruptured carotid-ophthalmic aneurysms: clinicaland radiographic outcomes. Neurosurgery 2011;68:1434 – 43; discus-sion 1443 CrossRef Medline
AJNR Am J Neuroradiol 37:1866 – 69 Oct 2016 www.ajnr.org 1869
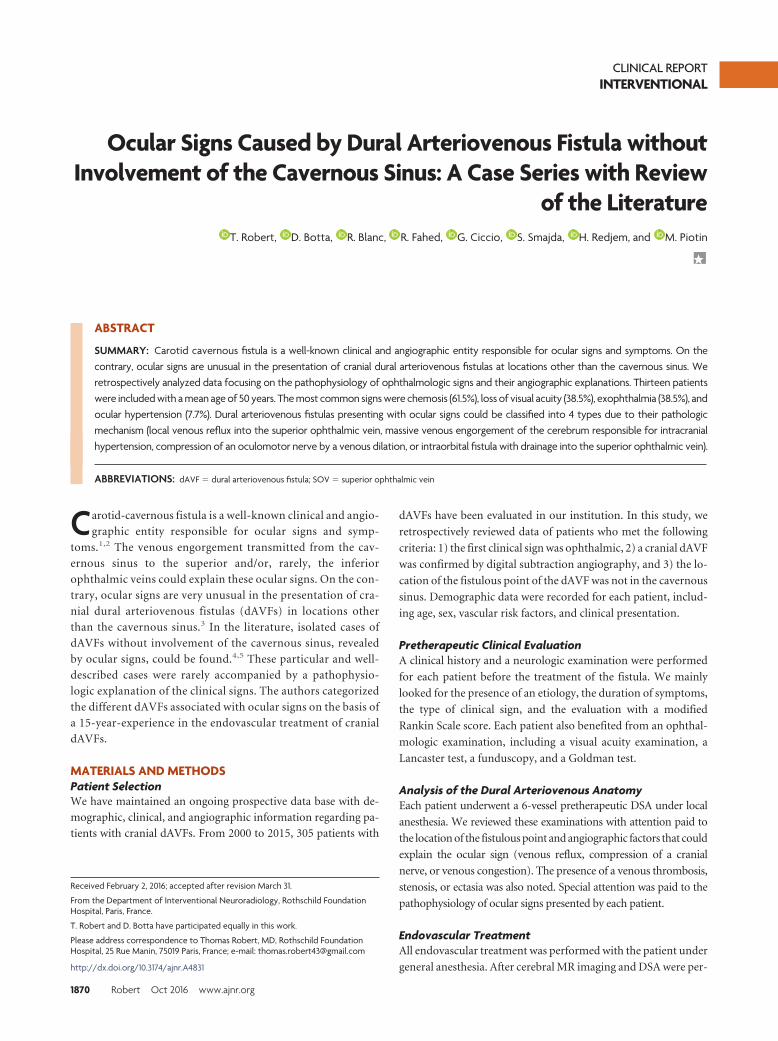
CLINICAL REPORTINTERVENTIONAL
Ocular Signs Caused by Dural Arteriovenous Fistula withoutInvolvement of the Cavernous Sinus: A Case Series with Review
of the LiteratureX T. Robert, X D. Botta, X R. Blanc, X R. Fahed, X G. Ciccio, X S. Smajda, X H. Redjem, and X M. Piotin
ABSTRACT
SUMMARY: Carotid cavernous fistula is a well-known clinical and angiographic entity responsible for ocular signs and symptoms. On thecontrary, ocular signs are unusual in the presentation of cranial dural arteriovenous fistulas at locations other than the cavernous sinus. Weretrospectively analyzed data focusing on the pathophysiology of ophthalmologic signs and their angiographic explanations. Thirteen patientswere included with a mean age of 50 years. The most common signs were chemosis (61.5%), loss of visual acuity (38.5%), exophthalmia (38.5%), andocular hypertension (7.7%). Dural arteriovenous fistulas presenting with ocular signs could be classified into 4 types due to their pathologicmechanism (local venous reflux into the superior ophthalmic vein, massive venous engorgement of the cerebrum responsible for intracranialhypertension, compression of an oculomotor nerve by a venous dilation, or intraorbital fistula with drainage into the superior ophthalmic vein).
ABBREVIATIONS: dAVF � dural arteriovenous fistula; SOV � superior ophthalmic vein
Carotid-cavernous fistula is a well-known clinical and angio-
graphic entity responsible for ocular signs and symp-
toms.1,2 The venous engorgement transmitted from the cav-
ernous sinus to the superior and/or, rarely, the inferior
ophthalmic veins could explain these ocular signs. On the con-
trary, ocular signs are very unusual in the presentation of cra-
nial dural arteriovenous fistulas (dAVFs) in locations other
than the cavernous sinus.3 In the literature, isolated cases of
dAVFs without involvement of the cavernous sinus, revealed
by ocular signs, could be found.4,5 These particular and well-
described cases were rarely accompanied by a pathophysio-
logic explanation of the clinical signs. The authors categorized
the different dAVFs associated with ocular signs on the basis of
a 15-year-experience in the endovascular treatment of cranial
dAVFs.
MATERIALS AND METHODSPatient SelectionWe have maintained an ongoing prospective data base with de-
mographic, clinical, and angiographic information regarding pa-
tients with cranial dAVFs. From 2000 to 2015, 305 patients with
dAVFs have been evaluated in our institution. In this study, we
retrospectively reviewed data of patients who met the following
criteria: 1) the first clinical sign was ophthalmic, 2) a cranial dAVF
was confirmed by digital subtraction angiography, and 3) the lo-
cation of the fistulous point of the dAVF was not in the cavernous
sinus. Demographic data were recorded for each patient, includ-
ing age, sex, vascular risk factors, and clinical presentation.
Pretherapeutic Clinical EvaluationA clinical history and a neurologic examination were performed
for each patient before the treatment of the fistula. We mainly
looked for the presence of an etiology, the duration of symptoms,
the type of clinical sign, and the evaluation with a modified
Rankin Scale score. Each patient also benefited from an ophthal-
mologic examination, including a visual acuity examination, a
Lancaster test, a funduscopy, and a Goldman test.
Analysis of the Dural Arteriovenous AnatomyEach patient underwent a 6-vessel pretherapeutic DSA under local
anesthesia. We reviewed these examinations with attention paid to
the location of the fistulous point and angiographic factors that could
explain the ocular sign (venous reflux, compression of a cranial
nerve, or venous congestion). The presence of a venous thrombosis,
stenosis, or ectasia was also noted. Special attention was paid to the
pathophysiology of ocular signs presented by each patient.
Endovascular TreatmentAll endovascular treatment was performed with the patient under
general anesthesia. After cerebral MR imaging and DSA were per-
Received February 2, 2016; accepted after revision March 31.
From the Department of Interventional Neuroradiology, Rothschild FoundationHospital, Paris, France.
T. Robert and D. Botta have participated equally in this work.
Please address correspondence to Thomas Robert, MD, Rothschild FoundationHospital, 25 Rue Manin, 75019 Paris, France; e-mail: [email protected]
http://dx.doi.org/10.3174/ajnr.A4831
1870 Robert Oct 2016 www.ajnr.org
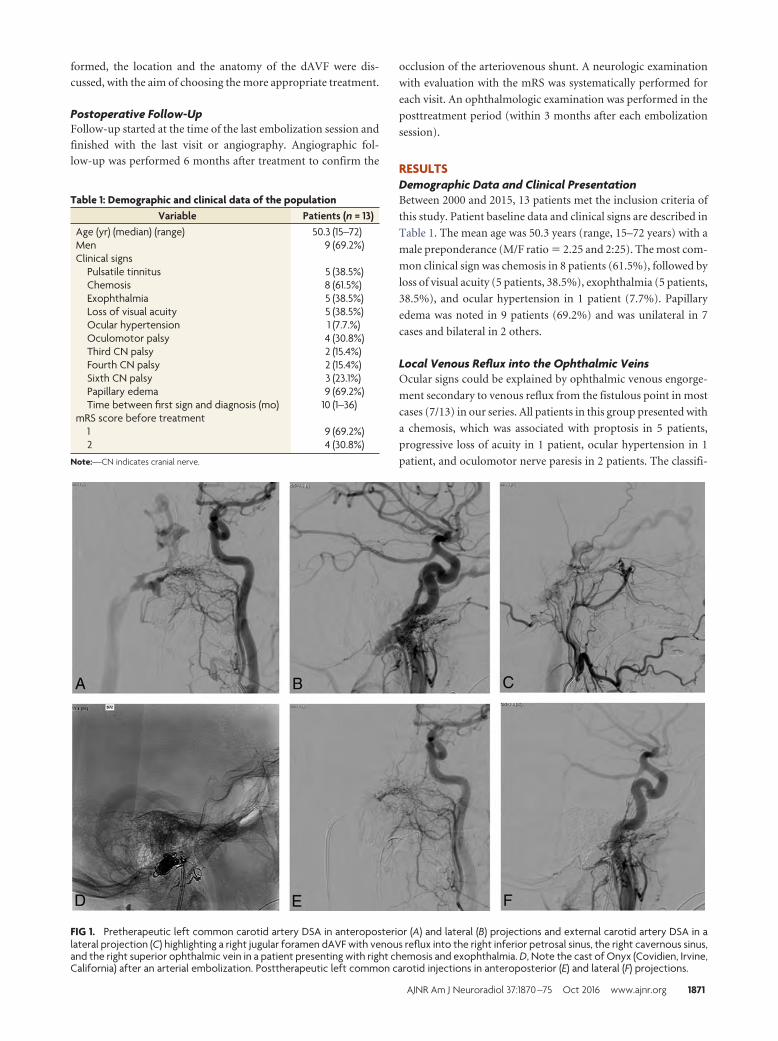
formed, the location and the anatomy of the dAVF were dis-
cussed, with the aim of choosing the more appropriate treatment.
Postoperative Follow-UpFollow-up started at the time of the last embolization session and
finished with the last visit or angiography. Angiographic fol-
low-up was performed 6 months after treatment to confirm the
occlusion of the arteriovenous shunt. A neurologic examination
with evaluation with the mRS was systematically performed for
each visit. An ophthalmologic examination was performed in the
posttreatment period (within 3 months after each embolization
session).
RESULTSDemographic Data and Clinical PresentationBetween 2000 and 2015, 13 patients met the inclusion criteria of
this study. Patient baseline data and clinical signs are described in
Table 1. The mean age was 50.3 years (range, 15–72 years) with a
male preponderance (M/F ratio � 2.25 and 2:25). The most com-
mon clinical sign was chemosis in 8 patients (61.5%), followed by
loss of visual acuity (5 patients, 38.5%), exophthalmia (5 patients,
38.5%), and ocular hypertension in 1 patient (7.7%). Papillary
edema was noted in 9 patients (69.2%) and was unilateral in 7
cases and bilateral in 2 others.
Local Venous Reflux into the Ophthalmic VeinsOcular signs could be explained by ophthalmic venous engorge-
ment secondary to venous reflux from the fistulous point in most
cases (7/13) in our series. All patients in this group presented with
a chemosis, which was associated with proptosis in 5 patients,
progressive loss of acuity in 1 patient, ocular hypertension in 1
patient, and oculomotor nerve paresis in 2 patients. The classifi-
FIG 1. Pretherapeutic left common carotid artery DSA in anteroposterior (A) and lateral (B) projections and external carotid artery DSA in alateral projection (C) highlighting a right jugular foramen dAVF with venous reflux into the right inferior petrosal sinus, the right cavernous sinus,and the right superior ophthalmic vein in a patient presenting with right chemosis and exophthalmia. D, Note the cast of Onyx (Covidien, Irvine,California) after an arterial embolization. Posttherapeutic left common carotid injections in anteroposterior (E) and lateral (F) projections.
Table 1: Demographic and clinical data of the populationVariable Patients (n = 13)
Age (yr) (median) (range) 50.3 (15–72)Men 9 (69.2%)Clinical signs
Pulsatile tinnitus 5 (38.5%)Chemosis 8 (61.5%)Exophthalmia 5 (38.5%)Loss of visual acuity 5 (38.5%)Ocular hypertension 1 (7.7.%)Oculomotor palsy 4 (30.8%)Third CN palsy 2 (15.4%)Fourth CN palsy 2 (15.4%)Sixth CN palsy 3 (23.1%)Papillary edema 9 (69.2%)Time between first sign and diagnosis (mo) 10 (1–36)
mRS score before treatment1 9 (69.2%)2 4 (30.8%)
Note:—CN indicates cranial nerve.
AJNR Am J Neuroradiol 37:1870 –75 Oct 2016 www.ajnr.org 1871
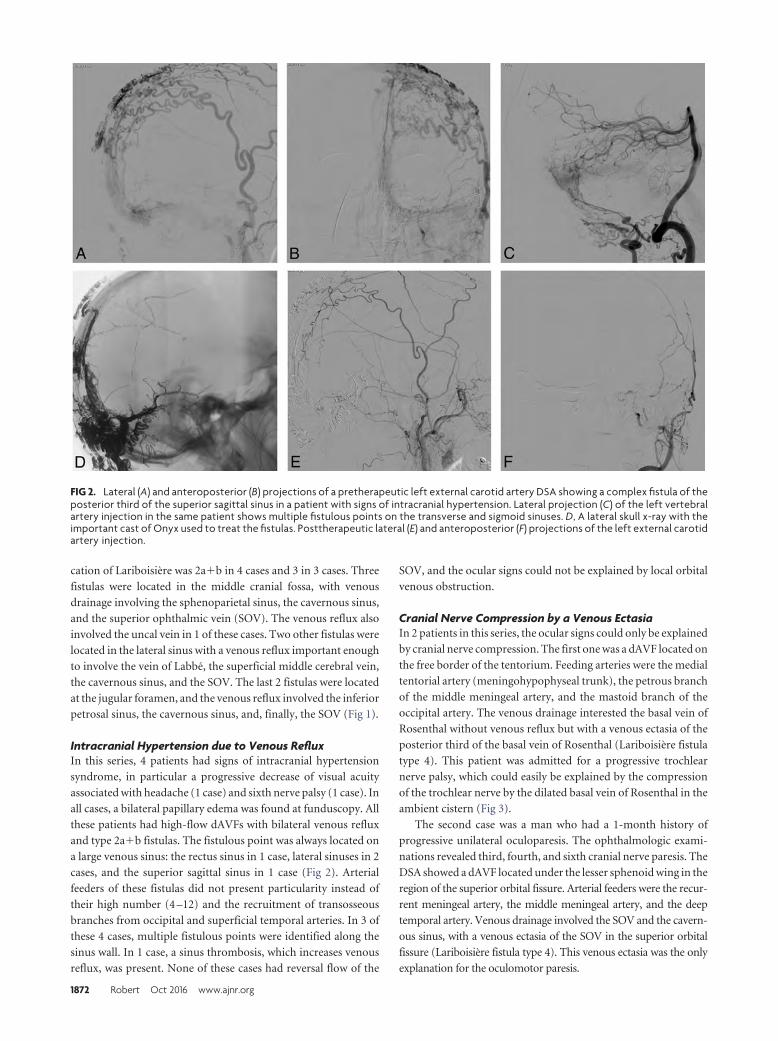
cation of Lariboisiere was 2a�b in 4 cases and 3 in 3 cases. Three
fistulas were located in the middle cranial fossa, with venous
drainage involving the sphenoparietal sinus, the cavernous sinus,
and the superior ophthalmic vein (SOV). The venous reflux also
involved the uncal vein in 1 of these cases. Two other fistulas were
located in the lateral sinus with a venous reflux important enough
to involve the vein of Labbe, the superficial middle cerebral vein,
the cavernous sinus, and the SOV. The last 2 fistulas were located
at the jugular foramen, and the venous reflux involved the inferior
petrosal sinus, the cavernous sinus, and, finally, the SOV (Fig 1).
Intracranial Hypertension due to Venous RefluxIn this series, 4 patients had signs of intracranial hypertension
syndrome, in particular a progressive decrease of visual acuity
associated with headache (1 case) and sixth nerve palsy (1 case). In
all cases, a bilateral papillary edema was found at funduscopy. All
these patients had high-flow dAVFs with bilateral venous reflux
and type 2a�b fistulas. The fistulous point was always located on
a large venous sinus: the rectus sinus in 1 case, lateral sinuses in 2
cases, and the superior sagittal sinus in 1 case (Fig 2). Arterial
feeders of these fistulas did not present particularity instead of
their high number (4 –12) and the recruitment of transosseous
branches from occipital and superficial temporal arteries. In 3 of
these 4 cases, multiple fistulous points were identified along the
sinus wall. In 1 case, a sinus thrombosis, which increases venous
reflux, was present. None of these cases had reversal flow of the
SOV, and the ocular signs could not be explained by local orbital
venous obstruction.
Cranial Nerve Compression by a Venous EctasiaIn 2 patients in this series, the ocular signs could only be explained
by cranial nerve compression. The first one was a dAVF located on
the free border of the tentorium. Feeding arteries were the medial
tentorial artery (meningohypophyseal trunk), the petrous branch
of the middle meningeal artery, and the mastoid branch of the
occipital artery. The venous drainage interested the basal vein of
Rosenthal without venous reflux but with a venous ectasia of the
posterior third of the basal vein of Rosenthal (Lariboisiere fistula
type 4). This patient was admitted for a progressive trochlear
nerve palsy, which could easily be explained by the compression
of the trochlear nerve by the dilated basal vein of Rosenthal in the
ambient cistern (Fig 3).
The second case was a man who had a 1-month history of
progressive unilateral oculoparesis. The ophthalmologic exami-
nations revealed third, fourth, and sixth cranial nerve paresis. The
DSA showed a dAVF located under the lesser sphenoid wing in the
region of the superior orbital fissure. Arterial feeders were the recur-
rent meningeal artery, the middle meningeal artery, and the deep
temporal artery. Venous drainage involved the SOV and the cavern-
ous sinus, with a venous ectasia of the SOV in the superior orbital
fissure (Lariboisiere fistula type 4). This venous ectasia was the only
explanation for the oculomotor paresis.
FIG 2. Lateral (A) and anteroposterior (B) projections of a pretherapeutic left external carotid artery DSA showing a complex fistula of theposterior third of the superior sagittal sinus in a patient with signs of intracranial hypertension. Lateral projection (C) of the left vertebralartery injection in the same patient shows multiple fistulous points on the transverse and sigmoid sinuses. D, A lateral skull x-ray with theimportant cast of Onyx used to treat the fistulas. Posttherapeutic lateral (E) and anteroposterior (F) projections of the left external carotidartery injection.
1872 Robert Oct 2016 www.ajnr.org
Treatment of the PathologyTreatment details and outcome are summarized in Table 2. Every
patient was treated by endovascular therapy. Twenty-three embo-
lization sessions were necessary to treat the fistulas. Seven patients
were successfully treated in 1 session, 4 patients had 2 sessions,
and 2 fistulas needed 3 sessions to be completely obliterated. One
patient was treated by microsurgical exclusion of a middle cranial
fossa fistula after failed embolization.
An arterial approach was used in 8 sessions; a venous ap-
proach, in 14 patients; and a combined approach, in 1 patient. The
overall success rate per embolization session was 52.2% (12 em-
bolization sessions). In 4 patients (15.4%), the fistula persisted
after the injection of the embolic agent, and in 2 patients (7.7%),
the venous access to the fistula was impossible. Among these 4
patients, in 2, a partial embolization was planned to reduce the
venous reflux and to decrease the intracranial pressure. In 2 pa-
tients (8.8%), the implantation of coils in an arterial feeder near
the fistulous point was sufficient to obliterate the fistula.
Clinical and Angiographic Follow-UpThe fistula was cured at the 6-month follow-up DSA in 11 cases
(78.5%). A partial embolization was planned for 2 patients who
had a complex dAVF and intracranial hypertension.
Neurologic complications were found after 2 embolization
sessions. One patient with a tentorial fistula developed an exten-
sive venous thrombosis a few hours after
the embolization, responsible for a
hemiplegia and multiple cranial nerve
palsies. This patient was dependent and
died 1 year after the treatment. The
other patient with a complication had a
middle cranial fossa dAVF treated by
coils and Glubran Tiss (Aspide Medical,
La Talaudiere, France). Twenty-four
hours after the treatment, she developed
a temporal lobe hematoma with a con-
tralateral hemiparesis (mRS 3). The
mean clinical follow-up was 10.1
months (range, 1– 48 months). At the
last follow-up visit, 3 patients had mRS
0; 6, mRS 1; 2, mRS 2; 1, mRS 3; and 1,
mRS 6. The ophthalmologic examina-
tion findings 3 months after treatment
were normal in 8 patients.
DISCUSSIONCranial dural arteriovenous fistulas are
often symptomatic, with a pulsatile tin-
nitus with or without headache, focal
neurologic deficit, or compressive
signs.1,3,6 The occurrence of an intrace-
rebral hematoma is also a well-known
entity, in particular in cases of venous
reflux, cortical vein involvement, or ve-
nous ectasia.1 In rare cases, a dAVF
could be symptomatic by ocular signs
such as chemosis, exophthalmia, loss of
visual acuity, or oculomotor nerve
palsy.5 The literature of these dAVFs is exclusively represented by
case reports and small case series.3,16,19 These articles generally
described the symptoms and angiographic anatomy of the fistula
well but detailed analysis of the pathophysiology was always
missed except for the series of Cognard et al.4
The first and most frequent type of fistula in our series oc-
curred when the ocular signs could be explained by a direct ve-
nous reflux into the orbital veins. This was also the most frequent
type in the literature.7 These fistulas are generally located on the
transverse sinus,8 with a reflux through the vein of Labbe or at the
foramen magnum. For a venous reflux to produce orbital venous
hypertension, thrombosis or noncompetence of a large venous
collector (jugular bulb or transverse sinus) is necessary. The mid-
dle cranial fossa is also described with reflux into the sphenopari-
etal sinus.3 The anatomic variant of the paracavernous sinus
could be an important factor in venous reflux into the superior
orbital vein. Two case reports9,10 of tentorial dAVFs with venous
reflux into a basal vein, an uncal vein, and a superior ophthalmic
vein are also described, but they seem to be rare. The importance
of the venous reflux and the high frequency of venous ectasia in
these fistulas are 2 reasons for aggressive management. These fis-
tulas were treated by an arterial approach in all cases described. In
the literature and in our series, ocular symptoms and signs were
reversible after endovascular treatment of the fistula. With a sim-
FIG 3. Pretherapeutic lateral projections of the right external (A) and internal (B) carotid arteryDSA highlighting a tentorial dAVF with venous ectasia of the third portion of the basal vein in apatient with a trochlear nerve deficit. C, Note the cast of Onyx (Covidien, Irvine, California) afterinjection through the middle meningeal artery branches. D, Posttherapeutic right external carotidartery DSA in a lateral projection without a residual fistula.
AJNR Am J Neuroradiol 37:1870 –75 Oct 2016 www.ajnr.org 1873
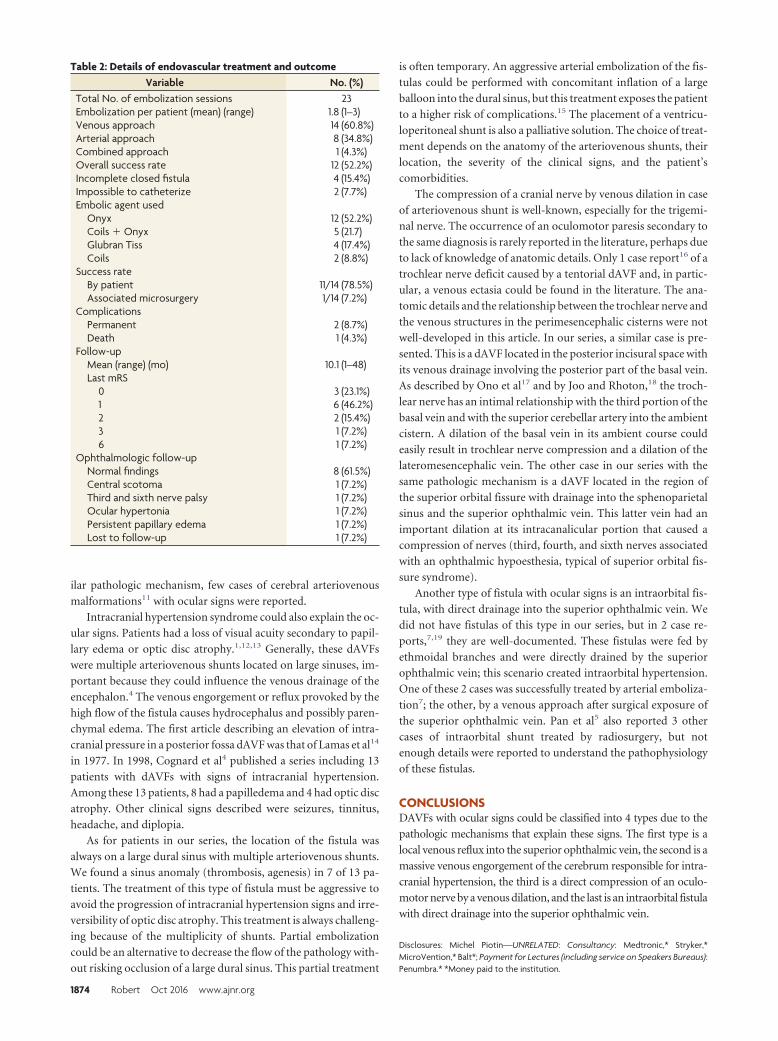
ilar pathologic mechanism, few cases of cerebral arteriovenous
malformations11 with ocular signs were reported.
Intracranial hypertension syndrome could also explain the oc-
ular signs. Patients had a loss of visual acuity secondary to papil-
lary edema or optic disc atrophy.1,12,13 Generally, these dAVFs
were multiple arteriovenous shunts located on large sinuses, im-
portant because they could influence the venous drainage of the
encephalon.4 The venous engorgement or reflux provoked by the
high flow of the fistula causes hydrocephalus and possibly paren-
chymal edema. The first article describing an elevation of intra-
cranial pressure in a posterior fossa dAVF was that of Lamas et al14
in 1977. In 1998, Cognard et al4 published a series including 13
patients with dAVFs with signs of intracranial hypertension.
Among these 13 patients, 8 had a papilledema and 4 had optic disc
atrophy. Other clinical signs described were seizures, tinnitus,
headache, and diplopia.
As for patients in our series, the location of the fistula was
always on a large dural sinus with multiple arteriovenous shunts.
We found a sinus anomaly (thrombosis, agenesis) in 7 of 13 pa-
tients. The treatment of this type of fistula must be aggressive to
avoid the progression of intracranial hypertension signs and irre-
versibility of optic disc atrophy. This treatment is always challeng-
ing because of the multiplicity of shunts. Partial embolization
could be an alternative to decrease the flow of the pathology with-
out risking occlusion of a large dural sinus. This partial treatment
is often temporary. An aggressive arterial embolization of the fis-
tulas could be performed with concomitant inflation of a large
balloon into the dural sinus, but this treatment exposes the patient
to a higher risk of complications.15 The placement of a ventricu-
loperitoneal shunt is also a palliative solution. The choice of treat-
ment depends on the anatomy of the arteriovenous shunts, their
location, the severity of the clinical signs, and the patient’s
comorbidities.
The compression of a cranial nerve by venous dilation in case
of arteriovenous shunt is well-known, especially for the trigemi-
nal nerve. The occurrence of an oculomotor paresis secondary to
the same diagnosis is rarely reported in the literature, perhaps due
to lack of knowledge of anatomic details. Only 1 case report16 of a
trochlear nerve deficit caused by a tentorial dAVF and, in partic-
ular, a venous ectasia could be found in the literature. The ana-
tomic details and the relationship between the trochlear nerve and
the venous structures in the perimesencephalic cisterns were not
well-developed in this article. In our series, a similar case is pre-
sented. This is a dAVF located in the posterior incisural space with
its venous drainage involving the posterior part of the basal vein.
As described by Ono et al17 and by Joo and Rhoton,18 the troch-
lear nerve has an intimal relationship with the third portion of the
basal vein and with the superior cerebellar artery into the ambient
cistern. A dilation of the basal vein in its ambient course could
easily result in trochlear nerve compression and a dilation of the
lateromesencephalic vein. The other case in our series with the
same pathologic mechanism is a dAVF located in the region of
the superior orbital fissure with drainage into the sphenoparietal
sinus and the superior ophthalmic vein. This latter vein had an
important dilation at its intracanalicular portion that caused a
compression of nerves (third, fourth, and sixth nerves associated
with an ophthalmic hypoesthesia, typical of superior orbital fis-
sure syndrome).
Another type of fistula with ocular signs is an intraorbital fis-
tula, with direct drainage into the superior ophthalmic vein. We
did not have fistulas of this type in our series, but in 2 case re-
ports,7,19 they are well-documented. These fistulas were fed by
ethmoidal branches and were directly drained by the superior
ophthalmic vein; this scenario created intraorbital hypertension.
One of these 2 cases was successfully treated by arterial emboliza-
tion7; the other, by a venous approach after surgical exposure of
the superior ophthalmic vein. Pan et al5 also reported 3 other
cases of intraorbital shunt treated by radiosurgery, but not
enough details were reported to understand the pathophysiology
of these fistulas.
CONCLUSIONSDAVFs with ocular signs could be classified into 4 types due to the
pathologic mechanisms that explain these signs. The first type is a
local venous reflux into the superior ophthalmic vein, the second is a
massive venous engorgement of the cerebrum responsible for intra-
cranial hypertension, the third is a direct compression of an oculo-
motor nerve by a venous dilation, and the last is an intraorbital fistula
with direct drainage into the superior ophthalmic vein.
Disclosures: Michel Piotin—UNRELATED: Consultancy: Medtronic,* Stryker,*MicroVention,* Balt*; Payment for Lectures (including service on Speakers Bureaus):Penumbra.* *Money paid to the institution.
Table 2: Details of endovascular treatment and outcomeVariable No. (%)
Total No. of embolization sessions 23Embolization per patient (mean) (range) 1.8 (1–3)Venous approach 14 (60.8%)Arterial approach 8 (34.8%)Combined approach 1 (4.3%)Overall success rate 12 (52.2%)Incomplete closed fistula 4 (15.4%)Impossible to catheterize 2 (7.7%)Embolic agent used
Onyx 12 (52.2%)Coils � Onyx 5 (21.7)Glubran Tiss 4 (17.4%)Coils 2 (8.8%)
Success rateBy patient 11/14 (78.5%)Associated microsurgery 1/14 (7.2%)
ComplicationsPermanent 2 (8.7%)Death 1 (4.3%)
Follow-upMean (range) (mo) 10.1 (1–48)Last mRS
0 3 (23.1%)1 6 (46.2%)2 2 (15.4%)3 1 (7.2%)6 1 (7.2%)
Ophthalmologic follow-upNormal findings 8 (61.5%)Central scotoma 1 (7.2%)Third and sixth nerve palsy 1 (7.2%)Ocular hypertonia 1 (7.2%)Persistent papillary edema 1 (7.2%)Lost to follow-up 1 (7.2%)
1874 Robert Oct 2016 www.ajnr.org
REFERENCES1. Awad IA, Little JR, Akarawi WP, et al. Intracranial dural arterio-
venous malformations: factors predisposing to an aggressive neu-rological course. J Neurosurg 1990;72:839 –50 Medline
2. Cognard C, Gobin YP, Pierot L, et al. Cerebral dural arteriovenousfistulas: clinical and angiographic correlation with a revised classi-fication of venous drainage. Radiology 1995;194:671– 80 Medline
3. Hayreh SS. Ocular Vascular Occlusion Disorders. New York: Springer;2015
4. Cognard C, Casasco A, Toevi M, et al. Dural arteriovenous fistulas asa cause of intracranial hypertension due to impairment of cranialvenous outflow. J Neurol Neurosurg Psychiatry 1998;65:308 –16Medline
5. Pan HC, Sun MH, Chen WH, et al. Minimally invasive ap-proaches to treating chemosis of the eyes from unusual duralarteriovenous fistulae. Minim Invasive Neurosurg 2009;52:222–28CrossRef Medline
6. Gandhi D, Chen J, Pearl M, et al. Intracranial dural arteriovenousfistulas: classification, imaging findings, and treatment. AJNR Am JNeuroradiol 2012;33:1007–13 CrossRef Medline
7. Inoue A, Tagawa M, Kumon Y, et al. Ethmoidal dural arteriovenousfistula with unusual drainage route treated by transarterial embo-lization. J Neurointerv Surg 2015;7:e15 CrossRef Medline
8. Feyissa AM, Ponce LL, Patterson JT, et al. Dural arteriovenous fis-tula presenting with exophthalmos and seizures. J Neurol Sci 2014;338:229 –31 CrossRef Medline
9. Benndorf G, Schmidt S, Sollmann WP, et al. Tentorial dural arterio-venous fistula presenting with various visual symptoms related toanterior and posterior visual pathway dysfunction: case report.Neurosurgery 2003;53:222–26; discussion 226 –27 Medline
10. Iizuka Y, Maehara T, Hishii M, et al. Successful transarterial glue
embolisation by wedged technique for a tentorial dural arterio-venous fistula presenting with a conjunctival injection. Neuroradi-ology 2001;43:677–79 Medline
11. Gregory ME, Berry-Brincat A, Ghosh YK, et al. An arteriovenousmalformation masquerading as a carotid-cavernous sinus fistula.Am J Ophthalmol 2005;140:548 –50 Medline
12. Biousse V, Mendicino ME, Simon DJ, et al. The ophthalmology ofintracranial vascular abnormalities. Am J Ophthalmol 1998;125:527– 44 Medline
13. Gelwan MJ, Choi IS, Berenstein A, et al. Dural arteriovenous mal-formations and papilledema. Neurosurgery 1988;22:1079 – 84Medline
14. Lamas E, Lobato RD, Esperarza J, et al. Dural posterior fossa AVMproducing raised sagittal simus pressure: case report. J Neurosurg1977;46:804 –10 Medline
15. Zako M, Murata K, Inukai T, et al. Long-term progressive deterio-ration of visual function after papilledema improved by emboliza-tion of a dural arteriovenous fistula in the sigmoid sinus: a casereport. J Med Case Rep 2014;8:392 CrossRef Medline
16. Mariniello G, Briganti F, Vergara P, et al. Dural tentorial arterio-venous fistula causing isolated trochlear nerve palsy: remissionafter endovascular embolization. J Neurointerv Surg 2012;4:e5CrossRef Medline
17. Ono M, Rhoton AL Jr, Peace D, et al. Microsurgical anatomy of thedeep venous system of the brain. Neurosurgery 1984;15:621–57Medline
18. Joo W, Rhoton AL Jr. Microsurgical anatomy of the trochlear nerve.Clin Anat 2015;28:857– 64 CrossRef Medline
19. Daou B, Chalouhi N, Williams K, et al. An unusual case of an eth-moidal arteriovenous fistula draining into the superior ophthalmicvein. Neurosurgery 2015 Aug 6. [Epub ahead of print] Medline
AJNR Am J Neuroradiol 37:1870 –75 Oct 2016 www.ajnr.org 1875
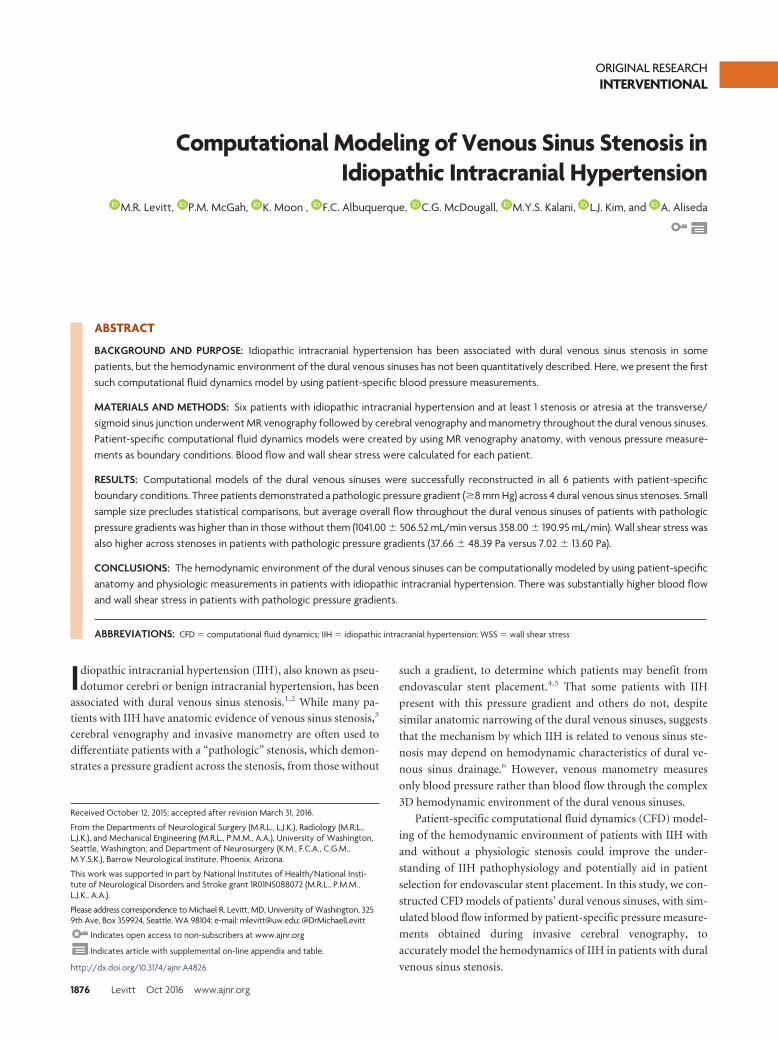
ORIGINAL RESEARCHINTERVENTIONAL
Computational Modeling of Venous Sinus Stenosis inIdiopathic Intracranial Hypertension
X M.R. Levitt, X P.M. McGah, X K. Moon , X F.C. Albuquerque, X C.G. McDougall, X M.Y.S. Kalani, X L.J. Kim, and X A. Aliseda
ABSTRACT
BACKGROUND AND PURPOSE: Idiopathic intracranial hypertension has been associated with dural venous sinus stenosis in somepatients, but the hemodynamic environment of the dural venous sinuses has not been quantitatively described. Here, we present the firstsuch computational fluid dynamics model by using patient-specific blood pressure measurements.
MATERIALS AND METHODS: Six patients with idiopathic intracranial hypertension and at least 1 stenosis or atresia at the transverse/sigmoid sinus junction underwent MR venography followed by cerebral venography and manometry throughout the dural venous sinuses.Patient-specific computational fluid dynamics models were created by using MR venography anatomy, with venous pressure measure-ments as boundary conditions. Blood flow and wall shear stress were calculated for each patient.
RESULTS: Computational models of the dural venous sinuses were successfully reconstructed in all 6 patients with patient-specificboundary conditions. Three patients demonstrated a pathologic pressure gradient (�8 mm Hg) across 4 dural venous sinus stenoses. Smallsample size precludes statistical comparisons, but average overall flow throughout the dural venous sinuses of patients with pathologicpressure gradients was higher than in those without them (1041.00 � 506.52 mL/min versus 358.00 � 190.95 mL/min). Wall shear stress wasalso higher across stenoses in patients with pathologic pressure gradients (37.66 � 48.39 Pa versus 7.02 � 13.60 Pa).
CONCLUSIONS: The hemodynamic environment of the dural venous sinuses can be computationally modeled by using patient-specificanatomy and physiologic measurements in patients with idiopathic intracranial hypertension. There was substantially higher blood flowand wall shear stress in patients with pathologic pressure gradients.
ABBREVIATIONS: CFD � computational fluid dynamics; IIH � idiopathic intracranial hypertension; WSS � wall shear stress
Idiopathic intracranial hypertension (IIH), also known as pseu-
dotumor cerebri or benign intracranial hypertension, has been
associated with dural venous sinus stenosis.1,2 While many pa-
tients with IIH have anatomic evidence of venous sinus stenosis,3
cerebral venography and invasive manometry are often used to
differentiate patients with a “pathologic” stenosis, which demon-
strates a pressure gradient across the stenosis, from those without
such a gradient, to determine which patients may benefit from
endovascular stent placement.4,5 That some patients with IIH
present with this pressure gradient and others do not, despite
similar anatomic narrowing of the dural venous sinuses, suggests
that the mechanism by which IIH is related to venous sinus ste-
nosis may depend on hemodynamic characteristics of dural ve-
nous sinus drainage.6 However, venous manometry measures
only blood pressure rather than blood flow through the complex
3D hemodynamic environment of the dural venous sinuses.
Patient-specific computational fluid dynamics (CFD) model-
ing of the hemodynamic environment of patients with IIH with
and without a physiologic stenosis could improve the under-
standing of IIH pathophysiology and potentially aid in patient
selection for endovascular stent placement. In this study, we con-
structed CFD models of patients’ dural venous sinuses, with sim-
ulated blood flow informed by patient-specific pressure measure-
ments obtained during invasive cerebral venography, to
accurately model the hemodynamics of IIH in patients with dural
venous sinus stenosis.
Received October 12, 2015; accepted after revision March 31, 2016.
From the Departments of Neurological Surgery (M.R.L., L.J.K.), Radiology (M.R.L.,L.J.K.), and Mechanical Engineering (M.R.L., P.M.M., A.A.), University of Washington,Seattle, Washington; and Department of Neurosurgery (K.M., F.C.A., C.G.M.,M.Y.S.K.), Barrow Neurological Institute, Phoenix, Arizona.
This work was supported in part by National Institutes of Health/National Insti-tute of Neurological Disorders and Stroke grant 1R01NS088072 (M.R.L., P.M.M.,L.J.K., A.A.).
Please address correspondence to Michael R. Levitt, MD, University of Washington, 3259th Ave, Box 359924, Seattle, WA 98104; e-mail: [email protected]; @DrMichaelLevitt
Indicates open access to non-subscribers at www.ajnr.org
Indicates article with supplemental on-line appendix and table.
http://dx.doi.org/10.3174/ajnr.A4826
1876 Levitt Oct 2016 www.ajnr.org
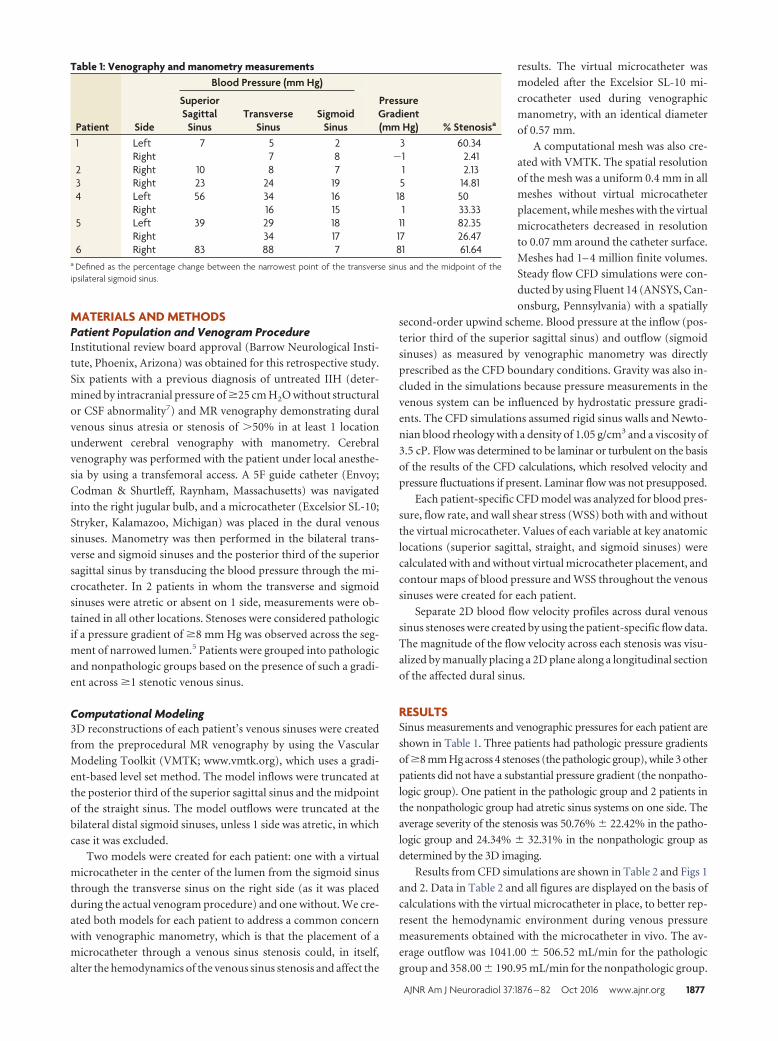
MATERIALS AND METHODSPatient Population and Venogram ProcedureInstitutional review board approval (Barrow Neurological Insti-
tute, Phoenix, Arizona) was obtained for this retrospective study.
Six patients with a previous diagnosis of untreated IIH (deter-
mined by intracranial pressure of �25 cm H2O without structural
or CSF abnormality7) and MR venography demonstrating dural
venous sinus atresia or stenosis of �50% in at least 1 location
underwent cerebral venography with manometry. Cerebral
venography was performed with the patient under local anesthe-
sia by using a transfemoral access. A 5F guide catheter (Envoy;
Codman & Shurtleff, Raynham, Massachusetts) was navigated
into the right jugular bulb, and a microcatheter (Excelsior SL-10;
Stryker, Kalamazoo, Michigan) was placed in the dural venous
sinuses. Manometry was then performed in the bilateral trans-
verse and sigmoid sinuses and the posterior third of the superior
sagittal sinus by transducing the blood pressure through the mi-
crocatheter. In 2 patients in whom the transverse and sigmoid
sinuses were atretic or absent on 1 side, measurements were ob-
tained in all other locations. Stenoses were considered pathologic
if a pressure gradient of �8 mm Hg was observed across the seg-
ment of narrowed lumen.5 Patients were grouped into pathologic
and nonpathologic groups based on the presence of such a gradi-
ent across �1 stenotic venous sinus.
Computational Modeling3D reconstructions of each patient’s venous sinuses were created
from the preprocedural MR venography by using the Vascular
Modeling Toolkit (VMTK; www.vmtk.org), which uses a gradi-
ent-based level set method. The model inflows were truncated at
the posterior third of the superior sagittal sinus and the midpoint
of the straight sinus. The model outflows were truncated at the
bilateral distal sigmoid sinuses, unless 1 side was atretic, in which
case it was excluded.
Two models were created for each patient: one with a virtual
microcatheter in the center of the lumen from the sigmoid sinus
through the transverse sinus on the right side (as it was placed
during the actual venogram procedure) and one without. We cre-
ated both models for each patient to address a common concern
with venographic manometry, which is that the placement of a
microcatheter through a venous sinus stenosis could, in itself,
alter the hemodynamics of the venous sinus stenosis and affect the
results. The virtual microcatheter was
modeled after the Excelsior SL-10 mi-
crocatheter used during venographic
manometry, with an identical diameter
of 0.57 mm.
A computational mesh was also cre-
ated with VMTK. The spatial resolution
of the mesh was a uniform 0.4 mm in all
meshes without virtual microcatheter
placement, while meshes with the virtual
microcatheters decreased in resolution
to 0.07 mm around the catheter surface.
Meshes had 1– 4 million finite volumes.
Steady flow CFD simulations were con-
ducted by using Fluent 14 (ANSYS, Can-
onsburg, Pennsylvania) with a spatially
second-order upwind scheme. Blood pressure at the inflow (pos-
terior third of the superior sagittal sinus) and outflow (sigmoid
sinuses) as measured by venographic manometry was directly
prescribed as the CFD boundary conditions. Gravity was also in-
cluded in the simulations because pressure measurements in the
venous system can be influenced by hydrostatic pressure gradi-
ents. The CFD simulations assumed rigid sinus walls and Newto-
nian blood rheology with a density of 1.05 g/cm3 and a viscosity of
3.5 cP. Flow was determined to be laminar or turbulent on the basis
of the results of the CFD calculations, which resolved velocity and
pressure fluctuations if present. Laminar flow was not presupposed.
Each patient-specific CFD model was analyzed for blood pres-
sure, flow rate, and wall shear stress (WSS) both with and without
the virtual microcatheter. Values of each variable at key anatomic
locations (superior sagittal, straight, and sigmoid sinuses) were
calculated with and without virtual microcatheter placement, and
contour maps of blood pressure and WSS throughout the venous
sinuses were created for each patient.
Separate 2D blood flow velocity profiles across dural venous
sinus stenoses were created by using the patient-specific flow data.
The magnitude of the flow velocity across each stenosis was visu-
alized by manually placing a 2D plane along a longitudinal section
of the affected dural sinus.
RESULTSSinus measurements and venographic pressures for each patient are
shown in Table 1. Three patients had pathologic pressure gradients
of �8 mm Hg across 4 stenoses (the pathologic group), while 3 other
patients did not have a substantial pressure gradient (the nonpatho-
logic group). One patient in the pathologic group and 2 patients in
the nonpathologic group had atretic sinus systems on one side. The
average severity of the stenosis was 50.76% � 22.42% in the patho-
logic group and 24.34% � 32.31% in the nonpathologic group as
determined by the 3D imaging.
Results from CFD simulations are shown in Table 2 and Figs 1
and 2. Data in Table 2 and all figures are displayed on the basis of
calculations with the virtual microcatheter in place, to better rep-
resent the hemodynamic environment during venous pressure
measurements obtained with the microcatheter in vivo. The av-
erage outflow was 1041.00 � 506.52 mL/min for the pathologic
group and 358.00 � 190.95 mL/min for the nonpathologic group.
Table 1: Venography and manometry measurements
Patient Side
Blood Pressure (mm Hg)
PressureGradient(mm Hg) % Stenosisa
SuperiorSagittal
SinusTransverse
SinusSigmoid
Sinus1 Left 7 5 2 3 60.34
Right 7 8 �1 2.412 Right 10 8 7 1 2.133 Right 23 24 19 5 14.814 Left 56 34 16 18 50
Right 16 15 1 33.335 Left 39 29 18 11 82.35
Right 34 17 17 26.476 Right 83 88 7 81 61.64
a Defined as the percentage change between the narrowest point of the transverse sinus and the midpoint of theipsilateral sigmoid sinus.
AJNR Am J Neuroradiol 37:1876 – 82 Oct 2016 www.ajnr.org 1877
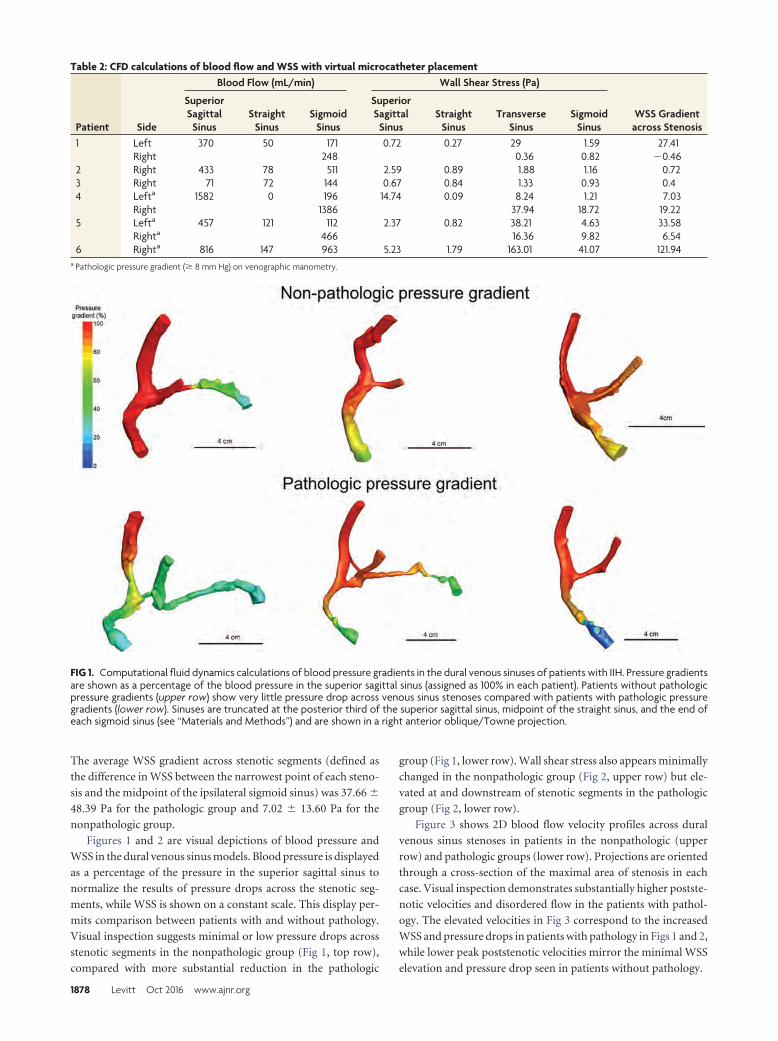
The average WSS gradient across stenotic segments (defined as
the difference in WSS between the narrowest point of each steno-
sis and the midpoint of the ipsilateral sigmoid sinus) was 37.66 �
48.39 Pa for the pathologic group and 7.02 � 13.60 Pa for the
nonpathologic group.
Figures 1 and 2 are visual depictions of blood pressure and
WSS in the dural venous sinus models. Blood pressure is displayed
as a percentage of the pressure in the superior sagittal sinus to
normalize the results of pressure drops across the stenotic seg-
ments, while WSS is shown on a constant scale. This display per-
mits comparison between patients with and without pathology.
Visual inspection suggests minimal or low pressure drops across
stenotic segments in the nonpathologic group (Fig 1, top row),
compared with more substantial reduction in the pathologic
group (Fig 1, lower row). Wall shear stress also appears minimally
changed in the nonpathologic group (Fig 2, upper row) but ele-
vated at and downstream of stenotic segments in the pathologic
group (Fig 2, lower row).
Figure 3 shows 2D blood flow velocity profiles across dural
venous sinus stenoses in patients in the nonpathologic (upper
row) and pathologic groups (lower row). Projections are oriented
through a cross-section of the maximal area of stenosis in each
case. Visual inspection demonstrates substantially higher postste-
notic velocities and disordered flow in the patients with pathol-
ogy. The elevated velocities in Fig 3 correspond to the increased
WSS and pressure drops in patients with pathology in Figs 1 and 2,
while lower peak poststenotic velocities mirror the minimal WSS
elevation and pressure drop seen in patients without pathology.
Table 2: CFD calculations of blood flow and WSS with virtual microcatheter placement
Patient Side
Blood Flow (mL/min) Wall Shear Stress (Pa)
WSS Gradientacross Stenosis
SuperiorSagittal
SinusStraight
SinusSigmoid
Sinus
SuperiorSagittal
SinusStraight
SinusTransverse
SinusSigmoid
Sinus1 Left 370 50 171 0.72 0.27 29 1.59 27.41
Right 248 0.36 0.82 �0.462 Right 433 78 511 2.59 0.89 1.88 1.16 0.723 Right 71 72 144 0.67 0.84 1.33 0.93 0.44 Lefta 1582 0 196 14.74 0.09 8.24 1.21 7.03
Right 1386 37.94 18.72 19.225 Lefta 457 121 112 2.37 0.82 38.21 4.63 33.58
Righta 466 16.36 9.82 6.546 Righta 816 147 963 5.23 1.79 163.01 41.07 121.94
a Pathologic pressure gradient (� 8 mm Hg) on venographic manometry.
FIG 1. Computational fluid dynamics calculations of blood pressure gradients in the dural venous sinuses of patients with IIH. Pressure gradientsare shown as a percentage of the blood pressure in the superior sagittal sinus (assigned as 100% in each patient). Patients without pathologicpressure gradients (upper row) show very little pressure drop across venous sinus stenoses compared with patients with pathologic pressuregradients (lower row). Sinuses are truncated at the posterior third of the superior sagittal sinus, midpoint of the straight sinus, and the end ofeach sigmoid sinus (see “Materials and Methods”) and are shown in a right anterior oblique/Towne projection.
1878 Levitt Oct 2016 www.ajnr.org
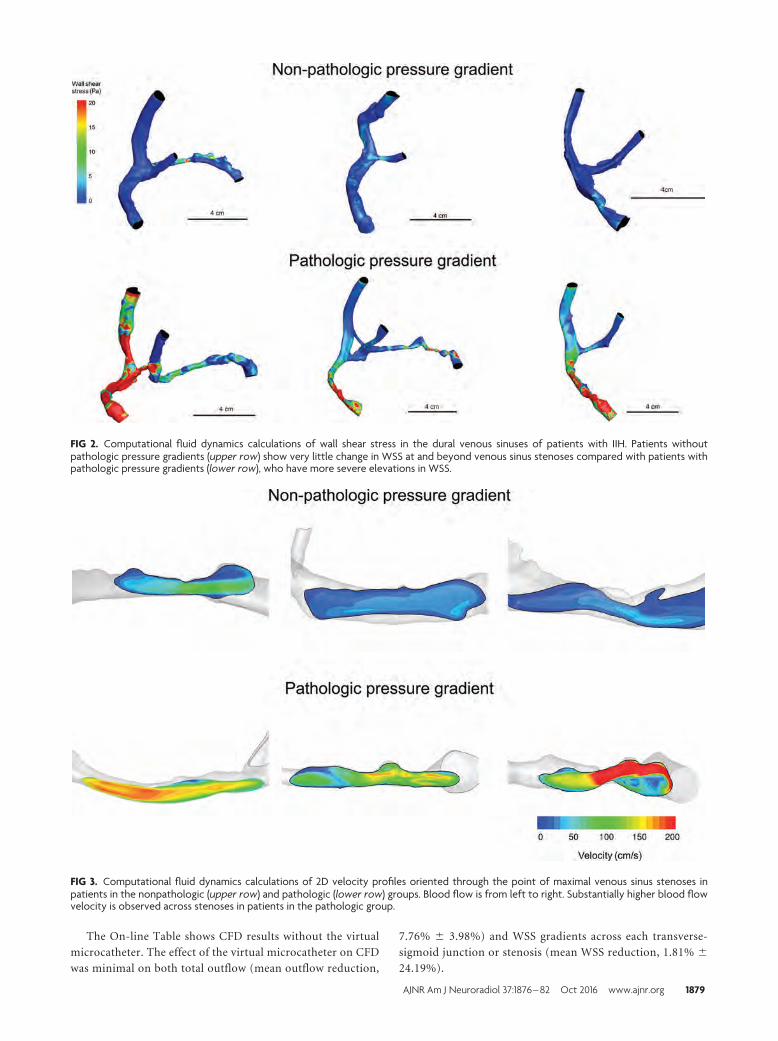
The On-line Table shows CFD results without the virtual
microcatheter. The effect of the virtual microcatheter on CFD
was minimal on both total outflow (mean outflow reduction,
7.76% � 3.98%) and WSS gradients across each transverse-
sigmoid junction or stenosis (mean WSS reduction, 1.81% �
24.19%).
FIG 2. Computational fluid dynamics calculations of wall shear stress in the dural venous sinuses of patients with IIH. Patients withoutpathologic pressure gradients (upper row) show very little change in WSS at and beyond venous sinus stenoses compared with patients withpathologic pressure gradients (lower row), who have more severe elevations in WSS.
FIG 3. Computational fluid dynamics calculations of 2D velocity profiles oriented through the point of maximal venous sinus stenoses inpatients in the nonpathologic (upper row) and pathologic (lower row) groups. Blood flow is from left to right. Substantially higher blood flowvelocity is observed across stenoses in patients in the pathologic group.
AJNR Am J Neuroradiol 37:1876 – 82 Oct 2016 www.ajnr.org 1879
DISCUSSIONWe have modeled the hemodynamic environment of patients
with IIH with dural venous sinus stenosis. Our CFD models used
patient-specific anatomic information from each patient’s MR
venography and incorporated patient-specific venographic ma-
nometry measurements for use as boundary conditions. Patient-
specific inlet and outlet boundary conditions have been shown to
be more accurate than stereotypic boundary conditions (derived
from literature averages of individual cases or healthy volunteer
cohorts) in the CFD modeling of other cerebrovascular diseases
such as intracranial aneurysms.8,9 These CFD models permit the
comparison of the hemodynamics of patients with IIH with sim-
ilar anatomic venous sinus stenoses to better understand why
some patients’ stenoses were pathologic and were responsive to
treatment with dural venous sinus stent placement, while others
were not.
Patients with pathologic pressure gradients did have higher
overall venous outflow rates through the transverse and sigmoid
sinuses than those with low or absent pressure gradients (1041
versus 358 mL/min). The high flow rate in patient 4, who had a
pathologic pressure gradient, may be an overestimate due to er-
rors inherent in CFD reconstructions from MR venography data
with large voxel sizes but is near previously published values of
overall cerebral blood flow.10 Despite anatomic abnormalities in
both groups, flow rates of patients without pathology were similar
to previously reported values for jugular flow in healthy con-
trols.11 This finding supports the theory that the presence of a
stenotic or atretic segment may be necessary but not sufficient to
cause pathologic pressure gradients across venous stenosis, be-
cause the presence of an atretic transverse/sigmoid sinus system
(with 100% of outflow through the remaining stenotic segment)
was seen in patients with and without pathologic pressure gradi-
ents in the current study, and others have observed no correlation
between stenosis severity and IIH symptoms.12 The presence of
unilateral sinus hypoplasia or atresia in up to 33% of asymptom-
atic patients also argues against a purely anatomic source of flow
disturbance.13,14
Wall shear stress also differed between patient groups. In the
nonpathologic group, minimal or no elevation in WSS was ob-
served in stenotic segments, while large elevations in WSS were
seen at and downstream from stenoses in the pathologic group.
Since WSS has been related to downstream vascular resistance,15
the difference in WSS profiles between groups further under-
scores the lack of adequate collateral pathways (and thus in-
creased vascular resistance across the stenosis) in the pathologic
group. Similarly, the 2D velocity profiles across the stenosis in
patients with and without pathology demonstrate higher postste-
notic velocity in the pathologic group, indicating more disordered
flow and vascular resistance, which could also correspond to re-
duced collaterals.
While the underlying mechanism for venous sinus stenosis in
patients with IIH remains unclear, these results suggest that pa-
tients with anatomic but not pathologic stenosis may have collat-
eral venous drainage in addition to the transverse/sigmoid sinus
system. These collateral venous pathways prevent the increased
resistance of an anatomic stenosis from affecting the overall pres-
sure gradient across it and thus limit the elevation of blood pres-
sure upstream from the stenosis. In patients in whom collaterals
are sparse or absent, the resistance created by the narrowing of 1
or both primary venous outflow channels (the sigmoid sinuses)
increases the pressure upstream from the stenosis, creating a
pathologic gradient and elevating the pressure in the entire ve-
nous sinus system. Cerebral venous hypertension further limits
CSF reabsorption, increasing intracranial pressure and further
exacerbating IIH by compressing the already stenosed segment
acting as a Starling resistor.16,17 On the other hand, in vitro and
animal studies on the influence of extravascular pressure on cere-
bral venous outflow do not perfectly follow this model.18
Because the compliance and elasticity of the dural venous si-
nuses are not known, we are unable to incorporate intracranial
pressure measurements into the model calculations. The near-
instantaneous nature of the CFD calculations (by using a single
time point of venous pressure) should limit the effects of intracra-
nial pressure on our calculations, but the complex relationship
between intracranial pressure and pathologic dural venous sinus
stenosis remains incompletely explained.18 In the pathologic
group, all 3 patients had intracranial pressures of �40 cm H2O,
while in the nonpathologic group, intracranial pressures were
lower (�30 cm H2O). Future study of CFD before and after stent
treatment would be improved with incorporation of intracranial
pressure changes to ensure accurate modeling of the influence of
external compression on the dural venous sinus stenosis.
The results of this study could have practical applications for
the noninvasive screening of patients with IIH for a pathologic
pressure gradient. A review of our large cohort of 158 patients
with and without IIH who underwent diagnostic cerebral venog-
raphy and manometry showed that noninvasive vascular imaging
(such as MR venography and CT venography) was an imperfect
predictor of the pathologic pressure gradient, even in the presence
of anatomic dural venous sinus stenosis.19 This finding is consis-
tent with the findings of the current study of different flow and
WSS profiles between patients with and without pathology, de-
spite similar degrees of anatomic stenoses or atresia. Recent ad-
vances in noninvasive quantitative phase-contrast MR venogra-
phy show promise in measuring blood flow through venous
sinuses.20 Applying such measurements as boundary conditions
in the CFD simulation methodology of the current study may
allow noninvasive, patient-specific, and accurate determination
of pathologic and nonpathologic stenoses without the need for
invasive venography. This method could be used for enhanced
screening of patients with IIH at the time of diagnosis and is under
investigation by our group. In addition, the hemodynamic
changes before and after stent placement across pathologic seg-
ments could be virtually modeled before the procedure to help
predict the restoration of normal blood pressure, blood flow, and
WSS.
We observed a minimal effect on flow when the virtual micro-
catheter was placed across the venous sinus stenosis in our simu-
lations. This is an important finding relative to the methods by
which pressure gradients are obtained in venographic manometry
because a catheter placed through an already narrow vessel (such
as a venous sinus stenosis) could impart a “loading error,” further
reducing the cross-sectional area of the lumen and falsely elevat-
ing the pressure measurements.21 This is a common critique of
1880 Levitt Oct 2016 www.ajnr.org
the results of venographic manometry because there is concern
that the procedure in which pressures are measured may skew the
measured results and potentially affect patient treatment strategy.
However, we observed a minimal loading error for both outflow
and the WSS gradients, and the large SD observed for WSS gradi-
ents was the result of the effect of the microcatheter on very small
(�1 Pa) absolute WSS values in 3 patients. This minimal loading
error is unlikely to be clinically relevant because a substantially
larger error would be required to create a falsely elevated flow
leading to a pressure gradient of �8 mm Hg, which would change
clinical decision-making toward stent placement.5 Other CFD
studies using patient-specific boundary conditions measured by
intravascular devices may require integration of the presence of
the device into determining the load error, though in our study,
this did not have a substantial influence on calculations and
should not be considered as a source of clinically relevant error on
venographic manometry measurements in patients with IIH.
A simplified mathematic model was also created in an attempt
to predict the degree of flow disturbance created by a microcath-
eter of a certain diameter (On-line Appendix). This model pre-
dicts that a microcatheter one-tenth of the diameter of the ste-
notic segment of the vessel causes approximately 40% reduction
in flow, and that a microcatheter one-hundredth of the diameter
of the stenosis causes approximately 22% reduction in flow as-
suming that the pressure gradient is fixed. The ability of the model
to make quantitative predictions is limited by a number of impor-
tant factors. In a stenosis, the spatial accelerations are likely im-
portant and the flow is not fully developed; thus, these features
violate a key assumption of the model. More important, the excess
resistance is highly dependent on the individual anatomy of each
stenosis and not just the ratio of the diameters of the catheter and
stenosis as the model predicts. Thus, CFD modeling with patient-
specific anatomic and physiologic data as presented above is more
likely to reflect accurate hemodynamic conditions on a case-by-
case basis.
This work has several limitations. First, the sample size is
small, precluding statistical comparison between patients with
and without pathology. However, this study demonstrates the
methodology for CFD modeling of the dural venous sinuses by
using patient-specific physiologic measurements as boundary
conditions, which has not been reported before, to our knowl-
edge. Second, the voxel size of the MR venography used to recon-
struct the dural venous sinuses, which ranged from 0.43 to 0.86
mm3, could potentially miss fine webbing that could be better
seen by using high-resolution techniques such as conebeam CT
venography22 or felt during microcatheterization during invasive
venography. A 10% error in stenosis diameter estimation can
change the flow rate by 40%, and it is unclear how equally the
errors in the reconstructions affect patients with and without pa-
thology. Third, prescribing only the pressures (without velocities)
as the CFD boundary conditions may be more susceptible to ran-
dom errors subject to the precision of the pressure transducer (�1
mm Hg), especially in cases in which the pressure gradients are
small. The prescribed pressure gradients in CFD may have relative
errors of up to 25%, and the calculated flow rates may subse-
quently have similar relative errors. However, the relative errors
are likely much smaller in pathologic cases in which large pressure
gradients were measured and are thus unlikely to be clinically
significant. Fourth, there were differences in the severity of steno-
ses in patients with pathologic and nonpathologic stenoses. How-
ever, all patients had documented IIH and some degree of venous
sinus abnormality (stenosis, atresia, or both), which could cause
outflow abnormalities and influence hemodynamics across the
entire dural sinus system, as has been proposed by others.23
CONCLUSIONSDural venous sinus stenosis in patients with IIH can be computa-
tionally modeled by using patient-specific anatomic and physio-
logic data. Increased overall blood flow and WSS were found in
patients with a pathologic pressure gradient.
Disclosures: Michael R. Levitt—RELATED: Grant: National Institutes of Health/Na-tional Institute of Neurological Disorders and Stroke (grant 1R01NS088072)*; UNRE-LATED: Stock/Stock Options: Sanofi Pasteur, Comments: equity stock �$5000. Pat-rick M. McGah—RELATED: Grant: National Institutes of Health/National Institute ofNeurological Disorders and Stroke (grant 1R01NS088072).* Louis J. Kim—RELATED:Grant: National Institutes of Health/National Institute of Neurological Disordersand Stroke (grant 1R01NS088072)*; UNRELATED: Consultancy: MicroVention, Com-ments: Data and Safety Monitoring Board chair for an ongoing device trial. AlbertoAliseda—RELATED: Grant: National Institutes of Health/National Institute of Neu-rological Disorders and Stroke (grant 1R01NS088072).* *Money paid to the institution.
REFERENCES1. Higgins JN, Owler BK, Cousins C, et al. Venous sinus stenting for
refractory benign intracranial hypertension. Lancet 2002;359:228 –30 Medline
2. Puffer RC, Mustafa W, Lanzino G. Venous sinus stenting for idio-pathic intracranial hypertension: a review of the literature. J Neu-rointerv Surg 2013;5:483– 86 CrossRef Medline
3. Farb RI, Vanek I, Scott JN, et al. Idiopathic intracranialhypertension: the prevalence and morphology of sinovenous steno-sis. Neurology 2003;60:1418 –24 CrossRef Medline
4. Albuquerque FC, Dashti SR, Hu YC, et al. Intracranial venous sinusstenting for benign intracranial hypertension: clinical indications,technique, and preliminary results. World Neurosurg 2011;75:648 –52; discussion 592–95 CrossRef Medline
5. Ahmed RM, Wilkinson M, Parker GD, et al. Transverse sinus stent-ing for idiopathic intracranial hypertension: a review of 52 patientsand of model predictions. AJNR Am J Neuroradiol 2011;32:1408 –14CrossRef Medline
6. Bateman GA. Arterial inflow and venous outflow in idiopathic in-tracranial hypertension associated with venous outflow stenoses.J Clin Neurosci 2008;15:402– 08 CrossRef Medline
7. Friedman DI, Jacobson DM. Diagnostic criteria for idiopathic intra-cranial hypertension. Neurology 2002;59:1492–95 CrossRef Medline
8. McGah PM, Levitt MR, Barbour MC, et al. Accuracy of computa-tional cerebral aneurysm hemodynamics using patient-specificendovascular measurements. Ann Biomed Eng 2014;42:503–14CrossRef Medline
9. Venugopal P, Valentino D, Schmitt H, et al. Sensitivity of patient-specific numerical simulation of cerebral aneurysm hemodynam-ics to inflow boundary conditions. J Neurosurg 2007;106:1051– 60CrossRef Medline
10. Ford MD, Alperin N, Lee SH, et al. Characterization of volumetricflow rate waveforms in the normal internal carotid and vertebralarteries. Physiol Meas 2005;26:477– 88 CrossRef Medline
11. Kim J, Thacker NA, Bromiley PA, et al. Prediction of the jugularvenous waveform using a model of CSF dynamics. AJNR Am J Neu-roradiol 2007;28:983– 89 Medline
12. Riggeal BD, Bruce BB, Saindane AM, et al. Clinical course of idio-pathic intracranial hypertension with transverse sinus stenosis.Neurology 2013;80:289 –95 CrossRef Medline
13. Ayanzen RH, Bird CR, Keller PJ, et al. Cerebral MR venography:
AJNR Am J Neuroradiol 37:1876 – 82 Oct 2016 www.ajnr.org 1881
normal anatomy and potential diagnostic pitfalls. AJNR Am J Neu-roradiol 2000;21:74 –78 Medline
14. Durst CR, Ornan DA, Reardon MA, et al. Prevalence of dural venoussinus stenosis and hypoplasia in a generalized population. J Neuro-interv Surg 2016 Jan 8. [Epub ahead of print] CrossRef Medline
15. Van Steenkiste C, Trachet B, Casteleyn C, et al. Vascular corrosioncasting: analyzing wall shear stress in the portal vein and vascularabnormalities in portal hypertensive and cirrhotic rodents. Lab In-vest 2010;90:1558 –72 CrossRef Medline
16. De Simone R, Ranieri A, Bonavita V. Advancement in idiopathicintracranial hypertension pathogenesis: focus on sinus venous ste-nosis. Neurol Sci 2010;31(suppl 1):S33–39 CrossRef Medline
17. Stevens SA, Previte M, Lakin WD, et al. Idiopathic intracranial hy-pertension and transverse sinus stenosis: a modelling study. MathMed Biol 2007;24:85–109 Medline
18. Schaller B. Physiology of cerebral venous blood flow: from experi-mental data in animals to normal function in humans. Brain ResBrain Res Rev 2004;46:243– 60 CrossRef Medline
19. Levitt MR, Hlubek RJ, Moon K, et al. Incidence and predictors ofdural venous sinus pressure gradient in idiopathic intracranial hy-
pertension and non-idiopathic intracranial hypertension headachepatients: results from 164 cerebral venograms. J Neurosurg 2016Mar 11. [Epub ahead of print] Medline
20. Esfahani DR, Stevenson M, Moss HE, et al. Quantitative magneticresonance venography is correlated with intravenous pressuresbefore and after venous sinus stenting: implications for treat-ment and monitoring. Neurosurgery 2015;77:254 – 60 CrossRefMedline
21. Torii R, Wood NB, Hughes AD, et al. A computational study on theinfluence of catheter-delivered intravascular probes on blood flowin a coronary artery model. J Biomech 2007;40:2501– 09 CrossRefMedline
22. Hiu T, Kitagawa N, Morikawa M, et al. Efficacy of DynaCT digitalangiography in the detection of the fistulous point of dural arterio-venous fistulas. AJNR Am J Neuroradiol 2009;30:487–91 CrossRefMedline
23. Rohr A, Bindeballe J, Riedel C, et al. The entire dural sinus tree iscompressed in patients with idiopathic intracranial hypertension: alongitudinal, volumetric magnetic resonance imaging study. Neu-roradiology 2012;54:25–33 CrossRef Medline
1882 Levitt Oct 2016 www.ajnr.org
ORIGINAL RESEARCHINTERVENTIONAL
Peritherapeutic Hemodynamic Changes of Carotid StentingEvaluated with Quantitative DSA in Patients with Carotid
StenosisX M.M.H. Teng, X F.-C. Chang, X C.-J. Lin, X L. Chiang, X J.-S. Hong, and X Y.-H. Kao
ABSTRACT
BACKGROUND AND PURPOSE: Quantitative data from DSA have become important tools for understanding hemodynamic changes ofintracranial lesions. In this study, we evaluated 8 hemodynamic parameters in patients before and after carotid artery angioplasty.
MATERIALS AND METHODS: DSAimagesof34patientswithcarotidstenosiswhounderwentangioplastyandstentplacementwereretrospectivelyanalyzed. Eleven ROIs (M1, M2, A1, A2, the parietal vein, superior sagittal sinus, internal jugular vein, and 4 in the ICA) were selected on color-coded DSA.Eight hemodynamic parameters (bolus arrival time, TTP, relative TTP, full width at half maximum, wash-in slope, washout slope, maximum enhancement,and area under the curve) were measured from the time-concentration curves of these ROIs. The dependent t test for paired samples was applied tothese parameters before and after stent placement.
RESULTS: We found that the treatment significantly reduced TTP, relative TTP, bolus arrival time, and washout slope at all arterialROIs and full width at half maximum and area under the curve at some arterial ROIs. Bolus arrival time was significantly reduced aftertreatment for all arterial ROIs, the parietal vein, and the superior sagittal sinus. The maximum enhancement and wash-in slope didnot show significant changes after treatment. After treatment, the relative TTP from the ICA to M1, M2, and the parietal veinreturned to normal values.
CONCLUSIONS: In addition to TTP and relative TTP, other parameters can be used to evaluate peritherapeutic cerebral hemodynamicchanges. Bolus arrival time has the potential to evaluate brain circulation at arterial and venous sites, especially when TTP cannot bemeasured because of an incomplete time-concentration curve.
ABBREVIATIONS: AUC � area under the curve; BAT � bolus arrival time; FWHM � full width at half maximum; ME � maximal enhancement; PA � posterior-anterior; PV � parietal vein; rTTP � relative TTP; SSS � superior sagittal sinus; WI � wash-in slope; WO � washout slope
Digital subtraction angiography has been the criterion stan-
dard for diagnosing cerebral vascular disease since 1970s.
DSA imaging demonstrates the intravascular changes of concen-
tration in the time domain and can be used as a surrogate marker
for cerebral hemodynamics. Time-concentration curve analysis is
the most commonly used approach because the results are easily
accessible and intuitive for interventional purposes. Time-to-
peak (also called time-to-maximum in some previous publica-
tions) is the most commonly used parameter. It is applied to de-
tect intra-aneurysmal flow, and larger aneurysms demonstrate
more prolonged TTP than smaller aneurysms.1 The difference in
TTP between the parietal vein and cavernous ICA has been used
to monitor cerebral hemodynamic changes to improve patient
safety.2 Detecting shorter TTPs in carotid cavernous fistulas helps
determine whether the venous outlets contain higher blood flow,
which deserves treatment priority.3 In control angiography, nor-
malization of blood flow indicates spontaneous latent oblitera-
tion.4 Other applications include monitoring angioplasty for va-
sospasm after subarachnoid hemorrhage5 and quantitatively
grading Moyamoya disease.2
The standard gray-scale images of DSA are first encoded into a
single composite color image according to the contrast bolus ar-
rival time (BAT) at each point in the circulatory system of the
brain. This single composite color image improves the speed of
manual delineation of AVMs and makes the angioarchitecture
Received December 16, 2015; accepted after revision March 20, 2016.
From the Department of Medical Imaging (M.M.H.T.), Cheng Hsin General Hospital,Taipei, Taiwan; Department of Radiology (F.-C.C., C.-J.L., L.C.), Taipei Veterans Gen-eral Hospital, Taipei, Taiwan; and School of Medicine (F.-C.C., C.-J.L.) and Depart-ment of Biomedical Imaging and Radiological Sciences (J.-S.H., Y.-H.K.), NationalYang-Ming University, Taipei, Taiwan.
This work was supported, in part, by the Cheng Hsin General Hospital and NationalYang Ming University cooperative project (grant No. 103F003C10) and Taipei Veter-ans General Hospital (grant No. V104-C-012).
Please address correspondence to Chung-Jung Lin, PhD, Radiology Department,Taipei Veterans General Hospital, No. 201, Section 2, Shipai Rd, Beitou District, Tai-pei, Taiwan; e-mail: [email protected]; Yi-Hsuan Kao, MD, Department of Biomedi-cal Imaging and Radiological Sciences, National Yang-Ming University, No. 155, Sec-tion 2, Li-Nong St, Beitou District, Taipei, Taiwan; e-mail: [email protected]
http://dx.doi.org/10.3174/ajnr.A4813
AJNR Am J Neuroradiol 37:1883– 88 Oct 2016 www.ajnr.org 1883
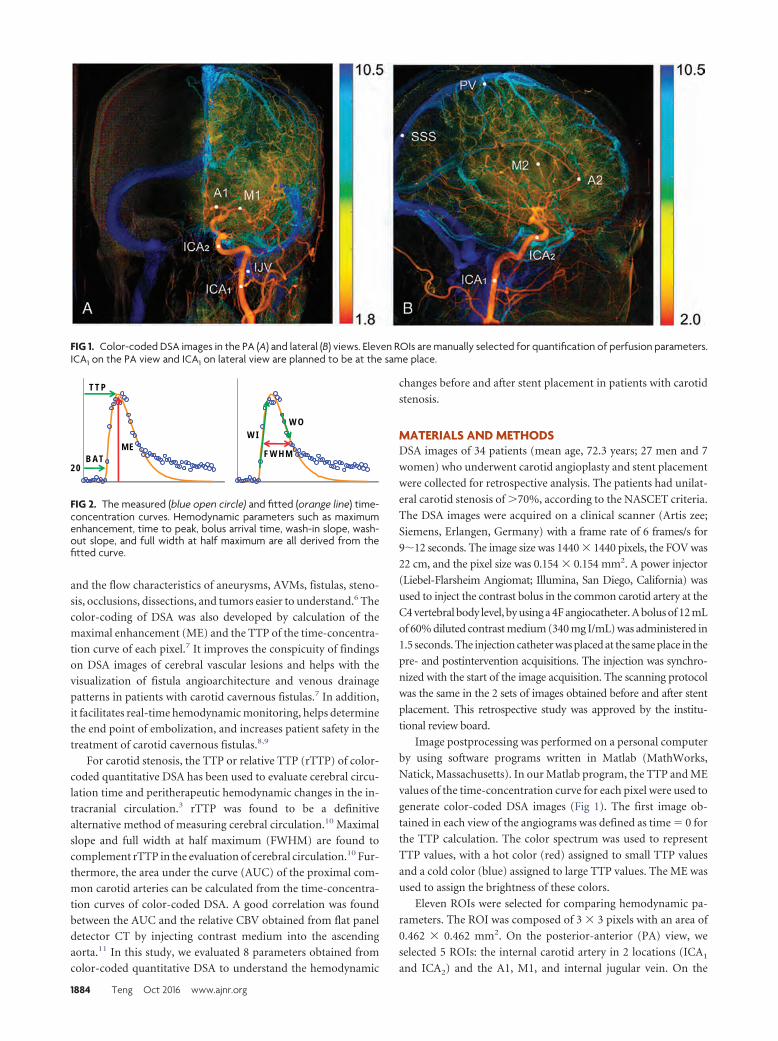
and the flow characteristics of aneurysms, AVMs, fistulas, steno-
sis, occlusions, dissections, and tumors easier to understand.6 The
color-coding of DSA was also developed by calculation of the
maximal enhancement (ME) and the TTP of the time-concentra-
tion curve of each pixel.7 It improves the conspicuity of findings
on DSA images of cerebral vascular lesions and helps with the
visualization of fistula angioarchitecture and venous drainage
patterns in patients with carotid cavernous fistulas.7 In addition,
it facilitates real-time hemodynamic monitoring, helps determine
the end point of embolization, and increases patient safety in the
treatment of carotid cavernous fistulas.8,9
For carotid stenosis, the TTP or relative TTP (rTTP) of color-
coded quantitative DSA has been used to evaluate cerebral circu-
lation time and peritherapeutic hemodynamic changes in the in-
tracranial circulation.3 rTTP was found to be a definitive
alternative method of measuring cerebral circulation.10 Maximal
slope and full width at half maximum (FWHM) are found to
complement rTTP in the evaluation of cerebral circulation.10 Fur-
thermore, the area under the curve (AUC) of the proximal com-
mon carotid arteries can be calculated from the time-concentra-
tion curves of color-coded DSA. A good correlation was found
between the AUC and the relative CBV obtained from flat panel
detector CT by injecting contrast medium into the ascending
aorta.11 In this study, we evaluated 8 parameters obtained from
color-coded quantitative DSA to understand the hemodynamic
changes before and after stent placement in patients with carotid
stenosis.
MATERIALS AND METHODSDSA images of 34 patients (mean age, 72.3 years; 27 men and 7
women) who underwent carotid angioplasty and stent placement
were collected for retrospective analysis. The patients had unilat-
eral carotid stenosis of �70%, according to the NASCET criteria.
The DSA images were acquired on a clinical scanner (Artis zee;
Siemens, Erlangen, Germany) with a frame rate of 6 frames/s for
9�12 seconds. The image size was 1440 � 1440 pixels, the FOV was
22 cm, and the pixel size was 0.154 � 0.154 mm2. A power injector
(Liebel-Flarsheim Angiomat; Illumina, San Diego, California) was
used to inject the contrast bolus in the common carotid artery at the
C4 vertebral body level, by using a 4F angiocatheter. A bolus of 12 mL
of 60% diluted contrast medium (340 mg I/mL) was administered in
1.5 seconds. The injection catheter was placed at the same place in the
pre- and postintervention acquisitions. The injection was synchro-
nized with the start of the image acquisition. The scanning protocol
was the same in the 2 sets of images obtained before and after stent
placement. This retrospective study was approved by the institu-
tional review board.
Image postprocessing was performed on a personal computer
by using software programs written in Matlab (MathWorks,
Natick, Massachusetts). In our Matlab program, the TTP and ME
values of the time-concentration curve for each pixel were used to
generate color-coded DSA images (Fig 1). The first image ob-
tained in each view of the angiograms was defined as time � 0 for
the TTP calculation. The color spectrum was used to represent
TTP values, with a hot color (red) assigned to small TTP values
and a cold color (blue) assigned to large TTP values. The ME was
used to assign the brightness of these colors.
Eleven ROIs were selected for comparing hemodynamic pa-
rameters. The ROI was composed of 3 � 3 pixels with an area of
0.462 � 0.462 mm2. On the posterior-anterior (PA) view, we
selected 5 ROIs: the internal carotid artery in 2 locations (ICA1
and ICA2) and the A1, M1, and internal jugular vein. On the
FIG 1. Color-coded DSA images in the PA (A) and lateral (B) views. Eleven ROIs are manually selected for quantification of perfusion parameters.ICA1 on the PA view and ICA1 on lateral view are planned to be at the same place.
FW H M
W OW I
TTP
M E
20B AT
FIG 2. The measured (blue open circle) and fitted (orange line) time-concentration curves. Hemodynamic parameters such as maximumenhancement, time to peak, bolus arrival time, wash-in slope, wash-out slope, and full width at half maximum are all derived from thefitted curve.
1884 Teng Oct 2016 www.ajnr.org
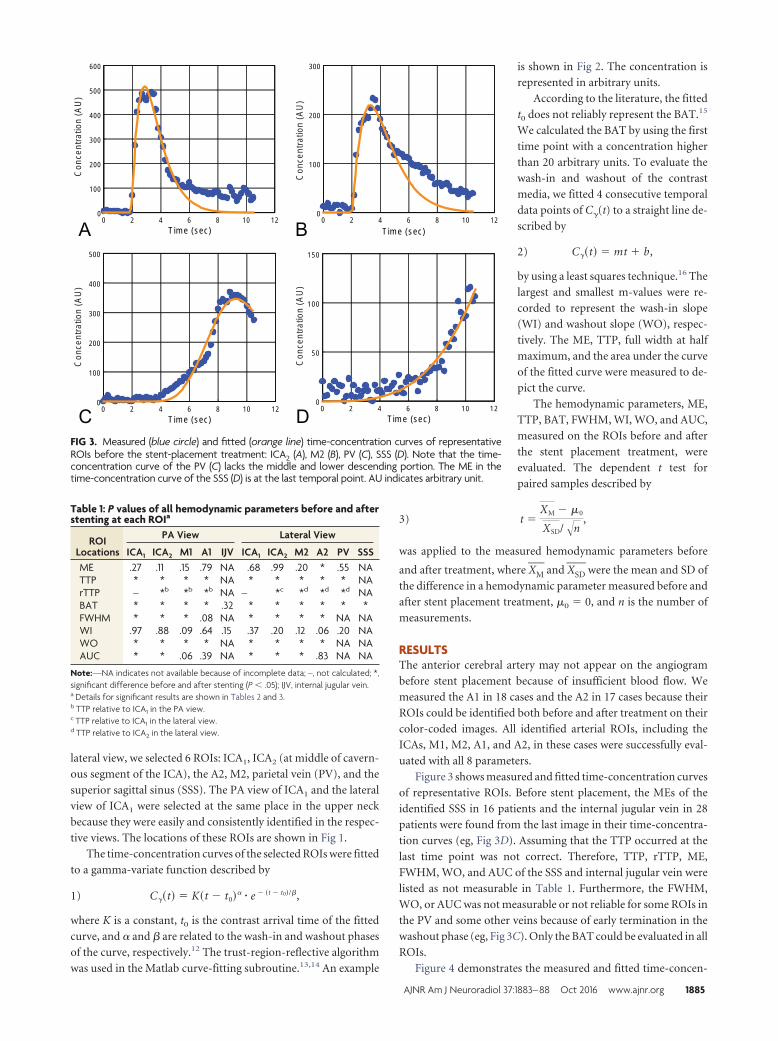
lateral view, we selected 6 ROIs: ICA1, ICA2 (at middle of cavern-
ous segment of the ICA), the A2, M2, parietal vein (PV), and the
superior sagittal sinus (SSS). The PA view of ICA1 and the lateral
view of ICA1 were selected at the same place in the upper neck
because they were easily and consistently identified in the respec-
tive views. The locations of these ROIs are shown in Fig 1.
The time-concentration curves of the selected ROIs were fitted
to a gamma-variate function described by
1) C��t� � K�t � t0�� � e � �t � t0�/�,
where K is a constant, t0 is the contrast arrival time of the fitted
curve, and � and � are related to the wash-in and washout phases
of the curve, respectively.12 The trust-region-reflective algorithm
was used in the Matlab curve-fitting subroutine.13,14 An example
is shown in Fig 2. The concentration is
represented in arbitrary units.
According to the literature, the fitted
t0 does not reliably represent the BAT.15
We calculated the BAT by using the first
time point with a concentration higher
than 20 arbitrary units. To evaluate the
wash-in and washout of the contrast
media, we fitted 4 consecutive temporal
data points of C�(t) to a straight line de-
scribed by
2) C��t� � mt � b,
by using a least squares technique.16 The
largest and smallest m-values were re-
corded to represent the wash-in slope
(WI) and washout slope (WO), respec-
tively. The ME, TTP, full width at half
maximum, and the area under the curve
of the fitted curve were measured to de-
pict the curve.
The hemodynamic parameters, ME,
TTP, BAT, FWHM, WI, WO, and AUC,
measured on the ROIs before and after
the stent placement treatment, were
evaluated. The dependent t test for
paired samples described by
3) t �XM � �0
XSD/�n,
was applied to the measured hemodynamic parameters before
and after treatment, where XM� and XSD
� were the mean and SD of
the difference in a hemodynamic parameter measured before and
after stent placement treatment, �0 � 0, and n is the number of
measurements.
RESULTSThe anterior cerebral artery may not appear on the angiogram
before stent placement because of insufficient blood flow. We
measured the A1 in 18 cases and the A2 in 17 cases because their
ROIs could be identified both before and after treatment on their
color-coded images. All identified arterial ROIs, including the
ICAs, M1, M2, A1, and A2, in these cases were successfully eval-
uated with all 8 parameters.
Figure 3 shows measured and fitted time-concentration curves
of representative ROIs. Before stent placement, the MEs of the
identified SSS in 16 patients and the internal jugular vein in 28
patients were found from the last image in their time-concentra-
tion curves (eg, Fig 3D). Assuming that the TTP occurred at the
last time point was not correct. Therefore, TTP, rTTP, ME,
FWHM, WO, and AUC of the SSS and internal jugular vein were
listed as not measurable in Table 1. Furthermore, the FWHM,
WO, or AUC was not measurable or not reliable for some ROIs in
the PV and some other veins because of early termination in the
washout phase (eg, Fig 3C). Only the BAT could be evaluated in all
ROIs.
Figure 4 demonstrates the measured and fitted time-concen-
Con
cent
ratio
n (A
U)
0 2 4 6 8 10 12T im e (sec)
0
100
200
300
0 2 4 6 8 1 0 1 2Tim e (sec)
0
5 0
1 0 0
1 5 0
0 2 4 6 8 10 12T im e (sec)
0
100
200
300
400
500
600
0 2 4 6 8 10 12T im e (sec)
0
100
200
300
400
500
Con
cent
ratio
n (A
U)
Con
cent
ratio
n (A
U)
Con
cent
ratio
n (A
U)
FIG 3. Measured (blue circle) and fitted (orange line) time-concentration curves of representativeROIs before the stent-placement treatment: ICA2 (A), M2 (B), PV (C), SSS (D). Note that the time-concentration curve of the PV (C) lacks the middle and lower descending portion. The ME in thetime-concentration curve of the SSS (D) is at the last temporal point. AU indicates arbitrary unit.
Table 1: P values of all hemodynamic parameters before and afterstenting at each ROIa
ROILocations
PA View Lateral View
ICA1 ICA2 M1 A1 IJV ICA1 ICA2 M2 A2 PV SSSME .27 .11 .15 .79 NA .68 .99 .20 * .55 NATTP * * * * NA * * * * * NArTTP – *b *b *b NA – *c *d *d *d NABAT * * * * .32 * * * * * *FWHM * * * .08 NA * * * * NA NAWI .97 .88 .09 .64 .15 .37 .20 .12 .06 .20 NAWO * * * * NA * * * * NA NAAUC * * .06 .39 NA * * * .83 NA NA
Note:—NA indicates not available because of incomplete data; –, not calculated; *,significant difference before and after stenting (P � .05); IJV, internal jugular vein.a Details for significant results are shown in Tables 2 and 3.b TTP relative to ICA1 in the PA view.c TTP relative to ICA1 in the lateral view.d TTP relative to ICA2 in the lateral view.
AJNR Am J Neuroradiol 37:1883– 88 Oct 2016 www.ajnr.org 1885
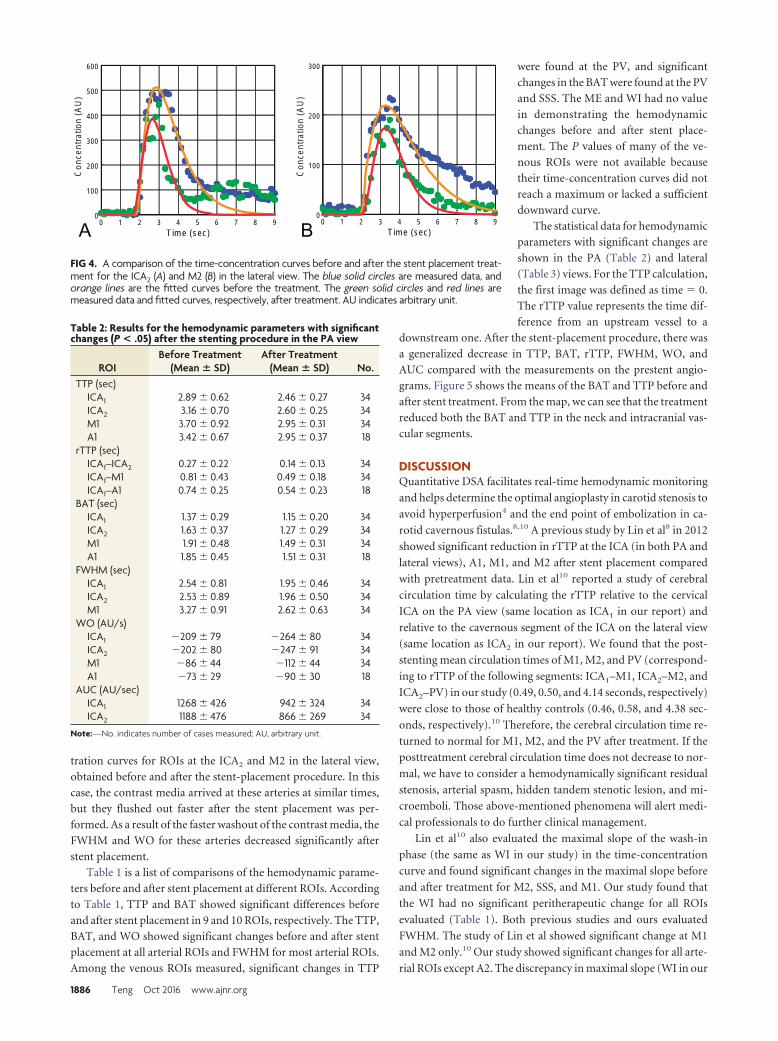
tration curves for ROIs at the ICA2 and M2 in the lateral view,
obtained before and after the stent-placement procedure. In this
case, the contrast media arrived at these arteries at similar times,
but they flushed out faster after the stent placement was per-
formed. As a result of the faster washout of the contrast media, the
FWHM and WO for these arteries decreased significantly after
stent placement.
Table 1 is a list of comparisons of the hemodynamic parame-
ters before and after stent placement at different ROIs. According
to Table 1, TTP and BAT showed significant differences before
and after stent placement in 9 and 10 ROIs, respectively. The TTP,
BAT, and WO showed significant changes before and after stent
placement at all arterial ROIs and FWHM for most arterial ROIs.
Among the venous ROIs measured, significant changes in TTP
were found at the PV, and significant
changes in the BAT were found at the PV
and SSS. The ME and WI had no value
in demonstrating the hemodynamic
changes before and after stent place-
ment. The P values of many of the ve-
nous ROIs were not available because
their time-concentration curves did not
reach a maximum or lacked a sufficient
downward curve.
The statistical data for hemodynamic
parameters with significant changes are
shown in the PA (Table 2) and lateral
(Table 3) views. For the TTP calculation,
the first image was defined as time � 0.
The rTTP value represents the time dif-
ference from an upstream vessel to a
downstream one. After the stent-placement procedure, there was
a generalized decrease in TTP, BAT, rTTP, FWHM, WO, and
AUC compared with the measurements on the prestent angio-
grams. Figure 5 shows the means of the BAT and TTP before and
after stent treatment. From the map, we can see that the treatment
reduced both the BAT and TTP in the neck and intracranial vas-
cular segments.
DISCUSSIONQuantitative DSA facilitates real-time hemodynamic monitoring
and helps determine the optimal angioplasty in carotid stenosis to
avoid hyperperfusion4 and the end point of embolization in ca-
rotid cavernous fistulas.8,10 A previous study by Lin et al8 in 2012
showed significant reduction in rTTP at the ICA (in both PA and
lateral views), A1, M1, and M2 after stent placement compared
with pretreatment data. Lin et al10 reported a study of cerebral
circulation time by calculating the rTTP relative to the cervical
ICA on the PA view (same location as ICA1 in our report) and
relative to the cavernous segment of the ICA on the lateral view
(same location as ICA2 in our report). We found that the post-
stenting mean circulation times of M1, M2, and PV (correspond-
ing to rTTP of the following segments: ICA1–M1, ICA2–M2, and
ICA2–PV) in our study (0.49, 0.50, and 4.14 seconds, respectively)
were close to those of healthy controls (0.46, 0.58, and 4.38 sec-
onds, respectively).10 Therefore, the cerebral circulation time re-
turned to normal for M1, M2, and the PV after treatment. If the
posttreatment cerebral circulation time does not decrease to nor-
mal, we have to consider a hemodynamically significant residual
stenosis, arterial spasm, hidden tandem stenotic lesion, and mi-
croemboli. Those above-mentioned phenomena will alert medi-
cal professionals to do further clinical management.
Lin et al10 also evaluated the maximal slope of the wash-in
phase (the same as WI in our study) in the time-concentration
curve and found significant changes in the maximal slope before
and after treatment for M2, SSS, and M1. Our study found that
the WI had no significant peritherapeutic change for all ROIs
evaluated (Table 1). Both previous studies and ours evaluated
FWHM. The study of Lin et al showed significant change at M1
and M2 only.10 Our study showed significant changes for all arte-
rial ROIs except A2. The discrepancy in maximal slope (WI in our
Con
cent
ratio
n (A
U)
Con
cent
ratio
n (A
U)
0 1 2 3 4 5 6 7 8 9T im e (sec)
0
100
200
300
0 1 2 3 4 5 6 7 8 9T im e (sec)
0
100
200
300
400
500
600
FIG 4. A comparison of the time-concentration curves before and after the stent placement treat-ment for the ICA2 (A) and M2 (B) in the lateral view. The blue solid circles are measured data, andorange lines are the fitted curves before the treatment. The green solid circles and red lines aremeasured data and fitted curves, respectively, after treatment. AU indicates arbitrary unit.
Table 2: Results for the hemodynamic parameters with significantchanges (P < .05) after the stenting procedure in the PA view
ROIBefore Treatment
(Mean � SD)After Treatment
(Mean � SD) No.TTP (sec)
ICA1 2.89 0.62 2.46 0.27 34ICA2 3.16 0.70 2.60 0.25 34M1 3.70 0.92 2.95 0.31 34A1 3.42 0.67 2.95 0.37 18
rTTP (sec)ICA1–ICA2 0.27 0.22 0.14 0.13 34ICA1–M1 0.81 0.43 0.49 0.18 34ICA1–A1 0.74 0.25 0.54 0.23 18
BAT (sec)ICA1 1.37 0.29 1.15 0.20 34ICA2 1.63 0.37 1.27 0.29 34M1 1.91 0.48 1.49 0.31 34A1 1.85 0.45 1.51 0.31 18
FWHM (sec)ICA1 2.54 0.81 1.95 0.46 34ICA2 2.53 0.89 1.96 0.50 34M1 3.27 0.91 2.62 0.63 34
WO (AU/s)ICA1 209 79 264 80 34ICA2 202 80 247 91 34M1 86 44 112 44 34A1 73 29 90 30 18
AUC (AU/sec)ICA1 1268 426 942 324 34ICA2 1188 476 866 269 34
Note:—No. indicates number of cases measured; AU, arbitrary unit.
1886 Teng Oct 2016 www.ajnr.org
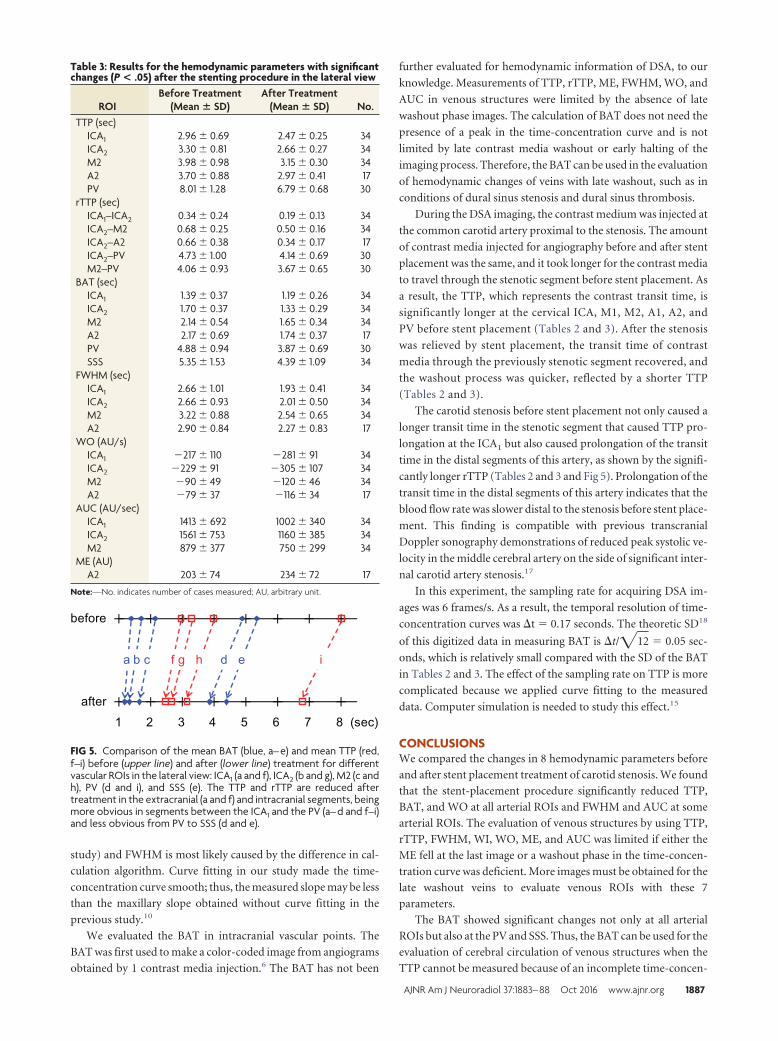
study) and FWHM is most likely caused by the difference in cal-
culation algorithm. Curve fitting in our study made the time-
concentration curve smooth; thus, the measured slope may be less
than the maxillary slope obtained without curve fitting in the
previous study.10
We evaluated the BAT in intracranial vascular points. The
BAT was first used to make a color-coded image from angiograms
obtained by 1 contrast media injection.6 The BAT has not been
further evaluated for hemodynamic information of DSA, to our
knowledge. Measurements of TTP, rTTP, ME, FWHM, WO, and
AUC in venous structures were limited by the absence of late
washout phase images. The calculation of BAT does not need the
presence of a peak in the time-concentration curve and is not
limited by late contrast media washout or early halting of the
imaging process. Therefore, the BAT can be used in the evaluation
of hemodynamic changes of veins with late washout, such as in
conditions of dural sinus stenosis and dural sinus thrombosis.
During the DSA imaging, the contrast medium was injected at
the common carotid artery proximal to the stenosis. The amount
of contrast media injected for angiography before and after stent
placement was the same, and it took longer for the contrast media
to travel through the stenotic segment before stent placement. As
a result, the TTP, which represents the contrast transit time, is
significantly longer at the cervical ICA, M1, M2, A1, A2, and
PV before stent placement (Tables 2 and 3). After the stenosis
was relieved by stent placement, the transit time of contrast
media through the previously stenotic segment recovered, and
the washout process was quicker, reflected by a shorter TTP
(Tables 2 and 3).
The carotid stenosis before stent placement not only caused a
longer transit time in the stenotic segment that caused TTP pro-
longation at the ICA1 but also caused prolongation of the transit
time in the distal segments of this artery, as shown by the signifi-
cantly longer rTTP (Tables 2 and 3 and Fig 5). Prolongation of the
transit time in the distal segments of this artery indicates that the
blood flow rate was slower distal to the stenosis before stent place-
ment. This finding is compatible with previous transcranial
Doppler sonography demonstrations of reduced peak systolic ve-
locity in the middle cerebral artery on the side of significant inter-
nal carotid artery stenosis.17
In this experiment, the sampling rate for acquiring DSA im-
ages was 6 frames/s. As a result, the temporal resolution of time-
concentration curves was �t � 0.17 seconds. The theoretic SD18
of this digitized data in measuring BAT is �t/�12 � 0.05 sec-
onds, which is relatively small compared with the SD of the BAT
in Tables 2 and 3. The effect of the sampling rate on TTP is more
complicated because we applied curve fitting to the measured
data. Computer simulation is needed to study this effect.15
CONCLUSIONSWe compared the changes in 8 hemodynamic parameters before
and after stent placement treatment of carotid stenosis. We found
that the stent-placement procedure significantly reduced TTP,
BAT, and WO at all arterial ROIs and FWHM and AUC at some
arterial ROIs. The evaluation of venous structures by using TTP,
rTTP, FWHM, WI, WO, ME, and AUC was limited if either the
ME fell at the last image or a washout phase in the time-concen-
tration curve was deficient. More images must be obtained for the
late washout veins to evaluate venous ROIs with these 7
parameters.
The BAT showed significant changes not only at all arterial
ROIs but also at the PV and SSS. Thus, the BAT can be used for the
evaluation of cerebral circulation of venous structures when the
TTP cannot be measured because of an incomplete time-concen-
Table 3: Results for the hemodynamic parameters with significantchanges (P < .05) after the stenting procedure in the lateral view
ROIBefore Treatment
(Mean � SD)After Treatment
(Mean � SD) No.TTP (sec)
ICA1 2.96 0.69 2.47 0.25 34ICA2 3.30 0.81 2.66 0.27 34M2 3.98 0.98 3.15 0.30 34A2 3.70 0.88 2.97 0.41 17PV 8.01 1.28 6.79 0.68 30
rTTP (sec)ICA1–ICA2 0.34 0.24 0.19 0.13 34ICA2–M2 0.68 0.25 0.50 0.16 34ICA2–A2 0.66 0.38 0.34 0.17 17ICA2–PV 4.73 1.00 4.14 0.69 30M2–PV 4.06 0.93 3.67 0.65 30
BAT (sec)ICA1 1.39 0.37 1.19 0.26 34ICA2 1.70 0.37 1.33 0.29 34M2 2.14 0.54 1.65 0.34 34A2 2.17 0.69 1.74 0.37 17PV 4.88 0.94 3.87 0.69 30SSS 5.35 1.53 4.39 1.09 34
FWHM (sec)ICA1 2.66 1.01 1.93 0.41 34ICA2 2.66 0.93 2.01 0.50 34M2 3.22 0.88 2.54 0.65 34A2 2.90 0.84 2.27 0.83 17
WO (AU/s)ICA1 217 110 281 91 34ICA2 229 91 305 107 34M2 90 49 120 46 34A2 79 37 116 34 17
AUC (AU/sec)ICA1 1413 692 1002 340 34ICA2 1561 753 1160 385 34M2 879 377 750 299 34
ME (AU)A2 203 74 234 72 17
Note:—No. indicates number of cases measured; AU, arbitrary unit.
FIG 5. Comparison of the mean BAT (blue, a– e) and mean TTP (red,f–i) before (upper line) and after (lower line) treatment for differentvascular ROIs in the lateral view: ICA1 (a and f), ICA2 (b and g), M2 (c andh), PV (d and i), and SSS (e). The TTP and rTTP are reduced aftertreatment in the extracranial (a and f) and intracranial segments, beingmore obvious in segments between the ICA1 and the PV (a– d and f–i)and less obvious from PV to SSS (d and e).
AJNR Am J Neuroradiol 37:1883– 88 Oct 2016 www.ajnr.org 1887
tration curve. This study also found that carotid stenosis resulted
in longer transit times not only in the stenotic segment but also in
the distal intracranial segments.
REFERENCES1. Tenjin H, Asakura F, Nakahara Y, et al. Evaluation of intraaneurys-
mal blood velocity by time-density curve analysis and digital sub-traction angiography. AJNR Am J Neuroradiol 1998;19:1303– 07Medline
2. Hung SC, Liang ML, Lin CF, et al. New grading of moyamoya diseaseusing color-coded parametric quantitative digital subtraction an-giography. J Chin Med Assoc 2014;77:437– 42 CrossRef Medline
3. Golitz P, Struffert T, Lucking H, et al. Parametric color coding ofdigital subtraction angiography in the evaluation of carotid cavern-ous fistulas. Clin Neuroradiol 2013;23:113–20 CrossRef Medline
4. Lin CJ, Chang FC, Tsai FY, et al. Stenotic transverse sinus predis-poses to poststenting hyperperfusion syndrome as evidenced byquantitative analysis of peritherapeutic cerebral circulation time.AJNR Am J Neuroradiol 2014;35:1132–36 CrossRef Medline
5. Levitt MR, Morton RP, Haynor DR, et al. Angiographic perfusionimaging: real-time assessment of endovascular treatment for cere-bral vasospasm. J Neuroimaging 2014;24:387–92 CrossRef Medline
6. Cover KS, Lagerwaard FJ, van den Berg R, et al. Color intensity pro-jection of digitally subtracted angiography for the visualization ofbrain arteriovenous malformations. Neurosurgery 2007;60:511–14;discussion 514 –15 Medline
7. Strother CM, Bender F, Deuerling-Zheng Y, et al. Parametric colorcoding of digital subtraction angiography. AJNR Am J Neuroradiol2010;31:919 –24 CrossRef Medline
8. Lin CJ, Hung SC, Guo WY, et al. Monitoring peri-therapeutic cere-bral circulation time: a feasibility study using color-coded quanti-tative DSA in patients with steno-occlusive arterial disease. AJNRAm J Neuroradiol 2012;33:1685–90 CrossRef Medline
9. Lin CJ, Luo CB, Hung SC, et al. Application of color-coded digitalsubtraction angiography in treatment of indirect carotid-cavern-ous fistulas: initial experience. J Chin Med Assoc 2013;76:218 –24CrossRef Medline
10. Lin CJ, Chang FC, Guo WY, et al. Changes of time-attenuation curveblood flow parameters in patients with and without carotid steno-sis. AJNR Am J Neuroradiol 2015;36:1176 – 81 CrossRef Medline
11. Zhang Q, Xu R, Sun Q, et al. Exploring the value of using color-coded quantitative DSA evaluation on bilateral common carotidarteries in predicting the reliability of intra-ascending aorta flatdetector CT–CBV maps. AJNR Am J Neuroradiol 2015;36:960 – 66CrossRef Medline
12. Thompson HK Jr, Starmer CF, Whalen RE, et al. Indicator transittime considered as a gamma variate. Cir Res 1964;14:502–15CrossRef Medline
13. Coleman TF, Li Y. On the convergence of interior-reflective Newtonmethods for nonlinear minimization subject to bounds. Math Prog1994;67:189 –224 CrossRef
14. Coleman TF, Li Y. An interior trust region approach for nonlinearminimization subject to bounds. SIAM J Optim 1996;6:418 – 45CrossRef
15. Bahn MM. A single-step method for estimation of local cerebralblood volume from susceptibility contrast MRI images. Magn ResonMed 1995;33:309 –17 CrossRef Medline
16. Kenney JF, Keeping ES. Mathematics of Statistics: Part 1. 3rd ed.Princeton: Van Nostrand; 1962
17. Can U, Furie KL, Suwanwela N, et al. Transcranial Doppler ultra-sound criteria for hemodynamically significant internal carotid ar-tery stenosis based on residual lumen diameter calculated from enbloc endarterectomy specimens. Stroke 1997;28:1966 –71 CrossRefMedline
18. Gray RM, Neuhoff DL. Quantization. IEEE Trans Inf Theory 1998;44:2325– 83 CrossRef
1888 Teng Oct 2016 www.ajnr.org
ORIGINAL RESEARCHEXTRACRANIAL VASCULAR
Intervention versus Aggressive Medical Therapy for Cognitionin Severe Asymptomatic Carotid Stenosis
X C.-J. Lin, X F.-C. Chang, X K.-H. Chou, X P.-C. Tu, X Y.-H. Lee, X C.-P. Lin, X P.-N. Wang, and X I.-H. Lee
ABSTRACT
BACKGROUND AND PURPOSE: Asymptomatic carotid stenosis of �70% increases the incidence of microembolism and/or chronichypoperfusion, which may consequently impair neurocognition and brain connections. We sought controlled evidence for any cognitivebenefit of aggressive medical therapy and combined carotid revascularization.
MATERIALS AND METHODS: Patients with asymptomatic, unilateral, �70% stenosis of the extracranial ICA chose either aggressivemedical therapy alone or in combination with carotid artery stent placement in this nonrandomized controlled study. They were examinedwith a battery of neuropsychological tests, structural MR imaging, DTI, and resting-state fMRI before and 3 months after treatment.
RESULTS: Forty patients were included with 15 in the medical group and 25 in the stent-placement group. Among them, 13 and 21 in therespective groups completed neuroimaging follow-up. The baseline characteristics and the changes in cognitive performance during 3months showed no differences between treatment groups. Nevertheless, compared with the medical group, the stent-placement groupshowed subjective dizziness alleviation (P � .045) and a small increase in fractional anisotropy at the splenium of the corpus callosum andthe posterior periventricular white matter ipsilateral to carotid artery stent placement. Moreover, only the stent-placement group showedinterval improvement in immediate memory and visuospatial performance, which was accompanied by an increase of functional connec-tivity at the insular cortex of the dorsal attention network and the medial prefrontal cortex of the default mode network.
CONCLUSIONS: Both aggressive medical therapy alone and combined carotid revascularization in �70% asymptomatic carotid stenosissimilarly preserved cognition during 3-month follow-up, though the latter had the potential for dizziness alleviation and cognitive andconnectivity enhancement.
ABBREVIATIONS: CAS � carotid artery stent placement; FA � fractional anisotropy; Fc � functional connectivity; MCI � mild cognitive impairment; VCIND �vascular cognitive impairment no dementia
Interventional revascularization for �60% asymptomatic ICA
stenosis has long been debated, given the decreasing annual risk
of ipsilateral ischemic stroke in these patients from 2.3% to 0.5%
with the development of contemporary optimal medical treat-
ment.1-4 However, some of these patients carry a higher risk of
stroke than others despite optimal medical treatment. Patients
with detectable embolic signals by transcranial Doppler have a
high annual risk (7%) of stroke.5 Stenotic degree of �90%, poor
collaterals, and echolucent plaque texture could also stratify pa-
tients into groups with varying high stroke risk to �4% annu-
ally.6,7 Thus, interventional revascularization should be considered
in such patients. Recently, long-term randomized trials, the Asymp-
tomatic Carotid Trial8 and the Carotid Revascularization Endarter-
ectomy versus Stenting Trial (CREST)9 demonstrated that there was
no difference in the rate of late ipsilateral stroke after carotid endar-
terectomy or carotid artery stent placement (CAS) in asymptomatic
and symptomatic patients. Of asymptomatic patients, the 5-year cu-
mulative rate of stroke-free survival was 93.1% in the CAS group and
94.7% in the carotid endarterectomy group.8
Hence, asymptomatic carotid stenosis has been viewed from a
changing perspective from stroke risk to cognitive susceptibil-
ity.10,11 We previously demonstrated that patients with unilateral
asymptomatic carotid stenosis of �70% had more dizziness/
Received October 16, 2015; accepted after revision March 10, 2016.
From the Departments of Neurology (C.-J.L., P.-N.W., I.-H.L.), Radiology (F.-C.C.), andMedical Education and Research (P.-C.T.), Taipei Veterans General Hospital, Taipei,Taiwan; and Institute of Brain Science (C.-J.L., P.-C.T., I.-H.L.), Institute of Neurosci-ence (K.-H.C., C.-P.L.), Department and Institute of Physiology (Y.-H.L.), and Schoolof Medicine (P.-N.W.), National Yang-Ming University, Taipei, Taiwan.
This work was sponsored by Taiwan Ministry of Science and Technology (MOST103-2320-B-075-002, MOST 103-2314-B-075-008, MOST 104-2320-B-075-001) and theTaipei Veterans General Hospital (V103C-171, V104C-059, V105B-029) in Taiwan.
Please address correspondence to I-Hui Lee, MD, PhD, Department of Neurology,Taipei Veterans General Hospital. 201, Section 2, Shipai Rd, Beitou District, Taipei,Taiwan; e-mail: [email protected]
Indicates open access to non-subscribers at www.ajnr.org
http://dx.doi.org/10.3174/ajnr.A4798
AJNR Am J Neuroradiol 37:1889 –97 Oct 2016 www.ajnr.org 1889
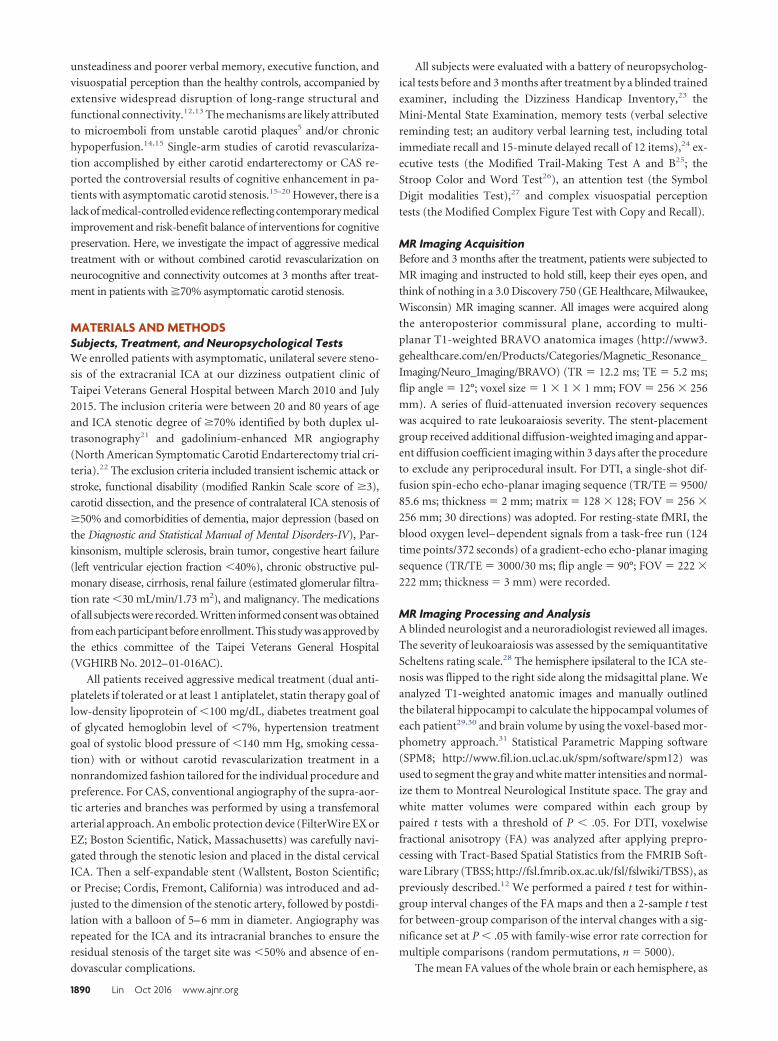
unsteadiness and poorer verbal memory, executive function, and
visuospatial perception than the healthy controls, accompanied by
extensive widespread disruption of long-range structural and
functional connectivity.12,13 The mechanisms are likely attributed
to microemboli from unstable carotid plaques5 and/or chronic
hypoperfusion.14,15 Single-arm studies of carotid revasculariza-
tion accomplished by either carotid endarterectomy or CAS re-
ported the controversial results of cognitive enhancement in pa-
tients with asymptomatic carotid stenosis.15-20 However, there is a
lack of medical-controlled evidence reflecting contemporary medical
improvement and risk-benefit balance of interventions for cognitive
preservation. Here, we investigate the impact of aggressive medical
treatment with or without combined carotid revascularization on
neurocognitive and connectivity outcomes at 3 months after treat-
ment in patients with �70% asymptomatic carotid stenosis.
MATERIALS AND METHODSSubjects, Treatment, and Neuropsychological TestsWe enrolled patients with asymptomatic, unilateral severe steno-
sis of the extracranial ICA at our dizziness outpatient clinic of
Taipei Veterans General Hospital between March 2010 and July
2015. The inclusion criteria were between 20 and 80 years of age
and ICA stenotic degree of �70% identified by both duplex ul-
trasonography21 and gadolinium-enhanced MR angiography
(North American Symptomatic Carotid Endarterectomy trial cri-
teria).22 The exclusion criteria included transient ischemic attack or
stroke, functional disability (modified Rankin Scale score of �3),
carotid dissection, and the presence of contralateral ICA stenosis of
�50% and comorbidities of dementia, major depression (based on
the Diagnostic and Statistical Manual of Mental Disorders-IV), Par-
kinsonism, multiple sclerosis, brain tumor, congestive heart failure
(left ventricular ejection fraction �40%), chronic obstructive pul-
monary disease, cirrhosis, renal failure (estimated glomerular filtra-
tion rate �30 mL/min/1.73 m2), and malignancy. The medications
of all subjects were recorded. Written informed consent was obtained
from each participant before enrollment. This study was approved by
the ethics committee of the Taipei Veterans General Hospital
(VGHIRB No. 2012–01-016AC).
All patients received aggressive medical treatment (dual anti-
platelets if tolerated or at least 1 antiplatelet, statin therapy goal of
low-density lipoprotein of �100 mg/dL, diabetes treatment goal
of glycated hemoglobin level of �7%, hypertension treatment
goal of systolic blood pressure of �140 mm Hg, smoking cessa-
tion) with or without carotid revascularization treatment in a
nonrandomized fashion tailored for the individual procedure and
preference. For CAS, conventional angiography of the supra-aor-
tic arteries and branches was performed by using a transfemoral
arterial approach. An embolic protection device (FilterWire EX or
EZ; Boston Scientific, Natick, Massachusetts) was carefully navi-
gated through the stenotic lesion and placed in the distal cervical
ICA. Then a self-expandable stent (Wallstent, Boston Scientific;
or Precise; Cordis, Fremont, California) was introduced and ad-
justed to the dimension of the stenotic artery, followed by postdi-
lation with a balloon of 5– 6 mm in diameter. Angiography was
repeated for the ICA and its intracranial branches to ensure the
residual stenosis of the target site was �50% and absence of en-
dovascular complications.
All subjects were evaluated with a battery of neuropsycholog-
ical tests before and 3 months after treatment by a blinded trained
examiner, including the Dizziness Handicap Inventory,23 the
Mini-Mental State Examination, memory tests (verbal selective
reminding test; an auditory verbal learning test, including total
immediate recall and 15-minute delayed recall of 12 items),24 ex-
ecutive tests (the Modified Trail-Making Test A and B25; the
Stroop Color and Word Test26), an attention test (the Symbol
Digit modalities Test),27 and complex visuospatial perception
tests (the Modified Complex Figure Test with Copy and Recall).
MR Imaging AcquisitionBefore and 3 months after the treatment, patients were subjected to
MR imaging and instructed to hold still, keep their eyes open, and
think of nothing in a 3.0 Discovery 750 (GE Healthcare, Milwaukee,
Wisconsin) MR imaging scanner. All images were acquired along
the anteroposterior commissural plane, according to multi-
planar T1-weighted BRAVO anatomica images (http://www3.
gehealthcare.com/en/Products/Categories/Magnetic_Resonance_
Imaging/Neuro_Imaging/BRAVO) (TR � 12.2 ms; TE � 5.2 ms;
flip angle � 12°; voxel size � 1 � 1 � 1 mm; FOV � 256 � 256
mm). A series of fluid-attenuated inversion recovery sequences
was acquired to rate leukoaraiosis severity. The stent-placement
group received additional diffusion-weighted imaging and appar-
ent diffusion coefficient imaging within 3 days after the procedure
to exclude any periprocedural insult. For DTI, a single-shot dif-
fusion spin-echo echo-planar imaging sequence (TR/TE � 9500/
85.6 ms; thickness � 2 mm; matrix � 128 � 128; FOV � 256 �
256 mm; 30 directions) was adopted. For resting-state fMRI, the
blood oxygen level– dependent signals from a task-free run (124
time points/372 seconds) of a gradient-echo echo-planar imaging
sequence (TR/TE � 3000/30 ms; flip angle � 90°; FOV � 222 �
222 mm; thickness � 3 mm) were recorded.
MR Imaging Processing and AnalysisA blinded neurologist and a neuroradiologist reviewed all images.
The severity of leukoaraiosis was assessed by the semiquantitative
Scheltens rating scale.28 The hemisphere ipsilateral to the ICA ste-
nosis was flipped to the right side along the midsagittal plane. We
analyzed T1-weighted anatomic images and manually outlined
the bilateral hippocampi to calculate the hippocampal volumes of
each patient29,30 and brain volume by using the voxel-based mor-
phometry approach.31 Statistical Parametric Mapping software
(SPM8; http://www.fil.ion.ucl.ac.uk/spm/software/spm12) was
used to segment the gray and white matter intensities and normal-
ize them to Montreal Neurological Institute space. The gray and
white matter volumes were compared within each group by
paired t tests with a threshold of P � .05. For DTI, voxelwise
fractional anisotropy (FA) was analyzed after applying prepro-
cessing with Tract-Based Spatial Statistics from the FMRIB Soft-
ware Library (TBSS; http://fsl.fmrib.ox.ac.uk/fsl/fslwiki/TBSS), as
previously described.12 We performed a paired t test for within-
group interval changes of the FA maps and then a 2-sample t test
for between-group comparison of the interval changes with a sig-
nificance set at P � .05 with family-wise error rate correction for
multiple comparisons (random permutations, n � 5000).
The mean FA values of the whole brain or each hemisphere, as
1890 Lin Oct 2016 www.ajnr.org
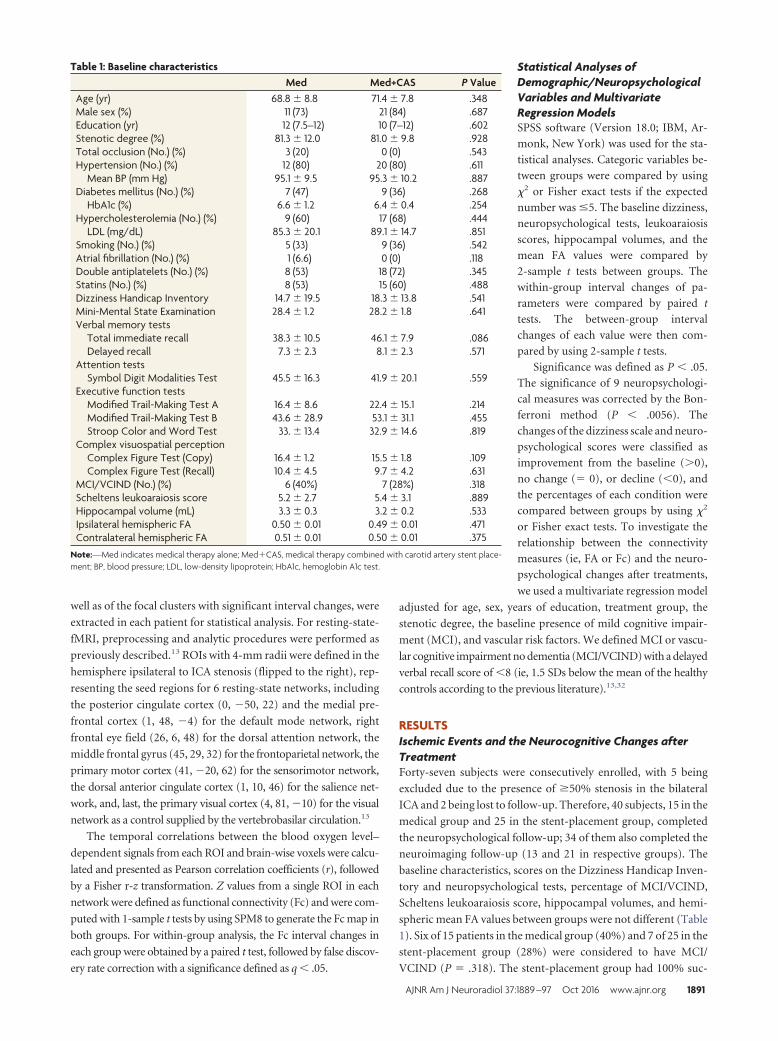
well as of the focal clusters with significant interval changes, were
extracted in each patient for statistical analysis. For resting-state-
fMRI, preprocessing and analytic procedures were performed as
previously described.13 ROIs with 4-mm radii were defined in the
hemisphere ipsilateral to ICA stenosis (flipped to the right), rep-
resenting the seed regions for 6 resting-state networks, including
the posterior cingulate cortex (0, �50, 22) and the medial pre-
frontal cortex (1, 48, �4) for the default mode network, right
frontal eye field (26, 6, 48) for the dorsal attention network, the
middle frontal gyrus (45, 29, 32) for the frontoparietal network, the
primary motor cortex (41, �20, 62) for the sensorimotor network,
the dorsal anterior cingulate cortex (1, 10, 46) for the salience net-
work, and, last, the primary visual cortex (4, 81, �10) for the visual
network as a control supplied by the vertebrobasilar circulation.13
The temporal correlations between the blood oxygen level–
dependent signals from each ROI and brain-wise voxels were calcu-
lated and presented as Pearson correlation coefficients (r), followed
by a Fisher r-z transformation. Z values from a single ROI in each
network were defined as functional connectivity (Fc) and were com-
puted with 1-sample t tests by using SPM8 to generate the Fc map in
both groups. For within-group analysis, the Fc interval changes in
each group were obtained by a paired t test, followed by false discov-
ery rate correction with a significance defined as q � .05.
Statistical Analyses ofDemographic/NeuropsychologicalVariables and MultivariateRegression ModelsSPSS software (Version 18.0; IBM, Ar-
monk, New York) was used for the sta-
tistical analyses. Categoric variables be-
tween groups were compared by using
�2 or Fisher exact tests if the expected
number was �5. The baseline dizziness,
neuropsychological tests, leukoaraiosis
scores, hippocampal volumes, and the
mean FA values were compared by
2-sample t tests between groups. The
within-group interval changes of pa-
rameters were compared by paired t
tests. The between-group interval
changes of each value were then com-
pared by using 2-sample t tests.
Significance was defined as P � .05.
The significance of 9 neuropsychologi-
cal measures was corrected by the Bon-
ferroni method (P � .0056). The
changes of the dizziness scale and neuro-
psychological scores were classified as
improvement from the baseline (�0),
no change (� 0), or decline (�0), and
the percentages of each condition were
compared between groups by using �2
or Fisher exact tests. To investigate the
relationship between the connectivity
measures (ie, FA or Fc) and the neuro-
psychological changes after treatments,
we used a multivariate regression model
adjusted for age, sex, years of education, treatment group, the
stenotic degree, the baseline presence of mild cognitive impair-
ment (MCI), and vascular risk factors. We defined MCI or vascu-
lar cognitive impairment no dementia (MCI/VCIND) with a delayed
verbal recall score of �8 (ie, 1.5 SDs below the mean of the healthy
controls according to the previous literature).13,32
RESULTSIschemic Events and the Neurocognitive Changes afterTreatmentForty-seven subjects were consecutively enrolled, with 5 being
excluded due to the presence of �50% stenosis in the bilateral
ICA and 2 being lost to follow-up. Therefore, 40 subjects, 15 in the
medical group and 25 in the stent-placement group, completed
the neuropsychological follow-up; 34 of them also completed the
neuroimaging follow-up (13 and 21 in respective groups). The
baseline characteristics, scores on the Dizziness Handicap Inven-
tory and neuropsychological tests, percentage of MCI/VCIND,
Scheltens leukoaraiosis score, hippocampal volumes, and hemi-
spheric mean FA values between groups were not different (Table
1). Six of 15 patients in the medical group (40%) and 7 of 25 in the
stent-placement group (28%) were considered to have MCI/
VCIND (P � .318). The stent-placement group had 100% suc-
Table 1: Baseline characteristicsMed Med+CAS P Value
Age (yr) 68.8 � 8.8 71.4 � 7.8 .348Male sex (%) 11 (73) 21 (84) .687Education (yr) 12 (7.5–12) 10 (7–12) .602Stenotic degree (%) 81.3 � 12.0 81.0 � 9.8 .928Total occlusion (No.) (%) 3 (20) 0 (0) .543Hypertension (No.) (%) 12 (80) 20 (80) .611
Mean BP (mm Hg) 95.1 � 9.5 95.3 � 10.2 .887Diabetes mellitus (No.) (%) 7 (47) 9 (36) .268
HbA1c (%) 6.6 � 1.2 6.4 � 0.4 .254Hypercholesterolemia (No.) (%) 9 (60) 17 (68) .444
LDL (mg/dL) 85.3 � 20.1 89.1 � 14.7 .851Smoking (No.) (%) 5 (33) 9 (36) .542Atrial fibrillation (No.) (%) 1 (6.6) 0 (0) .118Double antiplatelets (No.) (%) 8 (53) 18 (72) .345Statins (No.) (%) 8 (53) 15 (60) .488Dizziness Handicap Inventory 14.7 � 19.5 18.3 � 13.8 .541Mini-Mental State Examination 28.4 � 1.2 28.2 � 1.8 .641Verbal memory tests
Total immediate recall 38.3 � 10.5 46.1 � 7.9 .086Delayed recall 7.3 � 2.3 8.1 � 2.3 .571
Attention testsSymbol Digit Modalities Test 45.5 � 16.3 41.9 � 20.1 .559
Executive function testsModified Trail-Making Test A 16.4 � 8.6 22.4 � 15.1 .214Modified Trail-Making Test B 43.6 � 28.9 53.1 � 31.1 .455Stroop Color and Word Test 33. � 13.4 32.9 � 14.6 .819
Complex visuospatial perceptionComplex Figure Test (Copy) 16.4 � 1.2 15.5 � 1.8 .109Complex Figure Test (Recall) 10.4 � 4.5 9.7 � 4.2 .631
MCI/VCIND (No.) (%) 6 (40%) 7 (28%) .318Scheltens leukoaraiosis score 5.2 � 2.7 5.4 � 3.1 .889Hippocampal volume (mL) 3.3 � 0.3 3.2 � 0.2 .533Ipsilateral hemispheric FA 0.50 � 0.01 0.49 � 0.01 .471Contralateral hemispheric FA 0.51 � 0.01 0.50 � 0.01 .375
Note:—Med indicates medical therapy alone; Med�CAS, medical therapy combined with carotid artery stent place-ment; BP, blood pressure; LDL, low-density lipoprotein; HbA1c, hemoglobin A1c test.
AJNR Am J Neuroradiol 37:1889 –97 Oct 2016 www.ajnr.org 1891
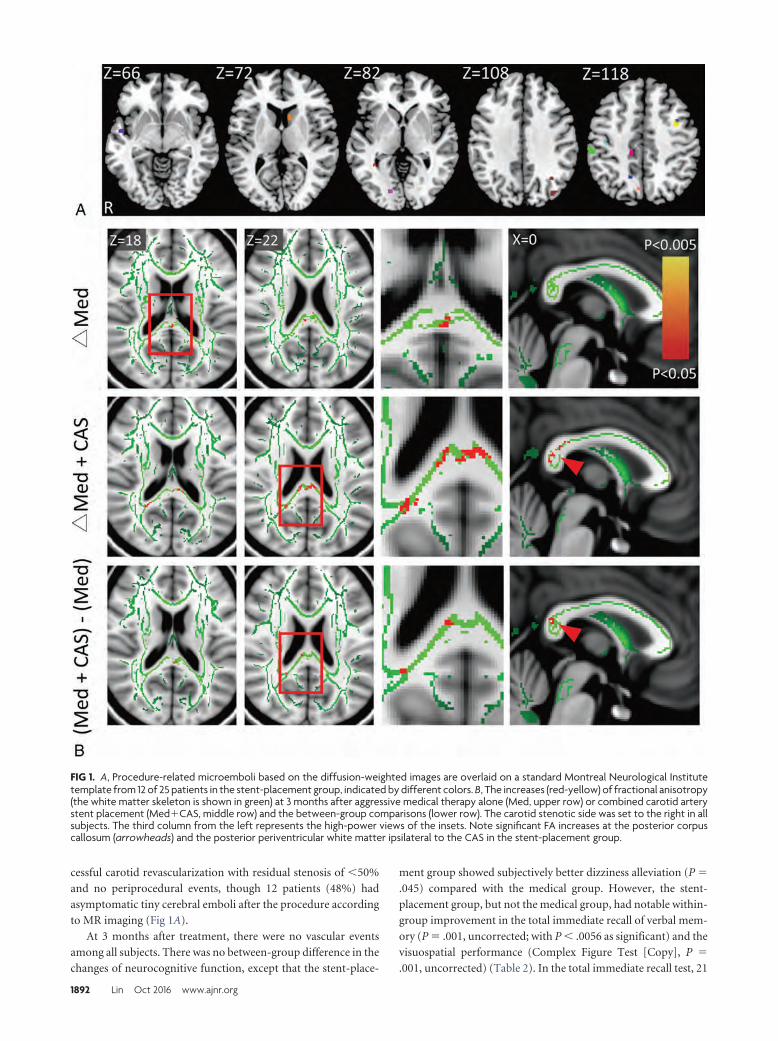
cessful carotid revascularization with residual stenosis of �50%
and no periprocedural events, though 12 patients (48%) had
asymptomatic tiny cerebral emboli after the procedure according
to MR imaging (Fig 1A).
At 3 months after treatment, there were no vascular events
among all subjects. There was no between-group difference in the
changes of neurocognitive function, except that the stent-place-
ment group showed subjectively better dizziness alleviation (P �
.045) compared with the medical group. However, the stent-
placement group, but not the medical group, had notable within-
group improvement in the total immediate recall of verbal mem-
ory (P � .001, uncorrected; with P � .0056 as significant) and the
visuospatial performance (Complex Figure Test [Copy], P �
.001, uncorrected) (Table 2). In the total immediate recall test, 21
FIG 1. A, Procedure-related microemboli based on the diffusion-weighted images are overlaid on a standard Montreal Neurological Institutetemplate from 12 of 25 patients in the stent-placement group, indicated by different colors. B, The increases (red-yellow) of fractional anisotropy(the white matter skeleton is shown in green) at 3 months after aggressive medical therapy alone (Med, upper row) or combined carotid arterystent placement (Med�CAS, middle row) and the between-group comparisons (lower row). The carotid stenotic side was set to the right in allsubjects. The third column from the left represents the high-power views of the insets. Note significant FA increases at the posterior corpuscallosum (arrowheads) and the posterior periventricular white matter ipsilateral to the CAS in the stent-placement group.
1892 Lin Oct 2016 www.ajnr.org
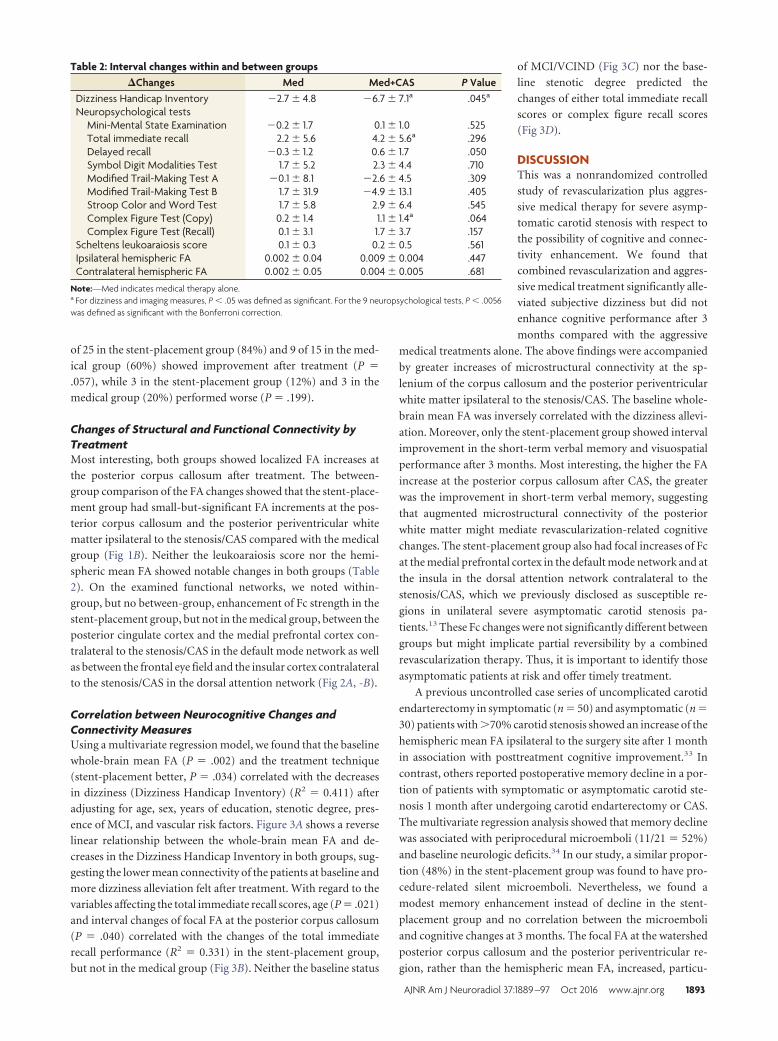
of 25 in the stent-placement group (84%) and 9 of 15 in the med-
ical group (60%) showed improvement after treatment (P �
.057), while 3 in the stent-placement group (12%) and 3 in the
medical group (20%) performed worse (P � .199).
Changes of Structural and Functional Connectivity byTreatmentMost interesting, both groups showed localized FA increases at
the posterior corpus callosum after treatment. The between-
group comparison of the FA changes showed that the stent-place-
ment group had small-but-significant FA increments at the pos-
terior corpus callosum and the posterior periventricular white
matter ipsilateral to the stenosis/CAS compared with the medical
group (Fig 1B). Neither the leukoaraiosis score nor the hemi-
spheric mean FA showed notable changes in both groups (Table
2). On the examined functional networks, we noted within-
group, but no between-group, enhancement of Fc strength in the
stent-placement group, but not in the medical group, between the
posterior cingulate cortex and the medial prefrontal cortex con-
tralateral to the stenosis/CAS in the default mode network as well
as between the frontal eye field and the insular cortex contralateral
to the stenosis/CAS in the dorsal attention network (Fig 2A, -B).
Correlation between Neurocognitive Changes andConnectivity MeasuresUsing a multivariate regression model, we found that the baseline
whole-brain mean FA (P � .002) and the treatment technique
(stent-placement better, P � .034) correlated with the decreases
in dizziness (Dizziness Handicap Inventory) (R2 � 0.411) after
adjusting for age, sex, years of education, stenotic degree, pres-
ence of MCI, and vascular risk factors. Figure 3A shows a reverse
linear relationship between the whole-brain mean FA and de-
creases in the Dizziness Handicap Inventory in both groups, sug-
gesting the lower mean connectivity of the patients at baseline and
more dizziness alleviation felt after treatment. With regard to the
variables affecting the total immediate recall scores, age (P � .021)
and interval changes of focal FA at the posterior corpus callosum
(P � .040) correlated with the changes of the total immediate
recall performance (R2 � 0.331) in the stent-placement group,
but not in the medical group (Fig 3B). Neither the baseline status
of MCI/VCIND (Fig 3C) nor the base-
line stenotic degree predicted the
changes of either total immediate recall
scores or complex figure recall scores
(Fig 3D).
DISCUSSIONThis was a nonrandomized controlled
study of revascularization plus aggres-
sive medical therapy for severe asymp-
tomatic carotid stenosis with respect to
the possibility of cognitive and connec-
tivity enhancement. We found that
combined revascularization and aggres-
sive medical treatment significantly alle-
viated subjective dizziness but did not
enhance cognitive performance after 3
months compared with the aggressive
medical treatments alone. The above findings were accompanied
by greater increases of microstructural connectivity at the sp-
lenium of the corpus callosum and the posterior periventricular
white matter ipsilateral to the stenosis/CAS. The baseline whole-
brain mean FA was inversely correlated with the dizziness allevi-
ation. Moreover, only the stent-placement group showed interval
improvement in the short-term verbal memory and visuospatial
performance after 3 months. Most interesting, the higher the FA
increase at the posterior corpus callosum after CAS, the greater
was the improvement in short-term verbal memory, suggesting
that augmented microstructural connectivity of the posterior
white matter might mediate revascularization-related cognitive
changes. The stent-placement group also had focal increases of Fc
at the medial prefrontal cortex in the default mode network and at
the insula in the dorsal attention network contralateral to the
stenosis/CAS, which we previously disclosed as susceptible re-
gions in unilateral severe asymptomatic carotid stenosis pa-
tients.13 These Fc changes were not significantly different between
groups but might implicate partial reversibility by a combined
revascularization therapy. Thus, it is important to identify those
asymptomatic patients at risk and offer timely treatment.
A previous uncontrolled case series of uncomplicated carotid
endarterectomy in symptomatic (n � 50) and asymptomatic (n �
30) patients with �70% carotid stenosis showed an increase of the
hemispheric mean FA ipsilateral to the surgery site after 1 month
in association with posttreatment cognitive improvement.33 In
contrast, others reported postoperative memory decline in a por-
tion of patients with symptomatic or asymptomatic carotid ste-
nosis 1 month after undergoing carotid endarterectomy or CAS.
The multivariate regression analysis showed that memory decline
was associated with periprocedural microemboli (11/21 � 52%)
and baseline neurologic deficits.34 In our study, a similar propor-
tion (48%) in the stent-placement group was found to have pro-
cedure-related silent microemboli. Nevertheless, we found a
modest memory enhancement instead of decline in the stent-
placement group and no correlation between the microemboli
and cognitive changes at 3 months. The focal FA at the watershed
posterior corpus callosum and the posterior periventricular re-
gion, rather than the hemispheric mean FA, increased, particu-
Table 2: Interval changes within and between groups�Changes Med Med+CAS P Value
Dizziness Handicap Inventory �2.7 � 4.8 �6.7 � 7.1a .045a
Neuropsychological testsMini-Mental State Examination �0.2 � 1.7 0.1 � 1.0 .525Total immediate recall 2.2 � 5.6 4.2 � 5.6a .296Delayed recall �0.3 � 1.2 0.6 � 1.7 .050Symbol Digit Modalities Test 1.7 � 5.2 2.3 � 4.4 .710Modified Trail-Making Test A �0.1 � 8.1 �2.6 � 4.5 .309Modified Trail-Making Test B 1.7 � 31.9 �4.9 � 13.1 .405Stroop Color and Word Test 1.7 � 5.8 2.9 � 6.4 .545Complex Figure Test (Copy) 0.2 � 1.4 1.1 � 1.4a .064Complex Figure Test (Recall) 0.1 � 3.1 1.7 � 3.7 .157
Scheltens leukoaraiosis score 0.1 � 0.3 0.2 � 0.5 .561Ipsilateral hemispheric FA 0.002 � 0.04 0.009 � 0.004 .447Contralateral hemispheric FA 0.002 � 0.05 0.004 � 0.005 .681
Note:—Med indicates medical therapy alone.a For dizziness and imaging measures, P � .05 was defined as significant. For the 9 neuropsychological tests, P � .0056was defined as significant with the Bonferroni correction.
AJNR Am J Neuroradiol 37:1889 –97 Oct 2016 www.ajnr.org 1893
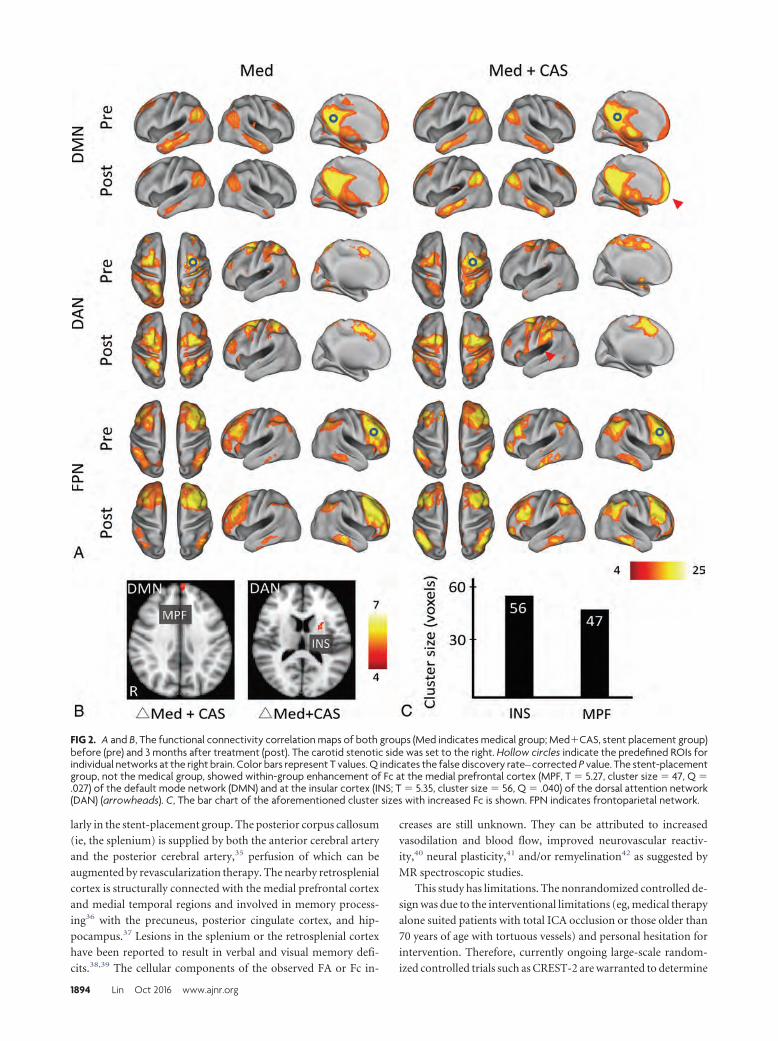
larly in the stent-placement group. The posterior corpus callosum
(ie, the splenium) is supplied by both the anterior cerebral artery
and the posterior cerebral artery,35 perfusion of which can be
augmented by revascularization therapy. The nearby retrosplenial
cortex is structurally connected with the medial prefrontal cortex
and medial temporal regions and involved in memory process-
ing36 with the precuneus, posterior cingulate cortex, and hip-
pocampus.37 Lesions in the splenium or the retrosplenial cortex
have been reported to result in verbal and visual memory defi-
cits.38,39 The cellular components of the observed FA or Fc in-
creases are still unknown. They can be attributed to increased
vasodilation and blood flow, improved neurovascular reactiv-
ity,40 neural plasticity,41 and/or remyelination42 as suggested by
MR spectroscopic studies.
This study has limitations. The nonrandomized controlled de-
sign was due to the interventional limitations (eg, medical therapy
alone suited patients with total ICA occlusion or those older than
70 years of age with tortuous vessels) and personal hesitation for
intervention. Therefore, currently ongoing large-scale random-
ized controlled trials such as CREST-2 are warranted to determine
FIG 2. A and B, The functional connectivity correlation maps of both groups (Med indicates medical group; Med�CAS, stent placement group)before (pre) and 3 months after treatment (post). The carotid stenotic side was set to the right. Hollow circles indicate the predefined ROIs forindividual networks at the right brain. Color bars represent T values. Q indicates the false discovery rate– corrected P value. The stent-placementgroup, not the medical group, showed within-group enhancement of Fc at the medial prefrontal cortex (MPF, T � 5.27, cluster size � 47, Q �.027) of the default mode network (DMN) and at the insular cortex (INS; T � 5.35, cluster size � 56, Q � .040) of the dorsal attention network(DAN) (arrowheads). C, The bar chart of the aforementioned cluster sizes with increased Fc is shown. FPN indicates frontoparietal network.
1894 Lin Oct 2016 www.ajnr.org
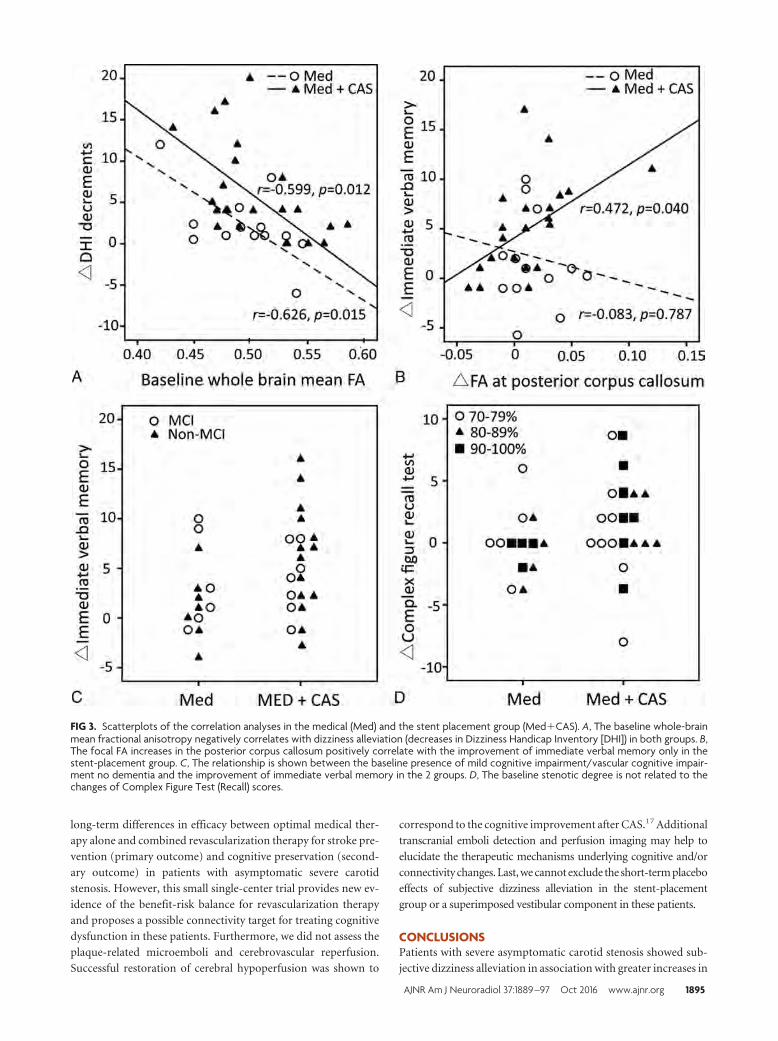
long-term differences in efficacy between optimal medical ther-
apy alone and combined revascularization therapy for stroke pre-
vention (primary outcome) and cognitive preservation (second-
ary outcome) in patients with asymptomatic severe carotid
stenosis. However, this small single-center trial provides new ev-
idence of the benefit-risk balance for revascularization therapy
and proposes a possible connectivity target for treating cognitive
dysfunction in these patients. Furthermore, we did not assess the
plaque-related microemboli and cerebrovascular reperfusion.
Successful restoration of cerebral hypoperfusion was shown to
correspond to the cognitive improvement after CAS.17 Additional
transcranial emboli detection and perfusion imaging may help to
elucidate the therapeutic mechanisms underlying cognitive and/or
connectivity changes. Last, we cannot exclude the short-term placebo
effects of subjective dizziness alleviation in the stent-placement
group or a superimposed vestibular component in these patients.
CONCLUSIONSPatients with severe asymptomatic carotid stenosis showed sub-
jective dizziness alleviation in association with greater increases in
FIG 3. Scatterplots of the correlation analyses in the medical (Med) and the stent placement group (Med�CAS). A, The baseline whole-brainmean fractional anisotropy negatively correlates with dizziness alleviation (decreases in Dizziness Handicap Inventory [DHI]) in both groups. B,The focal FA increases in the posterior corpus callosum positively correlate with the improvement of immediate verbal memory only in thestent-placement group. C, The relationship is shown between the baseline presence of mild cognitive impairment/vascular cognitive impair-ment no dementia and the improvement of immediate verbal memory in the 2 groups. D, The baseline stenotic degree is not related to thechanges of Complex Figure Test (Recall) scores.
AJNR Am J Neuroradiol 37:1889 –97 Oct 2016 www.ajnr.org 1895
microstructural connectivity at the posterior corpus callosum and
periventricular white matter by aggressive medical therapy plus
successful revascularization compared with aggressive medical
therapy alone. However, the cognitive benefit was insignificant
between groups at 3 months after treatment in our study. Unlike
neurodegenerative causes of cognitive impairment, vascular dam-
age is preventable and treatable. Our results suggest the feasibility
of combined medical and revascularization treatment in severe
asymptomatic carotid stenosis for limiting cognitive decline, pos-
sibly through ancillary connectivity enhancement. Large long-
term controlled studies are warranted to provide a risk-benefit
assessment for prophylactic carotid revascularization.
ACKNOWLEDGMENTSWe gratefully acknowledge Wen-Yung Sheng for providing sta-
tistical advice. We also thank the Clinical Research Core Labora-
tory of Taipei Veterans General Hospital for providing experi-
mental space and facilities.
Disclosures: Chun-Jen Lin—RELATED: Grant: Taipei Veterans General Hospital, Tai-wan (V103C-171, V104C-059, V105B-029).* I-Hui Lee—RELATED: Grant: Ministry ofScience and Technology, Taiwan (MOST103–2320-B-075– 002, MOST103–2314-B-075– 008, MOST104 –2320-B-075– 001), Taipei Veterans General Hospital, Taiwan(V103C-171, V104C-059, V105B-029)*; Support for Travel to Meetings for the Study orOther Purposes: Ministry of Science and Technology, Taiwan.* *Money paid to theinstitution.
REFERENCES1. Executive Committee for the Asymptomatic Carotid Atherosclerosis
Study. Endarterectomy for asymptomatic carotid artery stenosis.JAMA 1995;273:1421–28 CrossRef Medline
2. Halliday A, Mansfield A, Marro J, et al; MRC Asymptomatic CarotidSurgery Trial (ACST) Collaborative Group. Prevention of disablingand fatal strokes by successful carotid endarterectomy in patientswithout recent neurological symptoms: randomised controlledtrial. Lancet 2004;363:1491–502 CrossRef Medline
3. Marquardt L, Geraghty OC, Mehta Z, et al. Low risk of ipsilateralstroke in patients with asymptomatic carotid stenosis on best med-ical treatment: a prospective, population-based study. Stroke 2010;41:e11–17 CrossRef Medline
4. den Hartog AG, Achterberg S, Moll FL, et al; SMART Study Group.Asymptomatic carotid artery stenosis and the risk of ischemicstroke according to subtype in patients with clinical manifest arte-rial disease. Stroke 2013;44:1002– 07 CrossRef Medline
5. Markus HS, King A, Shipley M, et al. Asymptomatic embolisationfor prediction of stroke in the Asymptomatic Carotid Emboli Study(ACES): a prospective observational study. Lancet Neurol 2010;9:663–71 CrossRef Medline
6. Nicolaides AN, Kakkos SK, Kyriacou E, et al. Asymptomatic internalcarotid artery stenosis and cerebrovascular risk stratification. JVasc Surg 2010;52: 1486 –1496.e1–5 CrossRef Medline
7. Gupta A, Chazen JL, Hartman M, et al. Cerebrovascular reserve andstroke risk in patients with carotid stenosis or occlusion: a system-atic review and meta-analysis. Stroke 2012;43:2884 –91 CrossRefMedline
8. Rosenfield K, Matsumura JS, Chaturvedi S, et al. Randomized trial ofstent versus surgery for asymptomatic carotid stenosis. N EnglJ Med 2016;374:1011–20 CrossRef Medline
9. Brott TG, Howard G, Roubin GS, et al; CREST Investigators. Long-term results of stenting versus endarterectomy for carotid-arterystenosis. N Engl J Med 2016;374:1021–31 CrossRef Medline
10. Johnston SC, O’Meara ES, Manolio TA, et al. Cognitive impairmentand decline are associated with carotid artery disease in patientswithout clinically evident cerebrovascular disease. Ann Intern Med2004;140:237– 47 CrossRef Medline
11. Popovic IM, Lovrencic-Huzjan A, Simundic AM, et al. Cognitiveperformance in asymptomatic patients with advanced carotid dis-ease. Cogn Behav Neurol 2011;24:145–51 CrossRef Medline
12. Cheng HL, Lin CJ, Soong BW, et al. Impairments in cognitive func-tion and brain connectivity in severe asymptomatic carotid steno-sis. Stroke 2012;43:2567–73 CrossRef Medline
13. Lin CJ, Tu PC, Chern CM, et al. Connectivity features for identifyingcognitive impairment in presymptomatic carotid stenosis. PLoSOne 2014;9:e85441 CrossRef Medline
14. Silvestrini M, Paolino I, Vernieri F, et al. Cerebral hemodynamicsand cognitive performance in patients with asymptomatic carotidstenosis. Neurology 2009;72:1062– 68 CrossRef Medline
15. Ortega G, Alvarez B, Quintana M, et al. Asymptomatic carotid ste-nosis and cognitive improvement using transcervical stenting withprotective flow reversal technique. Eur J Vasc Endovas Surg 2014;47:585–92 CrossRef Medline
16. Grunwald IQ, Papanagiotou P, Reith W, et al. Influence of carotidartery stenting on cognitive function. Neuroradiology 2010;52:61– 66 CrossRef Medline
17. Chen YH, Lin MS, Lee JK, et al. Carotid stenting improves cognitivefunction in asymptomatic cerebral ischemia. Int J Cardiol 2012;157:104 – 07 CrossRef Medline
18. Antonopoulos CN, Kakisis JD, Sfyroeras GS, et al. The impact ofcarotid artery stenting on cognitive function in patients with ex-tracranial carotid artery stenosis. Ann Vasc Surg 2015;29:457– 69CrossRef Medline
19. Yoon BA, Sohn SW, Cheon SM, et al. Effect of carotid artery stentingon cognitive function in patients with carotid artery stenosis: a pro-spective, 3-month-follow-up study. J Clin Neurol 2015;11:149 –56CrossRef Medline
20. Mendiz OA, Sposato LA, Fabbro N, et al. Improvement in execu-tive function after unilateral carotid artery stenting for severeasymptomatic stenosis. J Neurosurg 2012;116:179 – 84 CrossRefMedline
21. Grant EG, Benson CB, Moneta GL, et al. Carotid artery stenosis:gray-scale and Doppler US diagnosis—Society of Radiologists inUltrasound Consensus Conference. Radiology 2003;229:340 – 46CrossRef Medline
22. North American Symptomatic Carotid Endarterectomy Trial Collab-orators. Beneficial effect of carotid endarterectomy in symptomaticpatients with high-grade carotid stenosis. N Engl J Med 1991;325:445–53 CrossRef Medline
23. Jacobson GP, Newman CW. The development of the DizzinessHandicap Inventory. Arch Otolaryngol Head Neck Surg 1990;116:424 –27 CrossRef Medline
24. Hannay HJ, Levin HS. Selective reminding test: an examination ofthe equivalence of four forms. J Clin Exp Neuropsychol 1985;7:251– 63 CrossRef Medline
25. Tombaugh TN. Trail Making Test A and B: normative data strati-fied by age and education. Arch Clin Neuropsychol 2004;19:203–14CrossRef Medline
26. Jensen AR, Rohwer WD Jr. The Stroop color-word test: a review.Acta Psychol (Amst) 1966;25:36 –93 CrossRef Medline
27. Erber JT, Botwinick J, Storandt M. The impact of memory on agedifferences in digit symbol performance. J Gerontol 1981;36:586 –90CrossRef Medline
28. Scheltens P, Barkhof F, Leys D, et al. A semiquantative rating scalefor the assessment of signal hyperintensities on magnetic reso-nance imaging. J Neurol Sci 1993;114:7–12 CrossRef Medline
29. Lehericy S, Baulac M, Chiras J, et al. Amygdalohippocampal MRvolume measurements in the early stages of Alzheimer disease.AJNR Am J Neuroradiol 1994;15:929 –37 Medline
30. Wang PN, Lirng JF, Lin KN, et al. Prediction of Alzheimer’s diseasein mild cognitive impairment: a prospective study in Taiwan. Neu-robiol Aging 2006;27:1797– 806 CrossRef Medline
31. Ashburner J, Friston KJ. Voxel-based morphometry: the methods.Neuroimage 2000;11:805–21 CrossRef Medline
1896 Lin Oct 2016 www.ajnr.org
32. Larrabee GJ, Trahan DE, Levin HS. Normative data for a six-trialadministration of the Verbal Selective Reminding Test. Clin Neuro-psychol 2000;14:110 –18 CrossRef Medline
33. Sato Y, Ito K, Ogasawara K, et al. Postoperative increase in cerebralwhite matter fractional anisotropy on diffusion tensor magnetic reso-nance imaging is associated with cognitive improvement after uncom-plicated carotid endarterectomy: tract-based spatial statistics analysis.Neurosurgery 2013;73:592–98; discussion 598–99 CrossRef Medline
34. Zhou W, Hitchner E, Gillis K, et al. Prospective neurocognitive eval-uation of patients undergoing carotid interventions. J Vasc Surg2012;56:1571–78 CrossRef Medline
35. Kahilogullari G, Comert A, Ozdemir M, et al. Arterial vasculariza-tion patterns of the splenium: an anatomical study. Clin Anat 2013;26:675– 81 CrossRef Medline
36. Vann SD, Aggleton JP, Maguire EA. What does the retrosplenialcortex do? Nat Rev Neurosci 2009;10:792– 802 CrossRef Medline
37. Wang L, Laviolette P, O’Keefe K, et al. Intrinsic connectivity betweenthe hippocampus and posteromedial cortex predicts memory per-
formance in cognitively intact older individuals. Neuroimage 2010;51:910 –17 CrossRef Medline
38. Kim JH, Park KY, Seo SW, et al. Reversible verbal and visual memorydeficits after left retrosplenial infarction. J Clin Neurol 2007;3:62– 66CrossRef Medline
39. Jeong SH, Lee JH, Lee AY. Reversible visual memory in transientsplenial lesion. Neurology 2009;73:647 CrossRef Medline
40. Schaaf M, Mommertz G, Ludolph A, et al. Functional MR imaging inpatients with carotid artery stenosis before and after revasculariza-tion. AJNR Am J Neuroradiol 2010;31:1791–98 CrossRef Medline
41. Saito H, Ogasawara K, Nishimoto H, et al. Postoperative changes incerebral metabolites associated with cognitive improvement and im-pairment after carotid endarterectomy: a 3T proton MR spectroscopystudy. AJNR Am J Neuroradiol 2013;34:976–82 CrossRef Medline
42. Kim GE, Lee JH, Cho YP. Can carotid endarterectomy improve met-abolic status in patients with asymptomatic internal carotid arteryflow lesion? Studies with localized in vivo proton magnetic reso-nance spectroscopy. J Vasc Surg 2002;36:559 – 64 CrossRef Medline
AJNR Am J Neuroradiol 37:1889 –97 Oct 2016 www.ajnr.org 1897
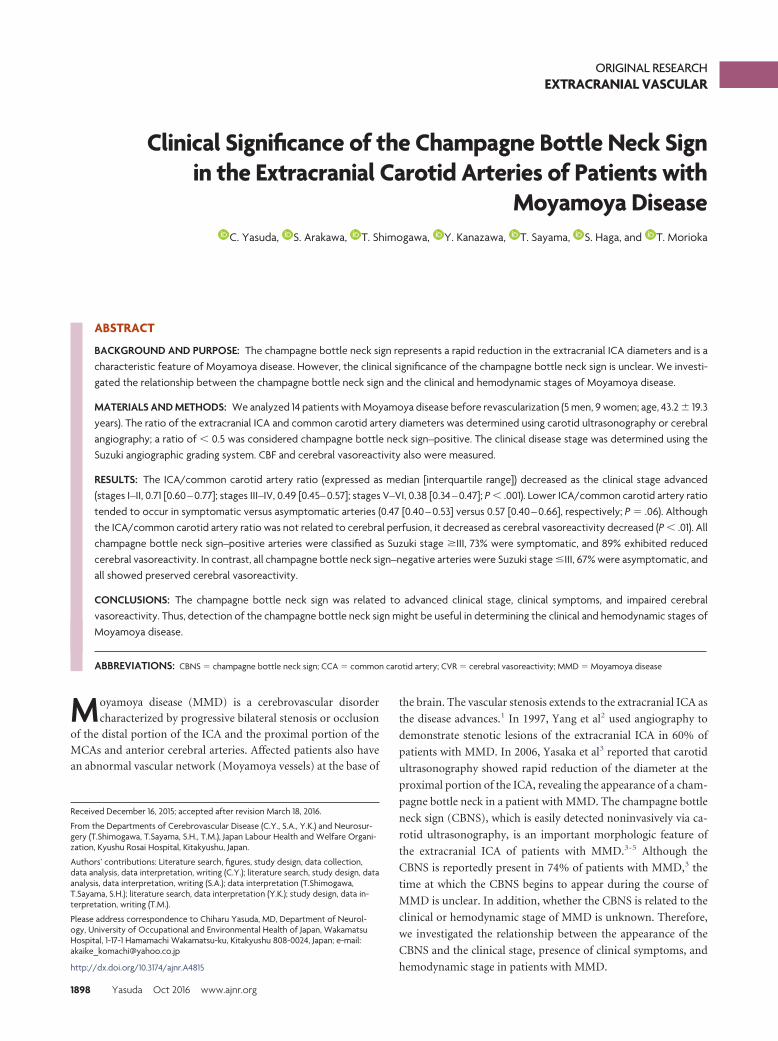
ORIGINAL RESEARCHEXTRACRANIAL VASCULAR
Clinical Significance of the Champagne Bottle Neck Signin the Extracranial Carotid Arteries of Patients with
Moyamoya DiseaseX C. Yasuda, X S. Arakawa, X T. Shimogawa, X Y. Kanazawa, X T. Sayama, X S. Haga, and X T. Morioka
ABSTRACT
BACKGROUND AND PURPOSE: The champagne bottle neck sign represents a rapid reduction in the extracranial ICA diameters and is acharacteristic feature of Moyamoya disease. However, the clinical significance of the champagne bottle neck sign is unclear. We investi-gated the relationship between the champagne bottle neck sign and the clinical and hemodynamic stages of Moyamoya disease.
MATERIALS AND METHODS: We analyzed 14 patients with Moyamoya disease before revascularization (5 men, 9 women; age, 43.2 � 19.3years). The ratio of the extracranial ICA and common carotid artery diameters was determined using carotid ultrasonography or cerebralangiography; a ratio of � 0.5 was considered champagne bottle neck sign–positive. The clinical disease stage was determined using theSuzuki angiographic grading system. CBF and cerebral vasoreactivity also were measured.
RESULTS: The ICA/common carotid artery ratio (expressed as median [interquartile range]) decreased as the clinical stage advanced(stages I–II, 0.71 [0.60 – 0.77]; stages III–IV, 0.49 [0.45– 0.57]; stages V–VI, 0.38 [0.34 – 0.47]; P � .001). Lower ICA/common carotid artery ratiotended to occur in symptomatic versus asymptomatic arteries (0.47 [0.40 – 0.53] versus 0.57 [0.40 – 0.66], respectively; P � .06). Althoughthe ICA/common carotid artery ratio was not related to cerebral perfusion, it decreased as cerebral vasoreactivity decreased (P � .01). Allchampagne bottle neck sign–positive arteries were classified as Suzuki stage �III, 73% were symptomatic, and 89% exhibited reducedcerebral vasoreactivity. In contrast, all champagne bottle neck sign–negative arteries were Suzuki stage �III, 67% were asymptomatic, andall showed preserved cerebral vasoreactivity.
CONCLUSIONS: The champagne bottle neck sign was related to advanced clinical stage, clinical symptoms, and impaired cerebralvasoreactivity. Thus, detection of the champagne bottle neck sign might be useful in determining the clinical and hemodynamic stages ofMoyamoya disease.
ABBREVIATIONS: CBNS � champagne bottle neck sign; CCA � common carotid artery; CVR � cerebral vasoreactivity; MMD � Moyamoya disease
Moyamoya disease (MMD) is a cerebrovascular disorder
characterized by progressive bilateral stenosis or occlusion
of the distal portion of the ICA and the proximal portion of the
MCAs and anterior cerebral arteries. Affected patients also have
an abnormal vascular network (Moyamoya vessels) at the base of
the brain. The vascular stenosis extends to the extracranial ICA as
the disease advances.1 In 1997, Yang et al2 used angiography to
demonstrate stenotic lesions of the extracranial ICA in 60% of
patients with MMD. In 2006, Yasaka et al3 reported that carotid
ultrasonography showed rapid reduction of the diameter at the
proximal portion of the ICA, revealing the appearance of a cham-
pagne bottle neck in a patient with MMD. The champagne bottle
neck sign (CBNS), which is easily detected noninvasively via ca-
rotid ultrasonography, is an important morphologic feature of
the extracranial ICA of patients with MMD.3-5 Although the
CBNS is reportedly present in 74% of patients with MMD,3 the
time at which the CBNS begins to appear during the course of
MMD is unclear. In addition, whether the CBNS is related to the
clinical or hemodynamic stage of MMD is unknown. Therefore,
we investigated the relationship between the appearance of the
CBNS and the clinical stage, presence of clinical symptoms, and
hemodynamic stage in patients with MMD.
Received December 16, 2015; accepted after revision March 18, 2016.
From the Departments of Cerebrovascular Disease (C.Y., S.A., Y.K.) and Neurosur-gery (T.Shimogawa, T.Sayama, S.H., T.M.), Japan Labour Health and Welfare Organi-zation, Kyushu Rosai Hospital, Kitakyushu, Japan.
Authors’ contributions: Literature search, figures, study design, data collection,data analysis, data interpretation, writing (C.Y.); literature search, study design, dataanalysis, data interpretation, writing (S.A.); data interpretation (T.Shimogawa,T.Sayama, S.H.); literature search, data interpretation (Y.K.); study design, data in-terpretation, writing (T.M.).
Please address correspondence to Chiharu Yasuda, MD, Department of Neurol-ogy, University of Occupational and Environmental Health of Japan, WakamatsuHospital, 1-17-1 Hamamachi Wakamatsu-ku, Kitakyushu 808-0024, Japan; e-mail:[email protected]
http://dx.doi.org/10.3174/ajnr.A4815
1898 Yasuda Oct 2016 www.ajnr.org
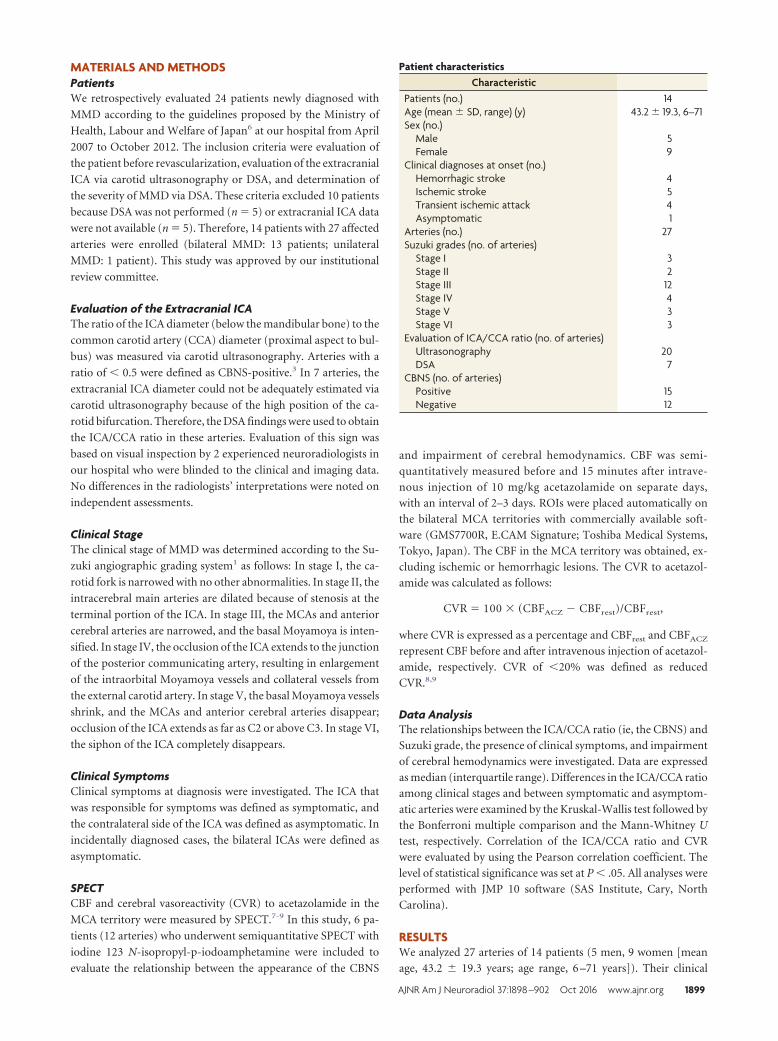
MATERIALS AND METHODSPatientsWe retrospectively evaluated 24 patients newly diagnosed with
MMD according to the guidelines proposed by the Ministry of
Health, Labour and Welfare of Japan6 at our hospital from April
2007 to October 2012. The inclusion criteria were evaluation of
the patient before revascularization, evaluation of the extracranial
ICA via carotid ultrasonography or DSA, and determination of
the severity of MMD via DSA. These criteria excluded 10 patients
because DSA was not performed (n � 5) or extracranial ICA data
were not available (n � 5). Therefore, 14 patients with 27 affected
arteries were enrolled (bilateral MMD: 13 patients; unilateral
MMD: 1 patient). This study was approved by our institutional
review committee.
Evaluation of the Extracranial ICAThe ratio of the ICA diameter (below the mandibular bone) to the
common carotid artery (CCA) diameter (proximal aspect to bul-
bus) was measured via carotid ultrasonography. Arteries with a
ratio of � 0.5 were defined as CBNS-positive.3 In 7 arteries, the
extracranial ICA diameter could not be adequately estimated via
carotid ultrasonography because of the high position of the ca-
rotid bifurcation. Therefore, the DSA findings were used to obtain
the ICA/CCA ratio in these arteries. Evaluation of this sign was
based on visual inspection by 2 experienced neuroradiologists in
our hospital who were blinded to the clinical and imaging data.
No differences in the radiologists’ interpretations were noted on
independent assessments.
Clinical StageThe clinical stage of MMD was determined according to the Su-
zuki angiographic grading system1 as follows: In stage I, the ca-
rotid fork is narrowed with no other abnormalities. In stage II, the
intracerebral main arteries are dilated because of stenosis at the
terminal portion of the ICA. In stage III, the MCAs and anterior
cerebral arteries are narrowed, and the basal Moyamoya is inten-
sified. In stage IV, the occlusion of the ICA extends to the junction
of the posterior communicating artery, resulting in enlargement
of the intraorbital Moyamoya vessels and collateral vessels from
the external carotid artery. In stage V, the basal Moyamoya vessels
shrink, and the MCAs and anterior cerebral arteries disappear;
occlusion of the ICA extends as far as C2 or above C3. In stage VI,
the siphon of the ICA completely disappears.
Clinical SymptomsClinical symptoms at diagnosis were investigated. The ICA that
was responsible for symptoms was defined as symptomatic, and
the contralateral side of the ICA was defined as asymptomatic. In
incidentally diagnosed cases, the bilateral ICAs were defined as
asymptomatic.
SPECTCBF and cerebral vasoreactivity (CVR) to acetazolamide in the
MCA territory were measured by SPECT.7-9 In this study, 6 pa-
tients (12 arteries) who underwent semiquantitative SPECT with
iodine 123 N-isopropyl-p-iodoamphetamine were included to
evaluate the relationship between the appearance of the CBNS
and impairment of cerebral hemodynamics. CBF was semi-
quantitatively measured before and 15 minutes after intrave-
nous injection of 10 mg/kg acetazolamide on separate days,
with an interval of 2–3 days. ROIs were placed automatically on
the bilateral MCA territories with commercially available soft-
ware (GMS7700R, E.CAM Signature; Toshiba Medical Systems,
Tokyo, Japan). The CBF in the MCA territory was obtained, ex-
cluding ischemic or hemorrhagic lesions. The CVR to acetazol-
amide was calculated as follows:
CVR � 100 � �CBFACZ � CBFrest)/CBFrest,
where CVR is expressed as a percentage and CBFrest and CBFACZ
represent CBF before and after intravenous injection of acetazol-
amide, respectively. CVR of �20% was defined as reduced
CVR.8,9
Data AnalysisThe relationships between the ICA/CCA ratio (ie, the CBNS) and
Suzuki grade, the presence of clinical symptoms, and impairment
of cerebral hemodynamics were investigated. Data are expressed
as median (interquartile range). Differences in the ICA/CCA ratio
among clinical stages and between symptomatic and asymptom-
atic arteries were examined by the Kruskal-Wallis test followed by
the Bonferroni multiple comparison and the Mann-Whitney U
test, respectively. Correlation of the ICA/CCA ratio and CVR
were evaluated by using the Pearson correlation coefficient. The
level of statistical significance was set at P � .05. All analyses were
performed with JMP 10 software (SAS Institute, Cary, North
Carolina).
RESULTSWe analyzed 27 arteries of 14 patients (5 men, 9 women [mean
age, 43.2 � 19.3 years; age range, 6 –71 years]). Their clinical
Patient characteristicsCharacteristic
Patients (no.) 14Age (mean � SD, range) (y) 43.2 � 19.3, 6–71Sex (no.)
Male 5Female 9
Clinical diagnoses at onset (no.)Hemorrhagic stroke 4Ischemic stroke 5Transient ischemic attack 4Asymptomatic 1
Arteries (no.) 27Suzuki grades (no. of arteries)
Stage I 3Stage II 2Stage III 12Stage IV 4Stage V 3Stage VI 3
Evaluation of ICA/CCA ratio (no. of arteries)Ultrasonography 20DSA 7
CBNS (no. of arteries)Positive 15Negative 12
AJNR Am J Neuroradiol 37:1898 –902 Oct 2016 www.ajnr.org 1899
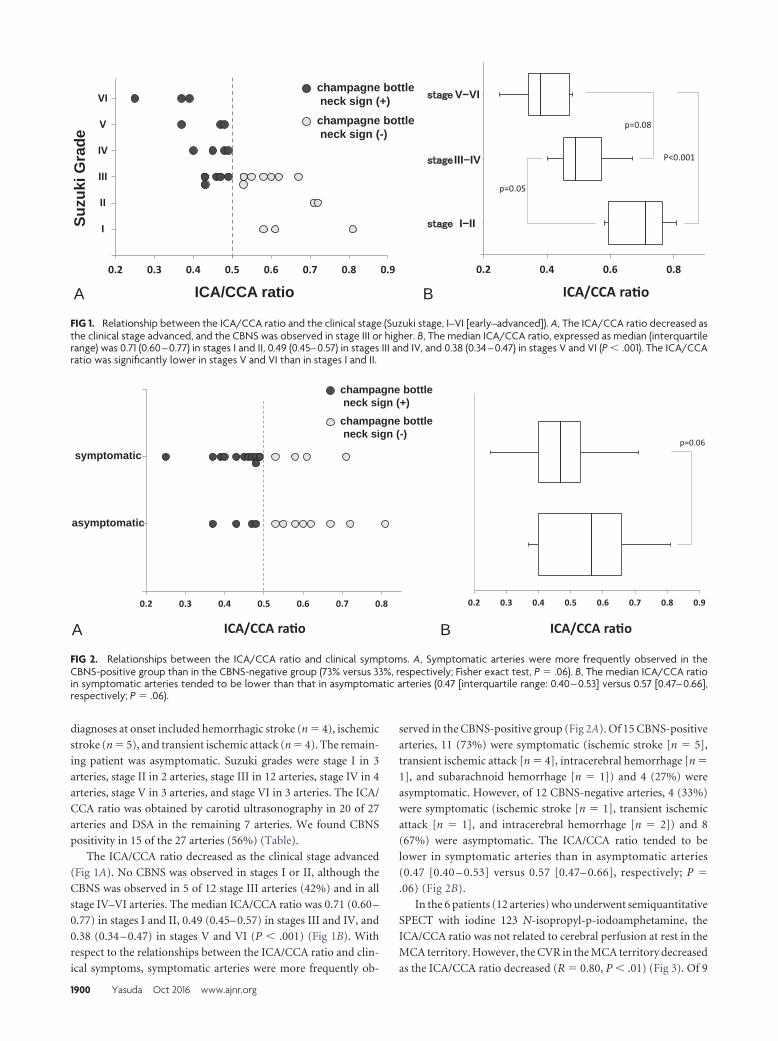
diagnoses at onset included hemorrhagic stroke (n � 4), ischemic
stroke (n � 5), and transient ischemic attack (n � 4). The remain-
ing patient was asymptomatic. Suzuki grades were stage I in 3
arteries, stage II in 2 arteries, stage III in 12 arteries, stage IV in 4
arteries, stage V in 3 arteries, and stage VI in 3 arteries. The ICA/
CCA ratio was obtained by carotid ultrasonography in 20 of 27
arteries and DSA in the remaining 7 arteries. We found CBNS
positivity in 15 of the 27 arteries (56%) (Table).
The ICA/CCA ratio decreased as the clinical stage advanced
(Fig 1A). No CBNS was observed in stages I or II, although the
CBNS was observed in 5 of 12 stage III arteries (42%) and in all
stage IV–VI arteries. The median ICA/CCA ratio was 0.71 (0.60 –
0.77) in stages I and II, 0.49 (0.45– 0.57) in stages III and IV, and
0.38 (0.34 – 0.47) in stages V and VI (P � .001) (Fig 1B). With
respect to the relationships between the ICA/CCA ratio and clin-
ical symptoms, symptomatic arteries were more frequently ob-
served in the CBNS-positive group (Fig 2A). Of 15 CBNS-positive
arteries, 11 (73%) were symptomatic (ischemic stroke [n � 5],
transient ischemic attack [n � 4], intracerebral hemorrhage [n �
1], and subarachnoid hemorrhage [n � 1]) and 4 (27%) were
asymptomatic. However, of 12 CBNS-negative arteries, 4 (33%)
were symptomatic (ischemic stroke [n � 1], transient ischemic
attack [n � 1], and intracerebral hemorrhage [n � 2]) and 8
(67%) were asymptomatic. The ICA/CCA ratio tended to be
lower in symptomatic arteries than in asymptomatic arteries
(0.47 [0.40 – 0.53] versus 0.57 [0.47– 0.66], respectively; P �
.06) (Fig 2B).
In the 6 patients (12 arteries) who underwent semiquantitative
SPECT with iodine 123 N-isopropyl-p-iodoamphetamine, the
ICA/CCA ratio was not related to cerebral perfusion at rest in the
MCA territory. However, the CVR in the MCA territory decreased
as the ICA/CCA ratio decreased (R � 0.80, P � .01) (Fig 3). Of 9
0.2 0.4 0.6 0.8
stage 5-6
stage 3-4
stage 1-2
0
I
II
III
IV
V
VI
7
0.2 0.3 0.4 0.5 0.6 0.7 0.8 0.9
Suzu
ki G
rade
ICA/CCA raICA/CCA ratio
p=0.05
p=0.08
P<0.001
champagne bottleneck sign (+)
champagne bottleneck sign (-)
A B
III−IV
V−VI
I−II
FIG 1. Relationship between the ICA/CCA ratio and the clinical stage (Suzuki stage, I–VI [early–advanced]). A, The ICA/CCA ratio decreased asthe clinical stage advanced, and the CBNS was observed in stage III or higher. B, The median ICA/CCA ratio, expressed as median (interquartilerange) was 0.71 (0.60 – 0.77) in stages I and II, 0.49 (0.45– 0.57) in stages III and IV, and 0.38 (0.34 – 0.47) in stages V and VI (P � .001). The ICA/CCAratio was significantly lower in stages V and VI than in stages I and II.
0.2 0.3 0.4 0.5 0.6 0.7 0.8 0.90.2 0.3 0.4 0.5 0.6 0.7 0.8
ICA/CCA ra ICA/CCA ra
symptomatic
asymptomatic
champagne bottleneck sign (+)
champagne bottleneck sign (-)
p=0.06
A B
FIG 2. Relationships between the ICA/CCA ratio and clinical symptoms. A, Symptomatic arteries were more frequently observed in theCBNS-positive group than in the CBNS-negative group (73% versus 33%, respectively; Fisher exact test, P � .06). B, The median ICA/CCA ratioin symptomatic arteries tended to be lower than that in asymptomatic arteries (0.47 [interquartile range: 0.40 – 0.53] versus 0.57 [0.47– 0.66],respectively; P � .06).
1900 Yasuda Oct 2016 www.ajnr.org
arteries with a CBNS, 8 (89%) exhibited a reduced CVR. On the
other hand, all 3 arteries without a CBNS exhibited a preserved
CVR. We observed both the CBNS and a reduced CVR in 6 symp-
tomatic arteries. Of the remaining 6 asymptomatic arteries, only 2
showed both the CBNS and a reduced CVR. Representative cases
are shown in Fig 4.
DISCUSSIONHistopathologic examination of tissue specimens from patients
with MMD reveals eccentrically laminated thickening of the in-
tracranial major cerebral arteries.10 This
fibrocellular intimal thickening extends
to the extracranial ICA as the disease ad-
vances1; it is also observed in other arter-
ies, such as the pulmonary, renal, and
coronary arteries.11-13 At the carotid bi-
furcation, there is a transitional zone be-
tween the elastic (�5 mm proximal to
the bifurcation) and muscular (�15
mm distal to the bifurcation) portions of
the carotid arteries, and the elastic arter-
ies typically have thicker walls (1–2 mm)
to tolerate the increased pressure.14,15
Therefore, the muscular portion is
thought to be more commonly affected,
and the narrowing at the transitional
zone results in formation of the CBNS.5
No systematic studies on the rela-
tionship between the presence of the
CBNS and the angiographic Suzuki
grade have been performed. However,
Yasuda et al4 reported that the CBNS
might be observed in advanced cases.Our study clearly demonstrated that the
CBNS was not observed in the early
stage; it began to appear in Suzuki stage
III, and all higher Suzuki stages showed
the CBNS. The relationships between
the CBNS and the presence of clinical
symptoms or cerebral hemodynamics
also have not been reported. In our
study, CBNS-positive arteries were
more likely to be symptomatic than
CBNS-negative arteries. These findings
support the concept that a cerebral he-
modynamic state with a reduced CVR is
responsible for the occurrence and re-
currence of stroke.16,17 Previous reports
regarding the cerebral hemodynamics of
patients with MMD have indicated that
cerebral perfusion at rest is not signifi-
cantly different among the various clin-
ical stages. This is because the blood sup-
ply through collateral pathways can
compensate for the reduced CBF, even
with advancement of the disease.1,18
However, CVR tends to diminish as
MMD progresses.18 We also found that
the CBNS was related to impaired CVR, though not to cerebral
perfusion. Our results indicate that the risk of stroke can be
predicted by the presence of the CBNS.
Although MR imaging is a useful technique with which to
evaluate MMD, the extracranial ICAs, unlike the intracranial
ICAs, are not always investigated by MRA. An advantage of ca-
rotid ultrasonography is that it enables direct evaluation of the
extracranial ICAs in real time. Furthermore, it can be noninva-
sively and repeatedly performed on an outpatient basis or at the
CVR
(%)
ICA/CCA ra�o
R = 0.80
-30
-20
-10
0
10
20
30
40
0.2 0.3 0.4 0.5 0.6 0.7 0.8
**
*
*
*
*
champagne bottleneck sign (+)
champagne bottleneck sign (-)
FIG 3. Relationship between the ICA/CCA ratio and CVR to acetazolamide in the MCA territory.The CVR decreased as the ICA/CCA ratio decreased (R � 0.80, P � .01). Of 9 arteries with a CBNS,8 (89%) exhibited a reduced CVR. Symptomatic arteries exhibited both the CBNS and a reducedCVR. Asterisk indicates symptomatic arteries.
FIG 4. Representative cases. The left, middle, and right columns show the features of carotidultrasonography, a lateral view of DSA of the carotid and intracranial arteries, and an axial SPECTimage from 3 cases: A, A 15-year-old girl had a Suzuki stage I artery on the right (asymptomatic) anda stage II artery on the left (symptomatic). The CBNS was negative on the right by carotidultrasonography and DSA, with preserved CVR (arrows). B, A 37-year-old woman had a stage IIIartery on the right (symptomatic) and a stage IV artery on the left (asymptomatic). The CBNS waspositive on the right, with a mildly decreased CVR (arrows). C, A 58-year-old woman had a stageII artery on the right (asymptomatic) and a stage VI artery on the left (symptomatic). The CBNSwas positive on the left, with a markedly decreased CVR (arrows).
AJNR Am J Neuroradiol 37:1898 –902 Oct 2016 www.ajnr.org 1901
bedside. Because of the increasing number of elderly patients with
MMD,19 differential diagnosis between MMD and atherosclerotic
occlusive cerebrovascular disease is becoming more important.
Although advantages of high-resolution MR wall imaging for the
differential diagnosis between MMD and atherosclerosis have
been reported,20 ultrasonography would be helpful to differenti-
ate these 2 diseases with respect to the morphologically different
features of their vessel walls. Especially in young children, seda-
tion is sometimes necessary to perform MR imaging, but not ca-
rotid ultrasonography. Therefore, we believe that carotid ultra-
sonography is useful for screening of MMD and estimation of the
clinical stages of MMD. Notably, however, the CBNS is not ob-
served in the early stages of MMD and can also be seen in other
diseases such as dissection, fibromuscular dysplasia, and intracra-
nial ICA occlusion of other causes.
This study had some limitations. First, the number of patients
was relatively small because we included patients with MMD who
underwent DSA. The prevalence of MMD in the general popula-
tion is low. Furthermore, MMD has recently tended to be more
frequently diagnosed by MR imaging or MRA rather than DSA.
Second, the arteries of patients with lower Suzuki grades were
relatively small. This may suggest bias in the selection process,
leading to over-representation of higher Suzuki grades and infla-
tion of the significance of a positive CBNS. Third, a quarter of
arteries were evaluated by DSA instead of carotid ultrasonography
because of the high position of the carotid bifurcation. However,
in the remaining arteries, the ICA/CCA ratio obtained by carotid
ultrasonography and that obtained by DSA were not different;
therefore, we do not believe that the results were affected.
CONCLUSIONSThe CBNS is related to Suzuki stage III or higher and impaired
CVR with clinical symptoms in patients with MMD. Detection of
the CBNS via carotid ultrasonography is useful for not only
screening of MMD, but also for determining the clinical and he-
modynamic stages of MMD.
ACKNOWLEDGMENTSThe authors thank the staff of the Departments of Cerebrovascu-
lar Disease and Neurosurgery, Japan Labour Health and Welfare
Organization, Kyushu Rosai Hospital, Kitakyushu, Japan.
Disclosures: Shuji Arakawa—UNRELATED: Payment for Lectures (including serviceon Speakers Bureaus): Kyushu Nutrition Welfare University, Comments: Gave lec-tures on stroke.
REFERENCES1. Suzuki J, Takaku A. Cerebrovascular “Moyamoya” disease. Disease
showing abnormal net-like vessels in base of brain. Arch Neurol1969;20:288 –99 CrossRef Medline
2. Yang SH, Li B, Wang CC, et al. Angiographic study of Moyamoyadisease and histological study in the external carotid artery system.Clin Neurol Neurosurg 1997;99:S61– 63 CrossRef Medline
3. Yasaka M, Ogata T, Yasumori K, et al. Bottle neck sign of the proxi-
mal portion of the internal carotid artery in Moyamoya disease. JUltrasound Med 2006;25:1547–52 Medline
4. Yasuda C, Yakusiji Y, Eriguchi M, et al. Usefulness of carotid ultra-sonography for the early detection of Moyamoya disease [in Japa-nese]. Rinsho Shinkeigaku 2007;47:441– 43 Medline
5. Shimogawa T, Morioka T, Sayama T, et al. Champagne bottle necksign in a patient with Moyamoya syndrome. World J Clin Cases 2014;2:474 –77 CrossRef Medline
6. Fukui M. Guidelines for the diagnosis and treatment of spontane-ous occlusion of the circle of Willis (‘Moyamoya’ disease). ResearchCommittee on Spontaneous Occlusion of the Circle of Willis(Moyamoya Disease) of the Ministry of Health and Welfare, Japan.Clin Neurol Neurosurg 1997;99:S238 – 40 CrossRef Medline
7. Nakagawara J, Takeda R, Suematsu K, et al. Quantification of re-gional cerebral blood flow and vascular reserve in childhood Moya-moya disease using [123I]IMP-ARG method. Clin Neurol Neurosurg1997;99:S96 –99 CrossRef Medline
8. Saito N, Nakagawara J, Nakamura H, et al. Assessment of cerebralhemodynamics in childhood Moyamoya disease using a quantita-tive and a semiquantitative IMP-SPECT study. Ann Nucl Med 2004;18:323–31 CrossRef Medline
9. Honda M, Ezaki Y, Kitagawa N, et al. Quantification of the regionalcerebral blood flow and vascular reserve in Moyamoya disease us-ing split-dose iodoamphetamine I 123 single-photon emissioncomputed tomography. Surg Neurol 2006;66:155–59; discussion 159CrossRef Medline
10. Fukui M, Kono S, Sueishi K, et al. Moyamoya disease. Neuropathol-ogy 2000;20:S61– 64 Medline
11. Ikeda E. Systemic vascular changes in spontaneous occlusion of thecircle of Willis. Stroke 1991;22:1358 – 62 CrossRef Medline
12. Kaczorowska M, Jozwiak S, Litwin M, et al. Moyamoya disease asso-ciated with stenosis of extracranial arteries: a case report and reviewof the literature. [in Polish] Neurol Neurochir Pol 2005;39:242– 46Medline
13. Lee JH, Youn TJ, Yoon YE, et al. Coronary artery stenosis in Moya-moya disease: tissue characterization by 256-slice multi-detectorCT and virtual histology. Circulation 2013;127:2063– 65 CrossRefMedline
14. Hori E, Hayashi N, Hamada H, et al. A development of atheroma-tous plaque is restricted by characteristic arterial wall structure atthe carotid bifurcation. Surg Neurol 2008;69:586 –90; discussion590 –91 CrossRef Medline
15. Janzen J, Lanzer P, Rothenberger-Janzen K, et al. Variable extensionof the transitional zone in the medial structure of carotid arterytripod. Vasa 2001;30:101– 06 CrossRef Medline
16. Grubb RL, Derdeyn CP, Fritsch SM, et al. Importance of hemody-namic factors in the prognosis of symptomatic carotid occlusion.JAMA 1998;280:1055– 60 CrossRef Medline
17. Yamauchi H, Higashi T, Kagawa S, et al. Is misery perfusion still apredictor of stroke in symptomatic major cerebral artery disease?Brain 2012;135:2515–26 CrossRef Medline
18. Kang KH, Kim HS, Kim SY. Quantitative cerebrovascular reservemeasured by acetazolamide-challenged dynamic CT perfusionin ischemic adult Moyamoya disease: initial experience with an-giographic correlation. AJNR Am J Neuroradiol 2008;29:1487–93CrossRef Medline
19. Kuriyama S, Kusaka Y, Fujimura M, et al. Prevalence and clinicoepide-miological features of Moyamoya disease in Japan: findings froma nationwide epidemiological survey. Stroke 2008;39:42–47 CrossRefMedline
20. Ryoo S, Cha J, Kim SJ, et al. High-resolution magnetic resonancewall imaging findings of Moyamoya disease. Stroke 2014;45:2457– 60 CrossRef Medline
1902 Yasuda Oct 2016 www.ajnr.org
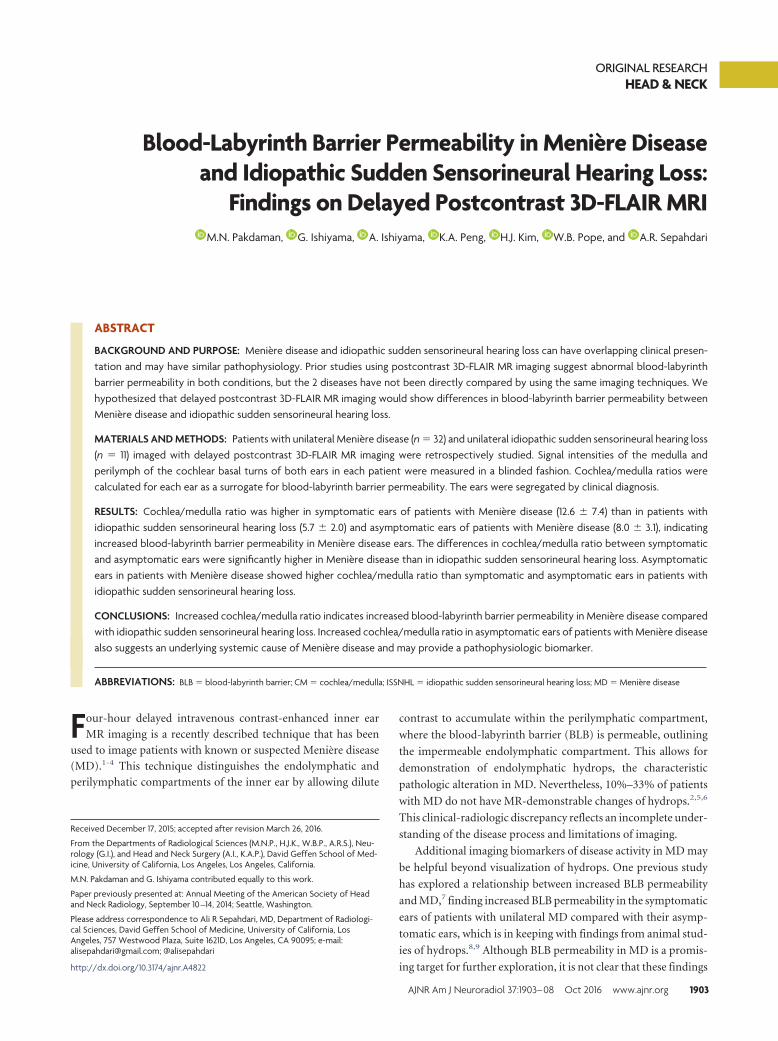
ORIGINAL RESEARCHHEAD & NECK
Blood-Labyrinth Barrier Permeability in Meniere Diseaseand Idiopathic Sudden Sensorineural Hearing Loss:
Findings on Delayed Postcontrast 3D-FLAIR MRIX M.N. Pakdaman, X G. Ishiyama, X A. Ishiyama, X K.A. Peng, X H.J. Kim, X W.B. Pope, and X A.R. Sepahdari
ABSTRACT
BACKGROUND AND PURPOSE: Meniere disease and idiopathic sudden sensorineural hearing loss can have overlapping clinical presen-tation and may have similar pathophysiology. Prior studies using postcontrast 3D-FLAIR MR imaging suggest abnormal blood-labyrinthbarrier permeability in both conditions, but the 2 diseases have not been directly compared by using the same imaging techniques. Wehypothesized that delayed postcontrast 3D-FLAIR MR imaging would show differences in blood-labyrinth barrier permeability betweenMeniere disease and idiopathic sudden sensorineural hearing loss.
MATERIALS AND METHODS: Patients with unilateral Meniere disease (n � 32) and unilateral idiopathic sudden sensorineural hearing loss(n � 11) imaged with delayed postcontrast 3D-FLAIR MR imaging were retrospectively studied. Signal intensities of the medulla andperilymph of the cochlear basal turns of both ears in each patient were measured in a blinded fashion. Cochlea/medulla ratios werecalculated for each ear as a surrogate for blood-labyrinth barrier permeability. The ears were segregated by clinical diagnosis.
RESULTS: Cochlea/medulla ratio was higher in symptomatic ears of patients with Meniere disease (12.6 � 7.4) than in patients withidiopathic sudden sensorineural hearing loss (5.7 � 2.0) and asymptomatic ears of patients with Meniere disease (8.0 � 3.1), indicatingincreased blood-labyrinth barrier permeability in Meniere disease ears. The differences in cochlea/medulla ratio between symptomaticand asymptomatic ears were significantly higher in Meniere disease than in idiopathic sudden sensorineural hearing loss. Asymptomaticears in patients with Meniere disease showed higher cochlea/medulla ratio than symptomatic and asymptomatic ears in patients withidiopathic sudden sensorineural hearing loss.
CONCLUSIONS: Increased cochlea/medulla ratio indicates increased blood-labyrinth barrier permeability in Meniere disease comparedwith idiopathic sudden sensorineural hearing loss. Increased cochlea/medulla ratio in asymptomatic ears of patients with Meniere diseasealso suggests an underlying systemic cause of Meniere disease and may provide a pathophysiologic biomarker.
ABBREVIATIONS: BLB � blood-labyrinth barrier; CM � cochlea/medulla; ISSNHL � idiopathic sudden sensorineural hearing loss; MD � Meniere disease
Four-hour delayed intravenous contrast-enhanced inner ear
MR imaging is a recently described technique that has been
used to image patients with known or suspected Meniere disease
(MD).1-4 This technique distinguishes the endolymphatic and
perilymphatic compartments of the inner ear by allowing dilute
contrast to accumulate within the perilymphatic compartment,
where the blood-labyrinth barrier (BLB) is permeable, outlining
the impermeable endolymphatic compartment. This allows for
demonstration of endolymphatic hydrops, the characteristic
pathologic alteration in MD. Nevertheless, 10%–33% of patients
with MD do not have MR-demonstrable changes of hydrops.2,5,6
This clinical-radiologic discrepancy reflects an incomplete under-
standing of the disease process and limitations of imaging.
Additional imaging biomarkers of disease activity in MD may
be helpful beyond visualization of hydrops. One previous study
has explored a relationship between increased BLB permeability
and MD,7 finding increased BLB permeability in the symptomatic
ears of patients with unilateral MD compared with their asymp-
tomatic ears, which is in keeping with findings from animal stud-
ies of hydrops.8,9 Although BLB permeability in MD is a promis-
ing target for further exploration, it is not clear that these findings
Received December 17, 2015; accepted after revision March 26, 2016.
From the Departments of Radiological Sciences (M.N.P., H.J.K., W.B.P., A.R.S.), Neu-rology (G.I.), and Head and Neck Surgery (A.I., K.A.P.), David Geffen School of Med-icine, University of California, Los Angeles, Los Angeles, California.
M.N. Pakdaman and G. Ishiyama contributed equally to this work.
Paper previously presented at: Annual Meeting of the American Society of Headand Neck Radiology, September 10 –14, 2014; Seattle, Washington.
Please address correspondence to Ali R Sepahdari, MD, Department of Radiologi-cal Sciences, David Geffen School of Medicine, University of California, LosAngeles, 757 Westwood Plaza, Suite 1621D, Los Angeles, CA 90095; e-mail:[email protected]; @alisepahdari
http://dx.doi.org/10.3174/ajnr.A4822
AJNR Am J Neuroradiol 37:1903– 08 Oct 2016 www.ajnr.org 1903
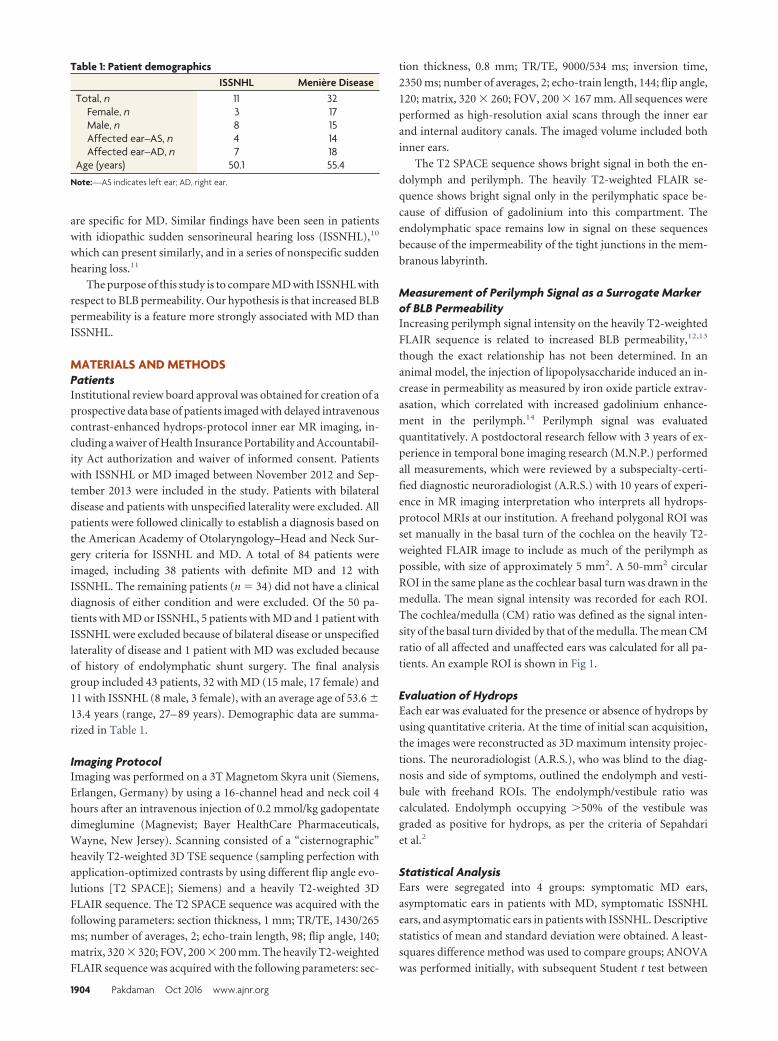
are specific for MD. Similar findings have been seen in patients
with idiopathic sudden sensorineural hearing loss (ISSNHL),10
which can present similarly, and in a series of nonspecific sudden
hearing loss.11
The purpose of this study is to compare MD with ISSNHL with
respect to BLB permeability. Our hypothesis is that increased BLB
permeability is a feature more strongly associated with MD than
ISSNHL.
MATERIALS AND METHODSPatientsInstitutional review board approval was obtained for creation of a
prospective data base of patients imaged with delayed intravenous
contrast-enhanced hydrops-protocol inner ear MR imaging, in-
cluding a waiver of Health Insurance Portability and Accountabil-
ity Act authorization and waiver of informed consent. Patients
with ISSNHL or MD imaged between November 2012 and Sep-
tember 2013 were included in the study. Patients with bilateral
disease and patients with unspecified laterality were excluded. All
patients were followed clinically to establish a diagnosis based on
the American Academy of Otolaryngology–Head and Neck Sur-
gery criteria for ISSNHL and MD. A total of 84 patients were
imaged, including 38 patients with definite MD and 12 with
ISSNHL. The remaining patients (n � 34) did not have a clinical
diagnosis of either condition and were excluded. Of the 50 pa-
tients with MD or ISSNHL, 5 patients with MD and 1 patient with
ISSNHL were excluded because of bilateral disease or unspecified
laterality of disease and 1 patient with MD was excluded because
of history of endolymphatic shunt surgery. The final analysis
group included 43 patients, 32 with MD (15 male, 17 female) and
11 with ISSNHL (8 male, 3 female), with an average age of 53.6 �
13.4 years (range, 27– 89 years). Demographic data are summa-
rized in Table 1.
Imaging ProtocolImaging was performed on a 3T Magnetom Skyra unit (Siemens,
Erlangen, Germany) by using a 16-channel head and neck coil 4
hours after an intravenous injection of 0.2 mmol/kg gadopentate
dimeglumine (Magnevist; Bayer HealthCare Pharmaceuticals,
Wayne, New Jersey). Scanning consisted of a “cisternographic”
heavily T2-weighted 3D TSE sequence (sampling perfection with
application-optimized contrasts by using different flip angle evo-
lutions [T2 SPACE]; Siemens) and a heavily T2-weighted 3D
FLAIR sequence. The T2 SPACE sequence was acquired with the
following parameters: section thickness, 1 mm; TR/TE, 1430/265
ms; number of averages, 2; echo-train length, 98; flip angle, 140;
matrix, 320 � 320; FOV, 200 � 200 mm. The heavily T2-weighted
FLAIR sequence was acquired with the following parameters: sec-
tion thickness, 0.8 mm; TR/TE, 9000/534 ms; inversion time,
2350 ms; number of averages, 2; echo-train length, 144; flip angle,
120; matrix, 320 � 260; FOV, 200 � 167 mm. All sequences were
performed as high-resolution axial scans through the inner ear
and internal auditory canals. The imaged volume included both
inner ears.
The T2 SPACE sequence shows bright signal in both the en-
dolymph and perilymph. The heavily T2-weighted FLAIR se-
quence shows bright signal only in the perilymphatic space be-
cause of diffusion of gadolinium into this compartment. The
endolymphatic space remains low in signal on these sequences
because of the impermeability of the tight junctions in the mem-
branous labyrinth.
Measurement of Perilymph Signal as a Surrogate Markerof BLB PermeabilityIncreasing perilymph signal intensity on the heavily T2-weighted
FLAIR sequence is related to increased BLB permeability,12,13
though the exact relationship has not been determined. In an
animal model, the injection of lipopolysaccharide induced an in-
crease in permeability as measured by iron oxide particle extrav-
asation, which correlated with increased gadolinium enhance-
ment in the perilymph.14 Perilymph signal was evaluated
quantitatively. A postdoctoral research fellow with 3 years of ex-
perience in temporal bone imaging research (M.N.P.) performed
all measurements, which were reviewed by a subspecialty-certi-
fied diagnostic neuroradiologist (A.R.S.) with 10 years of experi-
ence in MR imaging interpretation who interprets all hydrops-
protocol MRIs at our institution. A freehand polygonal ROI was
set manually in the basal turn of the cochlea on the heavily T2-
weighted FLAIR image to include as much of the perilymph as
possible, with size of approximately 5 mm2. A 50-mm2 circular
ROI in the same plane as the cochlear basal turn was drawn in the
medulla. The mean signal intensity was recorded for each ROI.
The cochlea/medulla (CM) ratio was defined as the signal inten-
sity of the basal turn divided by that of the medulla. The mean CM
ratio of all affected and unaffected ears was calculated for all pa-
tients. An example ROI is shown in Fig 1.
Evaluation of HydropsEach ear was evaluated for the presence or absence of hydrops by
using quantitative criteria. At the time of initial scan acquisition,
the images were reconstructed as 3D maximum intensity projec-
tions. The neuroradiologist (A.R.S.), who was blind to the diag-
nosis and side of symptoms, outlined the endolymph and vesti-
bule with freehand ROIs. The endolymph/vestibule ratio was
calculated. Endolymph occupying �50% of the vestibule was
graded as positive for hydrops, as per the criteria of Sepahdari
et al.2
Statistical AnalysisEars were segregated into 4 groups: symptomatic MD ears,
asymptomatic ears in patients with MD, symptomatic ISSNHL
ears, and asymptomatic ears in patients with ISSNHL. Descriptive
statistics of mean and standard deviation were obtained. A least-
squares difference method was used to compare groups; ANOVA
was performed initially, with subsequent Student t test between
Table 1: Patient demographicsISSNHL Menière Disease
Total, n 11 32Female, n 3 17Male, n 8 15Affected ear–AS, n 4 14Affected ear–AD, n 7 18
Age (years) 50.1 55.4
Note:—AS indicates left ear; AD, right ear.
1904 Pakdaman Oct 2016 www.ajnr.org
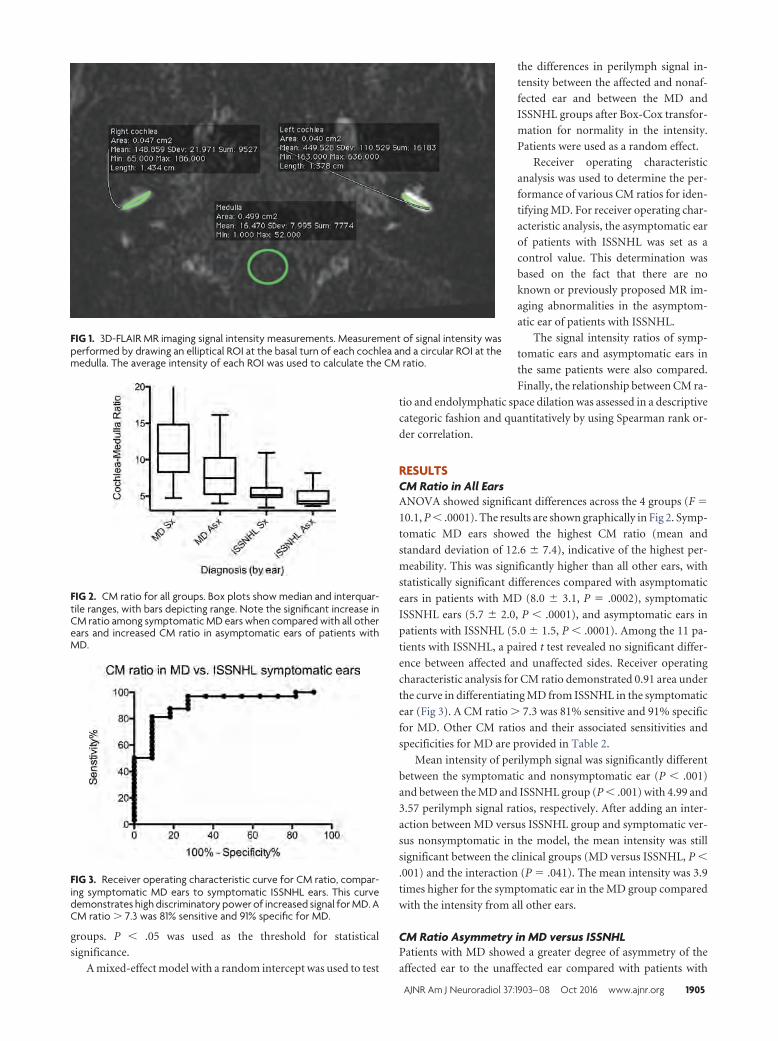
groups. P � .05 was used as the threshold for statistical
significance.
A mixed-effect model with a random intercept was used to test
the differences in perilymph signal in-
tensity between the affected and nonaf-
fected ear and between the MD and
ISSNHL groups after Box-Cox transfor-
mation for normality in the intensity.
Patients were used as a random effect.
Receiver operating characteristic
analysis was used to determine the per-
formance of various CM ratios for iden-
tifying MD. For receiver operating char-
acteristic analysis, the asymptomatic ear
of patients with ISSNHL was set as a
control value. This determination was
based on the fact that there are no
known or previously proposed MR im-
aging abnormalities in the asymptom-
atic ear of patients with ISSNHL.
The signal intensity ratios of symp-
tomatic ears and asymptomatic ears in
the same patients were also compared.
Finally, the relationship between CM ra-
tio and endolymphatic space dilation was assessed in a descriptive
categoric fashion and quantitatively by using Spearman rank or-
der correlation.
RESULTSCM Ratio in All EarsANOVA showed significant differences across the 4 groups (F �
10.1, P � .0001). The results are shown graphically in Fig 2. Symp-
tomatic MD ears showed the highest CM ratio (mean and
standard deviation of 12.6 � 7.4), indicative of the highest per-
meability. This was significantly higher than all other ears, with
statistically significant differences compared with asymptomatic
ears in patients with MD (8.0 � 3.1, P � .0002), symptomatic
ISSNHL ears (5.7 � 2.0, P � .0001), and asymptomatic ears in
patients with ISSNHL (5.0 � 1.5, P � .0001). Among the 11 pa-
tients with ISSNHL, a paired t test revealed no significant differ-
ence between affected and unaffected sides. Receiver operating
characteristic analysis for CM ratio demonstrated 0.91 area under
the curve in differentiating MD from ISSNHL in the symptomatic
ear (Fig 3). A CM ratio � 7.3 was 81% sensitive and 91% specific
for MD. Other CM ratios and their associated sensitivities and
specificities for MD are provided in Table 2.
Mean intensity of perilymph signal was significantly different
between the symptomatic and nonsymptomatic ear (P � .001)
and between the MD and ISSNHL group (P � .001) with 4.99 and
3.57 perilymph signal ratios, respectively. After adding an inter-
action between MD versus ISSNHL group and symptomatic ver-
sus nonsymptomatic in the model, the mean intensity was still
significant between the clinical groups (MD versus ISSNHL, P �
.001) and the interaction (P � .041). The mean intensity was 3.9
times higher for the symptomatic ear in the MD group compared
with the intensity from all other ears.
CM Ratio Asymmetry in MD versus ISSNHLPatients with MD showed a greater degree of asymmetry of the
affected ear to the unaffected ear compared with patients with
FIG 1. 3D-FLAIR MR imaging signal intensity measurements. Measurement of signal intensity wasperformed by drawing an elliptical ROI at the basal turn of each cochlea and a circular ROI at themedulla. The average intensity of each ROI was used to calculate the CM ratio.
FIG 2. CM ratio for all groups. Box plots show median and interquar-tile ranges, with bars depicting range. Note the significant increase inCM ratio among symptomatic MD ears when compared with all otherears and increased CM ratio in asymptomatic ears of patients withMD.
FIG 3. Receiver operating characteristic curve for CM ratio, compar-ing symptomatic MD ears to symptomatic ISSNHL ears. This curvedemonstrates high discriminatory power of increased signal for MD. ACM ratio � 7.3 was 81% sensitive and 91% specific for MD.
AJNR Am J Neuroradiol 37:1903– 08 Oct 2016 www.ajnr.org 1905
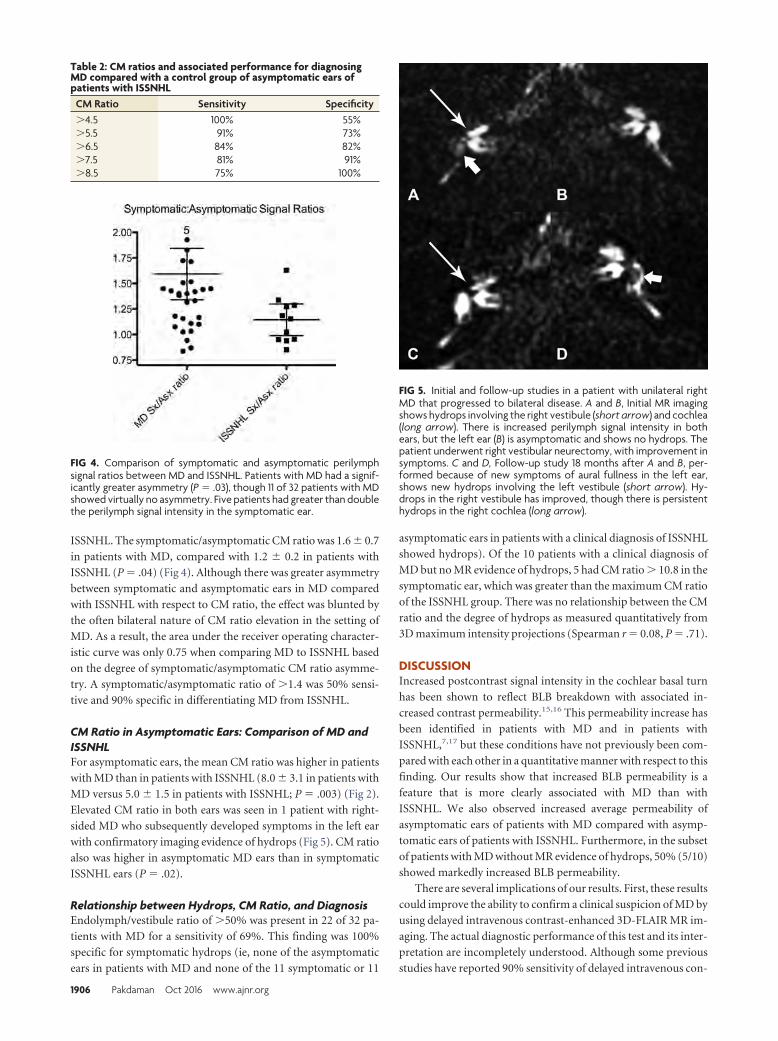
ISSNHL. The symptomatic/asymptomatic CM ratio was 1.6 � 0.7
in patients with MD, compared with 1.2 � 0.2 in patients with
ISSNHL (P � .04) (Fig 4). Although there was greater asymmetry
between symptomatic and asymptomatic ears in MD compared
with ISSNHL with respect to CM ratio, the effect was blunted by
the often bilateral nature of CM ratio elevation in the setting of
MD. As a result, the area under the receiver operating character-
istic curve was only 0.75 when comparing MD to ISSNHL based
on the degree of symptomatic/asymptomatic CM ratio asymme-
try. A symptomatic/asymptomatic ratio of �1.4 was 50% sensi-
tive and 90% specific in differentiating MD from ISSNHL.
CM Ratio in Asymptomatic Ears: Comparison of MD andISSNHLFor asymptomatic ears, the mean CM ratio was higher in patients
with MD than in patients with ISSNHL (8.0 � 3.1 in patients with
MD versus 5.0 � 1.5 in patients with ISSNHL; P � .003) (Fig 2).
Elevated CM ratio in both ears was seen in 1 patient with right-
sided MD who subsequently developed symptoms in the left ear
with confirmatory imaging evidence of hydrops (Fig 5). CM ratio
also was higher in asymptomatic MD ears than in symptomatic
ISSNHL ears (P � .02).
Relationship between Hydrops, CM Ratio, and DiagnosisEndolymph/vestibule ratio of �50% was present in 22 of 32 pa-
tients with MD for a sensitivity of 69%. This finding was 100%
specific for symptomatic hydrops (ie, none of the asymptomatic
ears in patients with MD and none of the 11 symptomatic or 11
asymptomatic ears in patients with a clinical diagnosis of ISSNHL
showed hydrops). Of the 10 patients with a clinical diagnosis of
MD but no MR evidence of hydrops, 5 had CM ratio � 10.8 in the
symptomatic ear, which was greater than the maximum CM ratio
of the ISSNHL group. There was no relationship between the CM
ratio and the degree of hydrops as measured quantitatively from
3D maximum intensity projections (Spearman r � 0.08, P � .71).
DISCUSSIONIncreased postcontrast signal intensity in the cochlear basal turn
has been shown to reflect BLB breakdown with associated in-
creased contrast permeability.15,16 This permeability increase has
been identified in patients with MD and in patients with
ISSNHL,7,17 but these conditions have not previously been com-
pared with each other in a quantitative manner with respect to this
finding. Our results show that increased BLB permeability is a
feature that is more clearly associated with MD than with
ISSNHL. We also observed increased average permeability of
asymptomatic ears of patients with MD compared with asymp-
tomatic ears of patients with ISSNHL. Furthermore, in the subset
of patients with MD without MR evidence of hydrops, 50% (5/10)
showed markedly increased BLB permeability.
There are several implications of our results. First, these results
could improve the ability to confirm a clinical suspicion of MD by
using delayed intravenous contrast-enhanced 3D-FLAIR MR im-
aging. The actual diagnostic performance of this test and its inter-
pretation are incompletely understood. Although some previous
studies have reported 90% sensitivity of delayed intravenous con-
Table 2: CM ratios and associated performance for diagnosingMD compared with a control group of asymptomatic ears ofpatients with ISSNHL
CM Ratio Sensitivity Specificity�4.5 100% 55%�5.5 91% 73%�6.5 84% 82%�7.5 81% 91%�8.5 75% 100%
FIG 4. Comparison of symptomatic and asymptomatic perilymphsignal ratios between MD and ISSNHL. Patients with MD had a signif-icantly greater asymmetry (P � .03), though 11 of 32 patients with MDshowed virtually no asymmetry. Five patients had greater than doublethe perilymph signal intensity in the symptomatic ear.
FIG 5. Initial and follow-up studies in a patient with unilateral rightMD that progressed to bilateral disease. A and B, Initial MR imagingshows hydrops involving the right vestibule (short arrow) and cochlea(long arrow). There is increased perilymph signal intensity in bothears, but the left ear (B) is asymptomatic and shows no hydrops. Thepatient underwent right vestibular neurectomy, with improvement insymptoms. C and D, Follow-up study 18 months after A and B, per-formed because of new symptoms of aural fullness in the left ear,shows new hydrops involving the left vestibule (short arrow). Hy-drops in the right vestibule has improved, though there is persistenthydrops in the right cochlea (long arrow).
1906 Pakdaman Oct 2016 www.ajnr.org
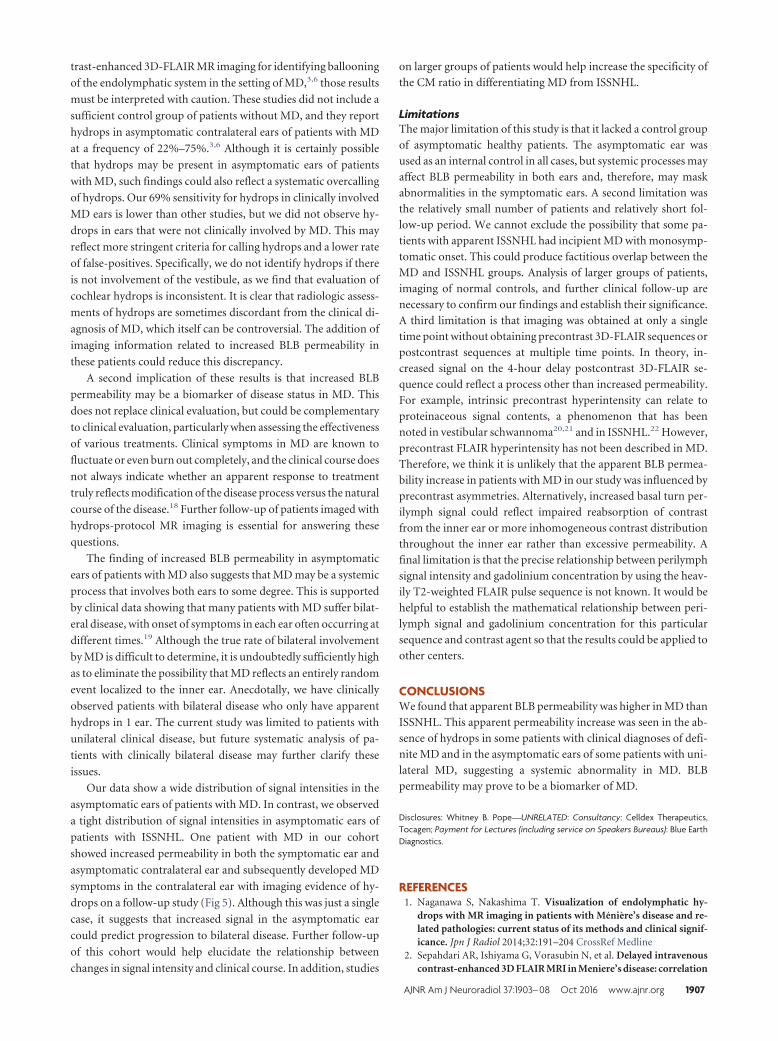
trast-enhanced 3D-FLAIR MR imaging for identifying ballooning
of the endolymphatic system in the setting of MD,3,6 those results
must be interpreted with caution. These studies did not include a
sufficient control group of patients without MD, and they report
hydrops in asymptomatic contralateral ears of patients with MD
at a frequency of 22%–75%.3,6 Although it is certainly possible
that hydrops may be present in asymptomatic ears of patients
with MD, such findings could also reflect a systematic overcalling
of hydrops. Our 69% sensitivity for hydrops in clinically involved
MD ears is lower than other studies, but we did not observe hy-
drops in ears that were not clinically involved by MD. This may
reflect more stringent criteria for calling hydrops and a lower rate
of false-positives. Specifically, we do not identify hydrops if there
is not involvement of the vestibule, as we find that evaluation of
cochlear hydrops is inconsistent. It is clear that radiologic assess-
ments of hydrops are sometimes discordant from the clinical di-
agnosis of MD, which itself can be controversial. The addition of
imaging information related to increased BLB permeability in
these patients could reduce this discrepancy.
A second implication of these results is that increased BLB
permeability may be a biomarker of disease status in MD. This
does not replace clinical evaluation, but could be complementary
to clinical evaluation, particularly when assessing the effectiveness
of various treatments. Clinical symptoms in MD are known to
fluctuate or even burn out completely, and the clinical course does
not always indicate whether an apparent response to treatment
truly reflects modification of the disease process versus the natural
course of the disease.18 Further follow-up of patients imaged with
hydrops-protocol MR imaging is essential for answering these
questions.
The finding of increased BLB permeability in asymptomatic
ears of patients with MD also suggests that MD may be a systemic
process that involves both ears to some degree. This is supported
by clinical data showing that many patients with MD suffer bilat-
eral disease, with onset of symptoms in each ear often occurring at
different times.19 Although the true rate of bilateral involvement
by MD is difficult to determine, it is undoubtedly sufficiently high
as to eliminate the possibility that MD reflects an entirely random
event localized to the inner ear. Anecdotally, we have clinically
observed patients with bilateral disease who only have apparent
hydrops in 1 ear. The current study was limited to patients with
unilateral clinical disease, but future systematic analysis of pa-
tients with clinically bilateral disease may further clarify these
issues.
Our data show a wide distribution of signal intensities in the
asymptomatic ears of patients with MD. In contrast, we observed
a tight distribution of signal intensities in asymptomatic ears of
patients with ISSNHL. One patient with MD in our cohort
showed increased permeability in both the symptomatic ear and
asymptomatic contralateral ear and subsequently developed MD
symptoms in the contralateral ear with imaging evidence of hy-
drops on a follow-up study (Fig 5). Although this was just a single
case, it suggests that increased signal in the asymptomatic ear
could predict progression to bilateral disease. Further follow-up
of this cohort would help elucidate the relationship between
changes in signal intensity and clinical course. In addition, studies
on larger groups of patients would help increase the specificity of
the CM ratio in differentiating MD from ISSNHL.
LimitationsThe major limitation of this study is that it lacked a control group
of asymptomatic healthy patients. The asymptomatic ear was
used as an internal control in all cases, but systemic processes may
affect BLB permeability in both ears and, therefore, may mask
abnormalities in the symptomatic ears. A second limitation was
the relatively small number of patients and relatively short fol-
low-up period. We cannot exclude the possibility that some pa-
tients with apparent ISSNHL had incipient MD with monosymp-
tomatic onset. This could produce factitious overlap between the
MD and ISSNHL groups. Analysis of larger groups of patients,
imaging of normal controls, and further clinical follow-up are
necessary to confirm our findings and establish their significance.
A third limitation is that imaging was obtained at only a single
time point without obtaining precontrast 3D-FLAIR sequences or
postcontrast sequences at multiple time points. In theory, in-
creased signal on the 4-hour delay postcontrast 3D-FLAIR se-
quence could reflect a process other than increased permeability.
For example, intrinsic precontrast hyperintensity can relate to
proteinaceous signal contents, a phenomenon that has been
noted in vestibular schwannoma20,21 and in ISSNHL.22 However,
precontrast FLAIR hyperintensity has not been described in MD.
Therefore, we think it is unlikely that the apparent BLB permea-
bility increase in patients with MD in our study was influenced by
precontrast asymmetries. Alternatively, increased basal turn per-
ilymph signal could reflect impaired reabsorption of contrast
from the inner ear or more inhomogeneous contrast distribution
throughout the inner ear rather than excessive permeability. A
final limitation is that the precise relationship between perilymph
signal intensity and gadolinium concentration by using the heav-
ily T2-weighted FLAIR pulse sequence is not known. It would be
helpful to establish the mathematical relationship between peri-
lymph signal and gadolinium concentration for this particular
sequence and contrast agent so that the results could be applied to
other centers.
CONCLUSIONSWe found that apparent BLB permeability was higher in MD than
ISSNHL. This apparent permeability increase was seen in the ab-
sence of hydrops in some patients with clinical diagnoses of defi-
nite MD and in the asymptomatic ears of some patients with uni-
lateral MD, suggesting a systemic abnormality in MD. BLB
permeability may prove to be a biomarker of MD.
Disclosures: Whitney B. Pope—UNRELATED: Consultancy: Celldex Therapeutics,Tocagen; Payment for Lectures (including service on Speakers Bureaus): Blue EarthDiagnostics.
REFERENCES1. Naganawa S, Nakashima T. Visualization of endolymphatic hy-
drops with MR imaging in patients with Meniere’s disease and re-lated pathologies: current status of its methods and clinical signif-icance. Jpn J Radiol 2014;32:191–204 CrossRef Medline
2. Sepahdari AR, Ishiyama G, Vorasubin N, et al. Delayed intravenouscontrast-enhanced 3D FLAIR MRI in Meniere’s disease: correlation
AJNR Am J Neuroradiol 37:1903– 08 Oct 2016 www.ajnr.org 1907
of quantitative measures of endolymphatic hydrops with hearing.Clin Imaging 2015;39:26 –31 CrossRef Medline
3. Barath K, Schuknecht B, Naldi AM, et al. Detection and grading ofendolymphatic hydrops in Meniere disease using MR imaging.AJNR Am J Neuroradiol 2014;35:1387–92 CrossRef Medline
4. Sepahdari AR, Vorasubin N, Ishiyama G, et al. Endolymphatic hy-drops reversal following acetazolamide therapy: demonstrationwith delayed intravenous contrast-enhanced 3D-FLAIR MRI.AJNR Am J Neuroradiol 2016;37:151–54 CrossRef Medline
5. Seo YJ, Kim J, Choi JY, et al. Visualization of endolymphatic hy-drops and correlation with audio-vestibular functional testing inpatients with definite Meniere’s disease. Auris Nasus Larynx 2013;40:167–72 CrossRef
6. Pyykko I, Nakashima T, Yoshida T, et al. Meniere’s disease: a reap-praisal supported by a variable latency of symptoms and the MRIvisualisation of endolymphatic hydrops. BMJ Open 2013;3:pii:e001555 CrossRef Medline
7. Yamazaki M, Naganawa S, Tagaya M, et al. Comparison of contrasteffect on the cochlear perilymph after intratympanic and intrave-nous gadolinium injection. AJNR Am J Neuroradiol 2012;33:773–78CrossRef Medline
8. Marshall AF, Jewells VL, Kranz P, et al. Magnetic resonance imagingof guinea pig cochlea after vasopressin-induced or surgically in-duced endolymphatic hydrops. Otolaryngol Head Neck Surg 2010;142:260 – 65 CrossRef Medline
9. Ishiyama G, Lopez IA, Sepahdari AR, et al. Meniere’s disease: histo-pathology, cytochemistry, and imaging. Ann N Y Acad Sci 2015;1343:49 –57 CrossRef Medline
10. Zou J, Poe D, Bjelke B, et al. Visualization of inner ear disorders withMRI in vivo: from animal models to human application. Acta Oto-laryngol Suppl 2009;(560):22–31 CrossRef Medline
11. Tagaya M, Teranishi M, Naganawa S, et al. 3 Tesla magnetic reso-nance imaging obtained 4 hours after intravenous gadolinium in-jection in patients with sudden deafness. Acta Otolaryngol 2010;130:665– 69 CrossRef Medline
12. Tagaya M, Yamazaki M, Teranishi M, et al. Endolymphatic hydrops
and blood-labyrinth barrier in Meniere’s disease. Acta Otolaryngol2011;131:474 –79 CrossRef Medline
13. Naganawa S, Kawai H, Sone M, et al. Increased sensitivity to lowconcentration gadolinium contrast by optimized heavily T2-weighted 3D-FLAIR to visualize endolymphatic space. Magn ResonMed Sci 2010;9:73– 80 CrossRef Medline
14. Floc’h JL, Tan W, Telang RS, et al. Markers of cochlear inflammationusing MRI. J Magn Reson Imaging 2014;39:150 – 61 CrossRef Medline
15. Sugiura M, Naganawa S, Teranishi M, et al. Three-dimensional fluid-attenuated inversion recovery magnetic resonance imaging find-ings in patients with sudden sensorineural hearing loss. Laryngo-scope 2006;116:1451–54 CrossRef Medline
16. Berrettini S, Seccia V, Fortunato S, et al. Analysis of the 3-dimen-sional fluid-attenuated inversion-recovery (3D-FLAIR) sequencein idiopathic sudden sensorineural hearing loss. JAMA OtolaryngolHead Neck Surg 2013;139:456 – 64 CrossRef Medline
17. Lee HY, Jung SY, Park MS, et al. Feasibility of three-dimensionalfluid-attenuated inversion recovery magnetic resonance imaging asa prognostic factor in patients with sudden hearing loss. Eur ArchOtorhinolaryngol 2012;269:1885–91 CrossRef Medline
18. Hamill TA. Evaluating treatments for Meniere’s disease: controver-sies surrounding placebo control. J Am Acad Audiol 2006;17:27–37CrossRef Medline
19. Balkany TJ, Sires B, Arenberg IK. Bilateral aspects of Meniere’sdisease: an underestimated clinical entity. Otolaryngol Clin NorthAm 1980;13:603– 09 Medline
20. Miller ME, Mafee MF, Bykowski J, et al. Hearing preservation andvestibular schwannoma: intracochlear FLAIR signal relates to hear-ing level. Otol Neurotol 2014;35:348 –52 CrossRef Medline
21. Yamazaki M, Naganawa S, Kawai H, et al. Increased signal intensityof the cochlea on pre- and post-contrast enhanced 3D-FLAIR inpatients with vestibular schwannoma. Neuroradiology 2009;51:855– 63 CrossRef Medline
22. Yoshida T, Sugiura M, Naganawa S, et al. Three-dimensional fluid-attenuated inversion recovery magnetic resonance imaging find-ings and prognosis in sudden sensorineural hearing loss. Laryngo-scope 2008;118:1433–37 CrossRef Medline
1908 Pakdaman Oct 2016 www.ajnr.org
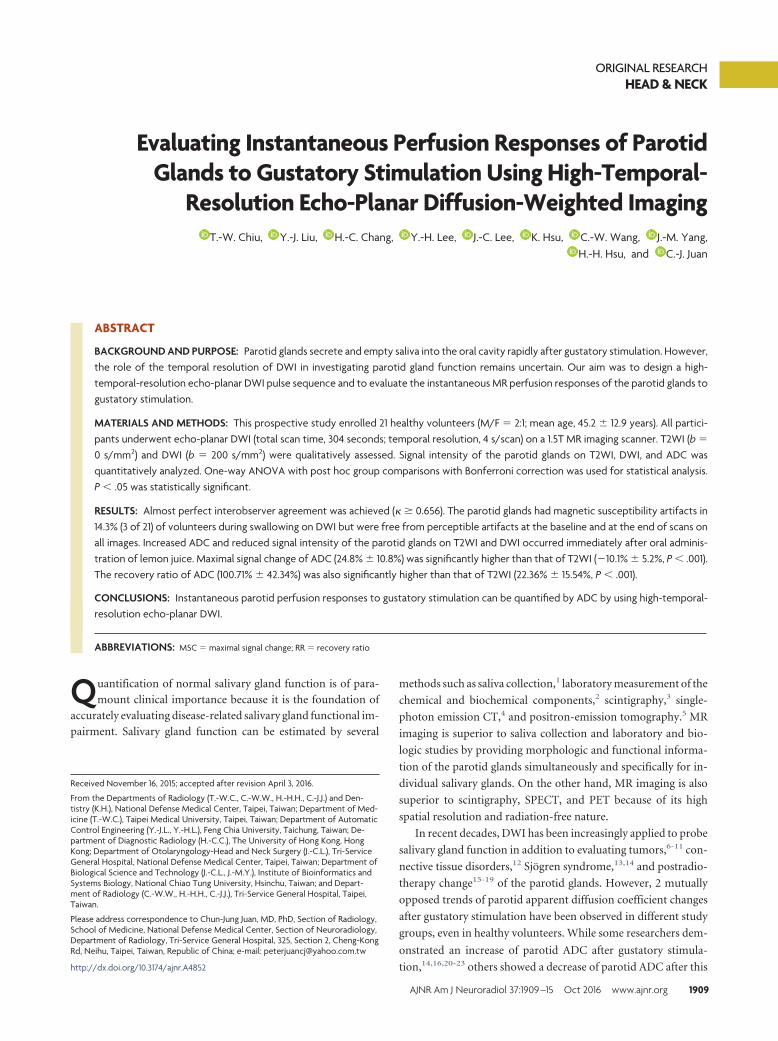
ORIGINAL RESEARCHHEAD & NECK
Evaluating Instantaneous Perfusion Responses of ParotidGlands to Gustatory Stimulation Using High-Temporal-
Resolution Echo-Planar Diffusion-Weighted ImagingX T.-W. Chiu, X Y.-J. Liu, X H.-C. Chang, X Y.-H. Lee, X J.-C. Lee, X K. Hsu, X C.-W. Wang, X J.-M. Yang,
X H.-H. Hsu, and X C.-J. Juan
ABSTRACT
BACKGROUND AND PURPOSE: Parotid glands secrete and empty saliva into the oral cavity rapidly after gustatory stimulation. However,the role of the temporal resolution of DWI in investigating parotid gland function remains uncertain. Our aim was to design a high-temporal-resolution echo-planar DWI pulse sequence and to evaluate the instantaneous MR perfusion responses of the parotid glands togustatory stimulation.
MATERIALS AND METHODS: This prospective study enrolled 21 healthy volunteers (M/F � 2:1; mean age, 45.2 � 12.9 years). All partici-pants underwent echo-planar DWI (total scan time, 304 seconds; temporal resolution, 4 s/scan) on a 1.5T MR imaging scanner. T2WI (b �
0 s/mm2) and DWI (b � 200 s/mm2) were qualitatively assessed. Signal intensity of the parotid glands on T2WI, DWI, and ADC wasquantitatively analyzed. One-way ANOVA with post hoc group comparisons with Bonferroni correction was used for statistical analysis.P � .05 was statistically significant.
RESULTS: Almost perfect interobserver agreement was achieved (� � 0.656). The parotid glands had magnetic susceptibility artifacts in14.3% (3 of 21) of volunteers during swallowing on DWI but were free from perceptible artifacts at the baseline and at the end of scans onall images. Increased ADC and reduced signal intensity of the parotid glands on T2WI and DWI occurred immediately after oral adminis-tration of lemon juice. Maximal signal change of ADC (24.8% � 10.8%) was significantly higher than that of T2WI (�10.1% � 5.2%, P � .001).The recovery ratio of ADC (100.71% � 42.34%) was also significantly higher than that of T2WI (22.36% � 15.54%, P � .001).
CONCLUSIONS: Instantaneous parotid perfusion responses to gustatory stimulation can be quantified by ADC by using high-temporal-resolution echo-planar DWI.
ABBREVIATIONS: MSC � maximal signal change; RR � recovery ratio
Quantification of normal salivary gland function is of para-
mount clinical importance because it is the foundation of
accurately evaluating disease-related salivary gland functional im-
pairment. Salivary gland function can be estimated by several
methods such as saliva collection,1 laboratory measurement of the
chemical and biochemical components,2 scintigraphy,3 single-
photon emission CT,4 and positron-emission tomography.5 MR
imaging is superior to saliva collection and laboratory and bio-
logic studies by providing morphologic and functional informa-
tion of the parotid glands simultaneously and specifically for in-
dividual salivary glands. On the other hand, MR imaging is also
superior to scintigraphy, SPECT, and PET because of its high
spatial resolution and radiation-free nature.
In recent decades, DWI has been increasingly applied to probe
salivary gland function in addition to evaluating tumors,6-11 con-
nective tissue disorders,12 Sjogren syndrome,13,14 and postradio-
therapy change15-19 of the parotid glands. However, 2 mutually
opposed trends of parotid apparent diffusion coefficient changes
after gustatory stimulation have been observed in different study
groups, even in healthy volunteers. While some researchers dem-
onstrated an increase of parotid ADC after gustatory stimula-
tion,14,16,20-23 others showed a decrease of parotid ADC after this
Received November 16, 2015; accepted after revision April 3, 2016.
From the Departments of Radiology (T.-W.C., C.-W.W., H.-H.H., C.-J.J.) and Den-tistry (K.H.), National Defense Medical Center, Taipei, Taiwan; Department of Med-icine (T.-W.C.), Taipei Medical University, Taipei, Taiwan; Department of AutomaticControl Engineering (Y.-J.L., Y.-H.L.), Feng Chia University, Taichung, Taiwan; De-partment of Diagnostic Radiology (H.-C.C.), The University of Hong Kong, HongKong; Department of Otolaryngology-Head and Neck Surgery (J.-C.L.), Tri-ServiceGeneral Hospital, National Defense Medical Center, Taipei, Taiwan; Department ofBiological Science and Technology (J.-C.L., J.-M.Y.), Institute of Bioinformatics andSystems Biology, National Chiao Tung University, Hsinchu, Taiwan; and Depart-ment of Radiology (C.-W.W., H.-H.H., C.-J.J.), Tri-Service General Hospital, Taipei,Taiwan.
Please address correspondence to Chun-Jung Juan, MD, PhD, Section of Radiology,School of Medicine, National Defense Medical Center, Section of Neuroradiology,Department of Radiology, Tri-Service General Hospital, 325, Section 2, Cheng-KongRd, Neihu, Taipei, Taiwan, Republic of China; e-mail: [email protected]
http://dx.doi.org/10.3174/ajnr.A4852
AJNR Am J Neuroradiol 37:1909 –15 Oct 2016 www.ajnr.org 1909
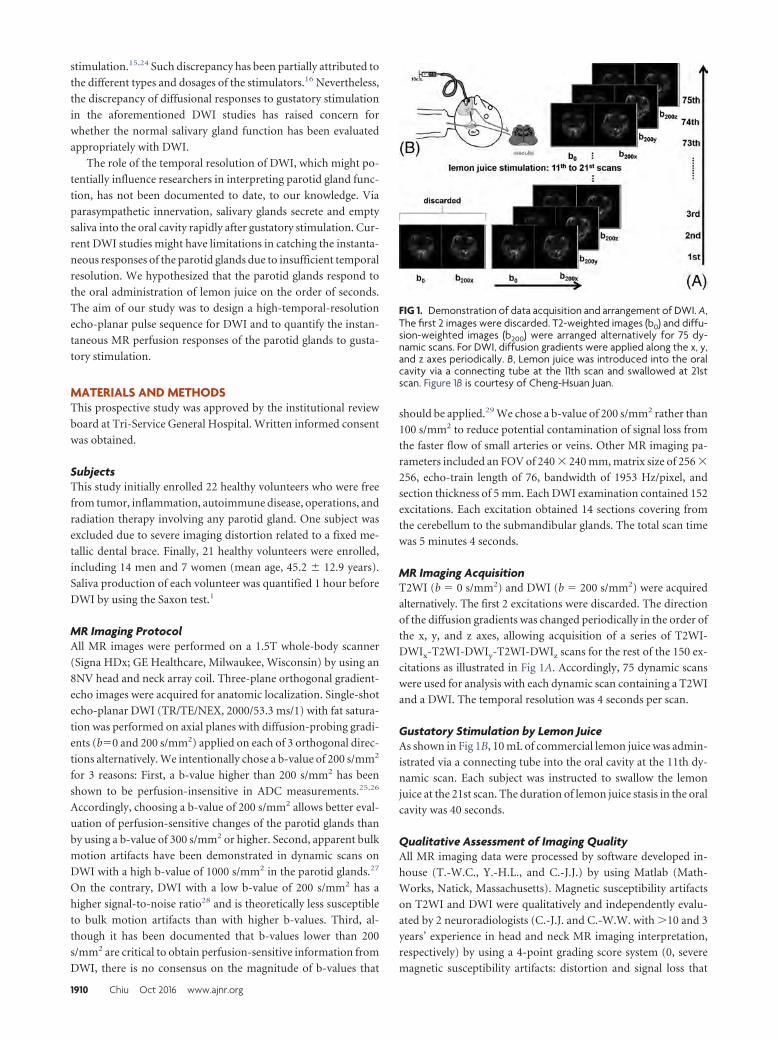
stimulation.15,24 Such discrepancy has been partially attributed to
the different types and dosages of the stimulators.16 Nevertheless,
the discrepancy of diffusional responses to gustatory stimulation
in the aforementioned DWI studies has raised concern for
whether the normal salivary gland function has been evaluated
appropriately with DWI.
The role of the temporal resolution of DWI, which might po-
tentially influence researchers in interpreting parotid gland func-
tion, has not been documented to date, to our knowledge. Via
parasympathetic innervation, salivary glands secrete and empty
saliva into the oral cavity rapidly after gustatory stimulation. Cur-
rent DWI studies might have limitations in catching the instanta-
neous responses of the parotid glands due to insufficient temporal
resolution. We hypothesized that the parotid glands respond to
the oral administration of lemon juice on the order of seconds.
The aim of our study was to design a high-temporal-resolution
echo-planar pulse sequence for DWI and to quantify the instan-
taneous MR perfusion responses of the parotid glands to gusta-
tory stimulation.
MATERIALS AND METHODSThis prospective study was approved by the institutional review
board at Tri-Service General Hospital. Written informed consent
was obtained.
SubjectsThis study initially enrolled 22 healthy volunteers who were free
from tumor, inflammation, autoimmune disease, operations, and
radiation therapy involving any parotid gland. One subject was
excluded due to severe imaging distortion related to a fixed me-
tallic dental brace. Finally, 21 healthy volunteers were enrolled,
including 14 men and 7 women (mean age, 45.2 � 12.9 years).
Saliva production of each volunteer was quantified 1 hour before
DWI by using the Saxon test.1
MR Imaging ProtocolAll MR images were performed on a 1.5T whole-body scanner
(Signa HDx; GE Healthcare, Milwaukee, Wisconsin) by using an
8NV head and neck array coil. Three-plane orthogonal gradient-
echo images were acquired for anatomic localization. Single-shot
echo-planar DWI (TR/TE/NEX, 2000/53.3 ms/1) with fat satura-
tion was performed on axial planes with diffusion-probing gradi-
ents (b�0 and 200 s/mm2) applied on each of 3 orthogonal direc-
tions alternatively. We intentionally chose a b-value of 200 s/mm2
for 3 reasons: First, a b-value higher than 200 s/mm2 has been
shown to be perfusion-insensitive in ADC measurements.25,26
Accordingly, choosing a b-value of 200 s/mm2 allows better eval-
uation of perfusion-sensitive changes of the parotid glands than
by using a b-value of 300 s/mm2 or higher. Second, apparent bulk
motion artifacts have been demonstrated in dynamic scans on
DWI with a high b-value of 1000 s/mm2 in the parotid glands.27
On the contrary, DWI with a low b-value of 200 s/mm2 has a
higher signal-to-noise ratio28 and is theoretically less susceptible
to bulk motion artifacts than with higher b-values. Third, al-
though it has been documented that b-values lower than 200
s/mm2 are critical to obtain perfusion-sensitive information from
DWI, there is no consensus on the magnitude of b-values that
should be applied.29 We chose a b-value of 200 s/mm2 rather than
100 s/mm2 to reduce potential contamination of signal loss from
the faster flow of small arteries or veins. Other MR imaging pa-
rameters included an FOV of 240 � 240 mm, matrix size of 256 �
256, echo-train length of 76, bandwidth of 1953 Hz/pixel, and
section thickness of 5 mm. Each DWI examination contained 152
excitations. Each excitation obtained 14 sections covering from
the cerebellum to the submandibular glands. The total scan time
was 5 minutes 4 seconds.
MR Imaging AcquisitionT2WI (b � 0 s/mm2) and DWI (b � 200 s/mm2) were acquired
alternatively. The first 2 excitations were discarded. The direction
of the diffusion gradients was changed periodically in the order of
the x, y, and z axes, allowing acquisition of a series of T2WI-
DWIx-T2WI-DWIy-T2WI-DWIz scans for the rest of the 150 ex-
citations as illustrated in Fig 1A. Accordingly, 75 dynamic scans
were used for analysis with each dynamic scan containing a T2WI
and a DWI. The temporal resolution was 4 seconds per scan.
Gustatory Stimulation by Lemon JuiceAs shown in Fig 1B, 10 mL of commercial lemon juice was admin-
istrated via a connecting tube into the oral cavity at the 11th dy-
namic scan. Each subject was instructed to swallow the lemon
juice at the 21st scan. The duration of lemon juice stasis in the oral
cavity was 40 seconds.
Qualitative Assessment of Imaging QualityAll MR imaging data were processed by software developed in-
house (T.-W.C., Y.-H.L., and C.-J.J.) by using Matlab (Math-
Works, Natick, Massachusetts). Magnetic susceptibility artifacts
on T2WI and DWI were qualitatively and independently evalu-
ated by 2 neuroradiologists (C.-J.J. and C.-W.W. with �10 and 3
years’ experience in head and neck MR imaging interpretation,
respectively) by using a 4-point grading score system (0, severe
magnetic susceptibility artifacts: distortion and signal loss that
FIG 1. Demonstration of data acquisition and arrangement of DWI. A,The first 2 images were discarded. T2-weighted images (b0) and diffu-sion-weighted images (b200) were arranged alternatively for 75 dy-namic scans. For DWI, diffusion gradients were applied along the x, y,and z axes periodically. B, Lemon juice was introduced into the oralcavity via a connecting tube at the 11th scan and swallowed at 21stscan. Figure 1B is courtesy of Cheng-Hsuan Juan.
1910 Chiu Oct 2016 www.ajnr.org
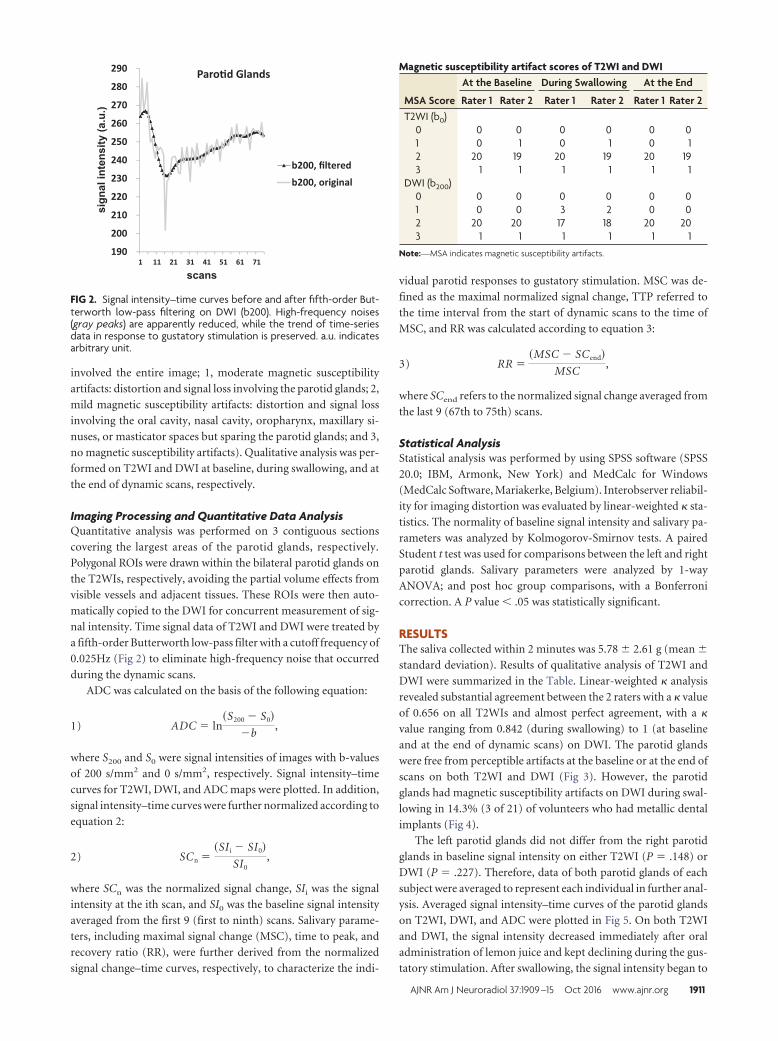
involved the entire image; 1, moderate magnetic susceptibility
artifacts: distortion and signal loss involving the parotid glands; 2,
mild magnetic susceptibility artifacts: distortion and signal loss
involving the oral cavity, nasal cavity, oropharynx, maxillary si-
nuses, or masticator spaces but sparing the parotid glands; and 3,
no magnetic susceptibility artifacts). Qualitative analysis was per-
formed on T2WI and DWI at baseline, during swallowing, and at
the end of dynamic scans, respectively.
Imaging Processing and Quantitative Data AnalysisQuantitative analysis was performed on 3 contiguous sections
covering the largest areas of the parotid glands, respectively.
Polygonal ROIs were drawn within the bilateral parotid glands on
the T2WIs, respectively, avoiding the partial volume effects from
visible vessels and adjacent tissues. These ROIs were then auto-
matically copied to the DWI for concurrent measurement of sig-
nal intensity. Time signal data of T2WI and DWI were treated by
a fifth-order Butterworth low-pass filter with a cutoff frequency of
0.025Hz (Fig 2) to eliminate high-frequency noise that occurred
during the dynamic scans.
ADC was calculated on the basis of the following equation:
1) ADC � ln�S200 � S0
�b,
where S200 and S0 were signal intensities of images with b-values
of 200 s/mm2 and 0 s/mm2, respectively. Signal intensity–time
curves for T2WI, DWI, and ADC maps were plotted. In addition,
signal intensity–time curves were further normalized according to
equation 2:
2) SCn ��SI i � SI0
SI0,
where SCn was the normalized signal change, SIi was the signal
intensity at the ith scan, and SI0 was the baseline signal intensity
averaged from the first 9 (first to ninth) scans. Salivary parame-
ters, including maximal signal change (MSC), time to peak, and
recovery ratio (RR), were further derived from the normalized
signal change–time curves, respectively, to characterize the indi-
vidual parotid responses to gustatory stimulation. MSC was de-
fined as the maximal normalized signal change, TTP referred to
the time interval from the start of dynamic scans to the time of
MSC, and RR was calculated according to equation 3:
3) RR ��MSC � SCend
MSC,
where SCend refers to the normalized signal change averaged from
the last 9 (67th to 75th) scans.
Statistical AnalysisStatistical analysis was performed by using SPSS software (SPSS
20.0; IBM, Armonk, New York) and MedCalc for Windows
(MedCalc Software, Mariakerke, Belgium). Interobserver reliabil-
ity for imaging distortion was evaluated by linear-weighted � sta-
tistics. The normality of baseline signal intensity and salivary pa-
rameters was analyzed by Kolmogorov-Smirnov tests. A paired
Student t test was used for comparisons between the left and right
parotid glands. Salivary parameters were analyzed by 1-way
ANOVA; and post hoc group comparisons, with a Bonferroni
correction. A P value � .05 was statistically significant.
RESULTSThe saliva collected within 2 minutes was 5.78 � 2.61 g (mean �
standard deviation). Results of qualitative analysis of T2WI and
DWI were summarized in the Table. Linear-weighted � analysis
revealed substantial agreement between the 2 raters with a � value
of 0.656 on all T2WIs and almost perfect agreement, with a �
value ranging from 0.842 (during swallowing) to 1 (at baseline
and at the end of dynamic scans) on DWI. The parotid glands
were free from perceptible artifacts at the baseline or at the end of
scans on both T2WI and DWI (Fig 3). However, the parotid
glands had magnetic susceptibility artifacts on DWI during swal-
lowing in 14.3% (3 of 21) of volunteers who had metallic dental
implants (Fig 4).
The left parotid glands did not differ from the right parotid
glands in baseline signal intensity on either T2WI (P � .148) or
DWI (P � .227). Therefore, data of both parotid glands of each
subject were averaged to represent each individual in further anal-
ysis. Averaged signal intensity–time curves of the parotid glands
on T2WI, DWI, and ADC were plotted in Fig 5. On both T2WI
and DWI, the signal intensity decreased immediately after oral
administration of lemon juice and kept declining during the gus-
tatory stimulation. After swallowing, the signal intensity began to
190
200
210
220
230
240
250
260
270
280
290
1 11 21 31 41 51 61 71
Paro�d Glands
b200, filtered
b200, original
FIG 2. Signal intensity–time curves before and after fifth-order But-terworth low-pass filtering on DWI (b200). High-frequency noises(gray peaks) are apparently reduced, while the trend of time-seriesdata in response to gustatory stimulation is preserved. a.u. indicatesarbitrary unit.
Magnetic susceptibility artifact scores of T2WI and DWI
MSA Score
At the Baseline During Swallowing At the End
Rater 1 Rater 2 Rater 1 Rater 2 Rater 1 Rater 2T2WI (b0)
0 0 0 0 0 0 01 0 1 0 1 0 12 20 19 20 19 20 193 1 1 1 1 1 1
DWI (b200)0 0 0 0 0 0 01 0 0 3 2 0 02 20 20 17 18 20 203 1 1 1 1 1 1
Note:—MSA indicates magnetic susceptibility artifacts.
AJNR Am J Neuroradiol 37:1909 –15 Oct 2016 www.ajnr.org 1911
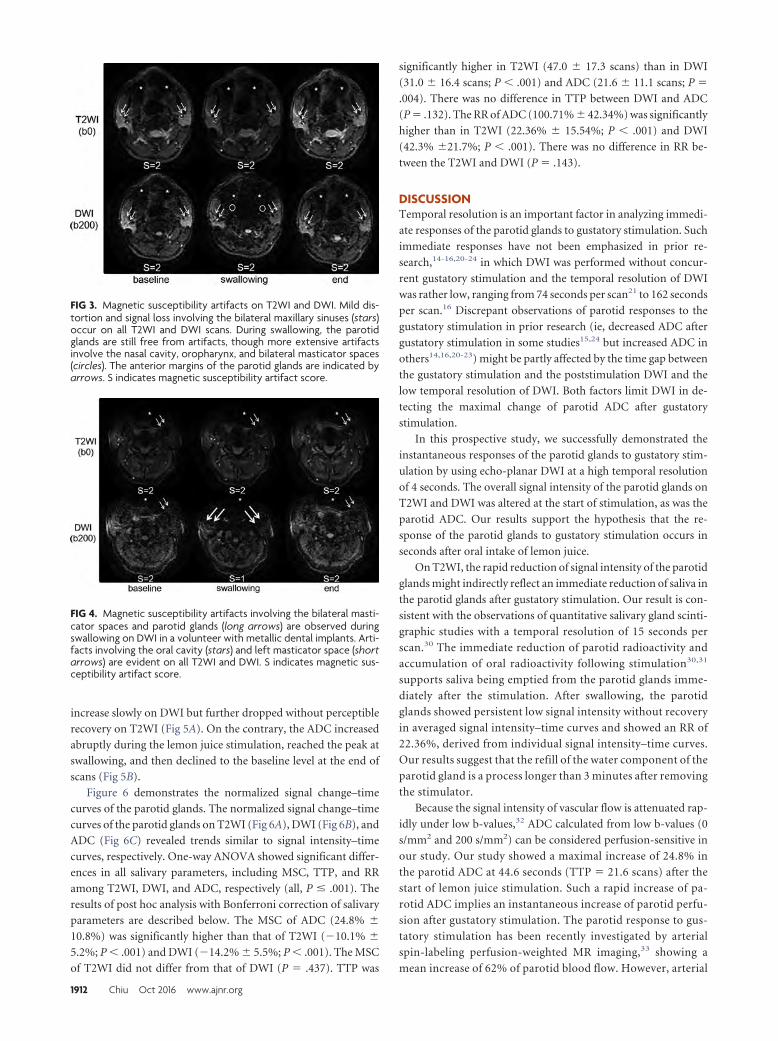
increase slowly on DWI but further dropped without perceptible
recovery on T2WI (Fig 5A). On the contrary, the ADC increased
abruptly during the lemon juice stimulation, reached the peak at
swallowing, and then declined to the baseline level at the end of
scans (Fig 5B).
Figure 6 demonstrates the normalized signal change–time
curves of the parotid glands. The normalized signal change–time
curves of the parotid glands on T2WI (Fig 6A), DWI (Fig 6B), and
ADC (Fig 6C) revealed trends similar to signal intensity–time
curves, respectively. One-way ANOVA showed significant differ-
ences in all salivary parameters, including MSC, TTP, and RR
among T2WI, DWI, and ADC, respectively (all, P � .001). The
results of post hoc analysis with Bonferroni correction of salivary
parameters are described below. The MSC of ADC (24.8% �
10.8%) was significantly higher than that of T2WI (�10.1% �
5.2%; P � .001) and DWI (�14.2% � 5.5%; P � .001). The MSC
of T2WI did not differ from that of DWI (P � .437). TTP was
significantly higher in T2WI (47.0 � 17.3 scans) than in DWI
(31.0 � 16.4 scans; P � .001) and ADC (21.6 � 11.1 scans; P �
.004). There was no difference in TTP between DWI and ADC
(P � .132). The RR of ADC (100.71% � 42.34%) was significantly
higher than in T2WI (22.36% � 15.54%; P � .001) and DWI
(42.3% �21.7%; P � .001). There was no difference in RR be-
tween the T2WI and DWI (P � .143).
DISCUSSIONTemporal resolution is an important factor in analyzing immedi-
ate responses of the parotid glands to gustatory stimulation. Such
immediate responses have not been emphasized in prior re-
search,14-16,20-24 in which DWI was performed without concur-
rent gustatory stimulation and the temporal resolution of DWI
was rather low, ranging from 74 seconds per scan21 to 162 seconds
per scan.16 Discrepant observations of parotid responses to the
gustatory stimulation in prior research (ie, decreased ADC after
gustatory stimulation in some studies15,24 but increased ADC in
others14,16,20-23) might be partly affected by the time gap between
the gustatory stimulation and the poststimulation DWI and the
low temporal resolution of DWI. Both factors limit DWI in de-
tecting the maximal change of parotid ADC after gustatory
stimulation.
In this prospective study, we successfully demonstrated the
instantaneous responses of the parotid glands to gustatory stim-
ulation by using echo-planar DWI at a high temporal resolution
of 4 seconds. The overall signal intensity of the parotid glands on
T2WI and DWI was altered at the start of stimulation, as was the
parotid ADC. Our results support the hypothesis that the re-
sponse of the parotid glands to gustatory stimulation occurs in
seconds after oral intake of lemon juice.
On T2WI, the rapid reduction of signal intensity of the parotid
glands might indirectly reflect an immediate reduction of saliva in
the parotid glands after gustatory stimulation. Our result is con-
sistent with the observations of quantitative salivary gland scinti-
graphic studies with a temporal resolution of 15 seconds per
scan.30 The immediate reduction of parotid radioactivity and
accumulation of oral radioactivity following stimulation30,31
supports saliva being emptied from the parotid glands imme-
diately after the stimulation. After swallowing, the parotid
glands showed persistent low signal intensity without recovery
in averaged signal intensity–time curves and showed an RR of
22.36%, derived from individual signal intensity–time curves.
Our results suggest that the refill of the water component of the
parotid gland is a process longer than 3 minutes after removing
the stimulator.
Because the signal intensity of vascular flow is attenuated rap-
idly under low b-values,32 ADC calculated from low b-values (0
s/mm2 and 200 s/mm2) can be considered perfusion-sensitive in
our study. Our study showed a maximal increase of 24.8% in
the parotid ADC at 44.6 seconds (TTP � 21.6 scans) after the
start of lemon juice stimulation. Such a rapid increase of pa-
rotid ADC implies an instantaneous increase of parotid perfu-
sion after gustatory stimulation. The parotid response to gus-
tatory stimulation has been recently investigated by arterial
spin-labeling perfusion-weighted MR imaging,33 showing a
mean increase of 62% of parotid blood flow. However, arterial
FIG 3. Magnetic susceptibility artifacts on T2WI and DWI. Mild dis-tortion and signal loss involving the bilateral maxillary sinuses (stars)occur on all T2WI and DWI scans. During swallowing, the parotidglands are still free from artifacts, though more extensive artifactsinvolve the nasal cavity, oropharynx, and bilateral masticator spaces(circles). The anterior margins of the parotid glands are indicated byarrows. S indicates magnetic susceptibility artifact score.
FIG 4. Magnetic susceptibility artifacts involving the bilateral masti-cator spaces and parotid glands (long arrows) are observed duringswallowing on DWI in a volunteer with metallic dental implants. Arti-facts involving the oral cavity (stars) and left masticator space (shortarrows) are evident on all T2WI and DWI. S indicates magnetic sus-ceptibility artifact score.
1912 Chiu Oct 2016 www.ajnr.org
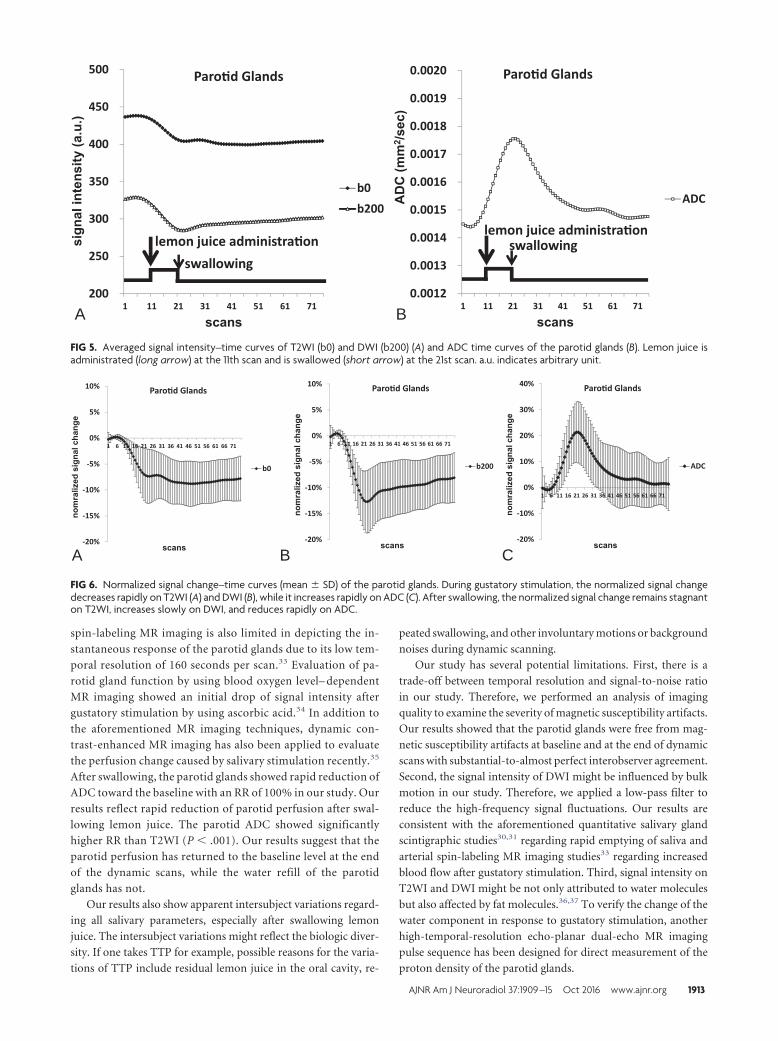
spin-labeling MR imaging is also limited in depicting the in-
stantaneous response of the parotid glands due to its low tem-
poral resolution of 160 seconds per scan.33 Evaluation of pa-
rotid gland function by using blood oxygen level– dependent
MR imaging showed an initial drop of signal intensity after
gustatory stimulation by using ascorbic acid.34 In addition to
the aforementioned MR imaging techniques, dynamic con-
trast-enhanced MR imaging has also been applied to evaluate
the perfusion change caused by salivary stimulation recently.35
After swallowing, the parotid glands showed rapid reduction of
ADC toward the baseline with an RR of 100% in our study. Our
results reflect rapid reduction of parotid perfusion after swal-
lowing lemon juice. The parotid ADC showed significantly
higher RR than T2WI (P � .001). Our results suggest that the
parotid perfusion has returned to the baseline level at the end
of the dynamic scans, while the water refill of the parotid
glands has not.
Our results also show apparent intersubject variations regard-
ing all salivary parameters, especially after swallowing lemon
juice. The intersubject variations might reflect the biologic diver-
sity. If one takes TTP for example, possible reasons for the varia-
tions of TTP include residual lemon juice in the oral cavity, re-
peated swallowing, and other involuntary motions or background
noises during dynamic scanning.
Our study has several potential limitations. First, there is a
trade-off between temporal resolution and signal-to-noise ratio
in our study. Therefore, we performed an analysis of imaging
quality to examine the severity of magnetic susceptibility artifacts.
Our results showed that the parotid glands were free from mag-
netic susceptibility artifacts at baseline and at the end of dynamic
scans with substantial-to-almost perfect interobserver agreement.
Second, the signal intensity of DWI might be influenced by bulk
motion in our study. Therefore, we applied a low-pass filter to
reduce the high-frequency signal fluctuations. Our results are
consistent with the aforementioned quantitative salivary gland
scintigraphic studies30,31 regarding rapid emptying of saliva and
arterial spin-labeling MR imaging studies33 regarding increased
blood flow after gustatory stimulation. Third, signal intensity on
T2WI and DWI might be not only attributed to water molecules
but also affected by fat molecules.36,37 To verify the change of the
water component in response to gustatory stimulation, another
high-temporal-resolution echo-planar dual-echo MR imaging
pulse sequence has been designed for direct measurement of the
proton density of the parotid glands.
200
250
300
350
400
450
500
1 11 21 31 41 51 61 71
Paro�d Glands
b0
b200
lemon juice administra�on
swallowing
0.0012
0.0013
0.0014
0.0015
0.0016
0.0017
0.0018
0.0019
0.0020
1 11 21 31 41 51 61 71
Paro�d Glands
ADC
lemon juice administra�onswallowing
A B
FIG 5. Averaged signal intensity–time curves of T2WI (b0) and DWI (b200) (A) and ADC time curves of the parotid glands (B). Lemon juice isadministrated (long arrow) at the 11th scan and is swallowed (short arrow) at the 21st scan. a.u. indicates arbitrary unit.
20%
15%
10%
5%
0%
5%
10%
1 6 11 16 21 26 31 36 41 46 51 56 61 66 71
Paro�d Glands
b0
20%
15%
10%
5%
0%
5%
10%
1 6 11 16 21 26 31 36 41 46 51 56 61 66 71
Paro�d Glands
b200
20%
10%
0%
10%
20%
30%
40%
1 6 11 16 21 26 31 36 41 46 51 56 61 66 71
Paro�d Glands
ADC
A B C
FIG 6. Normalized signal change–time curves (mean � SD) of the parotid glands. During gustatory stimulation, the normalized signal changedecreases rapidly on T2WI (A) and DWI (B), while it increases rapidly on ADC (C). After swallowing, the normalized signal change remains stagnanton T2WI, increases slowly on DWI, and reduces rapidly on ADC.
AJNR Am J Neuroradiol 37:1909 –15 Oct 2016 www.ajnr.org 1913
CONCLUSIONSInstantaneous parotid perfusion responses to gustatory stimula-
tion can be quantified by ADC by using high-temporal-resolution
echo-planar DWI.
ACKNOWLEDGMENTSThe authors are grateful to Cheng-Hsuan Juan for contribut-
ing the comprehensive cartoon illustration of gustatory
stimulation.
Disclosures: Y.-J. Liu—UNRELATED: Grants/Grants Pending: Received support inpart from the Ministry of Science and Technology under Grant No. NSC102-2221-E-035– 003–MY.
REFERENCES1. Kohler PF, Winter ME. A quantitative test for xerostomia: the Saxon
test, an oral equivalent of the Schirmer test. Arthritis Rheum 1985;28:1128 –32 CrossRef Medline
2. Chiappin S, Antonelli G, Gatti R, et al. Saliva specimen: a new labo-ratory tool for diagnostic and basic investigation. Clin Chim Acta2007;383:30 – 40 Medline
3. Arrago JP, Rain JD, Brocheriou C, et al. Scintigraphy of the salivaryglands in Sjogen’s syndrome. J Clin Pathol 1987;40:1463– 67CrossRef Medline
4. van Acker F, Flamen P, Lambin P, et al. The utility of SPECT indetermining the relationship between radiation dose and salivarygland dysfunction after radiotherapy. Nucl Med Commun 2001;22:225–31 CrossRef Medline
5. Buus S, Grau C, Munk OL, et al. 11C-methionine PET, a novelmethod for measuring regional salivary gland function after radio-therapy of head and neck cancer. Radiother Oncol 2004;73:289 –96CrossRef Medline
6. Ikeda M, Motoori K, Hanazawa T, et al. Warthin tumor of the pa-rotid gland: diagnostic value of MR imaging with histopathologiccorrelation. AJNR Am J Neuroradiol 2004;25:1256 – 62 Medline
7. Eida S, Sumi M, Sakihama N, et al. Apparent diffusion coefficientmapping of salivary gland tumors: prediction of the benignancyand malignancy. AJNR Am J Neuroradiol 2007;28:116 –21 Medline
8. Yerli H, Agildere AM, Aydin E, et al. Value of apparent diffusioncoefficient calculation in the differential diagnosis of parotid glandtumors. Acta Radiol 2007;48:980 – 87 CrossRef Medline
9. Yabuuchi H, Matsuo Y, Kamitani T, et al. Parotid gland tumors: canaddition of diffusion-weighted MR imaging to dynamic contrast-enhanced MR imaging improve diagnostic accuracy in character-ization? Radiology 2008;249:909 –16 CrossRef Medline
10. Habermann CR, Arndt C, Graessner J, et al. Diffusion-weightedecho-planar MR imaging of primary parotid gland tumors: is a pre-diction of different histologic subtypes possible? AJNR Am J Neuro-radiol 2009;30:591–96 CrossRef Medline
11. Celebi I, Mahmutoglu AS, Ucgul A, et al. Quantitative diffusion-weighted magnetic resonance imaging in the evaluation of parotidgland masses: a study with histopathological correlation. Clin Im-aging 2013;37:232–38 CrossRef Medline
12. Patel RR, Carlos RC, Midia M, et al. Apparent diffusion coefficientmapping of the normal parotid gland and parotid involvement inpatients with systemic connective tissue disorders. AJNR Am J Neu-roradiol 2004;25:16 –20 Medline
13. Sumi M, Takagi Y, Uetani M, et al. Diffusion-weighted echoplanarMR imaging of the salivary glands. AJR Am J Roentgenol 2002;178:959 – 65 CrossRef Medline
14. Regier M, Ries T, Arndt C, et al. Sjogren’s syndrome of the parotidgland: value of diffusion-weighted echo-planar MRI for diagnosisat an early stage based on MR sialography grading in comparisonwith healthy volunteers. Rofo 2009;181:242– 48 CrossRef Medline
15. Dirix P, De Keyzer F, Vandecaveye V, et al. Diffusion-weighted mag-netic resonance imaging to evaluate major salivary gland function
before and after radiotherapy. Int J Radiat Oncol Biol Phys 2008;71:1365–71 CrossRef Medline
16. Zhang Y, Ou D, Gu Y, et al. Diffusion-weighted MR imaging ofsalivary glands with gustatory stimulation: comparison before andafter radiotherapy. Acta Radiol 2013;54:928 –33 CrossRef Medline
17. Marzi S, Forina C, Marucci L, et al. Early radiation-induced changesevaluated by intravoxel incoherent motion in the major salivaryglands. J Magn Reson Imaging 2015;41:974 – 82 CrossRef Medline
18. Juan CJ, Cheng CC, Chiu SC, et al. Temporal evolution of parotidvolume and parotid apparent diffusion coefficient in nasopharyn-geal carcinoma patients treated by intensity-modulated radiother-apy investigated by magnetic resonance imaging: a pilot study. PLoSOne 2015;10:e0137073 CrossRef Medline
19. Studer G, Kirilova A, Jaffray D, et al. Major salivary gland function:diffusion-weighted MRI (DWI) assessment before, during and af-ter radiation therapy. International Journal of Radiation Oncology2005;63:S361 CrossRef
20. Habermann CR, Cramer MC, Graessner J, et al. Functional imagingof parotid glands: diffusion-weighted echo-planar MRI before andafter stimulation. Rofo 2004;176:1385– 89 CrossRef Medline
21. Habermann CR, Gossrau P, Kooijman H, et al. Monitoring of gusta-tory stimulation of salivary glands by diffusion-weighted MRimaging: comparison of 1.5T and 3T. AJNR Am J Neuroradiol 2007;28:1547–51 CrossRef Medline
22. Ries T, Arndt C, Regier M, et al. Value of apparent diffusion coeffi-cient calculation before and after gustatory stimulation in the diag-nosis of acute or chronic parotitis. Eur Radiol 2008;18:2251–57CrossRef Medline
23. Kato H, Kanematsu M, Toida M, et al. Salivary gland functionevaluated by diffusion-weighted MR imaging with gustatorystimulation: preliminary results. J Magn Reson Imaging 2011;34:904 – 09 CrossRef Medline
24. Thoeny HC, De Keyzer F, Claus FG, et al. Gustatory stimulationchanges the apparent diffusion coefficient of salivary glands: initialexperience. Radiology 2005;235:629 –34 CrossRef Medline
25. Freiman M, Voss SD, Mulkern RV, et al. In vivo assessment of opti-mal b-value range for perfusion-insensitive apparent diffusion co-efficient imaging. Med Phys 2012;39:4832–39 CrossRef Medline
26. Dikaios N, Punwani S, Hamy V, et al. Noise estimation from aver-aged diffusion weighted images: can unbiased quantitative decayparameters assist cancer evaluation? Magn Reson Med 2014;71:2105–17 CrossRef Medline
27. Liu YJ, Lee YH, Chang HC, et al. A potential risk of overestimatingapparent diffusion coefficient in parotid glands. PLoS One 2015;10:e0124118 CrossRef Medline
28. Lemke A, Stieltjes B, Schad LR, et al. Toward an optimal distributionof b values for intravoxel incoherent motion imaging. Magn ResonImaging 2011;29:766 –76 CrossRef Medline
29. Koh DM, Collins DJ, Orton MR. Intravoxel incoherent motion inbody diffusion-weighted MRI: reality and challenges. AJR Am JRoentgenol 2011;196:1351– 61 CrossRef Medline
30. Hermann GA, Vivino FB, Shnier D, et al. Variability of quantitativescintigraphic salivary indices in normal subjects. J Nucl Med 1998;39:1260 – 63 Medline
31. Aung W, Murata Y, Ishida R, et al. Study of quantitative oral radio-activity in salivary gland scintigraphy and determination of theclinical stage of Sjogren’s syndrome. J Nucl Med 2001;42:38 – 43Medline
32. Koh DM. Qualitative and quantitative analyses: image evaluationand interpretation. In: Koh DM, Theony HC. Diffusion-WeightedMR Imaging: Applications in the Body. Berlin: Springer-Verlag;2010:33– 47
33. Schwenzer NF, Schraml C, Martirosian P, et al. MR measurement ofblood flow in the parotid gland without contrast medium: a func-tional study before and after gustatory stimulation. NMR Biomed2008;21:598 – 605 CrossRef Medline
34. Simon-Zoula SC, Boesch C, De Keyzer F, et al. Functional imaging ofthe parotid glands using blood oxygenation level dependent
1914 Chiu Oct 2016 www.ajnr.org

(BOLD)-MRI at 1.5T and 3T. J Magn Reson Imaging 2008;27:43– 48CrossRef Medline
35. Clark HD, Moiseenko VV, Rackley TP, et al. Development of amethod for functional aspect identification in parotid using dy-namic contrast-enhanced magnetic resonance imaging and con-current stimulation. Acta Oncol 2015;54:1686 –90 CrossRefMedline
36. Juan CJ, Chang HC, Hsueh CJ, et al. Salivary glands: echo-planarversus PROPELLER diffusion-weighted MR imaging for assess-ment of ADCs. Radiology 2009;253:144 –52 CrossRef Medline
37. Chang HC, Juan CJ, Chiu HC, et al. Effects of gender, age, and bodymass index on fat contents and apparent diffusion coefficients inhealthy parotid glands: an MRI evaluation. Eur Radiol 2014;24:2069 –76 CrossRef Medline
AJNR Am J Neuroradiol 37:1909 –15 Oct 2016 www.ajnr.org 1915
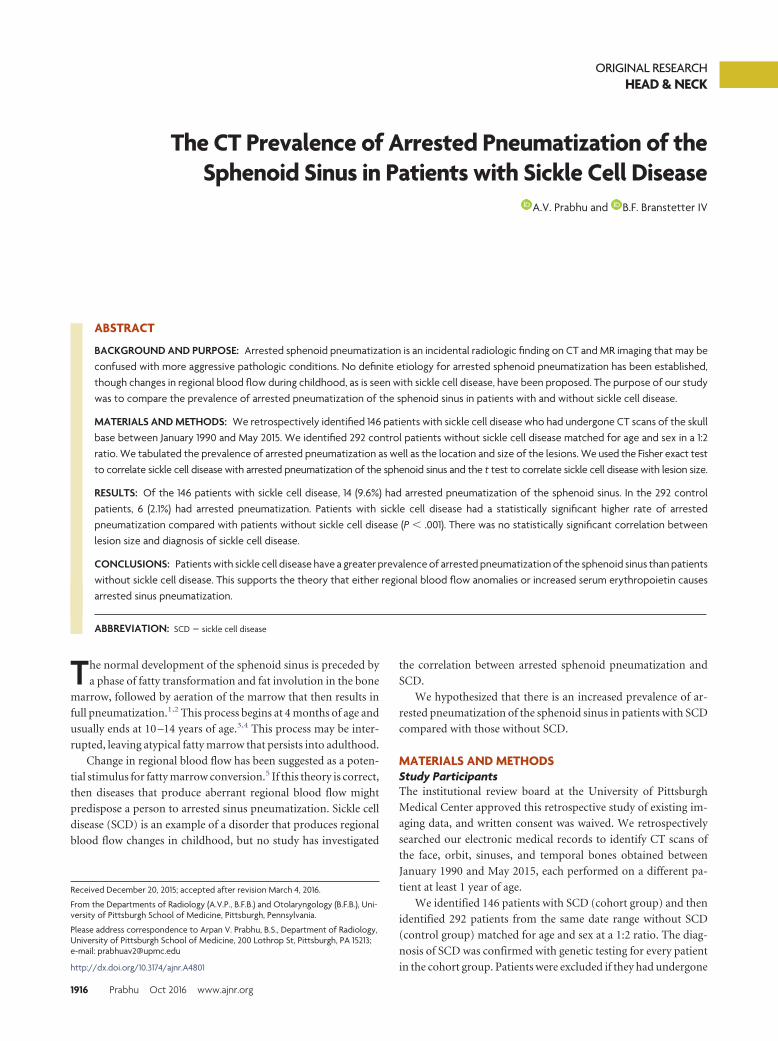
ORIGINAL RESEARCHHEAD & NECK
The CT Prevalence of Arrested Pneumatization of theSphenoid Sinus in Patients with Sickle Cell Disease
X A.V. Prabhu and X B.F. Branstetter IV
ABSTRACT
BACKGROUND AND PURPOSE: Arrested sphenoid pneumatization is an incidental radiologic finding on CT and MR imaging that may beconfused with more aggressive pathologic conditions. No definite etiology for arrested sphenoid pneumatization has been established,though changes in regional blood flow during childhood, as is seen with sickle cell disease, have been proposed. The purpose of our studywas to compare the prevalence of arrested pneumatization of the sphenoid sinus in patients with and without sickle cell disease.
MATERIALS AND METHODS: We retrospectively identified 146 patients with sickle cell disease who had undergone CT scans of the skullbase between January 1990 and May 2015. We identified 292 control patients without sickle cell disease matched for age and sex in a 1:2ratio. We tabulated the prevalence of arrested pneumatization as well as the location and size of the lesions. We used the Fisher exact testto correlate sickle cell disease with arrested pneumatization of the sphenoid sinus and the t test to correlate sickle cell disease with lesion size.
RESULTS: Of the 146 patients with sickle cell disease, 14 (9.6%) had arrested pneumatization of the sphenoid sinus. In the 292 controlpatients, 6 (2.1%) had arrested pneumatization. Patients with sickle cell disease had a statistically significant higher rate of arrestedpneumatization compared with patients without sickle cell disease (P � .001). There was no statistically significant correlation betweenlesion size and diagnosis of sickle cell disease.
CONCLUSIONS: Patients with sickle cell disease have a greater prevalence of arrested pneumatization of the sphenoid sinus than patientswithout sickle cell disease. This supports the theory that either regional blood flow anomalies or increased serum erythropoietin causesarrested sinus pneumatization.
ABBREVIATION: SCD � sickle cell disease
The normal development of the sphenoid sinus is preceded by
a phase of fatty transformation and fat involution in the bone
marrow, followed by aeration of the marrow that then results in
full pneumatization.1,2 This process begins at 4 months of age and
usually ends at 10 –14 years of age.3,4 This process may be inter-
rupted, leaving atypical fatty marrow that persists into adulthood.
Change in regional blood flow has been suggested as a poten-
tial stimulus for fatty marrow conversion.5 If this theory is correct,
then diseases that produce aberrant regional blood flow might
predispose a person to arrested sinus pneumatization. Sickle cell
disease (SCD) is an example of a disorder that produces regional
blood flow changes in childhood, but no study has investigated
the correlation between arrested sphenoid pneumatization and
SCD.
We hypothesized that there is an increased prevalence of ar-
rested pneumatization of the sphenoid sinus in patients with SCD
compared with those without SCD.
MATERIALS AND METHODSStudy ParticipantsThe institutional review board at the University of Pittsburgh
Medical Center approved this retrospective study of existing im-
aging data, and written consent was waived. We retrospectively
searched our electronic medical records to identify CT scans of
the face, orbit, sinuses, and temporal bones obtained between
January 1990 and May 2015, each performed on a different pa-
tient at least 1 year of age.
We identified 146 patients with SCD (cohort group) and then
identified 292 patients from the same date range without SCD
(control group) matched for age and sex at a 1:2 ratio. The diag-
nosis of SCD was confirmed with genetic testing for every patient
in the cohort group. Patients were excluded if they had undergone
Received December 20, 2015; accepted after revision March 4, 2016.
From the Departments of Radiology (A.V.P., B.F.B.) and Otolaryngology (B.F.B.), Uni-versity of Pittsburgh School of Medicine, Pittsburgh, Pennsylvania.
Please address correspondence to Arpan V. Prabhu, B.S., Department of Radiology,University of Pittsburgh School of Medicine, 200 Lothrop St, Pittsburgh, PA 15213;e-mail: [email protected]
http://dx.doi.org/10.3174/ajnr.A4801
1916 Prabhu Oct 2016 www.ajnr.org
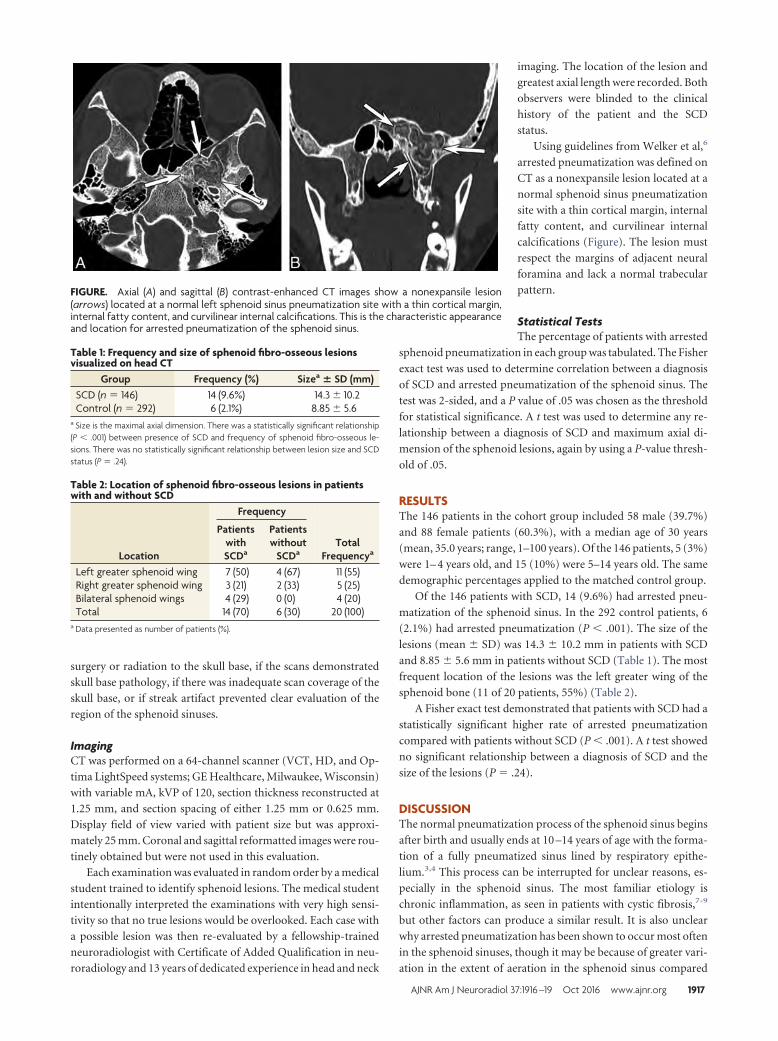
surgery or radiation to the skull base, if the scans demonstrated
skull base pathology, if there was inadequate scan coverage of the
skull base, or if streak artifact prevented clear evaluation of the
region of the sphenoid sinuses.
ImagingCT was performed on a 64-channel scanner (VCT, HD, and Op-
tima LightSpeed systems; GE Healthcare, Milwaukee, Wisconsin)
with variable mA, kVP of 120, section thickness reconstructed at
1.25 mm, and section spacing of either 1.25 mm or 0.625 mm.
Display field of view varied with patient size but was approxi-
mately 25 mm. Coronal and sagittal reformatted images were rou-
tinely obtained but were not used in this evaluation.
Each examination was evaluated in random order by a medical
student trained to identify sphenoid lesions. The medical student
intentionally interpreted the examinations with very high sensi-
tivity so that no true lesions would be overlooked. Each case with
a possible lesion was then re-evaluated by a fellowship-trained
neuroradiologist with Certificate of Added Qualification in neu-
roradiology and 13 years of dedicated experience in head and neck
imaging. The location of the lesion and
greatest axial length were recorded. Both
observers were blinded to the clinical
history of the patient and the SCD
status.
Using guidelines from Welker et al,6
arrested pneumatization was defined on
CT as a nonexpansile lesion located at a
normal sphenoid sinus pneumatization
site with a thin cortical margin, internal
fatty content, and curvilinear internal
calcifications (Figure). The lesion must
respect the margins of adjacent neural
foramina and lack a normal trabecular
pattern.
Statistical TestsThe percentage of patients with arrested
sphenoid pneumatization in each group was tabulated. The Fisher
exact test was used to determine correlation between a diagnosis
of SCD and arrested pneumatization of the sphenoid sinus. The
test was 2-sided, and a P value of .05 was chosen as the threshold
for statistical significance. A t test was used to determine any re-
lationship between a diagnosis of SCD and maximum axial di-
mension of the sphenoid lesions, again by using a P-value thresh-
old of .05.
RESULTSThe 146 patients in the cohort group included 58 male (39.7%)
and 88 female patients (60.3%), with a median age of 30 years
(mean, 35.0 years; range, 1–100 years). Of the 146 patients, 5 (3%)
were 1– 4 years old, and 15 (10%) were 5–14 years old. The same
demographic percentages applied to the matched control group.
Of the 146 patients with SCD, 14 (9.6%) had arrested pneu-
matization of the sphenoid sinus. In the 292 control patients, 6
(2.1%) had arrested pneumatization (P � .001). The size of the
lesions (mean � SD) was 14.3 � 10.2 mm in patients with SCD
and 8.85 � 5.6 mm in patients without SCD (Table 1). The most
frequent location of the lesions was the left greater wing of the
sphenoid bone (11 of 20 patients, 55%) (Table 2).
A Fisher exact test demonstrated that patients with SCD had a
statistically significant higher rate of arrested pneumatization
compared with patients without SCD (P � .001). A t test showed
no significant relationship between a diagnosis of SCD and the
size of the lesions (P � .24).
DISCUSSIONThe normal pneumatization process of the sphenoid sinus begins
after birth and usually ends at 10 –14 years of age with the forma-
tion of a fully pneumatized sinus lined by respiratory epithe-
lium.3,4 This process can be interrupted for unclear reasons, es-
pecially in the sphenoid sinus. The most familiar etiology is
chronic inflammation, as seen in patients with cystic fibrosis,7-9
but other factors can produce a similar result. It is also unclear
why arrested pneumatization has been shown to occur most often
in the sphenoid sinuses, though it may be because of greater vari-
ation in the extent of aeration in the sphenoid sinus compared
FIGURE. Axial (A) and sagittal (B) contrast-enhanced CT images show a nonexpansile lesion(arrows) located at a normal left sphenoid sinus pneumatization site with a thin cortical margin,internal fatty content, and curvilinear internal calcifications. This is the characteristic appearanceand location for arrested pneumatization of the sphenoid sinus.
Table 1: Frequency and size of sphenoid fibro-osseous lesionsvisualized on head CT
Group Frequency (%) Sizea � SD (mm)SCD (n � 146) 14 (9.6%) 14.3 � 10.2Control (n � 292) 6 (2.1%) 8.85 � 5.6
a Size is the maximal axial dimension. There was a statistically significant relationship(P � .001) between presence of SCD and frequency of sphenoid fibro-osseous le-sions. There was no statistically significant relationship between lesion size and SCDstatus (P � .24).
Table 2: Location of sphenoid fibro-osseous lesions in patientswith and without SCD
Location
Frequency
TotalFrequencya
PatientswithSCDa
Patientswithout
SCDa
Left greater sphenoid wing 7 (50) 4 (67) 11 (55)Right greater sphenoid wing 3 (21) 2 (33) 5 (25)Bilateral sphenoid wings 4 (29) 0 (0) 4 (20)Total 14 (70) 6 (30) 20 (100)
a Data presented as number of patients (%).
AJNR Am J Neuroradiol 37:1916 –19 Oct 2016 www.ajnr.org 1917
with other paranasal sinuses.6 Regarding arrested pneumatiza-
tion, there is a theory that aeration triggers the fatty marrow con-
version in the sphenoid sinus,1 whereas another theory suggests
that the ratio of trabecular to cortical bone is the driving mecha-
nism.10 Yonestu et al5 suggested a subsequent theory of regional
blood flow changes as the reason for atypical fatty marrow that
persists into adulthood.
It is important to note that the theory of regional blood flow
has not been proved. Using MR signal intensity changes on T1WI,
Yonetsu et al 5 showed sphenoid marrow conversion before 1 year
of age, when aeration of the sphenoid bone does not occur.4,11
This suggested that factors other than air supply, such as blood
supply, play an important role in conversion of the marrow.5
Humoral factors also may play a role in arrested pneumatization
of the sphenoid sinus, considering that serum erythropoietin
levels have been shown to be elevated in patients with SCD.12 The
elevated erythropoietin may interrupt the conversion of hemato-
poietic to fatty marrow.
The phrase “arrested pneumatization” makes an assumption
about the etiology of the sphenoid lesions that has not been
proved. In fact, radiologists may be uncomfortable using the
phrase because it is only one of several theories for the etiology of
these fibro-osseous lesions. Our study supports this terminology
and the theory of regional blood flow anomalies or increased
serum erythropoietin as a potential cause of arrested sinus
pneumatization.
The differential diagnosis for a mass in a normal sphenoid
sinus pneumatization site includes fibrous dysplasia, clival chor-
doma, chondrosarcoma, intraosseous lipoma, intraosseous hem-
angioma, hamartoma, ossifying fibroma, enchondroma, and
fibrous osteoma.6,13-16 Arrested pneumatization may be distin-
guished from these entities as a nonexpansile lesion with a thin
cortical margin, internal fatty content, and curvilinear internal
calcifications (Figure).6 These calcifications differ from the “ring
and arc” calcifications seen with chondroid tumors.13 Intraosse-
ous lipomas share some imaging characteristics with arrested si-
nus pneumatization,14 leading to the theory that these entities are
of similar etiology. However, our findings do not support this
theory. In particular, arrested pneumatization should not be con-
fused with ossifying fibroma. Whereas the internal matrix of ar-
rested pneumatization is characterized by curvilinear calcification
and fatty contents, ossifying fibromas exhibit ground-glass mar-
row on CT, often with an overlying radial pattern of calcifica-
tion.17 Ossifying fibromas are also expansile and may be exo-
phytic into the sinus itself.18
Our study has some important limitations. The study was ret-
rospective, and all the patients in the study were imaged for vari-
ous clinical reasons. The number of patients was too small to
break down our results by age to determine when these lesions
formed and determine whether age is predictive of prevalence.
Although the control patients were matched for age and sex, pa-
tient race was not reliably available to us, so we could not account
for this potential confounder. Serial CT scans could provide more
information about the usual development of arrested sphenoid
pneumatization, but in our series, no patients with lesions had
serial scans. Although the total number of patients in our series
who had arrested pneumatization was small, the statistical results
comparing the 2 groups were robust, with a P value less than .001.
Our study included some patients younger than 14 years of
age, when the development of the sphenoid sinuses is still ongo-
ing. Although these patients may be less likely to have fibro-osse-
ous lesions, we felt justified to include these patients because 2
patients with SCD (ages 8 and 14 years) had evidence of arrested
sphenoid pneumatization. Additionally, the case-control format
of our study would prevent this from biasing our overall results.
CONCLUSIONSPatients with SCD exhibit a higher prevalence of arrested pneu-
matization of the sphenoid sinus than patients without SCD. This
supports the theories that either regional blood flow anomalies or
increased serum erythropoietin cause arrested sinus pneumatiza-
tion and supports the continued use of this terminology.
ACKNOWLEDGMENTSThe authors thank Rose Jarosz for her role as research coordinator
for this study.
Disclosures: Arpan V. Prabhu—RELATED: Grant: University of Pittsburgh School ofMedicine through the Dean’s Summer Research Program.
REFERENCES1. Aoki S, Dillon WP, Barkovich AJ, et al. Marrow conversion before
pneumatization of the sphenoid sinus: assessment with MR imag-ing. Radiology 1989;172:373–75 CrossRef Medline
2. Scuderi AJ, Harnsberger HR, Boyer RS. Pneumatization of the para-nasal sinuses: normal features of importance to the accurate inter-pretation of CT scans and MR images. AJR Am J Roentgenol 1993;160:1101– 04 CrossRef Medline
3. Jang YJ, Kim SC. Pneumatization of the sphenoid sinus in childrenevaluated by magnetic resonance imaging. Am J Rhinol 2000;14:181– 85 CrossRef Medline
4. Szolar D, Preidler K, Ranner G, et al. Magnetic resonance assessmentof age-related development of the sphenoid sinus. Br J Radiol 1994;67:431–35 CrossRef Medline
5. Yonetsu K, Watanabe M, Nakamura T. Age-related expansion andreduction in aeration of the sphenoid sinus: volume assessmentby helical CT scanning. AJNR Am J Neuroradiol 2000;21:179 – 82Medline
6. Welker KM, DeLone DR, Lane JI, et al. Arrested pneumatization ofthe skull base: imaging characteristics. AJR Am J Roentgenol 2008;190:1691–96 CrossRef Medline
7. Bonfield TL, Konstan MW, Berger M. Altered respiratory epithelialcell cytokine production in cystic fibrosis. J Allergy Clin Immunol1999;104:72–78 CrossRef Medline
8. Chmiel JF, Berger M, Konstan MW. The role of inflammation in thepathophysiology of CF lung disease. Clin Rev Allergy Immunol 2002;23:5–27 CrossRef Medline
9. Nichols D, Chmiel J, Berger M. Chronic inflammation in the cysticfibrosis lung: alterations in inter- and intracellular signaling. ClinRev Allergy Immunol 2008;34:146 – 62 CrossRef Medline
10. Gurevitch O, Slavin S, Feldman AG. Conversion of red bone marrowinto yellow - cause and mechanisms. Med Hypotheses 2007;69:531–36 CrossRef Medline
11. Madeline LA, Elster AD. Suture closure in the humanchondrocranium: CT assessment. Radiology 1995;196:747–56CrossRef Medline
12. Ballas SK, Marcolina MJ. Determinants of red cell survival anderythropoietic activity in patients with sickle cell anemia in thesteady state. Hemoglobin 2000;24:277– 86 CrossRef Medline
1918 Prabhu Oct 2016 www.ajnr.org

13. Weerakkody Y. Arrested pneumatisation of the skull base (sphe-noid sinus). EuroRad 2013;Case 10648 CrossRef
14. Jalali E, Tadinada A. Arrested pneumatization of the sphenoid sinusmimicking intraosseous lesions of the skull base. Imaging Sci Dent2015;45:67–72 CrossRef Medline
15. Politi M, Romeike BF, Papanagiotou P, et al. Intraosseous hem-angioma of the skull with dural tail sign: radiologic features withpathologic correlation. AJNR Am J Neuroradiol 2005;26:2049 –52Medline
16. Srubiski A, Csillag A, Timperley D, et al. Radiological features of theintraosseous lipoma of the sphenoid. Otolaryngol Head Neck Surg2011;144:617–22 CrossRef Medline
17. Baumann I, Zimmermann R, Dammann F, et al. Ossifying fibromaof the ethmoid involving the orbit and the skull base. OtolaryngolHead Neck Surg 2005;133:158 –59 CrossRef Medline
18. Eversole R, Su L, ElMofty S. Benign fibro-osseous lesions of thecraniofacial complex. A review. Head Neck Pathol 2008;2:177–202CrossRef Medline
AJNR Am J Neuroradiol 37:1916 –19 Oct 2016 www.ajnr.org 1919
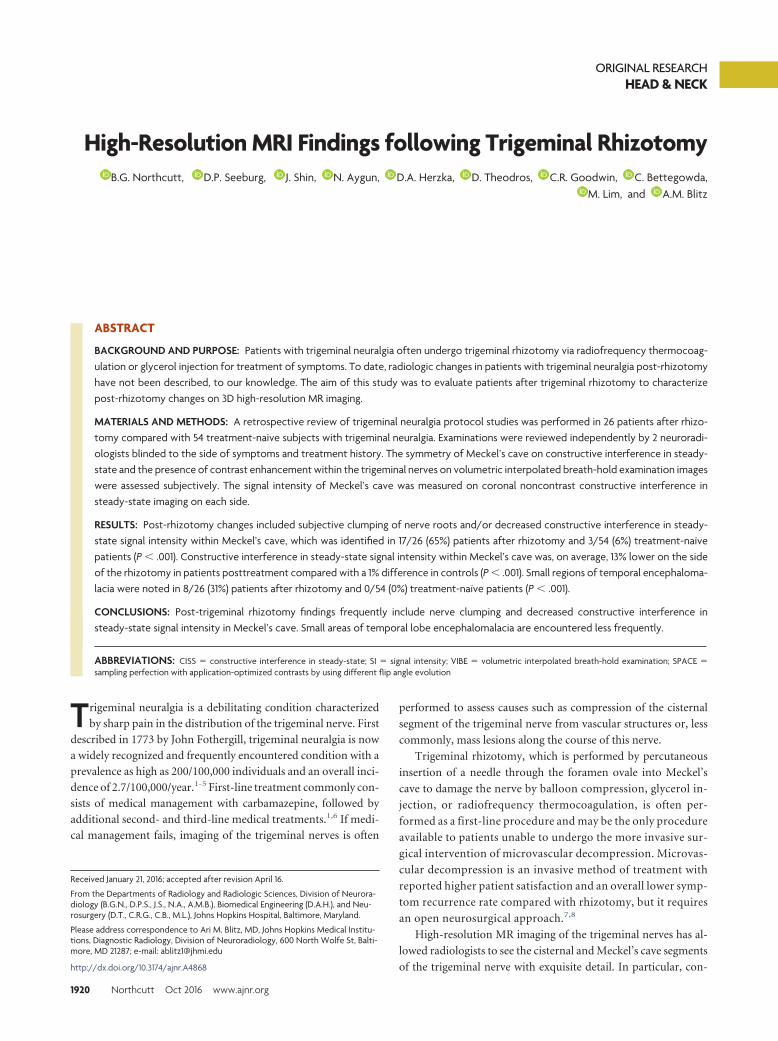
ORIGINAL RESEARCHHEAD & NECK
High-Resolution MRI Findings following Trigeminal RhizotomyX B.G. Northcutt, X D.P. Seeburg, X J. Shin, X N. Aygun, X D.A. Herzka, X D. Theodros, X C.R. Goodwin, X C. Bettegowda,
X M. Lim, and X A.M. Blitz
ABSTRACT
BACKGROUND AND PURPOSE: Patients with trigeminal neuralgia often undergo trigeminal rhizotomy via radiofrequency thermocoag-ulation or glycerol injection for treatment of symptoms. To date, radiologic changes in patients with trigeminal neuralgia post-rhizotomyhave not been described, to our knowledge. The aim of this study was to evaluate patients after trigeminal rhizotomy to characterizepost-rhizotomy changes on 3D high-resolution MR imaging.
MATERIALS AND METHODS: A retrospective review of trigeminal neuralgia protocol studies was performed in 26 patients after rhizo-tomy compared with 54 treatment-naïve subjects with trigeminal neuralgia. Examinations were reviewed independently by 2 neuroradi-ologists blinded to the side of symptoms and treatment history. The symmetry of Meckel’s cave on constructive interference in steady-state and the presence of contrast enhancement within the trigeminal nerves on volumetric interpolated breath-hold examination imageswere assessed subjectively. The signal intensity of Meckel’s cave was measured on coronal noncontrast constructive interference insteady-state imaging on each side.
RESULTS: Post-rhizotomy changes included subjective clumping of nerve roots and/or decreased constructive interference in steady-state signal intensity within Meckel’s cave, which was identified in 17/26 (65%) patients after rhizotomy and 3/54 (6%) treatment-naïvepatients (P � .001). Constructive interference in steady-state signal intensity within Meckel’s cave was, on average, 13% lower on the sideof the rhizotomy in patients posttreatment compared with a 1% difference in controls (P � .001). Small regions of temporal encephaloma-lacia were noted in 8/26 (31%) patients after rhizotomy and 0/54 (0%) treatment-naïve patients (P � .001).
CONCLUSIONS: Post-trigeminal rhizotomy findings frequently include nerve clumping and decreased constructive interference insteady-state signal intensity in Meckel’s cave. Small areas of temporal lobe encephalomalacia are encountered less frequently.
ABBREVIATIONS: CISS � constructive interference in steady-state; SI � signal intensity; VIBE � volumetric interpolated breath-hold examination; SPACE �sampling perfection with application-optimized contrasts by using different flip angle evolution
Trigeminal neuralgia is a debilitating condition characterized
by sharp pain in the distribution of the trigeminal nerve. First
described in 1773 by John Fothergill, trigeminal neuralgia is now
a widely recognized and frequently encountered condition with a
prevalence as high as 200/100,000 individuals and an overall inci-
dence of 2.7/100,000/year.1-5 First-line treatment commonly con-
sists of medical management with carbamazepine, followed by
additional second- and third-line medical treatments.1,6 If medi-
cal management fails, imaging of the trigeminal nerves is often
performed to assess causes such as compression of the cisternal
segment of the trigeminal nerve from vascular structures or, less
commonly, mass lesions along the course of this nerve.
Trigeminal rhizotomy, which is performed by percutaneous
insertion of a needle through the foramen ovale into Meckel’s
cave to damage the nerve by balloon compression, glycerol in-
jection, or radiofrequency thermocoagulation, is often per-
formed as a first-line procedure and may be the only procedure
available to patients unable to undergo the more invasive sur-
gical intervention of microvascular decompression. Microvas-
cular decompression is an invasive method of treatment with
reported higher patient satisfaction and an overall lower symp-
tom recurrence rate compared with rhizotomy, but it requires
an open neurosurgical approach.7,8
High-resolution MR imaging of the trigeminal nerves has al-
lowed radiologists to see the cisternal and Meckel’s cave segments
of the trigeminal nerve with exquisite detail. In particular, con-
Received January 21, 2016; accepted after revision April 16.
From the Departments of Radiology and Radiologic Sciences, Division of Neurora-diology (B.G.N., D.P.S., J.S., N.A., A.M.B.), Biomedical Engineering (D.A.H.), and Neu-rosurgery (D.T., C.R.G., C.B., M.L.), Johns Hopkins Hospital, Baltimore, Maryland.
Please address correspondence to Ari M. Blitz, MD, Johns Hopkins Medical Institu-tions, Diagnostic Radiology, Division of Neuroradiology, 600 North Wolfe St, Balti-more, MD 21287; e-mail: [email protected]
http://dx.doi.org/10.3174/ajnr.A4868
1920 Northcutt Oct 2016 www.ajnr.org
structive interference in steady-state (CISS) imaging, a free pre-
cession technique with intrinsic flow suppression and high signal-
to-noise ratio, allows visualization of fine structures, including
individual rootlets of the trigeminal nerve in Meckel’s cave. We
have also observed that CISS is sensitive to small perturbations in
the content of fluid and can demonstrate reduced signal com-
pared with CSF, even when differences are not visualized on spin-
echo-based imaging. Because patients can have high-resolution
imaging after trigeminal rhizotomy for a number of indications,
including recurrence of symptoms, the goal of this study was to
determine the findings expected on postprocedural imaging fol-
lowing percutaneous rhizotomy.
Given the postulated mechanism of action of rhizotomy—that
is, changes in osmolarity and resulting demyelination and neurol-
ysis with glycerol or direct heat neurolysis with radiofrequency
thermocoagulation—we hypothesized the following: the rootlets
of the trigeminal nerve in the region of the injection would dem-
onstrate visible changes in their course due to clumping and ad-
hesion; and the signal on CISS imaging would be reduced within
Meckel’s cave due to injectate and/or inflammatory debris.9 In
addition, we sought to evaluate whether enhancement of the tri-
geminal nerve or Meckel’s cave should be expected following rhi-
zotomy. The rates of other changes to surrounding structures and
the muscles of mastication that are innervated by the mandibular
division of the trigeminal nerve (cranial nerve V.3) were recorded.
MATERIALS AND METHODSPatient SampleA retrospective review of dedicated high-resolution 3D trigeminal
neuralgia protocol MR imaging studies was performed from 2011
to 2014. The study was approved by the institutional review board
and was Health Insurance Portability and Accountability Act–
compliant. Three hundred ten examinations were performed on
261 patients during the study period. Subjects were stratified into
preprocedural trigeminal neuralgia and post-rhizotomy groups.
Subjects were included in the post-rhizotomy group if they had a
documented history of either glycerol and/or radiofrequency
thermocoagulation rhizotomy before imaging. All rhizotomies
were performed with fluoroscopic image guidance. Subjects were
excluded from both groups if they had
symptoms atypical for trigeminal neu-
ralgia (n � 51), mass lesions in Meckel’s
cave (n � 11), and a history of microvas-
cular decompression (n � 65) or
gamma knife treatment (n � 4) before
imaging. Twenty-six studies qualified
for the post-rhizotomy group. One hun-
dred fifty-three examinations qualified
for the preprocedural trigeminal neural-
gia control group, of which 54 were se-
lected at random at approximately 2
controls per case with no statistically sig-
nificant difference between age and sex
compared with the post-rhizotomy
group.
Imaging TechniqueAll studies were conducted at our insti-
tution on Verio or Trio 3T scanners (75
examinations) or Magnetom Espree or
Avanto 1.5T scanners (3 examinations)
(Siemens, Erlangen, Germany) by using
a high-resolution trigeminal neuralgia
protocol. The protocol consisted of a
sagittal T1, isovolumetric T2 sampling
perfection with application-optimized
contrasts by using different flip angle
FIG 1. Coronal CISS precontrast images at the level of Meckel’s cave. A, Decreased T2 signalintensity and poorly delineated nerve rootlets in the left Meckel’s cave after rhizotomy. Note anormal-appearing right Meckel’s cave. B, A different patient with clumping of the nerve rootletsinferiorly within the left Meckel’s cave post-rhizotomy. C, Central clumping of nerve rootlets inthe right Meckel’s cave post-rhizotomy. D, A different patient with more subtle clumping of thenerve rootlets in the left Meckel’s cave and subtle decreased CISS SI post-rhizotomy.
Table 1: Subject age and sexPost-Rhizotomy Treatment-Naıve P Value
No. of Subjects 26 54Age (mean) (range) (yr) 60 (27–85) 55 (29–74) .09Sex 6 Men,
20 women20 Men,
34 women.31
Table 2: Frequency of findings within Meckel’s cave in treatment-naıve versus post-rhizotomy patientsa
Post-RhizotomyTreatment-
Naıve P ValueSubjective clumping 16/26 (62%) 3/54 (6%) �.001Decreased CISS 13/26 (50%) 3/54 (6%) �.001Subjective clumping without
decreased CISS SI4/26 (15%) 0/54 (0%) .01
2 CISS SI without clumping 1/26 (4%) 0/54 (0%) .33Subjective nerve clumping
and2 CISS SI12/26 (46%) 3/54 (6%) �.001
Subjective nerve clumpingand/or2 CISS SI
17/26 (65%) 3/54 (6%) �.001
Note:—2 indicates decrease.a Interobserver agreement � 90%, � � 0.69.
AJNR Am J Neuroradiol 37:1920 –24 Oct 2016 www.ajnr.org 1921
evolution sequence (SPACE; Siemens), FLAIR, and axial diffu-
sion-weighted images of the brain. High-resolution sequences
were acquired, including CISS pre- and postcontrast (section
thickness, 0.6 mm; matrix, 256/256; FOV, 16.9 � 24.6) and volu-
metric interpolated breath-hold examination (VIBE) pre- and
postcontrast (section thickness, 0.8 mm; matrix, 256/256; FOV,
16.9 � 24.6), with fat saturation applied on the postcontrast VIBE
imaging. Postcontrast images were acquired after administration
of 0.1 mL/kg of gadobutrol (Gadavist; Bayer Schering Pharma,
Berlin, German) if the glomerular filtration rate was above 60, and
half-dose of gadobenate dimeglumine (MultiHance; Bracco Di-
agnostics, Princeton, New Jersey) was used if the glomerular fil-
tration rate was below 60, per institutional protocol. 3D-time-of-
flight MRA of the circle of Willis was also performed as part of the
high-resolution trigeminal neuralgia protocol.
Image and Data AnalysisThe selected treatment-naïve and post-rhizotomy studies were
intermixed and reviewed independently by 2 neuroradiologists
(with �5 years experience) blinded to a history of prior treat-
ment. All study sequences were reviewed on a PACS. Meckel’s
caves were evaluated subjectively for asymmetry, including
clumping of the nerve roots and altered signal intensity on both
non-contrast-enhanced and contrast-enhanced CISS sequences.
Trigeminal nerves were assessed for enhancement on postcon-
trast VIBE images. The signal intensity of Meckel’s cave was ob-
jectively measured by a central freehand ROI within the largest
area of Meckel’s cave on coronal non-contrast-enhanced CISS
imaging for each case, avoiding Meckel’s cave borders. Post-
procedural changes in the adjacent structures were evaluated
on pre- and postcontrast CISS and VIBE sequences. These ad-
jacent structures included cranial nerves III and VI as they are
readily visualized; however, cranial nerve IV was not assessed
as it is not well-visualized routinely. Additionally, the medial
temporal lobes were assessed as they closely approximate and
often abut the lateral dural margin of the Meckel’s cave and can
be penetrated by piercing the lateral dura of Meckel’s cave.10,11
The adjacent petrous and cavernous segments of the internal
carotid arteries and cavernous sinuses were also assessed on 3D
TOF MRA.
Statistical AnalysisPatients in the control and post-rhizotomy groups were com-
pared for age by using a t test of independent samples, assum-
ing unequal variances, and compared for sex with the Fisher
exact test with MedCalc for Windows, Version 15.8 (MedCalc
Software; Mariakerke, Belgium). A P value �.05 was consid-
ered significant.
The sensitivity, specificity, and positive and negativepredictive values of subjective nerve clumping or decreasedCISS signal intensity (SI) for post-rhizotomy were calculated.Statistical significance was calculated via the Fisher exact test.Interobserver agreement and � were calculated between ob-servers.
A t test of independent samples assuming unequal variancewas performed to compare measurements of CISS SI betweengroups on the basis of the ROI SI values. The Fisher exact testand interobserver agreement were calculated for changes ofthe structures adjacent to Meckel’s cave, including hematoma,encephalomalacia, atrophy of muscles of mastication, cranial
nerve III, V, and VI enhancement, andvascular injury of the adjacent petrousand cavernous internal carotid artery,or cavernous-carotid fistula. A P value�.05 was considered significant.
RESULTSTwenty-six unique subjects were in-cluded in the post-rhizotomy group, 12with glycerol treatment and 14 receivingboth glycerol rhizotomy and radiofre-quency thermocoagulation rhizotomybefore imaging. Fifty-four subjects wereincluded in the trigeminal neuralgiaprocedure-naïve group. There were nostatistically significant differences in ageor sex between groups (Table 1).
Subjective nerve clumping or de-creased CISS SI was present in 17/26(65%) patients after rhizotomy, comparedwith only 3/54 (6%) treatment-naïve pa-tients (P � .001) (Table 2 and Fig 1). Ofthe 17 patients with changes in Meckel’s
cave after rhizotomy, 12/17 (71%) had a
0.5
0.6
0.7
0.8
0.9
1.0
1.1
1.2
1.3
1.4
1.5
C ontrol R ight Meckel's C ave/L eft Meckel's C ave
R hizotomy Meckel's C ave/Non-R hizotomy Meckel's C ave
Rat
io C
ISS
SI
FIG 2. Graph showing the ratio of CISS SI of the right and left Meckel’s caves in control patientsand rhizotomy/nonrhizotomy in Meckel’s caves in post-rhizotomy patients. The control groupratio was 0.99 compared with 0.87 for patients who underwent rhizotomy (P � .001).
Table 3: Ratio of CISS SI in treatment-naıve versus post-rhizotomy patients
Control RightMC/Left
MC (meanratio � SD)
Rhizotomy MC/Contralateral
MC (meanratio � SD) P Value
Ratio of CISS SI 0.99 (�0.09) 0.87 (�0.15) �.001
Note:—MC indicates Meckel cave.
1922 Northcutt Oct 2016 www.ajnr.org
combination of clumping and decreased overall subjective CISS sig-
nal intensity, 4/17 (24%) demonstrated only subjective clumping of
nerve rootlets, and 1/17 (5%) demonstrated only decreased subjec-
tive CISS signal intensity. All 3 treatment-naïve patients with subjec-
tive changes in Meckel’s cave demonstrated both clumping and de-
creased CISS signal. No nerve clumping or altered signal was noted in
Meckel’s cave on VIBE precontrast and postcontrast sequences or
FLAIR sequences, though clumping was identified in 2 patients after
rhizotomy on T2 SPACE sequences by both reviewers.
In the patients having undergone rhizotomy, objective mea-
surements of CISS SI by ROI in Meckel’s cave demonstrated a
statistically significant decrease in CISS SI on the side of the rhi-
zotomy compared with the contralateral side and with control
groups, with an average 13% decreased CISS SI on the side of the
rhizotomy (Table 3 and Fig 2). Encephalomalacia of the adjacent
temporal lobe was present in 8/26 (31%) patients post-rhizotomy
compared with 0/54 (0%) patients in the treatment-naïve group
(P � .001) (Fig 3). One small hematoma was present in the post-
rhizotomy group (4%), with no hematoma present in the treat-
ment-naïve group (P � .33). All cases of noted encephalomalacia
and hematoma on CISS were also identified on FLAIR, VIBE, and
T2 SPACE sequences by both reviewers. Atrophy of the muscles of
mastication was present in both groups, 3/26 (12%) in the rhizo-
tomy group and 3/54 (6%) in the treatment-naïve group (P �
.38). Cranial nerve enhancement (of CN III, V, and VI) was not
present in either group, nor was there damage to the adjacent
petrous or cavernous internal carotid arteries or evidence of cav-
ernous carotid fistula (P � 1) (Table 4).
The average time of imaging after the most recent rhizot-
omy was 17.2 months, with a range of 1– 63 months. The av-
erage time of follow-up of patients with nerve clumping or
decreased CISS signal was 16.5 months, compared with 18.4
months in those patients without clumping or CISS signal
change (P � .56). The average number of rhizotomy treat-
ments in patients with subjective clumping or decreased CISS
SI was 2.9, compared with 1.3 treatments for those who did not
have clumping or decreased CISS SI (P � .01). Seven of 12
(58%) patients who had undergone rhizotomy with only glyc-
erol treatment had subjective changes in Meckel’s cave, while
10/14 (63%) patients who had glycerol and radiofrequency
treatment had subjective changes (P � .68). All subjects in our
sample treated with radiofrequency rhizotomy had also under-
gone glycerol rhizotomy. The average number of rhizotomies
in those with encephalomalacia was 3.8, compared with 1.5 for
those without encephalomalacia (P � .03). Three of 12 (25%)
patients who had only glycerol treatment had encephalomala-
cia compared with 6/14 (42%) patients who had a combination
of glycerol and radiofrequency treatment (P � .43).
DISCUSSIONStudies to date on patients post-rhizotomy have primarily fo-cused on clinical outcomes, notably comparison of differentforms of rhizotomy with each other and with microvascular de-compression. While these articles offer occasional images of com-plications associated with rhizotomy, no studies to date, to theauthors’ knowledge, have evaluated patients after rhizotomy in aneffort to describe postprocedural findings on MR imaging. Thisstudy was performed to determine what findings can be encoun-tered on postprocedural MR imaging.
Subjective changes, such as decreased CISS SI and clumpingof nerve roots, are commonly encountered (65%) after rhizo-tomy; however, these changes are rarely seen in treatment-naïve patients (6%). These results suggest that the radiologicfindings are associated with the rhizotomy procedure ratherthan the underlying pathophysiology of trigeminal neuralgia.Objective measurements of signal intensity in Meckel’s cavesupport our subjective findings by showing a statistically sig-nificant decrease in CISS SI in Meckel’s cave after rhizotomy.The mechanism underlying these changes is presumed to bethe result of chemical- or heat-induced neurolysis of the nerverootlets in Meckel’s cave. Notably, the patients with changes inMeckel’s cave had undergone, on average, more rhizotomytreatments (n � 2.9) compared with those who did not havesuch changes (n � 1.3). Although the cause is unknown, sim-ilar changes demonstrated in procedure-naïve patients couldreflect a prior inflammatory event predating the developmentof trigeminal neuralgia. Conversely, there could be recall biasin our study, with the possibility that some subjects failed to
report their rhizotomy at another in-stitution to the clinician.
Small foci of encephalomalacia of thetemporal lobe adjacent to Meckel’s cavewere encountered in 31% of patients post-rhizotomy and not in the control group.One such focus demonstrated minimalblood products. These findings could bedue to the adjacent temporal lobe beingwithin the thermal zone of the radiofre-quency probe and/or direct surgical ma-
FIG 3. Coronal CISS precontrast at the level of Meckel’s caves. En-cephalomalacia of the medial left temporal lobe (straight arrow) ad-jacent to Meckel’s cave. Also note clumping of the nerve rootlets inthe left Meckel’s cave (curved arrow) status post rhizotomy.
Table 4: Frequency of findings in the adjacent structures in treatment-naıve versus post-rhizotomy patients
Post-Rhizotomy Treatment-Naıve P ValueInterobserver
Agreement �
Encephalomalacia 8/26 (31%) 0/54 (0%) �.001 98.8% 0.93Hematoma 1/26 (4%) 0/54 (0%) .33 100% 1Atrophy of muscles of
mastication3/26 (10%) 3/54 (4%) .38 96.3% 0.64
CN V enhancement 0/26 (0%) 0/54 (0%) 1.00 100% 1Vascular injury 0/26 (0%) 0/54 (0%) 1.00 100% 1
Note:—CN indicates cranial nerve.
AJNR Am J Neuroradiol 37:1920 –24 Oct 2016 www.ajnr.org 1923
nipulation.10,11 No adverse clinical signs or symptoms related to thetemporal lobe encephalomalacia were reported in these patients.
Weakness of muscles of mastication frequently occurs aftertrigeminal rhizotomy, with a recent review noting weakness in16% of patients, which is often transient lasting 6 –12 months.12
In our review, atrophy of the muscles of mastication was presentin patients with and without rhizotomy, with no statistically sig-nificant difference between groups. No enhancement of trigemi-nal nerve roots was encountered after treatment, though it is un-clear whether more immediate postprocedural imaging wouldperhaps reveal enhancement in the acute injury phase after treat-ment. Additional complications such as vascular injury (cavern-ous carotid fistula, internal carotid artery pseudoaneurysms), ab-scess, meningitis, and cranial nerve III and VI injury, noted inprevious publications, were not encountered clinically or on im-aging in our series.10-18
There were several limitations in this study, including the inher-ent biases associated with the retrospective study design. Subjectswere grouped according to a review of the medical record, dependingon whether the patient was documented as having previously under-gone rhizotomy. The patients were seen by experienced clinicians ina dedicated trigeminal neuralgia clinic, and documentation of priorprocedures is standard, but we cannot exclude the possibility thatsubjects had undergone rhizotomy at another institution and failedto report this to the clinician. All patients in our study who had rhi-zotomy underwent glycerol rhizotomy or glycerol in combinationwith radiofrequency thermocoagulation rhizotomy. No patients hadballoon compression rhizotomy, a method not used at our institu-tion due to the preference of the surgeons. Another limitation of thisretrospective study was lack of pre-rhizotomy imaging in those pa-tients who underwent rhizotomy, with the exception of 1 patient. Inthe case of the 1 patient who underwent high-resolution imagingboth before and after treatment, no difference was noted withinMeckel’s cave or the adjacent structures between studies. Addition-ally, no correlation between the degree of clumping or decreasedCISS SI in Meckel’s cave and the degree of symptoms could be madedue to the retrospective nature of the study and in the absence ofclinically reported grading of symptoms.
The timing of imaging after rhizotomy greatly varied, whichcould potentially influence the degree of changes seen in Meckel’scave, though the average time of imaging in those with and withoutnerve clumping was similar. Additionally, more acute changes withinMeckel’s cave after rhizotomy (�1 month) could not be accuratelyassessed. Last, the pain of trigeminal neuralgia is known to recurfrequently following rhizotomy. Many of the subjects imaged afterrhizotomy experienced recurrence of symptoms. Because patientswho responded positively to trigeminal rhizotomy are unlikely tohave undergone follow-up imaging, whether or to what extent thesefindings might correlate with degree or duration of therapeutic re-sponse remains a subject for further investigation.
CONCLUSIONSPost-trigeminal rhizotomy changes in patients with trigeminal neu-
ralgia frequently include nerve clumping and decreased CISS SI
within Meckel’s cave, findings that are not commonly encountered
in patients before treatment. Tiny foci of encephalomalacia can also
be seen in the adjacent temporal lobe. Further investigation is neces-
sary to determine whether and how such findings are related to the
extent and durability of pain relief following rhizotomy.
Disclosures: C. Rory Goodwin—UNRELATED: Grants/Grants Pending: UNCF MerckPostdoctoral Fellow,* Burroughs Wellcome Fund (award).* Ari M. Blitz—UNRELATED:Payment for Lectures (including service on Speakers Bureaus): Siemens, Comments:honorarium for an educational talk on imaging of the cranial nerves in 2014. MichaelLim—UNRELATED: Consultancy: Bristol-Myers Squibb, Stryker, Comments: research re-lated to my laboratory research in immunotherapy (BMS); Grants/Grants Pending:Stryker,* Bristol-Myers Squibb,* Aegenus,* Celldex,* Arbor,* ImmunoCellular Therapeu-tics,* Comments: grant for studying CSF leak rates in patients after MVD (Stryker), re-search pertaining to immunotherapy outside the scope of this article (others); Patents(planned, pending or issued): related to immunotherapy*; Travel/Accommodations/Meeting Expenses Unrelated to Activities Listed: for travel to consultant activities.*Money paid to the institution.
REFERENCES1. Prasad S, Galetta S. Trigeminal neuralgia: historical notes and cur-
rent concepts. Neurologist 2009;15:87–94 CrossRef Medline2. Penman J, Trigeminal neuralgia. In: Vinken PJ; Bruyn GW, eds. Handbook
of Clinical Neurology. Vol 5. Amsterdam: North Holland; 1968:296–3223. Katusic S, Beard CM, Bergstralh E, et al. Incidence and clinical fea-
tures of trigeminal neuralgia, Rochester, Minnesota, 1945–1984.Ann Neurol 1990;27:89 –95 CrossRef Medline
4. Rozen TD. Trigeminal neuralgia and glossopharyngeal neuralgia.Neurol Clin 2004;22:185–206 CrossRef Medline
5. Manzoni GC, Torelli P. Epidemiology of typical and atypical craniofacialneuralgias. Neurol Sci 2005;26(suppl 2):s65–s67 CrossRef Medline
6. Campbell FG, Graham JG, Zilkha KJ. Clinical trial of carbazepine(tegretol) in trigeminal neuralgia. J Neurol Neurosurg Psychiatry1966;29:265– 67 CrossRef Medline
7. Tatli M, Satici O, Kanpolat Y, et al. Various surgical modalities for trigem-inal neuralgia: literature study of respective long-term outcomes. ActaNeurochir (Wien) 2008;150:243–55 CrossRef Medline
8. Barker FG 2nd, Jannetta PJ, Bisonette DJ, et al. The long-term out-come of microvascular decompression for trigeminal neuralgia.N Engl J Med 1996;334:1077– 83 CrossRef Medline
9. Missios S, Mohammadi A, Barnett GH. Percutaneous treatments fortrigeminal neuralgia. Neurosurg Clin N Am 2014;25:751– 62CrossRef Medline
10. Arrese I, Lobato R, Alen JF, et al. Acute subdural and intratemporalhematoma as a complication of percutaneous compression of thegasserian ganglion for trigeminal neuralgia. Neurocirugia (Astur)2005;16:177– 82 Medline
11. Rath GP, Dash HH, Bithal PK, et al. Intracranial hemorrhage afterpercutaneous radiofrequency trigeminal rhizotomy. Pain Pract2009;9:82– 84 CrossRef Medline
12. Tew JM, Morgan CJ, Grande AW. Percutaneous stereotactic rhizotomy intreatmentofintractablefacialpain.In:Quinones-HinojosaA,ed.Schmidekand Sweet’s Operative Neurosurgical Techniques: Indications, Methods, andResults. 6th ed. Philadelphia: Elsevier Saunders; 2012
13. Taha JM, Tew JM Jr. Comparison of surgical treatments for trigem-inal neuralgia: reevaluation of radiofrequency rhizotomy. Neuro-surgery 1996;38:865–71 CrossRef Medline
14. SweetWH,PolettiCE,Roberts JT. Dangerous rises in blood pressure uponheating of trigeminal rootlets: increasing bleeding times in patients withtrigeminal neuralgia. Neurosurgery 1985;17:843–44 Medline
15. Sekhar LN, Heros RC, Kerber CW. Carotid-cavernous fistula fol-lowing percutaneous retrogasserian procedures: report of twocases. J Neurosurg 1979;51:700 – 06 CrossRef Medline
16. Gokalp HZ, Kanpolat Y, Tumer B. Carotid-cavernous fistula follow-ing percutaneous trigeminal ganglion approach. Clin Neurol Neu-rosurg 1980;82:269 –72 CrossRef Medline
17. Harrigan MR, Chandler WF. Abducens nerve palsy after radiofre-quency rhizolysis for trigeminal neuralgia: case report. Neurosur-gery 1998;43:623–25 Medline
18. Acqui M, Familiari P, Pesce A, et al. Brain abscess after percutaneoustherapy for trigeminal neuralgia. Case Rep Infect Dis 2015;2015:162793 CrossRef Medline
1924 Northcutt Oct 2016 www.ajnr.org
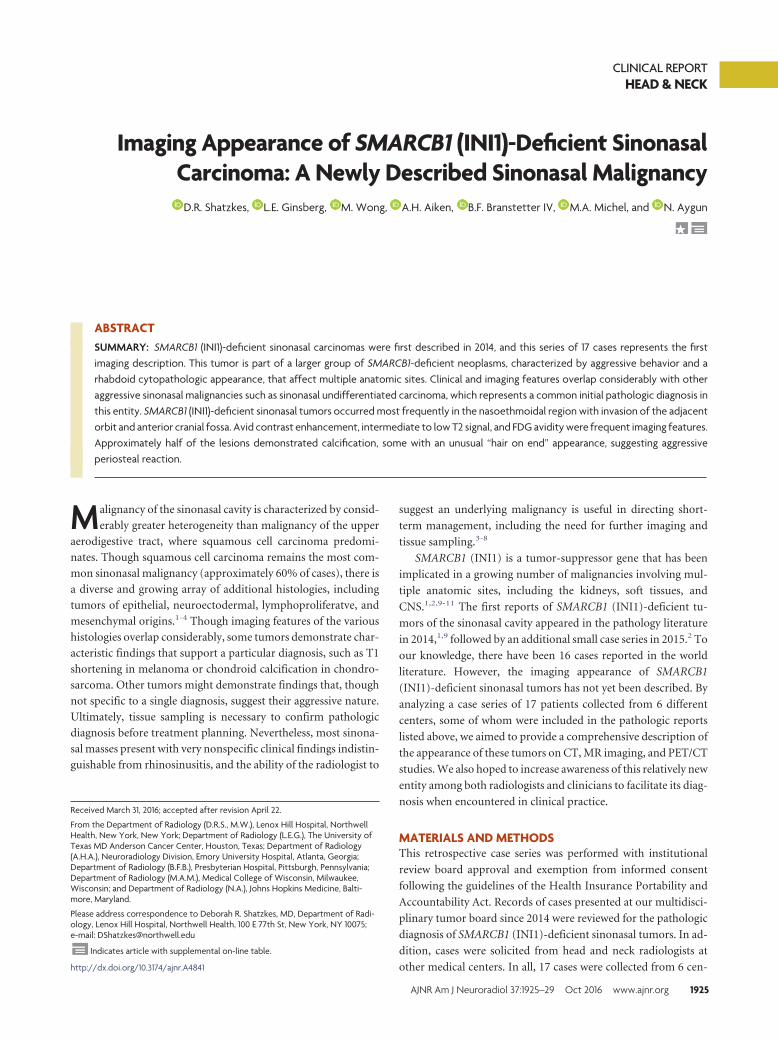
CLINICAL REPORTHEAD & NECK
Imaging Appearance of SMARCB1 (INI1)-Deficient SinonasalCarcinoma: A Newly Described Sinonasal Malignancy
X D.R. Shatzkes, X L.E. Ginsberg, X M. Wong, X A.H. Aiken, X B.F. Branstetter IV, X M.A. Michel, and X N. Aygun
ABSTRACTSUMMARY: SMARCB1 (INI1)-deficient sinonasal carcinomas were first described in 2014, and this series of 17 cases represents the firstimaging description. This tumor is part of a larger group of SMARCB1-deficient neoplasms, characterized by aggressive behavior and arhabdoid cytopathologic appearance, that affect multiple anatomic sites. Clinical and imaging features overlap considerably with otheraggressive sinonasal malignancies such as sinonasal undifferentiated carcinoma, which represents a common initial pathologic diagnosis inthis entity. SMARCB1 (INI1)-deficient sinonasal tumors occurred most frequently in the nasoethmoidal region with invasion of the adjacentorbit and anterior cranial fossa. Avid contrast enhancement, intermediate to low T2 signal, and FDG avidity were frequent imaging features.Approximately half of the lesions demonstrated calcification, some with an unusual “hair on end” appearance, suggesting aggressiveperiosteal reaction.
Malignancy of the sinonasal cavity is characterized by consid-
erably greater heterogeneity than malignancy of the upper
aerodigestive tract, where squamous cell carcinoma predomi-
nates. Though squamous cell carcinoma remains the most com-
mon sinonasal malignancy (approximately 60% of cases), there is
a diverse and growing array of additional histologies, including
tumors of epithelial, neuroectodermal, lymphoproliferatve, and
mesenchymal origins.1-4 Though imaging features of the various
histologies overlap considerably, some tumors demonstrate char-
acteristic findings that support a particular diagnosis, such as T1
shortening in melanoma or chondroid calcification in chondro-
sarcoma. Other tumors might demonstrate findings that, though
not specific to a single diagnosis, suggest their aggressive nature.
Ultimately, tissue sampling is necessary to confirm pathologic
diagnosis before treatment planning. Nevertheless, most sinona-
sal masses present with very nonspecific clinical findings indistin-
guishable from rhinosinusitis, and the ability of the radiologist to
suggest an underlying malignancy is useful in directing short-
term management, including the need for further imaging and
tissue sampling.3-8
SMARCB1 (INI1) is a tumor-suppressor gene that has been
implicated in a growing number of malignancies involving mul-
tiple anatomic sites, including the kidneys, soft tissues, and
CNS.1,2,9-11 The first reports of SMARCB1 (INI1)-deficient tu-
mors of the sinonasal cavity appeared in the pathology literature
in 2014,1,9 followed by an additional small case series in 2015.2 To
our knowledge, there have been 16 cases reported in the world
literature. However, the imaging appearance of SMARCB1
(INI1)-deficient sinonasal tumors has not yet been described. By
analyzing a case series of 17 patients collected from 6 different
centers, some of whom were included in the pathologic reports
listed above, we aimed to provide a comprehensive description of
the appearance of these tumors on CT, MR imaging, and PET/CT
studies. We also hoped to increase awareness of this relatively new
entity among both radiologists and clinicians to facilitate its diag-
nosis when encountered in clinical practice.
MATERIALS AND METHODSThis retrospective case series was performed with institutional
review board approval and exemption from informed consent
following the guidelines of the Health Insurance Portability and
Accountability Act. Records of cases presented at our multidisci-
plinary tumor board since 2014 were reviewed for the pathologic
diagnosis of SMARCB1 (INI1)-deficient sinonasal tumors. In ad-
dition, cases were solicited from head and neck radiologists at
other medical centers. In all, 17 cases were collected from 6 cen-
Received March 31, 2016; accepted after revision April 22.
From the Department of Radiology (D.R.S., M.W.), Lenox Hill Hospital, NorthwellHealth, New York, New York; Department of Radiology (L.E.G.), The University ofTexas MD Anderson Cancer Center, Houston, Texas; Department of Radiology(A.H.A.), Neuroradiology Division, Emory University Hospital, Atlanta, Georgia;Department of Radiology (B.F.B.), Presbyterian Hospital, Pittsburgh, Pennsylvania;Department of Radiology (M.A.M.), Medical College of Wisconsin, Milwaukee,Wisconsin; and Department of Radiology (N.A.), Johns Hopkins Medicine, Balti-more, Maryland.
Please address correspondence to Deborah R. Shatzkes, MD, Department of Radi-ology, Lenox Hill Hospital, Northwell Health, 100 E 77th St, New York, NY 10075;e-mail: [email protected]
Indicates article with supplemental on-line table.
http://dx.doi.org/10.3174/ajnr.A4841
AJNR Am J Neuroradiol 37:1925–29 Oct 2016 www.ajnr.org 1925
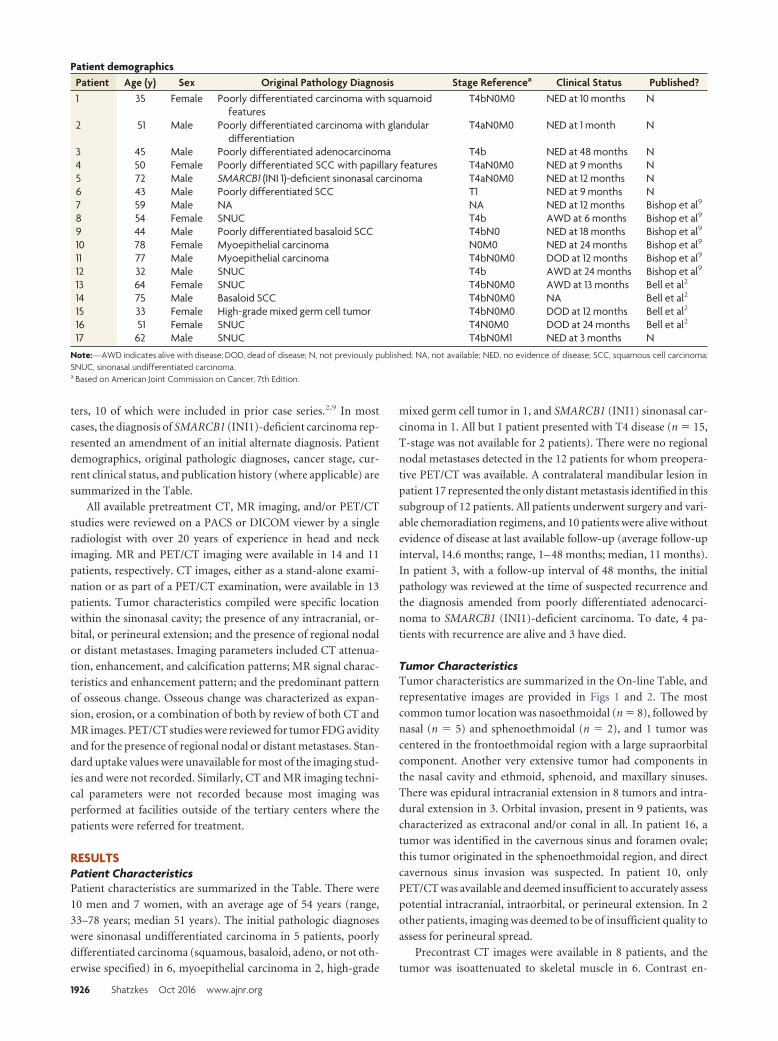
ters, 10 of which were included in prior case series.2,9 In most
cases, the diagnosis of SMARCB1 (INI1)-deficient carcinoma rep-
resented an amendment of an initial alternate diagnosis. Patient
demographics, original pathologic diagnoses, cancer stage, cur-
rent clinical status, and publication history (where applicable) are
summarized in the Table.
All available pretreatment CT, MR imaging, and/or PET/CT
studies were reviewed on a PACS or DICOM viewer by a single
radiologist with over 20 years of experience in head and neck
imaging. MR and PET/CT imaging were available in 14 and 11
patients, respectively. CT images, either as a stand-alone exami-
nation or as part of a PET/CT examination, were available in 13
patients. Tumor characteristics compiled were specific location
within the sinonasal cavity; the presence of any intracranial, or-
bital, or perineural extension; and the presence of regional nodal
or distant metastases. Imaging parameters included CT attenua-
tion, enhancement, and calcification patterns; MR signal charac-
teristics and enhancement pattern; and the predominant pattern
of osseous change. Osseous change was characterized as expan-
sion, erosion, or a combination of both by review of both CT and
MR images. PET/CT studies were reviewed for tumor FDG avidity
and for the presence of regional nodal or distant metastases. Stan-
dard uptake values were unavailable for most of the imaging stud-
ies and were not recorded. Similarly, CT and MR imaging techni-
cal parameters were not recorded because most imaging was
performed at facilities outside of the tertiary centers where the
patients were referred for treatment.
RESULTSPatient CharacteristicsPatient characteristics are summarized in the Table. There were
10 men and 7 women, with an average age of 54 years (range,
33–78 years; median 51 years). The initial pathologic diagnoses
were sinonasal undifferentiated carcinoma in 5 patients, poorly
differentiated carcinoma (squamous, basaloid, adeno, or not oth-
erwise specified) in 6, myoepithelial carcinoma in 2, high-grade
mixed germ cell tumor in 1, and SMARCB1 (INI1) sinonasal car-
cinoma in 1. All but 1 patient presented with T4 disease (n � 15,
T-stage was not available for 2 patients). There were no regional
nodal metastases detected in the 12 patients for whom preopera-
tive PET/CT was available. A contralateral mandibular lesion in
patient 17 represented the only distant metastasis identified in this
subgroup of 12 patients. All patients underwent surgery and vari-
able chemoradiation regimens, and 10 patients were alive without
evidence of disease at last available follow-up (average follow-up
interval, 14.6 months; range, 1– 48 months; median, 11 months).
In patient 3, with a follow-up interval of 48 months, the initial
pathology was reviewed at the time of suspected recurrence and
the diagnosis amended from poorly differentiated adenocarci-
noma to SMARCB1 (INI1)-deficient carcinoma. To date, 4 pa-
tients with recurrence are alive and 3 have died.
Tumor CharacteristicsTumor characteristics are summarized in the On-line Table, and
representative images are provided in Figs 1 and 2. The most
common tumor location was nasoethmoidal (n � 8), followed by
nasal (n � 5) and sphenoethmoidal (n � 2), and 1 tumor was
centered in the frontoethmoidal region with a large supraorbital
component. Another very extensive tumor had components in
the nasal cavity and ethmoid, sphenoid, and maxillary sinuses.
There was epidural intracranial extension in 8 tumors and intra-
dural extension in 3. Orbital invasion, present in 9 patients, was
characterized as extraconal and/or conal in all. In patient 16, a
tumor was identified in the cavernous sinus and foramen ovale;
this tumor originated in the sphenoethmoidal region, and direct
cavernous sinus invasion was suspected. In patient 10, only
PET/CT was available and deemed insufficient to accurately assess
potential intracranial, intraorbital, or perineural extension. In 2
other patients, imaging was deemed to be of insufficient quality to
assess for perineural spread.
Precontrast CT images were available in 8 patients, and the
tumor was isoattenuated to skeletal muscle in 6. Contrast en-
Patient demographicsPatient Age (y) Sex Original Pathology Diagnosis Stage Referencea Clinical Status Published?1 35 Female Poorly differentiated carcinoma with squamoid
featuresT4bN0M0 NED at 10 months N
2 51 Male Poorly differentiated carcinoma with glandulardifferentiation
T4aN0M0 NED at 1 month N
3 45 Male Poorly differentiated adenocarcinoma T4b NED at 48 months N4 50 Female Poorly differentiated SCC with papillary features T4aN0M0 NED at 9 months N5 72 Male SMARCB1 (INI 1)-deficient sinonasal carcinoma T4aN0M0 NED at 12 months N6 43 Male Poorly differentiated SCC T1 NED at 9 months N7 59 Male NA NA NED at 12 months Bishop et al9
8 54 Female SNUC T4b AWD at 6 months Bishop et al9
9 44 Male Poorly differentiated basaloid SCC T4bN0 NED at 18 months Bishop et al9
10 78 Female Myoepithelial carcinoma N0M0 NED at 24 months Bishop et al9
11 77 Male Myoepithelial carcinoma T4bN0M0 DOD at 12 months Bishop et al9
12 32 Male SNUC T4b AWD at 24 months Bishop et al9
13 64 Female SNUC T4bN0M0 AWD at 13 months Bell et al2
14 75 Male Basaloid SCC T4bN0M0 NA Bell et al2
15 33 Female High-grade mixed germ cell tumor T4bN0M0 DOD at 12 months Bell et al2
16 51 Female SNUC T4N0M0 DOD at 24 months Bell et al2
17 62 Male SNUC T4bN0M1 NED at 3 months N
Note:—AWD indicates alive with disease; DOD, dead of disease; N, not previously published; NA, not available; NED, no evidence of disease; SCC, squamous cell carcinoma;SNUC, sinonasal undifferentiated carcinoma.a Based on American Joint Commission on Cancer, 7th Edition.
1926 Shatzkes Oct 2016 www.ajnr.org
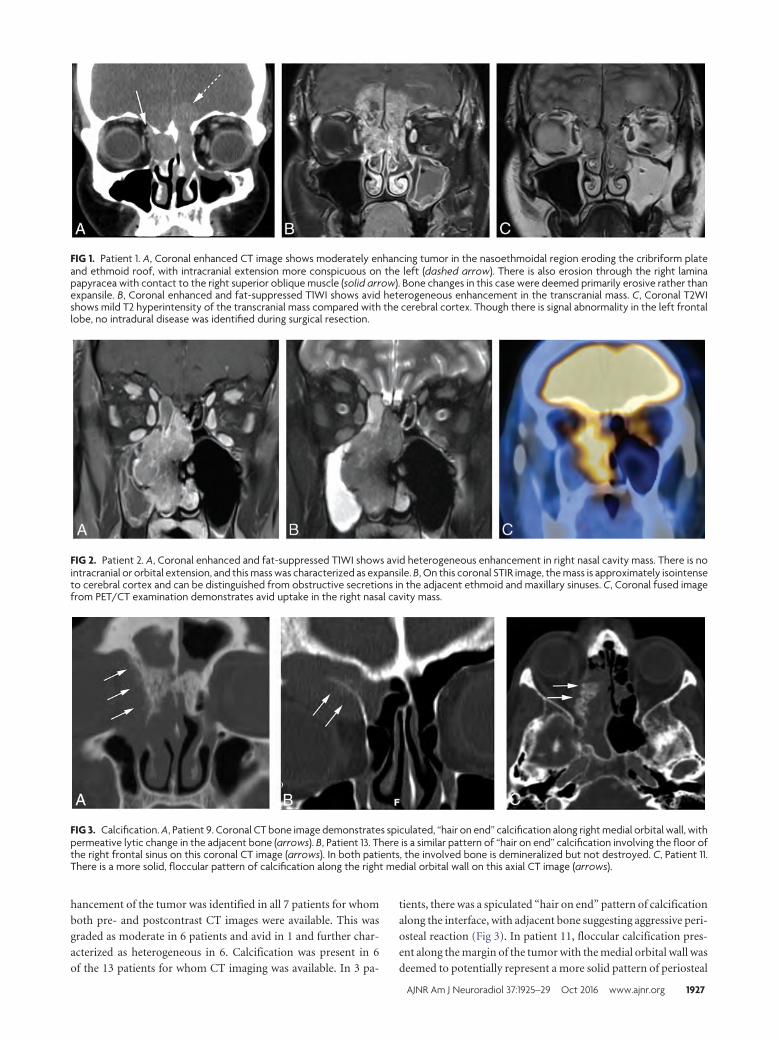
hancement of the tumor was identified in all 7 patients for whom
both pre- and postcontrast CT images were available. This was
graded as moderate in 6 patients and avid in 1 and further char-
acterized as heterogeneous in 6. Calcification was present in 6
of the 13 patients for whom CT imaging was available. In 3 pa-
tients, there was a spiculated “hair on end” pattern of calcification
along the interface, with adjacent bone suggesting aggressive peri-
osteal reaction (Fig 3). In patient 11, floccular calcification pres-
ent along the margin of the tumor with the medial orbital wall was
deemed to potentially represent a more solid pattern of periosteal
FIG 1. Patient 1. A, Coronal enhanced CT image shows moderately enhancing tumor in the nasoethmoidal region eroding the cribriform plateand ethmoid roof, with intracranial extension more conspicuous on the left (dashed arrow). There is also erosion through the right laminapapyracea with contact to the right superior oblique muscle (solid arrow). Bone changes in this case were deemed primarily erosive rather thanexpansile. B, Coronal enhanced and fat-suppressed T1WI shows avid heterogeneous enhancement in the transcranial mass. C, Coronal T2WIshows mild T2 hyperintensity of the transcranial mass compared with the cerebral cortex. Though there is signal abnormality in the left frontallobe, no intradural disease was identified during surgical resection.
FIG 2. Patient 2. A, Coronal enhanced and fat-suppressed T1WI shows avid heterogeneous enhancement in right nasal cavity mass. There is nointracranial or orbital extension, and this mass was characterized as expansile. B, On this coronal STIR image, the mass is approximately isointenseto cerebral cortex and can be distinguished from obstructive secretions in the adjacent ethmoid and maxillary sinuses. C, Coronal fused imagefrom PET/CT examination demonstrates avid uptake in the right nasal cavity mass.
FIG 3. Calcification. A, Patient 9. Coronal CT bone image demonstrates spiculated, “hair on end” calcification along right medial orbital wall, withpermeative lytic change in the adjacent bone (arrows). B, Patient 13. There is a similar pattern of “hair on end” calcification involving the floor ofthe right frontal sinus on this coronal CT image (arrows). In both patients, the involved bone is demineralized but not destroyed. C, Patient 11.There is a more solid, floccular pattern of calcification along the right medial orbital wall on this axial CT image (arrows).
AJNR Am J Neuroradiol 37:1925–29 Oct 2016 www.ajnr.org 1927
reaction. In 2 patients, stippled and curvilinear calcifications were
present within the tumor, thought to likely represent retained
bone fragments within a background of bone destruction. The
impact on adjacent bony structures was assessed on both CT and
MR imaging. Bone changes were classified as predominantly ero-
sive in 9 patients, expansile in 5, and a combination of expansile
and erosive in 3.
The tumor was isointense to cortex in 11 of the 14 patients for
whom precontrast T1WI was available. In the remaining 3 pa-
tients, the tumor was graded as mildly hypointense. The tumor
was variably mildly hypointense (n � 4), isointense (n � 4), mod-
erately hyperintense (n � 3), and mildly hyperintense (n � 3) to
cortex on T2WI. Enhancement was graded as avid in 11 of the 14
patients for whom postcontrast MR imaging was available, with
the remaining tumors demonstrating moderate enhancement.
Enhancement was additionally characterized as heterogeneous
(n � 7) and homogeneous (n � 7). DWI was available for 9
patients. Most lesions (n � 7) showed moderate diffusion
restriction.
FDG uptake was demonstrated in all 12 patients who under-
went PET/CT scanning. Radiotracer uptake was graded as avid in
9 patients and moderate in 3.
DISCUSSIONSMARCB1 is a tumor-suppressor gene located on chromosome
22q11.2.1,2,9,10 Deficiency of SMARCB1 (INI1) was first impli-
cated in malignant rhabdoid tumors of infancy, followed by rh-
abdoid tumor of the CNS, kidney, and soft tissue.1,2,9,10 This list
has since grown to include a diverse group of neoplasms in mul-
tiple anatomic sites, all of which are characterized by a rhabdoid
appearance on cytopathologic examination and generally aggres-
sive behavior.1,2,9,10 The first descriptions of SMARCB1 (INI1)-
deficient neoplasms of the sinonasal tract were published simul-
taneously in the pathology literature by 2 separate groups in
September 2014.1,9 A third case series, completing a total of 16
reported cases, was published in September 2015.2 Our series,
with an additional 7 cases, represents the fourth report and the
first detailed imaging description of this entity.
It is difficult to estimate the prevalence of this disease because
most cases were initially diagnosed as other high-grade malignant
tumors, most commonly sinonasal undifferentiated carcinoma
and other poorly differentiated carcinomas often qualified as hav-
ing rhabdoid or basaloid features. In their review of their own
cases and those previously reported, Bell et al2 found that
SMARCB1 (INI1)-deficient sinonasal carcinomas represented
3.3% of a combined series of 484 sinonasal primary tumors. How-
ever, Bishop et al9 noted that SMARCB1 (INI1)-deficient sinona-
sal carcinomas represented 14% of previously diagnosed sinona-
sal undifferentiated carcinomas.9 More accurate estimates will
likely be available once the diagnosis is more widely known in the
head and neck oncologic community.
There are few sinonasal tumors with highly characteristic or
pathognomonic imaging or clinical features, and this tumor is no
exception. With regard to patient demographics, the wide age
range and median age of 51 years overlap with virtually all sino-
nasal malignancies except those found in pediatric age groups,
such as juvenile nasopharyngeal angiofibroma and rhabdomyo-
sarcoma. A clear predilection for late-stage presentation was iden-
tified in our series, with only 1 patient staged below T4. However,
this is the case in most aggressive sinonasal malignancies.6,8,12,13
We found a predilection for central structures, with 13 of 17 tu-
mors described as nasal or nasoethmoidal in origin, with frequent
invasion into the adjacent orbital and intracranial compartments.
Other sinonasal malignancies such as sinonasal undifferentiated
carcinoma, esthesioneuroblastoma, lymphoma, and melanoma
arise most frequently in the superior nasal cavity with similar
patterns of invasion. The tendency toward avid enhancement,
intermediate T2 signal intensity, moderate diffusion restriction,
and FDG avidity demonstrated in our series is characteristic for
sinonasal undifferentiated carcinoma and squamous cell carci-
noma, which, though occurring most commonly in the paranasal
sinuses (75%), must still be considered when nasal cavity masses
are identified because of the high relative prevalence of this diag-
nosis.1-4,7,12 CT imaging demonstrated associated calcification in
close to half of the tumors (6 of 13), though no tumor calcification
was reported on histopathologic analysis. In considering this dis-
crepancy, we felt that calcification might reflect retained bone
fragments in 2 patients and an aggressive periosteal reaction in 4.
Nevertheless, our observed frequency of calcification on CT ex-
ceeds that reported in the literature, and the perpendicular “hair
on end” appearance suggesting aggressive periosteal reaction is a
particularly unusual feature.5,7,12,14 A more accurate estimation
of the incidence of this and other imaging features, and of their
potential utility as indicators of this disease, will require a larger
sample size.
LimitationsIn addition to the small sample size, other substantial limitations
are related to the pooling of data from multiple centers. Much of
the imaging reviewed was performed outside of these tertiary re-
ferral centers, and both imaging protocols and quality varied
widely. Technical specifications of scanners and specifics of pulse
sequence parameters were generally unavailable and were not
compiled. There were similar limitations on the availability of
clinical information, and length of follow-up was necessarily lim-
ited because of the short interval after initial description of the
entity. There are few prospectively acquired data regarding imag-
ing appearance of sinonasal malignancies, and available informa-
tion is largely limited to relatively small case series such as ours.
Therefore, comparisons with other sinonasal malignancies are
fraught with similar limitations of small sample size and hetero-
geneous data.
CONCLUSIONSThe recently described entity of SMARCB1 (INI1)-deficient sino-
nasal carcinoma should be included in the differential diagnosis of
a central sinonasal mass demonstrating aggressive imaging fea-
tures, particularly when there is associated calcification. Overlap
in clinical and imaging features of SMARCB1 (INI1)-deficient
carcinoma with other sinonasal malignancies, such as sinonasal
undifferentiated carcinoma, underscores the challenges currently
faced in diagnosis of these entities. The presence of rhabdoid fea-
tures on cytopathologic examination will help alert pathologists
and clinicians to the possibility of this diagnosis so confirmation
1928 Shatzkes Oct 2016 www.ajnr.org
can be achieved using appropriate testing. As the diagnosis be-
comes more widely known, we anticipate the opportunity for
larger series and more accurate assessment of clinical and imaging
features of this disease.
ACKNOWLEDGMENTSThe authors gratefully acknowledge contribution of case material
from Drs. Justin A. Bishop and John M. DelGaudio.
Disclosures: Michelle A. Michel—UNRELATED: Payment for Lectures (including ser-vice on speakers bureaus): iiCME, Comments: lectured at a continuing medical ed-ucation course in January 2016 and received honoraria; Royalties: Elsevier, Com-ments: received a royalty check for prior contributions to Diagnostic Imagingtextbooks; Stock/Stock Options: Fidelity, Transamerica, Comments: personal in-vestments only.
REFERENCES1. Agaimy A, Koch M, Lell M, et al. SMARCB1(INI1)-deficient sinona-
sal basaloid carcinoma: a novel member of the expanding family ofSMARCB1-deficient neoplasms. Am J Surg Pathol 2014;38:1274 – 81CrossRef Medline
2. Bell D, Hanna EY, Agaimy, et al. Reappraisal of sinonasal undif-ferentiated carcinoma: SMARCB1 (INI1)-deficient sinonasalcarcinoma: a single-institution experience. Virchows Arch 2015;467:649 –56 CrossRef Medline
3. Eggesbø HB. Imaging of sinonasal tumours. Cancer Imaging 2012;12:136 –52 CrossRef
4. Sen S, Chandra A, Mukhopadhyay S, et al. Sinonasal tumors: com-puted tomography and MR imaging features. Neuroimaging Clin NAm 2015;25:595– 618 CrossRef Medline
5. Loevner LA, Sonners AI. Imaging of neoplasms of the paranasalsinuses. Neuroimaging Clin N Am 2004;14:625– 46 CrossRef Medline
6. Lund VJ, Stammberger H, Nicolai P, et al. European position paperon endoscopic management of tumours of the nose, paranasal si-nuses and skull base. Rhinol Suppl 2010;22:1–143 Medline
7. Phillips CD, Futterer SF, Lipper MH, et al. Sinonasal undifferenti-ated carcinoma: CT and MR imaging of an uncommon neoplasm ofthe nasal cavity. Radiology 1997;202:477– 80 CrossRef Medline
8. Sen S, Chandra A, Mukhopadhyay S, et al. Imaging approach to si-nonasal neoplasms. Neuroimaging Clin N Am 2015;25:577–93CrossRef Medline
9. Bishop JA, Antonescu CR, Westra WH. SMARCB1 (INI-1)-deficientcarcinomas of the sinonasal tract. Am J Surg Pathol 2014;38:1282– 89CrossRef Medline
10. Bishop JA. Newly described tumor entities in sinonasal tract pathol-ogy. Head Neck Pathol 2016;10:23–31 CrossRef Medline
11. Kalimuthu SN, Chetty R. Gene of the month: SMARCB1. J ClinPathol 2016;69:484 – 89 CrossRef Medline
12. Sivalingam J, Sarawagi R, Raghuwanshi S, et al. Sinonasal neoplasia:clinicopathological profile and importance of computed tomogra-phy. J Clin Diagn Res 2015;9:TC01– 4 CrossRef Medline
13. Xu CC, Dziegielewski PT, McGaw WT, et al. Sinonasal undifferenti-ated carcinoma (SNUC): the Alberta experience and literature re-view. J Otolaryngol Head Neck Surg 2013;42:2 CrossRef Medline
14. Rana RS, Wu JS, Eisenberg RL. Periosteal reaction. AJR Am J Roent-genol 2009;193:W259 –72 CrossRef Medline
AJNR Am J Neuroradiol 37:1925–29 Oct 2016 www.ajnr.org 1929
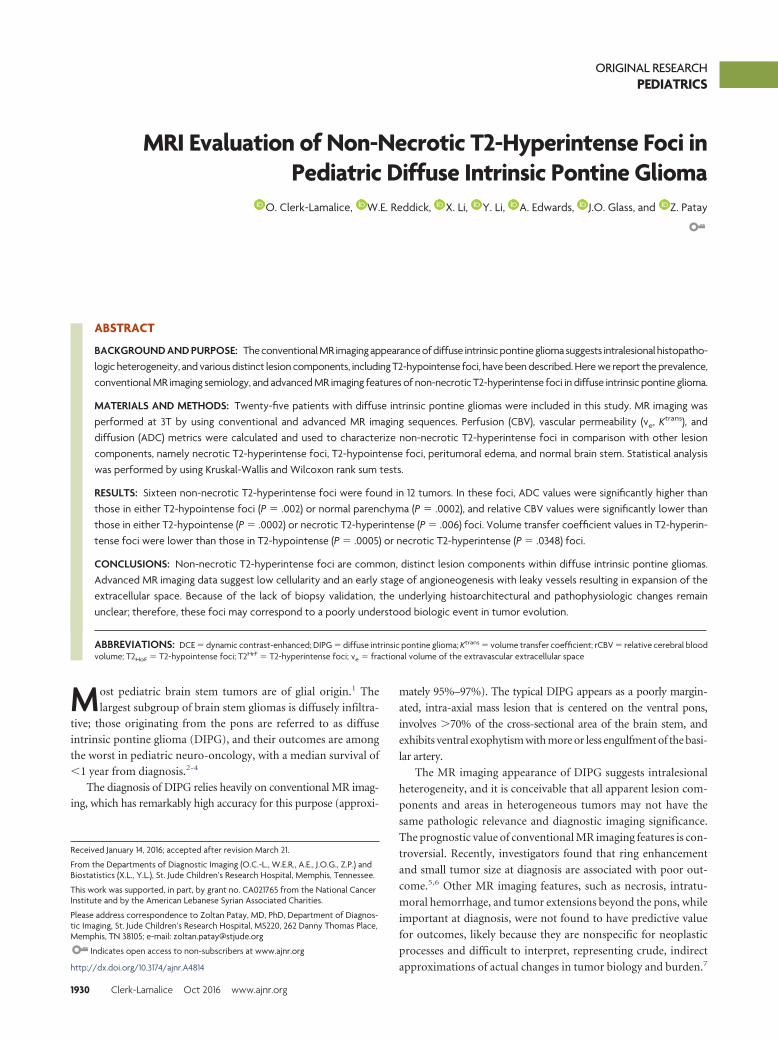
ORIGINAL RESEARCHPEDIATRICS
MRI Evaluation of Non-Necrotic T2-Hyperintense Foci inPediatric Diffuse Intrinsic Pontine Glioma
X O. Clerk-Lamalice, X W.E. Reddick, X X. Li, X Y. Li, X A. Edwards, X J.O. Glass, and X Z. Patay
ABSTRACT
BACKGROUND AND PURPOSE: The conventional MR imaging appearance of diffuse intrinsic pontine glioma suggests intralesional histopatho-logic heterogeneity, and various distinct lesion components, including T2-hypointense foci, have been described. Here we report the prevalence,conventional MR imaging semiology, and advanced MR imaging features of non-necrotic T2-hyperintense foci in diffuse intrinsic pontine glioma.
MATERIALS AND METHODS: Twenty-five patients with diffuse intrinsic pontine gliomas were included in this study. MR imaging wasperformed at 3T by using conventional and advanced MR imaging sequences. Perfusion (CBV), vascular permeability (ve, Ktrans), anddiffusion (ADC) metrics were calculated and used to characterize non-necrotic T2-hyperintense foci in comparison with other lesioncomponents, namely necrotic T2-hyperintense foci, T2-hypointense foci, peritumoral edema, and normal brain stem. Statistical analysiswas performed by using Kruskal-Wallis and Wilcoxon rank sum tests.
RESULTS: Sixteen non-necrotic T2-hyperintense foci were found in 12 tumors. In these foci, ADC values were significantly higher thanthose in either T2-hypointense foci (P � .002) or normal parenchyma (P � .0002), and relative CBV values were significantly lower thanthose in either T2-hypointense (P � .0002) or necrotic T2-hyperintense (P � .006) foci. Volume transfer coefficient values in T2-hyperin-tense foci were lower than those in T2-hypointense (P � .0005) or necrotic T2-hyperintense (P � .0348) foci.
CONCLUSIONS: Non-necrotic T2-hyperintense foci are common, distinct lesion components within diffuse intrinsic pontine gliomas.Advanced MR imaging data suggest low cellularity and an early stage of angioneogenesis with leaky vessels resulting in expansion of theextracellular space. Because of the lack of biopsy validation, the underlying histoarchitectural and pathophysiologic changes remainunclear; therefore, these foci may correspond to a poorly understood biologic event in tumor evolution.
ABBREVIATIONS: DCE � dynamic contrast-enhanced; DIPG � diffuse intrinsic pontine glioma; Ktrans � volume transfer coefficient; rCBV � relative cerebral bloodvolume; T2HoF � T2-hypointense foci; T2HrF � T2-hyperintense foci; ve � fractional volume of the extravascular extracellular space
Most pediatric brain stem tumors are of glial origin.1 The
largest subgroup of brain stem gliomas is diffusely infiltra-
tive; those originating from the pons are referred to as diffuse
intrinsic pontine glioma (DIPG), and their outcomes are among
the worst in pediatric neuro-oncology, with a median survival of
�1 year from diagnosis.2-4
The diagnosis of DIPG relies heavily on conventional MR imag-
ing, which has remarkably high accuracy for this purpose (approxi-
mately 95%–97%). The typical DIPG appears as a poorly margin-
ated, intra-axial mass lesion that is centered on the ventral pons,
involves �70% of the cross-sectional area of the brain stem, and
exhibits ventral exophytism with more or less engulfment of the basi-
lar artery.
The MR imaging appearance of DIPG suggests intralesional
heterogeneity, and it is conceivable that all apparent lesion com-
ponents and areas in heterogeneous tumors may not have the
same pathologic relevance and diagnostic imaging significance.
The prognostic value of conventional MR imaging features is con-
troversial. Recently, investigators found that ring enhancement
and small tumor size at diagnosis are associated with poor out-
come.5,6 Other MR imaging features, such as necrosis, intratu-
moral hemorrhage, and tumor extensions beyond the pons, while
important at diagnosis, were not found to have predictive value
for outcomes, likely because they are nonspecific for neoplastic
processes and difficult to interpret, representing crude, indirect
approximations of actual changes in tumor biology and burden.7
Received January 14, 2016; accepted after revision March 21.
From the Departments of Diagnostic Imaging (O.C.-L., W.E.R., A.E., J.O.G., Z.P.) andBiostatistics (X.L., Y.L.), St. Jude Children’s Research Hospital, Memphis, Tennessee.
This work was supported, in part, by grant no. CA021765 from the National CancerInstitute and by the American Lebanese Syrian Associated Charities.
Please address correspondence to Zoltan Patay, MD, PhD, Department of Diagnos-tic Imaging, St. Jude Children’s Research Hospital, MS220, 262 Danny Thomas Place,Memphis, TN 38105; e-mail: [email protected]
Indicates open access to non-subscribers at www.ajnr.org
http://dx.doi.org/10.3174/ajnr.A4814
1930 Clerk-Lamalice Oct 2016 www.ajnr.org
Alternatively, advanced imaging characterization of distinct le-
sion components (“building blocks”) with potentially distinct
histopathologic and/or pathophysiologic interpretation may be
more valuable, allowing a more direct and selective modular ap-
proach to the imaging evaluation of DIPG.
Several distinct lesion components or MR imaging features
reflecting different forms or types of lesion heterogeneity in DIPG
and other tumors, such as cysts, necrosis, and edema, have been
described.7 Furthermore, intratumoral T2-hypointense foci
(T2HoF) characterized by low ADC and high CBV values have
been reported in 11.6% of patients and have been putatively at-
tributed to foci of anaplasia.8 Also, a peculiar form of postcontrast
T1 signal enhancement (“occult enhancement”) has been de-
scribed in subtraction postcontrast T1-weighted images and was
found to be associated with increased CBV9; hence, this type of
enhancement is thought to correspond to the MR imaging sub-
strate of intratumoral angioneogenesis.
A systematic review of a cohort of pediatric patients enrolled in
a clinical trial for the treatment of DIPG led us to recognize a
previously unreported lesion component in DIPG: solitary or
multiple, relatively well-defined, intratumoral, non-necrotic T2-
hyperintense foci (T2HrF) that are typically associated with local
mass effect. We, therefore, set out to evaluate and describe the
prevalence, conventional MR imaging semiology, and advanced
MR imaging features of non-necrotic T2HrF in DIPG in compar-
ison with those of T2HoF, necrotic T2HrF, peritumoral edema, and
normal brain stem.
MATERIALS AND METHODSPatientsWe reviewed and analyzed the baseline conventional and ad-
vanced MR imaging data of patients with newly diagnosed DIPG
who were enrolled in an institutional review board–approved
prospective phase I clinical trial (PDGFR [platelet-derived growth
factor receptor] Inhibitor Crenolanib in Children/Young Adults
With Diffuse Intrinsic Pontine Glioma or Recurrent High-Grade
Glioma [SJPDGF]) in our institution between July 2011 and De-
cember 2013. The primary objective of that clinical trial was to
evaluate the toxicity of crenolanib, an inhibitor of platelet-derived
growth factor receptor– kinase, in children and young adults with
newly diagnosed DIPG (or recurrent, progressive, or refractory
high-grade gliomas, including DIPG). Consent was obtained
from patients or legal representatives before enrollment. The full
description of the SJPDGF trial protocol is available on-line
(http://clinicaltrials.gov/ct2/show/NCT01393912).
Twenty-eight patients with newly diagnosed DIPG were ini-
tially enrolled in the SJPDGF study; however, after reviewing the
available images, advanced MR imaging datasets, and the partic-
ipants’ medical records, we excluded 3 patients from the current
study. Two patients were excluded because the MR imaging fea-
tures and clinical evolution were uncharacteristic of DIPG and, in
retrospect, more suggestive of a lower grade astrocytoma (ie, the
patient was still alive 3 years after the initial diagnosis; tumor
regressed and was stable after treatment). One other patient was
excluded because of a very hemorrhagic tumor, which led to sub-
optimal DSC perfusion MR imaging datasets. Thus, 25 patients
were included in the current study (14 females and 11 males;
mean age, 6.94 years; age range, 2.08 –17 years). No biopsies were
performed; therefore, no histopathologic data were available for
any of these patients at enrollment.
Normative MR Imaging Data of the PonsTo establish normative diffusion and DSC perfusion values for
the pons in children, we used advanced MR imaging data from an
age-matched (mean age, 5.23 years; age range, 2–12 years) cohort
of patients (n � 17) who had MR imaging studies for supraten-
torial CNS malignancies (5 pineoblastomas, 1 ependymoma, 1
astrocytoma, 1 anaplastic ganglioma, 1 choroid plexus carcinoma,
1 high-grade glioma, 3 primitive neuroectodermal tumors, and 4
atypical teratoid/rhabdoid tumors) at the time of initial diagnosis
and who had no visible structural abnormalities in the posterior
fossa. Conventional MR images were screened for any visible ab-
normality before analysis of advanced MR imaging data, and find-
ings were unremarkable. The small SD of the ADC and CBV values in
this cohort suggests homogeneity of the normative dataset.
Conventional MR Imaging and IV Contrast InjectionWhile patients were under sedation or general anesthesia, all MR
imaging studies were performed on 3T scanners (Magnetom Trio or
Skyra; Siemens, Erlangen, Germany) by using 32-channel (Trio) or
20-channel (Skyra) phased array head coils. The standard conven-
tional MR imaging protocol included axial T2-weighted turbo spin-
echo (TR/TE � 3800/83 ms), pre- and postcontrast axial T1-
weighted gradient-echo (TR/TE � 236/2.31 ms), and postcontrast
FLAIR (TR/TE � 10,000/108 ms; TI � 2600 ms) sequences with a
section thickness of 4 mm. Axial susceptibility-weighted images (TR/
TE � 56/25 ms) had a section thickness of 2 mm. A total of 0.2 mL/kg
(0.1 mmol/kg) of gadopentetate dimeglumine (Magnevist; Bayer
HealthCare Pharmaceuticals, Wayne, New Jersey) was administered
in all patients in 2 equally divided doses for the dynamic contrast-
enhanced (DCE) and DSC perfusion MR imaging studies (see
below) before performing the postcontrast T1-weighted imaging
sequences. In all cases and for all contrast-enhanced sequences,
Gd-DTPA was injected intravenously at a rate of 2 mL/s through
a 22-ga IV catheter by using an infusion pump synchronized with
the MR imaging scanner. A saline flush of 20 mL, also adminis-
tered at a rate of 2 mL/s, followed each Gd-DTPA injection.
Advanced MR Imaging
DCE-MR Imaging. First, 3 series of 3D gradient-echo images were
collected to calculate T1 maps in the brain parenchyma (TR/TE �
5.3/3.2 ms; flip angle � 2°, 10°, and 20°). Subsequently, a total of
50 dynamic series of 16 images covering the brain stem and pos-
terior fossa were acquired by using a 3D gradient-echo sequence
with parallel imaging (TR/TE � 5/3.2 ms, generalized autocali-
brating partially parallel acquisition accelerating factor R � 2, 24
reference lines, average � 1, flip angle � 15°, 16 sections, section
thickness � 4 mm [no gap], matrix size � 128 � 128, in-plane
resolution � 1.8 � 1.8 mm, temporal sampling � 6.84 seconds).
The IV injection of Gd-DTPA (0.1 mL/kg) started 20 seconds after
the initiation of the DCE sequence.
DSC-MR Imaging. The first dose of Gd-DTPA used for the
DCE-MR imaging study served as preloading to allow leakage
correction.10-12 DSC–MR imaging data were obtained after a sec-
AJNR Am J Neuroradiol 37:1930 –37 Oct 2016 www.ajnr.org 1931
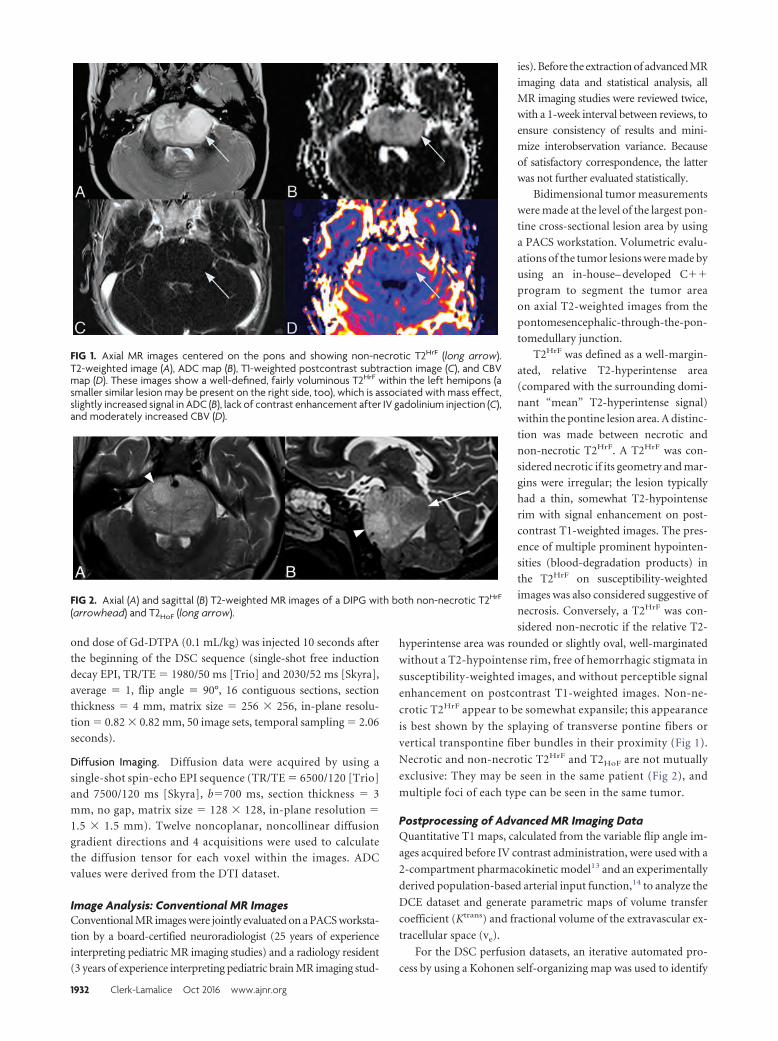
ond dose of Gd-DTPA (0.1 mL/kg) was injected 10 seconds after
the beginning of the DSC sequence (single-shot free induction
decay EPI, TR/TE � 1980/50 ms [Trio] and 2030/52 ms [Skyra],
average � 1, flip angle � 90°, 16 contiguous sections, section
thickness � 4 mm, matrix size � 256 � 256, in-plane resolu-
tion � 0.82 � 0.82 mm, 50 image sets, temporal sampling � 2.06
seconds).
Diffusion Imaging. Diffusion data were acquired by using a
single-shot spin-echo EPI sequence (TR/TE � 6500/120 [Trio]
and 7500/120 ms [Skyra], b�700 ms, section thickness � 3
mm, no gap, matrix size � 128 � 128, in-plane resolution �
1.5 � 1.5 mm). Twelve noncoplanar, noncollinear diffusion
gradient directions and 4 acquisitions were used to calculate
the diffusion tensor for each voxel within the images. ADC
values were derived from the DTI dataset.
Image Analysis: Conventional MR ImagesConventional MR images were jointly evaluated on a PACS worksta-
tion by a board-certified neuroradiologist (25 years of experience
interpreting pediatric MR imaging studies) and a radiology resident
(3 years of experience interpreting pediatric brain MR imaging stud-
ies). Before the extraction of advanced MR
imaging data and statistical analysis, all
MR imaging studies were reviewed twice,
with a 1-week interval between reviews, to
ensure consistency of results and mini-
mize interobservation variance. Because
of satisfactory correspondence, the latter
was not further evaluated statistically.
Bidimensional tumor measurements
were made at the level of the largest pon-
tine cross-sectional lesion area by using
a PACS workstation. Volumetric evalu-
ations of the tumor lesions were made by
using an in-house– developed C��
program to segment the tumor area
on axial T2-weighted images from the
pontomesencephalic-through-the-pon-
tomedullary junction.
T2HrF was defined as a well-margin-
ated, relative T2-hyperintense area
(compared with the surrounding domi-
nant “mean” T2-hyperintense signal)
within the pontine lesion area. A distinc-
tion was made between necrotic and
non-necrotic T2HrF. A T2HrF was con-
sidered necrotic if its geometry and mar-
gins were irregular; the lesion typically
had a thin, somewhat T2-hypointense
rim with signal enhancement on post-
contrast T1-weighted images. The pres-
ence of multiple prominent hypointen-
sities (blood-degradation products) in
the T2HrF on susceptibility-weighted
images was also considered suggestive of
necrosis. Conversely, a T2HrF was con-
sidered non-necrotic if the relative T2-
hyperintense area was rounded or slightly oval, well-marginated
without a T2-hypointense rim, free of hemorrhagic stigmata in
susceptibility-weighted images, and without perceptible signal
enhancement on postcontrast T1-weighted images. Non-ne-
crotic T2HrF appear to be somewhat expansile; this appearance
is best shown by the splaying of transverse pontine fibers or
vertical transpontine fiber bundles in their proximity (Fig 1).
Necrotic and non-necrotic T2HrF and T2HoF are not mutually
exclusive: They may be seen in the same patient (Fig 2), and
multiple foci of each type can be seen in the same tumor.
Postprocessing of Advanced MR Imaging DataQuantitative T1 maps, calculated from the variable flip angle im-
ages acquired before IV contrast administration, were used with a
2-compartment pharmacokinetic model13 and an experimentally
derived population-based arterial input function,14 to analyze the
DCE dataset and generate parametric maps of volume transfer
coefficient (Ktrans) and fractional volume of the extravascular ex-
tracellular space (ve).
For the DSC perfusion datasets, an iterative automated pro-
cess by using a Kohonen self-organizing map was used to identify
FIG 1. Axial MR images centered on the pons and showing non-necrotic T2HrF (long arrow).T2-weighted image (A), ADC map (B), T1-weighted postcontrast subtraction image (C), and CBVmap (D). These images show a well-defined, fairly voluminous T2HrF within the left hemipons (asmaller similar lesion may be present on the right side, too), which is associated with mass effect,slightly increased signal in ADC (B), lack of contrast enhancement after IV gadolinium injection (C),and moderately increased CBV (D).
FIG 2. Axial (A) and sagittal (B) T2-weighted MR images of a DIPG with both non-necrotic T2HrF
(arrowhead) and T2HoF (long arrow).
1932 Clerk-Lamalice Oct 2016 www.ajnr.org
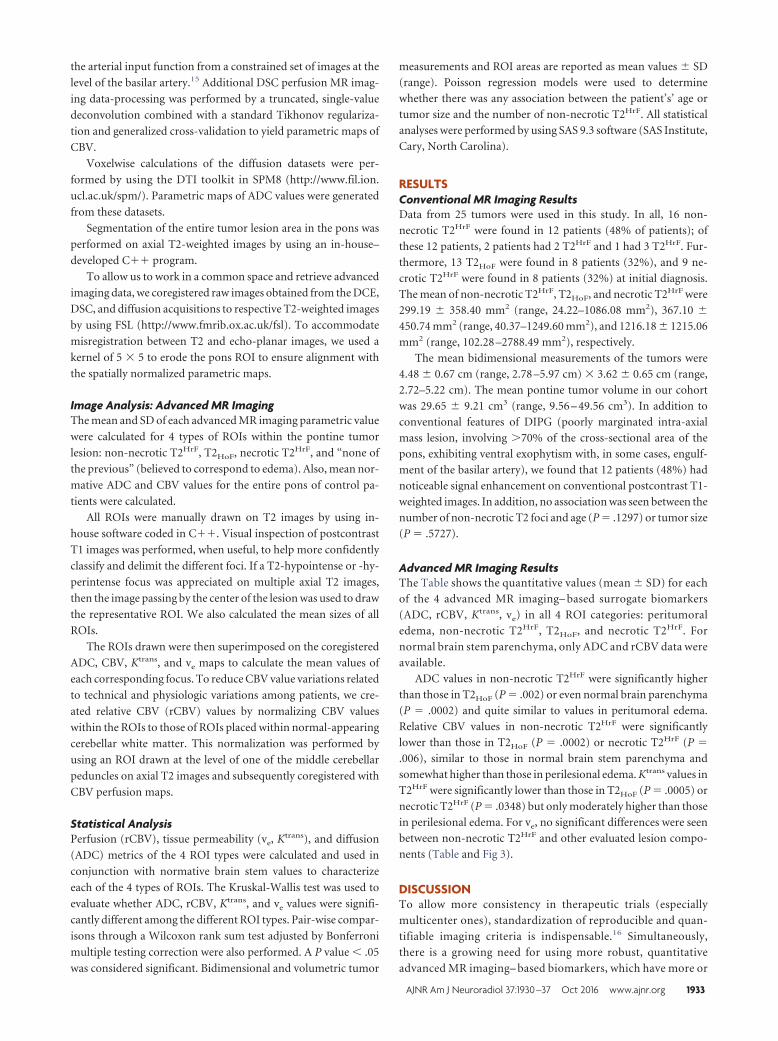
the arterial input function from a constrained set of images at the
level of the basilar artery.15 Additional DSC perfusion MR imag-
ing data-processing was performed by a truncated, single-value
deconvolution combined with a standard Tikhonov regulariza-
tion and generalized cross-validation to yield parametric maps of
CBV.
Voxelwise calculations of the diffusion datasets were per-
formed by using the DTI toolkit in SPM8 (http://www.fil.ion.
ucl.ac.uk/spm/). Parametric maps of ADC values were generated
from these datasets.
Segmentation of the entire tumor lesion area in the pons was
performed on axial T2-weighted images by using an in-house–
developed C�� program.
To allow us to work in a common space and retrieve advanced
imaging data, we coregistered raw images obtained from the DCE,
DSC, and diffusion acquisitions to respective T2-weighted images
by using FSL (http://www.fmrib.ox.ac.uk/fsl). To accommodate
misregistration between T2 and echo-planar images, we used a
kernel of 5 � 5 to erode the pons ROI to ensure alignment with
the spatially normalized parametric maps.
Image Analysis: Advanced MR ImagingThe mean and SD of each advanced MR imaging parametric value
were calculated for 4 types of ROIs within the pontine tumor
lesion: non-necrotic T2HrF, T2HoF, necrotic T2HrF, and “none of
the previous” (believed to correspond to edema). Also, mean nor-
mative ADC and CBV values for the entire pons of control pa-
tients were calculated.
All ROIs were manually drawn on T2 images by using in-
house software coded in C��. Visual inspection of postcontrast
T1 images was performed, when useful, to help more confidently
classify and delimit the different foci. If a T2-hypointense or -hy-
perintense focus was appreciated on multiple axial T2 images,
then the image passing by the center of the lesion was used to draw
the representative ROI. We also calculated the mean sizes of all
ROIs.
The ROIs drawn were then superimposed on the coregistered
ADC, CBV, Ktrans, and ve maps to calculate the mean values of
each corresponding focus. To reduce CBV value variations related
to technical and physiologic variations among patients, we cre-
ated relative CBV (rCBV) values by normalizing CBV values
within the ROIs to those of ROIs placed within normal-appearing
cerebellar white matter. This normalization was performed by
using an ROI drawn at the level of one of the middle cerebellar
peduncles on axial T2 images and subsequently coregistered with
CBV perfusion maps.
Statistical AnalysisPerfusion (rCBV), tissue permeability (ve, Ktrans), and diffusion
(ADC) metrics of the 4 ROI types were calculated and used in
conjunction with normative brain stem values to characterize
each of the 4 types of ROIs. The Kruskal-Wallis test was used to
evaluate whether ADC, rCBV, Ktrans, and ve values were signifi-
cantly different among the different ROI types. Pair-wise compar-
isons through a Wilcoxon rank sum test adjusted by Bonferroni
multiple testing correction were also performed. A P value � .05
was considered significant. Bidimensional and volumetric tumor
measurements and ROI areas are reported as mean values � SD
(range). Poisson regression models were used to determine
whether there was any association between the patient’s’ age or
tumor size and the number of non-necrotic T2HrF. All statistical
analyses were performed by using SAS 9.3 software (SAS Institute,
Cary, North Carolina).
RESULTSConventional MR Imaging ResultsData from 25 tumors were used in this study. In all, 16 non-
necrotic T2HrF were found in 12 patients (48% of patients); of
these 12 patients, 2 patients had 2 T2HrF and 1 had 3 T2HrF. Fur-
thermore, 13 T2HoF were found in 8 patients (32%), and 9 ne-
crotic T2HrF were found in 8 patients (32%) at initial diagnosis.
The mean of non-necrotic T2HrF, T2HoF, and necrotic T2HrF were
299.19 � 358.40 mm2 (range, 24.22–1086.08 mm2), 367.10 �
450.74 mm2 (range, 40.37–1249.60 mm2), and 1216.18 � 1215.06
mm2 (range, 102.28 –2788.49 mm2), respectively.
The mean bidimensional measurements of the tumors were
4.48 � 0.67 cm (range, 2.78 –5.97 cm) � 3.62 � 0.65 cm (range,
2.72–5.22 cm). The mean pontine tumor volume in our cohort
was 29.65 � 9.21 cm3 (range, 9.56 – 49.56 cm3). In addition to
conventional features of DIPG (poorly marginated intra-axial
mass lesion, involving �70% of the cross-sectional area of the
pons, exhibiting ventral exophytism with, in some cases, engulf-
ment of the basilar artery), we found that 12 patients (48%) had
noticeable signal enhancement on conventional postcontrast T1-
weighted images. In addition, no association was seen between the
number of non-necrotic T2 foci and age (P � .1297) or tumor size
(P � .5727).
Advanced MR Imaging ResultsThe Table shows the quantitative values (mean � SD) for each
of the 4 advanced MR imaging– based surrogate biomarkers
(ADC, rCBV, Ktrans, ve) in all 4 ROI categories: peritumoral
edema, non-necrotic T2HrF, T2HoF, and necrotic T2HrF. For
normal brain stem parenchyma, only ADC and rCBV data were
available.
ADC values in non-necrotic T2HrF were significantly higher
than those in T2HoF (P � .002) or even normal brain parenchyma
(P � .0002) and quite similar to values in peritumoral edema.
Relative CBV values in non-necrotic T2HrF were significantly
lower than those in T2HoF (P � .0002) or necrotic T2HrF (P �
.006), similar to those in normal brain stem parenchyma and
somewhat higher than those in perilesional edema. Ktrans values in
T2HrF were significantly lower than those in T2HoF (P � .0005) or
necrotic T2HrF (P � .0348) but only moderately higher than those
in perilesional edema. For ve, no significant differences were seen
between non-necrotic T2HrF and other evaluated lesion compo-
nents (Table and Fig 3).
DISCUSSIONTo allow more consistency in therapeutic trials (especially
multicenter ones), standardization of reproducible and quan-
tifiable imaging criteria is indispensable.16 Simultaneously,
there is a growing need for using more robust, quantitative
advanced MR imaging– based biomarkers, which have more or
AJNR Am J Neuroradiol 37:1930 –37 Oct 2016 www.ajnr.org 1933
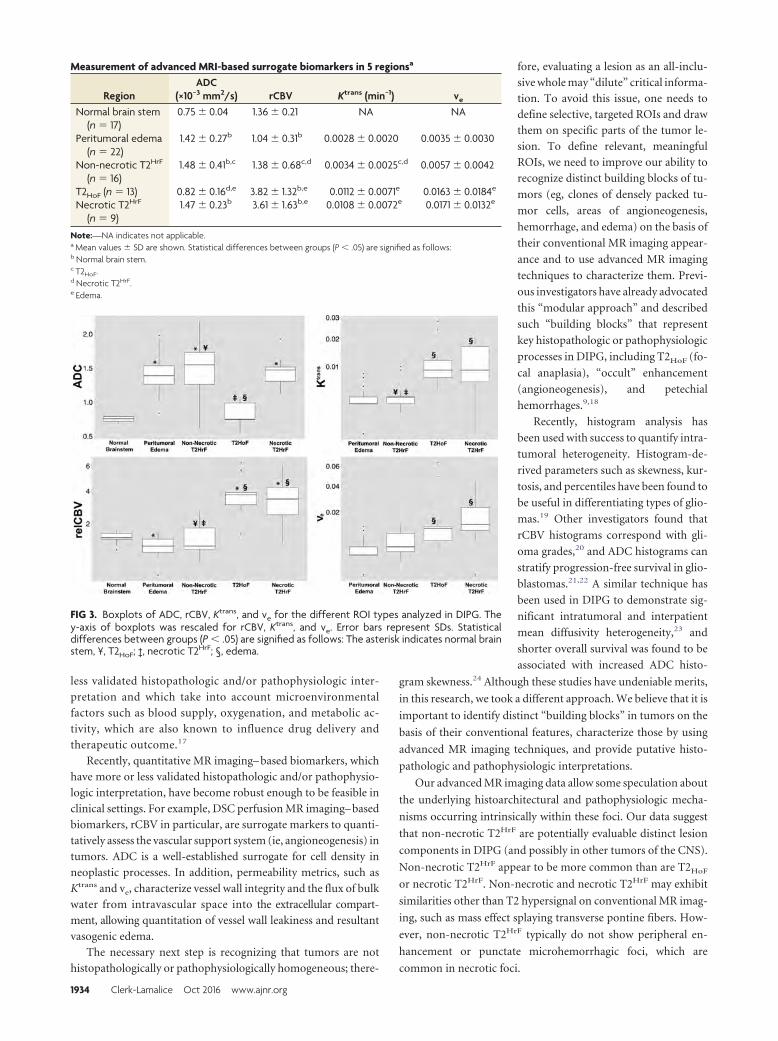
less validated histopathologic and/or pathophysiologic inter-
pretation and which take into account microenvironmental
factors such as blood supply, oxygenation, and metabolic ac-
tivity, which are also known to influence drug delivery and
therapeutic outcome.17
Recently, quantitative MR imaging– based biomarkers, which
have more or less validated histopathologic and/or pathophysio-
logic interpretation, have become robust enough to be feasible in
clinical settings. For example, DSC perfusion MR imaging– based
biomarkers, rCBV in particular, are surrogate markers to quanti-
tatively assess the vascular support system (ie, angioneogenesis) in
tumors. ADC is a well-established surrogate for cell density in
neoplastic processes. In addition, permeability metrics, such as
Ktrans and ve, characterize vessel wall integrity and the flux of bulk
water from intravascular space into the extracellular compart-
ment, allowing quantitation of vessel wall leakiness and resultant
vasogenic edema.
The necessary next step is recognizing that tumors are not
histopathologically or pathophysiologically homogeneous; there-
fore, evaluating a lesion as an all-inclu-
sive whole may “dilute” critical informa-
tion. To avoid this issue, one needs to
define selective, targeted ROIs and draw
them on specific parts of the tumor le-
sion. To define relevant, meaningful
ROIs, we need to improve our ability to
recognize distinct building blocks of tu-
mors (eg, clones of densely packed tu-
mor cells, areas of angioneogenesis,
hemorrhage, and edema) on the basis of
their conventional MR imaging appear-
ance and to use advanced MR imaging
techniques to characterize them. Previ-
ous investigators have already advocated
this “modular approach” and described
such “building blocks” that represent
key histopathologic or pathophysiologic
processes in DIPG, including T2HoF (fo-
cal anaplasia), “occult” enhancement
(angioneogenesis), and petechial
hemorrhages.9,18
Recently, histogram analysis has
been used with success to quantify intra-
tumoral heterogeneity. Histogram-de-
rived parameters such as skewness, kur-
tosis, and percentiles have been found to
be useful in differentiating types of glio-
mas.19 Other investigators found that
rCBV histograms correspond with gli-
oma grades,20 and ADC histograms can
stratify progression-free survival in glio-
blastomas.21,22 A similar technique has
been used in DIPG to demonstrate sig-
nificant intratumoral and interpatient
mean diffusivity heterogeneity,23 and
shorter overall survival was found to be
associated with increased ADC histo-
gram skewness.24 Although these studies have undeniable merits,
in this research, we took a different approach. We believe that it is
important to identify distinct “building blocks” in tumors on the
basis of their conventional features, characterize those by using
advanced MR imaging techniques, and provide putative histo-
pathologic and pathophysiologic interpretations.
Our advanced MR imaging data allow some speculation about
the underlying histoarchitectural and pathophysiologic mecha-
nisms occurring intrinsically within these foci. Our data suggest
that non-necrotic T2HrF are potentially evaluable distinct lesion
components in DIPG (and possibly in other tumors of the CNS).
Non-necrotic T2HrF appear to be more common than are T2HoF
or necrotic T2HrF. Non-necrotic and necrotic T2HrF may exhibit
similarities other than T2 hypersignal on conventional MR imag-
ing, such as mass effect splaying transverse pontine fibers. How-
ever, non-necrotic T2HrF typically do not show peripheral en-
hancement or punctate microhemorrhagic foci, which are
common in necrotic foci.
FIG 3. Boxplots of ADC, rCBV, Ktrans, and ve for the different ROI types analyzed in DIPG. They-axis of boxplots was rescaled for rCBV, Ktrans, and ve. Error bars represent SDs. Statisticaldifferences between groups (P � .05) are signified as follows: The asterisk indicates normal brainstem, ¥, T2HoF; ‡, necrotic T2HrF; §, edema.
Measurement of advanced MRI-based surrogate biomarkers in 5 regionsa
RegionADC
(×10−3 mm2/s) rCBV Ktrans (min−1) ve
Normal brain stem(n � 17)
0.75 � 0.04 1.36 � 0.21 NA NA
Peritumoral edema(n � 22)
1.42 � 0.27b 1.04 � 0.31b 0.0028 � 0.0020 0.0035 � 0.0030
Non-necrotic T2HrF
(n � 16)1.48 � 0.41b,c 1.38 � 0.68c,d 0.0034 � 0.0025c,d 0.0057 � 0.0042
T2HoF (n � 13) 0.82 � 0.16d,e 3.82 � 1.32b,e 0.0112 � 0.0071e 0.0163 � 0.0184e
Necrotic T2HrF
(n � 9)1.47 � 0.23b 3.61 � 1.63b,e 0.0108 � 0.0072e 0.0171 � 0.0132e
Note:—NA indicates not applicable.a Mean values � SD are shown. Statistical differences between groups (P � .05) are signified as follows:b Normal brain stem.c T2HoF.d Necrotic T2HrF.e Edema.
1934 Clerk-Lamalice Oct 2016 www.ajnr.org
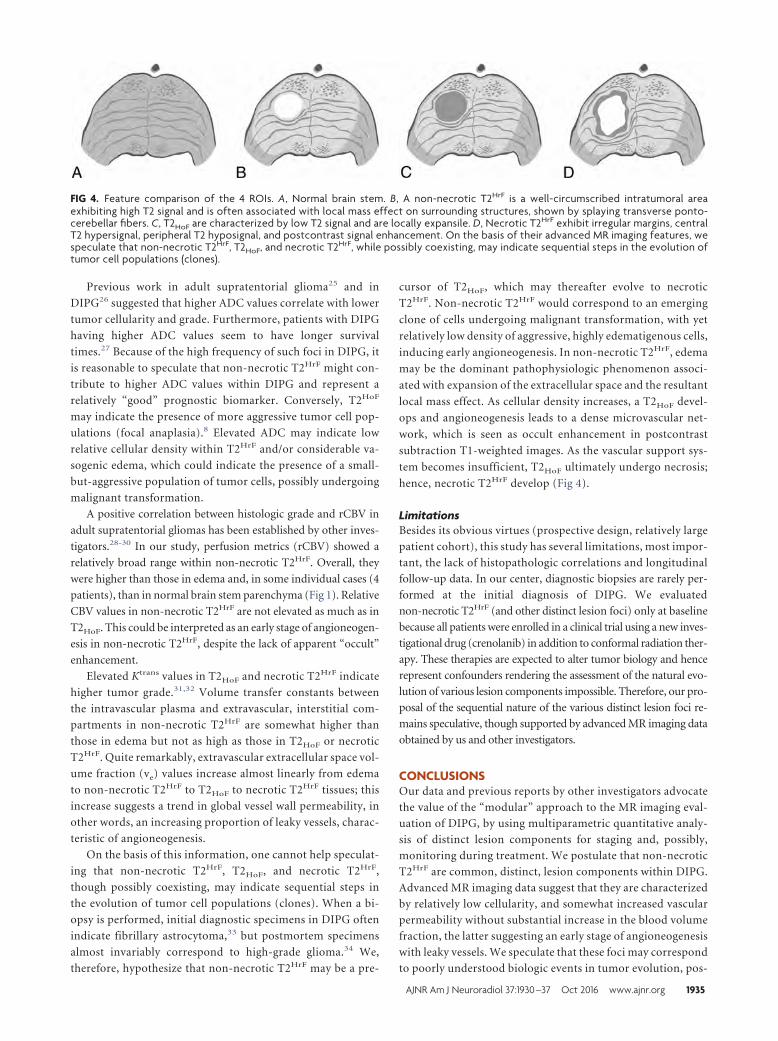
Previous work in adult supratentorial glioma25 and in
DIPG26 suggested that higher ADC values correlate with lower
tumor cellularity and grade. Furthermore, patients with DIPG
having higher ADC values seem to have longer survival
times.27 Because of the high frequency of such foci in DIPG, it
is reasonable to speculate that non-necrotic T2HrF might con-
tribute to higher ADC values within DIPG and represent a
relatively “good” prognostic biomarker. Conversely, T2HoF
may indicate the presence of more aggressive tumor cell pop-
ulations (focal anaplasia).8 Elevated ADC may indicate low
relative cellular density within T2HrF and/or considerable va-
sogenic edema, which could indicate the presence of a small-
but-aggressive population of tumor cells, possibly undergoing
malignant transformation.
A positive correlation between histologic grade and rCBV in
adult supratentorial gliomas has been established by other inves-
tigators.28-30 In our study, perfusion metrics (rCBV) showed a
relatively broad range within non-necrotic T2HrF. Overall, they
were higher than those in edema and, in some individual cases (4
patients), than in normal brain stem parenchyma (Fig 1). Relative
CBV values in non-necrotic T2HrF are not elevated as much as in
T2HoF. This could be interpreted as an early stage of angioneogen-
esis in non-necrotic T2HrF, despite the lack of apparent “occult”
enhancement.
Elevated Ktrans values in T2HoF and necrotic T2HrF indicate
higher tumor grade.31,32 Volume transfer constants between
the intravascular plasma and extravascular, interstitial com-
partments in non-necrotic T2HrF are somewhat higher than
those in edema but not as high as those in T2HoF or necrotic
T2HrF. Quite remarkably, extravascular extracellular space vol-
ume fraction (ve) values increase almost linearly from edema
to non-necrotic T2HrF to T2HoF to necrotic T2HrF tissues; this
increase suggests a trend in global vessel wall permeability, in
other words, an increasing proportion of leaky vessels, charac-
teristic of angioneogenesis.
On the basis of this information, one cannot help speculat-
ing that non-necrotic T2HrF, T2HoF, and necrotic T2HrF,
though possibly coexisting, may indicate sequential steps in
the evolution of tumor cell populations (clones). When a bi-
opsy is performed, initial diagnostic specimens in DIPG often
indicate fibrillary astrocytoma,33 but postmortem specimens
almost invariably correspond to high-grade glioma.34 We,
therefore, hypothesize that non-necrotic T2HrF may be a pre-
cursor of T2HoF, which may thereafter evolve to necrotic
T2HrF. Non-necrotic T2HrF would correspond to an emerging
clone of cells undergoing malignant transformation, with yet
relatively low density of aggressive, highly edematigenous cells,
inducing early angioneogenesis. In non-necrotic T2HrF, edema
may be the dominant pathophysiologic phenomenon associ-
ated with expansion of the extracellular space and the resultant
local mass effect. As cellular density increases, a T2HoF devel-
ops and angioneogenesis leads to a dense microvascular net-
work, which is seen as occult enhancement in postcontrast
subtraction T1-weighted images. As the vascular support sys-
tem becomes insufficient, T2HoF ultimately undergo necrosis;
hence, necrotic T2HrF develop (Fig 4).
LimitationsBesides its obvious virtues (prospective design, relatively large
patient cohort), this study has several limitations, most impor-
tant, the lack of histopathologic correlations and longitudinal
follow-up data. In our center, diagnostic biopsies are rarely per-
formed at the initial diagnosis of DIPG. We evaluated
non-necrotic T2HrF (and other distinct lesion foci) only at baseline
because all patients were enrolled in a clinical trial using a new inves-
tigational drug (crenolanib) in addition to conformal radiation ther-
apy. These therapies are expected to alter tumor biology and hence
represent confounders rendering the assessment of the natural evo-
lution of various lesion components impossible. Therefore, our pro-
posal of the sequential nature of the various distinct lesion foci re-
mains speculative, though supported by advanced MR imaging data
obtained by us and other investigators.
CONCLUSIONSOur data and previous reports by other investigators advocate
the value of the “modular” approach to the MR imaging eval-
uation of DIPG, by using multiparametric quantitative analy-
sis of distinct lesion components for staging and, possibly,
monitoring during treatment. We postulate that non-necrotic
T2HrF are common, distinct, lesion components within DIPG.
Advanced MR imaging data suggest that they are characterized
by relatively low cellularity, and somewhat increased vascular
permeability without substantial increase in the blood volume
fraction, the latter suggesting an early stage of angioneogenesis
with leaky vessels. We speculate that these foci may correspond
to poorly understood biologic events in tumor evolution, pos-
FIG 4. Feature comparison of the 4 ROIs. A, Normal brain stem. B, A non-necrotic T2HrF is a well-circumscribed intratumoral areaexhibiting high T2 signal and is often associated with local mass effect on surrounding structures, shown by splaying transverse ponto-cerebellar fibers. C, T2HoF are characterized by low T2 signal and are locally expansile. D, Necrotic T2HrF exhibit irregular margins, centralT2 hypersignal, peripheral T2 hyposignal, and postcontrast signal enhancement. On the basis of their advanced MR imaging features, wespeculate that non-necrotic T2HrF, T2HoF, and necrotic T2HrF, while possibly coexisting, may indicate sequential steps in the evolution oftumor cell populations (clones).
AJNR Am J Neuroradiol 37:1930 –37 Oct 2016 www.ajnr.org 1935
sibly representing clones of transforming cell populations
evolving toward foci of anaplasia. Future work is needed to
acquire histopathologic validation of our findings and the de-
rived hypotheses and to determine the value of various distinct
tumor components (eg, T2HrF, T2HoF) in the prognostication
of key outcome metrics, such as progression-free survival and
overall survival.
ACKNOWLEDGMENTSThe authors thank Cherise M. Guess, PhD, ELS, for reviewing and
editing the manuscript and Edwina Anderson for data management.
Disclosures: Olivier Clerk-Lamalice—RELATED: National Cancer Institute,* AmericanLebanese Syrian Associated Charities. Zoltan Patay—RELATED: Grant: National Can-cer Institute (P30 CA021765)*; UNRELATED: Travel/Accommodations/Meeting Ex-penses Unrelated to Activities Listed: Sao Paulo Radiological Society, European So-ciety of Neuroradiology, Erasmus Course in MRI, European Course in PediatricNeuroradiology, Hamad Medical Corporation, China International Forum of Pediat-ric Development, Indian Society of Neuroradiology, Comments: Sao Paulo Radiolog-ical Society (2013), travel and accommodations for lecturing; European Society ofNeuroradiology (2015), travel and accommodations for invited lecture; ErasmusCourse in MRI (2013, 2014, 2015), travel and accommodations for lecturing; EuropeanCourse On Pediatric Neuroradiology (2014), travel and accommodations for lectur-ing; Hamad Medical Corporation (2014, 2015), travel and accommodations for lectur-ing at a symposium in Doha, Qatar; China International Forum (2015), travel andaccommodations for lecturing; International Symposium on Neural Regeneration(2013), travel and accommodations for lecturing. *Money paid to the institution.
REFERENCES1. Ostrom QT, Gittleman H, Liao P, et al. CBTRUS statistical report:
primary brain and central nervous system tumors diagnosed in theUnited States in 2007–2011. Neuro Oncol 2014;16(suppl 4):iv1–iv63CrossRef Medline
2. Warren KE. Diffuse intrinsic pontine glioma: poised for progress.Front Oncol 2012;2:205 CrossRef Medline
3. Broniscer A, Baker JN, Tagen M, et al. Phase I study of vandetanibduring and after radiotherapy in children with diffuse intrinsicpontine glioma. J Clin Oncol 2010;28:4762– 68 CrossRef Medline
4. Broniscer A, Baker SD, Wetmore C, et al. Phase I trial, pharmacoki-netics, and pharmacodynamics of vandetanib and dasatinib in chil-dren with newly diagnosed diffuse intrinsic pontine glioma. ClinCancer Res 2013;19:3050 –58 CrossRef Medline
5. Poussaint TY, Kocak M, Vajapeyam S, et al. MRI as a central compo-nent of clinical trials analysis in brainstem glioma: a report fromthe Pediatric Brain Tumor Consortium (PBTC). Neuro Oncol 2011;13:417–27 CrossRef Medline
6. Jansen MH, Veldhuijzen van Zanten SE, Sanchez Aliaga E, et al. Sur-vival prediction model of children with diffuse intrinsic pontineglioma based on clinical and radiological criteria. Neuro Oncol 2015;17:160 – 66 CrossRef Medline
7. Hargrave D, Chuang N, Bouffet E. Conventional MRI cannot predictsurvival in childhood diffuse intrinsic pontine glioma. J Neurooncol2008;86:313–19 Medline
8. Lobel U, Sedlacik J, Reddick WE, et al. Quantitative diffusion-weighted and dynamic susceptibility-weighted contrast-enhancedperfusion MR imaging analysis of T2 hypointense lesion compo-nents in pediatric diffuse intrinsic pontine glioma. AJNR Am J Neu-roradiol 2011;32:315–22 CrossRef Medline
9. Conway AE, Reddick WE, Li Y, et al. “Occult” post-contrast signalenhancement in pediatric diffuse intrinsic pontine glioma is theMRI marker of angiogenesis? Neuroradiology 2014;56:405–12CrossRef Medline
10. Paulson ES, Schmainda KM. Comparison of dynamic susceptibility-weighted contrast-enhanced MR methods: recommendations formeasuring relative cerebral blood volume in brain tumors. Radiol-ogy 2008;249:601–13 CrossRef Medline
11. Hu LS, Baxter LC, Pinnaduwage DS, et al. Optimized preload leak-
age-correction methods to improve the diagnostic accuracy of dy-namic susceptibility-weighted contrast-enhanced perfusion MRimaging in posttreatment gliomas. AJNR Am J Neuroradiol 2010;31:40 – 48 CrossRef Medline
12. Boxerman JL, Prah DE, Paulson ES, et al. The role of preload andleakage correction in gadolinium-based cerebral blood volume es-timation determined by comparison with MION as a criterion stan-dard. AJNR Am J Neuroradiol 2012;33:1081– 87 CrossRef Medline
13. Tofts PS, Brix G, Buckley DL, et al. Estimating kinetic parametersfrom dynamic contrast-enhanced T(1)-weighted MRI of a diffus-able tracer: standardized quantities and symbols. J Magn Reson Im-aging 1999;10:223–32 Medline
14. Parker GJM, Roberts C, Macdonald A, et al. Experimentally-derivedfunctional form for a population-averaged high-temporal-resolu-tion arterial input function for dynamic contrast-enhanced MRI.Magn Reson Med 2006;56:993–1000 CrossRef Medline
15. Harreld JH, Helton KJ, Kaddoum RN, et al. The effects of propofolon cerebral perfusion MRI in children. Neuroradiology 2013;55:1049 –56 CrossRef Medline
16. Ellingson BM, Bendszus M, Boxerman J, et al; Jumpstarting BrainTumor Drug Development Coalition Imaging Standardization Steer-ing Committee. Consensus recommendations for a standardizedBrain Tumor Imaging Protocol in clinical trials. Neuro Oncol 2015;17:1188 –98 CrossRef Medline
17. Just N. Improving tumour heterogeneity MRI assessment with his-tograms. Br J Cancer 2014;111:2205–13 CrossRef Medline
18. Lobel U, Sedlacik J, Sabin ND, et al. Three-dimensional susceptibil-ity-weighted imaging and two-dimensional T2*-weighted gradi-ent-echo imaging of intratumoral hemorrhages in pediatric diffuseintrinsic pontine glioma. Neuroradiology 2010;52:1167–77 CrossRefMedline
19. Just N. Histogram analysis of the microvasculature of intracerebralhuman and murine glioma xenografts. Magn Reson Med 2011;65:778 – 89 CrossRef Medline
20. Law M, Young R, Babb J, et al. Histogram analysis versus region ofinterest analysis of dynamic susceptibility contrast perfusion MRimaging data in the grading of cerebral gliomas. AJNR Am J Neuro-radiol 2007;28:761– 66 Medline
21. Pope WB, Kim HJ, Huo J, et al. Recurrent glioblastoma multiforme:ADC histogram analysis predicts response to bevacizumab treat-ment. Radiology 2009;252:182– 89 CrossRef Medline
22. Pope WB, Qiao XJ, Kim HJ, et al. Apparent diffusion coefficienthistogram analysis stratifies progression-free and overall survivalin patients with recurrent GBM treated with bevacizumab: a multi-center study. J Neurooncol 2012;108:491–98 CrossRef Medline
23. Steffen-Smith EA, Sarlls JE, Pierpaoli C, et al. Diffusion tensor histo-gram analysis of pediatric diffuse intrinsic pontine glioma. BiomedRes Int 2014;2014:647356 CrossRef Medline
24. Poussaint TY, Vajapeyam S, Ricci KI, et al. Apparent diffusion coef-ficient histogram metrics correlate with survival in diffuse intrinsicpontine glioma: a report from the Pediatric Brain Tumor Consor-tium. Neuro Oncol 2015 Oct 20. [Epub ahead of print] Medline
25. Sugahara T, Korogi Y, Kochi M, et al. Usefulness of diffusion-weighted MRI with echo-planar technique in the evaluation of cel-lularity in gliomas. J Magn Reson Imaging 1999;9:53– 60 Medline
26. Lober RM, Cho YJ, Tang Y, et al. Diffusion-weighted MRI derivedapparent diffusion coefficient identifies prognostically distinctsubgroups of pediatric diffuse intrinsic pontine glioma. J Neuroon-col 2014;117:175– 82 CrossRef Medline
27. Chen HJ, Panigrahy A, Dhall G, et al. Apparent diffusion and frac-tional anisotropy of diffuse intrinsic brain stem gliomas. AJNRAm J Neuroradiol 2010;31:1879 – 85 CrossRef Medline
28. Al-Okaili RN, Krejza J, Woo JH, et al. Intraaxial brain masses: MRimaging– based diagnostic strategy—initial experience. Radiology2007;243:539 –50 CrossRef Medline
29. Law M, Yang S, Wang H, et al. Glioma grading: sensitivity, specific-ity, and predictive values of perfusion MR imaging and proton MR
1936 Clerk-Lamalice Oct 2016 www.ajnr.org
spectroscopic imaging compared with conventional MR imaging.AJNR Am J Neuroradiol 2003;24:1989 –98 Medline
30. Law M, Young RJ, Babb JS, et al. Gliomas: predicting time to pro-gression or survival with cerebral blood volume measurements atdynamic susceptibility-weighted contrast-enhanced perfusion MRimaging. Radiology 2008;247:490 –98 CrossRef Medline
31. Cha S. Dynamic susceptibility-weighted contrast-enhanced perfu-sion MR imaging in pediatric patients. Neuroimaging Clin N Am2006;16:137– 47, ix CrossRef Medline
32. Roberts HC, Roberts TP, Brasch RC, et al. Quantitative measure-
ment of microvascular permeability in human brain tumorsachieved using dynamic contrast-enhanced MR imaging: correlationwith histologic grade. AJNR Am J Neuroradiol 2000;21:891–99 Medline
33. Schumacher M, Schulte-Monting J, Stoeter P, et al. Magnetic reso-nance imaging compared with biopsy in the diagnosis of brainstemdiseases of childhood: a multicenter review. J Neurosurg 2007;106(2suppl):111–19 CrossRef Medline
34. Yoshimura J, Onda K, Tanaka R, et al. Clinicopathological study ofdiffuse type brainstem gliomas: analysis of 40 autopsy cases. NeurolMed Chir (Tokyo) 2003;43:375– 82; discussion 382 Medline
AJNR Am J Neuroradiol 37:1930 –37 Oct 2016 www.ajnr.org 1937
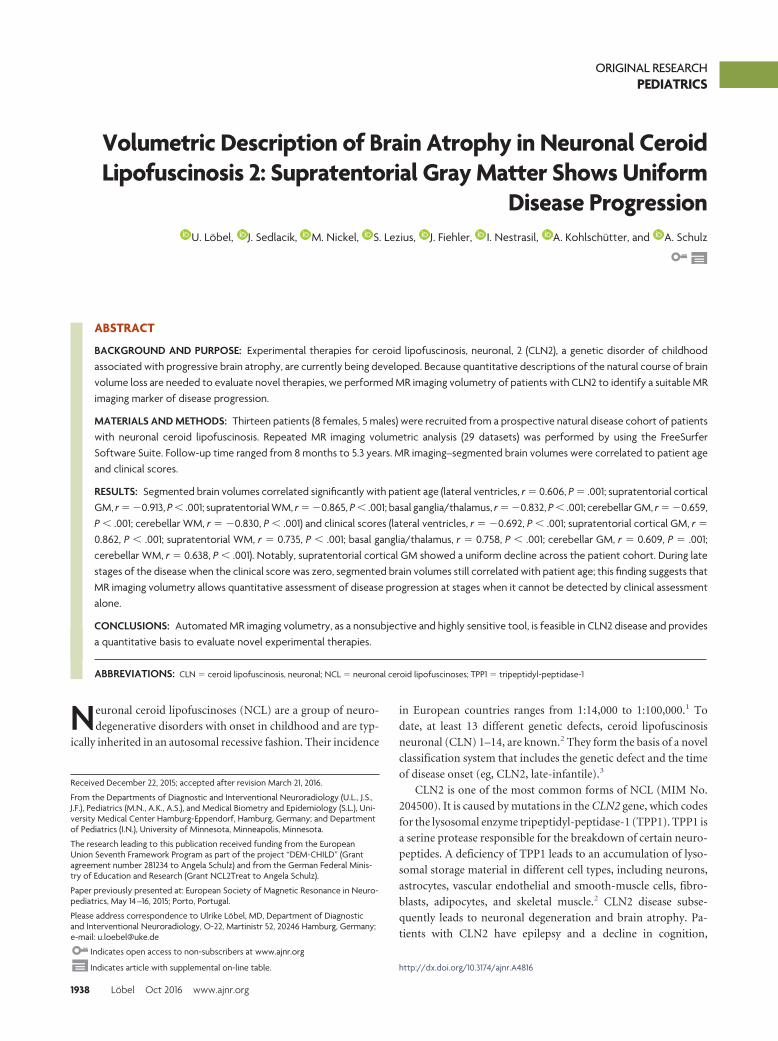
ORIGINAL RESEARCHPEDIATRICS
Volumetric Description of Brain Atrophy in Neuronal CeroidLipofuscinosis 2: Supratentorial Gray Matter Shows Uniform
Disease ProgressionX U. Lobel, X J. Sedlacik, X M. Nickel, X S. Lezius, X J. Fiehler, X I. Nestrasil, X A. Kohlschutter, and X A. Schulz
ABSTRACT
BACKGROUND AND PURPOSE: Experimental therapies for ceroid lipofuscinosis, neuronal, 2 (CLN2), a genetic disorder of childhoodassociated with progressive brain atrophy, are currently being developed. Because quantitative descriptions of the natural course of brainvolume loss are needed to evaluate novel therapies, we performed MR imaging volumetry of patients with CLN2 to identify a suitable MRimaging marker of disease progression.
MATERIALS AND METHODS: Thirteen patients (8 females, 5 males) were recruited from a prospective natural disease cohort of patientswith neuronal ceroid lipofuscinosis. Repeated MR imaging volumetric analysis (29 datasets) was performed by using the FreeSurferSoftware Suite. Follow-up time ranged from 8 months to 5.3 years. MR imaging–segmented brain volumes were correlated to patient ageand clinical scores.
RESULTS: Segmented brain volumes correlated significantly with patient age (lateral ventricles, r � 0.606, P � .001; supratentorial corticalGM, r � �0.913, P � .001; supratentorial WM, r � �0.865, P � .001; basal ganglia/thalamus, r � �0.832, P � .001; cerebellar GM, r � �0.659,P � .001; cerebellar WM, r � �0.830, P � .001) and clinical scores (lateral ventricles, r � �0.692, P � .001; supratentorial cortical GM, r �
0.862, P � .001; supratentorial WM, r � 0.735, P � .001; basal ganglia/thalamus, r � 0.758, P � .001; cerebellar GM, r � 0.609, P � .001;cerebellar WM, r � 0.638, P � .001). Notably, supratentorial cortical GM showed a uniform decline across the patient cohort. During latestages of the disease when the clinical score was zero, segmented brain volumes still correlated with patient age; this finding suggests thatMR imaging volumetry allows quantitative assessment of disease progression at stages when it cannot be detected by clinical assessmentalone.
CONCLUSIONS: Automated MR imaging volumetry, as a nonsubjective and highly sensitive tool, is feasible in CLN2 disease and providesa quantitative basis to evaluate novel experimental therapies.
ABBREVIATIONS: CLN � ceroid lipofuscinosis, neuronal; NCL � neuronal ceroid lipofuscinoses; TPP1 � tripeptidyl-peptidase-1
Neuronal ceroid lipofuscinoses (NCL) are a group of neuro-
degenerative disorders with onset in childhood and are typ-
ically inherited in an autosomal recessive fashion. Their incidence
in European countries ranges from 1:14,000 to 1:100,000.1 To
date, at least 13 different genetic defects, ceroid lipofuscinosis
neuronal (CLN) 1–14, are known.2 They form the basis of a novel
classification system that includes the genetic defect and the time
of disease onset (eg, CLN2, late-infantile).3
CLN2 is one of the most common forms of NCL (MIM No.
204500). It is caused by mutations in the CLN2 gene, which codes
for the lysosomal enzyme tripeptidyl-peptidase-1 (TPP1). TPP1 is
a serine protease responsible for the breakdown of certain neuro-
peptides. A deficiency of TPP1 leads to an accumulation of lyso-
somal storage material in different cell types, including neurons,
astrocytes, vascular endothelial and smooth-muscle cells, fibro-
blasts, adipocytes, and skeletal muscle.2 CLN2 disease subse-
quently leads to neuronal degeneration and brain atrophy. Pa-
tients with CLN2 have epilepsy and a decline in cognition,
Received December 22, 2015; accepted after revision March 21, 2016.
From the Departments of Diagnostic and Interventional Neuroradiology (U.L., J.S.,J.F.), Pediatrics (M.N., A.K., A.S.), and Medical Biometry and Epidemiology (S.L.), Uni-versity Medical Center Hamburg-Eppendorf, Hamburg, Germany; and Departmentof Pediatrics (I.N.), University of Minnesota, Minneapolis, Minnesota.
The research leading to this publication received funding from the EuropeanUnion Seventh Framework Program as part of the project “DEM-CHILD” (Grantagreement number 281234 to Angela Schulz) and from the German Federal Minis-try of Education and Research (Grant NCL2Treat to Angela Schulz).
Paper previously presented at: European Society of Magnetic Resonance in Neuro-pediatrics, May 14 –16, 2015; Porto, Portugal.
Please address correspondence to Ulrike Lobel, MD, Department of Diagnosticand Interventional Neuroradiology, O-22, Martinistr 52, 20246 Hamburg, Germany;e-mail: [email protected]
Indicates open access to non-subscribers at www.ajnr.org
Indicates article with supplemental on-line table. http://dx.doi.org/10.3174/ajnr.A4816
1938 Lobel Oct 2016 www.ajnr.org
language, and gross motor function starting at 2– 4 years of age.
The disease rapidly progresses, with loss of vision due to optic
atrophy and macular and retinal changes occurring in later dis-
ease stages.4 Nonclassic presentations (ie, juvenile, adult, or in-
fantile onset) exist as well.3,5-8
On conventional MR imaging, a marked supratentorial and
infratentorial atrophy with ventriculomegaly is the typical find-
ing. In addition, a progressive-but-mild increase of WM signal
intensity on T2WI and increased ADC values are observed.9,10
These findings have been largely related to myelin loss and glio-
sis11 and contrast with the decreasing ADC values observed dur-
ing normal brain maturation and myelination.12 Longitudinal
MR imaging is rarely performed in patients with NCL because
therapeutic options do not exist. Longitudinal MR brain volu-
metric studies have only been reported for CLN3 disease,13 and
only 1 cross-sectional study in patients with CLN2, focusing on
the size of CSF spaces, is available.14
The purpose of our study was to test our hypothesis that MR
imaging brain volumetry provides a quantitative tool to assess the
natural course of disease progression in CLN2 disease. More spe-
cifically, we hypothesized that GM volumes would be more
strongly linked to the clinical disease course compared with WM
regions and CSF spaces because CLN2 primarily involves the de-
generation of neurons in the cerebral and cerebellar cortices. We
aimed to establish reference values for current and future clinical
studies (intraventricular enzyme replacement [NCT01907087],
gene therapy [NCT01414985]; www.clinicaltrials.gov).
MATERIALS AND METHODSPatientsThirteen patients with confirmed defects of the CLN2 gene un-
derwent MR imaging between 2008 and 2015 (On-line Table).
Two patients are identical twins (457–1 and 457–2). Approval
from the local ethics committee and written informed consent
from the parents were obtained before inclusion of the patients
into the study.
Clinical ScoringThe clinical course was assessed by using an established clinical
rating scale for CLN2 disease.15 The scale represents a 12-point
inventory of disease-based clinical assessments. The original scale
consists of 4 functional domains: motor, language, vision, and
tonic-clonic seizures. Within each domain, scores ranging from 0
to 3 are given, with 0 representing the absence of function and 3,
the age-appropriate normal function. The clinical score for tonic-
clonic seizures may be strongly influenced by the individual phar-
macologic management of each patient and may show high vari-
ability. Therefore, it was not used in this study. To address the
period before the diagnosis of CLN2 disease, we performed rat-
ings retrospectively on the basis of patient charts and parent in-
terviews. Once the diagnosis of CLN2 was established, ratings
were obtained prospectively at 6-month intervals at the NCL spe-
cialty clinic in Hamburg. Three independent raters performed the
clinical scoring, and the average score of all 3 raters was used for
the final result. Patient characteristics and clinical scores are sum-
marized in the On-line Table.
ImagingMR imaging was performed on a 1.5T scanner (Avanto; Siemens,
Erlangen, Germany). Most children required either sedation or
general anesthesia to obtain adequate images. The imaging pro-
tocol included conventional MR imaging sequences (ie, FLAIR,
T2WI, DWI) and a 3D-T1-weighted MPRAGE sequence (TR/TE/
TI/flip angle, 1900/2.97/1100 ms/15°; matrix, 256 � 176; voxel
size, 1 � 1 � 1 mm3; whole-brain coverage), which was used for
the volumetric analysis. Initially, the 3D-T1-weighted MPRAGE
sequence was acquired in the axial plane. Due to relatively long
observation periods and updates to the software of the scanner,
scans were later acquired in the sagittal plane (TR/TE/TI/flip
angle, 2280/3.64/1000 ms/8°; matrix, 256 � 256; voxel size, 1 �
1 � 1 mm3).
Data EvaluationWe performed brain segmentation by using the FreeSurfer Soft-
ware Suite (stable Version 5.3.0, May 15, 2013; http://surfer.
nmr.mgh.harvard.edu),whiledisabling the skull-stripping option of
FreeSurfer.16
Before the segmentation in FreeSurfer, soft tissue and skull
were removed by using the Brain Extraction Tool in FSL (BET,
Version 2.1, FSL release 5.0, September 2012; http://fsl.fmrib.
ox.ac.uk/fsl/fslwiki/BET).17 Several options for brain extraction
were tested for each dataset, including robust brain center estima-
tion, bias field and neck cleanup, and different fractional intensity
threshold “f” values for the “standard_space_roi” command. We
found that an optimal brain extraction, defined as removal of as
much extracranial tissue as possible without removing brain tis-
sue, could be achieved by using either robust brain estimation or
the standard_space_roi command at f � 0.15. For patients with
�1 study, the longitudinal processing pipeline was used with an
intraindividual consistent skull-stripping mask. After segmenta-tion, all datasets were checked visually for major segmentationerrors (ie, obvious errors of GM and WM segmentation, inclusionof large amounts of dural venous sinuses or soft tissue). Suchstudies would have resulted in exclusion from the final analysis.No manual corrections for small segmentation errors were per-formed to ensure standardized processing.
Of the large number of brain structures segmented by Free-Surfer, the following regions were used for further evaluationbased on our hypothesis: supratentorial cortical GM (ie, total cor-tical GM volume), supratentorial WM (ie, total cortical WM vol-ume), deep GM structures (sum of segmented regions of caudatenucleus, putamen, pallidum, and thalamus), cerebellar GM, cer-ebellar WM, and lateral ventricles (sum of the lateral ventriclesand choroid plexus).
Statistical AnalysisFor the assessment of correlation between different variables, the
Pearson correlation coefficient (r) was calculated. A linear corre-
lation was assumed. The first step included the calculation of a
correlation of volumetric data and clinical scoring with the age of
the patients. Then, a correlation analysis of volumetric data to the
overall clinical scoring was performed. Because the clinical score
was zero for 15 of 29 data points, the analysis was also performed
for clinical scores of �1 to demonstrate the ability of the volumet-
ric data to deliver reliable measurements of disease progression,
AJNR Am J Neuroradiol 37:1938 – 43 Oct 2016 www.ajnr.org 1939
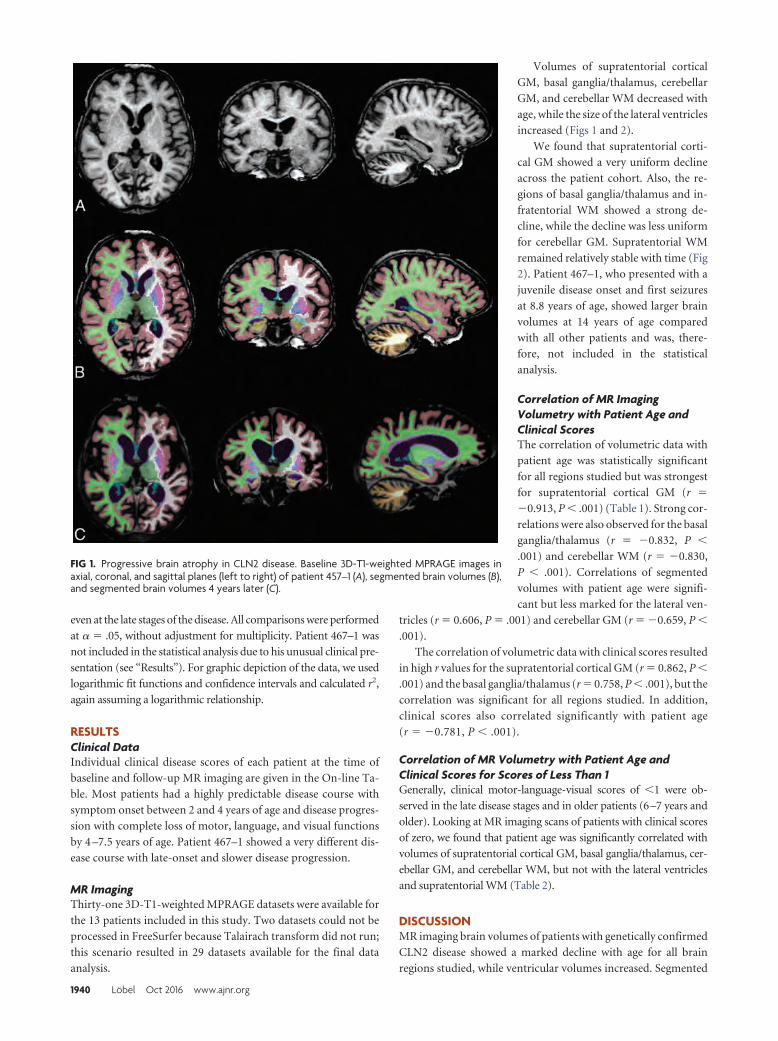
even at the late stages of the disease. All comparisons were performed
at � � .05, without adjustment for multiplicity. Patient 467–1 was
not included in the statistical analysis due to his unusual clinical pre-
sentation (see “Results”). For graphic depiction of the data, we used
logarithmic fit functions and confidence intervals and calculated r2,
again assuming a logarithmic relationship.
RESULTSClinical DataIndividual clinical disease scores of each patient at the time of
baseline and follow-up MR imaging are given in the On-line Ta-
ble. Most patients had a highly predictable disease course with
symptom onset between 2 and 4 years of age and disease progres-
sion with complete loss of motor, language, and visual functions
by 4 –7.5 years of age. Patient 467–1 showed a very different dis-
ease course with late-onset and slower disease progression.
MR ImagingThirty-one 3D-T1-weighted MPRAGE datasets were available for
the 13 patients included in this study. Two datasets could not be
processed in FreeSurfer because Talairach transform did not run;
this scenario resulted in 29 datasets available for the final data
analysis.
Volumes of supratentorial cortical
GM, basal ganglia/thalamus, cerebellar
GM, and cerebellar WM decreased with
age, while the size of the lateral ventricles
increased (Figs 1 and 2).
We found that supratentorial corti-
cal GM showed a very uniform decline
across the patient cohort. Also, the re-
gions of basal ganglia/thalamus and in-
fratentorial WM showed a strong de-
cline, while the decline was less uniform
for cerebellar GM. Supratentorial WM
remained relatively stable with time (Fig
2). Patient 467–1, who presented with a
juvenile disease onset and first seizures
at 8.8 years of age, showed larger brain
volumes at 14 years of age compared
with all other patients and was, there-
fore, not included in the statistical
analysis.
Correlation of MR ImagingVolumetry with Patient Age andClinical ScoresThe correlation of volumetric data with
patient age was statistically significant
for all regions studied but was strongest
for supratentorial cortical GM (r �
�0.913, P � .001) (Table 1). Strong cor-
relations were also observed for the basal
ganglia/thalamus (r � �0.832, P �
.001) and cerebellar WM (r � �0.830,
P � .001). Correlations of segmented
volumes with patient age were signifi-
cant but less marked for the lateral ven-
tricles (r � 0.606, P � .001) and cerebellar GM (r � �0.659, P �
.001).
The correlation of volumetric data with clinical scores resulted
in high r values for the supratentorial cortical GM (r � 0.862, P �
.001) and the basal ganglia/thalamus (r � 0.758, P � .001), but the
correlation was significant for all regions studied. In addition,
clinical scores also correlated significantly with patient age
(r � �0.781, P � .001).
Correlation of MR Volumetry with Patient Age andClinical Scores for Scores of Less Than 1Generally, clinical motor-language-visual scores of �1 were ob-
served in the late disease stages and in older patients (6–7 years and
older). Looking at MR imaging scans of patients with clinical scores
of zero, we found that patient age was significantly correlated with
volumes of supratentorial cortical GM, basal ganglia/thalamus, cer-
ebellar GM, and cerebellar WM, but not with the lateral ventricles
and supratentorial WM (Table 2).
DISCUSSIONMR imaging brain volumes of patients with genetically confirmed
CLN2 disease showed a marked decline with age for all brain
regions studied, while ventricular volumes increased. Segmented
FIG 1. Progressive brain atrophy in CLN2 disease. Baseline 3D-T1-weighted MPRAGE images inaxial, coronal, and sagittal planes (left to right) of patient 457–1 (A), segmented brain volumes (B),and segmented brain volumes 4 years later (C).
1940 Lobel Oct 2016 www.ajnr.org
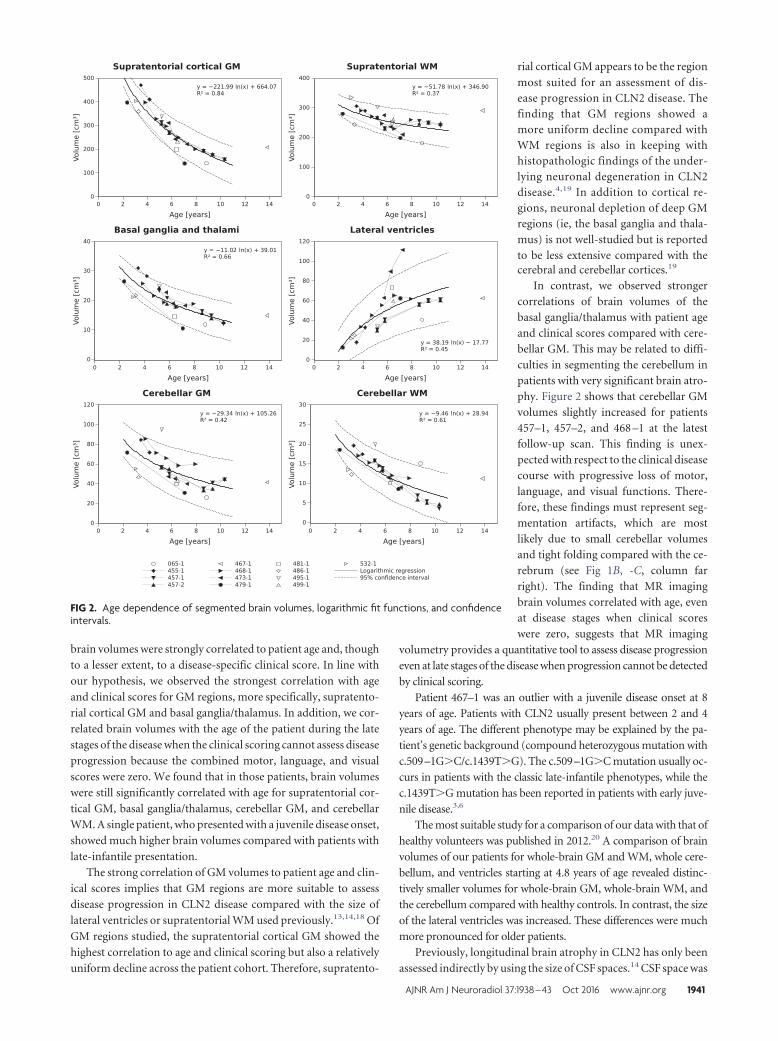
brain volumes were strongly correlated to patient age and, though
to a lesser extent, to a disease-specific clinical score. In line with
our hypothesis, we observed the strongest correlation with age
and clinical scores for GM regions, more specifically, supratento-
rial cortical GM and basal ganglia/thalamus. In addition, we cor-
related brain volumes with the age of the patient during the late
stages of the disease when the clinical scoring cannot assess disease
progression because the combined motor, language, and visual
scores were zero. We found that in those patients, brain volumes
were still significantly correlated with age for supratentorial cor-
tical GM, basal ganglia/thalamus, cerebellar GM, and cerebellar
WM. A single patient, who presented with a juvenile disease onset,
showed much higher brain volumes compared with patients with
late-infantile presentation.
The strong correlation of GM volumes to patient age and clin-
ical scores implies that GM regions are more suitable to assess
disease progression in CLN2 disease compared with the size of
lateral ventricles or supratentorial WM used previously.13,14,18 Of
GM regions studied, the supratentorial cortical GM showed the
highest correlation to age and clinical scoring but also a relatively
uniform decline across the patient cohort. Therefore, supratento-
rial cortical GM appears to be the region
most suited for an assessment of dis-ease progression in CLN2 disease. Thefinding that GM regions showed amore uniform decline compared withWM regions is also in keeping withhistopathologic findings of the under-lying neuronal degeneration in CLN2disease.4,19 In addition to cortical re-gions, neuronal depletion of deep GMregions (ie, the basal ganglia and thala-mus) is not well-studied but is reportedto be less extensive compared with thecerebral and cerebellar cortices.19
In contrast, we observed strongercorrelations of brain volumes of thebasal ganglia/thalamus with patient ageand clinical scores compared with cere-bellar GM. This may be related to diffi-culties in segmenting the cerebellum inpatients with very significant brain atro-phy. Figure 2 shows that cerebellar GMvolumes slightly increased for patients457–1, 457–2, and 468 –1 at the latestfollow-up scan. This finding is unex-pected with respect to the clinical diseasecourse with progressive loss of motor,language, and visual functions. There-fore, these findings must represent seg-mentation artifacts, which are mostlikely due to small cerebellar volumesand tight folding compared with the ce-rebrum (see Fig 1B, -C, column farright). The finding that MR imagingbrain volumes correlated with age, evenat disease stages when clinical scoreswere zero, suggests that MR imaging
volumetry provides a quantitative tool to assess disease progression
even at late stages of the disease when progression cannot be detected
by clinical scoring.
Patient 467–1 was an outlier with a juvenile disease onset at 8
years of age. Patients with CLN2 usually present between 2 and 4
years of age. The different phenotype may be explained by the pa-
tient’s genetic background (compound heterozygous mutation with
c.509–1G�C/c.1439T�G). The c.509–1G�C mutation usually oc-
curs in patients with the classic late-infantile phenotypes, while the
c.1439T�G mutation has been reported in patients with early juve-
nile disease.3,6
The most suitable study for a comparison of our data with that of
healthy volunteers was published in 2012.20 A comparison of brain
volumes of our patients for whole-brain GM and WM, whole cere-
bellum, and ventricles starting at 4.8 years of age revealed distinc-
tively smaller volumes for whole-brain GM, whole-brain WM, and
the cerebellum compared with healthy controls. In contrast, the size
of the lateral ventricles was increased. These differences were much
more pronounced for older patients.
Previously, longitudinal brain atrophy in CLN2 has only been
assessed indirectly by using the size of CSF spaces.14 CSF space was
FIG 2. Age dependence of segmented brain volumes, logarithmic fit functions, and confidenceintervals.
AJNR Am J Neuroradiol 37:1938 – 43 Oct 2016 www.ajnr.org 1941
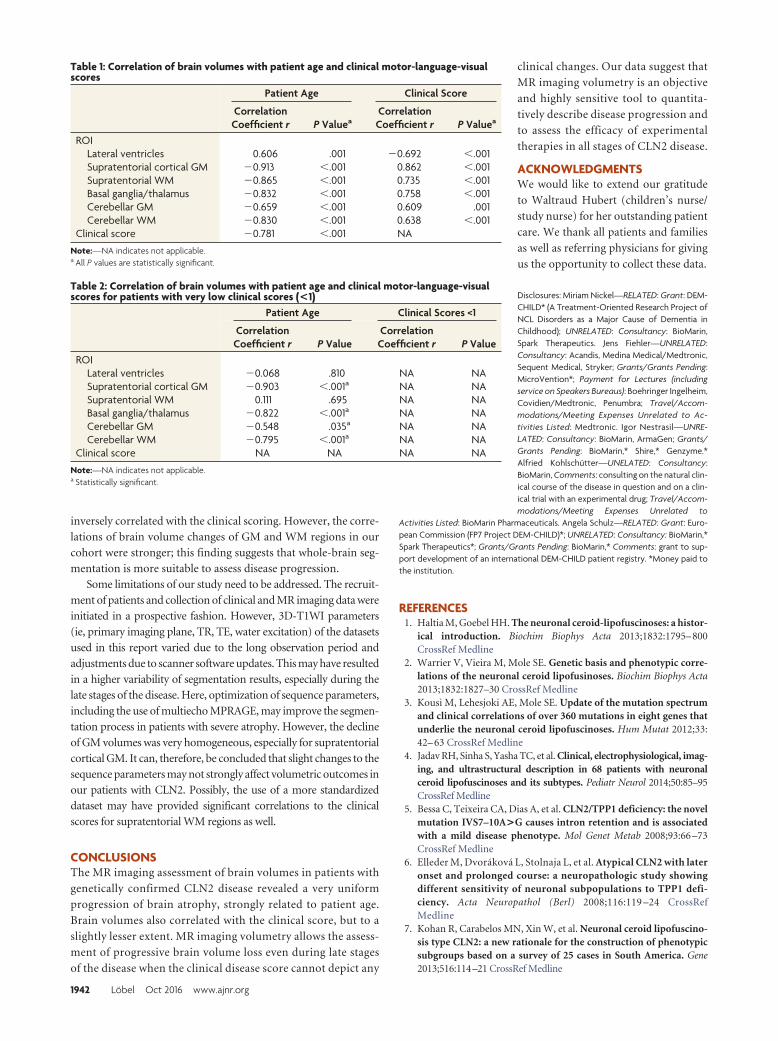
inversely correlated with the clinical scoring. However, the corre-lations of brain volume changes of GM and WM regions in ourcohort were stronger; this finding suggests that whole-brain seg-mentation is more suitable to assess disease progression.
Some limitations of our study need to be addressed. The recruit-ment of patients and collection of clinical and MR imaging data wereinitiated in a prospective fashion. However, 3D-T1WI parameters(ie, primary imaging plane, TR, TE, water excitation) of the datasetsused in this report varied due to the long observation period andadjustments due to scanner software updates. This may have resultedin a higher variability of segmentation results, especially during thelate stages of the disease. Here, optimization of sequence parameters,including the use of multiecho MPRAGE, may improve the segmen-tation process in patients with severe atrophy. However, the declineof GM volumes was very homogeneous, especially for supratentorialcortical GM. It can, therefore, be concluded that slight changes to thesequence parameters may not strongly affect volumetric outcomes inour patients with CLN2. Possibly, the use of a more standardizeddataset may have provided significant correlations to the clinicalscores for supratentorial WM regions as well.
CONCLUSIONSThe MR imaging assessment of brain volumes in patients with
genetically confirmed CLN2 disease revealed a very uniform
progression of brain atrophy, strongly related to patient age.
Brain volumes also correlated with the clinical score, but to a
slightly lesser extent. MR imaging volumetry allows the assess-
ment of progressive brain volume loss even during late stages
of the disease when the clinical disease score cannot depict any
clinical changes. Our data suggest that
MR imaging volumetry is an objective
and highly sensitive tool to quantita-
tively describe disease progression and
to assess the efficacy of experimental
therapies in all stages of CLN2 disease.
ACKNOWLEDGMENTSWe would like to extend our gratitude
to Waltraud Hubert (children’s nurse/
study nurse) for her outstanding patient
care. We thank all patients and families
as well as referring physicians for giving
us the opportunity to collect these data.
Disclosures: Miriam Nickel—RELATED: Grant: DEM-CHILD* (A Treatment-Oriented Research Project ofNCL Disorders as a Major Cause of Dementia inChildhood); UNRELATED: Consultancy: BioMarin,Spark Therapeutics. Jens Fiehler—UNRELATED:Consultancy: Acandis, Medina Medical/Medtronic,Sequent Medical, Stryker; Grants/Grants Pending:MicroVention*; Payment for Lectures (includingservice on Speakers Bureaus): Boehringer Ingelheim,Covidien/Medtronic, Penumbra; Travel/Accom-modations/Meeting Expenses Unrelated to Ac-tivities Listed: Medtronic. Igor Nestrasil—UNRE-LATED: Consultancy: BioMarin, ArmaGen; Grants/Grants Pending: BioMarin,* Shire,* Genzyme.*Alfried Kohlschutter—UNELATED: Consultancy:BioMarin, Comments: consulting on the natural clin-ical course of the disease in question and on a clin-ical trial with an experimental drug; Travel/Accom-modations/Meeting Expenses Unrelated to
Activities Listed: BioMarin Pharmaceuticals. Angela Schulz—RELATED: Grant: Euro-pean Commission (FP7 Project DEM-CHILD)*; UNRELATED: Consultancy: BioMarin,*Spark Therapeutics*; Grants/Grants Pending: BioMarin,* Comments: grant to sup-port development of an international DEM-CHILD patient registry. *Money paid tothe institution.
REFERENCES1. Haltia M, Goebel HH. The neuronal ceroid-lipofuscinoses: a histor-
ical introduction. Biochim Biophys Acta 2013;1832:1795– 800CrossRef Medline
2. Warrier V, Vieira M, Mole SE. Genetic basis and phenotypic corre-lations of the neuronal ceroid lipofusinoses. Biochim Biophys Acta2013;1832:1827–30 CrossRef Medline
3. Kousi M, Lehesjoki AE, Mole SE. Update of the mutation spectrumand clinical correlations of over 360 mutations in eight genes thatunderlie the neuronal ceroid lipofuscinoses. Hum Mutat 2012;33:42– 63 CrossRef Medline
4. Jadav RH, Sinha S, Yasha TC, et al. Clinical, electrophysiological, imag-ing, and ultrastructural description in 68 patients with neuronalceroid lipofuscinoses and its subtypes. Pediatr Neurol 2014;50:85–95CrossRef Medline
5. Bessa C, Teixeira CA, Dias A, et al. CLN2/TPP1 deficiency: the novelmutation IVS7–10A>G causes intron retention and is associatedwith a mild disease phenotype. Mol Genet Metab 2008;93:66 –73CrossRef Medline
6. Elleder M, Dvorakova L, Stolnaja L, et al. Atypical CLN2 with lateronset and prolonged course: a neuropathologic study showingdifferent sensitivity of neuronal subpopulations to TPP1 defi-ciency. Acta Neuropathol (Berl) 2008;116:119 –24 CrossRefMedline
7. Kohan R, Carabelos MN, Xin W, et al. Neuronal ceroid lipofuscino-sis type CLN2: a new rationale for the construction of phenotypicsubgroups based on a survey of 25 cases in South America. Gene2013;516:114–21 CrossRef Medline
Table 1: Correlation of brain volumes with patient age and clinical motor-language-visualscores
Patient Age Clinical Score
CorrelationCoefficient r P Valuea
CorrelationCoefficient r P Valuea
ROILateral ventricles 0.606 .001 �0.692 �.001Supratentorial cortical GM �0.913 �.001 0.862 �.001Supratentorial WM �0.865 �.001 0.735 �.001Basal ganglia/thalamus �0.832 �.001 0.758 �.001Cerebellar GM �0.659 �.001 0.609 .001Cerebellar WM �0.830 �.001 0.638 �.001
Clinical score �0.781 �.001 NA
Note:—NA indicates not applicable.a All P values are statistically significant.
Table 2: Correlation of brain volumes with patient age and clinical motor-language-visualscores for patients with very low clinical scores (<1)
Patient Age Clinical Scores <1
CorrelationCoefficient r P Value
CorrelationCoefficient r P Value
ROILateral ventricles �0.068 .810 NA NASupratentorial cortical GM �0.903 �.001a NA NASupratentorial WM 0.111 .695 NA NABasal ganglia/thalamus �0.822 �.001a NA NACerebellar GM �0.548 .035a NA NACerebellar WM �0.795 �.001a NA NA
Clinical score NA NA NA NA
Note:—NA indicates not applicable.a Statistically significant.
1942 Lobel Oct 2016 www.ajnr.org
8. Schulz A, Kohlschutter A, Mink J, et al. NCL diseases: clinical perspec-tives. Biochim Biophys Acta 2013;1832:1801–06 CrossRef Medline
9. Paniagua Bravo A, Forkert ND, Schulz A, et al. Quantitative T2 mea-surements in juvenile and late infantile neuronal ceroid lipofusci-nosis. Clin Neuroradiol 2013;23:189 –96 CrossRef Medline
10. Dyke JP, Voss HU, Sondhi D, et al. Assessing disease severity in lateinfantile neuronal ceroid lipofuscinosis using quantitative MR dif-fusion-weighted imaging. AJNR Am J Neuroradiol 2007;28:1232–36CrossRef Medline
11. Autti T, Raininko R, Santavuori P, et al. MRI of neuronal ceroidlipofuscinosis, II: postmortem MRI and histopathological study ofthe brain in 16 cases of neuronal ceroid lipofuscinosis of juvenile orlate infantile type. Neuroradiology 1997;39:371–77 CrossRef Medline
12. Lobel U, Sedlacik J, Gullmar D, et al. Diffusion tensor imaging: thenormal evolution of ADC, RA, FA, and eigenvalues studied in mul-tiple anatomical regions of the brain. Neuroradiology 2009;51:253– 63 CrossRef Medline
13. Autti TH, Hamalainen J, Mannerkoski M, et al. JNCL patients showmarked brain volume alterations on longitudinal MRI in adoles-cence. J Neurol 2008;255:1226 –30 CrossRef Medline
14. Dyke JP, Sondhi D, Voss HU, et al. Assessment of disease severity inlate infantile neuronal ceroid lipofuscinosis using multiparametricMR imaging. AJNR Am J Neuroradiol 2013;34:884 – 89 CrossRefMedline
15. Steinfeld R, Heim P, von Gregory H, et al. Late infantile neuronalceroid lipofuscinosis: quantitative description of the clinical coursein patients with CLN2 mutations. Am J Med Genet 2002;112:347–54CrossRef Medline
16. Fischl B. FreeSurfer. Neuroimage 2012;62:774 – 81 CrossRef Medline17. Smith SM. Fast robust automated brain extraction. Hum Brain
Mapp 2002;17:143–55 CrossRef Medline18. Worgall S, Kekatpure MV, Heier L, et al. Neurological deterioration
in late infantile neuronal ceroid lipofuscinosis. Neurology 2007;69:521–35 CrossRef Medline
19. Anderson GW, Goebel HH, Simonati A. Human pathology in NCL.Biochim Biophys Acta 2013;1832:1807–26 CrossRef Medline
20. Brain Development Cooperative Group. Total and regional brainvolumes in a population-based normative sample from 4 to 18years: the NIH MRI Study of Normal Brain Development. CerebCortex 2012;22:1–12 CrossRef Medline
AJNR Am J Neuroradiol 37:1938 – 43 Oct 2016 www.ajnr.org 1943
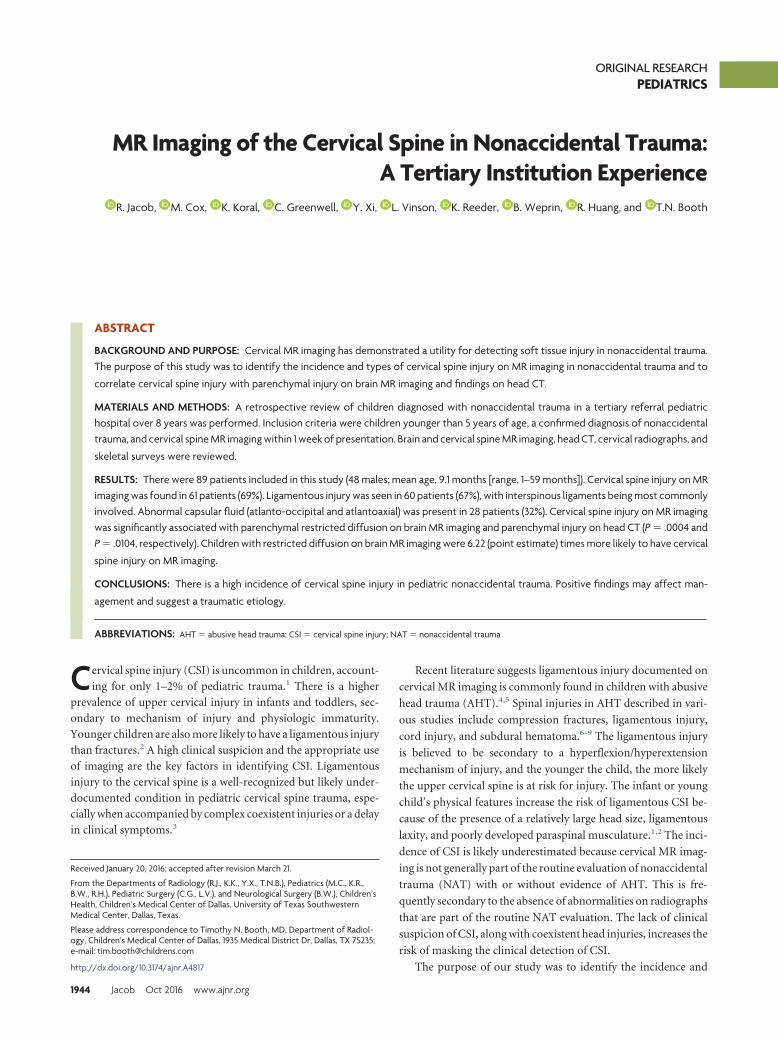
ORIGINAL RESEARCHPEDIATRICS
MR Imaging of the Cervical Spine in Nonaccidental Trauma:A Tertiary Institution Experience
X R. Jacob, X M. Cox, X K. Koral, X C. Greenwell, X Y. Xi, X L. Vinson, X K. Reeder, X B. Weprin, X R. Huang, and X T.N. Booth
ABSTRACT
BACKGROUND AND PURPOSE: Cervical MR imaging has demonstrated a utility for detecting soft tissue injury in nonaccidental trauma.The purpose of this study was to identify the incidence and types of cervical spine injury on MR imaging in nonaccidental trauma and to
correlate cervical spine injury with parenchymal injury on brain MR imaging and findings on head CT.
MATERIALS AND METHODS: A retrospective review of children diagnosed with nonaccidental trauma in a tertiary referral pediatrichospital over 8 years was performed. Inclusion criteria were children younger than 5 years of age, a confirmed diagnosis of nonaccidentaltrauma, and cervical spine MR imaging within 1 week of presentation. Brain and cervical spine MR imaging, head CT, cervical radiographs, and
skeletal surveys were reviewed.
RESULTS: There were 89 patients included in this study (48 males; mean age, 9.1 months [range, 1–59 months]). Cervical spine injury on MRimaging was found in 61 patients (69%). Ligamentous injury was seen in 60 patients (67%), with interspinous ligaments being most commonlyinvolved. Abnormal capsular fluid (atlanto-occipital and atlantoaxial) was present in 28 patients (32%). Cervical spine injury on MR imagingwas significantly associated with parenchymal restricted diffusion on brain MR imaging and parenchymal injury on head CT (P � .0004 andP � .0104, respectively). Children with restricted diffusion on brain MR imaging were 6.22 (point estimate) times more likely to have cervical
spine injury on MR imaging.
CONCLUSIONS: There is a high incidence of cervical spine injury in pediatric nonaccidental trauma. Positive findings may affect man-
agement and suggest a traumatic etiology.
ABBREVIATIONS: AHT � abusive head trauma; CSI � cervical spine injury; NAT � nonaccidental trauma
Cervical spine injury (CSI) is uncommon in children, account-
ing for only 1–2% of pediatric trauma.1 There is a higher
prevalence of upper cervical injury in infants and toddlers, sec-
ondary to mechanism of injury and physiologic immaturity.
Younger children are also more likely to have a ligamentous injury
than fractures.2 A high clinical suspicion and the appropriate use
of imaging are the key factors in identifying CSI. Ligamentous
injury to the cervical spine is a well-recognized but likely under-
documented condition in pediatric cervical spine trauma, espe-
cially when accompanied by complex coexistent injuries or a delay
in clinical symptoms.3
Recent literature suggests ligamentous injury documented on
cervical MR imaging is commonly found in children with abusive
head trauma (AHT).4,5 Spinal injuries in AHT described in vari-
ous studies include compression fractures, ligamentous injury,
cord injury, and subdural hematoma.6-9 The ligamentous injury
is believed to be secondary to a hyperflexion/hyperextension
mechanism of injury, and the younger the child, the more likely
the upper cervical spine is at risk for injury. The infant or young
child’s physical features increase the risk of ligamentous CSI be-
cause of the presence of a relatively large head size, ligamentous
laxity, and poorly developed paraspinal musculature.1,2 The inci-
dence of CSI is likely underestimated because cervical MR imag-
ing is not generally part of the routine evaluation of nonaccidental
trauma (NAT) with or without evidence of AHT. This is fre-
quently secondary to the absence of abnormalities on radiographs
that are part of the routine NAT evaluation. The lack of clinical
suspicion of CSI, along with coexistent head injuries, increases the
risk of masking the clinical detection of CSI.
The purpose of our study was to identify the incidence and
Received January 20, 2016; accepted after revision March 21.
From the Departments of Radiology (R.J., K.K., Y.X., T.N.B.), Pediatrics (M.C., K.R.,B.W., R.H.), Pediatric Surgery (C.G., L.V.), and Neurological Surgery (B.W.), Children’sHealth, Children’s Medical Center of Dallas, University of Texas SouthwesternMedical Center, Dallas, Texas.
Please address correspondence to Timothy N. Booth, MD, Department of Radiol-ogy, Children’s Medical Center of Dallas, 1935 Medical District Dr, Dallas, TX 75235;e-mail: [email protected]
http://dx.doi.org/10.3174/ajnr.A4817
1944 Jacob Oct 2016 www.ajnr.org
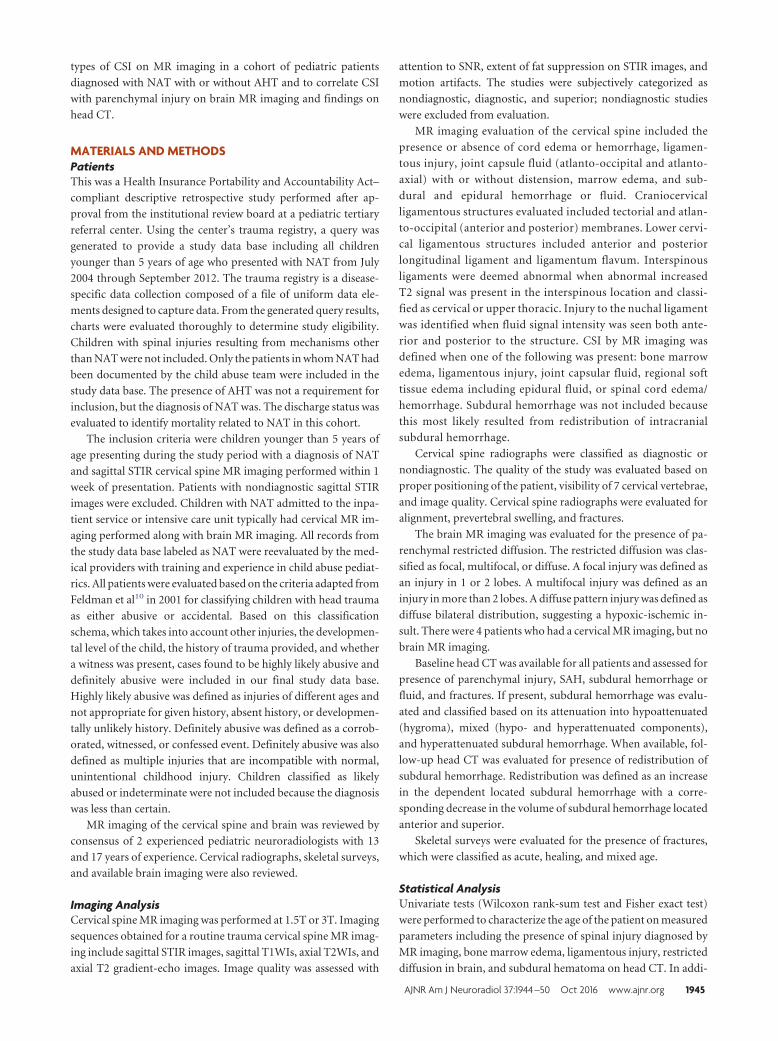
types of CSI on MR imaging in a cohort of pediatric patients
diagnosed with NAT with or without AHT and to correlate CSI
with parenchymal injury on brain MR imaging and findings on
head CT.
MATERIALS AND METHODSPatientsThis was a Health Insurance Portability and Accountability Act–
compliant descriptive retrospective study performed after ap-
proval from the institutional review board at a pediatric tertiary
referral center. Using the center’s trauma registry, a query was
generated to provide a study data base including all children
younger than 5 years of age who presented with NAT from July
2004 through September 2012. The trauma registry is a disease-
specific data collection composed of a file of uniform data ele-
ments designed to capture data. From the generated query results,
charts were evaluated thoroughly to determine study eligibility.
Children with spinal injuries resulting from mechanisms other
than NAT were not included. Only the patients in whom NAT had
been documented by the child abuse team were included in the
study data base. The presence of AHT was not a requirement for
inclusion, but the diagnosis of NAT was. The discharge status was
evaluated to identify mortality related to NAT in this cohort.
The inclusion criteria were children younger than 5 years of
age presenting during the study period with a diagnosis of NAT
and sagittal STIR cervical spine MR imaging performed within 1
week of presentation. Patients with nondiagnostic sagittal STIR
images were excluded. Children with NAT admitted to the inpa-
tient service or intensive care unit typically had cervical MR im-
aging performed along with brain MR imaging. All records from
the study data base labeled as NAT were reevaluated by the med-
ical providers with training and experience in child abuse pediat-
rics. All patients were evaluated based on the criteria adapted from
Feldman et al10 in 2001 for classifying children with head trauma
as either abusive or accidental. Based on this classification
schema, which takes into account other injuries, the developmen-
tal level of the child, the history of trauma provided, and whether
a witness was present, cases found to be highly likely abusive and
definitely abusive were included in our final study data base.
Highly likely abusive was defined as injuries of different ages and
not appropriate for given history, absent history, or developmen-
tally unlikely history. Definitely abusive was defined as a corrob-
orated, witnessed, or confessed event. Definitely abusive was also
defined as multiple injuries that are incompatible with normal,
unintentional childhood injury. Children classified as likely
abused or indeterminate were not included because the diagnosis
was less than certain.
MR imaging of the cervical spine and brain was reviewed by
consensus of 2 experienced pediatric neuroradiologists with 13
and 17 years of experience. Cervical radiographs, skeletal surveys,
and available brain imaging were also reviewed.
Imaging AnalysisCervical spine MR imaging was performed at 1.5T or 3T. Imaging
sequences obtained for a routine trauma cervical spine MR imag-
ing include sagittal STIR images, sagittal T1WIs, axial T2WIs, and
axial T2 gradient-echo images. Image quality was assessed with
attention to SNR, extent of fat suppression on STIR images, and
motion artifacts. The studies were subjectively categorized as
nondiagnostic, diagnostic, and superior; nondiagnostic studies
were excluded from evaluation.
MR imaging evaluation of the cervical spine included the
presence or absence of cord edema or hemorrhage, ligamen-
tous injury, joint capsule fluid (atlanto-occipital and atlanto-
axial) with or without distension, marrow edema, and sub-
dural and epidural hemorrhage or fluid. Craniocervical
ligamentous structures evaluated included tectorial and atlan-
to-occipital (anterior and posterior) membranes. Lower cervi-
cal ligamentous structures included anterior and posterior
longitudinal ligament and ligamentum flavum. Interspinous
ligaments were deemed abnormal when abnormal increased
T2 signal was present in the interspinous location and classi-
fied as cervical or upper thoracic. Injury to the nuchal ligament
was identified when fluid signal intensity was seen both ante-
rior and posterior to the structure. CSI by MR imaging was
defined when one of the following was present: bone marrow
edema, ligamentous injury, joint capsular fluid, regional soft
tissue edema including epidural fluid, or spinal cord edema/
hemorrhage. Subdural hemorrhage was not included because
this most likely resulted from redistribution of intracranial
subdural hemorrhage.
Cervical spine radiographs were classified as diagnostic or
nondiagnostic. The quality of the study was evaluated based on
proper positioning of the patient, visibility of 7 cervical vertebrae,
and image quality. Cervical spine radiographs were evaluated for
alignment, prevertebral swelling, and fractures.
The brain MR imaging was evaluated for the presence of pa-
renchymal restricted diffusion. The restricted diffusion was clas-
sified as focal, multifocal, or diffuse. A focal injury was defined as
an injury in 1 or 2 lobes. A multifocal injury was defined as an
injury in more than 2 lobes. A diffuse pattern injury was defined as
diffuse bilateral distribution, suggesting a hypoxic-ischemic in-
sult. There were 4 patients who had a cervical MR imaging, but no
brain MR imaging.
Baseline head CT was available for all patients and assessed for
presence of parenchymal injury, SAH, subdural hemorrhage or
fluid, and fractures. If present, subdural hemorrhage was evalu-
ated and classified based on its attenuation into hypoattenuated
(hygroma), mixed (hypo- and hyperattenuated components),
and hyperattenuated subdural hemorrhage. When available, fol-
low-up head CT was evaluated for presence of redistribution of
subdural hemorrhage. Redistribution was defined as an increase
in the dependent located subdural hemorrhage with a corre-
sponding decrease in the volume of subdural hemorrhage located
anterior and superior.
Skeletal surveys were evaluated for the presence of fractures,
which were classified as acute, healing, and mixed age.
Statistical AnalysisUnivariate tests (Wilcoxon rank-sum test and Fisher exact test)
were performed to characterize the age of the patient on measured
parameters including the presence of spinal injury diagnosed by
MR imaging, bone marrow edema, ligamentous injury, restricted
diffusion in brain, and subdural hematoma on head CT. In addi-
AJNR Am J Neuroradiol 37:1944 –50 Oct 2016 www.ajnr.org 1945
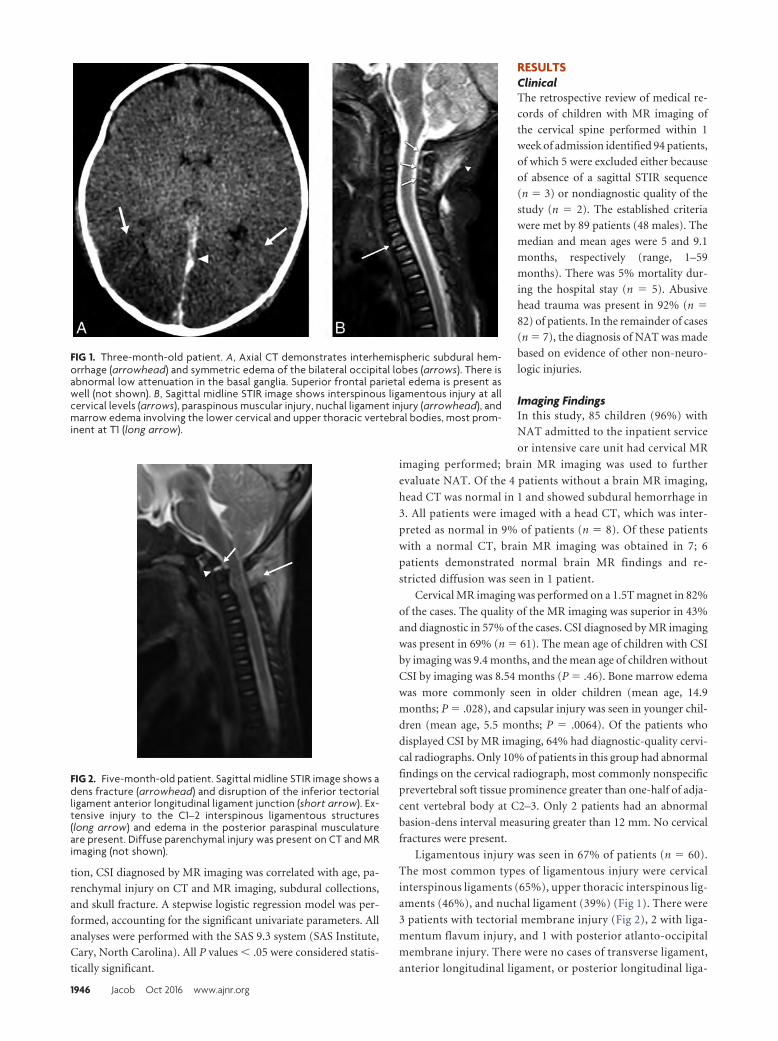
tion, CSI diagnosed by MR imaging was correlated with age, pa-
renchymal injury on CT and MR imaging, subdural collections,
and skull fracture. A stepwise logistic regression model was per-
formed, accounting for the significant univariate parameters. All
analyses were performed with the SAS 9.3 system (SAS Institute,
Cary, North Carolina). All P values � .05 were considered statis-
tically significant.
RESULTSClinicalThe retrospective review of medical re-
cords of children with MR imaging of
the cervical spine performed within 1
week of admission identified 94 patients,
of which 5 were excluded either because
of absence of a sagittal STIR sequence
(n � 3) or nondiagnostic quality of the
study (n � 2). The established criteria
were met by 89 patients (48 males). The
median and mean ages were 5 and 9.1
months, respectively (range, 1–59
months). There was 5% mortality dur-
ing the hospital stay (n � 5). Abusive
head trauma was present in 92% (n �
82) of patients. In the remainder of cases
(n � 7), the diagnosis of NAT was made
based on evidence of other non-neuro-
logic injuries.
Imaging FindingsIn this study, 85 children (96%) with
NAT admitted to the inpatient service
or intensive care unit had cervical MR
imaging performed; brain MR imaging was used to further
evaluate NAT. Of the 4 patients without a brain MR imaging,
head CT was normal in 1 and showed subdural hemorrhage in
3. All patients were imaged with a head CT, which was inter-
preted as normal in 9% of patients (n � 8). Of these patients
with a normal CT, brain MR imaging was obtained in 7; 6
patients demonstrated normal brain MR findings and re-
stricted diffusion was seen in 1 patient.
Cervical MR imaging was performed on a 1.5T magnet in 82%
of the cases. The quality of the MR imaging was superior in 43%
and diagnostic in 57% of the cases. CSI diagnosed by MR imaging
was present in 69% (n � 61). The mean age of children with CSI
by imaging was 9.4 months, and the mean age of children without
CSI by imaging was 8.54 months (P � .46). Bone marrow edema
was more commonly seen in older children (mean age, 14.9
months; P � .028), and capsular injury was seen in younger chil-
dren (mean age, 5.5 months; P � .0064). Of the patients who
displayed CSI by MR imaging, 64% had diagnostic-quality cervi-
cal radiographs. Only 10% of patients in this group had abnormal
findings on the cervical radiograph, most commonly nonspecific
prevertebral soft tissue prominence greater than one-half of adja-
cent vertebral body at C2–3. Only 2 patients had an abnormal
basion-dens interval measuring greater than 12 mm. No cervical
fractures were present.
Ligamentous injury was seen in 67% of patients (n � 60).
The most common types of ligamentous injury were cervical
interspinous ligaments (65%), upper thoracic interspinous lig-
aments (46%), and nuchal ligament (39%) (Fig 1). There were
3 patients with tectorial membrane injury (Fig 2), 2 with liga-
mentum flavum injury, and 1 with posterior atlanto-occipital
membrane injury. There were no cases of transverse ligament,
anterior longitudinal ligament, or posterior longitudinal liga-
FIG 1. Three-month-old patient. A, Axial CT demonstrates interhemispheric subdural hem-orrhage (arrowhead) and symmetric edema of the bilateral occipital lobes (arrows). There isabnormal low attenuation in the basal ganglia. Superior frontal parietal edema is present aswell (not shown). B, Sagittal midline STIR image shows interspinous ligamentous injury at allcervical levels (arrows), paraspinous muscular injury, nuchal ligament injury (arrowhead), andmarrow edema involving the lower cervical and upper thoracic vertebral bodies, most prom-inent at T1 (long arrow).
FIG 2. Five-month-old patient. Sagittal midline STIR image shows adens fracture (arrowhead) and disruption of the inferior tectorialligament anterior longitudinal ligament junction (short arrow). Ex-tensive injury to the C1–2 interspinous ligamentous structures(long arrow) and edema in the posterior paraspinal musculatureare present. Diffuse parenchymal injury was present on CT and MRimaging (not shown).
1946 Jacob Oct 2016 www.ajnr.org
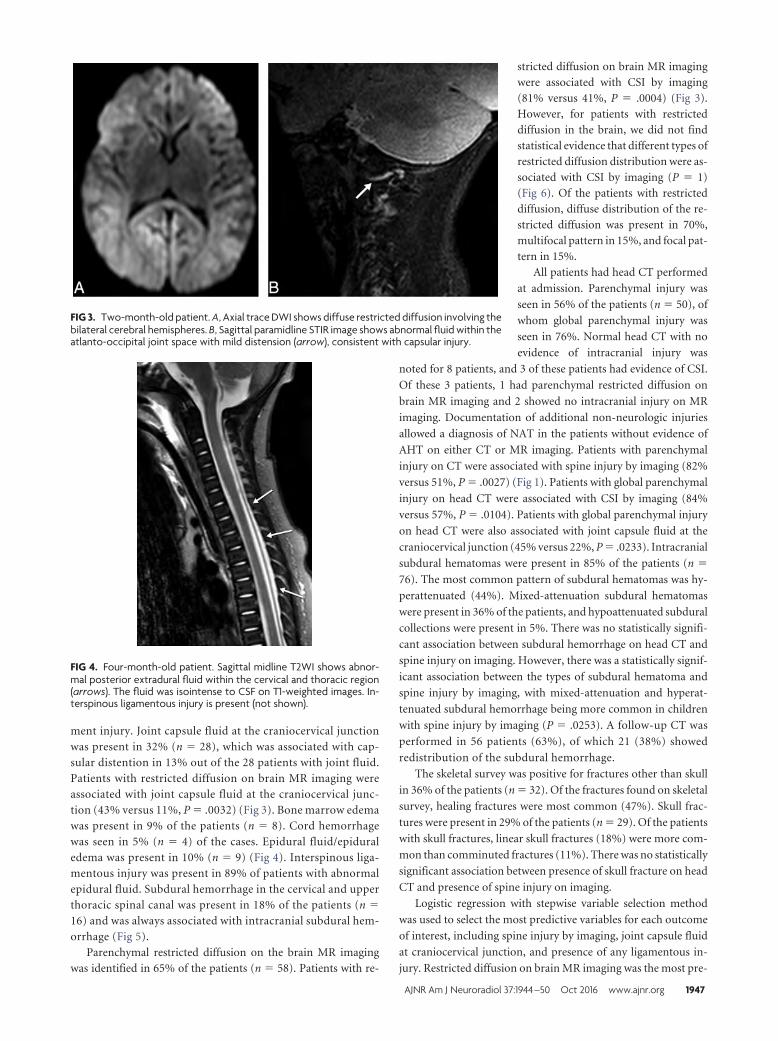
ment injury. Joint capsule fluid at the craniocervical junctionwas present in 32% (n � 28), which was associated with cap-sular distention in 13% out of the 28 patients with joint fluid.Patients with restricted diffusion on brain MR imaging wereassociated with joint capsule fluid at the craniocervical junc-tion (43% versus 11%, P � .0032) (Fig 3). Bone marrow edemawas present in 9% of the patients (n � 8). Cord hemorrhagewas seen in 5% (n � 4) of the cases. Epidural fluid/epiduraledema was present in 10% (n � 9) (Fig 4). Interspinous liga-mentous injury was present in 89% of patients with abnormalepidural fluid. Subdural hemorrhage in the cervical and upperthoracic spinal canal was present in 18% of the patients (n �
16) and was always associated with intracranial subdural hem-orrhage (Fig 5).
Parenchymal restricted diffusion on the brain MR imagingwas identified in 65% of the patients (n � 58). Patients with re-
stricted diffusion on brain MR imagingwere associated with CSI by imaging(81% versus 41%, P � .0004) (Fig 3).However, for patients with restricteddiffusion in the brain, we did not findstatistical evidence that different types ofrestricted diffusion distribution were as-sociated with CSI by imaging (P � 1)(Fig 6). Of the patients with restricteddiffusion, diffuse distribution of the re-stricted diffusion was present in 70%,multifocal pattern in 15%, and focal pat-tern in 15%.
All patients had head CT performed
at admission. Parenchymal injury was
seen in 56% of the patients (n � 50), of
whom global parenchymal injury was
seen in 76%. Normal head CT with no
evidence of intracranial injury was
noted for 8 patients, and 3 of these patients had evidence of CSI.
Of these 3 patients, 1 had parenchymal restricted diffusion on
brain MR imaging and 2 showed no intracranial injury on MR
imaging. Documentation of additional non-neurologic injuries
allowed a diagnosis of NAT in the patients without evidence of
AHT on either CT or MR imaging. Patients with parenchymal
injury on CT were associated with spine injury by imaging (82%
versus 51%, P � .0027) (Fig 1). Patients with global parenchymal
injury on head CT were associated with CSI by imaging (84%
versus 57%, P � .0104). Patients with global parenchymal injury
on head CT were also associated with joint capsule fluid at the
craniocervical junction (45% versus 22%, P � .0233). Intracranial
subdural hematomas were present in 85% of the patients (n �
76). The most common pattern of subdural hematomas was hy-
perattenuated (44%). Mixed-attenuation subdural hematomas
were present in 36% of the patients, and hypoattenuated subdural
collections were present in 5%. There was no statistically signifi-
cant association between subdural hemorrhage on head CT and
spine injury on imaging. However, there was a statistically signif-
icant association between the types of subdural hematoma and
spine injury by imaging, with mixed-attenuation and hyperat-
tenuated subdural hemorrhage being more common in children
with spine injury by imaging (P � .0253). A follow-up CT was
performed in 56 patients (63%), of which 21 (38%) showed
redistribution of the subdural hemorrhage.
The skeletal survey was positive for fractures other than skull
in 36% of the patients (n � 32). Of the fractures found on skeletal
survey, healing fractures were most common (47%). Skull frac-
tures were present in 29% of the patients (n � 29). Of the patients
with skull fractures, linear skull fractures (18%) were more com-
mon than comminuted fractures (11%). There was no statistically
significant association between presence of skull fracture on head
CT and presence of spine injury on imaging.
Logistic regression with stepwise variable selection method
was used to select the most predictive variables for each outcome
of interest, including spine injury by imaging, joint capsule fluid
at craniocervical junction, and presence of any ligamentous in-
jury. Restricted diffusion on brain MR imaging was the most pre-
FIG 3. Two-month-old patient. A, Axial trace DWI shows diffuse restricted diffusion involving thebilateral cerebral hemispheres. B, Sagittal paramidline STIR image shows abnormal fluid within theatlanto-occipital joint space with mild distension (arrow), consistent with capsular injury.
FIG 4. Four-month-old patient. Sagittal midline T2WI shows abnor-mal posterior extradural fluid within the cervical and thoracic region(arrows). The fluid was isointense to CSF on T1-weighted images. In-terspinous ligamentous injury is present (not shown).
AJNR Am J Neuroradiol 37:1944 –50 Oct 2016 www.ajnr.org 1947
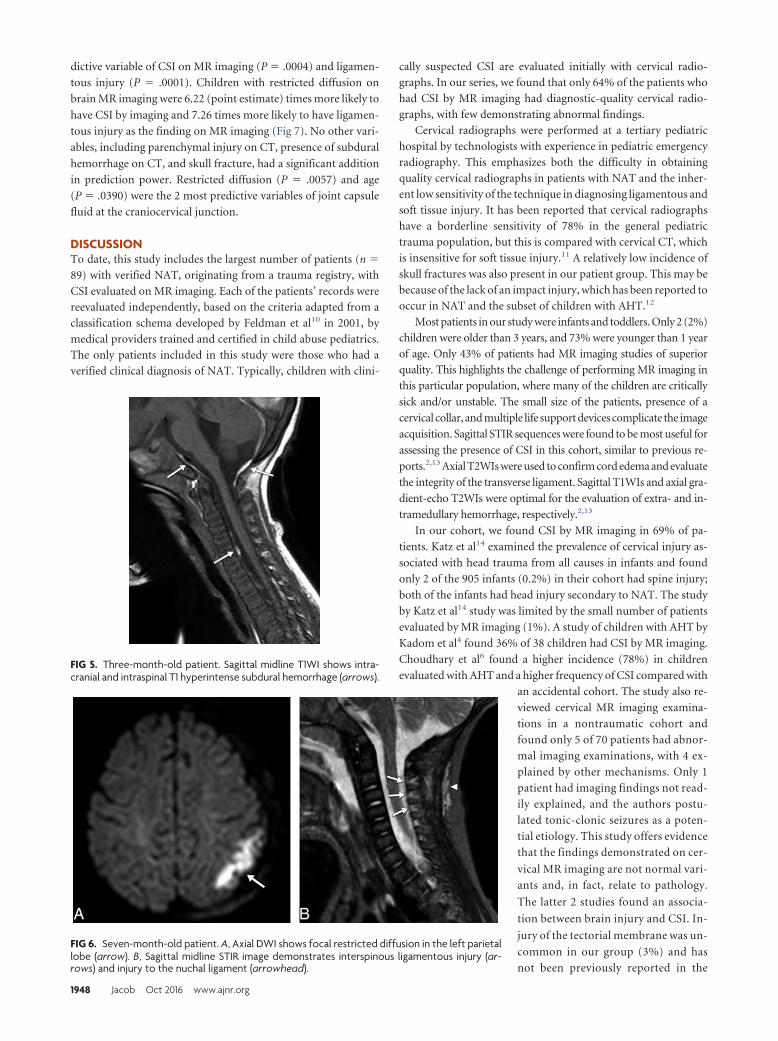
dictive variable of CSI on MR imaging (P � .0004) and ligamen-
tous injury (P � .0001). Children with restricted diffusion on
brain MR imaging were 6.22 (point estimate) times more likely to
have CSI by imaging and 7.26 times more likely to have ligamen-
tous injury as the finding on MR imaging (Fig 7). No other vari-
ables, including parenchymal injury on CT, presence of subdural
hemorrhage on CT, and skull fracture, had a significant addition
in prediction power. Restricted diffusion (P � .0057) and age
(P � .0390) were the 2 most predictive variables of joint capsule
fluid at the craniocervical junction.
DISCUSSIONTo date, this study includes the largest number of patients (n �
89) with verified NAT, originating from a trauma registry, with
CSI evaluated on MR imaging. Each of the patients’ records were
reevaluated independently, based on the criteria adapted from a
classification schema developed by Feldman et al10 in 2001, by
medical providers trained and certified in child abuse pediatrics.
The only patients included in this study were those who had a
verified clinical diagnosis of NAT. Typically, children with clini-
cally suspected CSI are evaluated initially with cervical radio-
graphs. In our series, we found that only 64% of the patients who
had CSI by MR imaging had diagnostic-quality cervical radio-
graphs, with few demonstrating abnormal findings.
Cervical radiographs were performed at a tertiary pediatric
hospital by technologists with experience in pediatric emergency
radiography. This emphasizes both the difficulty in obtaining
quality cervical radiographs in patients with NAT and the inher-
ent low sensitivity of the technique in diagnosing ligamentous and
soft tissue injury. It has been reported that cervical radiographs
have a borderline sensitivity of 78% in the general pediatric
trauma population, but this is compared with cervical CT, which
is insensitive for soft tissue injury.11 A relatively low incidence of
skull fractures was also present in our patient group. This may be
because of the lack of an impact injury, which has been reported to
occur in NAT and the subset of children with AHT.12
Most patients in our study were infants and toddlers. Only 2 (2%)
children were older than 3 years, and 73% were younger than 1 year
of age. Only 43% of patients had MR imaging studies of superior
quality. This highlights the challenge of performing MR imaging in
this particular population, where many of the children are critically
sick and/or unstable. The small size of the patients, presence of a
cervical collar, and multiple life support devices complicate the image
acquisition. Sagittal STIR sequences were found to be most useful for
assessing the presence of CSI in this cohort, similar to previous re-
ports.2,13 Axial T2WIs were used to confirm cord edema and evaluate
the integrity of the transverse ligament. Sagittal T1WIs and axial gra-
dient-echo T2WIs were optimal for the evaluation of extra- and in-
tramedullary hemorrhage, respectively.2,13
In our cohort, we found CSI by MR imaging in 69% of pa-
tients. Katz et al14 examined the prevalence of cervical injury as-
sociated with head trauma from all causes in infants and found
only 2 of the 905 infants (0.2%) in their cohort had spine injury;
both of the infants had head injury secondary to NAT. The study
by Katz et al14 study was limited by the small number of patients
evaluated by MR imaging (1%). A study of children with AHT by
Kadom et al4 found 36% of 38 children had CSI by MR imaging.
Choudhary et al6 found a higher incidence (78%) in children
evaluated with AHT and a higher frequency of CSI compared with
an accidental cohort. The study also re-
viewed cervical MR imaging examina-
tions in a nontraumatic cohort and
found only 5 of 70 patients had abnor-
mal imaging examinations, with 4 ex-
plained by other mechanisms. Only 1
patient had imaging findings not read-
ily explained, and the authors postu-
lated tonic-clonic seizures as a poten-
tial etiology. This study offers evidence
that the findings demonstrated on cer-
vical MR imaging are not normal vari-
ants and, in fact, relate to pathology.
The latter 2 studies found an associa-
tion between brain injury and CSI. In-
jury of the tectorial membrane was un-
common in our group (3%) and has
not been previously reported in the
FIG 5. Three-month-old patient. Sagittal midline T1WI shows intra-cranial and intraspinal T1 hyperintense subdural hemorrhage (arrows).
FIG 6. Seven-month-old patient. A, Axial DWI shows focal restricted diffusion in the left parietallobe (arrow). B, Sagittal midline STIR image demonstrates interspinous ligamentous injury (ar-rows) and injury to the nuchal ligament (arrowhead).
1948 Jacob Oct 2016 www.ajnr.org
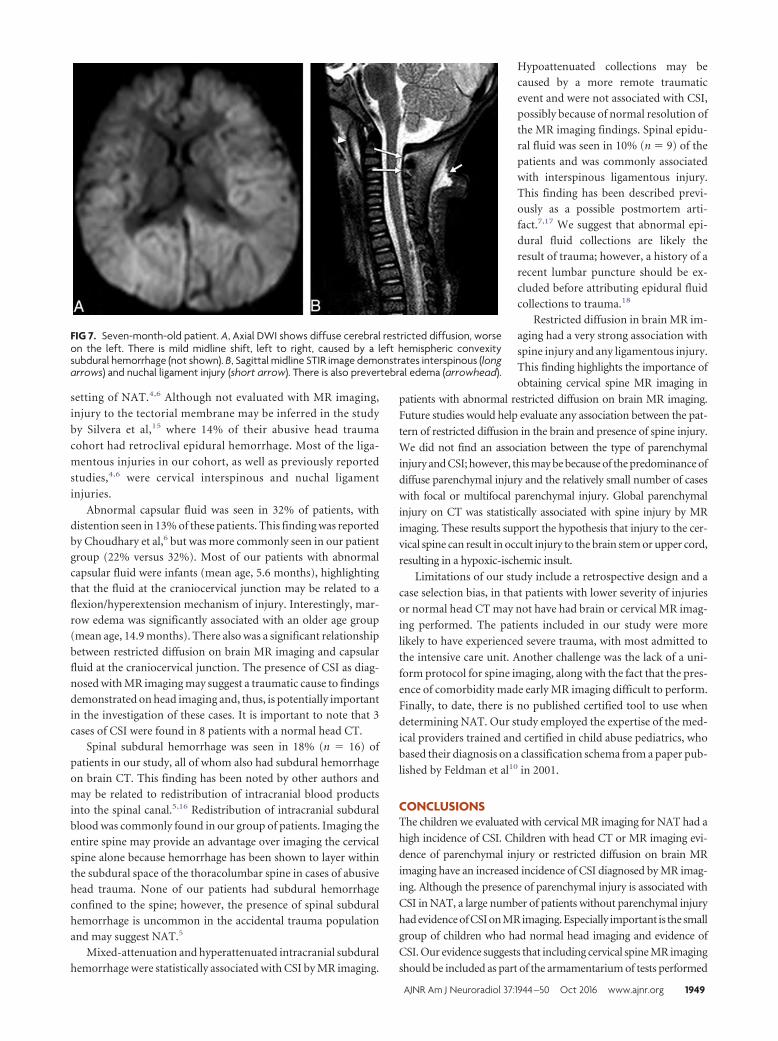
setting of NAT.4,6 Although not evaluated with MR imaging,
injury to the tectorial membrane may be inferred in the study
by Silvera et al,15 where 14% of their abusive head trauma
cohort had retroclival epidural hemorrhage. Most of the liga-
mentous injuries in our cohort, as well as previously reported
studies,4,6 were cervical interspinous and nuchal ligament
injuries.
Abnormal capsular fluid was seen in 32% of patients, withdistention seen in 13% of these patients. This finding was reportedby Choudhary et al,6 but was more commonly seen in our patientgroup (22% versus 32%). Most of our patients with abnormalcapsular fluid were infants (mean age, 5.6 months), highlightingthat the fluid at the craniocervical junction may be related to aflexion/hyperextension mechanism of injury. Interestingly, mar-row edema was significantly associated with an older age group(mean age, 14.9 months). There also was a significant relationshipbetween restricted diffusion on brain MR imaging and capsularfluid at the craniocervical junction. The presence of CSI as diag-nosed with MR imaging may suggest a traumatic cause to findingsdemonstrated on head imaging and, thus, is potentially importantin the investigation of these cases. It is important to note that 3cases of CSI were found in 8 patients with a normal head CT.
Spinal subdural hemorrhage was seen in 18% (n � 16) ofpatients in our study, all of whom also had subdural hemorrhageon brain CT. This finding has been noted by other authors andmay be related to redistribution of intracranial blood productsinto the spinal canal.5,16 Redistribution of intracranial subduralblood was commonly found in our group of patients. Imaging theentire spine may provide an advantage over imaging the cervicalspine alone because hemorrhage has been shown to layer withinthe subdural space of the thoracolumbar spine in cases of abusivehead trauma. None of our patients had subdural hemorrhageconfined to the spine; however, the presence of spinal subduralhemorrhage is uncommon in the accidental trauma populationand may suggest NAT.5
Mixed-attenuation and hyperattenuated intracranial subduralhemorrhage were statistically associated with CSI by MR imaging.
Hypoattenuated collections may becaused by a more remote traumaticevent and were not associated with CSI,possibly because of normal resolution ofthe MR imaging findings. Spinal epidu-ral fluid was seen in 10% (n � 9) of thepatients and was commonly associatedwith interspinous ligamentous injury.This finding has been described previ-ously as a possible postmortem arti-fact.7,17 We suggest that abnormal epi-dural fluid collections are likely theresult of trauma; however, a history of arecent lumbar puncture should be ex-cluded before attributing epidural fluidcollections to trauma.18
Restricted diffusion in brain MR im-aging had a very strong association withspine injury and any ligamentous injury.This finding highlights the importance ofobtaining cervical spine MR imaging in
patients with abnormal restricted diffusion on brain MR imaging.
Future studies would help evaluate any association between the pat-
tern of restricted diffusion in the brain and presence of spine injury.
We did not find an association between the type of parenchymal
injury and CSI; however, this may be because of the predominance of
diffuse parenchymal injury and the relatively small number of cases
with focal or multifocal parenchymal injury. Global parenchymal
injury on CT was statistically associated with spine injury by MR
imaging. These results support the hypothesis that injury to the cer-
vical spine can result in occult injury to the brain stem or upper cord,
resulting in a hypoxic-ischemic insult.
Limitations of our study include a retrospective design and a
case selection bias, in that patients with lower severity of injuries
or normal head CT may not have had brain or cervical MR imag-
ing performed. The patients included in our study were more
likely to have experienced severe trauma, with most admitted to
the intensive care unit. Another challenge was the lack of a uni-
form protocol for spine imaging, along with the fact that the pres-
ence of comorbidity made early MR imaging difficult to perform.
Finally, to date, there is no published certified tool to use when
determining NAT. Our study employed the expertise of the med-
ical providers trained and certified in child abuse pediatrics, who
based their diagnosis on a classification schema from a paper pub-
lished by Feldman et al10 in 2001.
CONCLUSIONSThe children we evaluated with cervical MR imaging for NAT had a
high incidence of CSI. Children with head CT or MR imaging evi-
dence of parenchymal injury or restricted diffusion on brain MR
imaging have an increased incidence of CSI diagnosed by MR imag-
ing. Although the presence of parenchymal injury is associated with
CSI in NAT, a large number of patients without parenchymal injury
had evidence of CSI on MR imaging. Especially important is the small
group of children who had normal head imaging and evidence of
CSI. Our evidence suggests that including cervical spine MR imaging
should be included as part of the armamentarium of tests performed
FIG 7. Seven-month-old patient. A, Axial DWI shows diffuse cerebral restricted diffusion, worseon the left. There is mild midline shift, left to right, caused by a left hemispheric convexitysubdural hemorrhage (not shown). B, Sagittal midline STIR image demonstrates interspinous (longarrows) and nuchal ligament injury (short arrow). There is also prevertebral edema (arrowhead).
AJNR Am J Neuroradiol 37:1944 –50 Oct 2016 www.ajnr.org 1949
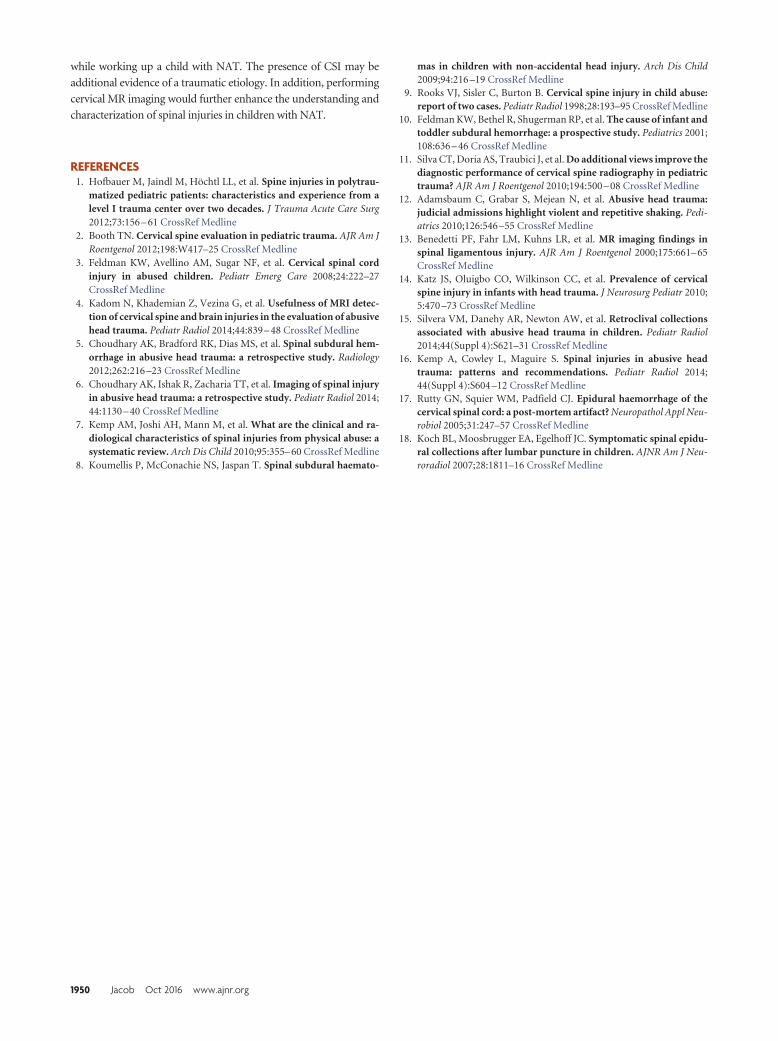
while working up a child with NAT. The presence of CSI may be
additional evidence of a traumatic etiology. In addition, performing
cervical MR imaging would further enhance the understanding and
characterization of spinal injuries in children with NAT.
REFERENCES1. Hofbauer M, Jaindl M, Hochtl LL, et al. Spine injuries in polytrau-
matized pediatric patients: characteristics and experience from alevel I trauma center over two decades. J Trauma Acute Care Surg2012;73:156 – 61 CrossRef Medline
2. Booth TN. Cervical spine evaluation in pediatric trauma. AJR Am JRoentgenol 2012;198:W417–25 CrossRef Medline
3. Feldman KW, Avellino AM, Sugar NF, et al. Cervical spinal cordinjury in abused children. Pediatr Emerg Care 2008;24:222–27CrossRef Medline
4. Kadom N, Khademian Z, Vezina G, et al. Usefulness of MRI detec-tion of cervical spine and brain injuries in the evaluation of abusivehead trauma. Pediatr Radiol 2014;44:839 – 48 CrossRef Medline
5. Choudhary AK, Bradford RK, Dias MS, et al. Spinal subdural hem-orrhage in abusive head trauma: a retrospective study. Radiology2012;262:216 –23 CrossRef Medline
6. Choudhary AK, Ishak R, Zacharia TT, et al. Imaging of spinal injuryin abusive head trauma: a retrospective study. Pediatr Radiol 2014;44:1130 – 40 CrossRef Medline
7. Kemp AM, Joshi AH, Mann M, et al. What are the clinical and ra-diological characteristics of spinal injuries from physical abuse: asystematic review. Arch Dis Child 2010;95:355– 60 CrossRef Medline
8. Koumellis P, McConachie NS, Jaspan T. Spinal subdural haemato-
mas in children with non-accidental head injury. Arch Dis Child2009;94:216 –19 CrossRef Medline
9. Rooks VJ, Sisler C, Burton B. Cervical spine injury in child abuse:report of two cases. Pediatr Radiol 1998;28:193–95 CrossRef Medline
10. Feldman KW, Bethel R, Shugerman RP, et al. The cause of infant andtoddler subdural hemorrhage: a prospective study. Pediatrics 2001;108:636 – 46 CrossRef Medline
11. Silva CT, Doria AS, Traubici J, et al. Do additional views improve thediagnostic performance of cervical spine radiography in pediatrictrauma? AJR Am J Roentgenol 2010;194:500 – 08 CrossRef Medline
12. Adamsbaum C, Grabar S, Mejean N, et al. Abusive head trauma:judicial admissions highlight violent and repetitive shaking. Pedi-atrics 2010;126:546 –55 CrossRef Medline
13. Benedetti PF, Fahr LM, Kuhns LR, et al. MR imaging findings inspinal ligamentous injury. AJR Am J Roentgenol 2000;175:661– 65CrossRef Medline
14. Katz JS, Oluigbo CO, Wilkinson CC, et al. Prevalence of cervicalspine injury in infants with head trauma. J Neurosurg Pediatr 2010;5:470 –73 CrossRef Medline
15. Silvera VM, Danehy AR, Newton AW, et al. Retroclival collectionsassociated with abusive head trauma in children. Pediatr Radiol2014;44(Suppl 4):S621–31 CrossRef Medline
16. Kemp A, Cowley L, Maguire S. Spinal injuries in abusive headtrauma: patterns and recommendations. Pediatr Radiol 2014;44(Suppl 4):S604 –12 CrossRef Medline
17. Rutty GN, Squier WM, Padfield CJ. Epidural haemorrhage of thecervical spinal cord: a post-mortem artifact? Neuropathol Appl Neu-robiol 2005;31:247–57 CrossRef Medline
18. Koch BL, Moosbrugger EA, Egelhoff JC. Symptomatic spinal epidu-ral collections after lumbar puncture in children. AJNR Am J Neu-roradiol 2007;28:1811–16 CrossRef Medline
1950 Jacob Oct 2016 www.ajnr.org
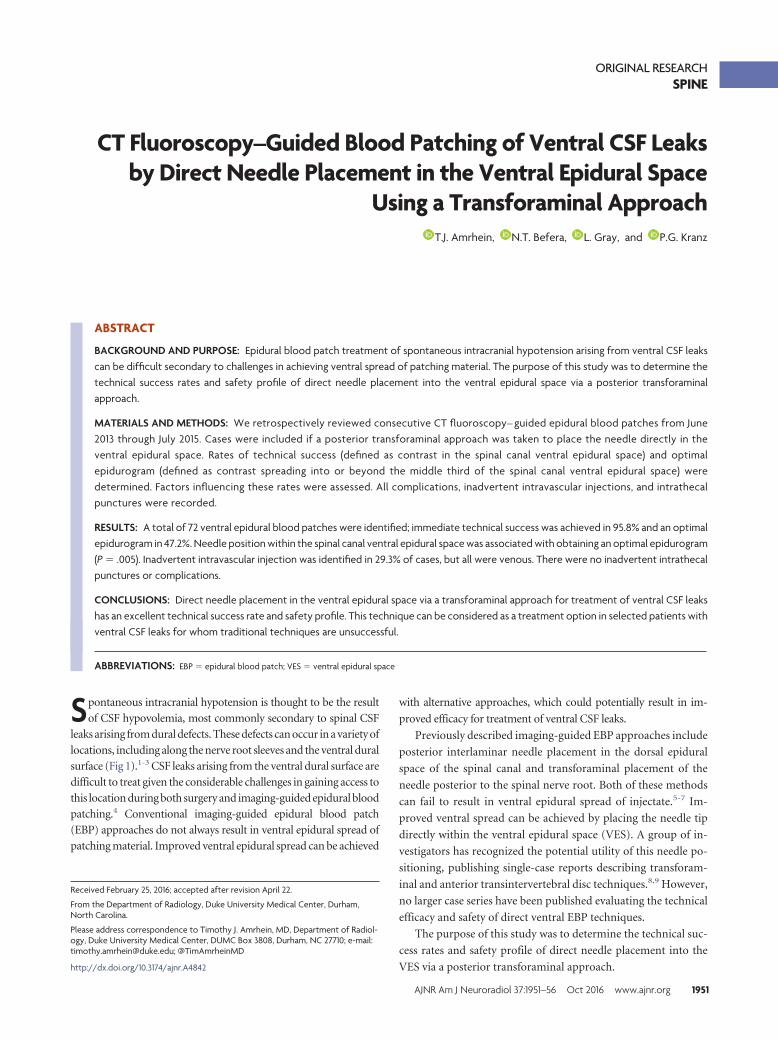
ORIGINAL RESEARCHSPINE
CT Fluoroscopy–Guided Blood Patching of Ventral CSF Leaksby Direct Needle Placement in the Ventral Epidural Space
Using a Transforaminal ApproachX T.J. Amrhein, X N.T. Befera, X L. Gray, and X P.G. Kranz
ABSTRACT
BACKGROUND AND PURPOSE: Epidural blood patch treatment of spontaneous intracranial hypotension arising from ventral CSF leakscan be difficult secondary to challenges in achieving ventral spread of patching material. The purpose of this study was to determine thetechnical success rates and safety profile of direct needle placement into the ventral epidural space via a posterior transforaminalapproach.
MATERIALS AND METHODS: We retrospectively reviewed consecutive CT fluoroscopy– guided epidural blood patches from June2013 through July 2015. Cases were included if a posterior transforaminal approach was taken to place the needle directly in theventral epidural space. Rates of technical success (defined as contrast in the spinal canal ventral epidural space) and optimalepidurogram (defined as contrast spreading into or beyond the middle third of the spinal canal ventral epidural space) weredetermined. Factors influencing these rates were assessed. All complications, inadvertent intravascular injections, and intrathecalpunctures were recorded.
RESULTS: A total of 72 ventral epidural blood patches were identified; immediate technical success was achieved in 95.8% and an optimalepidurogram in 47.2%. Needle position within the spinal canal ventral epidural space was associated with obtaining an optimal epidurogram(P � .005). Inadvertent intravascular injection was identified in 29.3% of cases, but all were venous. There were no inadvertent intrathecalpunctures or complications.
CONCLUSIONS: Direct needle placement in the ventral epidural space via a transforaminal approach for treatment of ventral CSF leakshas an excellent technical success rate and safety profile. This technique can be considered as a treatment option in selected patients withventral CSF leaks for whom traditional techniques are unsuccessful.
ABBREVIATIONS: EBP � epidural blood patch; VES � ventral epidural space
Spontaneous intracranial hypotension is thought to be the result
of CSF hypovolemia, most commonly secondary to spinal CSF
leaks arising from dural defects. These defects can occur in a variety of
locations, including along the nerve root sleeves and the ventral dural
surface (Fig 1).1-3 CSF leaks arising from the ventral dural surface are
difficult to treat given the considerable challenges in gaining access to
this location during both surgery and imaging-guided epidural blood
patching.4 Conventional imaging-guided epidural blood patch
(EBP) approaches do not always result in ventral epidural spread of
patching material. Improved ventral epidural spread can be achieved
with alternative approaches, which could potentially result in im-
proved efficacy for treatment of ventral CSF leaks.
Previously described imaging-guided EBP approaches include
posterior interlaminar needle placement in the dorsal epidural
space of the spinal canal and transforaminal placement of the
needle posterior to the spinal nerve root. Both of these methods
can fail to result in ventral epidural spread of injectate.5-7 Im-
proved ventral spread can be achieved by placing the needle tip
directly within the ventral epidural space (VES). A group of in-
vestigators has recognized the potential utility of this needle po-
sitioning, publishing single-case reports describing transforam-
inal and anterior transintervertebral disc techniques.8,9 However,
no larger case series have been published evaluating the technical
efficacy and safety of direct ventral EBP techniques.
The purpose of this study was to determine the technical suc-
cess rates and safety profile of direct needle placement into the
VES via a posterior transforaminal approach.
Received February 25, 2016; accepted after revision April 22.
From the Department of Radiology, Duke University Medical Center, Durham,North Carolina.
Please address correspondence to Timothy J. Amrhein, MD, Department of Radiol-ogy, Duke University Medical Center, DUMC Box 3808, Durham, NC 27710; e-mail:[email protected]; @TimAmrheinMD
http://dx.doi.org/10.3174/ajnr.A4842
AJNR Am J Neuroradiol 37:1951–56 Oct 2016 www.ajnr.org 1951
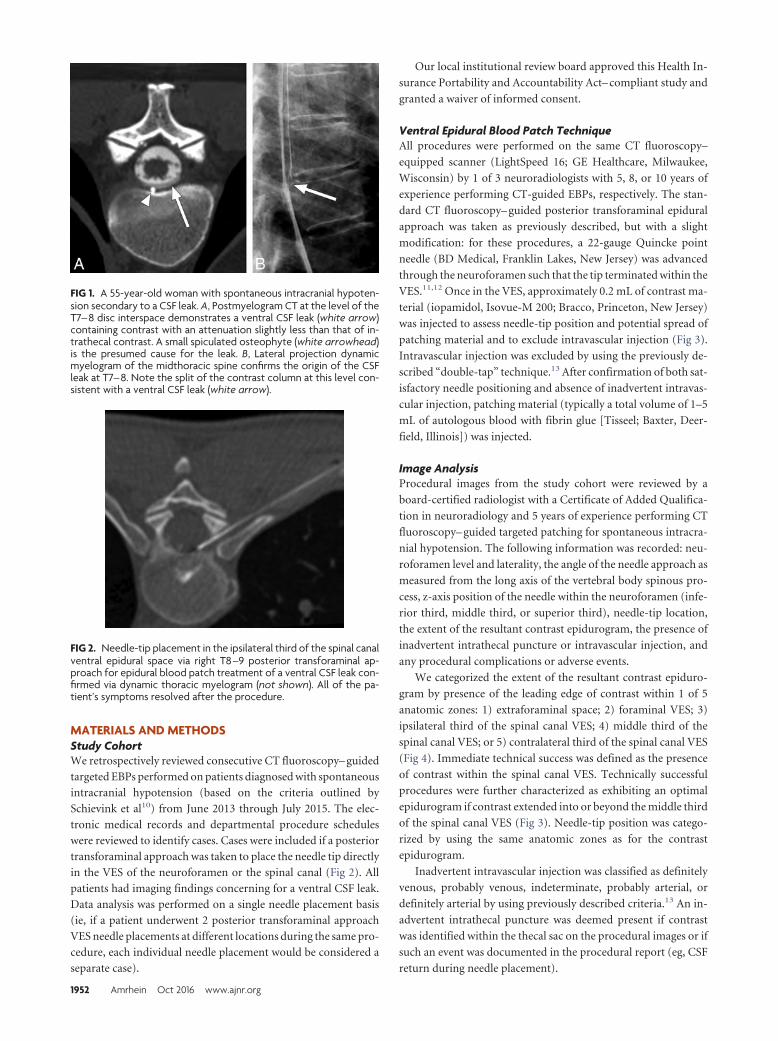
MATERIALS AND METHODSStudy CohortWe retrospectively reviewed consecutive CT fluoroscopy– guided
targeted EBPs performed on patients diagnosed with spontaneous
intracranial hypotension (based on the criteria outlined by
Schievink et al10) from June 2013 through July 2015. The elec-
tronic medical records and departmental procedure schedules
were reviewed to identify cases. Cases were included if a posterior
transforaminal approach was taken to place the needle tip directly
in the VES of the neuroforamen or the spinal canal (Fig 2). All
patients had imaging findings concerning for a ventral CSF leak.
Data analysis was performed on a single needle placement basis
(ie, if a patient underwent 2 posterior transforaminal approach
VES needle placements at different locations during the same pro-
cedure, each individual needle placement would be considered a
separate case).
Our local institutional review board approved this Health In-
surance Portability and Accountability Act– compliant study and
granted a waiver of informed consent.
Ventral Epidural Blood Patch TechniqueAll procedures were performed on the same CT fluoroscopy–
equipped scanner (LightSpeed 16; GE Healthcare, Milwaukee,
Wisconsin) by 1 of 3 neuroradiologists with 5, 8, or 10 years of
experience performing CT-guided EBPs, respectively. The stan-
dard CT fluoroscopy– guided posterior transforaminal epidural
approach was taken as previously described, but with a slight
modification: for these procedures, a 22-gauge Quincke point
needle (BD Medical, Franklin Lakes, New Jersey) was advanced
through the neuroforamen such that the tip terminated within the
VES.11,12 Once in the VES, approximately 0.2 mL of contrast ma-
terial (iopamidol, Isovue-M 200; Bracco, Princeton, New Jersey)
was injected to assess needle-tip position and potential spread of
patching material and to exclude intravascular injection (Fig 3).
Intravascular injection was excluded by using the previously de-
scribed “double-tap” technique.13 After confirmation of both sat-
isfactory needle positioning and absence of inadvertent intravas-
cular injection, patching material (typically a total volume of 1–5
mL of autologous blood with fibrin glue [Tisseel; Baxter, Deer-
field, Illinois]) was injected.
Image AnalysisProcedural images from the study cohort were reviewed by a
board-certified radiologist with a Certificate of Added Qualifica-
tion in neuroradiology and 5 years of experience performing CT
fluoroscopy– guided targeted patching for spontaneous intracra-
nial hypotension. The following information was recorded: neu-
roforamen level and laterality, the angle of the needle approach as
measured from the long axis of the vertebral body spinous pro-
cess, z-axis position of the needle within the neuroforamen (infe-
rior third, middle third, or superior third), needle-tip location,
the extent of the resultant contrast epidurogram, the presence of
inadvertent intrathecal puncture or intravascular injection, and
any procedural complications or adverse events.
We categorized the extent of the resultant contrast epiduro-
gram by presence of the leading edge of contrast within 1 of 5
anatomic zones: 1) extraforaminal space; 2) foraminal VES; 3)
ipsilateral third of the spinal canal VES; 4) middle third of the
spinal canal VES; or 5) contralateral third of the spinal canal VES
(Fig 4). Immediate technical success was defined as the presence
of contrast within the spinal canal VES. Technically successful
procedures were further characterized as exhibiting an optimal
epidurogram if contrast extended into or beyond the middle third
of the spinal canal VES (Fig 3). Needle-tip position was catego-
rized by using the same anatomic zones as for the contrast
epidurogram.
Inadvertent intravascular injection was classified as definitely
venous, probably venous, indeterminate, probably arterial, or
definitely arterial by using previously described criteria.13 An in-
advertent intrathecal puncture was deemed present if contrast
was identified within the thecal sac on the procedural images or if
such an event was documented in the procedural report (eg, CSF
return during needle placement).
FIG 1. A 55-year-old woman with spontaneous intracranial hypoten-sion secondary to a CSF leak. A, Postmyelogram CT at the level of theT7– 8 disc interspace demonstrates a ventral CSF leak (white arrow)containing contrast with an attenuation slightly less than that of in-trathecal contrast. A small spiculated osteophyte (white arrowhead)is the presumed cause for the leak. B, Lateral projection dynamicmyelogram of the midthoracic spine confirms the origin of the CSFleak at T7– 8. Note the split of the contrast column at this level con-sistent with a ventral CSF leak (white arrow).
FIG 2. Needle-tip placement in the ipsilateral third of the spinal canalventral epidural space via right T8 –9 posterior transforaminal ap-proach for epidural blood patch treatment of a ventral CSF leak con-firmed via dynamic thoracic myelogram (not shown). All of the pa-tient’s symptoms resolved after the procedure.
1952 Amrhein Oct 2016 www.ajnr.org
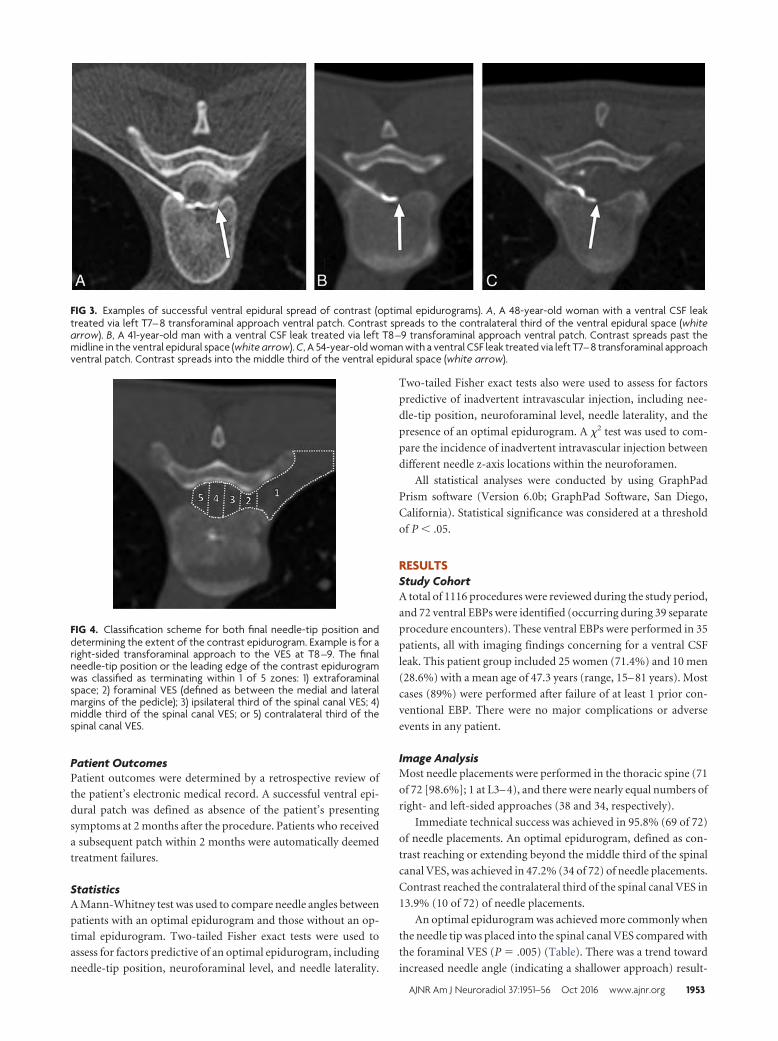
Patient OutcomesPatient outcomes were determined by a retrospective review of
the patient’s electronic medical record. A successful ventral epi-
dural patch was defined as absence of the patient’s presenting
symptoms at 2 months after the procedure. Patients who received
a subsequent patch within 2 months were automatically deemed
treatment failures.
StatisticsA Mann-Whitney test was used to compare needle angles between
patients with an optimal epidurogram and those without an op-
timal epidurogram. Two-tailed Fisher exact tests were used to
assess for factors predictive of an optimal epidurogram, including
needle-tip position, neuroforaminal level, and needle laterality.
Two-tailed Fisher exact tests also were used to assess for factors
predictive of inadvertent intravascular injection, including nee-
dle-tip position, neuroforaminal level, needle laterality, and the
presence of an optimal epidurogram. A �2 test was used to com-
pare the incidence of inadvertent intravascular injection between
different needle z-axis locations within the neuroforamen.
All statistical analyses were conducted by using GraphPad
Prism software (Version 6.0b; GraphPad Software, San Diego,
California). Statistical significance was considered at a threshold
of P � .05.
RESULTSStudy CohortA total of 1116 procedures were reviewed during the study period,
and 72 ventral EBPs were identified (occurring during 39 separate
procedure encounters). These ventral EBPs were performed in 35
patients, all with imaging findings concerning for a ventral CSF
leak. This patient group included 25 women (71.4%) and 10 men
(28.6%) with a mean age of 47.3 years (range, 15– 81 years). Most
cases (89%) were performed after failure of at least 1 prior con-
ventional EBP. There were no major complications or adverse
events in any patient.
Image AnalysisMost needle placements were performed in the thoracic spine (71
of 72 [98.6%]; 1 at L3– 4), and there were nearly equal numbers of
right- and left-sided approaches (38 and 34, respectively).
Immediate technical success was achieved in 95.8% (69 of 72)
of needle placements. An optimal epidurogram, defined as con-
trast reaching or extending beyond the middle third of the spinal
canal VES, was achieved in 47.2% (34 of 72) of needle placements.
Contrast reached the contralateral third of the spinal canal VES in
13.9% (10 of 72) of needle placements.
An optimal epidurogram was achieved more commonly when
the needle tip was placed into the spinal canal VES compared with
the foraminal VES (P � .005) (Table). There was a trend toward
increased needle angle (indicating a shallower approach) result-
FIG 3. Examples of successful ventral epidural spread of contrast (optimal epidurograms). A, A 48-year-old woman with a ventral CSF leaktreated via left T7– 8 transforaminal approach ventral patch. Contrast spreads to the contralateral third of the ventral epidural space (whitearrow). B, A 41-year-old man with a ventral CSF leak treated via left T8 –9 transforaminal approach ventral patch. Contrast spreads past themidline in the ventral epidural space (white arrow). C, A 54-year-old woman with a ventral CSF leak treated via left T7– 8 transforaminal approachventral patch. Contrast spreads into the middle third of the ventral epidural space (white arrow).
FIG 4. Classification scheme for both final needle-tip position anddetermining the extent of the contrast epidurogram. Example is for aright-sided transforaminal approach to the VES at T8 –9. The finalneedle-tip position or the leading edge of the contrast epidurogramwas classified as terminating within 1 of 5 zones: 1) extraforaminalspace; 2) foraminal VES (defined as between the medial and lateralmargins of the pedicle); 3) ipsilateral third of the spinal canal VES; 4)middle third of the spinal canal VES; or 5) contralateral third of thespinal canal VES.
AJNR Am J Neuroradiol 37:1951–56 Oct 2016 www.ajnr.org 1953
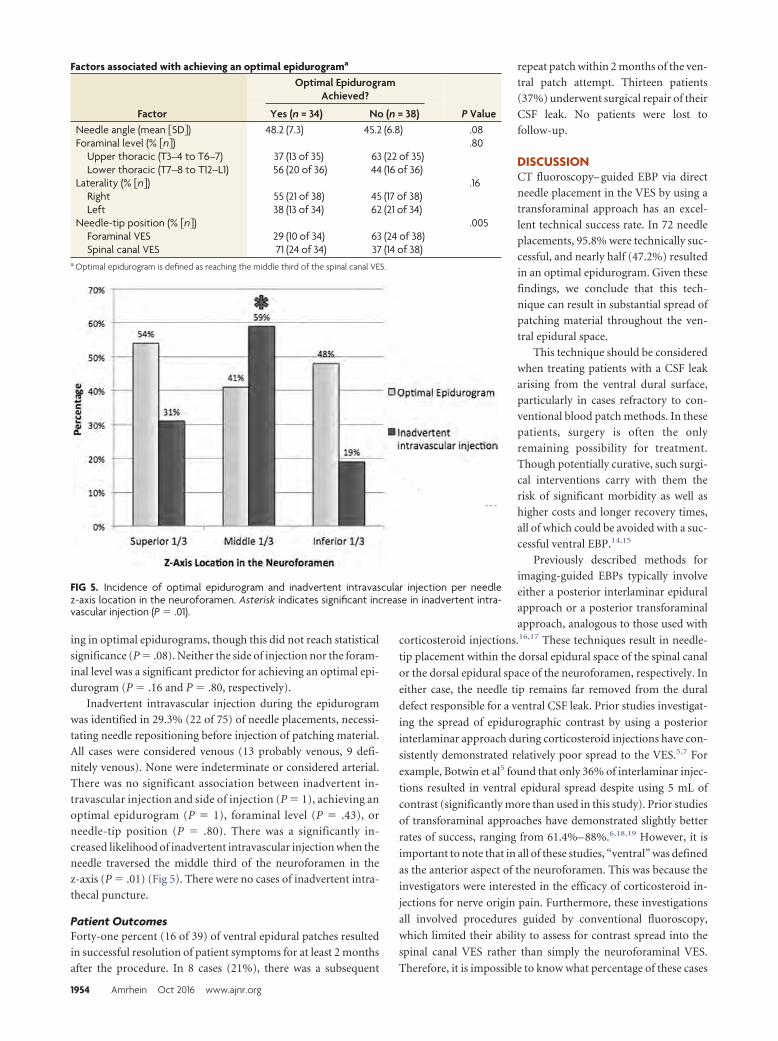
ing in optimal epidurograms, though this did not reach statistical
significance (P � .08). Neither the side of injection nor the foram-
inal level was a significant predictor for achieving an optimal epi-
durogram (P � .16 and P � .80, respectively).
Inadvertent intravascular injection during the epidurogram
was identified in 29.3% (22 of 75) of needle placements, necessi-
tating needle repositioning before injection of patching material.
All cases were considered venous (13 probably venous, 9 defi-
nitely venous). None were indeterminate or considered arterial.
There was no significant association between inadvertent in-
travascular injection and side of injection (P � 1), achieving an
optimal epidurogram (P � 1), foraminal level (P � .43), or
needle-tip position (P � .80). There was a significantly in-
creased likelihood of inadvertent intravascular injection when the
needle traversed the middle third of the neuroforamen in the
z-axis (P � .01) (Fig 5). There were no cases of inadvertent intra-
thecal puncture.
Patient OutcomesForty-one percent (16 of 39) of ventral epidural patches resulted
in successful resolution of patient symptoms for at least 2 months
after the procedure. In 8 cases (21%), there was a subsequent
repeat patch within 2 months of the ven-
tral patch attempt. Thirteen patients
(37%) underwent surgical repair of their
CSF leak. No patients were lost to
follow-up.
DISCUSSIONCT fluoroscopy– guided EBP via direct
needle placement in the VES by using a
transforaminal approach has an excel-
lent technical success rate. In 72 needle
placements, 95.8% were technically suc-
cessful, and nearly half (47.2%) resulted
in an optimal epidurogram. Given these
findings, we conclude that this tech-
nique can result in substantial spread of
patching material throughout the ven-
tral epidural space.
This technique should be considered
when treating patients with a CSF leak
arising from the ventral dural surface,
particularly in cases refractory to con-
ventional blood patch methods. In these
patients, surgery is often the only
remaining possibility for treatment.
Though potentially curative, such surgi-
cal interventions carry with them the
risk of significant morbidity as well as
higher costs and longer recovery times,
all of which could be avoided with a suc-
cessful ventral EBP.14,15
Previously described methods for
imaging-guided EBPs typically involve
either a posterior interlaminar epidural
approach or a posterior transforaminal
approach, analogous to those used with
corticosteroid injections.16,17 These techniques result in needle-
tip placement within the dorsal epidural space of the spinal canal
or the dorsal epidural space of the neuroforamen, respectively. In
either case, the needle tip remains far removed from the dural
defect responsible for a ventral CSF leak. Prior studies investigat-
ing the spread of epidurographic contrast by using a posterior
interlaminar approach during corticosteroid injections have con-
sistently demonstrated relatively poor spread to the VES.5,7 For
example, Botwin et al5 found that only 36% of interlaminar injec-
tions resulted in ventral epidural spread despite using 5 mL of
contrast (significantly more than used in this study). Prior studies
of transforaminal approaches have demonstrated slightly better
rates of success, ranging from 61.4%– 88%.6,18,19 However, it is
important to note that in all of these studies, “ventral” was defined
as the anterior aspect of the neuroforamen. This was because the
investigators were interested in the efficacy of corticosteroid in-
jections for nerve origin pain. Furthermore, these investigations
all involved procedures guided by conventional fluoroscopy,
which limited their ability to assess for contrast spread into the
spinal canal VES rather than simply the neuroforaminal VES.
Therefore, it is impossible to know what percentage of these cases
FIG 5. Incidence of optimal epidurogram and inadvertent intravascular injection per needlez-axis location in the neuroforamen. Asterisk indicates significant increase in inadvertent intra-vascular injection (P � .01).
Factors associated with achieving an optimal epidurograma
Factor
Optimal EpidurogramAchieved?
P ValueYes (n = 34) No (n = 38)Needle angle (mean �SD�) 48.2 (7.3) 45.2 (6.8) .08Foraminal level (% �n�) .80
Upper thoracic (T3–4 to T6–7) 37 (13 of 35) 63 (22 of 35)Lower thoracic (T7–8 to T12–L1) 56 (20 of 36) 44 (16 of 36)
Laterality (% �n�) .16Right 55 (21 of 38) 45 (17 of 38)Left 38 (13 of 34) 62 (21 of 34)
Needle-tip position (% �n�) .005Foraminal VES 29 (10 of 34) 63 (24 of 38)Spinal canal VES 71 (24 of 34) 37 (14 of 38)
a Optimal epidurogram is defined as reaching the middle third of the spinal canal VES.
1954 Amrhein Oct 2016 www.ajnr.org
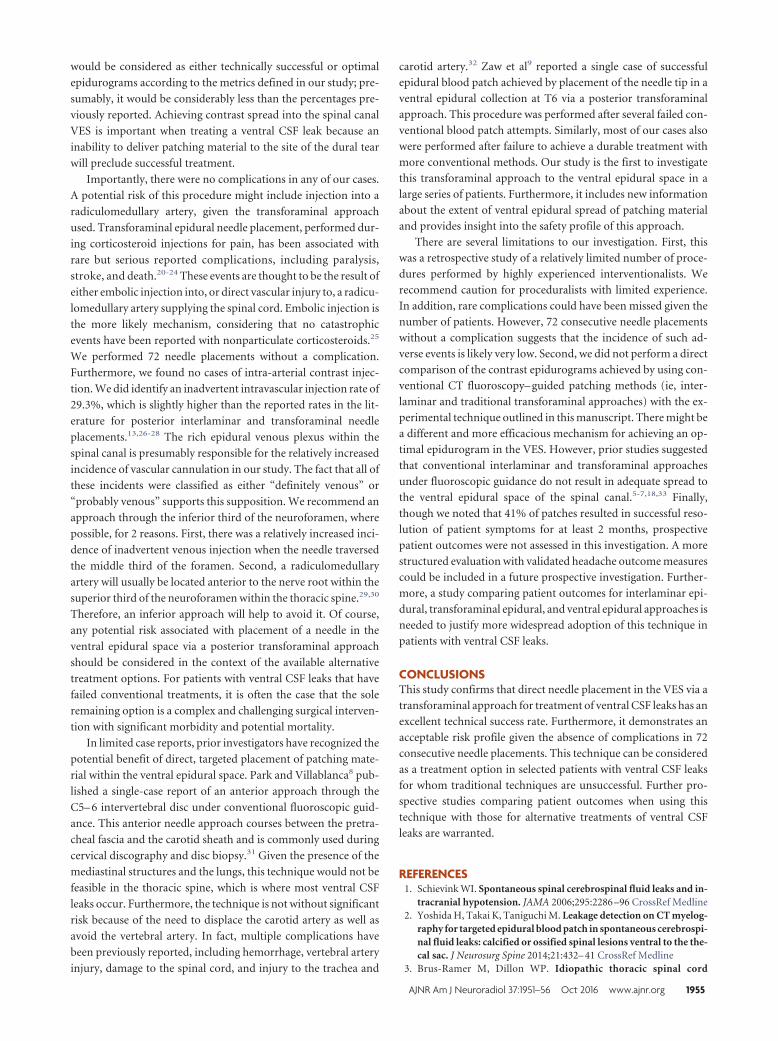
would be considered as either technically successful or optimal
epidurograms according to the metrics defined in our study; pre-
sumably, it would be considerably less than the percentages pre-
viously reported. Achieving contrast spread into the spinal canal
VES is important when treating a ventral CSF leak because an
inability to deliver patching material to the site of the dural tear
will preclude successful treatment.
Importantly, there were no complications in any of our cases.
A potential risk of this procedure might include injection into a
radiculomedullary artery, given the transforaminal approach
used. Transforaminal epidural needle placement, performed dur-
ing corticosteroid injections for pain, has been associated with
rare but serious reported complications, including paralysis,
stroke, and death.20-24 These events are thought to be the result of
either embolic injection into, or direct vascular injury to, a radicu-
lomedullary artery supplying the spinal cord. Embolic injection is
the more likely mechanism, considering that no catastrophic
events have been reported with nonparticulate corticosteroids.25
We performed 72 needle placements without a complication.
Furthermore, we found no cases of intra-arterial contrast injec-
tion. We did identify an inadvertent intravascular injection rate of
29.3%, which is slightly higher than the reported rates in the lit-
erature for posterior interlaminar and transforaminal needle
placements.13,26-28 The rich epidural venous plexus within the
spinal canal is presumably responsible for the relatively increased
incidence of vascular cannulation in our study. The fact that all of
these incidents were classified as either “definitely venous” or
“probably venous” supports this supposition. We recommend an
approach through the inferior third of the neuroforamen, where
possible, for 2 reasons. First, there was a relatively increased inci-
dence of inadvertent venous injection when the needle traversed
the middle third of the foramen. Second, a radiculomedullary
artery will usually be located anterior to the nerve root within the
superior third of the neuroforamen within the thoracic spine.29,30
Therefore, an inferior approach will help to avoid it. Of course,
any potential risk associated with placement of a needle in the
ventral epidural space via a posterior transforaminal approach
should be considered in the context of the available alternative
treatment options. For patients with ventral CSF leaks that have
failed conventional treatments, it is often the case that the sole
remaining option is a complex and challenging surgical interven-
tion with significant morbidity and potential mortality.
In limited case reports, prior investigators have recognized the
potential benefit of direct, targeted placement of patching mate-
rial within the ventral epidural space. Park and Villablanca8 pub-
lished a single-case report of an anterior approach through the
C5– 6 intervertebral disc under conventional fluoroscopic guid-
ance. This anterior needle approach courses between the pretra-
cheal fascia and the carotid sheath and is commonly used during
cervical discography and disc biopsy.31 Given the presence of the
mediastinal structures and the lungs, this technique would not be
feasible in the thoracic spine, which is where most ventral CSF
leaks occur. Furthermore, the technique is not without significant
risk because of the need to displace the carotid artery as well as
avoid the vertebral artery. In fact, multiple complications have
been previously reported, including hemorrhage, vertebral artery
injury, damage to the spinal cord, and injury to the trachea and
carotid artery.32 Zaw et al9 reported a single case of successful
epidural blood patch achieved by placement of the needle tip in a
ventral epidural collection at T6 via a posterior transforaminal
approach. This procedure was performed after several failed con-
ventional blood patch attempts. Similarly, most of our cases also
were performed after failure to achieve a durable treatment with
more conventional methods. Our study is the first to investigate
this transforaminal approach to the ventral epidural space in a
large series of patients. Furthermore, it includes new information
about the extent of ventral epidural spread of patching material
and provides insight into the safety profile of this approach.
There are several limitations to our investigation. First, this
was a retrospective study of a relatively limited number of proce-
dures performed by highly experienced interventionalists. We
recommend caution for proceduralists with limited experience.
In addition, rare complications could have been missed given the
number of patients. However, 72 consecutive needle placements
without a complication suggests that the incidence of such ad-
verse events is likely very low. Second, we did not perform a direct
comparison of the contrast epidurograms achieved by using con-
ventional CT fluoroscopy– guided patching methods (ie, inter-
laminar and traditional transforaminal approaches) with the ex-
perimental technique outlined in this manuscript. There might be
a different and more efficacious mechanism for achieving an op-
timal epidurogram in the VES. However, prior studies suggested
that conventional interlaminar and transforaminal approaches
under fluoroscopic guidance do not result in adequate spread to
the ventral epidural space of the spinal canal.5-7,18,33 Finally,
though we noted that 41% of patches resulted in successful reso-
lution of patient symptoms for at least 2 months, prospective
patient outcomes were not assessed in this investigation. A more
structured evaluation with validated headache outcome measures
could be included in a future prospective investigation. Further-
more, a study comparing patient outcomes for interlaminar epi-
dural, transforaminal epidural, and ventral epidural approaches is
needed to justify more widespread adoption of this technique in
patients with ventral CSF leaks.
CONCLUSIONSThis study confirms that direct needle placement in the VES via a
transforaminal approach for treatment of ventral CSF leaks has an
excellent technical success rate. Furthermore, it demonstrates an
acceptable risk profile given the absence of complications in 72
consecutive needle placements. This technique can be considered
as a treatment option in selected patients with ventral CSF leaks
for whom traditional techniques are unsuccessful. Further pro-
spective studies comparing patient outcomes when using this
technique with those for alternative treatments of ventral CSF
leaks are warranted.
REFERENCES1. Schievink WI. Spontaneous spinal cerebrospinal fluid leaks and in-
tracranial hypotension. JAMA 2006;295:2286 –96 CrossRef Medline2. Yoshida H, Takai K, Taniguchi M. Leakage detection on CT myelog-
raphy for targeted epidural blood patch in spontaneous cerebrospi-nal fluid leaks: calcified or ossified spinal lesions ventral to the the-cal sac. J Neurosurg Spine 2014;21:432– 41 CrossRef Medline
3. Brus-Ramer M, Dillon WP. Idiopathic thoracic spinal cord
AJNR Am J Neuroradiol 37:1951–56 Oct 2016 www.ajnr.org 1955
herniation: retrospective analysis supporting a mechanism ofdiskogenic dural injury and subsequent tamponade. AJNR Am JNeuroradiol 2012;33:52–56 CrossRef Medline
4. Schievink WI, Maya MM, Nuno M. Chronic cerebellar hemorrhagein spontaneous intracranial hypotension: association with ventralspinal cerebrospinal fluid leaks: clinical article. J Neurosurg Spine2011;15:433– 40 CrossRef Medline
5. Botwin KP, Natalicchio J, Hanna A. Fluoroscopic guided lumbarinterlaminar epidural injections: a prospective evaluation of epidu-rography contrast patterns and anatomical review of the epiduralspace. Pain Physician 2004;7:77– 80 Medline
6. Candido KD, Raghavendra MS, Chinthagada M, et al. A prospectiveevaluation of iodinated contrast flow patterns with fluoroscopi-cally guided lumbar epidural steroid injections: the lateral parasag-ittal interlaminar epidural approach versus the transforaminal epi-dural approach. Anesth Analg 2008;106:638 – 44 CrossRef Medline
7. Gupta R, Singh S, Kaur S, et al. Correlation between epidurographiccontrast flow patterns and clinical effectiveness in chronic lumbardiscogenic radicular pain treated with epidural steroid injectionsvia different approaches. Korean J Pain 2014;27:353–59 CrossRefMedline
8. Park JK, Villablanca JP. Feasibility of placement of an anterior cer-vical epidural blood patch for spontaneous intracranial hypoten-sion. AJNR Am J Neuroradiol 2013;34:E84 – 86 CrossRef Medline
9. Zaw TM, Park JK, Al-Tariq Q, et al. Feasibility of ventral epiduralblood patch placement via CT-guided transforaminal approach forthe treatment of intracranial hypotension. Neurographics 2014;4:101– 05 CrossRef
10. Schievink WI, Dodick DW, Mokri B, et al. Diagnostic criteria forheadache due to spontaneous intracranial hypotension: a perspec-tive. Headache 2011;51:1442– 44 CrossRef Medline
11. Wagner AL. Selective lumbar nerve root blocks with CT fluoro-scopic guidance: technique, results, procedure time, and radiationdose. AJNR Am J Neuroradiol 2004;25:1592–94 Medline
12. Wagner AL, Murtagh FR. Selective nerve root blocks. Tech Vasc In-terv Radiol 2002;5:194 –200 CrossRef Medline
13. Kranz PG, Amrhein TJ, Gray L. Incidence of inadvertent intravas-cular injection during CT fluoroscopy– guided epidural steroid in-jections. AJNR Am J Neuroradiol 2015;36:1000 – 07 CrossRef Medline
14. Pricola Fehnel K, Borges LF. Posterior thoracic laminoplasty withdorsal, intradural identification of ventral defect and transduraldiscectomy for a spontaneous cerebrospinal fluid leak: case report.J Neurosurg Spine 2015;22:478 – 82 CrossRef Medline
15. Schievink WI, Morreale VM, Atkinson JL, et al. Surgical treatment ofspontaneous spinal cerebrospinal fluid leaks. J Neurosurg 1998;88:243– 46 CrossRef Medline
16. Agarwal V, Sreedher G, Rothfus WE. Targeted CT-guided epiduralblood patch for treatment of spontaneous intracranial hypotensiondue to calcified intradural thoracic disc herniation. Interv Neurora-diol 2013;19:121–26 Medline
17. Bowden K, Wuollet A, Patwardhan A, et al. Transforaminal bloodpatch for the treatment of chronic headache from intracranial
hypotension: a case report and review. Anesthesiol Res Pract 2012;2012:923904 CrossRef Medline
18. Desai MJ, Shah B, Sayal PK. Epidural contrast flow patterns of trans-foraminal epidural steroid injections stratified by commonly usedfinal needle-tip position. Pain Med 2011;12:864 –70 CrossRefMedline
19. Manchikanti L, Cash KA, Pampati V, et al. Evaluation of lumbartransforaminal epidural injections with needle placement and con-trast flow patterns: a prospective, descriptive report. Pain Physician2004;7:217–23 Medline
20. Brouwers PJ, Kottink EJ, Simon MA, et al. A cervical anterior spinalartery syndrome after diagnostic blockade of the right C6-nerveroot. Pain 2001;91:397–99 CrossRef Medline
21. Huston CW, Slipman CW, Garvin C. Complications and side effectsof cervical and lumbosacral selective nerve root injections. ArchPhys Med Rehabil 2005;86:277– 83 CrossRef Medline
22. Ludwig MA, Burns SP. Spinal cord infarction following cervicaltransforaminal epidural injection: a case report. Spine (Phila Pa1976) 2005;30:E266 – 68 CrossRef Medline
23. Ma DJ, Gilula LA, Riew KD. Complications of fluoroscopicallyguided extraforaminal cervical nerve blocks. An analysis of 1036injections. J Bone Joint Surg Am 2005;87:1025–30 CrossRef Medline
24. Tiso RL, Cutler T, Catania JA, et al. Adverse central nervous systemsequelae after selective transforaminal block: the role of corticoste-roids. Spine J 2004;4:468 –74 CrossRef Medline
25. Emanuel EJ. Reform of clinical research regulations, finally. N EnglJ Med 2015;373:2296 –99 CrossRef Medline
26. El Abd OH, Amadera JE, Pimentel DC, et al. Intravascular flow de-tection during transforaminal epidural injections: a prospective as-sessment. Pain Physician 2014;17:21–27 Medline
27. Furman MB, Giovanniello MT, O’Brien EM. Incidence of intravas-cular penetration in transforaminal cervical epidural steroid injec-tions. Spine (Phila Pa 1976) 2003;28:21–25 CrossRef Medline
28. McLean JP, Sigler JD, Plastaras CT, et al. The rate of detection ofintravascular injection in cervical transforaminal epidural steroidinjections with and without digital subtraction angiography. PM R2009;1:636 – 42 CrossRef Medline
29. Demondion X, Lefebvre G, Fisch O, et al. Radiographic anatomy ofthe intervertebral cervical and lumbar foramina (vessels and vari-ants). Diagn Interv Imaging 2012;93:690 –97 CrossRef Medline
30. Murthy NS, Maus TP, Behrns CL. Intraforaminal location of thegreat anterior radiculomedullary artery (artery of Adamkiewicz): aretrospective review. Pain Med 2010;11:1756 – 64 CrossRef Medline
31. Smith GW, Nichols P Jr. The technic of cervical discography. Radi-ology 1957;68:718 –20 CrossRef Medline
32. Lee SH, Kim KT, Jeong BO, et al. The safety zone of percutaneouscervical approach: a dynamic computed tomographic study. Spine(Phila Pa 1976) 2007;32:E569 –74 CrossRef Medline
33. Botwin K, Natalicchio J, Brown LA. Epidurography contrast pat-terns with fluoroscopic guided lumbar transforaminal epiduralinjections: a prospective evaluation. Pain Physician 2004;7:211–15Medline
1956 Amrhein Oct 2016 www.ajnr.org
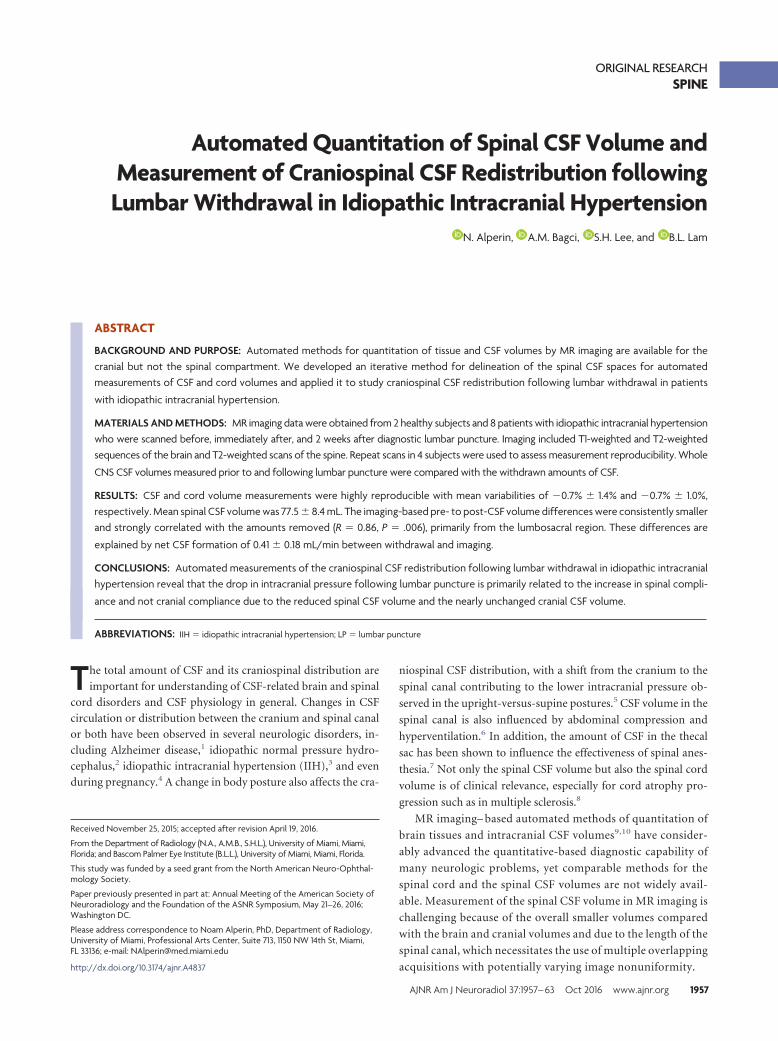
ORIGINAL RESEARCHSPINE
Automated Quantitation of Spinal CSF Volume andMeasurement of Craniospinal CSF Redistribution followingLumbar Withdrawal in Idiopathic Intracranial Hypertension
X N. Alperin, X A.M. Bagci, X S.H. Lee, and X B.L. Lam
ABSTRACT
BACKGROUND AND PURPOSE: Automated methods for quantitation of tissue and CSF volumes by MR imaging are available for thecranial but not the spinal compartment. We developed an iterative method for delineation of the spinal CSF spaces for automatedmeasurements of CSF and cord volumes and applied it to study craniospinal CSF redistribution following lumbar withdrawal in patients
with idiopathic intracranial hypertension.
MATERIALS AND METHODS: MR imaging data were obtained from 2 healthy subjects and 8 patients with idiopathic intracranial hypertensionwho were scanned before, immediately after, and 2 weeks after diagnostic lumbar puncture. Imaging included T1-weighted and T2-weightedsequences of the brain and T2-weighted scans of the spine. Repeat scans in 4 subjects were used to assess measurement reproducibility. Whole
CNS CSF volumes measured prior to and following lumbar puncture were compared with the withdrawn amounts of CSF.
RESULTS: CSF and cord volume measurements were highly reproducible with mean variabilities of �0.7% � 1.4% and �0.7% � 1.0%,respectively. Mean spinal CSF volume was 77.5 � 8.4 mL. The imaging-based pre- to post-CSF volume differences were consistently smallerand strongly correlated with the amounts removed (R � 0.86, P � .006), primarily from the lumbosacral region. These differences are
explained by net CSF formation of 0.41 � 0.18 mL/min between withdrawal and imaging.
CONCLUSIONS: Automated measurements of the craniospinal CSF redistribution following lumbar withdrawal in idiopathic intracranialhypertension reveal that the drop in intracranial pressure following lumbar puncture is primarily related to the increase in spinal compli-
ance and not cranial compliance due to the reduced spinal CSF volume and the nearly unchanged cranial CSF volume.
ABBREVIATIONS: IIH � idiopathic intracranial hypertension; LP � lumbar puncture
The total amount of CSF and its craniospinal distribution are
important for understanding of CSF-related brain and spinal
cord disorders and CSF physiology in general. Changes in CSF
circulation or distribution between the cranium and spinal canal
or both have been observed in several neurologic disorders, in-
cluding Alzheimer disease,1 idiopathic normal pressure hydro-
cephalus,2 idiopathic intracranial hypertension (IIH),3 and even
during pregnancy.4 A change in body posture also affects the cra-
niospinal CSF distribution, with a shift from the cranium to the
spinal canal contributing to the lower intracranial pressure ob-
served in the upright-versus-supine postures.5 CSF volume in the
spinal canal is also influenced by abdominal compression and
hyperventilation.6 In addition, the amount of CSF in the thecal
sac has been shown to influence the effectiveness of spinal anes-
thesia.7 Not only the spinal CSF volume but also the spinal cord
volume is of clinical relevance, especially for cord atrophy pro-
gression such as in multiple sclerosis.8
MR imaging– based automated methods of quantitation of
brain tissues and intracranial CSF volumes9,10 have consider-
ably advanced the quantitative-based diagnostic capability of
many neurologic problems, yet comparable methods for the
spinal cord and the spinal CSF volumes are not widely avail-
able. Measurement of the spinal CSF volume in MR imaging is
challenging because of the overall smaller volumes compared
with the brain and cranial volumes and due to the length of the
spinal canal, which necessitates the use of multiple overlapping
acquisitions with potentially varying image nonuniformity.
Received November 25, 2015; accepted after revision April 19, 2016.
From the Department of Radiology (N.A., A.M.B., S.H.L.), University of Miami, Miami,Florida; and Bascom Palmer Eye Institute (B.L.L.), University of Miami, Miami, Florida.
This study was funded by a seed grant from the North American Neuro-Ophthal-mology Society.
Paper previously presented in part at: Annual Meeting of the American Society ofNeuroradiology and the Foundation of the ASNR Symposium, May 21–26, 2016;Washington DC.
Please address correspondence to Noam Alperin, PhD, Department of Radiology,University of Miami, Professional Arts Center, Suite 713, 1150 NW 14th St, Miami,FL 33136; e-mail: [email protected]
http://dx.doi.org/10.3174/ajnr.A4837
AJNR Am J Neuroradiol 37:1957– 63 Oct 2016 www.ajnr.org 1957
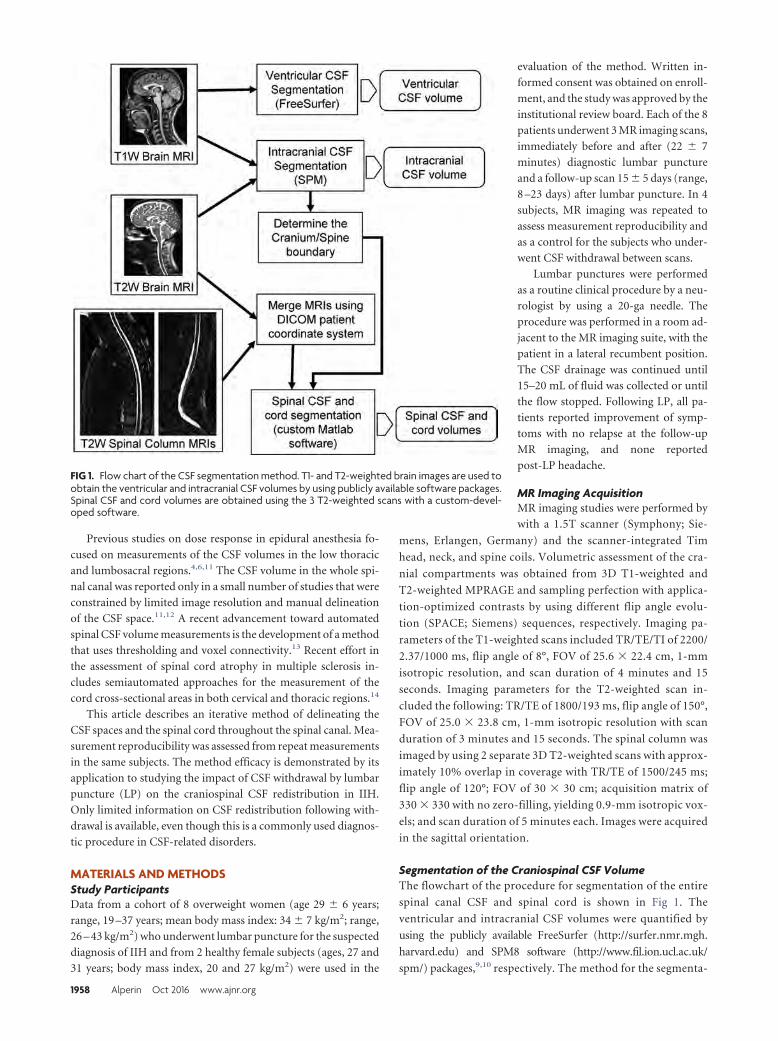
Previous studies on dose response in epidural anesthesia fo-
cused on measurements of the CSF volumes in the low thoracic
and lumbosacral regions.4,6,11 The CSF volume in the whole spi-
nal canal was reported only in a small number of studies that were
constrained by limited image resolution and manual delineation
of the CSF space.11,12 A recent advancement toward automated
spinal CSF volume measurements is the development of a method
that uses thresholding and voxel connectivity.13 Recent effort in
the assessment of spinal cord atrophy in multiple sclerosis in-
cludes semiautomated approaches for the measurement of the
cord cross-sectional areas in both cervical and thoracic regions.14
This article describes an iterative method of delineating the
CSF spaces and the spinal cord throughout the spinal canal. Mea-
surement reproducibility was assessed from repeat measurements
in the same subjects. The method efficacy is demonstrated by its
application to studying the impact of CSF withdrawal by lumbar
puncture (LP) on the craniospinal CSF redistribution in IIH.
Only limited information on CSF redistribution following with-
drawal is available, even though this is a commonly used diagnos-
tic procedure in CSF-related disorders.
MATERIALS AND METHODSStudy ParticipantsData from a cohort of 8 overweight women (age 29 � 6 years;
range, 19 –37 years; mean body mass index: 34 � 7 kg/m2; range,
26 – 43 kg/m2) who underwent lumbar puncture for the suspected
diagnosis of IIH and from 2 healthy female subjects (ages, 27 and
31 years; body mass index, 20 and 27 kg/m2) were used in the
evaluation of the method. Written in-
formed consent was obtained on enroll-
ment, and the study was approved by the
institutional review board. Each of the 8
patients underwent 3 MR imaging scans,
immediately before and after (22 � 7
minutes) diagnostic lumbar puncture
and a follow-up scan 15 � 5 days (range,
8 –23 days) after lumbar puncture. In 4
subjects, MR imaging was repeated to
assess measurement reproducibility and
as a control for the subjects who under-
went CSF withdrawal between scans.
Lumbar punctures were performed
as a routine clinical procedure by a neu-
rologist by using a 20-ga needle. The
procedure was performed in a room ad-
jacent to the MR imaging suite, with the
patient in a lateral recumbent position.
The CSF drainage was continued until
15–20 mL of fluid was collected or until
the flow stopped. Following LP, all pa-
tients reported improvement of symp-
toms with no relapse at the follow-up
MR imaging, and none reported
post-LP headache.
MR Imaging AcquisitionMR imaging studies were performed by
with a 1.5T scanner (Symphony; Sie-
mens, Erlangen, Germany) and the scanner-integrated Tim
head, neck, and spine coils. Volumetric assessment of the cra-
nial compartments was obtained from 3D T1-weighted and
T2-weighted MPRAGE and sampling perfection with applica-
tion-optimized contrasts by using different flip angle evolu-
tion (SPACE; Siemens) sequences, respectively. Imaging pa-
rameters of the T1-weighted scans included TR/TE/TI of 2200/
2.37/1000 ms, flip angle of 8°, FOV of 25.6 � 22.4 cm, 1-mm
isotropic resolution, and scan duration of 4 minutes and 15
seconds. Imaging parameters for the T2-weighted scan in-
cluded the following: TR/TE of 1800/193 ms, flip angle of 150°,
FOV of 25.0 � 23.8 cm, 1-mm isotropic resolution with scan
duration of 3 minutes and 15 seconds. The spinal column was
imaged by using 2 separate 3D T2-weighted scans with approx-
imately 10% overlap in coverage with TR/TE of 1500/245 ms;
flip angle of 120°; FOV of 30 � 30 cm; acquisition matrix of
330 � 330 with no zero-filling, yielding 0.9-mm isotropic vox-
els; and scan duration of 5 minutes each. Images were acquired
in the sagittal orientation.
Segmentation of the Craniospinal CSF VolumeThe flowchart of the procedure for segmentation of the entire
spinal canal CSF and spinal cord is shown in Fig 1. The
ventricular and intracranial CSF volumes were quantified by
using the publicly available FreeSurfer (http://surfer.nmr.mgh.
harvard.edu) and SPM8 software (http://www.fil.ion.ucl.ac.uk/
spm/) packages,9,10 respectively. The method for the segmenta-
FIG 1. Flow chart of the CSF segmentation method. T1- and T2-weighted brain images are used toobtain the ventricular and intracranial CSF volumes by using publicly available software packages.Spinal CSF and cord volumes are obtained using the 3 T2-weighted scans with a custom-devel-oped software.
1958 Alperin Oct 2016 www.ajnr.org
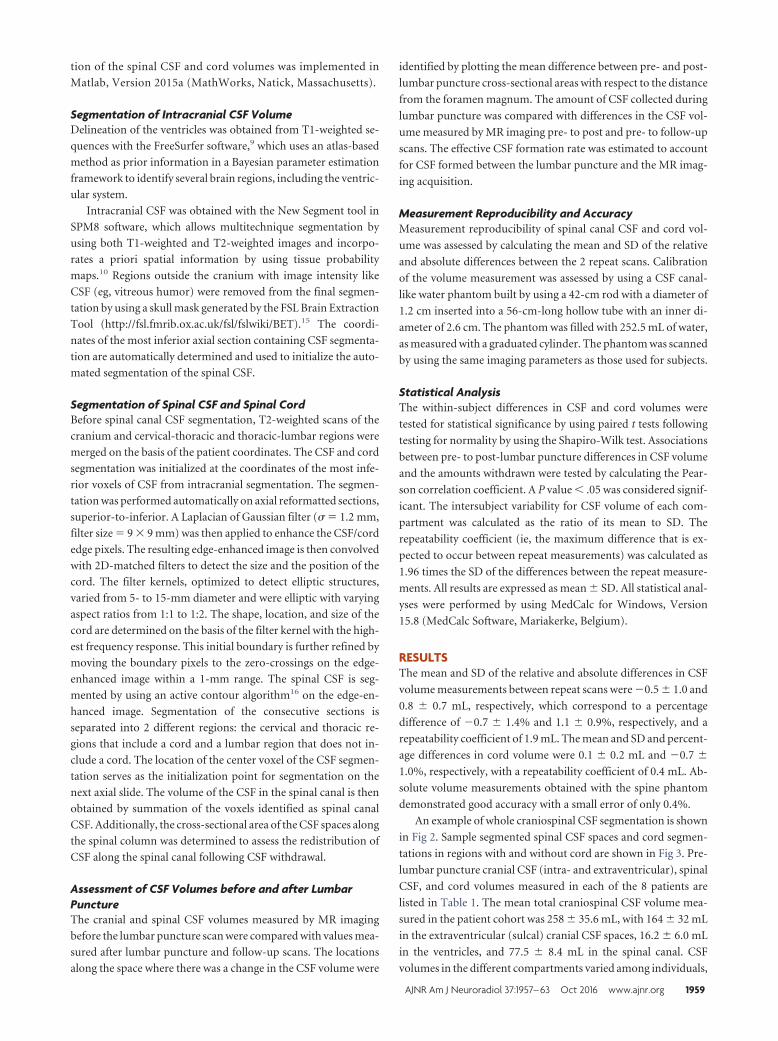
tion of the spinal CSF and cord volumes was implemented in
Matlab, Version 2015a (MathWorks, Natick, Massachusetts).
Segmentation of Intracranial CSF VolumeDelineation of the ventricles was obtained from T1-weighted se-
quences with the FreeSurfer software,9 which uses an atlas-based
method as prior information in a Bayesian parameter estimation
framework to identify several brain regions, including the ventric-
ular system.
Intracranial CSF was obtained with the New Segment tool in
SPM8 software, which allows multitechnique segmentation by
using both T1-weighted and T2-weighted images and incorpo-
rates a priori spatial information by using tissue probability
maps.10 Regions outside the cranium with image intensity like
CSF (eg, vitreous humor) were removed from the final segmen-
tation by using a skull mask generated by the FSL Brain Extraction
Tool (http://fsl.fmrib.ox.ac.uk/fsl/fslwiki/BET).15 The coordi-
nates of the most inferior axial section containing CSF segmenta-
tion are automatically determined and used to initialize the auto-
mated segmentation of the spinal CSF.
Segmentation of Spinal CSF and Spinal CordBefore spinal canal CSF segmentation, T2-weighted scans of the
cranium and cervical-thoracic and thoracic-lumbar regions were
merged on the basis of the patient coordinates. The CSF and cord
segmentation was initialized at the coordinates of the most infe-
rior voxels of CSF from intracranial segmentation. The segmen-
tation was performed automatically on axial reformatted sections,
superior-to-inferior. A Laplacian of Gaussian filter (� � 1.2 mm,
filter size � 9 � 9 mm) was then applied to enhance the CSF/cord
edge pixels. The resulting edge-enhanced image is then convolved
with 2D-matched filters to detect the size and the position of the
cord. The filter kernels, optimized to detect elliptic structures,
varied from 5- to 15-mm diameter and were elliptic with varying
aspect ratios from 1:1 to 1:2. The shape, location, and size of the
cord are determined on the basis of the filter kernel with the high-
est frequency response. This initial boundary is further refined by
moving the boundary pixels to the zero-crossings on the edge-
enhanced image within a 1-mm range. The spinal CSF is seg-
mented by using an active contour algorithm16 on the edge-en-
hanced image. Segmentation of the consecutive sections is
separated into 2 different regions: the cervical and thoracic re-
gions that include a cord and a lumbar region that does not in-
clude a cord. The location of the center voxel of the CSF segmen-
tation serves as the initialization point for segmentation on the
next axial slide. The volume of the CSF in the spinal canal is then
obtained by summation of the voxels identified as spinal canal
CSF. Additionally, the cross-sectional area of the CSF spaces along
the spinal column was determined to assess the redistribution of
CSF along the spinal canal following CSF withdrawal.
Assessment of CSF Volumes before and after LumbarPunctureThe cranial and spinal CSF volumes measured by MR imaging
before the lumbar puncture scan were compared with values mea-
sured after lumbar puncture and follow-up scans. The locations
along the space where there was a change in the CSF volume were
identified by plotting the mean difference between pre- and post-
lumbar puncture cross-sectional areas with respect to the distance
from the foramen magnum. The amount of CSF collected during
lumbar puncture was compared with differences in the CSF vol-
ume measured by MR imaging pre- to post and pre- to follow-up
scans. The effective CSF formation rate was estimated to account
for CSF formed between the lumbar puncture and the MR imag-
ing acquisition.
Measurement Reproducibility and AccuracyMeasurement reproducibility of spinal canal CSF and cord vol-
ume was assessed by calculating the mean and SD of the relative
and absolute differences between the 2 repeat scans. Calibration
of the volume measurement was assessed by using a CSF canal-
like water phantom built by using a 42-cm rod with a diameter of
1.2 cm inserted into a 56-cm-long hollow tube with an inner di-
ameter of 2.6 cm. The phantom was filled with 252.5 mL of water,
as measured with a graduated cylinder. The phantom was scanned
by using the same imaging parameters as those used for subjects.
Statistical AnalysisThe within-subject differences in CSF and cord volumes were
tested for statistical significance by using paired t tests following
testing for normality by using the Shapiro-Wilk test. Associations
between pre- to post-lumbar puncture differences in CSF volume
and the amounts withdrawn were tested by calculating the Pear-
son correlation coefficient. A P value � .05 was considered signif-
icant. The intersubject variability for CSF volume of each com-
partment was calculated as the ratio of its mean to SD. The
repeatability coefficient (ie, the maximum difference that is ex-
pected to occur between repeat measurements) was calculated as
1.96 times the SD of the differences between the repeat measure-
ments. All results are expressed as mean � SD. All statistical anal-
yses were performed by using MedCalc for Windows, Version
15.8 (MedCalc Software, Mariakerke, Belgium).
RESULTSThe mean and SD of the relative and absolute differences in CSF
volume measurements between repeat scans were �0.5 � 1.0 and
0.8 � 0.7 mL, respectively, which correspond to a percentage
difference of �0.7 � 1.4% and 1.1 � 0.9%, respectively, and a
repeatability coefficient of 1.9 mL. The mean and SD and percent-
age differences in cord volume were 0.1 � 0.2 mL and �0.7 �
1.0%, respectively, with a repeatability coefficient of 0.4 mL. Ab-
solute volume measurements obtained with the spine phantom
demonstrated good accuracy with a small error of only 0.4%.
An example of whole craniospinal CSF segmentation is shown
in Fig 2. Sample segmented spinal CSF spaces and cord segmen-
tations in regions with and without cord are shown in Fig 3. Pre-
lumbar puncture cranial CSF (intra- and extraventricular), spinal
CSF, and cord volumes measured in each of the 8 patients are
listed in Table 1. The mean total craniospinal CSF volume mea-
sured in the patient cohort was 258 � 35.6 mL, with 164 � 32 mL
in the extraventricular (sulcal) cranial CSF spaces, 16.2 � 6.0 mL
in the ventricles, and 77.5 � 8.4 mL in the spinal canal. CSF
volumes in the different compartments varied among individuals,
AJNR Am J Neuroradiol 37:1957– 63 Oct 2016 www.ajnr.org 1959
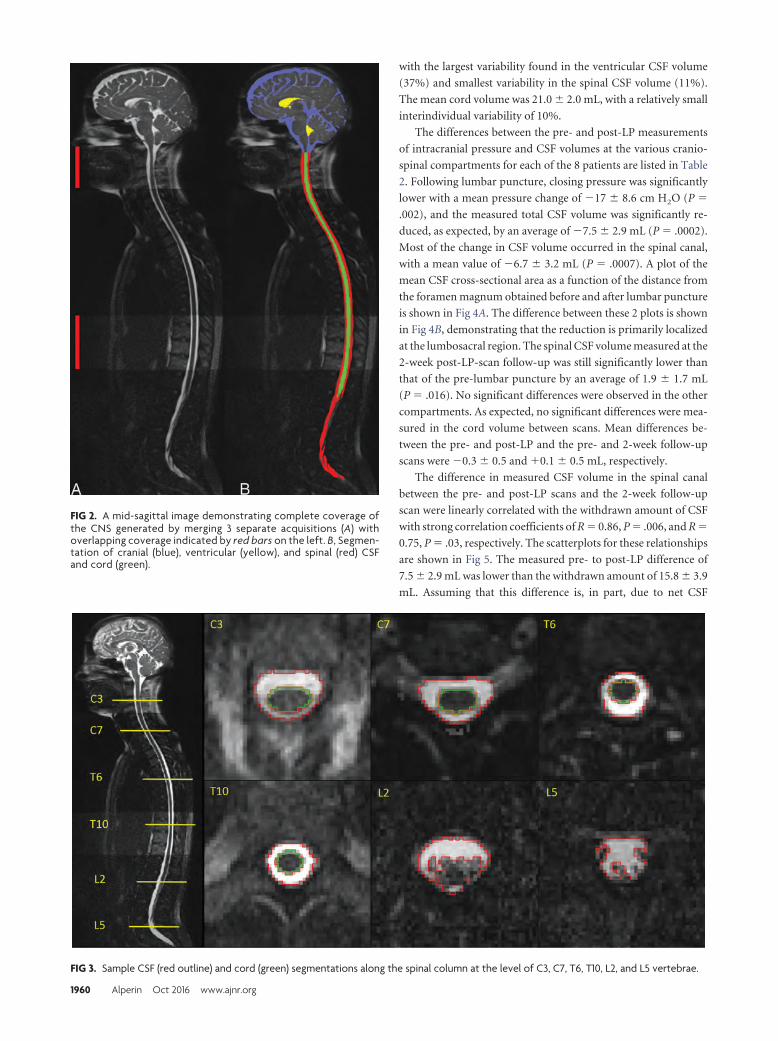
with the largest variability found in the ventricular CSF volume
(37%) and smallest variability in the spinal CSF volume (11%).
The mean cord volume was 21.0 � 2.0 mL, with a relatively small
interindividual variability of 10%.
The differences between the pre- and post-LP measurements
of intracranial pressure and CSF volumes at the various cranio-
spinal compartments for each of the 8 patients are listed in Table
2. Following lumbar puncture, closing pressure was significantly
lower with a mean pressure change of �17 � 8.6 cm H2O (P �
.002), and the measured total CSF volume was significantly re-
duced, as expected, by an average of �7.5 � 2.9 mL (P � .0002).
Most of the change in CSF volume occurred in the spinal canal,
with a mean value of �6.7 � 3.2 mL (P � .0007). A plot of the
mean CSF cross-sectional area as a function of the distance from
the foramen magnum obtained before and after lumbar puncture
is shown in Fig 4A. The difference between these 2 plots is shown
in Fig 4B, demonstrating that the reduction is primarily localized
at the lumbosacral region. The spinal CSF volume measured at the
2-week post-LP-scan follow-up was still significantly lower than
that of the pre-lumbar puncture by an average of 1.9 � 1.7 mL
(P � .016). No significant differences were observed in the other
compartments. As expected, no significant differences were mea-
sured in the cord volume between scans. Mean differences be-
tween the pre- and post-LP and the pre- and 2-week follow-up
scans were �0.3 � 0.5 and �0.1 � 0.5 mL, respectively.
The difference in measured CSF volume in the spinal canal
between the pre- and post-LP scans and the 2-week follow-up
scan were linearly correlated with the withdrawn amount of CSF
with strong correlation coefficients of R � 0.86, P � .006, and R �
0.75, P � .03, respectively. The scatterplots for these relationships
are shown in Fig 5. The measured pre- to post-LP difference of
7.5 � 2.9 mL was lower than the withdrawn amount of 15.8 � 3.9
mL. Assuming that this difference is, in part, due to net CSF
FIG 2. A mid-sagittal image demonstrating complete coverage ofthe CNS generated by merging 3 separate acquisitions (A) withoverlapping coverage indicated by red bars on the left. B, Segmen-tation of cranial (blue), ventricular (yellow), and spinal (red) CSFand cord (green).
FIG 3. Sample CSF (red outline) and cord (green) segmentations along the spinal column at the level of C3, C7, T6, T10, L2, and L5 vertebrae.
1960 Alperin Oct 2016 www.ajnr.org
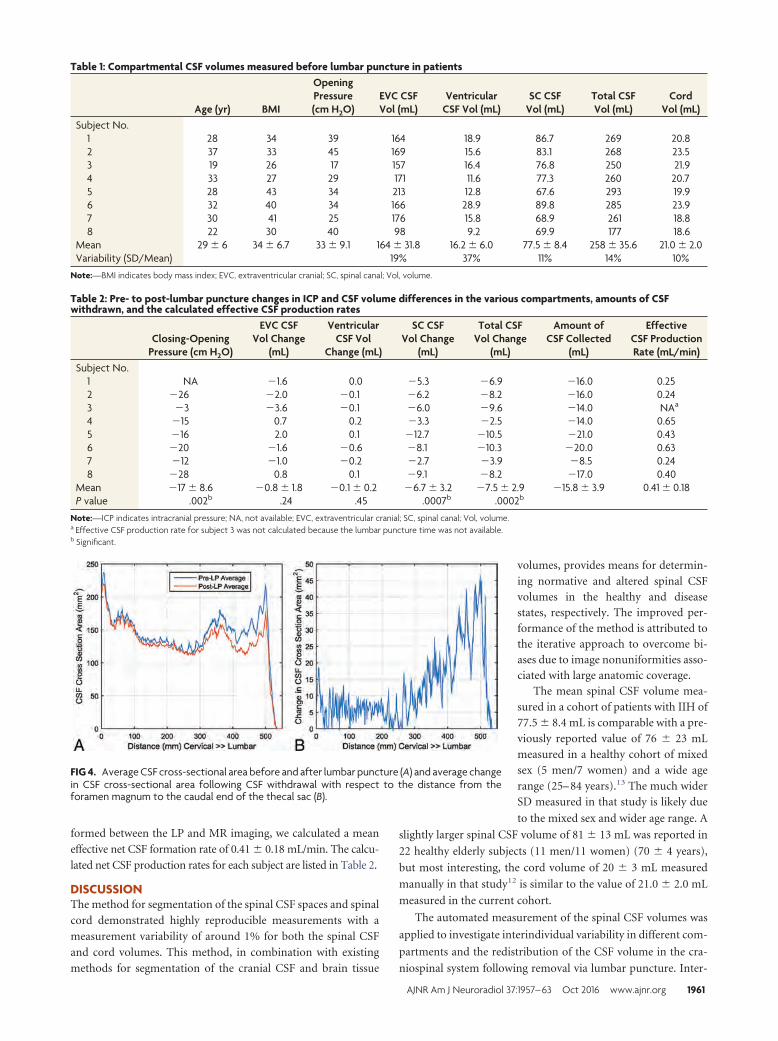
formed between the LP and MR imaging, we calculated a mean
effective net CSF formation rate of 0.41 � 0.18 mL/min. The calcu-
lated net CSF production rates for each subject are listed in Table 2.
DISCUSSIONThe method for segmentation of the spinal CSF spaces and spinal
cord demonstrated highly reproducible measurements with a
measurement variability of around 1% for both the spinal CSF
and cord volumes. This method, in combination with existing
methods for segmentation of the cranial CSF and brain tissue
volumes, provides means for determin-
ing normative and altered spinal CSFvolumes in the healthy and diseasestates, respectively. The improved per-formance of the method is attributed tothe iterative approach to overcome bi-ases due to image nonuniformities asso-ciated with large anatomic coverage.
The mean spinal CSF volume mea-sured in a cohort of patients with IIH of77.5 � 8.4 mL is comparable with a pre-viously reported value of 76 � 23 mLmeasured in a healthy cohort of mixedsex (5 men/7 women) and a wide agerange (25– 84 years).13 The much widerSD measured in that study is likely due
to the mixed sex and wider age range. A
slightly larger spinal CSF volume of 81 � 13 mL was reported in
22 healthy elderly subjects (11 men/11 women) (70 � 4 years),
but most interesting, the cord volume of 20 � 3 mL measured
manually in that study12 is similar to the value of 21.0 � 2.0 mL
measured in the current cohort.
The automated measurement of the spinal CSF volumes was
applied to investigate interindividual variability in different com-
partments and the redistribution of the CSF volume in the cra-
niospinal system following removal via lumbar puncture. Inter-
FIG 4. Average CSF cross-sectional area before and after lumbar puncture (A) and average changein CSF cross-sectional area following CSF withdrawal with respect to the distance from theforamen magnum to the caudal end of the thecal sac (B).
Table 1: Compartmental CSF volumes measured before lumbar puncture in patients
Age (yr) BMI
OpeningPressure(cm H2O)
EVC CSFVol (mL)
VentricularCSF Vol (mL)
SC CSFVol (mL)
Total CSFVol (mL)
CordVol (mL)
Subject No.1 28 34 39 164 18.9 86.7 269 20.82 37 33 45 169 15.6 83.1 268 23.53 19 26 17 157 16.4 76.8 250 21.94 33 27 29 171 11.6 77.3 260 20.75 28 43 34 213 12.8 67.6 293 19.96 32 40 34 166 28.9 89.8 285 23.97 30 41 25 176 15.8 68.9 261 18.88 22 30 40 98 9.2 69.9 177 18.6
Mean 29 � 6 34 � 6.7 33 � 9.1 164 � 31.8 16.2 � 6.0 77.5 � 8.4 258 � 35.6 21.0 � 2.0Variability (SD/Mean) 19% 37% 11% 14% 10%
Note:—BMI indicates body mass index; EVC, extraventricular cranial; SC, spinal canal; Vol, volume.
Table 2: Pre- to post-lumbar puncture changes in ICP and CSF volume differences in the various compartments, amounts of CSFwithdrawn, and the calculated effective CSF production rates
Closing-OpeningPressure (cm H2O)
EVC CSFVol Change
(mL)
VentricularCSF Vol
Change (mL)
SC CSFVol Change
(mL)
Total CSFVol Change
(mL)
Amount ofCSF Collected
(mL)
EffectiveCSF ProductionRate (mL/min)
Subject No.1 NA �1.6 0.0 �5.3 �6.9 �16.0 0.252 �26 �2.0 �0.1 �6.2 �8.2 �16.0 0.243 �3 �3.6 �0.1 �6.0 �9.6 �14.0 NAa
4 �15 0.7 0.2 �3.3 �2.5 �14.0 0.655 �16 2.0 0.1 �12.7 �10.5 �21.0 0.436 �20 �1.6 �0.6 �8.1 �10.3 �20.0 0.637 �12 �1.0 �0.2 �2.7 �3.9 �8.5 0.248 �28 0.8 0.1 �9.1 �8.2 �17.0 0.40
Mean �17 � 8.6 �0.8 � 1.8 �0.1 � 0.2 �6.7 � 3.2 �7.5 � 2.9 �15.8 � 3.9 0.41 � 0.18P value .002b .24 .45 .0007b .0002b
Note:—ICP indicates intracranial pressure; NA, not available; EVC, extraventricular cranial; SC, spinal canal; Vol, volume.a Effective CSF production rate for subject 3 was not calculated because the lumbar puncture time was not available.b Significant.
AJNR Am J Neuroradiol 37:1957– 63 Oct 2016 www.ajnr.org 1961
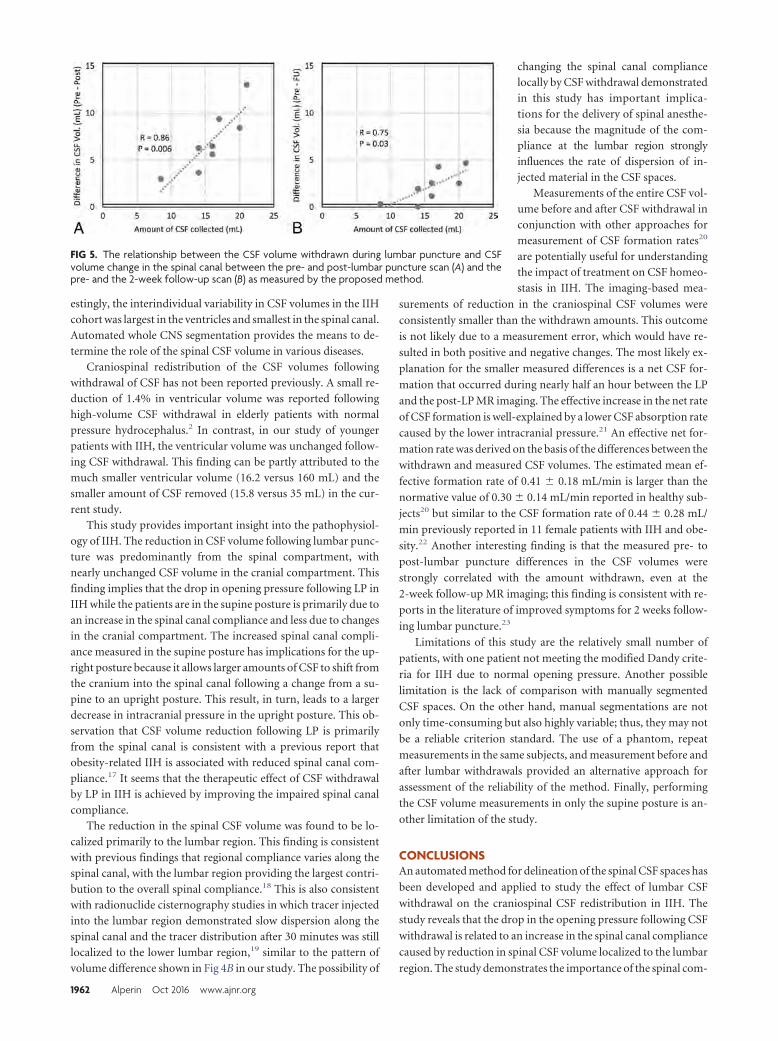
estingly, the interindividual variability in CSF volumes in the IIHcohort was largest in the ventricles and smallest in the spinal canal.Automated whole CNS segmentation provides the means to de-termine the role of the spinal CSF volume in various diseases.
Craniospinal redistribution of the CSF volumes followingwithdrawal of CSF has not been reported previously. A small re-duction of 1.4% in ventricular volume was reported followinghigh-volume CSF withdrawal in elderly patients with normalpressure hydrocephalus.2 In contrast, in our study of youngerpatients with IIH, the ventricular volume was unchanged follow-ing CSF withdrawal. This finding can be partly attributed to themuch smaller ventricular volume (16.2 versus 160 mL) and thesmaller amount of CSF removed (15.8 versus 35 mL) in the cur-rent study.
This study provides important insight into the pathophysiol-ogy of IIH. The reduction in CSF volume following lumbar punc-ture was predominantly from the spinal compartment, withnearly unchanged CSF volume in the cranial compartment. Thisfinding implies that the drop in opening pressure following LP inIIH while the patients are in the supine posture is primarily due toan increase in the spinal canal compliance and less due to changesin the cranial compartment. The increased spinal canal compli-ance measured in the supine posture has implications for the up-right posture because it allows larger amounts of CSF to shift fromthe cranium into the spinal canal following a change from a su-pine to an upright posture. This result, in turn, leads to a largerdecrease in intracranial pressure in the upright posture. This ob-servation that CSF volume reduction following LP is primarilyfrom the spinal canal is consistent with a previous report thatobesity-related IIH is associated with reduced spinal canal com-pliance.17 It seems that the therapeutic effect of CSF withdrawalby LP in IIH is achieved by improving the impaired spinal canalcompliance.
The reduction in the spinal CSF volume was found to be lo-calized primarily to the lumbar region. This finding is consistentwith previous findings that regional compliance varies along thespinal canal, with the lumbar region providing the largest contri-bution to the overall spinal compliance.18 This is also consistentwith radionuclide cisternography studies in which tracer injectedinto the lumbar region demonstrated slow dispersion along thespinal canal and the tracer distribution after 30 minutes was stilllocalized to the lower lumbar region,19 similar to the pattern ofvolume difference shown in Fig 4B in our study. The possibility of
changing the spinal canal compliancelocally by CSF withdrawal demonstratedin this study has important implica-tions for the delivery of spinal anesthe-sia because the magnitude of the com-pliance at the lumbar region stronglyinfluences the rate of dispersion of in-jected material in the CSF spaces.
Measurements of the entire CSF vol-ume before and after CSF withdrawal inconjunction with other approaches formeasurement of CSF formation rates20
are potentially useful for understandingthe impact of treatment on CSF homeo-stasis in IIH. The imaging-based mea-
surements of reduction in the craniospinal CSF volumes were
consistently smaller than the withdrawn amounts. This outcome
is not likely due to a measurement error, which would have re-
sulted in both positive and negative changes. The most likely ex-
planation for the smaller measured differences is a net CSF for-
mation that occurred during nearly half an hour between the LP
and the post-LP MR imaging. The effective increase in the net rate
of CSF formation is well-explained by a lower CSF absorption rate
caused by the lower intracranial pressure.21 An effective net for-
mation rate was derived on the basis of the differences between the
withdrawn and measured CSF volumes. The estimated mean ef-
fective formation rate of 0.41 � 0.18 mL/min is larger than the
normative value of 0.30 � 0.14 mL/min reported in healthy sub-
jects20 but similar to the CSF formation rate of 0.44 � 0.28 mL/
min previously reported in 11 female patients with IIH and obe-
sity.22 Another interesting finding is that the measured pre- to
post-lumbar puncture differences in the CSF volumes were
strongly correlated with the amount withdrawn, even at the
2-week follow-up MR imaging; this finding is consistent with re-
ports in the literature of improved symptoms for 2 weeks follow-
ing lumbar puncture.23
Limitations of this study are the relatively small number of
patients, with one patient not meeting the modified Dandy crite-
ria for IIH due to normal opening pressure. Another possible
limitation is the lack of comparison with manually segmented
CSF spaces. On the other hand, manual segmentations are not
only time-consuming but also highly variable; thus, they may not
be a reliable criterion standard. The use of a phantom, repeat
measurements in the same subjects, and measurement before and
after lumbar withdrawals provided an alternative approach for
assessment of the reliability of the method. Finally, performing
the CSF volume measurements in only the supine posture is an-
other limitation of the study.
CONCLUSIONSAn automated method for delineation of the spinal CSF spaces has
been developed and applied to study the effect of lumbar CSF
withdrawal on the craniospinal CSF redistribution in IIH. The
study reveals that the drop in the opening pressure following CSF
withdrawal is related to an increase in the spinal canal compliance
caused by reduction in spinal CSF volume localized to the lumbar
region. The study demonstrates the importance of the spinal com-
FIG 5. The relationship between the CSF volume withdrawn during lumbar puncture and CSFvolume change in the spinal canal between the pre- and post-lumbar puncture scan (A) and thepre- and the 2-week follow-up scan (B) as measured by the proposed method.
1962 Alperin Oct 2016 www.ajnr.org
partment in intracranial pressure regulation and the benefit of
automated craniospinal CSF volumetry to further elucidate the
pathophysiology of CSF-related diseases.
Disclosures: Noam Alperin—UNRELATED: Board Membership: Alperin NoninvasiveDiagnostics. Byron L. Lam—RELATED: Grant: North American Neuro-Ophthalmol-ogy Society pilot grant.* *Money paid to the institution.
REFERENCES1. Silverberg GD, Heit G, Huhn S, et al. The cerebrospinal fluid pro-
duction rate is reduced in dementia of the Alzheimer’s type. Neu-rology 2001;57:1763– 66 CrossRef Medline
2. Singer OC, Melber J, Hattingen E, et al. MR volumetric changes afterdiagnostic CSF removal in normal pressure hydrocephalus. J Neu-rology 2012;259:2440 – 46 CrossRef Medline
3. Alperin N, Ranganathan S, Bagci AM, et al. MRI evidence of im-paired CSF homeostasis in obesity-associated idiopathic intracra-nial hypertension. AJNR Am J Neuroradiol 2013;34:29 –34 CrossRefMedline
4. Onuki E, Higuchi H, Takagi S, et al. Gestation-related reduction inlumbar cerebrospinal fluid volume and dural sac surface area.Anesth Analg 2010;110:148 –53 CrossRef Medline
5. Alperin N, Lee SH, Sivaramakrishnan A, et al. Quantifying the effectof posture on intracranial physiology in humans by MRI flow stud-ies. J Magn Reson Imaging 2005;22:591–96 CrossRef Medline
6. Lee RR, Abraham RA, Quinn CB. Dynamic physiologic changes inlumbar CSF volume quantitatively measured by three-dimensionalfast spin-echo MRI. Spine (Phila Pa 1976) 2001;26:1172–78 CrossRefMedline
7. Higuchi H, Adachi Y, Kazama T. The influence of lumbosacral cerebro-spinal fluid volume on extent and duration of hyperbaric bupivacainespinal anesthesia: a comparison between seated and lateral decubitusinjection positions. Anesth Analg 2005;101:555–60 CrossRef Medline
8. Rashid W, Davies GR, Chard DT, et al. Increasing cord atrophy inearly relapsing-remitting multiple sclerosis: a 3 year study. J NeurolNeurosurg Psychiatry 2006;77:51–55 CrossRef Medline
9. Fischl B, Salat DH, Busa E, et al. Whole brain segmentation: auto-mated labeling of neuroanatomical structures in the human brain.Neuron 2002;33:341–55 CrossRef Medline
10. Ashburner J, Friston KJ. Unified segmentation. Neuroimage 2005;26:839 –51 CrossRef Medline
11. Hogan QH, Prost R, Kulier A, et al. Magnetic resonance imaging of
cerebrospinal fluid volume and the influence of body habitus and ab-dominal pressure. Anesthesiology 1996;84:1341–49 CrossRef Medline
12. Edsbagge M, Starck G, Zetterberg H, et al. Spinal cerebrospinal fluidvolume in healthy elderly individuals. Clin Anat 2011;24:733– 40CrossRef Medline
13. Lebret A, Hodel J, Rahmouni A, et al. Cerebrospinal fluid volumeanalysis for hydrocephalus diagnosis and clinical research. ComputMed Imaging Graph 2013;37:224 –33 CrossRef Medline
14. Horsfield MA, Sala S, Neema M, et al. Rapid semi-automatic seg-mentation of the spinal cord from magnetic resonance images:application in multiple sclerosis. Neuroimage 2010;50:446 –55CrossRef Medline
15. Smith SM. Fast robust automated brain extraction. Hum BrainMapp 2002;17:143–55 CrossRef Medline
16. Chan TF, Vese LA. Active contours without edges. IEEE Trans ImageProcess 2001;10:266 –77 CrossRef Medline
17. Tain RW, Bagci AM, Lam BL, et al. Determination of cranio-spinalcanal compliance distribution by MRI: methodology and early ap-plication in idiopathic intracranial hypertension. J Magn Reson Im-aging 2011;34:1397– 404 CrossRef Medline
18. Yallapragada N, Alperin N. Characterization of spinal canal hydro-dynamics and compliance using bond graph technique and CSFflow measurements by MRI. In: Proceedings of the Scientific Meetingand Exhibition of the International Society for Magnetic Resonance inMedicine, Kyoto, Japan. May 15–21, 2004:2658
19. Greitz D, Hannerz J A proposed model of cerebrospinal fluidcirculation: observations with radionuclide cisternography. AJNRAm J Neuroradiol 1996;17:431–38 Medline
20. Huang TY, Chung HW, Chen MY, et al. Supratentorial cerebrospinalfluid production rate in healthy adults: quantification with two-di-mensional cine phase-contrast MR imaging with high temporal andspatial resolution. Radiology 2004;233:603–08 CrossRef Medline
21. Cutler RW, Page L, Galicich J, et al. Formation and absorption ofcerebrospinal fluid in man. Brain 1968;91:707–20 CrossRef Medline
22. Alperin N, Lam BL, Tain RW, et al. Evidence for altered spinal canalcompliance and cerebral venous drainage in untreated idiopathicintracranial hypertension. Acta Neurochir Suppl 2012;114:201– 05CrossRef Medline
23. Scoffings DJ, Pickard JD, Higgins JN. Resolution of transverse sinusstenoses immediately after CSF withdrawal in idiopathic intracra-nial hypertension. J Neurol Neurosurg Psychiatry 2007;78:911–12CrossRef Medline
AJNR Am J Neuroradiol 37:1957– 63 Oct 2016 www.ajnr.org 1963
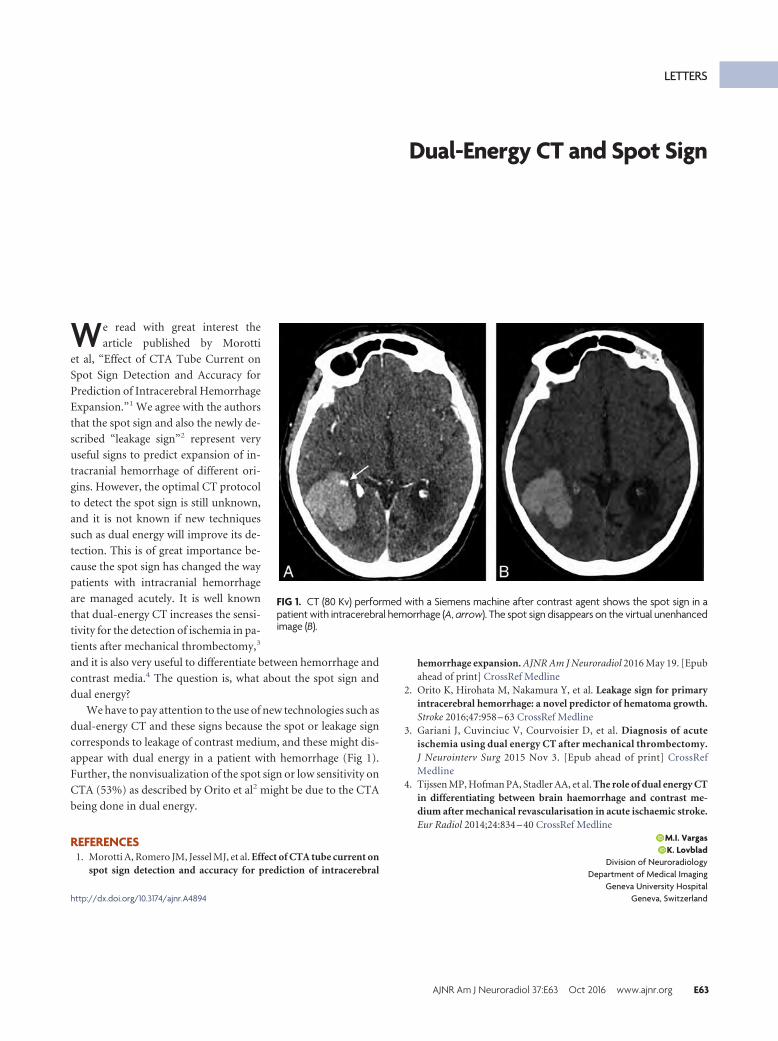
LETTERS
Dual-Energy CT and Spot Sign
We read with great interest the
article published by Morotti
et al, “Effect of CTA Tube Current on
Spot Sign Detection and Accuracy for
Prediction of Intracerebral Hemorrhage
Expansion.”1 We agree with the authors
that the spot sign and also the newly de-
scribed “leakage sign”2 represent very
useful signs to predict expansion of in-
tracranial hemorrhage of different ori-
gins. However, the optimal CT protocol
to detect the spot sign is still unknown,
and it is not known if new techniques
such as dual energy will improve its de-
tection. This is of great importance be-
cause the spot sign has changed the way
patients with intracranial hemorrhage
are managed acutely. It is well known
that dual-energy CT increases the sensi-
tivity for the detection of ischemia in pa-
tients after mechanical thrombectomy,3
and it is also very useful to differentiate between hemorrhage and
contrast media.4 The question is, what about the spot sign and
dual energy?
We have to pay attention to the use of new technologies such as
dual-energy CT and these signs because the spot or leakage sign
corresponds to leakage of contrast medium, and these might dis-
appear with dual energy in a patient with hemorrhage (Fig 1).
Further, the nonvisualization of the spot sign or low sensitivity on
CTA (53%) as described by Orito et al2 might be due to the CTA
being done in dual energy.
REFERENCES1. Morotti A, Romero JM, Jessel MJ, et al. Effect of CTA tube current on
spot sign detection and accuracy for prediction of intracerebral
hemorrhage expansion. AJNR Am J Neuroradiol 2016 May 19. [Epubahead of print] CrossRef Medline
2. Orito K, Hirohata M, Nakamura Y, et al. Leakage sign for primaryintracerebral hemorrhage: a novel predictor of hematoma growth.Stroke 2016;47:958 – 63 CrossRef Medline
3. Gariani J, Cuvinciuc V, Courvoisier D, et al. Diagnosis of acuteischemia using dual energy CT after mechanical thrombectomy.J Neurointerv Surg 2015 Nov 3. [Epub ahead of print] CrossRefMedline
4. Tijssen MP, Hofman PA, Stadler AA, et al. The role of dual energy CTin differentiating between brain haemorrhage and contrast me-dium after mechanical revascularisation in acute ischaemic stroke.Eur Radiol 2014;24:834 – 40 CrossRef Medline
X M.I. VargasX K. Lovblad
Division of NeuroradiologyDepartment of Medical Imaging
Geneva University HospitalGeneva, Switzerlandhttp://dx.doi.org/10.3174/ajnr.A4894
FIG 1. CT (80 Kv) performed with a Siemens machine after contrast agent shows the spot sign in apatient with intracerebral hemorrhage (A, arrow). The spot sign disappears on the virtual unenhancedimage (B).
AJNR Am J Neuroradiol 37:E63 Oct 2016 www.ajnr.org E63
REPLY:
We thank Drs Vargas and Lovblad for their interest and com-
ments on our article investigating the influence of CTA
tube current on spot sign detection and prediction of intracere-
bral hemorrhage expansion. The role of dual-energy CT (DECT)
in spot sign identification has not been extensively and systemat-
ically investigated, to our knowledge, and we agree that more
research on the use of this technique is needed. DECT can distin-
guish different types of materials with high sensitivity and speci-
ficity.1,2 As shown in the figure provided by Drs Vargas and
Lovblad, DECT can remove spots of iodine extraction from the
virtual noncontrast images and map them to the iodine-overlay
images. The degree to which this separation is effective and the
minimum concentration of extravasated iodine separable from
hematoma, in situ, are currently unknown. Therefore, how the
single-energy CT spot sign should be translated in the context of
dual-energy remains a topic of research. For example, it is not
clear whether one should be counting the number of spots on the
iodine-overlay images or computing the total amount of extrav-
asated iodine in the iodine-overlay images. We would like to high-
light the following additional points:
1) There is great heterogeneity in the CTA acquisition proto-
col,3 and several factors such as the time from stroke onset to CTA
and acquisition of delayed images4,5 can influence the rate of spot
sign identification and its ability to identify patients at high risk of
hematoma expansion. Therefore, the relatively low sensitivity
(53%) reported by Du et al6 in a recent meta-analysis cannot be
directly attributed to the use of DECT.
2) It is difficult to compare the frequency and diagnostic per-
formance of the spot sign across different studies because several
definitions of spot sign and hematoma expansion have been re-
ported and used in clinical practice.4
3) DECT has the ability to reduce artifacts and to remodel the
signal-to-noise ratio7 and may therefore provide an additional
diagnostic value in case of poor-quality scans.
4) Vascular and nonvascular cerebral lesions like aneurysms or
calcifications can mimic the spot sign,8 and DECT appears supe-
rior to conventional CTA in the identification of these mimics.7
5) There are multiple implementations of DECT, and not all of
them are dose-neutral compared with a single-energy CT scan. In
general, the advantages of DECT use need to be balanced against
the risk of increased radiation delivery.9
In conclusion, DECT is a promising technique, but its role in
spot sign identification is still unclear.
REFERENCES1. Gupta R, Phan CM, Leidecker C, et al. Evaluation of dual-energy
CT for differentiating intracerebral hemorrhage from iodinatedcontrast material staining. Radiology 2010;257:205–11 CrossRefMedline
2. Phan CM, Yoo AJ, Hirsch JA, et al. Differentiation of hemorrhagefrom iodinated contrast in different intracranial compartments us-ing dual-energy head CT. AJNR Am J Neuroradiol 2012;33:1088 –94CrossRef Medline
3. Huynh TJ, Demchuk AM, Dowlatshahi D, et al; PREDICT/Sunny-brook ICH CTA Study Group. Spot sign number is the most impor-tant spot sign characteristic for predicting hematoma expansionusing first-pass computed tomography angiography: analysis fromthe PREDICT study. Stroke 2013;44:972–77 CrossRef Medline
4. Brouwers HB, Goldstein JN, Romero JM, et al. Clinical applicationsof the computed tomography angiography spot sign in acute intra-cerebral hemorrhage: a review. Stroke 2012;43:3427–32 CrossRefMedline
5. Ciura VA, Brouwers HB, Pizzolato R, et al. Spot sign on 90-seconddelayed computed tomography angiography improves sensitivityfor hematoma expansion and mortality: prospective study. Stroke2014;45:3293–97 CrossRef Medline
6. Du F, Jiang R, Gu M, et al. The accuracy of spot sign in predictinghematoma expansion after intracerebral hemorrhage: a systematicreview and meta-analysis. PLoS One 2014;9:e115777 CrossRefMedline
7. Postma AA, Das M, Stadler AA, et al. Dual-energy CT: what theneuroradiologist should know. Curr Radiol Rep 2015;3:16 CrossRefMedline
8. Gazzola S, Aviv RI, Gladstone DJ, et al. Vascular and nonvascularmimics of the CT angiography “spot sign” in patients with second-ary intracerebral hemorrhage. Stroke 2008;39:1177– 83 CrossRefMedline
9. Smith AB, Dillon WP, Gould R, et al. Radiation dose-reductionstrategies for neuroradiology CT protocols. AJNR Am J Neuroradiol2007;28:1628 –32 CrossRef Medline
X A. MorottiDepartment of Clinical and Experimental Sciences, Neurology Clinic
University of Brescia, Brescia, ItalyJ. P. Kistler Stroke Research Center
Massachusetts General Hospital, Harvard Medical SchoolBoston, Massachusetts
X J.M. RomeroX R. Gupta
Neuroradiology Service, Department of RadiologyMassachusetts General Hospital, Harvard Medical School
Boston, MassachusettsX J.N. Goldstein
J. P. Kistler Stroke Research CenterDepartment of Emergency Medicine
Massachusetts General Hospital, Harvard Medical SchoolBoston, Massachusettshttp://dx.doi.org/10.3174/ajnr.A4887
E64 Letters Oct 2016 www.ajnr.org
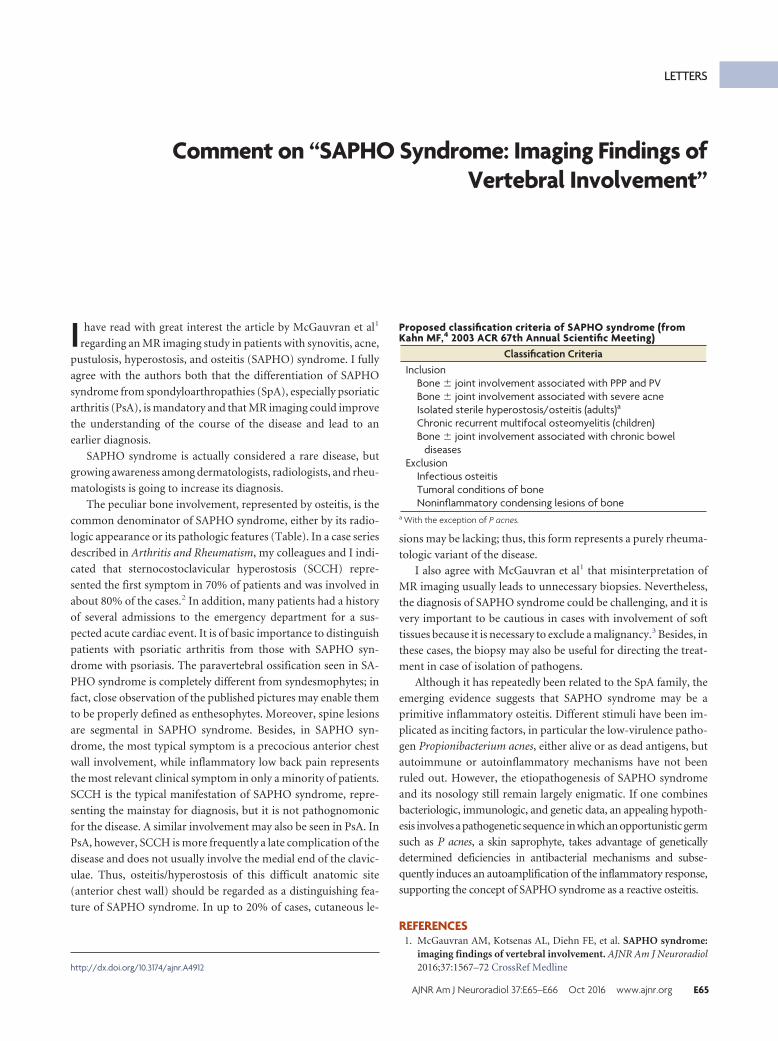
LETTERS
Comment on “SAPHO Syndrome: Imaging Findings ofVertebral Involvement”
I have read with great interest the article by McGauvran et al1
regarding an MR imaging study in patients with synovitis, acne,
pustulosis, hyperostosis, and osteitis (SAPHO) syndrome. I fully
agree with the authors both that the differentiation of SAPHO
syndrome from spondyloarthropathies (SpA), especially psoriatic
arthritis (PsA), is mandatory and that MR imaging could improve
the understanding of the course of the disease and lead to an
earlier diagnosis.
SAPHO syndrome is actually considered a rare disease, but
growing awareness among dermatologists, radiologists, and rheu-
matologists is going to increase its diagnosis.
The peculiar bone involvement, represented by osteitis, is the
common denominator of SAPHO syndrome, either by its radio-
logic appearance or its pathologic features (Table). In a case series
described in Arthritis and Rheumatism, my colleagues and I indi-
cated that sternocostoclavicular hyperostosis (SCCH) repre-
sented the first symptom in 70% of patients and was involved in
about 80% of the cases.2 In addition, many patients had a history
of several admissions to the emergency department for a sus-
pected acute cardiac event. It is of basic importance to distinguish
patients with psoriatic arthritis from those with SAPHO syn-
drome with psoriasis. The paravertebral ossification seen in SA-
PHO syndrome is completely different from syndesmophytes; in
fact, close observation of the published pictures may enable them
to be properly defined as enthesophytes. Moreover, spine lesions
are segmental in SAPHO syndrome. Besides, in SAPHO syn-
drome, the most typical symptom is a precocious anterior chest
wall involvement, while inflammatory low back pain represents
the most relevant clinical symptom in only a minority of patients.
SCCH is the typical manifestation of SAPHO syndrome, repre-
senting the mainstay for diagnosis, but it is not pathognomonic
for the disease. A similar involvement may also be seen in PsA. In
PsA, however, SCCH is more frequently a late complication of the
disease and does not usually involve the medial end of the clavic-
ulae. Thus, osteitis/hyperostosis of this difficult anatomic site
(anterior chest wall) should be regarded as a distinguishing fea-
ture of SAPHO syndrome. In up to 20% of cases, cutaneous le-
sions may be lacking; thus, this form represents a purely rheuma-
tologic variant of the disease.
I also agree with McGauvran et al1 that misinterpretation of
MR imaging usually leads to unnecessary biopsies. Nevertheless,
the diagnosis of SAPHO syndrome could be challenging, and it is
very important to be cautious in cases with involvement of soft
tissues because it is necessary to exclude a malignancy.3 Besides, in
these cases, the biopsy may also be useful for directing the treat-
ment in case of isolation of pathogens.
Although it has repeatedly been related to the SpA family, the
emerging evidence suggests that SAPHO syndrome may be a
primitive inflammatory osteitis. Different stimuli have been im-
plicated as inciting factors, in particular the low-virulence patho-
gen Propionibacterium acnes, either alive or as dead antigens, but
autoimmune or autoinflammatory mechanisms have not been
ruled out. However, the etiopathogenesis of SAPHO syndrome
and its nosology still remain largely enigmatic. If one combines
bacteriologic, immunologic, and genetic data, an appealing hypoth-
esis involves a pathogenetic sequence in which an opportunistic germ
such as P acnes, a skin saprophyte, takes advantage of genetically
determined deficiencies in antibacterial mechanisms and subse-
quently induces an autoamplification of the inflammatory response,
supporting the concept of SAPHO syndrome as a reactive osteitis.
REFERENCES1. McGauvran AM, Kotsenas AL, Diehn FE, et al. SAPHO syndrome:
imaging findings of vertebral involvement. AJNR Am J Neuroradiol2016;37:1567–72 CrossRef Medlinehttp://dx.doi.org/10.3174/ajnr.A4912
Proposed classification criteria of SAPHO syndrome (fromKahn MF,4 2003 ACR 67th Annual Scientific Meeting)
Classification CriteriaInclusion
Bone � joint involvement associated with PPP and PVBone � joint involvement associated with severe acneIsolated sterile hyperostosis/osteitis (adults)a
Chronic recurrent multifocal osteomyelitis (children)Bone � joint involvement associated with chronic bowel
diseasesExclusion
Infectious osteitisTumoral conditions of boneNoninflammatory condensing lesions of bone
a With the exception of P acnes.
AJNR Am J Neuroradiol 37:E65–E66 Oct 2016 www.ajnr.org E65

2. Colina, Govoni M, Orzincolo C, et al. Clinical and radiological evo-lution of synovitis, acne, pustulosis, hyperostosis, and osteitissyndrome: a single center study of a cohort of 71 subjects. ArthritisRheum 2009;61:813 CrossRef Medline
3. Colina M. Diagnostic challenges of SAPHO syndrome. J Rheumatol2015;42:2514 CrossRef Medline
4. Kahn MF. Proposed classification criteria of SAPHO syndrome. In:
Proceedings of the Annual Meeting of the American College of Radiology,Orlando, Florida. October 23–28, 2003
X M. ColinaRheumatology Service
Department of Internal Medicine and OncologyOspedale Santa Maria della Scaletta
Imola, Bologna, Italy
E66 Letters Oct 2016 www.ajnr.org
REPLY:
We thank Dr Colina for his comments regarding our recent
article “SAPHO Syndrome: Imaging Findings of Vertebral
Involvement.”1 We agree that growing awareness of SAPHO syn-
drome and its clinical and imaging findings will lead to earlier
diagnosis.
In response to the comment that sternocostoclavicular hyper-
ostosis represented the first symptom in 70% of the patients re-
ported in the study by Colina et al,2 39% of the patients in our
series had concurrent sternoclavicular involvement and 22% in-
volvement of the first costovertebral joint, supporting this being a
common symptom. We believe knowledge of the typical vertebral
findings is critical in making an appropriate diagnosis in the sub-
stantial minority of patients who do not present with sternocos-
toclavicular hyperostosis.
Because our article focused on the unique spinal manifesta-
tions of SAPHO syndrome, we did not investigate the frequency
with which patients in our series presented to the emergency de-
partment with chest pain or a coronary work-up. This would be
an interesting area for further investigation.
Finally, we agree that the diagnosis of SAPHO syndrome is
challenging and requires a multidisciplinary approach. In patients
presenting with the unique curvilinear or semicircular pattern of
contiguous vertebral involvement that we described along with
sclerosis along ligamentous attachment sites and the absence of
abnormal T2 hyperintensity and enhancement of the interverte-
bral disc, SAPHO syndrome should be included in the differential
diagnosis. A search for the concurrent sternoclavicular involve-
ment and consultation with dermatology and/or rheumatology
colleagues to identify the typical skin manifestations may prevent
misinterpretation of the imaging findings as discitis/osteomyelitis
or metastases, with subsequent potential reduction in the number
of unnecessary biopsies and delayed diagnoses.
REFERENCES1. McGauvran AM, Kotsenas AL, Diehn FE, et al. SAPHO syndrome:
imaging findings of vertebral involvement. AJNR Am J Neuroradiol2016;37:1567–72 CrossRef Medline
2. Colina, Govoni M, Orzincolo C, et al. Clinical and radiological evo-lution of synovitis, acne, pustulosis, hyperostosis, and osteitissyndrome: a single center study of a cohort of 71 subjects. ArthritisRheum 2009;61:813 CrossRef Medline
X A.M. McGauvranX A.L. Kotsenas
Department of RadiologyMayo Clinic
Rochester, Minnesotahttp://dx.doi.org/10.3174/ajnr.A4913
AJNR Am J Neuroradiol 37:E67 Oct 2016 www.ajnr.org E67
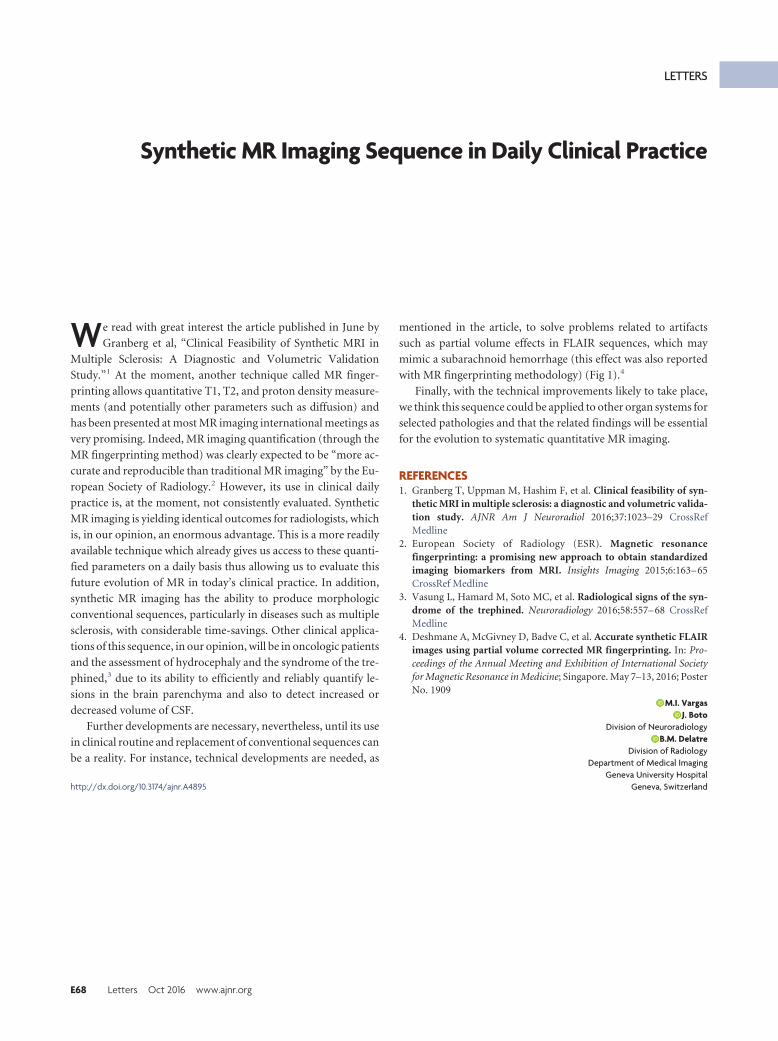
LETTERS
Synthetic MR Imaging Sequence in Daily Clinical Practice
We read with great interest the article published in June by
Granberg et al, “Clinical Feasibility of Synthetic MRI in
Multiple Sclerosis: A Diagnostic and Volumetric Validation
Study.”1 At the moment, another technique called MR finger-
printing allows quantitative T1, T2, and proton density measure-
ments (and potentially other parameters such as diffusion) and
has been presented at most MR imaging international meetings as
very promising. Indeed, MR imaging quantification (through the
MR fingerprinting method) was clearly expected to be “more ac-
curate and reproducible than traditional MR imaging” by the Eu-
ropean Society of Radiology.2 However, its use in clinical daily
practice is, at the moment, not consistently evaluated. Synthetic
MR imaging is yielding identical outcomes for radiologists, which
is, in our opinion, an enormous advantage. This is a more readily
available technique which already gives us access to these quanti-
fied parameters on a daily basis thus allowing us to evaluate this
future evolution of MR in today’s clinical practice. In addition,
synthetic MR imaging has the ability to produce morphologic
conventional sequences, particularly in diseases such as multiple
sclerosis, with considerable time-savings. Other clinical applica-
tions of this sequence, in our opinion, will be in oncologic patients
and the assessment of hydrocephaly and the syndrome of the tre-
phined,3 due to its ability to efficiently and reliably quantify le-
sions in the brain parenchyma and also to detect increased or
decreased volume of CSF.
Further developments are necessary, nevertheless, until its use
in clinical routine and replacement of conventional sequences can
be a reality. For instance, technical developments are needed, as
mentioned in the article, to solve problems related to artifacts
such as partial volume effects in FLAIR sequences, which may
mimic a subarachnoid hemorrhage (this effect was also reported
with MR fingerprinting methodology) (Fig 1).4
Finally, with the technical improvements likely to take place,
we think this sequence could be applied to other organ systems for
selected pathologies and that the related findings will be essential
for the evolution to systematic quantitative MR imaging.
REFERENCES1. Granberg T, Uppman M, Hashim F, et al. Clinical feasibility of syn-
thetic MRI in multiple sclerosis: a diagnostic and volumetric valida-tion study. AJNR Am J Neuroradiol 2016;37:1023–29 CrossRefMedline
2. European Society of Radiology (ESR). Magnetic resonancefingerprinting: a promising new approach to obtain standardizedimaging biomarkers from MRI. Insights Imaging 2015;6:163– 65CrossRef Medline
3. Vasung L, Hamard M, Soto MC, et al. Radiological signs of the syn-drome of the trephined. Neuroradiology 2016;58:557– 68 CrossRefMedline
4. Deshmane A, McGivney D, Badve C, et al. Accurate synthetic FLAIRimages using partial volume corrected MR fingerprinting. In: Pro-ceedings of the Annual Meeting and Exhibition of International Societyfor Magnetic Resonance in Medicine; Singapore. May 7–13, 2016; PosterNo. 1909
X M.I. VargasX J. Boto
Division of NeuroradiologyX B.M. Delatre
Division of RadiologyDepartment of Medical Imaging
Geneva University HospitalGeneva, Switzerlandhttp://dx.doi.org/10.3174/ajnr.A4895
E68 Letters Oct 2016 www.ajnr.org
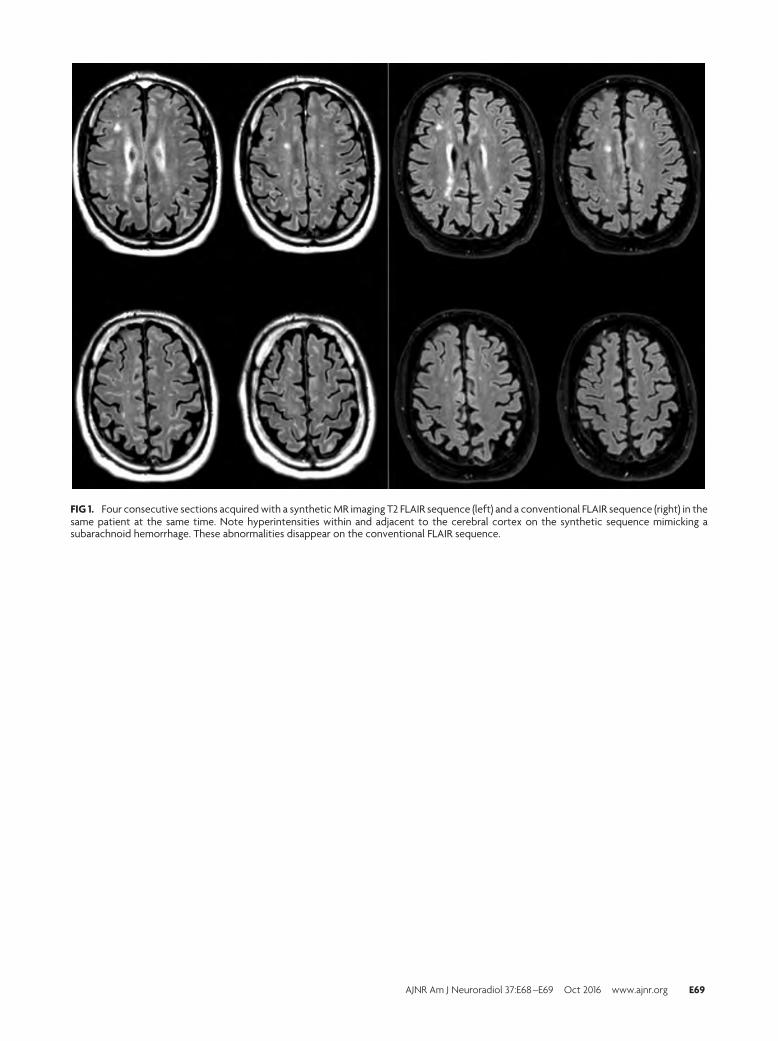
FIG 1. Four consecutive sections acquired with a synthetic MR imaging T2 FLAIR sequence (left) and a conventional FLAIR sequence (right) in thesame patient at the same time. Note hyperintensities within and adjacent to the cerebral cortex on the synthetic sequence mimicking asubarachnoid hemorrhage. These abnormalities disappear on the conventional FLAIR sequence.
AJNR Am J Neuroradiol 37:E68 –E69 Oct 2016 www.ajnr.org E69
REPLY:
We thank Vargas et al for their interest in our work and agree
that synthetic MR imaging indeed is a promising technique
with many potential applications for both clinical practice and
research. As the authors mention, there are similarities between
synthetic MR imaging and MR fingerprinting in their potential to
reduce scanning time and provide quantitative MR imaging mea-
surements to more objectively characterize tissue properties.1
In terms of clinical applications, SyMRI (SyntheticMR,
Linkoping, Sweden) has come far in making the sequence avail-
able on clinical scanners and integrating the analysis software in
the clinical PACS system, making it feasible for clinical practice.2
Further validations of the technique are expected, and recently its
quantification of proton-density, T1, and T2 have been shown to
be accurate and reproducible, even with different coils.3 These
results are promising for multicenter and longitudinal use. A pre-
cision study of synthetic MR imaging across scanners and field
strengths would, therefore, be especially valuable for future stud-
ies and is planned. There are also areas for future developments of
the technique, in which FLAIR artifacts are currently being ad-
dressed. 3D and further accelerated acquisitions remain on the
wish list. In our group, we are currently evaluating nonconven-
tional synthetic contrast weightings, such as phase-sensitive in-
version recovery for detecting cortical involvement in multiple
sclerosis, and more advanced tissue modeling based on the relax-
ometry. Other likely future applications include spinal imaging
and body imaging, such as musculoskeletal imaging.
Meanwhile, MR fingerprinting is still in the early phases of
development with many promising applications. How and where
these techniques can be applied and provide clinically important
and possibly complementing information remains to be explored.
As often found in MR imaging, the main bottleneck in terms of
possibilities for both techniques is our imagination.4
REFERENCES1. European Society of Radiology (ESR). Magnetic resonance
fingerprinting: a promising new approach to obtain standardizedimaging biomarkers from MRI. Insights Imaging 2015;6:163– 65CrossRef Medline
2. Granberg T, Uppman M, Hashim F, et al. Clinical feasibility of syn-thetic MRI in multiple sclerosis: a diagnostic and volumetric vali-dation study. AJNR Am J Neuroradiol 2016;37:1023–29 CrossRefMedline
3. Krauss W, Gunnarsson M, Andersson T, et al. Accuracy and repro-ducibility of a quantitative magnetic resonance imaging methodfor concurrent measurements of tissue relaxation times and protondensity. Magn Reson Imaging 2015;33:584 –91 CrossRef Medline
4. Ma D, Pierre EY, Jiang Y, et al. Music-based magnetic resonancefingerprinting to improve patient comfort during MRI examina-tions. Magn Reson Med 2016;75:2303–14 CrossRef Medline
X T. GranbergDepartment of Clinical Science, Intervention, and Technology
Karolinska InstitutetStockholm, Sweden
Department of RadiologyKarolinska University Hospital
Stockholm, Swedenhttp://dx.doi.org/10.3174/ajnr.A4896
E70 Letters Oct 2016 www.ajnr.org
Related Documents


