Performance Based Learning and Assessment Task #1 Curve of Best Fit. I. ASSESSSMENT TASK OVERVIEW & PURPOSE: The task is to provide real world experience for students involving quadratic equations and specifically finding the curve of best fit using data they have gathered. The student will take measurements of how much water has drained at specific intervals, plot and then derive the equation of best fit. II. UNIT AUTHOR: Arthur Madeoy, Frederick County Middle School, Frederick County, VA III. COURSE: AFDA IV. CONTENT STRAND: Algebra and Functions V. OBJECTIVES: The learner will be able to gather data, represent properly on a Cartesian plane, and determine whether to derive the line of best fit or curve of best fit utilizing the data gathered. VI. REFERENCE/RESOURCE MATERIALS: Students will use a narrow stem funnel, measuring cup, graph paper, clock, and TI-84 calculator. VII. PRIMARY ASSESSMENT STRATEGIES: Students will be assessed on: • Gathering the data correctly • Analyzing the data to choose whether to derive the a line/curve of best fit • Deriving the proper line/curve of best fit VIII. EVALUATION CRITERIA: See attached rubric and data sheet. IX. INSTRUCTIONAL TIME: This task should take one 50 minute class period.

Welcome message from author
This document is posted to help you gain knowledge. Please leave a comment to let me know what you think about it! Share it to your friends and learn new things together.
Transcript

Performance Based Learning and Assessment Task #1 Curve of Best Fit.
I. ASSESSSMENT TASK OVERVIEW & PURPOSE: The task is to provide real world experience for students involving quadratic equations and specifically finding the curve of best fit using data they have gathered. The student will take measurements of how much water has drained at specific intervals, plot and then derive the equation of best fit.
II. UNIT AUTHOR: Arthur Madeoy, Frederick County Middle School, Frederick County, VA
III. COURSE: AFDA
IV. CONTENT STRAND: Algebra and Functions
V. OBJECTIVES: The learner will be able to gather data, represent properly on a Cartesian plane, and determine whether to derive the line of best fit or curve of best fit utilizing the data gathered.
VI. REFERENCE/RESOURCE MATERIALS: Students will use a narrow stem funnel, measuring cup, graph paper, clock, and TI-84 calculator.
VII. PRIMARY ASSESSMENT STRATEGIES:
Students will be assessed on:
• Gathering the data correctly
• Analyzing the data to choose whether to derive the a line/curve of best fit
• Deriving the proper line/curve of best fit
VIII. EVALUATION CRITERIA: See attached rubric and data sheet.
IX. INSTRUCTIONAL TIME: This task should take one 50 minute class period.

2
Can I create a curve of best fit to model water drainage? Strand Algebra and Functions Mathematical Objective(s)
The learner will be able to gather data, represent properly on a Cartesian plane, and determine whether to derive the line of best fit or curve of best fit utilizing the data gathered.
Related SOL AFDA.3 The student will collect data and generate an equation for the curve of best fit to
model real world problems or applications. NCTM Standards
• Make conjectures about possible relationships between two characteristics of a sample on the basis of scatter plots of the data and approximate lines of fit
• Draw reasonable conclusions about a situation being modeled • Model and solve contextualized problems using various representations, such as graphs,
tables, and equations Additional Objectives for Student Learning (include if relevant; may not be math-related): Students should understand that most events in the universe do not occur at constant rates and that there is a whole branch of mathematics focused on varying rates. Materials/Resources Students will use a narrow stem funnel, measuring cup, graph paper, clock, and TI-84 calculator.

3
Assumption of Prior Knowledge • Graphing data on a Cartesian plane • Using scatter plots to determine if they represent a curve or a line
• Using data to find the line/curve of best fit
• Students may struggle in determining whether to use line/curve of best fit
To help prevent this issue, lines and curves will be reviewed before the activity
Introduction: Setting Up the Mathematical Task In this activity you will determine if water flows out of a water tower at a constant rate or if it varies. The task will take one class period (50 minutes). You will model a water tower by funneling water into a measuring cup. This task will be done with groups of 3.
1. You will pour 8 ounces of water into the funnel which is placed above the measuring cup.
2. Using the clock on the wall, you will allow water to drain for 3 seconds.
3. Take note of the amount of water in the measuring cup.
4. Record your data in the table provided.
5. Then you will repeat the process until all the water is emptied from the bottle.
Teacher will demonstrate how to do the steps properly.
Student Exploration Small Group Work Students will work together in groups of 3. One student should be doing the time, another the measuring, and the third student records the data. Students should work together to interpret the data and deciding on the best type of trend line. Student/Teacher Interactions Students should be communicating about the task. When completed they should be asking themselves and each other (in their group) why they chose to use a line or curve of best fit. Students should also be asking why the water would flow at a rate that varies. The teacher will go around the room and ensure that the students are following procedure and using questioning to guide students in their exploration.

4
Monitoring Student Responses Any group needing assistance on gathering data will be assisted. Those students who need extra help in understanding lines and curves will be given assistance. Students will demonstrate their knowledge of the material by explaining their reasoning in choosing whether to use a line or a curve.

5
AFDA Name(s)______________________________________________________________
"Curve of Best Fit”
You will model a water tower that a farm uses to water their cattle using a 10 oz. water bottle, a bowl, a measuring cup, and a clock. You will collect data by measuring the amount of water you collect at different time intervals. You will graph your data and find the curve of best fit. Be ready to explain your model. Use your model to predict the amount of water that is collected at a time period beyond your last collected data point.
Part I
Steps
1. You will fill the water bottle with 10 ounces of water and then set the water in the bowl so that the
water begins to drain.
2. Using the clock on the wall, you will allow water to drain for 3 seconds.
3. Check the measuring cup to see how much water has drained using the measuring lines on the sides.
4. Record your data in the table on the next page.
5. Then you will repeat the process until the water has completely flowed into the measuring cup.
6
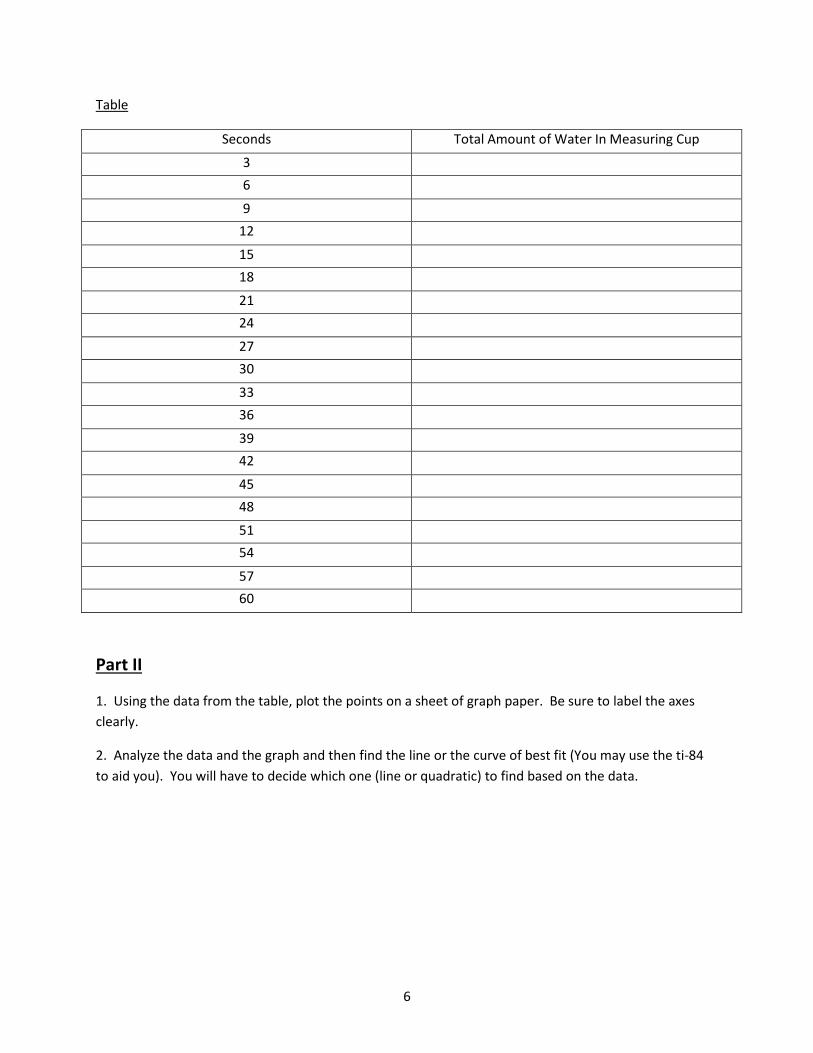
Table
Seconds Total Amount of Water In Measuring Cup
3 6
9 12
15 18
21 24
27 30
33 36
39 42
45 48
51 54
57 60
Part II
1. Using the data from the table, plot the points on a sheet of graph paper. Be sure to label the axes clearly.
2. Analyze the data and the graph and then find the line or the curve of best fit (You may use the ti-84 to aid you). You will have to decide which one (line or quadratic) to find based on the data.

7
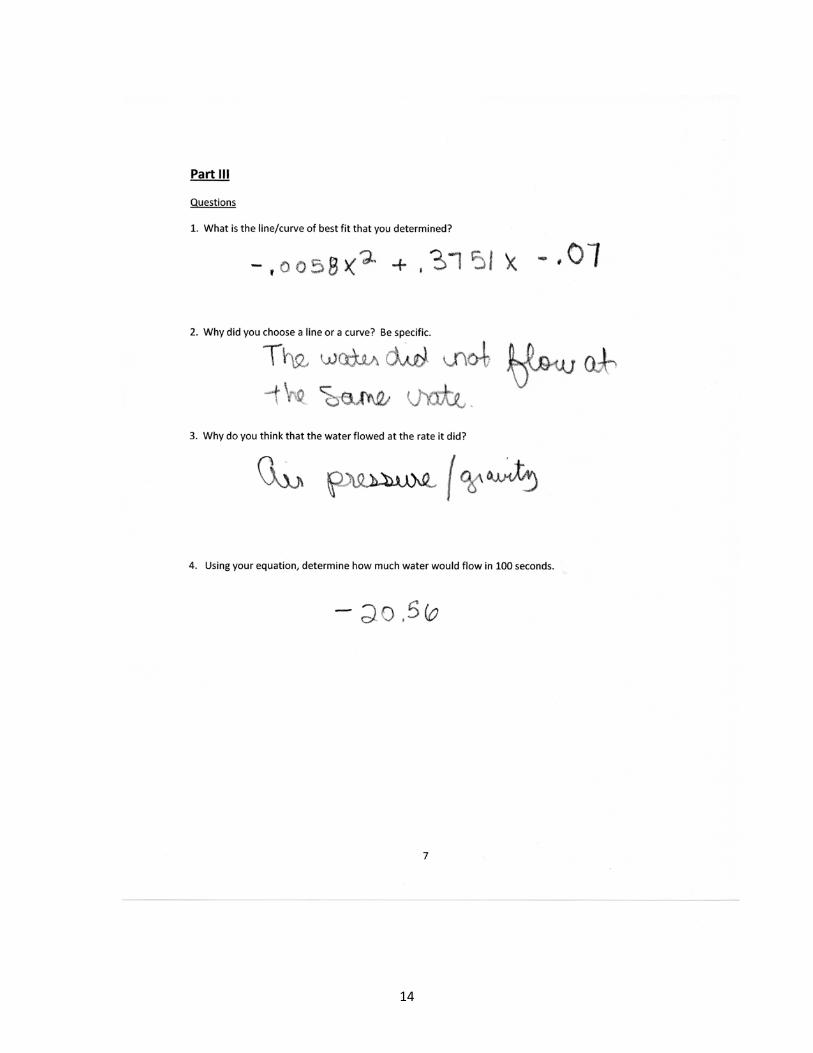
Part III
Questions
1. What is the curve of best fit that you determined?
2. Why did you choose a line or a quadratic? Be specific.
3. Why do you think that the water flowed at the rate it did?
4. Using your equation, determine how much water would flow in 100 seconds.

8
Rubric For Activity
"Curve of Best Fit”
Goals 0 1 2 3
Data Gathering No evidence Data was found but was not correct. Did not follow proper procedure.
Data was found but not correct. Proper procedure was inconsistently followed.
Data was found and is correct and proper procedure was adhered to.
Represented Data on Cartesian Plane
No evidence Data was improperly placed on the Cartesian plane with no reasoning behind the placement.
Data was improperly placed on the Cartesian plane but a slight mistake was made in doing so.
Data was properly placed on the Cartesian plane.
Chose correctly whether to create a line or curve of best fit
No evidence Incorrectly/correctly chose line/curve of best fit and evidence of reasoning was flawed.
Incorrectly/Correctly chose line/curve of best fit but reasoning was to a small extent flawed.
Correctly chose line/curve of best fit and reasoning was solid.
Accurately found the equation of the line or curve of best fit
No evidence Found incorrect line or curve equation and method in doing so was incorrect.
Found incorrect line or curve equation but method was correct and only a slight mistake was found in the process.
Found correct equation for the line or curve of best fit.
Follows Procedure and Presentable.
No Evidence. Did not follow procedures and/or work is not neat, organized and presentable.
Followed procedure and work is neat, organized, and presentable but has minor errors.
Followed procedure and work is neat, organized, and presentable.
9
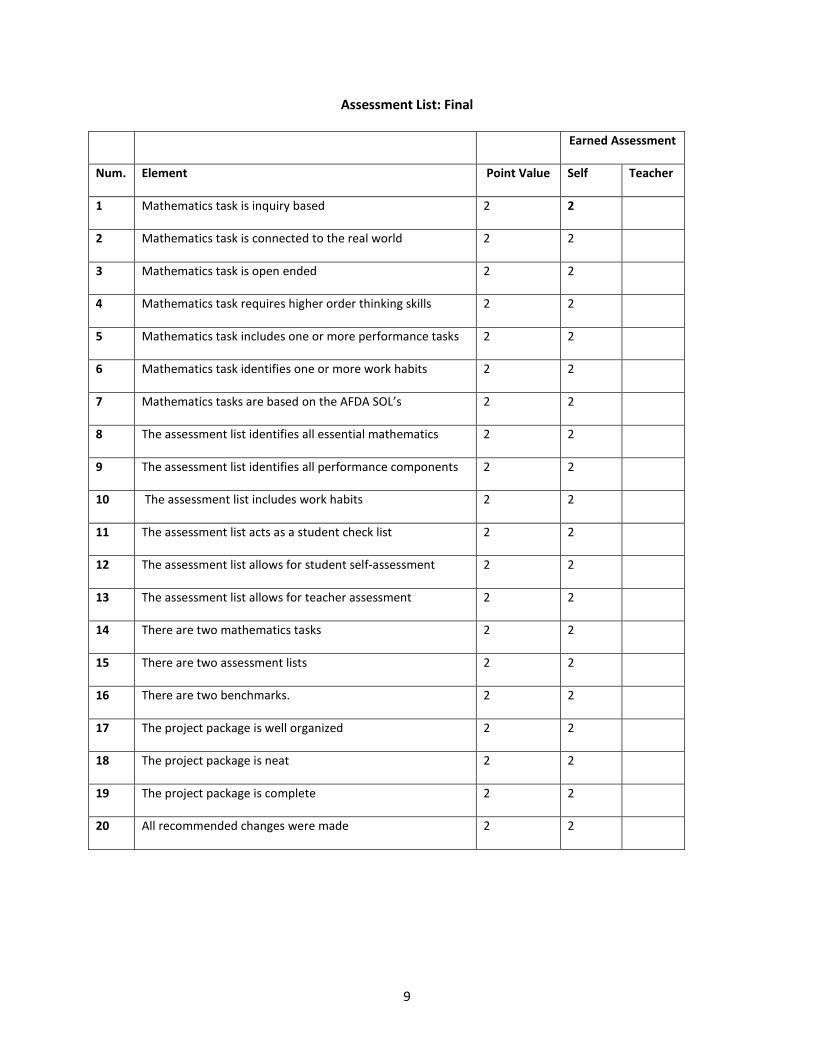
Assessment List: Final
Earned Assessment
Num. Element Point Value Self Teacher
1 Mathematics task is inquiry based 2 2
2 Mathematics task is connected to the real world 2 2
3 Mathematics task is open ended 2 2
4 Mathematics task requires higher order thinking skills 2 2
5 Mathematics task includes one or more performance tasks 2 2
6 Mathematics task identifies one or more work habits 2 2
7 Mathematics tasks are based on the AFDA SOL’s 2 2
8 The assessment list identifies all essential mathematics 2 2
9 The assessment list identifies all performance components 2 2
10 The assessment list includes work habits 2 2
11 The assessment list acts as a student check list 2 2
12 The assessment list allows for student self-assessment 2 2
13 The assessment list allows for teacher assessment 2 2
14 There are two mathematics tasks 2 2
15 There are two assessment lists 2 2
16 There are two benchmarks. 2 2
17 The project package is well organized 2 2
18 The project package is neat 2 2
19 The project package is complete 2 2
20 All recommended changes were made 2 2

10
Rubric for Final
# Element 0 1 2
1 Mathematics task is inquiry based Not inquiry based Somewhat inquiry based
Inquiry based
2 Mathematics task is connected to the real world
No connection to real world experiences
Connection to in-school
Connection to out-of-school
3 Mathematics task is open ended Fully teacher directed closed task
Teacher structured but open ended task
Many entry points and multiple solutions
4 Mathematics task requires higher order thinking skills
Memorization and skill practice
Show and explain Analysis, synthesis
5 Mathematics task includes one or more performance tasks
No performance tasks NA Includes one or more
6 Mathematics task identifies one or more work habits
No work habits identified
Some are identified All work habits are identified
7 Mathematics tasks are based on the AFDA (preferred) SOL’s
No SOL identified Uses unrelated SOL Uses appropriate AFDA SOL
8 The assessment list identifies all essential mathematics
No essential elements are identified
Some are identified All are identified
9 The assessment list identifies all performance components
None are identified Some are identified All are identified
10 The assessment list includes work habits
No work habits included Some appropriate work habits included
All appropriate work habits included
11 The assessment list acts as a student check list
Fails to act as a checklist Check list is difficult to use
Acts as a check list
12 The assessment list allows for student self-assessment
Fails to allow for self-assessment
Self-assessment difficult to perform
Allows for self-assessment
13 The assessment list allows for teacher assessment
Fails to allow for teacher assessment
Teacher assessment difficult to perform
Allows for teacher assessment
14 There are two mathematics tasks No tasks One task Two tasks
15 There are two assessment lists No lists One list Two lists

11
16 There are two benchmarks. No benchmarks One bench marks Two benchmarks
17 The project package is well organized
No evidence of organization
Not fully organized Well organized
18 The project package is neat Lacks neatness Needs improvement Neat
19 The project package is complete Incomplete in more than one area
Incomplete in one area
Complete
20 Recommended changes were addressed
No recommended changes were addressed
Some recommended changes were addressed
All recommended changes were addressed

12

13
14
Related Documents