Performance Based Financing at Hospital - Process of Care Quality Assessment July 11, 2013 James Sorsor, Foday Kanneh Shun Mabuchi

Performance Based Financing at Hospital - Process of Care Quality Assessment July 11, 2013 James Sorsor, Foday Kanneh Shun Mabuchi.
Dec 29, 2015
Welcome message from author
This document is posted to help you gain knowledge. Please leave a comment to let me know what you think about it! Share it to your friends and learn new things together.
Transcript
Performance Based Financing at Hospital- Process of Care Quality Assessment
July 11, 2013
James Sorsor, Foday KannehShun Mabuchi
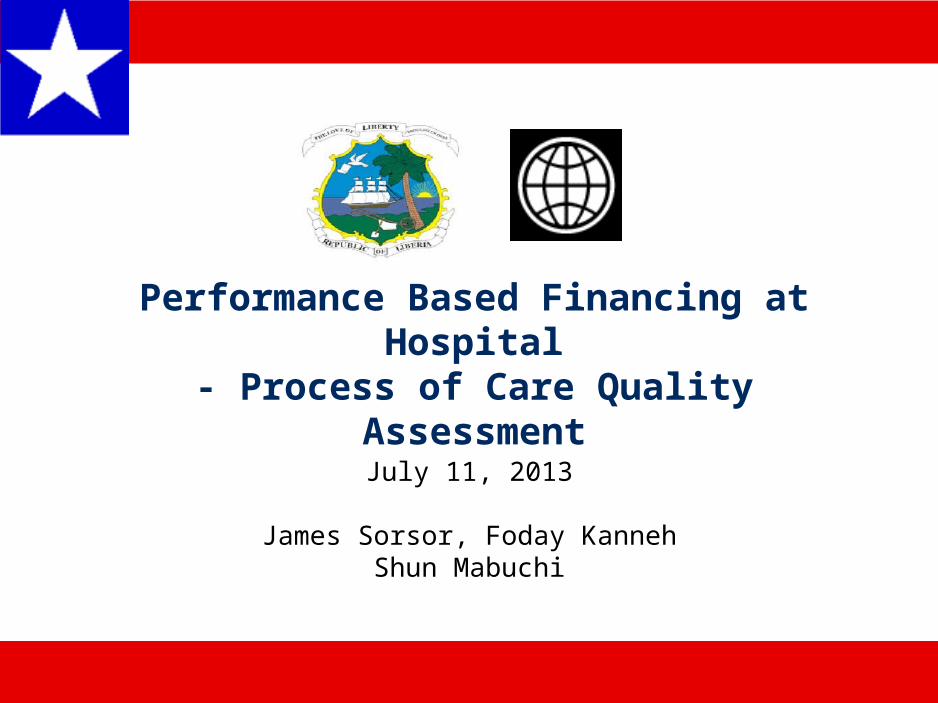
HSSP provides a set of management tools for hospital management
2
1Complicated and assisted delivery (including C-section)
Any labor that is made more difficult or complex by a deviation from the normal procedure. Complicated delivery is defined as: assisted vaginal deliveries (vacuum extraction or forceps), C-section, episiotomy and other procedures.
17
2 Normal deliveries of at risk referralsHigh-risk pregnant women referred by health center to the hospital but delivered normally. A high-risk pregnancy is defined as: evidence of edema, mal presentation, increased BP, multi-parity, etc.
17
3Counter referral slips returned to health facilities
Hospital returns counter referrals letter with feedback on the referred patient to the referring health center. The counter referral letter is completed in triplicate, with one also given to the patient, and one retained by the hospital.
2.5
4Newborn referred for emergency neonatal care treatment and treated
Newborns referred for emergency neonatal care due to: perinatal complications, low birth weight, congenital malformation, asphyxia, etc.
5
6Referred infants and under-fives with fever Any surgical procedure that does not involve anesthesia or respiratory assistance. 2.5
7 Minor surgical intervention
Any surgery in which the patient must be put under general spinal/anesthesia and given respiratory assistance. Major surgery in the case of this package of services is defined as any of the following: Herniarraphy, Appendectomy, Myomectomy, Sleenectomy, Salpingectomy, Hysterectomy, Thyrodectomy, Mastectomy.
5
8Major surgery (excluding CS, including major trauma)
Patients transferred from a lower-level facility (health center or health clinic) to the hospital for emergency treatment.
18
9 Patients transported by ambulance 2.5
10
Number of training sessions held by faculty for nurses, midwifes and PA according to in-service curriculum and defined protocols.
These indicators will incentivize the in-service training activities. 50
11Number of nurses, midwifes and PAs that received specialized in-service training, relevant to benchmarks
10
VerifiedTotal EarningsDefinition
Six Hospitals Total
Fee (USD)Indicators Claimed
Quantity Checklist
Actual % Earned Points
1. Obstructed Labor 0.80 3.87 100% 33% 1.292. Hemorrhage 1.00 4.84 100% 71% 3.453. Maternal Sepsis 1.00 4.84 100% 50% 2.424. Eclampsia 0.70 3.39 100% 47% 1.595. Neonatal Asphyxia 1.00 4.84 100% 67% 3.236. Neonatal Sepsis 1.00 4.84 100% 54% 2.617. Prematurity 0.50 2.42 100% 47% 1.148. Maternal Newborn Best Practices 1.00 4.84 100% 54% 2.619. ETAT 1.00 4.84 100% 33% 1.6110. Malaria 1.00 4.84 100% 71% 3.4511. Pneumonia 1.00 4.84 100% 50% 2.4212. Acute Diarrhea 0.80 3.87 100% 47% 1.8213. Severe Acute Malnutrition 0.60 2.90 100% 67% 1.9414. Surgical Safety 1.00 4.84 100% 54% 2.61
100% 60.00 100% 53% 32.20Total/Average
ChecklistsWeight (by
importance)Point
AllocationMax %
Process of Care Quality Checklist
Score 1.GENERAL MANAGEMENT (30pt)
2. HUMAN RESOURCES FOR HEALTH (16pt)3. HYGIENE AND MEDICAL WASTE DISPOSAL (27pt)
4. DRUGS MANAGEMENT (30 pt)5. EQUIPMENT AND SUPPLIES (84pt)
TOTAL %
Date of Verfication
TOTAL (187pt)
REPUBLIC OF LIBERIAMinistry of Health and Social Welfare (MOHSW)
Hospital Quarterly Quality AssessmentName of the Hospital
Name of Team Leader of Quality VerificationVerification Period
Quarterly Quality Verification Score
I. Management
II. Structural
Management and Structural Checklist
Assessment/Monitoring
IndicatorsMax Points
Actual Points Quarter I
1. General Management 30 2.62. Human Resources for Health 16 93. Hygiene and Medical Waste Disposal 27 04. Drugs Management 30 85. Equipment and Supplies 84 48
6. Aggregated Process of Care Score 60 32
Total 247 100Total Percentage 100% 40%
Total Quality Bonuses (USD) 159,678 64,517
PBF Bonus Calculation Tool
Financing
Business/Operation Plan
Health Worker Bonus Allocation
LHSSP Indices Tool for Bonus Allocation to Individual Health Workers for Hospitals
1 200 50 30 300,000 0 6,944 2 200 70 30 420,000 0 9,722 3 150 80 30 360,000 0 8,333 4 - - - 5 - - - 6 - - - 7 - - - 8 - - - 9 - - - 10 - - - 11 - - - 12 - - -
Quarter:Total PBF Incentives Earned% for Individual Bonus
Attendance points [C]
Hospital Name
Total Individual Bonus
Redemption HospitalJuly-Sept 2013
No Name of staffStaff
categoryMonthly
salary [A]
Perfor-mance
points [B]
$50,00050%$25,000
Total points = [A] x [B] x [C]
Indices of the period
PBF individual
bonus
Signature of receipt
Use of Finance
Focus of this presentation
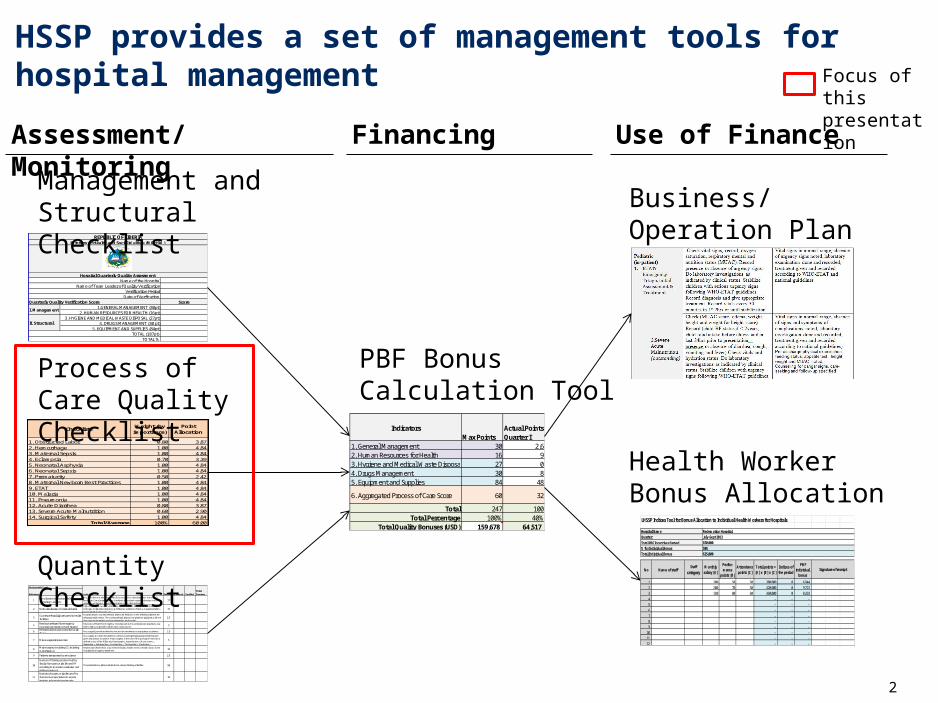
Process of care is an important part of quality
3
IndicatorsMax Points
1. General Management 302. Human Resources for Health 163. Hygiene and Medical Waste Disposal 274. Drugs Management 305. Equipment and Supplies 84
6. Aggregated Process of Care Score 60
Total 247Total Percentage 100%
Total Quality Bonuses (USD) 159,678
I. Management
II. Structural
Quarterly Quality Verification Score
III. Process of Care (See below for details)
Total
24% of Total Quality Score
Overview of Quality Checklists for Hospitals
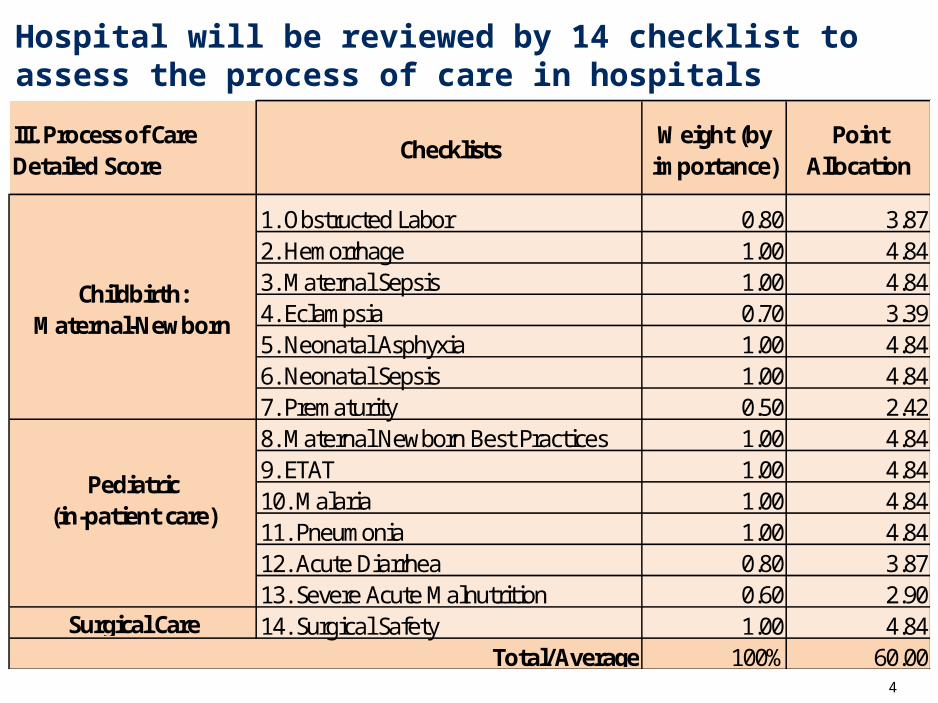
Hospital will be reviewed by 14 checklist to assess the process of care in hospitals
4
1. Obstructed Labor 0.80 3.872. Hemorrhage 1.00 4.843. Maternal Sepsis 1.00 4.844. Eclampsia 0.70 3.395. Neonatal Asphyxia 1.00 4.846. Neonatal Sepsis 1.00 4.847. Prematurity 0.50 2.428. Maternal Newborn Best Practices 1.00 4.849. ETAT 1.00 4.8410. Malaria 1.00 4.8411. Pneumonia 1.00 4.8412. Acute Diarrhea 0.80 3.8713. Severe Acute Malnutrition 0.60 2.9014. Surgical Safety 1.00 4.84
100% 60.00Total/Average
Childbirth:Maternal-Newborn
Pediatric (in-patient care)
Surgical Care
III. Process of Care Detailed Score
ChecklistsWeight (by
importance)Point
Allocation
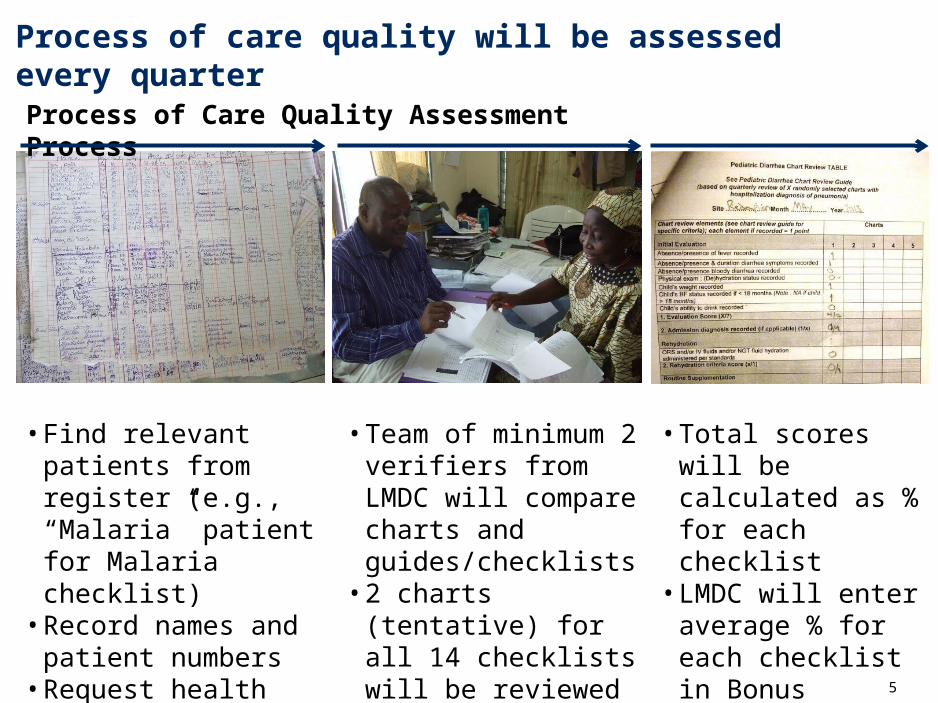
Process of care quality will be assessed every quarter
5
Process of Care Quality Assessment Process
• Find relevant patients from register (e.g., “Malaria” patient for Malaria checklist)
• Record names and patient numbers
• Request health workers to bring charts
• Team of minimum 2 verifiers from LMDC will compare charts and guides/checklists
• 2 charts (tentative) for all 14 checklists will be reviewed quarterly
• Total scores will be calculated as % for each checklist
• LMDC will enter average % for each checklist in Bonus Calculation Tool
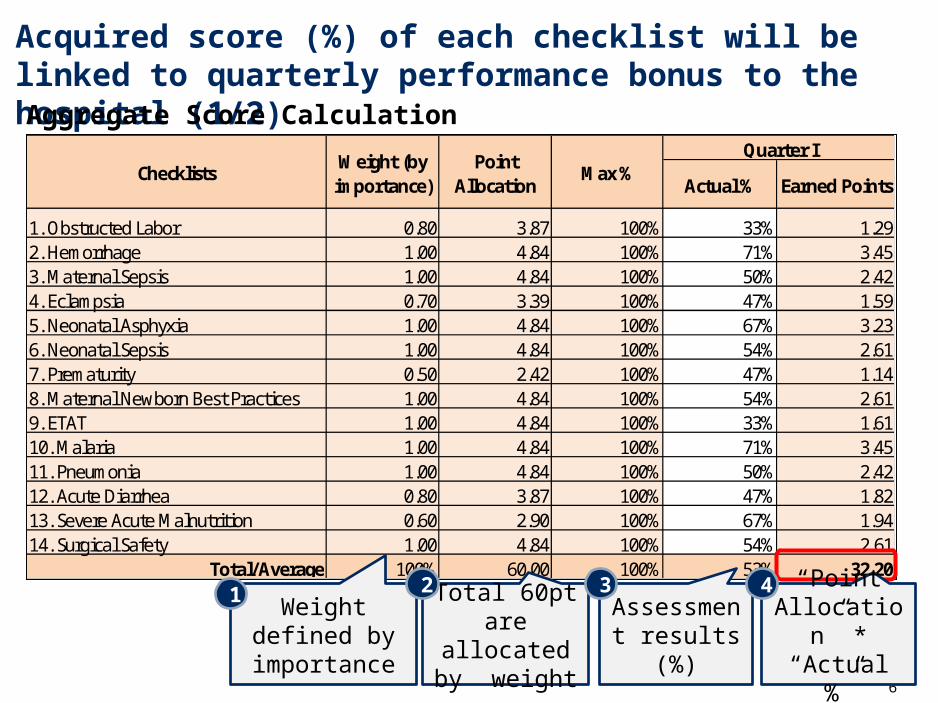
Acquired score (%) of each checklist will be linked to quarterly performance bonus to the hospital (1/2)
6
Aggregate Score Calculation
Actual % Earned Points
1. Obstructed Labor 0.80 3.87 100% 33% 1.292. Hemorrhage 1.00 4.84 100% 71% 3.453. Maternal Sepsis 1.00 4.84 100% 50% 2.424. Eclampsia 0.70 3.39 100% 47% 1.595. Neonatal Asphyxia 1.00 4.84 100% 67% 3.236. Neonatal Sepsis 1.00 4.84 100% 54% 2.617. Prematurity 0.50 2.42 100% 47% 1.148. Maternal Newborn Best Practices 1.00 4.84 100% 54% 2.619. ETAT 1.00 4.84 100% 33% 1.6110. Malaria 1.00 4.84 100% 71% 3.4511. Pneumonia 1.00 4.84 100% 50% 2.4212. Acute Diarrhea 0.80 3.87 100% 47% 1.8213. Severe Acute Malnutrition 0.60 2.90 100% 67% 1.9414. Surgical Safety 1.00 4.84 100% 54% 2.61
100% 60.00 100% 53% 32.20Total/Average
Quarter IChecklists
Weight (by importance)
Point Allocation
Max %
Weight defined by importance
Total 60pt are allocated by
weight
1 2
Assessment results (%)
3“Point
Allocation” * “Actual %”
4

Acquired score (%) of each checklist will be linked to quarterly performance bonus to the hospital (2/2)
7
Quality Bonus Calculation Process
IndicatorsMax Points
Actual Points Quarter I
1. General Management 30 2.62. Human Resources for Health 16 93. Hygiene and Medical Waste Disposal 27 04. Drugs Management 30 85. Equipment and Supplies 84 48
6. Aggregated Process of Care Score 60 32
Total 247 100Total Percentage 100% 40%
Total Quality Bonuses (USD) 159,678 64,517
Total aggregated process of care score
1
“Actual Points”/ “Max points”
2
40% of Total max quality bonuses
3

Hospital SMT and QI team should use the checklist results for continuous quality improvement
8
Actual % Earned Points
1. Obstructed Labor 0.80 3.87 100% 33% 1.292. Hemorrhage 1.00 4.84 100% 71% 3.453. Maternal Sepsis 1.00 4.84 100% 50% 2.424. Eclampsia 0.70 3.39 100% 47% 1.595. Neonatal Asphyxia 1.00 4.84 100% 67% 3.236. Neonatal Sepsis 1.00 4.84 100% 54% 2.617. Prematurity 0.50 2.42 100% 47% 1.148. Maternal Newborn Best Practices 1.00 4.84 100% 54% 2.619. ETAT 1.00 4.84 100% 33% 1.6110. Malaria 1.00 4.84 100% 71% 3.4511. Pneumonia 1.00 4.84 100% 50% 2.4212. Acute Diarrhea 0.80 3.87 100% 47% 1.8213. Severe Acute Malnutrition 0.60 2.90 100% 67% 1.9414. Surgical Safety 1.00 4.84 100% 54% 2.61
100% 60.00 100% 53% 32.20Total/Average
Quarter IChecklists
Weight (by importance)
Point Allocation
Max %
Actual % Earned Points
1. Obstructed Labor 0.80 3.87 100% 33% 1.292. Hemorrhage 1.00 4.84 100% 71% 3.453. Maternal Sepsis 1.00 4.84 100% 50% 2.424. Eclampsia 0.70 3.39 100% 47% 1.595. Neonatal Asphyxia 1.00 4.84 100% 67% 3.236. Neonatal Sepsis 1.00 4.84 100% 54% 2.617. Prematurity 0.50 2.42 100% 47% 1.148. Maternal Newborn Best Practices 1.00 4.84 100% 54% 2.619. ETAT 1.00 4.84 100% 33% 1.6110. Malaria 1.00 4.84 100% 71% 3.4511. Pneumonia 1.00 4.84 100% 50% 2.4212. Acute Diarrhea 0.80 3.87 100% 47% 1.8213. Severe Acute Malnutrition 0.60 2.90 100% 67% 1.9414. Surgical Safety 1.00 4.84 100% 54% 2.61
100% 60.00 100% 53% 32.20
Quarter IPoint
AllocationMax %
2
• Find major gaps in scores
3
• Look into the actual checklists to see what are wrong
4
• Plan specific activities to improve the low-score checklists in operational plan
1
• Review scores of all checklists
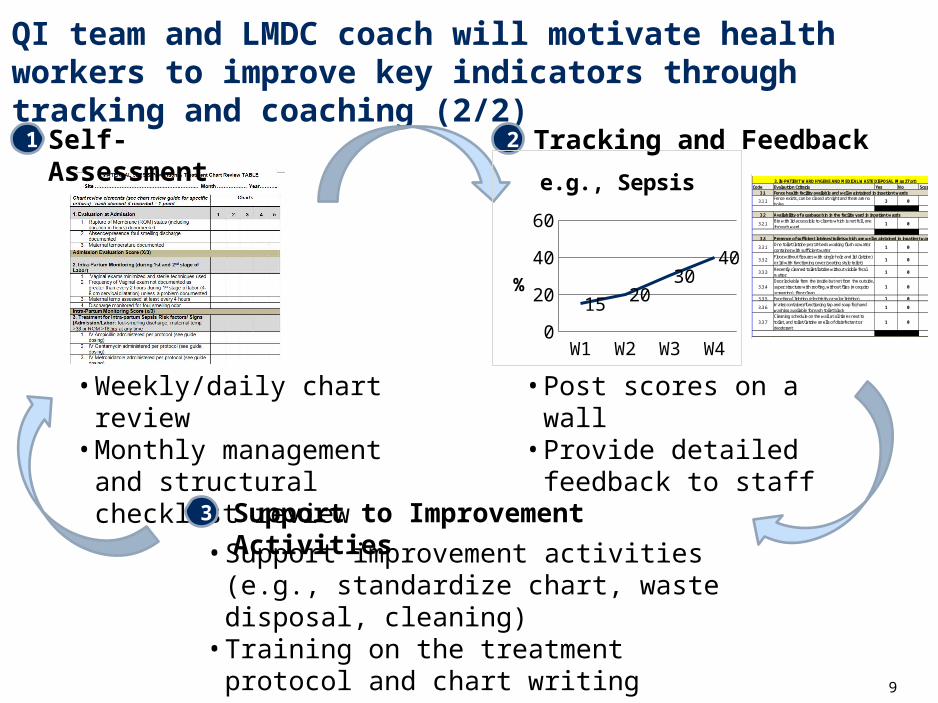
QI team and LMDC coach will motivate health workers to improve key indicators through tracking and coaching (2/2)
9
• Weekly/daily chart review• Monthly management and
structural checklist review
1 Self-Assessment 2
W1 W2 W3 W40
1020304050
1520
3040
e.g., Sepsis
%
• Post scores on a wall• Provide detailed feedback
to staff
Code Evalaution Criteria Yes No Score 3.1
3.1.1Fence exists, can be closed at night and there are no holes
3 0
3.2
3.2.1Bin with lid accessible to clients which is not full, one for each ward
1 0
3.3
3.3.1One toilet/latrine per 10 beds working flush or water container with sufficient water
1 0
3.3.2Floor without fissures with single hole and lid (latrine) or lid with functioning cover (seating style toilet)
1 0
3.3.3Recently cleaned toilet/latrine without visible fecal matter
1 0
3.3.4Door lockable from the inside but not from the outside, super structure with roofing, without flies (mosquito screening), floor clean
1 0
3.3.5 Functional lighting (electricity or solar lighting) 1 0
3.3.6Water container/functioning tap and soap for hand washing available for each toilet block
1 0
3.3.7Cleaning schedule on the wall at all times next to toilet, and toilet/latrine smells of disinfectant or deodorant
1 0
3.43.4.1 One shower per 10 beds 1 0
3.4.2 1 0
3.4.3 1 0
3.4.4
3.4.5 1 0
3.5
3.5.1
3.5.2
3.5.3
3.5.4
3.5.5
3.6
3.6.1 1 0
3.7
3.7.1
3.7.2 Sharp box for needles well positioned, and used3.7.3
3.7.4
3.8
3.8.1
3.8.2
3.8.3
3.8.4
3.8.5
Fence health facility available and well-maintained in inpatient wards
Availability of a garbage bin in the facility yard in inpatient wards
Presence of sufficient showers which are well-maintained in inpatient wards
3. IN-PATIENT WARD HYGENE AND MEDICAL WASTE DISPOSAL (Max 27 pt)
Presence of sufficient latrines/toilets which are well-maintained in inpatient wards
Tracking and Feedback
3
• Support improvement activities (e.g., standardize chart, waste disposal, cleaning)
• Training on the treatment protocol and chart writing
• ……
Support to Improvement Activities
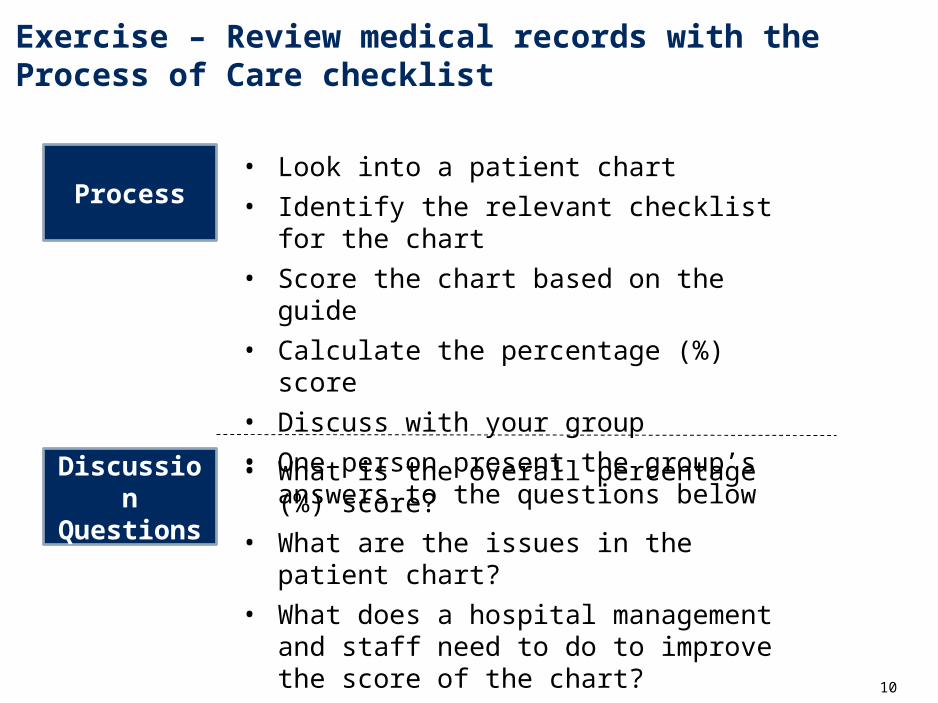
Exercise – Review medical records with the Process of Care checklist
10
• Look into a patient chart
• Identify the relevant checklist for the chart
• Score the chart based on the guide
• Calculate the percentage (%) score
• Discuss with your group
• One person present the group’s answers to the questions below
Process
Discussion Questions
• What is the overall percentage (%) score?
• What are the issues in the patient chart?
• What does a hospital management and staff need to do to improve the score of the chart?
Related Documents