PERFORMANCE ASSESSMENT OF RAIN GARDENS 1 Brooke C. Asleson, Rebecca S. Nestingen, John S. Gulliver, Raymond M. Hozalski, and John L. Nieber 2 ABSTRACT: The most widely used approach for evaluating the performance of stormwater best management practices (BMPs) such as rain gardens is monitoring, but this approach can involve a long time period to observe a sufficient number and variety of storm events, a high level of effort, and unavoidable uncertainty. In this paper, we describe the development and evaluation of three approaches for performance assessment of rain gardens: visual inspection, infiltration rate testing, and synthetic drawdown testing. Twelve rain gardens in Minnesota underwent visual inspection, with four determined to be nonfunctional based on one or more of the following criteria: (1) presence of ponded water, (2) presence of hydric soils, (3) presence of emergent (wetland) vegetation, and (4) failing vegetation. It is believed that these rain gardens failed due to a lack of maintenance. For the remaining eight rain gardens, an infiltrometer was used to determine the saturated hydraulic conductiv- ity (K sat ) of the soil surface at several locations throughout each basin in what is termed infiltration rate testing. The median K sat values for the rain gardens ranged from 3 to 72 cm ⁄ h. Synthetic drawdown testing was per- formed on three rain gardens by filling the basins with water to capacity where possible and recording water level over time. The observed drain times for two of those rain gardens were in good agreement with predictions based on the median of the infiltrometer measurements. The observed drain time for the third rain garden was much greater than predicted due to the presence of a restrictive soil layer beneath the topsoil. The assessment approaches developed in this research should prove useful for determining whether the construction of the rain garden was performed properly, a rain garden is functioning properly, and for developing maintenance tasks and schedules. (KEY TERMS: rain garden; bioretention practice; infiltration; best management practices; runoff; stormwater management.) Asleson, Brooke C., Rebecca S. Nestingen, John S. Gulliver, Raymond M. Hozalski, and John L. Nieber, 2009. Performance Assessment of Rain Gardens. Journal of the American Water Resources Association (JAWRA) 45(4):1019-1031. DOI: 10.1111 ⁄ j.1752-1688.2009.00344.x INTRODUCTION Urbanization of a watershed has significant nega- tive effects on downstream aquatic systems including degradation of both form and function (Booth and Jackson, 1997). The increase in runoff caused by increases in impervious land area during urbaniza- tion results in an increase in flood frequency and can decrease base flows (Wang et al., 2001). These 1 Paper No. JAWRA-08-0016-P of the Journal of the American Water Resources Association (JAWRA). Received January 18, 2008; accepted April 8, 2009. ª 2009 American Water Resources Association. Discussions are open until six months from print publication. 2 Respectively, Project Manager (Asleson), Watershed Section, Minnesota Pollution Control Agency, 520 Lafayette Road N., St. Paul, Min- nesota 55155; Water Resources Engineer (Nestingen), Short Elliott Hendrickson Inc., St. Paul, Minnesota; Professor (Gulliver), Associate Professor (Hozalski), Department of Civil Engineering, University of Minnesota, Minnesota; Professor (Nieber), Department of Bioproducts and Biosystems Engineering, University of Minnesota, St. Paul, Minnesota (E-Mail ⁄ Asleson: [email protected]). JOURNAL OF THE AMERICAN WATER RESOURCES ASSOCIATION 1019 JAWRA JOURNAL OF THE AMERICAN WATER RESOURCES ASSOCIATION Vol. 45, No. 4 AMERICAN WATER RESOURCES ASSOCIATION August 2009

Welcome message from author
This document is posted to help you gain knowledge. Please leave a comment to let me know what you think about it! Share it to your friends and learn new things together.
Transcript
PERFORMANCE ASSESSMENT OF RAIN GARDENS1
Brooke C. Asleson, Rebecca S. Nestingen, John S. Gulliver, Raymond M. Hozalski, and John L. Nieber2
ABSTRACT: The most widely used approach for evaluating the performance of stormwater best managementpractices (BMPs) such as rain gardens is monitoring, but this approach can involve a long time period to observea sufficient number and variety of storm events, a high level of effort, and unavoidable uncertainty. In thispaper, we describe the development and evaluation of three approaches for performance assessment of raingardens: visual inspection, infiltration rate testing, and synthetic drawdown testing. Twelve rain gardens inMinnesota underwent visual inspection, with four determined to be nonfunctional based on one or more of thefollowing criteria: (1) presence of ponded water, (2) presence of hydric soils, (3) presence of emergent (wetland)vegetation, and (4) failing vegetation. It is believed that these rain gardens failed due to a lack of maintenance.For the remaining eight rain gardens, an infiltrometer was used to determine the saturated hydraulic conductiv-ity (Ksat) of the soil surface at several locations throughout each basin in what is termed infiltration rate testing.The median Ksat values for the rain gardens ranged from 3 to 72 cm ⁄ h. Synthetic drawdown testing was per-formed on three rain gardens by filling the basins with water to capacity where possible and recording waterlevel over time. The observed drain times for two of those rain gardens were in good agreement with predictionsbased on the median of the infiltrometer measurements. The observed drain time for the third rain garden wasmuch greater than predicted due to the presence of a restrictive soil layer beneath the topsoil. The assessmentapproaches developed in this research should prove useful for determining whether the construction of the raingarden was performed properly, a rain garden is functioning properly, and for developing maintenance tasksand schedules.
(KEY TERMS: rain garden; bioretention practice; infiltration; best management practices; runoff; stormwatermanagement.)
Asleson, Brooke C., Rebecca S. Nestingen, John S. Gulliver, Raymond M. Hozalski, and John L. Nieber, 2009.Performance Assessment of Rain Gardens. Journal of the American Water Resources Association (JAWRA)45(4):1019-1031. DOI: 10.1111 ⁄ j.1752-1688.2009.00344.x
INTRODUCTION
Urbanization of a watershed has significant nega-tive effects on downstream aquatic systems including
degradation of both form and function (Booth andJackson, 1997). The increase in runoff caused byincreases in impervious land area during urbaniza-tion results in an increase in flood frequency and candecrease base flows (Wang et al., 2001). These
1Paper No. JAWRA-08-0016-P of the Journal of the American Water Resources Association (JAWRA). Received January 18, 2008; acceptedApril 8, 2009. ª 2009 American Water Resources Association. Discussions are open until six months from print publication.
2Respectively, Project Manager (Asleson), Watershed Section, Minnesota Pollution Control Agency, 520 Lafayette Road N., St. Paul, Min-nesota 55155; Water Resources Engineer (Nestingen), Short Elliott Hendrickson Inc., St. Paul, Minnesota; Professor (Gulliver), AssociateProfessor (Hozalski), Department of Civil Engineering, University of Minnesota, Minnesota; Professor (Nieber), Department of Bioproductsand Biosystems Engineering, University of Minnesota, St. Paul, Minnesota (E-Mail ⁄ Asleson: [email protected]).
JOURNAL OF THE AMERICAN WATER RESOURCES ASSOCIATION 1019 JAWRA
JOURNAL OF THE AMERICAN WATER RESOURCES ASSOCIATION
Vol. 45, No. 4 AMERICAN WATER RESOURCES ASSOCIATION August 2009
hydrologic changes result in widening and increasedinstability of stream channels, increase sedimentloads, and degradation of fish habitat (Booth andJackson, 1997). In addition to sediments, urban run-off often contains a wide variety of other pollutantsincluding: nutrients, oxygen-demanding substances,pathogens, road salts, petroleum hydrocarbons, heavymetals, and excess thermal energy (USEPA, 2005).Such pollutants could cause further degradation ofaquatic habitat as well as limit or eliminate recrea-tional uses.
In response to the degraded water quality found inour waterways due to urban stormwater runoff, theClean Water Act requires the regulation of municipalseparate storm sewer systems (MS4s) and the imple-mentation of a two-phase Storm Water Pollution Pre-vention Program (SWPPP) (USEPA, 2007). TheSWPPP requires discharge detection and elimination,construction and postconstruction runoff control, andpollution prevention measures. Key to pollution pre-vention efforts in urban areas are the installationand maintenance of stormwater best managementpractices (BMPs). For example, low impact develop-ment (LID) stormwater BMPs, such as rain gardensand bioretention facilities, are commonly used to infil-trate stormwater to reduce outfall stormwater runoffvolume and improve water quality via filtration andother processes. These systems are gaining interestamong MS4s due to their low impact, potential effec-tiveness, and high esthetic value. Currently, there islittle guidance on how to properly assess the effec-tiveness of LID stormwater BMPs after installation.Consequently, information is lacking concerning howwell these stormwater BMPs perform immediatelyafter installation, how they perform over time, andwhen maintenance may be required. Guidance isneeded regarding assessment of the effectiveness ofLID stormwater BMPs such as rain gardens.
Currently, comprehensive water quantity andquality monitoring is the most widely used approachfor evaluating the performance of stormwater BMPs(USEPA, 2002). Monitoring typically involves the col-lection of stormwater grab samples for analysis ofpollutant concentration and determination of thewater budget of the BMP using flow measurementdevices at all inflow and outflow locations, data log-gers, and related equipment. Monitoring is especiallyuseful for watershed-scale studies to assess overallpollutant loads to receiving waters and the impact ofa group of stormwater BMPs on these loads. Monitor-ing of individual stormwater BMPs, however, is oftenimpractical due to the long time period (one or morerainy seasons) required to observe a sufficient num-ber and variety of storm events, the effort to setupand maintain such a system, and uncertainty in theresults (Weiss et al., 2007) as a natural storm event
can neither be controlled nor repeated. This is espe-cially true for rain gardens, which are often small(<150 m2), simple, stormwater BMPs that are widelydistributed throughout urban and suburban neigh-borhoods. Therefore, alternatives to typical monitor-ing protocols are needed for assessing theperformance of rain gardens.
In this paper, we discuss the development andevaluation of three alternative suggested approachesfor rain garden evaluation: (1) visual inspection, (2)infiltration rate testing, and (3) synthetic drawdowntesting. These assessment approaches differ in termsof the effort required and the information obtained.Visual inspection involves examination of the inletand outlet structures, vegetation, and soil and is usedto quickly determine if a rain garden is malfunction-ing and in need of maintenance or replacement. Infil-tration rate testing involves the use of infiltrometersto determine near-surface saturated hydraulic con-ductivity (Ksat) throughout a rain garden. In syntheticdrawdown testing, a fire hydrant or water truck isused to fill the basin with water and the overall draintime of the rain garden is determined. They aredescribed more fully in the next section.
LEVELS OF ASSESSMENT OVERVIEW
Visual Inspection (Level 1)
The visual inspection may be simple or comprehen-sive depending on the site conditions and the purposeof assessment. Simple observations, such as visiting asite after a storm event to check for standing water,are valuable and require less effort (1 h), althoughlimited information is obtained. A comprehensivevisual inspection requires some knowledge of bothvegetation and soils and requires roughly 4 h to com-plete. For verification of proper construction anddetermination of long-term functionality, it is recom-mended that additional assessment be performedeven if no problems are found during the visualinspection. This more detailed assessment will be ofinterest to officials that certify rain gardens.
Infiltration Rate Testing (Level 2)
The ability of a rain garden to infiltrate water undersaturated (flooded) conditions can be estimated bydetermining Ksat at a number of locations throughoutthe stormwater BMP using permeameters or infiltrom-eters. Five field devices [Double-Ring Infiltrometer,Guelph Permeameter (Rickly Hydrological Company,
ASLESON, NESTINGEN, GULLIVER, HOZALSKI, AND NIEBER
JAWRA 1020 JOURNAL OF THE AMERICAN WATER RESOURCES ASSOCIATION
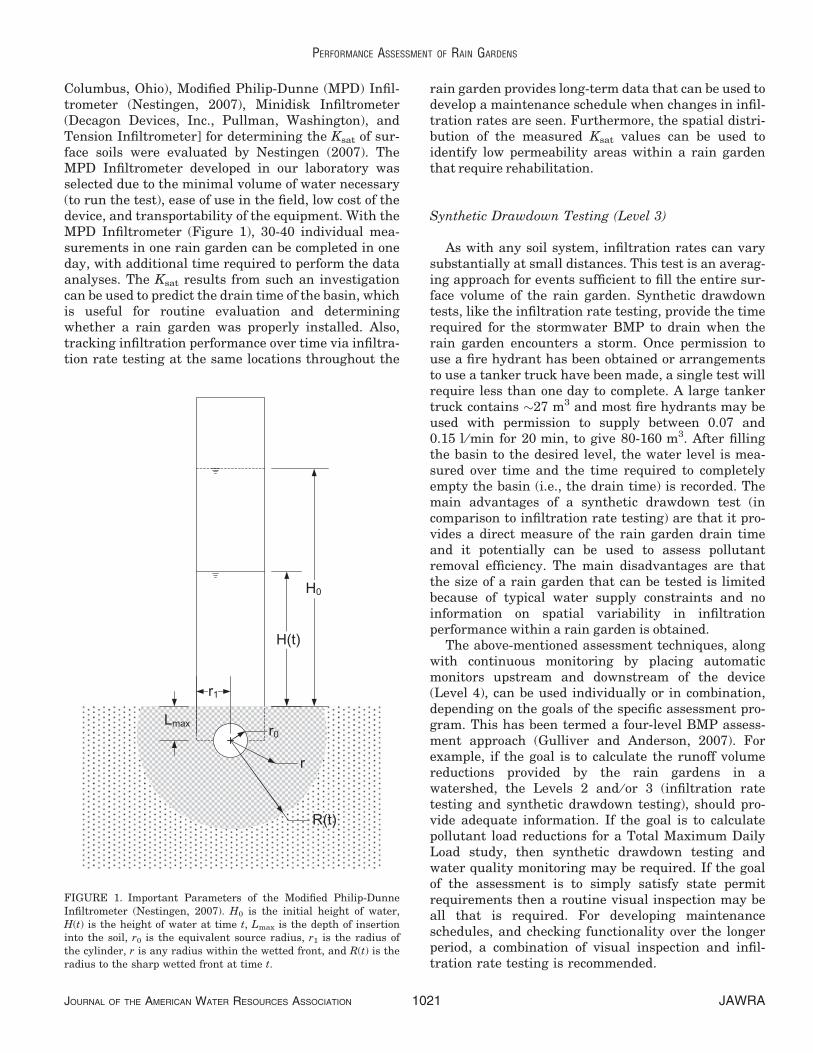
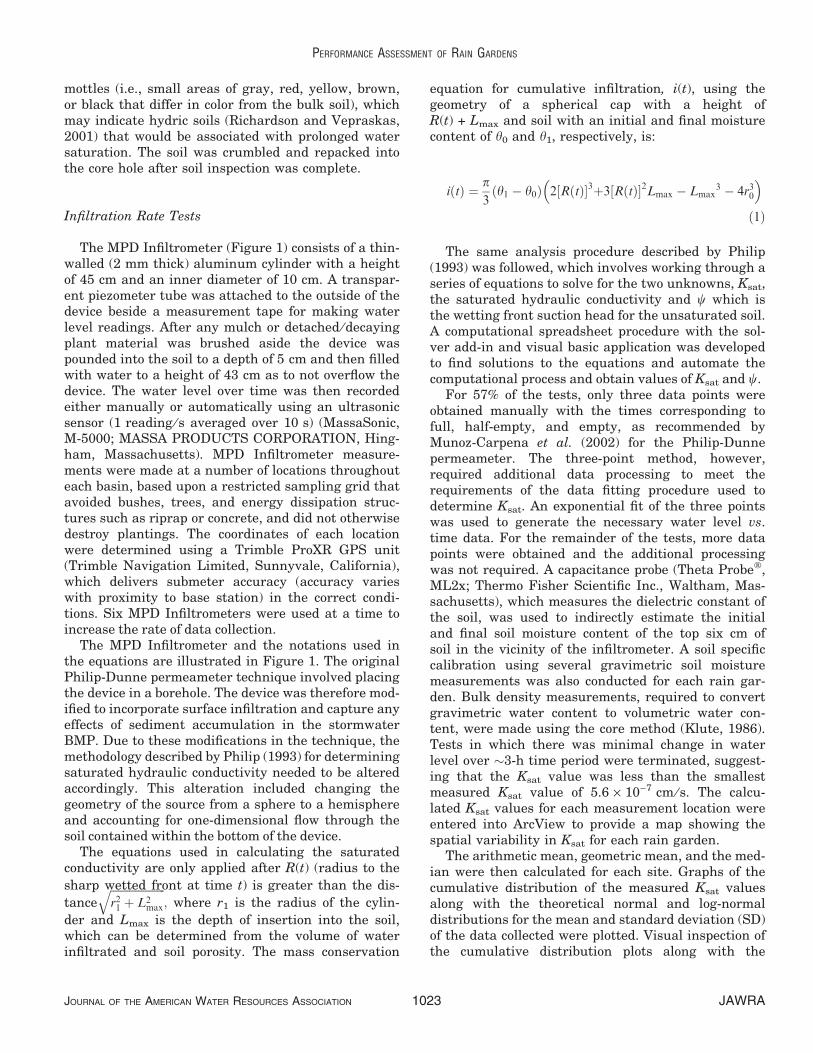
Columbus, Ohio), Modified Philip-Dunne (MPD) Infil-trometer (Nestingen, 2007), Minidisk Infiltrometer(Decagon Devices, Inc., Pullman, Washington), andTension Infiltrometer] for determining the Ksat of sur-face soils were evaluated by Nestingen (2007). TheMPD Infiltrometer developed in our laboratory wasselected due to the minimal volume of water necessary(to run the test), ease of use in the field, low cost of thedevice, and transportability of the equipment. With theMPD Infiltrometer (Figure 1), 30-40 individual mea-surements in one rain garden can be completed in oneday, with additional time required to perform the dataanalyses. The Ksat results from such an investigationcan be used to predict the drain time of the basin, whichis useful for routine evaluation and determiningwhether a rain garden was properly installed. Also,tracking infiltration performance over time via infiltra-tion rate testing at the same locations throughout the
rain garden provides long-term data that can be used todevelop a maintenance schedule when changes in infil-tration rates are seen. Furthermore, the spatial distri-bution of the measured Ksat values can be used toidentify low permeability areas within a rain gardenthat require rehabilitation.
Synthetic Drawdown Testing (Level 3)
As with any soil system, infiltration rates can varysubstantially at small distances. This test is an averag-ing approach for events sufficient to fill the entire sur-face volume of the rain garden. Synthetic drawdowntests, like the infiltration rate testing, provide the timerequired for the stormwater BMP to drain when therain garden encounters a storm. Once permission touse a fire hydrant has been obtained or arrangementsto use a tanker truck have been made, a single test willrequire less than one day to complete. A large tankertruck contains �27 m3 and most fire hydrants may beused with permission to supply between 0.07 and0.15 l ⁄ min for 20 min, to give 80-160 m3. After fillingthe basin to the desired level, the water level is mea-sured over time and the time required to completelyempty the basin (i.e., the drain time) is recorded. Themain advantages of a synthetic drawdown test (incomparison to infiltration rate testing) are that it pro-vides a direct measure of the rain garden drain timeand it potentially can be used to assess pollutantremoval efficiency. The main disadvantages are thatthe size of a rain garden that can be tested is limitedbecause of typical water supply constraints and noinformation on spatial variability in infiltrationperformance within a rain garden is obtained.
The above-mentioned assessment techniques, alongwith continuous monitoring by placing automaticmonitors upstream and downstream of the device(Level 4), can be used individually or in combination,depending on the goals of the specific assessment pro-gram. This has been termed a four-level BMP assess-ment approach (Gulliver and Anderson, 2007). Forexample, if the goal is to calculate the runoff volumereductions provided by the rain gardens in awatershed, the Levels 2 and ⁄ or 3 (infiltration ratetesting and synthetic drawdown testing), should pro-vide adequate information. If the goal is to calculatepollutant load reductions for a Total Maximum DailyLoad study, then synthetic drawdown testing andwater quality monitoring may be required. If the goalof the assessment is to simply satisfy state permitrequirements then a routine visual inspection may beall that is required. For developing maintenanceschedules, and checking functionality over the longerperiod, a combination of visual inspection and infil-tration rate testing is recommended.
FIGURE 1. Important Parameters of the Modified Philip-DunneInfiltrometer (Nestingen, 2007). H0 is the initial height of water,H(t) is the height of water at time t, Lmax is the depth of insertioninto the soil, r0 is the equivalent source radius, r1 is the radius ofthe cylinder, r is any radius within the wetted front, and R(t) is theradius to the sharp wetted front at time t.
PERFORMANCE ASSESSMENT OF RAIN GARDENS
JOURNAL OF THE AMERICAN WATER RESOURCES ASSOCIATION 1021 JAWRA
SITE SELECTION AND DESCRIPTIONS
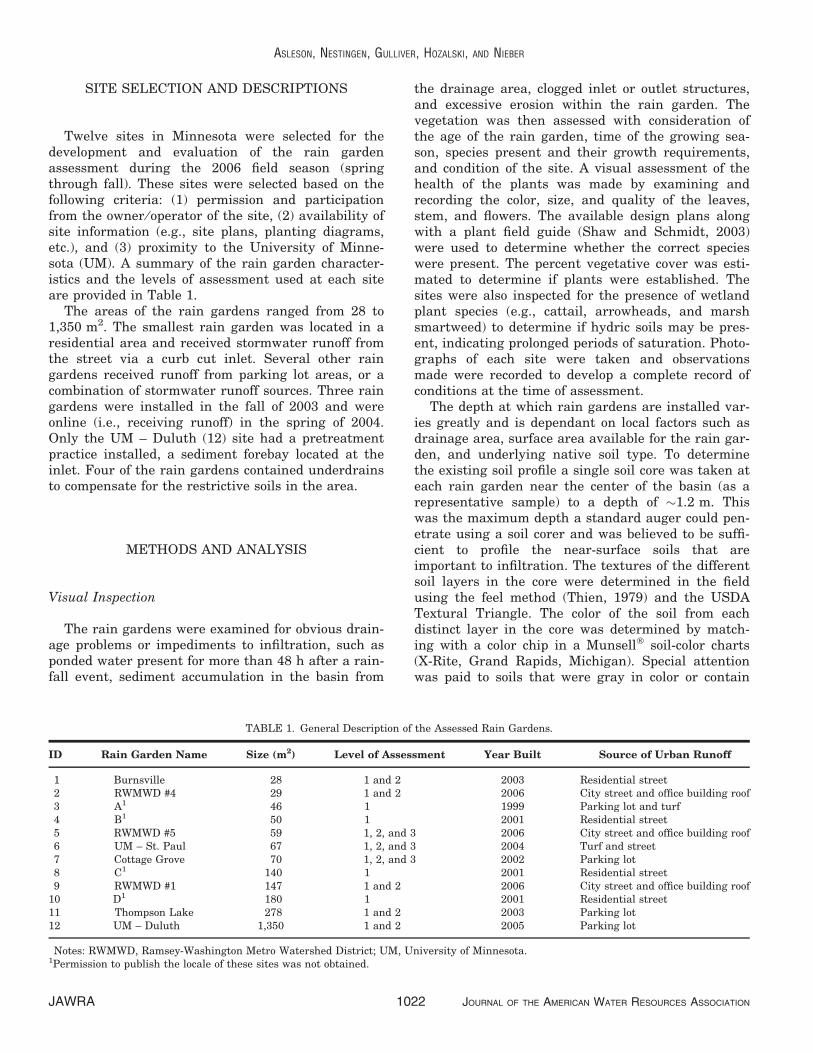
Twelve sites in Minnesota were selected for thedevelopment and evaluation of the rain gardenassessment during the 2006 field season (springthrough fall). These sites were selected based on thefollowing criteria: (1) permission and participationfrom the owner ⁄ operator of the site, (2) availability ofsite information (e.g., site plans, planting diagrams,etc.), and (3) proximity to the University of Minne-sota (UM). A summary of the rain garden character-istics and the levels of assessment used at each siteare provided in Table 1.
The areas of the rain gardens ranged from 28 to1,350 m2. The smallest rain garden was located in aresidential area and received stormwater runoff fromthe street via a curb cut inlet. Several other raingardens received runoff from parking lot areas, or acombination of stormwater runoff sources. Three raingardens were installed in the fall of 2003 and wereonline (i.e., receiving runoff) in the spring of 2004.Only the UM – Duluth (12) site had a pretreatmentpractice installed, a sediment forebay located at theinlet. Four of the rain gardens contained underdrainsto compensate for the restrictive soils in the area.
METHODS AND ANALYSIS
Visual Inspection
The rain gardens were examined for obvious drain-age problems or impediments to infiltration, such asponded water present for more than 48 h after a rain-fall event, sediment accumulation in the basin from
the drainage area, clogged inlet or outlet structures,and excessive erosion within the rain garden. Thevegetation was then assessed with consideration ofthe age of the rain garden, time of the growing sea-son, species present and their growth requirements,and condition of the site. A visual assessment of thehealth of the plants was made by examining andrecording the color, size, and quality of the leaves,stem, and flowers. The available design plans alongwith a plant field guide (Shaw and Schmidt, 2003)were used to determine whether the correct specieswere present. The percent vegetative cover was esti-mated to determine if plants were established. Thesites were also inspected for the presence of wetlandplant species (e.g., cattail, arrowheads, and marshsmartweed) to determine if hydric soils may be pres-ent, indicating prolonged periods of saturation. Photo-graphs of each site were taken and observationsmade were recorded to develop a complete record ofconditions at the time of assessment.
The depth at which rain gardens are installed var-ies greatly and is dependant on local factors such asdrainage area, surface area available for the rain gar-den, and underlying native soil type. To determinethe existing soil profile a single soil core was taken ateach rain garden near the center of the basin (as arepresentative sample) to a depth of �1.2 m. Thiswas the maximum depth a standard auger could pen-etrate using a soil corer and was believed to be suffi-cient to profile the near-surface soils that areimportant to infiltration. The textures of the differentsoil layers in the core were determined in the fieldusing the feel method (Thien, 1979) and the USDATextural Triangle. The color of the soil from eachdistinct layer in the core was determined by match-ing with a color chip in a Munsell� soil-color charts(X-Rite, Grand Rapids, Michigan). Special attentionwas paid to soils that were gray in color or contain
TABLE 1. General Description of the Assessed Rain Gardens.
ID Rain Garden Name Size (m2) Level of Assessment Year Built Source of Urban Runoff
1 Burnsville 28 1 and 2 2003 Residential street2 RWMWD #4 29 1 and 2 2006 City street and office building roof3 A1 46 1 1999 Parking lot and turf4 B1 50 1 2001 Residential street5 RWMWD #5 59 1, 2, and 3 2006 City street and office building roof6 UM – St. Paul 67 1, 2, and 3 2004 Turf and street7 Cottage Grove 70 1, 2, and 3 2002 Parking lot8 C1 140 1 2001 Residential street9 RWMWD #1 147 1 and 2 2006 City street and office building roof
10 D1 180 1 2001 Residential street11 Thompson Lake 278 1 and 2 2003 Parking lot12 UM – Duluth 1,350 1 and 2 2005 Parking lot
Notes: RWMWD, Ramsey-Washington Metro Watershed District; UM, University of Minnesota.1Permission to publish the locale of these sites was not obtained.
ASLESON, NESTINGEN, GULLIVER, HOZALSKI, AND NIEBER
JAWRA 1022 JOURNAL OF THE AMERICAN WATER RESOURCES ASSOCIATION
mottles (i.e., small areas of gray, red, yellow, brown,or black that differ in color from the bulk soil), whichmay indicate hydric soils (Richardson and Vepraskas,2001) that would be associated with prolonged watersaturation. The soil was crumbled and repacked intothe core hole after soil inspection was complete.
Infiltration Rate Tests
The MPD Infiltrometer (Figure 1) consists of a thin-walled (2 mm thick) aluminum cylinder with a heightof 45 cm and an inner diameter of 10 cm. A transpar-ent piezometer tube was attached to the outside of thedevice beside a measurement tape for making waterlevel readings. After any mulch or detached ⁄ decayingplant material was brushed aside the device waspounded into the soil to a depth of 5 cm and then filledwith water to a height of 43 cm as to not overflow thedevice. The water level over time was then recordedeither manually or automatically using an ultrasonicsensor (1 reading ⁄ s averaged over 10 s) (MassaSonic,M-5000; MASSA PRODUCTS CORPORATION, Hing-ham, Massachusetts). MPD Infiltrometer measure-ments were made at a number of locations throughouteach basin, based upon a restricted sampling grid thatavoided bushes, trees, and energy dissipation struc-tures such as riprap or concrete, and did not otherwisedestroy plantings. The coordinates of each locationwere determined using a Trimble ProXR GPS unit(Trimble Navigation Limited, Sunnyvale, California),which delivers submeter accuracy (accuracy varieswith proximity to base station) in the correct condi-tions. Six MPD Infiltrometers were used at a time toincrease the rate of data collection.
The MPD Infiltrometer and the notations used inthe equations are illustrated in Figure 1. The originalPhilip-Dunne permeameter technique involved placingthe device in a borehole. The device was therefore mod-ified to incorporate surface infiltration and capture anyeffects of sediment accumulation in the stormwaterBMP. Due to these modifications in the technique, themethodology described by Philip (1993) for determiningsaturated hydraulic conductivity needed to be alteredaccordingly. This alteration included changing thegeometry of the source from a sphere to a hemisphereand accounting for one-dimensional flow through thesoil contained within the bottom of the device.
The equations used in calculating the saturatedconductivity are only applied after R(t) (radius to the
sharp wetted front at time t) is greater than the dis-
tanceffiffiffiffiffiffiffiffiffiffiffiffiffiffiffiffiffiffiffiffir21 þ L2
max
q; where r1 is the radius of the cylin-
der and Lmax is the depth of insertion into the soil,which can be determined from the volume of waterinfiltrated and soil porosity. The mass conservation
equation for cumulative infiltration, i(t), using thegeometry of a spherical cap with a height ofR(t) + Lmax and soil with an initial and final moisturecontent of h0 and h1, respectively, is:
iðtÞ ¼ p3
h1 � h0ð Þ 2 RðtÞ½ �3þ3 RðtÞ½ �2Lmax � Lmax3 � 4r30
� �
ð1Þ
The same analysis procedure described by Philip(1993) was followed, which involves working through aseries of equations to solve for the two unknowns, Ksat,the saturated hydraulic conductivity and w which isthe wetting front suction head for the unsaturated soil.A computational spreadsheet procedure with the sol-ver add-in and visual basic application was developedto find solutions to the equations and automate thecomputational process and obtain values of Ksat and w.
For 57% of the tests, only three data points wereobtained manually with the times corresponding tofull, half-empty, and empty, as recommended byMunoz-Carpena et al. (2002) for the Philip-Dunnepermeameter. The three-point method, however,required additional data processing to meet therequirements of the data fitting procedure used todetermine Ksat. An exponential fit of the three pointswas used to generate the necessary water level vs.time data. For the remainder of the tests, more datapoints were obtained and the additional processingwas not required. A capacitance probe (Theta Probe�,ML2x; Thermo Fisher Scientific Inc., Waltham, Mas-sachusetts), which measures the dielectric constant ofthe soil, was used to indirectly estimate the initialand final soil moisture content of the top six cm ofsoil in the vicinity of the infiltrometer. A soil specificcalibration using several gravimetric soil moisturemeasurements was also conducted for each rain gar-den. Bulk density measurements, required to convertgravimetric water content to volumetric water con-tent, were made using the core method (Klute, 1986).Tests in which there was minimal change in waterlevel over �3-h time period were terminated, suggest-ing that the Ksat value was less than the smallestmeasured Ksat value of 5.6 · 10)7 cm ⁄ s. The calcu-lated Ksat values for each measurement location wereentered into ArcView to provide a map showing thespatial variability in Ksat for each rain garden.
The arithmetic mean, geometric mean, and the med-ian were then calculated for each site. Graphs of thecumulative distribution of the measured Ksat valuesalong with the theoretical normal and log-normaldistributions for the mean and standard deviation (SD)of the data collected were plotted. Visual inspection ofthe cumulative distribution plots along with the
PERFORMANCE ASSESSMENT OF RAIN GARDENS
JOURNAL OF THE AMERICAN WATER RESOURCES ASSOCIATION 1023 JAWRA
computed coefficient of variation (CV) values was usedto determine the appropriate distribution for the mea-sured Ksat values. Possible outliers were not removeddue to the highly heterogeneous soil expected in vege-tative landscapes and the uncertainty involved withremoval of such data points.
The median or mean Ksat value from the infiltrom-eter results; the surface area, A (m2); and volume, V(m3) of the water in the rain garden at the time ofthe test were used to predict the drain time, t, usingthe following equation:
Drain Time ¼ V
KsatAð2Þ
Equation (2) will provide a rough estimate of thedrain time, subject to the following assumptions:
(1) The mean piezometric head over the soil, repre-sented by V ⁄ A, is appropriate to estimate draintime, and
(2) The soil is saturated at the conclusion of filling,when drain time measurements commenced.
Synthetic Drawdown Tests
The flow rate needed to fill a rain garden with waterfor the simulated runoff assessment was calculated todetermine if an adequate supply of water was avail-able. The parameters necessary to estimate this flowrate include the surface area of the basin, the esti-mated or measured infiltration rate, and the storagecapacity of the basin. After filling the rain garden withwater to the highest level possible, the water level vs.time was recorded using a staff gauge and a stopwatch. Measurements also were collected every secondand averaged over 10 s intervals with an ultrasonicsensor (MassaSonic, M-5000) mounted to a postset atthe lowest point in the basin. The time required to filleach rain garden was �30 min. Measurements ofwater level began as soon as the inflow was turned off.The reported drain times are based on the actual vol-ume of water used during the synthetic drawdown testand not the maximum capacity of each site.
RESULTS AND DISCUSSION
Visual Inspection
All of the rain gardens contained various species ofnative perennial vegetation. Four of the sites con-
tained new plantings and were considered to be ingood health based on their early stage in develop-ment. Four rain gardens suffered from an obviouslack of infiltration observed during a visual inspec-tion, including ponded water, the presence of hydricsoils and wetland plants, and a lack of plant growthon compacted soil. These rain gardens failed theLevel 1 inspection and will require rehabilitation.Vegetation health at the Cottage Grove (7) site wasrated as poor based on the presence of failing trees.Nevertheless, the prairie grasses and perennialplants appeared to be established and growing well.With the exception of the four sites determined to benonfunctional and the Cottage Grove (7) site, theother sites had well-established vegetation thatappeared to be healthy.
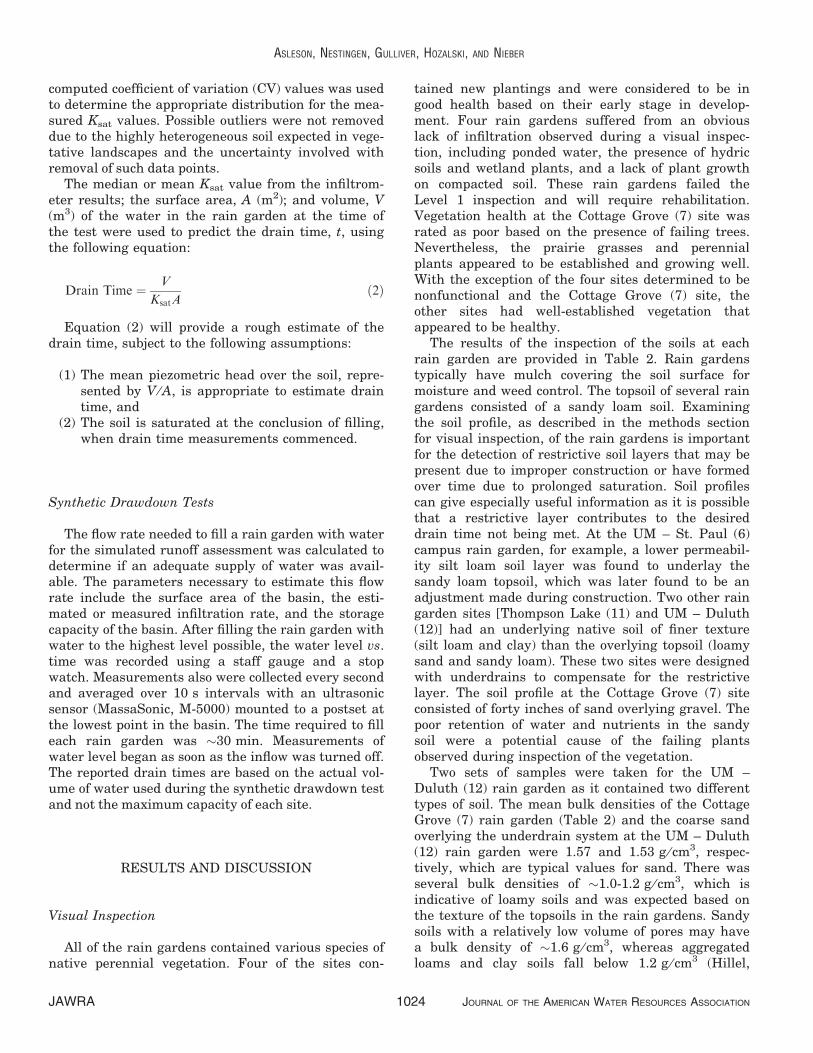
The results of the inspection of the soils at eachrain garden are provided in Table 2. Rain gardenstypically have mulch covering the soil surface formoisture and weed control. The topsoil of several raingardens consisted of a sandy loam soil. Examiningthe soil profile, as described in the methods sectionfor visual inspection, of the rain gardens is importantfor the detection of restrictive soil layers that may bepresent due to improper construction or have formedover time due to prolonged saturation. Soil profilescan give especially useful information as it is possiblethat a restrictive layer contributes to the desireddrain time not being met. At the UM – St. Paul (6)campus rain garden, for example, a lower permeabil-ity silt loam soil layer was found to underlay thesandy loam topsoil, which was later found to be anadjustment made during construction. Two other raingarden sites [Thompson Lake (11) and UM – Duluth(12)] had an underlying native soil of finer texture(silt loam and clay) than the overlying topsoil (loamysand and sandy loam). These two sites were designedwith underdrains to compensate for the restrictivelayer. The soil profile at the Cottage Grove (7) siteconsisted of forty inches of sand overlying gravel. Thepoor retention of water and nutrients in the sandysoil were a potential cause of the failing plantsobserved during inspection of the vegetation.
Two sets of samples were taken for the UM –Duluth (12) rain garden as it contained two differenttypes of soil. The mean bulk densities of the CottageGrove (7) rain garden (Table 2) and the coarse sandoverlying the underdrain system at the UM – Duluth(12) rain garden were 1.57 and 1.53 g ⁄ cm3, respec-tively, which are typical values for sand. There wasseveral bulk densities of �1.0-1.2 g ⁄ cm3, which isindicative of loamy soils and was expected based onthe texture of the topsoils in the rain gardens. Sandysoils with a relatively low volume of pores may havea bulk density of �1.6 g ⁄ cm3, whereas aggregatedloams and clay soils fall below 1.2 g ⁄ cm3 (Hillel,
ASLESON, NESTINGEN, GULLIVER, HOZALSKI, AND NIEBER
JAWRA 1024 JOURNAL OF THE AMERICAN WATER RESOURCES ASSOCIATION
1998). By comparing the bulk density measurementsto the texture of the soils, compaction did not appearto be a problem for any of the eight functioning raingardens.
Infiltration Rate Tests
Infiltration rate tests, using the methods describedin the Methods and Analysis section for infiltrationrate testing, were performed at the eight functionalrain gardens. Rain gardens A (3), B (4), C (8), and D(10) were not included in these tests because theyfailed the Level 1 assessment based on the existenceof hydric soils and wetland plants, therefore infiltra-tion rates were assumed to be poor and ⁄ or inhibitedat those sites. Six MPD Infiltrometers were usedsimultaneously allowing infiltration rate testing to becompleted within 8 h at each rain garden, with the
exception of UM – Duluth (12) due to its large size.The number of locations where measurements weremade using the MPD varied among the rain gardensdue to differences in rain garden size. The timerequired for each individual MPD test to be com-pleted ranged from 1.5 min to 8.6 h with an averagetime of 1.3 h. Only 1% of the tests took 8 h or longerto drain completely, while 78% of the tests were com-pleted in less than 2 h. One percent of the MPD testswere terminated at the UM – St. Paul (6) and UM –Duluth (12) sites due to minimal change in waterlevel over a period of more than 8 h.
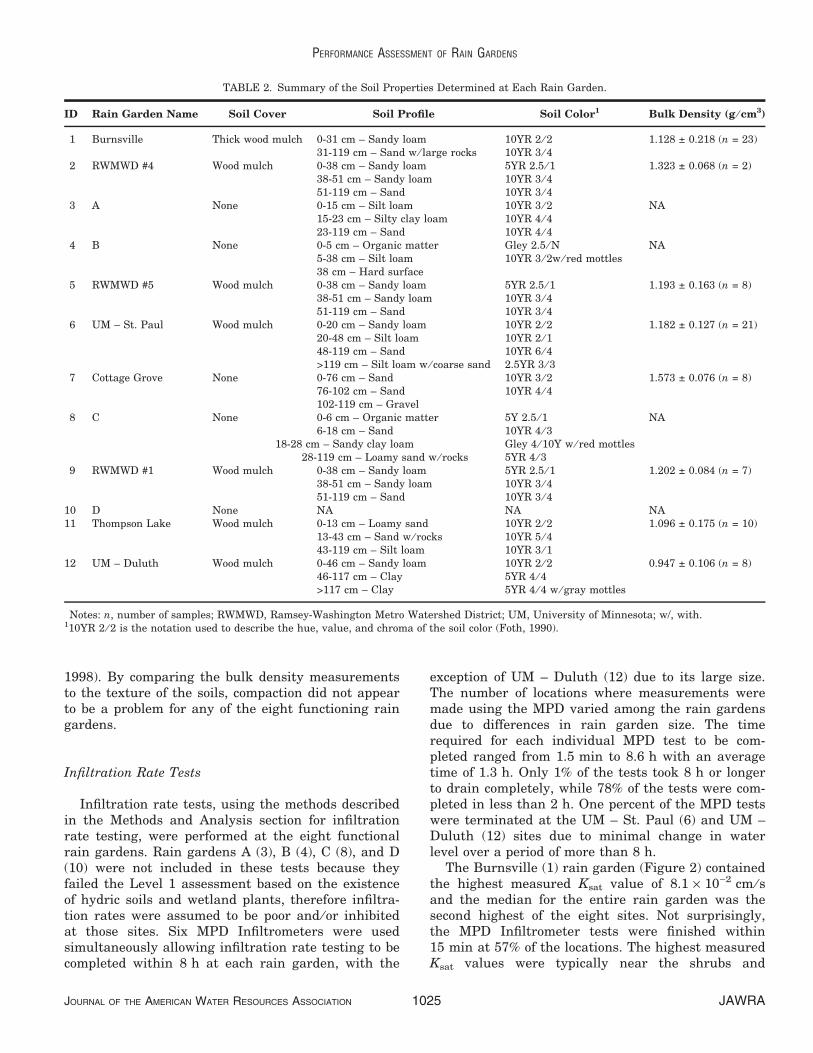
The Burnsville (1) rain garden (Figure 2) containedthe highest measured Ksat value of 8.1 · 10)2 cm ⁄ sand the median for the entire rain garden was thesecond highest of the eight sites. Not surprisingly,the MPD Infiltrometer tests were finished within15 min at 57% of the locations. The highest measuredKsat values were typically near the shrubs and
TABLE 2. Summary of the Soil Properties Determined at Each Rain Garden.
ID Rain Garden Name Soil Cover Soil Profile Soil Color1 Bulk Density (g ⁄ cm3)
1 Burnsville Thick wood mulch 0-31 cm – Sandy loam 10YR 2 ⁄ 2 1.128 ± 0.218 (n = 23)31-119 cm – Sand w ⁄ large rocks 10YR 3 ⁄ 4
2 RWMWD #4 Wood mulch 0-38 cm – Sandy loam 5YR 2.5 ⁄ 1 1.323 ± 0.068 (n = 2)38-51 cm – Sandy loam 10YR 3 ⁄ 451-119 cm – Sand 10YR 3 ⁄ 4
3 A None 0-15 cm – Silt loam 10YR 3 ⁄ 2 NA15-23 cm – Silty clay loam 10YR 4 ⁄ 423-119 cm – Sand 10YR 4 ⁄ 4
4 B None 0-5 cm – Organic matter Gley 2.5 ⁄ N NA5-38 cm – Silt loam 10YR 3 ⁄ 2w ⁄ red mottles38 cm – Hard surface
5 RWMWD #5 Wood mulch 0-38 cm – Sandy loam 5YR 2.5 ⁄ 1 1.193 ± 0.163 (n = 8)38-51 cm – Sandy loam 10YR 3 ⁄ 451-119 cm – Sand 10YR 3 ⁄ 4
6 UM – St. Paul Wood mulch 0-20 cm – Sandy loam 10YR 2 ⁄ 2 1.182 ± 0.127 (n = 21)20-48 cm – Silt loam 10YR 2 ⁄ 148-119 cm – Sand 10YR 6 ⁄ 4>119 cm – Silt loam w ⁄ coarse sand 2.5YR 3 ⁄ 3
7 Cottage Grove None 0-76 cm – Sand 10YR 3 ⁄ 2 1.573 ± 0.076 (n = 8)76-102 cm – Sand 10YR 4 ⁄ 4102-119 cm – Gravel
8 C None 0-6 cm – Organic matter 5Y 2.5 ⁄ 1 NA6-18 cm – Sand 10YR 4 ⁄ 3
18-28 cm – Sandy clay loam Gley 4 ⁄ 10Y w ⁄ red mottles28-119 cm – Loamy sand w ⁄ rocks 5YR 4 ⁄ 3
9 RWMWD #1 Wood mulch 0-38 cm – Sandy loam 5YR 2.5 ⁄ 1 1.202 ± 0.084 (n = 7)38-51 cm – Sandy loam 10YR 3 ⁄ 451-119 cm – Sand 10YR 3 ⁄ 4
10 D None NA NA NA11 Thompson Lake Wood mulch 0-13 cm – Loamy sand 10YR 2 ⁄ 2 1.096 ± 0.175 (n = 10)
13-43 cm – Sand w ⁄ rocks 10YR 5 ⁄ 443-119 cm – Silt loam 10YR 3 ⁄ 1
12 UM – Duluth Wood mulch 0-46 cm – Sandy loam 10YR 2 ⁄ 2 0.947 ± 0.106 (n = 8)46-117 cm – Clay 5YR 4 ⁄ 4>117 cm – Clay 5YR 4 ⁄ 4 w ⁄ gray mottles
Notes: n, number of samples; RWMWD, Ramsey-Washington Metro Watershed District; UM, University of Minnesota; w/, with.110YR 2 ⁄ 2 is the notation used to describe the hue, value, and chroma of the soil color (Foth, 1990).
PERFORMANCE ASSESSMENT OF RAIN GARDENS
JOURNAL OF THE AMERICAN WATER RESOURCES ASSOCIATION 1025 JAWRA
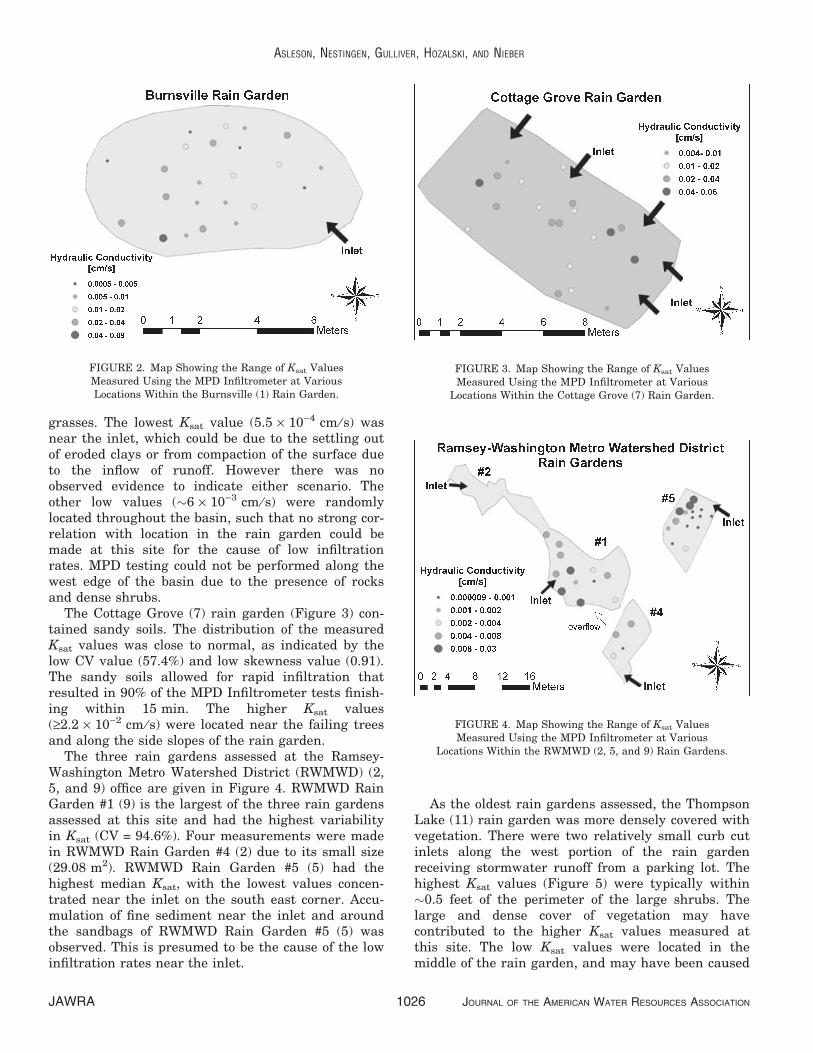
grasses. The lowest Ksat value (5.5 · 10)4 cm ⁄ s) wasnear the inlet, which could be due to the settling outof eroded clays or from compaction of the surface dueto the inflow of runoff. However there was noobserved evidence to indicate either scenario. Theother low values (�6 · 10)3 cm ⁄ s) were randomlylocated throughout the basin, such that no strong cor-relation with location in the rain garden could bemade at this site for the cause of low infiltrationrates. MPD testing could not be performed along thewest edge of the basin due to the presence of rocksand dense shrubs.
The Cottage Grove (7) rain garden (Figure 3) con-tained sandy soils. The distribution of the measuredKsat values was close to normal, as indicated by thelow CV value (57.4%) and low skewness value (0.91).The sandy soils allowed for rapid infiltration thatresulted in 90% of the MPD Infiltrometer tests finish-ing within 15 min. The higher Ksat values(‡2.2 · 10)2 cm ⁄ s) were located near the failing treesand along the side slopes of the rain garden.
The three rain gardens assessed at the Ramsey-Washington Metro Watershed District (RWMWD) (2,5, and 9) office are given in Figure 4. RWMWD RainGarden #1 (9) is the largest of the three rain gardensassessed at this site and had the highest variabilityin Ksat (CV = 94.6%). Four measurements were madein RWMWD Rain Garden #4 (2) due to its small size(29.08 m2). RWMWD Rain Garden #5 (5) had thehighest median Ksat, with the lowest values concen-trated near the inlet on the south east corner. Accu-mulation of fine sediment near the inlet and aroundthe sandbags of RWMWD Rain Garden #5 (5) wasobserved. This is presumed to be the cause of the lowinfiltration rates near the inlet.
As the oldest rain gardens assessed, the ThompsonLake (11) rain garden was more densely covered withvegetation. There were two relatively small curb cutinlets along the west portion of the rain gardenreceiving stormwater runoff from a parking lot. Thehighest Ksat values (Figure 5) were typically within�0.5 feet of the perimeter of the large shrubs. Thelarge and dense cover of vegetation may havecontributed to the higher Ksat values measured atthis site. The low Ksat values were located in themiddle of the rain garden, and may have been caused
FIGURE 2. Map Showing the Range of Ksat ValuesMeasured Using the MPD Infiltrometer at VariousLocations Within the Burnsville (1) Rain Garden.
FIGURE 3. Map Showing the Range of Ksat ValuesMeasured Using the MPD Infiltrometer at Various
Locations Within the Cottage Grove (7) Rain Garden.
FIGURE 4. Map Showing the Range of Ksat ValuesMeasured Using the MPD Infiltrometer at Various
Locations Within the RWMWD (2, 5, and 9) Rain Gardens.
ASLESON, NESTINGEN, GULLIVER, HOZALSKI, AND NIEBER
JAWRA 1026 JOURNAL OF THE AMERICAN WATER RESOURCES ASSOCIATION
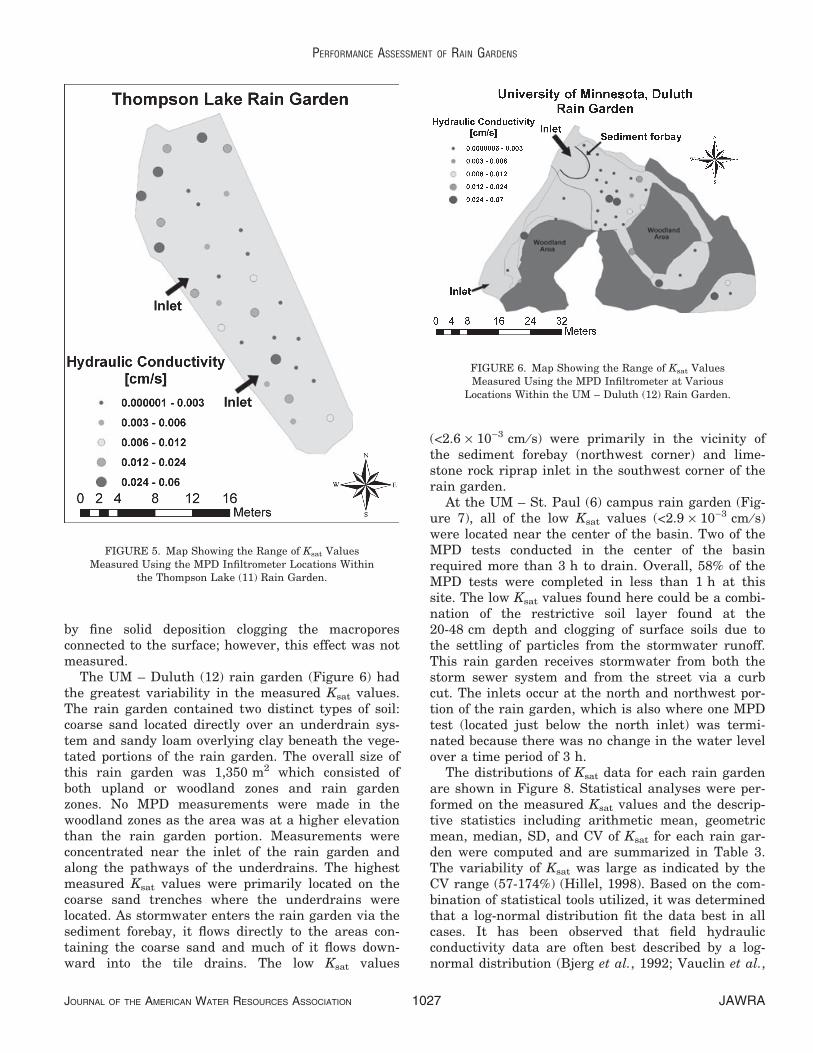
by fine solid deposition clogging the macroporesconnected to the surface; however, this effect was notmeasured.
The UM – Duluth (12) rain garden (Figure 6) hadthe greatest variability in the measured Ksat values.The rain garden contained two distinct types of soil:coarse sand located directly over an underdrain sys-tem and sandy loam overlying clay beneath the vege-tated portions of the rain garden. The overall size ofthis rain garden was 1,350 m2 which consisted ofboth upland or woodland zones and rain gardenzones. No MPD measurements were made in thewoodland zones as the area was at a higher elevationthan the rain garden portion. Measurements wereconcentrated near the inlet of the rain garden andalong the pathways of the underdrains. The highestmeasured Ksat values were primarily located on thecoarse sand trenches where the underdrains werelocated. As stormwater enters the rain garden via thesediment forebay, it flows directly to the areas con-taining the coarse sand and much of it flows down-ward into the tile drains. The low Ksat values
(<2.6 · 10)3 cm ⁄ s) were primarily in the vicinity ofthe sediment forebay (northwest corner) and lime-stone rock riprap inlet in the southwest corner of therain garden.
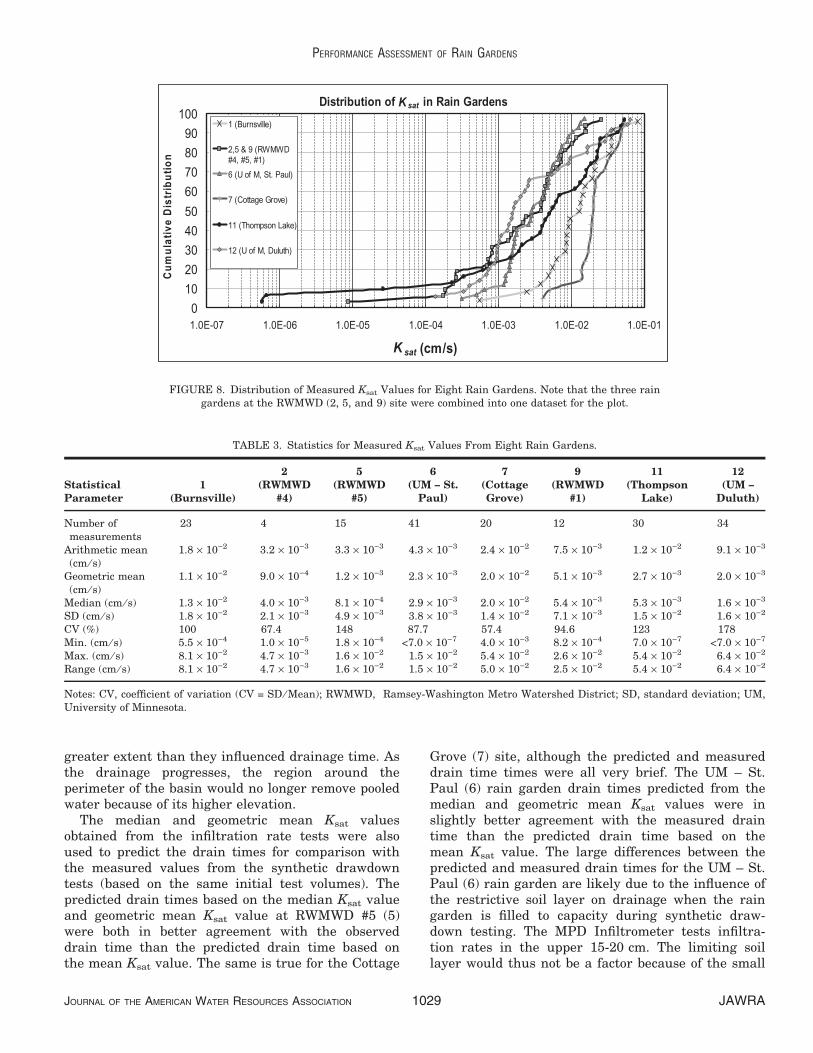
At the UM – St. Paul (6) campus rain garden (Fig-ure 7), all of the low Ksat values (<2.9 · 10)3 cm ⁄ s)were located near the center of the basin. Two of theMPD tests conducted in the center of the basinrequired more than 3 h to drain. Overall, 58% of theMPD tests were completed in less than 1 h at thissite. The low Ksat values found here could be a combi-nation of the restrictive soil layer found at the20-48 cm depth and clogging of surface soils due tothe settling of particles from the stormwater runoff.This rain garden receives stormwater from both thestorm sewer system and from the street via a curbcut. The inlets occur at the north and northwest por-tion of the rain garden, which is also where one MPDtest (located just below the north inlet) was termi-nated because there was no change in the water levelover a time period of 3 h.
The distributions of Ksat data for each rain gardenare shown in Figure 8. Statistical analyses were per-formed on the measured Ksat values and the descrip-tive statistics including arithmetic mean, geometricmean, median, SD, and CV of Ksat for each rain gar-den were computed and are summarized in Table 3.The variability of Ksat was large as indicated by theCV range (57-174%) (Hillel, 1998). Based on the com-bination of statistical tools utilized, it was determinedthat a log-normal distribution fit the data best in allcases. It has been observed that field hydraulicconductivity data are often best described by a log-normal distribution (Bjerg et al., 1992; Vauclin et al.,
FIGURE 5. Map Showing the Range of Ksat ValuesMeasured Using the MPD Infiltrometer Locations Within
the Thompson Lake (11) Rain Garden.
FIGURE 6. Map Showing the Range of Ksat ValuesMeasured Using the MPD Infiltrometer at Various
Locations Within the UM – Duluth (12) Rain Garden.
PERFORMANCE ASSESSMENT OF RAIN GARDENS
JOURNAL OF THE AMERICAN WATER RESOURCES ASSOCIATION 1027 JAWRA
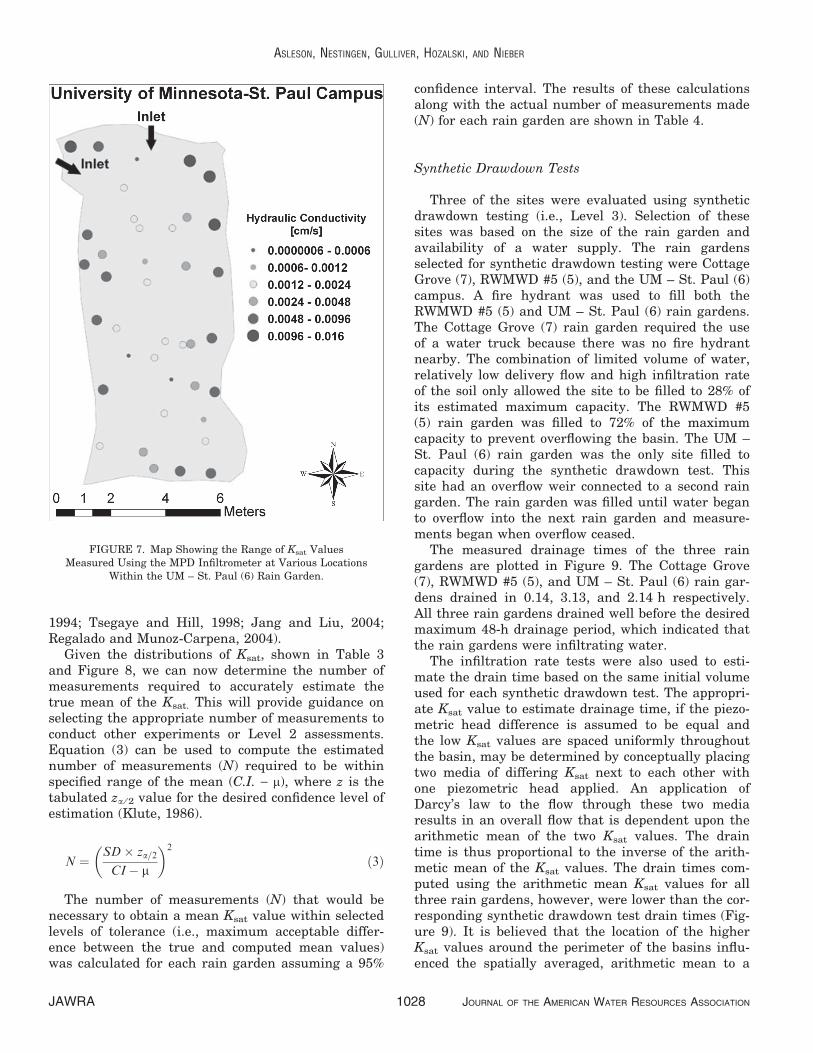
1994; Tsegaye and Hill, 1998; Jang and Liu, 2004;Regalado and Munoz-Carpena, 2004).
Given the distributions of Ksat, shown in Table 3and Figure 8, we can now determine the number ofmeasurements required to accurately estimate thetrue mean of the Ksat. This will provide guidance onselecting the appropriate number of measurements toconduct other experiments or Level 2 assessments.Equation (3) can be used to compute the estimatednumber of measurements (N) required to be withinspecified range of the mean (C.I. ) l), where z is thetabulated za ⁄ 2 value for the desired confidence level ofestimation (Klute, 1986).
N ¼SD� za=2
CI� l
� �2
ð3Þ
The number of measurements (N) that would benecessary to obtain a mean Ksat value within selectedlevels of tolerance (i.e., maximum acceptable differ-ence between the true and computed mean values)was calculated for each rain garden assuming a 95%
confidence interval. The results of these calculationsalong with the actual number of measurements made(N) for each rain garden are shown in Table 4.
Synthetic Drawdown Tests
Three of the sites were evaluated using syntheticdrawdown testing (i.e., Level 3). Selection of thesesites was based on the size of the rain garden andavailability of a water supply. The rain gardensselected for synthetic drawdown testing were CottageGrove (7), RWMWD #5 (5), and the UM – St. Paul (6)campus. A fire hydrant was used to fill both theRWMWD #5 (5) and UM – St. Paul (6) rain gardens.The Cottage Grove (7) rain garden required the useof a water truck because there was no fire hydrantnearby. The combination of limited volume of water,relatively low delivery flow and high infiltration rateof the soil only allowed the site to be filled to 28% ofits estimated maximum capacity. The RWMWD #5(5) rain garden was filled to 72% of the maximumcapacity to prevent overflowing the basin. The UM –St. Paul (6) rain garden was the only site filled tocapacity during the synthetic drawdown test. Thissite had an overflow weir connected to a second raingarden. The rain garden was filled until water beganto overflow into the next rain garden and measure-ments began when overflow ceased.
The measured drainage times of the three raingardens are plotted in Figure 9. The Cottage Grove(7), RWMWD #5 (5), and UM – St. Paul (6) rain gar-dens drained in 0.14, 3.13, and 2.14 h respectively.All three rain gardens drained well before the desiredmaximum 48-h drainage period, which indicated thatthe rain gardens were infiltrating water.
The infiltration rate tests were also used to esti-mate the drain time based on the same initial volumeused for each synthetic drawdown test. The appropri-ate Ksat value to estimate drainage time, if the piezo-metric head difference is assumed to be equal andthe low Ksat values are spaced uniformly throughoutthe basin, may be determined by conceptually placingtwo media of differing Ksat next to each other withone piezometric head applied. An application ofDarcy’s law to the flow through these two mediaresults in an overall flow that is dependent upon thearithmetic mean of the two Ksat values. The draintime is thus proportional to the inverse of the arith-metic mean of the Ksat values. The drain times com-puted using the arithmetic mean Ksat values for allthree rain gardens, however, were lower than the cor-responding synthetic drawdown test drain times (Fig-ure 9). It is believed that the location of the higherKsat values around the perimeter of the basins influ-enced the spatially averaged, arithmetic mean to a
FIGURE 7. Map Showing the Range of Ksat ValuesMeasured Using the MPD Infiltrometer at Various Locations
Within the UM – St. Paul (6) Rain Garden.
ASLESON, NESTINGEN, GULLIVER, HOZALSKI, AND NIEBER
JAWRA 1028 JOURNAL OF THE AMERICAN WATER RESOURCES ASSOCIATION
greater extent than they influenced drainage time. Asthe drainage progresses, the region around theperimeter of the basin would no longer remove pooledwater because of its higher elevation.
The median and geometric mean Ksat valuesobtained from the infiltration rate tests were alsoused to predict the drain times for comparison withthe measured values from the synthetic drawdowntests (based on the same initial test volumes). Thepredicted drain times based on the median Ksat valueand geometric mean Ksat value at RWMWD #5 (5)were both in better agreement with the observeddrain time than the predicted drain time based onthe mean Ksat value. The same is true for the Cottage
Grove (7) site, although the predicted and measureddrain time times were all very brief. The UM – St.Paul (6) rain garden drain times predicted from themedian and geometric mean Ksat values were inslightly better agreement with the measured draintime than the predicted drain time based on themean Ksat value. The large differences between thepredicted and measured drain times for the UM – St.Paul (6) rain garden are likely due to the influence ofthe restrictive soil layer on drainage when the raingarden is filled to capacity during synthetic draw-down testing. The MPD Infiltrometer tests infiltra-tion rates in the upper 15-20 cm. The limiting soillayer would thus not be a factor because of the small
FIGURE 8. Distribution of Measured Ksat Values for Eight Rain Gardens. Note that the three raingardens at the RWMWD (2, 5, and 9) site were combined into one dataset for the plot.
TABLE 3. Statistics for Measured Ksat Values From Eight Rain Gardens.
StatisticalParameter
1(Burnsville)
2(RWMWD
#4)
5(RWMWD
#5)
6(UM – St.
Paul)
7(CottageGrove)
9(RWMWD
#1)
11(Thompson
Lake)
12(UM –
Duluth)
Number ofmeasurements
23 4 15 41 20 12 30 34
Arithmetic mean(cm ⁄ s)
1.8 · 10)2 3.2 · 10)3 3.3 · 10)3 4.3 · 10)3 2.4 · 10)2 7.5 · 10)3 1.2 · 10)2 9.1 · 10)3
Geometric mean(cm ⁄ s)
1.1 · 10)2 9.0 · 10)4 1.2 · 10)3 2.3 · 10)3 2.0 · 10)2 5.1 · 10)3 2.7 · 10)3 2.0 · 10)3
Median (cm ⁄ s) 1.3 · 10)2 4.0 · 10)3 8.1 · 10)4 2.9 · 10)3 2.0 · 10)2 5.4 · 10)3 5.3 · 10)3 1.6 · 10)3
SD (cm ⁄ s) 1.8 · 10)2 2.1 · 10)3 4.9 · 10)3 3.8 · 10)3 1.4 · 10)2 7.1 · 10)3 1.5 · 10)2 1.6 · 10)2
CV (%) 100 67.4 148 87.7 57.4 94.6 123 178Min. (cm ⁄ s) 5.5 · 10)4 1.0 · 10)5 1.8 · 10)4 <7.0 · 10)7 4.0 · 10)3 8.2 · 10)4 7.0 · 10)7 <7.0 · 10)7
Max. (cm ⁄ s) 8.1 · 10)2 4.7 · 10)3 1.6 · 10)2 1.5 · 10)2 5.4 · 10)2 2.6 · 10)2 5.4 · 10)2 6.4 · 10)2
Range (cm ⁄ s) 8.1 · 10)2 4.7 · 10)3 1.6 · 10)2 1.5 · 10)2 5.0 · 10)2 2.5 · 10)2 5.4 · 10)2 6.4 · 10)2
Notes: CV, coefficient of variation (CV = SD ⁄ Mean); RWMWD, Ramsey-Washington Metro Watershed District; SD, standard deviation; UM,University of Minnesota.
PERFORMANCE ASSESSMENT OF RAIN GARDENS
JOURNAL OF THE AMERICAN WATER RESOURCES ASSOCIATION 1029 JAWRA
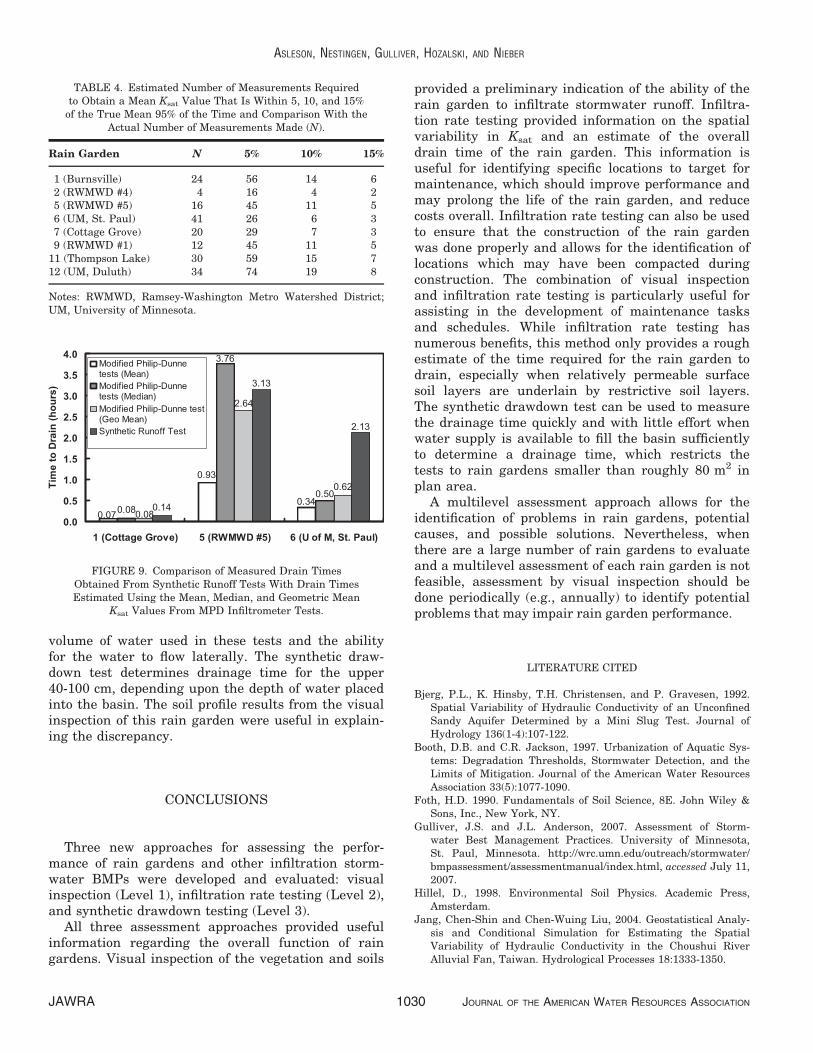
volume of water used in these tests and the abilityfor the water to flow laterally. The synthetic draw-down test determines drainage time for the upper40-100 cm, depending upon the depth of water placedinto the basin. The soil profile results from the visualinspection of this rain garden were useful in explain-ing the discrepancy.
CONCLUSIONS
Three new approaches for assessing the perfor-mance of rain gardens and other infiltration storm-water BMPs were developed and evaluated: visualinspection (Level 1), infiltration rate testing (Level 2),and synthetic drawdown testing (Level 3).
All three assessment approaches provided usefulinformation regarding the overall function of raingardens. Visual inspection of the vegetation and soils
provided a preliminary indication of the ability of therain garden to infiltrate stormwater runoff. Infiltra-tion rate testing provided information on the spatialvariability in Ksat and an estimate of the overalldrain time of the rain garden. This information isuseful for identifying specific locations to target formaintenance, which should improve performance andmay prolong the life of the rain garden, and reducecosts overall. Infiltration rate testing can also be usedto ensure that the construction of the rain gardenwas done properly and allows for the identification oflocations which may have been compacted duringconstruction. The combination of visual inspectionand infiltration rate testing is particularly useful forassisting in the development of maintenance tasksand schedules. While infiltration rate testing hasnumerous benefits, this method only provides a roughestimate of the time required for the rain garden todrain, especially when relatively permeable surfacesoil layers are underlain by restrictive soil layers.The synthetic drawdown test can be used to measurethe drainage time quickly and with little effort whenwater supply is available to fill the basin sufficientlyto determine a drainage time, which restricts thetests to rain gardens smaller than roughly 80 m2 inplan area.
A multilevel assessment approach allows for theidentification of problems in rain gardens, potentialcauses, and possible solutions. Nevertheless, whenthere are a large number of rain gardens to evaluateand a multilevel assessment of each rain garden is notfeasible, assessment by visual inspection should bedone periodically (e.g., annually) to identify potentialproblems that may impair rain garden performance.
LITERATURE CITED
Bjerg, P.L., K. Hinsby, T.H. Christensen, and P. Gravesen, 1992.Spatial Variability of Hydraulic Conductivity of an UnconfinedSandy Aquifer Determined by a Mini Slug Test. Journal ofHydrology 136(1-4):107-122.
Booth, D.B. and C.R. Jackson, 1997. Urbanization of Aquatic Sys-tems: Degradation Thresholds, Stormwater Detection, and theLimits of Mitigation. Journal of the American Water ResourcesAssociation 33(5):1077-1090.
Foth, H.D. 1990. Fundamentals of Soil Science, 8E. John Wiley &Sons, Inc., New York, NY.
Gulliver, J.S. and J.L. Anderson, 2007. Assessment of Storm-water Best Management Practices. University of Minnesota,St. Paul, Minnesota. http://wrc.umn.edu/outreach/stormwater/bmpassessment/assessmentmanual/index.html, accessed July 11,2007.
Hillel, D., 1998. Environmental Soil Physics. Academic Press,Amsterdam.
Jang, Chen-Shin and Chen-Wuing Liu, 2004. Geostatistical Analy-sis and Conditional Simulation for Estimating the SpatialVariability of Hydraulic Conductivity in the Choushui RiverAlluvial Fan, Taiwan. Hydrological Processes 18:1333-1350.
TABLE 4. Estimated Number of Measurements Requiredto Obtain a Mean Ksat Value That Is Within 5, 10, and 15%
of the True Mean 95% of the Time and Comparison With theActual Number of Measurements Made (N).
Rain Garden N 5% 10% 15%
1 (Burnsville) 24 56 14 62 (RWMWD #4) 4 16 4 25 (RWMWD #5) 16 45 11 56 (UM, St. Paul) 41 26 6 37 (Cottage Grove) 20 29 7 39 (RWMWD #1) 12 45 11 5
11 (Thompson Lake) 30 59 15 712 (UM, Duluth) 34 74 19 8
Notes: RWMWD, Ramsey-Washington Metro Watershed District;UM, University of Minnesota.
FIGURE 9. Comparison of Measured Drain TimesObtained From Synthetic Runoff Tests With Drain TimesEstimated Using the Mean, Median, and Geometric Mean
Ksat Values From MPD Infiltrometer Tests.
ASLESON, NESTINGEN, GULLIVER, HOZALSKI, AND NIEBER
JAWRA 1030 JOURNAL OF THE AMERICAN WATER RESOURCES ASSOCIATION

Klute, A. 1986. Methods of Soil Analysis, Part I. Physical andMineralogical Methods (Second edition). Soil Science Society ofAmerica, Inc. Publisher, Madison, Wisconsin.
Munoz-Carpena, R., C.M. Regalado, J. Alvarez-Benedi, and F. Bar-toli, 2002. Field Evaluation of the New Philip-Dunne Permeam-eter for Measuring Saturated Hydraulic Conductivity. SoilScience 167:9-24.
Nestingen, R.S., 2007. The Comparison of Infiltration Devices andModification of the Philip-Dunne Permeameter for the Assess-ment of Rain Gardens. M.S. Thesis, University of Minnesota,Minneapolis, Minnesota.
Philip, J.R., 1993. Approximate Analysis of Falling-Head LinedBorehole Permeameter. Water Resources Research 29:3763-3768.
Regalado, C.M. and R. Munoz-Carpena, 2004. Estimating the Satu-rated Hydraulic Conductivity in a Spatially Variable Soil WithDifferent Permeameters: A Stochastic Kozeny-Carman Relation.Soil and Tillage Research 77(2):189-202.
Richardson, J.L. and M.J. Vepraskas, 2001. Wetland Soils: Genesis,Hydrology, Landscapes, and Classification. Lewis Publishers,Boca Raton, Florida.
Shaw, D. and R. Schmidt, 2003. Plants for Stormwater Design:Species Selection for the Upper Midwest. Minnesota PollutionControl Agency, St. Paul, Minnesota.
Thien, S.J., 1979. A Flow Diagram for Teaching Texture-by-FeelAnalysis. Journal of Agronomic Education 8:54-55.
Tsegaye, T. and Robert L. Hill, 1998. Intensive Tillage Effects onSpatial Variability of Soil Physical Properties. Soil Science163(2):143-154.
USEPA (U.S. Environmental Protection Agency), 2002. UrbanStormwater BMP Performance Monitoring, 821-B-02-001, Wash-ington D.C. http://epa.gov/waterscience/stormwater/monitor.htm,accessed September 2007.
USEPA (U.S. Environmental Protection Agency), 2005. NationalManagement Measures to Control Nonpoint Source PollutionFrom Urban Areas, 841-B-05-004, Washington, D.C. http://www.epa.gov/owow/nps/urbanmm/index.html#08, accessed Sep-tember 2007.
USEPA (U.S. Environmental Protection Agency), 2007. Phases ofthe NPDES Stormwater Program. http://cfpub.epa.gov/npdes/stormwater/swphases.cfm, accessed September 2007.
Vauclin, M., D.E. Elrick, J.L. Thony, G. Vachaud, P. Revol, and P.Ruelle, 1994. Hydraulic Conductivity Measurements of the Spa-tial Variability of a Loamy Soil. Soil Technology 7(3):181-195.
Wang, L., J. Lyons, P. Kanehl, and R. Bannerman, 2001. Impactsof Urbanization on Stream Habitat and Fish Across MultipleSpatial Scales. Environmental Management 28(2):255-266.
Weiss, P.T., A.J. Erickson, and J.S. Gulliver, 2007. Cost and Pollu-tant Removal of Storm-Water Treatment Practices. Journal ofWater Resources Planning and Management 133(3):218-229.
PERFORMANCE ASSESSMENT OF RAIN GARDENS
JOURNAL OF THE AMERICAN WATER RESOURCES ASSOCIATION 1031 JAWRA
Related Documents