BRÄNSLEBASERAD EL- OCH VÄRMEPRODUKTION PERFORMANCE AND POTENTIAL OF SMALL-SCALE ORC SYSTEMS RAPPORT 2020:717

Welcome message from author
This document is posted to help you gain knowledge. Please leave a comment to let me know what you think about it! Share it to your friends and learn new things together.
Transcript
BRÄNSLEBASERAD EL- OCH VÄRMEPRODUKTION
PERFORMANCE AND POTENTIAL OF SMALL-SCALE ORC SYSTEMSRAPPORT 2020:717

Performance and Potential of Small-Scale ORC Systems
JOAKIM WREN, HOSSEIN NADALI NAJAFABADI, MARIA JOHANSSON, JOAR HJÄRTSJÖ THYRESSON, MÅNS LINDE AND IGOR CRUZ
ISBN 978-91-7673-717-0 | © Energiforsk December 2020
Energiforsk AB | Phone: 08-677 25 30 | E-mail: [email protected] | www.energiforsk.se

PERFORMANCE AND POTENTIAL OF SMALL-SCALE ORC SYSTEMS
3
Förord
Denna rapport är slutrapportering av projekt S44911 Resurseffektiv biobränslebaserad elproduktion med ORC-teknik i värme- och avloppsverk (Energimyndighetens projektnummer P 44911).
Projektet har finansierats av Energimyndigheten och av de organisationer som utgjort industriparterna i SEBRA (samverkansprogrammet för bränslebaserad el- och värmeproduktion).
SEBRA-programmets övergripande mål har varit att bidra till långsiktig utveckling av effektiva miljövänliga energisystemlösningar. Syftet är att medverka till framtagning av flexibla bränslebaserade anläggningar som kan anpassas till framtida behov och krav. Programmet fyra teknikområden: anläggnings- och förbränningsteknik, processtyrning, material- och kemiteknik samt systemteknik. Detta projekt hör till teknikområde Systemteknik.
Organic Rankine Cycle (ORC) är en teknik för småskalig värmebaserad el-produktion. Projektets huvudsyfte har varit att redovisa hur ORC-teknik kan och bör integreras för att bidra till ett effektivt utnyttjande av energiresurser i hela energisystemet.
Projektet har genomförts av Againity och Linköpings universitet med Joakim Wren som huvudprojektledare. Nader Padban, Vattenfall och Carl-Johan Löthgren, Sweco har varit med i projektets referensgrupp och gett värdefulla inspel till arbetet.
Stockholm december 2020
Helena Sellerholm Områdesansvarig Termisk energiomvandling, Energiforsk AB
These are the results and conclusions of a project, which is part of a research programme run by Energiforsk. The author/authors are responsible for the content.
PERFORMANCE AND POTENTIAL OF SMALL-SCALE ORC SYSTEMS
4
Sammanfattning
Inledning
Sverige har infört lagar som syftar till att fasa ut icke förnyelsebar produktion av elektricitet till år 2040, och till 2030 ska energieffektiviteten ha ökat med 50 % jämfört med nivåerna 2005 (Regeringskansliet, 2018). Beträffande växthusgaser är målet att inga nettoutsläpp ska ske efter 2045 (Energimyndigheten, 2018). Energisektorn spelar en avgörande roll för att dessa mål ska uppnås, både för att utveckla och expandera lösningar baserade på förnyelsebar energi och för att öka effektiviteten i energianvändningen.
I Sverige liksom i många andra länder sker elproduktionen i centraliserade storskaliga anläggningar (Altmann, 2010). Flertalet av dessa producerar i Sverige och norra Europa även värme till fjärrvärmenät. Dessutom finns en mängd mindre fjärrvärmeverk och andra lokala värmeproducenter utan elproduktion. På senare år har forskare, ingenjörer och entreprenörer skalat ner tekniken för värmebaserad elproduktion så att även småskalig elproduktion (50-1000 kW el-effekt) är möjlig.
I Sverige finns många småskaliga (< 10 MW värmeeffekt) biobränsleeldade fjärrvärmeverk som tillsammans producerar 9 TWh värme per år (Goop, 2012). Att uppgradera dessa till att även producera el (combined heat and power, CHP) kan generera mer än 1,5 % av Sveriges totala elbehov (Kjellström, 2012), och samtidigt öka energieffektiviteten och andelen förnyelsebar baskraft. Den distribuerade elproduktionen minskar belastning på, och förluster i, elnätet.
Den dominerande tekniken för småskalig värmebaserad elproduktion är den organiska Rankine-cykeln (ORC) vars kommersiella betydelse har ökat avsevärt de senaste decennierna, (Chen et al., 2010; Landelle, 2017). I princip har ORC stora likheter med en vanlig ångkraftcykel, men med skillnaden att arbetsmediet inte är vatten utan ett organiskt ämne som förångas vid förhållandevis låg temperatur och därmed lämpar sig väl för att omvandla värme vid låg temperatur till el. Jämfört med vanlig ångkraftteknik finns fördelar som lägre komplexitet samt låg investerings- och underhållskostnad (Chen et al., 2010).
Även om ORC-tekniken har genomgått omfattande studier (Macchi, 2017) är det endast ett fåtal som studerar småskaliga ORC-system i kommersiella och industriella installationer. I ett europeiskt perspektiv har ORC-tekniken bedömts ha stor potential (Pili et al. (2017). Samtidigt understryks behovet av riktiga industriella system för att analysera och verifiera ekonomisk och teknisk prestanda samt miljö- och klimatavtryck under olika förhållanden såsom tillgänglig värmeeffekt och temperatur på värmekällan. Både klimatpåverkan och ekonomisk prestanda beror på produktion och prissättning av marginalel (Greer, 2012).
Syfte och mål
Syftet med rapporten är att studera elproduktion baserad på bio-bränsle från småskaliga ORC-system (< 50 kWe). Två faktiska installationer i Sverige ligger till grund för studien, dels vid ett avloppsreningsverk i Norrköping och dels i ett fjärrvärmeverk i Ronneby/Bräkne-Hoby. Systemen används för att bedöma

PERFORMANCE AND POTENTIAL OF SMALL-SCALE ORC SYSTEMS
5
teknisk, ekonomisk och klimatmässig potential under olika driftförhållanden. Med utgångspunkt från dessa installationer studeras även potentialen för implementering av ORC-system i en vidare kontext med Sverige, England och Brasilien som exempel.
Studien är indelad i tre delar:
1. Teknisk prestanda för ORC-systemen i befintliga installationer 2. Ekonomisk och klimatmässig prestanda för småskalig ORC-teknik i Sverige 3. Framtida potential för hållbar elproduktion via ORC-system
För del 1 är målet att klargöra systemens prestanda i form av elektrisk verkningsgrad (α-värde) och total verkningsgrad, samt hur dessa påverkas av exempelvis tillgänglig värmeeffekt och temperaturer på systemets varma sida (förångaren) respektive kalla sidan (kondensorn).
Målet med del 2 är att analysera ekonomisk prestanda och klimatprestanda för småskaliga ORC-system i Sverige med installationerna i Norrköping och Ronneby som exempel. Inverkan av olika lastfall och säsongsvariationer inkluderas.
Del 3 handlar om ORC-system i en vidare kontext, och inkluderar hur prestanda i termer av ekonomi och klimat påverkas av energimarknadsaspekter. Sverige, England och Brasilien utgör exempelmarknader för att klargöra hur marginalelproduktion och dess utsläpp av CO2, bränslepriser, skatter och övriga incitament påverkar tillämpning av ORC-system.
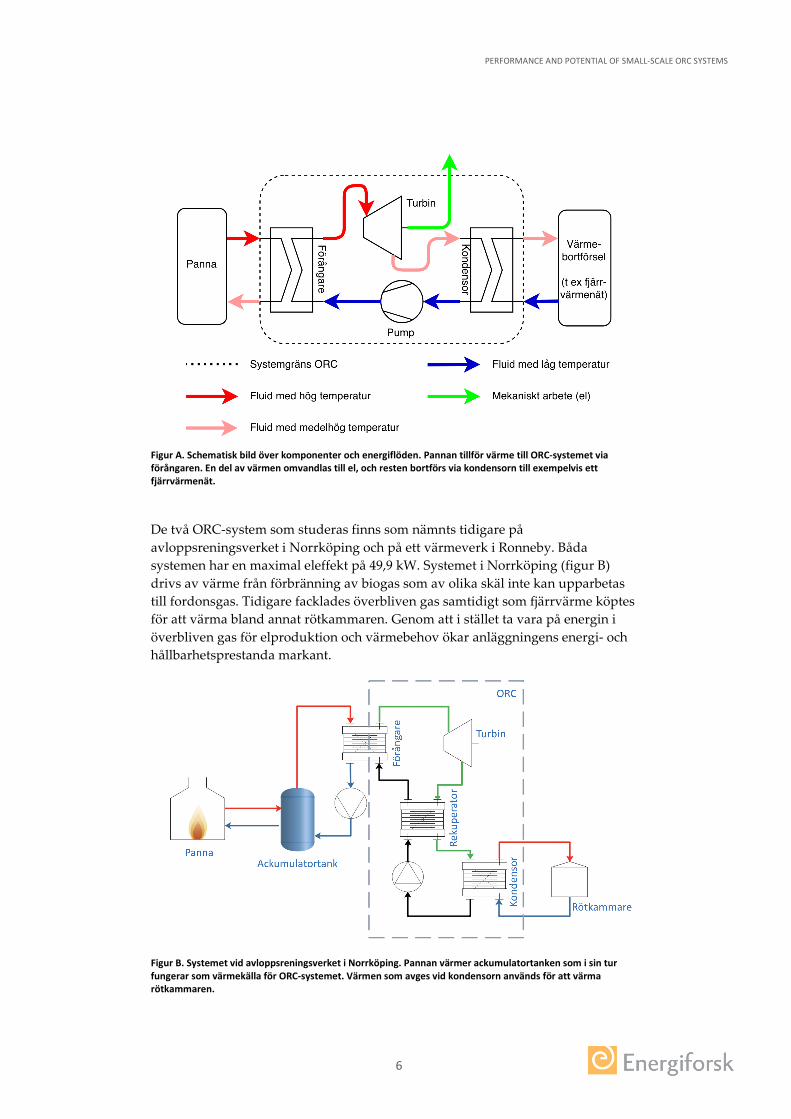
ORC-system och studerade installationer Den organiska Rankine-cykeln (ORC) är en variant av den vanliga Rankine-cykeln (ångkraftcykeln), med den huvudsakliga skillnaden att ORC-system använder ett organiskt arbetsmedium i stället för vatten. Systemets principiella funktion beskrivs av figur A. Värme tillförs systemet vid hög temperatur och förångar arbetsmediet vid högt tryck. Ångan driver en turbin kopplad till en generator som producerar elektricitet. Ånga vid lågt tryck lämnar turbinen och kyls så att den kondenserar, varvid värme avges till exempelvis returflödet i fjärrvärmenätet, innan pumpen återigen höjer trycket.
ORC-system är väl lämpade för att omvandla värme vid låg till medelhög temperatur (80-400 °C) till el. En viktig fördel är att ORC kan integreras inom en stor mängd system och driftförhållanden genom att välja ett lämpligt arbetsmedium anpassat till systemtemperaturer och värmeeffekt. Jämfört med vanliga Rankine-cykler karaktäriseras ORC-system av låga systemtryck och volymflöden vilket möjliggör mindre komplexa och billigare komponenter såsom värmeväxlare, ventiler och turbin (Macchi, 2017). ORC-teknik för småskalig elproduktion i värmeverk diskuteras i Goldschmidt (2007).
PERFORMANCE AND POTENTIAL OF SMALL-SCALE ORC SYSTEMS
6
Figur A. Schematisk bild över komponenter och energiflöden. Pannan tillför värme till ORC-systemet via förångaren. En del av värmen omvandlas till el, och resten bortförs via kondensorn till exempelvis ett fjärrvärmenät.
De två ORC-system som studeras finns som nämnts tidigare på avloppsreningsverket i Norrköping och på ett värmeverk i Ronneby. Båda systemen har en maximal eleffekt på 49,9 kW. Systemet i Norrköping (figur B) drivs av värme från förbränning av biogas som av olika skäl inte kan upparbetas till fordonsgas. Tidigare facklades överbliven gas samtidigt som fjärrvärme köptes för att värma bland annat rötkammaren. Genom att i stället ta vara på energin i överbliven gas för elproduktion och värmebehov ökar anläggningens energi- och hållbarhetsprestanda markant.
Figur B. Systemet vid avloppsreningsverket i Norrköping. Pannan värmer ackumulatortanken som i sin tur fungerar som värmekälla för ORC-systemet. Värmen som avges vid kondensorn används för att värma rötkammaren.
PERFORMANCE AND POTENTIAL OF SMALL-SCALE ORC SYSTEMS
7
Systemet innehåller en ackumulatortank som förbättrar prestanda vid intermittent drift. Restvärmen från kondensorn används för att värma bioreaktorn som bör hålla en temperatur på 35 - 37 °C. ORC-systemet innefattar en rekuperator som förvärmer vätskan efter pumpen.
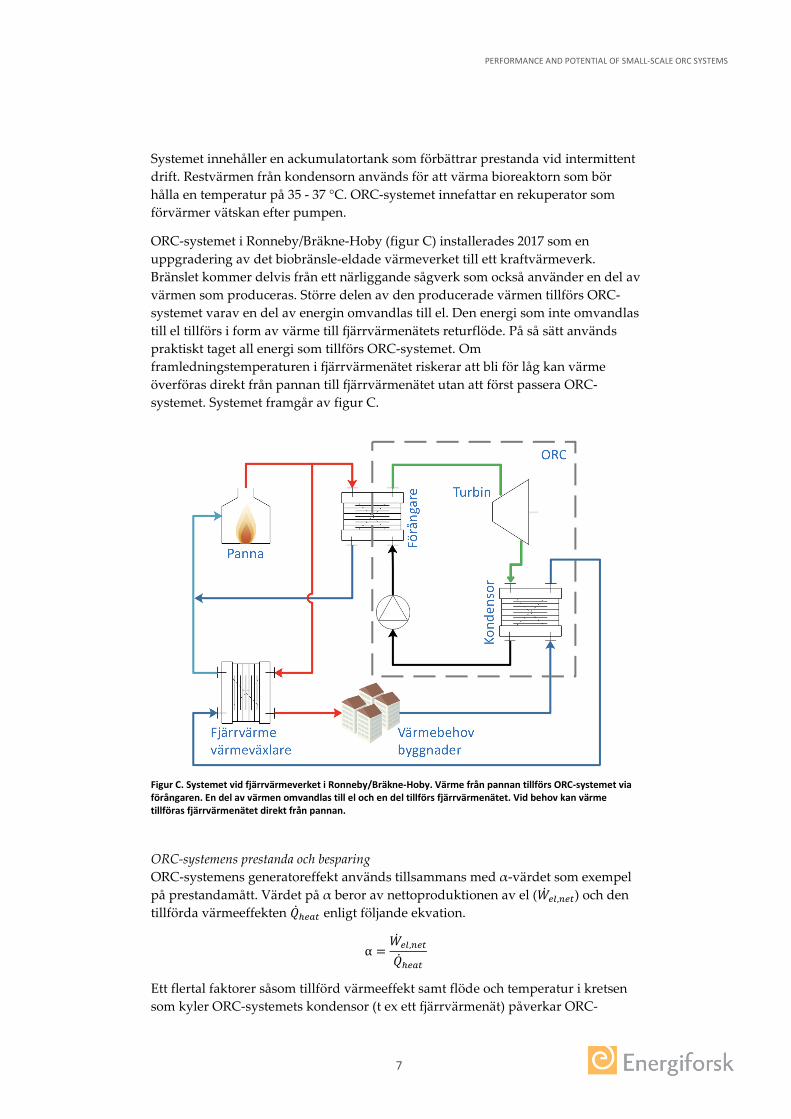
ORC-systemet i Ronneby/Bräkne-Hoby (figur C) installerades 2017 som en uppgradering av det biobränsle-eldade värmeverket till ett kraftvärmeverk. Bränslet kommer delvis från ett närliggande sågverk som också använder en del av värmen som produceras. Större delen av den producerade värmen tillförs ORC-systemet varav en del av energin omvandlas till el. Den energi som inte omvandlas till el tillförs i form av värme till fjärrvärmenätets returflöde. På så sätt används praktiskt taget all energi som tillförs ORC-systemet. Om framledningstemperaturen i fjärrvärmenätet riskerar att bli för låg kan värme överföras direkt från pannan till fjärrvärmenätet utan att först passera ORC-systemet. Systemet framgår av figur C.
Figur C. Systemet vid fjärrvärmeverket i Ronneby/Bräkne-Hoby. Värme från pannan tillförs ORC-systemet via förångaren. En del av värmen omvandlas till el och en del tillförs fjärrvärmenätet. Vid behov kan värme tillföras fjärrvärmenätet direkt från pannan.
ORC-systemens prestanda och besparing ORC-systemens generatoreffekt används tillsammans med α-värdet som exempel på prestandamått. Värdet på α beror av nettoproduktionen av el (��𝑊𝑒𝑒𝑒𝑒,𝑛𝑛𝑒𝑒𝑛𝑛) och den tillförda värmeeffekten ��𝑄ℎ𝑒𝑒𝑒𝑒𝑛𝑛 enligt följande ekvation.
α =��𝑊𝑒𝑒𝑒𝑒,𝑛𝑛𝑒𝑒𝑛𝑛
��𝑄ℎ𝑒𝑒𝑒𝑒𝑛𝑛
Ett flertal faktorer såsom tillförd värmeeffekt samt flöde och temperatur i kretsen som kyler ORC-systemets kondensor (t ex ett fjärrvärmenät) påverkar ORC-
PERFORMANCE AND POTENTIAL OF SMALL-SCALE ORC SYSTEMS
8
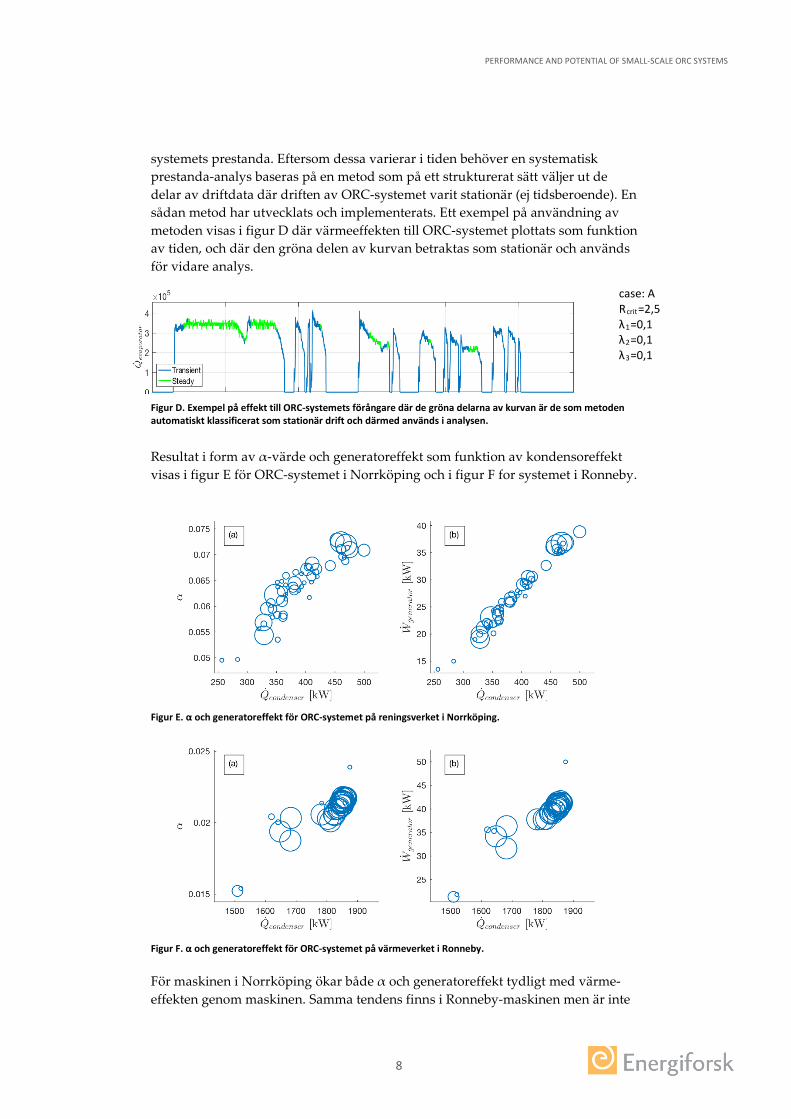
systemets prestanda. Eftersom dessa varierar i tiden behöver en systematisk prestanda-analys baseras på en metod som på ett strukturerat sätt väljer ut de delar av driftdata där driften av ORC-systemet varit stationär (ej tidsberoende). En sådan metod har utvecklats och implementerats. Ett exempel på användning av metoden visas i figur D där värmeeffekten till ORC-systemet plottats som funktion av tiden, och där den gröna delen av kurvan betraktas som stationär och används för vidare analys.
case: A Rcrit=2,5
λ1=0,1 λ2=0,1 λ3=0,1
Figur D. Exempel på effekt till ORC-systemets förångare där de gröna delarna av kurvan är de som metoden automatiskt klassificerat som stationär drift och därmed används i analysen.
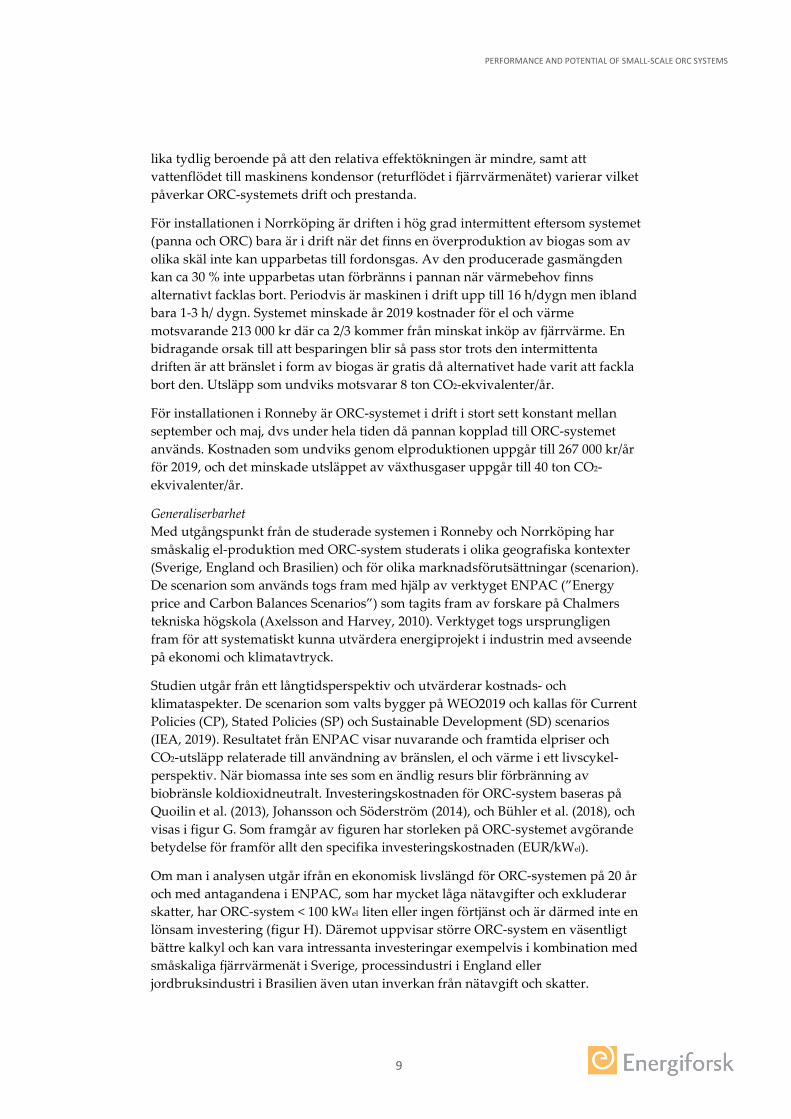
Resultat i form av α-värde och generatoreffekt som funktion av kondensoreffekt visas i figur E för ORC-systemet i Norrköping och i figur F for systemet i Ronneby.
Figur E. α och generatoreffekt för ORC-systemet på reningsverket i Norrköping.
Figur F. α och generatoreffekt för ORC-systemet på värmeverket i Ronneby.
För maskinen i Norrköping ökar både α och generatoreffekt tydligt med värme-effekten genom maskinen. Samma tendens finns i Ronneby-maskinen men är inte
PERFORMANCE AND POTENTIAL OF SMALL-SCALE ORC SYSTEMS
9
lika tydlig beroende på att den relativa effektökningen är mindre, samt att vattenflödet till maskinens kondensor (returflödet i fjärrvärmenätet) varierar vilket påverkar ORC-systemets drift och prestanda.
För installationen i Norrköping är driften i hög grad intermittent eftersom systemet (panna och ORC) bara är i drift när det finns en överproduktion av biogas som av olika skäl inte kan upparbetas till fordonsgas. Av den producerade gasmängden kan ca 30 % inte upparbetas utan förbränns i pannan när värmebehov finns alternativt facklas bort. Periodvis är maskinen i drift upp till 16 h/dygn men ibland bara 1-3 h/ dygn. Systemet minskade år 2019 kostnader för el och värme motsvarande 213 000 kr där ca 2/3 kommer från minskat inköp av fjärrvärme. En bidragande orsak till att besparingen blir så pass stor trots den intermittenta driften är att bränslet i form av biogas är gratis då alternativet hade varit att fackla bort den. Utsläpp som undviks motsvarar 8 ton CO2-ekvivalenter/år.
För installationen i Ronneby är ORC-systemet i drift i stort sett konstant mellan september och maj, dvs under hela tiden då pannan kopplad till ORC-systemet används. Kostnaden som undviks genom elproduktionen uppgår till 267 000 kr/år för 2019, och det minskade utsläppet av växthusgaser uppgår till 40 ton CO2-ekvivalenter/år.
Generaliserbarhet Med utgångspunkt från de studerade systemen i Ronneby och Norrköping har småskalig el-produktion med ORC-system studerats i olika geografiska kontexter (Sverige, England och Brasilien) och för olika marknadsförutsättningar (scenarion). De scenarion som används togs fram med hjälp av verktyget ENPAC (”Energy price and Carbon Balances Scenarios”) som tagits fram av forskare på Chalmers tekniska högskola (Axelsson and Harvey, 2010). Verktyget togs ursprungligen fram för att systematiskt kunna utvärdera energiprojekt i industrin med avseende på ekonomi och klimatavtryck.
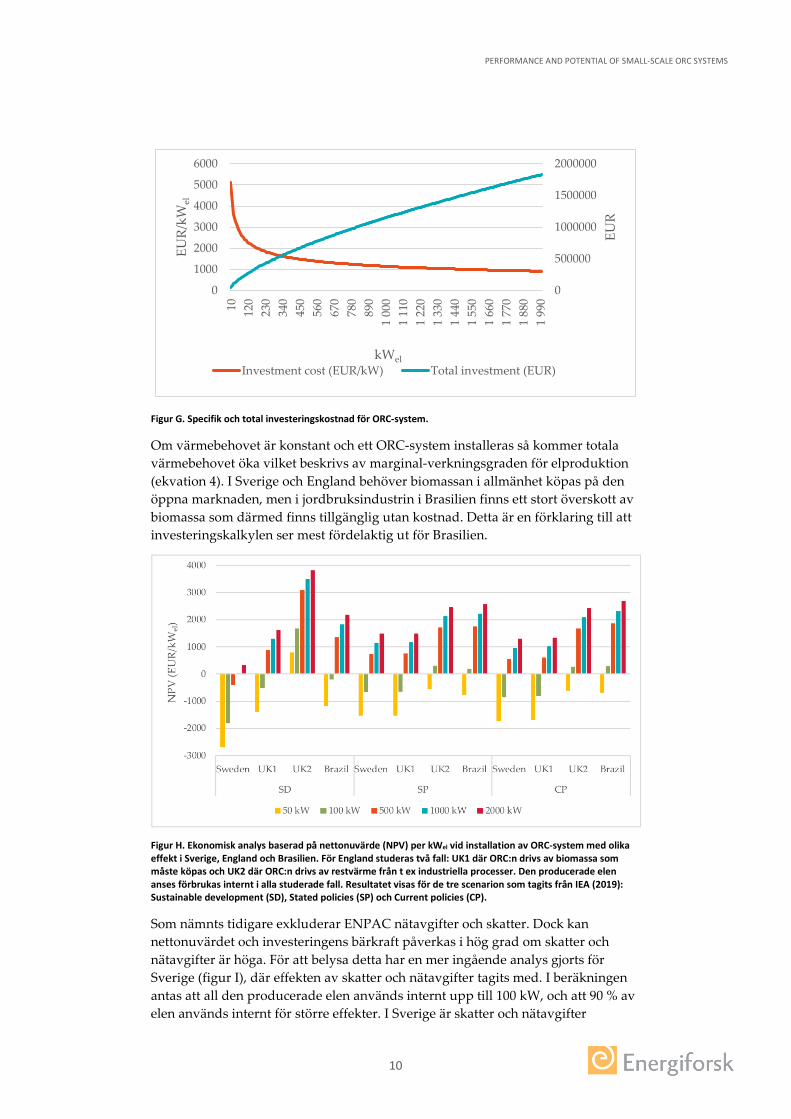
Studien utgår från ett långtidsperspektiv och utvärderar kostnads- och klimataspekter. De scenarion som valts bygger på WEO2019 och kallas för Current Policies (CP), Stated Policies (SP) och Sustainable Development (SD) scenarios (IEA, 2019). Resultatet från ENPAC visar nuvarande och framtida elpriser och CO2-utsläpp relaterade till användning av bränslen, el och värme i ett livscykel-perspektiv. När biomassa inte ses som en ändlig resurs blir förbränning av biobränsle koldioxidneutralt. Investeringskostnaden för ORC-system baseras på Quoilin et al. (2013), Johansson och Söderström (2014), och Bühler et al. (2018), och visas i figur G. Som framgår av figuren har storleken på ORC-systemet avgörande betydelse för framför allt den specifika investeringskostnaden (EUR/kWel).
Om man i analysen utgår ifrån en ekonomisk livslängd för ORC-systemen på 20 år och med antagandena i ENPAC, som har mycket låga nätavgifter och exkluderar skatter, har ORC-system < 100 kWel liten eller ingen förtjänst och är därmed inte en lönsam investering (figur H). Däremot uppvisar större ORC-system en väsentligt bättre kalkyl och kan vara intressanta investeringar exempelvis i kombination med småskaliga fjärrvärmenät i Sverige, processindustri i England eller jordbruksindustri i Brasilien även utan inverkan från nätavgift och skatter.
PERFORMANCE AND POTENTIAL OF SMALL-SCALE ORC SYSTEMS
10
Figur G. Specifik och total investeringskostnad för ORC-system.
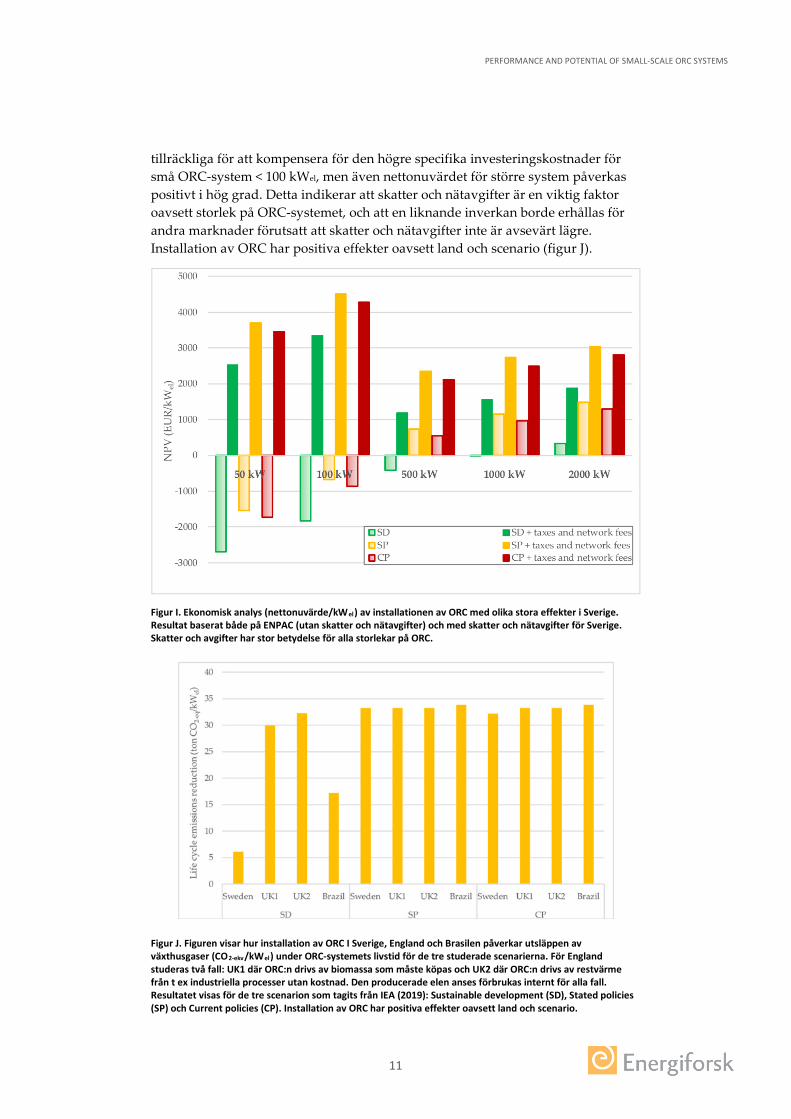
Om värmebehovet är konstant och ett ORC-system installeras så kommer totala värmebehovet öka vilket beskrivs av marginal-verkningsgraden för elproduktion (ekvation 4). I Sverige och England behöver biomassan i allmänhet köpas på den öppna marknaden, men i jordbruksindustrin i Brasilien finns ett stort överskott av biomassa som därmed finns tillgänglig utan kostnad. Detta är en förklaring till att investeringskalkylen ser mest fördelaktig ut för Brasilien.
Figur H. Ekonomisk analys baserad på nettonuvärde (NPV) per kWel vid installation av ORC-system med olika effekt i Sverige, England och Brasilien. För England studeras två fall: UK1 där ORC:n drivs av biomassa som måste köpas och UK2 där ORC:n drivs av restvärme från t ex industriella processer. Den producerade elen anses förbrukas internt i alla studerade fall. Resultatet visas för de tre scenarion som tagits från IEA (2019): Sustainable development (SD), Stated policies (SP) och Current policies (CP).
Som nämnts tidigare exkluderar ENPAC nätavgifter och skatter. Dock kan nettonuvärdet och investeringens bärkraft påverkas i hög grad om skatter och nätavgifter är höga. För att belysa detta har en mer ingående analys gjorts för Sverige (figur I), där effekten av skatter och nätavgifter tagits med. I beräkningen antas att all den producerade elen används internt upp till 100 kW, och att 90 % av elen används internt för större effekter. I Sverige är skatter och nätavgifter
0
500000
1000000
1500000
2000000
0
1000
2000
3000
4000
5000
6000
10 120
230
340
450
560
670
780
890
1 00
01
110
1 22
01
330
1 44
01
550
1 66
01
770
1 88
01
990
EUR
EUR/
kWel
kWelInvestment cost (EUR/kW) Total investment (EUR)
PERFORMANCE AND POTENTIAL OF SMALL-SCALE ORC SYSTEMS
11
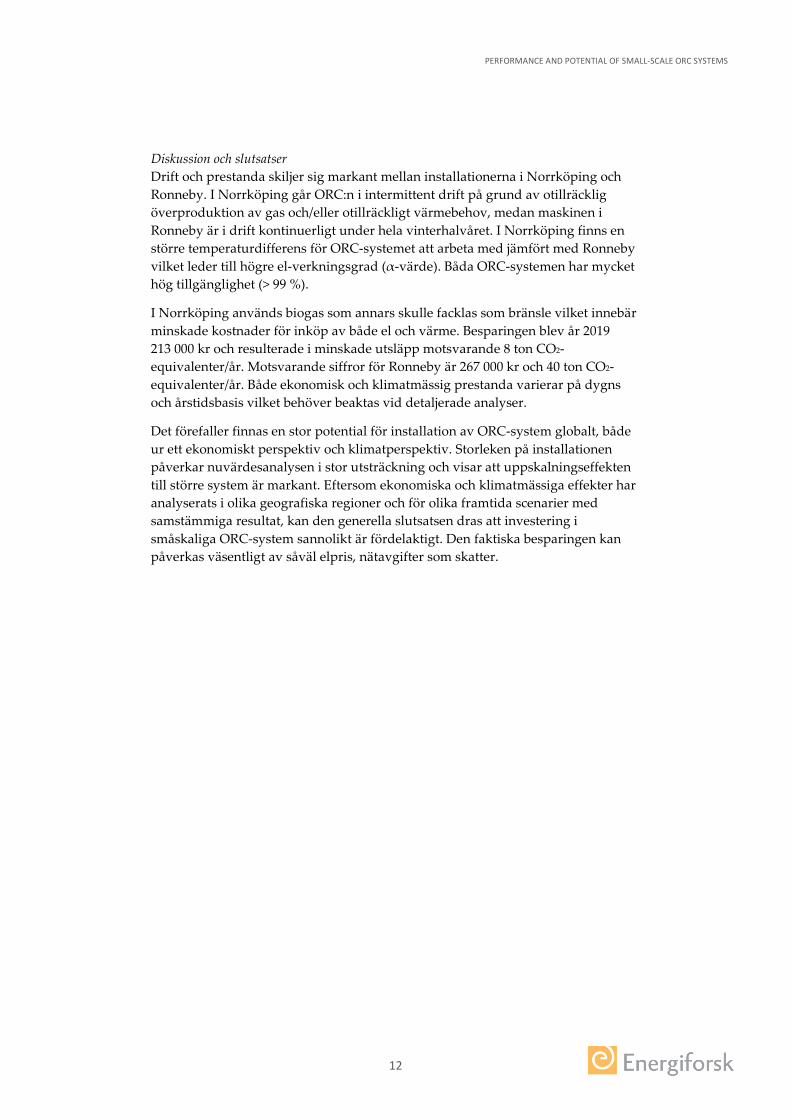
tillräckliga för att kompensera för den högre specifika investeringskostnader för små ORC-system < 100 kWel, men även nettonuvärdet för större system påverkas positivt i hög grad. Detta indikerar att skatter och nätavgifter är en viktig faktor oavsett storlek på ORC-systemet, och att en liknande inverkan borde erhållas för andra marknader förutsatt att skatter och nätavgifter inte är avsevärt lägre. Installation av ORC har positiva effekter oavsett land och scenario (figur J).
Figur I. Ekonomisk analys (nettonuvärde/kWel) av installationen av ORC med olika stora effekter i Sverige. Resultat baserat både på ENPAC (utan skatter och nätavgifter) och med skatter och nätavgifter för Sverige. Skatter och avgifter har stor betydelse för alla storlekar på ORC.
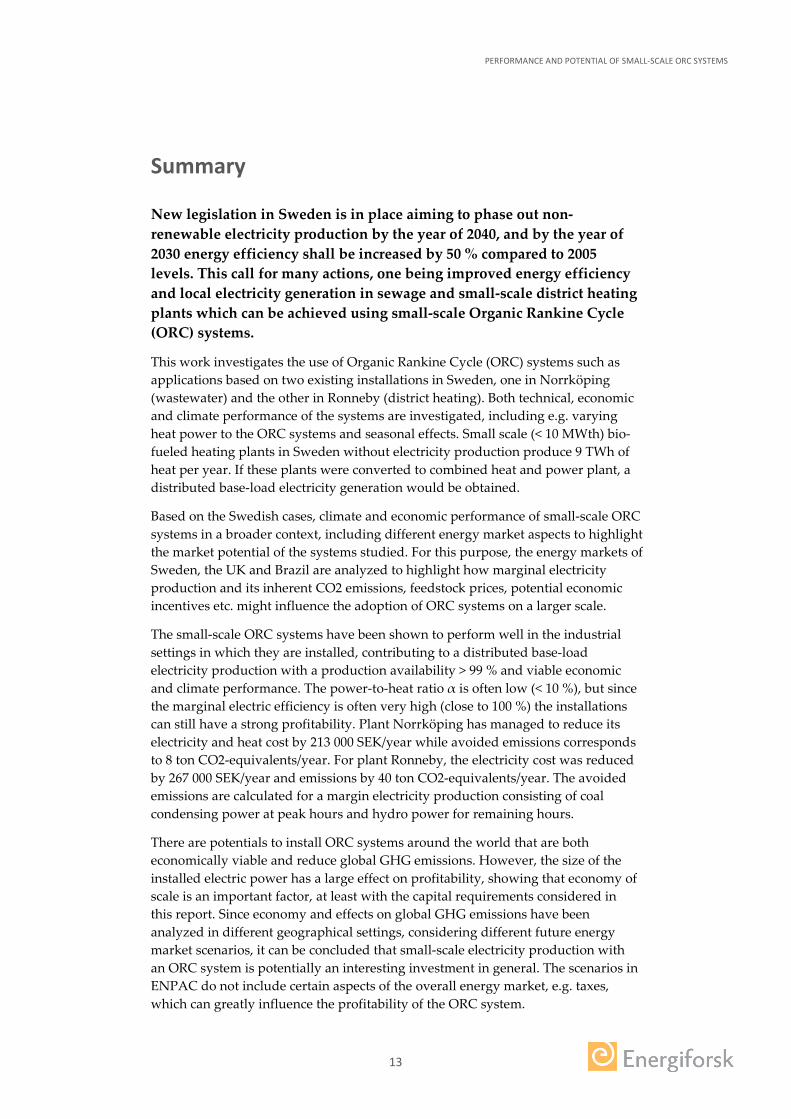
Figur J. Figuren visar hur installation av ORC I Sverige, England och Brasilen påverkar utsläppen av växthusgaser (CO2-ekv/kWel) under ORC-systemets livstid för de tre studerade scenarierna. För England studeras två fall: UK1 där ORC:n drivs av biomassa som måste köpas och UK2 där ORC:n drivs av restvärme från t ex industriella processer utan kostnad. Den producerade elen anses förbrukas internt för alla fall. Resultatet visas för de tre scenarion som tagits från IEA (2019): Sustainable development (SD), Stated policies (SP) och Current policies (CP). Installation av ORC har positiva effekter oavsett land och scenario.
PERFORMANCE AND POTENTIAL OF SMALL-SCALE ORC SYSTEMS
12
Diskussion och slutsatser Drift och prestanda skiljer sig markant mellan installationerna i Norrköping och Ronneby. I Norrköping går ORC:n i intermittent drift på grund av otillräcklig överproduktion av gas och/eller otillräckligt värmebehov, medan maskinen i Ronneby är i drift kontinuerligt under hela vinterhalvåret. I Norrköping finns en större temperaturdifferens för ORC-systemet att arbeta med jämfört med Ronneby vilket leder till högre el-verkningsgrad (α-värde). Båda ORC-systemen har mycket hög tillgänglighet (> 99 %).
I Norrköping används biogas som annars skulle facklas som bränsle vilket innebär minskade kostnader för inköp av både el och värme. Besparingen blev år 2019 213 000 kr och resulterade i minskade utsläpp motsvarande 8 ton CO2-equivalenter/år. Motsvarande siffror för Ronneby är 267 000 kr och 40 ton CO2-equivalenter/år. Både ekonomisk och klimatmässig prestanda varierar på dygns och årstidsbasis vilket behöver beaktas vid detaljerade analyser.
Det förefaller finnas en stor potential för installation av ORC-system globalt, både ur ett ekonomiskt perspektiv och klimatperspektiv. Storleken på installationen påverkar nuvärdesanalysen i stor utsträckning och visar att uppskalningseffekten till större system är markant. Eftersom ekonomiska och klimatmässiga effekter har analyserats i olika geografiska regioner och för olika framtida scenarier med samstämmiga resultat, kan den generella slutsatsen dras att investering i småskaliga ORC-system sannolikt är fördelaktigt. Den faktiska besparingen kan påverkas väsentligt av såväl elpris, nätavgifter som skatter.
PERFORMANCE AND POTENTIAL OF SMALL-SCALE ORC SYSTEMS
13
Summary
New legislation in Sweden is in place aiming to phase out non-renewable electricity production by the year of 2040, and by the year of 2030 energy efficiency shall be increased by 50 % compared to 2005 levels. This call for many actions, one being improved energy efficiency and local electricity generation in sewage and small-scale district heating plants which can be achieved using small-scale Organic Rankine Cycle (ORC) systems.
This work investigates the use of Organic Rankine Cycle (ORC) systems such as applications based on two existing installations in Sweden, one in Norrköping (wastewater) and the other in Ronneby (district heating). Both technical, economic and climate performance of the systems are investigated, including e.g. varying heat power to the ORC systems and seasonal effects. Small scale (< 10 MWth) bio-fueled heating plants in Sweden without electricity production produce 9 TWh of heat per year. If these plants were converted to combined heat and power plant, a distributed base-load electricity generation would be obtained.
Based on the Swedish cases, climate and economic performance of small-scale ORC systems in a broader context, including different energy market aspects to highlight the market potential of the systems studied. For this purpose, the energy markets of Sweden, the UK and Brazil are analyzed to highlight how marginal electricity production and its inherent CO2 emissions, feedstock prices, potential economic incentives etc. might influence the adoption of ORC systems on a larger scale.
The small-scale ORC systems have been shown to perform well in the industrial settings in which they are installed, contributing to a distributed base-load electricity production with a production availability > 99 % and viable economic and climate performance. The power-to-heat ratio α is often low (< 10 %), but since the marginal electric efficiency is often very high (close to 100 %) the installations can still have a strong profitability. Plant Norrköping has managed to reduce its electricity and heat cost by 213 000 SEK/year while avoided emissions corresponds to 8 ton CO2-equivalents/year. For plant Ronneby, the electricity cost was reduced by 267 000 SEK/year and emissions by 40 ton CO2-equivalents/year. The avoided emissions are calculated for a margin electricity production consisting of coal condensing power at peak hours and hydro power for remaining hours.
There are potentials to install ORC systems around the world that are both economically viable and reduce global GHG emissions. However, the size of the installed electric power has a large effect on profitability, showing that economy of scale is an important factor, at least with the capital requirements considered in this report. Since economy and effects on global GHG emissions have been analyzed in different geographical settings, considering different future energy market scenarios, it can be concluded that small-scale electricity production with an ORC system is potentially an interesting investment in general. The scenarios in ENPAC do not include certain aspects of the overall energy market, e.g. taxes, which can greatly influence the profitability of the ORC system.
PERFORMANCE AND POTENTIAL OF SMALL-SCALE ORC SYSTEMS
14
Nomenclature
𝜂𝜂𝑛𝑛𝑡𝑡𝑛𝑛 Total efficiency -
𝜂𝜂𝑖𝑖𝑖𝑖𝑒𝑒𝑒𝑒𝑒𝑒 Ideal (thermodynamic) efficiency -
𝜂𝜂𝑟𝑟𝑒𝑒𝑒𝑒𝑒𝑒 Real efficiency -
𝜂𝜂𝑒𝑒𝑒𝑒,𝑚𝑚𝑒𝑒𝑟𝑟𝑚𝑚𝑖𝑖𝑛𝑛𝑒𝑒𝑒𝑒 Marginal electric efficiency -
��𝑊𝑛𝑛 Turbine, electric output W
��𝑊𝑝𝑝 Pump, electric input W
��𝑄𝑒𝑒𝑒𝑒𝑒𝑒 Evaporator, heat input W
��𝑄𝑐𝑐 Condenser, heat output W
��𝑉𝑛𝑛 Volume flow m3/s
𝜌𝜌 Density kg/m3
𝑐𝑐𝑝𝑝 Specific heat capacity J/(KgK)
𝐸𝐸 Produced electricity Wh
𝐾𝐾 Avoided cost SEK
𝐶𝐶 Avoided emissions kg CO2 equivalents
CRF Capital recovery factor -
CFn Cash flow in year n EUR
NL Loan duration years
NE Equipment lifetime years
I Investment cost EUR
d Discount rate %
i Interest rate %
Acronyms
CBG Compressed biogas
CCS Carbon capture and storage
CHP Combined heat and power
DH District heating
GHG Greenhouse gas
GWP Global warming potential
LCC Lifecycle cost
NG Natural gas
NGCC Natural gas combined cycle power plant
NPV Net present value
ORC Organic Rankine Cycle

PERFORMANCE AND POTENTIAL OF SMALL-SCALE ORC SYSTEMS
15
Subscripts
el Electric power, electric energy
fuel Fuel input power, fuel input energy
heat Heat power, heat energy
HL High load
n Year n (in loan or equipment lifetime)
O Other times
PERFORMANCE AND POTENTIAL OF SMALL-SCALE ORC SYSTEMS
16
List of content
1 Introduction 18 1.1 Scope and aim 18 1.2 Limitations 19
1.2.1 Part 1 – The ORC system 19 1.2.2 Part 2 - Climate and economic performance 19 1.2.3 Part 3 – Potential of ORC systems 20
2 Performance of ORC systems 21 2.1 The organic rankine cycle 21 2.2 Studied systems 21
2.2.1 Plant Norrköping 22 2.2.2 Plant Ronneby 23
2.3 Method 23 2.3.1 Performance measures 23 2.3.2 Steady state detection 24 2.3.3 Effect of transient conditions 26
2.4 Results and discussion 27 2.4.1 Performance at steady state conditions: Plant Norrköping 27 2.4.2 Performance at steady state conditions: Plant Ronneby 31 2.4.3 General Impact of adding ORC to existing facility 33 2.4.4 Effect of transient conditions: Plant Norrköping 34
3 Climate and economic effects of small-scale ORC systems 36 3.1 A System Perspective on ORC electricity generation: Marginal electricity
and heat prices 36 3.2 Economic effects 38 3.3 Climate impact 40 3.4 Legal conditions 41 3.5 Calculation of economic and Climate effects for plants Ronneby and
Norrköping 42 3.6 Results 43
3.6.1 Plant Norrköping 44 3.6.2 Plant Ronneby 45
3.7 Discussion 46 3.7.1 Plant Norrköping 46 3.7.2 Plant Ronneby 47 3.7.3 Potential systems improvements 48
4 Generalizability and potential assessment 50 4.1 Cases studied 50
4.1.1 Sweden 50 4.1.2 The UK 51
PERFORMANCE AND POTENTIAL OF SMALL-SCALE ORC SYSTEMS
17
4.1.3 Brazil 51 4.2 System boundaries 52 4.3 Energy market scenarios using ENPAC 53 4.4 ORC performance calculations 58 4.5 Economic calculations 59
4.5.1 Investment costs 60 4.6 Results and discussion 61
4.6.1 Economy 61 4.6.2 Global CO2 emissions 64
5 General discussion and conclusions 66
References 68 Appendix A: Description of components 74
PERFORMANCE AND POTENTIAL OF SMALL-SCALE ORC SYSTEMS
18
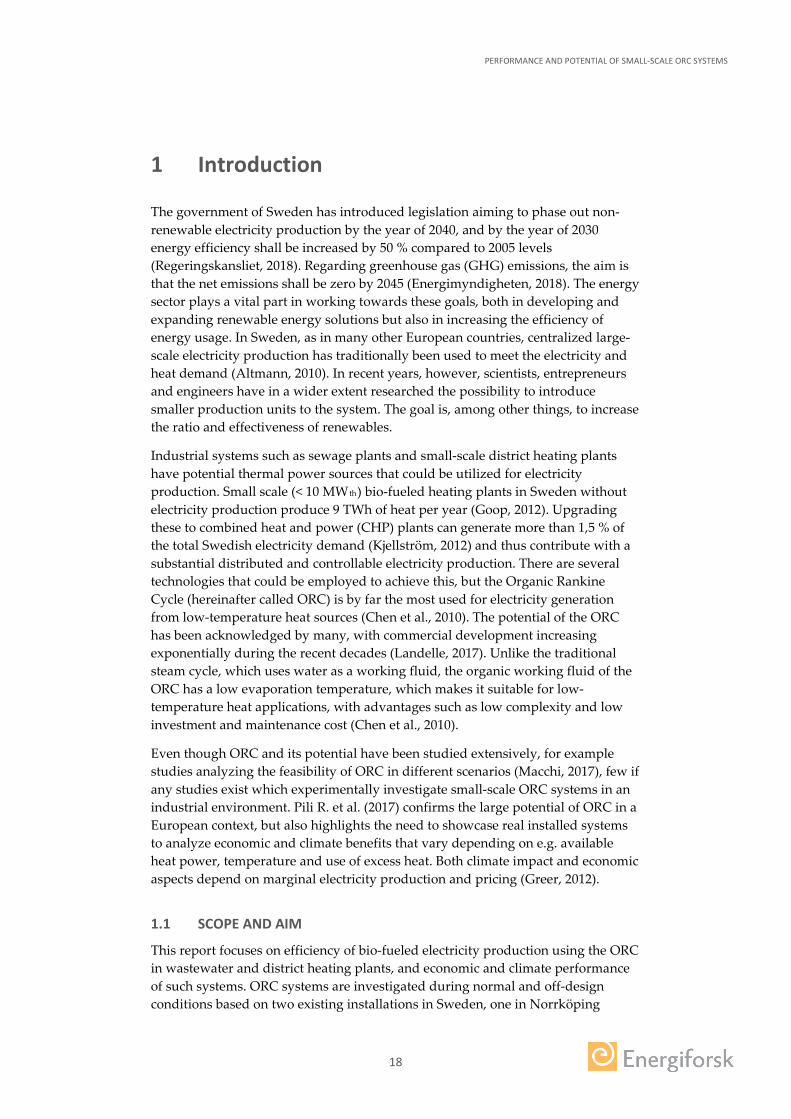
1 Introduction
The government of Sweden has introduced legislation aiming to phase out non-renewable electricity production by the year of 2040, and by the year of 2030 energy efficiency shall be increased by 50 % compared to 2005 levels (Regeringskansliet, 2018). Regarding greenhouse gas (GHG) emissions, the aim is that the net emissions shall be zero by 2045 (Energimyndigheten, 2018). The energy sector plays a vital part in working towards these goals, both in developing and expanding renewable energy solutions but also in increasing the efficiency of energy usage. In Sweden, as in many other European countries, centralized large-scale electricity production has traditionally been used to meet the electricity and heat demand (Altmann, 2010). In recent years, however, scientists, entrepreneurs and engineers have in a wider extent researched the possibility to introduce smaller production units to the system. The goal is, among other things, to increase the ratio and effectiveness of renewables.
Industrial systems such as sewage plants and small-scale district heating plants have potential thermal power sources that could be utilized for electricity production. Small scale (< 10 MWth) bio-fueled heating plants in Sweden without electricity production produce 9 TWh of heat per year (Goop, 2012). Upgrading these to combined heat and power (CHP) plants can generate more than 1,5 % of the total Swedish electricity demand (Kjellström, 2012) and thus contribute with a substantial distributed and controllable electricity production. There are several technologies that could be employed to achieve this, but the Organic Rankine Cycle (hereinafter called ORC) is by far the most used for electricity generation from low-temperature heat sources (Chen et al., 2010). The potential of the ORC has been acknowledged by many, with commercial development increasing exponentially during the recent decades (Landelle, 2017). Unlike the traditional steam cycle, which uses water as a working fluid, the organic working fluid of the ORC has a low evaporation temperature, which makes it suitable for low-temperature heat applications, with advantages such as low complexity and low investment and maintenance cost (Chen et al., 2010).
Even though ORC and its potential have been studied extensively, for example studies analyzing the feasibility of ORC in different scenarios (Macchi, 2017), few if any studies exist which experimentally investigate small-scale ORC systems in an industrial environment. Pili R. et al. (2017) confirms the large potential of ORC in a European context, but also highlights the need to showcase real installed systems to analyze economic and climate benefits that vary depending on e.g. available heat power, temperature and use of excess heat. Both climate impact and economic aspects depend on marginal electricity production and pricing (Greer, 2012).
1.1 SCOPE AND AIM
This report focuses on efficiency of bio-fueled electricity production using the ORC in wastewater and district heating plants, and economic and climate performance of such systems. ORC systems are investigated during normal and off-design conditions based on two existing installations in Sweden, one in Norrköping
PERFORMANCE AND POTENTIAL OF SMALL-SCALE ORC SYSTEMS
19
(wastewater) and the other in Ronneby (district heating). Based on results for the installations investigated, the potential for implementation of ORC systems in the future is analyzed in a wider context, taking Sweden, the UK and Brazil as example countries to investigate economic and climate effects of ORC systems.
The work is divided into three parts:
1. Performance of the ORC systems 2. Economic and climate performance of small-scale ORC systems in Sweden 3. Potential of ORC systems in future sustainable electricity production.
For part 1, the aim is to determine performance in terms of electric and overall efficiency of the ORC systems, and how these are affected by heat power and temperatures on the hot (evaporator) and cold (condenser) sides of the system.
The aim of part 2 is to investigate climate and economic performance of small-scale ORC systems in Sweden, using the plants in Norrköping and Ronneby as examples. The effect of a varying heat power to the ORC systems as well as seasonal effects are included.
The aim of part 3 is to analyze the climate and economic performance of small-scale ORC systems in a broader context, including different energy market aspects to highlight the market potential of the systems studied. For this purpose, the energy markets of Sweden, the UK and Brazil are analyzed to highlight how marginal electricity production and its inherent CO2 emissions, feedstock prices, potential economic incentives etc. might influence the adoption of ORC systems on a larger scale.
1.2 LIMITATIONS
The following limitations are used for the three project parts described above.
1.2.1 Part 1 – The ORC system
The operation of the ORC systems is subject to limitations and requirements on temperature of heat for the plants in which they are installed. The power and temperature rating of the respective boilers must be fulfilled. In the district heating plant in Ronneby, the boiler temperature is normally between 100 °C and 110 °C. Both the supply and return temperatures of the district heating network must be kept above a certain level, which depend on the heat load and vary during the day and with outside temperature. Typical supply and return temperatures are 80 °C and 48 °C, respectively. In the sewage plant in Norrköping, the boiler power is dependent on available biogas, and the setpoint boiler temperature can be changed between 100 and 126 °C. Heat rejected by the condenser is used to heat the digestion tank/bioreactor, which cannot be heated above 38 °C.
1.2.2 Part 2 - Climate and economic performance
Power generation from ORC systems results in avoided production of electricity elsewhere which can have several and diverse benefits. For example, if assuming that electricity produced in the ORC system avoids electricity produced from
PERFORMANCE AND POTENTIAL OF SMALL-SCALE ORC SYSTEMS
20
nuclear power plants, then mining for uranium and the amount of nuclear waste are reduced, as well as the effects of these activities on the environment. In this report however, the only environmental aspect that will be analyzed is climate impact in terms of CO2 emissions. The reason for this is that climate effects are regarded as one of the most urgent environmental challenges faced by todays’ society. Another reason is that electricity production is one of the major contributors to the increase in GHG emissions to the atmosphere.
It is assumed that the heat produced from the ORC at plant Norrköping can be sold or used as space heating regardless the time of the year. There is likely a lower demand for heat in the local district heating system during warmer months, but it was assumed that the heat can be used for other purposes at the facility.
1.2.3 Part 3 – Potential of ORC systems
As for Part 2, the environmental impact of ORC systems is analyzed only in terms of GHG emissions. Another limitation is that only systems up to 2000 kWelectricity are considered. Energy market scenarios will be considered up to the year 2040, using estimates provided by the International Energy agency (IEA) in its scenarios presented in the 2019 World Energy Outlook (IEA, 2019).
PERFORMANCE AND POTENTIAL OF SMALL-SCALE ORC SYSTEMS
21
2 Performance of ORC systems
2.1 THE ORGANIC RANKINE CYCLE
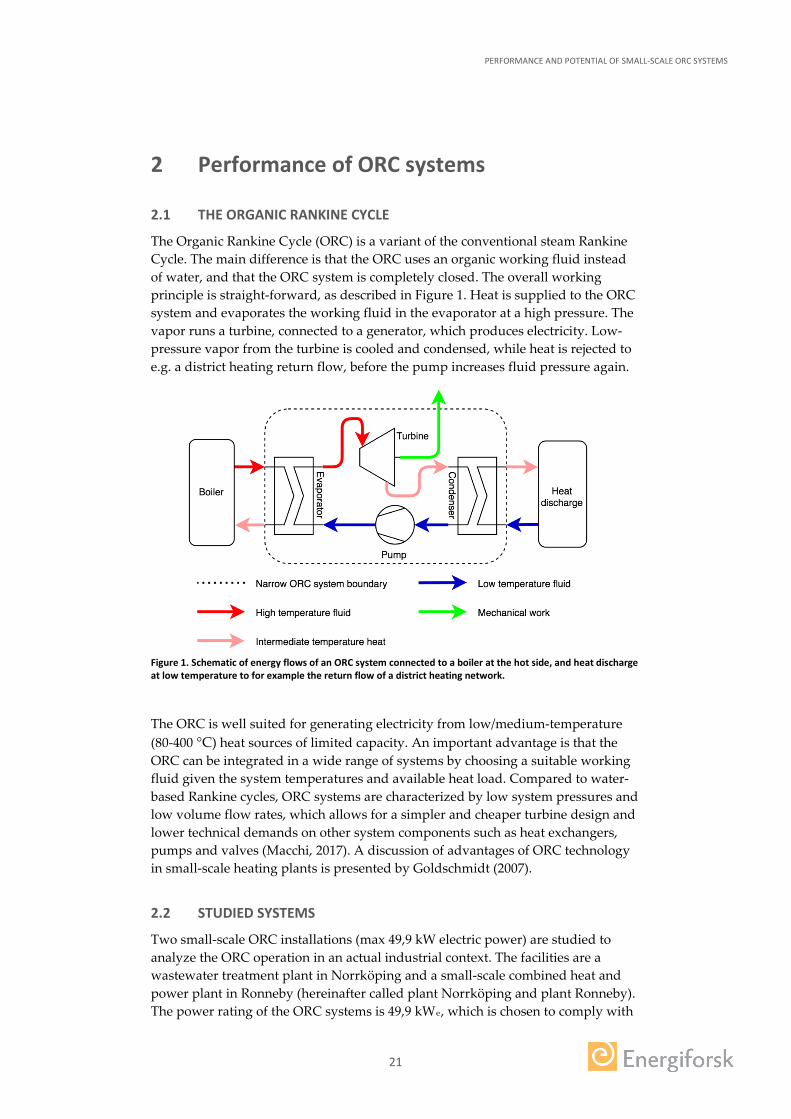
The Organic Rankine Cycle (ORC) is a variant of the conventional steam Rankine Cycle. The main difference is that the ORC uses an organic working fluid instead of water, and that the ORC system is completely closed. The overall working principle is straight-forward, as described in Figure 1. Heat is supplied to the ORC system and evaporates the working fluid in the evaporator at a high pressure. The vapor runs a turbine, connected to a generator, which produces electricity. Low-pressure vapor from the turbine is cooled and condensed, while heat is rejected to e.g. a district heating return flow, before the pump increases fluid pressure again.
Figure 1. Schematic of energy flows of an ORC system connected to a boiler at the hot side, and heat discharge at low temperature to for example the return flow of a district heating network.
The ORC is well suited for generating electricity from low/medium-temperature (80-400 °C) heat sources of limited capacity. An important advantage is that the ORC can be integrated in a wide range of systems by choosing a suitable working fluid given the system temperatures and available heat load. Compared to water-based Rankine cycles, ORC systems are characterized by low system pressures and low volume flow rates, which allows for a simpler and cheaper turbine design and lower technical demands on other system components such as heat exchangers, pumps and valves (Macchi, 2017). A discussion of advantages of ORC technology in small-scale heating plants is presented by Goldschmidt (2007).
2.2 STUDIED SYSTEMS
Two small-scale ORC installations (max 49,9 kW electric power) are studied to analyze the ORC operation in an actual industrial context. The facilities are a wastewater treatment plant in Norrköping and a small-scale combined heat and power plant in Ronneby (hereinafter called plant Norrköping and plant Ronneby). The power rating of the ORC systems is 49,9 kWe, which is chosen to comply with
PERFORMANCE AND POTENTIAL OF SMALL-SCALE ORC SYSTEMS
22
the Swedish tax rules described in chapter 3.4 Legal Conditions. The turbine power was a design criterion for the systems, in order to maximize economic benefits.
2.2.1 Plant Norrköping
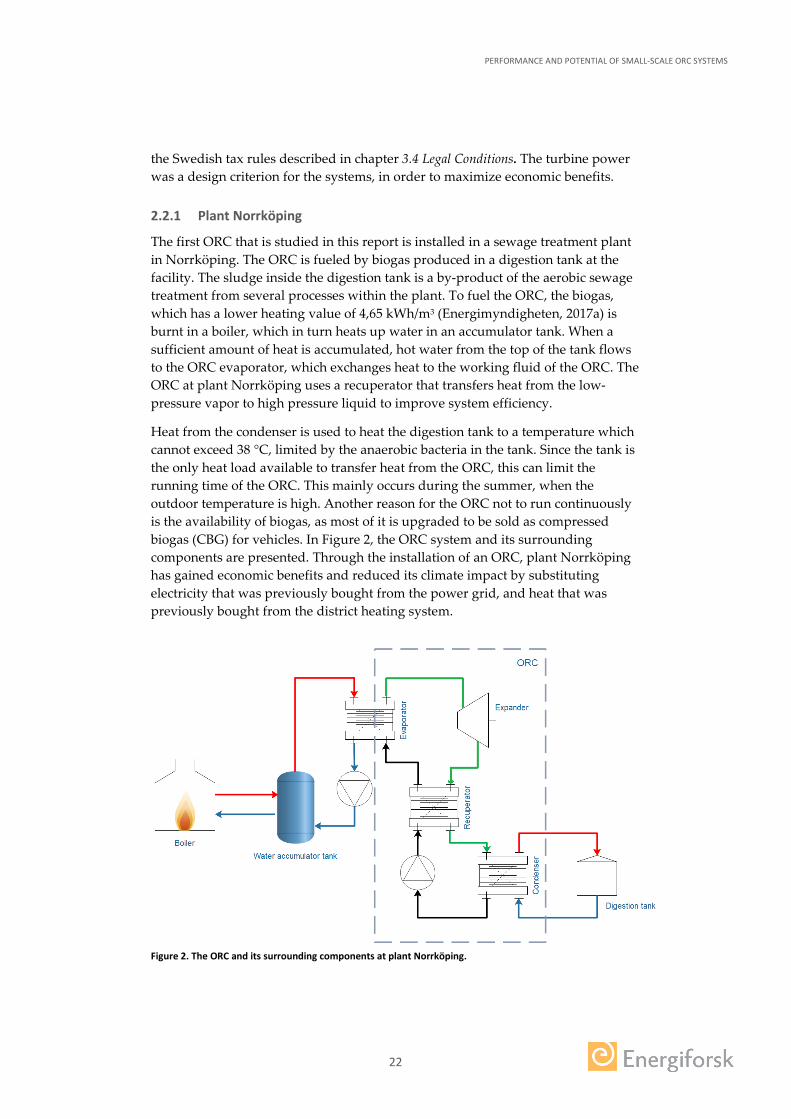
The first ORC that is studied in this report is installed in a sewage treatment plant in Norrköping. The ORC is fueled by biogas produced in a digestion tank at the facility. The sludge inside the digestion tank is a by-product of the aerobic sewage treatment from several processes within the plant. To fuel the ORC, the biogas, which has a lower heating value of 4,65 kWh/m3 (Energimyndigheten, 2017a) is burnt in a boiler, which in turn heats up water in an accumulator tank. When a sufficient amount of heat is accumulated, hot water from the top of the tank flows to the ORC evaporator, which exchanges heat to the working fluid of the ORC. The ORC at plant Norrköping uses a recuperator that transfers heat from the low-pressure vapor to high pressure liquid to improve system efficiency.
Heat from the condenser is used to heat the digestion tank to a temperature which cannot exceed 38 °C, limited by the anaerobic bacteria in the tank. Since the tank is the only heat load available to transfer heat from the ORC, this can limit the running time of the ORC. This mainly occurs during the summer, when the outdoor temperature is high. Another reason for the ORC not to run continuously is the availability of biogas, as most of it is upgraded to be sold as compressed biogas (CBG) for vehicles. In Figure 2, the ORC system and its surrounding components are presented. Through the installation of an ORC, plant Norrköping has gained economic benefits and reduced its climate impact by substituting electricity that was previously bought from the power grid, and heat that was previously bought from the district heating system.
Figure 2. The ORC and its surrounding components at plant Norrköping.
PERFORMANCE AND POTENTIAL OF SMALL-SCALE ORC SYSTEMS
23
2.2.2 Plant Ronneby
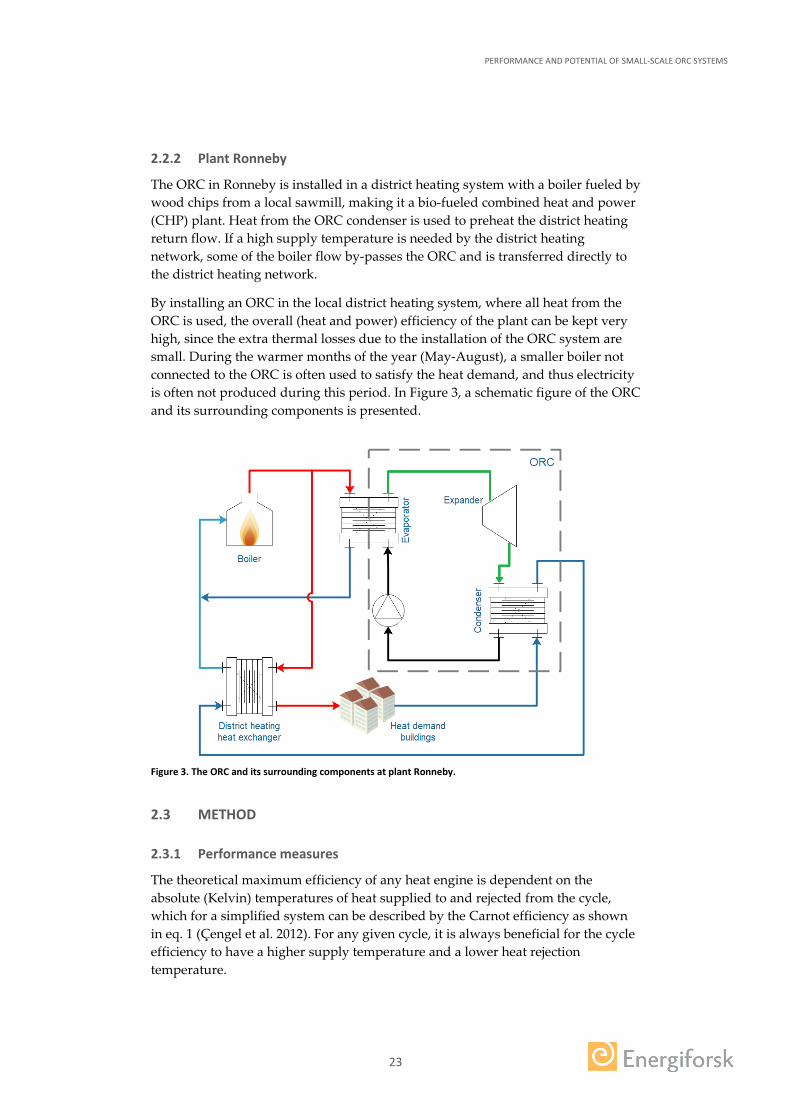
The ORC in Ronneby is installed in a district heating system with a boiler fueled by wood chips from a local sawmill, making it a bio-fueled combined heat and power (CHP) plant. Heat from the ORC condenser is used to preheat the district heating return flow. If a high supply temperature is needed by the district heating network, some of the boiler flow by-passes the ORC and is transferred directly to the district heating network.
By installing an ORC in the local district heating system, where all heat from the ORC is used, the overall (heat and power) efficiency of the plant can be kept very high, since the extra thermal losses due to the installation of the ORC system are small. During the warmer months of the year (May-August), a smaller boiler not connected to the ORC is often used to satisfy the heat demand, and thus electricity is often not produced during this period. In Figure 3, a schematic figure of the ORC and its surrounding components is presented.
Figure 3. The ORC and its surrounding components at plant Ronneby.
2.3 METHOD
2.3.1 Performance measures
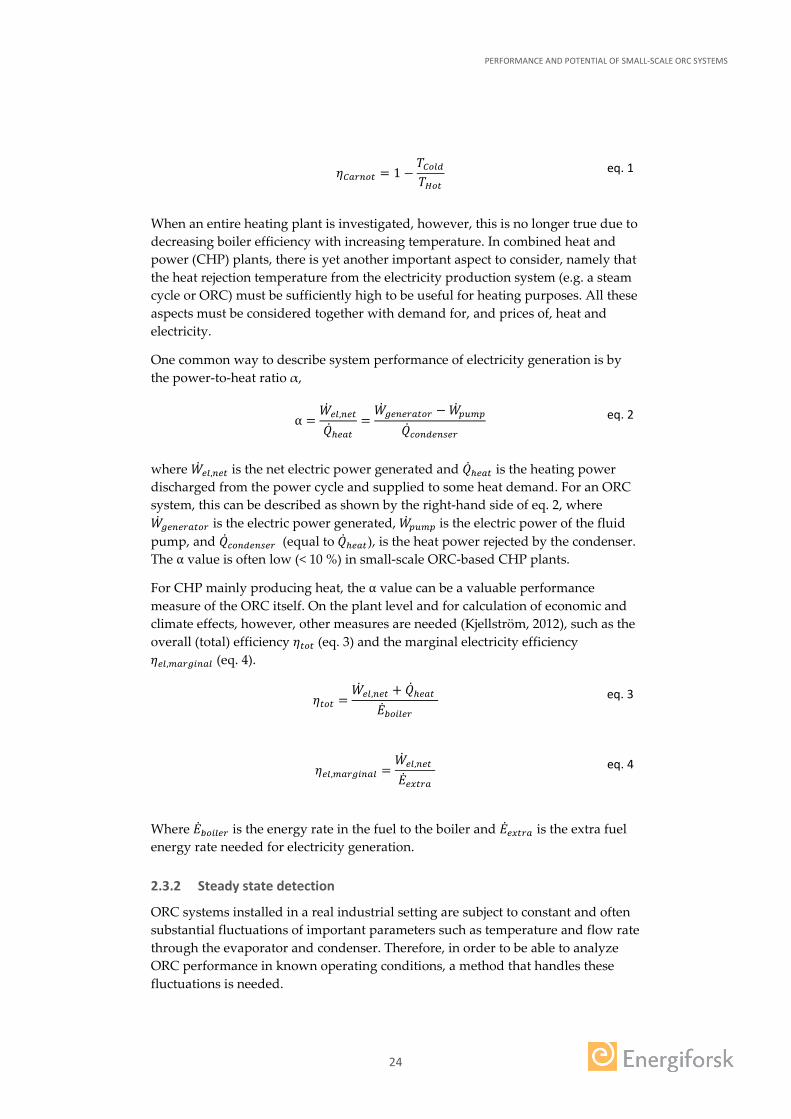
The theoretical maximum efficiency of any heat engine is dependent on the absolute (Kelvin) temperatures of heat supplied to and rejected from the cycle, which for a simplified system can be described by the Carnot efficiency as shown in eq. 1 (Çengel et al. 2012). For any given cycle, it is always beneficial for the cycle efficiency to have a higher supply temperature and a lower heat rejection temperature.
PERFORMANCE AND POTENTIAL OF SMALL-SCALE ORC SYSTEMS
24
𝜂𝜂𝐶𝐶𝑒𝑒𝑟𝑟𝑛𝑛𝑡𝑡𝑛𝑛 = 1 −
𝑇𝑇𝐶𝐶𝑡𝑡𝑒𝑒𝑖𝑖𝑇𝑇𝐻𝐻𝑡𝑡𝑛𝑛
eq. 1
When an entire heating plant is investigated, however, this is no longer true due to decreasing boiler efficiency with increasing temperature. In combined heat and power (CHP) plants, there is yet another important aspect to consider, namely that the heat rejection temperature from the electricity production system (e.g. a steam cycle or ORC) must be sufficiently high to be useful for heating purposes. All these aspects must be considered together with demand for, and prices of, heat and electricity.
One common way to describe system performance of electricity generation is by the power-to-heat ratio α,
α =
��𝑊𝑒𝑒𝑒𝑒,𝑛𝑛𝑒𝑒𝑛𝑛
��𝑄ℎ𝑒𝑒𝑒𝑒𝑛𝑛=��𝑊𝑚𝑚𝑒𝑒𝑛𝑛𝑒𝑒𝑟𝑟𝑒𝑒𝑛𝑛𝑡𝑡𝑟𝑟 − ��𝑊𝑝𝑝𝑝𝑝𝑚𝑚𝑝𝑝
��𝑄𝑐𝑐𝑡𝑡𝑛𝑛𝑖𝑖𝑒𝑒𝑛𝑛𝑐𝑐𝑒𝑒𝑟𝑟 eq. 2
where ��𝑊𝑒𝑒𝑒𝑒,𝑛𝑛𝑒𝑒𝑛𝑛 is the net electric power generated and ��𝑄ℎ𝑒𝑒𝑒𝑒𝑛𝑛 is the heating power discharged from the power cycle and supplied to some heat demand. For an ORC system, this can be described as shown by the right-hand side of eq. 2, where ��𝑊𝑚𝑚𝑒𝑒𝑛𝑛𝑒𝑒𝑟𝑟𝑒𝑒𝑛𝑛𝑡𝑡𝑟𝑟 is the electric power generated, ��𝑊𝑝𝑝𝑝𝑝𝑚𝑚𝑝𝑝 is the electric power of the fluid pump, and ��𝑄𝑐𝑐𝑡𝑡𝑛𝑛𝑖𝑖𝑒𝑒𝑛𝑛𝑐𝑐𝑒𝑒𝑟𝑟 (equal to ��𝑄ℎ𝑒𝑒𝑒𝑒𝑛𝑛), is the heat power rejected by the condenser. The α value is often low (< 10 %) in small-scale ORC-based CHP plants.
For CHP mainly producing heat, the α value can be a valuable performance measure of the ORC itself. On the plant level and for calculation of economic and climate effects, however, other measures are needed (Kjellström, 2012), such as the overall (total) efficiency 𝜂𝜂𝑛𝑛𝑡𝑡𝑛𝑛 (eq. 3) and the marginal electricity efficiency 𝜂𝜂𝑒𝑒𝑒𝑒,𝑚𝑚𝑒𝑒𝑟𝑟𝑚𝑚𝑖𝑖𝑛𝑛𝑒𝑒𝑒𝑒 (eq. 4).
𝜂𝜂𝑛𝑛𝑡𝑡𝑛𝑛 =
��𝑊𝑒𝑒𝑒𝑒,𝑛𝑛𝑒𝑒𝑛𝑛 + ��𝑄ℎ𝑒𝑒𝑒𝑒𝑛𝑛 ��𝐸𝑏𝑏𝑡𝑡𝑖𝑖𝑒𝑒𝑒𝑒𝑟𝑟
eq. 3
𝜂𝜂𝑒𝑒𝑒𝑒,𝑚𝑚𝑒𝑒𝑟𝑟𝑚𝑚𝑖𝑖𝑛𝑛𝑒𝑒𝑒𝑒 =
��𝑊𝑒𝑒𝑒𝑒,𝑛𝑛𝑒𝑒𝑛𝑛 ��𝐸𝑒𝑒𝑒𝑒𝑛𝑛𝑟𝑟𝑒𝑒
eq. 4
Where ��𝐸𝑏𝑏𝑡𝑡𝑖𝑖𝑒𝑒𝑒𝑒𝑟𝑟 is the energy rate in the fuel to the boiler and ��𝐸𝑒𝑒𝑒𝑒𝑛𝑛𝑟𝑟𝑒𝑒 is the extra fuel energy rate needed for electricity generation.
2.3.2 Steady state detection
ORC systems installed in a real industrial setting are subject to constant and often substantial fluctuations of important parameters such as temperature and flow rate through the evaporator and condenser. Therefore, in order to be able to analyze ORC performance in known operating conditions, a method that handles these fluctuations is needed.
PERFORMANCE AND POTENTIAL OF SMALL-SCALE ORC SYSTEMS
25
In this study, a method that evaluates the rate of change of important parameters and extracts only the measurement data with close to steady-state conditions was developed and implemented. The method makes it possible to automatically evaluate performance for long periods of times (months) in a systematic and controlled way.
Visually identifying the state of the system, i.e. whether considering it in transient or steady-state condition, is highly time consuming. Human analysis of large datasets is also associated with a high risk for error and bias, especially with noisy data. Therefore, it is essential to use a systematic and robust method, with low computational cost, for consistent performance evaluation.
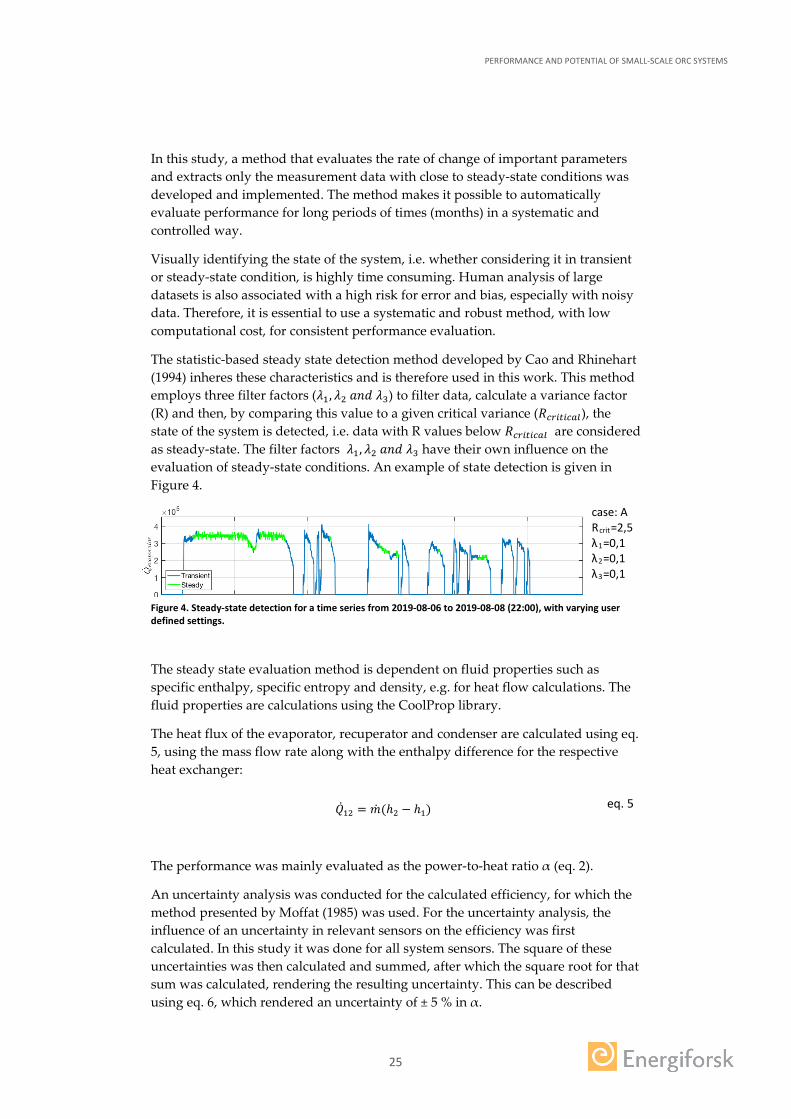
The statistic-based steady state detection method developed by Cao and Rhinehart (1994) inheres these characteristics and is therefore used in this work. This method employs three filter factors (𝜆𝜆1, 𝜆𝜆2 𝑎𝑎𝑎𝑎𝑎𝑎 𝜆𝜆3) to filter data, calculate a variance factor (R) and then, by comparing this value to a given critical variance (𝑅𝑅𝑐𝑐𝑟𝑟𝑖𝑖𝑛𝑛𝑖𝑖𝑐𝑐𝑒𝑒𝑒𝑒), the state of the system is detected, i.e. data with R values below 𝑅𝑅𝑐𝑐𝑟𝑟𝑖𝑖𝑛𝑛𝑖𝑖𝑐𝑐𝑒𝑒𝑒𝑒 are considered as steady-state. The filter factors 𝜆𝜆1, 𝜆𝜆2 𝑎𝑎𝑎𝑎𝑎𝑎 𝜆𝜆3 have their own influence on the evaluation of steady-state conditions. An example of state detection is given in Figure 4.
case: A Rcrit=2,5
λ1=0,1 λ2=0,1 λ3=0,1
Figure 4. Steady-state detection for a time series from 2019-08-06 to 2019-08-08 (22:00), with varying user defined settings.
The steady state evaluation method is dependent on fluid properties such as specific enthalpy, specific entropy and density, e.g. for heat flow calculations. The fluid properties are calculations using the CoolProp library.
The heat flux of the evaporator, recuperator and condenser are calculated using eq. 5, using the mass flow rate along with the enthalpy difference for the respective heat exchanger:
��𝑄12 = ��𝑚(ℎ2 − ℎ1) eq. 5
The performance was mainly evaluated as the power-to-heat ratio α (eq. 2).
An uncertainty analysis was conducted for the calculated efficiency, for which the method presented by Moffat (1985) was used. For the uncertainty analysis, the influence of an uncertainty in relevant sensors on the efficiency was first calculated. In this study it was done for all system sensors. The square of these uncertainties was then calculated and summed, after which the square root for that sum was calculated, rendering the resulting uncertainty. This can be described using eq. 6, which rendered an uncertainty of ± 5 % in α.
PERFORMANCE AND POTENTIAL OF SMALL-SCALE ORC SYSTEMS
26
𝛿𝛿𝑅𝑅 = ��
𝜕𝜕𝑅𝑅𝜕𝜕𝑥𝑥1
𝛿𝛿𝑥𝑥1�2
+ �𝜕𝜕𝑅𝑅𝜕𝜕𝑥𝑥2
𝛿𝛿𝑥𝑥2�2
+. . . + �𝜕𝜕𝑅𝑅𝜕𝜕𝑥𝑥𝑁𝑁
𝛿𝛿𝑥𝑥𝑁𝑁�2
eq. 6
2.3.3 Effect of transient conditions
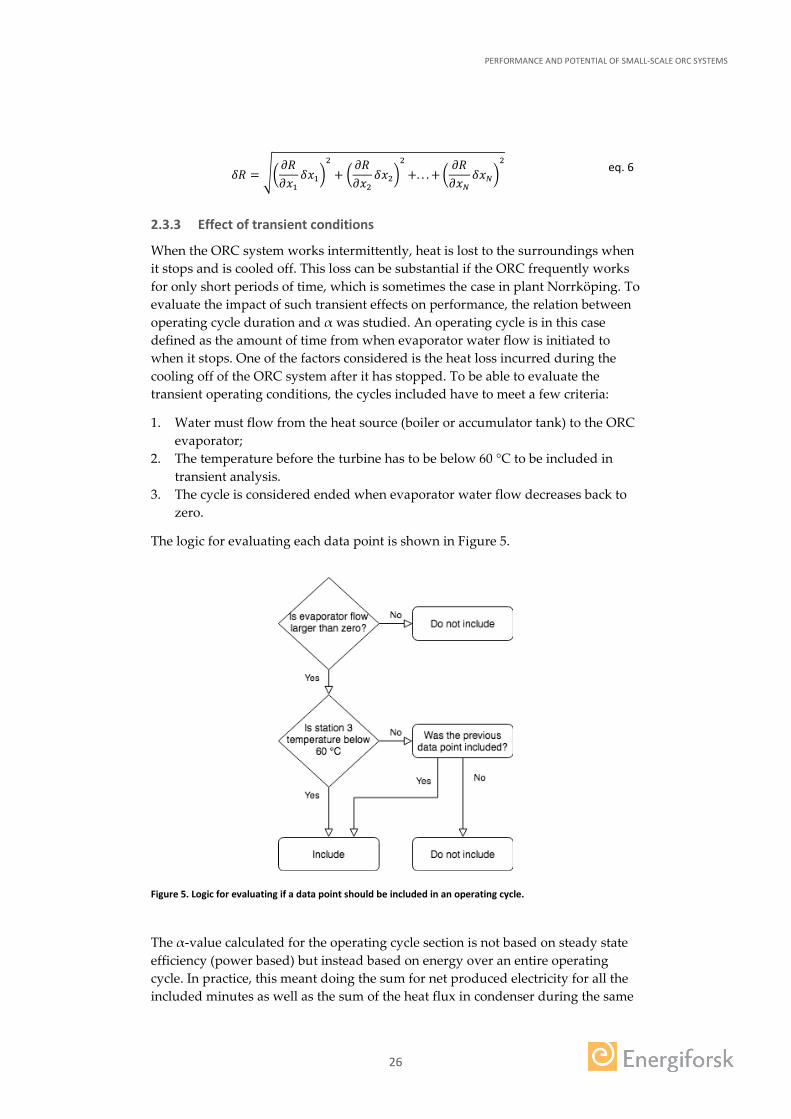
When the ORC system works intermittently, heat is lost to the surroundings when it stops and is cooled off. This loss can be substantial if the ORC frequently works for only short periods of time, which is sometimes the case in plant Norrköping. To evaluate the impact of such transient effects on performance, the relation between operating cycle duration and α was studied. An operating cycle is in this case defined as the amount of time from when evaporator water flow is initiated to when it stops. One of the factors considered is the heat loss incurred during the cooling off of the ORC system after it has stopped. To be able to evaluate the transient operating conditions, the cycles included have to meet a few criteria:
1. Water must flow from the heat source (boiler or accumulator tank) to the ORC evaporator;
2. The temperature before the turbine has to be below 60 °C to be included in transient analysis.
3. The cycle is considered ended when evaporator water flow decreases back to zero.
The logic for evaluating each data point is shown in Figure 5.
Figure 5. Logic for evaluating if a data point should be included in an operating cycle.
The α-value calculated for the operating cycle section is not based on steady state efficiency (power based) but instead based on energy over an entire operating cycle. In practice, this meant doing the sum for net produced electricity for all the included minutes as well as the sum of the heat flux in condenser during the same
PERFORMANCE AND POTENTIAL OF SMALL-SCALE ORC SYSTEMS
27
time. The ratio between the sum of net produced electricity and supplied heat is defined as the α-value of an operating cycle. This is represented by eq. 7.
𝛼𝛼 𝑡𝑡𝑝𝑝𝑒𝑒𝑟𝑟𝑒𝑒𝑛𝑛𝑖𝑖𝑛𝑛𝑚𝑚 𝑐𝑐𝑐𝑐𝑐𝑐𝑒𝑒𝑒𝑒 =
∑��𝑊𝑛𝑛𝑒𝑒𝑛𝑛
∑ ��𝑄𝑐𝑐𝑡𝑡𝑛𝑛𝑖𝑖𝑒𝑒𝑛𝑛𝑐𝑐𝑒𝑒𝑟𝑟 eq. 7
2.4 RESULTS AND DISCUSSION
This chapter shows steady state performance evaluated for the Norrköping and Ronneby plants. The impact of transient effects is investigated in a separate section, and only plant Norrköping is included since plant Ronneby is running continuously for extended periods of time.
2.4.1 Performance at steady state conditions: Plant Norrköping
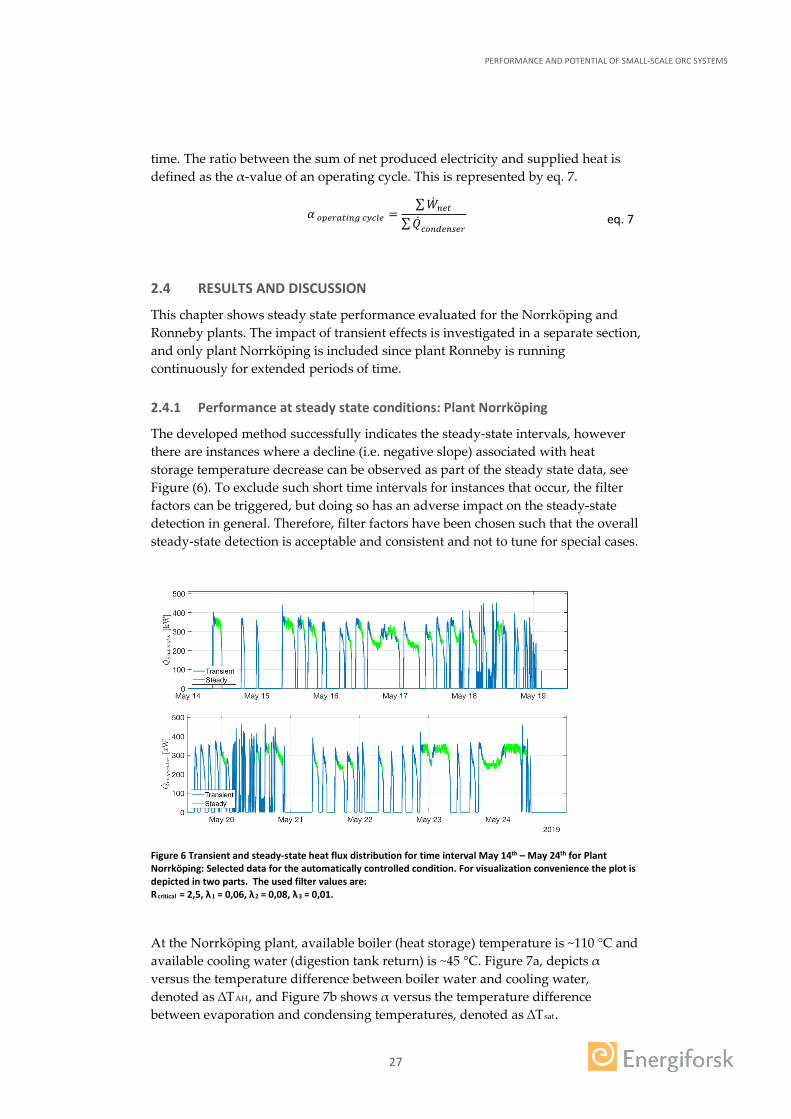
The developed method successfully indicates the steady-state intervals, however there are instances where a decline (i.e. negative slope) associated with heat storage temperature decrease can be observed as part of the steady state data, see Figure (6). To exclude such short time intervals for instances that occur, the filter factors can be triggered, but doing so has an adverse impact on the steady-state detection in general. Therefore, filter factors have been chosen such that the overall steady-state detection is acceptable and consistent and not to tune for special cases.
Figure 6 Transient and steady-state heat flux distribution for time interval May 14th – May 24th for Plant Norrköping: Selected data for the automatically controlled condition. For visualization convenience the plot is depicted in two parts. The used filter values are: Rcritical = 2,5, λ1 = 0,06, λ2 = 0,08, λ3 = 0,01.
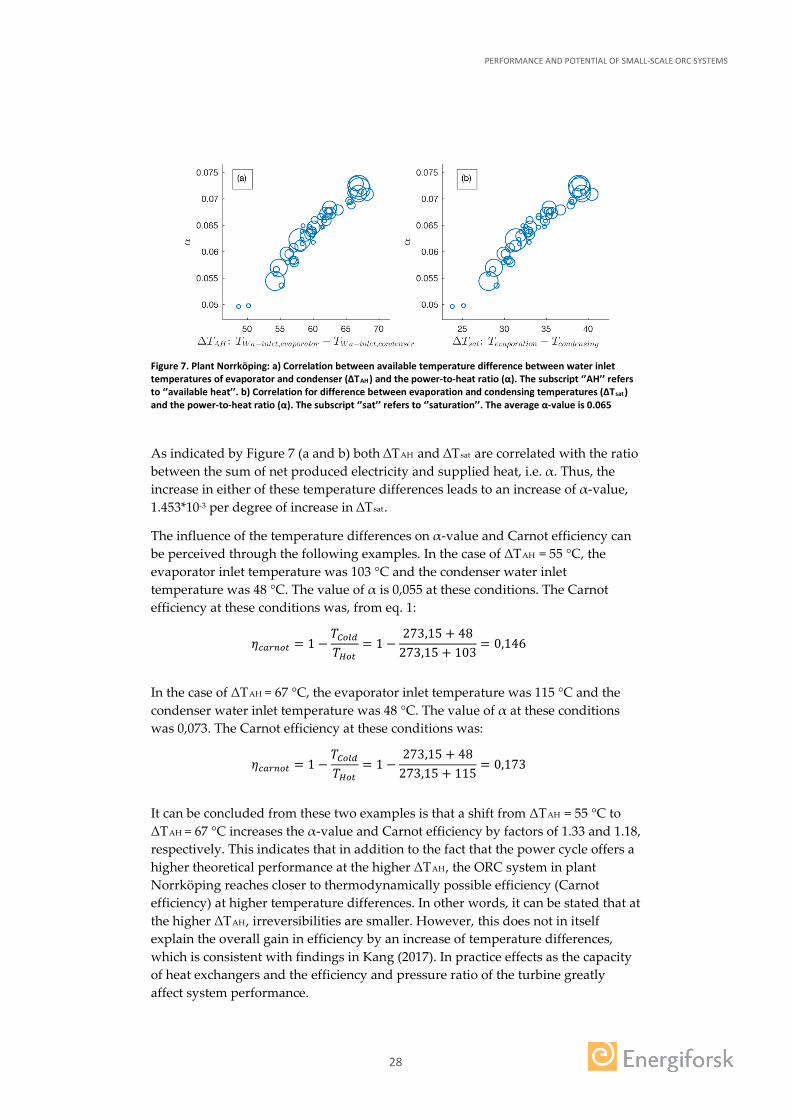
At the Norrköping plant, available boiler (heat storage) temperature is ~110 °C and available cooling water (digestion tank return) is ~45 °C. Figure 7a, depicts α versus the temperature difference between boiler water and cooling water, denoted as ∆TAH, and Figure 7b shows α versus the temperature difference between evaporation and condensing temperatures, denoted as ∆Tsat.
PERFORMANCE AND POTENTIAL OF SMALL-SCALE ORC SYSTEMS
28
Figure 7. Plant Norrköping: a) Correlation between available temperature difference between water inlet temperatures of evaporator and condenser (∆TAH) and the power-to-heat ratio (α). The subscript ‘’AH’’ refers to ‘’available heat’’. b) Correlation for difference between evaporation and condensing temperatures (∆Tsat) and the power-to-heat ratio (α). The subscript ‘’sat’’ refers to ‘’saturation’’. The average α-value is 0.065
As indicated by Figure 7 (a and b) both ∆TAH and ∆Tsat are correlated with the ratio between the sum of net produced electricity and supplied heat, i.e. α. Thus, the increase in either of these temperature differences leads to an increase of α-value, 1.453*10-3 per degree of increase in ∆Tsat.
The influence of the temperature differences on α-value and Carnot efficiency can be perceived through the following examples. In the case of ΔTAH = 55 °C, the evaporator inlet temperature was 103 °C and the condenser water inlet temperature was 48 °C. The value of α is 0,055 at these conditions. The Carnot efficiency at these conditions was, from eq. 1:
𝜂𝜂𝑐𝑐𝑒𝑒𝑟𝑟𝑛𝑛𝑡𝑡𝑛𝑛 = 1 −
𝑇𝑇𝐶𝐶𝑡𝑡𝑒𝑒𝑖𝑖𝑇𝑇𝐻𝐻𝑡𝑡𝑛𝑛
= 1 −273,15 + 48
273,15 + 103= 0,146
In the case of ΔTAH = 67 °C, the evaporator inlet temperature was 115 °C and the condenser water inlet temperature was 48 °C. The value of α at these conditions was 0,073. The Carnot efficiency at these conditions was:
𝜂𝜂𝑐𝑐𝑒𝑒𝑟𝑟𝑛𝑛𝑡𝑡𝑛𝑛 = 1 −
𝑇𝑇𝐶𝐶𝑡𝑡𝑒𝑒𝑖𝑖𝑇𝑇𝐻𝐻𝑡𝑡𝑛𝑛
= 1 −273,15 + 48
273,15 + 115= 0,173
It can be concluded from these two examples is that a shift from ΔTAH = 55 °C to ΔTAH = 67 °C increases the α-value and Carnot efficiency by factors of 1.33 and 1.18, respectively. This indicates that in addition to the fact that the power cycle offers a higher theoretical performance at the higher ΔTAH, the ORC system in plant Norrköping reaches closer to thermodynamically possible efficiency (Carnot efficiency) at higher temperature differences. In other words, it can be stated that at the higher ΔTAH, irreversibilities are smaller. However, this does not in itself explain the overall gain in efficiency by an increase of temperature differences, which is consistent with findings in Kang (2017). In practice effects as the capacity of heat exchangers and the efficiency and pressure ratio of the turbine greatly affect system performance.
PERFORMANCE AND POTENTIAL OF SMALL-SCALE ORC SYSTEMS
29
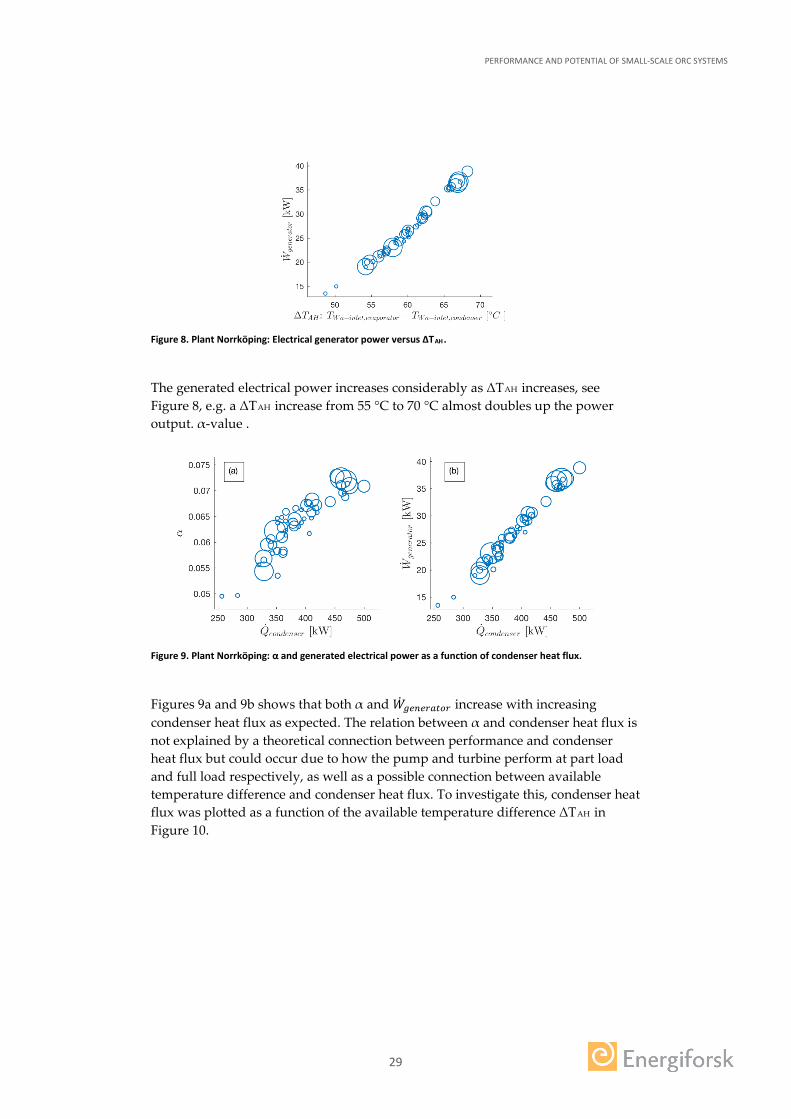
Figure 8. Plant Norrköping: Electrical generator power versus ΔTAH.
The generated electrical power increases considerably as ΔTAH increases, see Figure 8, e.g. a ΔTAH increase from 55 °C to 70 °C almost doubles up the power output. α-value .
Figure 9. Plant Norrköping: α and generated electrical power as a function of condenser heat flux.
Figures 9a and 9b shows that both α and ��𝑊𝑚𝑚𝑒𝑒𝑛𝑛𝑒𝑒𝑟𝑟𝑒𝑒𝑛𝑛𝑡𝑡𝑟𝑟 increase with increasing condenser heat flux as expected. The relation between α and condenser heat flux is not explained by a theoretical connection between performance and condenser heat flux but could occur due to how the pump and turbine perform at part load and full load respectively, as well as a possible connection between available temperature difference and condenser heat flux. To investigate this, condenser heat flux was plotted as a function of the available temperature difference ΔTAH in Figure 10.
PERFORMANCE AND POTENTIAL OF SMALL-SCALE ORC SYSTEMS
30
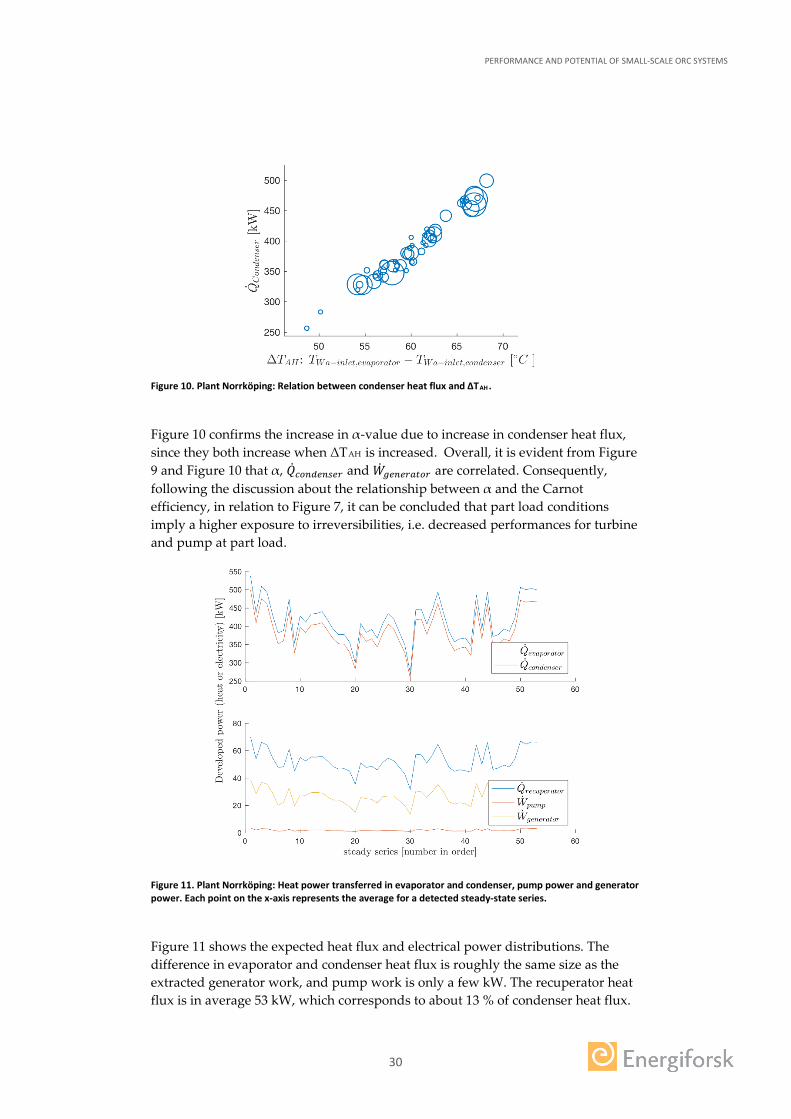
Figure 10. Plant Norrköping: Relation between condenser heat flux and ΔTAH.
Figure 10 confirms the increase in α-value due to increase in condenser heat flux, since they both increase when ΔTAH is increased. Overall, it is evident from Figure 9 and Figure 10 that α, ��𝑄𝑐𝑐𝑡𝑡𝑛𝑛𝑖𝑖𝑒𝑒𝑛𝑛𝑐𝑐𝑒𝑒𝑟𝑟 and ��𝑊𝑚𝑚𝑒𝑒𝑛𝑛𝑒𝑒𝑟𝑟𝑒𝑒𝑛𝑛𝑡𝑡𝑟𝑟 are correlated. Consequently, following the discussion about the relationship between α and the Carnot efficiency, in relation to Figure 7, it can be concluded that part load conditions imply a higher exposure to irreversibilities, i.e. decreased performances for turbine and pump at part load.
Figure 11. Plant Norrköping: Heat power transferred in evaporator and condenser, pump power and generator power. Each point on the x-axis represents the average for a detected steady-state series.
Figure 11 shows the expected heat flux and electrical power distributions. The difference in evaporator and condenser heat flux is roughly the same size as the extracted generator work, and pump work is only a few kW. The recuperator heat flux is in average 53 kW, which corresponds to about 13 % of condenser heat flux.
PERFORMANCE AND POTENTIAL OF SMALL-SCALE ORC SYSTEMS
31
This means that for the same temperatures and pressures of operation, the evaporator and condenser heat fluxes would have to be 53 kW larger to maintain the same generated electrical output if the system did not have a recuperator. This would reduce the magnitude of α by 13 %, or 0,009 in terms of absolute change.
2.4.2 Performance at steady state conditions: Plant Ronneby
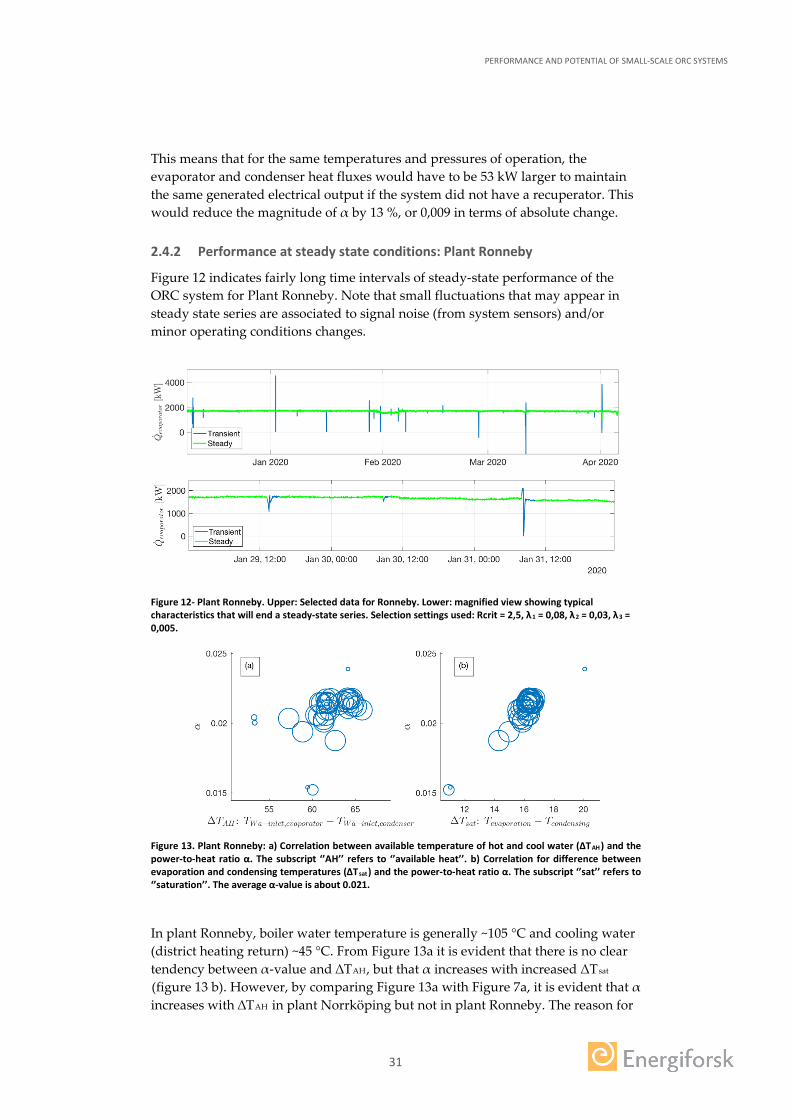
Figure 12 indicates fairly long time intervals of steady-state performance of the ORC system for Plant Ronneby. Note that small fluctuations that may appear in steady state series are associated to signal noise (from system sensors) and/or minor operating conditions changes.
Figure 12- Plant Ronneby. Upper: Selected data for Ronneby. Lower: magnified view showing typical characteristics that will end a steady-state series. Selection settings used: Rcrit = 2,5, λ1 = 0,08, λ2 = 0,03, λ3 = 0,005.
Figure 13. Plant Ronneby: a) Correlation between available temperature of hot and cool water (ΔTAH) and the power-to-heat ratio α. The subscript ‘’AH’’ refers to ‘’available heat’’. b) Correlation for difference between evaporation and condensing temperatures (∆Tsat) and the power-to-heat ratio α. The subscript ‘’sat’’ refers to ‘’saturation’’. The average α-value is about 0.021.
In plant Ronneby, boiler water temperature is generally ~105 °C and cooling water (district heating return) ~45 °C. From Figure 13a it is evident that there is no clear tendency between α-value and ∆TAH, but that α increases with increased ΔTsat
(figure 13 b). However, by comparing Figure 13a with Figure 7a, it is evident that α increases with ∆TAH in plant Norrköping but not in plant Ronneby. The reason for
PERFORMANCE AND POTENTIAL OF SMALL-SCALE ORC SYSTEMS
32
this difference is mainly due to a difference in how the condenser water flow rate is controlled. In plant Norrköping the condenser water flow is constant, and thereby a decreased water temperature at the inlet will decrease the condensing temperature of the working fluid. This in turn will increase the ΔTsat and thereby increase α (Figure 7b).
In plant Ronneby however, the water flow rate to the condenser is controlled based on the district heating load. Another related factor is that a sufficient supply temperature to the district heating network is given priority over electricity production, which in turn affects the relative amount of heat passing through the ORC compared to the heat going directly from the boiler to the district heating network. A maximum allowed electricity production of 49,9 kW (as explained in section 4.4 Legal conditions) also imposes restrictions on how much heat that passes through the ORC and thereby affects the relation between α-value and ∆TAH.
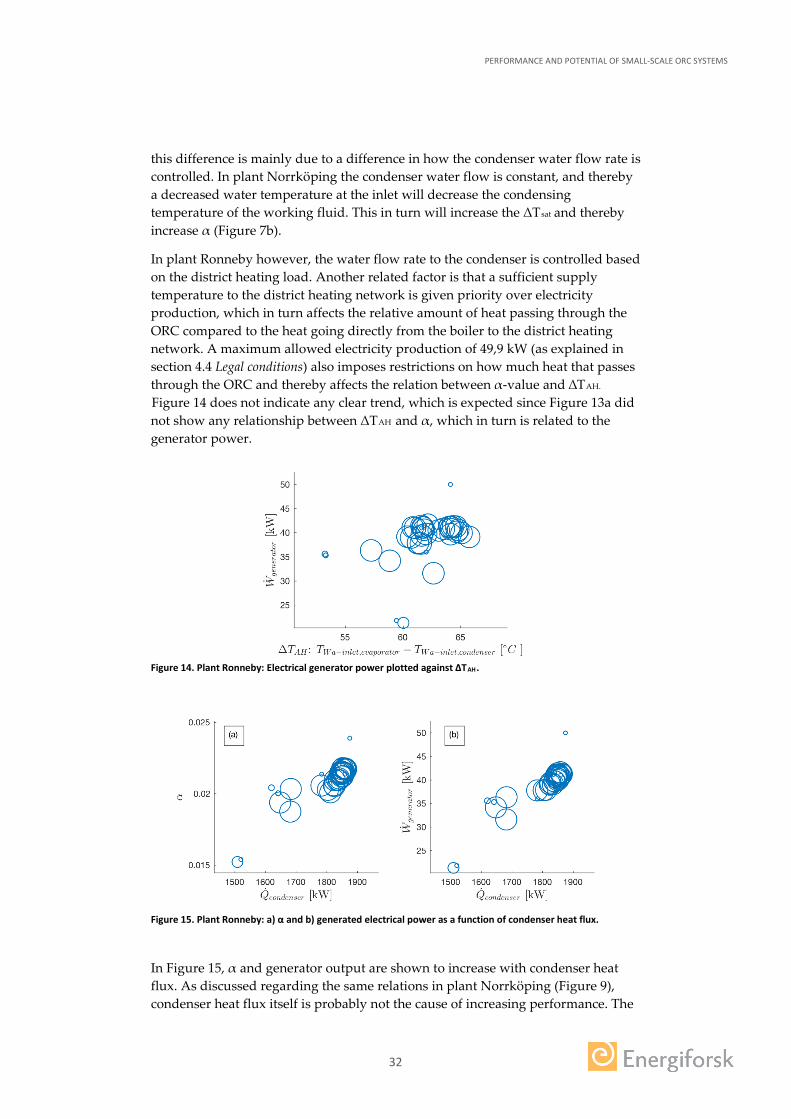
Figure 14 does not indicate any clear trend, which is expected since Figure 13a did not show any relationship between ΔTAH and α, which in turn is related to the generator power.
Figure 14. Plant Ronneby: Electrical generator power plotted against ΔTAH.
Figure 15. Plant Ronneby: a) α and b) generated electrical power as a function of condenser heat flux.
In Figure 15, α and generator output are shown to increase with condenser heat flux. As discussed regarding the same relations in plant Norrköping (Figure 9), condenser heat flux itself is probably not the cause of increasing performance. The
PERFORMANCE AND POTENTIAL OF SMALL-SCALE ORC SYSTEMS
33
impact of part load on turbine and pump efficiency and the connection with temperature difference ΔTsat within the cycle are likely the main contributors to the connection between condenser heat flux and α as well as generator power.
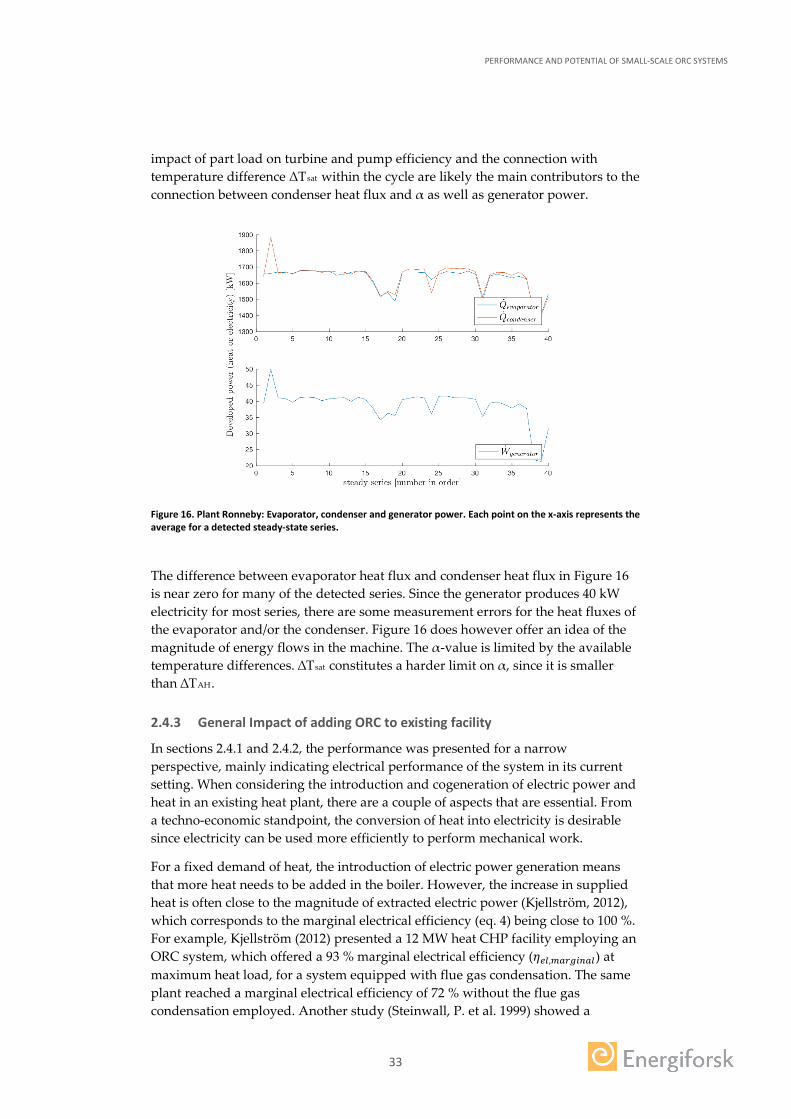
Figure 16. Plant Ronneby: Evaporator, condenser and generator power. Each point on the x-axis represents the average for a detected steady-state series.
The difference between evaporator heat flux and condenser heat flux in Figure 16 is near zero for many of the detected series. Since the generator produces 40 kW electricity for most series, there are some measurement errors for the heat fluxes of the evaporator and/or the condenser. Figure 16 does however offer an idea of the magnitude of energy flows in the machine. The α-value is limited by the available temperature differences. ∆Tsat constitutes a harder limit on α, since it is smaller than ∆TAH.
2.4.3 General Impact of adding ORC to existing facility
In sections 2.4.1 and 2.4.2, the performance was presented for a narrow perspective, mainly indicating electrical performance of the system in its current setting. When considering the introduction and cogeneration of electric power and heat in an existing heat plant, there are a couple of aspects that are essential. From a techno-economic standpoint, the conversion of heat into electricity is desirable since electricity can be used more efficiently to perform mechanical work.
For a fixed demand of heat, the introduction of electric power generation means that more heat needs to be added in the boiler. However, the increase in supplied heat is often close to the magnitude of extracted electric power (Kjellström, 2012), which corresponds to the marginal electrical efficiency (eq. 4) being close to 100 %. For example, Kjellström (2012) presented a 12 MW heat CHP facility employing an ORC system, which offered a 93 % marginal electrical efficiency (𝜂𝜂𝑒𝑒𝑒𝑒,𝑚𝑚𝑒𝑒𝑟𝑟𝑚𝑚𝑖𝑖𝑛𝑛𝑒𝑒𝑒𝑒) at maximum heat load, for a system equipped with flue gas condensation. The same plant reached a marginal electrical efficiency of 72 % without the flue gas condensation employed. Another study (Steinwall, P. et al. 1999) showed a
PERFORMANCE AND POTENTIAL OF SMALL-SCALE ORC SYSTEMS
34
marginal electrical efficiency in the ranges of 75 % to 90 % for a conventional steam cycle 10 MWheat CHP plant. In other words, the choice between cycle configurations (ORC vs. steam) is not technical, but rather economic.
The results of Kjellström also showed a total plant efficiency (by the definition in eq. 3) of 103 %. The efficiency reaches above 100 % due to the way fuel energy rate is defined (the use of lower heating value LHV in combination with flue gas condensation). Goldschmidt (2009) showed a 90 % total plant efficiency for a CHP plant based on an ORC system employing flue gas condensation.
2.4.4 Effect of transient conditions: Plant Norrköping
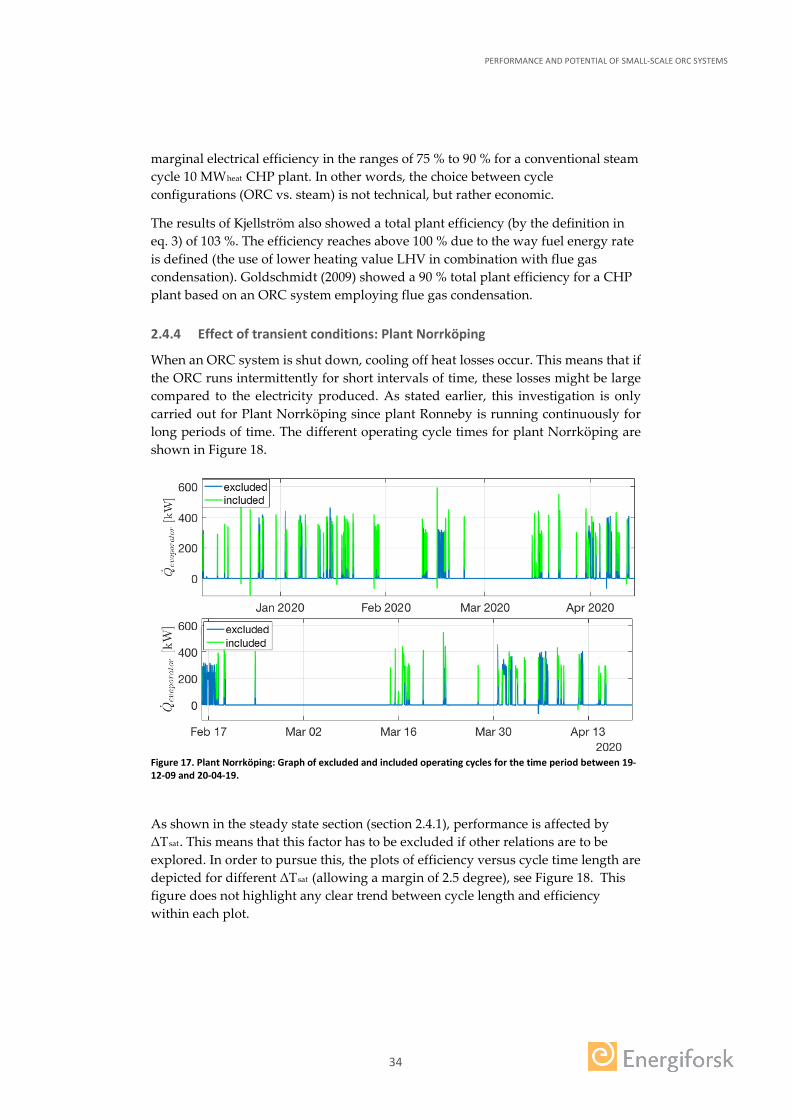
When an ORC system is shut down, cooling off heat losses occur. This means that if the ORC runs intermittently for short intervals of time, these losses might be large compared to the electricity produced. As stated earlier, this investigation is only carried out for Plant Norrköping since plant Ronneby is running continuously for long periods of time. The different operating cycle times for plant Norrköping are shown in Figure 18.
Figure 17. Plant Norrköping: Graph of excluded and included operating cycles for the time period between 19-12-09 and 20-04-19.
As shown in the steady state section (section 2.4.1), performance is affected by ΔTsat. This means that this factor has to be excluded if other relations are to be explored. In order to pursue this, the plots of efficiency versus cycle time length are depicted for different ΔTsat (allowing a margin of 2.5 degree), see Figure 18. This figure does not highlight any clear trend between cycle length and efficiency within each plot.
PERFORMANCE AND POTENTIAL OF SMALL-SCALE ORC SYSTEMS
35
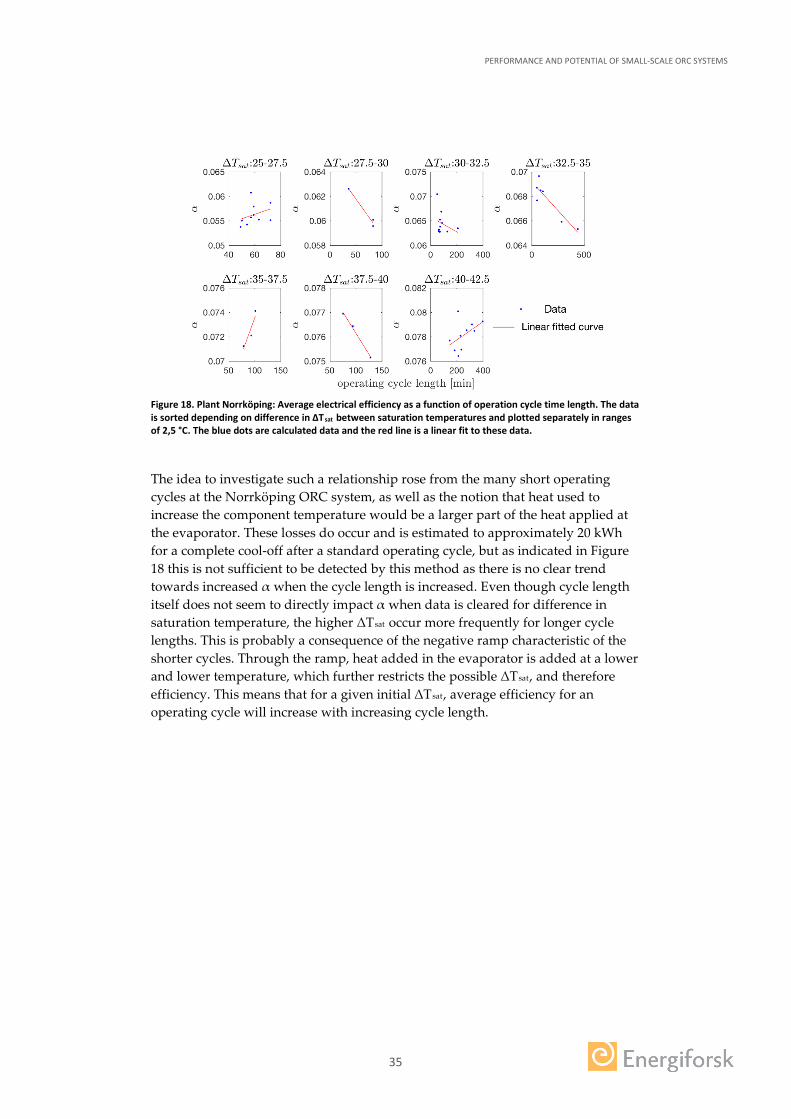
Figure 18. Plant Norrköping: Average electrical efficiency as a function of operation cycle time length. The data is sorted depending on difference in ΔTsat between saturation temperatures and plotted separately in ranges of 2,5 °C. The blue dots are calculated data and the red line is a linear fit to these data.
The idea to investigate such a relationship rose from the many short operating cycles at the Norrköping ORC system, as well as the notion that heat used to increase the component temperature would be a larger part of the heat applied at the evaporator. These losses do occur and is estimated to approximately 20 kWh for a complete cool-off after a standard operating cycle, but as indicated in Figure 18 this is not sufficient to be detected by this method as there is no clear trend towards increased α when the cycle length is increased. Even though cycle length itself does not seem to directly impact α when data is cleared for difference in saturation temperature, the higher ΔTsat occur more frequently for longer cycle lengths. This is probably a consequence of the negative ramp characteristic of the shorter cycles. Through the ramp, heat added in the evaporator is added at a lower and lower temperature, which further restricts the possible ΔTsat, and therefore efficiency. This means that for a given initial ΔTsat, average efficiency for an operating cycle will increase with increasing cycle length.
PERFORMANCE AND POTENTIAL OF SMALL-SCALE ORC SYSTEMS
36
3 Climate and economic effects of small-scale ORC systems
Europe is in a process of replacing nuclear and fossil-based electricity producers with renewable sources such as wind and solar (Oscarsson, 2017). In Sweden, according to Lindahl & Stoltz (2018), the amount of installed Photovoltaic (PV) solar power increased by 50 % from 2016 to 2017. However, replacing predictable and stable electricity sources with producers that are sensitive to weather changes will also create a demand for dispatchable electricity production that can guarantee a steady supply all year (Oscarsson, 2017). Today, there exist about 450 district heating systems in Sweden, but only about 90 of these employ combined heat and power (Byman & Koebe, 2016). Introducing combined heat and electricity production at more plants would increase the base production in the electricity system.
3.1 A SYSTEM PERSPECTIVE ON ORC ELECTRICITY GENERATION: MARGINAL ELECTRICITY AND HEAT PRICES
The energy output from the ORC system operating in CHP mode comes in the form of both heat and power. A well said analogy by Nordenstam (2018) is that the exergy (useful work of the energy) is first “shaved-off” in the form of electricity. The remaining useful energy is then presented as heat, which can be used for purposes such as district heating or local space heating. Because of these factors, when studying the ORC system, it is important to also consider the surrounding electricity and heat systems.
The electricity used in Sweden is a product of several electricity producers. Not only Swedish producers, but also power plants in all the Nordic countries and parts of northern Europe as well (Energirådgivning, 2018). The collaboration between countries regarding electricity generation is only expected to increase, and the EU is currently working on creating a single European electricity market. This includes common rules for electricity trading, connection to the grid and reliability of supply (Nordenstam, 2018). According to the Swedish Energy Agency (2017), electricity prices went up by 7 % from 2017 to 2018 in Sweden and are expected to increase further as the European power grid becomes more integrated.
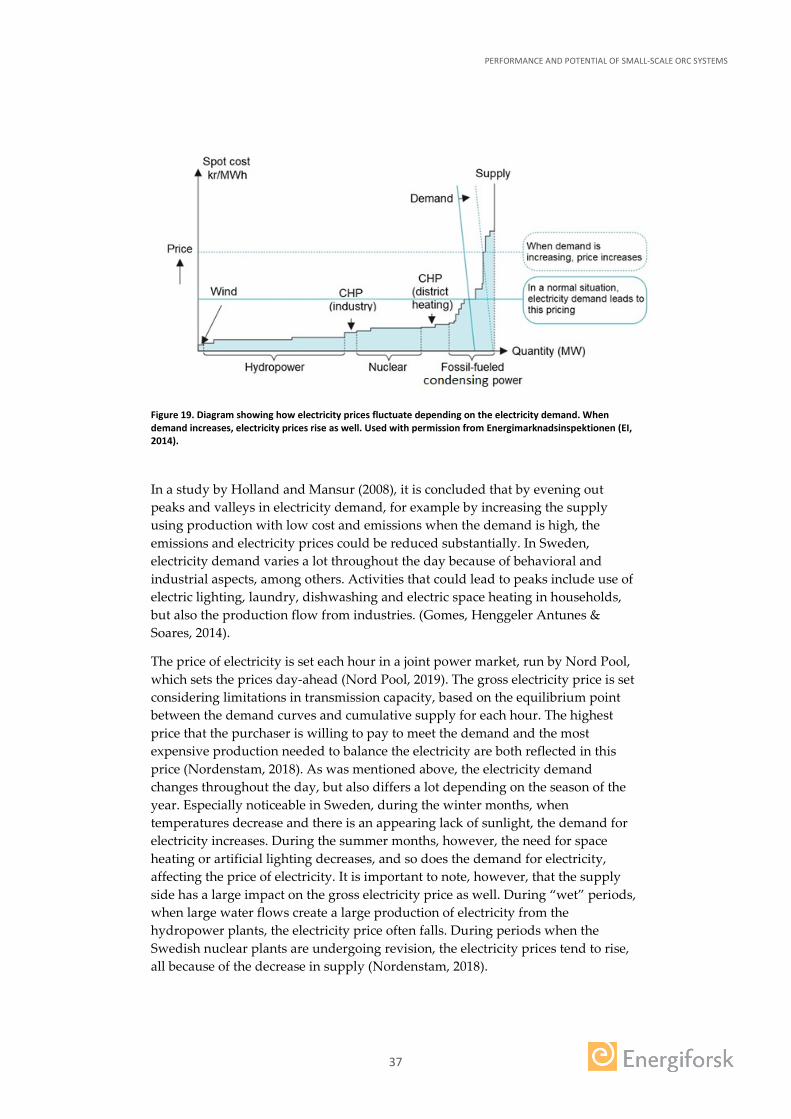
Figure 19 shows how the electricity used in Sweden is supplied, both in terms of the quantity but also the cost of electricity production (EI, 2014). As can be seen, the baseload mainly consists of cheap sources with low variable costs of production, such as hydropower (which also works as a regulator in the electricity market), nuclear power and from waste and biomass. However, in situations with high national demand, which cannot be satisfied with domestic production, electricity must be imported from other countries. This on-the-margin electricity is often covered by electricity generated from condensing plants fueled with coal or other fossil fuels. Not only does this mean that an increased demand leads to higher costs and therefore higher electricity prices, but also larger GHG emissions (Energirådgivningen, 2018).
PERFORMANCE AND POTENTIAL OF SMALL-SCALE ORC SYSTEMS
37
Figure 19. Diagram showing how electricity prices fluctuate depending on the electricity demand. When demand increases, electricity prices rise as well. Used with permission from Energimarknadsinspektionen (EI, 2014).
In a study by Holland and Mansur (2008), it is concluded that by evening out peaks and valleys in electricity demand, for example by increasing the supply using production with low cost and emissions when the demand is high, the emissions and electricity prices could be reduced substantially. In Sweden, electricity demand varies a lot throughout the day because of behavioral and industrial aspects, among others. Activities that could lead to peaks include use of electric lighting, laundry, dishwashing and electric space heating in households, but also the production flow from industries. (Gomes, Henggeler Antunes & Soares, 2014).
The price of electricity is set each hour in a joint power market, run by Nord Pool, which sets the prices day-ahead (Nord Pool, 2019). The gross electricity price is set considering limitations in transmission capacity, based on the equilibrium point between the demand curves and cumulative supply for each hour. The highest price that the purchaser is willing to pay to meet the demand and the most expensive production needed to balance the electricity are both reflected in this price (Nordenstam, 2018). As was mentioned above, the electricity demand changes throughout the day, but also differs a lot depending on the season of the year. Especially noticeable in Sweden, during the winter months, when temperatures decrease and there is an appearing lack of sunlight, the demand for electricity increases. During the summer months, however, the need for space heating or artificial lighting decreases, and so does the demand for electricity, affecting the price of electricity. It is important to note, however, that the supply side has a large impact on the gross electricity price as well. During “wet” periods, when large water flows create a large production of electricity from the hydropower plants, the electricity price often falls. During periods when the Swedish nuclear plants are undergoing revision, the electricity prices tend to rise, all because of the decrease in supply (Nordenstam, 2018).
PERFORMANCE AND POTENTIAL OF SMALL-SCALE ORC SYSTEMS
38
3.2 ECONOMIC EFFECTS
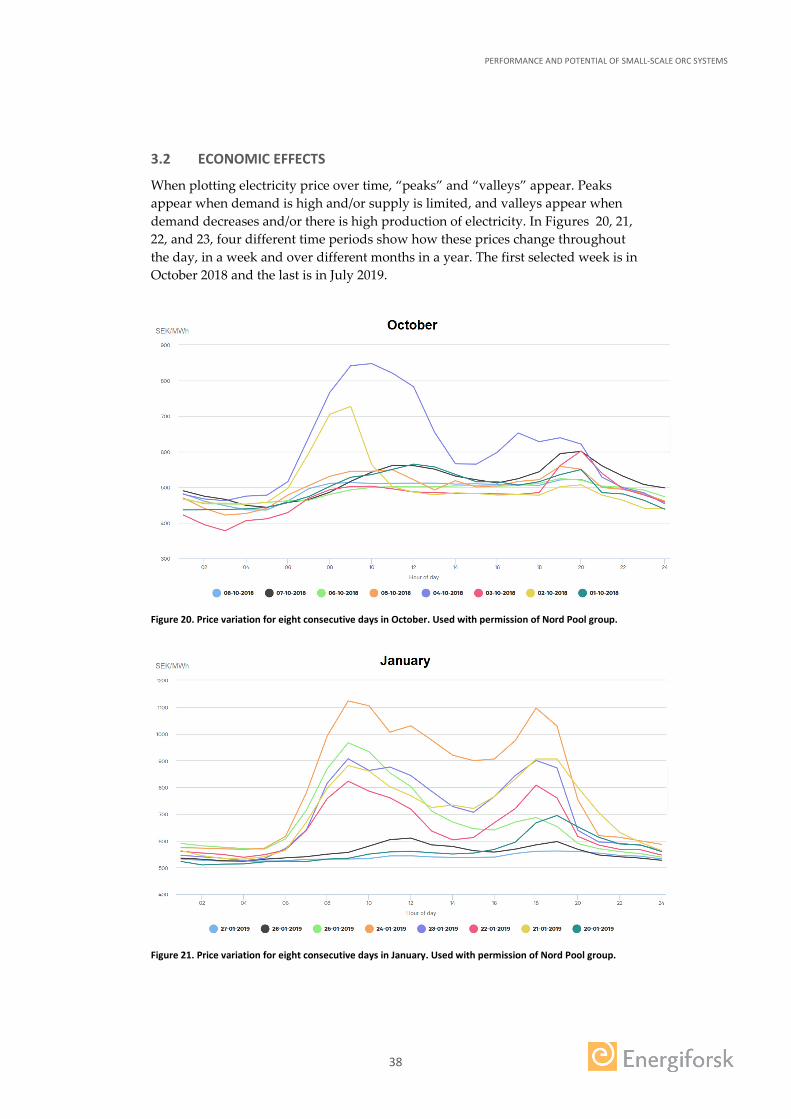
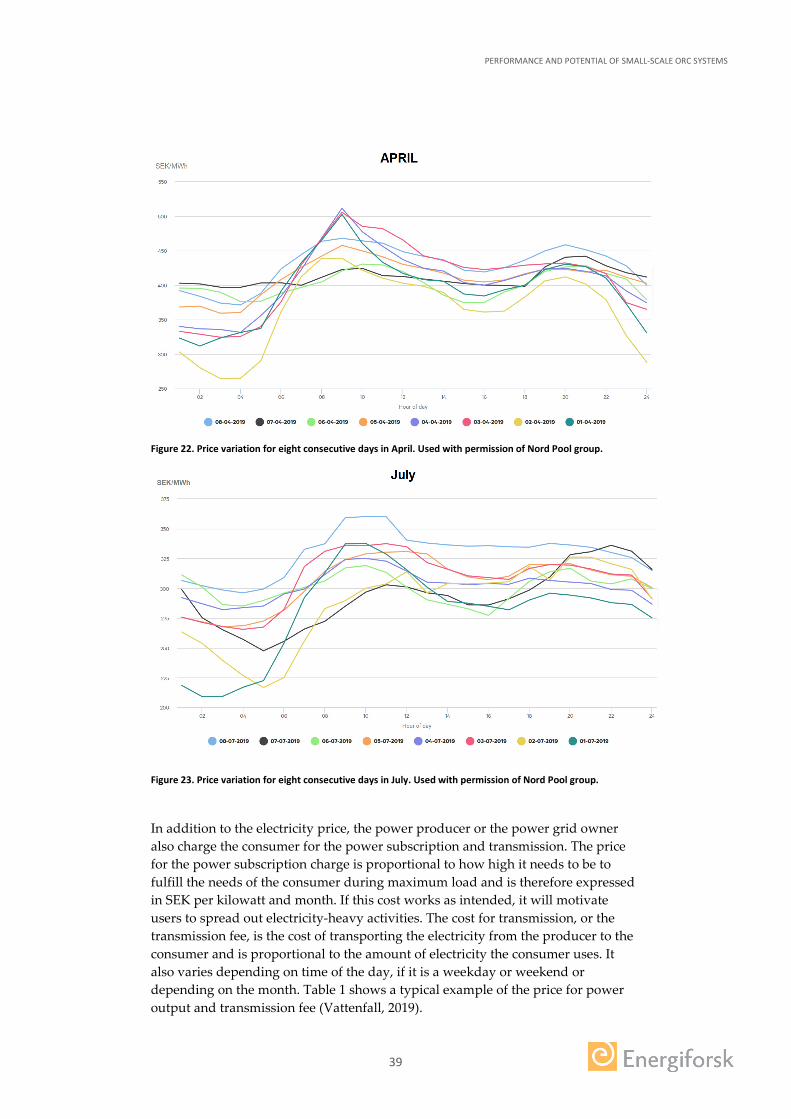
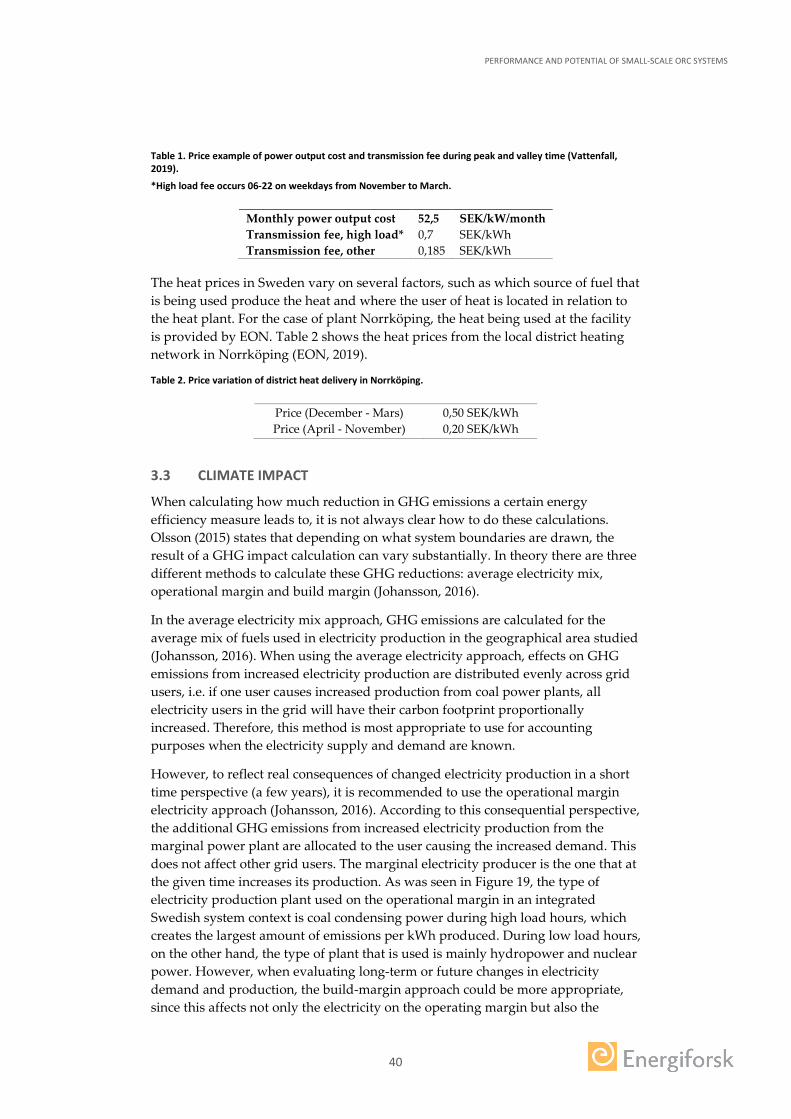
When plotting electricity price over time, “peaks” and “valleys” appear. Peaks appear when demand is high and/or supply is limited, and valleys appear when demand decreases and/or there is high production of electricity. In Figures 20, 21, 22, and 23, four different time periods show how these prices change throughout the day, in a week and over different months in a year. The first selected week is in October 2018 and the last is in July 2019.
Figure 20. Price variation for eight consecutive days in October. Used with permission of Nord Pool group.
Figure 21. Price variation for eight consecutive days in January. Used with permission of Nord Pool group.
PERFORMANCE AND POTENTIAL OF SMALL-SCALE ORC SYSTEMS
39
Figure 22. Price variation for eight consecutive days in April. Used with permission of Nord Pool group.
Figure 23. Price variation for eight consecutive days in July. Used with permission of Nord Pool group.
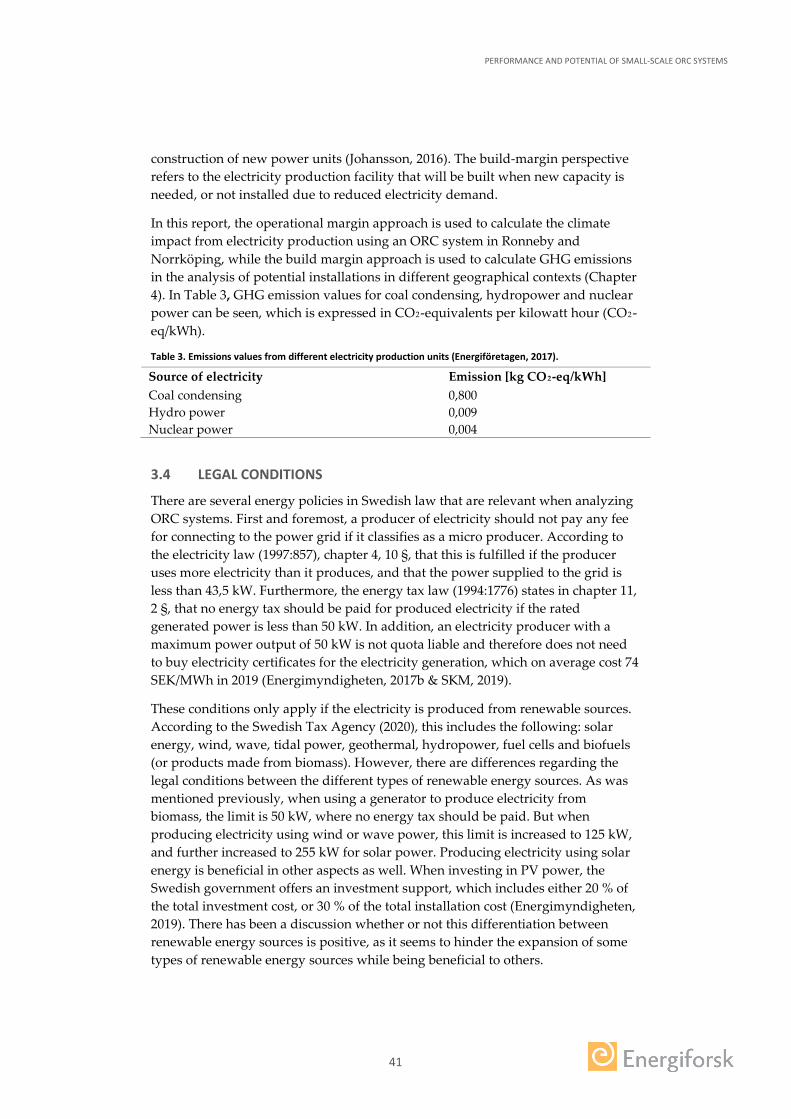
In addition to the electricity price, the power producer or the power grid owner also charge the consumer for the power subscription and transmission. The price for the power subscription charge is proportional to how high it needs to be to fulfill the needs of the consumer during maximum load and is therefore expressed in SEK per kilowatt and month. If this cost works as intended, it will motivate users to spread out electricity-heavy activities. The cost for transmission, or the transmission fee, is the cost of transporting the electricity from the producer to the consumer and is proportional to the amount of electricity the consumer uses. It also varies depending on time of the day, if it is a weekday or weekend or depending on the month. Table 1 shows a typical example of the price for power output and transmission fee (Vattenfall, 2019).
PERFORMANCE AND POTENTIAL OF SMALL-SCALE ORC SYSTEMS
40
Table 1. Price example of power output cost and transmission fee during peak and valley time (Vattenfall, 2019).
*High load fee occurs 06-22 on weekdays from November to March.
Monthly power output cost 52,5 SEK/kW/month Transmission fee, high load* 0,7 SEK/kWh Transmission fee, other 0,185 SEK/kWh
The heat prices in Sweden vary on several factors, such as which source of fuel that is being used produce the heat and where the user of heat is located in relation to the heat plant. For the case of plant Norrköping, the heat being used at the facility is provided by EON. Table 2 shows the heat prices from the local district heating network in Norrköping (EON, 2019).
Table 2. Price variation of district heat delivery in Norrköping.
Price (December - Mars) 0,50 SEK/kWh Price (April - November) 0,20 SEK/kWh
3.3 CLIMATE IMPACT
When calculating how much reduction in GHG emissions a certain energy efficiency measure leads to, it is not always clear how to do these calculations. Olsson (2015) states that depending on what system boundaries are drawn, the result of a GHG impact calculation can vary substantially. In theory there are three different methods to calculate these GHG reductions: average electricity mix, operational margin and build margin (Johansson, 2016).
In the average electricity mix approach, GHG emissions are calculated for the average mix of fuels used in electricity production in the geographical area studied (Johansson, 2016). When using the average electricity approach, effects on GHG emissions from increased electricity production are distributed evenly across grid users, i.e. if one user causes increased production from coal power plants, all electricity users in the grid will have their carbon footprint proportionally increased. Therefore, this method is most appropriate to use for accounting purposes when the electricity supply and demand are known.
However, to reflect real consequences of changed electricity production in a short time perspective (a few years), it is recommended to use the operational margin electricity approach (Johansson, 2016). According to this consequential perspective, the additional GHG emissions from increased electricity production from the marginal power plant are allocated to the user causing the increased demand. This does not affect other grid users. The marginal electricity producer is the one that at the given time increases its production. As was seen in Figure 19, the type of electricity production plant used on the operational margin in an integrated Swedish system context is coal condensing power during high load hours, which creates the largest amount of emissions per kWh produced. During low load hours, on the other hand, the type of plant that is used is mainly hydropower and nuclear power. However, when evaluating long-term or future changes in electricity demand and production, the build-margin approach could be more appropriate, since this affects not only the electricity on the operating margin but also the
PERFORMANCE AND POTENTIAL OF SMALL-SCALE ORC SYSTEMS
41
construction of new power units (Johansson, 2016). The build-margin perspective refers to the electricity production facility that will be built when new capacity is needed, or not installed due to reduced electricity demand.
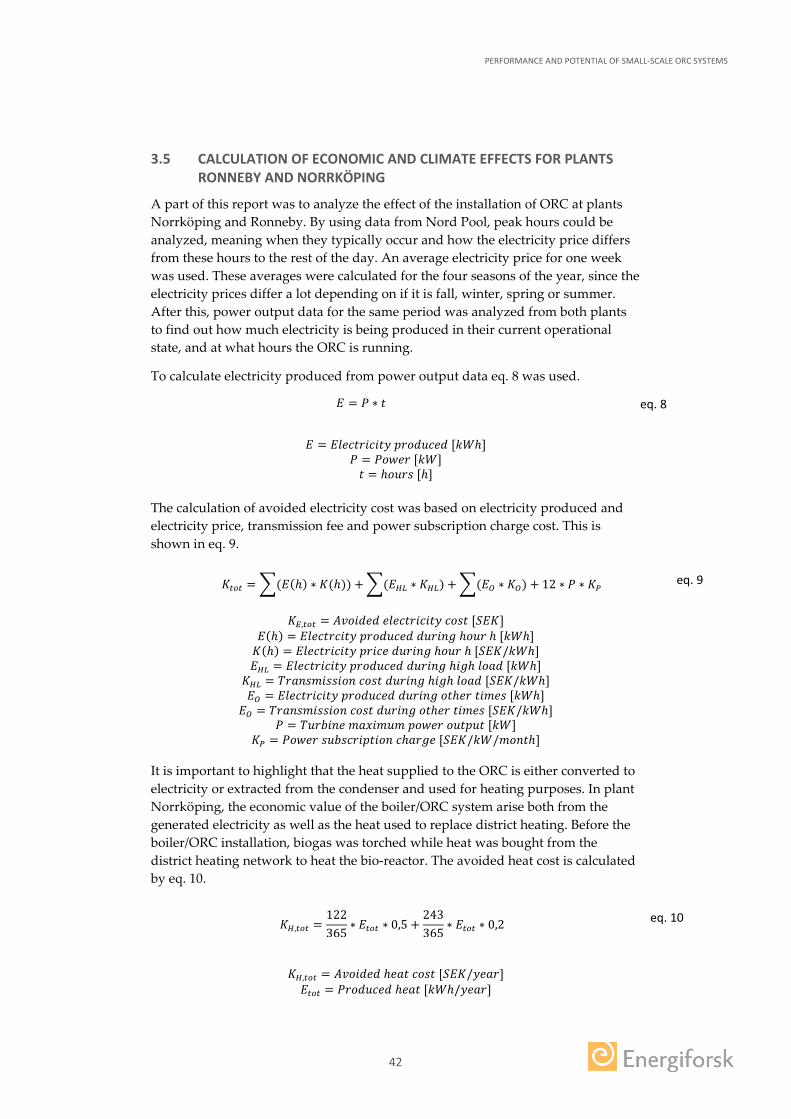
In this report, the operational margin approach is used to calculate the climate impact from electricity production using an ORC system in Ronneby and Norrköping, while the build margin approach is used to calculate GHG emissions in the analysis of potential installations in different geographical contexts (Chapter 4). In Table 3, GHG emission values for coal condensing, hydropower and nuclear power can be seen, which is expressed in CO2-equivalents per kilowatt hour (CO2-eq/kWh).
Table 3. Emissions values from different electricity production units (Energiföretagen, 2017).
Source of electricity Emission [kg CO2-eq/kWh] Coal condensing 0,800 Hydro power 0,009 Nuclear power 0,004
3.4 LEGAL CONDITIONS
There are several energy policies in Swedish law that are relevant when analyzing ORC systems. First and foremost, a producer of electricity should not pay any fee for connecting to the power grid if it classifies as a micro producer. According to the electricity law (1997:857), chapter 4, 10 §, that this is fulfilled if the producer uses more electricity than it produces, and that the power supplied to the grid is less than 43,5 kW. Furthermore, the energy tax law (1994:1776) states in chapter 11, 2 §, that no energy tax should be paid for produced electricity if the rated generated power is less than 50 kW. In addition, an electricity producer with a maximum power output of 50 kW is not quota liable and therefore does not need to buy electricity certificates for the electricity generation, which on average cost 74 SEK/MWh in 2019 (Energimyndigheten, 2017b & SKM, 2019).
These conditions only apply if the electricity is produced from renewable sources. According to the Swedish Tax Agency (2020), this includes the following: solar energy, wind, wave, tidal power, geothermal, hydropower, fuel cells and biofuels (or products made from biomass). However, there are differences regarding the legal conditions between the different types of renewable energy sources. As was mentioned previously, when using a generator to produce electricity from biomass, the limit is 50 kW, where no energy tax should be paid. But when producing electricity using wind or wave power, this limit is increased to 125 kW, and further increased to 255 kW for solar power. Producing electricity using solar energy is beneficial in other aspects as well. When investing in PV power, the Swedish government offers an investment support, which includes either 20 % of the total investment cost, or 30 % of the total installation cost (Energimyndigheten, 2019). There has been a discussion whether or not this differentiation between renewable energy sources is positive, as it seems to hinder the expansion of some types of renewable energy sources while being beneficial to others.
PERFORMANCE AND POTENTIAL OF SMALL-SCALE ORC SYSTEMS
42
3.5 CALCULATION OF ECONOMIC AND CLIMATE EFFECTS FOR PLANTS RONNEBY AND NORRKÖPING
A part of this report was to analyze the effect of the installation of ORC at plants Norrköping and Ronneby. By using data from Nord Pool, peak hours could be analyzed, meaning when they typically occur and how the electricity price differs from these hours to the rest of the day. An average electricity price for one week was used. These averages were calculated for the four seasons of the year, since the electricity prices differ a lot depending on if it is fall, winter, spring or summer. After this, power output data for the same period was analyzed from both plants to find out how much electricity is being produced in their current operational state, and at what hours the ORC is running.
To calculate electricity produced from power output data eq. 8 was used.
𝐸𝐸 = 𝑃𝑃 ∗ 𝑡𝑡 eq. 8
𝐸𝐸 = 𝐸𝐸𝐸𝐸𝐸𝐸𝑐𝑐𝑡𝑡𝐸𝐸𝐸𝐸𝑐𝑐𝐸𝐸𝑡𝑡𝐸𝐸 𝑝𝑝𝐸𝐸𝑝𝑝𝑎𝑎𝑝𝑝𝑐𝑐𝐸𝐸𝑎𝑎 [𝑘𝑘𝑊𝑊ℎ]
𝑃𝑃 = 𝑃𝑃𝑝𝑝𝑃𝑃𝐸𝐸𝐸𝐸 [𝑘𝑘𝑊𝑊] 𝑡𝑡 = ℎ𝑝𝑝𝑝𝑝𝐸𝐸𝑜𝑜 [ℎ]
The calculation of avoided electricity cost was based on electricity produced and electricity price, transmission fee and power subscription charge cost. This is shown in eq. 9.
𝐾𝐾𝐸𝐸,𝑛𝑛𝑡𝑡𝑛𝑛 = 𝐴𝐴𝐴𝐴𝑝𝑝𝐸𝐸𝑎𝑎𝐸𝐸𝑎𝑎 𝐸𝐸𝐸𝐸𝐸𝐸𝑐𝑐𝑡𝑡𝐸𝐸𝐸𝐸𝑐𝑐𝐸𝐸𝑡𝑡𝐸𝐸 𝑐𝑐𝑝𝑝𝑜𝑜𝑡𝑡 [𝑆𝑆𝐸𝐸𝐾𝐾] 𝐸𝐸(ℎ) = 𝐸𝐸𝐸𝐸𝐸𝐸𝑐𝑐𝑡𝑡𝐸𝐸𝑐𝑐𝐸𝐸𝑡𝑡𝐸𝐸 𝑝𝑝𝐸𝐸𝑝𝑝𝑎𝑎𝑝𝑝𝑐𝑐𝐸𝐸𝑎𝑎 𝑎𝑎𝑝𝑝𝐸𝐸𝐸𝐸𝑎𝑎𝑑𝑑 ℎ𝑝𝑝𝑝𝑝𝐸𝐸 ℎ [𝑘𝑘𝑊𝑊ℎ] 𝐾𝐾(ℎ) = 𝐸𝐸𝐸𝐸𝐸𝐸𝑐𝑐𝑡𝑡𝐸𝐸𝐸𝐸𝑐𝑐𝐸𝐸𝑡𝑡𝐸𝐸 𝑝𝑝𝐸𝐸𝐸𝐸𝑐𝑐𝐸𝐸 𝑎𝑎𝑝𝑝𝐸𝐸𝐸𝐸𝑎𝑎𝑑𝑑 ℎ𝑝𝑝𝑝𝑝𝐸𝐸 ℎ [𝑆𝑆𝐸𝐸𝐾𝐾/𝑘𝑘𝑊𝑊ℎ] 𝐸𝐸𝐻𝐻𝐻𝐻 = 𝐸𝐸𝐸𝐸𝐸𝐸𝑐𝑐𝑡𝑡𝐸𝐸𝐸𝐸𝑐𝑐𝐸𝐸𝑡𝑡𝐸𝐸 𝑝𝑝𝐸𝐸𝑝𝑝𝑎𝑎𝑝𝑝𝑐𝑐𝐸𝐸𝑎𝑎 𝑎𝑎𝑝𝑝𝐸𝐸𝐸𝐸𝑎𝑎𝑑𝑑 ℎ𝐸𝐸𝑑𝑑ℎ 𝐸𝐸𝑝𝑝𝑎𝑎𝑎𝑎 [𝑘𝑘𝑊𝑊ℎ]
𝐾𝐾𝐻𝐻𝐻𝐻 = 𝑇𝑇𝐸𝐸𝑎𝑎𝑎𝑎𝑜𝑜𝑚𝑚𝐸𝐸𝑜𝑜𝑜𝑜𝐸𝐸𝑝𝑝𝑎𝑎 𝑐𝑐𝑝𝑝𝑜𝑜𝑡𝑡 𝑎𝑎𝑝𝑝𝐸𝐸𝐸𝐸𝑎𝑎𝑑𝑑 ℎ𝐸𝐸𝑑𝑑ℎ 𝐸𝐸𝑝𝑝𝑎𝑎𝑎𝑎 [𝑆𝑆𝐸𝐸𝐾𝐾/𝑘𝑘𝑊𝑊ℎ] 𝐸𝐸𝑂𝑂 = 𝐸𝐸𝐸𝐸𝐸𝐸𝑐𝑐𝑡𝑡𝐸𝐸𝐸𝐸𝑐𝑐𝐸𝐸𝑡𝑡𝐸𝐸 𝑝𝑝𝐸𝐸𝑝𝑝𝑎𝑎𝑝𝑝𝑐𝑐𝐸𝐸𝑎𝑎 𝑎𝑎𝑝𝑝𝐸𝐸𝐸𝐸𝑎𝑎𝑑𝑑 𝑝𝑝𝑡𝑡ℎ𝐸𝐸𝐸𝐸 𝑡𝑡𝐸𝐸𝑚𝑚𝐸𝐸𝑜𝑜 [𝑘𝑘𝑊𝑊ℎ]
𝐸𝐸𝑂𝑂 = 𝑇𝑇𝐸𝐸𝑎𝑎𝑎𝑎𝑜𝑜𝑚𝑚𝐸𝐸𝑜𝑜𝑜𝑜𝐸𝐸𝑝𝑝𝑎𝑎 𝑐𝑐𝑝𝑝𝑜𝑜𝑡𝑡 𝑎𝑎𝑝𝑝𝐸𝐸𝐸𝐸𝑎𝑎𝑑𝑑 𝑝𝑝𝑡𝑡ℎ𝐸𝐸𝐸𝐸 𝑡𝑡𝐸𝐸𝑚𝑚𝐸𝐸𝑜𝑜 [𝑆𝑆𝐸𝐸𝐾𝐾/𝑘𝑘𝑊𝑊ℎ] 𝑃𝑃 = 𝑇𝑇𝑝𝑝𝐸𝐸𝑇𝑇𝐸𝐸𝑎𝑎𝐸𝐸 𝑚𝑚𝑎𝑎𝑥𝑥𝐸𝐸𝑚𝑚𝑝𝑝𝑚𝑚 𝑝𝑝𝑝𝑝𝑃𝑃𝐸𝐸𝐸𝐸 𝑝𝑝𝑝𝑝𝑡𝑡𝑝𝑝𝑝𝑝𝑡𝑡 [𝑘𝑘𝑊𝑊]
𝐾𝐾𝑃𝑃 = 𝑃𝑃𝑝𝑝𝑃𝑃𝐸𝐸𝐸𝐸 𝑜𝑜𝑝𝑝𝑇𝑇𝑜𝑜𝑐𝑐𝐸𝐸𝐸𝐸𝑝𝑝𝑡𝑡𝐸𝐸𝑝𝑝𝑎𝑎 𝑐𝑐ℎ𝑎𝑎𝐸𝐸𝑑𝑑𝐸𝐸 [𝑆𝑆𝐸𝐸𝐾𝐾/𝑘𝑘𝑊𝑊/𝑚𝑚𝑝𝑝𝑎𝑎𝑡𝑡ℎ]
It is important to highlight that the heat supplied to the ORC is either converted to electricity or extracted from the condenser and used for heating purposes. In plant Norrköping, the economic value of the boiler/ORC system arise both from the generated electricity as well as the heat used to replace district heating. Before the boiler/ORC installation, biogas was torched while heat was bought from the district heating network to heat the bio-reactor. The avoided heat cost is calculated by eq. 10.
𝐾𝐾𝐻𝐻,𝑛𝑛𝑡𝑡𝑛𝑛 = 𝐴𝐴𝐴𝐴𝑝𝑝𝐸𝐸𝑎𝑎𝐸𝐸𝑎𝑎 ℎ𝐸𝐸𝑎𝑎𝑡𝑡 𝑐𝑐𝑝𝑝𝑜𝑜𝑡𝑡 [𝑆𝑆𝐸𝐸𝐾𝐾/𝐸𝐸𝐸𝐸𝑎𝑎𝐸𝐸] 𝐸𝐸𝑛𝑛𝑡𝑡𝑛𝑛 = 𝑃𝑃𝐸𝐸𝑝𝑝𝑎𝑎𝑝𝑝𝑐𝑐𝐸𝐸𝑎𝑎 ℎ𝐸𝐸𝑎𝑎𝑡𝑡 [𝑘𝑘𝑊𝑊ℎ/𝐸𝐸𝐸𝐸𝑎𝑎𝐸𝐸]
𝐾𝐾𝑛𝑛𝑡𝑡𝑛𝑛 = �(𝐸𝐸(ℎ) ∗ 𝐾𝐾(ℎ)) + �(𝐸𝐸𝐻𝐻𝐻𝐻 ∗ 𝐾𝐾𝐻𝐻𝐻𝐻) + �(𝐸𝐸𝑂𝑂 ∗ 𝐾𝐾𝑂𝑂) + 12 ∗ 𝑃𝑃 ∗ 𝐾𝐾𝑃𝑃 eq. 9
𝐾𝐾𝐻𝐻,𝑛𝑛𝑡𝑡𝑛𝑛 =122365
∗ 𝐸𝐸𝑛𝑛𝑡𝑡𝑛𝑛 ∗ 0,5 +243365
∗ 𝐸𝐸𝑛𝑛𝑡𝑡𝑛𝑛 ∗ 0,2 eq. 10
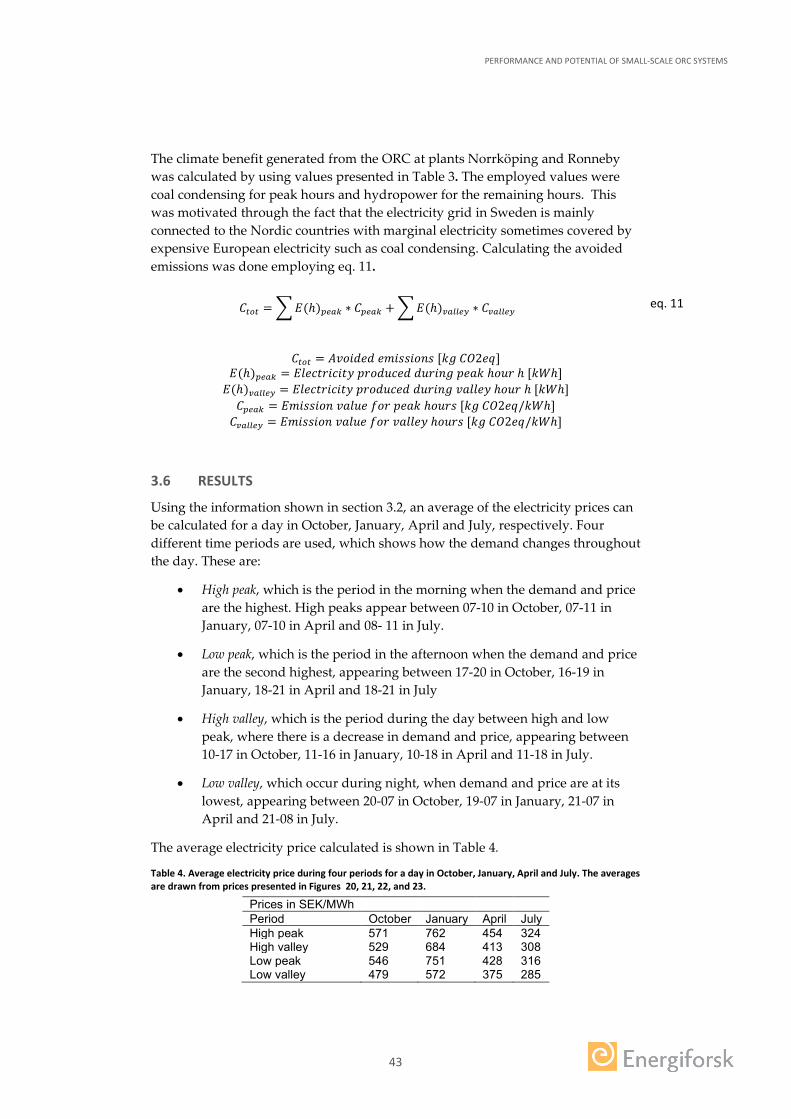
PERFORMANCE AND POTENTIAL OF SMALL-SCALE ORC SYSTEMS
43
The climate benefit generated from the ORC at plants Norrköping and Ronneby was calculated by using values presented in Table 3. The employed values were coal condensing for peak hours and hydropower for the remaining hours. This was motivated through the fact that the electricity grid in Sweden is mainly connected to the Nordic countries with marginal electricity sometimes covered by expensive European electricity such as coal condensing. Calculating the avoided emissions was done employing eq. 11.
𝐶𝐶𝑛𝑛𝑡𝑡𝑛𝑛 = 𝐴𝐴𝐴𝐴𝑝𝑝𝐸𝐸𝑎𝑎𝐸𝐸𝑎𝑎 𝐸𝐸𝑚𝑚𝐸𝐸𝑜𝑜𝑜𝑜𝐸𝐸𝑝𝑝𝑎𝑎𝑜𝑜 [𝑘𝑘𝑑𝑑 𝐶𝐶𝐶𝐶2𝐸𝐸𝑒𝑒]
𝐸𝐸(ℎ)𝑝𝑝𝑒𝑒𝑒𝑒𝑝𝑝 = 𝐸𝐸𝐸𝐸𝐸𝐸𝑐𝑐𝑡𝑡𝐸𝐸𝐸𝐸𝑐𝑐𝐸𝐸𝑡𝑡𝐸𝐸 𝑝𝑝𝐸𝐸𝑝𝑝𝑎𝑎𝑝𝑝𝑐𝑐𝐸𝐸𝑎𝑎 𝑎𝑎𝑝𝑝𝐸𝐸𝐸𝐸𝑎𝑎𝑑𝑑 𝑝𝑝𝐸𝐸𝑎𝑎𝑘𝑘 ℎ𝑝𝑝𝑝𝑝𝐸𝐸 ℎ [𝑘𝑘𝑊𝑊ℎ] 𝐸𝐸(ℎ)𝑒𝑒𝑒𝑒𝑒𝑒𝑒𝑒𝑒𝑒𝑐𝑐 = 𝐸𝐸𝐸𝐸𝐸𝐸𝑐𝑐𝑡𝑡𝐸𝐸𝐸𝐸𝑐𝑐𝐸𝐸𝑡𝑡𝐸𝐸 𝑝𝑝𝐸𝐸𝑝𝑝𝑎𝑎𝑝𝑝𝑐𝑐𝐸𝐸𝑎𝑎 𝑎𝑎𝑝𝑝𝐸𝐸𝐸𝐸𝑎𝑎𝑑𝑑 𝐴𝐴𝑎𝑎𝐸𝐸𝐸𝐸𝐸𝐸𝐸𝐸 ℎ𝑝𝑝𝑝𝑝𝐸𝐸 ℎ [𝑘𝑘𝑊𝑊ℎ] 𝐶𝐶𝑝𝑝𝑒𝑒𝑒𝑒𝑝𝑝 = 𝐸𝐸𝑚𝑚𝐸𝐸𝑜𝑜𝑜𝑜𝐸𝐸𝑝𝑝𝑎𝑎 𝐴𝐴𝑎𝑎𝐸𝐸𝑝𝑝𝐸𝐸 𝑓𝑓𝑝𝑝𝐸𝐸 𝑝𝑝𝐸𝐸𝑎𝑎𝑘𝑘 ℎ𝑝𝑝𝑝𝑝𝐸𝐸𝑜𝑜 [𝑘𝑘𝑑𝑑 𝐶𝐶𝐶𝐶2𝐸𝐸𝑒𝑒/𝑘𝑘𝑊𝑊ℎ] 𝐶𝐶𝑒𝑒𝑒𝑒𝑒𝑒𝑒𝑒𝑒𝑒𝑐𝑐 = 𝐸𝐸𝑚𝑚𝐸𝐸𝑜𝑜𝑜𝑜𝐸𝐸𝑝𝑝𝑎𝑎 𝐴𝐴𝑎𝑎𝐸𝐸𝑝𝑝𝐸𝐸 𝑓𝑓𝑝𝑝𝐸𝐸 𝐴𝐴𝑎𝑎𝐸𝐸𝐸𝐸𝐸𝐸𝐸𝐸 ℎ𝑝𝑝𝑝𝑝𝐸𝐸𝑜𝑜 [𝑘𝑘𝑑𝑑 𝐶𝐶𝐶𝐶2𝐸𝐸𝑒𝑒/𝑘𝑘𝑊𝑊ℎ]
3.6 RESULTS
Using the information shown in section 3.2, an average of the electricity prices can be calculated for a day in October, January, April and July, respectively. Four different time periods are used, which shows how the demand changes throughout the day. These are:
• High peak, which is the period in the morning when the demand and price are the highest. High peaks appear between 07-10 in October, 07-11 in January, 07-10 in April and 08- 11 in July.
• Low peak, which is the period in the afternoon when the demand and price are the second highest, appearing between 17-20 in October, 16-19 in January, 18-21 in April and 18-21 in July
• High valley, which is the period during the day between high and low peak, where there is a decrease in demand and price, appearing between 10-17 in October, 11-16 in January, 10-18 in April and 11-18 in July.
• Low valley, which occur during night, when demand and price are at its lowest, appearing between 20-07 in October, 19-07 in January, 21-07 in April and 21-08 in July.
The average electricity price calculated is shown in Table 4.
Table 4. Average electricity price during four periods for a day in October, January, April and July. The averages are drawn from prices presented in Figures 20, 21, 22, and 23.
Prices in SEK/MWh Period October January April July High peak 571 762 454 324 High valley 529 684 413 308 Low peak 546 751 428 316 Low valley 479 572 375 285
𝐶𝐶𝑛𝑛𝑡𝑡𝑛𝑛 = �𝐸𝐸(ℎ)𝑝𝑝𝑒𝑒𝑒𝑒𝑝𝑝 ∗ 𝐶𝐶𝑝𝑝𝑒𝑒𝑒𝑒𝑝𝑝 + �𝐸𝐸(ℎ)𝑒𝑒𝑒𝑒𝑒𝑒𝑒𝑒𝑒𝑒𝑐𝑐 ∗ 𝐶𝐶𝑒𝑒𝑒𝑒𝑒𝑒𝑒𝑒𝑒𝑒𝑐𝑐 eq. 11
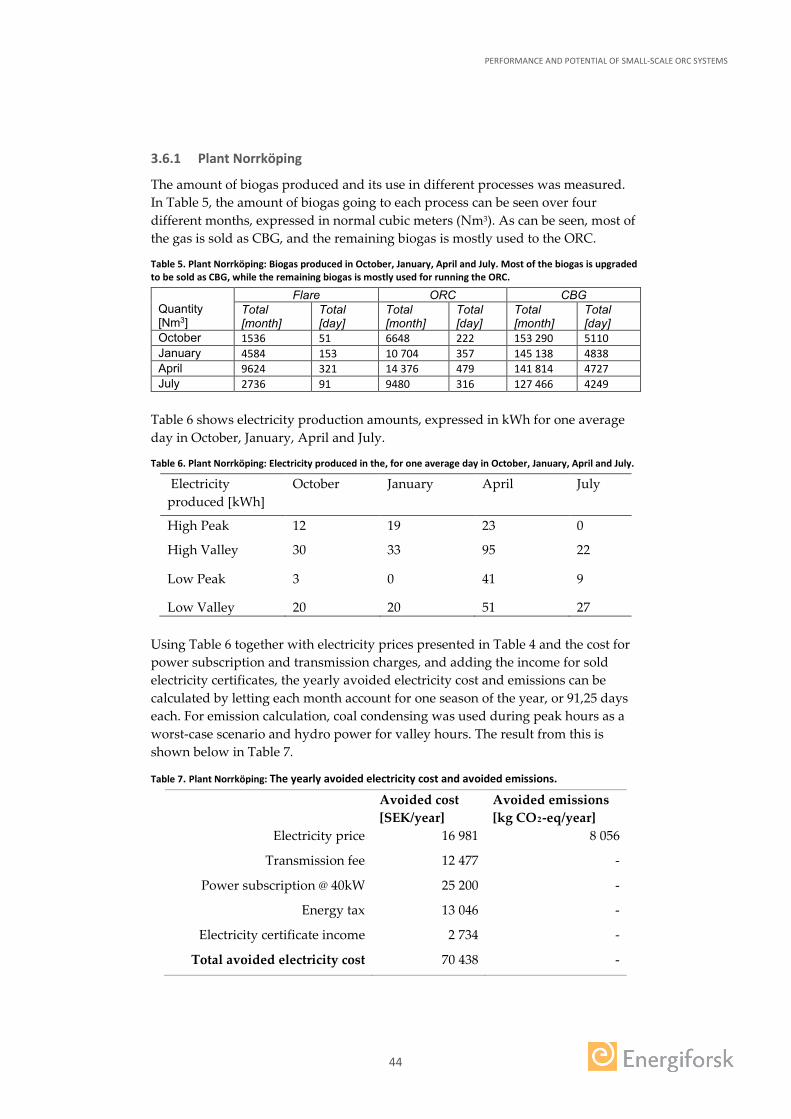
PERFORMANCE AND POTENTIAL OF SMALL-SCALE ORC SYSTEMS
44
3.6.1 Plant Norrköping
The amount of biogas produced and its use in different processes was measured. In Table 5, the amount of biogas going to each process can be seen over four different months, expressed in normal cubic meters (Nm3). As can be seen, most of the gas is sold as CBG, and the remaining biogas is mostly used to the ORC.
Table 5. Plant Norrköping: Biogas produced in October, January, April and July. Most of the biogas is upgraded to be sold as CBG, while the remaining biogas is mostly used for running the ORC.
Quantity [Nm3]
Flare ORC CBG Total [month]
Total [day]
Total [month]
Total [day]
Total [month]
Total [day]
October 1536 51 6648 222 153 290 5110 January 4584 153 10 704 357 145 138 4838 April 9624 321 14 376 479 141 814 4727 July 2736 91 9480 316 127 466 4249
Table 6 shows electricity production amounts, expressed in kWh for one average day in October, January, April and July.
Table 6. Plant Norrköping: Electricity produced in the, for one average day in October, January, April and July.
Electricity produced [kWh]
October January April July
High Peak 12 19 23 0
High Valley 30 33 95 22
Low Peak 3 0 41 9
Low Valley 20 20 51 27 Using Table 6 together with electricity prices presented in Table 4 and the cost for power subscription and transmission charges, and adding the income for sold electricity certificates, the yearly avoided electricity cost and emissions can be calculated by letting each month account for one season of the year, or 91,25 days each. For emission calculation, coal condensing was used during peak hours as a worst-case scenario and hydro power for valley hours. The result from this is shown below in Table 7.
Table 7. Plant Norrköping: The yearly avoided electricity cost and avoided emissions.
Avoided cost [SEK/year]
Avoided emissions [kg CO2-eq/year]
Electricity price 16 981 8 056
Transmission fee 12 477 -
Power subscription @ 40kW 25 200 -
Energy tax 13 046 -
Electricity certificate income 2 734 -
Total avoided electricity cost 70 438 -
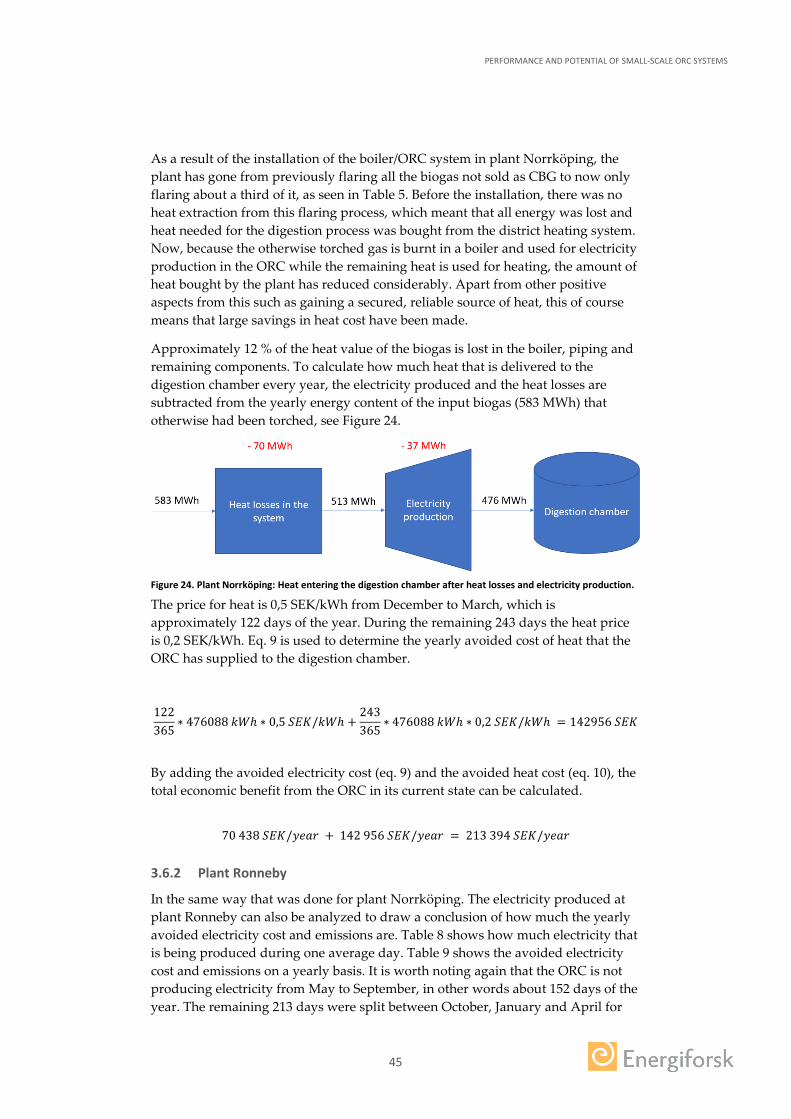
PERFORMANCE AND POTENTIAL OF SMALL-SCALE ORC SYSTEMS
45
As a result of the installation of the boiler/ORC system in plant Norrköping, the plant has gone from previously flaring all the biogas not sold as CBG to now only flaring about a third of it, as seen in Table 5. Before the installation, there was no heat extraction from this flaring process, which meant that all energy was lost and heat needed for the digestion process was bought from the district heating system. Now, because the otherwise torched gas is burnt in a boiler and used for electricity production in the ORC while the remaining heat is used for heating, the amount of heat bought by the plant has reduced considerably. Apart from other positive aspects from this such as gaining a secured, reliable source of heat, this of course means that large savings in heat cost have been made.
Approximately 12 % of the heat value of the biogas is lost in the boiler, piping and remaining components. To calculate how much heat that is delivered to the digestion chamber every year, the electricity produced and the heat losses are subtracted from the yearly energy content of the input biogas (583 MWh) that otherwise had been torched, see Figure 24.
Figure 24. Plant Norrköping: Heat entering the digestion chamber after heat losses and electricity production.
The price for heat is 0,5 SEK/kWh from December to March, which is approximately 122 days of the year. During the remaining 243 days the heat price is 0,2 SEK/kWh. Eq. 9 is used to determine the yearly avoided cost of heat that the ORC has supplied to the digestion chamber.
122365
∗ 476088 𝑘𝑘𝑊𝑊ℎ ∗ 0,5 𝑆𝑆𝐸𝐸𝐾𝐾/𝑘𝑘𝑊𝑊ℎ +243365
∗ 476088 𝑘𝑘𝑊𝑊ℎ ∗ 0,2 𝑆𝑆𝐸𝐸𝐾𝐾/𝑘𝑘𝑊𝑊ℎ = 142956 𝑆𝑆𝐸𝐸𝐾𝐾
By adding the avoided electricity cost (eq. 9) and the avoided heat cost (eq. 10), the total economic benefit from the ORC in its current state can be calculated.
70 438 𝑆𝑆𝐸𝐸𝐾𝐾/𝐸𝐸𝐸𝐸𝑎𝑎𝐸𝐸 + 142 956 𝑆𝑆𝐸𝐸𝐾𝐾/𝐸𝐸𝐸𝐸𝑎𝑎𝐸𝐸 = 213 394 𝑆𝑆𝐸𝐸𝐾𝐾/𝐸𝐸𝐸𝐸𝑎𝑎𝐸𝐸
3.6.2 Plant Ronneby
In the same way that was done for plant Norrköping. The electricity produced at plant Ronneby can also be analyzed to draw a conclusion of how much the yearly avoided electricity cost and emissions are. Table 8 shows how much electricity that is being produced during one average day. Table 9 shows the avoided electricity cost and emissions on a yearly basis. It is worth noting again that the ORC is not producing electricity from May to September, in other words about 152 days of the year. The remaining 213 days were split between October, January and April for
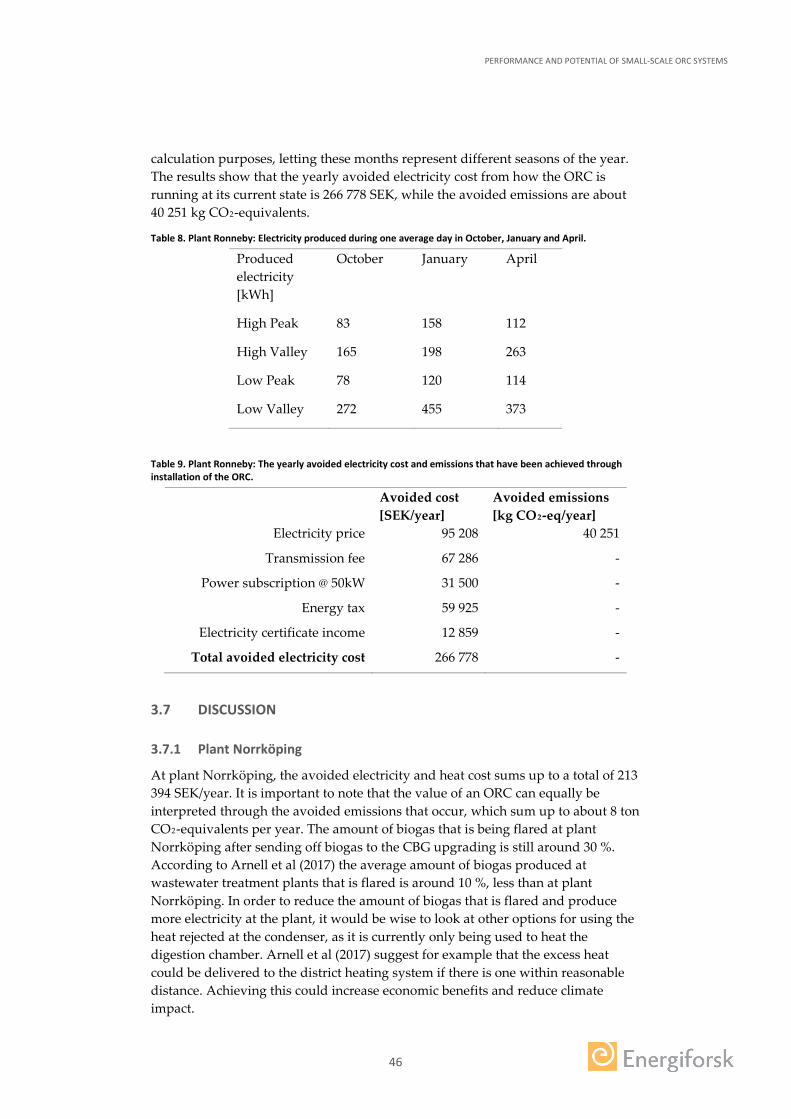
PERFORMANCE AND POTENTIAL OF SMALL-SCALE ORC SYSTEMS
46
calculation purposes, letting these months represent different seasons of the year. The results show that the yearly avoided electricity cost from how the ORC is running at its current state is 266 778 SEK, while the avoided emissions are about 40 251 kg CO2-equivalents.
Table 8. Plant Ronneby: Electricity produced during one average day in October, January and April.
Produced electricity [kWh]
October January April
High Peak 83 158 112
High Valley 165 198 263
Low Peak 78 120 114
Low Valley 272 455 373
Table 9. Plant Ronneby: The yearly avoided electricity cost and emissions that have been achieved through installation of the ORC.
Avoided cost [SEK/year]
Avoided emissions [kg CO2-eq/year]
Electricity price 95 208 40 251
Transmission fee 67 286 -
Power subscription @ 50kW 31 500 -
Energy tax 59 925 -
Electricity certificate income 12 859 -
Total avoided electricity cost 266 778 -
3.7 DISCUSSION
3.7.1 Plant Norrköping
At plant Norrköping, the avoided electricity and heat cost sums up to a total of 213 394 SEK/year. It is important to note that the value of an ORC can equally be interpreted through the avoided emissions that occur, which sum up to about 8 ton CO2-equivalents per year. The amount of biogas that is being flared at plant Norrköping after sending off biogas to the CBG upgrading is still around 30 %. According to Arnell et al (2017) the average amount of biogas produced at wastewater treatment plants that is flared is around 10 %, less than at plant Norrköping. In order to reduce the amount of biogas that is flared and produce more electricity at the plant, it would be wise to look at other options for using the heat rejected at the condenser, as it is currently only being used to heat the digestion chamber. Arnell et al (2017) suggest for example that the excess heat could be delivered to the district heating system if there is one within reasonable distance. Achieving this could increase economic benefits and reduce climate impact.
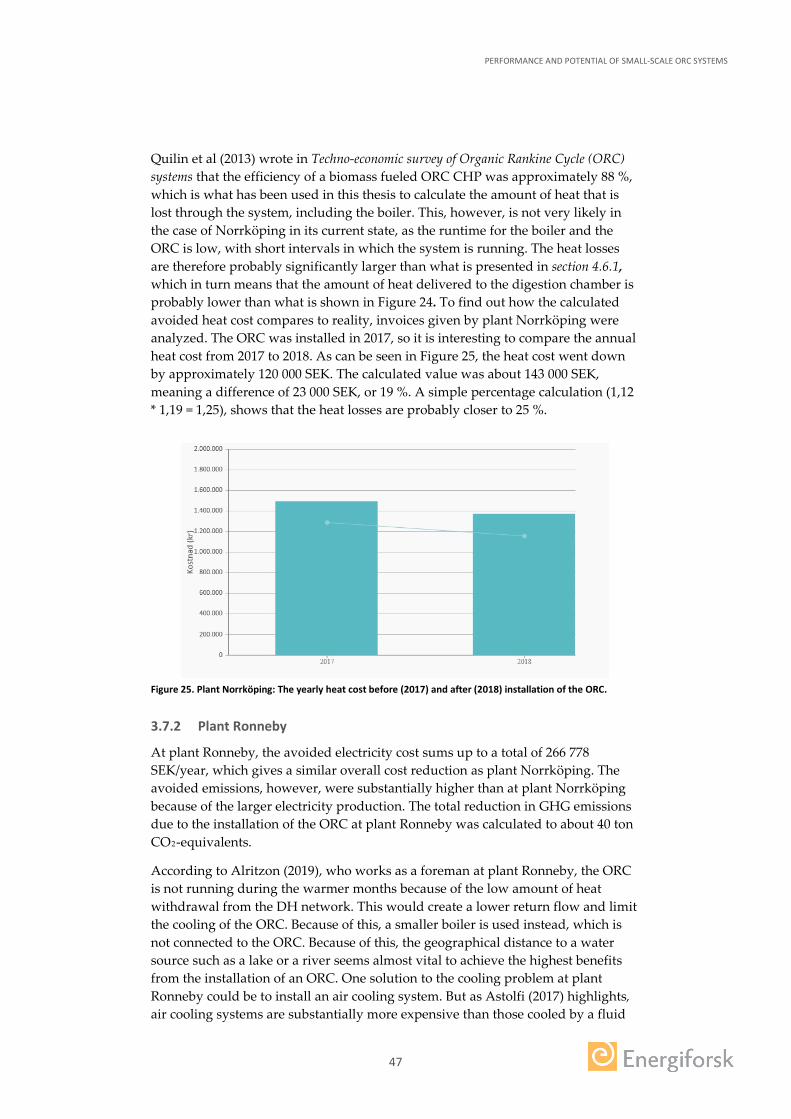
PERFORMANCE AND POTENTIAL OF SMALL-SCALE ORC SYSTEMS
47
Quilin et al (2013) wrote in Techno-economic survey of Organic Rankine Cycle (ORC) systems that the efficiency of a biomass fueled ORC CHP was approximately 88 %, which is what has been used in this thesis to calculate the amount of heat that is lost through the system, including the boiler. This, however, is not very likely in the case of Norrköping in its current state, as the runtime for the boiler and the ORC is low, with short intervals in which the system is running. The heat losses are therefore probably significantly larger than what is presented in section 4.6.1, which in turn means that the amount of heat delivered to the digestion chamber is probably lower than what is shown in Figure 24. To find out how the calculated avoided heat cost compares to reality, invoices given by plant Norrköping were analyzed. The ORC was installed in 2017, so it is interesting to compare the annual heat cost from 2017 to 2018. As can be seen in Figure 25, the heat cost went down by approximately 120 000 SEK. The calculated value was about 143 000 SEK, meaning a difference of 23 000 SEK, or 19 %. A simple percentage calculation (1,12 * 1,19 = 1,25), shows that the heat losses are probably closer to 25 %.
Figure 25. Plant Norrköping: The yearly heat cost before (2017) and after (2018) installation of the ORC.
3.7.2 Plant Ronneby
At plant Ronneby, the avoided electricity cost sums up to a total of 266 778 SEK/year, which gives a similar overall cost reduction as plant Norrköping. The avoided emissions, however, were substantially higher than at plant Norrköping because of the larger electricity production. The total reduction in GHG emissions due to the installation of the ORC at plant Ronneby was calculated to about 40 ton CO2-equivalents.
According to Alritzon (2019), who works as a foreman at plant Ronneby, the ORC is not running during the warmer months because of the low amount of heat withdrawal from the DH network. This would create a lower return flow and limit the cooling of the ORC. Because of this, a smaller boiler is used instead, which is not connected to the ORC. Because of this, the geographical distance to a water source such as a lake or a river seems almost vital to achieve the highest benefits from the installation of an ORC. One solution to the cooling problem at plant Ronneby could be to install an air cooling system. But as Astolfi (2017) highlights, air cooling systems are substantially more expensive than those cooled by a fluid

PERFORMANCE AND POTENTIAL OF SMALL-SCALE ORC SYSTEMS
48
because of the large heat exchanger area needed. Because of this, cooling the excess heat during warmer months at plant Ronneby by air is most likely not economic feasible, especially since the heat demand is rather low and would not lead to a lot of produced electricity.
Because of the larger and more consistent amounts of heat flowing through the ORC system at plant Ronneby compared to plant Norrköping, it is also more affected by the Swedish legislation. When analyzing the power output data at plant Norrköping it becomes clear that there is a big potential in producing more electricity at the plant. However, since the energy tax law (1993:1776) states that a maximum power of 50 kW is allowed before energy taxes applies, plant Ronneby is constrained by the economic aspect to install a turbine of higher capacity. This is unfortunate, as every kWh of electricity from renewable sources will help decreasing GHG emissions. For future studies, it would be interesting to analyze how the legislation affects small-scale electricity production on a larger system level, including more types of producers such as solar PV and wind. This could help to determine whether there is a value of the legislation on a larger scale and provide policymakers an information base for future legislation, if an increased amount of small-scale electricity production is desired.
3.7.3 Potential systems improvements
In the case of plant Norrköping, the ORC can only run when there is a heat demand in the digestion chamber, as there is no other heat load connected to the plant at present. A possible solution to this is to install piping and one additional heat exchanger and send the rejected condenser heat to the large sedimentation pools at the plant. The bacteria in these pools thrive in warmer water, which makes it an ideal solution. If this is combined with moving the electricity production to high demand hours, higher economic and climate benefits can be achieved, as during periods of high demand the electricity price is at its highest and higher GHG emissions are released per kWh of electricity produced. The result of implementing this suggestion can be calculated and can be seen in Table 10.
Table 10. Plant Norrköping: Total avoided electricity cost and CO2 emissions for one year that could be achieved.
Avoided cost [SEK/year]
Avoided emissions [kg CO2-eq/year]
Electricity price 30 808 40 043
Transmission fee 23 784 -
Power demand cost @ 40kW 25 200 -
Energy tax 21 447 -
Electricity certificate income 4 496 -
Total avoided electricity cost 105 735 -
In the case of plant Ronneby, it is substantially more difficult to implement improvements to the system, as it would require a larger heat demand in the DH network, or some other way of using the heat. If an alternative heat load is

PERFORMANCE AND POTENTIAL OF SMALL-SCALE ORC SYSTEMS
49
available, however, the production of electricity could be moved to hours of high demand. The results from this theoretical case can be seen below in Table 11.
Table 11. Plant Ronneby: Total avoided electricity cost and emissions for one year that could be achieved.
Avoided cost [SEK/year]
Avoided emissions [kg CO2-eq/year]
Electricity price 98 646 55 696
Transmission fee 80 680 -
Power demand cost @ 50 kW 31 500 -
Energy tax 61 341 -
Electricity certificate income 12 859 -
Total avoided electricity cost 285 026 -
As can be seen from tables Table 10 and Table 11, the avoided electricity cost would increase by a factor of 1.5 and avoided emissions by a factor of 4.97 at plant Norrköping. For plant Ronneby the avoided electricity cost would increase by a factor of 1.07 and the emissions by a factor of 1.38.
PERFORMANCE AND POTENTIAL OF SMALL-SCALE ORC SYSTEMS
50
4 Generalizability and potential assessment
This section is about generalizability and potential assessment for small-scale electricity production in different geographical contexts. The focus is on the installation of ORC technology on existing biomass-fired boilers with no electricity production today. Economic and climate effects are studied in three countries with different climates and energy market conditions, namely Sweden, the UK and Brazil.
4.1 CASES STUDIED
4.1.1 Sweden
In Sweden, all major cities and towns have district heating systems (Werner, 2017b). Often the large systems have combined heat and power production, while the small systems mainly produce heat with no electricity production. In these small systems, there is a potential to install ORC, which uses heat from the boilers to produce electricity and heat. In this study, we assume that the ORC is installed in a small Swedish district heating system and that the heat output from the system must be the same as before the ORC installation. Therefore, there will be an increased demand for biomass to the boilers to produce the heat that is needed for electricity production. The electricity is supposed to be used in-house by the heating plant, which results in avoided costs for purchased electricity and grid costs. In Sweden, there is a support for renewable electricity production. The renewable electricity certificate system is a market-oriented approach which results in a premium for electricity produced by renewable sources (Energimyndigheten, 2020c). The average spot price of the certificates in 2019 was 7,37 EUR/MWh, and the volume-weighted average price was 10,76 EUR/MWh. Eligible production is awarded electricity certificates for 15 years, and the scheme is planned to be terminated in 2045. However, there are proposed legislative changes to close the system for new entrants by 2022 (Energimyndigheten, 2020c). In addition, there are a number of tax regulations that are relevant for the case of ORC electricity production in this study. Electricity production in micro producers (up to 50 kW), either for self-consumption or to injection into the grid, is exempt from electricity tax (Energimyndigheten, 2020b). This limit is set to increase to 100 kW. Connections of electricity production up to 69 kW, where the main fuse in the connection point does not exceed 100A, are eligible to a general tax deduction of 59 EUR/MWh, but limited to 30 MWh per year, or to the amount of electricity bought from the grid. The current electricity tax (2020) is set at 33,40 EUR/MWh (41,75 EUR/MWh including VAT). Regardless of the installed power of electricity self-production, a tax reduction to 0,5 EUR/MWh is applied for the share of electricity used in-house. Other relevant costs in the electricity system are the power subscription charge and transmission costs, which depend on a number of factors, but corresponds to around 50 EUR/MWh (Energimyndigheten, 2020a).
PERFORMANCE AND POTENTIAL OF SMALL-SCALE ORC SYSTEMS
51
4.1.2 The UK
In the UK, the market for district heating is quite small. However, the government has set a target that 17% of the heating demand shall be met by district heating networks by 2030 (Euroheat & Power, 2019). Therefore, the ORC is not considered to be installed in a district heating system. Instead, the ORC installation is assumed to be implemented at an industrial company with a demand for process heat. Here, we analyze two cases: UK1 where the company already has its own biomass boiler in place that covers the heat demand. The company buys the biomass to the boiler. To cover the company’s heat demand, the heat output from the boiler and ORC system must be the same as the heat that was produced by the boiler before the ORC installation. Hence, there will be an increased purchase of biomass to the boiler to satisfy the production of heat that is converted to electricity. UK2 where the company has large amounts of excess heat in flue gases and the ORC uses the heat to produce electricity. In this case the heat is considered free and no biomass needs to be purchased. The electricity is supposed to be used in-house by the company in both cases, with the implication that they avoid costs for purchasing equivalent amount from the grid (including electricity costs and grid costs). The most relevant policy related to renewable electricity production is the Smart Export Guarantee (SEG), which came into effect in 2020 as a replacement for the previous feed-in tariff scheme. The SEG obliges electricity suppliers to buy electricity surplus from renewable sources, and applies to micro-CHP electricity generation up to 50 kWel (Ofgem, 2020). While there is no minimum price guarantee for generators, the government has a reference system sell price of 66,7 EUR/MWh. However, this price is only about 46% of the average electricity prices for non-residential users (BEIS, 2020), which should favor self-production for internal use. In the heat market, the Non-Domestic Renewable Heat Incentive (RHI) scheme provides financial compensation for 20 years to heat production from eligible renewable sources and heat pumps. As of 2020, the rate of support is approximately 50 EUR/MWhheat (ICAX, 2020).
4.1.3 Brazil
Brazil has no district heating systems. Agro-industry is one of the most important industries in Brazil, e.g. production of livestock, coffee, soybeans, wheat, rice, corn, sugarcane, citrus and cocoa (Alves, 2020). It is worth mentioning that e.g., sugar cane mills use the waste from the sugar canes as fuel in boilers to produce heat to the production processes. However, the amount of biomass waste is higher than the demand for process heat production. Therefore, the waste is sometimes burnt without energy recovery, just to get rid of it. The National Energy Plan 2030 (MME, 2007) does have provisions for the larger adoption of biomass co-generation in CHP plants, especially using sugar cane bagasse. For the Brazilian case, it is assumed that the ORC is installed at an agro-industry, such as a sugar cane mill, and since there is a heat excess it is assumed that no additional biomass has to be purchased to cover for the electricity production. The electricity is supposed to be used in-house by the industry, and hence the company needs to buy less electricity from the grid. The electricity market in Brazil is partially regulated and partially deregulated, depending on the power demand of the consumer. In general, consumers with a power demand below 500 kW are captive consumers, which can
PERFORMANCE AND POTENTIAL OF SMALL-SCALE ORC SYSTEMS
52
only contract with the power distribution company of the region. The regulated market corresponds to 70 % of the total power demand, and has prices approved by ANEEL, the national electricity market regulatory agency (ANEEL, 2020). From January 2020 onwards, the deregulated market is accessible to users with a contracted demand above 2000 kW, in which are free to trade electricity in the Electric Energy Trading Chamber (CCEE, 2020). Consumers with a total demand between 500 kW and 3000 kW are allowed to trade in the deregulated market only for electricity from certain renewable sources, which include solar, wind, biomass and small-scale hydropower. The benefit of contracting renewable generation from these sources is that they are exempt from transmission and distribution fees, which are on average between 3,70 and 9,38 EUR/MWh (Enel, 2018). One more regulation that is relevant in the electricity sector is the ANEEL Resolution 482/2012, which introduced a simplified scheme for distributed generation of micro (up to 75 kW) and mini-scale (between 75 kW and 5 MW) renewable sources (ANEEL, 2012). Electricity distribution companies must allow customers covered in this scheme to inject electricity into the grid and receive credits for it. Customers pay no connection fees, electricity produced is exempt from distribution and transmission charges and certain taxes, and the credits obtained from electricity supplied to the grid are valid for 60 months.
4.2 SYSTEM BOUNDARIES
To understand the potential benefits of adopting ORC equipment, both in economic and environmental terms, it is important to understand the surrounding energy system and the regional characteristics. For example, looking at only the system boundaries of the boiler and ORC installation (nominated System studied in Figure 26), there could be a clear advantage for this single system in replacing direct heat deliveries from a boiler with an ORC machine delivering heat and electricity. However, by using consequential analysis with system expansion (see Chapter 3.3 for an explanation), additional aspects are considered. In the analysis of the Swedish and the UK cases, the system is assumed to be part of a European market for electricity and biomass. One major influence in the results is whether or not biomass is considered a limited resource and if the electricity production that will be built in the future is going to be GHG neutral (e.g. wind and nuclear) or fossil-dependent (e.g. natural gas combined cycle (NGCC) or coal-fired plants combined with CCS). These are aspects that must be taken into account when analyzing the broader picture of an energy system.
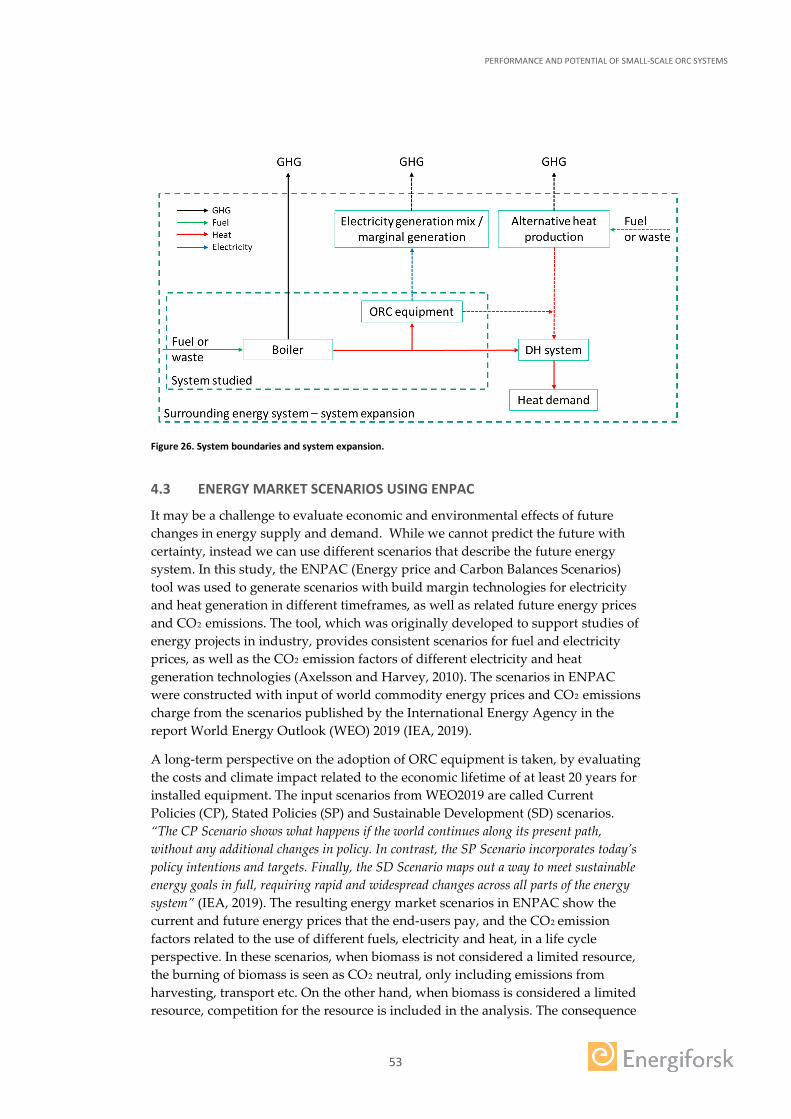
PERFORMANCE AND POTENTIAL OF SMALL-SCALE ORC SYSTEMS
53
Figure 26. System boundaries and system expansion.
4.3 ENERGY MARKET SCENARIOS USING ENPAC
It may be a challenge to evaluate economic and environmental effects of future changes in energy supply and demand. While we cannot predict the future with certainty, instead we can use different scenarios that describe the future energy system. In this study, the ENPAC (Energy price and Carbon Balances Scenarios) tool was used to generate scenarios with build margin technologies for electricity and heat generation in different timeframes, as well as related future energy prices and CO2 emissions. The tool, which was originally developed to support studies of energy projects in industry, provides consistent scenarios for fuel and electricity prices, as well as the CO2 emission factors of different electricity and heat generation technologies (Axelsson and Harvey, 2010). The scenarios in ENPAC were constructed with input of world commodity energy prices and CO2 emissions charge from the scenarios published by the International Energy Agency in the report World Energy Outlook (WEO) 2019 (IEA, 2019).
A long-term perspective on the adoption of ORC equipment is taken, by evaluating the costs and climate impact related to the economic lifetime of at least 20 years for installed equipment. The input scenarios from WEO2019 are called Current Policies (CP), Stated Policies (SP) and Sustainable Development (SD) scenarios. “The CP Scenario shows what happens if the world continues along its present path, without any additional changes in policy. In contrast, the SP Scenario incorporates today’s policy intentions and targets. Finally, the SD Scenario maps out a way to meet sustainable energy goals in full, requiring rapid and widespread changes across all parts of the energy system” (IEA, 2019). The resulting energy market scenarios in ENPAC show the current and future energy prices that the end-users pay, and the CO2 emission factors related to the use of different fuels, electricity and heat, in a life cycle perspective. In these scenarios, when biomass is not considered a limited resource, the burning of biomass is seen as CO2 neutral, only including emissions from harvesting, transport etc. On the other hand, when biomass is considered a limited resource, competition for the resource is included in the analysis. The consequence

PERFORMANCE AND POTENTIAL OF SMALL-SCALE ORC SYSTEMS
54
is that if the demand for biomass is increased in the system, the marginal (i.e. the price setting) user of biomass has a deficit in supply and must therefore use another energy carrier instead. For the Swedish and UK cases, the price setting user is assumed to be either a coal power plant with the capability of co-firing some wood fuel with the fossil coal (thus fossil coal consumption is affected) or a producer of biofuel for transportation (thus gasoline or diesel consumption is affected) (Axelsson and Harvey, 2010). For the Brazilian case, the price setting user of biomass is assumed to be pig iron production with charcoal as the reduction agent (Paiva, 2001), instead of coal (fossil coal consumption is affected).
The inputs for the scenarios and resulting prices and emission factors are available in Table 12 for Sweden, Table 13 for the UK, and Table 14 for Brazil.

PERFORMANCE AND POTENTIAL OF SMALL-SCALE ORC SYSTEMS
55
Table 12. Scenario inputs and resulting energy prices and emission factors for the Swedish case, based on WEO2019 (IEA, 2019). FT = producer of Fischer Tropsch diesel, Pellets = Wood pellets with a coal power plants as marginal user.
Scenarios inputs
Year 2025 2030 2040
Energy market scenario SD SP CP SD SP CP SD SP CP
Crude oil price (€/MWh) 63 81 99 62 88 111 59 103 134
Natural gas (EU imports) price (€/MWh) 8 8 8 8 8 9 8 9 10
OECD Steam Coal imports price (€/MWh) 56 75 83 57 76 83 60 78 90
CO2 charge High Low Low High Low Low High Low Low
CO2 emission charge (EU-ETS) (€/ton) 68 24 19 85 28 23 119 36 32
Renewable electricity certificates (€/MWh) 5 5 5 5 5 5 0 0 0
Biofuel support (€/MWh) 58 58 58 39 39 39 19 19 19
Allow CCS for marginal electricity production No No No No No No Yes Yes Yes
Allow nuclear power for marginal electricity No No No Yes No No Yes Yes No
Allow wind power for marginal electricity Yes No No Yes Yes Yes No Yes Yes
Biomass limited resource No No No Yes No No Yes No No
Resulting scenarios
Build margin technology for electricity generation Wind Coal Coal Wind Wind Wind Nuclear Wind Wind
CO2 emissions from marginal electricity production (kg CO2/MWh) 0 856 856 0 0 0 0 0 0
Price of electricity (sell) (€/MWhel) 46 49 47 46 46 46 56 51 51
Price of electricity including grid cost (buy) (€/MWhel) 50 53 51 50 50 50 59 55 55
Price of heat in a small DH system (sell) (€/MWhheat) 27 16 20 34 15 17 44 15 17
Marginal (price setting) user of wood fuel Pellets FT FT Pellets Pellets FT Pellets Pellets FT
Price of low-grade wood fuel (buy) (€/MWhfuel) 22 11 15 28 10 12 38 11 12
CO2 reduction from marginal use of biomass (kg CO2/MWhfuel) 47 8 8 47 47 8 47 47 8
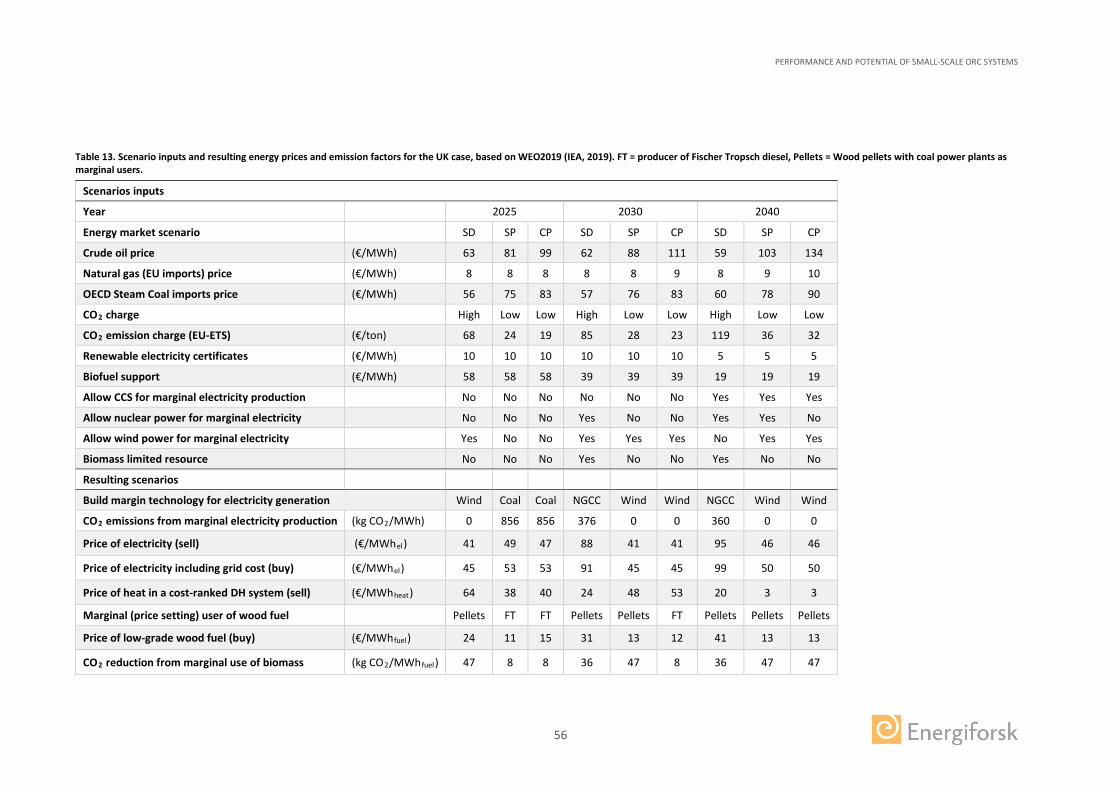
PERFORMANCE AND POTENTIAL OF SMALL-SCALE ORC SYSTEMS
56
Table 13. Scenario inputs and resulting energy prices and emission factors for the UK case, based on WEO2019 (IEA, 2019). FT = producer of Fischer Tropsch diesel, Pellets = Wood pellets with coal power plants as marginal users.
Scenarios inputs
Year 2025 2030 2040
Energy market scenario SD SP CP SD SP CP SD SP CP
Crude oil price (€/MWh) 63 81 99 62 88 111 59 103 134
Natural gas (EU imports) price (€/MWh) 8 8 8 8 8 9 8 9 10
OECD Steam Coal imports price (€/MWh) 56 75 83 57 76 83 60 78 90
CO2 charge High Low Low High Low Low High Low Low
CO2 emission charge (EU-ETS) (€/ton) 68 24 19 85 28 23 119 36 32
Renewable electricity certificates (€/MWh) 10 10 10 10 10 10 5 5 5
Biofuel support (€/MWh) 58 58 58 39 39 39 19 19 19
Allow CCS for marginal electricity production No No No No No No Yes Yes Yes
Allow nuclear power for marginal electricity No No No Yes No No Yes Yes No
Allow wind power for marginal electricity Yes No No Yes Yes Yes No Yes Yes
Biomass limited resource No No No Yes No No Yes No No
Resulting scenarios
Build margin technology for electricity generation Wind Coal Coal NGCC Wind Wind NGCC Wind Wind
CO2 emissions from marginal electricity production (kg CO2/MWh) 0 856 856 376 0 0 360 0 0
Price of electricity (sell) (€/MWhel) 41 49 47 88 41 41 95 46 46
Price of electricity including grid cost (buy) (€/MWhel) 45 53 53 91 45 45 99 50 50
Price of heat in a cost-ranked DH system (sell) (€/MWhheat) 64 38 40 24 48 53 20 3 3
Marginal (price setting) user of wood fuel Pellets FT FT Pellets Pellets FT Pellets Pellets Pellets
Price of low-grade wood fuel (buy) (€/MWhfuel) 24 11 15 31 13 12 41 13 13
CO2 reduction from marginal use of biomass (kg CO2/MWhfuel) 47 8 8 36 47 8 36 47 47
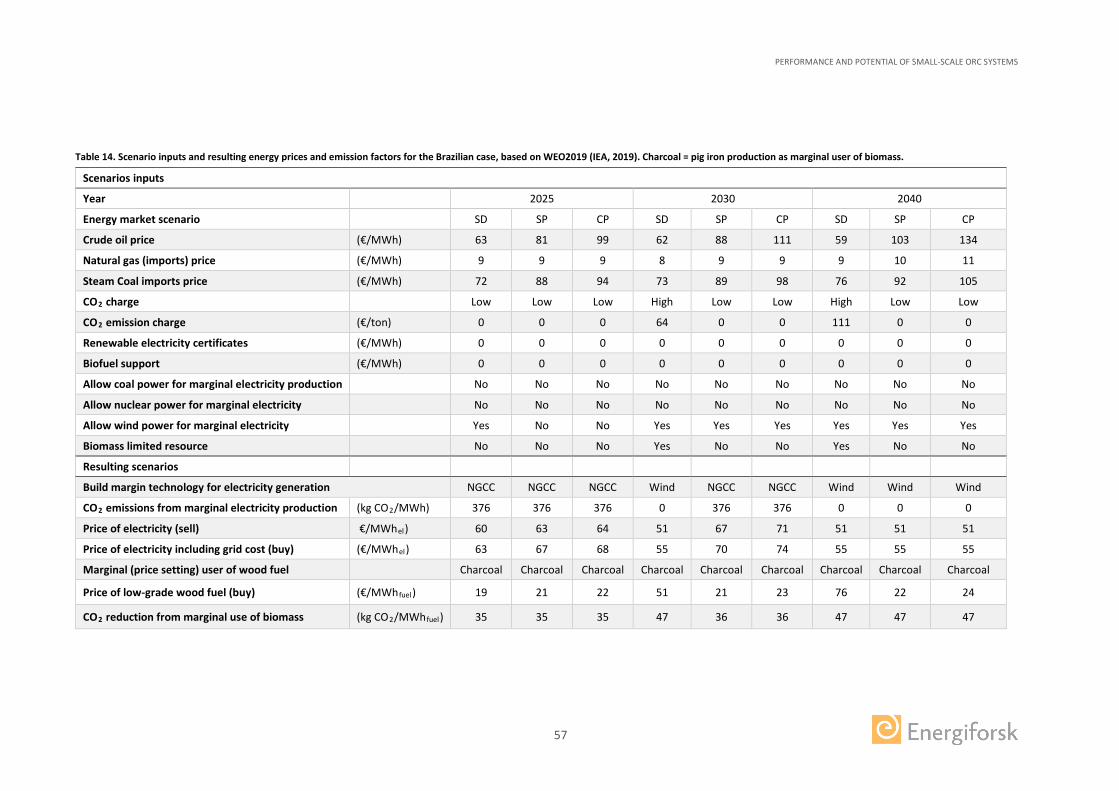
PERFORMANCE AND POTENTIAL OF SMALL-SCALE ORC SYSTEMS
57
Table 14. Scenario inputs and resulting energy prices and emission factors for the Brazilian case, based on WEO2019 (IEA, 2019). Charcoal = pig iron production as marginal user of biomass.
Scenarios inputs
Year 2025 2030 2040
Energy market scenario SD SP CP SD SP CP SD SP CP
Crude oil price (€/MWh) 63 81 99 62 88 111 59 103 134
Natural gas (imports) price (€/MWh) 9 9 9 8 9 9 9 10 11
Steam Coal imports price (€/MWh) 72 88 94 73 89 98 76 92 105
CO2 charge Low Low Low High Low Low High Low Low
CO2 emission charge (€/ton) 0 0 0 64 0 0 111 0 0
Renewable electricity certificates (€/MWh) 0 0 0 0 0 0 0 0 0
Biofuel support (€/MWh) 0 0 0 0 0 0 0 0 0
Allow coal power for marginal electricity production No No No No No No No No No
Allow nuclear power for marginal electricity No No No No No No No No No
Allow wind power for marginal electricity Yes No No Yes Yes Yes Yes Yes Yes
Biomass limited resource No No No Yes No No Yes No No
Resulting scenarios
Build margin technology for electricity generation NGCC NGCC NGCC Wind NGCC NGCC Wind Wind Wind
CO2 emissions from marginal electricity production (kg CO2/MWh) 376 376 376 0 376 376 0 0 0
Price of electricity (sell) €/MWhel) 60 63 64 51 67 71 51 51 51
Price of electricity including grid cost (buy) (€/MWhel) 63 67 68 55 70 74 55 55 55
Marginal (price setting) user of wood fuel Charcoal Charcoal Charcoal Charcoal Charcoal Charcoal Charcoal Charcoal Charcoal
Price of low-grade wood fuel (buy) (€/MWhfuel) 19 21 22 51 21 23 76 22 24
CO2 reduction from marginal use of biomass (kg CO2/MWhfuel) 35 35 35 47 36 36 47 47 47
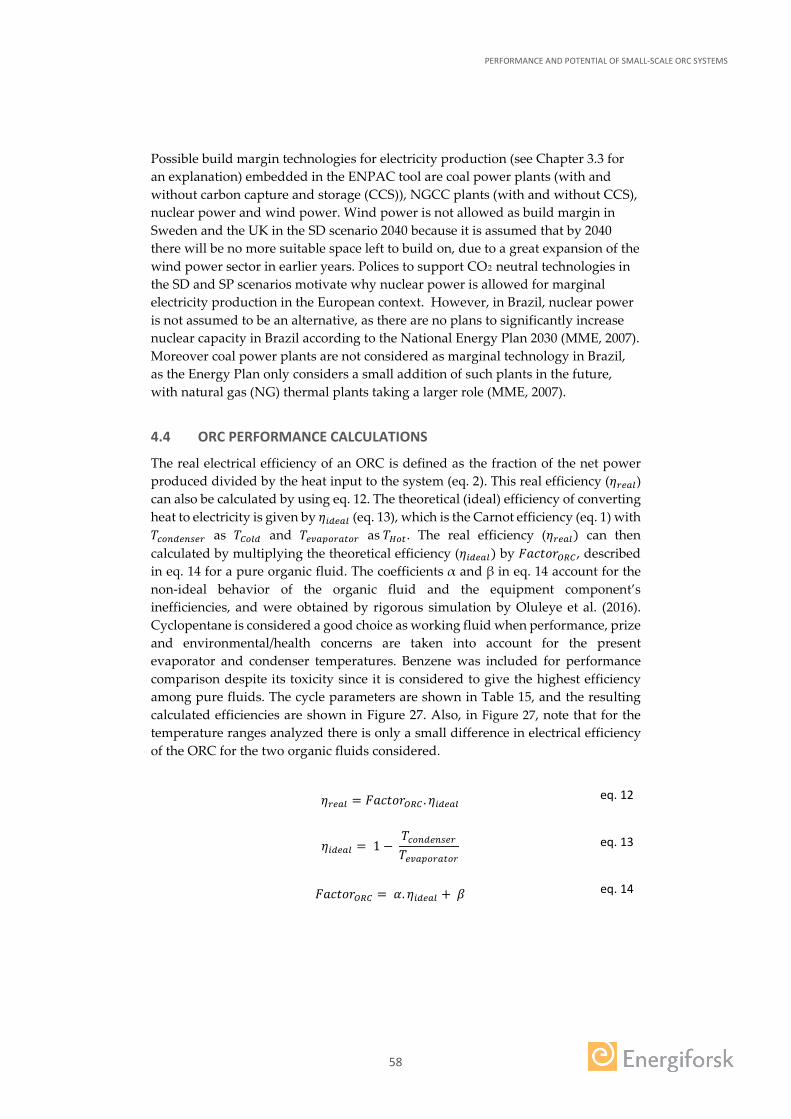
PERFORMANCE AND POTENTIAL OF SMALL-SCALE ORC SYSTEMS
58
Possible build margin technologies for electricity production (see Chapter 3.3 for an explanation) embedded in the ENPAC tool are coal power plants (with and without carbon capture and storage (CCS)), NGCC plants (with and without CCS), nuclear power and wind power. Wind power is not allowed as build margin in Sweden and the UK in the SD scenario 2040 because it is assumed that by 2040 there will be no more suitable space left to build on, due to a great expansion of the wind power sector in earlier years. Polices to support CO2 neutral technologies in the SD and SP scenarios motivate why nuclear power is allowed for marginal electricity production in the European context. However, in Brazil, nuclear power is not assumed to be an alternative, as there are no plans to significantly increase nuclear capacity in Brazil according to the National Energy Plan 2030 (MME, 2007). Moreover coal power plants are not considered as marginal technology in Brazil, as the Energy Plan only considers a small addition of such plants in the future, with natural gas (NG) thermal plants taking a larger role (MME, 2007).
4.4 ORC PERFORMANCE CALCULATIONS
The real electrical efficiency of an ORC is defined as the fraction of the net power produced divided by the heat input to the system (eq. 2). This real efficiency (𝜂𝜂𝑟𝑟𝑒𝑒𝑒𝑒𝑒𝑒) can also be calculated by using eq. 12. The theoretical (ideal) efficiency of converting heat to electricity is given by 𝜂𝜂𝑖𝑖𝑖𝑖𝑒𝑒𝑒𝑒𝑒𝑒 (eq. 13), which is the Carnot efficiency (eq. 1) with 𝑇𝑇𝑐𝑐𝑡𝑡𝑛𝑛𝑖𝑖𝑒𝑒𝑛𝑛𝑐𝑐𝑒𝑒𝑟𝑟 as 𝑇𝑇𝐶𝐶𝑡𝑡𝑒𝑒𝑖𝑖 and 𝑇𝑇𝑒𝑒𝑒𝑒𝑒𝑒𝑝𝑝𝑡𝑡𝑟𝑟𝑒𝑒𝑛𝑛𝑡𝑡𝑟𝑟 as 𝑇𝑇𝐻𝐻𝑡𝑡𝑛𝑛. The real efficiency (𝜂𝜂𝑟𝑟𝑒𝑒𝑒𝑒𝑒𝑒) can then calculated by multiplying the theoretical efficiency (𝜂𝜂𝑖𝑖𝑖𝑖𝑒𝑒𝑒𝑒𝑒𝑒) by 𝐹𝐹𝑎𝑎𝑐𝑐𝑡𝑡𝑝𝑝𝐸𝐸𝑂𝑂𝑂𝑂𝐶𝐶 , described in eq. 14 for a pure organic fluid. The coefficients α and β in eq. 14 account for the non-ideal behavior of the organic fluid and the equipment component’s inefficiencies, and were obtained by rigorous simulation by Oluleye et al. (2016). Cyclopentane is considered a good choice as working fluid when performance, prize and environmental/health concerns are taken into account for the present evaporator and condenser temperatures. Benzene was included for performance comparison despite its toxicity since it is considered to give the highest efficiency among pure fluids. The cycle parameters are shown in Table 15, and the resulting calculated efficiencies are shown in Figure 27. Also, in Figure 27, note that for the temperature ranges analyzed there is only a small difference in electrical efficiency of the ORC for the two organic fluids considered.
𝜂𝜂𝑟𝑟𝑒𝑒𝑒𝑒𝑒𝑒 = 𝐹𝐹𝑎𝑎𝑐𝑐𝑡𝑡𝑝𝑝𝐸𝐸𝑂𝑂𝑂𝑂𝐶𝐶 . 𝜂𝜂𝑖𝑖𝑖𝑖𝑒𝑒𝑒𝑒𝑒𝑒 eq. 12
𝜂𝜂𝑖𝑖𝑖𝑖𝑒𝑒𝑒𝑒𝑒𝑒 = 1 −
𝑇𝑇𝑐𝑐𝑡𝑡𝑛𝑛𝑖𝑖𝑒𝑒𝑛𝑛𝑐𝑐𝑒𝑒𝑟𝑟𝑇𝑇𝑒𝑒𝑒𝑒𝑒𝑒𝑝𝑝𝑡𝑡𝑟𝑟𝑒𝑒𝑛𝑛𝑡𝑡𝑟𝑟
eq. 13
𝐹𝐹𝑎𝑎𝑐𝑐𝑡𝑡𝑝𝑝𝐸𝐸𝑂𝑂𝑂𝑂𝐶𝐶 = 𝛼𝛼. 𝜂𝜂𝑖𝑖𝑖𝑖𝑒𝑒𝑒𝑒𝑒𝑒 + 𝛽𝛽 eq. 14
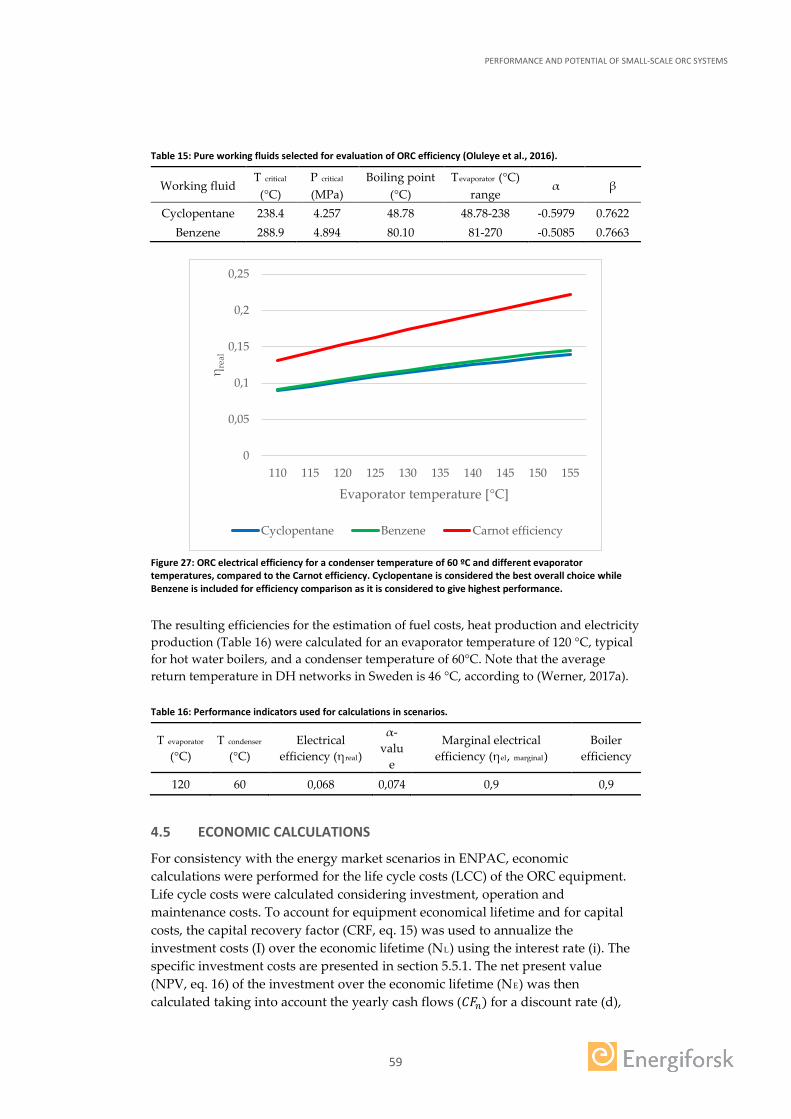
PERFORMANCE AND POTENTIAL OF SMALL-SCALE ORC SYSTEMS
59
Table 15: Pure working fluids selected for evaluation of ORC efficiency (Oluleye et al., 2016).
Working fluid T critical
(°C) P critical (MPa)
Boiling point (°C)
Tevaporator (°C) range
α β
Cyclopentane 238.4 4.257 48.78 48.78-238 -0.5979 0.7622 Benzene 288.9 4.894 80.10 81-270 -0.5085 0.7663
Figure 27: ORC electrical efficiency for a condenser temperature of 60 ºC and different evaporator temperatures, compared to the Carnot efficiency. Cyclopentane is considered the best overall choice while Benzene is included for efficiency comparison as it is considered to give highest performance.
The resulting efficiencies for the estimation of fuel costs, heat production and electricity production (Table 16) were calculated for an evaporator temperature of 120 °C, typical for hot water boilers, and a condenser temperature of 60°C. Note that the average return temperature in DH networks in Sweden is 46 °C, according to (Werner, 2017a). Table 16: Performance indicators used for calculations in scenarios.
T evaporator (°C)
T condenser (°C)
Electrical efficiency (ηreal)
α-valu
e
Marginal electrical efficiency (ηel, marginal)
Boiler efficiency
120 60 0,068 0,074 0,9 0,9
4.5 ECONOMIC CALCULATIONS
For consistency with the energy market scenarios in ENPAC, economic calculations were performed for the life cycle costs (LCC) of the ORC equipment. Life cycle costs were calculated considering investment, operation and maintenance costs. To account for equipment economical lifetime and for capital costs, the capital recovery factor (CRF, eq. 15) was used to annualize the investment costs (I) over the economic lifetime (NL) using the interest rate (i). The specific investment costs are presented in section 5.5.1. The net present value (NPV, eq. 16) of the investment over the economic lifetime (NE) was then calculated taking into account the yearly cash flows (𝐶𝐶𝐹𝐹𝑛𝑛) for a discount rate (d),
0
0,05
0,1
0,15
0,2
0,25
110 115 120 125 130 135 140 145 150 155
η rea
l
Evaporator temperature [°C]
Cyclopentane Benzene Carnot efficiency
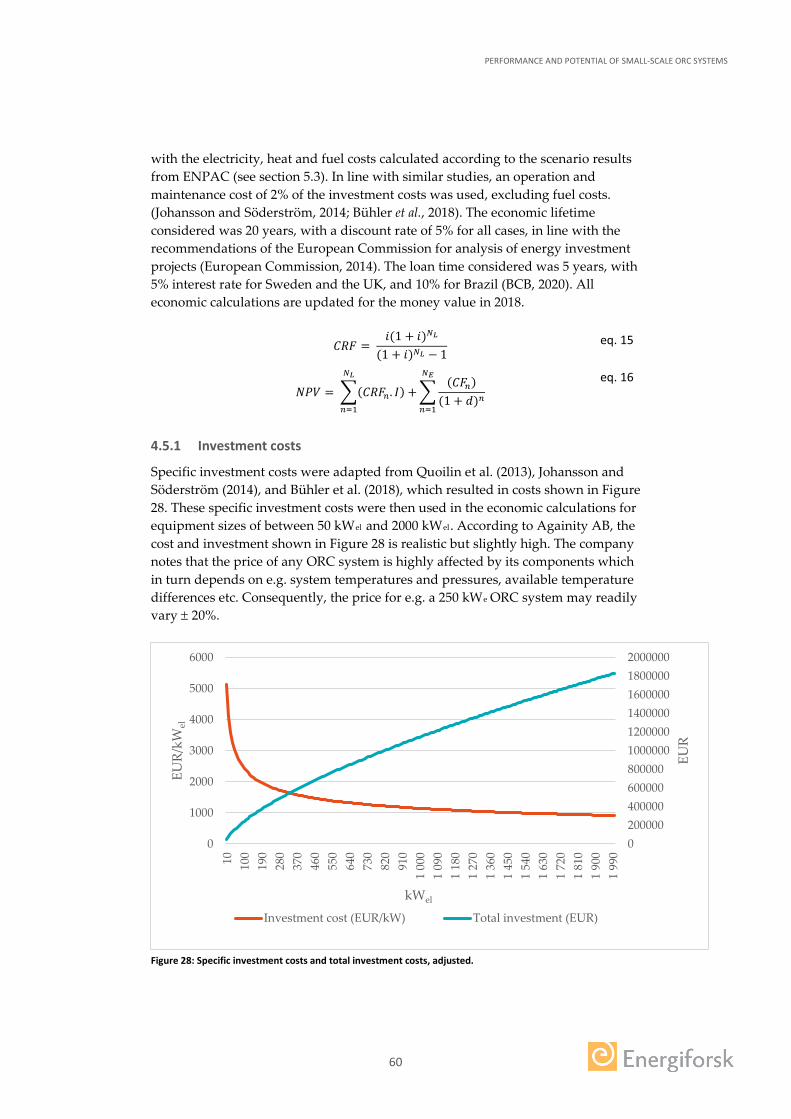
PERFORMANCE AND POTENTIAL OF SMALL-SCALE ORC SYSTEMS
60
with the electricity, heat and fuel costs calculated according to the scenario results from ENPAC (see section 5.3). In line with similar studies, an operation and maintenance cost of 2% of the investment costs was used, excluding fuel costs. (Johansson and Söderström, 2014; Bühler et al., 2018). The economic lifetime considered was 20 years, with a discount rate of 5% for all cases, in line with the recommendations of the European Commission for analysis of energy investment projects (European Commission, 2014). The loan time considered was 5 years, with 5% interest rate for Sweden and the UK, and 10% for Brazil (BCB, 2020). All economic calculations are updated for the money value in 2018.
𝐶𝐶𝑅𝑅𝐹𝐹 =
𝐸𝐸(1 + 𝐸𝐸)𝑁𝑁𝐿𝐿
(1 + 𝐸𝐸)𝑁𝑁𝐿𝐿 − 1 eq. 15
𝑁𝑁𝑃𝑃𝑉𝑉 = �(𝐶𝐶𝑅𝑅𝐹𝐹𝑛𝑛 . 𝐼𝐼) +
𝑁𝑁𝐿𝐿
𝑛𝑛=1
�(𝐶𝐶𝐹𝐹𝑛𝑛)
(1 + 𝑎𝑎)𝑛𝑛
𝑁𝑁𝐸𝐸
𝑛𝑛=1
eq. 16
4.5.1 Investment costs
Specific investment costs were adapted from Quoilin et al. (2013), Johansson and Söderström (2014), and Bühler et al. (2018), which resulted in costs shown in Figure 28. These specific investment costs were then used in the economic calculations for equipment sizes of between 50 kWel and 2000 kWel. According to Againity AB, the cost and investment shown in Figure 28 is realistic but slightly high. The company notes that the price of any ORC system is highly affected by its components which in turn depends on e.g. system temperatures and pressures, available temperature differences etc. Consequently, the price for e.g. a 250 kWe ORC system may readily vary ± 20%.
Figure 28: Specific investment costs and total investment costs, adjusted.
0200000400000600000800000100000012000001400000160000018000002000000
0
1000
2000
3000
4000
5000
6000
10 100
190
280
370
460
550
640
730
820
910
1 00
01
090
1 18
01
270
1 36
01
450
1 54
01
630
1 72
01
810
1 90
01
990
EUR
EUR/
kWel
kWel
Investment cost (EUR/kW) Total investment (EUR)
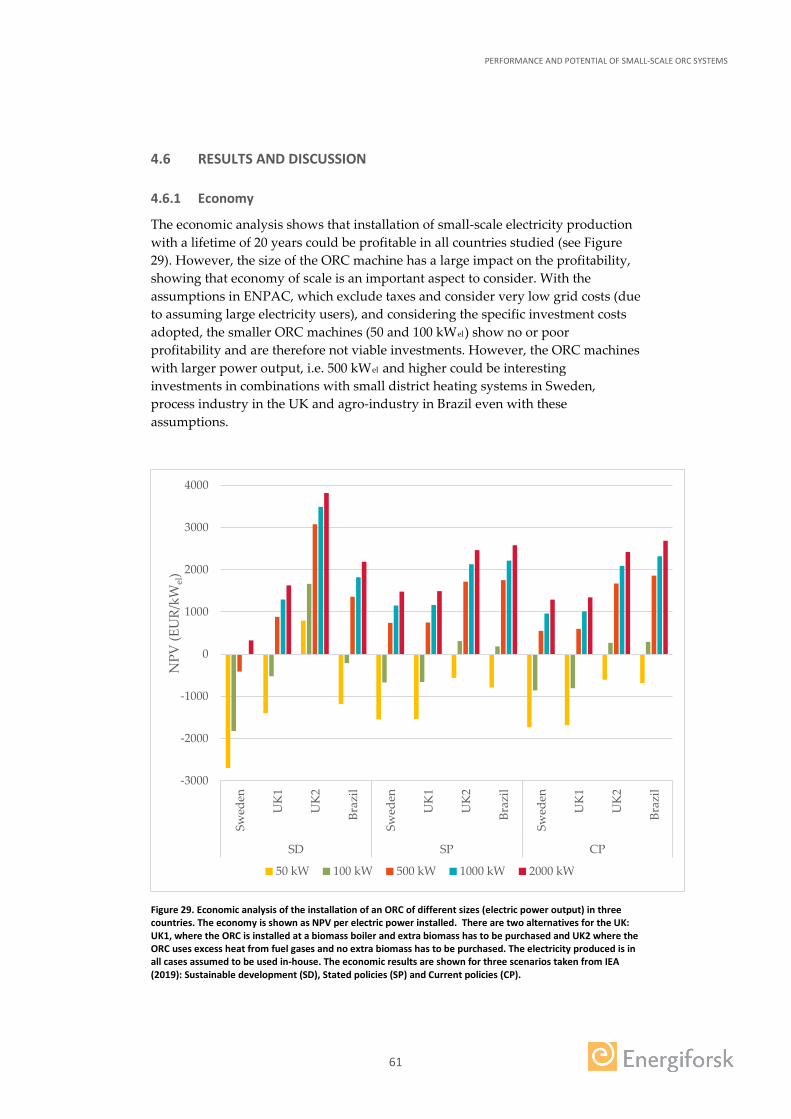
PERFORMANCE AND POTENTIAL OF SMALL-SCALE ORC SYSTEMS
61
4.6 RESULTS AND DISCUSSION
4.6.1 Economy
The economic analysis shows that installation of small-scale electricity production with a lifetime of 20 years could be profitable in all countries studied (see Figure 29). However, the size of the ORC machine has a large impact on the profitability, showing that economy of scale is an important aspect to consider. With the assumptions in ENPAC, which exclude taxes and consider very low grid costs (due to assuming large electricity users), and considering the specific investment costs adopted, the smaller ORC machines (50 and 100 kWel) show no or poor profitability and are therefore not viable investments. However, the ORC machines with larger power output, i.e. 500 kWel and higher could be interesting investments in combinations with small district heating systems in Sweden, process industry in the UK and agro-industry in Brazil even with these assumptions.
Figure 29. Economic analysis of the installation of an ORC of different sizes (electric power output) in three countries. The economy is shown as NPV per electric power installed. There are two alternatives for the UK: UK1, where the ORC is installed at a biomass boiler and extra biomass has to be purchased and UK2 where the ORC uses excess heat from fuel gases and no extra biomass has to be purchased. The electricity produced is in all cases assumed to be used in-house. The economic results are shown for three scenarios taken from IEA (2019): Sustainable development (SD), Stated policies (SP) and Current policies (CP).
-3000
-2000
-1000
0
1000
2000
3000
4000
Swed
en
UK
1
UK
2
Braz
il
Swed
en
UK
1
UK
2
Braz
il
Swed
en
UK
1
UK
2
Braz
il
SD SP CP
NPV
(EU
R/kW
el)
50 kW 100 kW 500 kW 1000 kW 2000 kW
PERFORMANCE AND POTENTIAL OF SMALL-SCALE ORC SYSTEMS
62
For a constant heat demand, with the addition of the ORC, an increase of the fuel input to the boiler is needed, which is equal to the marginal electricity production efficiency (see eq. 4). As a result, more biomass has to be used by the plant. In the Swedish and the UK cases, the biomass has to be bought by the district heating company and the process industry respectively, while the agro-industry in Brazil has an excess amount of biomass waste in-house that can be used. This is one explanation why it is the most profitable to install an ORC in the Brazilian case. An additional reason why the Swedish case in the SD scenario shows the lowest profitability is that the electricity prices are lower than in the UK in 2030 – 2040 (see Tables 12-14), which means lower avoided costs for purchased electricity. With regard to the two UK cases, the economic situation is more positive when the ORC uses excess heat from flue gases compared to using heat from a biomass boiler. This result was expected as the excess heat was considered free of charge, while extra biomass has to be purchased in the case of installing the ORC at the boiler. Of course, energy prices, CO2 emissions charges and the level of support for renewable electricity production in the different countries also have an impact on the economic results.
To provide a view of how specific taxes and electricity network costs affect the profitability of the ORC systems of different scales in the Swedish case, a more detailed analysis was performed to include these parameters and compare to the base case in ENPAC. The results are shown in Figure 30. The original results, with values from ENPAC (electricity network cost of 4 EUR/MWh and no taxes), are labelled SD, SP and CP. The cases considering taxes and electricity network costs are labelled accordingly. In both cases, the electricity price from ENPAC was considered. An electricity tax of 41 EUR/MWh and an electricity network cost of 39 EUR/MWh are considered. For an installed electricity capacity below 100 kW, the electricity tax and the network costs become avoided costs. For installed electricity capacity above 100 kW, it was assumed that 10% of the electricity generation is sold. This share of electricity pays electricity tax and network costs. The remaining 90% of the electricity production is used by the plant, which benefits from an electricity tax reduction, to 0,5 EUR/MWh and no network fees, and thus an avoided cost.
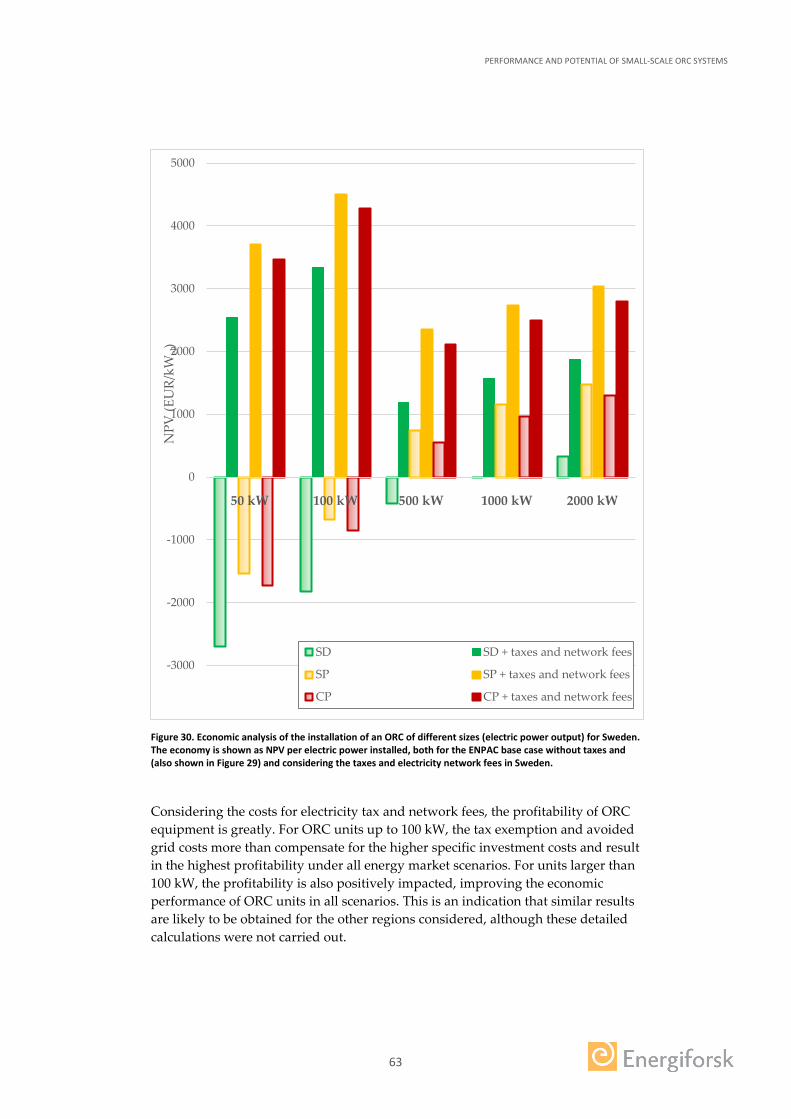
PERFORMANCE AND POTENTIAL OF SMALL-SCALE ORC SYSTEMS
63
Figure 30. Economic analysis of the installation of an ORC of different sizes (electric power output) for Sweden. The economy is shown as NPV per electric power installed, both for the ENPAC base case without taxes and (also shown in Figure 29) and considering the taxes and electricity network fees in Sweden.
Considering the costs for electricity tax and network fees, the profitability of ORC equipment is greatly. For ORC units up to 100 kW, the tax exemption and avoided grid costs more than compensate for the higher specific investment costs and result in the highest profitability under all energy market scenarios. For units larger than 100 kW, the profitability is also positively impacted, improving the economic performance of ORC units in all scenarios. This is an indication that similar results are likely to be obtained for the other regions considered, although these detailed calculations were not carried out.
-3000
-2000
-1000
0
1000
2000
3000
4000
5000
50 kW 100 kW 500 kW 1000 kW 2000 kW
NPV
(EU
R/kW
el)
SD SD + taxes and network fees
SP SP + taxes and network fees
CP CP + taxes and network fees

PERFORMANCE AND POTENTIAL OF SMALL-SCALE ORC SYSTEMS
64
4.6.2 Global CO2 emissions
The evaluation of how small-scale electricity generation with an ORC would affect global emissions of GHG shows that the emissions would decrease in all countries and all scenarios studied (see Figure 31).
Figure 31. The figure shows how the installation of an ORC in Sweden, the UK and Brazil would affect GHG emissions, considering the lifetime of the ORC and assuming three future energy market scenarios. The scenarios are based on the Sustainable development (SD) scenario, the Stated policy (SP) scenario, and the Current policy (CP) scenario in World Energy Outlook 2019 (IEA, 2019). The emission reductions are shown as CO2-eq per electrical power installed. There are two alternatives for the UK: UK1 where the ORC is installed at a biomass boiler and extra biomass has to be used and UK2 where the ORC uses excess heat from fuel gases and no extra biomass has to be used.
The results for emissions reductions are almost the same for the CP and SP scenarios, where all cases have nearly equal values. In these scenarios, the Brazilian case would give slightly higher reductions. The reason for this is that in the Brazilian case, the electricity replaces electricity with a fossil origin to a larger extent than in the Swedish and the UK cases,. The effects on emissions due to the ORC installation are more country specific in the SD scenario. Here, Sweden has the lowest reduction and the UK the highest. The larger differences between the cases are explained by the fact that the electricity that is produced by the ORC in Sweden replaces carbon neutral electricity from wind or nuclear from 2025, while in the UK the ORC replaces electricity from NGCC from 2030, meaning a higher emissions reduction for the UK case. Additionally, in the SD scenario, biomass is considered a limited resource from 2030 and henceforth. This implies that there is a CO2 emissions penalty attached to the increased demand and use of biomass due to the electricity production in the ORC. The penalty equals the emissions that the marginal biomass user emits as a cause of using fossil fuel instead of the biomass. In the Swedish and the UK cases the marginal biomass user is a coal power plant substituting some of the fossil coal with woody biomass and in the Brazilian case
0
5
10
15
20
25
30
35
40
Sweden UK1 UK2 Brazil Sweden UK1 UK2 Brazil Sweden UK1 UK2 Brazil
SD SP CP
Life
cyc
le e
mis
sion
s re
duct
ion
(ton
CO
2-eq
/kW
el)

PERFORMANCE AND POTENTIAL OF SMALL-SCALE ORC SYSTEMS
65
the marginal user is an iron and steel plant using charcoal instead of fossil coke in the blast furnace. Since no extra biomass has to be used in the UK2 case, there is no CO2 emissions penalty for using biomass, which explains the larger effects on global GHG emissions for this case.

PERFORMANCE AND POTENTIAL OF SMALL-SCALE ORC SYSTEMS
66
5 General discussion and conclusions
The performance of the ORC systems was very different between Norrköping and Ronneby. Norrköping showed a α-value in the range 0,055 to 0,075. The value of α increases by 1,453*10-3 per degree of increasing internal ORC temperature difference ∆Tsat for the studied temperature ranges. A clear relation is also shown between available temperature difference between heat and cooling water and the α-value. This indicates that the temperature of available heat and cooling water, which is restricted at 126 °C and ~45 °C respectively, imposes a limit on performance, in terms of α-value. If the system did not have a recuperator, 53 kW more heat would have to be added in the evaporator to maintain the same electrical output, reducing α by 13 %.
The transient operating conditions imposed on the Norrköping plant restricts the performance of the machine. Average internal temperature difference ΔTsat is restricted by the length of an operating cycle and is identified as the key influence on performance in this aspect.
The Ronneby system shows an α-value close to 0,021 for most operating cases, and the internal ORC temperature ∆Tsat is mostly in the range of 14-18 °C. For this system, there is no relation between the available temperature difference between heat and cooling water and the α-value, which was unexpected. This means that the design of this ORC system does not make full use of the surrounding it operates in.
Because of the installation of the boiler/ORC system, plant Norrköping now uses the biogas earlier torched, and has thereby managed to reduce its electricity cost by 70 000 SEK/year and heat cost by 143 000 SEK/year. The emissions avoided by this reduction in electricity purchase corresponds to 8 ton CO2-equivalents/year.
Through the installation of the ORC system, plant Ronneby has reduced its electricity cost by 267 000 SEK/year and reduced the global emissions by 40 ton CO2-equivalents/year.
Improvements that could be made at both plants would include moving the electricity production to high demand hours. If this is achieved, the avoided electricity cost would increase by a factor of 1,54 and the emissions by a factor of 4,97 at plant Norrköping. For plant Ronneby the avoided electricity cost would increase by a factor of 1,07 and the emissions by a factor of 1,38.
There are potentials to install ORC systems around the world that are both economically viable and reduce global GHG emissions. However, the size of the installed electric power has a large effect on profitability, showing that economy of scale is an important factor, at least with the capital requirements considered in this report. In an analysis considering the specific tax regulations and grid costs in Sweden, the economic performance of ORC units of all sizes considered in this study is positively impacted. The benefits of tax exemptions and avoided electricity costs have the highest impact in ORC units up to 100 kW, and more than compensate for the higher specific investment costs, resulting in the most profitable units among the installed capacities analyzed. This is also an indication

PERFORMANCE AND POTENTIAL OF SMALL-SCALE ORC SYSTEMS
67
that ORC installations in the UK and Brazil would be profitable at a higher level than what is shown on the analysis based solely on the ENPAC energy market scenarios.
Since economy and effects on global GHG emissions have been analyzed in different geographical settings, considering different future energy market scenarios, it can be concluded that small-scale electricity production with an ORC system could be an interesting investment in general, given the conditions set in this study. The scenarios in ENPAC do not include certain aspects of the overall energy market, e.g. taxes, which can greatly influence the profitability of the ORC system.
PERFORMANCE AND POTENTIAL OF SMALL-SCALE ORC SYSTEMS
68
References
Alves, B. (2020) Agricultural industry in Brazil – Statistics and Facts. Available at: https://www.statista.com/topics/5838/agriculture-in-brazil/ (Accessed: 23 September 2020). Antunes, C. H., Gomes, Á. & Soares, A. (2014). Categorization of residential electricity consumption as a basis for the assessment of the impacts of demand response actions. Renewable and Sustainable Energy Reviews, 30, 490-503. doi:10.1016/j.rser.2013.10.019 Andersson, I., Karlsson, M., Loyd, D., Renner, J., Storck, K. (2012). Formelsamling i termo- och fluiddynamik. Mekanisk värmeteori och strömningslära. LiTH-IKP-S-508. ANEEL (2012) Resolução no 482, de 17 de Abril de 2012 (In Portuguese). Available at: http://www2.aneel.gov.br/cedoc/ren2012482.pdf (Accessed: 13 September 2020). ANEEL (2020) Agência Nacional de Energia Elétrica (In Portuguese). Available at: https://www.aneel.gov.br/ (Accessed: 17 September 2020). Arnell, M., Boss, A., Hjörnhete, A., Ivarsson, P., Jannasch, A-K., Odhner, P., Puig von Friesen, M. (2017). More Efficient Use of Biogas at Waste Water Treatment Plants. ISBN: 978-91-7673-476-6 Astolfi, M. (2017). Technical options for Organic Rankine Cycle systems. Organic Rankine Cycle (ORC) Power Systems, 67-89. doi:10.1016/b978-0-08-100510-1.00003-x Atänäsoae, P., Pentiuc, R., Bobric, C., Olariu, E., & Martin, V. (2017). Integration of thermal energy storage systems for improved efficiency and flexibility of the combined heat and power plants of medium and small power. 2017 International Conference on Electromechanical and Power Systems (SIELMEN). doi:10.1109/sielmen.2017.8123342 Axelsson, E. and Harvey, S. (2010) Scenarios for assessing profitability and carbon balances of energy investments in industry. Gothenburg, Sweden. Available at: http://www.energy-pathways.org/reports.htm. BCB (2020) Average interest rate of new credit operations (In Portuguese). Available at: https://www3.bcb.gov.br/sgspub/consultarvalores/ (Accessed: 24 September 2020). BEIS (2020) Digest of the United Kingdom energy statistics 2009. Available at: www.gov.uk/government/collections/digest-of-uk-energystatistics-dukes (Accessed: 10 September 2020). Bracco, R., Micheli, D., Petrella, R., Reini, M., Taccani, R., & Toniato, G. (2017). Micro-Organic Rankine Cycle systems for domestic cogeneration. Organic Rankine Cycle (ORC) Power Systems, 637-668. doi:10.1016/b978-0-08-100510-1.00018-1
PERFORMANCE AND POTENTIAL OF SMALL-SCALE ORC SYSTEMS
69
Byman, K., & Koebe, C. (2016). Sveriges framtida elproduktion: En delrapport: IVA-projektet Vägval el. Kungl. Ingenjorsvetenskapsakademien (IVA). Bühler, F. et al. (2018). Identification and Evaluation of Cases for Excess Heat Utilisation Using GIS. Energies. Multidisciplinary Digital Publishing Institute, 11(4), p. 762. doi: 10.3390/en11040762. Cao, S., Rhinehart, RR. (1995) An efficient method for on-line identification of steady state. Journal of Process Control. 5(6): 363–374. CCEE (2020) CCEE - Início - Câmara de Comercialização de Energia Elétrica (In Portuguese). Available at: https://www.ccee.org.br/portal (Accessed: 3 September 2020). Çengel, Y. A., Cimbala, J. M., & Turner, R. H. (2012). Fundamentals of thermal-fluid sciences. Singapore: McGraw-Hill. ISBN: 9780071325110 Chen, H., Goswami, D. Y., & Stefanakos, K. (2010, 12). A review of thermodynamic cycles and working fluids for the conversion of low-grade heat. Renewable and Sustainable Energy Reviews, 14(9), 3059-3067. doi:10.1016/j.rser.2010.07.006 Dinc er, I., & Rosen, M. A. (2011). Thermal energy storage: Systems and applications. John Wiley & Sons. EI. (2014) Så sätts ditt elpris. Ett faktablad från Energimarknadsinspektionen. Enel (2018) Tarifas, Taxas e Impostos, Para você (In Portuguese). Available at: https://www.eneldistribuicao.com.br/go/TaxasETarifasCorporativo.aspx (Accessed: 3 September 2020). Energiföretagen. (2017). Energibranschens klimat- och miljöpåverkan. Energiåret 2016, Version 2017-08-27 Energimyndigheten. (2011). Ackumulatortankar - Får värmen att räcka längre. Energimyndigheten. (2019). Energiläget i siffror - 2019. Energimyndigheten. (2017a). Värmevärden från energimyndighetens datalager. Energimyndigheten. (2017b) Kvotpliktig. Available at: https://www.energimyndigheten.se/fornybart/elcertifikatsystemet/kvotpliktig/ (Accessed: 21 november 2019). Energimyndigheten. (2017c). Den europeiska elmarknaden – elpriser och slutkundpriser.
PERFORMANCE AND POTENTIAL OF SMALL-SCALE ORC SYSTEMS
70
Energimyndigheten. (2018). Det klimatpolitiska ramverket. Available at: https://www.energimyndigheten.se/klimat--miljo/sveriges-energi--och-klimatmal/det-klimatpolitiska ramverket/?fbclid=IwAR27sKLjjoXQuqOZsMomjwV8lJueik4riDz0h0mJ3x5dXSci4pjW5MRpEzQ (Accessed: 21 november 2019). Energimyndigheten. (2019). Stöd och bidrag. Available at: https://www.energimyndigheten.se/fornybart/stod-och-bidrag-pa-fornybartomradet/ (Accessed: 10 January 2020). Energimyndigheten (2020) The Swedish-Norwegian Electricity Certificate Market - Annual Report 2019. Available at: http://www.energimyndigheten.se/en/sustainability/the-electricity-certificate-system/ (Accessed: 10 January 2020). Energirådgivningen. (2018). Miljöpåverkan från el. Available at: https://energiradgivningen.se/klimat/miljopaverkan-fran-el (Accessed: 19 September 2019). EON. (2019). Fjärrvärmepris - Företag. Available at: www.eon.se/foeretag/vaerme-och-kyla/for-foretag-som-har-fjarrvarme/fjarrvarmepriser.html (Accessed: 29 October 2019). EPA (2017) Understanding Global Warming Potentials. Available at: https://www.epa.gov/ghgemissions/understanding-global-warming-potentials (Accessed: 2 October 2019). Euroheat & Power (2019) District Energy in the United Kingdom. Available at: https://www.euroheat.org/knowledge-hub/district-energy-united-kingdom/ (Accessed: 23 September 2020). European Commission (2014) Guide to Cost-benefit Analysis of Investment Projects: Economic appraisal tool for Cohesion Policy 2014-2020, Publications Office of the European Union. doi: 10.2776/97516. Florinsky, I. V. (2016). Digital terrain analysis in soil science and geology. Elsevier Butterworth-Heinemann. Frederiksen, S. (2009). Småskalig fjärrvärmebaserad kraftvärme. Svensk Fjärrvärme. ISBN: 978-91-7381-017-3 Goldschmidt, B. (2007). Elproduktion i biobränsleledat värmeverk eller från spillvärme i massabruk. Stockholm: Värmeforsk Service. ISSN: 1653-1248.
PERFORMANCE AND POTENTIAL OF SMALL-SCALE ORC SYSTEMS
71
Goldschmidt, B. (2009). ORC för elproduktion i värmeverk. Stockholm: Värmeforsk Service. ISSN: 1653-1248. Greer, M. (2012). Electricity marginal cost pricing: Applications in eliciting demand responses. Elsevier Butterworth-Heinemann. Holland, S. P., & Mansur, E. T. (2008, 08). Is Real-Time Pricing Green? The Environmental Impacts of Electricity Demand Variance. Review of Economics and Statistics, 90(3), 550-561. doi:10.1162/rest.90.3.550 Jannisch, A-K., Ragnar M. (2015). Gasens roll i det framtida energisystemet – Ett komplement till IVA:s rapportering Vägval El. Stockholm: Energiforsk. ISBN 978-91-7673-183-3 ICAX (2020) Renewable Heat Incentive | RHI rates | RHI tariffs, Interseasonal Heat Transfer. Available at: https://www.icax.co.uk/Renewable_Heat_Incentive.html (Accessed: 13 September 2020). IEA (2019) World Energy Outlook 2019, World Energy Outlook 2019. Available at: https://www.iea.org/reports/world-energy-outlook-2019%0Ahttps://www.iea.org/reports/world-energy-outlook-2019%0Ahttps://webstore.iea.org/download/summary/2467?fileName=Summary-WEO2019.pdf. (Accessed: 1 September 2020). Johansson, MT. (2016). Effects on global CO2 emissions when substituting LPG with bio-SNG as fuel in steel industry reheating furnaces—the impact of different perspectives on CO2 assessment. Energy Efficiency 9(6),1437-1445 Johansson, M. T. and Söderström, M. (2014) ‘Electricity generation from low-temperature industrial excess heat---an opportunity for the steel industry’, Energy Efficiency, 7(2), pp. 203–215. doi: 10.1007/s12053-013-9218-6. Kang, S. H. (2017). Design and experimental study of ORC (organic Rankine cycle) and radial turbine using R245fa working fluid. Energy 41(1): 514-524. https://doi.org/10.1016/j.energy.2012.02.035 Kjellström, B. (2012). Kostnad för el från småskalig kraftvärme. Stockholm: Värmeforsk Service. ISSN: 1653-124. Landelle, A., Tauveron, N., Haberschill, P., Revellin, R., & Colasson, S. (2017). Performance Evaluation and Comparison of Experimental Organic Rankine Cycle Prototypes from Published Data. Energy Procedia, 105, 1706-1711. doi:10.1016/j.egypro.2017.03.555 Ledskog, E. (2019). Email conversation with Elin Ledskog, Againity AB.
PERFORMANCE AND POTENTIAL OF SMALL-SCALE ORC SYSTEMS
72
Lindahl, J., Stoltz, C. (2018). National Survey Report of PV Power Applications in Sweden 2017. International energy agency. doi:10.13140/RG.2.2.15813.91369
Macchi, E. (2017). Theoretical basis of the Organic Rankine Cycle. Organic Rankine Cycle (ORC) Power Systems, 3-24. doi:10.1016/b978-0-08-100510-1.00001-6 Market data. (2019). Available at: https://www.nordpoolgroup.com/Market-data1/Dayahead/Area-Prices/SE/Hourly/?dd=SE&view=chart (Accessed: 9 September 2019). MME (2007) Plano Nacional de Energia 2030 (In Portuguese). Moffat, R. J. (1985). Using Uncertainty Analysis in the Planning of an Experiment. Journal of Fluids Engineering. 107(2):173–178. Nordenstam, L., Djuric Ilic, D., Ödlund, L., 2018. Corporate greenhouse gas inventories, guarantees of origin and combined heat and power production – Analysis of impacts on total carbon dioxide emissions. Journal of Cleaner Production 186, 203-214. Nord Pool. (2019). Day ahead prices. NODRA. (2019). Plant visit. Ofgen (2020) About the Smart Export Guarantee (SEG). Available at: https://www.ofgem.gov.uk/environmental-programmes/smart-export-guarantee-seg/about-smart-export-guarantee-seg (Accessed: 8 September 2020). Olsson, L. (2015). Sociotechnical system studies of the reduction of greenhouse gas emissions from energy and transport systems. doi:10.3384/diss.diva-116685 Oluleye, G. et al. (2016) ‘Evaluating the potential of process sites for waste heat recovery’, Applied Energy. Elsevier Ltd, 161, pp. 627–646. doi: 10.1016/j.apenergy.2015.07.011. Oscarsson, P. (2017). Konkurrenskraftig småskalig kraftvärme. Svebio. Paiva, M. C. S. de (2001) Financial analysis of vegetable charcoal and coke at a Minas Gerais plant from 1995 to 1999 (In Portuguese). Universidade Federal de Viçosa. Pili, R., Romagnoli, A., Spliethoff, H., & Wieland, C. (2017). Techno-Economic Analysis of Waste Heat Recovery with ORC from Fluctuating Industrial Sources. Energy Procedia, 129, 503-510. doi:10.1016/j.egypro.2017.09.170 Quoilin, S., Broek, M., Declaye, S., Dewallef, P., Lemort, V.. (2013). Techno-economic survey of Organic Rankine Cycle (ORC) systems. Renewable and Sustainable Energy Reviews, 168-186. doi:10.1016/j.rser.2013.01.028
PERFORMANCE AND POTENTIAL OF SMALL-SCALE ORC SYSTEMS
73
Regeringskansliet. (2018) Nya energipolitiska mål skapar långsiktighet. Available at: https://www.regeringen.se/pressmeddelanden/2018/04/nya-energipolitiska-mal-skapar-langsiktighet/ Riksdagsförvaltningen. (2014). Ellag (1997:857) Svensk författningssamling 1997:1997:857 t.o.m. SFS 2018:1448. Available at: https://www.riksdagen.se/sv/dokument-lagar/dokument/svensk-forfattningssamling/ellag-1997857_sfs-1997-857 Riksdagsförvaltningen. (2014). Lag (1994:1776) om skatt på energi svensk författningssamling 1994:1994:1776 t.o.m. SFS 2019:491. Available at https://www.riksdagen.se/sv/dokument-lagar/dokument/svensk-forfattningssamling/lag-19941776-om-skatt-pa-energi_sfs-1994-1776 SKM. (2019). Elcertificate price history. Available at: http://www.skm.se/priceinfo/history/2019/ (Accessed 9 January 2020). Steinwall, P., Nyström, J., Nyström, O. and Svensson, S-Å. (1999). Teknik och ekonomi för att förbereda nya biobränsleldade värmeverk för elproduktion. Stockholm: Värmeforsk Service. ISSN: 0282-3772. Swedish Tax Agency. (2019). Energiskatt på el. Retrieved 2020-01-10 from https://www.skatteverket.se/foretagochorganisationer/skatter/punktskatter/energiskatter/energiskattpael.4.15532c7b1442f256bae5e4c.html Thollander, P. (2019). Email response. Received 2019-08-25. Vattenfall. (2019). Våra priser. Retrieved 2019-11-14 from https://www.vattenfalleldistribution.se/el-hem-till-dig/elnatspriser/ Von Friesen, M. P., Odhner, P., Arnell, M., Ivarsson, P., Jannasch, A-K., Boss, A., Hjörnhede, A. (2018). More Efficient Use of Biogas at Waste Water Treatment Plants - Possibilities from integration of heat power. Stockholm: Energiforsk. ISBN: 978-91-7673-476-6. Werner, S. (2017a). District heating and cooling in Sweden, Energy, 126, pp. 419–429. doi: 10.1016/j.energy.2017.03.052. Werner, S. (2017b). International review of district heating and cooling, Energy. Elsevier Ltd, pp. 617–631. doi: 10.1016/j.energy.2017.04.045.
PERFORMANCE AND POTENTIAL OF SMALL-SCALE ORC SYSTEMS
74
Appendix A: Description of components
Even though the ORC may be the best choice of generating electricity from low grade heat sources, its capacity and efficiency is limited. First and foremost, the theoretical maximum efficiency that can be achieved is still fairly low, which is proved through the ideal Carnot cycle (Astolfi, 2017) stating that even with the most optimal conditions the efficiency will always be limited by the temperature differences in the system (Andersson, 2012). On the other hand, the output of the ORC will also be restrained by key components within the system. Components such as expander and pumps will suffer efficiency losses when miniaturized such as in the ORC case. However, as previously mentioned, because of the low power output, the plant layout also becomes simpler than the traditional steam Rankine cycles, making it cheaper to operate and more flexible to use for different system conditions (Astolfi, 2017). In Techno-economic survey of Organic Rankine Cycle (ORC) systems the authors show that the heat losses in a biomass fueled ORC is about 12 %, including heat leakages in the boiler and pipes (Quoilin et al, 2013). Following this section, the components of the ORC are presented.
Heat exchangers
Heat exchangers are used in several steps within the ORC. Namely at the heat introduction process where it’s called ‘evaporator’, for heat release out from the system where it is called ‘condenser’ and in some cases when using a heat exchanger as a way of recover heat after the expander for internal re-usage. In this last case the heat exchanger is called ‘recuperator’. Because of the low efficiency of the ORC, the heat exchanger must be chosen carefully. In general, there is a trade-off between sizing of the heat exchange surface and the economical aspect, since an increasing surface area benefits the performance of the heat exchanger, but also makes is more expensive (Astolfi, 2017). There are also different types of heat exchangers that can be used. In the article Performance Evaluation and Comparison of Experimental Organic Rankine Cycle Prototypes from Published Data, Landelle et al. (2017) describes that in a selection of 100 ORC systems 73 % of these used plate heat exchangers while shell & tube heat exchangers where employed by 15 % of these. This implies that using plate might be the best option, which also is confirmed by Bracco et al. (2017) where it is stated that plate heat exchangers is beneficial for small scale electricity production, both in technical and economic terms, while shell & tube is preferred for larger machines.
Evaporator
The evaporator is where heat is introduced into the system, exchanging heat from the heat source to a refrigerant within the ORC, which phase change from a liquid state to vapor form. In the ideal case the process is isobaric, meaning that the pressure is constant.
Expander
After the evaporator the working fluid, now in gas form, goes through the expander. Different types of expanders may be used depending on the power
PERFORMANCE AND POTENTIAL OF SMALL-SCALE ORC SYSTEMS
75
output of the ORC. Scroll expanders are preferred under 5kW, screw expander between 5 and 50 kW and turbines above 50 kW (Landelle et al., 2018). Common for all types of expander is that kinetic and static pressure is converted into mechanical work which powers a generator producing electricity. Because of low volume flow rates, turbines that are used in ORC, such as the case of Norrköping and Ronneby, are much less complex in being both smaller and made from fewer components. This in turn makes them a cheaper alternative to steam turbines (Astolfi, 2017).
Recuperator
A recuperator can be used to further improve the efficiency of the ORC. The recuperator exchanges heat from the fluid after expander to the fluid before the evaporator. By doing so, it reduces the heat discharged to the condenser water and limits temperature differences in the evaporator (Astolfi, 2017). However, in this case the steam turbine needs relief valves which contributes to the technical difficulties, hence another reason why the ORC has a low investment cost compared to the traditional steam cycle (Frederiksen, 2009). As mentioned, installing a recuperator can lead to beneficial efficiency improvements but if the condenser waste flow is to be used for a different purpose, such as warm water usage within the plant it might be better not to use a recuperator (Bracco et al, 2017). This is also an economical factor as heat exchangers are among the more expensive components within the ORC.
Condenser
A condenser can be called a reversed evaporator, where an external cooling medium, either cold water or a heat transfer fluid is being used. Cold water can be available from natural resources such as rivers, seas, lakes and boreholes while heat transfer fluid is used in conjunction with district heating. A condenser can also be air cooled, however because of air condensers needing a much larger cooling area for the same heat exchange as a water-cooled condenser it is often much more expensive and therefore should only be used if water is not available (Astolfi, 2017). The purpose of the condenser is to make the vapor exiting the expander or recuperator phase-change into liquid form before entering the pump. As previously mentioned, it is important to consider what usage the heated cooling stream have. Bracco et al. (2017) states that in order to produce hot water that can be used for sanitary needs the condenser temperature should be 40°C while for the use of space heating it should be 60°C.
Pump
The key role of the pump is to achieve the desired flow rate and pressure increase. However, when choosing pump type, it is important to take into consideration the operation temperatures, pressures, compatibility of the fluid with the pump materials and the viscosity of the fluid. Organic fluids usually have a low viscosity and it is therefore important to avoid leakages in the pump mechanism (Bracco et al., 2017). The pumps used in ORC systems are usually variable speed multistage centrifugal pumps with relatively common designs (Astolfi, 2017).
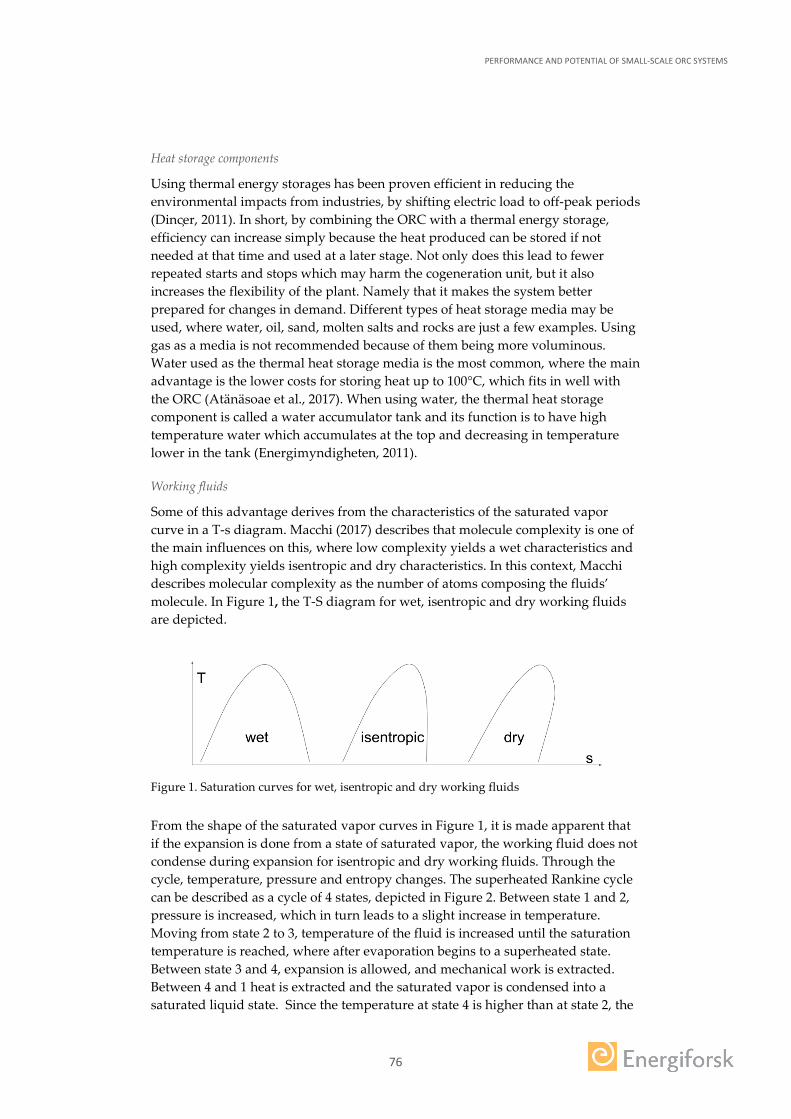
PERFORMANCE AND POTENTIAL OF SMALL-SCALE ORC SYSTEMS
76
Heat storage components
Using thermal energy storages has been proven efficient in reducing the environmental impacts from industries, by shifting electric load to off-peak periods (Dinc er, 2011). In short, by combining the ORC with a thermal energy storage, efficiency can increase simply because the heat produced can be stored if not needed at that time and used at a later stage. Not only does this lead to fewer repeated starts and stops which may harm the cogeneration unit, but it also increases the flexibility of the plant. Namely that it makes the system better prepared for changes in demand. Different types of heat storage media may be used, where water, oil, sand, molten salts and rocks are just a few examples. Using gas as a media is not recommended because of them being more voluminous. Water used as the thermal heat storage media is the most common, where the main advantage is the lower costs for storing heat up to 100°C, which fits in well with the ORC (Atänäsoae et al., 2017). When using water, the thermal heat storage component is called a water accumulator tank and its function is to have high temperature water which accumulates at the top and decreasing in temperature lower in the tank (Energimyndigheten, 2011).
Working fluids
Some of this advantage derives from the characteristics of the saturated vapor curve in a T-s diagram. Macchi (2017) describes that molecule complexity is one of the main influences on this, where low complexity yields a wet characteristics and high complexity yields isentropic and dry characteristics. In this context, Macchi describes molecular complexity as the number of atoms composing the fluids’ molecule. In Figure 1, the T-S diagram for wet, isentropic and dry working fluids are depicted.
Figure 1. Saturation curves for wet, isentropic and dry working fluids
From the shape of the saturated vapor curves in Figure 1, it is made apparent that if the expansion is done from a state of saturated vapor, the working fluid does not condense during expansion for isentropic and dry working fluids. Through the cycle, temperature, pressure and entropy changes. The superheated Rankine cycle can be described as a cycle of 4 states, depicted in Figure 2. Between state 1 and 2, pressure is increased, which in turn leads to a slight increase in temperature. Moving from state 2 to 3, temperature of the fluid is increased until the saturation temperature is reached, where after evaporation begins to a superheated state. Between state 3 and 4, expansion is allowed, and mechanical work is extracted. Between 4 and 1 heat is extracted and the saturated vapor is condensed into a saturated liquid state. Since the temperature at state 4 is higher than at state 2, the
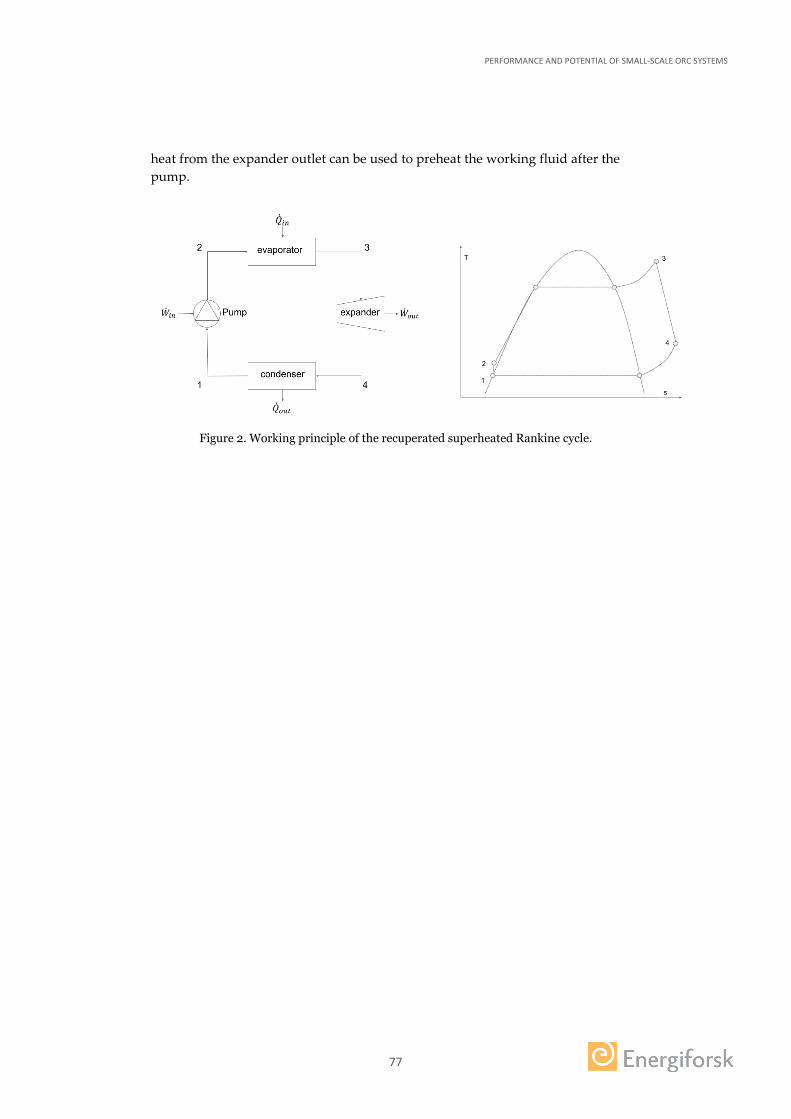
PERFORMANCE AND POTENTIAL OF SMALL-SCALE ORC SYSTEMS
77
heat from the expander outlet can be used to preheat the working fluid after the pump.
Figure 2. Working principle of the recuperated superheated Rankine cycle.
PERFORMANCE AND POTENTIAL OF SMALL-SCALE ORC SYSTEMSEnergisektorn spelar en avgörande roll för att utveckla och expandera lösningar baserade på förnyelsebar energi och för att öka effektiviteten i energianvänd-ningen. Den dominerande tekniken för småskalig värmebaserad elproduktion är den organiska Rankine-cykeln som är en variant av den vanliga ångkraft- cykeln.
Den huvudsakliga skillnaden är att ORC-system använder ett organiskt arbets-medium i stället för vatten vilket leder till väsentligt förbättrad teknisk och ekonomisk prestanda för system där värmekällan har låga till medelhöga tem-peraturer. Det blir också möjligt att producera el- och värme samtidigt även i liten skala.
Den här tekniken har studerats i nyligen installerade system för biobränsle- baserad elproduktion vid avloppsreningsverket i Norrköping och värmeverket i Ronneby/Bräkne-Hoby. Resultaten visar att driftsäkerheten är mycket hög och att både den ekonomiska lönsamheten och den klimatmässiga prestandan kan vara god även för mycket små kraftverk. Vid kontinuerlig drift vid ett värme-verk är totalverkningsgraden nära 100 procent, eftersom all värme som produ-ceras antingen omvandlas till el eller leds in i fjärrvärmenätet.
Småskalig elproduktion med ORC-system har här studerats i olika länder och för olika marknadsförutsättningar. Installationens storlek påverkar nuvärde- sanalysen och visar att uppskalningseffekten till större system är markant. Resultaten visar att potentialen för att installera ORC-system globalt är stor, både ur ett ekonomiskt perspektiv och ett klimatperspektiv.
Energiforsk is the Swedish Energy Research Centre – an industrially owned body dedicated to meeting the common energy challenges faced by industries, authorities and society. Our vision is to be hub of Swedish energy research and our mission is to make the world of energy smarter!
Related Documents