Internship Report On “Performance and Financial Analysis of Fareast Islami Life Insurance Company Limited” Prepared for S.M Arifuzzaman Asst. Professor, BRACU Supervisor, Internship Program Prepared by Md. Mamunur Rashid Mamun Student ID: 12164084 MBA (Major in Finance)

Welcome message from author
This document is posted to help you gain knowledge. Please leave a comment to let me know what you think about it! Share it to your friends and learn new things together.
Transcript
Internship Report
On
“Performance and Financial Analysis of
Fareast Islami Life Insurance Company Limited”
Prepared for
S.M Arifuzzaman
Asst. Professor, BRACU
Supervisor, Internship Program
Prepared by
Md. Mamunur Rashid Mamun
Student ID: 12164084
MBA (Major in Finance)

September 01, 2014
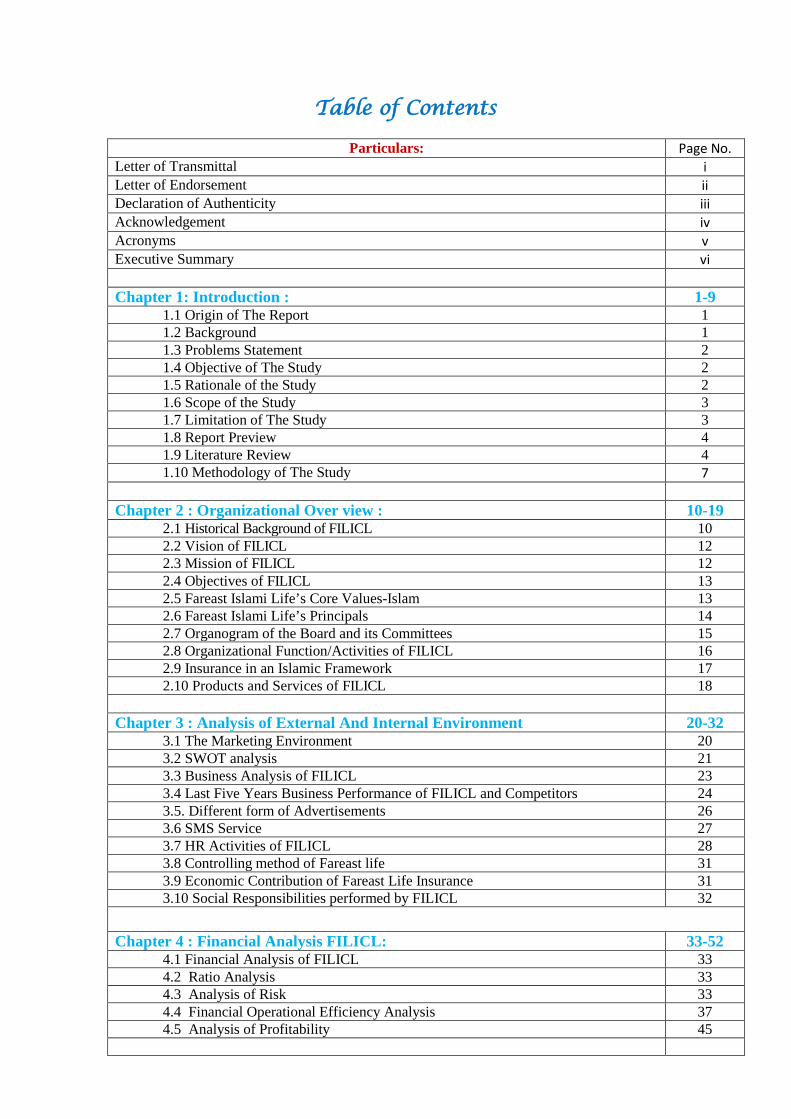
Table of Contents
Particulars: Page No. Letter of Transmittal i Letter of Endorsement ii Declaration of Authenticity iii Acknowledgement iv Acronyms v Executive Summary vi Chapter 1: Introduction : 1-9
1.1 Origin of The Report 1 1.2 Background 1 1.3 Problems Statement 2 1.4 Objective of The Study 2 1.5 Rationale of the Study 2 1.6 Scope of the Study 3 1.7 Limitation of The Study 3 1.8 Report Preview 4 1.9 Literature Review 4
1.10 Methodology of The Study 7 Chapter 2 : Organizational Over view : 10-19
2.1 Historical Background of FILICL 10 2.2 Vision of FILICL 12 2.3 Mission of FILICL 12 2.4 Objectives of FILICL 13 2.5 Fareast Islami Life’s Core Values-Islam 13 2.6 Fareast Islami Life’s Principals 14 2.7 Organogram of the Board and its Committees 15 2.8 Organizational Function/Activities of FILICL 16 2.9 Insurance in an Islamic Framework 17 2.10 Products and Services of FILICL 18
Chapter 3 : Analysis of External And Internal Environment 20-32
3.1 The Marketing Environment 20 3.2 SWOT analysis 21 3.3 Business Analysis of FILICL 23 3.4 Last Five Years Business Performance of FILICL and Competitors 24 3.5. Different form of Advertisements 26 3.6 SMS Service 27 3.7 HR Activities of FILICL 28 3.8 Controlling method of Fareast life 31 3.9 Economic Contribution of Fareast Life Insurance 31 3.10 Social Responsibilities performed by FILICL 32
Chapter 4 : Financial Analysis FILICL: 33-52 4.1 Financial Analysis of FILICL 33 4.2 Ratio Analysis 33 4.3 Analysis of Risk 33 4.4 Financial Operational Efficiency Analysis 37 4.5 Analysis of Profitability 45
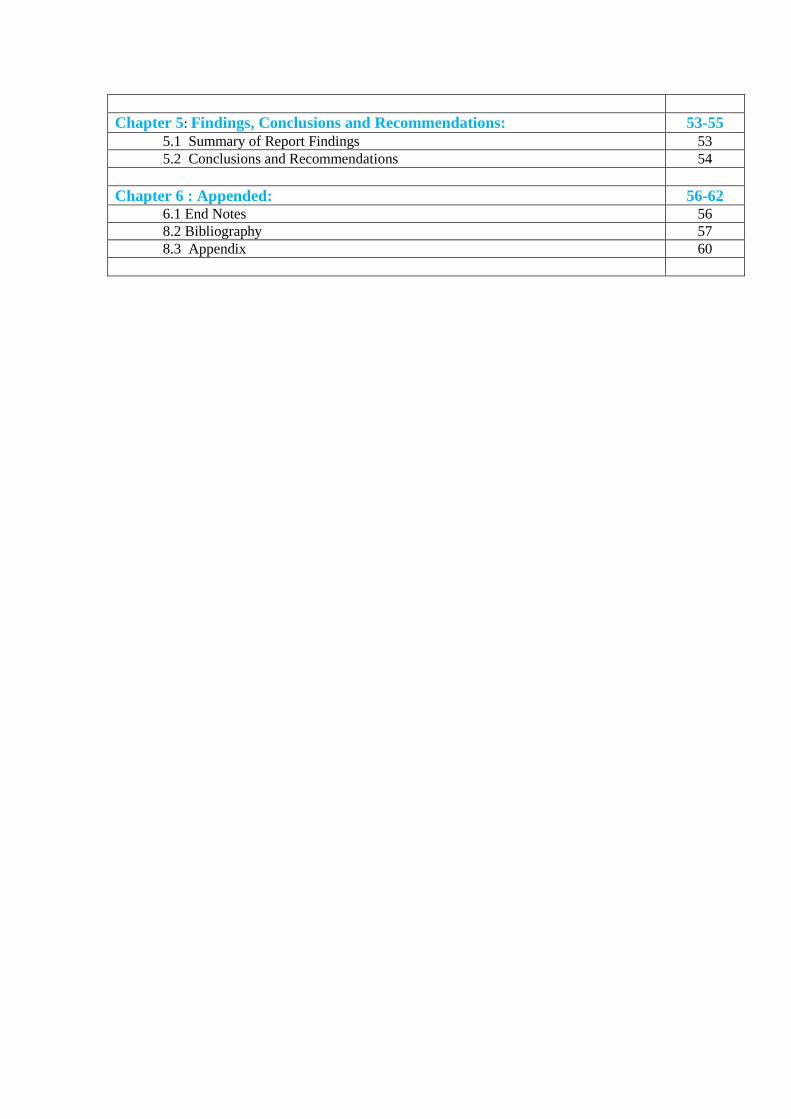
Chapter 5: Findings, Conclusions and Recommendations: 53-55
5.1 Summary of Report Findings 53 5.2 Conclusions and Recommendations 54
Chapter 6 : Appended: 56-62
6.1 End Notes 56 8.2 Bibliography 57 8.3 Appendix 60
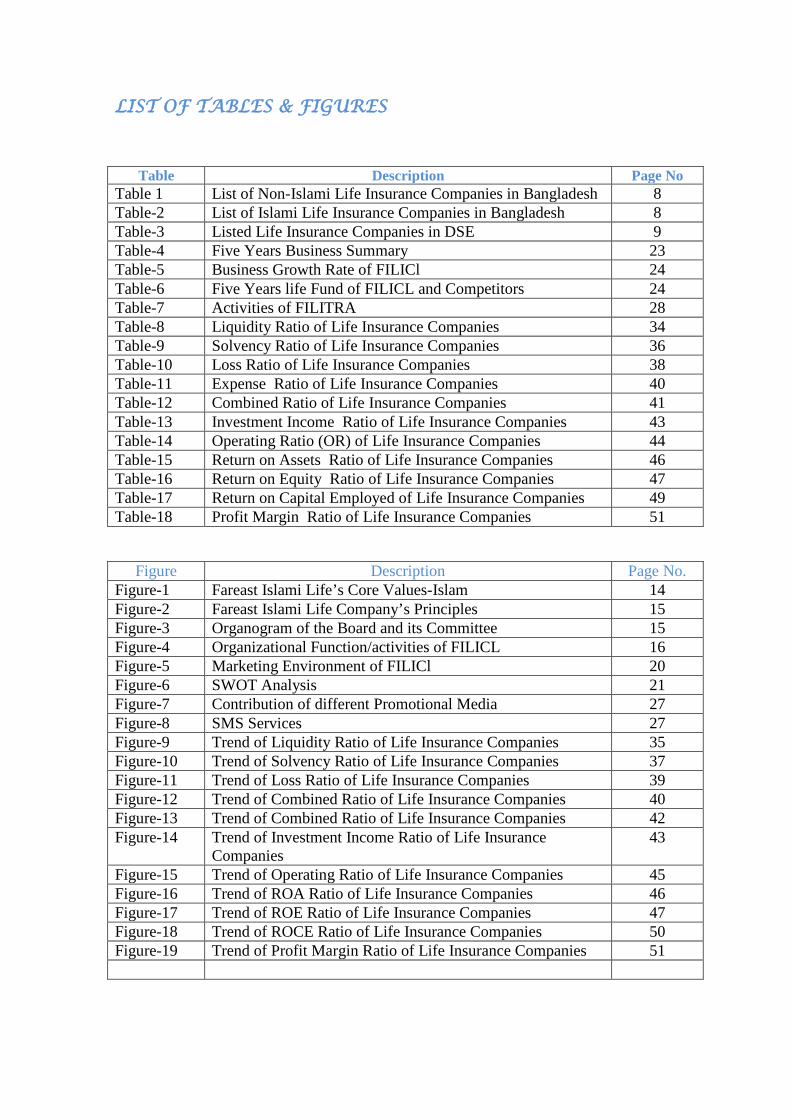
LIST OF TABLES & FIGURES
Table Description Page No Table 1 List of Non-Islami Life Insurance Companies in Bangladesh 8 Table-2 List of Islami Life Insurance Companies in Bangladesh 8 Table-3 Listed Life Insurance Companies in DSE 9 Table-4 Five Years Business Summary 23 Table-5 Business Growth Rate of FILICl 24 Table-6 Five Years life Fund of FILICL and Competitors 24 Table-7 Activities of FILITRA 28 Table-8 Liquidity Ratio of Life Insurance Companies 34 Table-9 Solvency Ratio of Life Insurance Companies 36 Table-10 Loss Ratio of Life Insurance Companies 38 Table-11 Expense Ratio of Life Insurance Companies 40 Table-12 Combined Ratio of Life Insurance Companies 41 Table-13 Investment Income Ratio of Life Insurance Companies 43 Table-14 Operating Ratio (OR) of Life Insurance Companies 44 Table-15 Return on Assets Ratio of Life Insurance Companies 46 Table-16 Return on Equity Ratio of Life Insurance Companies 47 Table-17 Return on Capital Employed of Life Insurance Companies 49 Table-18 Profit Margin Ratio of Life Insurance Companies 51
Figure Description Page No. Figure-1 Fareast Islami Life’s Core Values-Islam 14 Figure-2 Fareast Islami Life Company’s Principles 15 Figure-3 Organogram of the Board and its Committee 15 Figure-4 Organizational Function/activities of FILICL 16 Figure-5 Marketing Environment of FILICl 20 Figure-6 SWOT Analysis 21 Figure-7 Contribution of different Promotional Media 27 Figure-8 SMS Services 27 Figure-9 Trend of Liquidity Ratio of Life Insurance Companies 35 Figure-10 Trend of Solvency Ratio of Life Insurance Companies 37 Figure-11 Trend of Loss Ratio of Life Insurance Companies 39 Figure-12 Trend of Combined Ratio of Life Insurance Companies 40 Figure-13 Trend of Combined Ratio of Life Insurance Companies 42 Figure-14 Trend of Investment Income Ratio of Life Insurance
Companies 43
Figure-15 Trend of Operating Ratio of Life Insurance Companies 45 Figure-16 Trend of ROA Ratio of Life Insurance Companies 46 Figure-17 Trend of ROE Ratio of Life Insurance Companies 47 Figure-18 Trend of ROCE Ratio of Life Insurance Companies 50 Figure-19 Trend of Profit Margin Ratio of Life Insurance Companies 51
LETTER OF TRANSMITTAL
September 01, 2014
S.M Arifuzzaman,
Asst. Professor,
BRAC Business School,
BRAC University
Mohakhali, Dhaka.
Dear Sir:
Subject:
With due respect and humble to inform you that it is my pleasure to submit this report on
“Performance and Financial Analysis of Fareast Islami Life Insurance Company Limited” as a
partial MBA course requirement.
Submission of Internship Report.
As you will see, this report is based on Performance and Financial Analysis of Fareast Islami Life Insurance Company and comparative analysis with its competitors and industry. The report provides a clear view of Islami Life Insurance Company and its financial performance. It provides a scope to us to acquire practical knowledge on how an insurer operates its investment procedures from premium incomes.
As your valuable suggestions and guidance, I have tried my best t o prepare t h e report
properly. There may be some shortcomings. I would be grateful if you consider those as
excusable points and I like to thank you for your kind cooperation. Despite the limitations, I
sincerely believe that you will find this report very significant and informative.
Therefore, I pray and hope that you would be kind enough to accept my report for evaluation and
oblige thereby.
Sincerely yours,
Md. Mamunur Rashid Mamun Student ID: 12164084
MBA (Major in Finance), BRACU
ACKNOWLEDGEMENT
The outcome of any particular research depends on the contribution of a number of people,
especially those who take time to share their thoughtful guidance, ideas and suggestions to make
the research a successful one. This research is not an exception from the mentioned criteria. A
number of people have made significant contribution in preparing this report. Their insights,
advise and suggestions helped me a lot.
At first, I would like to express my deepest sense of gratitude; all sorts of praises to the “Almighty
Allah”, whose blessing have enabled me to complete this report.
It is my proud privilege to acknowledge the sincere and deepest sense of gratitude to my
internship supervisor S.M Arifuzzaman (Asst. Professor of BRAC Business School) for
continuously guiding me about the development and preparation of the paper. He has
enriched me with necessary ideas and concept for incessant improvement of the report.
I would like to thanks Fareast Islami Life Insurance Company Limited (FILICL) for having such a
wonderful and unique organizational structure through which I get the chances to learn and
experience the particular applications of Islamic Life Insurance. I would like to specially thank Mr.
Md. Abdul Khaleque FCA (Addl. MD and Chief Finance Officer of FILICL) who had been my
external supervisor for internship. He has provided me with all necessary facilities to carry out my
tasks in a familiar environment. He has continuously guided me to organize the report.
My sincere thanks to Mr. Abdur Razzaque, Joint Vice President (In-charge Banking &
Investment Department), Mr. Md. Saiful Islam (In-charge HR Department), and Mr. Mr.
Ruhul Amin Khan, Vice President (Finance & Account Department of FILICL) provide
me all the access and working environment as well as provide all necessary information
for research work.
Last but not the least, I would like to thank Mr. Md. Farid Uddin, Assistant Vice
President of Finance & Accounts Department, FILICL who in all steps was with me and
guided to the end in every possible doubt with every possible means. He was the
supervisor of all necessary coordination and preparation for doing the research. It would
be an impossible task for without the help of him to complete this report into a presentable
one.
EXECUTIVE SUMMARY
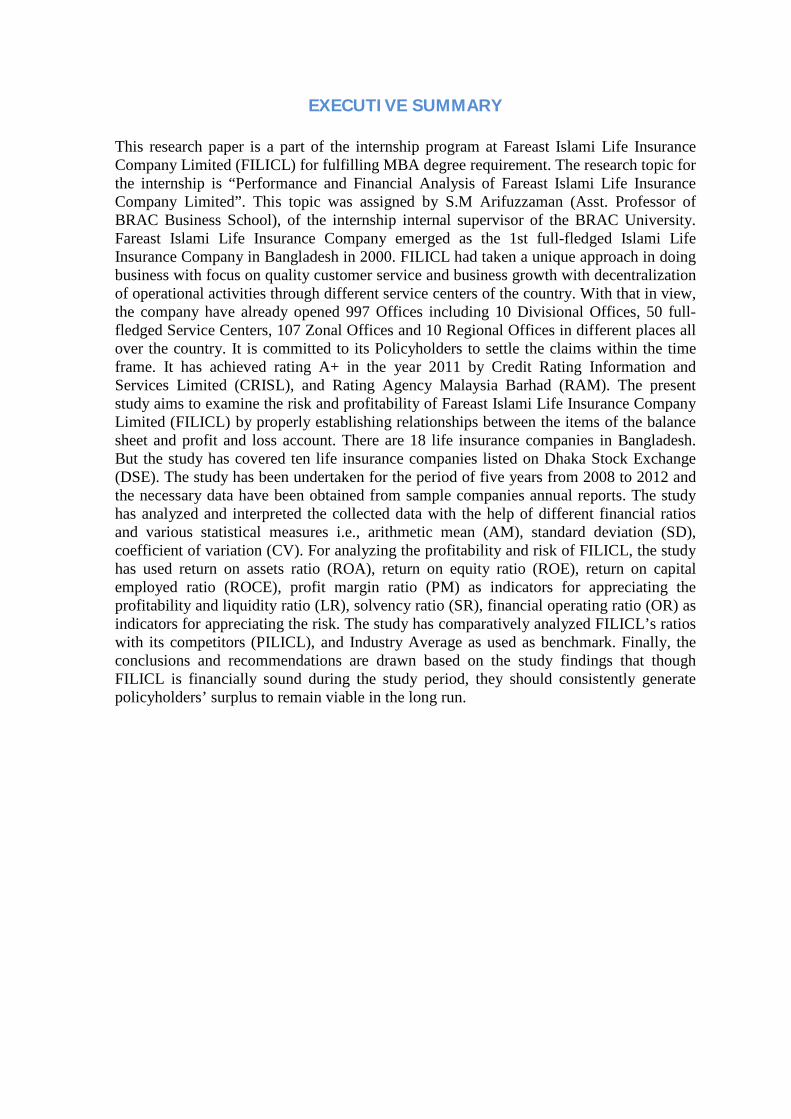
This research paper is a part of the internship program at Fareast Islami Life Insurance Company Limited (FILICL) for fulfilling MBA degree requirement. The research topic for the internship is “Performance and Financial Analysis of Fareast Islami Life Insurance Company Limited”. This topic was assigned by S.M Arifuzzaman (Asst. Professor of BRAC Business School), of the internship internal supervisor of the BRAC University. Fareast Islami Life Insurance Company emerged as the 1st full-fledged Islami Life Insurance Company in Bangladesh in 2000. FILICL had taken a unique approach in doing business with focus on quality customer service and business growth with decentralization of operational activities through different service centers of the country. With that in view, the company have already opened 997 Offices including 10 Divisional Offices, 50 full-fledged Service Centers, 107 Zonal Offices and 10 Regional Offices in different places all over the country. It is committed to its Policyholders to settle the claims within the time frame. It has achieved rating A+ in the year 2011 by Credit Rating Information and Services Limited (CRISL), and Rating Agency Malaysia Barhad (RAM). The present study aims to examine the risk and profitability of Fareast Islami Life Insurance Company Limited (FILICL) by properly establishing relationships between the items of the balance sheet and profit and loss account. There are 18 life insurance companies in Bangladesh. But the study has covered ten life insurance companies listed on Dhaka Stock Exchange (DSE). The study has been undertaken for the period of five years from 2008 to 2012 and the necessary data have been obtained from sample companies annual reports. The study has analyzed and interpreted the collected data with the help of different financial ratios and various statistical measures i.e., arithmetic mean (AM), standard deviation (SD), coefficient of variation (CV). For analyzing the profitability and risk of FILICL, the study has used return on assets ratio (ROA), return on equity ratio (ROE), return on capital employed ratio (ROCE), profit margin ratio (PM) as indicators for appreciating the profitability and liquidity ratio (LR), solvency ratio (SR), financial operating ratio (OR) as indicators for appreciating the risk. The study has comparatively analyzed FILICL’s ratios with its competitors (PILICL), and Industry Average as used as benchmark. Finally, the conclusions and recommendations are drawn based on the study findings that though FILICL is financially sound during the study period, they should consistently generate policyholders’ surplus to remain viable in the long run.
Performance and Financial Analysis of FILICL
1 Introduction
1.1 Origin of the Report As part of the Internship Program of Masters of Business Administration (MBA) course
requirement, I was assigned for doing my internship in Fareast Islami Life Insurance
Company Limited (FILICL). I was placed as an intern in Finance and Accounts
department of FILICL (Head Office) under the supervision of Mr. Md. Abdul Khaleque
FCA (Addl. MD and Chief Finance Officer of FILICL). The research topic for the
internship is “Performance and Financial Analysis of Fareast Islami Life Insurance
Company Limited”, which was approved proposal by the faculty supervisor S.M
Arifuzzaman (Asst. Professor of BRAC Business School) and accepted by the host
organization as par necessity to fulfill the internship requirement. The report is submitted
on September 01, 2014.
1.2 Background of the Report Insurance is a contract (policy) according to which one party (a policy holder) pays an
amount of money (premium1) to another party (insurer) in return for an obligation to
compensate some possible losses of the policy holder. The aim of such a contract is to
provide a policy holder with some protection against certain risks. Death, sickness,
disability, motor vehicle accident, loss of property, etc. are some typical examples of
such risks. Each policy contract specifies the policy term and the method of
compensation. Any event specified in the policy contract that takes place during its term
can result in such an insurance claim.
Insurance is an old form of financial practice of sharing risk, which was introduced in
mid-18th century. There are various types of insurance policies (such as life insurance,
car insurance, health insurance, business insurance, marine insurance, and so on )
introduced in the world. But Life insurance is very well-known policy in insurance
business and it is a valuable asset to mitigate the financial risk of untimely death. As a
crucial component of the financial system, life insurance policy is an important source of
savings and long-term institutional investments essential for the development and growth
of the financial markets. The main uses of life insurance company funds are as
investment in government securities, corporate securities, mortgages, and real estate.
Insurance companies are exposed to different risk categories, including financial risks
(such as leverage risks, credit risk, liquidity risk, and interest rate risk), environmental
Performance and Financial Analysis of FILICL
2 Introduction
risks, management risks, delivery risks, etc which are incurred in delivering a product or
service.
1.3 Problem Statement
The issues of profitability2 have always been a concern, both among researchers and
practitioners. Companies can set different goals, but profitability remains a key element,
required to ensure market survival. The profitability analysis should be made in the
context of risk3. Between these two variables must be a very strong direct relationship. A
high level of risk must lead higher return otherwise the entrepreneurs wouldn’t invest
any more in that business. So, this study has attempt to analysis any discrepancies
between risk and profitability of Fareast Islami Life Insurance Company.
1.4 Objectives of the Study To develop the research objectives, I have considered the followings: 1.4.1 Broad Objective: To analysis the risk and profitability of Fareast Islami Life
Insurance Company Limited.
1.4.2 Specific Objectives: The specific objectives of the study are as follows:
1) To find out the liquidity risk of life insurance companies in Bangladesh.
2) To find out the solvency risk of life insurance companies in Bangladesh.
3) To find out the operational risk of life insurance companies in Bangladesh.
4) To find out the profitability of life insurance companies in Bangladesh.
5) To find out the limitations of Fareast Islami Life Insurance Company in terms of
its financial performance, if any and to suggest some measures for the problem
encountered.
1.5 Rationale of the Study
The Insurance business is one of the most important commercial sectors in Bangladesh
that fosters financial stability by enabling economic agents to undertake various
transactions with the facility of transfer and dispersion of risks. So, Knowledge of
insurance is as much essential as trading business for the society. But students of
BRACU have never got any chance to acquire knowledge on Insurance business.
Because none of research work has previously done by any BRACU student on
Insurance Sector of Bangladesh and there is no article in BUP Library related to
Performance and Financial Analysis of FILICL
3 Introduction
insurance business. Therefore, this study was a great experience for me to work in the
insurance sector of Bangladesh and it will enrich the resources of BRACU Library,
which will be used as reference for future research. The other beneficiaries of this
research are as follows:
i) Management of Fareast Islami Life Insurance Company
ii) Insurance Development & Regulatory Authority, Bangladesh (IDRA)
1.6 Scope of the Study
This study is conducted on life insurance sector of Bangladesh. This report gives an
overview of FILICL including its products, services, operating activities, and its business
environment. The scope of this study is to analysis the risk and profitability of Fareast
Islami Life Insurance Company, which also has compared with its competitors using data
of last five years (2008 to 2012). The scope of the study is confined within the Dhaka
Stock Exchange (DSE) listed life insurance companies.
1.7 Limitations of the Study
During internship period, one cannot have adequate working experience and cannot have
time to carry out the subject study in detail. Having the scope of working only in the
head office or branch office, one cannot have enough exposure to the various activities of
a large organization like Fareast Islami Life Insurance Company. Moreover, the subject
matter of the report covers the entire life insurance industry of Bangladesh. So it was
difficult for me to collect primary data from the entire life insurance industry of
Bangladesh during internship period. But I have tried my level best to find out the
opportunity of work for overcoming the limitation. The research also had following
limitations:
• Due to shortage of time and official compulsion it was not possible to collect
secondary data from the entire life insurance industry of Bangladesh. As such
help has been taken from sample companies’ annual reports.
• Another limitation of this study is the company’s policy of not disclosing some
data and information for obvious reasons, which could be very much useful.
Performance and Financial Analysis of FILICL
4 Introduction
1.8 Report Preview
For better layout of the entire presentation the report is arranged in the following parts:
Part I – Development of the Research • Up to Methodology of the Study
Part II – Organizational Part (about FILICL)
Part III – Analysis of External and Internal Environment (about FILICL)
Part IV – Financial Data Analysis and Interpretation • Risk Analysis • Profitability Analysis
Part V – Findings, Conclusion and Recommendations
Part VI – Appended Part
1.9 Literature Review
The focused literature is particularly concerned with the profitability and risk issues of
life sector in Bangladesh. This will simulate the reader as well as the researcher for
getting a deeper understanding of the sector and its financial performance. Literature
review will help emphasize the reason why this study is important and relevant to the
current scenario. Literature review involves extensive reading and helps the researcher to
get a closer look at various insurers are performing. This section is further divided into
following sections:
1.9.1 Conceptual Review: The principal function of insurance as an economic institution
is the equitable distribution of the financial losses of the few over the many. In insurance,
each policy holder contributes an amount in insurance with the risk he introduced to a
fund, established and administered by the insurer and out of the fund; the losses are paid
to the insured members. The main function of an insurance organization then becomes
the management of the fund and the assessment of the equitable contributions to be made
by the policyholders.
Life assurance contracts available are many and the basis of all these policies can be
found under the following headings:
Term Insurance: This is the simplest and oldest form of assurance and provides
for payment of the sum assured on death, provided death occurs within a specified
Performance and Financial Analysis of FILICL
5 Introduction
term. This is a very cheap form of cover and suitable, for a young married man
who wants to provide a reasonable sum for his wife in the event of his death.
Whole Life Insurance: The chosen sum assured is payable on the death of the
assured whenever it occurs. Premiums are payable throughout the life of the
assured or until retirement of the assured. Although premiums may cease at , say,
age sixty the policy is still in force and should the person die at age seventy-five
the policy would provide the benefits for his widow or family.
Endowment Insurance: The chosen sum assured is payable at the end of a given
term of years or on earlier death. These contracts are taken out as savings plans for
the future with the added attraction of life cover being included.
Annuities: When a person has a reasonably large sum of money and wants to
provide an income for himself after he retires or at some other time he can
approach a life assurance company and purchase an annuity. The annuity may start
at once, when it is called an immediate annuity, or may start at some date in the
future (a deferred annuity).
Pension Schemes: These schemes are designed to provide an income at retirement.
So far as insurers are concerned they may be asked to arrange a scheme, rather
than a firm doing all the work itself. This involves collecting the premiums,
investing them and paying pensions to retired work people.
Premiums: Premiums are a regular periodic payment for an insurance policy, also called
insurance premium. Different types of policies require different premiums based on the
degree of risk that the situation presents.
Claims: An insurance claim is the actual application for benefits provided by an
insurance company. The most common issue in insurance disputes is whether the insurer
is obligated to pay a claim. The determination of the insurer's obligation depends on
many factors, such as the circumstances surrounding the loss and the precise coverage of
the insurance policy.
Insurers Business Model:
Profit = earned premium + investment income - incurred loss - underwriting expenses
Performance and Financial Analysis of FILICL
6 Introduction
Reinsurance: It is insurance that is purchased by an insurance company (insurer also
sometimes called a "cedant" or "cedent") from another insurance company (reinsurer) as
a means of risk management.
Life Fund: Life fund in a life insurance company represents the accumulated balance at
any time of surplus in income over all expenses including claims outgo and often all
adjustments have been made.
1.9.2 Empirical Review: This section reviews existing empirical research regarding the
profitability of an insurer. The aim of this literature review is to give a comprehensive
overview of important findings of other studies and to provide understanding of potential
contradictions and shortcomings of current literature.
D. F. Babbel and J. Lamm (1987) stated that liquidity is not as big a concern with many
insurance firms as it is in other financial institutions for one good reason: most of their
policies are less liquid than their assets. If liquid resources are not already available to
meet a financial commitment as it claims due, liquid funds will need to be borrowed
and/or illiquid assets sold in order to meet the commitment. Losses would arise from the
interest on borrowings and from any discount that would need to be offered to realize
assets. In the worst case scenario, a life insurer may not be able to meet its commitments.
Pradeep Kansal (1997) stated that a life insurer need to minimum solvency that is related
to the policy reserve. He denotes solvency margin as the capital base, defined as the
surplus of assets over liabilities. It is often called shareholders’ funds.
Zulkornain, Radam, Ismail and Rubayah Yakob (2011) stated that Insurers have to
preserve the solvency environment in ensuring their obligations to policyholder. The
insurers also must have the proper framework to balance the risk return trade-off, as well
as sound and prudent asset liability matching.
Wright (1992) stated that life insurance companies used unique accounting system due to
which profitability of the industry has always been difficult to measure as compared to
other financial institutions. Profitability is affected by factors including the scale of
policy holder’s dividend, capital gain or losses and federal/state taxes for insurer.
Performance and Financial Analysis of FILICL
7 Introduction
Al-Shammari and Salimi (1998) stated that profitability ratio especially Return on Equity
(ROE) signals the earning capability of the organization. They also suggest that higher
return on Equity (ROE) ratio is appreciable and it is the primary indicator of banks
profitability and functional efficiency.
Hye & Rahman (1997) conducted a research to assess the performance of the selected
private sector general insurance companies in Bangladesh. The study found that the
insurance companies were keeping their surplus funds in the form of fixed deposits with
different commercial banks due to absence of suitable avenues for investment. These
studies attest that the ratio analysis is the good method to evaluate firm performance.
1.10 Methodology of the Study
The methodology of the study has been discussed in the following sub-heads:
1.10.1 Type of Study: This study was a descriptive research where I have been analyzed
mainly secondary data to find out the situation of risk and profitability of a life insurance
company.
1.10.2 Sources of Data: All the data has gathered for report writing during the course on
internship. Information collected to furnish this report is mainly from secondary in
nature. Primary information from the organization was gathered through informal
discussion.
1.10. 2.1 Primary Sources:
i) Face to face conversation with the respective officers and stuffs of Fareast Islami Life
Insurance Company.
ii) Practical work experience in different departments of Fareast Islami Life Insurance
Company.
1.10.2.2 Secondary Sources:
i) Annual reports of different life insurance company in Bangladesh.
ii) Website of different life insurance Companies.
iii) Different internal manual of Fareast Islami Life Insurance Company Ltd.
iv) DSE and SEC Library
Performance and Financial Analysis of FILICL
8 Introduction
1.10.3 Sampling Plan:
1.10.3.1 Target Population: The target population for this study is the different life
insurance companies in Bangladesh.
1.10.3.2 Sample Frame: There are 18 (eighteen) life insurance companies in
Bangladesh, which are divided in two groups: ‘Islami Life Insurance Company’ and
‘Non-Islami Life Insurance Company’. The lists of life insurance companies based on
group are stated in table-1 and table-2.
Table-1: List of Non-Islami Life Insurance Companies in Bangladesh
SL. No. Name of Life Insurance Company
1. Jiban Bima Corporation
2. American Life Insurance Company
3. Baira Life Insurance Company Ltd.
4. Delta Life Insurance Company Ltd.
5. Golden Life Insurance Ltd.
6. Homeland Life Insurance Company Ltd.
7. Meghna Life Insurance Company Ltd.
8. National Life Insurance Company Ltd.
9. Popular Life Insurance Company Ltd
10. Pragati Life Insurance Ltd.
11. Progressive Life Insurance Company Ltd.
12. Rupali Life Insurance Company Ltd.
13. Sandhani Life Insurance Company Ltd.
14. Sunflower Life Insurance Company Ltd.
15. Sun Life Insurance Company Ltd.
Table-2: List of Islami Life Insurance Companies in Bangladesh
SL. No. Name of Life Insurance Company
1. Farest Islami Life Insurance Co. Ltd. (FILICL)
2. Prime Islami Life Insurance Company Ltd. (PILICL)
3. Padma Islami Life Insurance Company
Performance and Financial Analysis of FILICL
9 Introduction
1.10.3.3 Sampling Method: The non-probability-sampling has used primarily for available
appropriate sampling frame.
1.10.3.4 Sample Size: There are 18 life insurance companies in Bangladesh among them
10 life insurance companies are listed in the Dhaka Stock Exchanges (DSE). As the time
limitation for this research, I have only selected those companies which are listed in
DSE. Hence, my desired sample size was 10 for data collection. The following
companies are listed in DSE:
Table-3: Listed Life Insurance Companies in DSE
SL. No. Name of the Life Insurance Company
1. Delta Life Insurance Company Ltd.
2. Meghna Life Insurance Company Ltd.
3. National Life Insurance Company Ltd.
4. Popular Life Insurance Company Ltd
5. Pragati Life Insurance Ltd.
6. Progressive Life Insurance Company Ltd.
7. Rupali Life Insurance Company Ltd.
8. Sandhani Life Insurance Company Ltd.
9. Farest Islami Life Insurance Co. Ltd. (FILICL)
10 Prime Islami Life Insurance Company Ltd. (PILICL)
1.10.4 Data Analysis and Interpretation: The collected data have been tabulated,
analyzed and interpreted with the help of different financial ratios. Various statistical
measures have been used i.e., arithmetic mean (AM), standard deviation (SD),
coefficient of variation (CV), level of significance, confidence interval.
Performance and Financial Analysis of FILICL
10 Introduction
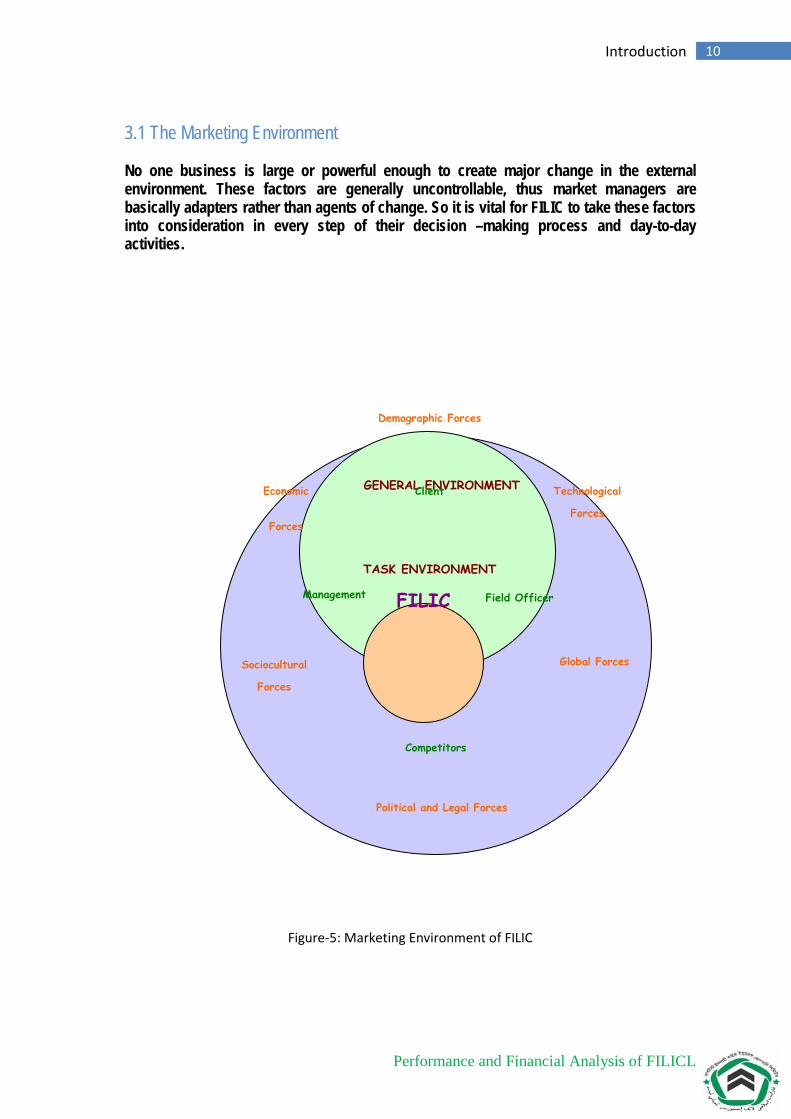
3.1 The Marketing Environment No one business is large or powerful enough to create major change in the external environment. These factors are generally uncontrollable, thus market managers are basically adapters rather than agents of change. So it is vital for FILIC to take these factors into consideration in every step of their decision –making process and day-to-day activities.
Figure-5: Marketing Environment of FILIC
GENERAL ENVIRONMENT
TASK ENVIRONMENT
Economic
Forces
Technological
Forces
Demographic Forces
Sociocultural
Forces
Political and Legal Forces
Global Forces
Competitors
Management Field Officer
Client
FILIC
Performance and Financial Analysis of FILICL
11 Introduction
3.1.1Marketing Strategies:
“A well-organized, precise and appropriate plan is sometimes very successful in transforming a
business into a very established and profitable one.”
Planning is very crucial for an organization as it gives them direction of where they are headed
for. It reduces uncertainty by forcing marketers to look ahead, by anticipating changes and by
considering the impact of change and by developing appropriate responses. Furthermore,
planning minimizes wastage, and can set standards in controlling.
FILIC is managed by developing the plans –
Plans:
o To become one of the market leaders in the Insurance industry.
o To gain goodwill.
o To expand its business domestically and internationally.
o To ensure long-term existence by being profitable, successful and
sustainable.
o To make a worthwhile contribution to progress of the nation.
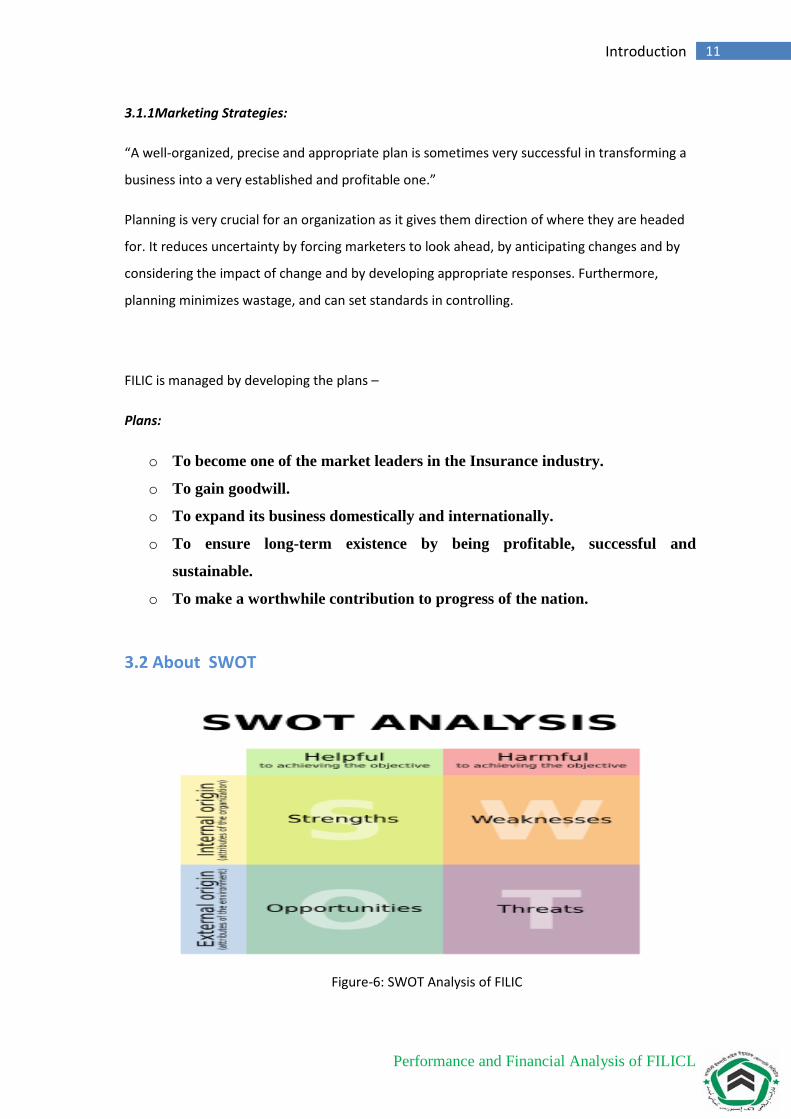
3.2 About SWOT
Figure-6: SWOT Analysis of FILIC
Performance and Financial Analysis of FILICL
12 Introduction
3.2.1 Strength :
• Strong corporate Management
• Maintain strong network through the country.
• FILIC has strength to attract actual and potential Customer’s to sustain in the
challenging and competitive market.
• Enough financial strength or own financial capability of the company
• Members/customers identify as our strengths
• High qualified and experience employee that can bring the FILIC in the higher position.
3.2.2 Weakness:
• Centralized decision making.
• Conflict in about power of authority among directors.
• Poor co-ordination and communication among different departments.
• Marketing Officer are not educated enough about Insurance law.
• Inefficient and ineffective employee for some positions.
3.2.3 Opportunities:
• Home country constraints are becoming flexible as because of govt. are now very much
aware to this sector advantages and disadvantages.
• Target market is increasing at a higher rate on competitor’s products
• Rapid growth of business function and chancing the current market.
• Might attract a specific target market which they have initially targeted for – the rural
market.
• FAREAST brand can attract a group of customers.
3.2.4 Threats:
• The market is very competitive
• Commission offered by competitors is some cases low
• Employee dissatisfactions for the current position in the company.
• Political environment of the country.
• Inflation and slow growth of the economy
• Economic conditions affecting our financial viability
Performance and Financial Analysis of FILICL
13 Introduction
• Foreign company are entering the market frequently at a faster rate which is a reason for
increasing competition.
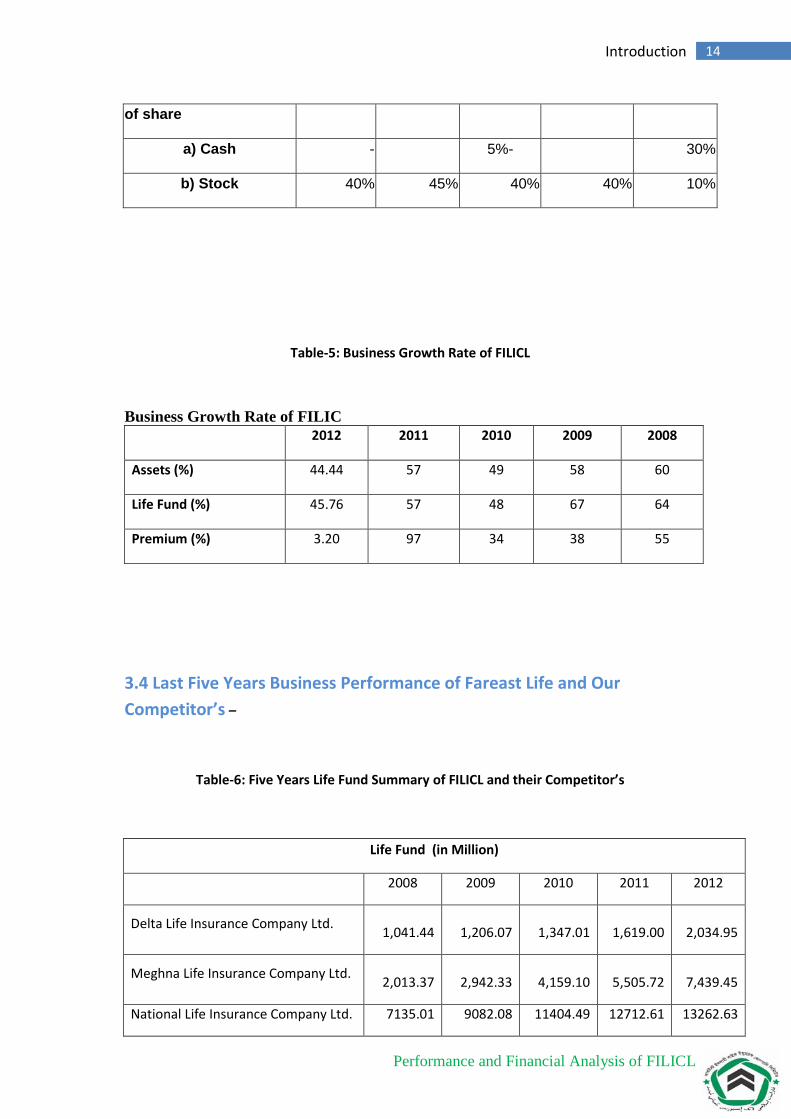
3.3 Business Analysis of FILICL
Dividend issued 2012, 40% stock ie 45% bonus shares against every 100 shares.
Life fund at the end of the year 2012 Taka 13,529.51 million.
Table-4: Five Years Business Summary of FILICL
Five Years Summary of FILIC Business Performance (Taka in Million)
2012 2011 2010 2009 2008
First Year Premium 2771.90 3409.73 1210.92 952.30 788.04
Renewal Premium 3741.83 2901.42 1988.64 1436.13 940.86
Group Insurance Premium 0.63 0.27 0.28 0.27 -
Gross Premium 6514.56 6311.42 3198.84 2388.99 1729.90
Investment Income 1131.33 662.63 430.44 300.26 151.80
Claims 6623.80 649.50 425.22 252.84 227.74
Management Expenses :
a) Commission 1722.23 2214.71 827.31 597.62 521.70
b) Admin. Expenses 804.43 559.14 355.32 228.64 166.40
Assets 14612.80 10116.20 6451.23 4316.50 2729.80
Life Fund 13,529.51 9,282.16 5,899.32 3,974.85 2,374.75
Claims to Premium (%) 10.17 10.29 13.30 10.55 13.17
Mgt. Expense to Premium (%) 38.79 43.93 36.98 34.52 39.74
Dividend of face value
Performance and Financial Analysis of FILICL
14 Introduction
of share
a) Cash - 5%- 30%
b) Stock 40% 45% 40% 40% 10%
Table-5: Business Growth Rate of FILICL
Business Growth Rate of FILIC
2012 2011 2010 2009 2008
Assets (%) 44.44 57 49 58 60
Life Fund (%) 45.76 57 48 67 64
Premium (%) 3.20 97 34 38 55
3.4 Last Five Years Business Performance of Fareast Life and Our Competitor’s –
Table-6: Five Years Life Fund Summary of FILICL and their Competitor’s
Life Fund (in Million)
2008 2009 2010 2011 2012
Delta Life Insurance Company Ltd. 1,041.44
1,206.07
1,347.01
1,619.00
2,034.95
Meghna Life Insurance Company Ltd. 2,013.37
2,942.33
4,159.10
5,505.72
7,439.45
National Life Insurance Company Ltd. 7135.01 9082.08 11404.49 12712.61 13262.63
Performance and Financial Analysis of FILICL
15 Introduction
Popular Life Insurance Company Ltd 675.62 848.12 1388.24 1765.85 2475.66
Pragati Life Insurance Ltd. 536.14 794.66 1058.86 1,511.23 1948.93
Progressive Life Insurance Company Ltd. 855.42 972.56 1250.12 1410.74 2004.05
Rupali Life Insurance Company Ltd. 466.37 670.80 743.43 1,436.37 2,037.08
Sandhani Life Insurance Company Ltd. 1657.26 2561.33 3671.18 3997.13 4763.69
Prime Islami Life Insurance Company Ltd. 438.6 848.1 1388.2 2258.17 3378.88
Farest Islami Life Insurance Co. Ltd. 2,374.75
3,974.85
5,899.32
9,282.16
13,529.51
Industry Average 1,719.40 2,390.09 3,231.00 4,149.90 5,287.48
Table-7: Five Years Investment and others income Summary of FILICL and Competitor’s
Investment and Others Income (in Million)
2008 2009 2010 2011 2012
Delta Life Insurance Company Ltd. 89.66 112.00 117.99 180.99 298.95
Meghna Life Insurance Company Ltd. 105.00 215.35 286.98 559.56 940.50
National Life Insurance Company Ltd. 564.42 830.89 872.45 1,045.85 1,368.74
Popular Life Insurance Company Ltd 68.96 77.51 141.38 262.35 370.52
Pragati Life Insurance Ltd. 36.21 114.38 154.74 160.61 377.83
Progressive Life Insurance Company Ltd. 78.77 90.25 95.93 105.33 119.68
Rupali Life Insurance Company Ltd. 24.99 33.63 36.24 53.12 81.05
Sandhani Life Insurance Company Ltd. 109.38 196.95 207.85 360.35 409.38
Prime Islami Life Insurance Company Ltd. 133.34 170.25 241.97 253.69 356.53
Farest Islami Life Insurance Co. Ltd. 150.80 300.24 430.44 661.64 1,324.52
Industry Average 136.15 214.15 258.60 364.35 564.77
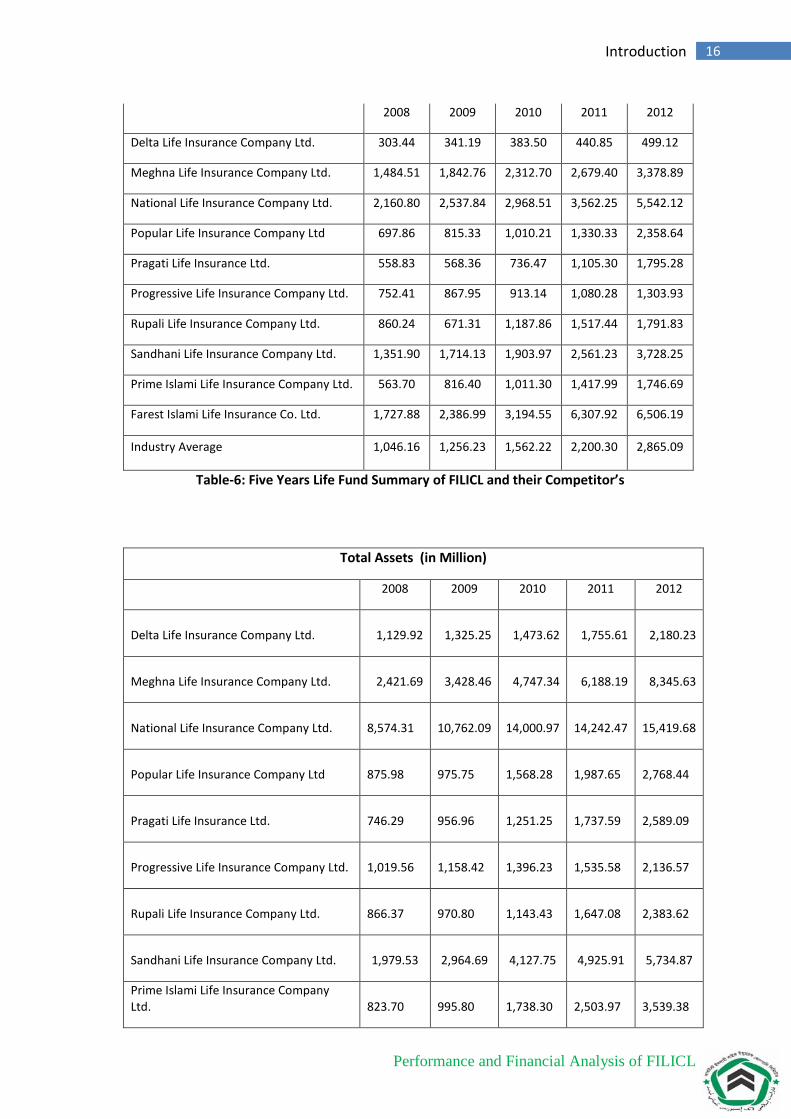
Table-8: Five Years Net Premium Income Summary of FILICL and Competitor’s
Net Premium Income (in Million)
Performance and Financial Analysis of FILICL
16 Introduction
2008 2009 2010 2011 2012
Delta Life Insurance Company Ltd. 303.44 341.19 383.50 440.85 499.12
Meghna Life Insurance Company Ltd. 1,484.51 1,842.76 2,312.70 2,679.40 3,378.89
National Life Insurance Company Ltd. 2,160.80 2,537.84 2,968.51 3,562.25 5,542.12
Popular Life Insurance Company Ltd 697.86 815.33 1,010.21 1,330.33 2,358.64
Pragati Life Insurance Ltd. 558.83 568.36 736.47 1,105.30 1,795.28
Progressive Life Insurance Company Ltd. 752.41 867.95 913.14 1,080.28 1,303.93
Rupali Life Insurance Company Ltd. 860.24 671.31 1,187.86 1,517.44 1,791.83
Sandhani Life Insurance Company Ltd. 1,351.90 1,714.13 1,903.97 2,561.23 3,728.25
Prime Islami Life Insurance Company Ltd. 563.70 816.40 1,011.30 1,417.99 1,746.69
Farest Islami Life Insurance Co. Ltd. 1,727.88 2,386.99 3,194.55 6,307.92 6,506.19
Industry Average 1,046.16 1,256.23 1,562.22 2,200.30 2,865.09
Table-6: Five Years Life Fund Summary of FILICL and their Competitor’s
Total Assets (in Million)
2008 2009 2010 2011 2012
Delta Life Insurance Company Ltd.
1,129.92
1,325.25
1,473.62
1,755.61
2,180.23
Meghna Life Insurance Company Ltd.
2,421.69
3,428.46
4,747.34
6,188.19
8,345.63
National Life Insurance Company Ltd. 8,574.31
10,762.09
14,000.97
14,242.47
15,419.68
Popular Life Insurance Company Ltd 875.98
975.75
1,568.28
1,987.65
2,768.44
Pragati Life Insurance Ltd. 746.29
956.96
1,251.25
1,737.59
2,589.09
Progressive Life Insurance Company Ltd. 1,019.56
1,158.42
1,396.23
1,535.58
2,136.57
Rupali Life Insurance Company Ltd. 866.37
970.80
1,143.43
1,647.08
2,383.62
Sandhani Life Insurance Company Ltd.
1,979.53
2,964.69
4,127.75
4,925.91
5,734.87
Prime Islami Life Insurance Company Ltd.
823.70
995.80
1,738.30
2,503.97
3,539.38
Performance and Financial Analysis of FILICL
17 Introduction
Farest Islami Life Insurance Co. Ltd.
2,728.80 4,316.45
6,451.32
10,116.00
14,611.79
Industry Average 2,116.62
2,785.47
3,789.85
4,664.01
5,970.93
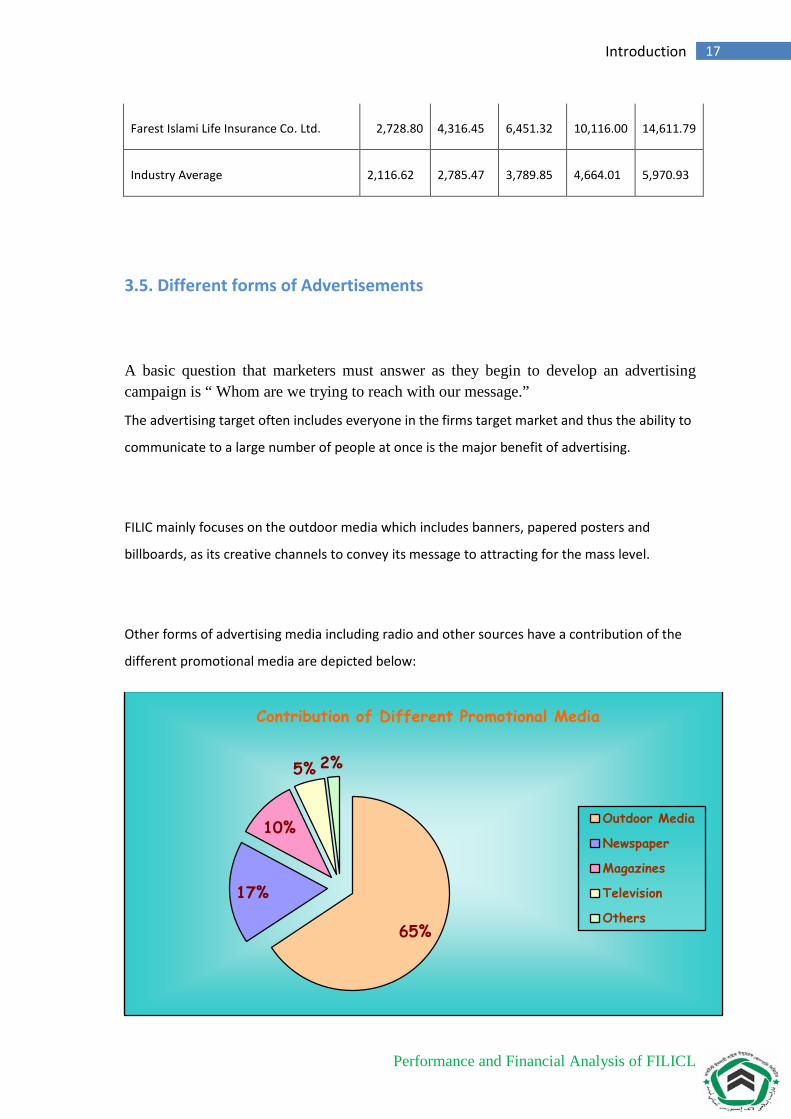
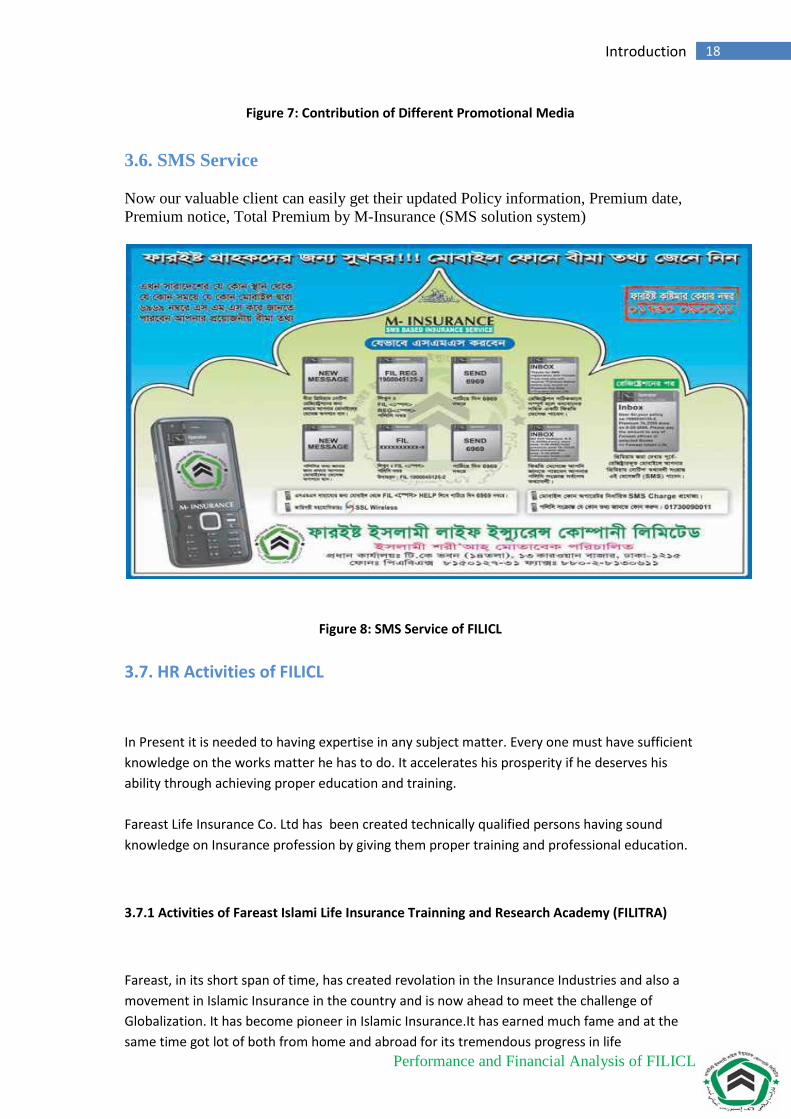
3.5. Different forms of Advertisements
A basic question that marketers must answer as they begin to develop an advertising campaign is “ Whom are we trying to reach with our message.”
The advertising target often includes everyone in the firms target market and thus the ability to
communicate to a large number of people at once is the major benefit of advertising.
FILIC mainly focuses on the outdoor media which includes banners, papered posters and
billboards, as its creative channels to convey its message to attracting for the mass level.
Other forms of advertising media including radio and other sources have a contribution of the
different promotional media are depicted below:
65%
17%
10%
5% 2%
Contribution of Different Promotional Media
Outdoor Media
Newspaper
Magazines
Television
Others
Performance and Financial Analysis of FILICL
18 Introduction
Figure 7: Contribution of Different Promotional Media
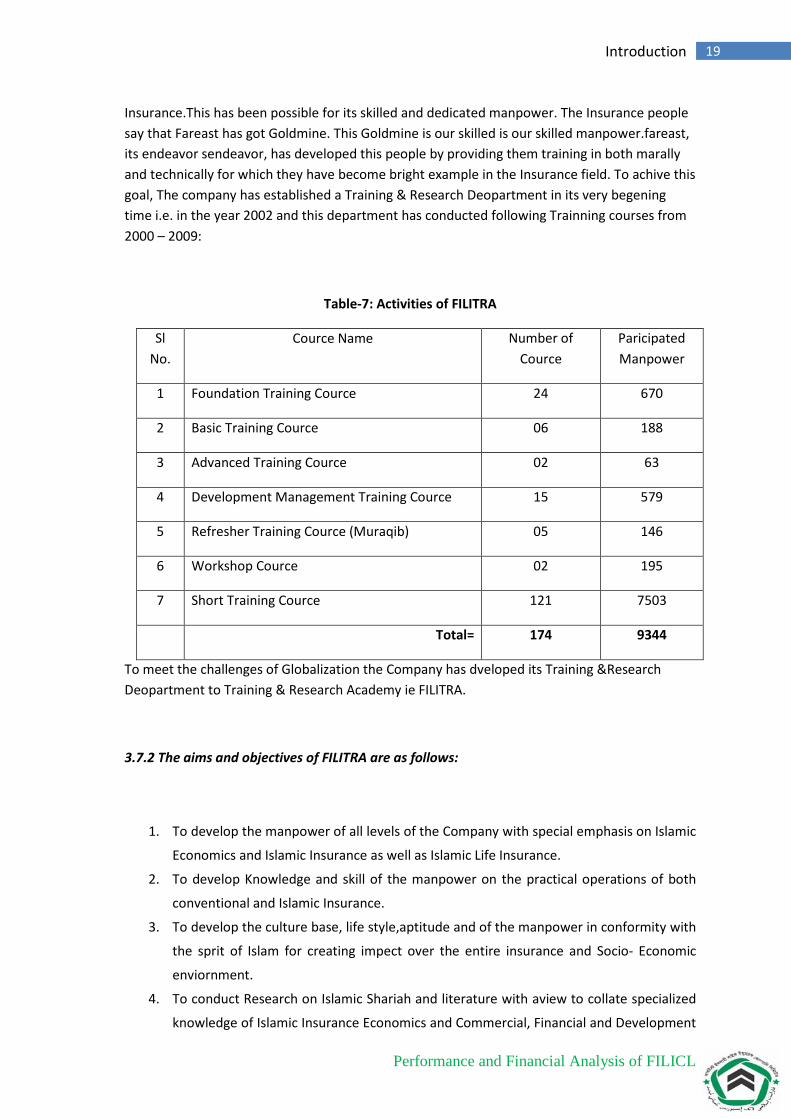
3.6. SMS Service
Now our valuable client can easily get their updated Policy information, Premium date, Premium notice, Total Premium by M-Insurance (SMS solution system)
Figure 8: SMS Service of FILICL
3.7. HR Activities of FILICL
In Present it is needed to having expertise in any subject matter. Every one must have sufficient knowledge on the works matter he has to do. It accelerates his prosperity if he deserves his ability through achieving proper education and training. Fareast Life Insurance Co. Ltd has been created technically qualified persons having sound knowledge on Insurance profession by giving them proper training and professional education.
3.7.1 Activities of Fareast Islami Life Insurance Trainning and Research Academy (FILITRA)
Fareast, in its short span of time, has created revolation in the Insurance Industries and also a movement in Islamic Insurance in the country and is now ahead to meet the challenge of Globalization. It has become pioneer in Islamic Insurance.It has earned much fame and at the same time got lot of both from home and abroad for its tremendous progress in life
Performance and Financial Analysis of FILICL
19 Introduction
Insurance.This has been possible for its skilled and dedicated manpower. The Insurance people say that Fareast has got Goldmine. This Goldmine is our skilled is our skilled manpower.fareast, its endeavor sendeavor, has developed this people by providing them training in both marally and technically for which they have become bright example in the Insurance field. To achive this goal, The company has established a Training & Research Deopartment in its very begening time i.e. in the year 2002 and this department has conducted following Trainning courses from 2000 – 2009:
Table-7: Activities of FILITRA
Sl No.
Cource Name Number of Cource
Paricipated Manpower
1 Foundation Training Cource 24 670
2 Basic Training Cource 06 188
3 Advanced Training Cource 02 63
4 Development Management Training Cource 15 579
5 Refresher Training Cource (Muraqib) 05 146
6 Workshop Cource 02 195
7 Short Training Cource 121 7503
Total= 174 9344
To meet the challenges of Globalization the Company has dveloped its Training &Research Deopartment to Training & Research Academy ie FILITRA.
3.7.2 The aims and objectives of FILITRA are as follows:
1. To develop the manpower of all levels of the Company with special emphasis on Islamic
Economics and Islamic Insurance as well as Islamic Life Insurance.
2. To develop Knowledge and skill of the manpower on the practical operations of both
conventional and Islamic Insurance.
3. To develop the culture base, life style,aptitude and of the manpower in conformity with
the sprit of Islam for creating impect over the entire insurance and Socio- Economic
enviornment.
4. To conduct Research on Islamic Shariah and literature with aview to collate specialized
knowledge of Islamic Insurance Economics and Commercial, Financial and Development
Performance and Financial Analysis of FILICL
20 Introduction
activities.
5. To promote and undertake faculty Development programs to assure an adequate
supply of competent trainers to institutions conducting training programs for the
personnel of Insurance and Financial institutions.
6. To make the Islamic Insurance system more effective and adaptable to the gradually
changing situation through concerted efforts of Research and studies.
7. To develop Training and Research capabilities among the manpower to enable them to
provide technical assistance to local and overseas Business and Financial institutions.
8. To assist Life Insurance system and Financial institutions in matters such as designing
measurment tests for employee selaction, appraisal, programs, conducting moral and
productivity studies, streamlining organizational structure and to review from time to
time the impect of edecational, training and research activities and offer suggestions
for filling the gaps in the Islamic Insurance and Financial systems.
9. To provide consultancy services to Insurance Companies or any other institutions or
matters having bearing on priductivity in islamic Insurance services, optimum use of
financial resources or any other matter conductive ti socio-economic welfare.
10. To award diploma, distinctions and certificates and to prescribe standards of
proficiency for the same.
11. To establish and maintain a fund with the contributions of FILIC Insurance system and
Financial institutions of both home and abrod and or any other organization/Instations
for awarding scholarship for research fellows who inted to obtain Ph. D or equivalent
degrees from different Universitys of the World.
The main objective of FILITRA is not only to award diploma in Islamic Insurance but also develop in Insurance people with the sprit to create over the entire Insurance and socio-economic development.
3.7.3 Rewards & Benefits
They believe the greatest reward they have to offer is the unique opportunity to be instrumental in the creation of a world-class Insurance operation. As such, the people we choose to join us will experience one of the most exciting challenges in the industry today.
They offer the opportunity to work with and learn from the very best people in the industry in a dynamic, client-orientated, global culture. We will have access to a strong support network of colleagues and most business areas offer formal mentoring schemes to help us gain valuable career development advice during the graduate programme and beyond.
Performance and Financial Analysis of FILICL
21 Introduction
As well as extensive training and development, they offer a very attractive industry-competitive benefits package with rapid rewards for the right people. Benefits include:
Performance-related bonus scheme
Yearly Incentive
Provident fund & Gratuity
Festival bonus
Life assurance benefit
Motorcycle loan
Preferential rates on a range of FILIC’s products
Sports and social scheme
Employee assistance programme
Corporate discounts
35 days' holiday
3.8. Controlling method of Fareast life
Regardless of the negative connotation of the word "control", it must exist or there is no
organization at all. In its most basic form, an organization is two or more people working
together to reach a goal. Whether an organization is highly bureaucratic or changing and self-
organizing, the organization must exist for some reason, some purpose, some mission (implicit
or explicit) -- or it isn't an organization at all. The organization must have some goal. Identifying
this goal requires some form of planning, informal or formal. Reaching the goal means
identifying some strategies, formal or informal. These strategies are agreed upon by members
of the organization through some form of communication, formal or informal. Then members
set about to act in accordance with what they agreed to do. They may change their minds, fine.
But they need to recognize and acknowledge that they're changing their minds.
This form of ongoing communication to reach a goal, tracking activities toward the goal
and then subsequent decisions about what to do is the essence of management
coordination. It needs to exist in some manner - formal or informal.
The following are rather typical methods of coordination in organizations. They are used
as means to communicate direction and guide behaviors in that direction. The function of
the following methods is not to "control", but rather to guide. If, from ongoing
Performance and Financial Analysis of FILICL
22 Introduction
communications among management and employees, the direction changes, then fine.
The following methods are changed accordingly.
Note that many of the following methods are so common that we often don't think of
them as having anything to do with coordination at all. No matter what one calls the
following methods -- coordination or control -- they're important to the success of any
organization.
3.9 Economic Contribution of Fareast Life Insurance
Fareast life insurance by the nature of their business are constantly receiving sums of money in the form of premiums and much of this money will be required to be paid out in the shape of claims. All such money they receive is not in fact required at a time and, therefore, in one position of custodians of vast sums they are able to invest it for earning interest in the capital market. The investment is usually made on government securities, mortgages, industrial loans and shares, debentures etc. Like this way, Fareast life insurance contributes much in the overall economic development of a country. One another side, Risk minimizes the work ability of human. So, to get relax from this risk people take insurance against life risk, that is called life insurance. When a man feel more confident he/she then can any work freely that is viable for economic. One the other hand, people take life insurance to form a capital for business venture, to provide some financial benefits for his dependents in case of his premature death, to secure a capital sum at a particular time to start a business venture, to secure a loan or mortgage, to provide for his children education or marriage expenses etc, that are very important for our economy. By providing those financial support Fareast Life insurance contributes in our economy with a great excellence. Every year it pays huge amount of money to the government as income tax and vat on due course.
3.10. Social Responsibilities performed by FILICL
To preserve Islamic values, the company arranged Ifter Mahfil during the holy Ramadan with due solemnity in the Head Office, Divisional, Zonal Offices. To extend our co-operation to the helpless and have-nots, the company has established Fareast Islami Life Foundation by contributing from the Valuation Surplus and fund generated from the Sadaqa, donation etc. I expect and hope that our valued shareholders will have magnimity and fellow feeling and would do their best in helping the foundation through collective efforts. This appeal should be propagated to all the generous and well-up classes of the society for extending their benevolent hands to create a sound financial position of the foundation.

Performance and Financial Analysis of FILICL
23 Introduction
(Keep your Life secure with FILICL)
Performance and Financial Analysis of FILICL
24 Introduction
4.1 Financial Analysis of FILICL Financial analysis is the process of understanding the risk and profitability of a company
through analysis of reported financial information, particularly annual and quarterly
reports. Investors need this information to estimate both future cash flows from the firm
and the riskiness of those cash flows. Financial managers need an in-depth risk and
profitability analysis if a comprehensive evaluation of company’s performance is
required. Financial analysis also concentrates how a particular firm compares with other
firms in its industry (benchmarking). The following are some devices to analyze the risk
and profitability of FILICL:
4.2 Ratio Analysis
Financial ratios are mathematical equations derived from information presenting on a
company’s financial statements. Every ratio measures a unique association that may have
an impact on other ratios. All financial ratios are used as indicators to reveal the financial
health of the company. Financial ratios are represented in percentage or decimal format,
which allow comparing a company's ratios to its competitors. Company owners,
stockholders, or potential investors should understand how to calculate key financial
ratios and their importance in analyzing the financial pulse of a firm. In this paper, I have
used some ratios for analyzing the risk and profitability of FILICL.
4.3 Analysis of Risk
Analysis of risk typically aims at detecting the underlying liquidity risk, solvency risk,
and financial operating risk of FILICL.
4.3.1. Liquidity Analysis: Liquidity risk can best be described as the risk of short-term
funding crisis. Unexpected events, such as a large claim or a loss of confidence, or a
legal crisis, can cause such funding crisis. Liquidity is a pre-requisite for the survival of
an enterprise. But liquidity is not as big a concern with many life insurance companies as
it is in other financial institutions for one good reason: most of their policies are less
liquid than their assets. Life insurance companies are required to maintain their
investment portfolio as per insurance law. The significant portion of the investment
portfolio is usually kept with different banks as fixed deposit rate (FDR) under different
Performance and Financial Analysis of FILICL
25 Introduction
maturity bucket which serves the purpose of liquidity. In addition, the companies keep a
considerable amount in saving term deposit (STD) and current account.
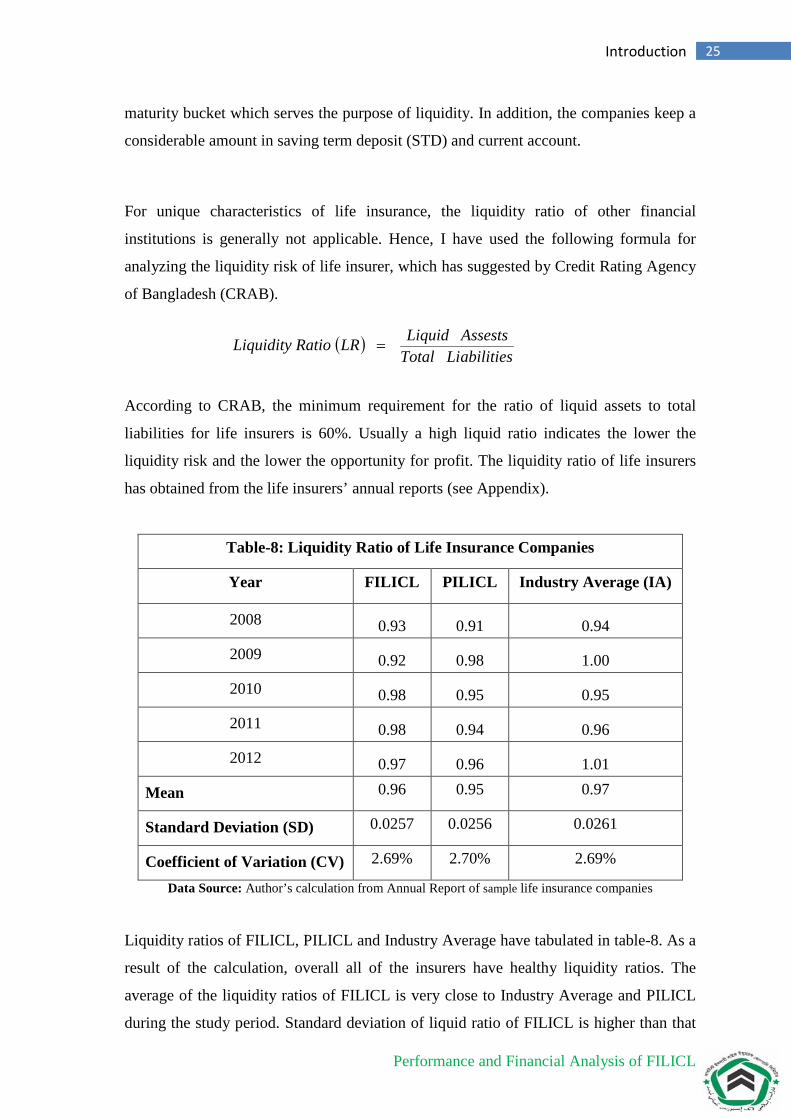
For unique characteristics of life insurance, the liquidity ratio of other financial
institutions is generally not applicable. Hence, I have used the following formula for
analyzing the liquidity risk of life insurer, which has suggested by Credit Rating Agency
of Bangladesh (CRAB).
( )
abilitiesTotal LissestsLiquid A LRRatio Liquidity =
According to CRAB, the minimum requirement for the ratio of liquid assets to total
liabilities for life insurers is 60%. Usually a high liquid ratio indicates the lower the
liquidity risk and the lower the opportunity for profit. The liquidity ratio of life insurers
has obtained from the life insurers’ annual reports (see Appendix).
Table-8: Liquidity Ratio of Life Insurance Companies
Year FILICL PILICL Industry Average (IA)
2008 0.93 0.91 0.94
2009 0.92 0.98 1.00
2010 0.98 0.95 0.95
2011 0.98 0.94 0.96
2012 0.97 0.96 1.01
Mean 0.96 0.95 0.97
Standard Deviation (SD) 0.0257 0.0256 0.0261
Coefficient of Variation (CV) 2.69% 2.70% 2.69%
Data Source: Author’s calculation from Annual Report of sample life insurance companies
Liquidity ratios of FILICL, PILICL and Industry Average have tabulated in table-8. As a
result of the calculation, overall all of the insurers have healthy liquidity ratios. The
average of the liquidity ratios of FILICL is very close to Industry Average and PILICL
during the study period. Standard deviation of liquid ratio of FILICL is higher than that
Performance and Financial Analysis of FILICL
26 Introduction
of PILICL but lower than that of industry average. The coefficient variation in liquid
ratio of FILICL was 2.69%, which indicates that there is only 2.69% dispersion in the
liquid ratio of FILICL during the study period. The coefficient variation in liquid ratio of
FILICL is equal to Industry Average and very close to PILICL. These results indicate
that FILICL has undertaken low risks in managing the liquid assets as like its
competitors.
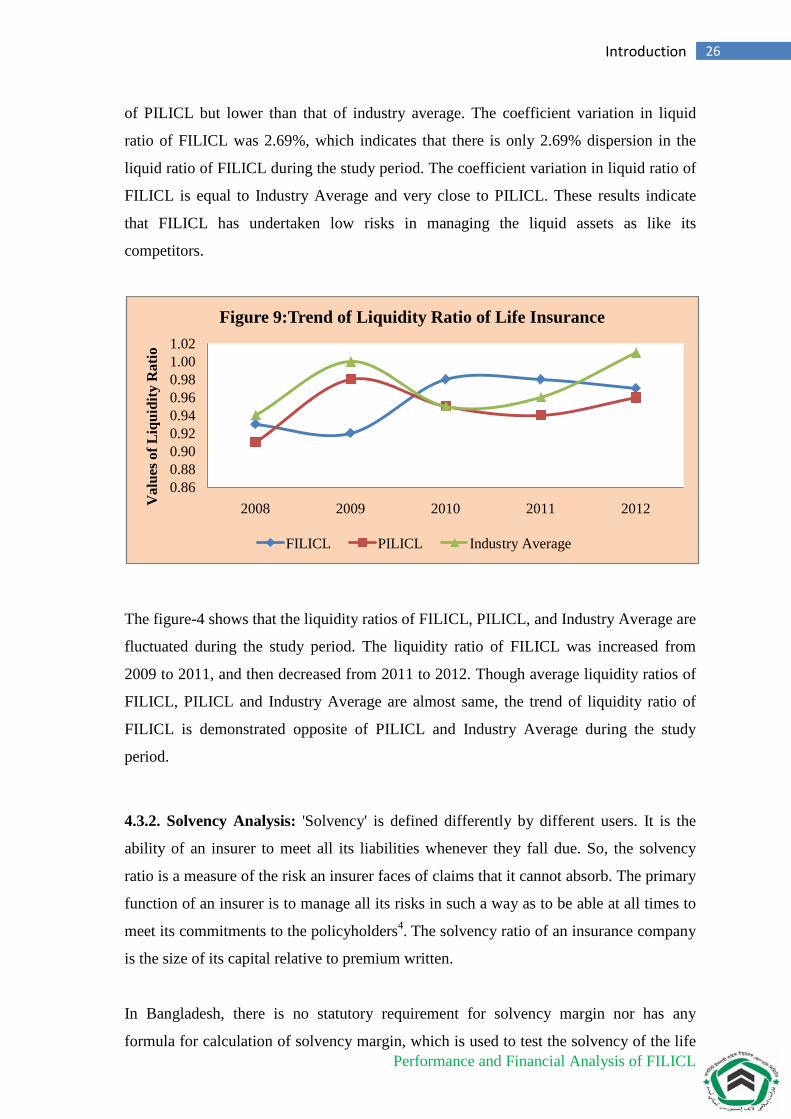
The figure-4 shows that the liquidity ratios of FILICL, PILICL, and Industry Average are
fluctuated during the study period. The liquidity ratio of FILICL was increased from
2009 to 2011, and then decreased from 2011 to 2012. Though average liquidity ratios of
FILICL, PILICL and Industry Average are almost same, the trend of liquidity ratio of
FILICL is demonstrated opposite of PILICL and Industry Average during the study
period.
4.3.2. Solvency Analysis: 'Solvency' is defined differently by different users. It is the
ability of an insurer to meet all its liabilities whenever they fall due. So, the solvency
ratio is a measure of the risk an insurer faces of claims that it cannot absorb. The primary
function of an insurer is to manage all its risks in such a way as to be able at all times to
meet its commitments to the policyholders4. The solvency ratio of an insurance company
is the size of its capital relative to premium written.
In Bangladesh, there is no statutory requirement for solvency margin nor has any
formula for calculation of solvency margin, which is used to test the solvency of the life
0.860.880.900.920.940.960.981.001.02
2008 2009 2010 2011 2012Val
ues o
f Liq
uidi
ty R
atio
Figure 9:Trend of Liquidity Ratio of Life Insurance
FILICL PILICL Industry Average
Performance and Financial Analysis of FILICL
27 Introduction
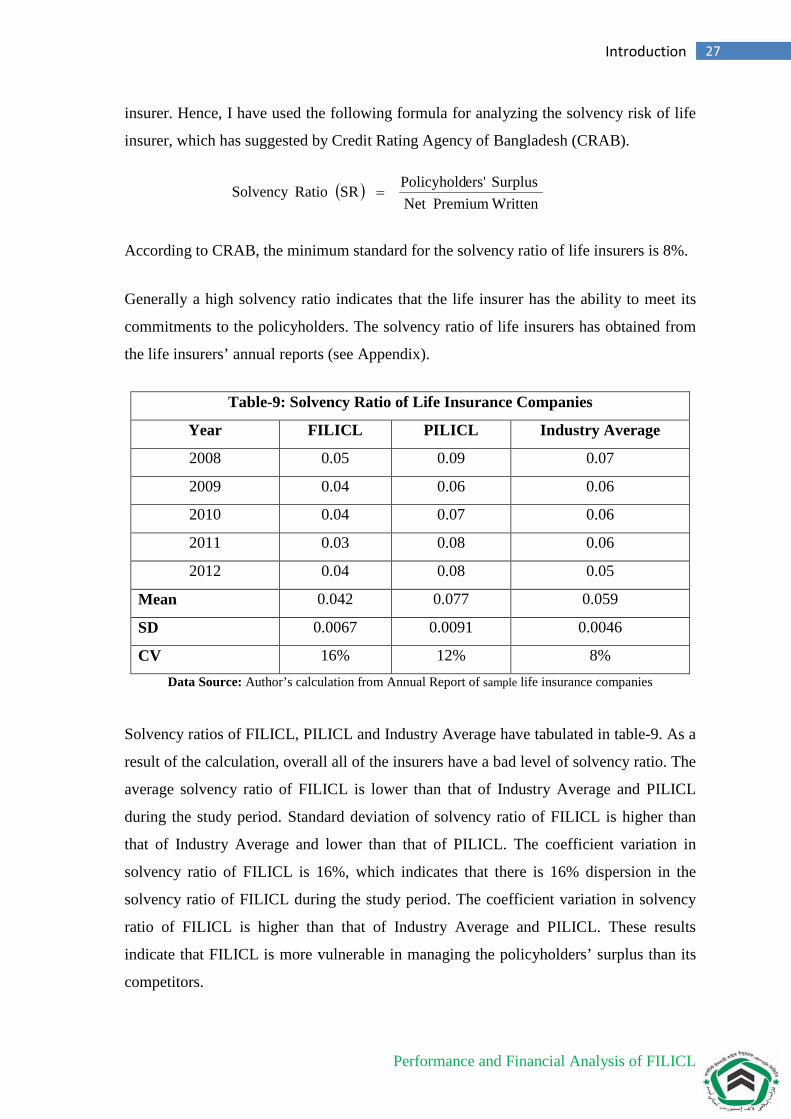
insurer. Hence, I have used the following formula for analyzing the solvency risk of life
insurer, which has suggested by Credit Rating Agency of Bangladesh (CRAB).
( )
WrittenPremium Net Surplus 'ersPolicyhold SRRatio Solvency =
According to CRAB, the minimum standard for the solvency ratio of life insurers is 8%.
Generally a high solvency ratio indicates that the life insurer has the ability to meet its
commitments to the policyholders. The solvency ratio of life insurers has obtained from
the life insurers’ annual reports (see Appendix).
Table-9: Solvency Ratio of Life Insurance Companies
Year FILICL PILICL Industry Average
2008 0.05 0.09 0.07
2009 0.04 0.06 0.06
2010 0.04 0.07 0.06
2011 0.03 0.08 0.06
2012 0.04 0.08 0.05
Mean 0.042 0.077 0.059
SD 0.0067 0.0091 0.0046
CV 16% 12% 8% Data Source: Author’s calculation from Annual Report of sample life insurance companies
Solvency ratios of FILICL, PILICL and Industry Average have tabulated in table-9. As a
result of the calculation, overall all of the insurers have a bad level of solvency ratio. The
average solvency ratio of FILICL is lower than that of Industry Average and PILICL
during the study period. Standard deviation of solvency ratio of FILICL is higher than
that of Industry Average and lower than that of PILICL. The coefficient variation in
solvency ratio of FILICL is 16%, which indicates that there is 16% dispersion in the
solvency ratio of FILICL during the study period. The coefficient variation in solvency
ratio of FILICL is higher than that of Industry Average and PILICL. These results
indicate that FILICL is more vulnerable in managing the policyholders’ surplus than its
competitors.
Performance and Financial Analysis of FILICL
28 Introduction
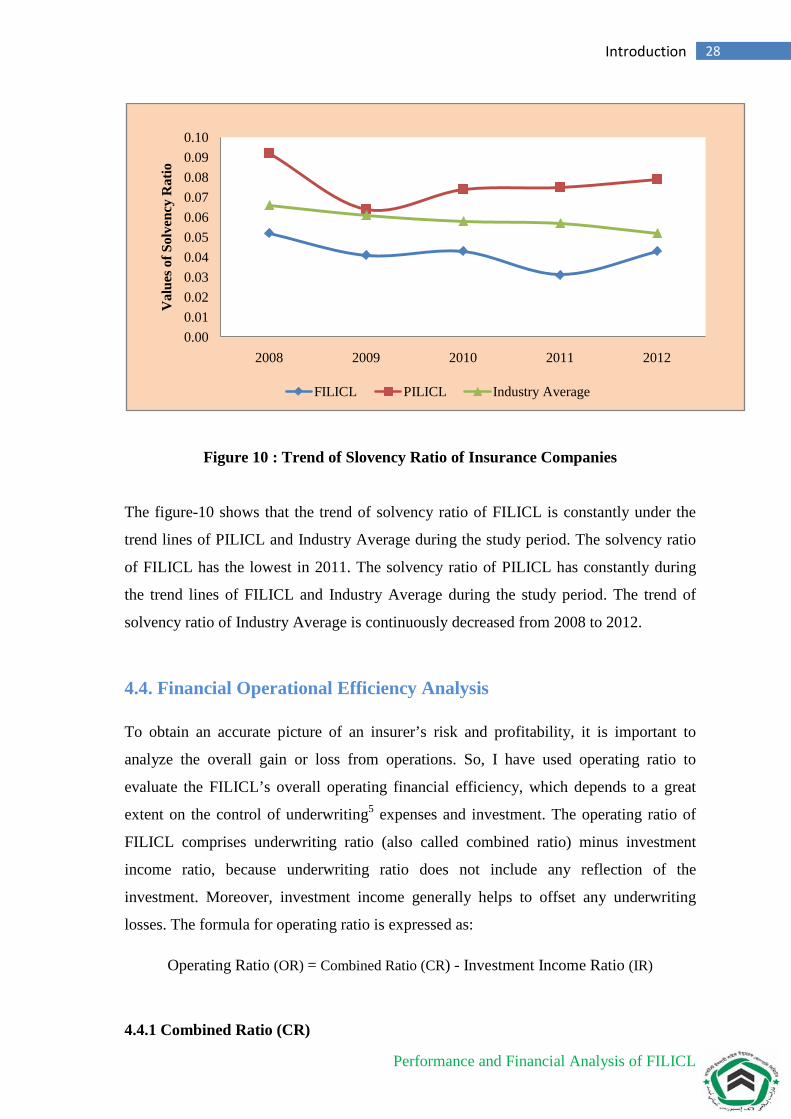
Figure 10 : Trend of Slovency Ratio of Insurance Companies
The figure-10 shows that the trend of solvency ratio of FILICL is constantly under the
trend lines of PILICL and Industry Average during the study period. The solvency ratio
of FILICL has the lowest in 2011. The solvency ratio of PILICL has constantly during
the trend lines of FILICL and Industry Average during the study period. The trend of
solvency ratio of Industry Average is continuously decreased from 2008 to 2012.
4.4. Financial Operational Efficiency Analysis
To obtain an accurate picture of an insurer’s risk and profitability, it is important to
analyze the overall gain or loss from operations. So, I have used operating ratio to
evaluate the FILICL’s overall operating financial efficiency, which depends to a great
extent on the control of underwriting5 expenses and investment. The operating ratio of
FILICL comprises underwriting ratio (also called combined ratio) minus investment
income ratio, because underwriting ratio does not include any reflection of the
investment. Moreover, investment income generally helps to offset any underwriting
losses. The formula for operating ratio is expressed as:
Operating Ratio (OR) = Combined Ratio (CR) - Investment Income Ratio (IR)
4.4.1 Combined Ratio (CR)
0.000.010.020.030.040.050.060.070.080.090.10
2008 2009 2010 2011 2012
Val
ues o
f Sol
venc
y R
atio
FILICL PILICL Industry Average
Performance and Financial Analysis of FILICL
29 Introduction
Combined ratio is also used a measure of the profitability of an insurance company,
because it is an indication of an insurance company's health. The combined ratio equals
expenses and losses divided by revenue from premiums. The result is expressed as a
percentage, and a value more than 100 percent, the insurer has an underwriting loss. So,
a combined ratio above 100% indicates that a carrier is paying out more in claims and
expenses than it is taking in premiums.
The word "combined" is used because it includes two ratios: • Loss Ratio • Expense Ratio
The formula for combined ratio is expressed as:
Earned Premium NetExpenses ting Underwri Claims Net Ratio Expense Ratio Loss Ratio Combined +
=+=
Loss Ratio (LOR): The loss ratio is determined by dividing the net claims by net
premiums earned. The formula for loss ratio is expressed as:
( )Earned Premium Net
Claims Net LOR Ratio Loss =
The result is expressed as a percentage and lower loss ratio shows higher operating profit
and vice versa. Higher loss ratios may indicate that an insurance company may need
better risk management policies to guard against future possible insurance payouts. The
loss ratio of life insurers has obtained from the life insurers’ annual reports (see
Appendix).
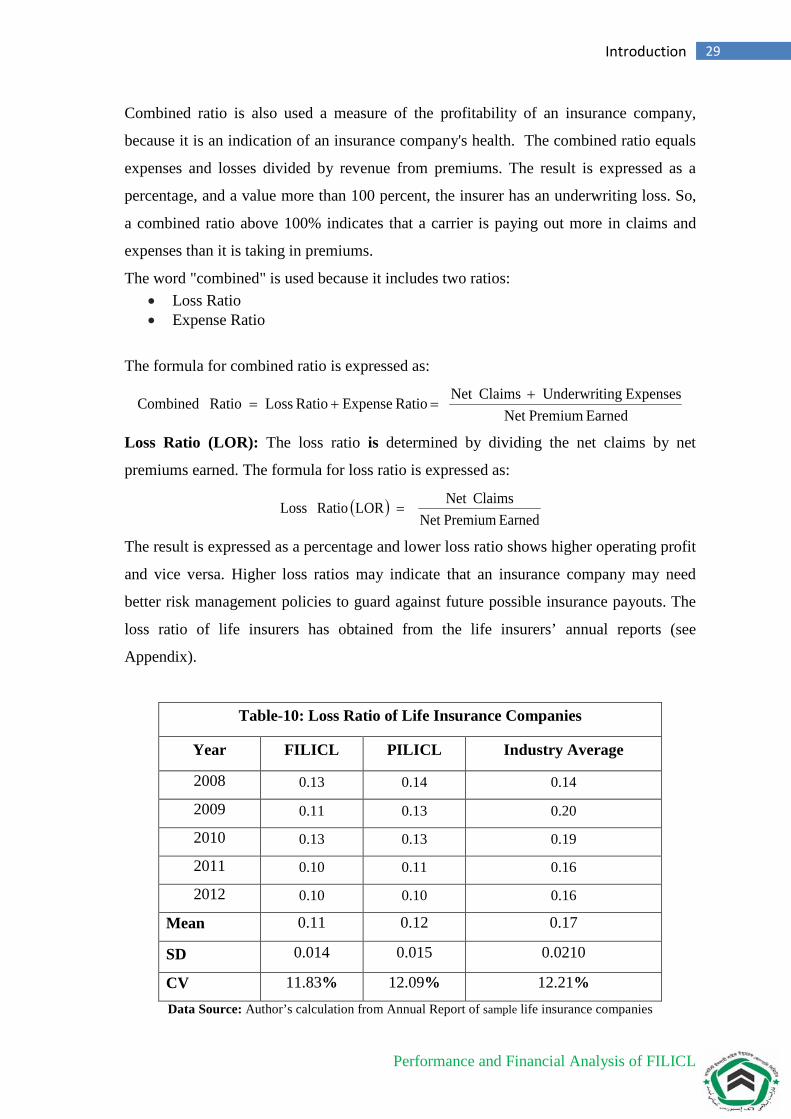
Table-10: Loss Ratio of Life Insurance Companies
Year FILICL PILICL Industry Average
2008 0.13 0.14 0.14
2009 0.11 0.13 0.20
2010 0.13 0.13 0.19
2011 0.10 0.11 0.16
2012 0.10 0.10 0.16
Mean 0.11 0.12 0.17
SD 0.014 0.015 0.0210
CV 11.83% 12.09% 12.21% Data Source: Author’s calculation from Annual Report of sample life insurance companies
Performance and Financial Analysis of FILICL
30 Introduction
Loss ratios of FILICL, PILICL and Industry Average have tabulated in table-10. The
average loss ratio of FILICL is lower than that of PILICL and Industry Average.
Standard deviation of loss ratio of FILICL is also lower than that of industry average and
PILICL. Coefficient of variation of loss ratio of FILICL is 11.83%, which indicates that
there is 11.83% dispersion in the loss ratio of FILICL during the study period.
Coefficient of variation of loss ratio of PILICL is 12.21% and Industry Average is
12.09%. These results indicate that FILICL is better in managing the policyholders’
claims than PILICL and Industry Average.
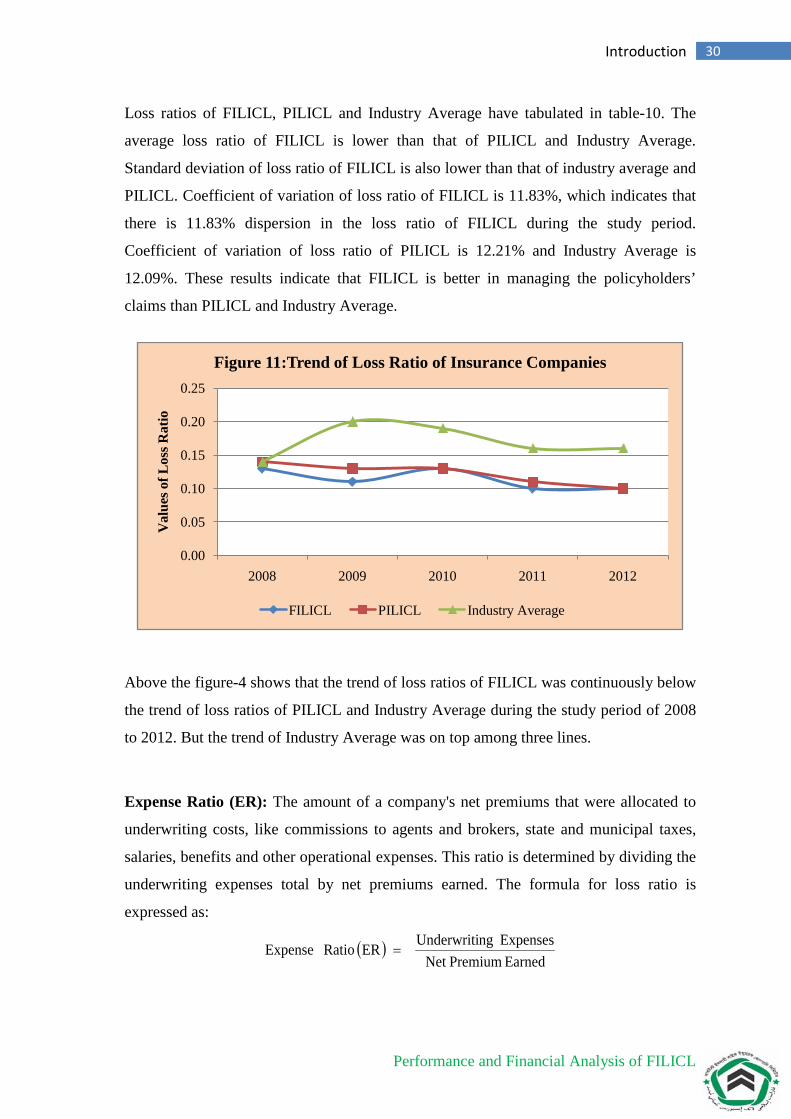
Above the figure-4 shows that the trend of loss ratios of FILICL was continuously below
the trend of loss ratios of PILICL and Industry Average during the study period of 2008
to 2012. But the trend of Industry Average was on top among three lines.
Expense Ratio (ER): The amount of a company's net premiums that were allocated to
underwriting costs, like commissions to agents and brokers, state and municipal taxes,
salaries, benefits and other operational expenses. This ratio is determined by dividing the
underwriting expenses total by net premiums earned. The formula for loss ratio is
expressed as:
( )Earned Premium Net
Expenses ngUnderwriti ER Ratio Expense =
0.00
0.05
0.10
0.15
0.20
0.25
2008 2009 2010 2011 2012
Val
ues o
f Los
s Rat
io
Figure 11:Trend of Loss Ratio of Insurance Companies
FILICL PILICL Industry Average
Performance and Financial Analysis of FILICL
31 Introduction
The result is expressed as a percentage, and lower loss ratio shows higher operating
profit and vice versa. So, it is the measure of an insurer's business efficiency to investors.
The expense ratio of life insurers has obtained from the life insurers’ annual reports (see
Appendix).
Table-11: Expense Ratio of Life Insurance Companies
Year FILICL PILICL Industry Average
2008 0.43 0.49 0.37
2009 0.36 0.54 0.30
2010 0.39 0.46 0.26
2011 0.47 0.36 0.34
2012 0.39 0.37 0.31
Mean 0.41 0.44 0.32
SD 0.0382 0.0695 0.0372
CV 9.35% 15.64% 11.77% Data Source: Author’s calculation from Annual Report of sample life insurance companies
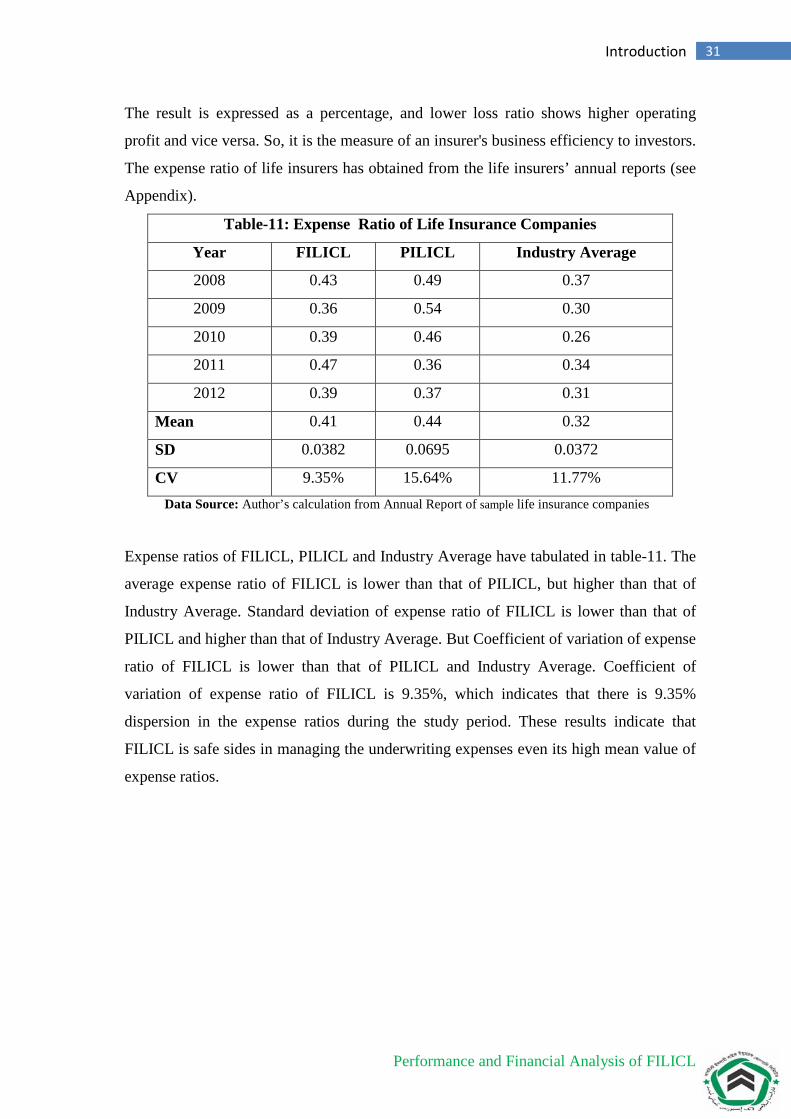
Expense ratios of FILICL, PILICL and Industry Average have tabulated in table-11. The
average expense ratio of FILICL is lower than that of PILICL, but higher than that of
Industry Average. Standard deviation of expense ratio of FILICL is lower than that of
PILICL and higher than that of Industry Average. But Coefficient of variation of expense
ratio of FILICL is lower than that of PILICL and Industry Average. Coefficient of
variation of expense ratio of FILICL is 9.35%, which indicates that there is 9.35%
dispersion in the expense ratios during the study period. These results indicate that
FILICL is safe sides in managing the underwriting expenses even its high mean value of
expense ratios.
Performance and Financial Analysis of FILICL
32 Introduction
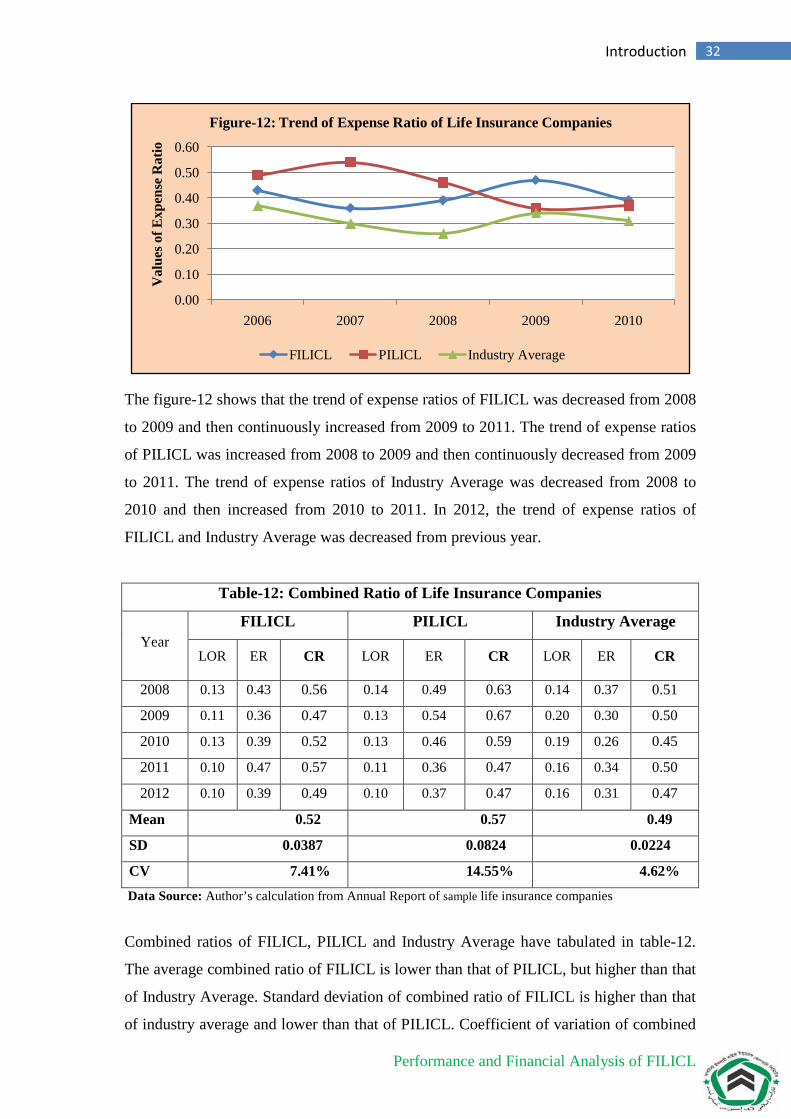
The figure-12 shows that the trend of expense ratios of FILICL was decreased from 2008
to 2009 and then continuously increased from 2009 to 2011. The trend of expense ratios
of PILICL was increased from 2008 to 2009 and then continuously decreased from 2009
to 2011. The trend of expense ratios of Industry Average was decreased from 2008 to
2010 and then increased from 2010 to 2011. In 2012, the trend of expense ratios of
FILICL and Industry Average was decreased from previous year.
Table-12: Combined Ratio of Life Insurance Companies
Year FILICL PILICL Industry Average
LOR ER CR LOR ER CR LOR ER CR
2008 0.13 0.43 0.56 0.14 0.49 0.63 0.14 0.37 0.51
2009 0.11 0.36 0.47 0.13 0.54 0.67 0.20 0.30 0.50
2010 0.13 0.39 0.52 0.13 0.46 0.59 0.19 0.26 0.45
2011 0.10 0.47 0.57 0.11 0.36 0.47 0.16 0.34 0.50
2012 0.10 0.39 0.49 0.10 0.37 0.47 0.16 0.31 0.47
Mean 0.52 0.57 0.49
SD 0.0387 0.0824 0.0224
CV 7.41% 14.55% 4.62%
Data Source: Author’s calculation from Annual Report of sample life insurance companies
Combined ratios of FILICL, PILICL and Industry Average have tabulated in table-12.
The average combined ratio of FILICL is lower than that of PILICL, but higher than that
of Industry Average. Standard deviation of combined ratio of FILICL is higher than that
of industry average and lower than that of PILICL. Coefficient of variation of combined
0.00
0.10
0.20
0.30
0.40
0.50
0.60
2006 2007 2008 2009 2010
Val
ues o
f Exp
ense
Rat
io
Figure-12: Trend of Expense Ratio of Life Insurance Companies
FILICL PILICL Industry Average
Performance and Financial Analysis of FILICL
33 Introduction
ratio of FILICL is 7.41%, indicates that there is 7.41% dispersion in the combined ratios
during the study period. Coefficient of variation of combined ratio of FILICL shows
relatively less consistency during the study period because its coefficient of variation is
higher than that of Industry Average.
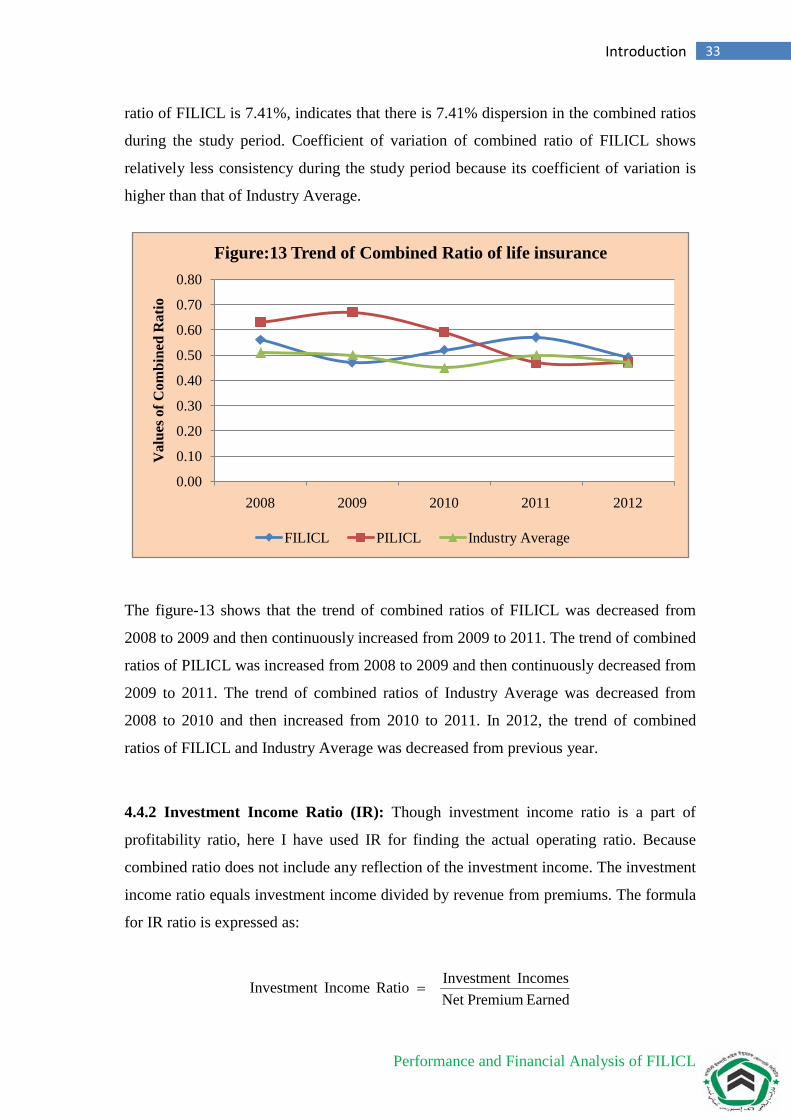
The figure-13 shows that the trend of combined ratios of FILICL was decreased from
2008 to 2009 and then continuously increased from 2009 to 2011. The trend of combined
ratios of PILICL was increased from 2008 to 2009 and then continuously decreased from
2009 to 2011. The trend of combined ratios of Industry Average was decreased from
2008 to 2010 and then increased from 2010 to 2011. In 2012, the trend of combined
ratios of FILICL and Industry Average was decreased from previous year.
4.4.2 Investment Income Ratio (IR): Though investment income ratio is a part of
profitability ratio, here I have used IR for finding the actual operating ratio. Because
combined ratio does not include any reflection of the investment income. The investment
income ratio equals investment income divided by revenue from premiums. The formula
for IR ratio is expressed as:
Earned Premium NetIncomes Investment Ratio Income Investment =
0.00
0.10
0.20
0.30
0.40
0.50
0.60
0.70
0.80
2008 2009 2010 2011 2012
Val
ues o
f Com
bine
d R
atio
Figure:13 Trend of Combined Ratio of life insurance
FILICL PILICL Industry Average
Performance and Financial Analysis of FILICL
34 Introduction
The result is expressed as a percentage, and higher IR ratio shows higher operating profit
and vice versa. The investment income ratio of life insurers has obtained from the life
insurers’ annual reports (see Appendix).
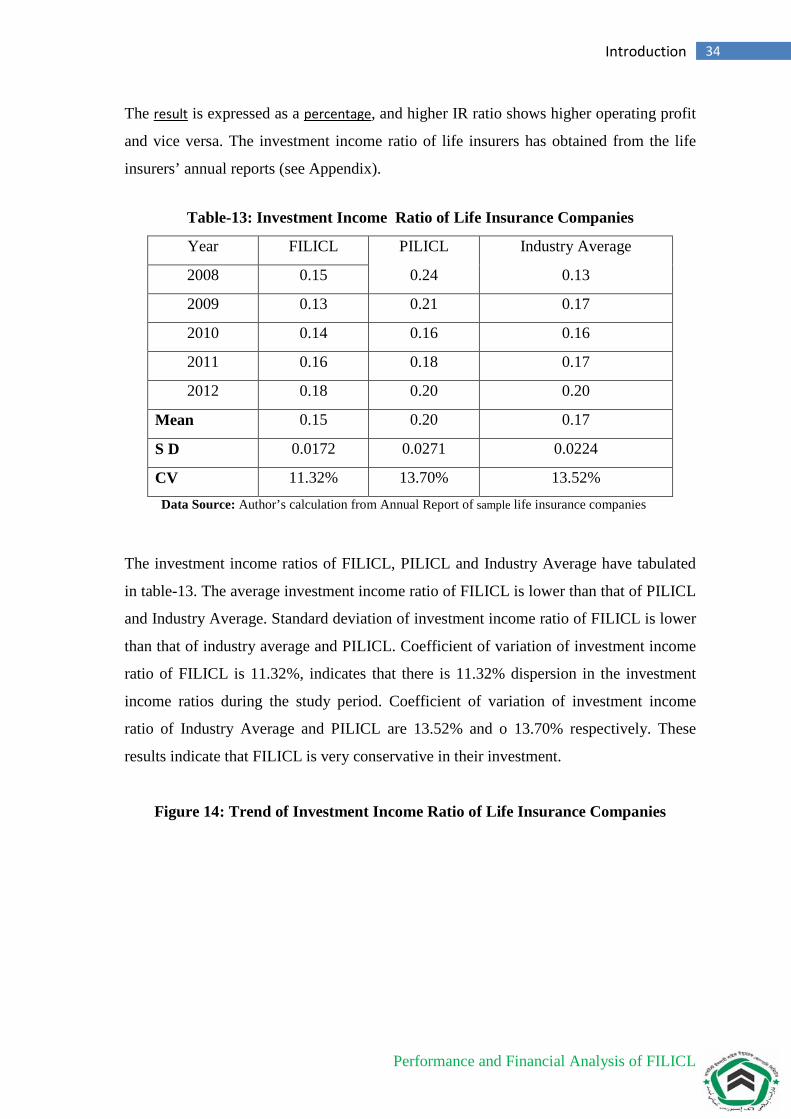
Table-13: Investment Income Ratio of Life Insurance Companies
Year FILICL PILICL Industry Average
2008 0.15 0.24 0.13
2009 0.13 0.21 0.17
2010 0.14 0.16 0.16
2011 0.16 0.18 0.17
2012 0.18 0.20 0.20
Mean 0.15 0.20 0.17
S D 0.0172 0.0271 0.0224
CV 11.32% 13.70% 13.52% Data Source: Author’s calculation from Annual Report of sample life insurance companies
The investment income ratios of FILICL, PILICL and Industry Average have tabulated
in table-13. The average investment income ratio of FILICL is lower than that of PILICL
and Industry Average. Standard deviation of investment income ratio of FILICL is lower
than that of industry average and PILICL. Coefficient of variation of investment income
ratio of FILICL is 11.32%, indicates that there is 11.32% dispersion in the investment
income ratios during the study period. Coefficient of variation of investment income
ratio of Industry Average and PILICL are 13.52% and o 13.70% respectively. These
results indicate that FILICL is very conservative in their investment.
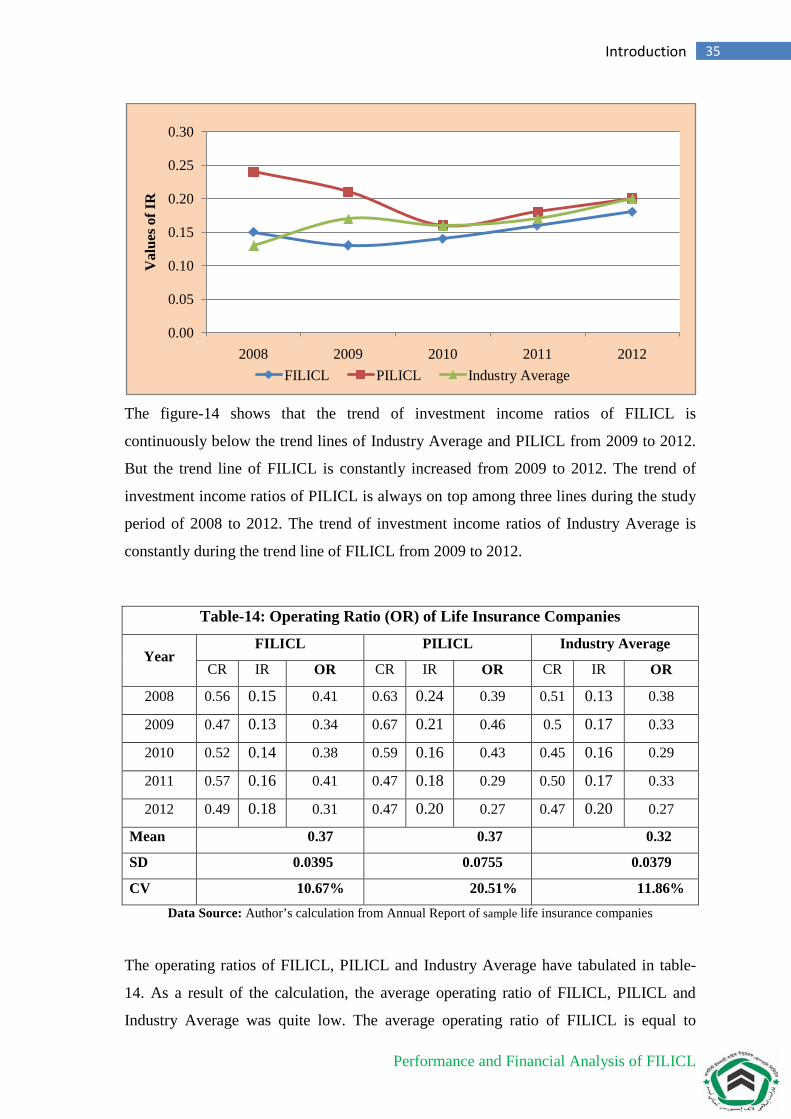
Figure 14: Trend of Investment Income Ratio of Life Insurance Companies
Performance and Financial Analysis of FILICL
35 Introduction
The figure-14 shows that the trend of investment income ratios of FILICL is
continuously below the trend lines of Industry Average and PILICL from 2009 to 2012.
But the trend line of FILICL is constantly increased from 2009 to 2012. The trend of
investment income ratios of PILICL is always on top among three lines during the study
period of 2008 to 2012. The trend of investment income ratios of Industry Average is
constantly during the trend line of FILICL from 2009 to 2012.
Table-14: Operating Ratio (OR) of Life Insurance Companies
Year FILICL PILICL Industry Average
CR IR OR CR IR OR CR IR OR
2008 0.56 0.15 0.41 0.63 0.24 0.39 0.51 0.13 0.38
2009 0.47 0.13 0.34 0.67 0.21 0.46 0.5 0.17 0.33
2010 0.52 0.14 0.38 0.59 0.16 0.43 0.45 0.16 0.29
2011 0.57 0.16 0.41 0.47 0.18 0.29 0.50 0.17 0.33
2012 0.49 0.18 0.31 0.47 0.20 0.27 0.47 0.20 0.27
Mean 0.37 0.37 0.32
SD 0.0395 0.0755 0.0379
CV 10.67% 20.51% 11.86% Data Source: Author’s calculation from Annual Report of sample life insurance companies
The operating ratios of FILICL, PILICL and Industry Average have tabulated in table-
14. As a result of the calculation, the average operating ratio of FILICL, PILICL and
Industry Average was quite low. The average operating ratio of FILICL is equal to
0.00
0.05
0.10
0.15
0.20
0.25
0.30
2008 2009 2010 2011 2012
Val
ues o
f IR
FILICL PILICL Industry Average
Performance and Financial Analysis of FILICL
36 Introduction
PILICL and higher than that of Industry Average. But standard deviation of operating
ratio of FILICL is lower than that of PILICL and higher than that of Industry Average.
Coefficient of variation of operating ratio of FILICL is 10.67%, indicates that there is
10.67% dispersion in the operating ratios during the study period. Coefficient of
variation of operating ratio of FILICL shows relatively more consistency during the
study period because its coefficient of variation is lower than Industry Average of
11.86% and PILICL of 20.51%. These results indicate that FILICL is efficient in
managing its underwriting expenses during the study period.
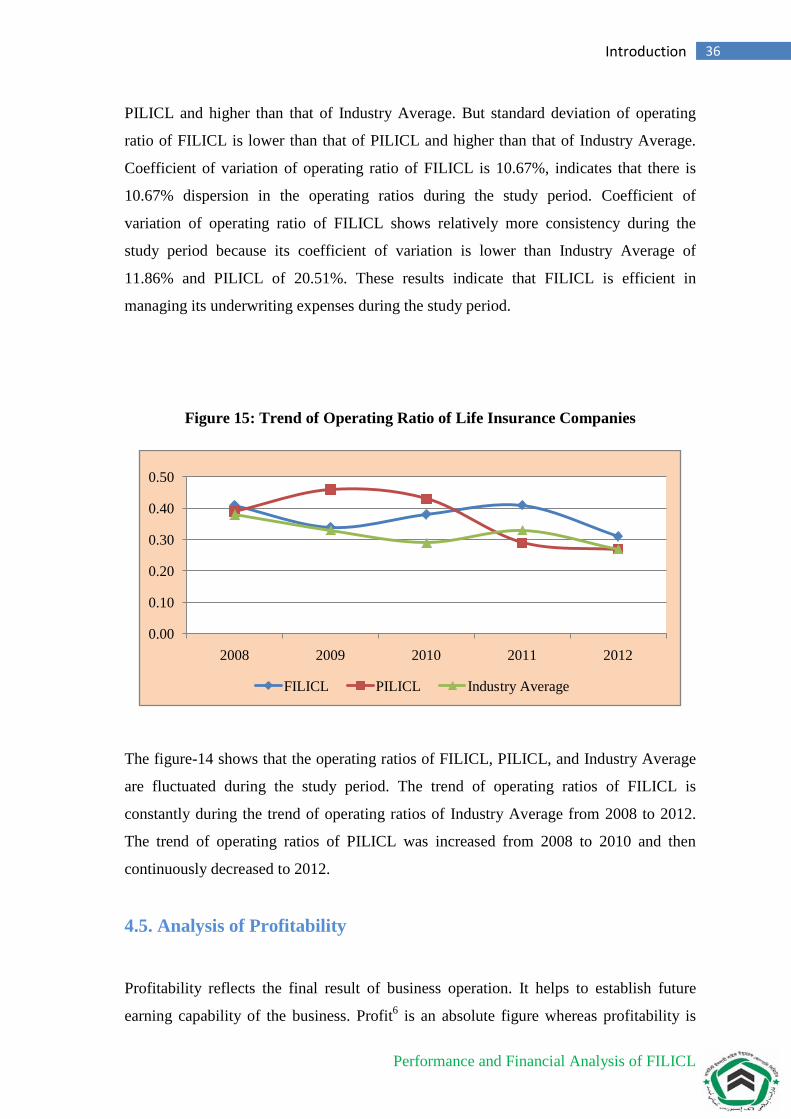
Figure 15: Trend of Operating Ratio of Life Insurance Companies
The figure-14 shows that the operating ratios of FILICL, PILICL, and Industry Average
are fluctuated during the study period. The trend of operating ratios of FILICL is
constantly during the trend of operating ratios of Industry Average from 2008 to 2012.
The trend of operating ratios of PILICL was increased from 2008 to 2010 and then
continuously decreased to 2012.
4.5. Analysis of Profitability
Profitability reflects the final result of business operation. It helps to establish future
earning capability of the business. Profit6 is an absolute figure whereas profitability is
0.00
0.10
0.20
0.30
0.40
0.50
2008 2009 2010 2011 2012
FILICL PILICL Industry Average
Performance and Financial Analysis of FILICL
37 Introduction
defined as profits expressed as a proportion of total assets, total capital employed and
total equity.
For a life insurance company, premium/underwriting income and investment income are
mainly two components of profits that I have considered for profitability. The
profitability indicators are the rate of return on assets (ROA), rate of return on equity
(ROE), rate of return on capital employed (ROCE), and profit margin (PM), which were
obtained from the life insurers’ annual reports (see Appendix).
4.5.1 Return on Assets Ratio (ROA): The rate of return on assets is the most
comprehensive accounting measure of a life insurer’s overall performance. Since it is
defined as net profit during total assets, it shows the profit earned per taka of assets. It is
an indicator of life insurer’s efficiency and a measure of the life insurer’s ability to earn
funds from its total operations. More important, it gauges how effectively a life insurance
company uses its financial and real investments to generate profits. The formula for
ROA ratio is expressed as:
Assets TotalProfitNet RatioROA =
Lesser variability in the return on assets ratio indicates proper or efficient management of
wealth.
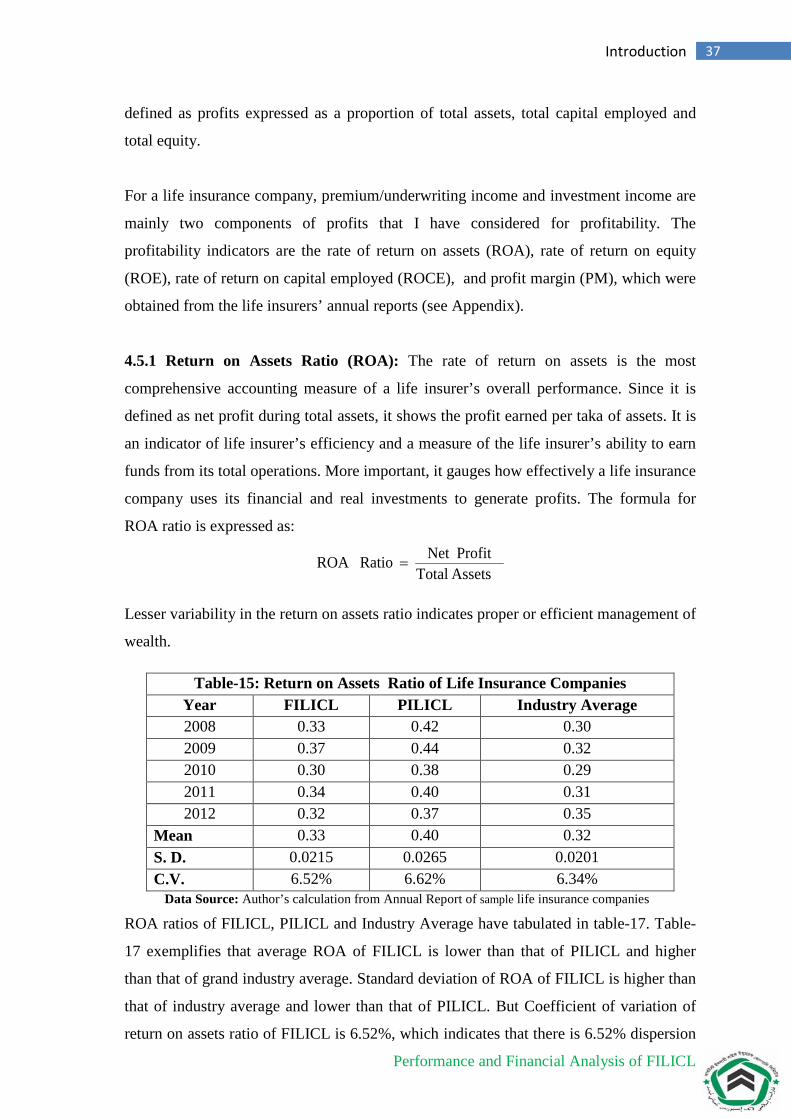
Table-15: Return on Assets Ratio of Life Insurance Companies Year FILICL PILICL Industry Average 2008 0.33 0.42 0.30 2009 0.37 0.44 0.32 2010 0.30 0.38 0.29 2011 0.34 0.40 0.31 2012 0.32 0.37 0.35
Mean 0.33 0.40 0.32 S. D. 0.0215 0.0265 0.0201 C.V. 6.52% 6.62% 6.34%
Data Source: Author’s calculation from Annual Report of sample life insurance companies
ROA ratios of FILICL, PILICL and Industry Average have tabulated in table-17. Table-
17 exemplifies that average ROA of FILICL is lower than that of PILICL and higher
than that of grand industry average. Standard deviation of ROA of FILICL is higher than
that of industry average and lower than that of PILICL. But Coefficient of variation of
return on assets ratio of FILICL is 6.52%, which indicates that there is 6.52% dispersion
Performance and Financial Analysis of FILICL
38 Introduction
in the ROA ratios during the study period. Coefficient of variation of ROA ratio of
FILICL is very close to Industry Average of 6.34% and PILICL of 6.62%. These results
indicate that FILICL is efficient in managing its wealth during the study period.
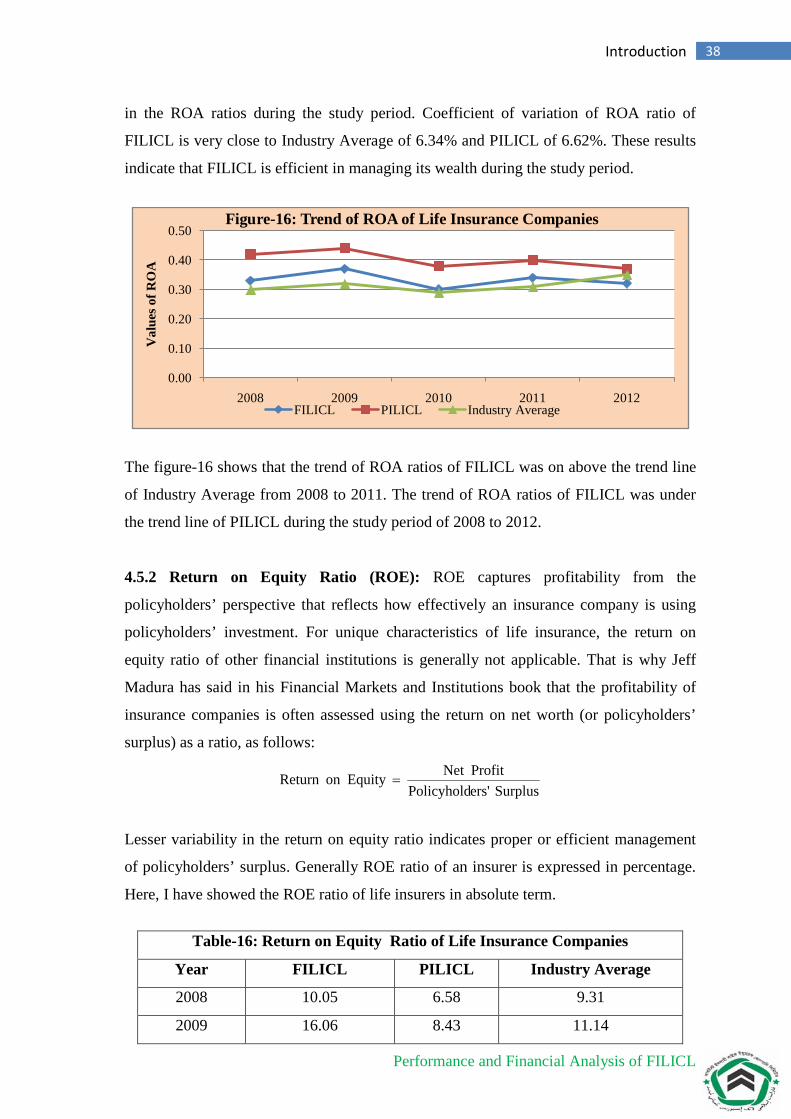
The figure-16 shows that the trend of ROA ratios of FILICL was on above the trend line
of Industry Average from 2008 to 2011. The trend of ROA ratios of FILICL was under
the trend line of PILICL during the study period of 2008 to 2012.
4.5.2 Return on Equity Ratio (ROE): ROE captures profitability from the
policyholders’ perspective that reflects how effectively an insurance company is using
policyholders’ investment. For unique characteristics of life insurance, the return on
equity ratio of other financial institutions is generally not applicable. That is why Jeff
Madura has said in his Financial Markets and Institutions book that the profitability of
insurance companies is often assessed using the return on net worth (or policyholders’
surplus) as a ratio, as follows:
Surplus ers'PolicyholdProfitNet Equity on Return =
Lesser variability in the return on equity ratio indicates proper or efficient management
of policyholders’ surplus. Generally ROE ratio of an insurer is expressed in percentage.
Here, I have showed the ROE ratio of life insurers in absolute term.
Table-16: Return on Equity Ratio of Life Insurance Companies
Year FILICL PILICL Industry Average
2008 10.05 6.58 9.31
2009 16.06 8.43 11.14
0.00
0.10
0.20
0.30
0.40
0.50
2008 2009 2010 2011 2012
Val
ues o
f RO
A
Figure-16: Trend of ROA of Life Insurance Companies
FILICL PILICL Industry Average
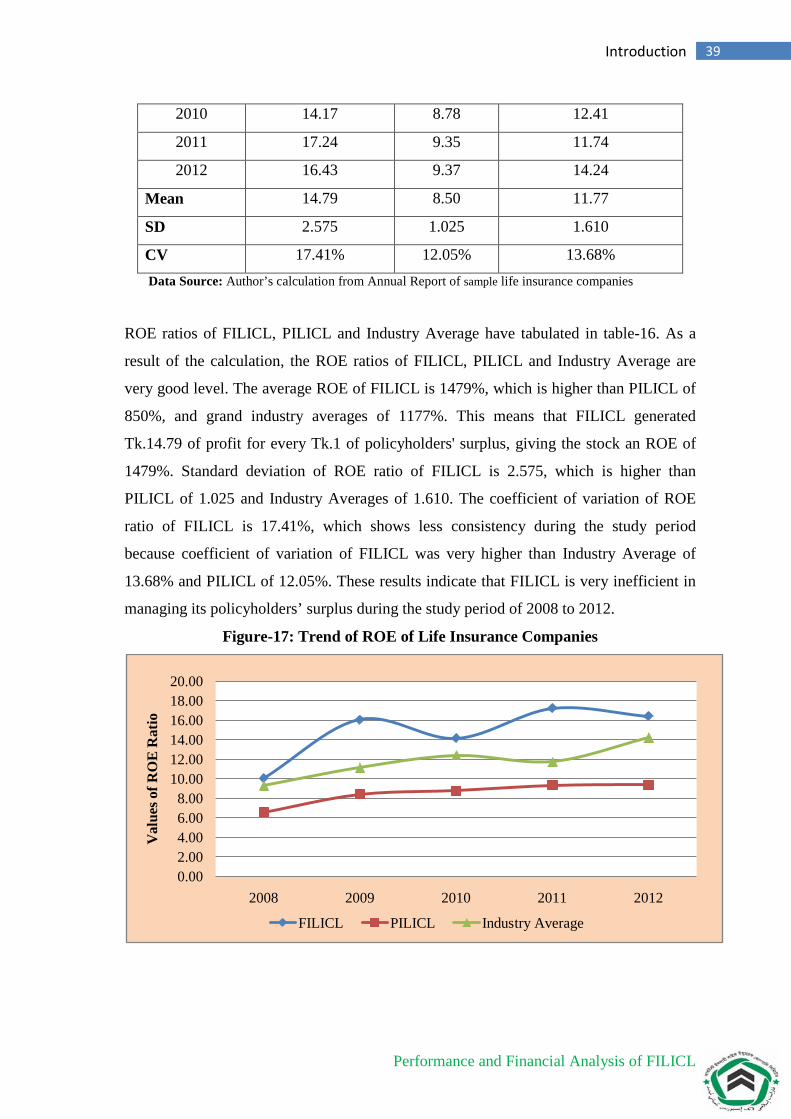
Performance and Financial Analysis of FILICL
39 Introduction
2010 14.17 8.78 12.41
2011 17.24 9.35 11.74
2012 16.43 9.37 14.24
Mean 14.79 8.50 11.77
SD 2.575 1.025 1.610
CV 17.41% 12.05% 13.68% Data Source: Author’s calculation from Annual Report of sample life insurance companies
ROE ratios of FILICL, PILICL and Industry Average have tabulated in table-16. As a
result of the calculation, the ROE ratios of FILICL, PILICL and Industry Average are
very good level. The average ROE of FILICL is 1479%, which is higher than PILICL of
850%, and grand industry averages of 1177%. This means that FILICL generated
Tk.14.79 of profit for every Tk.1 of policyholders' surplus, giving the stock an ROE of
1479%. Standard deviation of ROE ratio of FILICL is 2.575, which is higher than
PILICL of 1.025 and Industry Averages of 1.610. The coefficient of variation of ROE
ratio of FILICL is 17.41%, which shows less consistency during the study period
because coefficient of variation of FILICL was very higher than Industry Average of
13.68% and PILICL of 12.05%. These results indicate that FILICL is very inefficient in
managing its policyholders’ surplus during the study period of 2008 to 2012.
Figure-17: Trend of ROE of Life Insurance Companies
0.002.004.006.008.00
10.0012.0014.0016.0018.0020.00
2008 2009 2010 2011 2012
Val
ues o
f RO
E R
atio
FILICL PILICL Industry Average
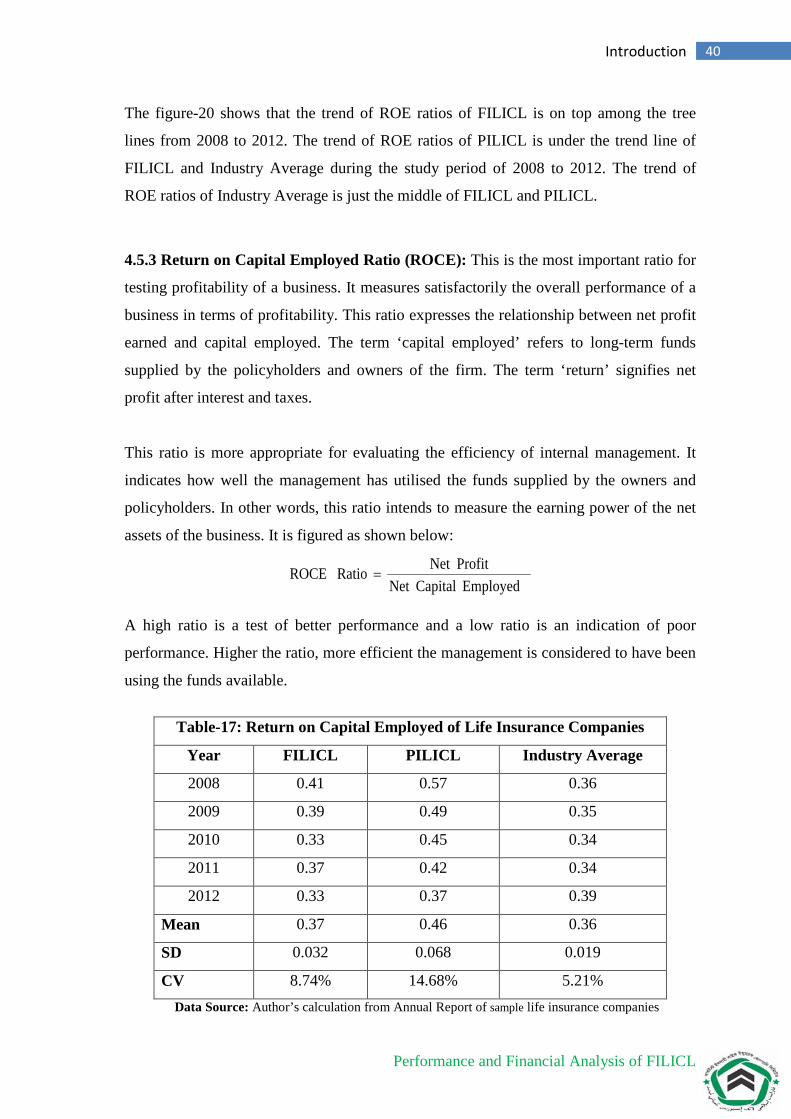
Performance and Financial Analysis of FILICL
40 Introduction
The figure-20 shows that the trend of ROE ratios of FILICL is on top among the tree
lines from 2008 to 2012. The trend of ROE ratios of PILICL is under the trend line of
FILICL and Industry Average during the study period of 2008 to 2012. The trend of
ROE ratios of Industry Average is just the middle of FILICL and PILICL.
4.5.3 Return on Capital Employed Ratio (ROCE): This is the most important ratio for
testing profitability of a business. It measures satisfactorily the overall performance of a
business in terms of profitability. This ratio expresses the relationship between net profit
earned and capital employed. The term ‘capital employed’ refers to long-term funds
supplied by the policyholders and owners of the firm. The term ‘return’ signifies net
profit after interest and taxes.
This ratio is more appropriate for evaluating the efficiency of internal management. It
indicates how well the management has utilised the funds supplied by the owners and
policyholders. In other words, this ratio intends to measure the earning power of the net
assets of the business. It is figured as shown below:
Employed CapitalNet ProfitNet Ratio ROCE =
A high ratio is a test of better performance and a low ratio is an indication of poor
performance. Higher the ratio, more efficient the management is considered to have been
using the funds available.
Table-17: Return on Capital Employed of Life Insurance Companies
Year FILICL PILICL Industry Average
2008 0.41 0.57 0.36
2009 0.39 0.49 0.35
2010 0.33 0.45 0.34
2011 0.37 0.42 0.34
2012 0.33 0.37 0.39
Mean 0.37 0.46 0.36
SD 0.032 0.068 0.019
CV 8.74% 14.68% 5.21% Data Source: Author’s calculation from Annual Report of sample life insurance companies
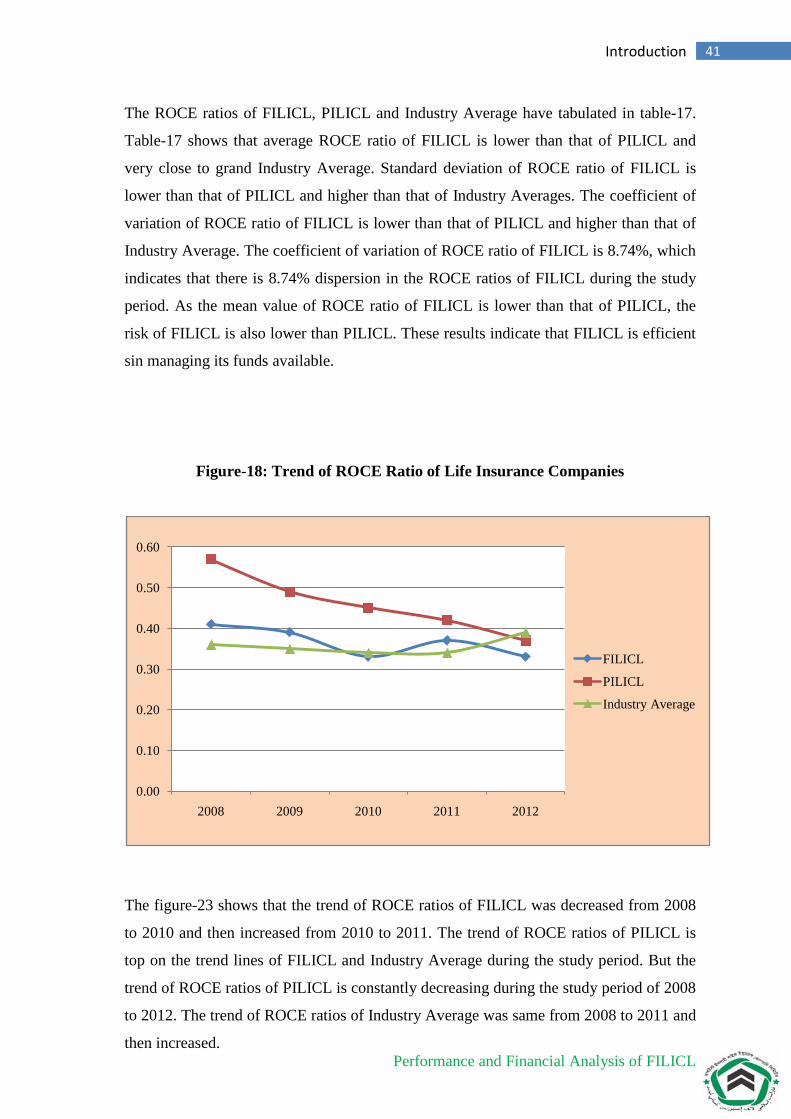
Performance and Financial Analysis of FILICL
41 Introduction
The ROCE ratios of FILICL, PILICL and Industry Average have tabulated in table-17.
Table-17 shows that average ROCE ratio of FILICL is lower than that of PILICL and
very close to grand Industry Average. Standard deviation of ROCE ratio of FILICL is
lower than that of PILICL and higher than that of Industry Averages. The coefficient of
variation of ROCE ratio of FILICL is lower than that of PILICL and higher than that of
Industry Average. The coefficient of variation of ROCE ratio of FILICL is 8.74%, which
indicates that there is 8.74% dispersion in the ROCE ratios of FILICL during the study
period. As the mean value of ROCE ratio of FILICL is lower than that of PILICL, the
risk of FILICL is also lower than PILICL. These results indicate that FILICL is efficient
sin managing its funds available.
Figure-18: Trend of ROCE Ratio of Life Insurance Companies
The figure-23 shows that the trend of ROCE ratios of FILICL was decreased from 2008
to 2010 and then increased from 2010 to 2011. The trend of ROCE ratios of PILICL is
top on the trend lines of FILICL and Industry Average during the study period. But the
trend of ROCE ratios of PILICL is constantly decreasing during the study period of 2008
to 2012. The trend of ROCE ratios of Industry Average was same from 2008 to 2011 and
then increased.
0.00
0.10
0.20
0.30
0.40
0.50
0.60
2008 2009 2010 2011 2012
FILICL
PILICL
Industry Average
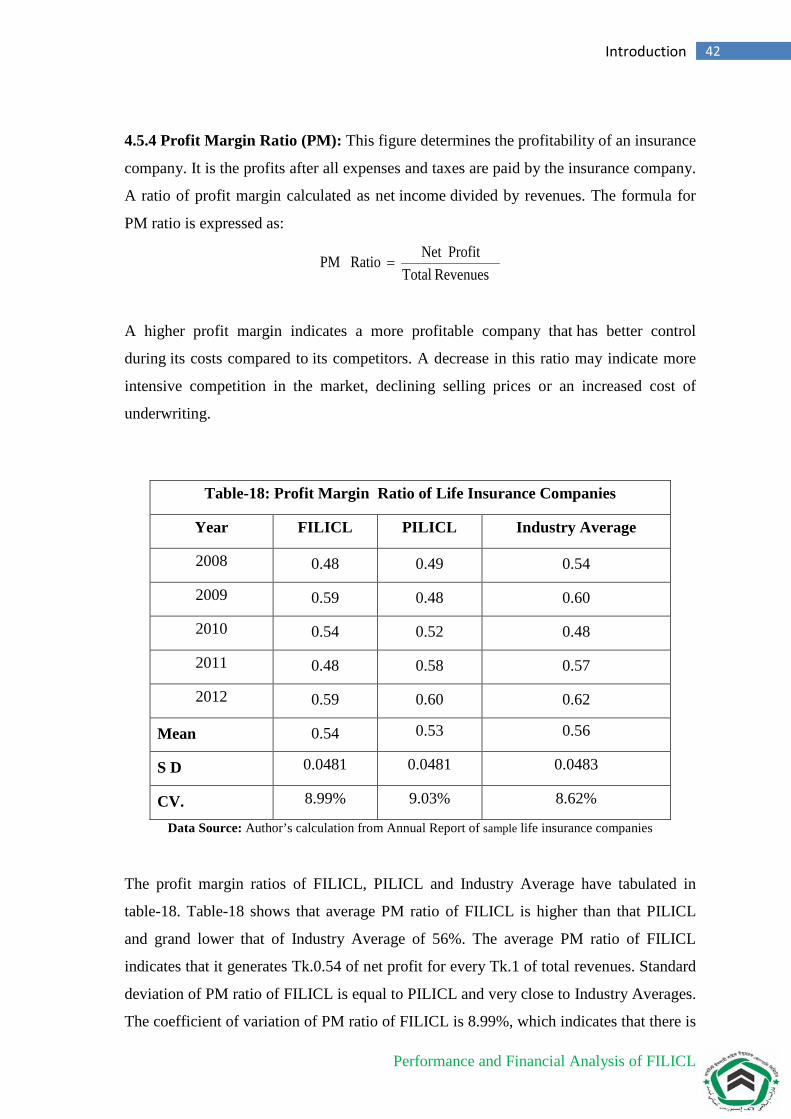
Performance and Financial Analysis of FILICL
42 Introduction
4.5.4 Profit Margin Ratio (PM): This figure determines the profitability of an insurance
company. It is the profits after all expenses and taxes are paid by the insurance company.
A ratio of profit margin calculated as net income divided by revenues. The formula for
PM ratio is expressed as:
Revenues TotalProfitNet Ratio PM =
A higher profit margin indicates a more profitable company that has better control
during its costs compared to its competitors. A decrease in this ratio may indicate more
intensive competition in the market, declining selling prices or an increased cost of
underwriting.
Table-18: Profit Margin Ratio of Life Insurance Companies
Year FILICL PILICL Industry Average
2008 0.48 0.49 0.54
2009 0.59 0.48 0.60
2010 0.54 0.52 0.48
2011 0.48 0.58 0.57
2012 0.59 0.60 0.62
Mean 0.54 0.53 0.56
S D 0.0481 0.0481 0.0483
CV. 8.99% 9.03% 8.62%
Data Source: Author’s calculation from Annual Report of sample life insurance companies
The profit margin ratios of FILICL, PILICL and Industry Average have tabulated in
table-18. Table-18 shows that average PM ratio of FILICL is higher than that PILICL
and grand lower that of Industry Average of 56%. The average PM ratio of FILICL
indicates that it generates Tk.0.54 of net profit for every Tk.1 of total revenues. Standard
deviation of PM ratio of FILICL is equal to PILICL and very close to Industry Averages.
The coefficient of variation of PM ratio of FILICL is 8.99%, which indicates that there is
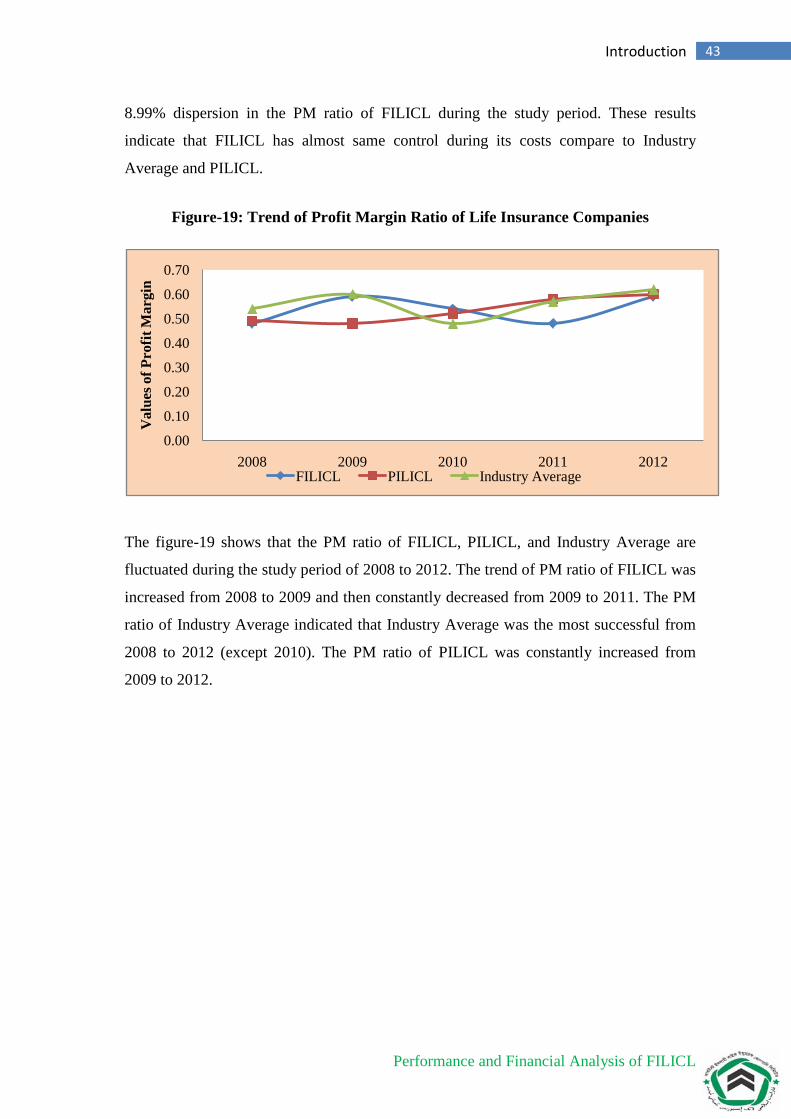
Performance and Financial Analysis of FILICL
43 Introduction
8.99% dispersion in the PM ratio of FILICL during the study period. These results
indicate that FILICL has almost same control during its costs compare to Industry
Average and PILICL.
Figure-19: Trend of Profit Margin Ratio of Life Insurance Companies
The figure-19 shows that the PM ratio of FILICL, PILICL, and Industry Average are
fluctuated during the study period of 2008 to 2012. The trend of PM ratio of FILICL was
increased from 2008 to 2009 and then constantly decreased from 2009 to 2011. The PM
ratio of Industry Average indicated that Industry Average was the most successful from
2008 to 2012 (except 2010). The PM ratio of PILICL was constantly increased from
2009 to 2012.
0.00
0.10
0.20
0.30
0.40
0.50
0.60
0.70
2008 2009 2010 2011 2012
Val
ues o
f Pro
fit M
argi
n
FILICL PILICL Industry Average
Performance and Financial Analysis of FILICL
44 Introduction
5.1 Summary of Report Findings
This report had started with an objective: to analysis the risk and profitability of Fareast
Islami Life Insurance Company Limited. While my journey to that goal, I have found
some interesting discoveries. The followings are the summary of my study findings:
1. There is no significant difference in liquidity risk among the life insurers of
Bangladesh over the study period. All the life insurance companies in Bangladesh
have a good level of liquid assets. The liquidity risk of FILICL is very low as like
its competitors.
2. There is significant difference in solvency risk among the life insurers of
Bangladesh during the study period. All the life insurance companies have a bad
level of policyholders’ surplus or net worth. FILICL is more vulnerable in
managing the policyholders’ surplus than its competitors or Industry Average.
3. FILICL is efficient in managing the policyholders’ claims than its competitors
and Industry Average.
4. FILICL is efficient in managing its underwriting expenses as like PILICL and
Industry Average.
5. FILICL is very conservative in their investment than its compactors or Industry
Average.
6. FILICL is efficient in managing its operating expenses as like PILICL. But
FILICL is inefficient in managing its operating expenses comparative to Industry
Average during the study period.
7. There is no significant in return on assets between FILICL and Industry Average
and have a significant difference between FILICL and PILICL during the study
period. FILICL is efficient in managing its wealth as like Industry Average but
more efficient than PILICL.
8. There is significant difference in return on equity among the life insurers of
Bangladesh over the study period. But all the life insurance companies in
Bangladesh have obtained a very good level of return on equity.
9. There is no significant difference in return on capital employed between FILICL
and Industry Average, but have a significant difference between FILICL and
PILICL during the study period. FILICL is more efficient in managing its net
capital employed than PILICL but less efficient than Industry Average.
Performance and Financial Analysis of FILICL
45 Introduction
10. There is no significant difference in profit margin among the life insurers of
Bangladesh during the study period. FILICL has almost same control over its
costs compare to Industry Average and PILICL.
11. The correlation result between ROA and SR of FILICL and Industry Average
shows no linear association.
12. The correlation result between ROA and LR of FILICL and Industry Average
shows a moderate negative coefficient. The correlation result between ROA and
LR of PILICL shows a weak negative coefficient.
13. The correlation result between ROA and OR of FILICL, PILICL, and Industry
Average shows a weak negative coefficient.
14. The regression model suggests that there is significant positive relationship
between risk and profitability of among the life insurance companies of
Bangladesh during the study period.
15. The regression result shows that the ROA of FILICL and Industry Average
positively depends on SR. But the ROA of PILICL negatively depends on SR.
16. The regression result also shows that the ROA of FILICL and Industry Average
negatively depends on LR and OR.
17. The risk index of life insurers in Bangladesh is very bad level. Moreover, the book
value insolvency of FILICL is lower than PILICL and Industry Average.
5.2 Conclusions and Recommendations
Fareast Islami Life Insurance Company has started their journey as the 1st full-fledged
Islami Life Insurance Company in Bangladesh in the year of 2000. FILICL has already
developed an images and goodwill among its policyholders by offering it excellent
services. This success has resulted from the dedication, commitment, and dynamic
leadership of its management over the periods. During the short span of time of FILICL
has successfully grabbed a position itself as a progressive and dynamic company in
insurance sector with their Islamic values.
The study has analytically examined the implications of the FILICL’s scale on
profitability and risk measures on the basis of published data. The analytical results
showed that there is significant positive relationship between risk and profitability of
Performance and Financial Analysis of FILICL
46 Introduction
FILICL. FILICL is safer in managing its liquidity and financial operating risk during the
period of study. The profitability performance of FILICL is quite impressive during the
study period. Although the analysis revealed that Fareast Islami Life Insurance Company
is financially sound during the study period, there are certain areas in which the company
can improve for sustain in long-run in the competitive market. On the basis of the present
study, following recommendations can be made:
• Due to the bad level of solvency margin of FILICL, they should pay special
attention in determining their optimal capital structure. More especially, they
should consistently generate policyholders’ surplus to remain viable in the long
run.
• Due to strong positive relationship between risk and profitability of FILICL, they
should more aggressive or effective in their investment policies.
• FILICL should more concentrate on net premiums earned to bring down the
claims ratio and increase their profits. Higher profits would mean better reserves
which in turn would assist the insurer to operate in times of unexpected
eventualities and also help them maintain liquidity at all times.
• Operational efficiency should be increased by reducing underwriting expense and
improving operating and management performance.
• Insurance Development and Regulatory Authority of Bangladesh (IDRA) should
specified maximum capacity ratio for the insurers so that at any point of time the
insurers have funds available to service any unexpected claims.
Performance and Financial Analysis of FILICL
47 Introduction
End Notes
1 Premiums are a regular periodic payment for an insurance policy.
2 Profitability means ability to make profit from all the business activities of an
organization.
3 Risk refers to the chance that some unfavorable event will occur.
4 Policyholders’ Surplus (also known as owner’s equity) is the total assets minus the
total liabilities of an insurer.
5 Underwriting refers to the process that a large financial service provider uses to
assess the eligibility of a customer to receive their products.
6 Profit is the difference between the total revenue and the total expenses.
Performance and Financial Analysis of FILICL
48 Introduction
BIBLIOGRAPHY
Books:
Brigham, Eugene F. and Houston, Joel F. (2005). Fundamental of Financial
Management. 10th Edition, United States: Thomson Southwestern.
Jain, P. K. and Khan, M.Y. (1995). Financial Management Text and Problems, 2nd
Edition, New Delhi: Tata MeGraw-Hill Company Limited.
James, C. van Horne. (1996). Financial Management Policy. 10th Edition, New Delhi:
Prentice-hall of India.
Lesikar, Raymond V. and Marie E. Flatley. (2005). Basic Business Communication. 10th
Edition, New Delhi: Tata McGraw-Hill Publishing Company Limited.
Levin, Rechard I. and Rubin, Davis S. (1997). Statistics for Management. 7th Edition,
New Delhi: Prentice Hall of India Private Limited.
Madura, Jeff. (2003). Financial Markets and Institutions. 6th Edition, South-Western:
Thomson Learning.
Mishra. M.N. (1997). Insurance: Principles and Practices. 7th Edition, New Delhi: S.
Chand & Company Limited.
Ross, Stephen A., Westerfield, Randolph W., & Jaffe, Jeffrey. (2004). Corporate
Finance. 7th Edition, New Delhi: Tata McGraw-Hill Publishing Company
Limited.
Zikmund, William G. (2000). Business Research Methods. 6th Edition, New York: The
Dryden Press.
Journals:
Ambrose J.M. and Seward J.A. (1988). Best’s Ratings, Financial Ratios and Prior
Probabilities in Insolvency Prediction. The Journal of Risk and Insurance, Vol.
55, No. 2, pp. 229-244.
Performance and Financial Analysis of FILICL
49 Introduction
Azad, A.K. (1999). Nature and Significance of General Insurance in Bangladesh: A Case
Study of Bangladesh Co-operative Insurance Limited. Insurance Journal,
Bangladesh Insurance Academy, Vol. 50, p. 81.
Bashir, Abdel-Hameed M. (1999). Risk and Profitability Measures in Islamic Banks: The
Case of Two Sudanese Banks. Islamic Economic Studies, Vol. 6, No. 2.
Bhattacharjee, D. (1980). The Contribution of General Insurance Business and the
Economy of Bangladesh: An Appraisal. Insurance Journal, Bangladesh Insurance
Academy, Vol. 21, pp. 33.
Chen, J.S., Chen, M.C., Chen, T.H., and Liao, W.J. (2009). Influence of Capital
Structure and Operational Risk on Profitability of Life Insurance Industry in
Taiwan. Journal of Modeling in Management, Journal, Vol. 4, No. 1, pp. 7-18.
Greene, William H. and Segal, Dan. (2004). Profitability and Efficiency in the U.A. Life
Insurance Industry. The Journal of Risk and Insurance, Vol. 21, No. 11, pp. 229-
247.
Holzheu, T. (2008). Measuring Underwriting Profitability of the Non-Life Insurance
Industry. Swiss RE Sigma, No.3, pp. 1-31.
Hye, D.M.A. & Rahman, M.A. (1997). Performance of Selected Private Sector General
Insurance Companies in Bangladesh. Chittagong University Journal of
Commerce, Vol. 13, pp. 137-160
Jahangir, N., Shill, S., and Haque, M. A. J. (2007). Examination of Profitability in the
Context of Bangladesh Banking Industry. ABAC Journal, Vol. 27, No. 2.
Annual Reports:
Annual reports of Fareast Islami Life Insurance Company Limited, 2008-2012
Annual reports of Prime Islami Life Insurance Company Limited, 2008-2012
Annual reports of Delta Life Insurance Company Limited, 2008-2012
Annual reports of Meghna Life Insurance Company Limited, 2008-2012
Performance and Financial Analysis of FILICL
50 Introduction
Annual reports of National Life Insurance Company Limited, 2008-2012
Annual reports of Popular Life Insurance Company Limited, 2008-2012
Annual reports of Pragati Life Insurance Company Limited, 2008-2012
Annual reports of Progressive Life Insurance Company Limited, 2008-2012
Annual reports of Rupali Life Insurance Company Limited, 2008-2012
Annual reports of Sandhani Life Insurance Company Limited, 2008-2012
Websites:
http://www.idra.org.bd
http://www.fareastislamilife.com
http://www.primeislamilifebd.com
http://www.crab.com.bd
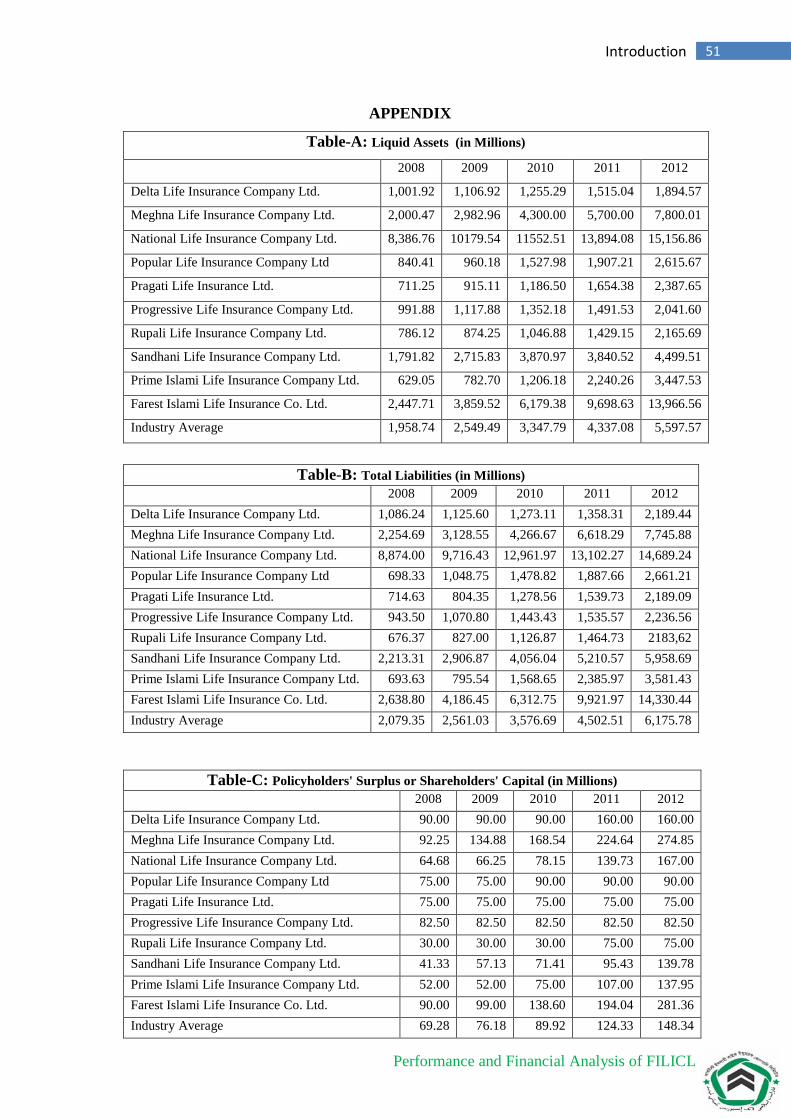
Performance and Financial Analysis of FILICL
51 Introduction
APPENDIX
Table-A: Liquid Assets (in Millions)
2008 2009 2010 2011 2012
Delta Life Insurance Company Ltd. 1,001.92 1,106.92 1,255.29 1,515.04 1,894.57
Meghna Life Insurance Company Ltd. 2,000.47 2,982.96 4,300.00 5,700.00 7,800.01
National Life Insurance Company Ltd. 8,386.76 10179.54 11552.51 13,894.08 15,156.86
Popular Life Insurance Company Ltd 840.41 960.18 1,527.98 1,907.21 2,615.67
Pragati Life Insurance Ltd. 711.25 915.11 1,186.50 1,654.38 2,387.65
Progressive Life Insurance Company Ltd. 991.88 1,117.88 1,352.18 1,491.53 2,041.60
Rupali Life Insurance Company Ltd. 786.12 874.25 1,046.88 1,429.15 2,165.69
Sandhani Life Insurance Company Ltd. 1,791.82 2,715.83 3,870.97 3,840.52 4,499.51
Prime Islami Life Insurance Company Ltd. 629.05 782.70 1,206.18 2,240.26 3,447.53
Farest Islami Life Insurance Co. Ltd. 2,447.71 3,859.52 6,179.38 9,698.63 13,966.56
Industry Average 1,958.74 2,549.49 3,347.79 4,337.08 5,597.57
Table-B: Total Liabilities (in Millions)
2008 2009 2010 2011 2012 Delta Life Insurance Company Ltd. 1,086.24 1,125.60 1,273.11 1,358.31 2,189.44 Meghna Life Insurance Company Ltd. 2,254.69 3,128.55 4,266.67 6,618.29 7,745.88 National Life Insurance Company Ltd. 8,874.00 9,716.43 12,961.97 13,102.27 14,689.24 Popular Life Insurance Company Ltd 698.33 1,048.75 1,478.82 1,887.66 2,661.21 Pragati Life Insurance Ltd. 714.63 804.35 1,278.56 1,539.73 2,189.09 Progressive Life Insurance Company Ltd. 943.50 1,070.80 1,443.43 1,535.57 2,236.56 Rupali Life Insurance Company Ltd. 676.37 827.00 1,126.87 1,464.73 2183,62 Sandhani Life Insurance Company Ltd. 2,213.31 2,906.87 4,056.04 5,210.57 5,958.69 Prime Islami Life Insurance Company Ltd. 693.63 795.54 1,568.65 2,385.97 3,581.43 Farest Islami Life Insurance Co. Ltd. 2,638.80 4,186.45 6,312.75 9,921.97 14,330.44 Industry Average 2,079.35 2,561.03 3,576.69 4,502.51 6,175.78
Table-C: Policyholders' Surplus or Shareholders' Capital (in Millions) 2008 2009 2010 2011 2012 Delta Life Insurance Company Ltd. 90.00 90.00 90.00 160.00 160.00 Meghna Life Insurance Company Ltd. 92.25 134.88 168.54 224.64 274.85 National Life Insurance Company Ltd. 64.68 66.25 78.15 139.73 167.00 Popular Life Insurance Company Ltd 75.00 75.00 90.00 90.00 90.00 Pragati Life Insurance Ltd. 75.00 75.00 75.00 75.00 75.00 Progressive Life Insurance Company Ltd. 82.50 82.50 82.50 82.50 82.50 Rupali Life Insurance Company Ltd. 30.00 30.00 30.00 75.00 75.00 Sandhani Life Insurance Company Ltd. 41.33 57.13 71.41 95.43 139.78 Prime Islami Life Insurance Company Ltd. 52.00 52.00 75.00 107.00 137.95 Farest Islami Life Insurance Co. Ltd. 90.00 99.00 138.60 194.04 281.36 Industry Average 69.28 76.18 89.92 124.33 148.34
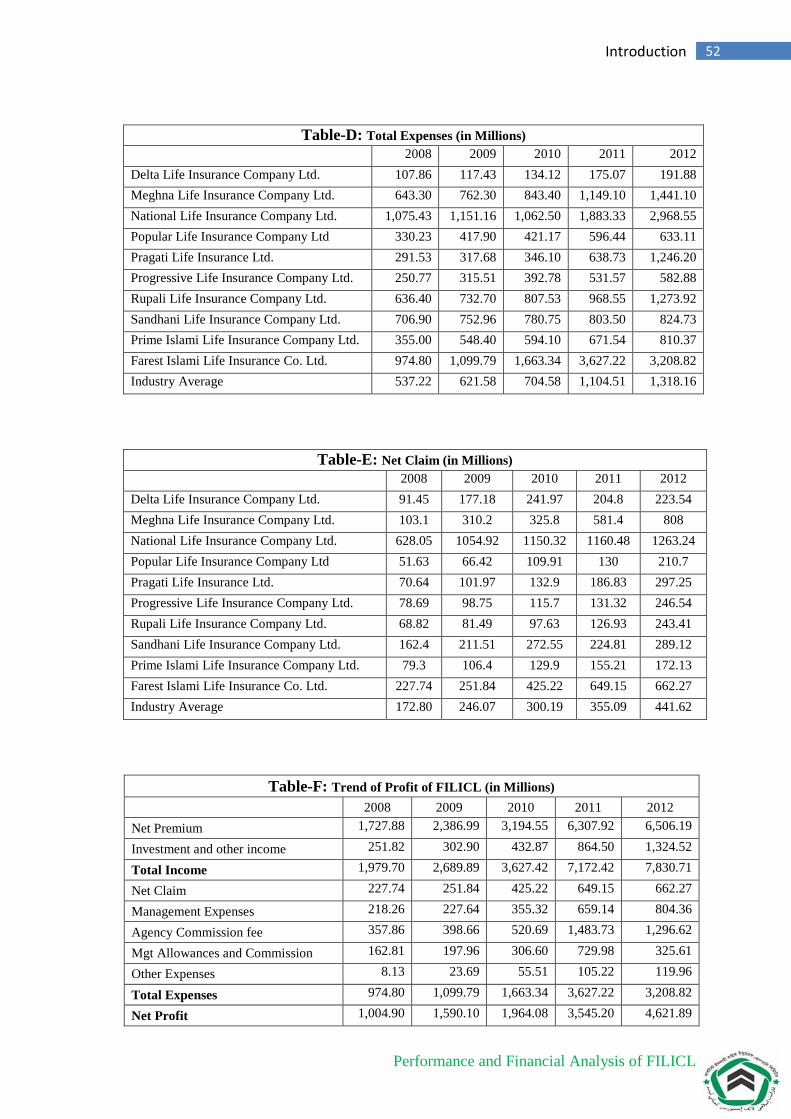
Performance and Financial Analysis of FILICL
52 Introduction
Table-D: Total Expenses (in Millions)
2008 2009 2010 2011 2012 Delta Life Insurance Company Ltd. 107.86 117.43 134.12 175.07 191.88 Meghna Life Insurance Company Ltd. 643.30 762.30 843.40 1,149.10 1,441.10 National Life Insurance Company Ltd. 1,075.43 1,151.16 1,062.50 1,883.33 2,968.55 Popular Life Insurance Company Ltd 330.23 417.90 421.17 596.44 633.11 Pragati Life Insurance Ltd. 291.53 317.68 346.10 638.73 1,246.20 Progressive Life Insurance Company Ltd. 250.77 315.51 392.78 531.57 582.88 Rupali Life Insurance Company Ltd. 636.40 732.70 807.53 968.55 1,273.92 Sandhani Life Insurance Company Ltd. 706.90 752.96 780.75 803.50 824.73 Prime Islami Life Insurance Company Ltd. 355.00 548.40 594.10 671.54 810.37 Farest Islami Life Insurance Co. Ltd. 974.80 1,099.79 1,663.34 3,627.22 3,208.82 Industry Average 537.22 621.58 704.58 1,104.51 1,318.16
Table-E: Net Claim (in Millions) 2008 2009 2010 2011 2012 Delta Life Insurance Company Ltd. 91.45 177.18 241.97 204.8 223.54 Meghna Life Insurance Company Ltd. 103.1 310.2 325.8 581.4 808 National Life Insurance Company Ltd. 628.05 1054.92 1150.32 1160.48 1263.24 Popular Life Insurance Company Ltd 51.63 66.42 109.91 130 210.7 Pragati Life Insurance Ltd. 70.64 101.97 132.9 186.83 297.25 Progressive Life Insurance Company Ltd. 78.69 98.75 115.7 131.32 246.54 Rupali Life Insurance Company Ltd. 68.82 81.49 97.63 126.93 243.41 Sandhani Life Insurance Company Ltd. 162.4 211.51 272.55 224.81 289.12 Prime Islami Life Insurance Company Ltd. 79.3 106.4 129.9 155.21 172.13 Farest Islami Life Insurance Co. Ltd. 227.74 251.84 425.22 649.15 662.27 Industry Average 172.80 246.07 300.19 355.09 441.62
Table-F: Trend of Profit of FILICL (in Millions) 2008 2009 2010 2011 2012 Net Premium 1,727.88 2,386.99 3,194.55 6,307.92 6,506.19
Investment and other income 251.82 302.90 432.87 864.50 1,324.52
Total Income 1,979.70 2,689.89 3,627.42 7,172.42 7,830.71
Net Claim 227.74 251.84 425.22 649.15 662.27
Management Expenses 218.26 227.64 355.32 659.14 804.36
Agency Commission fee 357.86 398.66 520.69 1,483.73 1,296.62
Mgt Allowances and Commission 162.81 197.96 306.60 729.98 325.61
Other Expenses 8.13 23.69 55.51 105.22 119.96
Total Expenses 974.80 1,099.79 1,663.34 3,627.22 3,208.82
Net Profit 1,004.90 1,590.10 1,964.08 3,545.20 4,621.89
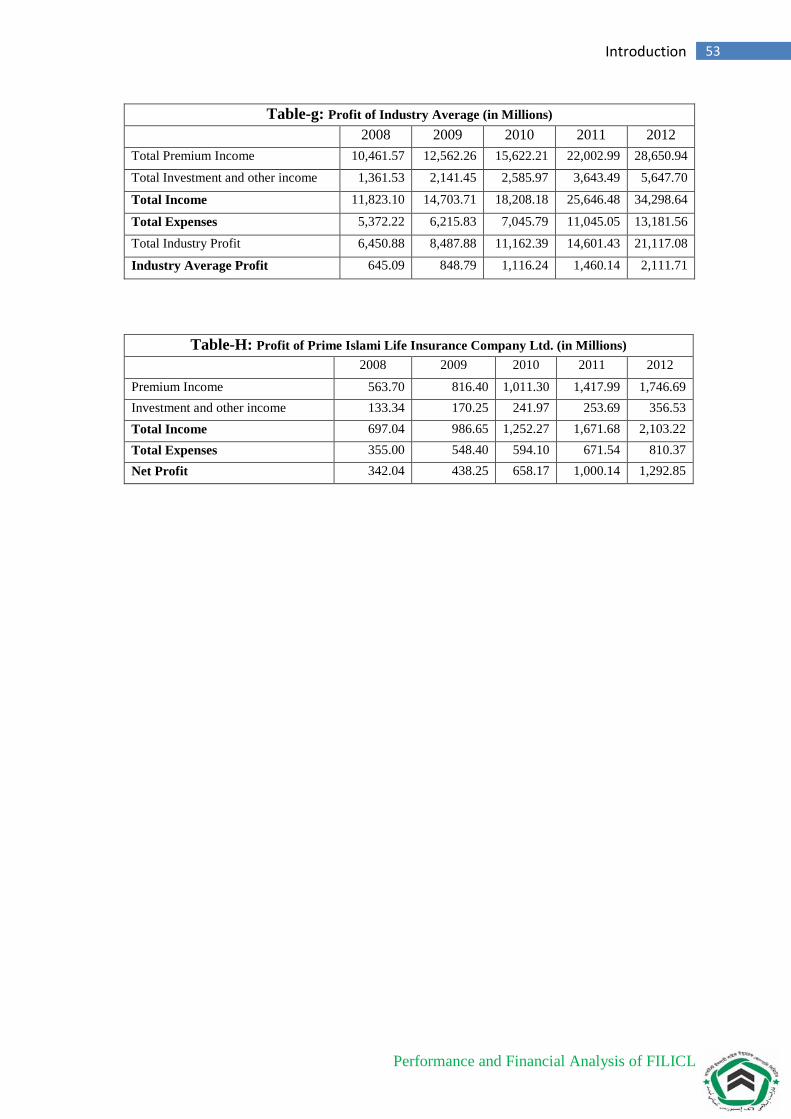
Performance and Financial Analysis of FILICL
53 Introduction
Table-g: Profit of Industry Average (in Millions) 2008 2009 2010 2011 2012 Total Premium Income 10,461.57 12,562.26 15,622.21 22,002.99 28,650.94
Total Investment and other income 1,361.53 2,141.45 2,585.97 3,643.49 5,647.70
Total Income 11,823.10 14,703.71 18,208.18 25,646.48 34,298.64
Total Expenses 5,372.22 6,215.83 7,045.79 11,045.05 13,181.56
Total Industry Profit 6,450.88 8,487.88 11,162.39 14,601.43 21,117.08
Industry Average Profit 645.09 848.79 1,116.24 1,460.14 2,111.71
Table-H: Profit of Prime Islami Life Insurance Company Ltd. (in Millions) 2008 2009 2010 2011 2012
Premium Income 563.70 816.40 1,011.30 1,417.99 1,746.69 Investment and other income 133.34 170.25 241.97 253.69 356.53 Total Income 697.04 986.65 1,252.27 1,671.68 2,103.22 Total Expenses 355.00 548.40 594.10 671.54 810.37 Net Profit 342.04 438.25 658.17 1,000.14 1,292.85
Related Documents