National Aeronautics and Space Administration Performance and Accountability Report Pe Perf rf ormance and ormance and Accountability Repo Accountability Report rt Fiscal Year 2006 Fiscal Year Fiscal Year 2006 2006

Welcome message from author
This document is posted to help you gain knowledge. Please leave a comment to let me know what you think about it! Share it to your friends and learn new things together.
Transcript
National Aeronautics and Space Administration
Performance and Accountability ReportPePerfrformance and ormance and Accountability RepoAccountability ReportrtF
isca
l Yea
r
20
06
Fis
cal Y
ear
Fis
cal Y
ear
20
06
20
06
NASA’s Performance andAccountability Report
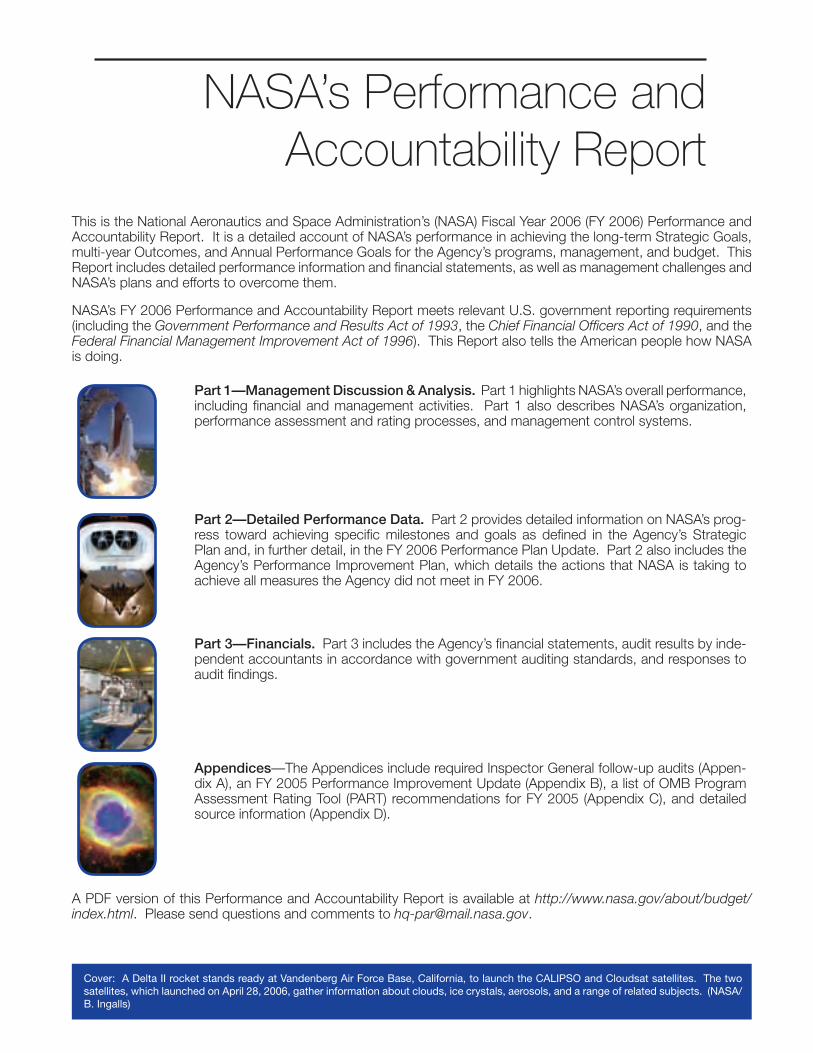
This is the National Aeronautics and Space Administration’s (NASA) Fiscal Year 2006 (FY 2006) Performance and Accountability Report. It is a detailed account of NASA’s performance in achieving the long-term Strategic Goals, multi-year Outcomes, and Annual Performance Goals for the Agency’s programs, management, and budget. This Report includes detailed performance information and fi nancial statements, as well as management challenges and NASA’s plans and efforts to overcome them.
NASA’s FY 2006 Performance and Accountability Report meets relevant U.S. government reporting requirements (including the Government Performance and Results Act of 1993, the Chief Financial Offi cers Act of 1990, and the Federal Financial Management Improvement Act of 1996). This Report also tells the American people how NASA is doing.
Part 1—Management Discussion & Analysis. Part 1 highlights NASA’s overall performance, including fi nancial and management activities. Part 1 also describes NASA’s organization, performance assessment and rating processes, and management control systems.
Part 2—Detailed Performance Data. Part 2 provides detailed information on NASA’s prog-ress toward achieving specifi c milestones and goals as defi ned in the Agency’s Strategic Plan and, in further detail, in the FY 2006 Performance Plan Update. Part 2 also includes the Agency’s Performance Improvement Plan, which details the actions that NASA is taking to achieve all measures the Agency did not meet in FY 2006.
Part 3—Financials. Part 3 includes the Agency’s fi nancial statements, audit results by inde-pendent accountants in accordance with government auditing standards, and responses to audit fi ndings.
Appendices—The Appendices include required Inspector General follow-up audits (Appen-dix A), an FY 2005 Performance Improvement Update (Appendix B), a list of OMB Program Assessment Rating Tool (PART) recommendations for FY 2005 (Appendix C), and detailed source information (Appendix D).
A PDF version of this Performance and Accountability Report is available at http://www.nasa.gov/about/budget/index.html. Please send questions and comments to [email protected].
Cover: A Delta II rocket stands ready at Vandenberg Air Force Base, California, to launch the CALIPSO and Cloudsat satellites. The two satellites, which launched on April 28, 2006, gather information about clouds, ice crystals, aerosols, and a range of related subjects. (NASA/B. Ingalls)
Fiscal Year 2006 was a very good year for NASA. We made signifi cant progress in implementing the goals articulated in NASA’s Strategic Plan to carry out our mission of space exploration, scientifi c discovery, and aeronautics research. With the NASA Authorization Act of 2005, Congress affi rmed the Vision for Space Exploration and the course that President Bush set for us to advance our Nation’s economic, scientifi c, and security interests. We have much remaining yet to accomplish, but we are making steady progress in achieving our goals.
Robotic and human spacefl ight are the most technically challenging endeavors we can undertake as a Nation. Completion of the International Space Station (ISS), retirement of the Space Shuttle, and transitioning to new exploration systems will be NASA’s greatest challenges over the next several years, and we are moving forward to achieve all three goals. In August 2006, we re-started assembly of the ISS, and we plan to complete construction by 2010 and then retire the Space Shuttle. Following the Exploration Systems Architecture Study completed in 2005, this year we awarded a contract to design and develop the Orion Crew Exploration Vehicle that will return our astronauts to the Moon and eventually carry them to Mars and other destinations. NASA also signed Space Act Agreements to demonstrate commercial crew and cargo transportation services to the ISS, and we refi ned our designs for the Ares I Crew Launch Vehicle and Ares V heavy-lift Cargo Launch Vehicle to save money in life-cycle costs. In the coming months, NASA will enter into development contracts for the upper stage of the Ares I Crew Launch Vehicle, and we are partnering with the U.S. Air Force in developing the RS-68 engine for the Ares V Cargo Launch Vehicle.
We are fostering a work environment throughout NASA in which engineers and technicians feel free to address problems that may affect the safety of the crew and mission. We have completed three successful Shuttle fl ights to the ISS since the Space Shuttle Columbia accident, and we are on track to complete all planned Shuttle fl ights by 2010, including a servicing mission to the Hubble Space Telescope in 2008.
NASA continues to be a world leader in space and Earth sciences. In 2006, the Nobel Prize for Physics was awarded to Dr. John Mather, the fi rst NASA employee to be awarded this honor. This year, we launched the New Horizons mission to Pluto, the Cloudsat and CALIPSO satellites to monitor global climate change, the STEREO mission to view the effects of solar activity on the Earth, and two additional heliophysics satellites—TWINS–A and SOLAR–B. Today, robotic rovers and satellites explore Mars searching for evidence of life. Scientists working with NASA’s astronomy and astrophysics missions search for planets—and possibly life—around other stars and try to unlock the mysteries of the way the universe began and may ultimately end.
In FY 2006, we restructured our aeronautics research program to ensure that it will support long-term, cutting-edge research aligned to our national priorities for the benefi t of the broad aeronautics community in academia, industry, and other government agencies. This restructuring refl ects NASA’s commitment to restoring and maintaining core aeronautics capabilities within the Centers.
These initiatives are part of NASA’s objective of creating ten healthy Centers, with each actively contributing to all NASA missions. In FY 2006, we also began tackling the problem of our “uncovered capacity” workforce, those
Message from the Administrator
November 15, 2006
ii NASA FY 2006 PERFORMANCE AND ACCOUNTABILITY REPORT
employees who are not assigned directly to specifi c programs. At the beginning of FY 2006, NASA had approxi-mately 3,000 uncovered positions, but by the end of the fi scal year, the estimate was reduced to approximately 300 positions.
We have many challenges ahead of us. In submitting this Report of our achievements and challenges in FY 2006, NASA accepts the responsibility of reporting performance and fi nancial data accurately and reliably with the same vigor as we conduct our scientifi c research. For FY 2006, I can provide reasonable assurance that the performance data in this Report are complete and reliable. Performance data limitations are documented explicitly.
In accordance with the Federal Financial Management Improvement Act (FFMIA), NASA’s Integrated Financial Management System Core Financial Module (IFMSCFM) produces fi nancial and budget reports. However, because of unresolved data conversion issues, the system is unable to provide reliable and timely information for managing current operations and safeguarding assets. Therefore, NASA’s IFMSCFM does not comply fully with the requirements of the FFMIA, and the independent auditors were unable to render an opinion on our FY 2006 fi nancial statements. Instead, they issued a disclaimer of opinion. Therefore, I cannot provide reasonable assurance that the fi nancial data in this Report are complete and reliable. We will continue to focus on bringing NASA’s fi nancial management system into compliance.
NASA continues to improve the Agency’s internal control environment, compliance with established requirements and standards, and heightened stewardship of the resources and assets entrusted to the Agency. In FY 2006, NASA resolved two of four material weaknesses reported in FY 2005. This year, we report two continuing material weaknesses and one new material weakness in internal control. With the exception of these three material weak-nesses, I submit a qualifi ed Statement of Assurance that reasonable controls are in place to achieve the Agency’s programmatic, institutional, and fi nancial management objectives. Internal control initiatives and corrective action plans for closing material weaknesses are discussed in detail within the Systems, Controls, & Legal Compliance chapter, Part 1, of this Report.
We have a lot of work ahead of us, but we are making solid progress. Therefore, it is my pleasure to submit NASA’s FY 2006 Performance and Accountability Report.
Michael D. Griffi n Administrator
Table of Contents
TABLE OF CONTENTS iii
PART 1: MANAGEMENT DISCUSSION & ANALYSIS . . . . . . . . . . . . . . . . . . . . . . . . . . . . . . . . . . .1
Mission, Vision, Values, & Organization . . . . . . . . . . . . . . . . . . . . . . . . . . . . . . . . . . . . . . . . . . . . . .3
NASA’s Mission Is on Track . . . . . . . . . . . . . . . . . . . . . . . . . . . . . . . . . . . . . . . . . . . . . . . . . . . .3Making Progress . . . . . . . . . . . . . . . . . . . . . . . . . . . . . . . . . . . . . . . . . . . . . . . . . . . . . . . . . . . .3NASA’s Values . . . . . . . . . . . . . . . . . . . . . . . . . . . . . . . . . . . . . . . . . . . . . . . . . . . . . . . . . . . . . .4NASA’s Organization . . . . . . . . . . . . . . . . . . . . . . . . . . . . . . . . . . . . . . . . . . . . . . . . . . . . . . . . .4
NASA Headquarters . . . . . . . . . . . . . . . . . . . . . . . . . . . . . . . . . . . . . . . . . . . . . . . . . . . . . .4Building Healthy NASA Centers . . . . . . . . . . . . . . . . . . . . . . . . . . . . . . . . . . . . . . . . . . . . . .5
Measuring NASA’s Performance . . . . . . . . . . . . . . . . . . . . . . . . . . . . . . . . . . . . . . . . . . . . . . . . . . .7
Establishing Government Performance and Results Act (GPRA) Performance Measures . . . . . .7Rating NASA’s Performance . . . . . . . . . . . . . . . . . . . . . . . . . . . . . . . . . . . . . . . . . . . . . . . . . . .7Program Assessment Rating Tool (PART) . . . . . . . . . . . . . . . . . . . . . . . . . . . . . . . . . . . . . . . .12President’s Management Agenda (PMA) . . . . . . . . . . . . . . . . . . . . . . . . . . . . . . . . . . . . . . . . .12Major Program Annual Reports . . . . . . . . . . . . . . . . . . . . . . . . . . . . . . . . . . . . . . . . . . . . . . . .13
Performance Overview . . . . . . . . . . . . . . . . . . . . . . . . . . . . . . . . . . . . . . . . . . . . . . . . . . . . . . . . .15
Progress Toward Achieving NASA’s Strategic Goals . . . . . . . . . . . . . . . . . . . . . . . . . . . . . . . .15A Guide to Performance Overviews . . . . . . . . . . . . . . . . . . . . . . . . . . . . . . . . . . . . . . . . . .15Strategic Goal 1: Fly the Shuttle as safely as possible until its retirement,
not later than 2010. . . . . . . . . . . . . . . . . . . . . . . . . . . . . . . . . . . . . . . . . . . . . . . . . . . . . .16Strategic Goal 2: Complete the International Space Station in a manner
consistent with NASA’s International Partner commitments and the needs of human exploration. . . . . . . . . . . . . . . . . . . . . . . . . . . . . . . . . . . . . . . . . . . . . . . . . . . .18
Goal 3: Develop a balanced overall program of science, exploration, and aeronautics consistent with the redirection of the human spacefl ight program to focus on exploration. . . . . . . . . . . . . . . . . . . . . . . . . . . . . . . . . . . . . . . . . . . .20
Sub-goal 3A: Study Earth from space to advance scientifi c understanding and meet societal needs. . . . . . . . . . . . . . . . . . . . . . . . . . . . . . . . . . . . . . . . . . . . . . . . . .22
Sub-goal 3B: Understand the Sun and its effects on Earth and the solar system. . . . . . . .25Sub-goal 3C: Advance scientifi c knowledge of the origin and history of
the solar system, the potential for life elsewhere, and the hazards and resources present as humans explore space. . . . . . . . . . . . . . . . . . . . . . . . . . . . . . .28
Sub-goal 3D: Discover the origin, structure, evolution, and destiny of the universe, and search for Earth-like planets. . . . . . . . . . . . . . . . . . . . . . . . . . . . . . . . .31
iv NASA FY 2006 PERFORMANCE AND ACCOUNTABILITY REPORT
Sub-goal 3E: Advance knowledge in the fundamental disciplines of aeronautics, and develop technologies for safer aircraft and higher capacity airspace systems. . . . . . . . . . . . . . . . . . . . . . . . . . . . . . . . . . . . . . . . . . . . . . . .34
Sub-goal 3F: Understand the effects of the space environment on human performance, and test new technologies and countermeasures for long-duration human space exploration. . . . . . . . . . . . . . . . . . . . . . . . . . . . . . . . . . . .37
Strategic Goal 4: Bring a new Crew Exploration Vehicle into service as soon as possible after Shuttle retirement. . . . . . . . . . . . . . . . . . . . . . . . . . . . . . . . . . .40
Strategic Goal 5: Encourage the pursuit of appropriate partnerships with the emerging commercial space sector. . . . . . . . . . . . . . . . . . . . . . . . . . . . . . . . . . .43
Strategic Goal 6: Establish a lunar return program having the maximum possible utility for later missions to Mars and other destinations. . . . . . . . . . . . . . . . . . . .46
Financial Overview . . . . . . . . . . . . . . . . . . . . . . . . . . . . . . . . . . . . . . . . . . . . . . . . . . . . . . . . . . . .49
Financial Statements and Stewardship . . . . . . . . . . . . . . . . . . . . . . . . . . . . . . . . . . . . . . . . . .49Overview of Financial Position . . . . . . . . . . . . . . . . . . . . . . . . . . . . . . . . . . . . . . . . . . . . . . . . .50
Assets . . . . . . . . . . . . . . . . . . . . . . . . . . . . . . . . . . . . . . . . . . . . . . . . . . . . . . . . . . . . . . . .50Liabilities . . . . . . . . . . . . . . . . . . . . . . . . . . . . . . . . . . . . . . . . . . . . . . . . . . . . . . . . . . . . . .51Ending Net Position . . . . . . . . . . . . . . . . . . . . . . . . . . . . . . . . . . . . . . . . . . . . . . . . . . . . . .52Results of Operations . . . . . . . . . . . . . . . . . . . . . . . . . . . . . . . . . . . . . . . . . . . . . . . . . . . .52
Limitation of the Financial Statements . . . . . . . . . . . . . . . . . . . . . . . . . . . . . . . . . . . . . . . . . . .53Key Financial-Related Measures . . . . . . . . . . . . . . . . . . . . . . . . . . . . . . . . . . . . . . . . . . . . . . .53
Systems, Controls, & Legal Compliance . . . . . . . . . . . . . . . . . . . . . . . . . . . . . . . . . . . . . . . . . . . .55
Overview . . . . . . . . . . . . . . . . . . . . . . . . . . . . . . . . . . . . . . . . . . . . . . . . . . . . . . . . . . . . . . . . .55Management Assurances . . . . . . . . . . . . . . . . . . . . . . . . . . . . . . . . . . . . . . . . . . . . . . . . . . . .57Corrective Action Plan . . . . . . . . . . . . . . . . . . . . . . . . . . . . . . . . . . . . . . . . . . . . . . . . . . . . . . .58
New Material Weakness . . . . . . . . . . . . . . . . . . . . . . . . . . . . . . . . . . . . . . . . . . . . . . . . . . .58Continuing Material Weaknesses . . . . . . . . . . . . . . . . . . . . . . . . . . . . . . . . . . . . . . . . . . . .58Closed Items . . . . . . . . . . . . . . . . . . . . . . . . . . . . . . . . . . . . . . . . . . . . . . . . . . . . . . . . . . .59
Offi ce of the Inspector General Statement on Material Weaknesses at the Agency . . . . . . . . .61Federal Financial Management Improvement Act . . . . . . . . . . . . . . . . . . . . . . . . . . . . . . . . . .70Improper Payments Information Act . . . . . . . . . . . . . . . . . . . . . . . . . . . . . . . . . . . . . . . . . . . .70
NASA’s Efforts to Identify Erroneous/Improper Payments . . . . . . . . . . . . . . . . . . . . . . . . . .70NASA’s Planned Fiscal Year 2007 IPIA Compliance Approach . . . . . . . . . . . . . . . . . . . . . .71Legal Compliance . . . . . . . . . . . . . . . . . . . . . . . . . . . . . . . . . . . . . . . . . . . . . . . . . . . . . . .72
Looking Ahead . . . . . . . . . . . . . . . . . . . . . . . . . . . . . . . . . . . . . . . . . . . . . . . . . . . . . . . . . . . . . . .73
Staying on Target and on Budget . . . . . . . . . . . . . . . . . . . . . . . . . . . . . . . . . . . . . . . . . . . . . .73Transitions . . . . . . . . . . . . . . . . . . . . . . . . . . . . . . . . . . . . . . . . . . . . . . . . . . . . . . . . . . . . . . . .73Maximizing NASA’s Workforce . . . . . . . . . . . . . . . . . . . . . . . . . . . . . . . . . . . . . . . . . . . . . . . .73Improving Agency Management . . . . . . . . . . . . . . . . . . . . . . . . . . . . . . . . . . . . . . . . . . . . . . .74Thinking (and Contracting) Outside of the Box . . . . . . . . . . . . . . . . . . . . . . . . . . . . . . . . . . . . .75Strengthening International Relationships and Collaboration . . . . . . . . . . . . . . . . . . . . . . . . . .75
TABLE OF CONTENTS v
PART 2: DETAILED PERFORMANCE DATA . . . . . . . . . . . . . . . . . . . . . . . . . . . . . . . . . . . . . . . . .77
Detailed Performance Data . . . . . . . . . . . . . . . . . . . . . . . . . . . . . . . . . . . . . . . . . . . . . . . . . . . . . .79
NASA’s Performance Rating System . . . . . . . . . . . . . . . . . . . . . . . . . . . . . . . . . . . . . . . . . . . .79Strategic Goal 1 . . . . . . . . . . . . . . . . . . . . . . . . . . . . . . . . . . . . . . . . . . . . . . . . . . . . . . . . .82Strategic Goal 2 . . . . . . . . . . . . . . . . . . . . . . . . . . . . . . . . . . . . . . . . . . . . . . . . . . . . . . . . .85Strategic Goal 3 . . . . . . . . . . . . . . . . . . . . . . . . . . . . . . . . . . . . . . . . . . . . . . . . . . . . . . . . .88Sub-goal 3A . . . . . . . . . . . . . . . . . . . . . . . . . . . . . . . . . . . . . . . . . . . . . . . . . . . . . . . . . . .89Sub-goal 3B . . . . . . . . . . . . . . . . . . . . . . . . . . . . . . . . . . . . . . . . . . . . . . . . . . . . . . . . . . .99Sub-goal 3C . . . . . . . . . . . . . . . . . . . . . . . . . . . . . . . . . . . . . . . . . . . . . . . . . . . . . . . . . .104Sub-goal 3D . . . . . . . . . . . . . . . . . . . . . . . . . . . . . . . . . . . . . . . . . . . . . . . . . . . . . . . . . .110Sub-goal 3E . . . . . . . . . . . . . . . . . . . . . . . . . . . . . . . . . . . . . . . . . . . . . . . . . . . . . . . . . .117Sub-goal 3F . . . . . . . . . . . . . . . . . . . . . . . . . . . . . . . . . . . . . . . . . . . . . . . . . . . . . . . . . . .122Strategic Goal 4 . . . . . . . . . . . . . . . . . . . . . . . . . . . . . . . . . . . . . . . . . . . . . . . . . . . . . . . .126Strategic Goal 5 . . . . . . . . . . . . . . . . . . . . . . . . . . . . . . . . . . . . . . . . . . . . . . . . . . . . . . . .130Strategic Goal 6 . . . . . . . . . . . . . . . . . . . . . . . . . . . . . . . . . . . . . . . . . . . . . . . . . . . . . . . .132
Cross-Agency Support Programs . . . . . . . . . . . . . . . . . . . . . . . . . . . . . . . . . . . . . . . . . . . . .137Education . . . . . . . . . . . . . . . . . . . . . . . . . . . . . . . . . . . . . . . . . . . . . . . . . . . . . . . . . . . .137Advanced Business Systems (Integrated Enterprise Management Program) . . . . . . . . . .138Innovative Partnerships Program . . . . . . . . . . . . . . . . . . . . . . . . . . . . . . . . . . . . . . . . . . .139
Effi ciency Measures . . . . . . . . . . . . . . . . . . . . . . . . . . . . . . . . . . . . . . . . . . . . . . . . . . . . . . . .141NASA’s FY 2006 Performance Improvement Plan . . . . . . . . . . . . . . . . . . . . . . . . . . . . . . . . .143
PART 3: FINANCIALS . . . . . . . . . . . . . . . . . . . . . . . . . . . . . . . . . . . . . . . . . . . . . . . . . . . . . . . .155
Message from the Chief Financial Offi cer . . . . . . . . . . . . . . . . . . . . . . . . . . . . . . . . . . . . . . . . . .157
Financial Management Improvement . . . . . . . . . . . . . . . . . . . . . . . . . . . . . . . . . . . . . . . . . .1582006 Financial Management Improvement Efforts . . . . . . . . . . . . . . . . . . . . . . . . . . . . . .158
Introduction to the Principal Financial Statements . . . . . . . . . . . . . . . . . . . . . . . . . . . . . . . . .160Offi ce of Inspector General Letter on Audit of NASA’s Financial Statements . . . . . . . . . . . . . .206Report of the Independent Auditors . . . . . . . . . . . . . . . . . . . . . . . . . . . . . . . . . . . . . . . . . . .208Chief Financial Offi cer’s Response to the Audit Report of the Independent Auditors . . . . . . .235
APPENDICES . . . . . . . . . . . . . . . . . . . . . . . . . . . . . . . . . . . . . . . . . . . . . . . . . . . . . . . . . . . . . . .237
Appendix A: Audit Follow-up Actions . . . . . . . . . . . . . . . . . . . . . . . . . . . . . . . . . . . . . . . . . . . . . A-1
Appendix B: FY 2005 Performance Improvement Plan Follow-up . . . . . . . . . . . . . . . . . . . . . . .B-1
Appendix C: OMB Program Assessment Rating Tool (PART) Recommendations . . . . . . . . . . . .C-1
Appendix D: Source Information . . . . . . . . . . . . . . . . . . . . . . . . . . . . . . . . . . . . . . . . . . . . . . . .D-1

vi NASA FY 2006 PERFORMANCE AND ACCOUNTABILITY REPORT
Part
1: M
anag
emen
t Disc
ussio
n & A
nalys
is
Previous page: A fi sh-eye-view lens curves the fi xed service structure toward Space Shuttle Atlantis as it blasts off Launch Pad 39B, propelled by columns of fi re from the solid rocket boosters. At the lower left is the White Room that, when ex-tended, gave the mission crew access to the Shuttle. After lift-off, Atlantis headed for rendezvous with the International Space Station (ISS) on mission STS-115. Mission STS-115 was the 116th Space Shuttle fl ight, the 27th fl ight for Atlantis, and the 19th fl ight to the ISS. (NASA)
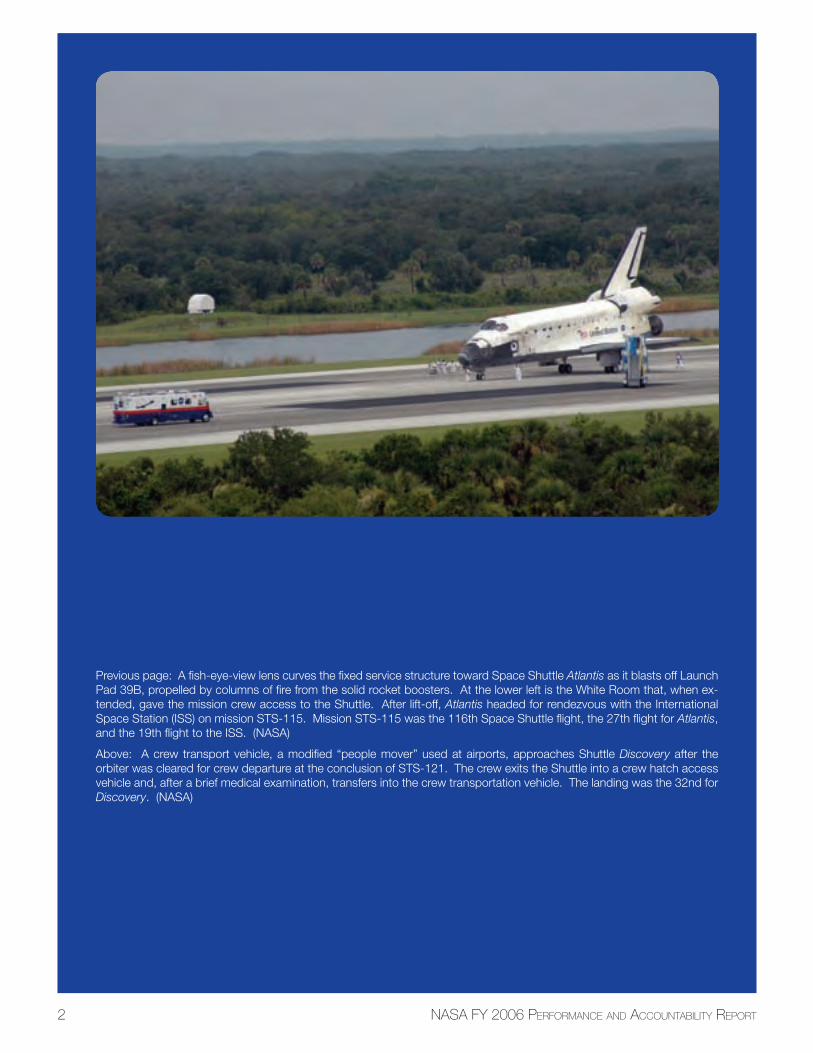
Above: A crew transport vehicle, a modifi ed “people mover” used at airports, approaches Shuttle Discovery after the orbiter was cleared for crew departure at the conclusion of STS-121. The crew exits the Shuttle into a crew hatch access vehicle and, after a brief medical examination, transfers into the crew transportation vehicle. The landing was the 32nd for Discovery. (NASA)
2 NASA FY 2006 PERFORMANCE AND ACCOUNTABILITY REPORT
PART 1 • MANAGEMENT DISCUSSION & ANALYSIS 3
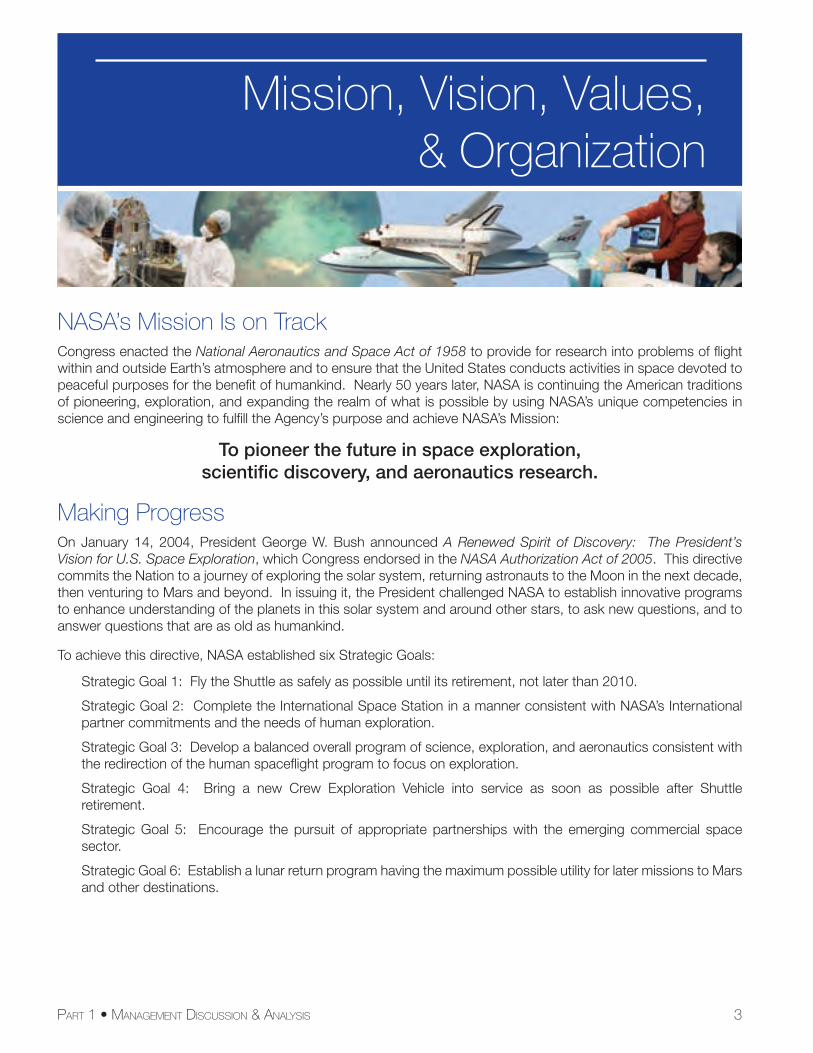
NASA’s Mission Is on TrackCongress enacted the National Aeronautics and Space Act of 1958 to provide for research into problems of fl ight within and outside Earth’s atmosphere and to ensure that the United States conducts activities in space devoted to peaceful purposes for the benefi t of humankind. Nearly 50 years later, NASA is continuing the American traditions of pioneering, exploration, and expanding the realm of what is possible by using NASA’s unique competencies in science and engineering to fulfi ll the Agency’s purpose and achieve NASA’s Mission:
To pioneer the future in space exploration,scientifi c discovery, and aeronautics research.
Making ProgressOn January 14, 2004, President George W. Bush announced A Renewed Spirit of Discovery: The President’s Vision for U.S. Space Exploration, which Congress endorsed in the NASA Authorization Act of 2005. This directive commits the Nation to a journey of exploring the solar system, returning astronauts to the Moon in the next decade, then venturing to Mars and beyond. In issuing it, the President challenged NASA to establish innovative programs to enhance understanding of the planets in this solar system and around other stars, to ask new questions, and to answer questions that are as old as humankind.
To achieve this directive, NASA established six Strategic Goals:
Strategic Goal 1: Fly the Shuttle as safely as possible until its retirement, not later than 2010.
Strategic Goal 2: Complete the International Space Station in a manner consistent with NASA’s International partner commitments and the needs of human exploration.
Strategic Goal 3: Develop a balanced overall program of science, exploration, and aeronautics consistent with the redirection of the human spacefl ight program to focus on exploration.
Strategic Goal 4: Bring a new Crew Exploration Vehicle into service as soon as possible after Shuttle retirement.
Strategic Goal 5: Encourage the pursuit of appropriate partnerships with the emerging commercial space sector.
Strategic Goal 6: Establish a lunar return program having the maximum possible utility for later missions to Mars and other destinations.
Mission, Vision, Values,& Organization
4 NASA FY 2006 PERFORMANCE AND ACCOUNTABILITY REPORT
NASA’s ValuesThe Agency’s four shared core values support NASA’s commitment to technical excellence and express the ethics that guide the Agency’s behavior. These values are the underpinnings of NASA’s spirit and resolve.
• Safety: NASA’s constant attention to safety is the cornerstone upon which NASA builds mission success. NASA employees are committed, individually and as a team, to protecting the safety and health of the public, NASA team members, and the assets that the Nation entrusts to the Agency.
• Teamwork: NASA’s most powerful tool for achieving mission success is the Agency’s highly skilled, multi-disci-plinary workforce. NASA’s success is built on high-performing teams that are committed to continuous learning, trust, and openness to innovation and new ideas.
• Integrity: NASA is committed to maintaining an environment of trust built upon honesty, ethical behavior, respect, and candor. Building trust through ethical conduct as individuals and as an organization is a necessary component of mission success.
• Mission Success: NASA’s purpose is to carry out space exploration, scientifi c discovery, and aeronautics research on behalf of the Nation. Every NASA employee believes that mission success is the natural conse-quence of an uncompromising commitment to technical excellence, safety, teamwork, and integrity.
NASA’s OrganizationNASA is comprised of NASA Headquarters in Washington, D.C., nine Centers located around the country, and the Jet Propulsion Laboratory, a Federally Funded Research and Development Center operated under a contract with the California Institute of Technology. In addition, NASA partners with academia, the private sector, state and local governments, other federal agencies, and a number of international organizations to create an extended NASA fam-ily of civil servants, allied partners, and stakeholders. Together, this skilled, diverse group of scientists, engineers, managers, and support personnel share the Mission, Vision, and Values that are NASA.
NASA HeadquartersTo achieve NASA’s Mission and the Vision for Space Exploration, NASA Headquarters is organized into four Mission Directorates:
• The Aeronautics Research Mission Directorate conducts fundamental research in aeronautical disciplines and develops capabilities, tools, and technologies that will enhance signifi cantly aircraft performance, envi-ronmental compatibility, and safety, as well as the capacity, fl exibility, and safety of the future air transportation system.
• The Science Mission Directorate conducts the scientifi c exploration of Earth, the Sun, the rest of the solar system, and the universe. Large, strategic missions are complemented by smaller, Principal Investigator-led missions, including ground-, air-, and space-based observatories, deep-space automated spacecraft, and plan-etary orbiters, landers, and surface rovers. This Directorate also develops increasingly refi ned instrumentation, spacecraft, and robotic techniques in pursuit of NASA’s science goals.
• The Exploration Systems Mission Directorate develops systems and supports research and technology development to enable sustained and affordable human and robotic space exploration. This Directorate will develop the robotic precursor missions, human transportation elements, and life support systems for the near-term goal of lunar exploration.
• The Space Operations Mission Directorate directs spacefl ight operations, space launches, and space com-munications and manages the operation of integrated systems in low Earth orbit and beyond, including the International Space Station. This Directorate also is laying the foundation for future missions to the Moon and Mars by using the International Space Station as an orbital outpost where astronauts can gather vital information that will enable safer and more capable systems for human explorers.
5PART 1 • MANAGEMENT DISCUSSION & ANALYSIS
Mission, Vision, Values, & Organization
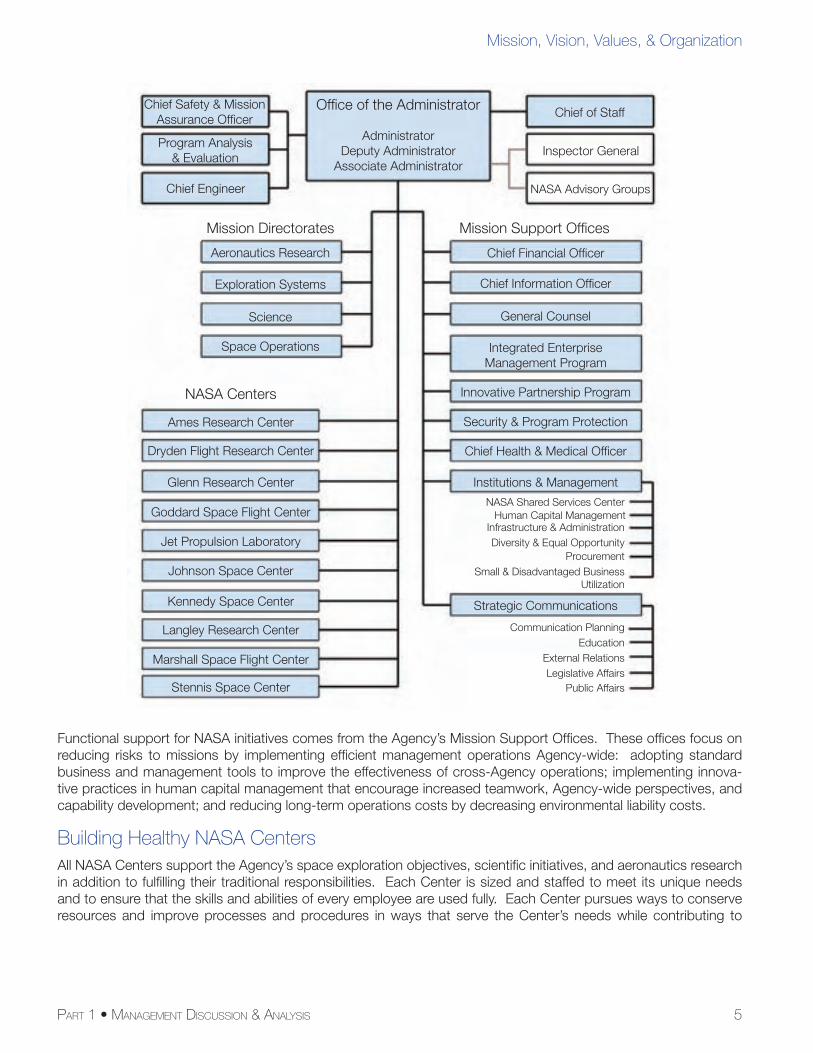
Functional support for NASA initiatives comes from the Agency’s Mission Support Offi ces. These offi ces focus on reducing risks to missions by implementing effi cient management operations Agency-wide: adopting standard business and management tools to improve the effectiveness of cross-Agency operations; implementing innova-tive practices in human capital management that encourage increased teamwork, Agency-wide perspectives, and capability development; and reducing long-term operations costs by decreasing environmental liability costs.
Building Healthy NASA CentersAll NASA Centers support the Agency’s space exploration objectives, scientifi c initiatives, and aeronautics research in addition to fulfi lling their traditional responsibilities. Each Center is sized and staffed to meet its unique needs and to ensure that the skills and abilities of every employee are used fully. Each Center pursues ways to conserve resources and improve processes and procedures in ways that serve the Center’s needs while contributing to
Offi ce of the Administrator
AdministratorDeputy Administrator
Associate Administrator
Chief of Staff
Inspector General
NASA Advisory Groups
Chief Safety & MissionAssurance Offi cer
Program Analysis& Evaluation
Chief Engineer
Mission Directorates Mission Support Offi ces
NASA Centers
Aeronautics Research
Exploration Systems
Science
Space Operations
Chief Financial Offi cer
Chief Information Offi cer
General Counsel
Integrated EnterpriseManagement Program
Innovative Partnership Program
Security & Program Protection
Chief Health & Medical Offi cer
Institutions & Management
Strategic Communications
Ames Research Center
Dryden Flight Research Center
Glenn Research Center
Goddard Space Flight Center
Jet Propulsion Laboratory
Johnson Space Center
Kennedy Space Center
Langley Research Center
Marshall Space Flight Center
Stennis Space Center
NASA Shared Services Center
Communication Planning
Human Capital ManagementInfrastructure & AdministrationDiversity & Equal Opportunity
ProcurementSmall & Disadvantaged Business
Utilization
EducationExternal RelationsLegislative Affairs
Public Affairs
6 NASA FY 2006 PERFORMANCE AND ACCOUNTABILITY REPORT
achieving NASA’s Mission. And, all Centers must undertake initiatives to demonstrate the attributes of strong, healthy, productive Centers identifi ed by NASA’s Strategic Management Council:
• Clear, stable, and enduring roles and responsibilities;
• Clear program/project management leadership roles;
• Major in-house, durable spacefl ight responsibility;
• Skilled, fl exible, blended workforce with suffi cient depth and breadth to meet NASA’s challenges;
• Technically competent and value-centered leadership;
• Capable and effectively utilized infrastructure; and
• Strong stakeholder support.
PART 1 • MANAGEMENT DISCUSSION & ANALYSIS 7
Establishing Government Performance and Results Act (GPRA) Performance MeasuresIn February, NASA issued the 2006 NASA Strategic Plan refl ecting the Agency’s focus on achieving the Vision for Space Exploration through six Strategic Goals. At the same time, NASA updated the Agency’s FY 2006 Performance Plan to include multi-year and annual performance metrics that NASA is pursuing in support of the new Strategic Goals.
The resulting FY 2006 Performance Plan Update also demonstrated the latest efforts toward improving the Agency’s performance measurement process. NASA reduced the number of multi-year Outcomes from 78 to 37 and, by eliminating redundancies, cut the number of Annual Performance Goals (APGs) from 210 to 165. NASA also began revising the Agency’s multi-year Outcomes and APGs to make them more measurable and traceable over given periods of performance and to ensure that they provide relevant and useful performance information to NASA’s decision-makers, the White House, Congress, and other stakeholders.
NASA, like all research and development agencies, faces challenges in measuring and reporting annual perfor-mance progress against long-term Strategic Goals. NASA’s space exploration, science, and aeronautics focus often yields unpredictable discoveries or technological breakthroughs that can enhance or impede progress in the short-term and impact the Agency’s long-term goals. In fact, NASA may appear to take a step back in perfor-mance progress one year only to make greater progress the following year. NASA will continue to work toward improved performance measurements and reports in subsequent years should show increasing improvement.
Rating NASA’s PerformanceNASA managers calculate annually Outcome and APG performance ratings based on a number of factors, includ-ing internal and external assessments. Internally, program managers, analysts from the Offi ce of Program Analysis and Evaluation, and review committees monitor and analyze each program’s adherence to budgets, schedules, and key milestones. External advisors, like the NASA Advisory Council, the National Research Council, and the Aerospace Safety Advisory Panel, assess program content and direction. Also, experts from the science commu-nity, coordinated by the Science Mission Directorate, review NASA’s progress toward meeting performance metrics under Strategic Goal 3 (Sub-goals 3A through 3D). After weighing the input from all these reviews, NASA program managers determine a program’s progress toward achieving its multi-year and annual performance metrics.
In FY 2006, as part of NASA’s commitment to improving the Agency’s performance measurement and evalua-tion system, NASA analysts created PARWeb to simplify the process of collecting performance data. PARWeb provides a centralized, Web-based location for all performance ratings, narrative descriptions of performance prog-ress and challenges, explanations of performance shortfalls, and source data to support assigned ratings. PARWeb also lays the foundation for improving NASA’s ability to track historical trends for multi-year Outcomes and APGs.
Measuring NASA’s Performance
8 NASA FY 2006 PERFORMANCE AND ACCOUNTABILITY REPORT
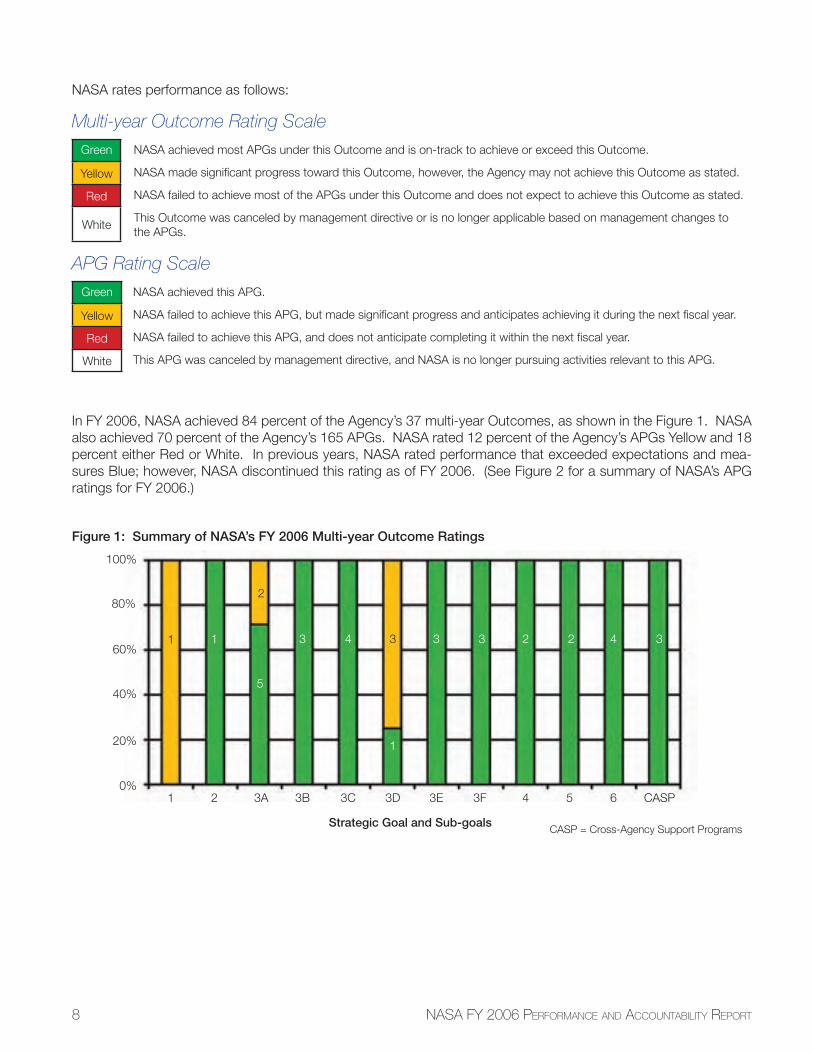
NASA rates performance as follows:
Multi-year Outcome Rating ScaleGreen NASA achieved most APGs under this Outcome and is on-track to achieve or exceed this Outcome.
Yellow NASA made signifi cant progress toward this Outcome, however, the Agency may not achieve this Outcome as stated.
Red NASA failed to achieve most of the APGs under this Outcome and does not expect to achieve this Outcome as stated.
WhiteThis Outcome was canceled by management directive or is no longer applicable based on management changes to the APGs.
APG Rating ScaleGreen NASA achieved this APG.
Yellow NASA failed to achieve this APG, but made signifi cant progress and anticipates achieving it during the next fi scal year.
Red NASA failed to achieve this APG, and does not anticipate completing it within the next fi scal year.
White This APG was canceled by management directive, and NASA is no longer pursuing activities relevant to this APG.
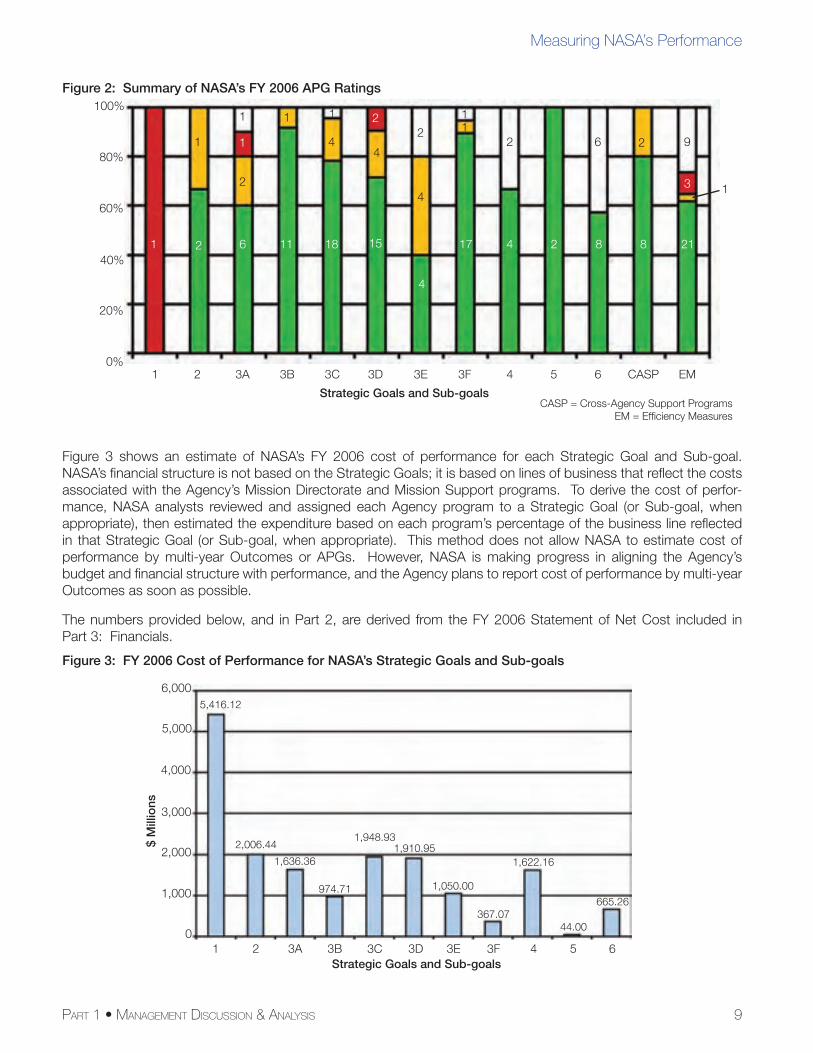
In FY 2006, NASA achieved 84 percent of the Agency’s 37 multi-year Outcomes, as shown in the Figure 1. NASA also achieved 70 percent of the Agency’s 165 APGs. NASA rated 12 percent of the Agency’s APGs Yellow and 18 percent either Red or White. In previous years, NASA rated performance that exceeded expectations and mea-sures Blue; however, NASA discontinued this rating as of FY 2006. (See Figure 2 for a summary of NASA’s APG ratings for FY 2006.)
100%
80%
60%
40%
0%
20%
1 2 3A 3B 3C 3D 3E 3F 4 5 6 CASP
CASP = Cross-Agency Support Programs
1 1
2
5
3 4
1
3 3 2 2 4 33
Strategic Goal and Sub-goals
Figure 1: Summary of NASA’s FY 2006 Multi-year Outcome Ratings
9PART 1 • MANAGEMENT DISCUSSION & ANALYSIS
Measuring NASA’s Performance
Figure 3 shows an estimate of NASA’s FY 2006 cost of performance for each Strategic Goal and Sub-goal. NASA’s fi nancial structure is not based on the Strategic Goals; it is based on lines of business that refl ect the costs associated with the Agency’s Mission Directorate and Mission Support programs. To derive the cost of perfor-mance, NASA analysts reviewed and assigned each Agency program to a Strategic Goal (or Sub-goal, when appropriate), then estimated the expenditure based on each program’s percentage of the business line refl ected in that Strategic Goal (or Sub-goal, when appropriate). This method does not allow NASA to estimate cost of performance by multi-year Outcomes or APGs. However, NASA is making progress in aligning the Agency’s budget and fi nancial structure with performance, and the Agency plans to report cost of performance by multi-year Outcomes as soon as possible.
The numbers provided below, and in Part 2, are derived from the FY 2006 Statement of Net Cost included in Part 3: Financials.
Figure 2: Summary of NASA’s FY 2006 APG Ratings100%
80%
60%
40%
20%
0%1 2 3A 3B 3C 3D 3E 3F 4 5 6 CASP EM
Strategic Goals and Sub-goalsCASP = Cross-Agency Support Programs
EM = Effi ciency Measures
1 2 6
1
11 18 15
2
4
17 4 2 8 8 21
3
1
2
1 1
4
1
4
4
2 11
2 6 2 9
1
Strategic Goals and Sub-goals
$ M
illio
ns
6,000
5,000
4,000
3,000
2,000
1,000
01 2 3A 3B 3C 3D 3E 3F 4 5 6
5,416.12
2,006.44
1,636.36
974.71
1,948.931,910.95
1,050.00
367.07
1,622.16
665.26
44.00
Figure 3: FY 2006 Cost of Performance for NASA’s Strategic Goals and Sub-goals
10 NASA FY 2006 PERFORMANCE AND ACCOUNTABILITY REPORT
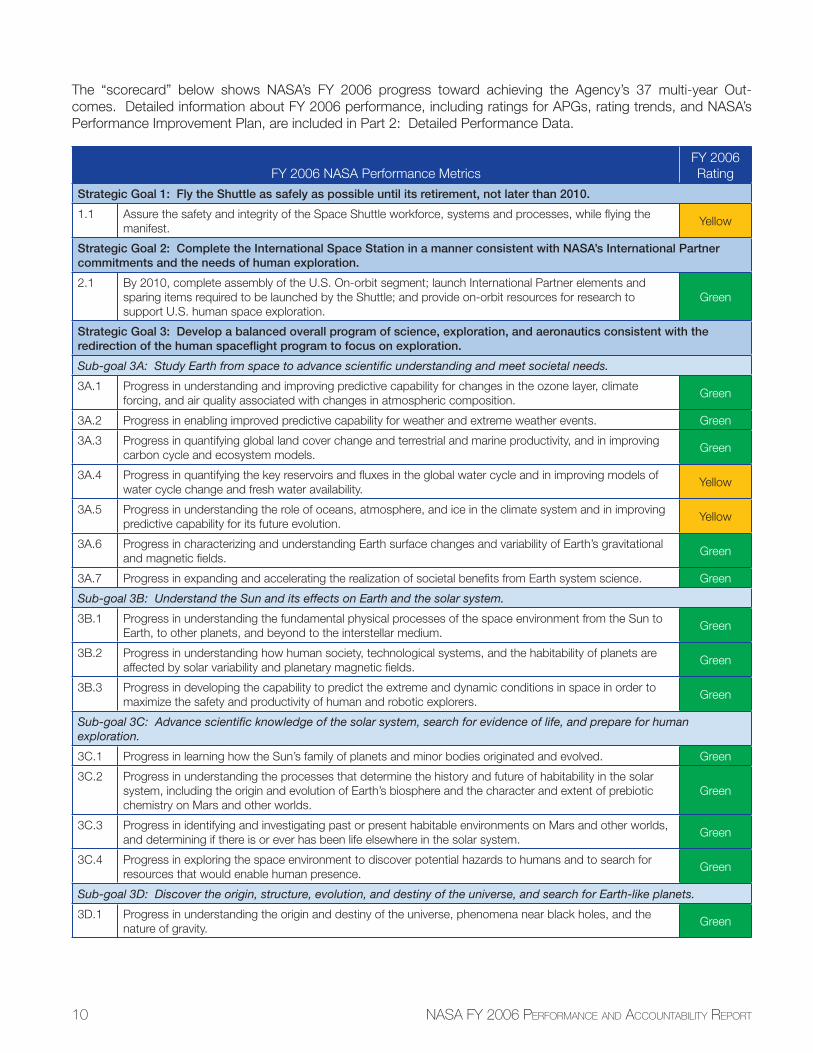
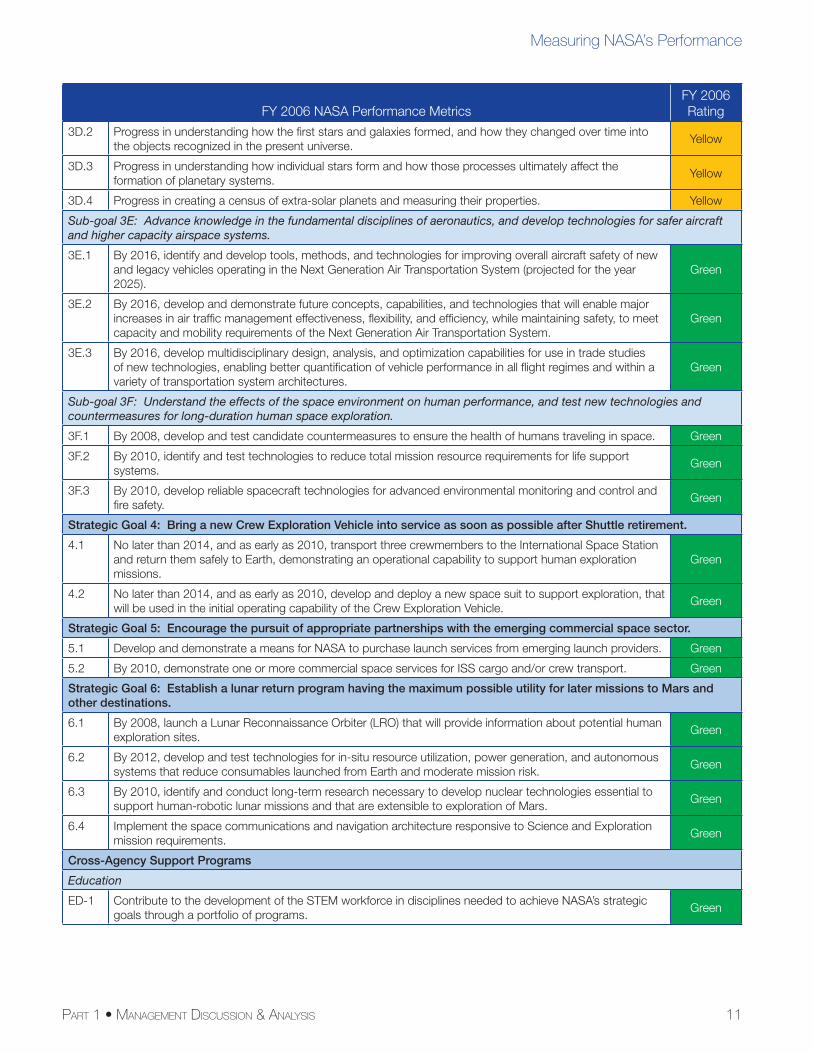
The “scorecard” below shows NASA’s FY 2006 progress toward achieving the Agency’s 37 multi-year Out-comes. Detailed information about FY 2006 performance, including ratings for APGs, rating trends, and NASA’s Performance Improvement Plan, are included in Part 2: Detailed Performance Data.
FY 2006 NASA Performance MetricsFY 2006Rating
Strategic Goal 1: Fly the Shuttle as safely as possible until its retirement, not later than 2010.
1.1 Assure the safety and integrity of the Space Shuttle workforce, systems and processes, while fl ying the manifest.
Yellow
Strategic Goal 2: Complete the International Space Station in a manner consistent with NASA’s International Partner commitments and the needs of human exploration.
2.1 By 2010, complete assembly of the U.S. On-orbit segment; launch International Partner elements and sparing items required to be launched by the Shuttle; and provide on-orbit resources for research to support U.S. human space exploration.
Green
Strategic Goal 3: Develop a balanced overall program of science, exploration, and aeronautics consistent with the redirection of the human spacefl ight program to focus on exploration.
Sub-goal 3A: Study Earth from space to advance scientifi c understanding and meet societal needs.
3A.1 Progress in understanding and improving predictive capability for changes in the ozone layer, climate forcing, and air quality associated with changes in atmospheric composition.
Green
3A.2 Progress in enabling improved predictive capability for weather and extreme weather events. Green
3A.3 Progress in quantifying global land cover change and terrestrial and marine productivity, and in improving carbon cycle and ecosystem models.
Green
3A.4 Progress in quantifying the key reservoirs and fl uxes in the global water cycle and in improving models of water cycle change and fresh water availability.
Yellow
3A.5 Progress in understanding the role of oceans, atmosphere, and ice in the climate system and in improving predictive capability for its future evolution.
Yellow
3A.6 Progress in characterizing and understanding Earth surface changes and variability of Earth’s gravitational and magnetic fi elds.
Green
3A.7 Progress in expanding and accelerating the realization of societal benefi ts from Earth system science. Green
Sub-goal 3B: Understand the Sun and its effects on Earth and the solar system.
3B.1 Progress in understanding the fundamental physical processes of the space environment from the Sun to Earth, to other planets, and beyond to the interstellar medium.
Green
3B.2 Progress in understanding how human society, technological systems, and the habitability of planets are affected by solar variability and planetary magnetic fi elds.
Green
3B.3 Progress in developing the capability to predict the extreme and dynamic conditions in space in order to maximize the safety and productivity of human and robotic explorers.
Green
Sub-goal 3C: Advance scientifi c knowledge of the solar system, search for evidence of life, and prepare for human exploration.
3C.1 Progress in learning how the Sun’s family of planets and minor bodies originated and evolved. Green
3C.2 Progress in understanding the processes that determine the history and future of habitability in the solar system, including the origin and evolution of Earth’s biosphere and the character and extent of prebiotic chemistry on Mars and other worlds.
Green
3C.3 Progress in identifying and investigating past or present habitable environments on Mars and other worlds, and determining if there is or ever has been life elsewhere in the solar system.
Green
3C.4 Progress in exploring the space environment to discover potential hazards to humans and to search for resources that would enable human presence.
Green
Sub-goal 3D: Discover the origin, structure, evolution, and destiny of the universe, and search for Earth-like planets.
3D.1 Progress in understanding the origin and destiny of the universe, phenomena near black holes, and the nature of gravity.
Green
11PART 1 • MANAGEMENT DISCUSSION & ANALYSIS
Measuring NASA’s Performance
FY 2006 NASA Performance MetricsFY 2006Rating
3D.2 Progress in understanding how the fi rst stars and galaxies formed, and how they changed over time into the objects recognized in the present universe.
Yellow
3D.3 Progress in understanding how individual stars form and how those processes ultimately affect the formation of planetary systems.
Yellow
3D.4 Progress in creating a census of extra-solar planets and measuring their properties. Yellow
Sub-goal 3E: Advance knowledge in the fundamental disciplines of aeronautics, and develop technologies for safer aircraft and higher capacity airspace systems.
3E.1 By 2016, identify and develop tools, methods, and technologies for improving overall aircraft safety of new and legacy vehicles operating in the Next Generation Air Transportation System (projected for the year 2025).
Green
3E.2 By 2016, develop and demonstrate future concepts, capabilities, and technologies that will enable major increases in air traffi c management effectiveness, fl exibility, and effi ciency, while maintaining safety, to meet capacity and mobility requirements of the Next Generation Air Transportation System.
Green
3E.3 By 2016, develop multidisciplinary design, analysis, and optimization capabilities for use in trade studies of new technologies, enabling better quantifi cation of vehicle performance in all fl ight regimes and within a variety of transportation system architectures.
Green
Sub-goal 3F: Understand the effects of the space environment on human performance, and test new technologies and countermeasures for long-duration human space exploration.
3F.1 By 2008, develop and test candidate countermeasures to ensure the health of humans traveling in space. Green
3F.2 By 2010, identify and test technologies to reduce total mission resource requirements for life support systems.
Green
3F.3 By 2010, develop reliable spacecraft technologies for advanced environmental monitoring and control and fi re safety.
Green
Strategic Goal 4: Bring a new Crew Exploration Vehicle into service as soon as possible after Shuttle retirement.
4.1 No later than 2014, and as early as 2010, transport three crewmembers to the International Space Station and return them safely to Earth, demonstrating an operational capability to support human exploration missions.
Green
4.2 No later than 2014, and as early as 2010, develop and deploy a new space suit to support exploration, that will be used in the initial operating capability of the Crew Exploration Vehicle.
Green
Strategic Goal 5: Encourage the pursuit of appropriate partnerships with the emerging commercial space sector.
5.1 Develop and demonstrate a means for NASA to purchase launch services from emerging launch providers. Green
5.2 By 2010, demonstrate one or more commercial space services for ISS cargo and/or crew transport. Green
Strategic Goal 6: Establish a lunar return program having the maximum possible utility for later missions to Mars and other destinations.
6.1 By 2008, launch a Lunar Reconnaissance Orbiter (LRO) that will provide information about potential human exploration sites.
Green
6.2 By 2012, develop and test technologies for in-situ resource utilization, power generation, and autonomous systems that reduce consumables launched from Earth and moderate mission risk.
Green
6.3 By 2010, identify and conduct long-term research necessary to develop nuclear technologies essential to support human-robotic lunar missions and that are extensible to exploration of Mars.
Green
6.4 Implement the space communications and navigation architecture responsive to Science and Exploration mission requirements.
Green
Cross-Agency Support Programs
Education
ED-1 Contribute to the development of the STEM workforce in disciplines needed to achieve NASA’s strategic goals through a portfolio of programs.
Green
12 NASA FY 2006 PERFORMANCE AND ACCOUNTABILITY REPORT
FY 2006 NASA Performance MetricsFY 2006Rating
Advanced Business Systems (Integrated Enterprise Management Program)
IEM-2 Increase effi ciency by implementing new business systems and reengineering Agency business processes. Green
Innovative Partnerships Program
IPP-1 Promote and develop innovative technology partnerships among NASA, U.S. industry, and other sectors for the benefi t of Agency programs and projects.
Green
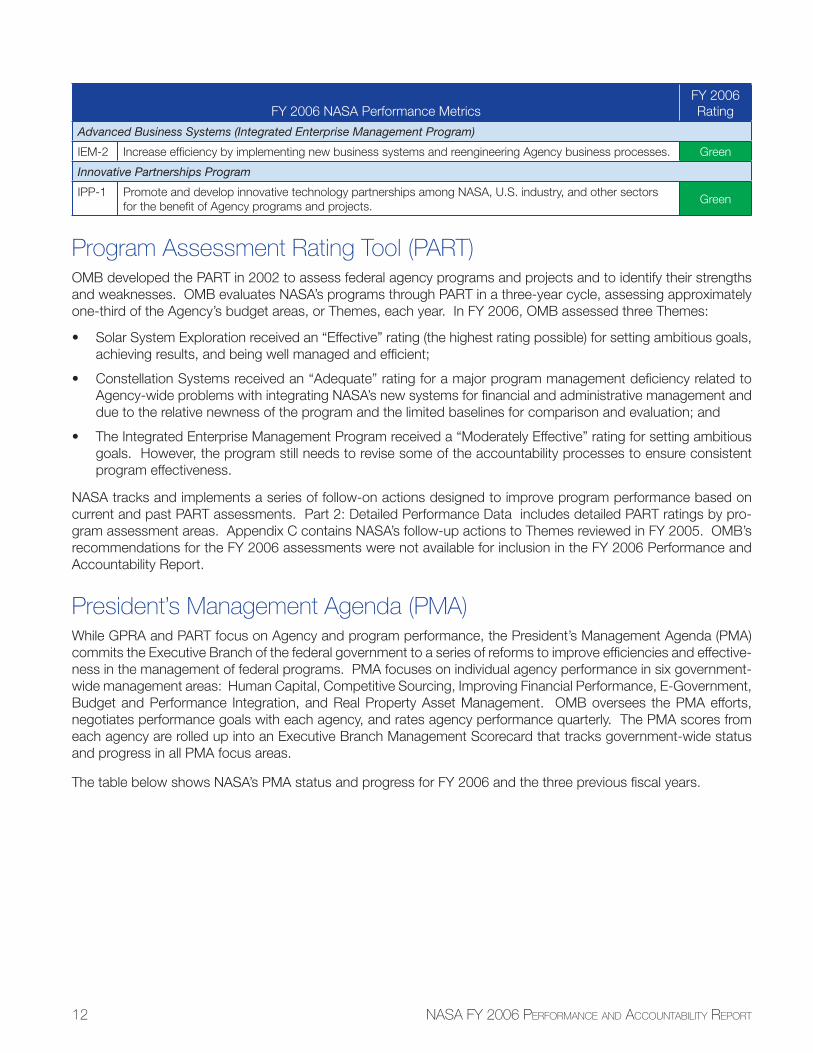
Program Assessment Rating Tool (PART)OMB developed the PART in 2002 to assess federal agency programs and projects and to identify their strengths and weaknesses. OMB evaluates NASA’s programs through PART in a three-year cycle, assessing approximately one-third of the Agency’s budget areas, or Themes, each year. In FY 2006, OMB assessed three Themes:
• Solar System Exploration received an “Effective” rating (the highest rating possible) for setting ambitious goals, achieving results, and being well managed and effi cient;
• Constellation Systems received an “Adequate” rating for a major program management defi ciency related to Agency-wide problems with integrating NASA’s new systems for fi nancial and administrative management and due to the relative newness of the program and the limited baselines for comparison and evaluation; and
• The Integrated Enterprise Management Program received a “Moderately Effective” rating for setting ambitious goals. However, the program still needs to revise some of the accountability processes to ensure consistent program effectiveness.
NASA tracks and implements a series of follow-on actions designed to improve program performance based on current and past PART assessments. Part 2: Detailed Performance Data includes detailed PART ratings by pro-gram assessment areas. Appendix C contains NASA’s follow-up actions to Themes reviewed in FY 2005. OMB’s recommendations for the FY 2006 assessments were not available for inclusion in the FY 2006 Performance and Accountability Report.
President’s Management Agenda (PMA)While GPRA and PART focus on Agency and program performance, the President’s Management Agenda (PMA) commits the Executive Branch of the federal government to a series of reforms to improve effi ciencies and effective-ness in the management of federal programs. PMA focuses on individual agency performance in six government-wide management areas: Human Capital, Competitive Sourcing, Improving Financial Performance, E-Government, Budget and Performance Integration, and Real Property Asset Management. OMB oversees the PMA efforts, negotiates performance goals with each agency, and rates agency performance quarterly. The PMA scores from each agency are rolled up into an Executive Branch Management Scorecard that tracks government-wide status and progress in all PMA focus areas.
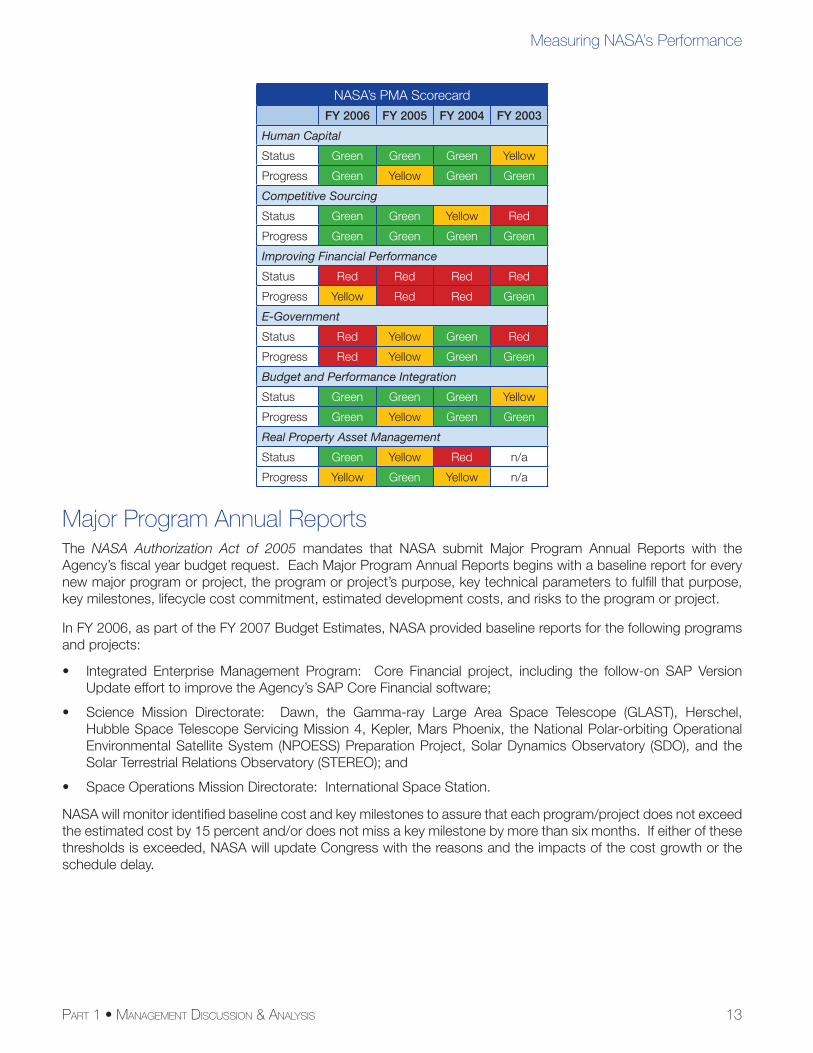
The table below shows NASA’s PMA status and progress for FY 2006 and the three previous fi scal years.
13PART 1 • MANAGEMENT DISCUSSION & ANALYSIS
Measuring NASA’s Performance
NASA’s PMA Scorecard
FY 2006 FY 2005 FY 2004 FY 2003
Human Capital
Status Green Green Green Yellow
Progress Green Yellow Green Green
Competitive Sourcing
Status Green Green Yellow Red
Progress Green Green Green Green
Improving Financial Performance
Status Red Red Red Red
Progress Yellow Red Red Green
E-Government
Status Red Yellow Green Red
Progress Red Yellow Green Green
Budget and Performance Integration
Status Green Green Green Yellow
Progress Green Yellow Green Green
Real Property Asset Management
Status Green Yellow Red n/a
Progress Yellow Green Yellow n/a
Major Program Annual ReportsThe NASA Authorization Act of 2005 mandates that NASA submit Major Program Annual Reports with the Agency’s fi scal year budget request. Each Major Program Annual Reports begins with a baseline report for every new major program or project, the program or project’s purpose, key technical parameters to fulfi ll that purpose, key milestones, lifecycle cost commitment, estimated development costs, and risks to the program or project.
In FY 2006, as part of the FY 2007 Budget Estimates, NASA provided baseline reports for the following programs and projects:
• Integrated Enterprise Management Program: Core Financial project, including the follow-on SAP Version Update effort to improve the Agency’s SAP Core Financial software;
• Science Mission Directorate: Dawn, the Gamma-ray Large Area Space Telescope (GLAST), Herschel, Hubble Space Telescope Servicing Mission 4, Kepler, Mars Phoenix, the National Polar-orbiting Operational Environmental Satellite System (NPOESS) Preparation Project, Solar Dynamics Observatory (SDO), and the Solar Terrestrial Relations Observatory (STEREO); and
• Space Operations Mission Directorate: International Space Station.
NASA will monitor identifi ed baseline cost and key milestones to assure that each program/project does not exceed the estimated cost by 15 percent and/or does not miss a key milestone by more than six months. If either of these thresholds is exceeded, NASA will update Congress with the reasons and the impacts of the cost growth or the schedule delay.

14 NASA FY 2006 PERFORMANCE AND ACCOUNTABILITY REPORT
PART 1 • MANAGEMENT DISCUSSION & ANALYSIS 15
Progress Toward Achieving NASA’s Strategic GoalsA Guide to Performance OverviewsThe following Performance Overviews describe NASA’s Strategic Goals and Sub-goals. The discussions include performance achievement highlights and challenges in FY 2006.
Introduction and Reaping Benefi tsThe introduction provides a general overview of the Strategic Goal or Sub-goal and explains NASA’s rationale for pursuing each. The benefi ts section discusses how each Strategic Goal or Sub-goal serves the public, the Nation, the Vision for Space Exploration, and NASA’s Mission.
In the upper right corner is a box displaying the cost of performance for the Strategic Goal or Sub-goal and the responsible Mission Directorate. (Note: The cost of performance is an estimate based on NASA’s FY 2006 Statement of Net Cost included in Part 3: Financials. This estimate does not include cost obligations deferred to subsequent fi scal years. A description of how NASA obtains the cost of performance is included in Measuring NASA’s Performance.)
Highlighting AchievementsThis section highlights the top performance successes during the fi scal year. It also identifi es management issues, such as reorganizations, that enabled the Agency to achieve these successes.
Confronting ChallengesThis section highlights the major challenges NASA faced during FY 2006 and plans to mitigate or overcome the challenges.
Moving ForwardThis section describes activities planned for the next few years that will contribute to the successful achievement of each Strategic Goal or Sub-goal. It also addresses the obstacles that NASA may have to overcome in the near future to achieve the Vision.
Performance Overview
16 NASA FY 2006 PERFORMANCE AND ACCOUNTABILITY REPORT
Strategic Goal 1: Fly the Shuttle as safely as possible until its retirement, not later than 2010.The Space Shuttle has supported NASA’s Mission for over 25 years, car-rying crews and cargo to low Earth orbit, performing repair, recovery, and maintenance missions on orbiting satellites, providing a platform for conduct-ing science experiments, and supporting construction of the International Space Station (ISS). NASA will retire the Shuttle fl eet by 2010. Until then, the Agency will demonstrate NASA’s most critical value—safety—by promoting engineering excellence, maintaining realistic fl ight schedules, and fostering internal forums where mission risks and benefi ts can be discussed and analyzed freely.
Reaping Benefi tsThe Shuttle is recognized around the world as a symbol of America’s space program and the Nation’s commitment to space exploration. NASA’s Space Shuttle Program, and the Shuttle itself, have inspired generations of school-children to pursue dreams and careers in science, technology, engineering, and mathematics. The Space Shuttle Program also provides direct benefi ts to the Nation by advancing national security and economic interests in space and spurring technology development in critical areas such as navigation, computing, materials, and communica-tions. Furthermore, due to its heavy-lift capacity, the Shuttle is the only vehicle capable of completing assembly of the ISS in a manner consistent with NASA’s international partnership commitments and exploration research needs. The remaining Shuttle fl ights will be dedicated to ISS construction and a Hubble Space Telescope service mission.
A primary public benefi t of retiring the Shuttle is to redirect resources toward new programs, such as the Orion Crew Exploration Vehicle and the Ares launch vehicles, needed to carry out the Vision. NASA will use the knowl-edge and assets developed over nearly three decades of Shuttle operations to build a new generation of vehicles designed for missions beyond low Earth orbit. When NASA retires the Shuttle, the Agency will direct Shuttle per-sonnel, assets, and knowledge toward the development and support of new hardware and technologies necessary to achieve the Vision. For the American public, this means continuity in our access to space and sustained U.S. leadership in technology development and civilian space exploration.
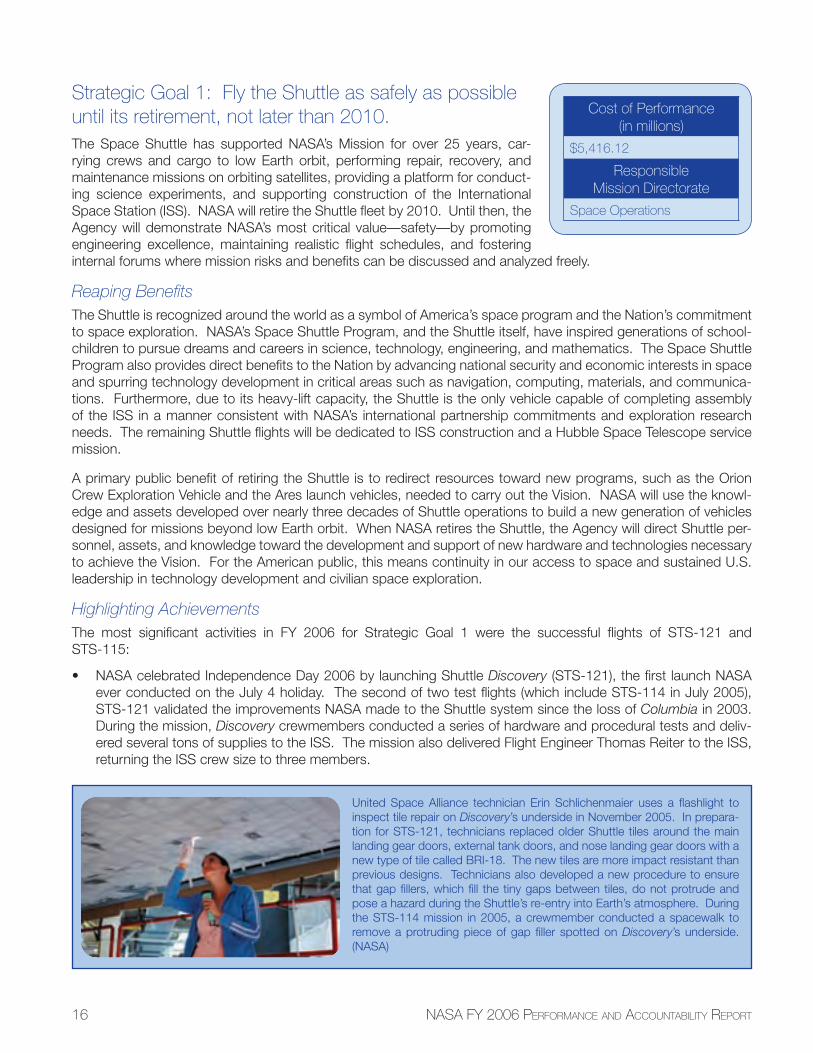
Highlighting AchievementsThe most signifi cant activities in FY 2006 for Strategic Goal 1 were the successful fl ights of STS-121 and STS-115:
• NASA celebrated Independence Day 2006 by launching Shuttle Discovery (STS-121), the fi rst launch NASA ever conducted on the July 4 holiday. The second of two test fl ights (which include STS-114 in July 2005), STS-121 validated the improvements NASA made to the Shuttle system since the loss of Columbia in 2003. During the mission, Discovery crewmembers conducted a series of hardware and procedural tests and deliv-ered several tons of supplies to the ISS. The mission also delivered Flight Engineer Thomas Reiter to the ISS, returning the ISS crew size to three members.
Cost of Performance(in millions)
$5,416.12
ResponsibleMission Directorate
Space Operations
United Space Alliance technician Erin Schlichenmaier uses a fl ashlight to inspect tile repair on Discovery’s underside in November 2005. In prepara-tion for STS-121, technicians replaced older Shuttle tiles around the main landing gear doors, external tank doors, and nose landing gear doors with a new type of tile called BRI-18. The new tiles are more impact resistant than previous designs. Technicians also developed a new procedure to ensure that gap fi llers, which fi ll the tiny gaps between tiles, do not protrude and pose a hazard during the Shuttle’s re-entry into Earth’s atmosphere. During the STS-114 mission in 2005, a crewmember conducted a spacewalk to remove a protruding piece of gap fi ller spotted on Discovery’s underside. (NASA)
17PART 1 • MANAGEMENT DISCUSSION & ANALYSIS
Performance Overview
• Atlantis (STS-115) launched on September 9, marked a return to sustained Shuttle operations, placing NASA on track to complete assembly of the ISS by Shuttle retirement in 2010. Atlantis delivered to the ISS the P3/P4 truss, which will provide a quarter of the power, data, and communications services needed to operate the completed ISS. During the mission, Atlantis crewmembers conducted spacewalks—the most complex ever conducted—to attach the truss and the Solar Alpha Rotary Joint, a wagon wheel-shaped joint that allows the solar arrays attached to the truss to turn toward the Sun.
Confronting ChallengesThe Space Shuttle Program faces two main challenges. First, NASA must maintain the skilled workforce and criti-cal assets needed to safely complete the Shuttle manifest. Second, NASA must manage the process of identifying, transitioning, and dispositioning the resources that support the Shuttle in anticipation of the Shuttle’s retirement.
The Shuttle transition and phase-out effort will be complex and challenging, especially since it will happen at the same time as the Shuttle is set to carry out the most complicated sequence of fl ights ever attempted. Over the next four years, the Shuttle will carry tons of hardware to the ISS, where astronauts and cosmonauts will conduct nearly 80 spacewalks to assemble, check out, and maintain the orbiting facility. NASA also plans to conduct a fi fth servicing mission to the Hubble Space Telescope to repair critical subsystems and improve Hubble’s astronomical instruments.
The Space Shuttle Program occupies 640 facilities and uses over 900,000 pieces of equipment. The total equipment value is over $12 billion, located in hundreds of government and contractor facilities across the United States. The total facilities value is approximately $5.7 billion, which accounts for approximately one-fourth of the value of the Agency’s total facility inventory. NASA currently has more than 1,500 active suppliers and 3,000 to 4,000 qualifi ed suppliers located throughout the country. Retiring these assets and facilities or transitioning them to new human exploration efforts is a formidable challenge. NASA must leverage strategically the existing human spacefl ight workforce, hardware, and infrastructure to ensure safe Shuttle missions while simultane-ously preparing to meet future needs. NASA uses a number of working groups and control boards to monitor and control the transition process, including the Transition Control Board, the Joint Integration Control Board, and the Headquarters Transition Working Group. The Space Shuttle Program man-ager executes risk management responsibilities through the commit-to-fl ight process, the Shuttle Engineering Review Board, and Regular Program Requirements Control Board. These boards and processes are designed to manage and reduce the risks associated with both fl ying the Shuttle and transitioning from Shuttle to other exploration vehicles.
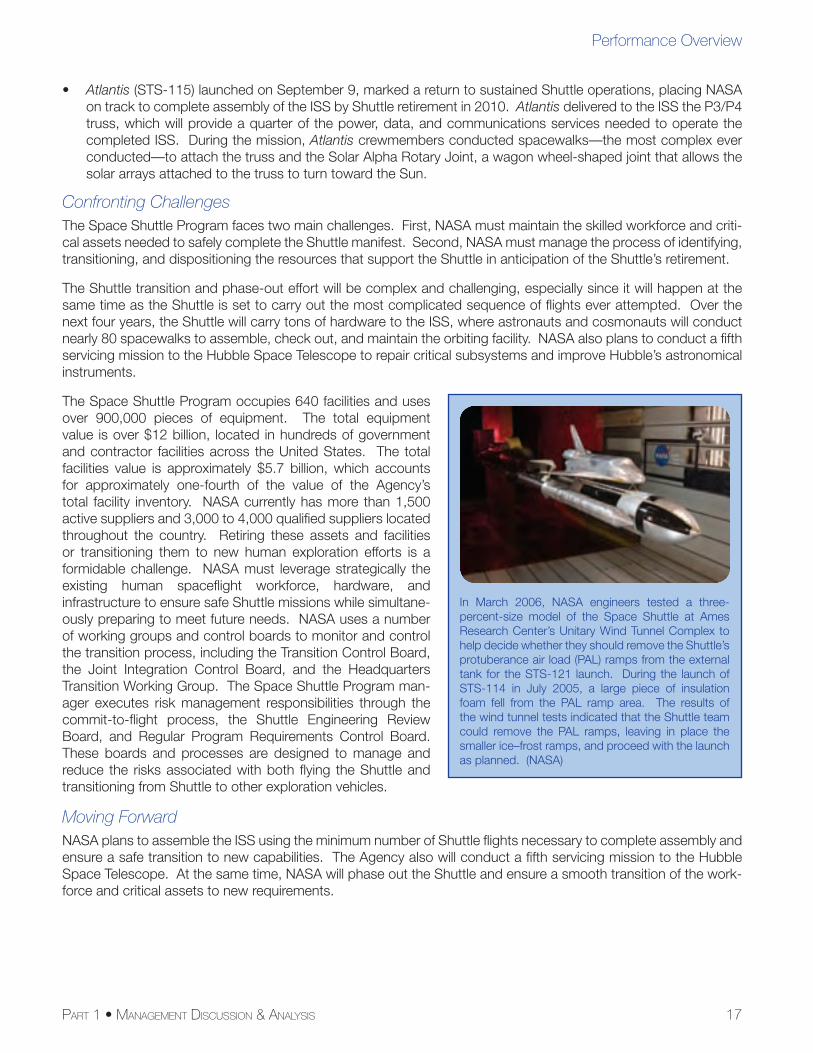
Moving ForwardNASA plans to assemble the ISS using the minimum number of Shuttle fl ights necessary to complete assembly and ensure a safe transition to new capabilities. The Agency also will conduct a fi fth servicing mission to the Hubble Space Telescope. At the same time, NASA will phase out the Shuttle and ensure a smooth transition of the work-force and critical assets to new requirements.
In March 2006, NASA engineers tested a three-percent-size model of the Space Shuttle at Ames Research Center’s Unitary Wind Tunnel Complex to help decide whether they should remove the Shuttle’s protuberance air load (PAL) ramps from the external tank for the STS-121 launch. During the launch of STS-114 in July 2005, a large piece of insulation foam fell from the PAL ramp area. The results of the wind tunnel tests indicated that the Shuttle team could remove the PAL ramps, leaving in place the smaller ice–frost ramps, and proceed with the launch as planned. (NASA)
18 NASA FY 2006 PERFORMANCE AND ACCOUNTABILITY REPORT
Strategic Goal 2: Complete the International Space Station in a manner consistent with NASA’s International Partner commitments and the needs of human exploration.Built and operated using state of the art science and technology, the Interna-tional Space Station (ISS) is a vital part of NASA’s program of exploration. The ISS provides an environment for developing, testing, and validating the next generation of technologies and processes needed to support the Nation’s exploration program and achievement of the Vision for Space Exploration.
Reaping Benefi tsThe ISS is a testbed for exploration technologies and processes. Its equipment and location provide a one-of-a-kind platform for Earth observations, microgravity research, and investigations of the long-term effects of the space environment on human beings. The ISS also enables research in fundamental physics and biology, materials sciences, and medicine. Crewmembers test processes for repairing equipment in microgravity, conducting space-walks, and keeping systems operational over long periods of time—capabilities critical to future missions.
When completed, the ISS will be the largest crewed spacecraft ever built. Many nations provide the resources and technologies that keep the ISS fl ying, and these international partnerships have increased cooperation and goodwill among participating nations.
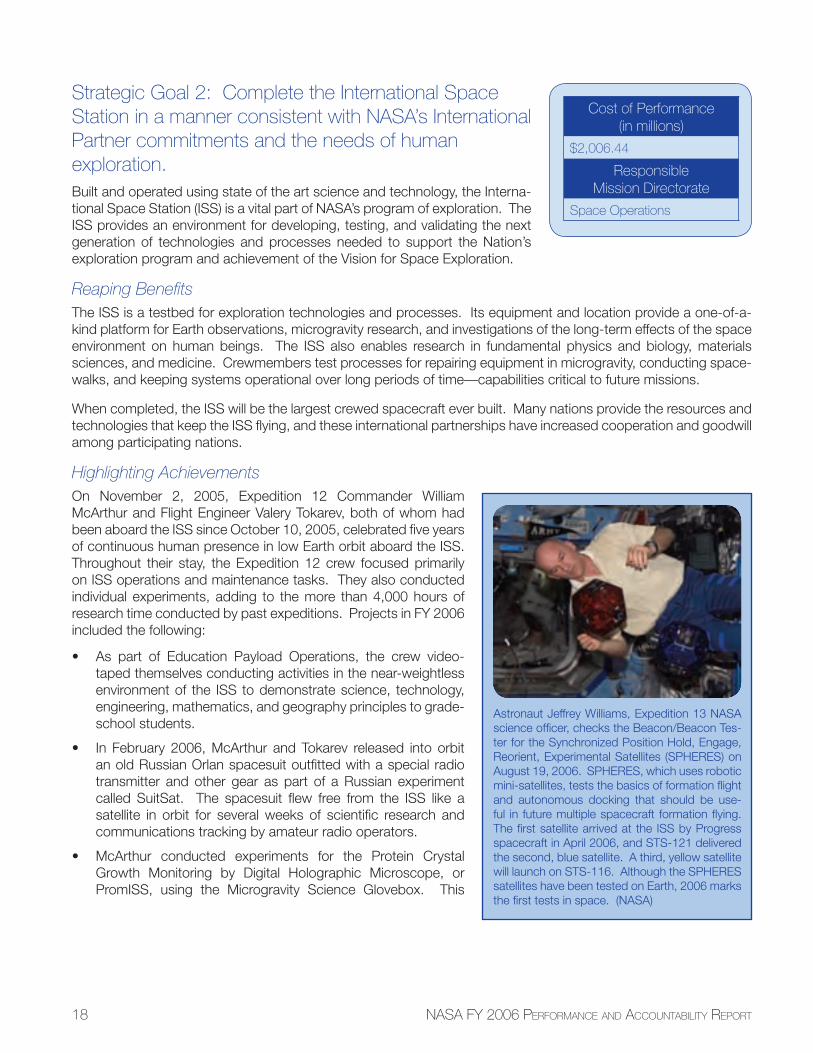
Highlighting AchievementsOn November 2, 2005, Expedition 12 Commander William McArthur and Flight Engineer Valery Tokarev, both of whom had been aboard the ISS since October 10, 2005, celebrated fi ve years of continuous human presence in low Earth orbit aboard the ISS. Throughout their stay, the Expedition 12 crew focused primarily on ISS operations and maintenance tasks. They also conducted individual experiments, adding to the more than 4,000 hours of research time conducted by past expeditions. Projects in FY 2006 included the following:
• As part of Education Payload Operations, the crew video-taped themselves conducting activities in the near-weightless environment of the ISS to demonstrate science, technology, engineering, mathematics, and geography principles to grade-school students.
• In February 2006, McArthur and Tokarev released into orbit an old Russian Orlan spacesuit outfi tted with a special radio transmitter and other gear as part of a Russian experiment called SuitSat. The spacesuit fl ew free from the ISS like a satellite in orbit for several weeks of scientifi c research and communications tracking by amateur radio operators.
• McArthur conducted experiments for the Protein Crystal Growth Monitoring by Digital Holographic Microscope, or PromISS, using the Microgravity Science Glovebox. This
Astronaut Jeffrey Williams, Expedition 13 NASA science offi cer, checks the Beacon/Beacon Tes-ter for the Synchronized Position Hold, Engage, Reorient, Experimental Satellites (SPHERES) on August 19, 2006. SPHERES, which uses robotic mini-satellites, tests the basics of formation fl ight and autonomous docking that should be use-ful in future multiple spacecraft formation fl ying. The fi rst satellite arrived at the ISS by Progress spacecraft in April 2006, and STS-121 delivered the second, blue satellite. A third, yellow satellite will launch on STS-116. Although the SPHERES satellites have been tested on Earth, 2006 marks the fi rst tests in space. (NASA)
Cost of Performance(in millions)
$2,006.44
ResponsibleMission Directorate
Space Operations
19PART 1 • MANAGEMENT DISCUSSION & ANALYSIS
Performance Overview
experiment used a holographic microscope to study how the near-weightless environment aboard the ISS affects protein crystal growth to help scientists better understand the role of proteins in diseases.
• The STS-121 mission in July 2006 delivered the oxygen gen-eration system rack, which is part of the regenerative envi-ronmental control and life support system. This rack eventu-ally will allow the ISS to accommodate six crewmembers and will help NASA develop and validate life support technology for use during long-duration human space missions. Shuttle astronauts Michael Fossum and Piers Sellers repaired the ISS’s mobile transporter rail car, which allows the remote manipula-tor arm, or Canadarm-2, to move along the ISS’s truss ele-ments, extending the arm’s reach so that it can aid future ISS construction. During another extravehicular activity, the two astronauts attached a spare pump module that helps transport liquid ammonia through the ISS’s cooling system. STS-121 also delivered Flight Engineer Thomas Reiter, returning the ISS crew complement to three members.
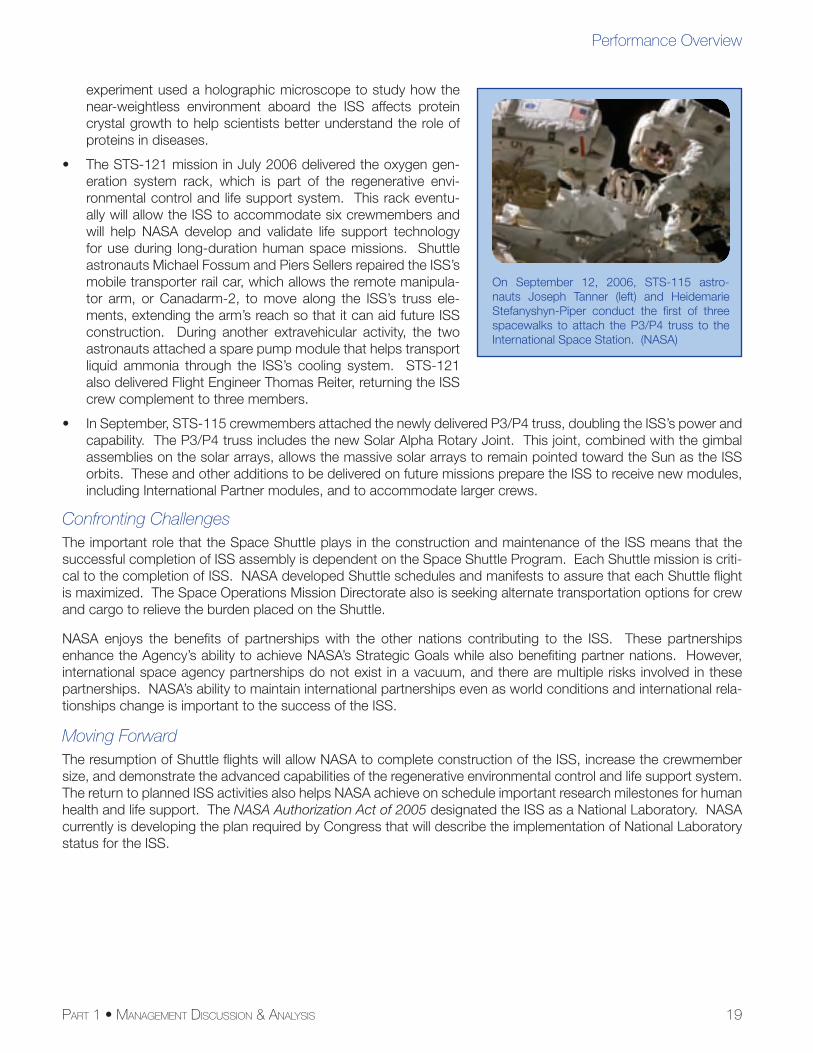
• In September, STS-115 crewmembers attached the newly delivered P3/P4 truss, doubling the ISS’s power and capability. The P3/P4 truss includes the new Solar Alpha Rotary Joint. This joint, combined with the gimbal assemblies on the solar arrays, allows the massive solar arrays to remain pointed toward the Sun as the ISS orbits. These and other additions to be delivered on future missions prepare the ISS to receive new modules, including International Partner modules, and to accommodate larger crews.
Confronting ChallengesThe important role that the Space Shuttle plays in the construction and maintenance of the ISS means that the successful completion of ISS assembly is dependent on the Space Shuttle Program. Each Shuttle mission is criti-cal to the completion of ISS. NASA developed Shuttle schedules and manifests to assure that each Shuttle fl ight is maximized. The Space Operations Mission Directorate also is seeking alternate transportation options for crew and cargo to relieve the burden placed on the Shuttle.
NASA enjoys the benefi ts of partnerships with the other nations contributing to the ISS. These partnerships enhance the Agency’s ability to achieve NASA’s Strategic Goals while also benefi ting partner nations. However, international space agency partnerships do not exist in a vacuum, and there are multiple risks involved in these partnerships. NASA’s ability to maintain international partnerships even as world conditions and international rela-tionships change is important to the success of the ISS.
Moving ForwardThe resumption of Shuttle fl ights will allow NASA to complete construction of the ISS, increase the crewmember size, and demonstrate the advanced capabilities of the regenerative environmental control and life support system. The return to planned ISS activities also helps NASA achieve on schedule important research milestones for human health and life support. The NASA Authorization Act of 2005 designated the ISS as a National Laboratory. NASA currently is developing the plan required by Congress that will describe the implementation of National Laboratory status for the ISS.
On September 12, 2006, STS-115 astro-nauts Joseph Tanner (left) and Heidemarie Stefanyshyn-Piper conduct the fi rst of three spacewalks to attach the P3/P4 truss to the International Space Station. (NASA)
20 NASA FY 2006 PERFORMANCE AND ACCOUNTABILITY REPORT
Goal 3: Develop a balanced overall program of science, exploration, and aeronautics consistent with the redirection of the human spacefl ight program to focus on exploration.Strategic Goal 3 encompasses all basic research programs that enable, and are enabled by, NASA’s exploration activities. To ensure a balanced focus that addresses and achieves all objectives of the Vision for Space Explora-tion and NASA’s Mission, the Agency established six Sub-goals supporting Goal 3:
• Sub-goal 3A: Study Earth from space to advance scientifi c understanding and meet societal needs.
• Sub-goal 3B: Understand the Sun and its effects on Earth and the solar system.
• Sub-goal 3C: Advance scientifi c knowledge of the solar system, search for evidence of life, and prepare for human exploration.
• Sub-goal 3D: Discover the origin, structure, evolution, and destiny of the universe, and search for Earth-like planets.
• Sub-goal 3E: Advance knowledge in the fundamental disciplines of aeronautics, and develop technologies for safer aircraft and higher capacity airspace systems.
• Sub-goal 3F: Understand the effects of the space environment on human performance, and test new tech-nologies and countermeasures for long-duration human space exploration.
All four Mission Directorates contribute to these Sub-goals.
Highlighting AchievementsNASA made excellent progress toward achieving Strategic Goal 3 during FY 2006. The Science Mission Director-ate, which manages work under Sub-goals 3A through 3D, celebrated many achievements, including the success-ful completion of several missions: Stardust, which returned samples from comet Wild 2; Gravity Probe–B (GPB), which tested Einstein’s theory of general relativity; and the Topography Experiment for Ocean Circulation (TOPEX)/Poseidon mission, which revolutionized the way scientists study Earth’s oceans. In July, NASA returned the Inter-national Space Station crew size to three members and the Shuttle returned to regular operations in September, increasing fl ight research opportunities in human health and performance and fundamental physics and biology. The Aeronautics Research Mission Directorate conducted a major reorganization that aligned its programs with NASA’s new priorities. Exploration Systems, Science, and Space Operations also streamlined their organizations to strengthen and enhance programmatic coordination, direction, and accountability.
Confronting ChallengesAchieving Sub-goals 3A through 3F will demand that NASA confront unique challenges specifi c to each Sub-goal. However, NASA also faces some over-arching challenges that impinge on more than one Sub-goal. For example, the Science Mission Directorate must predict technology development and mission implementation life-cycle costs that are key to estimating budget needs across the life of a project. This challenge is apparent in large, fl agship missions, as well as in medium and small missions. The Science Mission Directorate also is challenged by the need to maximize the science return for each mission while maintaining an acceptable level of implementation risk and meeting cost and schedule objectives.
The challenge of maximizing science while maintaining cost and schedule objectives is exacerbated by the need to develop one-of-a-kind spacecraft that require cutting-edge technologies and engineering processes. Because NASA and Agency partners are doing something for the fi rst time, costs are rarely fully predictable. A key obstacle in achieving program success is being able to mature the required technologies early enough in the life of the mis-sion to keep the life-cycle costs reasonable and predictable. If NASA and Agency partners take too long to tackle the technology challenges, schedule delays will occur later in the mission when delays are even more costly.
The Agency constantly strives to do a better job of predicting accurately total lifecycle costs. In order to do this, NASA aims to have enough reserves, while conserving resources, at mission confi rmation. In addition, the
21PART 1 • MANAGEMENT DISCUSSION & ANALYSIS
Performance Overview
Science Mission Directorate is conducting studies to analyze best practices from selected past missions in the small, medium, and large mission cost categories.
Another challenge confronting NASA’s Science missions is the future availability and cost of launch services. As retirement looms for medium-class expendable launch vehicles like the Delta II, expendable launch vehicles are evolving toward larger, more expensive launchers like the Delta 4 and Atlas 5. These larger launchers provide advantages in lift capabilities for larger payloads, but are more expensive per pound of payload for small- and medium-sized payloads, since NASA would be paying for unneeded lift capabilities.
In addition, technical issues associated with available expendable launch vehicles have led to launch delays and additional costs for several missions. To address the challenge, NASA has undertaken a study to consider options the Agency might pursue to strengthen the launch vehicle portfolio, including using alternate launch providers.
The following discussions of each Sub-goal include background, highlights, and challenges specifi c to that Sub-goal.
22 NASA FY 2006 PERFORMANCE AND ACCOUNTABILITY REPORT
Sub-goal 3A: Study Earth from space to advance scientifi c understanding and meet societal needs.Earth is a dynamic system. Its land, oceans, atmosphere, climate, and gravi-tational fi elds are changing constantly. Some of these changes, especially short-duration and localized phenomena like hurricanes and earthquakes, are big and can pose hazards to humans around the world. Other changes, like climate variability, take longer to have an effect and are revealed through long-term, intensive research. NASA’s Earth Science Division helps researchers better understand the causes and consequences of these changes through data gathered by Earth-observing satellites, aircraft, and balloons. Using advanced computer systems, program scientists analyze and model the data into useful Earth science information and distribute it to end users around the world.
NASA’s Earth Science Division partners with other government agencies, academia, non-profi t organizations, industry, and international organizations to share data and analyses that will help researchers better understand and predict the effects of Earth system events, changes, and interactions. Improved understanding and predictive ability enables end users, especially policy makers, to ameliorate harmful impacts of events and changes to the Earth system.
Reaping Benefi tsNASA’s Earth Science Division is central to three Presidential initiatives that serve the public:
• The Climate Change Research Initiative, established in 2001 to study global climate change and to provide a forum for public debate and decision-making about how the United States monitors and responds to climate change;
• The Global Earth Observation System of Systems, a multinational effort to coordinate existing and new Earth observation hardware and software to supply free data and information for the benefi t of humanity and the environment; and
• The U.S. Ocean Action Plan, released in 2004 as part of an Administration effort to ensure that benefi ts derived from oceans and other bodies of water will be available to future generations.
To support these initiatives, NASA and the Agency’s partners conduct vital research that helps the Nation man-age environmental and agricultural resources and prepare for natural disasters. In the course of conducting this research, NASA applies the resulting data and knowledge with the Agency’s operational partners to improve their decision making in societal need areas such as public health, aviation, water management, air quality, and energy.
The Earth Science Program also helps NASA achieve the Agency’s other Strategic Goals and Mission:
• Earth observing satellites provide meteorological information used by the National Oceanic and Atmospheric Administration (NOAA) and the Department of Defense in providing weather forecasts that help NASA plan launches and landings. At the end of August 2006, satellites indicated that Tropical Storm Ernesto would make landfall in Florida, giving NASA time to review the launch of Space Shuttle Atlantis and postpone it until early September.
• The Earth Science Division develops instruments for Earth observation that, with modifi cation, can help NASA explore other planets. For example, instruments that study chemicals in Earth’s atmosphere can be adapted to study the atmospheres of planets throughout the solar system.
Highlighting AchievementsUsing data from the fi rst-ever gravity survey by the twin Gravity Recovery and Climate Experiment (GRACE) satel-lites, scientists concluded this year that the mass of the Antarctic ice sheet has decreased signifi cantly since 2002, providing further evidence that observed warming in polar regions is affecting ice mass. The loss, mostly from the West Antarctic ice sheet, was enough to raise sea levels around the world by about 0.05 inches. This loss primarily
Cost of Performance(in millions)
$1,636.36
Responsible Mission Directorate
Science
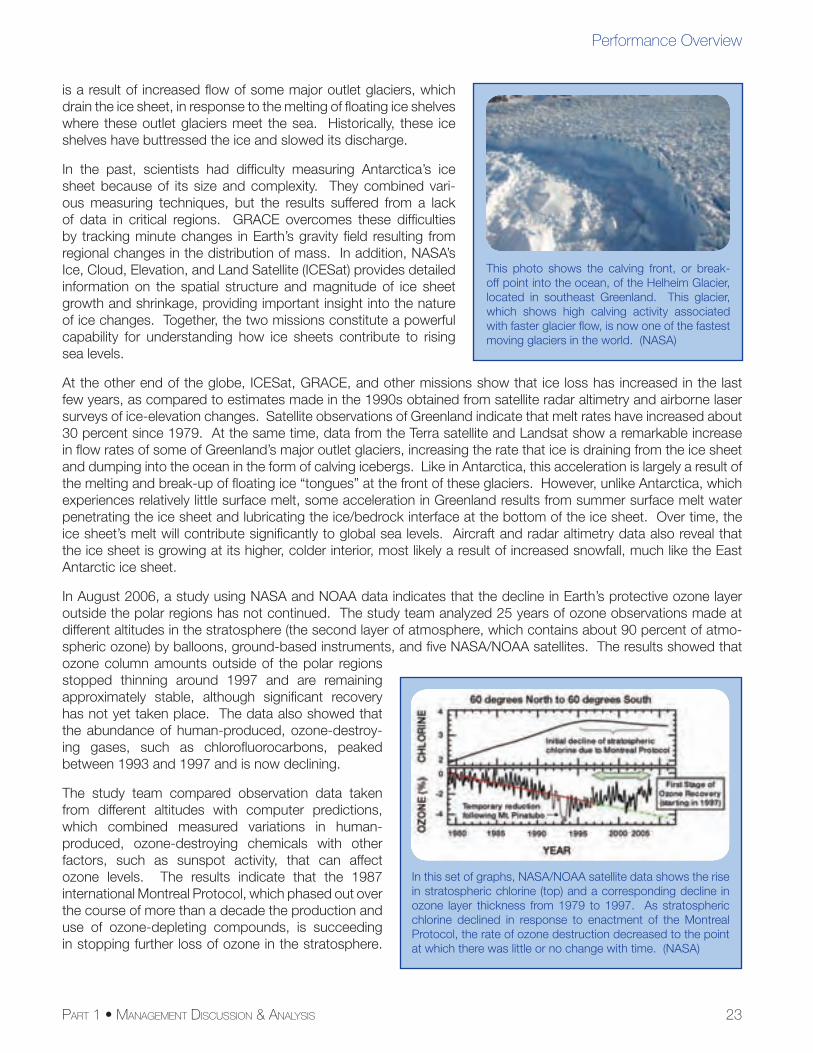
23PART 1 • MANAGEMENT DISCUSSION & ANALYSIS
Performance Overview
is a result of increased fl ow of some major outlet glaciers, which drain the ice sheet, in response to the melting of fl oating ice shelves where these outlet glaciers meet the sea. Historically, these ice shelves have buttressed the ice and slowed its discharge.
In the past, scientists had diffi culty measuring Antarctica’s ice sheet because of its size and complexity. They combined vari-ous measuring techniques, but the results suffered from a lack of data in critical regions. GRACE overcomes these diffi culties by tracking minute changes in Earth’s gravity fi eld resulting from regional changes in the distribution of mass. In addition, NASA’s Ice, Cloud, Elevation, and Land Satellite (ICESat) provides detailed information on the spatial structure and magnitude of ice sheet growth and shrinkage, providing important insight into the nature of ice changes. Together, the two missions constitute a powerful capability for understanding how ice sheets contribute to rising sea levels.
At the other end of the globe, ICESat, GRACE, and other missions show that ice loss has increased in the last few years, as compared to estimates made in the 1990s obtained from satellite radar altimetry and airborne laser surveys of ice-elevation changes. Satellite observations of Greenland indicate that melt rates have increased about 30 percent since 1979. At the same time, data from the Terra satellite and Landsat show a remarkable increase in fl ow rates of some of Greenland’s major outlet glaciers, increasing the rate that ice is draining from the ice sheet and dumping into the ocean in the form of calving icebergs. Like in Antarctica, this acceleration is largely a result of the melting and break-up of fl oating ice “tongues” at the front of these glaciers. However, unlike Antarctica, which experiences relatively little surface melt, some acceleration in Greenland results from summer surface melt water penetrating the ice sheet and lubricating the ice/bedrock interface at the bottom of the ice sheet. Over time, the ice sheet’s melt will contribute signifi cantly to global sea levels. Aircraft and radar altimetry data also reveal that the ice sheet is growing at its higher, colder interior, most likely a result of increased snowfall, much like the East Antarctic ice sheet.
In August 2006, a study using NASA and NOAA data indicates that the decline in Earth’s protective ozone layer outside the polar regions has not continued. The study team analyzed 25 years of ozone observations made at different altitudes in the stratosphere (the second layer of atmosphere, which contains about 90 percent of atmo-spheric ozone) by balloons, ground-based instruments, and fi ve NASA/NOAA satellites. The results showed that ozone column amounts outside of the polar regions stopped thinning around 1997 and are remaining approximately stable, although signifi cant recovery has not yet taken place. The data also showed that the abundance of human-produced, ozone-destroy-ing gases, such as chlorofl uorocarbons, peaked between 1993 and 1997 and is now declining.
The study team compared observation data taken from different altitudes with computer predictions, which combined measured variations in human-produced, ozone-destroying chemicals with other factors, such as sunspot activity, that can affect ozone levels. The results indicate that the 1987 international Montreal Protocol, which phased out over the course of more than a decade the production and use of ozone-depleting compounds, is succeeding in stopping further loss of ozone in the stratosphere.
This photo shows the calving front, or break-off point into the ocean, of the Helheim Glacier, located in southeast Greenland. This glacier, which shows high calving activity associated with faster glacier fl ow, is now one of the fastest moving glaciers in the world. (NASA)
In this set of graphs, NASA/NOAA satellite data shows the rise in stratospheric chlorine (top) and a corresponding decline in ozone layer thickness from 1979 to 1997. As stratospheric chlorine declined in response to enactment of the Montreal Protocol, the rate of ozone destruction decreased to the point at which there was little or no change with time. (NASA)
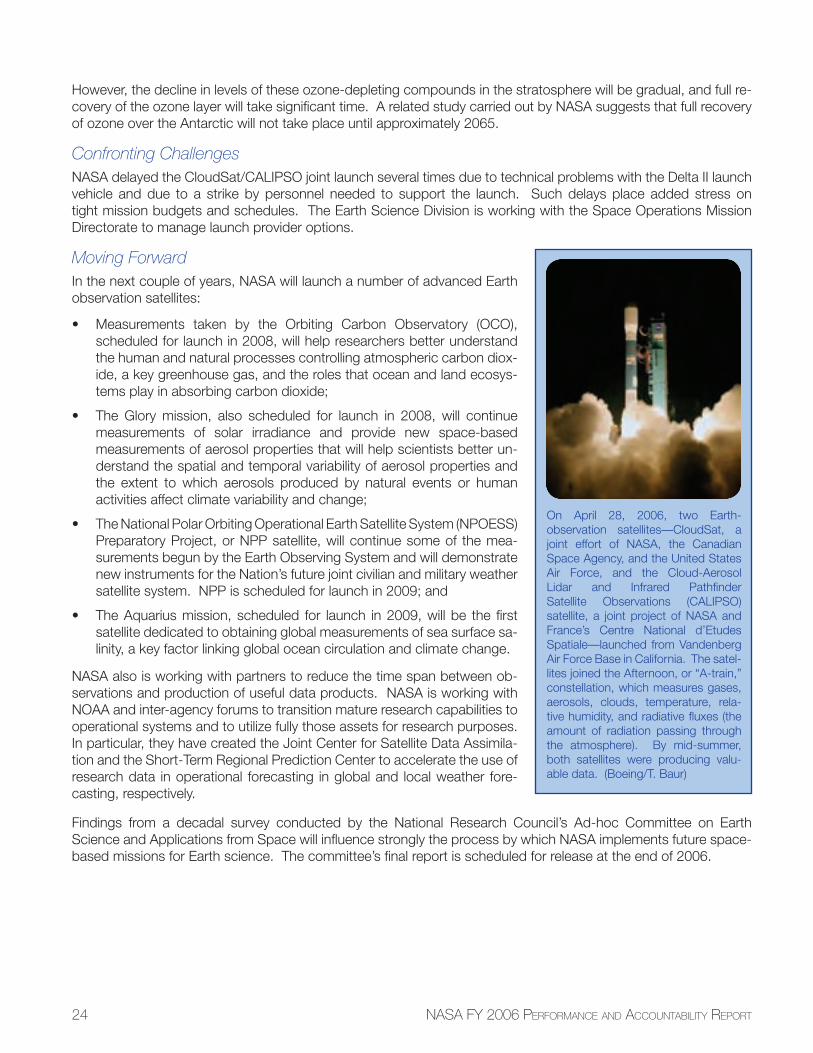
24 NASA FY 2006 PERFORMANCE AND ACCOUNTABILITY REPORT
However, the decline in levels of these ozone-depleting compounds in the stratosphere will be gradual, and full re-covery of the ozone layer will take signifi cant time. A related study carried out by NASA suggests that full recovery of ozone over the Antarctic will not take place until approximately 2065.
Confronting ChallengesNASA delayed the CloudSat/CALIPSO joint launch several times due to technical problems with the Delta II launch vehicle and due to a strike by personnel needed to support the launch. Such delays place added stress on tight mission budgets and schedules. The Earth Science Division is working with the Space Operations Mission Directorate to manage launch provider options.
Moving ForwardIn the next couple of years, NASA will launch a number of advanced Earth observation satellites:
• Measurements taken by the Orbiting Carbon Observatory (OCO), scheduled for launch in 2008, will help researchers better understand the human and natural processes controlling atmospheric carbon diox-ide, a key greenhouse gas, and the roles that ocean and land ecosys-tems play in absorbing carbon dioxide;
• The Glory mission, also scheduled for launch in 2008, will continue measurements of solar irradiance and provide new space-based measurements of aerosol properties that will help scientists better un-derstand the spatial and temporal variability of aerosol properties and the extent to which aerosols produced by natural events or human activities affect climate variability and change;
• The National Polar Orbiting Operational Earth Satellite System (NPOESS) Preparatory Project, or NPP satellite, will continue some of the mea-surements begun by the Earth Observing System and will demonstrate new instruments for the Nation’s future joint civilian and military weather satellite system. NPP is scheduled for launch in 2009; and
• The Aquarius mission, scheduled for launch in 2009, will be the fi rst satellite dedicated to obtaining global measurements of sea surface sa-linity, a key factor linking global ocean circulation and climate change.
NASA also is working with partners to reduce the time span between ob-servations and production of useful data products. NASA is working with NOAA and inter-agency forums to transition mature research capabilities to operational systems and to utilize fully those assets for research purposes. In particular, they have created the Joint Center for Satellite Data Assimila-tion and the Short-Term Regional Prediction Center to accelerate the use of research data in operational forecasting in global and local weather fore-casting, respectively.
Findings from a decadal survey conducted by the National Research Council’s Ad-hoc Committee on Earth Science and Applications from Space will infl uence strongly the process by which NASA implements future space-based missions for Earth science. The committee’s fi nal report is scheduled for release at the end of 2006.
On April 28, 2006, two Earth-observation satellites—CloudSat, a joint effort of NASA, the Canadian Space Agency, and the United States Air Force, and the Cloud-Aerosol Lidar and Infrared Pathfi nder Satellite Observations (CALIPSO) satellite, a joint project of NASA and France’s Centre National d’Etudes Spatiale—launched from Vandenberg Air Force Base in California. The satel-lites joined the Afternoon, or “A-train,” constellation, which measures gases, aerosols, clouds, temperature, rela-tive humidity, and radiative fl uxes (the amount of radiation passing through the atmosphere). By mid-summer, both satellites were producing valu-able data. (Boeing/T. Baur)
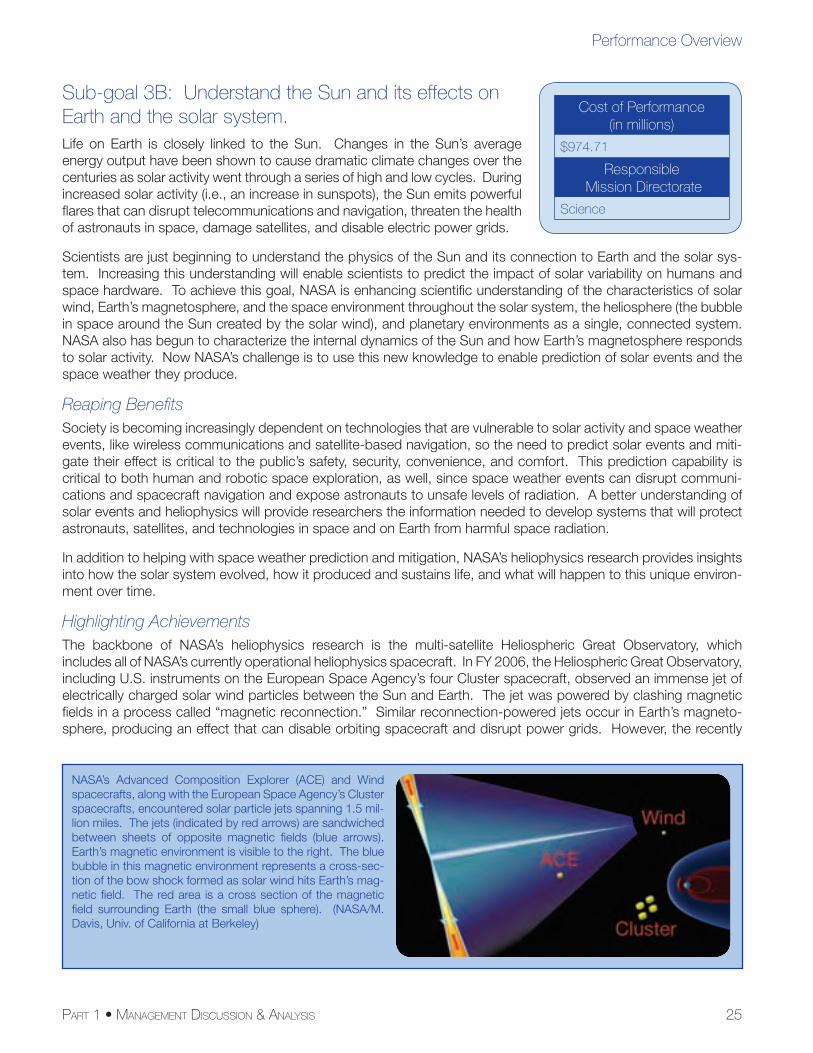
25PART 1 • MANAGEMENT DISCUSSION & ANALYSIS
Performance Overview
Sub-goal 3B: Understand the Sun and its effects on Earth and the solar system.Life on Earth is closely linked to the Sun. Changes in the Sun’s average energy output have been shown to cause dramatic climate changes over the centuries as solar activity went through a series of high and low cycles. During increased solar activity (i.e., an increase in sunspots), the Sun emits powerful fl ares that can disrupt telecommunications and navigation, threaten the health of astronauts in space, damage satellites, and disable electric power grids.
Scientists are just beginning to understand the physics of the Sun and its connection to Earth and the solar sys-tem. Increasing this understanding will enable scientists to predict the impact of solar variability on humans and space hardware. To achieve this goal, NASA is enhancing scientifi c understanding of the characteristics of solar wind, Earth’s magnetosphere, and the space environment throughout the solar system, the heliosphere (the bubble in space around the Sun created by the solar wind), and planetary environments as a single, connected system. NASA also has begun to characterize the internal dynamics of the Sun and how Earth’s magnetosphere responds to solar activity. Now NASA’s challenge is to use this new knowledge to enable prediction of solar events and the space weather they produce.
Reaping Benefi tsSociety is becoming increasingly dependent on technologies that are vulnerable to solar activity and space weather events, like wireless communications and satellite-based navigation, so the need to predict solar events and miti-gate their effect is critical to the public’s safety, security, convenience, and comfort. This prediction capability is critical to both human and robotic space exploration, as well, since space weather events can disrupt communi-cations and spacecraft navigation and expose astronauts to unsafe levels of radiation. A better understanding of solar events and heliophysics will provide researchers the information needed to develop systems that will protect astronauts, satellites, and technologies in space and on Earth from harmful space radiation.
In addition to helping with space weather prediction and mitigation, NASA’s heliophysics research provides insights into how the solar system evolved, how it produced and sustains life, and what will happen to this unique environ-ment over time.
Highlighting AchievementsThe backbone of NASA’s heliophysics research is the multi-satellite Heliospheric Great Observatory, which includes all of NASA’s currently operational heliophysics spacecraft. In FY 2006, the Heliospheric Great Observatory, including U.S. instruments on the European Space Agency’s four Cluster spacecraft, observed an immense jet of electrically charged solar wind particles between the Sun and Earth. The jet was powered by clashing magnetic fi elds in a process called “magnetic reconnection.” Similar reconnection-powered jets occur in Earth’s magneto-sphere, producing an effect that can disable orbiting spacecraft and disrupt power grids. However, the recently
Cost of Performance(in millions)
$974.71
Responsible Mission Directorate
Science
NASA’s Advanced Composition Explorer (ACE) and Wind spacecrafts, along with the European Space Agency’s Cluster spacecrafts, encountered solar particle jets spanning 1.5 mil-lion miles. The jets (indicated by red arrows) are sandwiched between sheets of opposite magnetic fi elds (blue arrows). Earth’s magnetic environment is visible to the right. The blue bubble in this magnetic environment represents a cross-sec-tion of the bow shock formed as solar wind hits Earth’s mag-netic fi eld. The red area is a cross section of the magnetic fi eld surrounding Earth (the small blue sphere). (NASA/M. Davis, Univ. of California at Berkeley)
26 NASA FY 2006 PERFORMANCE AND ACCOUNTABILITY REPORT
discovered interplanetary jets are far larger than those that occur within Earth’s magnetosphere. This observation is the fi rst direct measurement indicating that magnetic reconnection can happen on immense scales.
Understanding magnetic reconnection is fundamental to understanding explosive phenomena like solar fl ares and gamma ray bursts throughout the universe and even nuclear fusion experiments conducted in laboratories. These observations also are proving important for planning the future four-spacecraft Magnetospheric Multiscale mission, which will study the fundamental physical process of magnetic reconnection.
The Great Observatory also discovered that rising tides of hot air from intense thunderstorm activity over South America, Africa, and Southeast Asia are connected to changes in the structure of Earth’s ionosphere, according to NASA-funded researchers in a paper published in the August 11, 2006, issue of Geophysical Research Letters. The ionosphere is a layer of electrically charged plasma formed by solar X-rays and ultraviolet light. Storm-induced changes to the ionosphere infl uence the structure of the atmosphere and can disrupt radio signals from commu-nication and navigation satellites.
Using data from NASA’s Imager for Magnetopause-to-Aurora Global Exploration (IMAGE) spacecraft, the research team found four mysterious bright regions of plasma that were 20 to 30 percent more dense than the average bands of plasma encircling Earth above the equator. Three of the bright regions were located over tropical rainfor-ests with plenty of storm activity. Computer simulations confi rmed that the storms in these tropical areas produce rising tides of hot air, but the simulations could not explain the connection between the storms and the bright areas in the two bands. Thunderstorms develop in Earth’s dense lower atmosphere just 10 miles over the equator. However, the plasma bands develop 500 miles above Earth in the ionosphere where the gas is about 100 million times less dense. The tide of hot air needs to collide with atoms in the ionosphere to create the bright areas, but because the gas in the ionosphere is so thin, atoms rarely collide.
In FY 2006, additional research showed that the tides could affect the plasma bands indirectly. Below the plasma bands, a layer of the ionosphere called the E-layer becomes partially electrifi ed during the day. This E-layer shapes the plasma bands above by creating an electric fi eld when the charged particles in the E-layer are blown across Earth’s magnetic fi eld. The research model showed that the rising tides of hot air from tropical storms around the world dump their energy in the E-layer, disrupting the plasma there. This in turn disrupts the electric fi elds and cre-ates dense, bright zones in the bands above.
This is the fi rst time that scientists have identifi ed a regional infl uence on multiple layers of the atmosphere and related space weather. They now know that accurate predictions of ionospheric space weather disturbances must incorporate the effect of tropical weather.
In May 2006, NASA added fi ve new Virtual Observatories to its Heliophysics Data Environment, a project to create a standardized, electronic tool to collect, store, manage, and distribute Sun–Earth physics mission data. The Virtual Observatories concept is part of an international effort to make accessible to the world’s science community the vast, dynamic body of available astronomy and astrophysics data.
Confronting ChallengesAll spacecraft that currently constitute NASA’s Heliospheric Great Observatory are operating in extended service, past their planned ends-of-missions. However, the Heliophysics Division made good progress in FY 2006 toward refreshing the Observatory. NASA’s partner for the Time History of Events and Macroscale Interactions (THEMIS) mission delivered, integrated, and tested the instruments for THEMIS’s fi ve spacecraft, and the mission is on schedule to launch late in 2006. NASA also tested and prepared the Aeronomy of Ice in Mesosphere (AIM) and Solar Terrestrial Relations Observatory (STEREO) missions for launch in FY 2007. Both missions were delayed in FY 2006 due to technical problems with their launch vehicles. NASA is working with the launch providers to prevent further delays. In addition, the Japanese Aerospace Exploration Agency (JAXA) launched the joint JAXA–NASA Solar–B mission, now renamed Hinode (the Japanese word for “sunrise”), on September 22, 2006. Through high-resolution observations, Solar–B will help researchers study the mechanisms that power the solar atmosphere and drive solar eruptions.
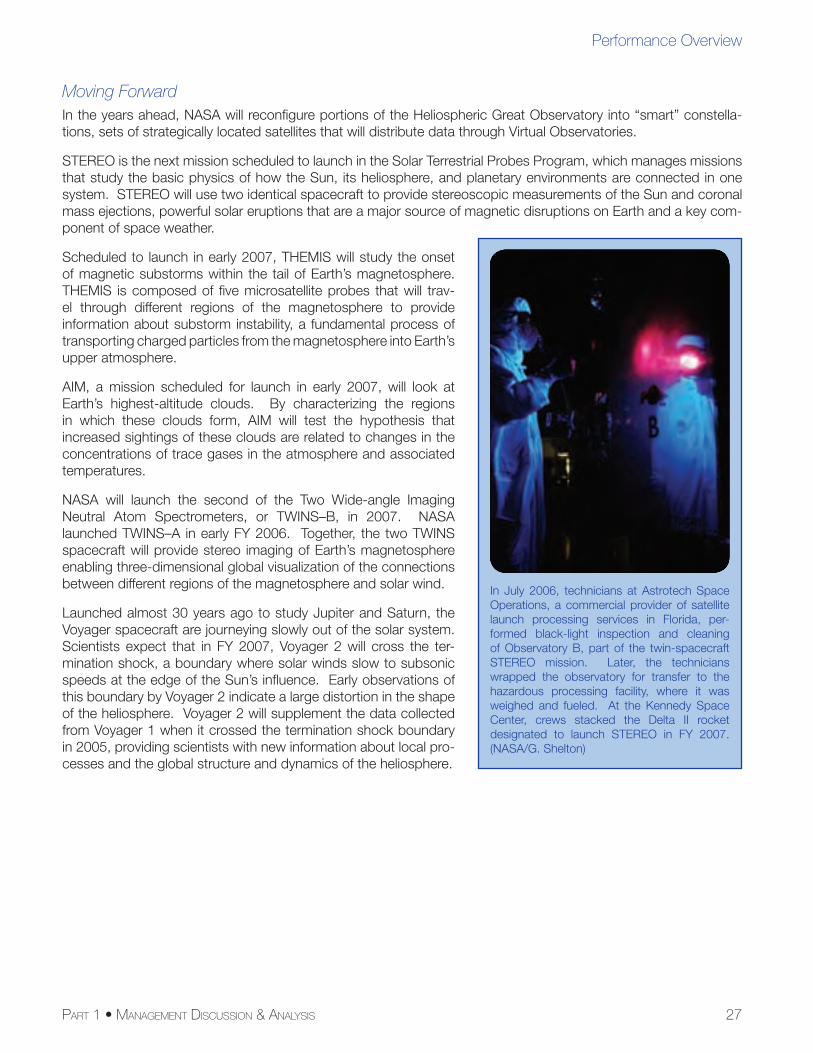
27PART 1 • MANAGEMENT DISCUSSION & ANALYSIS
Performance Overview
Moving ForwardIn the years ahead, NASA will reconfi gure portions of the Heliospheric Great Observatory into “smart” constella-tions, sets of strategically located satellites that will distribute data through Virtual Observatories.
STEREO is the next mission scheduled to launch in the Solar Terrestrial Probes Program, which manages missions that study the basic physics of how the Sun, its heliosphere, and planetary environments are connected in one system. STEREO will use two identical spacecraft to provide stereoscopic measurements of the Sun and coronal mass ejections, powerful solar eruptions that are a major source of magnetic disruptions on Earth and a key com-ponent of space weather.
Scheduled to launch in early 2007, THEMIS will study the onset of magnetic substorms within the tail of Earth’s magnetosphere. THEMIS is composed of fi ve microsatellite probes that will trav-el through different regions of the magnetosphere to provide information about substorm instability, a fundamental process of transporting charged particles from the magnetosphere into Earth’s upper atmosphere.
AIM, a mission scheduled for launch in early 2007, will look at Earth’s highest-altitude clouds. By characterizing the regions in which these clouds form, AIM will test the hypothesis that increased sightings of these clouds are related to changes in the concentrations of trace gases in the atmosphere and associated temperatures.
NASA will launch the second of the Two Wide-angle Imaging Neutral Atom Spectrometers, or TWINS–B, in 2007. NASA launched TWINS–A in early FY 2006. Together, the two TWINS spacecraft will provide stereo imaging of Earth’s magnetosphere enabling three-dimensional global visualization of the connections between different regions of the magnetosphere and solar wind.
Launched almost 30 years ago to study Jupiter and Saturn, the Voyager spacecraft are journeying slowly out of the solar system. Scientists expect that in FY 2007, Voyager 2 will cross the ter-mination shock, a boundary where solar winds slow to subsonic speeds at the edge of the Sun’s infl uence. Early observations of this boundary by Voyager 2 indicate a large distortion in the shape of the heliosphere. Voyager 2 will supplement the data collected from Voyager 1 when it crossed the termination shock boundary in 2005, providing scientists with new information about local pro-cesses and the global structure and dynamics of the heliosphere.
In July 2006, technicians at Astrotech Space Operations, a commercial provider of satellite launch processing services in Florida, per-formed black-light inspection and cleaning of Observatory B, part of the twin-spacecraft STEREO mission. Later, the technicians wrapped the observatory for transfer to the hazardous processing facility, where it was weighed and fueled. At the Kennedy Space Center, crews stacked the Delta II rocket designated to launch STEREO in FY 2007. (NASA/G. Shelton)
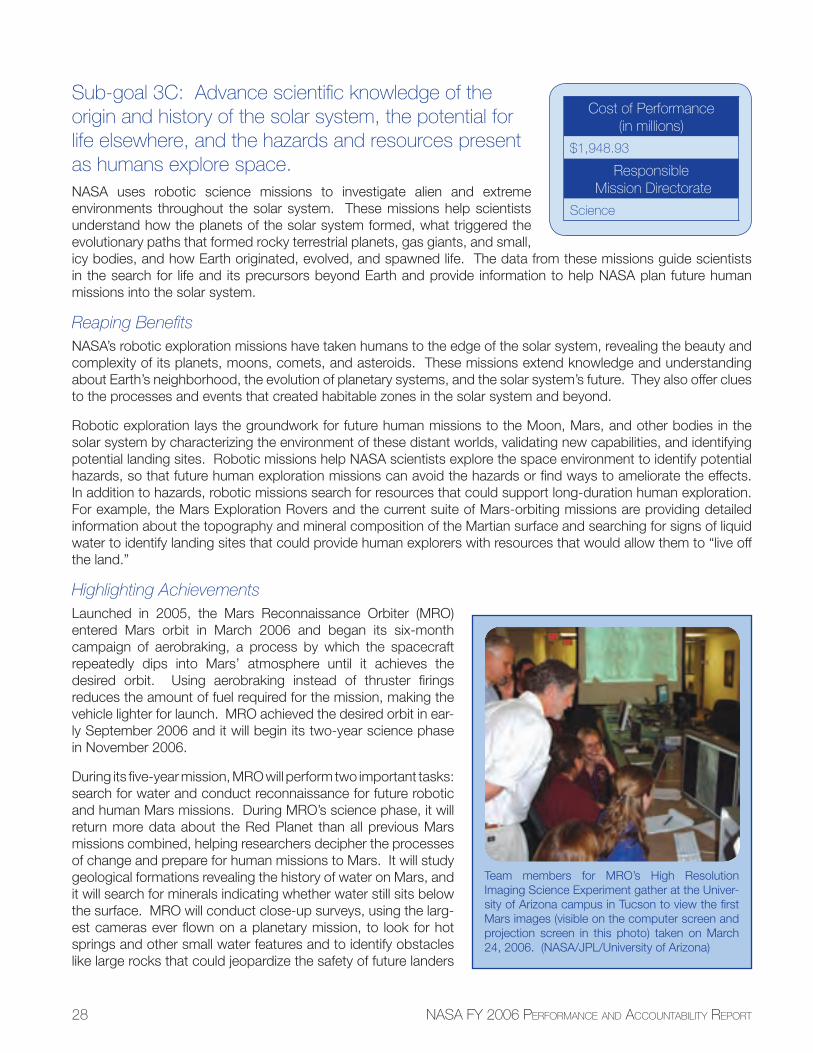
28 NASA FY 2006 PERFORMANCE AND ACCOUNTABILITY REPORT
Sub-goal 3C: Advance scientifi c knowledge of the origin and history of the solar system, the potential for life elsewhere, and the hazards and resources present as humans explore space.NASA uses robotic science missions to investigate alien and extreme environments throughout the solar system. These missions help scientists understand how the planets of the solar system formed, what triggered the evolutionary paths that formed rocky terrestrial planets, gas giants, and small, icy bodies, and how Earth originated, evolved, and spawned life. The data from these missions guide scientists in the search for life and its precursors beyond Earth and provide information to help NASA plan future human missions into the solar system.
Reaping Benefi tsNASA’s robotic exploration missions have taken humans to the edge of the solar system, revealing the beauty and complexity of its planets, moons, comets, and asteroids. These missions extend knowledge and understanding about Earth’s neighborhood, the evolution of planetary systems, and the solar system’s future. They also offer clues to the processes and events that created habitable zones in the solar system and beyond.
Robotic exploration lays the groundwork for future human missions to the Moon, Mars, and other bodies in the solar system by characterizing the environment of these distant worlds, validating new capabilities, and identifying potential landing sites. Robotic missions help NASA scientists explore the space environment to identify potential hazards, so that future human exploration missions can avoid the hazards or fi nd ways to ameliorate the effects. In addition to hazards, robotic missions search for resources that could support long-duration human exploration. For example, the Mars Exploration Rovers and the current suite of Mars-orbiting missions are providing detailed information about the topography and mineral composition of the Martian surface and searching for signs of liquid water to identify landing sites that could provide human explorers with resources that would allow them to “live off the land.”
Highlighting AchievementsLaunched in 2005, the Mars Reconnaissance Orbiter (MRO) entered Mars orbit in March 2006 and began its six-month campaign of aerobraking, a process by which the spacecraft repeatedly dips into Mars’ atmosphere until it achieves the desired orbit. Using aerobraking instead of thruster fi rings reduces the amount of fuel required for the mission, making the vehicle lighter for launch. MRO achieved the desired orbit in ear-ly September 2006 and it will begin its two-year science phase in November 2006.
During its fi ve-year mission, MRO will perform two important tasks: search for water and conduct reconnaissance for future robotic and human Mars missions. During MRO’s science phase, it will return more data about the Red Planet than all previous Mars missions combined, helping researchers decipher the processes of change and prepare for human missions to Mars. It will study geological formations revealing the history of water on Mars, and it will search for minerals indicating whether water still sits below the surface. MRO will conduct close-up surveys, using the larg-est cameras ever fl own on a planetary mission, to look for hot springs and other small water features and to identify obstacles like large rocks that could jeopardize the safety of future landers
Team members for MRO’s High Resolution Imaging Science Experiment gather at the Univer-sity of Arizona campus in Tucson to view the fi rst Mars images (visible on the computer screen and projection screen in this photo) taken on March 24, 2006. (NASA/JPL/University of Arizona)
Cost of Performance(in millions)
$1,948.93
Responsible Mission Directorate
Science
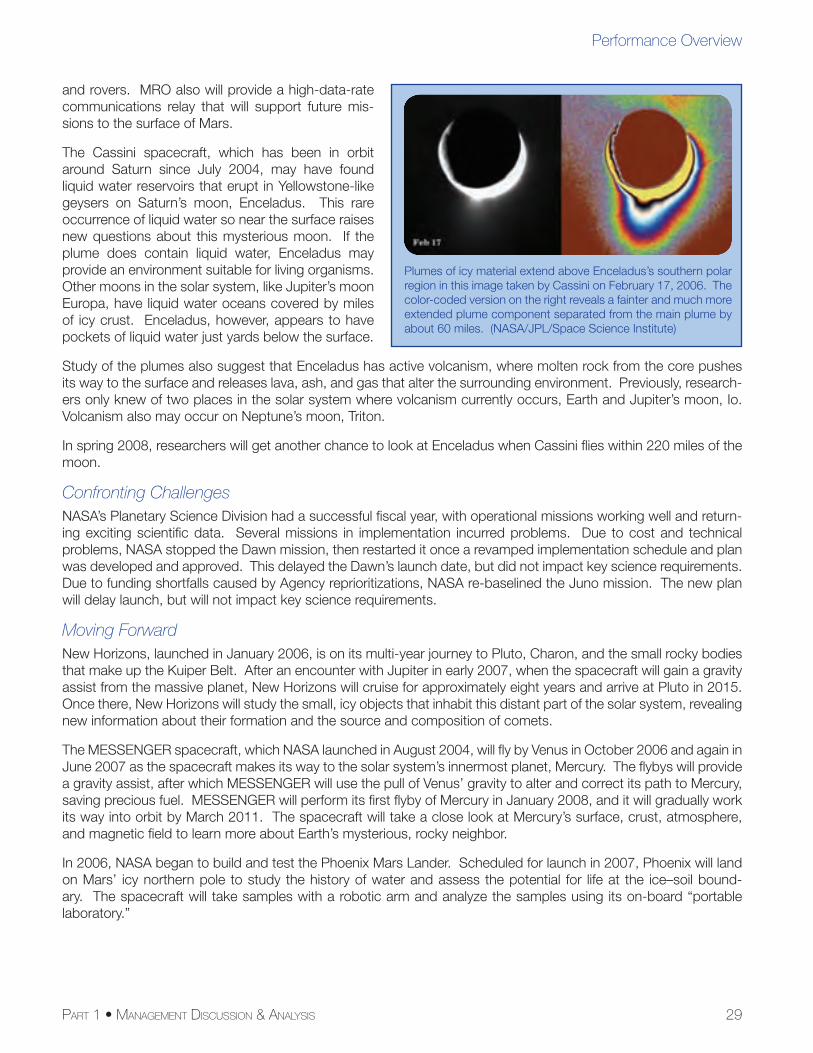
29PART 1 • MANAGEMENT DISCUSSION & ANALYSIS
Performance Overview
and rovers. MRO also will provide a high-data-rate communications relay that will support future mis-sions to the surface of Mars.
The Cassini spacecraft, which has been in orbit around Saturn since July 2004, may have found liquid water reservoirs that erupt in Yellowstone-like geysers on Saturn’s moon, Enceladus. This rare occurrence of liquid water so near the surface raises new questions about this mysterious moon. If the plume does contain liquid water, Enceladus may provide an environment suitable for living organisms. Other moons in the solar system, like Jupiter’s moon Europa, have liquid water oceans covered by miles of icy crust. Enceladus, however, appears to have pockets of liquid water just yards below the surface.
Study of the plumes also suggest that Enceladus has active volcanism, where molten rock from the core pushes its way to the surface and releases lava, ash, and gas that alter the surrounding environment. Previously, research-ers only knew of two places in the solar system where volcanism currently occurs, Earth and Jupiter’s moon, Io. Volcanism also may occur on Neptune’s moon, Triton.
In spring 2008, researchers will get another chance to look at Enceladus when Cassini fl ies within 220 miles of the moon.
Confronting ChallengesNASA’s Planetary Science Division had a successful fi scal year, with operational missions working well and return-ing exciting scientifi c data. Several missions in implementation incurred problems. Due to cost and technical problems, NASA stopped the Dawn mission, then restarted it once a revamped implementation schedule and plan was developed and approved. This delayed the Dawn’s launch date, but did not impact key science requirements. Due to funding shortfalls caused by Agency reprioritizations, NASA re-baselined the Juno mission. The new plan will delay launch, but will not impact key science requirements.
Moving ForwardNew Horizons, launched in January 2006, is on its multi-year journey to Pluto, Charon, and the small rocky bodies that make up the Kuiper Belt. After an encounter with Jupiter in early 2007, when the spacecraft will gain a gravity assist from the massive planet, New Horizons will cruise for approximately eight years and arrive at Pluto in 2015. Once there, New Horizons will study the small, icy objects that inhabit this distant part of the solar system, revealing new information about their formation and the source and composition of comets.
The MESSENGER spacecraft, which NASA launched in August 2004, will fl y by Venus in October 2006 and again in June 2007 as the spacecraft makes its way to the solar system’s innermost planet, Mercury. The fl ybys will provide a gravity assist, after which MESSENGER will use the pull of Venus’ gravity to alter and correct its path to Mercury, saving precious fuel. MESSENGER will perform its fi rst fl yby of Mercury in January 2008, and it will gradually work its way into orbit by March 2011. The spacecraft will take a close look at Mercury’s surface, crust, atmosphere, and magnetic fi eld to learn more about Earth’s mysterious, rocky neighbor.
In 2006, NASA began to build and test the Phoenix Mars Lander. Scheduled for launch in 2007, Phoenix will land on Mars’ icy northern pole to study the history of water and assess the potential for life at the ice–soil bound-ary. The spacecraft will take samples with a robotic arm and analyze the samples using its on-board “portable laboratory.”
Plumes of icy material extend above Enceladus’s southern polar region in this image taken by Cassini on February 17, 2006. The color-coded version on the right reveals a fainter and much more extended plume component separated from the main plume by about 60 miles. (NASA/JPL/Space Science Institute)
30 NASA FY 2006 PERFORMANCE AND ACCOUNTABILITY REPORT
Throughout 2006, the Dawn mission underwent review, and engineers began preparing the spacecraft for launch in summer 2007. Dawn will study two large asteroids, 1 Ceres and 4 Vesta, to help scientists learn more about the conditions and processes that formed the solar system.
Also in 2006, NASA initiated the implementation phase of the Mars Science Laboratory (MSL) mission. MSL is the next fl agship mission to conduct exploration of the solar system. This challenging mission, planned for launch in 2009, is a rover the size of a compact car. It boasts a suite of 10 scientifi c instruments that will conduct defi nitive mineralogy, search for organic compounds, study Mars’s meteorology, and explore the potential past and present habitability of Mars. The largest lander since Viking in the 1970s, MSL’s technologies will pave the way for future missions to planetary surfaces and directly benefi t eventual human exploration of Mars.
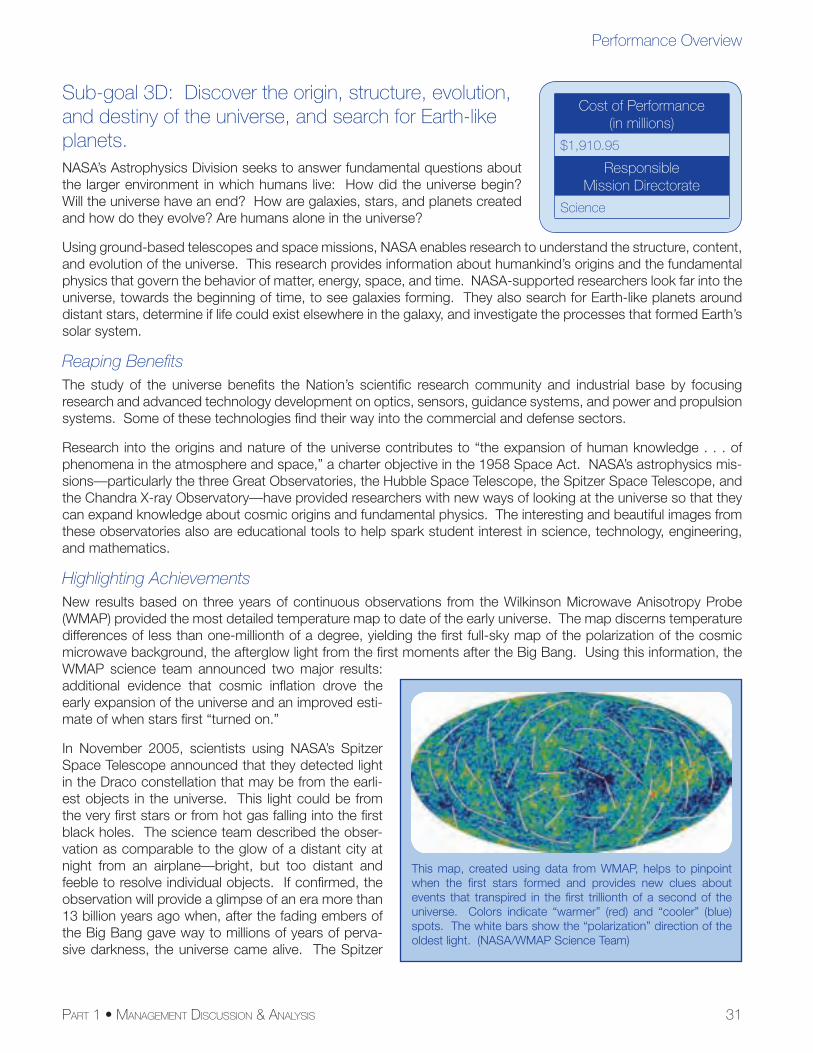
31PART 1 • MANAGEMENT DISCUSSION & ANALYSIS
Performance Overview
Sub-goal 3D: Discover the origin, structure, evolution, and destiny of the universe, and search for Earth-like planets.NASA’s Astrophysics Division seeks to answer fundamental questions about the larger environment in which humans live: How did the universe begin? Will the universe have an end? How are galaxies, stars, and planets created and how do they evolve? Are humans alone in the universe?
Using ground-based telescopes and space missions, NASA enables research to understand the structure, content, and evolution of the universe. This research provides information about humankind’s origins and the fundamental physics that govern the behavior of matter, energy, space, and time. NASA-supported researchers look far into the universe, towards the beginning of time, to see galaxies forming. They also search for Earth-like planets around distant stars, determine if life could exist elsewhere in the galaxy, and investigate the processes that formed Earth’s solar system.
Reaping Benefi tsThe study of the universe benefi ts the Nation’s scientifi c research community and industrial base by focusing research and advanced technology development on optics, sensors, guidance systems, and power and propulsion systems. Some of these technologies fi nd their way into the commercial and defense sectors.
Research into the origins and nature of the universe contributes to “the expansion of human knowledge . . . of phenomena in the atmosphere and space,” a charter objective in the 1958 Space Act. NASA’s astrophysics mis-sions—particularly the three Great Observatories, the Hubble Space Telescope, the Spitzer Space Telescope, and the Chandra X-ray Observatory—have provided researchers with new ways of looking at the universe so that they can expand knowledge about cosmic origins and fundamental physics. The interesting and beautiful images from these observatories also are educational tools to help spark student interest in science, technology, engineering, and mathematics.
Highlighting AchievementsNew results based on three years of continuous observations from the Wilkinson Microwave Anisotropy Probe (WMAP) provided the most detailed temperature map to date of the early universe. The map discerns temperature differences of less than one-millionth of a degree, yielding the fi rst full-sky map of the polarization of the cosmic microwave background, the afterglow light from the fi rst moments after the Big Bang. Using this information, the WMAP science team announced two major results: additional evidence that cosmic infl ation drove the early expansion of the universe and an improved esti-mate of when stars fi rst “turned on.”
In November 2005, scientists using NASA’s Spitzer Space Telescope announced that they detected light in the Draco constellation that may be from the earli-est objects in the universe. This light could be from the very fi rst stars or from hot gas falling into the fi rst black holes. The science team described the obser-vation as comparable to the glow of a distant city at night from an airplane—bright, but too distant and feeble to resolve individual objects. If confi rmed, the observation will provide a glimpse of an era more than 13 billion years ago when, after the fading embers of the Big Bang gave way to millions of years of perva-sive darkness, the universe came alive. The Spitzer
Cost of Performance(in millions)
$1,910.95
ResponsibleMission Directorate
Science
This map, created using data from WMAP, helps to pinpoint when the fi rst stars formed and provides new clues about events that transpired in the fi rst trillionth of a second of the universe. Colors indicate “warmer” (red) and “cooler” (blue) spots. The white bars show the “polarization” direction of the oldest light. (NASA/WMAP Science Team)
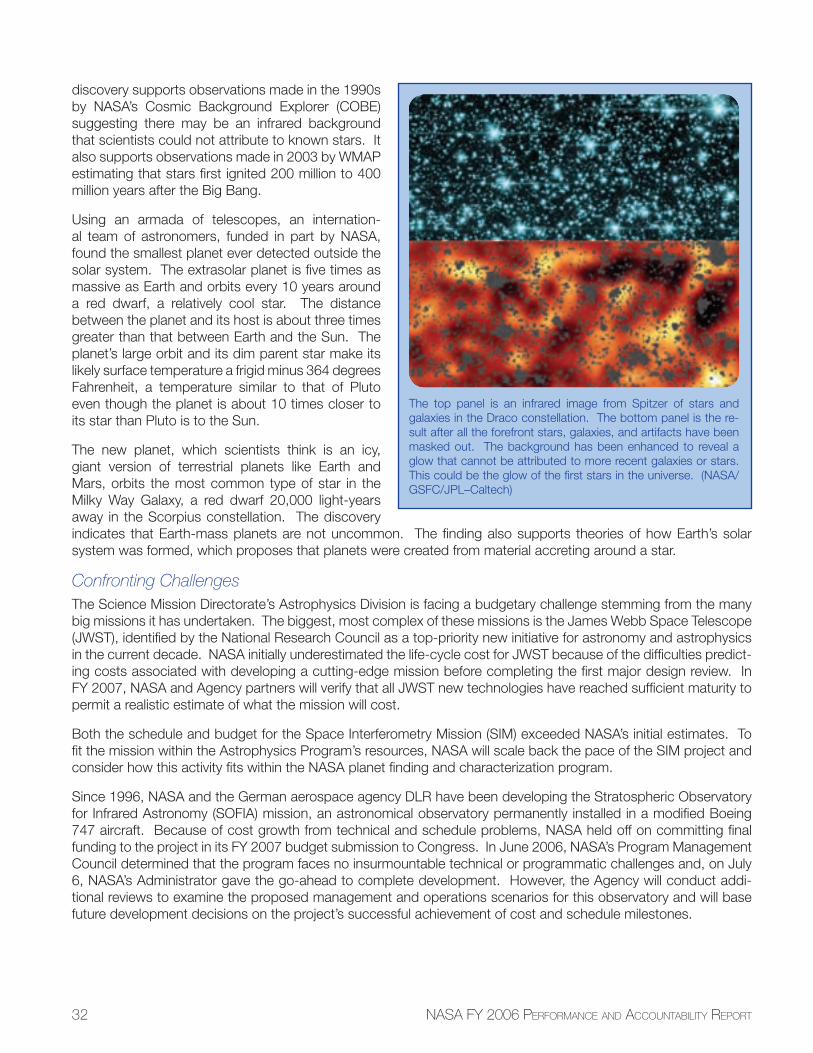
32 NASA FY 2006 PERFORMANCE AND ACCOUNTABILITY REPORT
discovery supports observations made in the 1990s by NASA’s Cosmic Background Explorer (COBE) suggesting there may be an infrared background that scientists could not attribute to known stars. It also supports observations made in 2003 by WMAP estimating that stars fi rst ignited 200 million to 400 million years after the Big Bang.
Using an armada of telescopes, an internation-al team of astronomers, funded in part by NASA, found the smallest planet ever detected outside the solar system. The extrasolar planet is fi ve times as massive as Earth and orbits every 10 years around a red dwarf, a relatively cool star. The distance between the planet and its host is about three times greater than that between Earth and the Sun. The planet’s large orbit and its dim parent star make its likely surface temperature a frigid minus 364 degrees Fahrenheit, a temperature similar to that of Pluto even though the planet is about 10 times closer to its star than Pluto is to the Sun.
The new planet, which scientists think is an icy, giant version of terrestrial planets like Earth and Mars, orbits the most common type of star in the Milky Way Galaxy, a red dwarf 20,000 light-years away in the Scorpius constellation. The discovery indicates that Earth-mass planets are not uncommon. The fi nding also supports theories of how Earth’s solar system was formed, which proposes that planets were created from material accreting around a star.
Confronting ChallengesThe Science Mission Directorate’s Astrophysics Division is facing a budgetary challenge stemming from the many big missions it has undertaken. The biggest, most complex of these missions is the James Webb Space Telescope (JWST), identifi ed by the National Research Council as a top-priority new initiative for astronomy and astrophysics in the current decade. NASA initially underestimated the life-cycle cost for JWST because of the diffi culties predict-ing costs associated with developing a cutting-edge mission before completing the fi rst major design review. In FY 2007, NASA and Agency partners will verify that all JWST new technologies have reached suffi cient maturity to permit a realistic estimate of what the mission will cost.
Both the schedule and budget for the Space Interferometry Mission (SIM) exceeded NASA’s initial estimates. To fi t the mission within the Astrophysics Program’s resources, NASA will scale back the pace of the SIM project and consider how this activity fi ts within the NASA planet fi nding and characterization program.
Since 1996, NASA and the German aerospace agency DLR have been developing the Stratospheric Observatory for Infrared Astronomy (SOFIA) mission, an astronomical observatory permanently installed in a modifi ed Boeing 747 aircraft. Because of cost growth from technical and schedule problems, NASA held off on committing fi nal funding to the project in its FY 2007 budget submission to Congress. In June 2006, NASA’s Program Management Council determined that the program faces no insurmountable technical or programmatic challenges and, on July 6, NASA’s Administrator gave the go-ahead to complete development. However, the Agency will conduct addi-tional reviews to examine the proposed management and operations scenarios for this observatory and will base future development decisions on the project’s successful achievement of cost and schedule milestones.
The top panel is an infrared image from Spitzer of stars and galaxies in the Draco constellation. The bottom panel is the re-sult after all the forefront stars, galaxies, and artifacts have been masked out. The background has been enhanced to reveal a glow that cannot be attributed to more recent galaxies or stars. This could be the glow of the fi rst stars in the universe. (NASA/GSFC/JPL–Caltech)
33PART 1 • MANAGEMENT DISCUSSION & ANALYSIS
Performance Overview
Moving ForwardSOFIA passed a major milestone in August 2006 when its Boeing 747 aircraft taxied down a runway in Texas under its own power. The SOFIA Aircraft Operations Team will conduct the fi rst test fl ight in early 2007.
In FY 2006, the Stanford Linear Accelerator Center delivered to NASA the Gamma-ray Large Area Space Telescope’s (GLAST’s) primary instrument, the Large Area Telescope. The GLAST mission will improve scientists’ understanding of the structure of the universe by analyzing the direction, energy, and arrival time of celestial high-energy gamma rays. GLAST will study the mechanisms of galaxies possessing a central core, or nuclei, that produces more radiation than the rest of the galaxy. It also will study dark matter, supernova remnants, pulsars, and rotating neutron stars, providing information crucial to solving the mysteries of high-energy gamma ray sources. NASA continues to prepare GLAST for launch in Fall 2007.
NASA’s Astrophysics Division also has other observatory missions—including JWST, the Wide fi eld Infrared Survey Explorer (WISE), and the Kepler mission—in formulation or development for launch near the end of the decade or early in the next decade. Managers for the Beyond Einstein Program have deferred selecting the program’s next mission until a program-level review is completed. To aid with mission selection, program engineers will assess technology readiness for several mission options, including the Joint Dark Energy Mission (JDEM, a joint activity of NASA and the Department of Energy), Constellation–X (Con–X), the Laser Interferometer Space Antenna (LISA), Cosmic Microwave Background Polarization Probe (CMBPol), and the Black Hole Finder Probe (BHFP). The Beyond Einstein Program develops missions that study the physics of phenomena, like black holes, dark energy, and the Big Bang, predicted by several of Albert Einstein’s theories.
34 NASA FY 2006 PERFORMANCE AND ACCOUNTABILITY REPORT
Sub-goal 3E: Advance knowledge in the fundamental disciplines of aeronautics, and develop technologies for safer aircraft and higher capacity airspace systems.NASA’s Aeronautics Research Mission Directorate conducts high-quality, innovative research to expand the boundaries of aeronautical knowledge for the benefi t of the broad aeronautics community, which includes the Agency’s partners in academia, industry, and other government agencies.
Reaping Benefi tsNASA’s aeronautics research leads to the development of revolutionary concepts, technologies, and capabilities that enable revolutionary change to both the airspace system and the aircraft that fl y within it, facilitating a safer, more environmentally friendly, and more effi cient air transportation system.
NASA’s aeronautics research also supports the Agency’s space exploration Strategic Goals. The Aeronautics Research Mission Directorate conducts research in key aeronautics disciplines such as aerodynamics, aerothermo-dynamics, materials, structures, and fl ight controls to advance the Nation’s capabilities for safe fl ight through any atmosphere at any speed, be it our own, or that of another planet.
Highlighting AchievementsDuring FY 2006, NASA initiated a comprehensive restructuring of the Aeronautics Research Mission Directorate to ensure that it pursues long-term, cutting-edge research that expands the boundaries of aeronautical knowledge for the benefi t of the broad aeronautics community, including the Agency’s partners in academia, industry and other government agencies. Three core principles guided the restructuring:
1. Dedicate NASA aeronautics initiatives to the mastery and intellectual stewardship of the core competencies of aeronautics for the Nation in all fl ight regimes;
2. Focus research in areas that are appropriate to NASA’s unique capabilities; and
3. Address the fundamental research needs of the Next Generation Air Transportation System (NGATS) while working closely with Agency partners in the Joint Planning and Development Offi ce (JPDO).
Given these three principles, NASA then established the four programs within the Aeronautics Research Mission Directorate: the Fundamental Aeronautics Program; the Aviation Safety Program; the Airspace Systems Program; and the Aeronautics Test Program. The Fundamental Aeronautics Program conducts cutting-edge research that produces concepts, tools, and technologies that enable the design of vehicles that fl y through any atmosphere at any speed. The Aviation Safety Program is focused on developing revolutionary tools, methods, and technologies that will improve the inherent safety attributes of current and future aircraft that will be operating in the evolving National Airspace System. The Airspace Systems Program directly addresses the fundamental air traffi c manage-ment research needs of the NGATS. This research will yield revolutionary concepts, capabilities, and technologies that will enable signifi cant increases in the capacity, effi ciency and fl exibility of the National Airspace System. The Aeronautics Test Program is ensuring the strategic availability and accessibility of a critical suite of aeronautics test facilities necessary to meet aeronautics, Agency, and national needs.
The Aeronautics Research Mission Directorate established a four-step approach to putting together technical plans in the ten aeronautics projects in our four aeronautics programs. The approach was designed to enable us to foster close collaboration with and to facilitate the exchange of ideas and information among researchers at NASA, industry, academia, and other government agencies, in a manner that benefi ts the community broadly. The four steps were:
1. NASA researchers, with input from other government agency partners, developed preliminary 10-year road-maps for each program including technical milestones for each project.
Cost of Performance(in millions)
$1,050.00
ResponsibleMission Directorate
Aeronautics Research
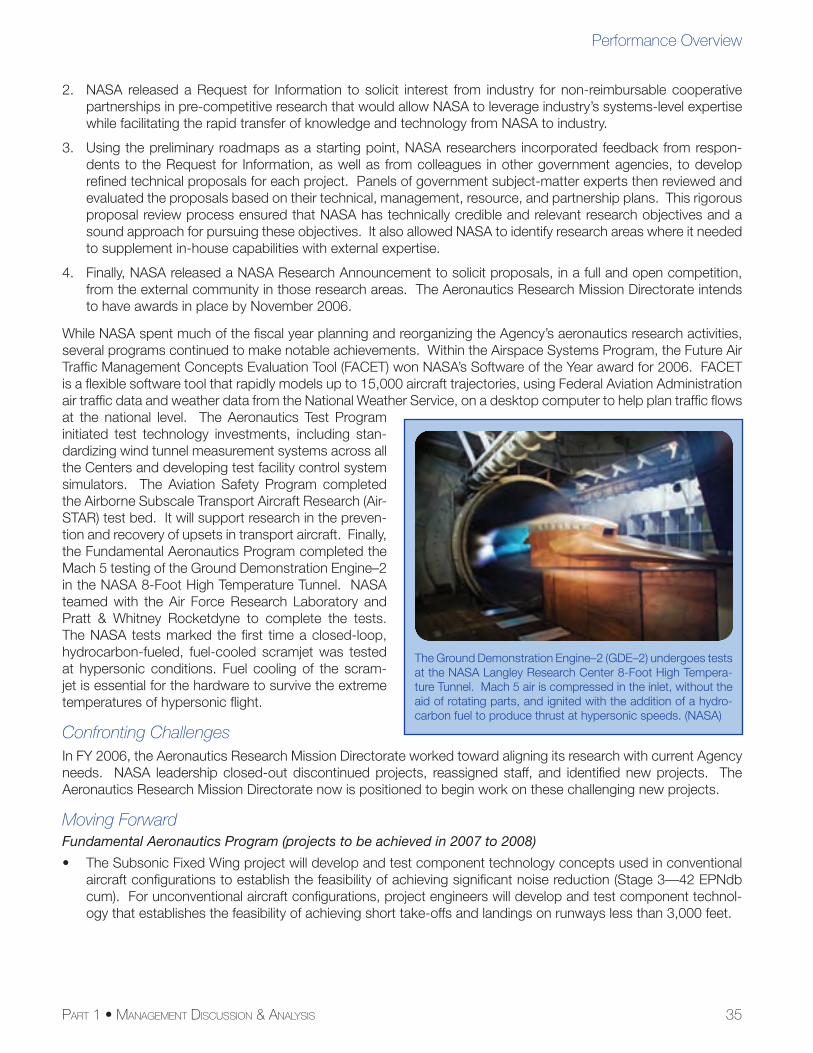
35PART 1 • MANAGEMENT DISCUSSION & ANALYSIS
Performance Overview
2. NASA released a Request for Information to solicit interest from industry for non-reimbursable cooperative partnerships in pre-competitive research that would allow NASA to leverage industry’s systems-level expertise while facilitating the rapid transfer of knowledge and technology from NASA to industry.
3. Using the preliminary roadmaps as a starting point, NASA researchers incorporated feedback from respon-dents to the Request for Information, as well as from colleagues in other government agencies, to develop refi ned technical proposals for each project. Panels of government subject-matter experts then reviewed and evaluated the proposals based on their technical, management, resource, and partnership plans. This rigorous proposal review process ensured that NASA has technically credible and relevant research objectives and a sound approach for pursuing these objectives. It also allowed NASA to identify research areas where it needed to supplement in-house capabilities with external expertise.
4. Finally, NASA released a NASA Research Announcement to solicit proposals, in a full and open competition, from the external community in those research areas. The Aeronautics Research Mission Directorate intends to have awards in place by November 2006.
While NASA spent much of the fi scal year planning and reorganizing the Agency’s aeronautics research activities, several programs continued to make notable achievements. Within the Airspace Systems Program, the Future Air Traffi c Management Concepts Evaluation Tool (FACET) won NASA’s Software of the Year award for 2006. FACET is a fl exible software tool that rapidly models up to 15,000 aircraft trajectories, using Federal Aviation Administration air traffi c data and weather data from the National Weather Service, on a desktop computer to help plan traffi c fl ows at the national level. The Aeronautics Test Program initiated test technology investments, including stan-dardizing wind tunnel measurement systems across all the Centers and developing test facility control system simulators. The Aviation Safety Program completed the Airborne Subscale Transport Aircraft Research (Air-STAR) test bed. It will support research in the preven-tion and recovery of upsets in transport aircraft. Finally, the Fundamental Aeronautics Program completed the Mach 5 testing of the Ground Demonstration Engine–2 in the NASA 8-Foot High Temperature Tunnel. NASA teamed with the Air Force Research Laboratory and Pratt & Whitney Rocketdyne to complete the tests. The NASA tests marked the fi rst time a closed-loop, hydrocarbon-fueled, fuel-cooled scramjet was tested at hypersonic conditions. Fuel cooling of the scram-jet is essential for the hardware to survive the extreme temperatures of hypersonic fl ight.
Confronting ChallengesIn FY 2006, the Aeronautics Research Mission Directorate worked toward aligning its research with current Agency needs. NASA leadership closed-out discontinued projects, reassigned staff, and identifi ed new projects. The Aeronautics Research Mission Directorate now is positioned to begin work on these challenging new projects.
Moving ForwardFundamental Aeronautics Program (projects to be achieved in 2007 to 2008)
• The Subsonic Fixed Wing project will develop and test component technology concepts used in conventional aircraft confi gurations to establish the feasibility of achieving signifi cant noise reduction (Stage 3—42 EPNdb cum). For unconventional aircraft confi gurations, project engineers will develop and test component technol-ogy that establishes the feasibility of achieving short take-offs and landings on runways less than 3,000 feet.
The Ground Demonstration Engine–2 (GDE–2) undergoes tests at the NASA Langley Research Center 8-Foot High Tempera-ture Tunnel. Mach 5 air is compressed in the inlet, without the aid of rotating parts, and ignited with the addition of a hydro-carbon fuel to produce thrust at hypersonic speeds. (NASA)
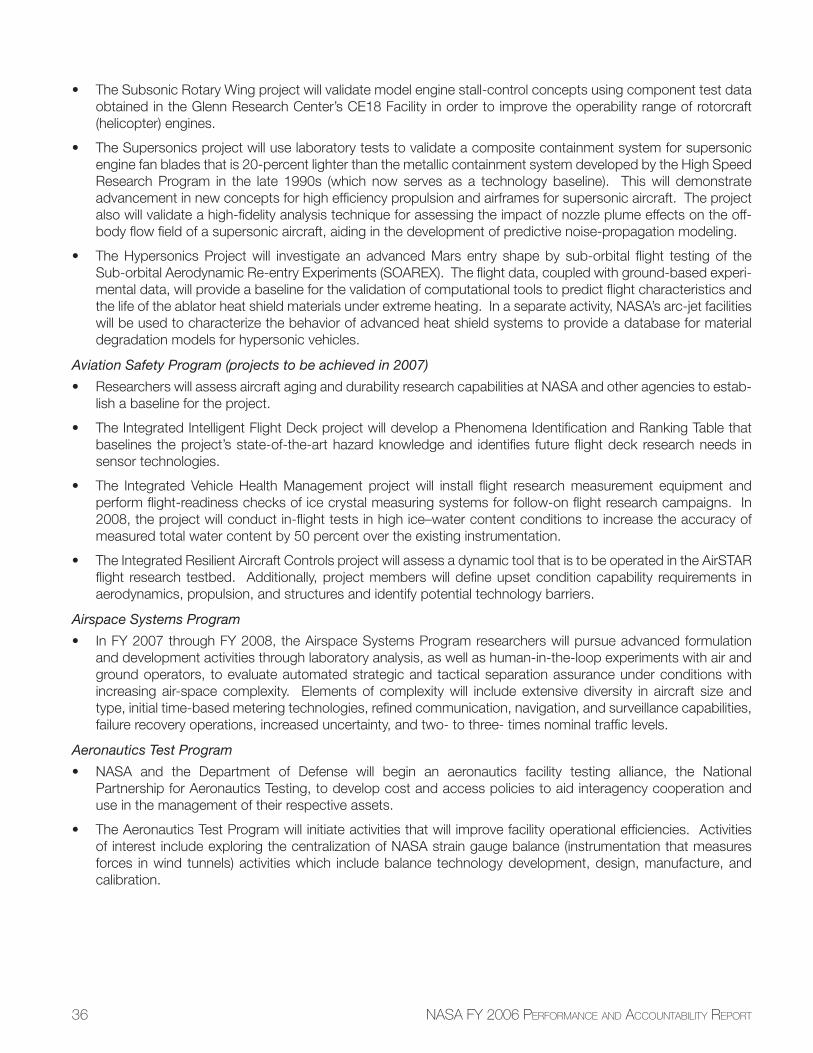
36 NASA FY 2006 PERFORMANCE AND ACCOUNTABILITY REPORT
• The Subsonic Rotary Wing project will validate model engine stall-control concepts using component test data obtained in the Glenn Research Center’s CE18 Facility in order to improve the operability range of rotorcraft (helicopter) engines.
• The Supersonics project will use laboratory tests to validate a composite containment system for supersonic engine fan blades that is 20-percent lighter than the metallic containment system developed by the High Speed Research Program in the late 1990s (which now serves as a technology baseline). This will demonstrate advancement in new concepts for high effi ciency propulsion and airframes for supersonic aircraft. The project also will validate a high-fi delity analysis technique for assessing the impact of nozzle plume effects on the off-body fl ow fi eld of a supersonic aircraft, aiding in the development of predictive noise-propagation modeling.
• The Hypersonics Project will investigate an advanced Mars entry shape by sub-orbital fl ight testing of the Sub-orbital Aerodynamic Re-entry Experiments (SOAREX). The fl ight data, coupled with ground-based experi-mental data, will provide a baseline for the validation of computational tools to predict fl ight characteristics and the life of the ablator heat shield materials under extreme heating. In a separate activity, NASA’s arc-jet facilities will be used to characterize the behavior of advanced heat shield systems to provide a database for material degradation models for hypersonic vehicles.
Aviation Safety Program (projects to be achieved in 2007)
• Researchers will assess aircraft aging and durability research capabilities at NASA and other agencies to estab-lish a baseline for the project.
• The Integrated Intelligent Flight Deck project will develop a Phenomena Identifi cation and Ranking Table that baselines the project’s state-of-the-art hazard knowledge and identifi es future fl ight deck research needs in sensor technologies.
• The Integrated Vehicle Health Management project will install fl ight research measurement equipment and perform fl ight-readiness checks of ice crystal measuring systems for follow-on fl ight research campaigns. In 2008, the project will conduct in-fl ight tests in high ice–water content conditions to increase the accuracy of measured total water content by 50 percent over the existing instrumentation.
• The Integrated Resilient Aircraft Controls project will assess a dynamic tool that is to be operated in the AirSTAR fl ight research testbed. Additionally, project members will defi ne upset condition capability requirements in aerodynamics, propulsion, and structures and identify potential technology barriers.
Airspace Systems Program
• In FY 2007 through FY 2008, the Airspace Systems Program researchers will pursue advanced formulation and development activities through laboratory analysis, as well as human-in-the-loop experiments with air and ground operators, to evaluate automated strategic and tactical separation assurance under conditions with increasing air-space complexity. Elements of complexity will include extensive diversity in aircraft size and type, initial time-based metering technologies, refi ned communication, navigation, and surveillance capabilities, failure recovery operations, increased uncertainty, and two- to three- times nominal traffi c levels.
Aeronautics Test Program
• NASA and the Department of Defense will begin an aeronautics facility testing alliance, the National Partnership for Aeronautics Testing, to develop cost and access policies to aid interagency cooperation and use in the management of their respective assets.
• The Aeronautics Test Program will initiate activities that will improve facility operational effi ciencies. Activities of interest include exploring the centralization of NASA strain gauge balance (instrumentation that measures forces in wind tunnels) activities which include balance technology development, design, manufacture, and calibration.
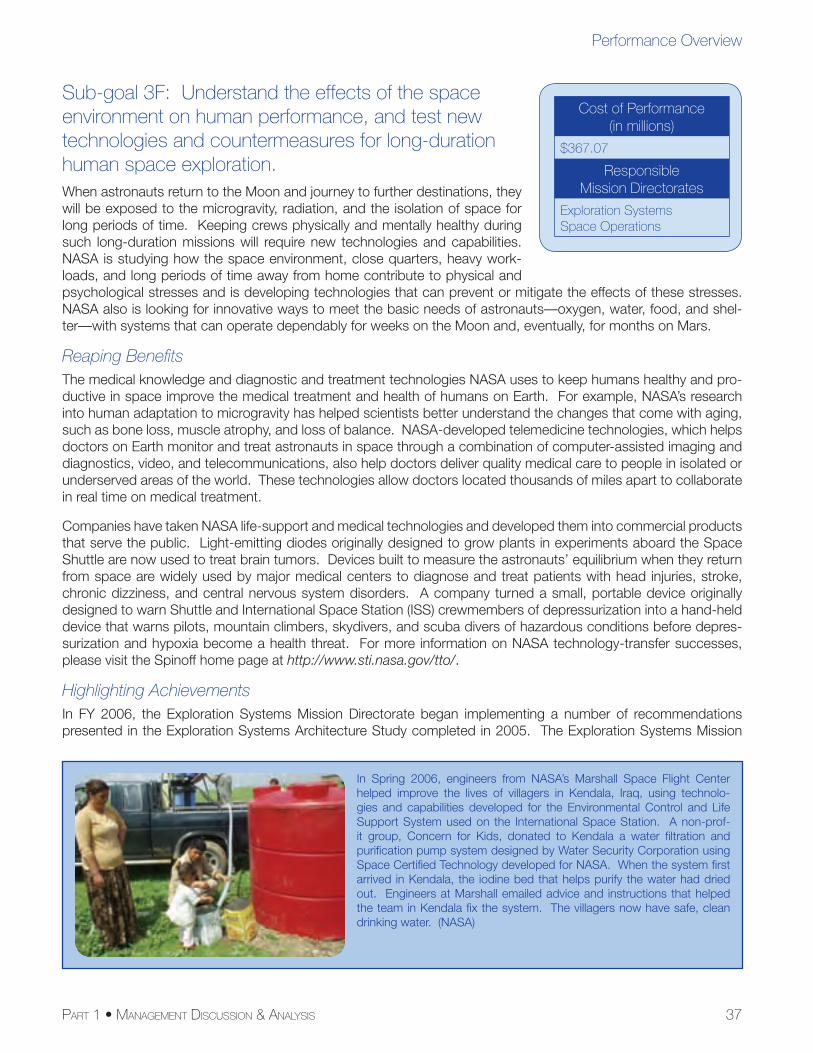
37PART 1 • MANAGEMENT DISCUSSION & ANALYSIS
Performance Overview
Sub-goal 3F: Understand the effects of the space environment on human performance, and test new technologies and countermeasures for long-duration human space exploration.When astronauts return to the Moon and journey to further destinations, they will be exposed to the microgravity, radiation, and the isolation of space for long periods of time. Keeping crews physically and mentally healthy during such long-duration missions will require new technologies and capabilities. NASA is studying how the space environment, close quarters, heavy work-loads, and long periods of time away from home contribute to physical and psychological stresses and is developing technologies that can prevent or mitigate the effects of these stresses. NASA also is looking for innovative ways to meet the basic needs of astronauts—oxygen, water, food, and shel-ter—with systems that can operate dependably for weeks on the Moon and, eventually, for months on Mars.
Reaping Benefi tsThe medical knowledge and diagnostic and treatment technologies NASA uses to keep humans healthy and pro-ductive in space improve the medical treatment and health of humans on Earth. For example, NASA’s research into human adaptation to microgravity has helped scientists better understand the changes that come with aging, such as bone loss, muscle atrophy, and loss of balance. NASA-developed telemedicine technologies, which helps doctors on Earth monitor and treat astronauts in space through a combination of computer-assisted imaging and diagnostics, video, and telecommunications, also help doctors deliver quality medical care to people in isolated or underserved areas of the world. These technologies allow doctors located thousands of miles apart to collaborate in real time on medical treatment.
Companies have taken NASA life-support and medical technologies and developed them into commercial products that serve the public. Light-emitting diodes originally designed to grow plants in experiments aboard the Space Shuttle are now used to treat brain tumors. Devices built to measure the astronauts’ equilibrium when they return from space are widely used by major medical centers to diagnose and treat patients with head injuries, stroke, chronic dizziness, and central nervous system disorders. A company turned a small, portable device originally designed to warn Shuttle and International Space Station (ISS) crewmembers of depressurization into a hand-held device that warns pilots, mountain climbers, skydivers, and scuba divers of hazardous conditions before depres-surization and hypoxia become a health threat. For more information on NASA technology-transfer successes, please visit the Spinoff home page at http://www.sti.nasa.gov/tto/.
Highlighting AchievementsIn FY 2006, the Exploration Systems Mission Directorate began implementing a number of recommendations presented in the Exploration Systems Architecture Study completed in 2005. The Exploration Systems Mission
Cost of Performance(in millions)
$367.07
ResponsibleMission Directorates
Exploration SystemsSpace Operations
In Spring 2006, engineers from NASA’s Marshall Space Flight Center helped improve the lives of villagers in Kendala, Iraq, using technolo-gies and capabilities developed for the Environmental Control and Life Support System used on the International Space Station. A non-prof-it group, Concern for Kids, donated to Kendala a water fi ltration and purifi cation pump system designed by Water Security Corporation using Space Certifi ed Technology developed for NASA. When the system fi rst arrived in Kendala, the iodine bed that helps purify the water had dried out. Engineers at Marshall emailed advice and instructions that helped the team in Kendala fi x the system. The villagers now have safe, clean drinking water. (NASA)
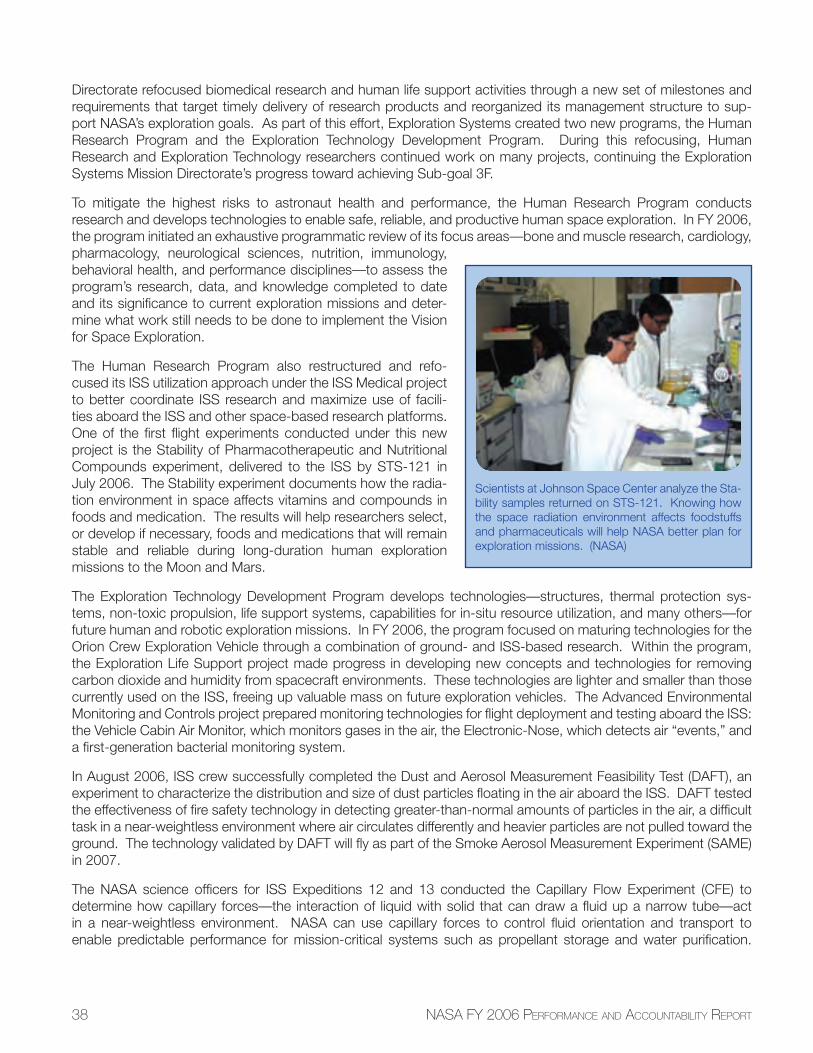
38 NASA FY 2006 PERFORMANCE AND ACCOUNTABILITY REPORT
Directorate refocused biomedical research and human life support activities through a new set of milestones and requirements that target timely delivery of research products and reorganized its management structure to sup-port NASA’s exploration goals. As part of this effort, Exploration Systems created two new programs, the Human Research Program and the Exploration Technology Development Program. During this refocusing, Human Research and Exploration Technology researchers continued work on many projects, continuing the Exploration Systems Mission Directorate’s progress toward achieving Sub-goal 3F.
To mitigate the highest risks to astronaut health and performance, the Human Research Program conducts research and develops technologies to enable safe, reliable, and productive human space exploration. In FY 2006, the program initiated an exhaustive programmatic review of its focus areas—bone and muscle research, cardiology, pharmacology, neurological sciences, nutrition, immunology, behavioral health, and performance disciplines—to assess the program’s research, data, and knowledge completed to date and its signifi cance to current exploration missions and deter-mine what work still needs to be done to implement the Vision for Space Exploration.
The Human Research Program also restructured and refo-cused its ISS utilization approach under the ISS Medical project to better coordinate ISS research and maximize use of facili-ties aboard the ISS and other space-based research platforms. One of the fi rst fl ight experiments conducted under this new project is the Stability of Pharmacotherapeutic and Nutritional Compounds experiment, delivered to the ISS by STS-121 in July 2006. The Stability experiment documents how the radia-tion environment in space affects vitamins and compounds in foods and medication. The results will help researchers select, or develop if necessary, foods and medications that will remain stable and reliable during long-duration human exploration missions to the Moon and Mars.
The Exploration Technology Development Program develops technologies—structures, thermal protection sys-tems, non-toxic propulsion, life support systems, capabilities for in-situ resource utilization, and many others—for future human and robotic exploration missions. In FY 2006, the program focused on maturing technologies for the Orion Crew Exploration Vehicle through a combination of ground- and ISS-based research. Within the program, the Exploration Life Support project made progress in developing new concepts and technologies for removing carbon dioxide and humidity from spacecraft environments. These technologies are lighter and smaller than those currently used on the ISS, freeing up valuable mass on future exploration vehicles. The Advanced Environmental Monitoring and Controls project prepared monitoring technologies for fl ight deployment and testing aboard the ISS: the Vehicle Cabin Air Monitor, which monitors gases in the air, the Electronic-Nose, which detects air “events,” and a fi rst-generation bacterial monitoring system.
In August 2006, ISS crew successfully completed the Dust and Aerosol Measurement Feasibility Test (DAFT), an experiment to characterize the distribution and size of dust particles fl oating in the air aboard the ISS. DAFT tested the effectiveness of fi re safety technology in detecting greater-than-normal amounts of particles in the air, a diffi cult task in a near-weightless environment where air circulates differently and heavier particles are not pulled toward the ground. The technology validated by DAFT will fl y as part of the Smoke Aerosol Measurement Experiment (SAME) in 2007.
The NASA science offi cers for ISS Expeditions 12 and 13 conducted the Capillary Flow Experiment (CFE) to determine how capillary forces—the interaction of liquid with solid that can draw a fl uid up a narrow tube—act in a near-weightless environment. NASA can use capillary forces to control fl uid orientation and transport to enable predictable performance for mission-critical systems such as propellant storage and water purifi cation.
Scientists at Johnson Space Center analyze the Sta-bility samples returned on STS-121. Knowing how the space radiation environment affects foodstuffs and pharmaceuticals will help NASA better plan for exploration missions. (NASA)
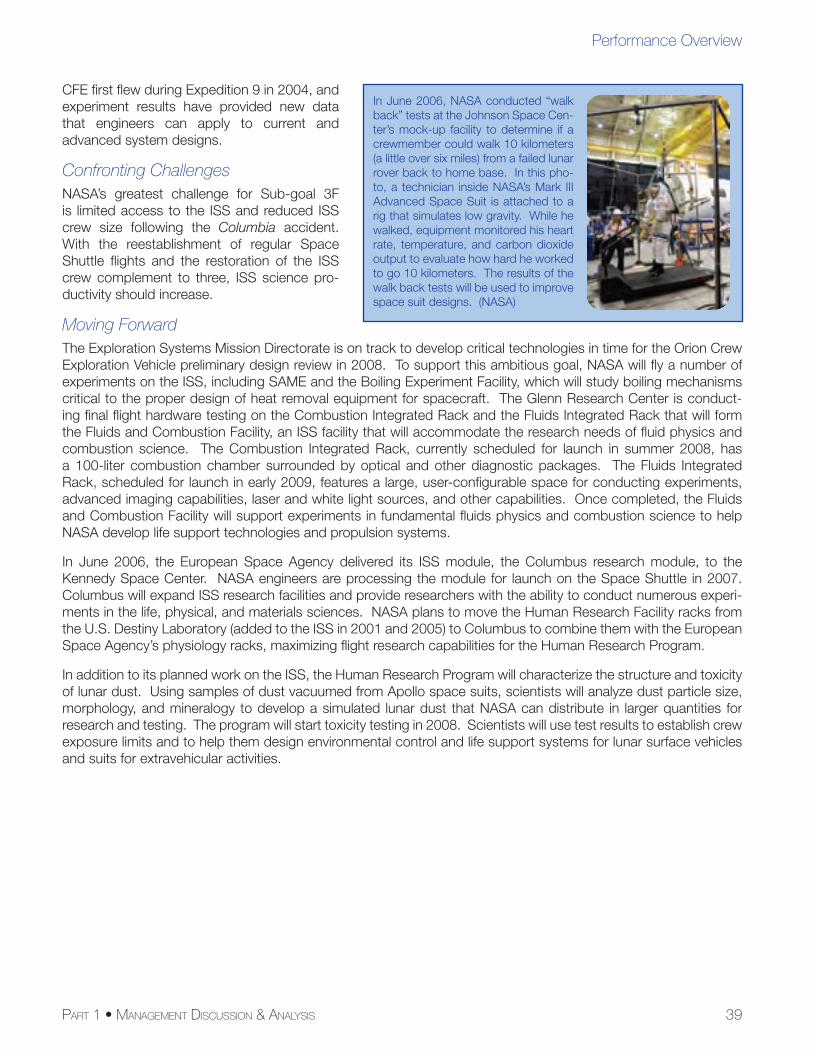
39PART 1 • MANAGEMENT DISCUSSION & ANALYSIS
Performance Overview
CFE fi rst fl ew during Expedition 9 in 2004, and experiment results have provided new data that engineers can apply to current and advanced system designs.
Confronting ChallengesNASA’s greatest challenge for Sub-goal 3F is limited access to the ISS and reduced ISS crew size following the Columbia accident. With the reestablishment of regular Space Shuttle fl ights and the restoration of the ISS crew complement to three, ISS science pro-ductivity should increase.
Moving ForwardThe Exploration Systems Mission Directorate is on track to develop critical technologies in time for the Orion Crew Exploration Vehicle preliminary design review in 2008. To support this ambitious goal, NASA will fl y a number of experiments on the ISS, including SAME and the Boiling Experiment Facility, which will study boiling mechanisms critical to the proper design of heat removal equipment for spacecraft. The Glenn Research Center is conduct-ing fi nal fl ight hardware testing on the Combustion Integrated Rack and the Fluids Integrated Rack that will form the Fluids and Combustion Facility, an ISS facility that will accommodate the research needs of fl uid physics and combustion science. The Combustion Integrated Rack, currently scheduled for launch in summer 2008, has a 100-liter combustion chamber surrounded by optical and other diagnostic packages. The Fluids Integrated Rack, scheduled for launch in early 2009, features a large, user-confi gurable space for conducting experiments, advanced imaging capabilities, laser and white light sources, and other capabilities. Once completed, the Fluids and Combustion Facility will support experiments in fundamental fl uids physics and combustion science to help NASA develop life support technologies and propulsion systems.
In June 2006, the European Space Agency delivered its ISS module, the Columbus research module, to the Kennedy Space Center. NASA engineers are processing the module for launch on the Space Shuttle in 2007. Columbus will expand ISS research facilities and provide researchers with the ability to conduct numerous experi-ments in the life, physical, and materials sciences. NASA plans to move the Human Research Facility racks from the U.S. Destiny Laboratory (added to the ISS in 2001 and 2005) to Columbus to combine them with the European Space Agency’s physiology racks, maximizing fl ight research capabilities for the Human Research Program.
In addition to its planned work on the ISS, the Human Research Program will characterize the structure and toxicity of lunar dust. Using samples of dust vacuumed from Apollo space suits, scientists will analyze dust particle size, morphology, and mineralogy to develop a simulated lunar dust that NASA can distribute in larger quantities for research and testing. The program will start toxicity testing in 2008. Scientists will use test results to establish crew exposure limits and to help them design environmental control and life support systems for lunar surface vehicles and suits for extravehicular activities.
In June 2006, NASA conducted “walk back” tests at the Johnson Space Cen-ter’s mock-up facility to determine if a crewmember could walk 10 kilometers (a little over six miles) from a failed lunar rover back to home base. In this pho-to, a technician inside NASA’s Mark III Advanced Space Suit is attached to a rig that simulates low gravity. While he walked, equipment monitored his heart rate, temperature, and carbon dioxide output to evaluate how hard he worked to go 10 kilometers. The results of the walk back tests will be used to improve space suit designs. (NASA)
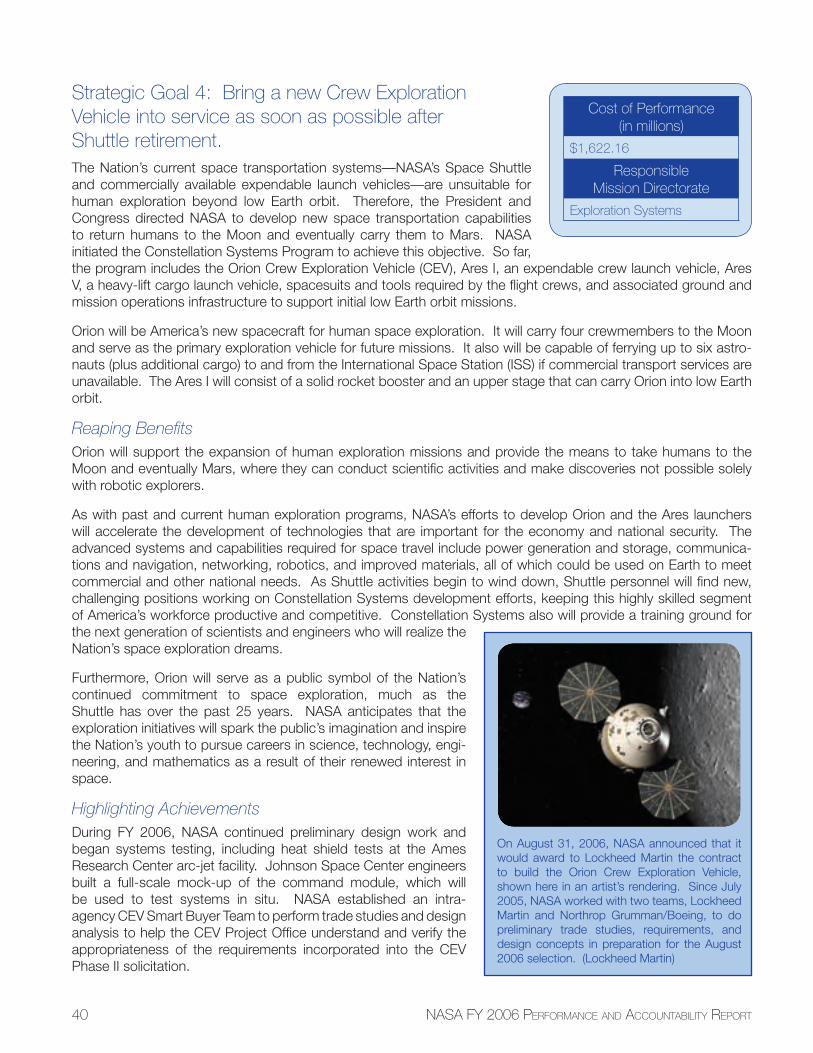
40 NASA FY 2006 PERFORMANCE AND ACCOUNTABILITY REPORT
Strategic Goal 4: Bring a new Crew Exploration Vehicle into service as soon as possible after Shuttle retirement.The Nation’s current space transportation systems—NASA’s Space Shuttle and commercially available expendable launch vehicles—are unsuitable for human exploration beyond low Earth orbit. Therefore, the President and Congress directed NASA to develop new space transportation capabilities to return humans to the Moon and eventually carry them to Mars. NASA initiated the Constellation Systems Program to achieve this objective. So far, the program includes the Orion Crew Exploration Vehicle (CEV), Ares I, an expendable crew launch vehicle, Ares V, a heavy-lift cargo launch vehicle, spacesuits and tools required by the fl ight crews, and associated ground and mission operations infrastructure to support initial low Earth orbit missions.
Orion will be America’s new spacecraft for human space exploration. It will carry four crewmembers to the Moon and serve as the primary exploration vehicle for future missions. It also will be capable of ferrying up to six astro-nauts (plus additional cargo) to and from the International Space Station (ISS) if commercial transport services are unavailable. The Ares I will consist of a solid rocket booster and an upper stage that can carry Orion into low Earth orbit.
Reaping Benefi tsOrion will support the expansion of human exploration missions and provide the means to take humans to the Moon and eventually Mars, where they can conduct scientifi c activities and make discoveries not possible solely with robotic explorers.
As with past and current human exploration programs, NASA’s efforts to develop Orion and the Ares launchers will accelerate the development of technologies that are important for the economy and national security. The advanced systems and capabilities required for space travel include power generation and storage, communica-tions and navigation, networking, robotics, and improved materials, all of which could be used on Earth to meet commercial and other national needs. As Shuttle activities begin to wind down, Shuttle personnel will fi nd new, challenging positions working on Constellation Systems development efforts, keeping this highly skilled segment of America’s workforce productive and competitive. Constellation Systems also will provide a training ground for the next generation of scientists and engineers who will realize the Nation’s space exploration dreams.
Furthermore, Orion will serve as a public symbol of the Nation’s continued commitment to space exploration, much as the Shuttle has over the past 25 years. NASA anticipates that the exploration initiatives will spark the public’s imagination and inspire the Nation’s youth to pursue careers in science, technology, engi-neering, and mathematics as a result of their renewed interest in space.
Highlighting AchievementsDuring FY 2006, NASA continued preliminary design work and began systems testing, including heat shield tests at the Ames Research Center arc-jet facility. Johnson Space Center engineers built a full-scale mock-up of the command module, which will be used to test systems in situ. NASA established an intra-agency CEV Smart Buyer Team to perform trade studies and design analysis to help the CEV Project Offi ce understand and verify the appropriateness of the requirements incorporated into the CEV Phase II solicitation.
Cost of Performance(in millions)
$1,622.16
ResponsibleMission Directorate
Exploration Systems
On August 31, 2006, NASA announced that it would award to Lockheed Martin the contract to build the Orion Crew Exploration Vehicle, shown here in an artist’s rendering. Since July 2005, NASA worked with two teams, Lockheed Martin and Northrop Grumman/Boeing, to do preliminary trade studies, requirements, and design concepts in preparation for the August 2006 selection. (Lockheed Martin)
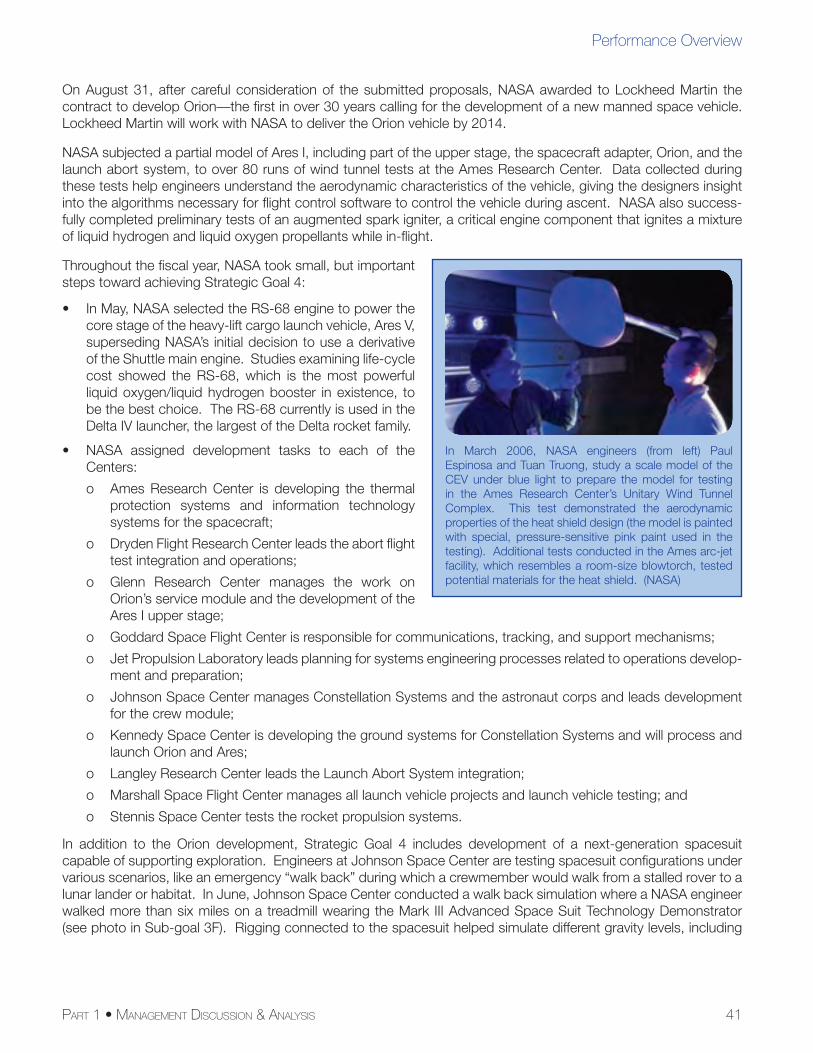
41PART 1 • MANAGEMENT DISCUSSION & ANALYSIS
Performance Overview
On August 31, after careful consideration of the submitted proposals, NASA awarded to Lockheed Martin the contract to develop Orion—the fi rst in over 30 years calling for the development of a new manned space vehicle. Lockheed Martin will work with NASA to deliver the Orion vehicle by 2014.
NASA subjected a partial model of Ares I, including part of the upper stage, the spacecraft adapter, Orion, and the launch abort system, to over 80 runs of wind tunnel tests at the Ames Research Center. Data collected during these tests help engineers understand the aerodynamic characteristics of the vehicle, giving the designers insight into the algorithms necessary for fl ight control software to control the vehicle during ascent. NASA also success-fully completed preliminary tests of an augmented spark igniter, a critical engine component that ignites a mixture of liquid hydrogen and liquid oxygen propellants while in-fl ight.
Throughout the fi scal year, NASA took small, but important steps toward achieving Strategic Goal 4:
• In May, NASA selected the RS-68 engine to power the core stage of the heavy-lift cargo launch vehicle, Ares V, superseding NASA’s initial decision to use a derivative of the Shuttle main engine. Studies examining life-cycle cost showed the RS-68, which is the most powerful liquid oxygen/liquid hydrogen booster in existence, to be the best choice. The RS-68 currently is used in the Delta IV launcher, the largest of the Delta rocket family.
• NASA assigned development tasks to each of the Centers:
o Ames Research Center is developing the thermal protection systems and information technology systems for the spacecraft;
o Dryden Flight Research Center leads the abort fl ight test integration and operations;
o Glenn Research Center manages the work on Orion’s service module and the development of the Ares I upper stage;
o Goddard Space Flight Center is responsible for communications, tracking, and support mechanisms;
o Jet Propulsion Laboratory leads planning for systems engineering processes related to operations develop-ment and preparation;
o Johnson Space Center manages Constellation Systems and the astronaut corps and leads development for the crew module;
o Kennedy Space Center is developing the ground systems for Constellation Systems and will process and launch Orion and Ares;
o Langley Research Center leads the Launch Abort System integration;
o Marshall Space Flight Center manages all launch vehicle projects and launch vehicle testing; and
o Stennis Space Center tests the rocket propulsion systems.
In addition to the Orion development, Strategic Goal 4 includes development of a next-generation spacesuit capable of supporting exploration. Engineers at Johnson Space Center are testing spacesuit confi gurations under various scenarios, like an emergency “walk back” during which a crewmember would walk from a stalled rover to a lunar lander or habitat. In June, Johnson Space Center conducted a walk back simulation where a NASA engineer walked more than six miles on a treadmill wearing the Mark III Advanced Space Suit Technology Demonstrator (see photo in Sub-goal 3F). Rigging connected to the spacesuit helped simulate different gravity levels, including
In March 2006, NASA engineers (from left) Paul Espinosa and Tuan Truong, study a scale model of the CEV under blue light to prepare the model for testing in the Ames Research Center’s Unitary Wind Tunnel Complex. This test demonstrated the aerodynamic properties of the heat shield design (the model is painted with special, pressure-sensitive pink paint used in the testing). Additional tests conducted in the Ames arc-jet facility, which resembles a room-size blowtorch, tested potential materials for the heat shield. (NASA)
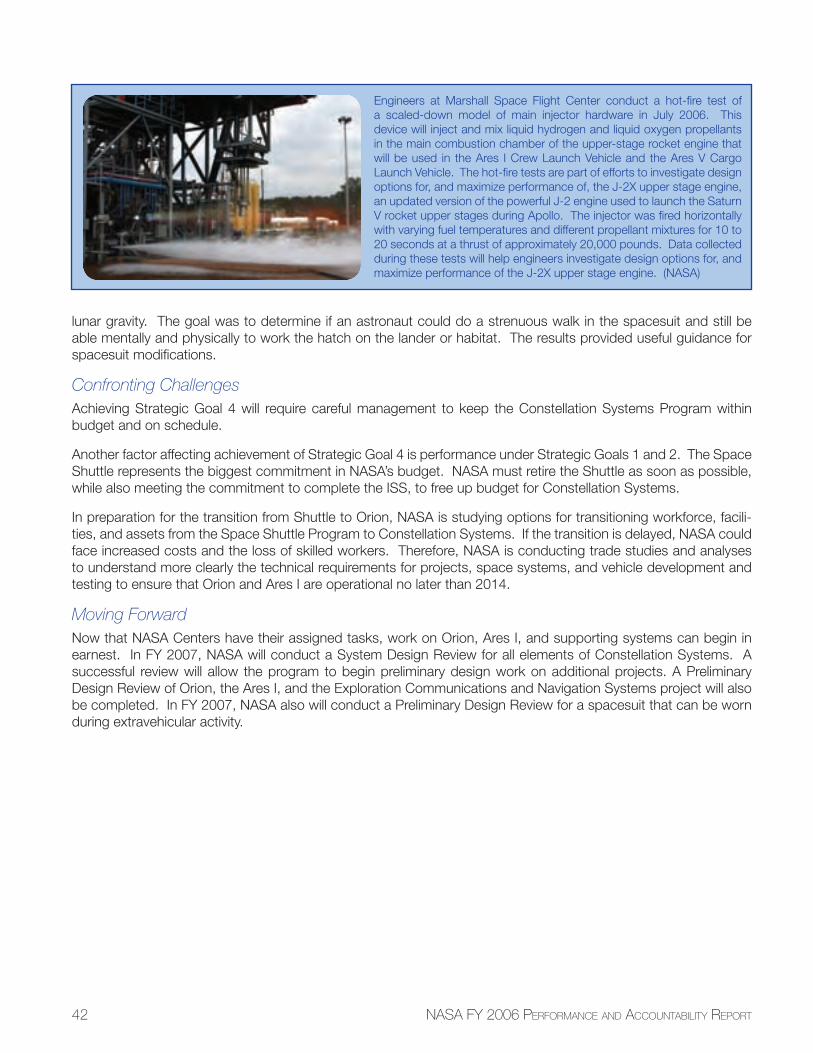
42 NASA FY 2006 PERFORMANCE AND ACCOUNTABILITY REPORT
lunar gravity. The goal was to determine if an astronaut could do a strenuous walk in the spacesuit and still be able mentally and physically to work the hatch on the lander or habitat. The results provided useful guidance for spacesuit modifi cations.
Confronting ChallengesAchieving Strategic Goal 4 will require careful management to keep the Constellation Systems Program within budget and on schedule.
Another factor affecting achievement of Strategic Goal 4 is performance under Strategic Goals 1 and 2. The Space Shuttle represents the biggest commitment in NASA’s budget. NASA must retire the Shuttle as soon as possible, while also meeting the commitment to complete the ISS, to free up budget for Constellation Systems.
In preparation for the transition from Shuttle to Orion, NASA is studying options for transitioning workforce, facili-ties, and assets from the Space Shuttle Program to Constellation Systems. If the transition is delayed, NASA could face increased costs and the loss of skilled workers. Therefore, NASA is conducting trade studies and analyses to understand more clearly the technical requirements for projects, space systems, and vehicle development and testing to ensure that Orion and Ares I are operational no later than 2014.
Moving ForwardNow that NASA Centers have their assigned tasks, work on Orion, Ares I, and supporting systems can begin in earnest. In FY 2007, NASA will conduct a System Design Review for all elements of Constellation Systems. A successful review will allow the program to begin preliminary design work on additional projects. A Preliminary Design Review of Orion, the Ares I, and the Exploration Communications and Navigation Systems project will also be completed. In FY 2007, NASA also will conduct a Preliminary Design Review for a spacesuit that can be worn during extravehicular activity.
Engineers at Marshall Space Flight Center conduct a hot-fi re test of a scaled-down model of main injector hardware in July 2006. This device will inject and mix liquid hydrogen and liquid oxygen propellants in the main combustion chamber of the upper-stage rocket engine that will be used in the Ares I Crew Launch Vehicle and the Ares V Cargo Launch Vehicle. The hot-fi re tests are part of efforts to investigate design options for, and maximize performance of, the J-2X upper stage engine, an updated version of the powerful J-2 engine used to launch the Saturn V rocket upper stages during Apollo. The injector was fi red horizontally with varying fuel temperatures and different propellant mixtures for 10 to 20 seconds at a thrust of approximately 20,000 pounds. Data collected during these tests will help engineers investigate design options for, and maximize performance of the J-2X upper stage engine. (NASA)
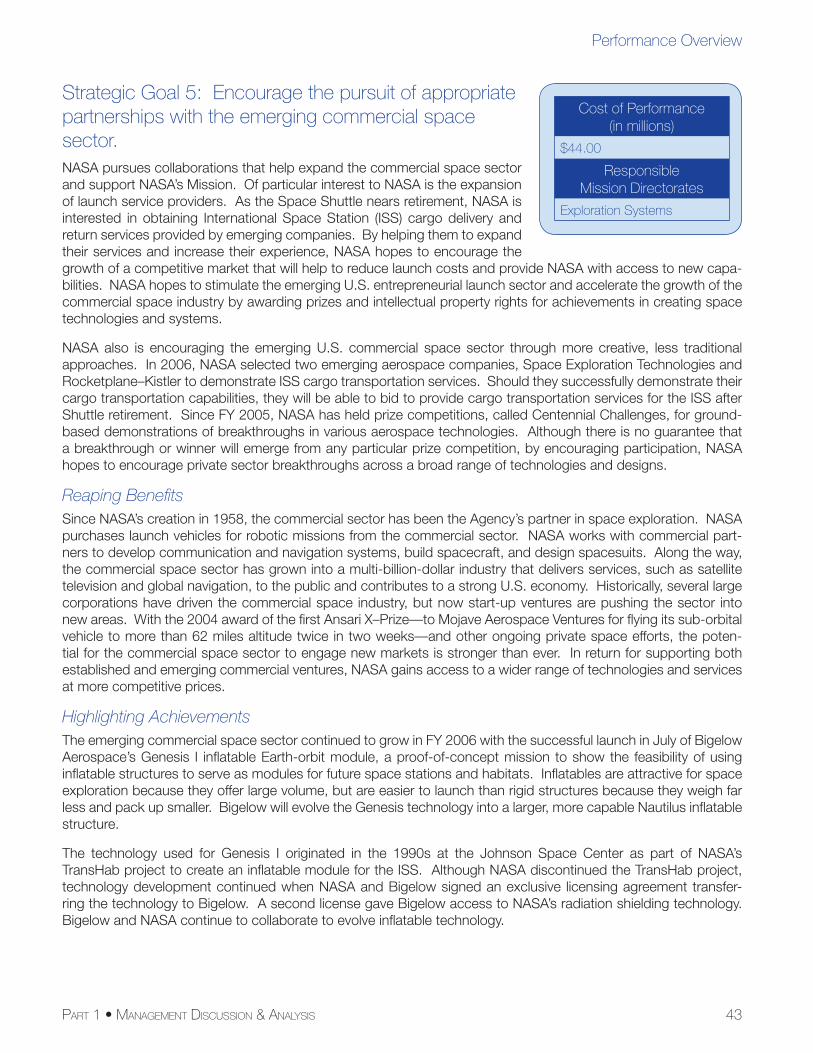
43PART 1 • MANAGEMENT DISCUSSION & ANALYSIS
Performance Overview
Strategic Goal 5: Encourage the pursuit of appropriate partnerships with the emerging commercial space sector.NASA pursues collaborations that help expand the commercial space sector and support NASA’s Mission. Of particular interest to NASA is the expansion of launch service providers. As the Space Shuttle nears retirement, NASA is interested in obtaining International Space Station (ISS) cargo delivery and return services provided by emerging companies. By helping them to expand their services and increase their experience, NASA hopes to encourage the growth of a competitive market that will help to reduce launch costs and provide NASA with access to new capa-bilities. NASA hopes to stimulate the emerging U.S. entrepreneurial launch sector and accelerate the growth of the commercial space industry by awarding prizes and intellectual property rights for achievements in creating space technologies and systems.
NASA also is encouraging the emerging U.S. commercial space sector through more creative, less traditional approaches. In 2006, NASA selected two emerging aerospace companies, Space Exploration Technologies and Rocketplane–Kistler to demonstrate ISS cargo transportation services. Should they successfully demonstrate their cargo transportation capabilities, they will be able to bid to provide cargo transportation services for the ISS after Shuttle retirement. Since FY 2005, NASA has held prize competitions, called Centennial Challenges, for ground-based demonstrations of breakthroughs in various aerospace technologies. Although there is no guarantee that a breakthrough or winner will emerge from any particular prize competition, by encouraging participation, NASA hopes to encourage private sector breakthroughs across a broad range of technologies and designs.
Reaping Benefi tsSince NASA’s creation in 1958, the commercial sector has been the Agency’s partner in space exploration. NASA purchases launch vehicles for robotic missions from the commercial sector. NASA works with commercial part-ners to develop communication and navigation systems, build spacecraft, and design spacesuits. Along the way, the commercial space sector has grown into a multi-billion-dollar industry that delivers services, such as satellite television and global navigation, to the public and contributes to a strong U.S. economy. Historically, several large corporations have driven the commercial space industry, but now start-up ventures are pushing the sector into new areas. With the 2004 award of the fi rst Ansari X–Prize—to Mojave Aerospace Ventures for fl ying its sub-orbital vehicle to more than 62 miles altitude twice in two weeks—and other ongoing private space efforts, the poten-tial for the commercial space sector to engage new markets is stronger than ever. In return for supporting both established and emerging commercial ventures, NASA gains access to a wider range of technologies and services at more competitive prices.
Highlighting AchievementsThe emerging commercial space sector continued to grow in FY 2006 with the successful launch in July of Bigelow Aerospace’s Genesis I infl atable Earth-orbit module, a proof-of-concept mission to show the feasibility of using infl atable structures to serve as modules for future space stations and habitats. Infl atables are attractive for space exploration because they offer large volume, but are easier to launch than rigid structures because they weigh far less and pack up smaller. Bigelow will evolve the Genesis technology into a larger, more capable Nautilus infl atable structure.
The technology used for Genesis I originated in the 1990s at the Johnson Space Center as part of NASA’s TransHab project to create an infl atable module for the ISS. Although NASA discontinued the TransHab project, technology development continued when NASA and Bigelow signed an exclusive licensing agreement transfer-ring the technology to Bigelow. A second license gave Bigelow access to NASA’s radiation shielding technology. Bigelow and NASA continue to collaborate to evolve infl atable technology.
Cost of Performance(in millions)
$44.00
ResponsibleMission Directorates
Exploration Systems
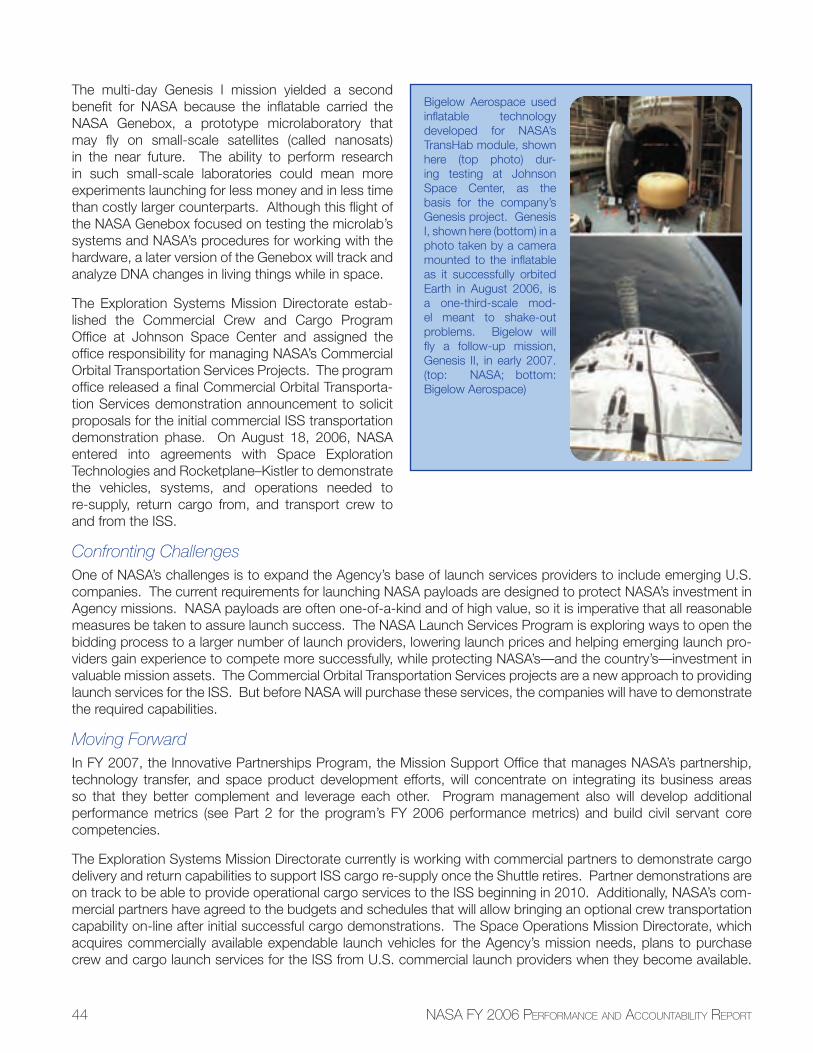
44 NASA FY 2006 PERFORMANCE AND ACCOUNTABILITY REPORT
The multi-day Genesis I mission yielded a second benefi t for NASA because the infl atable carried the NASA Genebox, a prototype microlaboratory that may fl y on small-scale satellites (called nanosats) in the near future. The ability to perform research in such small-scale laboratories could mean more experiments launching for less money and in less time than costly larger counterparts. Although this fl ight of the NASA Genebox focused on testing the microlab’s systems and NASA’s procedures for working with the hardware, a later version of the Genebox will track and analyze DNA changes in living things while in space.
The Exploration Systems Mission Directorate estab-lished the Commercial Crew and Cargo Program Offi ce at Johnson Space Center and assigned the offi ce responsibility for managing NASA’s Commercial Orbital Transportation Services Projects. The program offi ce released a fi nal Commercial Orbital Transporta-tion Services demonstration announcement to solicit proposals for the initial commercial ISS transportation demonstration phase. On August 18, 2006, NASA entered into agreements with Space Exploration Technologies and Rocketplane–Kistler to demonstrate the vehicles, systems, and operations needed to re-supply, return cargo from, and transport crew to and from the ISS.
Confronting ChallengesOne of NASA’s challenges is to expand the Agency’s base of launch services providers to include emerging U.S. companies. The current requirements for launching NASA payloads are designed to protect NASA’s investment in Agency missions. NASA payloads are often one-of-a-kind and of high value, so it is imperative that all reasonable measures be taken to assure launch success. The NASA Launch Services Program is exploring ways to open the bidding process to a larger number of launch providers, lowering launch prices and helping emerging launch pro-viders gain experience to compete more successfully, while protecting NASA’s—and the country’s—investment in valuable mission assets. The Commercial Orbital Transportation Services projects are a new approach to providing launch services for the ISS. But before NASA will purchase these services, the companies will have to demonstrate the required capabilities.
Moving ForwardIn FY 2007, the Innovative Partnerships Program, the Mission Support Offi ce that manages NASA’s partnership, technology transfer, and space product development efforts, will concentrate on integrating its business areas so that they better complement and leverage each other. Program management also will develop additional performance metrics (see Part 2 for the program’s FY 2006 performance metrics) and build civil servant core competencies.
The Exploration Systems Mission Directorate currently is working with commercial partners to demonstrate cargo delivery and return capabilities to support ISS cargo re-supply once the Shuttle retires. Partner demonstrations are on track to be able to provide operational cargo services to the ISS beginning in 2010. Additionally, NASA’s com-mercial partners have agreed to the budgets and schedules that will allow bringing an optional crew transportation capability on-line after initial successful cargo demonstrations. The Space Operations Mission Directorate, which acquires commercially available expendable launch vehicles for the Agency’s mission needs, plans to purchase crew and cargo launch services for the ISS from U.S. commercial launch providers when they become available.
Bigelow Aerospace used infl atable technology developed for NASA’s TransHab module, shown here (top photo) dur-ing testing at Johnson Space Center, as the basis for the company’s Genesis project. Genesis I, shown here (bottom) in a photo taken by a camera mounted to the infl atable as it successfully orbited Earth in August 2006, is a one-third-scale mod-el meant to shake-out problems. Bigelow will fl y a follow-up mission, Genesis II, in early 2007. (top: NASA; bottom: Bigelow Aerospace)
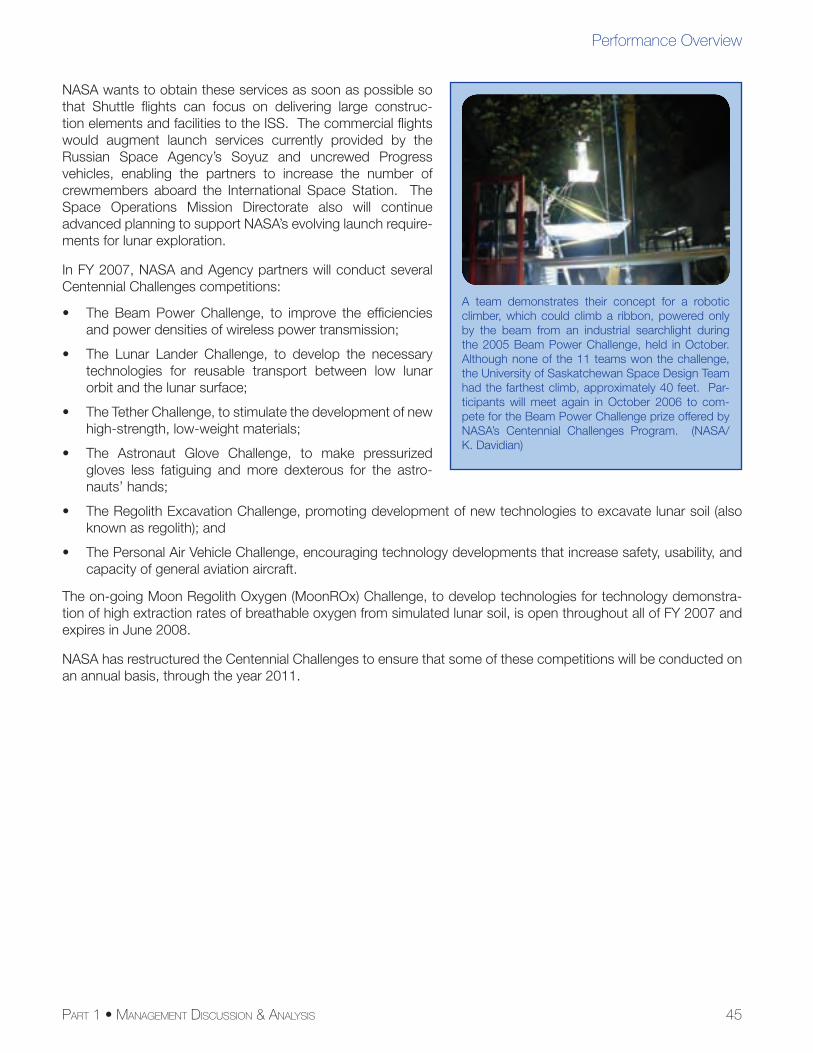
45PART 1 • MANAGEMENT DISCUSSION & ANALYSIS
Performance Overview
NASA wants to obtain these services as soon as possible so that Shuttle fl ights can focus on delivering large construc-tion elements and facilities to the ISS. The commercial fl ights would augment launch services currently provided by the Russian Space Agency’s Soyuz and uncrewed Progress vehicles, enabling the partners to increase the number of crewmembers aboard the International Space Station. The Space Operations Mission Directorate also will continue advanced planning to support NASA’s evolving launch require-ments for lunar exploration.
In FY 2007, NASA and Agency partners will conduct several Centennial Challenges competitions:
• The Beam Power Challenge, to improve the effi ciencies and power densities of wireless power transmission;
• The Lunar Lander Challenge, to develop the necessary technologies for reusable transport between low lunar orbit and the lunar surface;
• The Tether Challenge, to stimulate the development of new high-strength, low-weight materials;
• The Astronaut Glove Challenge, to make pressurized gloves less fatiguing and more dexterous for the astro-nauts’ hands;
• The Regolith Excavation Challenge, promoting development of new technologies to excavate lunar soil (also known as regolith); and
• The Personal Air Vehicle Challenge, encouraging technology developments that increase safety, usability, and capacity of general aviation aircraft.
The on-going Moon Regolith Oxygen (MoonROx) Challenge, to develop technologies for technology demonstra-tion of high extraction rates of breathable oxygen from simulated lunar soil, is open throughout all of FY 2007 and expires in June 2008.
NASA has restructured the Centennial Challenges to ensure that some of these competitions will be conducted on an annual basis, through the year 2011.
A team demonstrates their concept for a robotic climber, which could climb a ribbon, powered only by the beam from an industrial searchlight during the 2005 Beam Power Challenge, held in October. Although none of the 11 teams won the challenge, the University of Saskatchewan Space Design Team had the farthest climb, approximately 40 feet. Par-ticipants will meet again in October 2006 to com-pete for the Beam Power Challenge prize offered by NASA’s Centennial Challenges Program. (NASA/K. Davidian)
46 NASA FY 2006 PERFORMANCE AND ACCOUNTABILITY REPORT
Strategic Goal 6: Establish a lunar return program having the maximum possible utility for later missions to Mars and other destinations.NASA’s Vision for the future is clear. America’s robotic and human explorers will venture farther into the solar system than ever before. The fi rst stop on this exciting voyage will be the Moon, where robots, then humans, will explore the lunar surface in depth to supplement the work done by their Apollo prede-cessors. Early robotic missions will survey and characterize potential landing sites, as well as mining sites from which astronauts later can process lunar resources. Longer-duration lunar missions will enable astronauts to test new technologies for communications, computing, navigation, power generation, propulsion, habitation systems, and in-space construction and servicing processes. NASA and the Agency’s part-ners are developing these technologies today to support achieving the Vision for Space Exploration tomorrow.
Reaping Benefi tsNASA and the Agency’s partners transfer advanced space exploration systems and capabilities—power generation, communications, computing, robotics, and improved materials from space exploration research and execution—to the commercial sector to serve public, national, and global needs. In the past, technologies devel-oped for space exploration have yielded ground-based applications such as non-polluting solar energy systems, advanced batteries for laptop computers and cell phones, and fuel cells for electric vehicles.
Historically, space exploration has inspired industry, academia, and individual researchers to redefi ne what is “possible.” NASA’s Vision to expand the limits of robotic and human exploration through a technically ambitious portfolio of programs should provide even greater challenges and opportunities for personal development and future economic growth to NASA’s extended family of visionary partners.
The activities under Strategic Goal 6 lay the groundwork for NASA’s future human space exploration goals. Through the successful completion of these activities, NASA will have the technologies and capabilities to support humans on the Moon by the time the Orion Crew Exploration Vehicle and the Ares launch vehicles are fully operational. Along the way, these activities will benefi t other efforts across NASA: new power generation and nuclear technolo-gies will help future space exploration missions; autonomous systems and integrated systems health management can make air travel safer and more effi cient; and improved space communications enable better data delivery to and from the Space Shuttle, the International Space Station, and robotic spacecraft.
Highlighting AchievementsIn 2006, the Exploration Systems Mission Directorate initiated development of a multinational exploration strat-egy. Working with the worldwide community of space agencies, academia, and private sector stakeholders, the Exploration Systems Mission Directorate defi ned six primary lunar exploration themes that provide the high-level rationale for lunar exploration and a detailed set of over one hundred lunar exploration objectives. The Exploration Systems Mission Directorate and the Offi ce of External Relations are engaged in discussions with 13 international space agencies to understand each agency’s unique interests related to lunar exploration and to determine where NASA’s interests overlap. The Exploration Systems Mission Directorate also is engaged in discussions with the private sector to understand the role that these organizations may play in future lunar exploration efforts.
During FY 2006, NASA established the Lunar Precursor and Robotic Program (previously called the Robotic Lunar Exploration Program) Offi ce at Marshall Space Flight Center. The program will conduct a series of missions that support the overall lunar exploration effort, and may include missions that will investigate radiation protection and dust mitigation technologies.
In 2006, the Lunar Reconnaissance Orbiter (LRO) mission passed the Preliminary Design and Confi rmation Reviews, where an external team reviewed plans for systems, software, and vehicle confi guration and determined that the project should progress forward to the development stage. To take advantage of the launch vehicle’s ability
Cost of Performance(in millions)
$665.26
ResponsibleMission Directorates
Exploration SystemsScienceSpace Operations
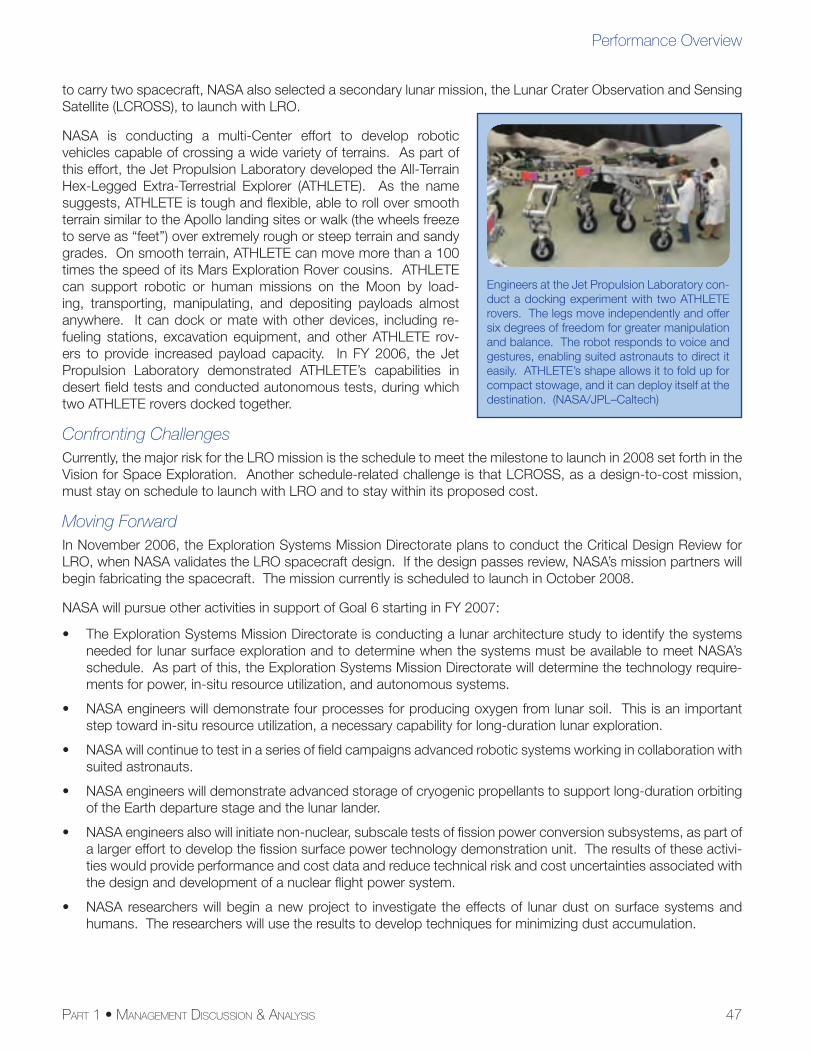
47PART 1 • MANAGEMENT DISCUSSION & ANALYSIS
Performance Overview
to carry two spacecraft, NASA also selected a secondary lunar mission, the Lunar Crater Observation and Sensing Satellite (LCROSS), to launch with LRO.
NASA is conducting a multi-Center effort to develop robotic vehicles capable of crossing a wide variety of terrains. As part of this effort, the Jet Propulsion Laboratory developed the All-Terrain Hex-Legged Extra-Terrestrial Explorer (ATHLETE). As the name suggests, ATHLETE is tough and fl exible, able to roll over smooth terrain similar to the Apollo landing sites or walk (the wheels freeze to serve as “feet”) over extremely rough or steep terrain and sandy grades. On smooth terrain, ATHLETE can move more than a 100 times the speed of its Mars Exploration Rover cousins. ATHLETE can support robotic or human missions on the Moon by load-ing, transporting, manipulating, and depositing payloads almost anywhere. It can dock or mate with other devices, including re-fueling stations, excavation equipment, and other ATHLETE rov-ers to provide increased payload capacity. In FY 2006, the Jet Propulsion Laboratory demonstrated ATHLETE’s capabilities in desert fi eld tests and conducted autonomous tests, during which two ATHLETE rovers docked together.
Confronting ChallengesCurrently, the major risk for the LRO mission is the schedule to meet the milestone to launch in 2008 set forth in the Vision for Space Exploration. Another schedule-related challenge is that LCROSS, as a design-to-cost mission, must stay on schedule to launch with LRO and to stay within its proposed cost.
Moving ForwardIn November 2006, the Exploration Systems Mission Directorate plans to conduct the Critical Design Review for LRO, when NASA validates the LRO spacecraft design. If the design passes review, NASA’s mission partners will begin fabricating the spacecraft. The mission currently is scheduled to launch in October 2008.
NASA will pursue other activities in support of Goal 6 starting in FY 2007:
• The Exploration Systems Mission Directorate is conducting a lunar architecture study to identify the systems needed for lunar surface exploration and to determine when the systems must be available to meet NASA’s schedule. As part of this, the Exploration Systems Mission Directorate will determine the technology require-ments for power, in-situ resource utilization, and autonomous systems.
• NASA engineers will demonstrate four processes for producing oxygen from lunar soil. This is an important step toward in-situ resource utilization, a necessary capability for long-duration lunar exploration.
• NASA will continue to test in a series of fi eld campaigns advanced robotic systems working in collaboration with suited astronauts.
• NASA engineers will demonstrate advanced storage of cryogenic propellants to support long-duration orbiting of the Earth departure stage and the lunar lander.
• NASA engineers also will initiate non-nuclear, subscale tests of fi ssion power conversion subsystems, as part of a larger effort to develop the fi ssion surface power technology demonstration unit. The results of these activi-ties would provide performance and cost data and reduce technical risk and cost uncertainties associated with the design and development of a nuclear fl ight power system.
• NASA researchers will begin a new project to investigate the effects of lunar dust on surface systems and humans. The researchers will use the results to develop techniques for minimizing dust accumulation.
Engineers at the Jet Propulsion Laboratory con-duct a docking experiment with two ATHLETE rovers. The legs move independently and offer six degrees of freedom for greater manipulation and balance. The robot responds to voice and gestures, enabling suited astronauts to direct it easily. ATHLETE’s shape allows it to fold up for compact stowage, and it can deploy itself at the destination. (NASA/JPL–Caltech)

48 NASA FY 2006 PERFORMANCE AND ACCOUNTABILITY REPORT
PART 1 • MANAGEMENT DISCUSSION & ANALYSIS 49
Financial Statements and Stewardship NASA’s fi nancial statements, which appear in Part 3: Financials of this Performance and Accountability Report, are unaudited. The statements provide information regarding the fi nancial position and results of the Agency’s operations. Agency management is responsible for the integrity and objectivity of the fi nancial information in these statements.
NASA prepared the fi nancial statements and fi nancial data presented throughout this Performance and Accountability Report from the Agency’s fi nancial management system and other Treasury reports in accordance with the requirements and formats prescribed by the Offi ce of Management and Budget. The Agency’s fi nancial statements, notes, Required Supplementary Information, and Required Supplementary Stewardship Information are provided in Part 3: Financials of this Report.
Financial Overview
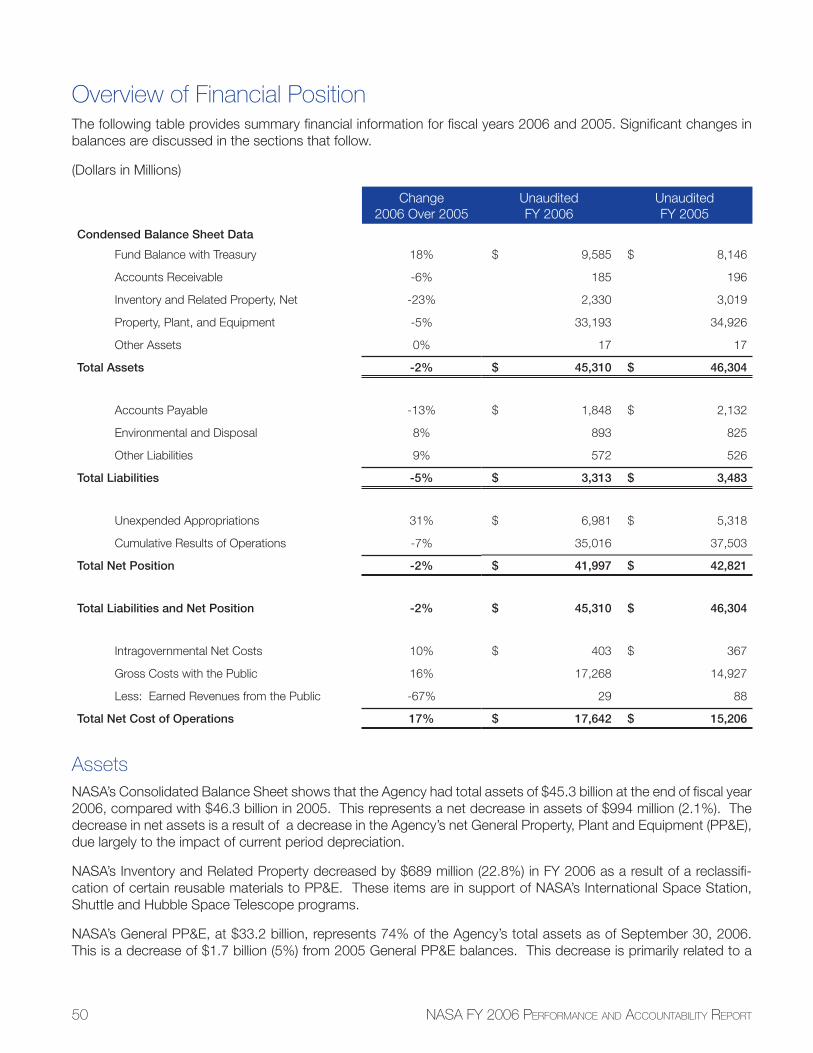
50 NASA FY 2006 PERFORMANCE AND ACCOUNTABILITY REPORT
Overview of Financial PositionThe following table provides summary fi nancial information for fi scal years 2006 and 2005. Signifi cant changes in balances are discussed in the sections that follow.
(Dollars in Millions)
Change2006 Over 2005
UnauditedFY 2006
UnauditedFY 2005
Condensed Balance Sheet Data
Fund Balance with Treasury 18% $ 9,585 $ 8,146
Accounts Receivable -6% 185 196
Inventory and Related Property, Net -23% 2,330 3,019
Property, Plant, and Equipment -5% 33,193 34,926
Other Assets 0% 17 17
Total Assets -2% $ 45,310 $ 46,304
Accounts Payable -13% $ 1,848 $ 2,132
Environmental and Disposal 8% 893 825
Other Liabilities 9% 572 526
Total Liabilities -5% $ 3,313 $ 3,483
Unexpended Appropriations 31% $ 6,981 $ 5,318
Cumulative Results of Operations -7% 35,016 37,503
Total Net Position -2% $ 41,997 $ 42,821
Total Liabilities and Net Position -2% $ 45,310 $ 46,304
Intragovernmental Net Costs 10% $ 403 $ 367
Gross Costs with the Public 16% 17,268 14,927
Less: Earned Revenues from the Public -67% 29 88
Total Net Cost of Operations 17% $ 17,642 $ 15,206
AssetsNASA’s Consolidated Balance Sheet shows that the Agency had total assets of $45.3 billion at the end of fi scal year 2006, compared with $46.3 billion in 2005. This represents a net decrease in assets of $994 million (2.1%). The decrease in net assets is a result of a decrease in the Agency’s net General Property, Plant and Equipment (PP&E), due largely to the impact of current period depreciation.
NASA’s Inventory and Related Property decreased by $689 million (22.8%) in FY 2006 as a result of a reclassifi -cation of certain reusable materials to PP&E. These items are in support of NASA’s International Space Station, Shuttle and Hubble Space Telescope programs.
NASA’s General PP&E, at $33.2 billion, represents 74% of the Agency’s total assets as of September 30, 2006. This is a decrease of $1.7 billion (5%) from 2005 General PP&E balances. This decrease is primarily related to a
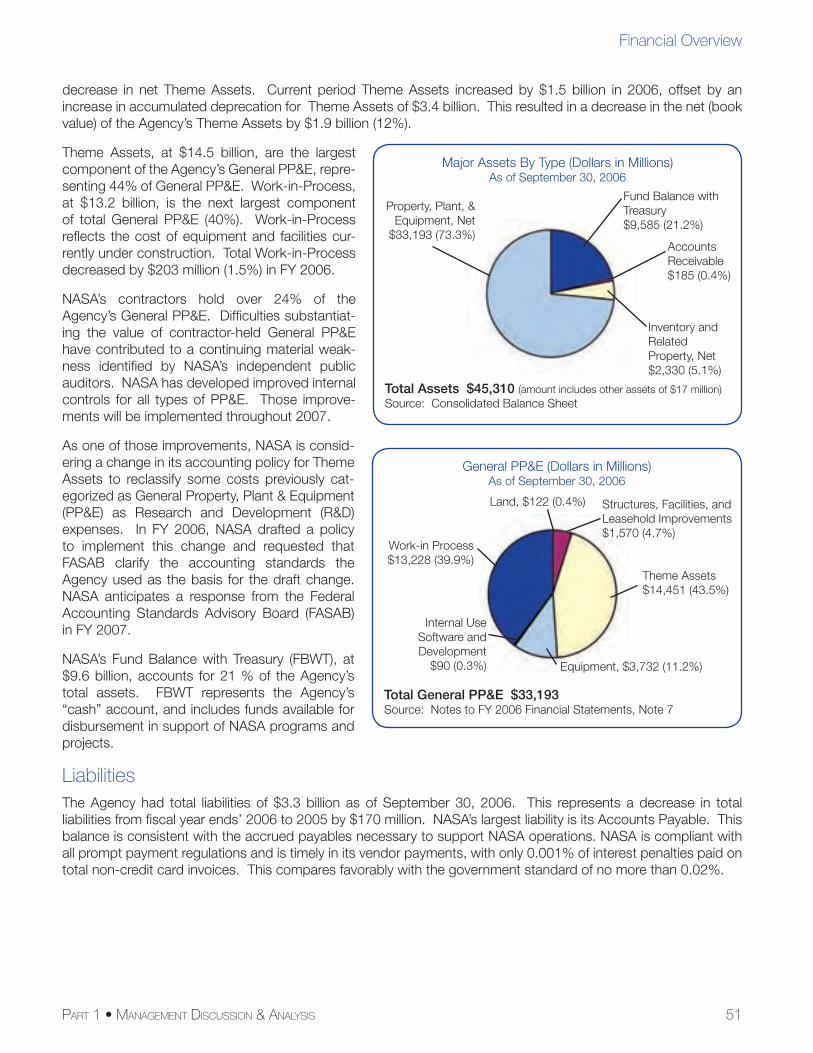
51PART 1 • MANAGEMENT DISCUSSION & ANALYSIS
Financial Overview
decrease in net Theme Assets. Current period Theme Assets increased by $1.5 billion in 2006, offset by an increase in accumulated deprecation for Theme Assets of $3.4 billion. This resulted in a decrease in the net (book value) of the Agency’s Theme Assets by $1.9 billion (12%).
Theme Assets, at $14.5 billion, are the largest component of the Agency’s General PP&E, repre-senting 44% of General PP&E. Work-in-Process, at $13.2 billion, is the next largest component of total General PP&E (40%). Work-in-Process refl ects the cost of equipment and facilities cur-rently under construction. Total Work-in-Process decreased by $203 million (1.5%) in FY 2006.
NASA’s contractors hold over 24% of the Agency’s General PP&E. Diffi culties substantiat-ing the value of contractor-held General PP&E have contributed to a continuing material weak-ness identifi ed by NASA’s independent public auditors. NASA has developed improved internal controls for all types of PP&E. Those improve-ments will be implemented throughout 2007.
As one of those improvements, NASA is consid-ering a change in its accounting policy for Theme Assets to reclassify some costs previously cat-egorized as General Property, Plant & Equipment (PP&E) as Research and Development (R&D) expenses. In FY 2006, NASA drafted a policy to implement this change and requested that FASAB clarify the accounting standards the Agency used as the basis for the draft change. NASA anticipates a response from the Federal Accounting Standards Advisory Board (FASAB) in FY 2007.
NASA’s Fund Balance with Treasury (FBWT), at $9.6 billion, accounts for 21 % of the Agency’s total assets. FBWT represents the Agency’s “cash” account, and includes funds available for disbursement in support of NASA programs and projects.
LiabilitiesThe Agency had total liabilities of $3.3 billion as of September 30, 2006. This represents a decrease in total liabilities from fi scal year ends’ 2006 to 2005 by $170 million. NASA’s largest liability is its Accounts Payable. This balance is consistent with the accrued payables necessary to support NASA operations. NASA is compliant with all prompt payment regulations and is timely in its vendor payments, with only 0.001% of interest penalties paid on total non-credit card invoices. This compares favorably with the government standard of no more than 0.02%.
Fund Balance with Treasury$9,585 (21.2%)
Inventory and RelatedProperty, Net$2,330 (5.1%)
AccountsReceivable$185 (0.4%)
Property, Plant, & Equipment, Net
$33,193 (73.3%)
Major Assets By Type (Dollars in Millions)As of September 30, 2006
Total Assets $45,310 (amount includes other assets of $17 million)Source: Consolidated Balance Sheet
General PP&E (Dollars in Millions)As of September 30, 2006
Total General PP&E $33,193Source: Notes to FY 2006 Financial Statements, Note 7
Structures, Facilities, and Leasehold Improvements$1,570 (4.7%)
Land, $122 (0.4%)
Internal Use Software and Development
$90 (0.3%) Equipment, $3,732 (11.2%)
Work-in Process$13,228 (39.9%)
Theme Assets$14,451 (43.5%)
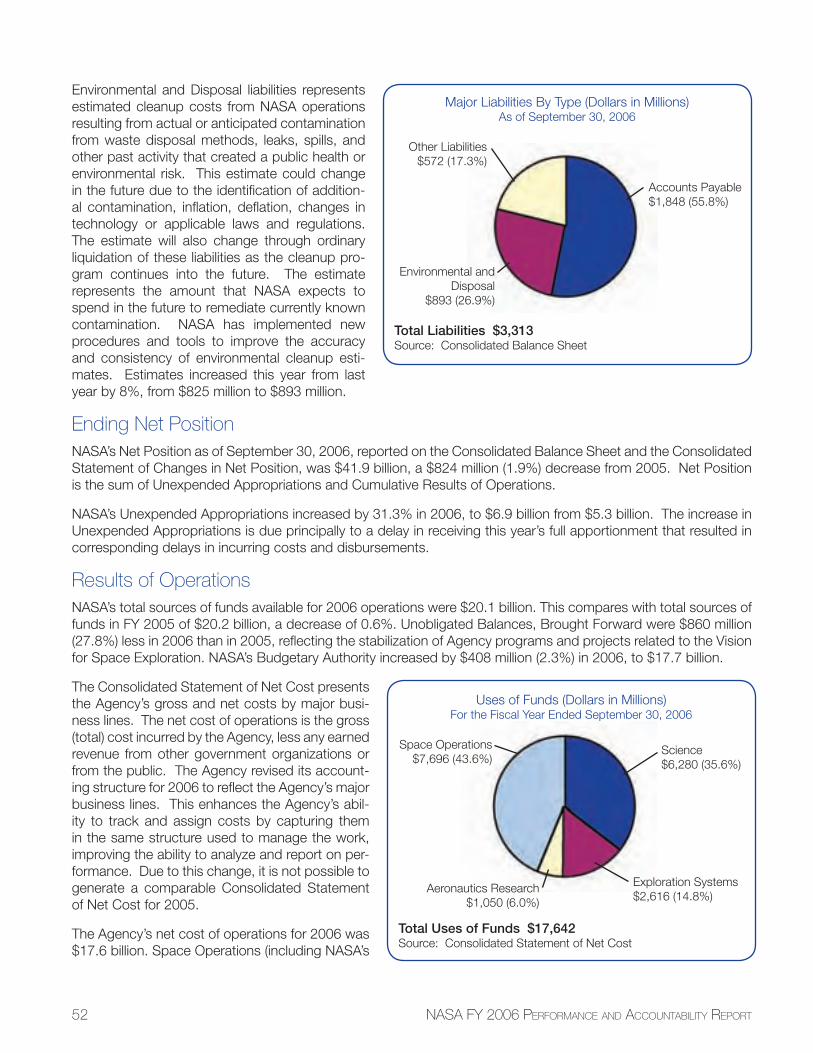
52 NASA FY 2006 PERFORMANCE AND ACCOUNTABILITY REPORT
Environmental and Disposal liabilities represents estimated cleanup costs from NASA operations resulting from actual or anticipated contamination from waste disposal methods, leaks, spills, and other past activity that created a public health or environmental risk. This estimate could change in the future due to the identifi cation of addition-al contamination, infl ation, defl ation, changes in technology or applicable laws and regulations. The estimate will also change through ordinary liquidation of these liabilities as the cleanup pro-gram continues into the future. The estimate represents the amount that NASA expects to spend in the future to remediate currently known contamination. NASA has implemented new procedures and tools to improve the accuracy and consistency of environmental cleanup esti-mates. Estimates increased this year from last year by 8%, from $825 million to $893 million.
Ending Net PositionNASA’s Net Position as of September 30, 2006, reported on the Consolidated Balance Sheet and the Consolidated Statement of Changes in Net Position, was $41.9 billion, a $824 million (1.9%) decrease from 2005. Net Position is the sum of Unexpended Appropriations and Cumulative Results of Operations.
NASA’s Unexpended Appropriations increased by 31.3% in 2006, to $6.9 billion from $5.3 billion. The increase in Unexpended Appropriations is due principally to a delay in receiving this year’s full apportionment that resulted in corresponding delays in incurring costs and disbursements.
Results of OperationsNASA’s total sources of funds available for 2006 operations were $20.1 billion. This compares with total sources of funds in FY 2005 of $20.2 billion, a decrease of 0.6%. Unobligated Balances, Brought Forward were $860 million (27.8%) less in 2006 than in 2005, refl ecting the stabilization of Agency programs and projects related to the Vision for Space Exploration. NASA’s Budgetary Authority increased by $408 million (2.3%) in 2006, to $17.7 billion.
The Consolidated Statement of Net Cost presents the Agency’s gross and net costs by major busi-ness lines. The net cost of operations is the gross (total) cost incurred by the Agency, less any earned revenue from other government organizations or from the public. The Agency revised its account-ing structure for 2006 to refl ect the Agency’s major business lines. This enhances the Agency’s abil-ity to track and assign costs by capturing them in the same structure used to manage the work, improving the ability to analyze and report on per-formance. Due to this change, it is not possible to generate a comparable Consolidated Statement of Net Cost for 2005.
The Agency’s net cost of operations for 2006 was $17.6 billion. Space Operations (including NASA’s
Major Liabilities By Type (Dollars in Millions)As of September 30, 2006
Total Liabilities $3,313Source: Consolidated Balance Sheet
Accounts Payable$1,848 (55.8%)
Other Liabilities$572 (17.3%)
Environmental and Disposal
$893 (26.9%)
Uses of Funds (Dollars in Millions)For the Fiscal Year Ended September 30, 2006
Total Uses of Funds $17,642Source: Consolidated Statement of Net Cost
Exploration Systems$2,616 (14.8%)
Aeronautics Research$1,050 (6.0%)
Science$6,280 (35.6%)
Space Operations$7,696 (43.6%)
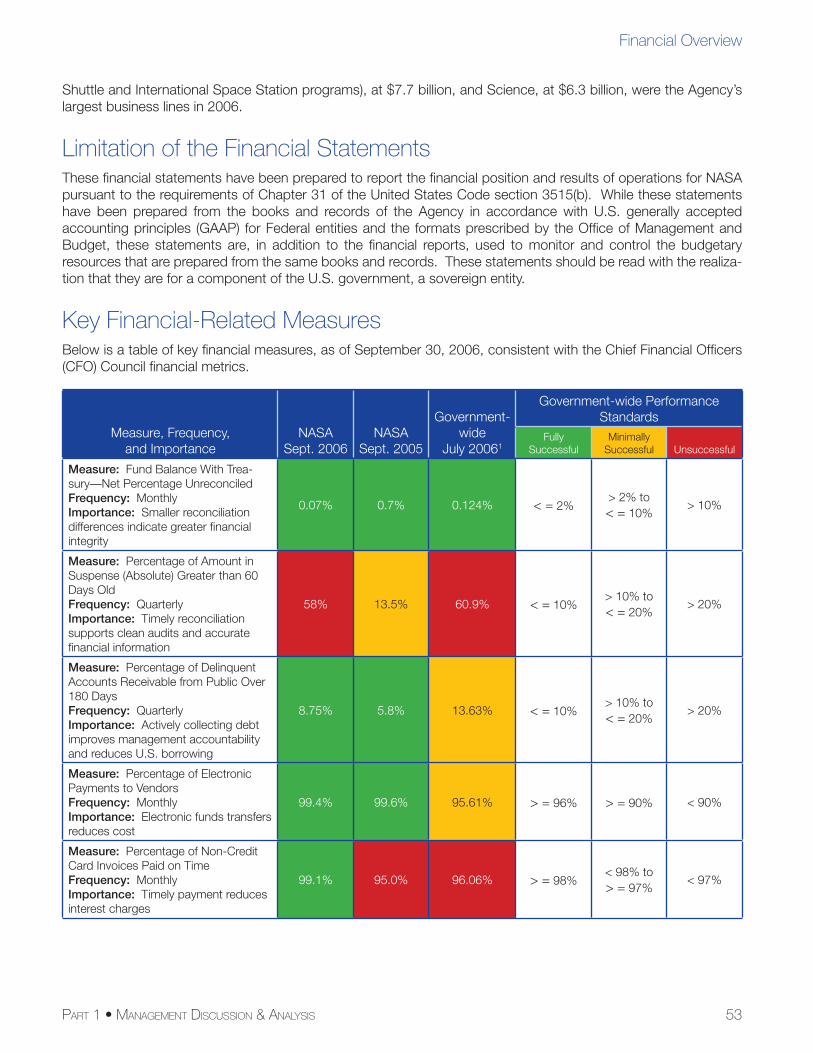
53PART 1 • MANAGEMENT DISCUSSION & ANALYSIS
Financial Overview
Shuttle and International Space Station programs), at $7.7 billion, and Science, at $6.3 billion, were the Agency’s largest business lines in 2006.
Limitation of the Financial StatementsThese fi nancial statements have been prepared to report the fi nancial position and results of operations for NASA pursuant to the requirements of Chapter 31 of the United States Code section 3515(b). While these statements have been prepared from the books and records of the Agency in accordance with U.S. generally accepted accounting principles (GAAP) for Federal entities and the formats prescribed by the Offi ce of Management and Budget, these statements are, in addition to the fi nancial reports, used to monitor and control the budgetary resources that are prepared from the same books and records. These statements should be read with the realiza-tion that they are for a component of the U.S. government, a sovereign entity.
Key Financial-Related Measures Below is a table of key fi nancial measures, as of September 30, 2006, consistent with the Chief Financial Offi cers (CFO) Council fi nancial metrics.
Measure, Frequency, and Importance
NASASept. 2006
NASASept. 2005
Government-wide
July 20061
Government-wide Performance Standards
Fully Successful
Minimally Successful Unsuccessful
Measure: Fund Balance With Trea-sury—Net Percentage Unreconciled Frequency: MonthlyImportance: Smaller reconciliation differences indicate greater fi nancial integrity
0.07% 0.7% 0.124% < = 2%> 2% to< = 10%
> 10%
Measure: Percentage of Amount in Suspense (Absolute) Greater than 60 Days OldFrequency: QuarterlyImportance: Timely reconciliation supports clean audits and accurate fi nancial information
58% 13.5% 60.9% < = 10%> 10% to< = 20%
> 20%
Measure: Percentage of Delinquent Accounts Receivable from Public Over 180 Days Frequency: QuarterlyImportance: Actively collecting debt improves management accountability and reduces U.S. borrowing
8.75% 5.8% 13.63% < = 10%> 10% to< = 20%
> 20%
Measure: Percentage of Electronic Payments to VendorsFrequency: MonthlyImportance: Electronic funds transfers reduces cost
99.4% 99.6% 95.61% > = 96% > = 90% < 90%
Measure: Percentage of Non-Credit Card Invoices Paid on TimeFrequency: MonthlyImportance: Timely payment reduces interest charges
99.1% 95.0% 96.06% > = 98%< 98% to> = 97%
< 97%
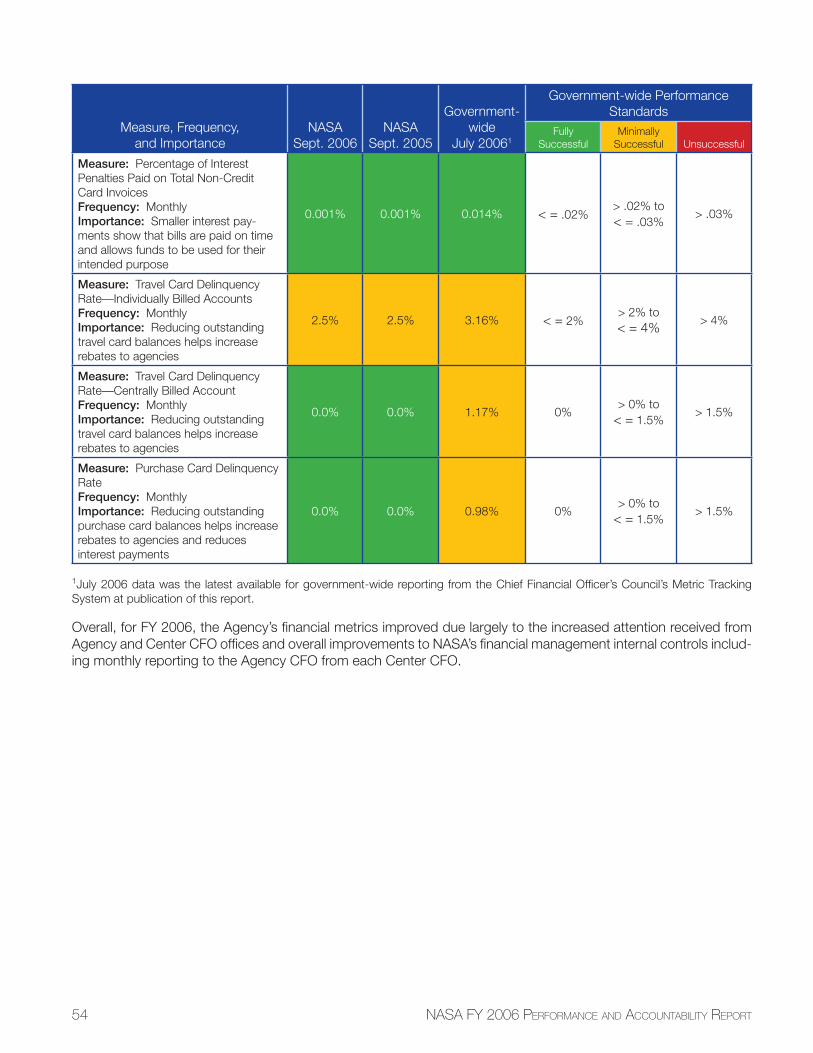
54 NASA FY 2006 PERFORMANCE AND ACCOUNTABILITY REPORT
Measure, Frequency, and Importance
NASASept. 2006
NASASept. 2005
Government-wide
July 20061
Government-wide Performance Standards
Fully Successful
Minimally Successful Unsuccessful
Measure: Percentage of Interest Penalties Paid on Total Non-Credit Card InvoicesFrequency: MonthlyImportance: Smaller interest pay-ments show that bills are paid on time and allows funds to be used for their intended purpose
0.001% 0.001% 0.014% < = .02%> .02% to< = .03%
> .03%
Measure: Travel Card Delinquency Rate—Individually Billed AccountsFrequency: MonthlyImportance: Reducing outstanding travel card balances helps increase rebates to agencies
2.5% 2.5% 3.16% < = 2%> 2% to< = 4%
> 4%
Measure: Travel Card Delinquency Rate—Centrally Billed AccountFrequency: MonthlyImportance: Reducing outstanding travel card balances helps increase rebates to agencies
0.0% 0.0% 1.17% 0%> 0% to
< = 1.5%> 1.5%
Measure: Purchase Card Delinquency RateFrequency: MonthlyImportance: Reducing outstanding purchase card balances helps increase rebates to agencies and reduces interest payments
0.0% 0.0% 0.98% 0%> 0% to
< = 1.5%> 1.5%
1July 2006 data was the latest available for government-wide reporting from the Chief Financial Offi cer’s Council’s Metric Tracking System at publication of this report.
Overall, for FY 2006, the Agency’s fi nancial metrics improved due largely to the increased attention received from Agency and Center CFO offi ces and overall improvements to NASA’s fi nancial management internal controls includ-ing monthly reporting to the Agency CFO from each Center CFO.
PART 1 • MANAGEMENT DISCUSSION & ANALYSIS 55
OverviewThe Federal Managers’ Financial Integrity Act (FMFIA) of 1982 requires federal agencies to establish “controls that reasonably ensure that (i) obligations and costs are in compliance with applicable law; (ii) funds, property, and other assets are safeguarded against loss, unauthorized use or misappropriation; and (iii) revenues and expenditures applicable to agency operations are properly recorded and accounted for to permit the preparation of accounts and reliable fi nancial and statistical reports and to maintain accountability over the assets.” In addition, the agency head annually must evaluate and report on the control and fi nancial systems that protect the integrity of federal programs (Section 2 and Section 4 of FMFIA respectively).
Section 2 of FMFIA requires the head of each agency to submit a statement on whether there is reasonable assurance that the agency’s controls are achieving their intended objectives and, as applicable, report on material weaknesses in the agency’s controls. A separate statement on the effectiveness of internal controls over fi nancial reporting is included as a subset of the overall assurance statement.
Section 4 of FMFIA requires a statement on whether the agency’s fi nancial management systems conform to gov-ernment-wide requirements. In addition, the Federal Financial Management Improvement Act (FFMIA) of 1996 requires the agency head to evaluate and determine whether the fi nancial management systems substantially comply with its requirements. The systems also must comply with any other applicable laws.
The Administrator’s statement of assurance is based on information gathered from a variety of sources, including the Administrator’s personal knowledge of NASA’s day-to-day operations, existing controls, management program reviews, and other internal reports. If the Agency’s systems do not comply with the FMFIA, the assurance statement must identify any material weaknesses and include NASA’s corrective action plan to address those weaknesses.
This year, NASA began several initiatives to improve internal accounting and administrative control processes. As part of this effort, NASA’s Offi ce of the Chief Financial Offi cer established an Offi ce of Quality Assurance to strengthen and improve both internal controls and NASA compliance with fi nancial management policy, FMFIA, and requirements from the Offi ce of Management and Budget (OMB). Personnel from the Offi ce of Quality Assurance conducted on-site assessments to document and test key internal controls for compliance with FMFIA and OMB Circular A-123, Appendix A: Internal Control over Financial Reporting.
NASA further improved the Agency’s internal accounting and administrative controls processes by taking the follow-ing actions: developing and distributing a new policy on internal controls; conducting training on the requirements and implementation of OMB Circular A-123, Management’s Responsibility for Internal Control; assessing and test-ing fi nancial statement line items and related processes; and analyzing 120 identifi ed risks as supporting evidence for the Administrator’s statement of assurance. The Offi cials-in-Charge of NASA Headquarters offi ces and the Agency’s Center Directors identifi ed these risks by submitting individual statements of assurance for their respective organizations to the NASA Administrator.
Systems, Controls, & Legal Compliance
56 NASA FY 2006 PERFORMANCE AND ACCOUNTABILITY REPORT
A NASA Headquarters team evaluated the 120 risks identifi ed in the 28 statements of assurance and developed recommendations for consideration by the Operations Management Council, one of NASA’s three governing bod-ies that provide senior-level oversight of NASA’s operations. The Operations Management Council holds an annual meeting to confi rm the defi ciencies in Agency processes that will be reported as material weaknesses. This year, the Council recommended that two previously reported material weaknesses—Space Shuttle Return to Flight and Financial Management Data Integrity—be closed out; two previously reported material weaknesses—Asset Man-agement and Financial Management System—continue to be reported as weaknesses; and Information Technology Security be raised from an internally tracked defi ciency to an externally reported material weakness.
57PART 1 • MANAGEMENT DISCUSSION & ANALYSIS
Systems, Controls, & Legal Compliance
Management Assurances
November 15, 2006
NASA management is responsible for developing and maintaining effective internal controls and fi nancial manage-ment systems that meet the objectives of the Federal Managers Financial Integrity Act (FMFIA). Based on the results of our FY 2006 assessment of the effectiveness and effi ciency of operations, and compliance with applicable laws and regulations in accordance with OMB Circular A-123, Management’s Responsibility for Internal Control, I am able to submit a qualifi ed statement of assurance that NASA’s internal controls and fi nancial management systems meet the objectives of FMFIA. This assessment identifi ed two material weaknesses, Asset Management and Information Technology Security, reported under Section 2 of FMFIA, and a third material weakness, Financial Management Sys-tem, reported as a non-conformance under Section 4 of FMFIA. In FY 2006, NASA closed two previously reported material weaknesses: Space Shuttle Return to Flight and Financial Management Data Integrity. (A summary of the weaknesses and corrective action plans follow this statement.) Other than these exceptions, the Agency found no other material weaknesses in the design or operations of internal controls.
NASA also conducted an assessment focused on the effectiveness of internal control over fi nancial reporting, which includes safeguarding of assets and compliance with applicable laws and regulations, in accordance with the requirements of Appendix A of OMB Circular A-123. NASA is taking a multi-year approach toward achieving compliance through the NASA Financial Management Internal Control (FMIC) Plan. This statement refl ects the sta-tus of internal control over fi nancial reporting for four signifi cant line items as of June 30, 2006: Property, Plant, and Equipment; Fund Balance with Treasury; Material and Supplies; and Unfunded Environmental Liabilities. Based on the results of this evaluation, NASA identifi ed one material weakness—Financial Management System—related to internal control over fi nancial reporting. Other than this exception, the Agency found no additional material weak-nesses in the design or operation of the internal controls over fi nancial reporting. Due to the identifi ed weakness and the scope of our assessment for FY 2006, NASA is only able to provide a qualifi ed statement of assurance that the Agency’s internal controls over fi nancial reporting were operating effectively as of June 30, 2006.
In accordance with the Federal Financial Management Improvement Act (FFMIA), NASA management is respon-sible for implementing and maintaining fi nancial management systems that substantially comply with federal systems requirements, applicable federal accounting standards, and the U.S. Government Standard General Ledger (SGL) at the transaction level. Due to several remaining corrective actions defi ned in the Agency’s 2005 Corrective Action Plan, NASA’s fi nancial management systems are not substantially compliant with the requirements of the Act as of September 30, 2006.
As explained in the auditor’s report in Part 3: Financials, NASA’s independent auditors were unable to render an opinion on our FY 2006 fi nancial statements and issued a disclaimer of opinion. Therefore, I cannot provide rea-sonable assurance that the fi nancial data in this report are complete and reliable. As we face the many challenges ahead of us, we will focus on bringing NASA’s fi nancial management system into compliance.
Michael D. Griffi n Administrator
58 NASA FY 2006 PERFORMANCE AND ACCOUNTABILITY REPORT
Corrective Action PlanNew Material Weakness
Information Technology (IT) SecurityFMFIA Section 2 Weakness
Responsible Offi cial: Chief Information Offi cer
Description: NASA’s IT Security Program needs more effective implementation, monitoring, enforcement, verifi ca-tion, and validation. NASA’s policy and procedures are not consistent with new OMB directives, and the Agency’s systems are noncompliant with the Federal Information Security Management Act of 2002. This defi ciency affects mission accomplishment by compromising the integrity, availability, and confi dentiality of mission critical data. The operational effi ciency of the Agency also is hampered by the inconsistent application of security solutions at different Centers. If this weakness goes unchecked, mission resources may have to be reallocated to bring the Agency’s IT systems into compliance.
Corrective Action Plan: NASA has been improving IT security for the past three years through a corrective action plan that made changes to the Agency’s IT security policies and requirements. In FY 2006, NASA updated and dis-tributed a new NASA IT security policy, established standard operating procedures to meet Agency requirements, and updated NASA’s IT security training and certifi cation programs. Despite these changes, recent IT security incidents and Offi ce of Inspector General audit results revealed that the same problems still exist. Therefore, in FY 2007, NASA will: establish independent methods for verifying and validating processes related to IT security; create an organizational structure that will assure consistency in the way that Centers implement new IT security processes; and, revise IT security clauses for use in NASA contracts.
Continuing Material Weaknesses
Asset ManagementFMFIA Section 2 Weakness
Responsible Offi cial: Chief Financial Offi cer
Description: NASA’s lack of proper management controls has resulted in inconsistent fi nancial recording prac-tices contributing to misstated asset values and period expenses. Therefore, NASA needs to improve the Agency’s management controls for the fi nancial accounting and reporting of NASA owned Property, Plant, and Equipment; materials; space parts; and other assets. The Agency also needs to improve accounting for contractor-held property.
Corrective Action Plan: The Agency’s strategy for addressing this material weakness is to align NASA’s poli-cies, processes, and systems with published accounting standards and appropriate accounting standards-setting organizations. As part of this strategy, NASA revised the Agency’s asset capitalization policy (currently under review by the Federal Accounting Standards Advisory Board). NASA also used working groups to identify solutions and implementation plans for process and system gaps between current and desired business processes. In addition, the Agency implemented a new Procurement Information Circular to improve accounting for property furnished to contractors, including transfers, retirement, and recovery of government property.
Financial Management SystemFMFIA Section 4 Weakness
Responsible Offi cial: Chief Financial Offi cer
Description: In FY 2003, NASA implemented the Core Financial Module of the Integrated Enterprise Management System. The Core Financial Module replaced all disparate Center-level accounting systems, the NASA Head-quarters accounting system, and approximately 120 ancillary systems. However, NASA management identifi ed
59PART 1 • MANAGEMENT DISCUSSION & ANALYSIS
Systems, Controls, & Legal Compliance
signifi cant errors in the data produced by Core Financial Module beginning in September 2003 as a result of problems in the conversion effort and system confi guration. Limitations in Core Financial Module software still require the implementation of compensating controls and systems, further complicating the resolution of this weak-ness.
Corrective Action Plan: NASA continues to develop and implement procedures for identifying and validating the Agency’s fi nancial data and processes. In FY 2006, these efforts included aligning internal controls with authorita-tive guidance and implementing automated fi nancial system functions to complement process changes. Specifi c progress toward improving this material weakness included:
• Developing and distributing a monthly schedule with due dates generated by a cross-Agency task team for data processing, reconciliations, verifi cations, feedback, and reports;
• Performing periodic controls reviews and reconciliations at all Centers for 23 specifi c activities, after which each Center developed a corrective action plan (monitored monthly by Headquarters) to assure the timely resolution of anomalies;
• Completing fi nancial management internal control assessments and testing for four signifi cant accounts (Fund Balance with Treasury; Property, Plant, and Equipment; Material and Supplies; and Environmental Liabilities) in accordance with the NASA Financial Management Internal Control Plan. In June 2006, NASA updated and submitted this plan to OMB;
• Reviewing, validating and redesigning NASA’s fi nancial statements to ensure accuracy of reporting and consis-tency with the requirement of OMB Circular A-136, Financial Reporting Requirements;
• Producing monthly fi nancial statements directly from the Core Financial system within 30 days after the closing of each period. This process included documenting data anomalies or corrections and preparing of statement analyses; and
• Modifying the Agency’s Statement of Net Cost to provide a breakdown of net costs by major lines of business, consistent with OMB Circular A-136.
Closed Items
Space Shuttle Return to FlightFMFIA Section 2 Weakness
Responsible Offi cial: Associate Administrator for Space Operations Mission Directorate
Description: The loss of the Space Shuttle Columbia in 2003 revealed a material weakness centered on loss of control and enforcement of NASA’s standards of technical excellence, safety, teamwork, and integrity.
Corrective Action Plan: NASA established a formal Return to Flight (RTF) Planning Team to manage all aspects of a safe return to fl ight, including complying with the recommendations of the Columbia Accident Investigation Board. The Space Flight Leadership Council, co-chaired by the Associate Administrator for Space Operations and the Deputy Chief Engineer for Independent Technical Authority, assessed the options and recommendations from the RTF Planning Team. Through this process, NASA identifi ed the technical causes and systemic cultural, organi-zational, and managerial issues associated with the Columbia accident. NASA then addressed the defi ciencies by implementing a governance structure that includes forums for open discussions of technical and safety issues.
Following the completion of major test fl ight objectives on STS-121 in July 2006, only one vehicle modifi cation remains—the Ice Frost Ramp design—scheduled for testing in February 2007 aboard STS-117. Therefore, NASA’s Operations Management Council removed the Space Shuttle RTF as a material weakness based on evidence that the technical and cultural issues contributing to the Columbia accident have been corrected.
60 NASA FY 2006 PERFORMANCE AND ACCOUNTABILITY REPORT
Financial Management Data IntegrityFMFIA Section 2 Weakness
Responsible Offi cial: Chief Financial Offi cer
Description: This material weakness focused on two identifi ed challenges: Fund Balance with Treasury differ-ences and estimating environmental liabilities. Weaknesses in NASA’s procedures for reconciling items resulted in unexplained differences in the Agency’s Fund Balance with Treasury account, as compared to Treasury balances. Weaknesses in NASA’s procedures for generating estimates of its Unfunded Environmental Liabilities resulted in a lack of auditable evidence to support estimates of environmental liabilities.
Corrective Action Plan: NASA established additional reconciliation controls and procedures at all Centers and at Headquarters to assure consistent access to the data required for Agency oversight. NASA also developed and implemented a process for estimating environmental liabilities in a consistent manner and held joint training classes for the environmental engineers and accountants responsible for identifying and reporting environmental liabilities to assure consistent application of policies and procedures. Additional performance reporting, in the form of a monthly review of Center corrective action plans and monthly fi nancial metrics, also contributed to resolution of this weak-ness. As a result of these improvements, the Operations Management Council removed this item from the reported material weakness list.
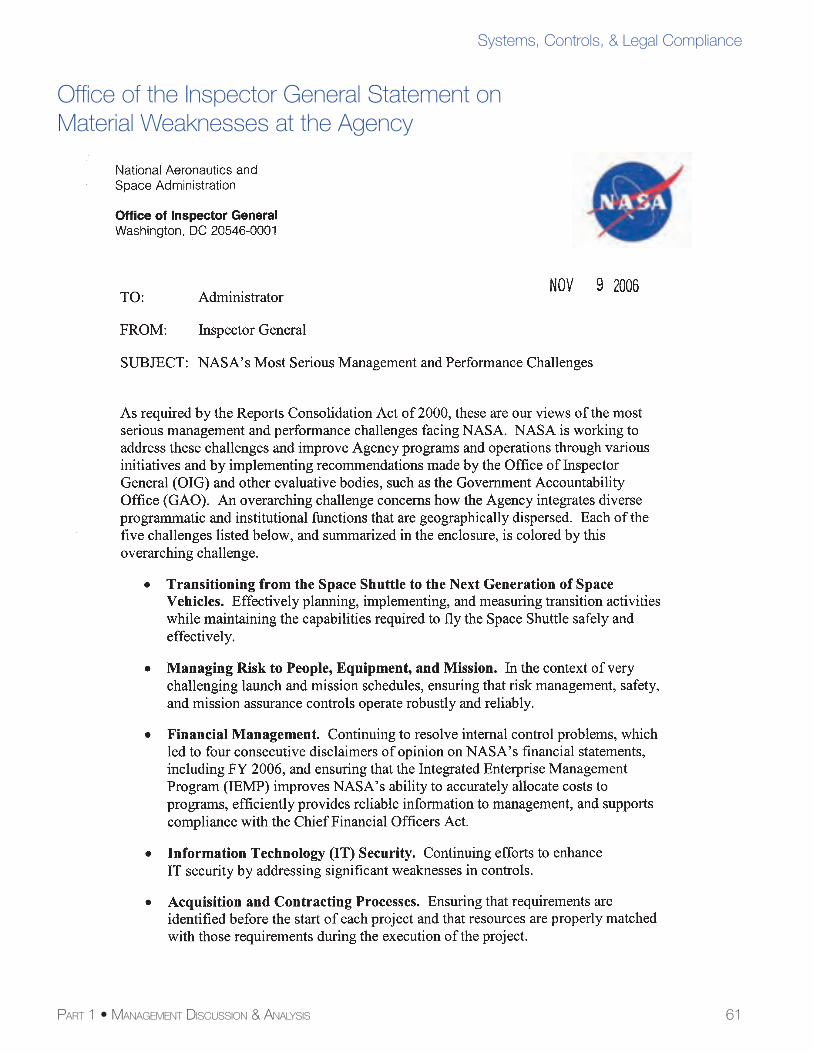
61PART 1 • MANAGEMENT DISCUSSION & ANALYSIS
Systems, Controls, & Legal Compliance
Offi ce of the Inspector General Statement on Material Weaknesses at the Agency
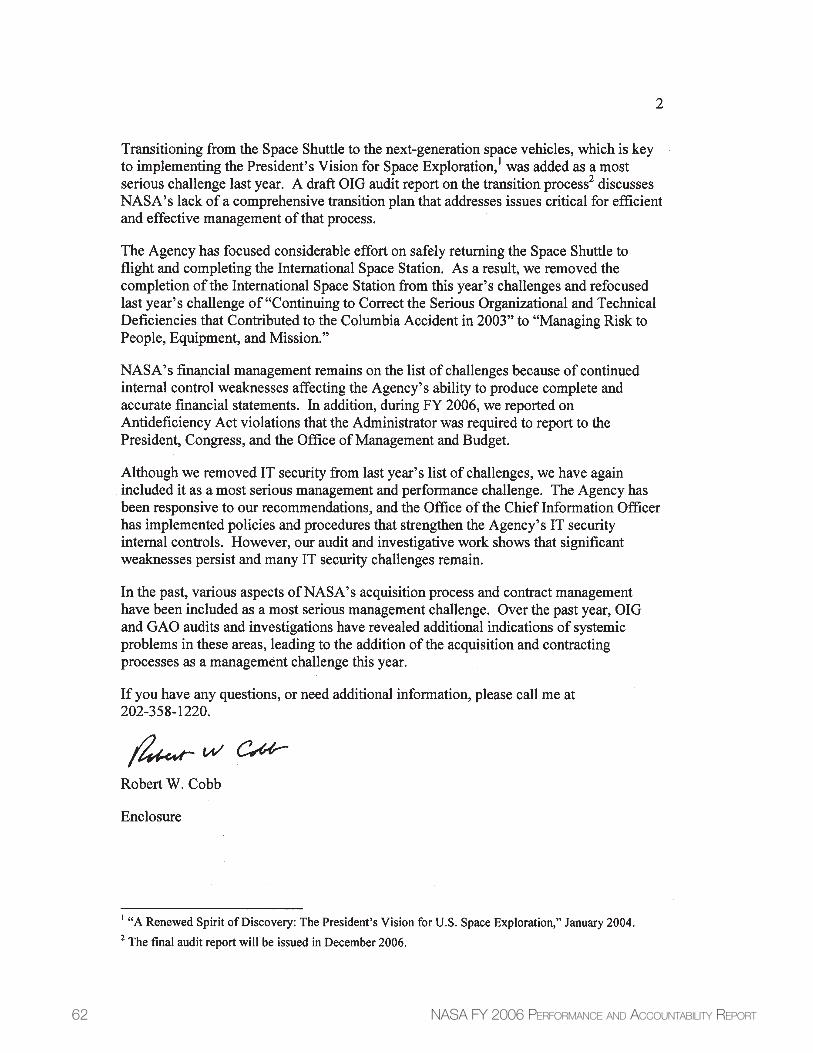
62 NASA FY 2006 PERFORMANCE AND ACCOUNTABILITY REPORT
63PART 1 • MANAGEMENT DISCUSSION & ANALYSIS
Systems, Controls, & Legal Compliance
64 NASA FY 2006 PERFORMANCE AND ACCOUNTABILITY REPORT
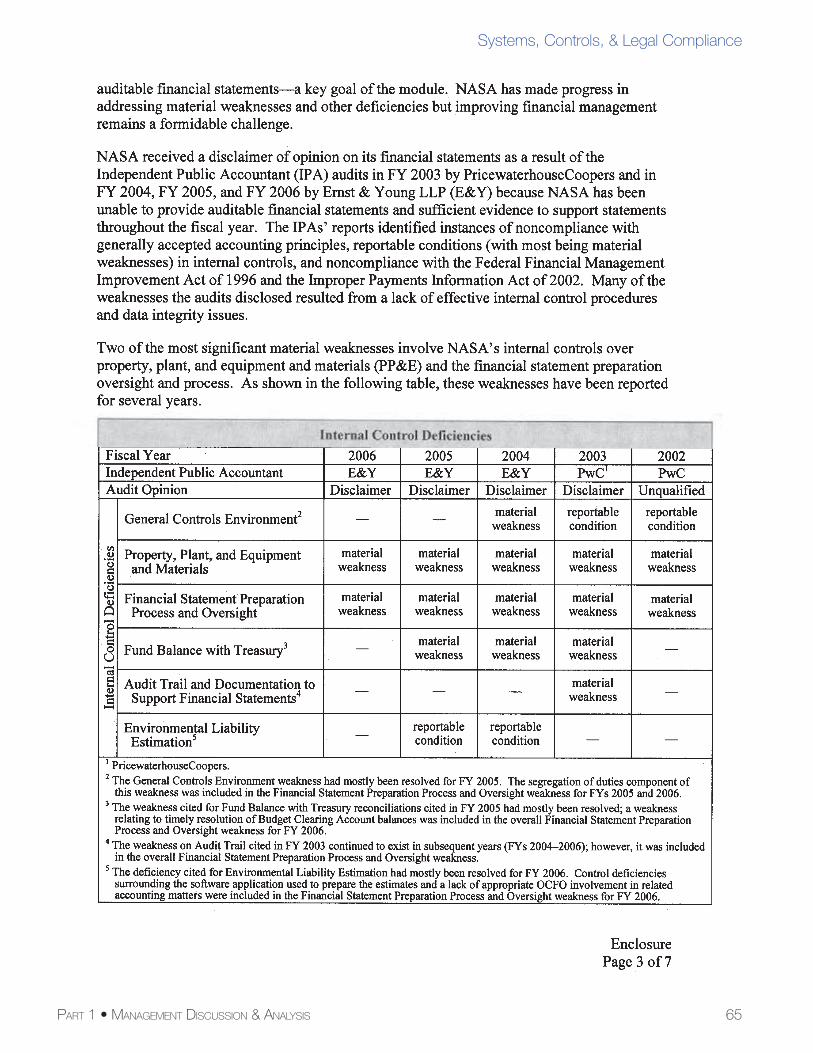
65PART 1 • MANAGEMENT DISCUSSION & ANALYSIS
Systems, Controls, & Legal Compliance
66 NASA FY 2006 PERFORMANCE AND ACCOUNTABILITY REPORT
67PART 1 • MANAGEMENT DISCUSSION & ANALYSIS
Systems, Controls, & Legal Compliance
68 NASA FY 2006 PERFORMANCE AND ACCOUNTABILITY REPORT
69PART 1 • MANAGEMENT DISCUSSION & ANALYSIS
Systems, Controls, & Legal Compliance
70 NASA FY 2006 PERFORMANCE AND ACCOUNTABILITY REPORT
Federal Financial Management Improvement ActNASA assessed the Agency’s fi nancial management systems to determine whether they comply with the require-ments of the Federal Financial Management Improvement Act (FFMIA) of 1996. The assessment was based on guidance issued by the Offi ce of Management and Budget (OMB). NASA management agrees with the fi ndings set forth in the independent auditor’s Report on Compliance with Laws and Regulations.
NASA is in the process of implementing remaining corrective actions from its 2005 Corrective Action Plan that address the Agency’s FFMIA weaknesses. Those corrective actions are intended to resolve the following:
• Certain weaknesses in fi nancial management process controls, primarily related to the Agency’s Property, Plant and Equipment;
• Limitations in NASA’s Core Financial Module software that continue to require compensating controls and systems; and
• Incorrect postings to certain general ledger accounts due to system confi guration or design issues.
As of September 30, 2006, NASA fi nancial management systems do not substantially comply with federal fi nancial management systems standards and requirements.
Improper Payments Information ActThe Improper Payments Information Act (IPIA) of 2002 requires federal agencies to review their programs and activi-ties annually to identify those that are susceptible to risk. OMB guidance defi nes signifi cant improper payments as annual improper payments in a Line of Business or Program that exceed both 2.5 percent of program payments and $10 million. Agencies are required to identify any programs and activities at risk, report the annual amount of improper payments, and implement corrective actions. NASA’s improper payment risk assessments identify existing and emerging vulnerabilities that can be reduced through corrective actions and that may produce a corresponding increase in program savings for the Agency.
In FY 2006, NASA continued to improve the Agency’s internal controls by establishing policies and procedures in NASA’s Financial Management Requirements (FMR), Volume 19: Periodic Monitoring Controls Activities, and by requiring that all NASA Field Centers perform 23 fi nancial reconciliations or verifi cations on a scheduled basis. The Agency also established a Quality Assurance Offi ce within the Offi ce of the Chief Financial Offi cer to provide direction and focus for NASA Internal Control activities.
NASA’s Efforts to Identify Erroneous/Improper PaymentsNASA reviews historical performance from the Offi ce of the Chief Financial Offi cer to identify programs and activi-ties susceptible to signifi cant improper payments. NASA’s assessed risk and actual results for the past three fi scal years have shown NASA’s improper payments to be less than 2.5 percent of program payments and less than $10 million.
In FY 2006, the Offi ce of the Chief Financial Offi cer expedited the identifi cation and recapturing of improper pay-ments that may have occurred at NASA Centers by implementing new processes based on OMB Memoranda M-03-07, Programs to Identify and Recover Erroneous Payments to Contractors. NASA further strengthened the Agency’s approach for addressing IPIA requirements by conducting an erroneous/improper payment assess-ment on all the research and development contract disbursements processed between FY 1997 and FY 2005, with a cumulative value of approximately $57.5 billion, as depicted in the chart below. The assessment validated that NASA’s susceptibility to improper payments is low under current guidance. (Note: The Improper Payment Reduction Outlook chart required by OMB Circular A-136, Financial Reporting Requirements, is not included in this report because NASA identifi ed no programs susceptible to signifi cant risk.)
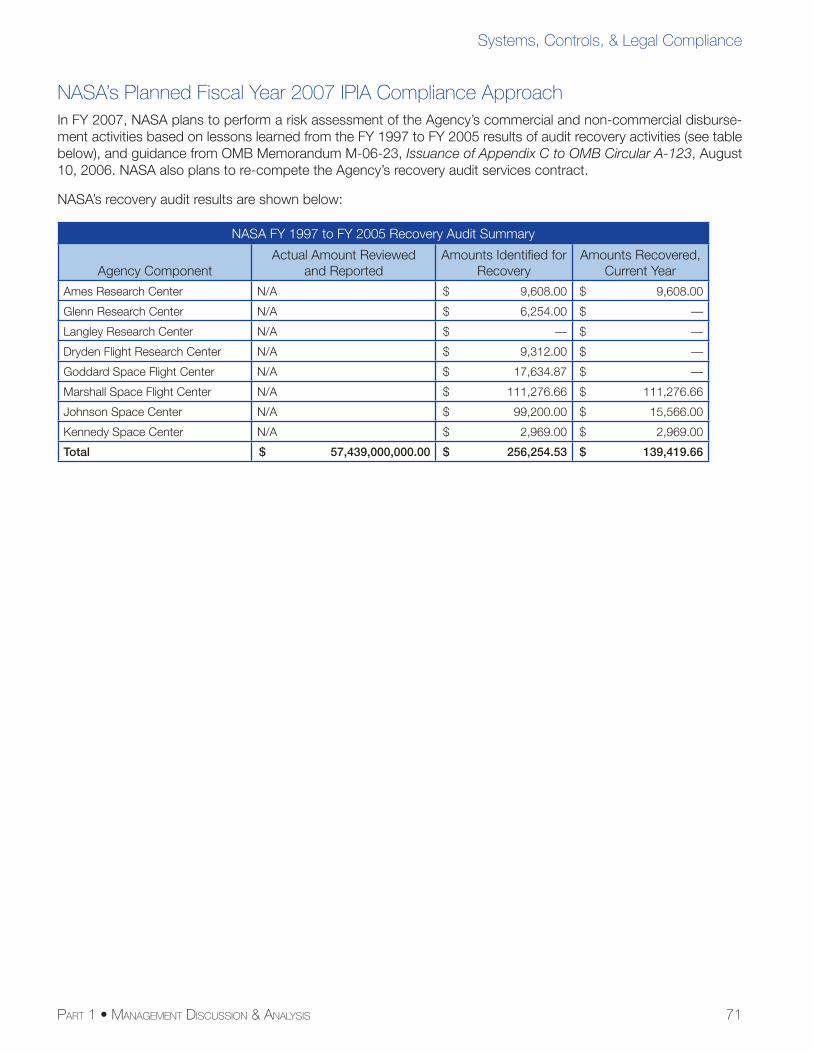
71PART 1 • MANAGEMENT DISCUSSION & ANALYSIS
Systems, Controls, & Legal Compliance
NASA’s Planned Fiscal Year 2007 IPIA Compliance ApproachIn FY 2007, NASA plans to perform a risk assessment of the Agency’s commercial and non-commercial disburse-ment activities based on lessons learned from the FY 1997 to FY 2005 results of audit recovery activities (see table below), and guidance from OMB Memorandum M-06-23, Issuance of Appendix C to OMB Circular A-123, August 10, 2006. NASA also plans to re-compete the Agency’s recovery audit services contract.
NASA’s recovery audit results are shown below:
NASA FY 1997 to FY 2005 Recovery Audit Summary
Agency ComponentActual Amount Reviewed
and ReportedAmounts Identifi ed for
RecoveryAmounts Recovered,
Current Year
Ames Research Center N/A $ 9,608.00 $ 9,608.00
Glenn Research Center N/A $ 6,254.00 $ —
Langley Research Center N/A $ — $ —
Dryden Flight Research Center N/A $ 9,312.00 $ —
Goddard Space Flight Center N/A $ 17,634.87 $ —
Marshall Space Flight Center N/A $ 111,276.66 $ 111,276.66
Johnson Space Center N/A $ 99,200.00 $ 15,566.00
Kennedy Space Center N/A $ 2,969.00 $ 2,969.00
Total $ 57,439,000,000.00 $ 256,254.53 $ 139,419.66
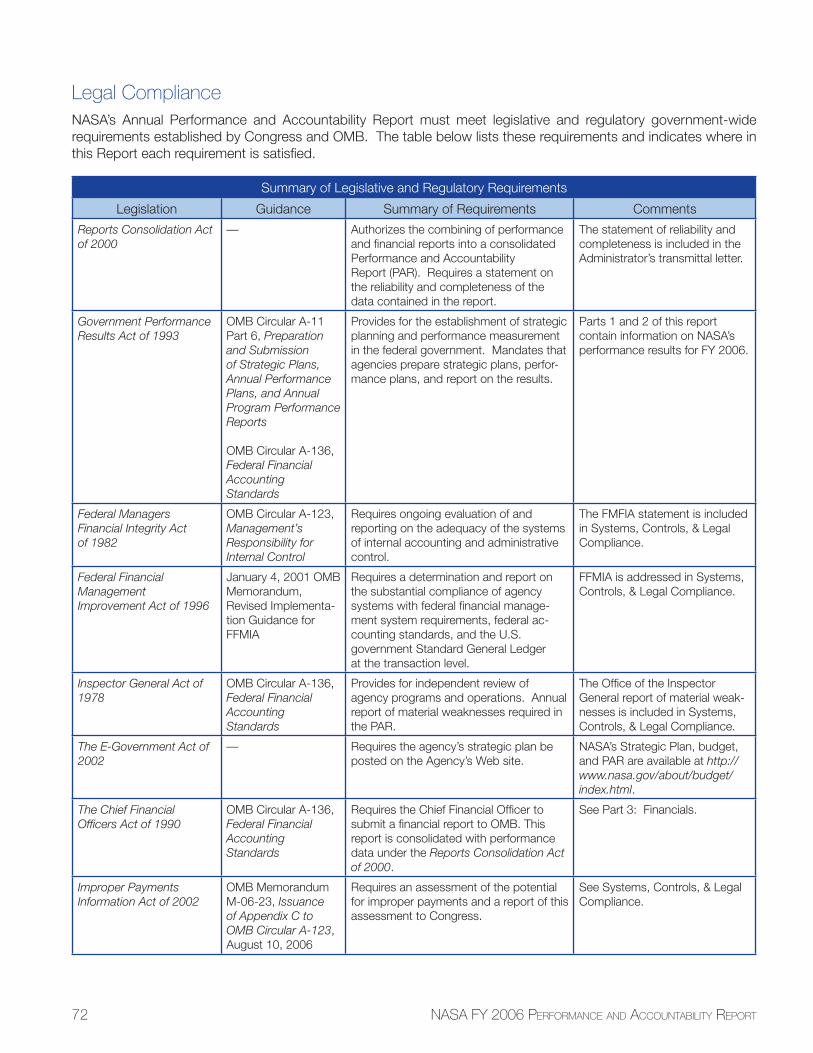
72 NASA FY 2006 PERFORMANCE AND ACCOUNTABILITY REPORT
Legal ComplianceNASA’s Annual Performance and Accountability Report must meet legislative and regulatory government-wide requirements established by Congress and OMB. The table below lists these requirements and indicates where in this Report each requirement is satisfi ed.
Summary of Legislative and Regulatory Requirements
Legislation Guidance Summary of Requirements Comments
Reports Consolidation Act of 2000
— Authorizes the combining of performance and fi nancial reports into a consolidated Performance and Accountability Report (PAR). Requires a statement on the reliability and completeness of the data contained in the report.
The statement of reliability and completeness is included in the Administrator’s transmittal letter.
Government Performance Results Act of 1993
OMB Circular A-11 Part 6, Preparation and Submission of Strategic Plans, Annual Performance Plans, and Annual Program Performance Reports
OMB Circular A-136, Federal Financial Accounting Standards
Provides for the establishment of strategic planning and performance measurement in the federal government. Mandates that agencies prepare strategic plans, perfor-mance plans, and report on the results.
Parts 1 and 2 of this report contain information on NASA’s performance results for FY 2006.
Federal Managers Financial Integrity Act of 1982
OMB Circular A-123, Management’s Responsibility for Internal Control
Requires ongoing evaluation of and reporting on the adequacy of the systems of internal accounting and administrative control.
The FMFIA statement is included in Systems, Controls, & Legal Compliance.
Federal Financial Management Improvement Act of 1996
January 4, 2001 OMB Memorandum, Revised Implementa-tion Guidance for FFMIA
Requires a determination and report on the substantial compliance of agency systems with federal fi nancial manage-ment system requirements, federal ac-counting standards, and the U.S. government Standard General Ledger at the transaction level.
FFMIA is addressed in Systems, Controls, & Legal Compliance.
Inspector General Act of 1978
OMB Circular A-136, Federal Financial Accounting Standards
Provides for independent review of agency programs and operations. Annual report of material weaknesses required in the PAR.
The Offi ce of the Inspector General report of material weak-nesses is included in Systems, Controls, & Legal Compliance.
The E-Government Act of 2002
— Requires the agency’s strategic plan be posted on the Agency’s Web site.
NASA’s Strategic Plan, budget, and PAR are available at http://www.nasa.gov/about/budget/index.html.
The Chief Financial Offi cers Act of 1990
OMB Circular A-136, Federal Financial Accounting Standards
Requires the Chief Financial Offi cer to submit a fi nancial report to OMB. This report is consolidated with performance data under the Reports Consolidation Act of 2000.
See Part 3: Financials.
Improper Payments Information Act of 2002
OMB Memorandum M-06-23, Issuance of Appendix C to OMB Circular A-123, August 10, 2006
Requires an assessment of the potential for improper payments and a report of this assessment to Congress.
See Systems, Controls, & Legal Compliance.
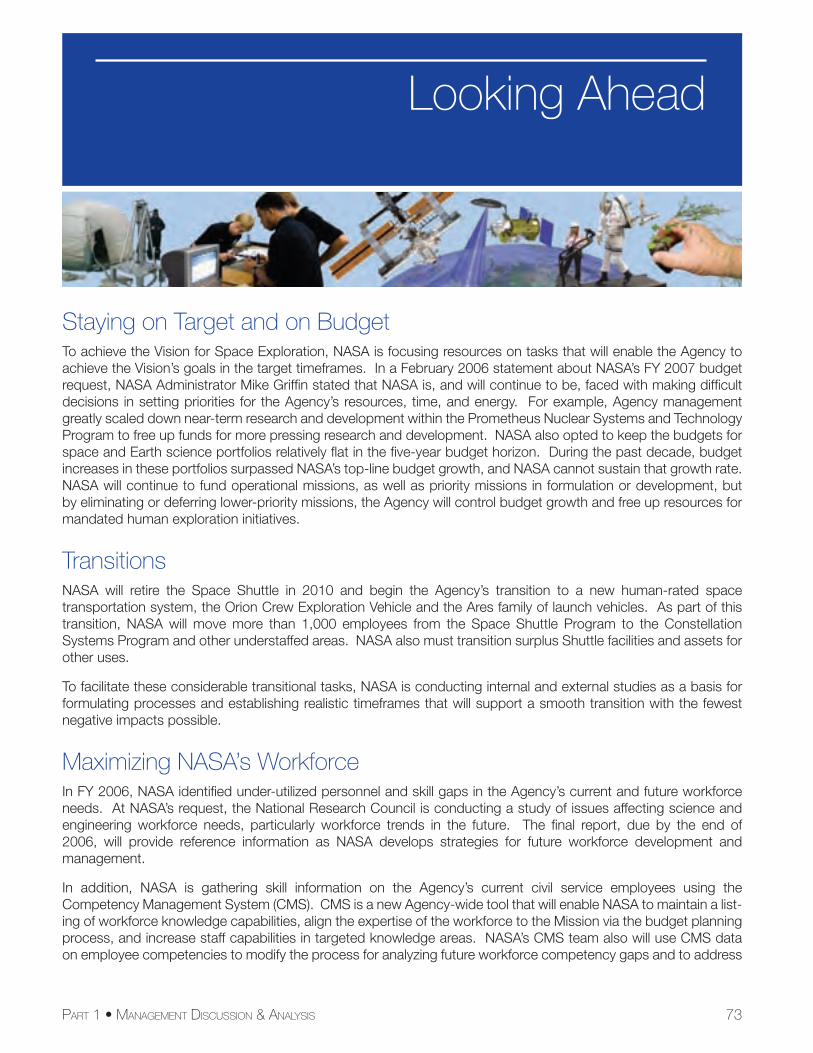
PART 1 • MANAGEMENT DISCUSSION & ANALYSIS 73
Staying on Target and on BudgetTo achieve the Vision for Space Exploration, NASA is focusing resources on tasks that will enable the Agency to achieve the Vision’s goals in the target timeframes. In a February 2006 statement about NASA’s FY 2007 budget request, NASA Administrator Mike Griffi n stated that NASA is, and will continue to be, faced with making diffi cult decisions in setting priorities for the Agency’s resources, time, and energy. For example, Agency management greatly scaled down near-term research and development within the Prometheus Nuclear Systems and Technology Program to free up funds for more pressing research and development. NASA also opted to keep the budgets for space and Earth science portfolios relatively fl at in the fi ve-year budget horizon. During the past decade, budget increases in these portfolios surpassed NASA’s top-line budget growth, and NASA cannot sustain that growth rate. NASA will continue to fund operational missions, as well as priority missions in formulation or development, but by eliminating or deferring lower-priority missions, the Agency will control budget growth and free up resources for mandated human exploration initiatives.
TransitionsNASA will retire the Space Shuttle in 2010 and begin the Agency’s transition to a new human-rated space transportation system, the Orion Crew Exploration Vehicle and the Ares family of launch vehicles. As part of this transition, NASA will move more than 1,000 employees from the Space Shuttle Program to the Constellation Systems Program and other understaffed areas. NASA also must transition surplus Shuttle facilities and assets for other uses.
To facilitate these considerable transitional tasks, NASA is conducting internal and external studies as a basis for formulating processes and establishing realistic timeframes that will support a smooth transition with the fewest negative impacts possible.
Maximizing NASA’s Workforce In FY 2006, NASA identifi ed under-utilized personnel and skill gaps in the Agency’s current and future workforce needs. At NASA’s request, the National Research Council is conducting a study of issues affecting science and engineering workforce needs, particularly workforce trends in the future. The fi nal report, due by the end of 2006, will provide reference information as NASA develops strategies for future workforce development and management.
In addition, NASA is gathering skill information on the Agency’s current civil service employees using the Competency Management System (CMS). CMS is a new Agency-wide tool that will enable NASA to maintain a list-ing of workforce knowledge capabilities, align the expertise of the workforce to the Mission via the budget planning process, and increase staff capabilities in targeted knowledge areas. NASA’s CMS team also will use CMS data on employee competencies to modify the process for analyzing future workforce competency gaps and to address
Looking Ahead
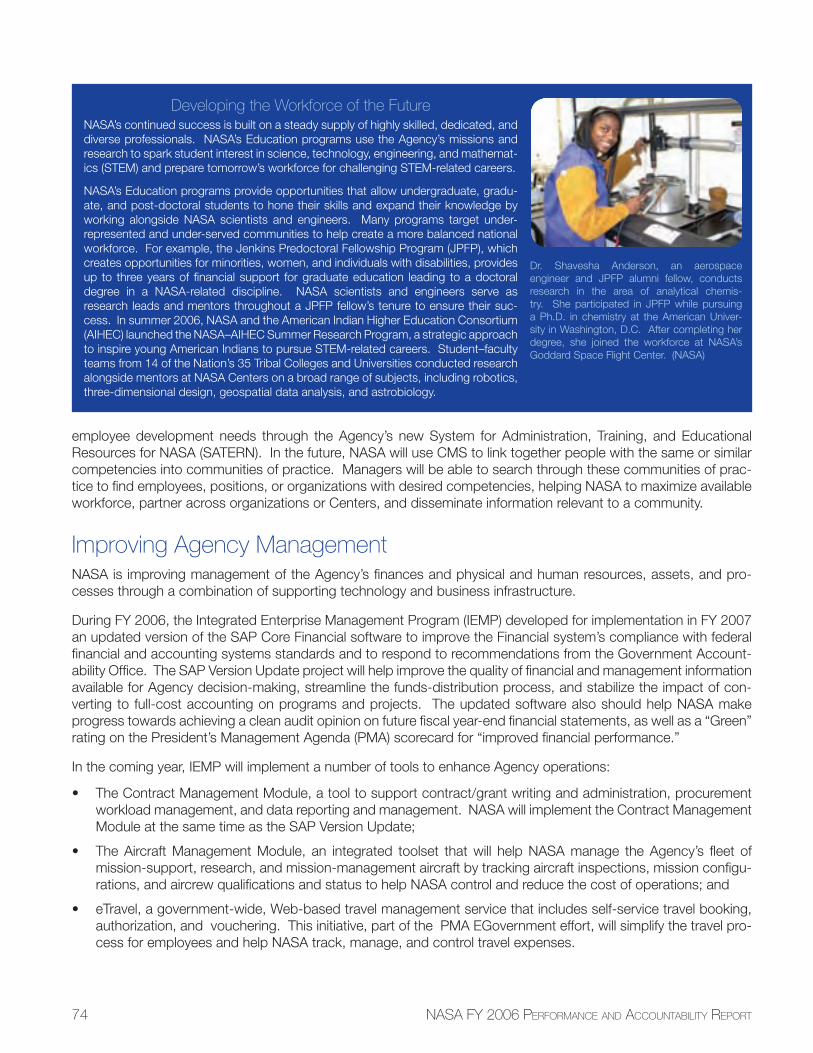
74 NASA FY 2006 PERFORMANCE AND ACCOUNTABILITY REPORT
employee development needs through the Agency’s new System for Administration, Training, and Educational Resources for NASA (SATERN). In the future, NASA will use CMS to link together people with the same or similar competencies into communities of practice. Managers will be able to search through these communities of prac-tice to fi nd employees, positions, or organizations with desired competencies, helping NASA to maximize available workforce, partner across organizations or Centers, and disseminate information relevant to a community.
Improving Agency ManagementNASA is improving management of the Agency’s fi nances and physical and human resources, assets, and pro-cesses through a combination of supporting technology and business infrastructure.
During FY 2006, the Integrated Enterprise Management Program (IEMP) developed for implementation in FY 2007 an updated version of the SAP Core Financial software to improve the Financial system’s compliance with federal fi nancial and accounting systems standards and to respond to recommendations from the Government Account-ability Offi ce. The SAP Version Update project will help improve the quality of fi nancial and management information available for Agency decision-making, streamline the funds-distribution process, and stabilize the impact of con-verting to full-cost accounting on programs and projects. The updated software also should help NASA make progress towards achieving a clean audit opinion on future fi scal year-end fi nancial statements, as well as a “Green” rating on the President’s Management Agenda (PMA) scorecard for “improved fi nancial performance.”
In the coming year, IEMP will implement a number of tools to enhance Agency operations:
• The Contract Management Module, a tool to support contract/grant writing and administration, procurement workload management, and data reporting and management. NASA will implement the Contract Management Module at the same time as the SAP Version Update;
• The Aircraft Management Module, an integrated toolset that will help NASA manage the Agency’s fl eet of mission-support, research, and mission-management aircraft by tracking aircraft inspections, mission confi gu-rations, and aircrew qualifi cations and status to help NASA control and reduce the cost of operations; and
• eTravel, a government-wide, Web-based travel management service that includes self-service travel booking, authorization, and vouchering. This initiative, part of the PMA EGovernment effort, will simplify the travel pro-cess for employees and help NASA track, manage, and control travel expenses.
Developing the Workforce of the FutureNASA’s continued success is built on a steady supply of highly skilled, dedicated, and diverse professionals. NASA’s Education programs use the Agency’s missions and research to spark student interest in science, technology, engineering, and mathemat-ics (STEM) and prepare tomorrow’s workforce for challenging STEM-related careers.
NASA’s Education programs provide opportunities that allow undergraduate, gradu-ate, and post-doctoral students to hone their skills and expand their knowledge by working alongside NASA scientists and engineers. Many programs target under-represented and under-served communities to help create a more balanced national workforce. For example, the Jenkins Predoctoral Fellowship Program (JPFP), which creates opportunities for minorities, women, and individuals with disabilities, provides up to three years of fi nancial support for graduate education leading to a doctoral degree in a NASA-related discipline. NASA scientists and engineers serve as research leads and mentors throughout a JPFP fellow’s tenure to ensure their suc-cess. In summer 2006, NASA and the American Indian Higher Education Consortium (AIHEC) launched the NASA–AIHEC Summer Research Program, a strategic approach to inspire young American Indians to pursue STEM-related careers. Student–faculty teams from 14 of the Nation’s 35 Tribal Colleges and Universities conducted research alongside mentors at NASA Centers on a broad range of subjects, including robotics, three-dimensional design, geospatial data analysis, and astrobiology.
Dr. Shavesha Anderson, an aerospace engineer and JPFP alumni fellow, conducts research in the area of analytical chemis-try. She participated in JPFP while pursuing a Ph.D. in chemistry at the American Univer-sity in Washington, D.C. After completing her degree, she joined the workforce at NASA’s Goddard Space Flight Center. (NASA)
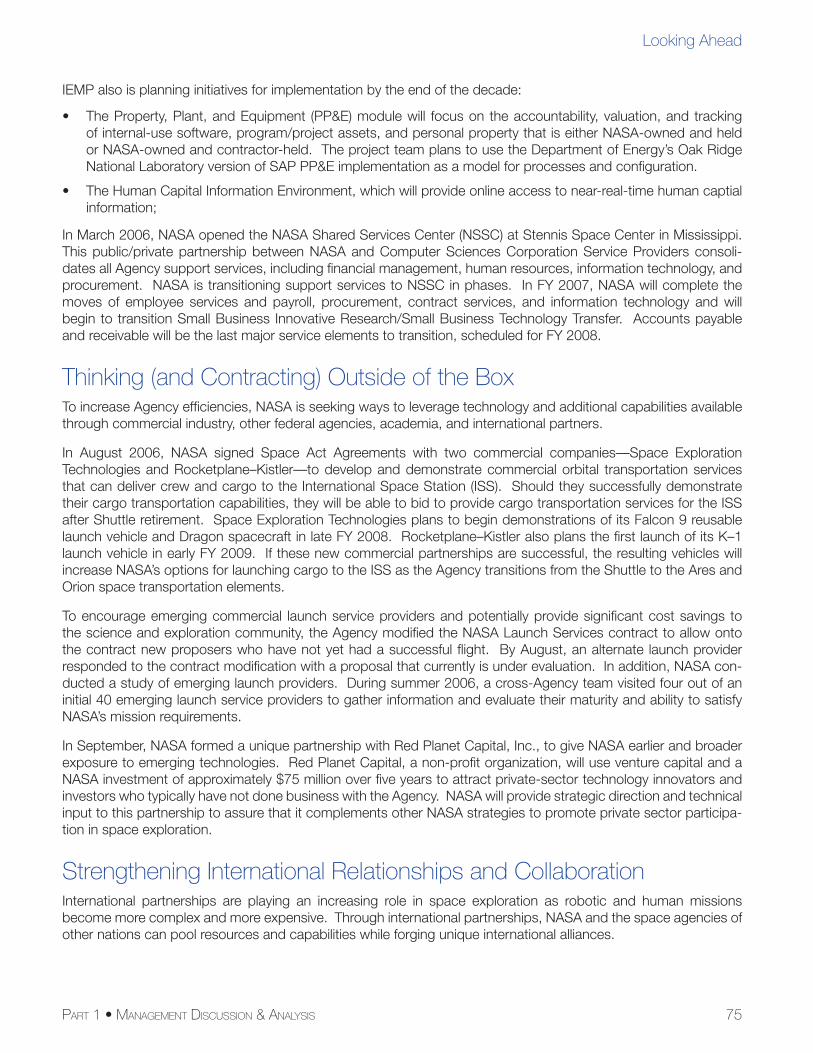
75PART 1 • MANAGEMENT DISCUSSION & ANALYSIS
Looking Ahead
IEMP also is planning initiatives for implementation by the end of the decade:
• The Property, Plant, and Equipment (PP&E) module will focus on the accountability, valuation, and tracking of internal-use software, program/project assets, and personal property that is either NASA-owned and held or NASA-owned and contractor-held. The project team plans to use the Department of Energy’s Oak Ridge National Laboratory version of SAP PP&E implementation as a model for processes and confi guration.
• The Human Capital Information Environment, which will provide online access to near-real-time human captial information;
In March 2006, NASA opened the NASA Shared Services Center (NSSC) at Stennis Space Center in Mississippi. This public/private partnership between NASA and Computer Sciences Corporation Service Providers consoli-dates all Agency support services, including fi nancial management, human resources, information technology, and procurement. NASA is transitioning support services to NSSC in phases. In FY 2007, NASA will complete the moves of employee services and payroll, procurement, contract services, and information technology and will begin to transition Small Business Innovative Research/Small Business Technology Transfer. Accounts payable and receivable will be the last major service elements to transition, scheduled for FY 2008.
Thinking (and Contracting) Outside of the BoxTo increase Agency effi ciencies, NASA is seeking ways to leverage technology and additional capabilities available through commercial industry, other federal agencies, academia, and international partners.
In August 2006, NASA signed Space Act Agreements with two commercial companies—Space Exploration Technologies and Rocketplane–Kistler—to develop and demonstrate commercial orbital transportation services that can deliver crew and cargo to the International Space Station (ISS). Should they successfully demonstrate their cargo transportation capabilities, they will be able to bid to provide cargo transportation services for the ISS after Shuttle retirement. Space Exploration Technologies plans to begin demonstrations of its Falcon 9 reusable launch vehicle and Dragon spacecraft in late FY 2008. Rocketplane–Kistler also plans the fi rst launch of its K–1 launch vehicle in early FY 2009. If these new commercial partnerships are successful, the resulting vehicles will increase NASA’s options for launching cargo to the ISS as the Agency transitions from the Shuttle to the Ares and Orion space transportation elements.
To encourage emerging commercial launch service providers and potentially provide signifi cant cost savings to the science and exploration community, the Agency modifi ed the NASA Launch Services contract to allow onto the contract new proposers who have not yet had a successful fl ight. By August, an alternate launch provider responded to the contract modifi cation with a proposal that currently is under evaluation. In addition, NASA con-ducted a study of emerging launch providers. During summer 2006, a cross-Agency team visited four out of an initial 40 emerging launch service providers to gather information and evaluate their maturity and ability to satisfy NASA’s mission requirements.
In September, NASA formed a unique partnership with Red Planet Capital, Inc., to give NASA earlier and broader exposure to emerging technologies. Red Planet Capital, a non-profi t organization, will use venture capital and a NASA investment of approximately $75 million over fi ve years to attract private-sector technology innovators and investors who typically have not done business with the Agency. NASA will provide strategic direction and technical input to this partnership to assure that it complements other NASA strategies to promote private sector participa-tion in space exploration.
Strengthening International Relationships and CollaborationInternational partnerships are playing an increasing role in space exploration as robotic and human missions become more complex and more expensive. Through international partnerships, NASA and the space agencies of other nations can pool resources and capabilities while forging unique international alliances.
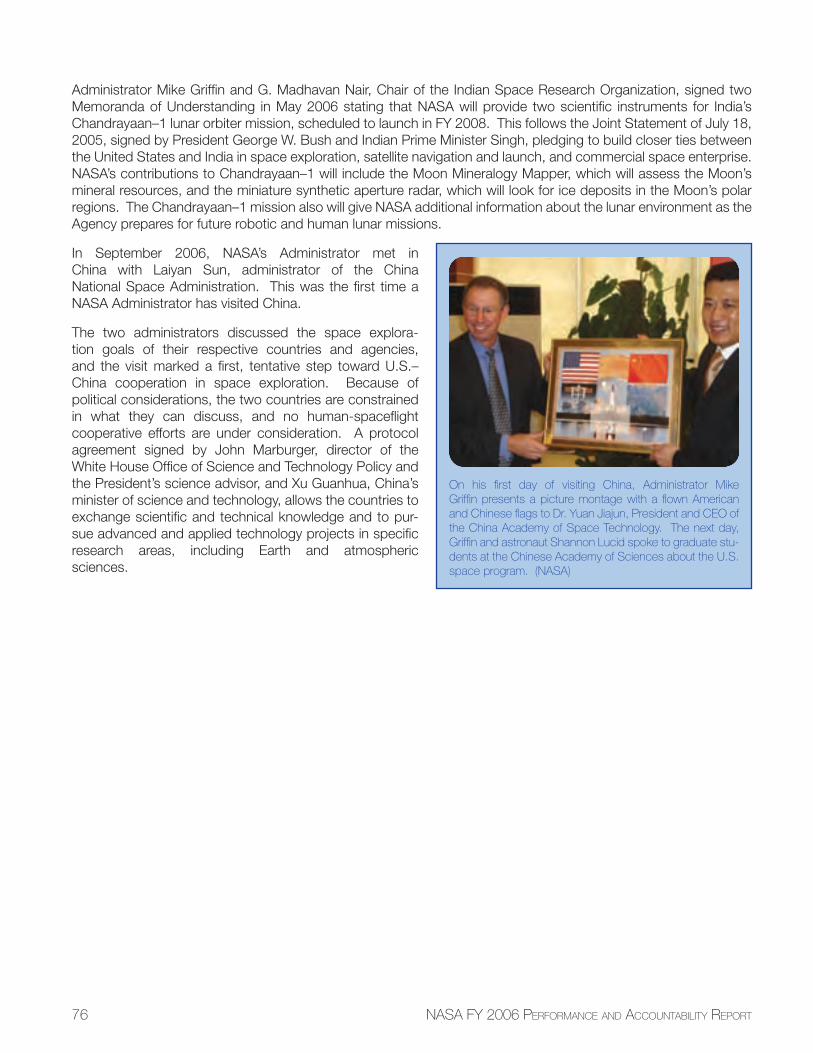
76 NASA FY 2006 PERFORMANCE AND ACCOUNTABILITY REPORT
Administrator Mike Griffi n and G. Madhavan Nair, Chair of the Indian Space Research Organization, signed two Memoranda of Understanding in May 2006 stating that NASA will provide two scientifi c instruments for India’s Chandrayaan–1 lunar orbiter mission, scheduled to launch in FY 2008. This follows the Joint Statement of July 18, 2005, signed by President George W. Bush and Indian Prime Minister Singh, pledging to build closer ties between the United States and India in space exploration, satellite navigation and launch, and commercial space enterprise. NASA’s contributions to Chandrayaan–1 will include the Moon Mineralogy Mapper, which will assess the Moon’s mineral resources, and the miniature synthetic aperture radar, which will look for ice deposits in the Moon’s polar regions. The Chandrayaan–1 mission also will give NASA additional information about the lunar environment as the Agency prepares for future robotic and human lunar missions.
In September 2006, NASA’s Administrator met in China with Laiyan Sun, administrator of the China National Space Administration. This was the fi rst time a NASA Administrator has visited China.
The two administrators discussed the space explora-tion goals of their respective countries and agencies, and the visit marked a fi rst, tentative step toward U.S.–China cooperation in space exploration. Because of political considerations, the two countries are constrained in what they can discuss, and no human-spacefl ight cooperative efforts are under consideration. A protocol agreement signed by John Marburger, director of the White House Offi ce of Science and Technology Policy and the President’s science advisor, and Xu Guanhua, China’s minister of science and technology, allows the countries to exchange scientifi c and technical knowledge and to pur-sue advanced and applied technology projects in specifi c research areas, including Earth and atmospheric sciences.
On his fi rst day of visiting China, Administrator Mike Griffi n presents a picture montage with a fl own American and Chinese fl ags to Dr. Yuan Jiajun, President and CEO of the China Academy of Space Technology. The next day, Griffi n and astronaut Shannon Lucid spoke to graduate stu-dents at the Chinese Academy of Sciences about the U.S. space program. (NASA)
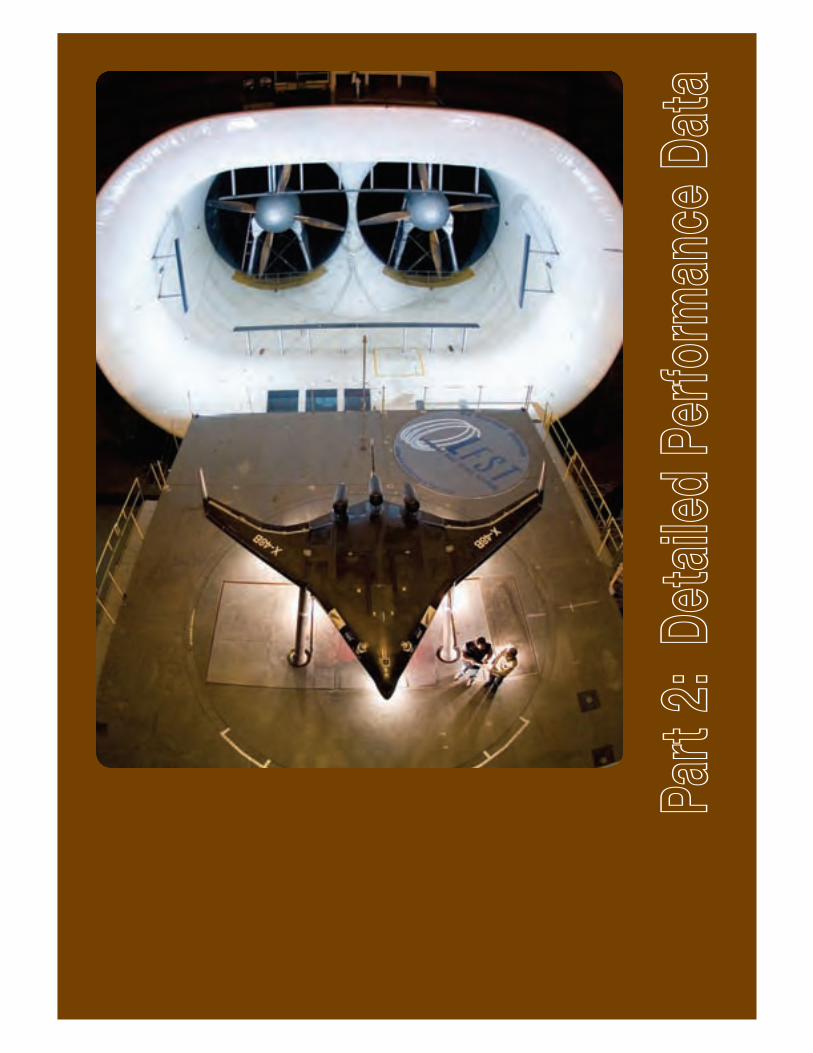
Part
2: D
etail
ed P
erfo
rman
ce D
ata
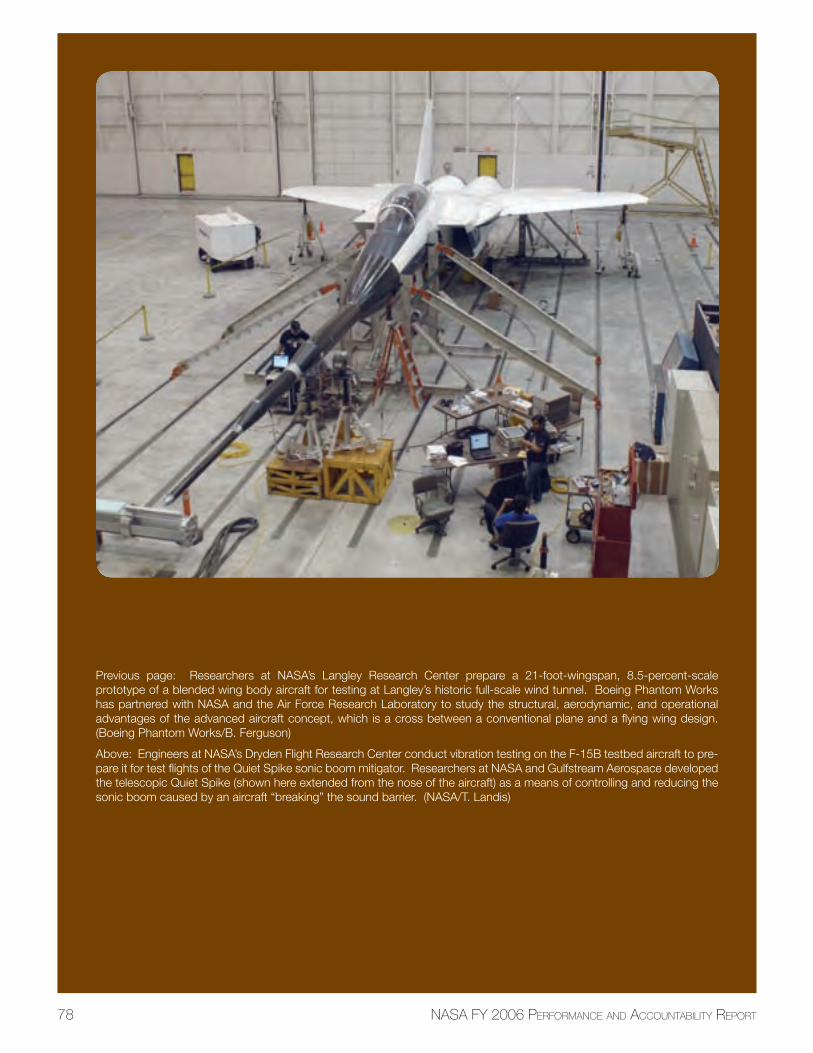
Previous page: Researchers at NASA’s Langley Research Center prepare a 21-foot-wingspan, 8.5-percent-scale prototype of a blended wing body aircraft for testing at Langley’s historic full-scale wind tunnel. Boeing Phantom Works has partnered with NASA and the Air Force Research Laboratory to study the structural, aerodynamic, and operational advantages of the advanced aircraft concept, which is a cross between a conventional plane and a fl ying wing design. (Boeing Phantom Works/B. Ferguson)
Above: Engineers at NASA’s Dryden Flight Research Center conduct vibration testing on the F-15B testbed aircraft to pre-pare it for test fl ights of the Quiet Spike sonic boom mitigator. Researchers at NASA and Gulfstream Aerospace developed the telescopic Quiet Spike (shown here extended from the nose of the aircraft) as a means of controlling and reducing the sonic boom caused by an aircraft “breaking” the sound barrier. (NASA/T. Landis)
78 NASA FY 2006 PERFORMANCE AND ACCOUNTABILITY REPORT
PART 2 • DETAILED PERFORMANCE DATA 79
NASA’s Performance Rating SystemIn February, NASA issued the 2006 NASA Strategic Plan, refl ecting the Agency’s focus on achieving the Vision for Space Exploration through six Strategic Goals and, under Strategic Goal 3, six Sub-goals. At the same time, NASA updated the Agency’s FY 2006 Performance Plan to include multi-year and annual performance metrics that NASA will pursue in support of the new Strategic Goals.
Part 2: Detailed Performance Data describes each Strategic Goal and Sub-goal and provides a detailed perfor-mance report and color rating, including trend data, for each of NASA’s 37 multi-year Outcomes and 165 Annual Performance Goals (APGs). The FY 2006 NASA Performance Improvement Plan, included at the end of this part, provides further information on performance shortfalls and the Agency’s plans to achieve the unmet multi-year Outcomes and APGs in the future.
NASA managers assign annual performance ratings to each multi-year Outcome and APG based on a number of factors, including internal assessments of performance against plans in such areas as budgets, schedules, and key milestones. Managers also consider input from external reviewers, including NASA advisors and experts from the science community, as well as recommendations from the Offi ce of Management and Budget.
NASA rates performance as follows:
Multi-year Outcome Rating Scale
Green NASA achieved most APGs under this Outcome and is on-track to achieve or exceed this Outcome.
Yellow NASA made signifi cant progress toward this Outcome, however, the Agency may not achieve this Outcome as stated.
Red NASA failed to achieve most of the APGs under this Outcome and does not expect to achieve this Outcome as stated.
WhiteThis Outcome was canceled by management directive or is no longer applicable based on management changes to the APGs.
APG Rating Scale
Green NASA achieved this APG.
Yellow NASA failed to achieve this APG, but made signifi cant progress and anticipates achieving it during the next fi scal year.
Red NASA failed to achieve this APG, and does not anticipate completing it within the next fi scal year.
White This APG was canceled by management directive, and NASA is no longer pursuing activities relevant to this APG.
In FY 2006, NASA achieved 84 percent of the Agency’s 37 multi-year Outcomes, as shown in Figure 1. NASA also achieved 70 percent of the Agency’s 165 APGs. NASA rated 12 percent of the Agency’s APGs Yellow and 18 percent either Red or White. In previous years, NASA rated performance that exceeded expectations and
Detailed Performance Data
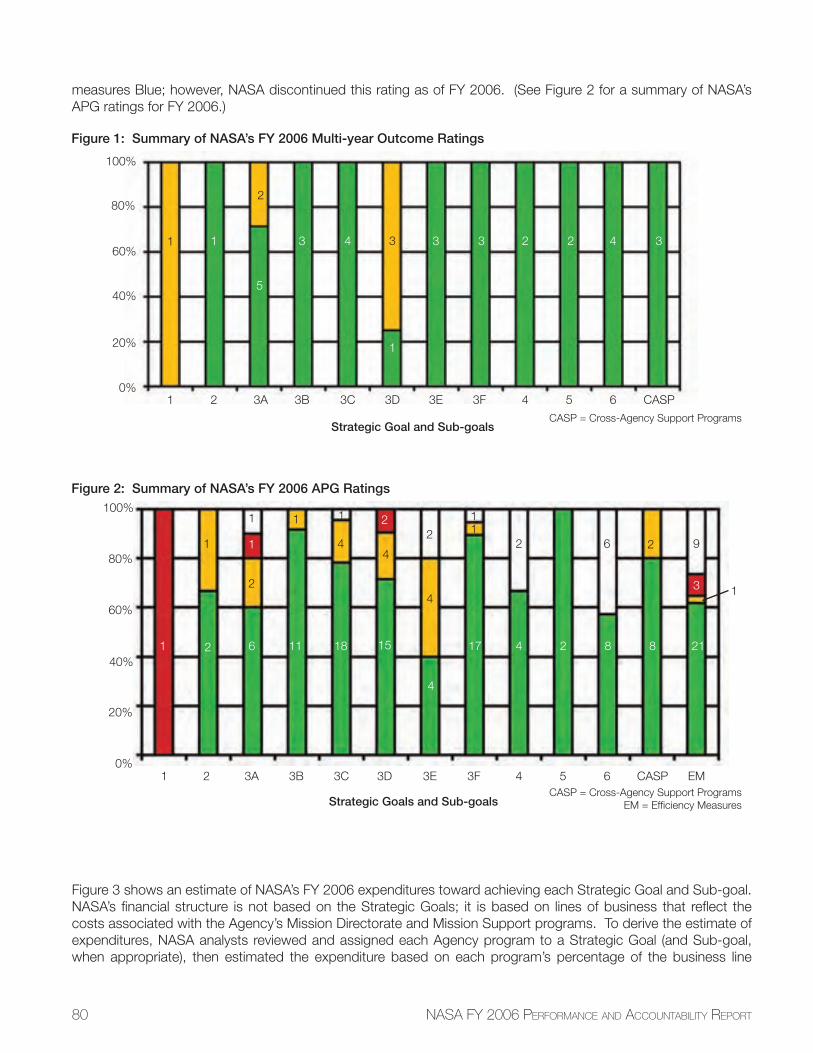
80 NASA FY 2006 PERFORMANCE AND ACCOUNTABILITY REPORT
measures Blue; however, NASA discontinued this rating as of FY 2006. (See Figure 2 for a summary of NASA’s APG ratings for FY 2006.)
Figure 3 shows an estimate of NASA’s FY 2006 expenditures toward achieving each Strategic Goal and Sub-goal. NASA’s fi nancial structure is not based on the Strategic Goals; it is based on lines of business that refl ect the costs associated with the Agency’s Mission Directorate and Mission Support programs. To derive the estimate of expenditures, NASA analysts reviewed and assigned each Agency program to a Strategic Goal (and Sub-goal, when appropriate), then estimated the expenditure based on each program’s percentage of the business line
Figure 2: Summary of NASA’s FY 2006 APG Ratings100%
80%
60%
40%
20%
0%1 2 3A 3B 3C 3D 3E 3F 4 5 6 CASP EM
Strategic Goals and Sub-goalsCASP = Cross-Agency Support Programs
EM = Effi ciency Measures
1 2 6
1
11 18 15
2
4
17 4 2 8 8 21
3
1
2
1 1
4
1
4
4
2 11
2 6 2 9
1
100%
80%
60%
40%
0%
20%
1 2 3A 3B 3C 3D 3E 3F 4 5 6 CASP
CASP = Cross-Agency Support Programs
1 1
2
5
3 4
1
3 3 2 2 4 33
Strategic Goal and Sub-goals
Figure 1: Summary of NASA’s FY 2006 Multi-year Outcome Ratings
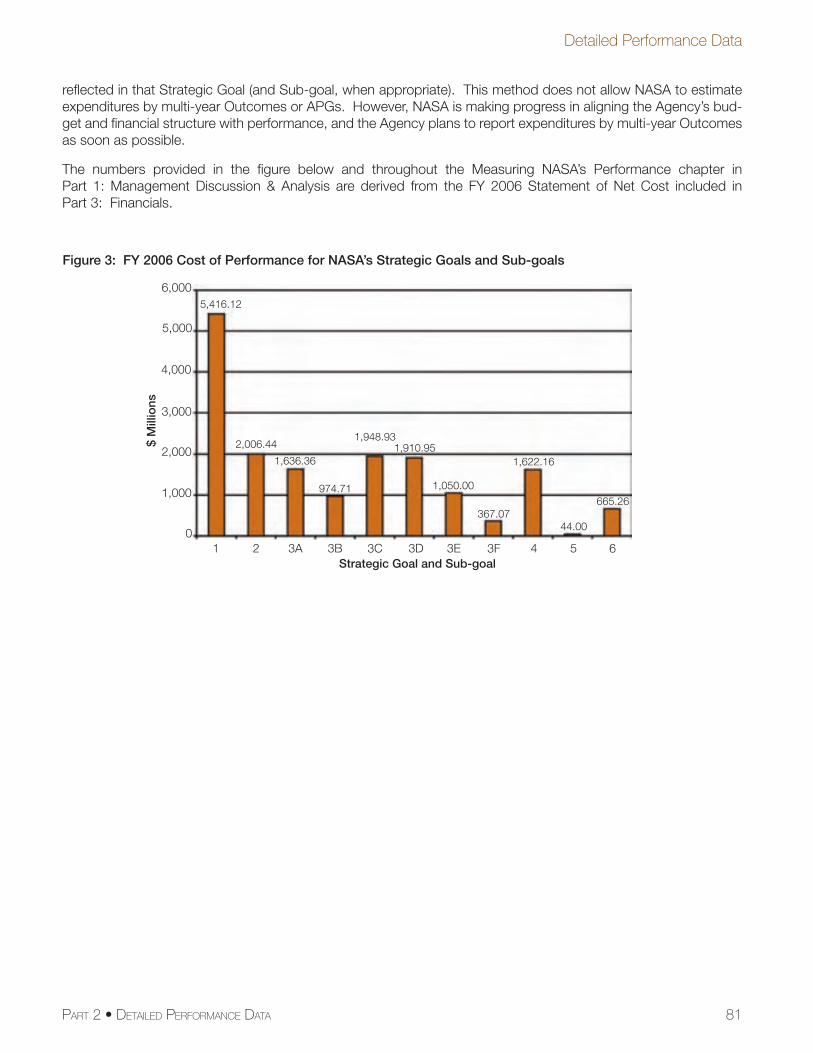
81
Detailed Performance Data
PART 2 • DETAILED PERFORMANCE DATA
refl ected in that Strategic Goal (and Sub-goal, when appropriate). This method does not allow NASA to estimate expenditures by multi-year Outcomes or APGs. However, NASA is making progress in aligning the Agency’s bud-get and fi nancial structure with performance, and the Agency plans to report expenditures by multi-year Outcomes as soon as possible.
The numbers provided in the fi gure below and throughout the Measuring NASA’s Performance chapter in Part 1: Management Discussion & Analysis are derived from the FY 2006 Statement of Net Cost included in Part 3: Financials.
Strategic Goal and Sub-goal
$ M
illio
ns
6,000
5,000
4,000
3,000
2,000
1,000
01 2 3A 3B 3C 3D 3E 3F 4 5 6
5,416.12
2,006.44
1,636.36
974.71
1,948.931,910.95
1,050.00
367.07
1,622.16
665.26
44.00
Figure 3: FY 2006 Cost of Performance for NASA’s Strategic Goals and Sub-goals
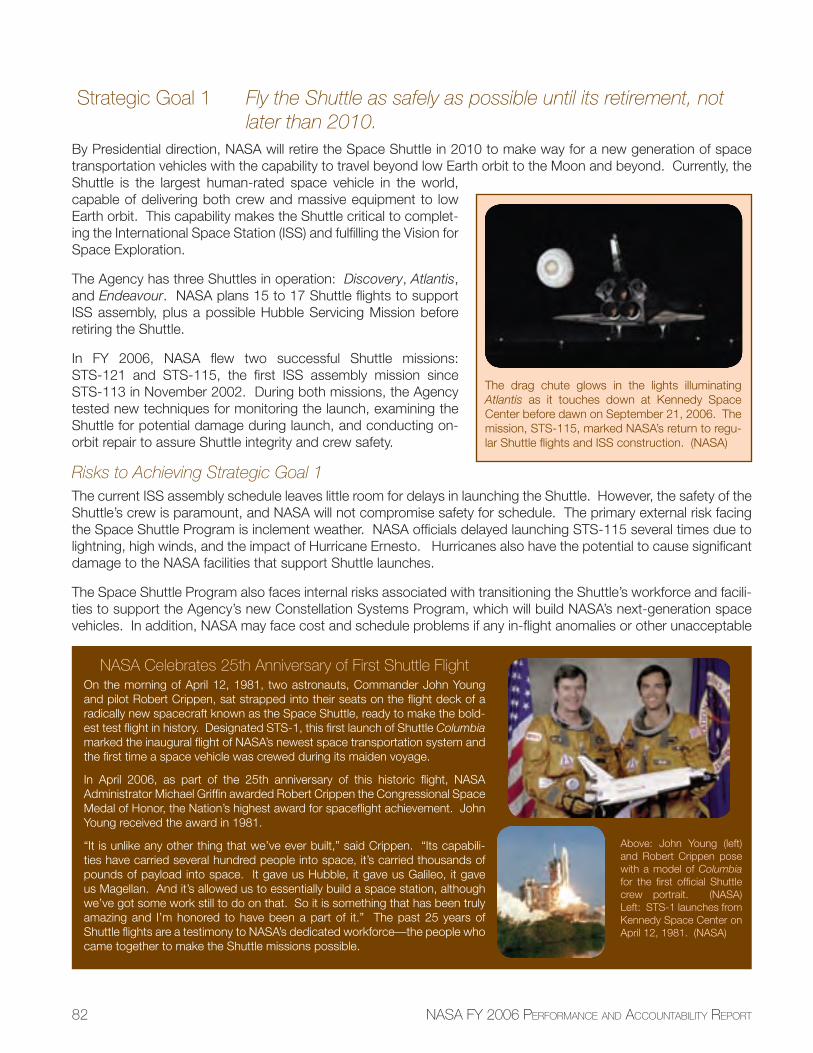
82 NASA FY 2006 PERFORMANCE AND ACCOUNTABILITY REPORT
Strategic Goal 1 Fly the Shuttle as safely as possible until its retirement, not later than 2010.
By Presidential direction, NASA will retire the Space Shuttle in 2010 to make way for a new generation of space transportation vehicles with the capability to travel beyond low Earth orbit to the Moon and beyond. Currently, the Shuttle is the largest human-rated space vehicle in the world, capable of delivering both crew and massive equipment to low Earth orbit. This capability makes the Shuttle critical to complet-ing the International Space Station (ISS) and fulfi lling the Vision for Space Exploration.
The Agency has three Shuttles in operation: Discovery, Atlantis, and Endeavour. NASA plans 15 to 17 Shuttle fl ights to support ISS assembly, plus a possible Hubble Servicing Mission before retiring the Shuttle.
In FY 2006, NASA fl ew two successful Shuttle missions: STS-121 and STS-115, the fi rst ISS assembly mission since STS-113 in November 2002. During both missions, the Agency tested new techniques for monitoring the launch, examining the Shuttle for potential damage during launch, and conducting on-orbit repair to assure Shuttle integrity and crew safety.
Risks to Achieving Strategic Goal 1 The current ISS assembly schedule leaves little room for delays in launching the Shuttle. However, the safety of the Shuttle’s crew is paramount, and NASA will not compromise safety for schedule. The primary external risk facing the Space Shuttle Program is inclement weather. NASA offi cials delayed launching STS-115 several times due to lightning, high winds, and the impact of Hurricane Ernesto. Hurricanes also have the potential to cause signifi cant damage to the NASA facilities that support Shuttle launches.
The Space Shuttle Program also faces internal risks associated with transitioning the Shuttle’s workforce and facili-ties to support the Agency’s new Constellation Systems Program, which will build NASA’s next-generation space vehicles. In addition, NASA may face cost and schedule problems if any in-fl ight anomalies or other unacceptable
The drag chute glows in the lights illuminating Atlantis as it touches down at Kennedy Space Center before dawn on September 21, 2006. The mission, STS-115, marked NASA’s return to regu-lar Shuttle fl ights and ISS construction. (NASA)
NASA Celebrates 25th Anniversary of First Shuttle FlightOn the morning of April 12, 1981, two astronauts, Commander John Young and pilot Robert Crippen, sat strapped into their seats on the fl ight deck of a radically new spacecraft known as the Space Shuttle, ready to make the bold-est test fl ight in history. Designated STS-1, this fi rst launch of Shuttle Columbia marked the inaugural fl ight of NASA’s newest space transportation system and the fi rst time a space vehicle was crewed during its maiden voyage.
In April 2006, as part of the 25th anniversary of this historic fl ight, NASA Administrator Michael Griffi n awarded Robert Crippen the Congressional Space Medal of Honor, the Nation’s highest award for spacefl ight achievement. John Young received the award in 1981.
“It is unlike any other thing that we’ve ever built,” said Crippen. “Its capabili-ties have carried several hundred people into space, it’s carried thousands of pounds of payload into space. It gave us Hubble, it gave us Galileo, it gave us Magellan. And it’s allowed us to essentially build a space station, although we’ve got some work still to do on that. So it is something that has been truly amazing and I’m honored to have been a part of it.” The past 25 years of Shuttle fl ights are a testimony to NASA’s dedicated workforce—the people who came together to make the Shuttle missions possible.
Above: John Young (left) and Robert Crippen pose with a model of Columbia for the fi rst offi cial Shuttle crew portrait. (NASA) Left: STS-1 launches from Kennedy Space Center on April 12, 1981. (NASA)
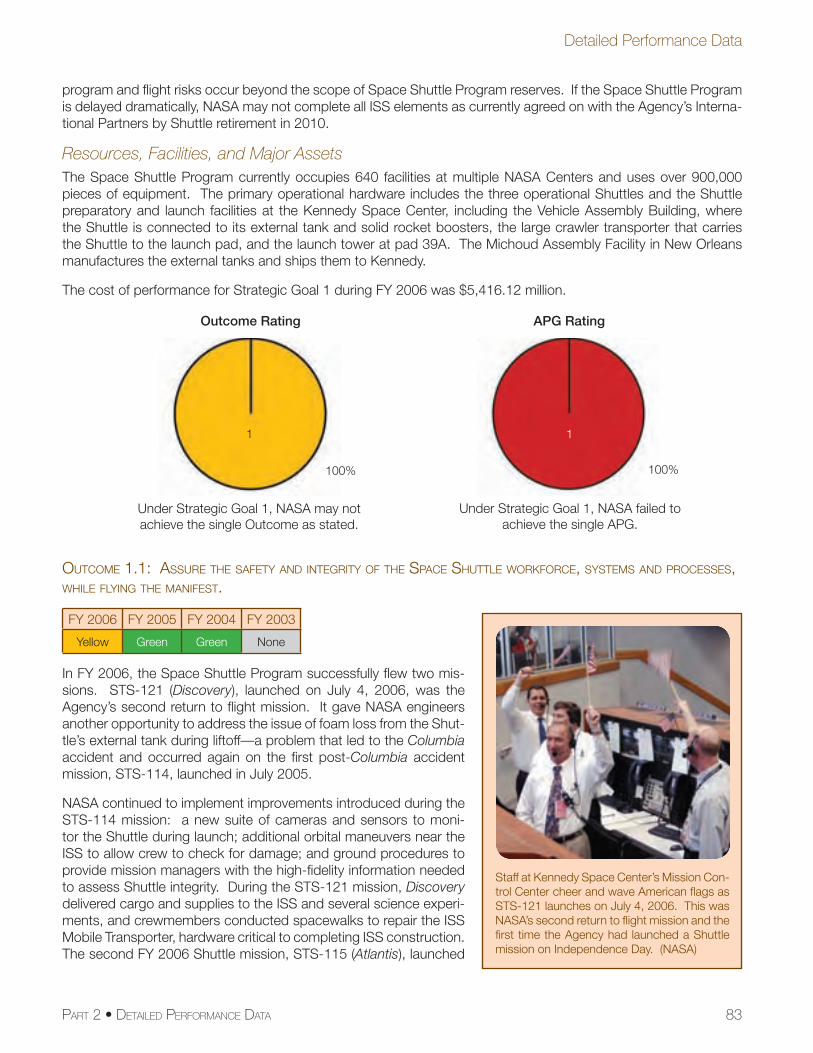
83
Detailed Performance Data
PART 2 • DETAILED PERFORMANCE DATA
program and fl ight risks occur beyond the scope of Space Shuttle Program reserves. If the Space Shuttle Program is delayed dramatically, NASA may not complete all ISS elements as currently agreed on with the Agency’s Interna-tional Partners by Shuttle retirement in 2010.
Resources, Facilities, and Major AssetsThe Space Shuttle Program currently occupies 640 facilities at multiple NASA Centers and uses over 900,000 pieces of equipment. The primary operational hardware includes the three operational Shuttles and the Shuttle preparatory and launch facilities at the Kennedy Space Center, including the Vehicle Assembly Building, where the Shuttle is connected to its external tank and solid rocket boosters, the large crawler transporter that carries the Shuttle to the launch pad, and the launch tower at pad 39A. The Michoud Assembly Facility in New Orleans manufactures the external tanks and ships them to Kennedy.
The cost of performance for Strategic Goal 1 during FY 2006 was $5,416.12 million.
OUTCOME 1.1: ASSURE THE SAFETY AND INTEGRITY OF THE SPACE SHUTTLE WORKFORCE, SYSTEMS AND PROCESSES, WHILE FLYING THE MANIFEST.
FY 2006 FY 2005 FY 2004 FY 2003
Yellow Green Green None
In FY 2006, the Space Shuttle Program successfully fl ew two mis-sions. STS-121 (Discovery), launched on July 4, 2006, was the Agency’s second return to fl ight mission. It gave NASA engineers another opportunity to address the issue of foam loss from the Shut-tle’s external tank during liftoff—a problem that led to the Columbia accident and occurred again on the fi rst post-Columbia accident mission, STS-114, launched in July 2005.
NASA continued to implement improvements introduced during the STS-114 mission: a new suite of cameras and sensors to moni-tor the Shuttle during launch; additional orbital maneuvers near the ISS to allow crew to check for damage; and ground procedures to provide mission managers with the high-fi delity information needed to assess Shuttle integrity. During the STS-121 mission, Discovery delivered cargo and supplies to the ISS and several science experi-ments, and crewmembers conducted spacewalks to repair the ISS Mobile Transporter, hardware critical to completing ISS construction. The second FY 2006 Shuttle mission, STS-115 (Atlantis), launched
Staff at Kennedy Space Center’s Mission Con-trol Center cheer and wave American fl ags as STS-121 launches on July 4, 2006. This was NASA’s second return to fl ight mission and the fi rst time the Agency had launched a Shuttle mission on Independence Day. (NASA)
Outcome Rating
Under Strategic Goal 1, NASA may not achieve the single Outcome as stated.
1
100%
APG Rating
1
100%
Under Strategic Goal 1, NASA failed to achieve the single APG.
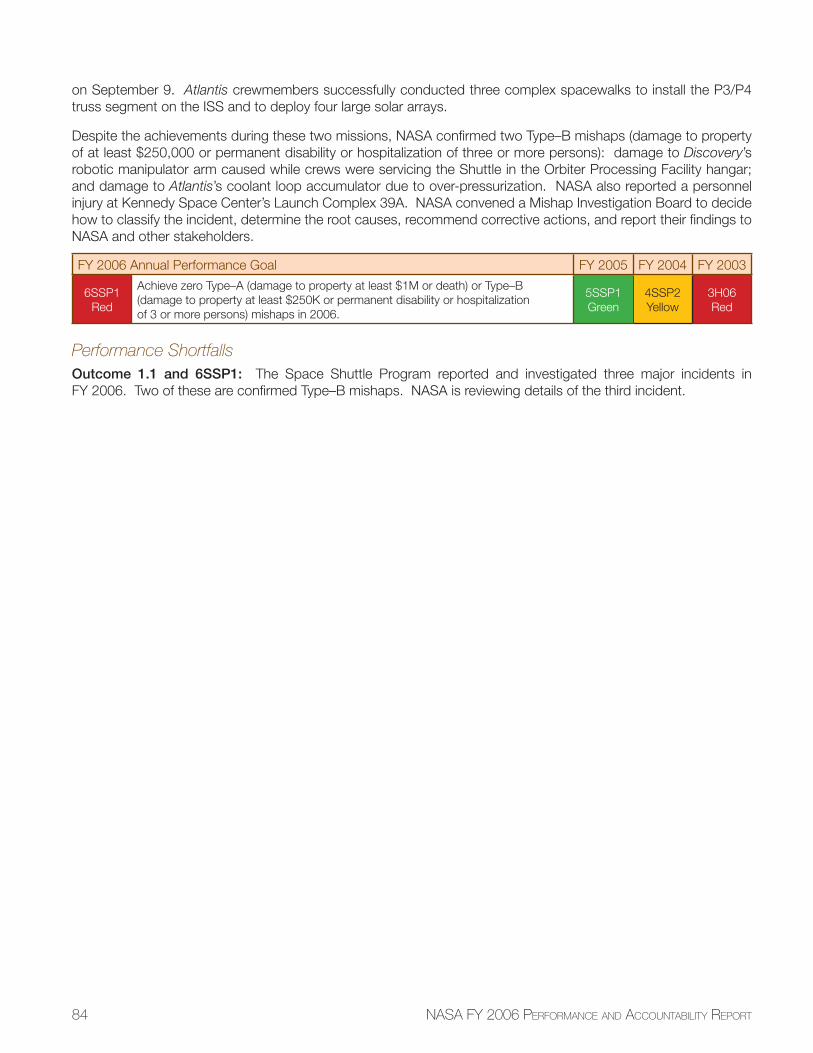
84 NASA FY 2006 PERFORMANCE AND ACCOUNTABILITY REPORT
on September 9. Atlantis crewmembers successfully conducted three complex spacewalks to install the P3/P4 truss segment on the ISS and to deploy four large solar arrays.
Despite the achievements during these two missions, NASA confi rmed two Type–B mishaps (damage to property of at least $250,000 or permanent disability or hospitalization of three or more persons): damage to Discovery’s robotic manipulator arm caused while crews were servicing the Shuttle in the Orbiter Processing Facility hangar; and damage to Atlantis’s coolant loop accumulator due to over-pressurization. NASA also reported a personnel injury at Kennedy Space Center’s Launch Complex 39A. NASA convened a Mishap Investigation Board to decide how to classify the incident, determine the root causes, recommend corrective actions, and report their fi ndings to NASA and other stakeholders.
FY 2006 Annual Performance Goal FY 2005 FY 2004 FY 2003
6SSP1Red
Achieve zero Type–A (damage to property at least $1M or death) or Type–B (damage to property at least $250K or permanent disability or hospitalization of 3 or more persons) mishaps in 2006.
5SSP1Green
4SSP2Yellow
3H06Red
Performance Shortfalls Outcome 1.1 and 6SSP1: The Space Shuttle Program reported and investigated three major incidents in FY 2006. Two of these are confi rmed Type–B mishaps. NASA is reviewing details of the third incident.
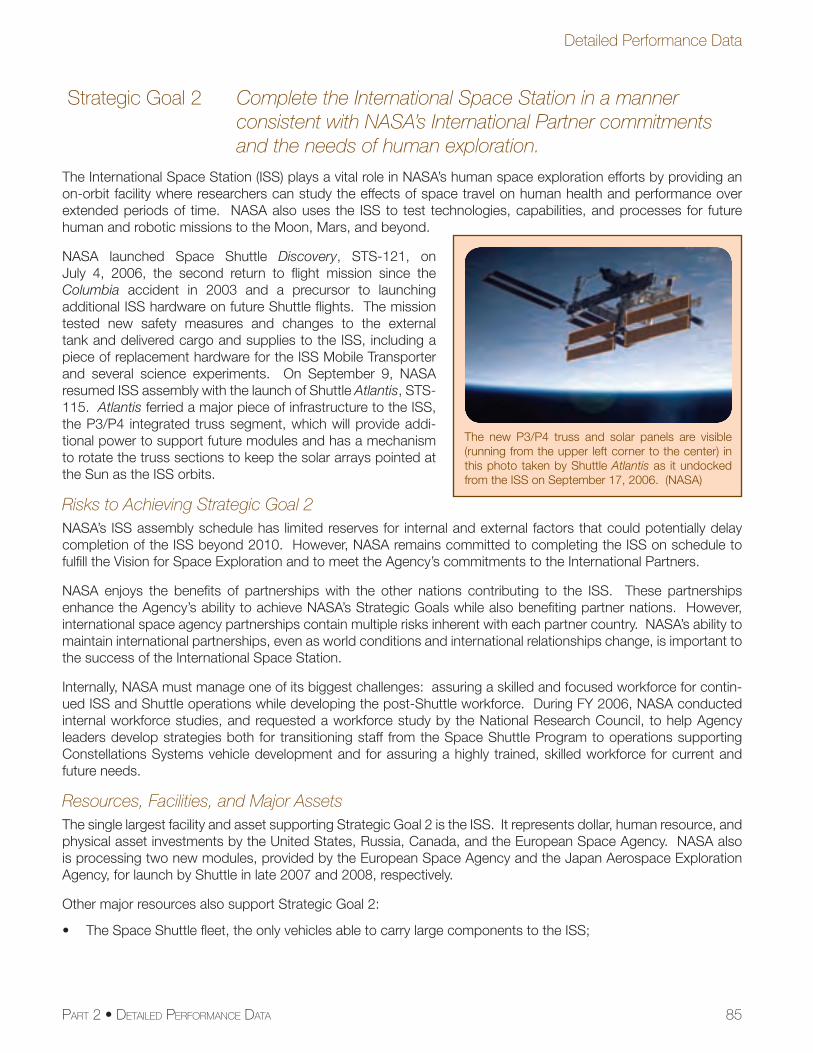
85
Detailed Performance Data
PART 2 • DETAILED PERFORMANCE DATA
Strategic Goal 2 Complete the International Space Station in a manner consistent with NASA’s International Partner commitments and the needs of human exploration.
The International Space Station (ISS) plays a vital role in NASA’s human space exploration efforts by providing an on-orbit facility where researchers can study the effects of space travel on human health and performance over extended periods of time. NASA also uses the ISS to test technologies, capabilities, and processes for future human and robotic missions to the Moon, Mars, and beyond.
NASA launched Space Shuttle Discovery, STS-121, on July 4, 2006, the second return to fl ight mission since the Columbia accident in 2003 and a precursor to launching additional ISS hardware on future Shuttle fl ights. The mission tested new safety measures and changes to the external tank and delivered cargo and supplies to the ISS, including a piece of replacement hardware for the ISS Mobile Transporter and several science experiments. On September 9, NASA resumed ISS assembly with the launch of Shuttle Atlantis, STS-115. Atlantis ferried a major piece of infrastructure to the ISS, the P3/P4 integrated truss segment, which will provide addi-tional power to support future modules and has a mechanism to rotate the truss sections to keep the solar arrays pointed at the Sun as the ISS orbits.
Risks to Achieving Strategic Goal 2 NASA’s ISS assembly schedule has limited reserves for internal and external factors that could potentially delay completion of the ISS beyond 2010. However, NASA remains committed to completing the ISS on schedule to fulfi ll the Vision for Space Exploration and to meet the Agency’s commitments to the International Partners.
NASA enjoys the benefi ts of partnerships with the other nations contributing to the ISS. These partnerships enhance the Agency’s ability to achieve NASA’s Strategic Goals while also benefi ting partner nations. However, international space agency partnerships contain multiple risks inherent with each partner country. NASA’s ability to maintain international partnerships, even as world conditions and international relationships change, is important to the success of the International Space Station.
Internally, NASA must manage one of its biggest challenges: assuring a skilled and focused workforce for contin-ued ISS and Shuttle operations while developing the post-Shuttle workforce. During FY 2006, NASA conducted internal workforce studies, and requested a workforce study by the National Research Council, to help Agency leaders develop strategies both for transitioning staff from the Space Shuttle Program to operations supporting Constellations Systems vehicle development and for assuring a highly trained, skilled workforce for current and future needs.
Resources, Facilities, and Major AssetsThe single largest facility and asset supporting Strategic Goal 2 is the ISS. It represents dollar, human resource, and physical asset investments by the United States, Russia, Canada, and the European Space Agency. NASA also is processing two new modules, provided by the European Space Agency and the Japan Aerospace Exploration Agency, for launch by Shuttle in late 2007 and 2008, respectively.
Other major resources also support Strategic Goal 2:
• The Space Shuttle fl eet, the only vehicles able to carry large components to the ISS;
The new P3/P4 truss and solar panels are visible (running from the upper left corner to the center) in this photo taken by Shuttle Atlantis as it undocked from the ISS on September 17, 2006. (NASA)
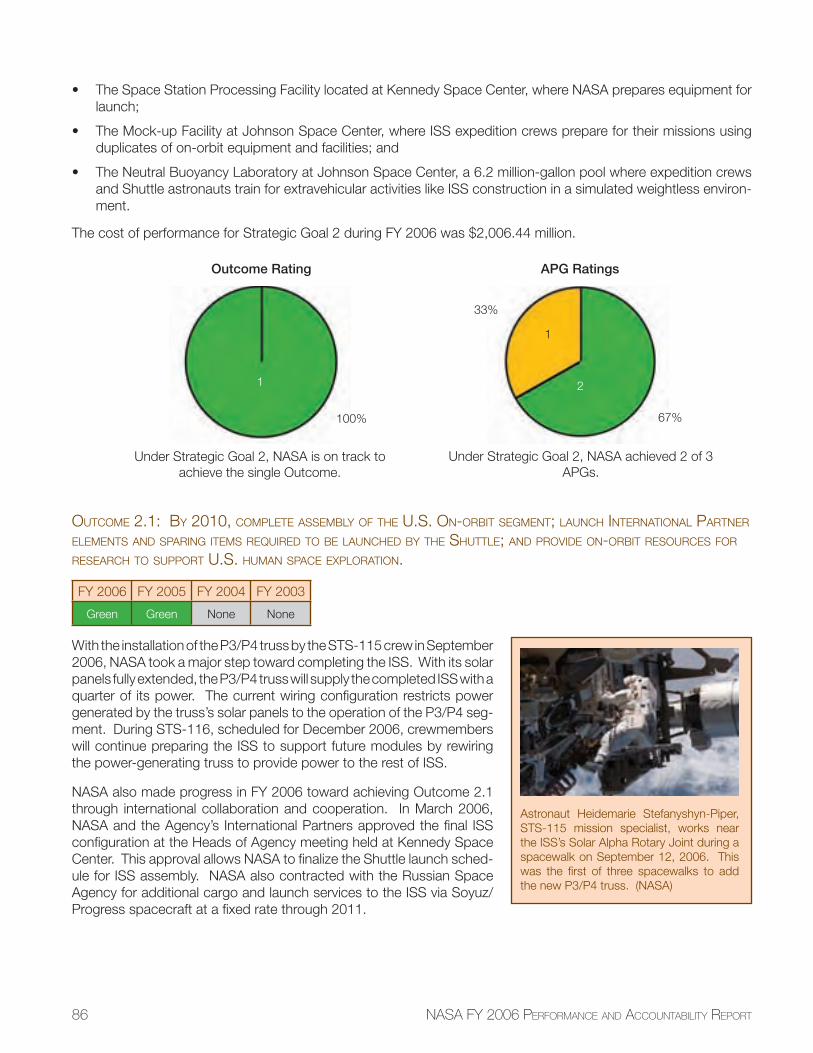
86 NASA FY 2006 PERFORMANCE AND ACCOUNTABILITY REPORT
• The Space Station Processing Facility located at Kennedy Space Center, where NASA prepares equipment for launch;
• The Mock-up Facility at Johnson Space Center, where ISS expedition crews prepare for their missions using duplicates of on-orbit equipment and facilities; and
• The Neutral Buoyancy Laboratory at Johnson Space Center, a 6.2 million-gallon pool where expedition crews and Shuttle astronauts train for extravehicular activities like ISS construction in a simulated weightless environ-ment.
The cost of performance for Strategic Goal 2 during FY 2006 was $2,006.44 million.
OUTCOME 2.1: BY 2010, COMPLETE ASSEMBLY OF THE U.S. ON-ORBIT SEGMENT; LAUNCH INTERNATIONAL PARTNER ELEMENTS AND SPARING ITEMS REQUIRED TO BE LAUNCHED BY THE SHUTTLE; AND PROVIDE ON-ORBIT RESOURCES FOR RESEARCH TO SUPPORT U.S. HUMAN SPACE EXPLORATION.
FY 2006 FY 2005 FY 2004 FY 2003
Green Green None None
With the installation of the P3/P4 truss by the STS-115 crew in September 2006, NASA took a major step toward completing the ISS. With its solar panels fully extended, the P3/P4 truss will supply the completed ISS with a quarter of its power. The current wiring confi guration restricts power generated by the truss’s solar panels to the operation of the P3/P4 seg-ment. During STS-116, scheduled for December 2006, crewmembers will continue preparing the ISS to support future modules by rewiring the power-generating truss to provide power to the rest of ISS.
NASA also made progress in FY 2006 toward achieving Outcome 2.1 through international collaboration and cooperation. In March 2006, NASA and the Agency’s International Partners approved the fi nal ISS confi guration at the Heads of Agency meeting held at Kennedy Space Center. This approval allows NASA to fi nalize the Shuttle launch sched-ule for ISS assembly. NASA also contracted with the Russian Space Agency for additional cargo and launch services to the ISS via Soyuz/Progress spacecraft at a fi xed rate through 2011.
Astronaut Heidemarie Stefanyshyn-Piper, STS-115 mission specialist, works near the ISS’s Solar Alpha Rotary Joint during a spacewalk on September 12, 2006. This was the fi rst of three spacewalks to add the new P3/P4 truss. (NASA)
Outcome Rating
Under Strategic Goal 2, NASA is on track to achieve the single Outcome.
1
100%
APG Ratings
2
67%
Under Strategic Goal 2, NASA achieved 2 of 3 APGs.
1
33%
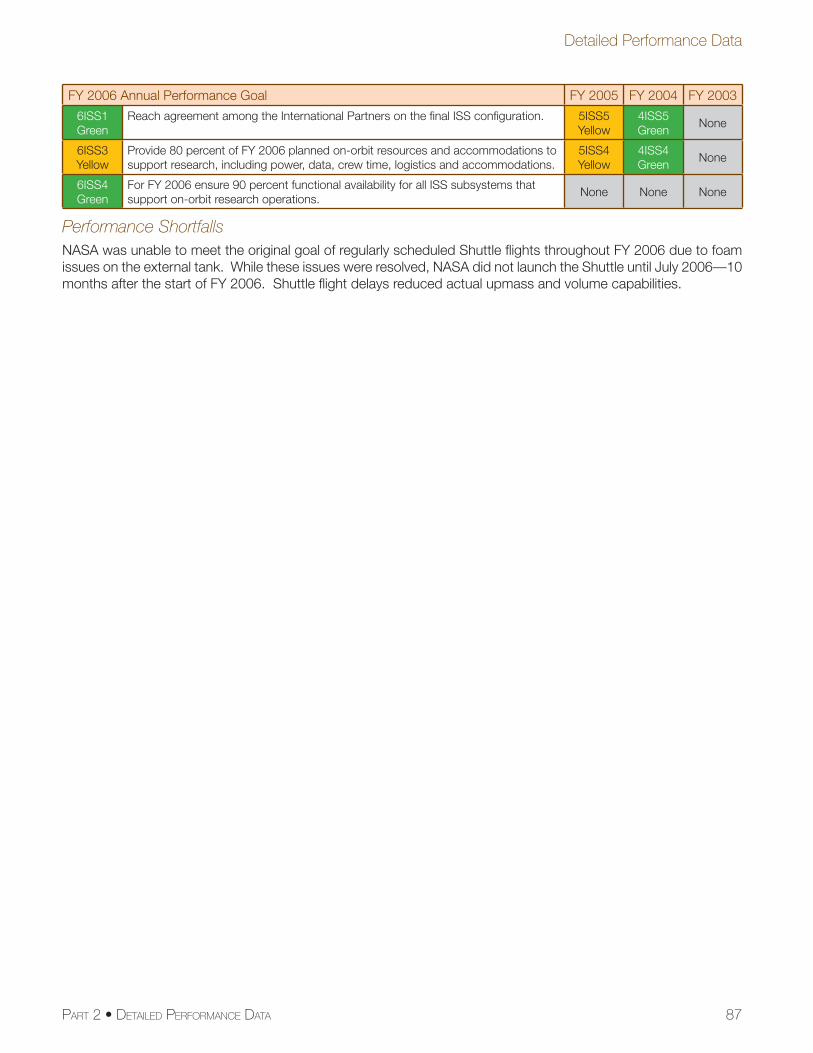
87
Detailed Performance Data
PART 2 • DETAILED PERFORMANCE DATA
FY 2006 Annual Performance Goal FY 2005 FY 2004 FY 2003
6ISS1Green
Reach agreement among the International Partners on the fi nal ISS confi guration. 5ISS5Yellow
4ISS5Green
None
6ISS3Yellow
Provide 80 percent of FY 2006 planned on-orbit resources and accommodations to support research, including power, data, crew time, logistics and accommodations.
5ISS4Yellow
4ISS4Green
None
6ISS4Green
For FY 2006 ensure 90 percent functional availability for all ISS subsystems that support on-orbit research operations.
None None None
Performance ShortfallsNASA was unable to meet the original goal of regularly scheduled Shuttle fl ights throughout FY 2006 due to foam issues on the external tank. While these issues were resolved, NASA did not launch the Shuttle until July 2006—10 months after the start of FY 2006. Shuttle fl ight delays reduced actual upmass and volume capabilities.
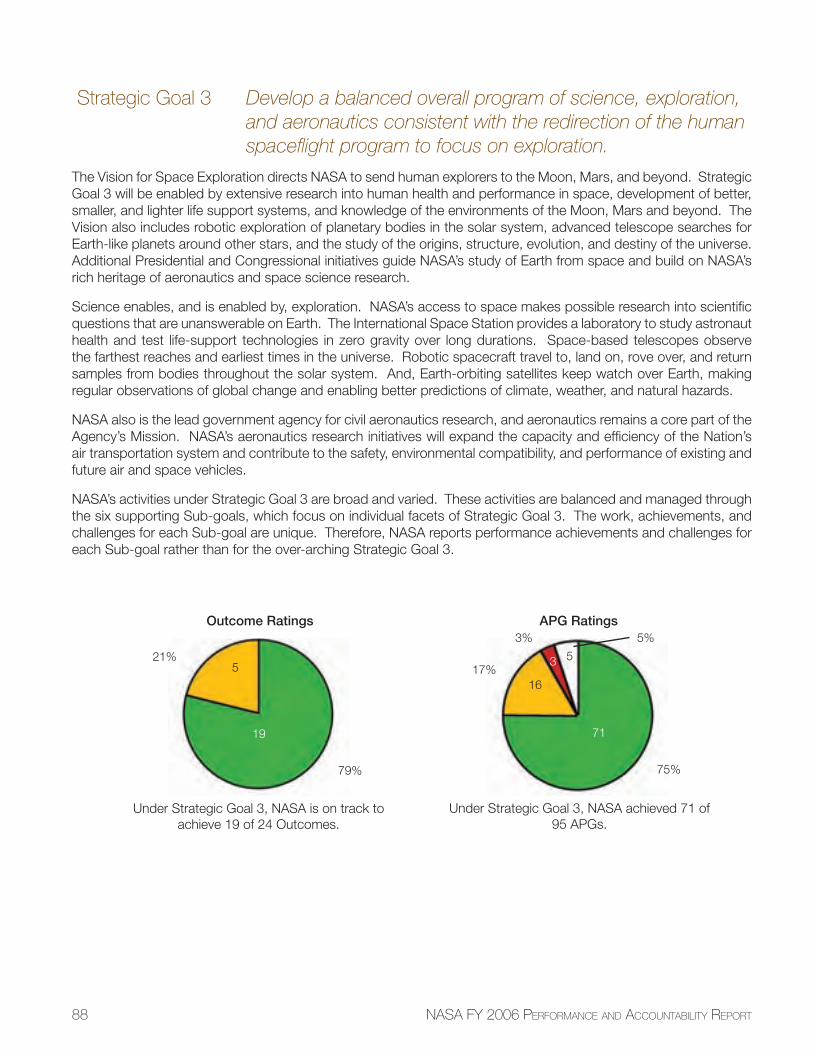
88 NASA FY 2006 PERFORMANCE AND ACCOUNTABILITY REPORT
Strategic Goal 3 Develop a balanced overall program of science, exploration, and aeronautics consistent with the redirection of the human spacefl ight program to focus on exploration.
The Vision for Space Exploration directs NASA to send human explorers to the Moon, Mars, and beyond. Strategic Goal 3 will be enabled by extensive research into human health and performance in space, development of better, smaller, and lighter life support systems, and knowledge of the environments of the Moon, Mars and beyond. The Vision also includes robotic exploration of planetary bodies in the solar system, advanced telescope searches for Earth-like planets around other stars, and the study of the origins, structure, evolution, and destiny of the universe. Additional Presidential and Congressional initiatives guide NASA’s study of Earth from space and build on NASA’s rich heritage of aeronautics and space science research.
Science enables, and is enabled by, exploration. NASA’s access to space makes possible research into scientifi c questions that are unanswerable on Earth. The International Space Station provides a laboratory to study astronaut health and test life-support technologies in zero gravity over long durations. Space-based telescopes observe the farthest reaches and earliest times in the universe. Robotic spacecraft travel to, land on, rove over, and return samples from bodies throughout the solar system. And, Earth-orbiting satellites keep watch over Earth, making regular observations of global change and enabling better predictions of climate, weather, and natural hazards.
NASA also is the lead government agency for civil aeronautics research, and aeronautics remains a core part of the Agency’s Mission. NASA’s aeronautics research initiatives will expand the capacity and effi ciency of the Nation’s air transportation system and contribute to the safety, environmental compatibility, and performance of existing and future air and space vehicles.
NASA’s activities under Strategic Goal 3 are broad and varied. These activities are balanced and managed through the six supporting Sub-goals, which focus on individual facets of Strategic Goal 3. The work, achievements, and challenges for each Sub-goal are unique. Therefore, NASA reports performance achievements and challenges for each Sub-goal rather than for the over-arching Strategic Goal 3.
Outcome Ratings
Under Strategic Goal 3, NASA is on track to achieve 19 of 24 Outcomes.
19
79%
APG Ratings
71
75%
Under Strategic Goal 3, NASA achieved 71 of 95 APGs.
16
3%
521%
17%53
5%
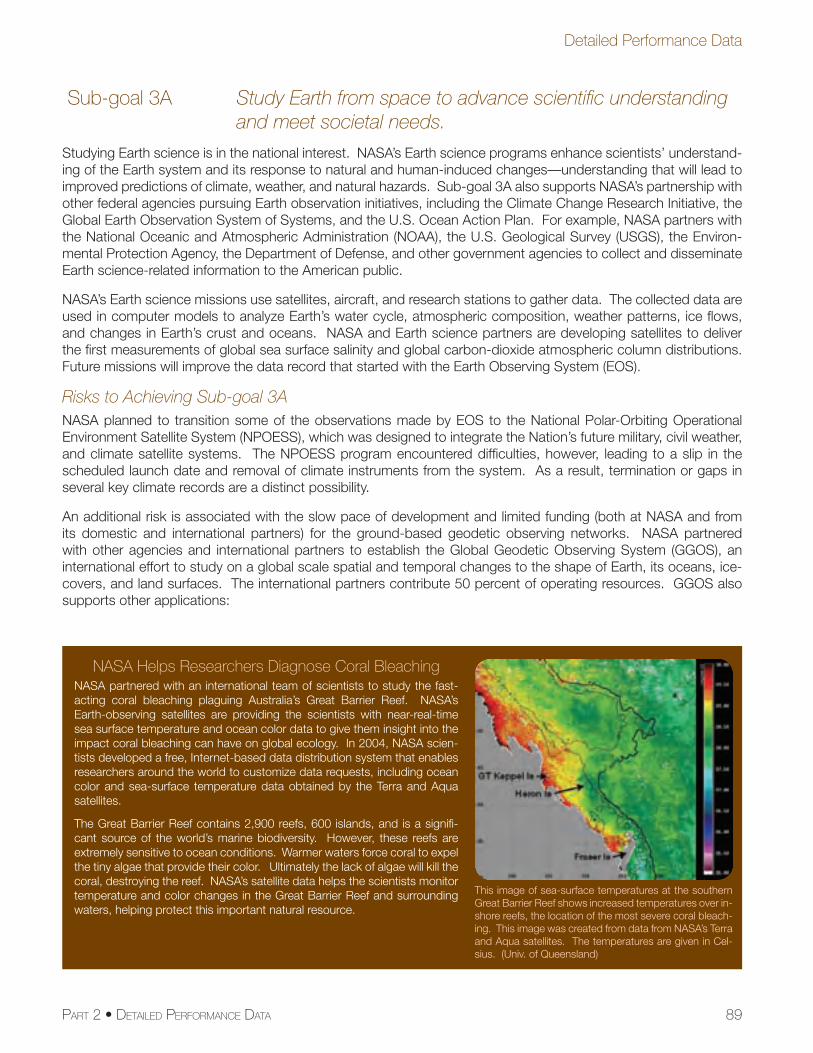
89
Detailed Performance Data
PART 2 • DETAILED PERFORMANCE DATA
Sub-goal 3A Study Earth from space to advance scientifi c understanding and meet societal needs.
Studying Earth science is in the national interest. NASA’s Earth science programs enhance scientists’ understand-ing of the Earth system and its response to natural and human-induced changes—understanding that will lead to improved predictions of climate, weather, and natural hazards. Sub-goal 3A also supports NASA’s partnership with other federal agencies pursuing Earth observation initiatives, including the Climate Change Research Initiative, the Global Earth Observation System of Systems, and the U.S. Ocean Action Plan. For example, NASA partners with the National Oceanic and Atmospheric Administration (NOAA), the U.S. Geological Survey (USGS), the Environ-mental Protection Agency, the Department of Defense, and other government agencies to collect and disseminate Earth science-related information to the American public.
NASA’s Earth science missions use satellites, aircraft, and research stations to gather data. The collected data are used in computer models to analyze Earth’s water cycle, atmospheric composition, weather patterns, ice fl ows, and changes in Earth’s crust and oceans. NASA and Earth science partners are developing satellites to deliver the fi rst measurements of global sea surface salinity and global carbon-dioxide atmospheric column distributions. Future missions will improve the data record that started with the Earth Observing System (EOS).
Risks to Achieving Sub-goal 3ANASA planned to transition some of the observations made by EOS to the National Polar-Orbiting Operational Environment Satellite System (NPOESS), which was designed to integrate the Nation’s future military, civil weather, and climate satellite systems. The NPOESS program encountered diffi culties, however, leading to a slip in the scheduled launch date and removal of climate instruments from the system. As a result, termination or gaps in several key climate records are a distinct possibility.
An additional risk is associated with the slow pace of development and limited funding (both at NASA and from its domestic and international partners) for the ground-based geodetic observing networks. NASA partnered with other agencies and international partners to establish the Global Geodetic Observing System (GGOS), an international effort to study on a global scale spatial and temporal changes to the shape of Earth, its oceans, ice-covers, and land surfaces. The international partners contribute 50 percent of operating resources. GGOS also supports other applications:
NASA Helps Researchers Diagnose Coral BleachingNASA partnered with an international team of scientists to study the fast-acting coral bleaching plaguing Australia’s Great Barrier Reef. NASA’s Earth-observing satellites are providing the scientists with near-real-time sea surface temperature and ocean color data to give them insight into the impact coral bleaching can have on global ecology. In 2004, NASA scien-tists developed a free, Internet-based data distribution system that enables researchers around the world to customize data requests, including ocean color and sea-surface temperature data obtained by the Terra and Aqua satellites.
The Great Barrier Reef contains 2,900 reefs, 600 islands, and is a signifi -cant source of the world’s marine biodiversity. However, these reefs are extremely sensitive to ocean conditions. Warmer waters force coral to expel the tiny algae that provide their color. Ultimately the lack of algae will kill the coral, destroying the reef. NASA’s satellite data helps the scientists monitor temperature and color changes in the Great Barrier Reef and surrounding waters, helping protect this important natural resource.
This image of sea-surface temperatures at the southern Great Barrier Reef shows increased temperatures over in-shore reefs, the location of the most severe coral bleach-ing. This image was created from data from NASA’s Terra and Aqua satellites. The temperatures are given in Cel-sius. (Univ. of Queensland)
90 NASA FY 2006 PERFORMANCE AND ACCOUNTABILITY REPORT
• The precision navigation and timing for geodetic satellites, including Jason–1 and –2, the Gravity Recovery and Climate Experiment (GRACE), the Ice, Cloud, and Land Elevation satellite (ICESat), and the Constellation Observing System for Meteorology, Ionosphere, and Climate (COSMIC) mission;
• Navigation of interplanetary probes; and
• Alignment of telescopes and communications equipment.
NASA’s ability to maintain fully this network to support both scientifi c research and space operations (which go beyond operations for Earth science missions) is limited. In 2006, NASA closed an important geodetic very-long baseline interferometry observatory in Fairbanks, Alaska, due to budget shortfalls. In previous years, NASA also reduced satellite laser tracking observations by 70 percent. NASA is developing a strategic plan for the develop-ment of a next-generation geodetic network to meet the needs of the scientifi c community. The National Research Council is reviewing the draft strategic plan as part of their decadal survey of Earth sciences and applications from space.
Current U.S. policy commits the federal government to continue collecting Landsat-type data; however, problems with aging spacecraft and delays with follow-on satellites raise concerns about a possible data gap. Launched in April 1999, Landsat–7 will deplete its fuel supply by 2010. A Landsat follow-on mission is scheduled to begin in 2012. NASA is drafting requirements for a “free fl ying” Landsat data continuity mission, scheduled for competi-tive bid in FY 2007. NASA also is working proactively with the Agency’s international partners to examine other potential sources of land-cover data that can continue the availability of measurements until a Landsat follow-on is operational.
Resources, Facilities, and Major AssetsNASA develops Earth science missions either alone or with partners in the United States and around the world. NASA launches mission satellites, tracks the satellites throughout their missions, and manages data collection, distribution, and archiving. NASA also conducts an active science program that enables the use of NASA-provided data to answer scientifi c questions, improve predictive capability, and, through interagency partnerships, improve policy and decision-making.
NASA’s Earth Observing System Data and Information System (EOSDIS) manages and distributes data products through the Distributed Active Archive Centers. These centers process, archive, document, and distribute data from NASA’s past and current research satellites and fi eld programs. Each center serves one or more specifi c Earth science disciplines and provides data products, data information, services, and tools unique to its particular science. EOSDIS data products are available via the Web.
NASA’s Ground Communication Networks, which include tracking stations and the Wallops Research Range control and communications, track Earth-orbiting satellites and suborbital vehicles and downlink raw data. The Distributed Active Archive Centers then process the raw data for distribution to users.
The NASA Earth Science Suborbital Science program supports the maintenance and operation of several tailored airborne platforms (including the ER–2, DC–8, WB–57F aircraft) for Earth science research. NASA and the Agency’s community of investigators own and operate a broad range of scientifi c instrumentation, including both in-situ and remote-sensing capabilities, that use these platforms for process study, satellite calibration/validation, and integrated scientifi c study. In addition, NASA maintains a number of surface-based measurement networks around the world (many in conjunction with international partners) that support satellite calibration and integrated scientifi c activities. For example, the AERONET network maintains approximately 150 Sun photometers around the world, as well as a data center that receives, processes, and distributes the data from all. In addition, NASA operates critical components of GGOS, including ground-based systems, satellites, and data systems.
To explore the new interdisciplinary fi eld of integrated global Earth system science, NASA uses advanced models that assimilate chemical and physical measurements—initially in the atmosphere and then in the ocean—to simu-late the interactions between multiple components of the Earth system. Integrated global Earth system models are an effective tool to determine global carbon sources and sinks, the types of aerosols that increase and decrease global warming, and the important role that clouds play in global climate change.
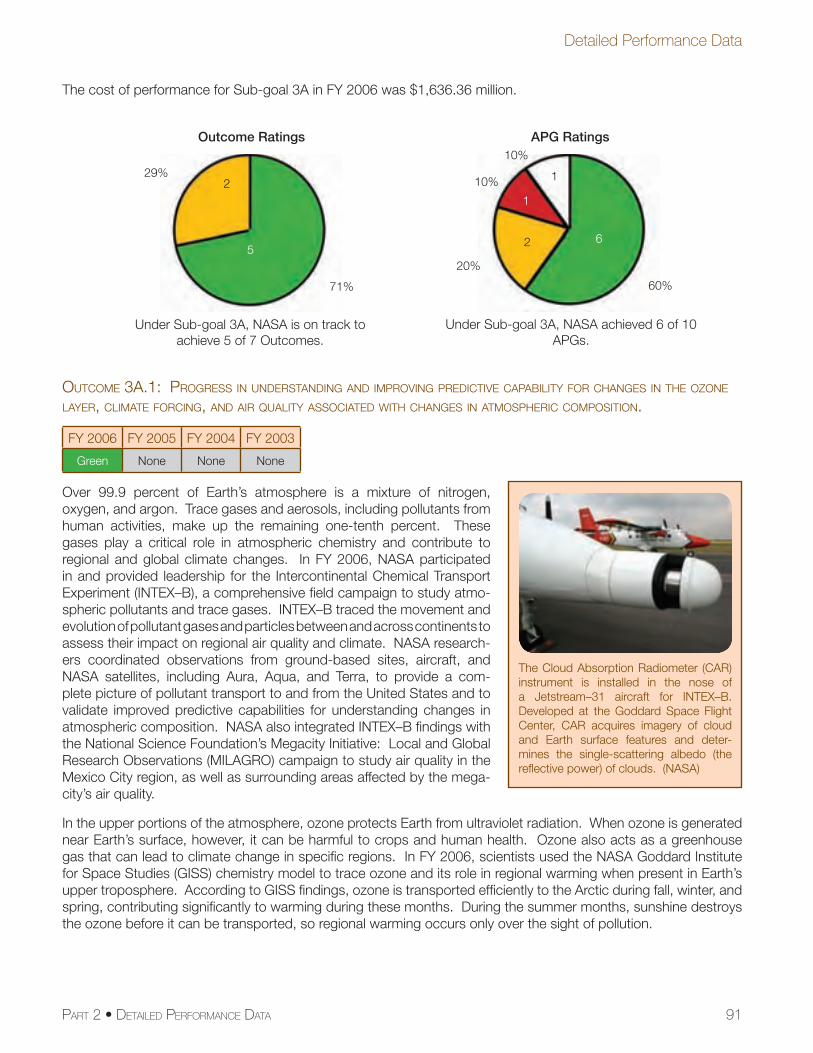
91
Detailed Performance Data
PART 2 • DETAILED PERFORMANCE DATA
The cost of performance for Sub-goal 3A in FY 2006 was $1,636.36 million.
OUTCOME 3A.1: PROGRESS IN UNDERSTANDING AND IMPROVING PREDICTIVE CAPABILITY FOR CHANGES IN THE OZONE LAYER, CLIMATE FORCING, AND AIR QUALITY ASSOCIATED WITH CHANGES IN ATMOSPHERIC COMPOSITION.
FY 2006 FY 2005 FY 2004 FY 2003
Green None None None
Over 99.9 percent of Earth’s atmosphere is a mixture of nitrogen, oxygen, and argon. Trace gases and aerosols, including pollutants from human activities, make up the remaining one-tenth percent. These gases play a critical role in atmospheric chemistry and contribute to regional and global climate changes. In FY 2006, NASA participated in and provided leadership for the Intercontinental Chemical Transport Experiment (INTEX–B), a comprehensive fi eld campaign to study atmo-spheric pollutants and trace gases. INTEX–B traced the movement and evolution of pollutant gases and particles between and across continents to assess their impact on regional air quality and climate. NASA research-ers coordinated observations from ground-based sites, aircraft, and NASA satellites, including Aura, Aqua, and Terra, to provide a com-plete picture of pollutant transport to and from the United States and to validate improved predictive capabilities for understanding changes in atmospheric composition. NASA also integrated INTEX–B fi ndings with the National Science Foundation’s Megacity Initiative: Local and Global Research Observations (MILAGRO) campaign to study air quality in the Mexico City region, as well as surrounding areas affected by the mega-city’s air quality.
In the upper portions of the atmosphere, ozone protects Earth from ultraviolet radiation. When ozone is generated near Earth’s surface, however, it can be harmful to crops and human health. Ozone also acts as a greenhouse gas that can lead to climate change in specifi c regions. In FY 2006, scientists used the NASA Goddard Institute for Space Studies (GISS) chemistry model to trace ozone and its role in regional warming when present in Earth’s upper troposphere. According to GISS fi ndings, ozone is transported effi ciently to the Arctic during fall, winter, and spring, contributing signifi cantly to warming during these months. During the summer months, sunshine destroys the ozone before it can be transported, so regional warming occurs only over the sight of pollution.
The Cloud Absorption Radiometer (CAR) instrument is installed in the nose of a Jetstream–31 aircraft for INTEX–B. Developed at the Goddard Space Flight Center, CAR acquires imagery of cloud and Earth surface features and deter-mines the single-scattering albedo (the refl ective power) of clouds. (NASA)
Outcome Ratings
Under Sub-goal 3A, NASA is on track to achieve 5 of 7 Outcomes.
5
71%
APG Ratings
6
60%
Under Sub-goal 3A, NASA achieved 6 of 10 APGs.
2
10%229%
20%
1
1
10%
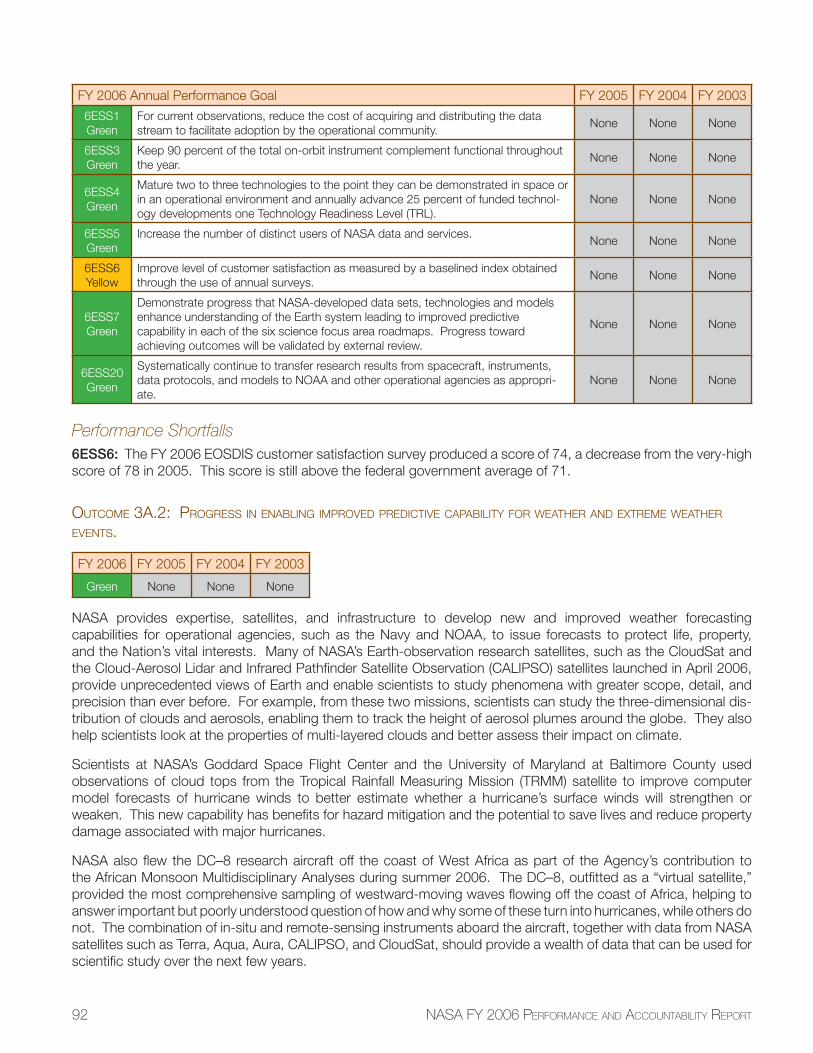
92 NASA FY 2006 PERFORMANCE AND ACCOUNTABILITY REPORT
FY 2006 Annual Performance Goal FY 2005 FY 2004 FY 2003
6ESS1Green
For current observations, reduce the cost of acquiring and distributing the data stream to facilitate adoption by the operational community.
None None None
6ESS3Green
Keep 90 percent of the total on-orbit instrument complement functional throughout the year.
None None None
6ESS4Green
Mature two to three technologies to the point they can be demonstrated in space or in an operational environment and annually advance 25 percent of funded technol-ogy developments one Technology Readiness Level (TRL).
None None None
6ESS5Green
Increase the number of distinct users of NASA data and services.None None None
6ESS6Yellow
Improve level of customer satisfaction as measured by a baselined index obtained through the use of annual surveys.
None None None
6ESS7Green
Demonstrate progress that NASA-developed data sets, technologies and models enhance understanding of the Earth system leading to improved predictive capability in each of the six science focus area roadmaps. Progress toward achieving outcomes will be validated by external review.
None None None
6ESS20Green
Systematically continue to transfer research results from spacecraft, instruments, data protocols, and models to NOAA and other operational agencies as appropri-ate.
None None None
Performance Shortfalls6ESS6: The FY 2006 EOSDIS customer satisfaction survey produced a score of 74, a decrease from the very-high score of 78 in 2005. This score is still above the federal government average of 71.
OUTCOME 3A.2: PROGRESS IN ENABLING IMPROVED PREDICTIVE CAPABILITY FOR WEATHER AND EXTREME WEATHER EVENTS.
FY 2006 FY 2005 FY 2004 FY 2003
Green None None None
NASA provides expertise, satellites, and infrastructure to develop new and improved weather forecasting capabilities for operational agencies, such as the Navy and NOAA, to issue forecasts to protect life, property, and the Nation’s vital interests. Many of NASA’s Earth-observation research satellites, such as the CloudSat and the Cloud-Aerosol Lidar and Infrared Pathfi nder Satellite Observation (CALIPSO) satellites launched in April 2006, provide unprecedented views of Earth and enable scientists to study phenomena with greater scope, detail, and precision than ever before. For example, from these two missions, scientists can study the three-dimensional dis-tribution of clouds and aerosols, enabling them to track the height of aerosol plumes around the globe. They also help scientists look at the properties of multi-layered clouds and better assess their impact on climate.
Scientists at NASA’s Goddard Space Flight Center and the University of Maryland at Baltimore County used observations of cloud tops from the Tropical Rainfall Measuring Mission (TRMM) satellite to improve computer model forecasts of hurricane winds to better estimate whether a hurricane’s surface winds will strengthen or weaken. This new capability has benefi ts for hazard mitigation and the potential to save lives and reduce property damage associated with major hurricanes.
NASA also fl ew the DC–8 research aircraft off the coast of West Africa as part of the Agency’s contribution to the African Monsoon Multidisciplinary Analyses during summer 2006. The DC–8, outfi tted as a “virtual satellite,” provided the most comprehensive sampling of westward-moving waves fl owing off the coast of Africa, helping to answer important but poorly understood question of how and why some of these turn into hurricanes, while others do not. The combination of in-situ and remote-sensing instruments aboard the aircraft, together with data from NASA satellites such as Terra, Aqua, Aura, CALIPSO, and CloudSat, should provide a wealth of data that can be used for scientifi c study over the next few years.
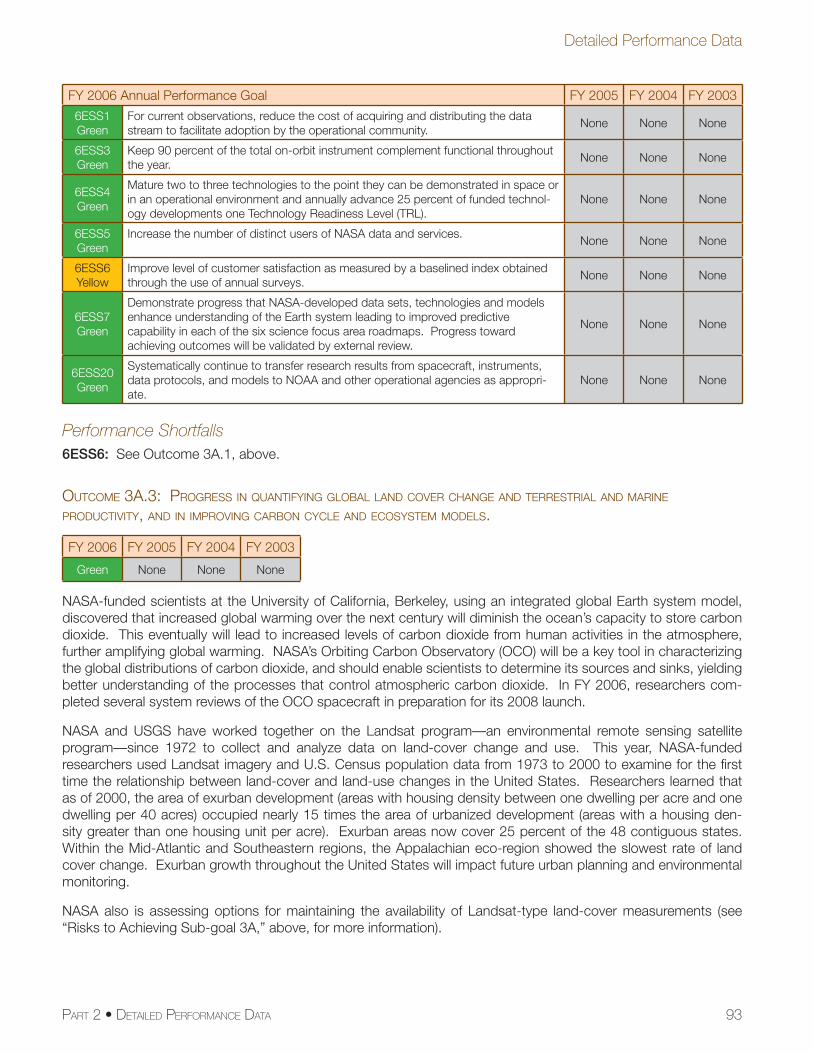
93
Detailed Performance Data
PART 2 • DETAILED PERFORMANCE DATA
FY 2006 Annual Performance Goal FY 2005 FY 2004 FY 2003
6ESS1Green
For current observations, reduce the cost of acquiring and distributing the data stream to facilitate adoption by the operational community.
None None None
6ESS3Green
Keep 90 percent of the total on-orbit instrument complement functional throughout the year.
None None None
6ESS4Green
Mature two to three technologies to the point they can be demonstrated in space or in an operational environment and annually advance 25 percent of funded technol-ogy developments one Technology Readiness Level (TRL).
None None None
6ESS5Green
Increase the number of distinct users of NASA data and services.None None None
6ESS6Yellow
Improve level of customer satisfaction as measured by a baselined index obtained through the use of annual surveys.
None None None
6ESS7Green
Demonstrate progress that NASA-developed data sets, technologies and models enhance understanding of the Earth system leading to improved predictive capability in each of the six science focus area roadmaps. Progress toward achieving outcomes will be validated by external review.
None None None
6ESS20Green
Systematically continue to transfer research results from spacecraft, instruments, data protocols, and models to NOAA and other operational agencies as appropri-ate.
None None None
Performance Shortfalls6ESS6: See Outcome 3A.1, above.
OUTCOME 3A.3: PROGRESS IN QUANTIFYING GLOBAL LAND COVER CHANGE AND TERRESTRIAL AND MARINE PRODUCTIVITY, AND IN IMPROVING CARBON CYCLE AND ECOSYSTEM MODELS.
FY 2006 FY 2005 FY 2004 FY 2003
Green None None None
NASA-funded scientists at the University of California, Berkeley, using an integrated global Earth system model, discovered that increased global warming over the next century will diminish the ocean’s capacity to store carbon dioxide. This eventually will lead to increased levels of carbon dioxide from human activities in the atmosphere, further amplifying global warming. NASA’s Orbiting Carbon Observatory (OCO) will be a key tool in characterizing the global distributions of carbon dioxide, and should enable scientists to determine its sources and sinks, yielding better understanding of the processes that control atmospheric carbon dioxide. In FY 2006, researchers com-pleted several system reviews of the OCO spacecraft in preparation for its 2008 launch.
NASA and USGS have worked together on the Landsat program—an environmental remote sensing satellite program—since 1972 to collect and analyze data on land-cover change and use. This year, NASA-funded researchers used Landsat imagery and U.S. Census population data from 1973 to 2000 to examine for the fi rst time the relationship between land-cover and land-use changes in the United States. Researchers learned that as of 2000, the area of exurban development (areas with housing density between one dwelling per acre and one dwelling per 40 acres) occupied nearly 15 times the area of urbanized development (areas with a housing den-sity greater than one housing unit per acre). Exurban areas now cover 25 percent of the 48 contiguous states. Within the Mid-Atlantic and Southeastern regions, the Appalachian eco-region showed the slowest rate of land cover change. Exurban growth throughout the United States will impact future urban planning and environmental monitoring.
NASA also is assessing options for maintaining the availability of Landsat-type land-cover measurements (see “Risks to Achieving Sub-goal 3A,” above, for more information).
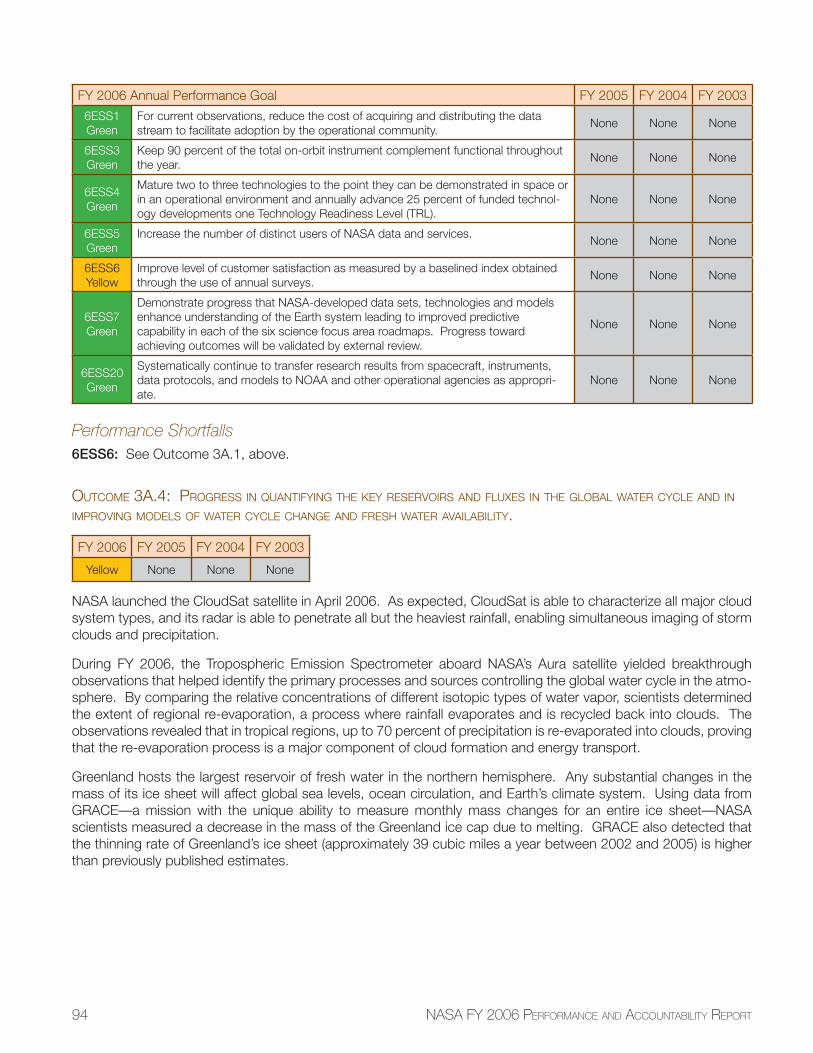
94 NASA FY 2006 PERFORMANCE AND ACCOUNTABILITY REPORT
FY 2006 Annual Performance Goal FY 2005 FY 2004 FY 2003
6ESS1Green
For current observations, reduce the cost of acquiring and distributing the data stream to facilitate adoption by the operational community.
None None None
6ESS3Green
Keep 90 percent of the total on-orbit instrument complement functional throughout the year.
None None None
6ESS4Green
Mature two to three technologies to the point they can be demonstrated in space or in an operational environment and annually advance 25 percent of funded technol-ogy developments one Technology Readiness Level (TRL).
None None None
6ESS5Green
Increase the number of distinct users of NASA data and services.None None None
6ESS6Yellow
Improve level of customer satisfaction as measured by a baselined index obtained through the use of annual surveys.
None None None
6ESS7Green
Demonstrate progress that NASA-developed data sets, technologies and models enhance understanding of the Earth system leading to improved predictive capability in each of the six science focus area roadmaps. Progress toward achieving outcomes will be validated by external review.
None None None
6ESS20Green
Systematically continue to transfer research results from spacecraft, instruments, data protocols, and models to NOAA and other operational agencies as appropri-ate.
None None None
Performance Shortfalls6ESS6: See Outcome 3A.1, above.
OUTCOME 3A.4: PROGRESS IN QUANTIFYING THE KEY RESERVOIRS AND FLUXES IN THE GLOBAL WATER CYCLE AND IN IMPROVING MODELS OF WATER CYCLE CHANGE AND FRESH WATER AVAILABILITY.
FY 2006 FY 2005 FY 2004 FY 2003
Yellow None None None
NASA launched the CloudSat satellite in April 2006. As expected, CloudSat is able to characterize all major cloud system types, and its radar is able to penetrate all but the heaviest rainfall, enabling simultaneous imaging of storm clouds and precipitation.
During FY 2006, the Tropospheric Emission Spectrometer aboard NASA’s Aura satellite yielded breakthrough observations that helped identify the primary processes and sources controlling the global water cycle in the atmo-sphere. By comparing the relative concentrations of different isotopic types of water vapor, scientists determined the extent of regional re-evaporation, a process where rainfall evaporates and is recycled back into clouds. The observations revealed that in tropical regions, up to 70 percent of precipitation is re-evaporated into clouds, proving that the re-evaporation process is a major component of cloud formation and energy transport.
Greenland hosts the largest reservoir of fresh water in the northern hemisphere. Any substantial changes in the mass of its ice sheet will affect global sea levels, ocean circulation, and Earth’s climate system. Using data from GRACE—a mission with the unique ability to measure monthly mass changes for an entire ice sheet—NASA scientists measured a decrease in the mass of the Greenland ice cap due to melting. GRACE also detected that the thinning rate of Greenland’s ice sheet (approximately 39 cubic miles a year between 2002 and 2005) is higher than previously published estimates.
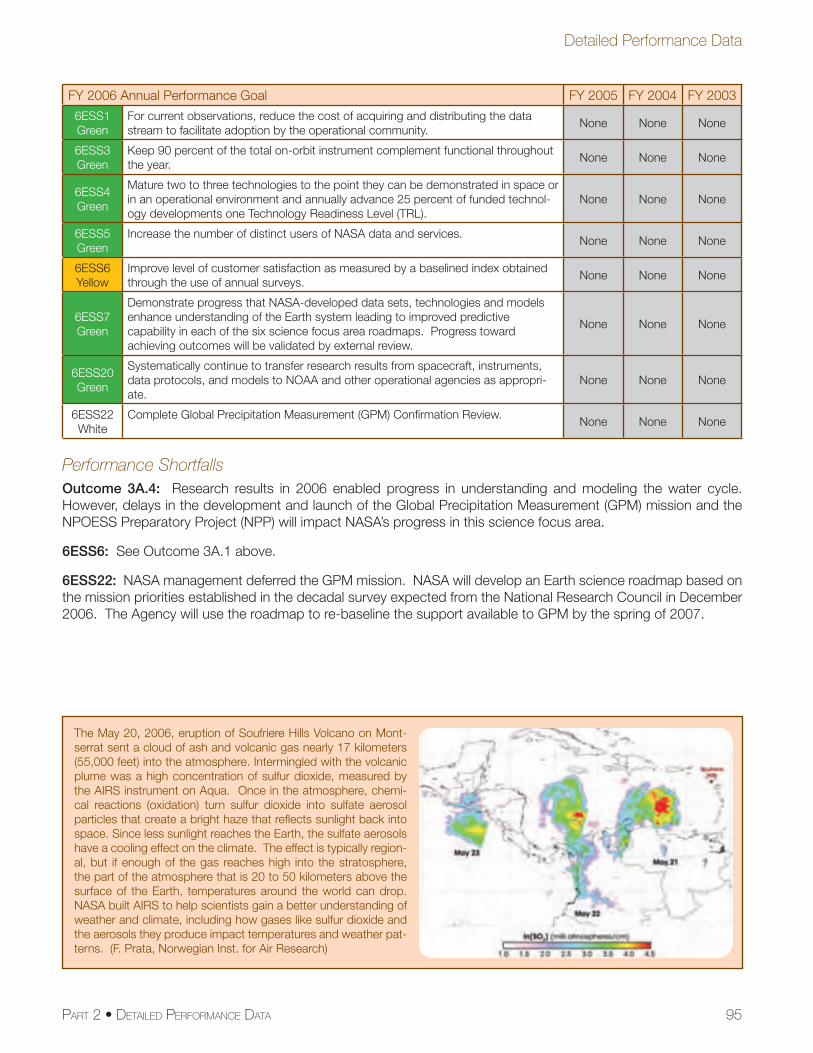
95
Detailed Performance Data
PART 2 • DETAILED PERFORMANCE DATA
FY 2006 Annual Performance Goal FY 2005 FY 2004 FY 2003
6ESS1Green
For current observations, reduce the cost of acquiring and distributing the data stream to facilitate adoption by the operational community.
None None None
6ESS3Green
Keep 90 percent of the total on-orbit instrument complement functional throughout the year.
None None None
6ESS4Green
Mature two to three technologies to the point they can be demonstrated in space or in an operational environment and annually advance 25 percent of funded technol-ogy developments one Technology Readiness Level (TRL).
None None None
6ESS5Green
Increase the number of distinct users of NASA data and services.None None None
6ESS6Yellow
Improve level of customer satisfaction as measured by a baselined index obtained through the use of annual surveys.
None None None
6ESS7Green
Demonstrate progress that NASA-developed data sets, technologies and models enhance understanding of the Earth system leading to improved predictive capability in each of the six science focus area roadmaps. Progress toward achieving outcomes will be validated by external review.
None None None
6ESS20Green
Systematically continue to transfer research results from spacecraft, instruments, data protocols, and models to NOAA and other operational agencies as appropri-ate.
None None None
6ESS22White
Complete Global Precipitation Measurement (GPM) Confi rmation Review.None None None
Performance ShortfallsOutcome 3A.4: Research results in 2006 enabled progress in understanding and modeling the water cycle. However, delays in the development and launch of the Global Precipitation Measurement (GPM) mission and the NPOESS Preparatory Project (NPP) will impact NASA’s progress in this science focus area.
6ESS6: See Outcome 3A.1 above.
6ESS22: NASA management deferred the GPM mission. NASA will develop an Earth science roadmap based on the mission priorities established in the decadal survey expected from the National Research Council in December 2006. The Agency will use the roadmap to re-baseline the support available to GPM by the spring of 2007.
The May 20, 2006, eruption of Soufriere Hills Volcano on Mont-serrat sent a cloud of ash and volcanic gas nearly 17 kilometers (55,000 feet) into the atmosphere. Intermingled with the volcanic plume was a high concentration of sulfur dioxide, measured by the AIRS instrument on Aqua. Once in the atmosphere, chemi-cal reactions (oxidation) turn sulfur dioxide into sulfate aerosol particles that create a bright haze that refl ects sunlight back into space. Since less sunlight reaches the Earth, the sulfate aerosols have a cooling effect on the climate. The effect is typically region-al, but if enough of the gas reaches high into the stratosphere, the part of the atmosphere that is 20 to 50 kilometers above the surface of the Earth, temperatures around the world can drop. NASA built AIRS to help scientists gain a better understanding of weather and climate, including how gases like sulfur dioxide and the aerosols they produce impact temperatures and weather pat-terns. (F. Prata, Norwegian Inst. for Air Research)
96 NASA FY 2006 PERFORMANCE AND ACCOUNTABILITY REPORT
OUTCOME 3A.5: PROGRESS IN UNDERSTANDING THE ROLE OF OCEANS, ATMOSPHERE, AND ICE IN THE CLIMATE SYSTEM AND IN IMPROVING PREDICTIVE CAPABILITY FOR ITS FUTURE EVOLUTION.
FY 2006 FY 2005 FY 2004 FY 2003
Yellow None None None
NASA funds research and satellite observations to study the dynamics between the oceans, atmosphere, and ice reservoirs. Studying the relationship of these systems improves predictions of future climate activity and increases understanding of climate processes. In FY 2006, observations from NASA’s Aura satellite showed that when a sea surface temperature exceeds about 80 degrees Fahrenheit, water evaporated from the warm surface is carried to the upper atmosphere through the formation of towering cumulus clouds (or thunderheads). This warm water vapor eventually evaporates ice particles in the high-altitude clouds, leaving increased water vapor concentra-tions in the upper atmosphere. This fi nding indicates that the cloud-induced moistening of the tropical upper troposphere leads to about three times more water vapor output than is expected in the absence of the clouds.
Scientists at NASA’s Jet Propulsion Laboratory used satellite observations to measure the complete cycle of atmospheric water movement over the South American continent, ocean to ocean. Using data from NASA’s QuikScat, GRACE, and TRMM satellites, researchers confi rmed that the amount of atmospheric water fl owing into the continent as rain and snow was equal to the amount of water returned to the ocean by rivers. This fi nding represents the fi rst direct observations of the seasonal cycle of continental water balance.
FY 2006 Annual Performance Goal FY 2005 FY 2004 FY 2003
6ESS1Green
For current observations, reduce the cost of acquiring and distributing the data stream to facilitate adoption by the operational community.
None None None
6ESS3Green
Keep 90 percent of the total on-orbit instrument complement functional throughout the year.
None None None
6ESS4Green
Mature two to three technologies to the point they can be demonstrated in space or in an operational environment and annually advance 25 percent of funded technol-ogy developments one Technology Readiness Level (TRL).
None None None
6ESS5Green
Increase the number of distinct users of NASA data and services.None None None
6ESS6Yellow
Improve level of customer satisfaction as measured by a baselined index obtained through the use of annual surveys.
None None None
6ESS7Green
Demonstrate progress that NASA-developed data sets, technologies and models enhance understanding of the Earth system leading to improved predictive capability in each of the six science focus area roadmaps. Progress toward achieving outcomes will be validated by external review.
None None None
6ESS20Green
Systematically continue to transfer research results from spacecraft, instruments, data protocols, and models to NOAA and other operational agencies as appropri-ate.
None None None
6ESS23Red
Complete Operational Readiness Review for the NPOESS Preparatory Project (NPP).
None None None
Performance ShortfallsOutcome 3A.5: Cost overruns and technical diffi culties delayed the NPOESS Preparatory Project (NPP) mission, which will impact NASA’s progress in this science focus area. Program funding supports the NPP 2009 launch date.
6ESS6: See Outcome 3A.1 above.
6ESS23: Due to late delivery of the key Visible/Infrarerd Imager/Radiometer Suite (VIIRS) instrument from a program partner, NASA moved the Operational Readiness Review for NPP to September 2009.
97
Detailed Performance Data
PART 2 • DETAILED PERFORMANCE DATA
OUTCOME 3A.6: PROGRESS IN CHARACTERIZING AND UNDERSTANDING EARTH SURFACE CHANGES AND VARIABILITY OF EARTH’S GRAVITATIONAL AND MAGNETIC FIELDS.
FY 2006 FY 2005 FY 2004 FY 2003
Green None None None
The measurements of changes in the gravity fi eld over time from the GRACE mission yielded the fi rst uniform mass balance estimates for the Greenland and Antarctic polar ice caps, indicating signifi cant and perhaps accelerating loss of ice mass. During FY 2006, the GRACE mission also yielded other results:
• Circum-Antarctic deep-ocean current variability;
• Regional water accumulation data demonstrating that algorithms show continual improvement for estimating biweekly to multi-year trends and periodicities in water storage over land regions, from continental areas to regional drainage basins;
• The fi rst complete signature of land surface displacements due to a major earthquake; and
• Observations showing that the movement of the ocean fl oor resulting from the Aceh Earthquake of December 2004 caused a gravity change on Earth. This is the fi rst observation of the stretching within Earth’s crust caused by an undersea earthquake. The fi nding indicates that GRACE’s measurements will provide a new global capability to enhance understanding of the release of stress by large earthquakes.
NASA continues to support the measurement of Earth’s magnetic fi eld variability. For example, the European Space Agency’s satellite constellation, Swarm (to be launched in 2009), uses a NASA-developed, comprehensive model for geomagnetic modeling. NASA also supports the measurement of ultra-low-frequency electromagnetic signals in California to study possible earthquake precursors.
In July 2006, NASA announced progress in understanding earthquake causes and effects with the development of a rapid earthquake-magnitude evaluation technique that reduces the time needed to determine the magnitude of large earthquakes from hours to minutes. The system is crucial to identifying possible tsunami-producing earthquakes, enabling early activation of disaster response teams. The system builds on the NASA-developed, real-time GPS precision positioning capability, which can feed data into the real-time tsunami modeling system being developed by NOAA. The USGS also has expressed interest in working with NASA to develop a similar capability to augment its seismometer-based networks. The real-time GPS capability also could be deployed aboard ocean buoys to aid in detecting passing tsunamis.
FY 2006 Annual Performance Goal FY 2005 FY 2004 FY 2003
6ESS1Green
For current observations, reduce the cost of acquiring and distributing the data stream to facilitate adoption by the operational community.
None None None
6ESS3Green
Keep 90 percent of the total on-orbit instrument complement functional throughout the year.
None None None
6ESS4Green
Mature two to three technologies to the point they can be demonstrated in space or in an operational environment and annually advance 25 percent of funded technol-ogy developments one Technology Readiness Level (TRL).
None None None
6ESS5Green
Increase the number of distinct users of NASA data and services.None None None
6ESS6Yellow
Improve level of customer satisfaction as measured by a baselined index obtained through the use of annual surveys.
None None None
6ESS7Green
Demonstrate progress that NASA-developed data sets, technologies and models enhance understanding of the Earth system leading to improved predictive capability in each of the six science focus area roadmaps. Progress toward achieving outcomes will be validated by external review.
None None None
98 NASA FY 2006 PERFORMANCE AND ACCOUNTABILITY REPORT
FY 2006 Annual Performance Goal FY 2005 FY 2004 FY 2003
6ESS20Green
Systematically continue to transfer research results from spacecraft, instruments, data protocols, and models to NOAA and other operational agencies as appropri-ate.
None None None
Performance Shortfalls6ESS6: See Outcome 3A.1, above.
OUTCOME 3A.7: PROGRESS IN EXPANDING AND ACCELERATING THE REALIZATION OF SOCIETAL BENEFITS FROM EARTH SYSTEM SCIENCE.
FY 2006 FY 2005 FY 2004 FY 2003
Green None None None
NASA’s Applied Science Program collaborates with other federal agency partners to expand their use of NASA Earth science research results. The Applied Science Program activities provide innovative benefi ts to the Nation in 12 focus areas: Agricultural Effi ciency, Air Quality, Aviation, Carbon Management, Coastal Management, Disaster Management, Ecological Forecasting, Energy Management, Homeland Security, Invasive Species, Public Health, and Water Management. In FY 2006, the program made progress toward this Outcome through 147 funded activi-ties that yielded results in all 12 focus areas. One project included an evaluation of the NOAA Harmful Algal Blooms Observation System prototype, which will alert coastal management offi cials when populations of phytoplankton (i.e., harmful algal blooms) grow out of control, threaten coastal ecosystems, or pose hazards to human health. The program also validated a prototype system that integrates NASA Earth science results into the Center for Disease Control (CDC)-sponsored ArboNET/Plague Surveillance System. This CDC system tracks insect populations that carry and transmit disease-producing microorganisms. NASA data and infrastructure support through the Regional Visualization and Monitoring System (SERVIR) Program also improved ecological forecasting and disaster manage-ment in Central America. NASA research enhanced aviation weather-hazard nowcasting (forecasting in a zero- to six-hour timeframe) and improved short-term forecasting products developed by the Federal Aviation Administra-tion. NASA’s research also improved global crop monitoring performed by the U.S. Department of Agriculture.
The National Research Council is evaluating NASA’s progress toward this Outcome.
FY 2006 Annual Performance Goal FY 2005 FY 2004 FY 2003
6ESS1Green
For current observations, reduce the cost of acquiring and distributing the data stream to facilitate adoption by the operational community.
None None None
6ESS21Yellow
Benchmark the assimilation of observations and products in decision support systems serving applications of national priority. Progress will be evaluated by the Committee on Environmental and National Resources.
None None None
Performance Shortfalls6ESS21: NASA completed this benchmarking in support of such areas as agricultural effi ciency, air quality, avia-tion, disaster management, and public health. However, the external evaluation was postponed, primarily due to delays related to committee members’ schedules.
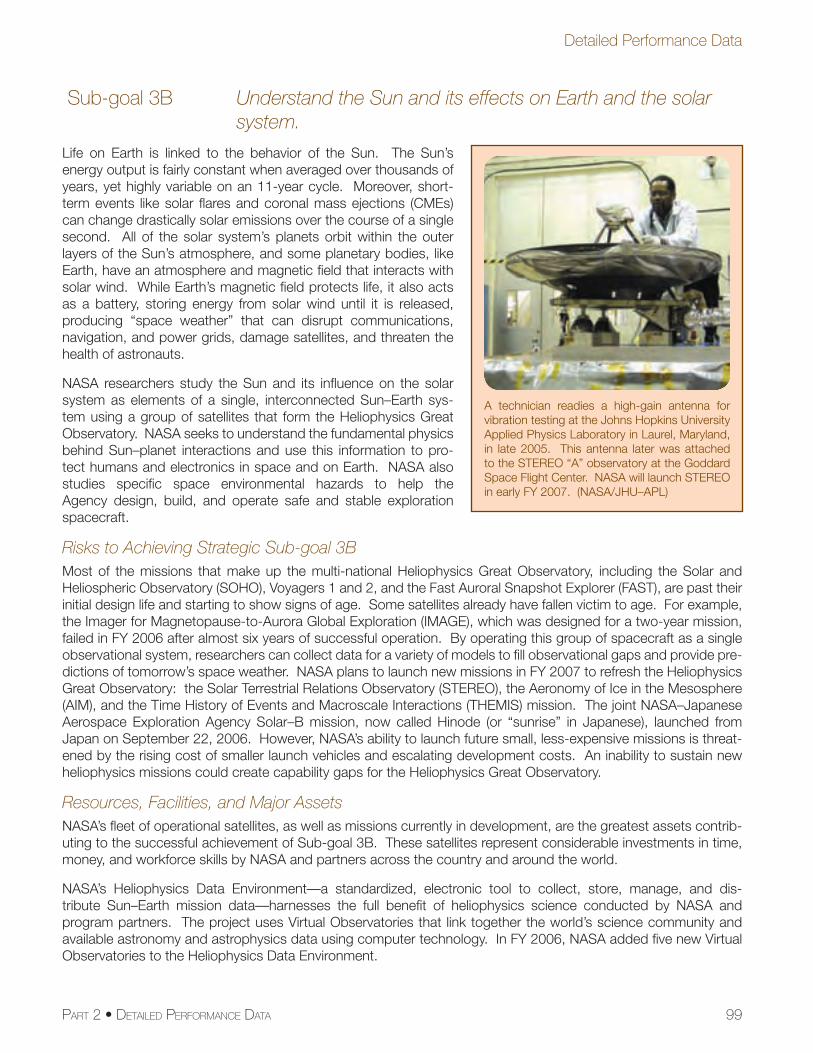
99
Detailed Performance Data
PART 2 • DETAILED PERFORMANCE DATA
Sub-goal 3B Understand the Sun and its effects on Earth and the solar system.
Life on Earth is linked to the behavior of the Sun. The Sun’s energy output is fairly constant when averaged over thousands of years, yet highly variable on an 11-year cycle. Moreover, short-term events like solar fl ares and coronal mass ejections (CMEs) can change drastically solar emissions over the course of a single second. All of the solar system’s planets orbit within the outer layers of the Sun’s atmosphere, and some planetary bodies, like Earth, have an atmosphere and magnetic fi eld that interacts with solar wind. While Earth’s magnetic fi eld protects life, it also acts as a battery, storing energy from solar wind until it is released, producing “space weather” that can disrupt communications, navigation, and power grids, damage satellites, and threaten the health of astronauts.
NASA researchers study the Sun and its infl uence on the solar system as elements of a single, interconnected Sun–Earth sys-tem using a group of satellites that form the Heliophysics Great Observatory. NASA seeks to understand the fundamental physics behind Sun–planet interactions and use this information to pro-tect humans and electronics in space and on Earth. NASA also studies specifi c space environmental hazards to help the Agency design, build, and operate safe and stable exploration spacecraft.
Risks to Achieving Strategic Sub-goal 3BMost of the missions that make up the multi-national Heliophysics Great Observatory, including the Solar and Heliospheric Observatory (SOHO), Voyagers 1 and 2, and the Fast Auroral Snapshot Explorer (FAST), are past their initial design life and starting to show signs of age. Some satellites already have fallen victim to age. For example, the Imager for Magnetopause-to-Aurora Global Exploration (IMAGE), which was designed for a two-year mission, failed in FY 2006 after almost six years of successful operation. By operating this group of spacecraft as a single observational system, researchers can collect data for a variety of models to fi ll observational gaps and provide pre-dictions of tomorrow’s space weather. NASA plans to launch new missions in FY 2007 to refresh the Heliophysics Great Observatory: the Solar Terrestrial Relations Observatory (STEREO), the Aeronomy of Ice in the Mesosphere (AIM), and the Time History of Events and Macroscale Interactions (THEMIS) mission. The joint NASA–Japanese Aerospace Exploration Agency Solar–B mission, now called Hinode (or “sunrise” in Japanese), launched from Japan on September 22, 2006. However, NASA’s ability to launch future small, less-expensive missions is threat-ened by the rising cost of smaller launch vehicles and escalating development costs. An inability to sustain new heliophysics missions could create capability gaps for the Heliophysics Great Observatory.
Resources, Facilities, and Major AssetsNASA’s fl eet of operational satellites, as well as missions currently in development, are the greatest assets contrib-uting to the successful achievement of Sub-goal 3B. These satellites represent considerable investments in time, money, and workforce skills by NASA and partners across the country and around the world.
NASA’s Heliophysics Data Environment—a standardized, electronic tool to collect, store, manage, and dis-tribute Sun–Earth mission data—harnesses the full benefi t of heliophysics science conducted by NASA and program partners. The project uses Virtual Observatories that link together the world’s science community and available astronomy and astrophysics data using computer technology. In FY 2006, NASA added fi ve new Virtual Observatories to the Heliophysics Data Environment.
A technician readies a high-gain antenna for vibration testing at the Johns Hopkins University Applied Physics Laboratory in Laurel, Maryland, in late 2005. This antenna later was attached to the STEREO “A” observatory at the Goddard Space Flight Center. NASA will launch STEREO in early FY 2007. (NASA/JHU–APL)
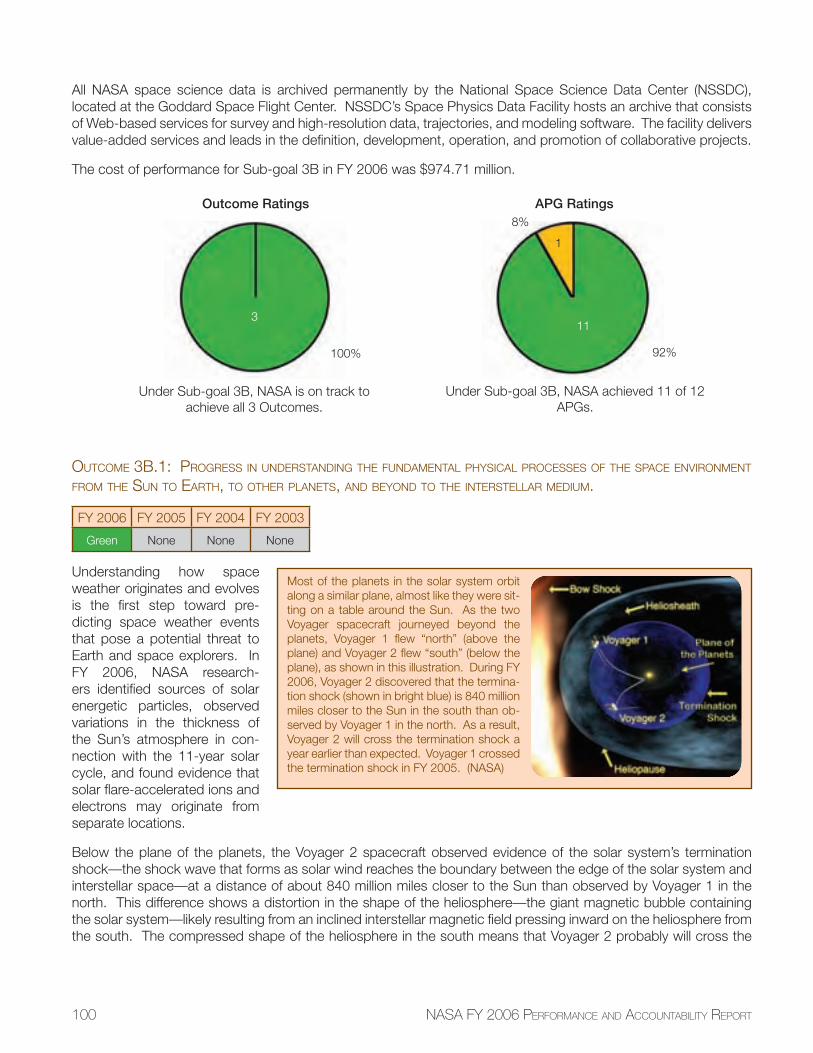
100 NASA FY 2006 PERFORMANCE AND ACCOUNTABILITY REPORT
All NASA space science data is archived permanently by the National Space Science Data Center (NSSDC), located at the Goddard Space Flight Center. NSSDC’s Space Physics Data Facility hosts an archive that consists of Web-based services for survey and high-resolution data, trajectories, and modeling software. The facility delivers value-added services and leads in the defi nition, development, operation, and promotion of collaborative projects.
The cost of performance for Sub-goal 3B in FY 2006 was $974.71 million.
OUTCOME 3B.1: PROGRESS IN UNDERSTANDING THE FUNDAMENTAL PHYSICAL PROCESSES OF THE SPACE ENVIRONMENT FROM THE SUN TO EARTH, TO OTHER PLANETS, AND BEYOND TO THE INTERSTELLAR MEDIUM.
FY 2006 FY 2005 FY 2004 FY 2003
Green None None None
Understanding how space weather originates and evolves is the fi rst step toward pre-dicting space weather events that pose a potential threat to Earth and space explorers. In FY 2006, NASA research-ers identifi ed sources of solar energetic particles, observed variations in the thickness of the Sun’s atmosphere in con-nection with the 11-year solar cycle, and found evidence that solar fl are-accelerated ions and electrons may originate from separate locations.
Below the plane of the planets, the Voyager 2 spacecraft observed evidence of the solar system’s termination shock—the shock wave that forms as solar wind reaches the boundary between the edge of the solar system and interstellar space—at a distance of about 840 million miles closer to the Sun than observed by Voyager 1 in the north. This difference shows a distortion in the shape of the heliosphere—the giant magnetic bubble containing the solar system—likely resulting from an inclined interstellar magnetic fi eld pressing inward on the heliosphere from the south. The compressed shape of the heliosphere in the south means that Voyager 2 probably will cross the
Most of the planets in the solar system orbit along a similar plane, almost like they were sit-ting on a table around the Sun. As the two Voyager spacecraft journeyed beyond the planets, Voyager 1 fl ew “north” (above the plane) and Voyager 2 fl ew “south” (below the plane), as shown in this illustration. During FY 2006, Voyager 2 discovered that the termina-tion shock (shown in bright blue) is 840 million miles closer to the Sun in the south than ob-served by Voyager 1 in the north. As a result, Voyager 2 will cross the termination shock a year earlier than expected. Voyager 1 crossed the termination shock in FY 2005. (NASA)
Outcome Ratings
Under Sub-goal 3B, NASA is on track to achieve all 3 Outcomes.
3
100%
APG Ratings
11
92%
Under Sub-goal 3B, NASA achieved 11 of 12 APGs.
1
8%
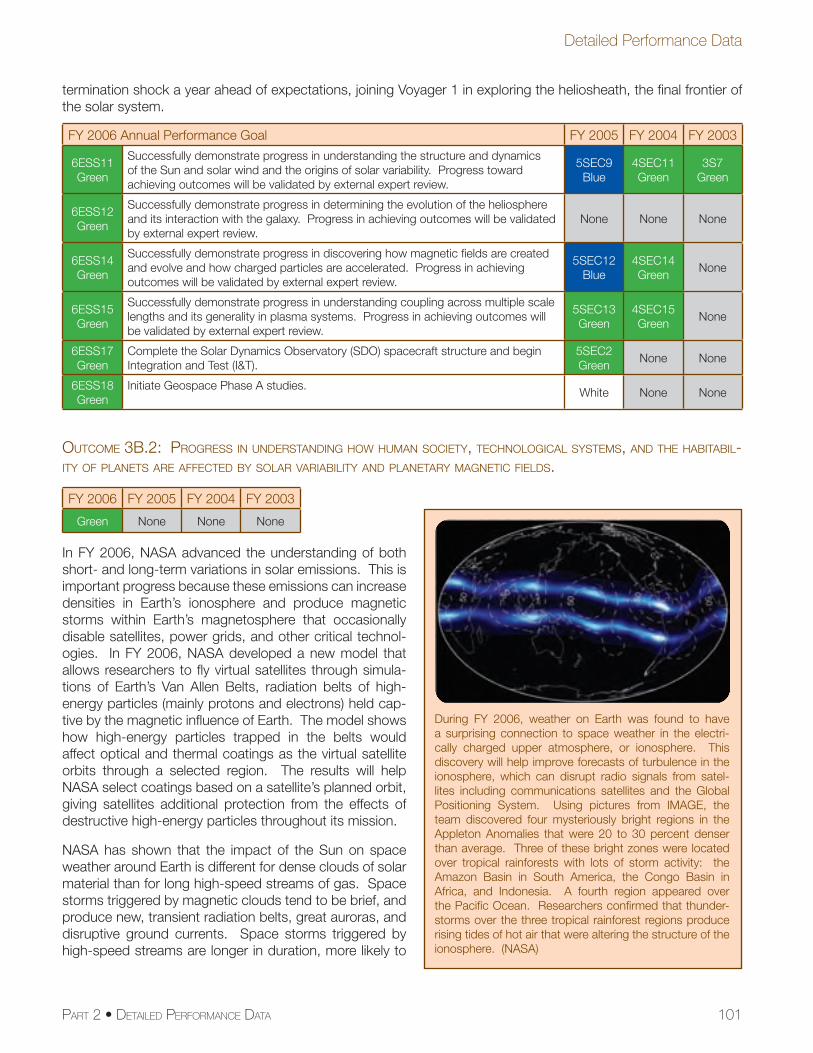
101
Detailed Performance Data
PART 2 • DETAILED PERFORMANCE DATA
termination shock a year ahead of expectations, joining Voyager 1 in exploring the heliosheath, the fi nal frontier of the solar system.
FY 2006 Annual Performance Goal FY 2005 FY 2004 FY 2003
6ESS11Green
Successfully demonstrate progress in understanding the structure and dynamics of the Sun and solar wind and the origins of solar variability. Progress toward achieving outcomes will be validated by external expert review.
5SEC9Blue
4SEC11Green
3S7Green
6ESS12Green
Successfully demonstrate progress in determining the evolution of the heliosphere and its interaction with the galaxy. Progress in achieving outcomes will be validated by external expert review.
None None None
6ESS14Green
Successfully demonstrate progress in discovering how magnetic fi elds are created and evolve and how charged particles are accelerated. Progress in achieving outcomes will be validated by external expert review.
5SEC12Blue
4SEC14Green
None
6ESS15Green
Successfully demonstrate progress in understanding coupling across multiple scale lengths and its generality in plasma systems. Progress in achieving outcomes will be validated by external expert review.
5SEC13Green
4SEC15Green
None
6ESS17Green
Complete the Solar Dynamics Observatory (SDO) spacecraft structure and begin Integration and Test (I&T).
5SEC2Green
None None
6ESS18Green
Initiate Geospace Phase A studies.White None None
OUTCOME 3B.2: PROGRESS IN UNDERSTANDING HOW HUMAN SOCIETY, TECHNOLOGICAL SYSTEMS, AND THE HABITABIL-ITY OF PLANETS ARE AFFECTED BY SOLAR VARIABILITY AND PLANETARY MAGNETIC FIELDS.
FY 2006 FY 2005 FY 2004 FY 2003
Green None None None
In FY 2006, NASA advanced the understanding of both short- and long-term variations in solar emissions. This is important progress because these emissions can increase densities in Earth’s ionosphere and produce magnetic storms within Earth’s magnetosphere that occasionally disable satellites, power grids, and other critical technol-ogies. In FY 2006, NASA developed a new model that allows researchers to fl y virtual satellites through simula-tions of Earth’s Van Allen Belts, radiation belts of high-energy particles (mainly protons and electrons) held cap-tive by the magnetic infl uence of Earth. The model shows how high-energy particles trapped in the belts would affect optical and thermal coatings as the virtual satellite orbits through a selected region. The results will help NASA select coatings based on a satellite’s planned orbit, giving satellites additional protection from the effects of destructive high-energy particles throughout its mission.
NASA has shown that the impact of the Sun on space weather around Earth is different for dense clouds of solar material than for long high-speed streams of gas. Space storms triggered by magnetic clouds tend to be brief, and produce new, transient radiation belts, great auroras, and disruptive ground currents. Space storms triggered by high-speed streams are longer in duration, more likely to
During FY 2006, weather on Earth was found to have a surprising connection to space weather in the electri-cally charged upper atmosphere, or ionosphere. This discovery will help improve forecasts of turbulence in the ionosphere, which can disrupt radio signals from satel-lites including communications satellites and the Global Positioning System. Using pictures from IMAGE, the team discovered four mysteriously bright regions in the Appleton Anomalies that were 20 to 30 percent denser than average. Three of these bright zones were located over tropical rainforests with lots of storm activity: the Amazon Basin in South America, the Congo Basin in Africa, and Indonesia. A fourth region appeared over the Pacifi c Ocean. Researchers confi rmed that thunder-storms over the three tropical rainforest regions produce rising tides of hot air that were altering the structure of the ionosphere. (NASA)
102 NASA FY 2006 PERFORMANCE AND ACCOUNTABILITY REPORT
affect spacecraft, and produce more intense radiation belts. Studies of these differences are important to under-standing the effects of solar events on the Earth system.
The charged particles (or plasma) trapped in the Van Allen Belts are drained continuously and replenished through dynamic interactions between the Sun and Earth. This interaction can alter the size and intensity of the radiation belts, creating space weather that affects directly the performance of satellites. NASA has discovered how one of these processes replenishes the high-energy radiation in the belts. NASA research revealed how low-frequency electromagnetic waves quickly accelerate plasma in the radiation belts. These waves, which are common in the boundary between the radiation belts and the cold, dense plasma from the upper ionosphere, are a primary source for replenishing the radiation belts.
FY 2006 Annual Performance Goal FY 2005 FY 2004 FY 2003
6ESS8Green
Successfully demonstrate progress in developing the capability to predict solar activity and the evolution of solar disturbances as they propagate in the heliosphere and affect the Earth. Progress toward achieving outcomes will be validated by external expert review.
5SEC6Green
4SEC8Green
3S7Green
6ESS9Green
Successfully demonstrate progress in specifying and enabling prediction of changes to the Earth’s radiation environment, ionosphere, and upper atmosphere. Progress toward achieving outcomes will be validated by external expert review.
5SEC7Green
4SEC9Green
3S8Green
6ESS10Green
Successfully demonstrate progress in understanding the role of solar variability in driving space climate and global change in the Earth’s atmosphere. Progress toward achieving outcomes will be validated by external expert review.
5SEC8Green
4SEC10Blue
None
6ESS13Green
Successfully demonstrate progress in understanding the response of magneto-spheres and atmospheres to external and internal drivers. Progress in achieving outcomes will be validated by external expert review.
5SEC11Green
4SEC13Green
None
6ESS16Yellow
Successfully launch the Solar Terrestrial Relations Observatory (STEREO).
5SEC1Yellow
None None
6ESS17Green
Complete the Solar Dynamics Observatory (SDO) spacecraft structure and begin Integration and Test (I&T).
5SEC2Green
None None
6ESS18Green
Initiate Geospace Phase A studies. 5SEC4White
None None
6ESS19Green
Publish Solar Sentinels Science Defi nition Team report.None None None
Performance Shortfalls6ESS16: NASA postponed the STEREO mission launch due to problems with the Delta II launch vehicle second-stage tanks.
OUTCOME 3B.3: PROGRESS IN DEVELOPING THE CAPABILITY TO PREDICT THE EXTREME AND DYNAMIC CONDITIONS IN SPACE IN ORDER TO MAXIMIZE THE SAFETY AND PRODUCTIVITY OF HUMAN AND ROBOTIC EXPLORERS.
FY 2006 FY 2005 FY 2004 FY 2003
Green None None None
To safeguard astronauts and robotic assets in space, researchers must characterize the extremes and variability of solar-induced events. The SOHO team made progress toward predicting potentially harmful solar events during FY 2006 by watching for wave motions excited in the Sun’s interior that are indicative of areas of high activity. This new method allows scientists to see almost the entire far side of the Sun. Since the Sun rotates every 27 days relative to Earth, a solar fl are could erupt around the horizon at any time. This new method for monitoring the entire surface of the Sun will provide early warning of solar events, helping NASA protect astronauts in space.
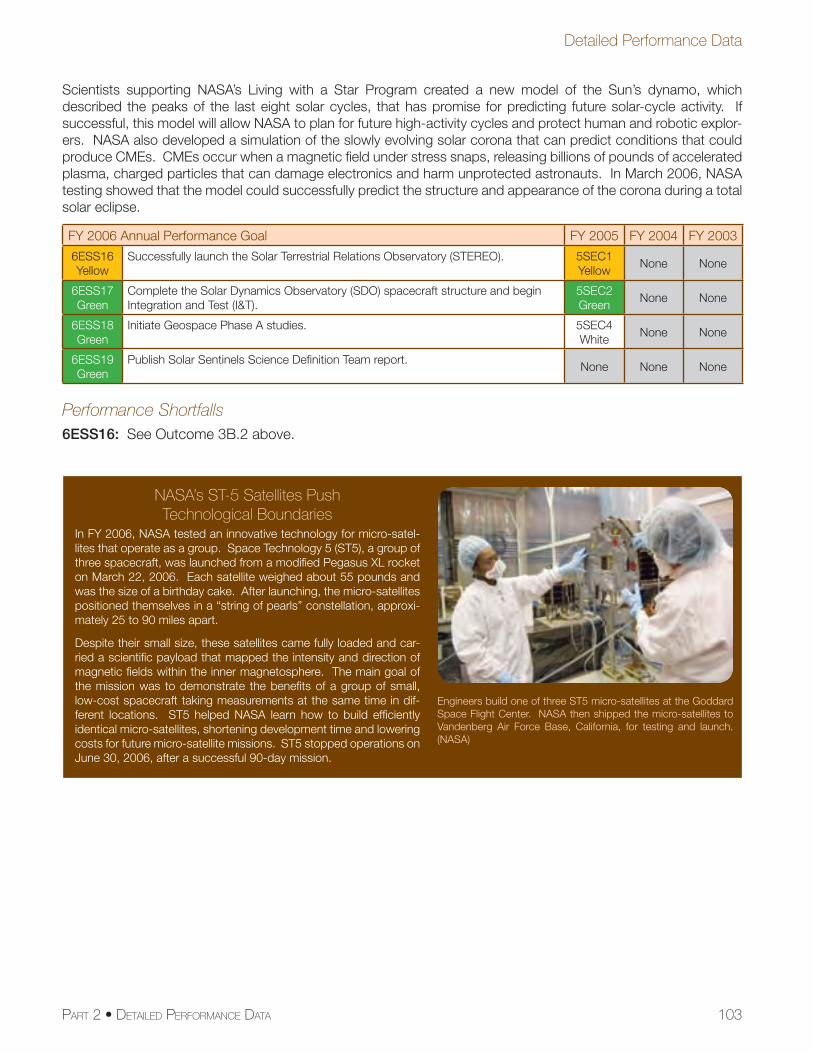
103
Detailed Performance Data
PART 2 • DETAILED PERFORMANCE DATA
Scientists supporting NASA’s Living with a Star Program created a new model of the Sun’s dynamo, which described the peaks of the last eight solar cycles, that has promise for predicting future solar-cycle activity. If successful, this model will allow NASA to plan for future high-activity cycles and protect human and robotic explor-ers. NASA also developed a simulation of the slowly evolving solar corona that can predict conditions that could produce CMEs. CMEs occur when a magnetic fi eld under stress snaps, releasing billions of pounds of accelerated plasma, charged particles that can damage electronics and harm unprotected astronauts. In March 2006, NASA testing showed that the model could successfully predict the structure and appearance of the corona during a total solar eclipse.
FY 2006 Annual Performance Goal FY 2005 FY 2004 FY 2003
6ESS16Yellow
Successfully launch the Solar Terrestrial Relations Observatory (STEREO). 5SEC1Yellow
None None
6ESS17Green
Complete the Solar Dynamics Observatory (SDO) spacecraft structure and begin Integration and Test (I&T).
5SEC2Green
None None
6ESS18Green
Initiate Geospace Phase A studies. 5SEC4White
None None
6ESS19Green
Publish Solar Sentinels Science Defi nition Team report.None None None
Performance Shortfalls6ESS16: See Outcome 3B.2 above.
NASA’s ST-5 Satellites Push Technological Boundaries
In FY 2006, NASA tested an innovative technology for micro-satel-lites that operate as a group. Space Technology 5 (ST5), a group of three spacecraft, was launched from a modifi ed Pegasus XL rocket on March 22, 2006. Each satellite weighed about 55 pounds and was the size of a birthday cake. After launching, the micro-satellites positioned themselves in a “string of pearls” constellation, approxi-mately 25 to 90 miles apart.
Despite their small size, these satellites came fully loaded and car-ried a scientifi c payload that mapped the intensity and direction of magnetic fi elds within the inner magnetosphere. The main goal of the mission was to demonstrate the benefi ts of a group of small, low-cost spacecraft taking measurements at the same time in dif-ferent locations. ST5 helped NASA learn how to build effi ciently identical micro-satellites, shortening development time and lowering costs for future micro-satellite missions. ST5 stopped operations on June 30, 2006, after a successful 90-day mission.
Engineers build one of three ST5 micro-satellites at the Goddard Space Flight Center. NASA then shipped the micro-satellites to Vandenberg Air Force Base, California, for testing and launch. (NASA)
104 NASA FY 2006 PERFORMANCE AND ACCOUNTABILITY REPORT
Sub-goal 3C Advance scientifi c knowledge of the solar system, search for evidence of life, and prepare for human exploration.
NASA’s robotic science missions are paving the way for human space exploration by studying and characterizing alien environments, identifying possible resources, validating new capabilities, and delivering the infrastructure that will enable safe and effective human missions.
Robotic explorers also gather data to help scientists understand how the planets formed, what triggered different evolutionary paths among planets, and how Earth originated, evolved, and became habitable. To search for evi-dence of life beyond Earth, scientists use this data to map zones of habitability, study the chemistry of alien worlds, and unveil the processes that lead to conditions necessary for life. Moreover, NASA scientists gain knowledge from robotic exploration that provides valuable insight into the nature of life on Earth.
Knowledge about the solar system helps protect life on Earth. For example, through the Near Earth Object Observation Program, NASA identifi es and categorizes near-Earth objects (e.g., asteroids and comets) that could threaten life on Earth.
Risks to Achieving Sub-goal 3CInterplanetary spacecraft for solar system exploration are expensive and complex and often require long lead-times for planning and development. Once launched, the travel times to the spacecraft’s destinations may take months or years.
AssessmentsIn FY 2006, the Offi ce of Management and Budget (OMB) assessed the Solar System Exploration Theme with OMB’s Program Assessment Rating Tool (PART). OMB assessed the overall program as “Effective,” the highest rating available, with the following scores by rating area:
• Program Purpose and Design—100%
• Strategic Planning—100%
• Program Management—91%
• Program Results/Accountability—80%
The lower scores under Program Management and Program Results/Accountability were due to on-going issues with Agency-wide fi nancial management practices and minor programmatic slips. NASA is making progress in improving the Agency’s fi nancial management system.
Resources, Facilities, and Major AssetsNASA’s progress toward achieving Sub-goal 3C rests on the success of numerous planetary science orbiters, solar system probes, rovers, landers, and sample return missions. These missions are supported by laboratories at NASA Centers, including the Goddard Space Flight Center and the Jet Propulsion Laboratory, and at universities around the country. These laboratories provide years—and occasionally decades—of mission management, data collection, and analysis. Some missions, including Cassini/Huygens and Rosetta, are joint projects between NASA and international partners.
NASA’s Planetary Data System (PDS) archives data by areas—atmospheres, geosciences, imaging, planetary plasma interactions, and small bodies—and makes data available to the planetary sciences community. Mission principal investigators comply with PDS standards to ensure the integrity and long-term usability of datasets. PDS is managed by NASA’s National Space Science Data Center, the permanent archive for all NASA space science data, located at the Goddard Space Flight Center. NASA also supports extraterrestrial sample curation (storage and oversight of material returned from space) at the Johnson Space Center.
The cost of performance for Sub-goal 3C in FY 2006 is $1,948.93 million.
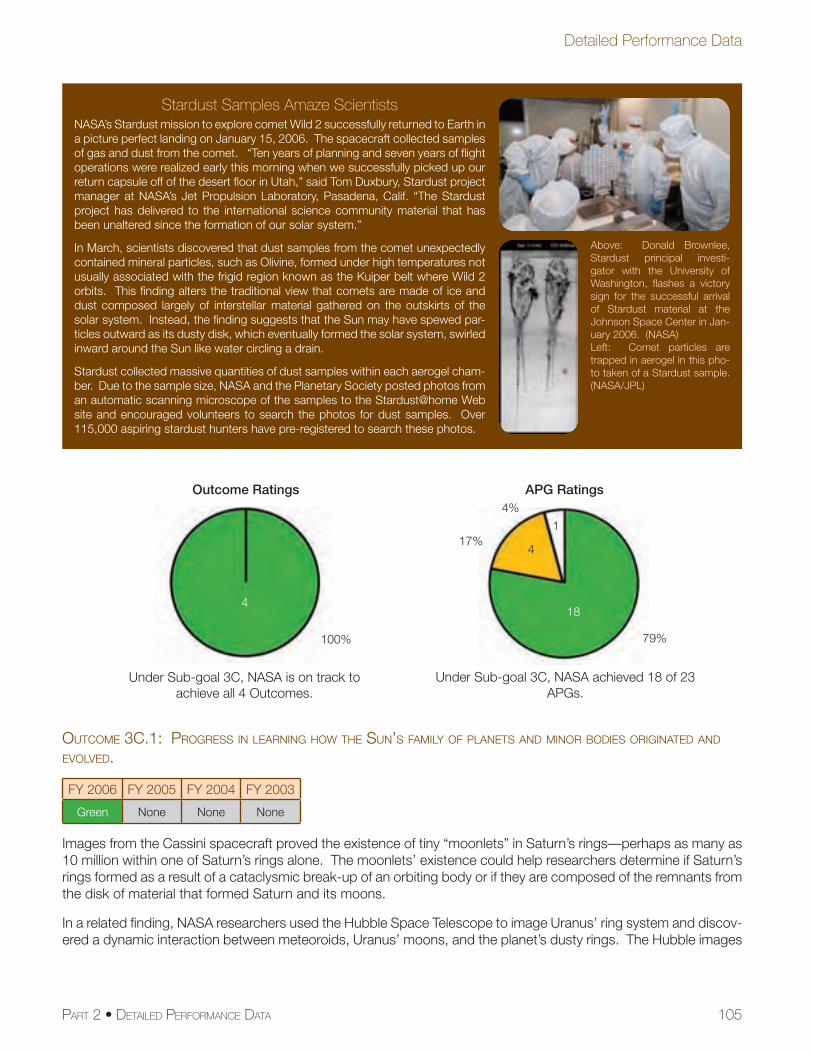
105
Detailed Performance Data
PART 2 • DETAILED PERFORMANCE DATA
OUTCOME 3C.1: PROGRESS IN LEARNING HOW THE SUN’S FAMILY OF PLANETS AND MINOR BODIES ORIGINATED AND EVOLVED.
FY 2006 FY 2005 FY 2004 FY 2003
Green None None None
Images from the Cassini spacecraft proved the existence of tiny “moonlets” in Saturn’s rings—perhaps as many as 10 million within one of Saturn’s rings alone. The moonlets’ existence could help researchers determine if Saturn’s rings formed as a result of a cataclysmic break-up of an orbiting body or if they are composed of the remnants from the disk of material that formed Saturn and its moons.
In a related fi nding, NASA researchers used the Hubble Space Telescope to image Uranus’ ring system and discov-ered a dynamic interaction between meteoroids, Uranus’ moons, and the planet’s dusty rings. The Hubble images
Stardust Samples Amaze ScientistsNASA’s Stardust mission to explore comet Wild 2 successfully returned to Earth in a picture perfect landing on January 15, 2006. The spacecraft collected samples of gas and dust from the comet. “Ten years of planning and seven years of fl ight operations were realized early this morning when we successfully picked up our return capsule off of the desert fl oor in Utah,” said Tom Duxbury, Stardust project manager at NASA’s Jet Propulsion Laboratory, Pasadena, Calif. “The Stardust project has delivered to the international science community material that has been unaltered since the formation of our solar system.”
In March, scientists discovered that dust samples from the comet unexpectedly contained mineral particles, such as Olivine, formed under high temperatures not usually associated with the frigid region known as the Kuiper belt where Wild 2 orbits. This fi nding alters the traditional view that comets are made of ice and dust composed largely of interstellar material gathered on the outskirts of the solar system. Instead, the fi nding suggests that the Sun may have spewed par-ticles outward as its dusty disk, which eventually formed the solar system, swirled inward around the Sun like water circling a drain.
Stardust collected massive quantities of dust samples within each aerogel cham-ber. Due to the sample size, NASA and the Planetary Society posted photos from an automatic scanning microscope of the samples to the Stardust@home Web site and encouraged volunteers to search the photos for dust samples. Over 115,000 aspiring stardust hunters have pre-registered to search these photos.
Above: Donald Brownlee, Stardust principal investi-gator with the University of Washington, fl ashes a victory sign for the successful arrival of Stardust material at the Johnson Space Center in Jan-uary 2006. (NASA) Left: Comet particles are trapped in aerogel in this pho-to taken of a Stardust sample. (NASA/JPL)
Outcome Ratings
Under Sub-goal 3C, NASA is on track to achieve all 4 Outcomes.
4
100%
APG Ratings
18
79%
Under Sub-goal 3C, NASA achieved 18 of 23 APGs.
1
4%
417%
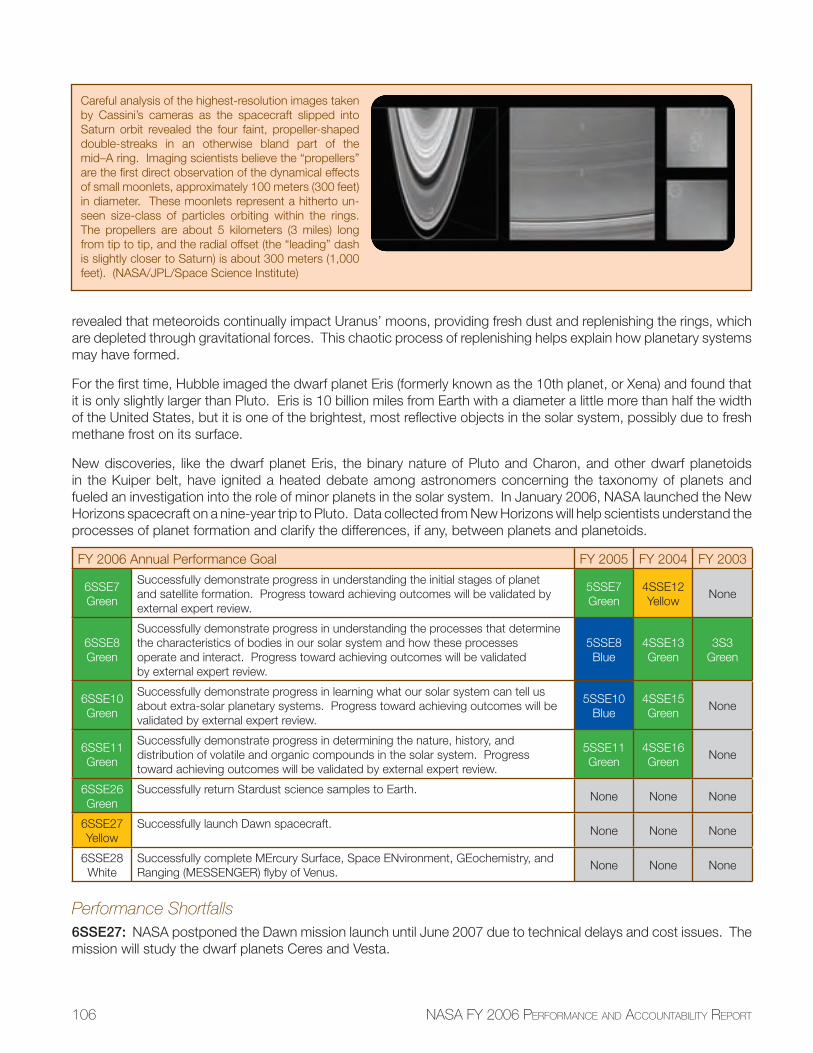
106 NASA FY 2006 PERFORMANCE AND ACCOUNTABILITY REPORT
revealed that meteoroids continually impact Uranus’ moons, providing fresh dust and replenishing the rings, which are depleted through gravitational forces. This chaotic process of replenishing helps explain how planetary systems may have formed.
For the fi rst time, Hubble imaged the dwarf planet Eris (formerly known as the 10th planet, or Xena) and found that it is only slightly larger than Pluto. Eris is 10 billion miles from Earth with a diameter a little more than half the width of the United States, but it is one of the brightest, most refl ective objects in the solar system, possibly due to fresh methane frost on its surface.
New discoveries, like the dwarf planet Eris, the binary nature of Pluto and Charon, and other dwarf planetoids in the Kuiper belt, have ignited a heated debate among astronomers concerning the taxonomy of planets and fueled an investigation into the role of minor planets in the solar system. In January 2006, NASA launched the New Horizons spacecraft on a nine-year trip to Pluto. Data collected from New Horizons will help scientists understand the processes of planet formation and clarify the differences, if any, between planets and planetoids.
FY 2006 Annual Performance Goal FY 2005 FY 2004 FY 2003
6SSE7Green
Successfully demonstrate progress in understanding the initial stages of planet and satellite formation. Progress toward achieving outcomes will be validated by external expert review.
5SSE7Green
4SSE12Yellow
None
6SSE8Green
Successfully demonstrate progress in understanding the processes that determine the characteristics of bodies in our solar system and how these processes operate and interact. Progress toward achieving outcomes will be validated by external expert review.
5SSE8Blue
4SSE13Green
3S3Green
6SSE10Green
Successfully demonstrate progress in learning what our solar system can tell us about extra-solar planetary systems. Progress toward achieving outcomes will be validated by external expert review.
5SSE10Blue
4SSE15Green
None
6SSE11Green
Successfully demonstrate progress in determining the nature, history, and distribution of volatile and organic compounds in the solar system. Progress toward achieving outcomes will be validated by external expert review.
5SSE11Green
4SSE16Green
None
6SSE26Green
Successfully return Stardust science samples to Earth.None None None
6SSE27Yellow
Successfully launch Dawn spacecraft.None None None
6SSE28White
Successfully complete MErcury Surface, Space ENvironment, GEochemistry, and Ranging (MESSENGER) fl yby of Venus.
None None None
Performance Shortfalls6SSE27: NASA postponed the Dawn mission launch until June 2007 due to technical delays and cost issues. The mission will study the dwarf planets Ceres and Vesta.
Careful analysis of the highest-resolution images taken by Cassini’s cameras as the spacecraft slipped into Saturn orbit revealed the four faint, propeller-shaped double-streaks in an otherwise bland part of the mid–A ring. Imaging scientists believe the “propellers” are the fi rst direct observation of the dynamical effects of small moonlets, approximately 100 meters (300 feet) in diameter. These moonlets represent a hitherto un-seen size-class of particles orbiting within the rings. The propellers are about 5 kilometers (3 miles) long from tip to tip, and the radial offset (the “leading” dash is slightly closer to Saturn) is about 300 meters (1,000 feet). (NASA/JPL/Space Science Institute)
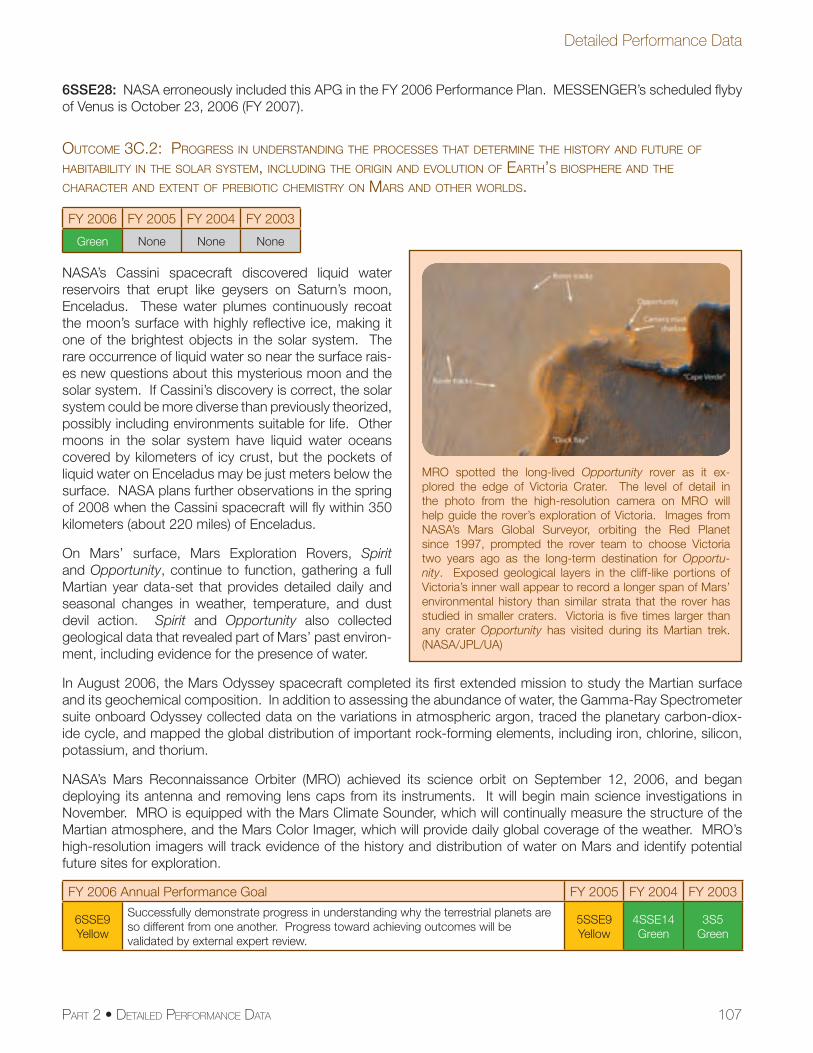
107
Detailed Performance Data
PART 2 • DETAILED PERFORMANCE DATA
6SSE28: NASA erroneously included this APG in the FY 2006 Performance Plan. MESSENGER’s scheduled fl yby of Venus is October 23, 2006 (FY 2007).
OUTCOME 3C.2: PROGRESS IN UNDERSTANDING THE PROCESSES THAT DETERMINE THE HISTORY AND FUTURE OF HABITABILITY IN THE SOLAR SYSTEM, INCLUDING THE ORIGIN AND EVOLUTION OF EARTH’S BIOSPHERE AND THE CHARACTER AND EXTENT OF PREBIOTIC CHEMISTRY ON MARS AND OTHER WORLDS.
FY 2006 FY 2005 FY 2004 FY 2003
Green None None None
NASA’s Cassini spacecraft discovered liquid water reservoirs that erupt like geysers on Saturn’s moon, Enceladus. These water plumes continuously recoat the moon’s surface with highly refl ective ice, making it one of the brightest objects in the solar system. The rare occurrence of liquid water so near the surface rais-es new questions about this mysterious moon and the solar system. If Cassini’s discovery is correct, the solar system could be more diverse than previously theorized, possibly including environments suitable for life. Other moons in the solar system have liquid water oceans covered by kilometers of icy crust, but the pockets of liquid water on Enceladus may be just meters below the surface. NASA plans further observations in the spring of 2008 when the Cassini spacecraft will fl y within 350 kilometers (about 220 miles) of Enceladus.
On Mars’ surface, Mars Exploration Rovers, Spirit and Opportunity, continue to function, gathering a full Martian year data-set that provides detailed daily and seasonal changes in weather, temperature, and dust devil action. Spirit and Opportunity also collected geological data that revealed part of Mars’ past environ-ment, including evidence for the presence of water.
In August 2006, the Mars Odyssey spacecraft completed its fi rst extended mission to study the Martian surface and its geochemical composition. In addition to assessing the abundance of water, the Gamma-Ray Spectrometer suite onboard Odyssey collected data on the variations in atmospheric argon, traced the planetary carbon-diox-ide cycle, and mapped the global distribution of important rock-forming elements, including iron, chlorine, silicon, potassium, and thorium.
NASA’s Mars Reconnaissance Orbiter (MRO) achieved its science orbit on September 12, 2006, and began deploying its antenna and removing lens caps from its instruments. It will begin main science investigations in November. MRO is equipped with the Mars Climate Sounder, which will continually measure the structure of the Martian atmosphere, and the Mars Color Imager, which will provide daily global coverage of the weather. MRO’s high-resolution imagers will track evidence of the history and distribution of water on Mars and identify potential future sites for exploration.
FY 2006 Annual Performance Goal FY 2005 FY 2004 FY 2003
6SSE9Yellow
Successfully demonstrate progress in understanding why the terrestrial planets are so different from one another. Progress toward achieving outcomes will be validated by external expert review.
5SSE9Yellow
4SSE14Green
3S5Green
MRO spotted the long-lived Opportunity rover as it ex-plored the edge of Victoria Crater. The level of detail in the photo from the high-resolution camera on MRO will help guide the rover’s exploration of Victoria. Images from NASA’s Mars Global Surveyor, orbiting the Red Planet since 1997, prompted the rover team to choose Victoria two years ago as the long-term destination for Opportu-nity. Exposed geological layers in the cliff-like portions of Victoria’s inner wall appear to record a longer span of Mars’ environmental history than similar strata that the rover has studied in smaller craters. Victoria is fi ve times larger than any crater Opportunity has visited during its Martian trek. (NASA/JPL/UA)
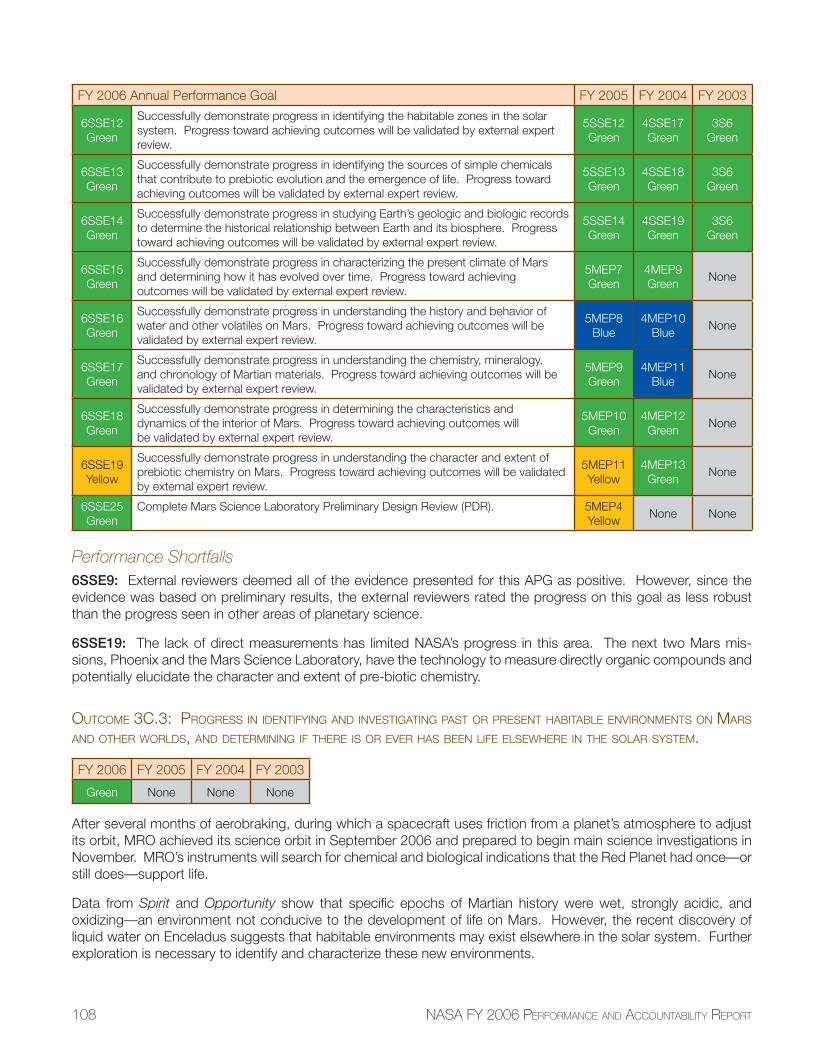
108 NASA FY 2006 PERFORMANCE AND ACCOUNTABILITY REPORT
FY 2006 Annual Performance Goal FY 2005 FY 2004 FY 2003
6SSE12Green
Successfully demonstrate progress in identifying the habitable zones in the solar system. Progress toward achieving outcomes will be validated by external expert review.
5SSE12Green
4SSE17Green
3S6Green
6SSE13Green
Successfully demonstrate progress in identifying the sources of simple chemicals that contribute to prebiotic evolution and the emergence of life. Progress toward achieving outcomes will be validated by external expert review.
5SSE13Green
4SSE18Green
3S6Green
6SSE14Green
Successfully demonstrate progress in studying Earth’s geologic and biologic records to determine the historical relationship between Earth and its biosphere. Progress toward achieving outcomes will be validated by external expert review.
5SSE14Green
4SSE19Green
3S6Green
6SSE15Green
Successfully demonstrate progress in characterizing the present climate of Mars and determining how it has evolved over time. Progress toward achieving outcomes will be validated by external expert review.
5MEP7Green
4MEP9Green
None
6SSE16Green
Successfully demonstrate progress in understanding the history and behavior of water and other volatiles on Mars. Progress toward achieving outcomes will be validated by external expert review.
5MEP8Blue
4MEP10Blue
None
6SSE17Green
Successfully demonstrate progress in understanding the chemistry, mineralogy, and chronology of Martian materials. Progress toward achieving outcomes will be validated by external expert review.
5MEP9Green
4MEP11Blue
None
6SSE18Green
Successfully demonstrate progress in determining the characteristics and dynamics of the interior of Mars. Progress toward achieving outcomes will be validated by external expert review.
5MEP10Green
4MEP12Green
None
6SSE19Yellow
Successfully demonstrate progress in understanding the character and extent of prebiotic chemistry on Mars. Progress toward achieving outcomes will be validated by external expert review.
5MEP11Yellow
4MEP13Green
None
6SSE25Green
Complete Mars Science Laboratory Preliminary Design Review (PDR). 5MEP4Yellow
None None
Performance Shortfalls6SSE9: External reviewers deemed all of the evidence presented for this APG as positive. However, since the evidence was based on preliminary results, the external reviewers rated the progress on this goal as less robust than the progress seen in other areas of planetary science.
6SSE19: The lack of direct measurements has limited NASA’s progress in this area. The next two Mars mis-sions, Phoenix and the Mars Science Laboratory, have the technology to measure directly organic compounds and potentially elucidate the character and extent of pre-biotic chemistry.
OUTCOME 3C.3: PROGRESS IN IDENTIFYING AND INVESTIGATING PAST OR PRESENT HABITABLE ENVIRONMENTS ON MARS AND OTHER WORLDS, AND DETERMINING IF THERE IS OR EVER HAS BEEN LIFE ELSEWHERE IN THE SOLAR SYSTEM.
FY 2006 FY 2005 FY 2004 FY 2003
Green None None None
After several months of aerobraking, during which a spacecraft uses friction from a planet’s atmosphere to adjust its orbit, MRO achieved its science orbit in September 2006 and prepared to begin main science investigations in November. MRO’s instruments will search for chemical and biological indications that the Red Planet had once—or still does—support life.
Data from Spirit and Opportunity show that specifi c epochs of Martian history were wet, strongly acidic, and oxidizing—an environment not conducive to the development of life on Mars. However, the recent discovery of liquid water on Enceladus suggests that habitable environments may exist elsewhere in the solar system. Further exploration is necessary to identify and characterize these new environments.
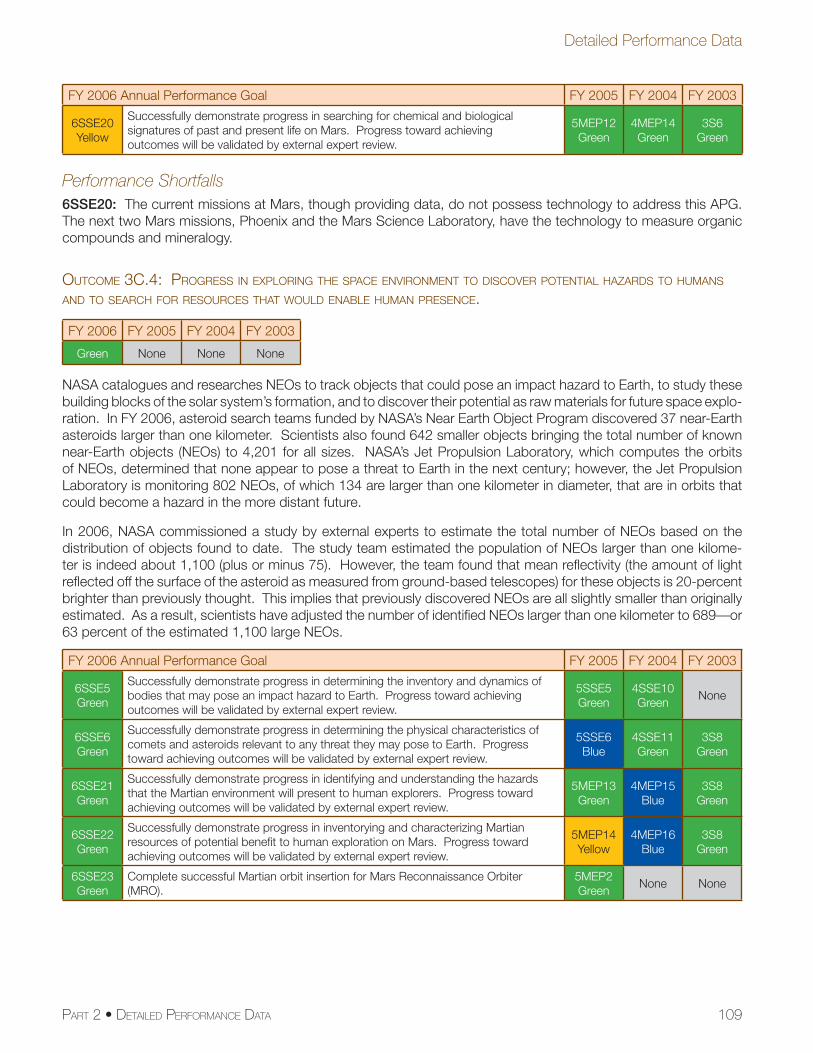
109
Detailed Performance Data
PART 2 • DETAILED PERFORMANCE DATA
FY 2006 Annual Performance Goal FY 2005 FY 2004 FY 2003
6SSE20Yellow
Successfully demonstrate progress in searching for chemical and biological signatures of past and present life on Mars. Progress toward achieving outcomes will be validated by external expert review.
5MEP12Green
4MEP14Green
3S6Green
Performance Shortfalls6SSE20: The current missions at Mars, though providing data, do not possess technology to address this APG. The next two Mars missions, Phoenix and the Mars Science Laboratory, have the technology to measure organic compounds and mineralogy.
OUTCOME 3C.4: PROGRESS IN EXPLORING THE SPACE ENVIRONMENT TO DISCOVER POTENTIAL HAZARDS TO HUMANS AND TO SEARCH FOR RESOURCES THAT WOULD ENABLE HUMAN PRESENCE.
FY 2006 FY 2005 FY 2004 FY 2003
Green None None None
NASA catalogues and researches NEOs to track objects that could pose an impact hazard to Earth, to study these building blocks of the solar system’s formation, and to discover their potential as raw materials for future space explo-ration. In FY 2006, asteroid search teams funded by NASA’s Near Earth Object Program discovered 37 near-Earth asteroids larger than one kilometer. Scientists also found 642 smaller objects bringing the total number of known near-Earth objects (NEOs) to 4,201 for all sizes. NASA’s Jet Propulsion Laboratory, which computes the orbits of NEOs, determined that none appear to pose a threat to Earth in the next century; however, the Jet Propulsion Laboratory is monitoring 802 NEOs, of which 134 are larger than one kilometer in diameter, that are in orbits that could become a hazard in the more distant future.
In 2006, NASA commissioned a study by external experts to estimate the total number of NEOs based on the distribution of objects found to date. The study team estimated the population of NEOs larger than one kilome-ter is indeed about 1,100 (plus or minus 75). However, the team found that mean refl ectivity (the amount of light refl ected off the surface of the asteroid as measured from ground-based telescopes) for these objects is 20-percent brighter than previously thought. This implies that previously discovered NEOs are all slightly smaller than originally estimated. As a result, scientists have adjusted the number of identifi ed NEOs larger than one kilometer to 689—or 63 percent of the estimated 1,100 large NEOs.
FY 2006 Annual Performance Goal FY 2005 FY 2004 FY 2003
6SSE5Green
Successfully demonstrate progress in determining the inventory and dynamics of bodies that may pose an impact hazard to Earth. Progress toward achieving outcomes will be validated by external expert review.
5SSE5Green
4SSE10Green
None
6SSE6Green
Successfully demonstrate progress in determining the physical characteristics of comets and asteroids relevant to any threat they may pose to Earth. Progress toward achieving outcomes will be validated by external expert review.
5SSE6Blue
4SSE11Green
3S8Green
6SSE21Green
Successfully demonstrate progress in identifying and understanding the hazards that the Martian environment will present to human explorers. Progress toward achieving outcomes will be validated by external expert review.
5MEP13Green
4MEP15Blue
3S8Green
6SSE22Green
Successfully demonstrate progress in inventorying and characterizing Martian resources of potential benefi t to human exploration on Mars. Progress toward achieving outcomes will be validated by external expert review.
5MEP14Yellow
4MEP16Blue
3S8Green
6SSE23Green
Complete successful Martian orbit insertion for Mars Reconnaissance Orbiter (MRO).
5MEP2Green
None None
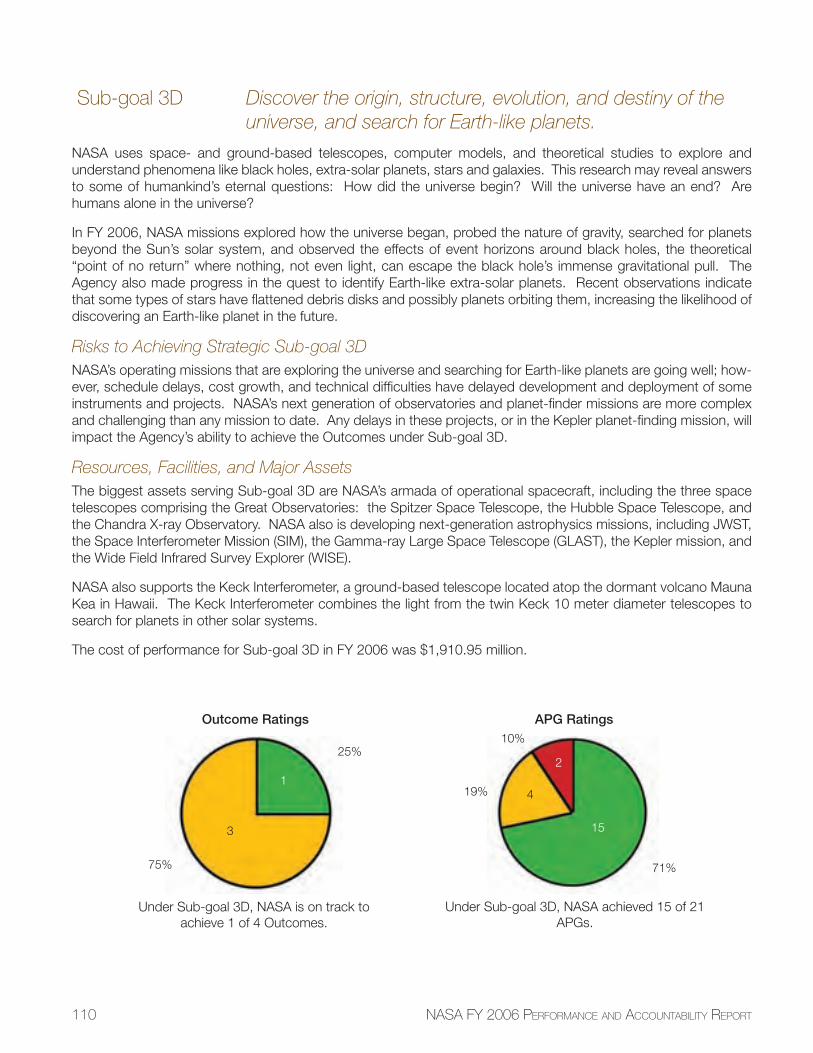
110 NASA FY 2006 PERFORMANCE AND ACCOUNTABILITY REPORT
Sub-goal 3D Discover the origin, structure, evolution, and destiny of the universe, and search for Earth-like planets.
NASA uses space- and ground-based telescopes, computer models, and theoretical studies to explore and understand phenomena like black holes, extra-solar planets, stars and galaxies. This research may reveal answers to some of humankind’s eternal questions: How did the universe begin? Will the universe have an end? Are humans alone in the universe?
In FY 2006, NASA missions explored how the universe began, probed the nature of gravity, searched for planets beyond the Sun’s solar system, and observed the effects of event horizons around black holes, the theoretical “point of no return” where nothing, not even light, can escape the black hole’s immense gravitational pull. The Agency also made progress in the quest to identify Earth-like extra-solar planets. Recent observations indicate that some types of stars have fl attened debris disks and possibly planets orbiting them, increasing the likelihood of discovering an Earth-like planet in the future.
Risks to Achieving Strategic Sub-goal 3DNASA’s operating missions that are exploring the universe and searching for Earth-like planets are going well; how-ever, schedule delays, cost growth, and technical diffi culties have delayed development and deployment of some instruments and projects. NASA’s next generation of observatories and planet-fi nder missions are more complex and challenging than any mission to date. Any delays in these projects, or in the Kepler planet-fi nding mission, will impact the Agency’s ability to achieve the Outcomes under Sub-goal 3D.
Resources, Facilities, and Major AssetsThe biggest assets serving Sub-goal 3D are NASA’s armada of operational spacecraft, including the three space telescopes comprising the Great Observatories: the Spitzer Space Telescope, the Hubble Space Telescope, and the Chandra X-ray Observatory. NASA also is developing next-generation astrophysics missions, including JWST, the Space Interferometer Mission (SIM), the Gamma-ray Large Space Telescope (GLAST), the Kepler mission, and the Wide Field Infrared Survey Explorer (WISE).
NASA also supports the Keck Interferometer, a ground-based telescope located atop the dormant volcano Mauna Kea in Hawaii. The Keck Interferometer combines the light from the twin Keck 10 meter diameter telescopes to search for planets in other solar systems.
The cost of performance for Sub-goal 3D in FY 2006 was $1,910.95 million.
Outcome Ratings
Under Sub-goal 3D, NASA is on track to achieve 1 of 4 Outcomes.
1
25%
APG Ratings
15
71%
Under Sub-goal 3D, NASA achieved 15 of 21 APGs.
10%
419%
3
75%
2
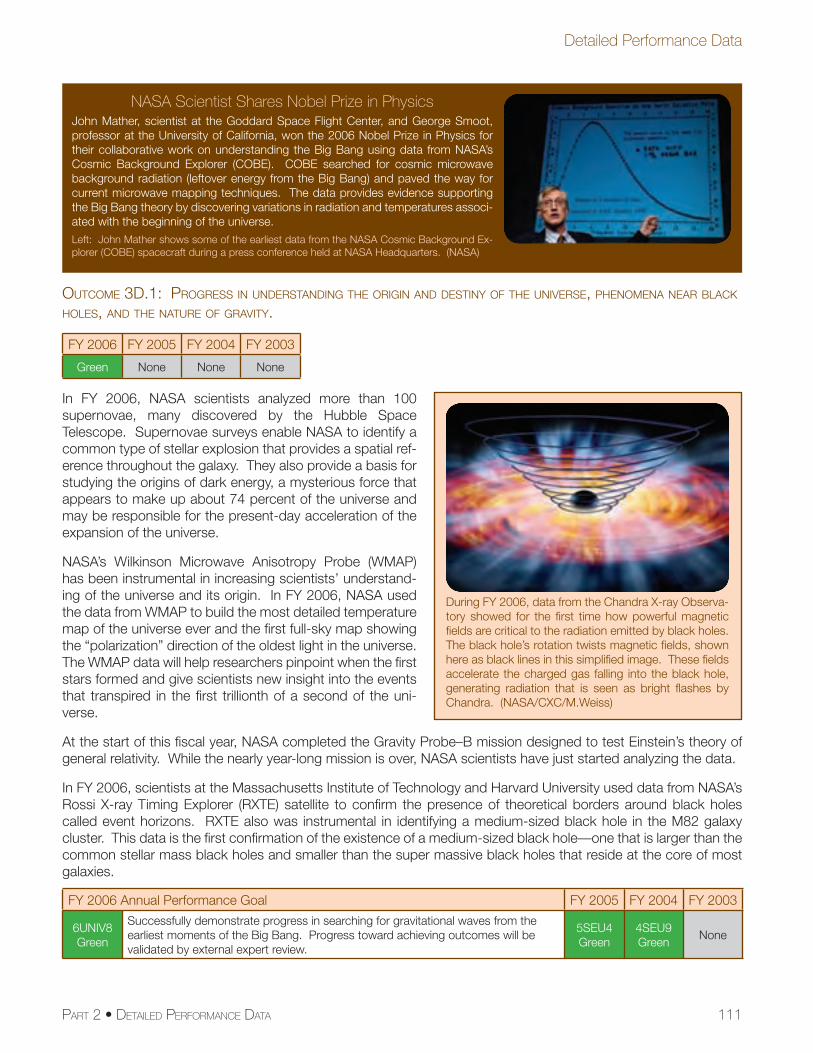
111
Detailed Performance Data
PART 2 • DETAILED PERFORMANCE DATA
OUTCOME 3D.1: PROGRESS IN UNDERSTANDING THE ORIGIN AND DESTINY OF THE UNIVERSE, PHENOMENA NEAR BLACK HOLES, AND THE NATURE OF GRAVITY.
FY 2006 FY 2005 FY 2004 FY 2003
Green None None None
In FY 2006, NASA scientists analyzed more than 100 supernovae, many discovered by the Hubble Space Telescope. Supernovae surveys enable NASA to identify a common type of stellar explosion that provides a spatial ref-erence throughout the galaxy. They also provide a basis for studying the origins of dark energy, a mysterious force that appears to make up about 74 percent of the universe and may be responsible for the present-day acceleration of the expansion of the universe.
NASA’s Wilkinson Microwave Anisotropy Probe (WMAP) has been instrumental in increasing scientists’ understand-ing of the universe and its origin. In FY 2006, NASA used the data from WMAP to build the most detailed temperature map of the universe ever and the fi rst full-sky map showing the “polarization” direction of the oldest light in the universe. The WMAP data will help researchers pinpoint when the fi rst stars formed and give scientists new insight into the events that transpired in the fi rst trillionth of a second of the uni-verse.
At the start of this fi scal year, NASA completed the Gravity Probe–B mission designed to test Einstein’s theory of general relativity. While the nearly year-long mission is over, NASA scientists have just started analyzing the data.
In FY 2006, scientists at the Massachusetts Institute of Technology and Harvard University used data from NASA’s Rossi X-ray Timing Explorer (RXTE) satellite to confi rm the presence of theoretical borders around black holes called event horizons. RXTE also was instrumental in identifying a medium-sized black hole in the M82 galaxy cluster. This data is the fi rst confi rmation of the existence of a medium-sized black hole—one that is larger than the common stellar mass black holes and smaller than the super massive black holes that reside at the core of most galaxies.
FY 2006 Annual Performance Goal FY 2005 FY 2004 FY 2003
6UNIV8Green
Successfully demonstrate progress in searching for gravitational waves from the earliest moments of the Big Bang. Progress toward achieving outcomes will be validated by external expert review.
5SEU4Green
4SEU9Green
None
During FY 2006, data from the Chandra X-ray Observa-tory showed for the fi rst time how powerful magnetic fi elds are critical to the radiation emitted by black holes. The black hole’s rotation twists magnetic fi elds, shown here as black lines in this simplifi ed image. These fi elds accelerate the charged gas falling into the black hole, generating radiation that is seen as bright fl ashes by Chandra. (NASA/CXC/M.Weiss)
NASA Scientist Shares Nobel Prize in PhysicsJohn Mather, scientist at the Goddard Space Flight Center, and George Smoot, professor at the University of California, won the 2006 Nobel Prize in Physics for their collaborative work on understanding the Big Bang using data from NASA’s Cosmic Background Explorer (COBE). COBE searched for cosmic microwave background radiation (leftover energy from the Big Bang) and paved the way for current microwave mapping techniques. The data provides evidence supporting the Big Bang theory by discovering variations in radiation and temperatures associ-ated with the beginning of the universe. Left: John Mather shows some of the earliest data from the NASA Cosmic Background Ex-plorer (COBE) spacecraft during a press conference held at NASA Headquarters. (NASA)
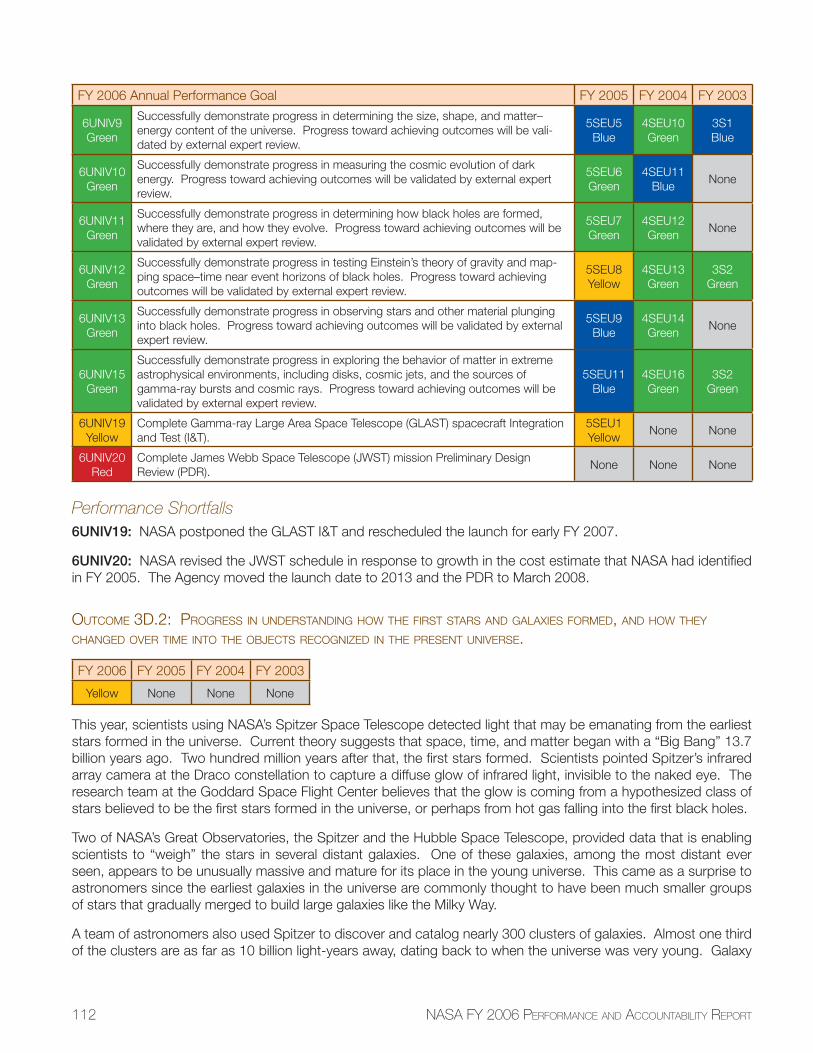
112 NASA FY 2006 PERFORMANCE AND ACCOUNTABILITY REPORT
FY 2006 Annual Performance Goal FY 2005 FY 2004 FY 2003
6UNIV9Green
Successfully demonstrate progress in determining the size, shape, and matter–energy content of the universe. Progress toward achieving outcomes will be vali-dated by external expert review.
5SEU5Blue
4SEU10Green
3S1Blue
6UNIV10Green
Successfully demonstrate progress in measuring the cosmic evolution of dark energy. Progress toward achieving outcomes will be validated by external expert review.
5SEU6Green
4SEU11Blue
None
6UNIV11Green
Successfully demonstrate progress in determining how black holes are formed, where they are, and how they evolve. Progress toward achieving outcomes will be validated by external expert review.
5SEU7Green
4SEU12Green
None
6UNIV12Green
Successfully demonstrate progress in testing Einstein’s theory of gravity and map-ping space–time near event horizons of black holes. Progress toward achieving outcomes will be validated by external expert review.
5SEU8Yellow
4SEU13Green
3S2Green
6UNIV13Green
Successfully demonstrate progress in observing stars and other material plunging into black holes. Progress toward achieving outcomes will be validated by external expert review.
5SEU9Blue
4SEU14Green
None
6UNIV15Green
Successfully demonstrate progress in exploring the behavior of matter in extreme astrophysical environments, including disks, cosmic jets, and the sources of gamma-ray bursts and cosmic rays. Progress toward achieving outcomes will be validated by external expert review.
5SEU11Blue
4SEU16Green
3S2Green
6UNIV19Yellow
Complete Gamma-ray Large Area Space Telescope (GLAST) spacecraft Integration and Test (I&T).
5SEU1Yellow
None None
6UNIV20Red
Complete James Webb Space Telescope (JWST) mission Preliminary Design Review (PDR).
None None None
Performance Shortfalls6UNIV19: NASA postponed the GLAST I&T and rescheduled the launch for early FY 2007.
6UNIV20: NASA revised the JWST schedule in response to growth in the cost estimate that NASA had identifi ed in FY 2005. The Agency moved the launch date to 2013 and the PDR to March 2008.
OUTCOME 3D.2: PROGRESS IN UNDERSTANDING HOW THE FIRST STARS AND GALAXIES FORMED, AND HOW THEY CHANGED OVER TIME INTO THE OBJECTS RECOGNIZED IN THE PRESENT UNIVERSE.
FY 2006 FY 2005 FY 2004 FY 2003
Yellow None None None
This year, scientists using NASA’s Spitzer Space Telescope detected light that may be emanating from the earliest stars formed in the universe. Current theory suggests that space, time, and matter began with a “Big Bang” 13.7 billion years ago. Two hundred million years after that, the fi rst stars formed. Scientists pointed Spitzer’s infrared array camera at the Draco constellation to capture a diffuse glow of infrared light, invisible to the naked eye. The research team at the Goddard Space Flight Center believes that the glow is coming from a hypothesized class of stars believed to be the fi rst stars formed in the universe, or perhaps from hot gas falling into the fi rst black holes.
Two of NASA’s Great Observatories, the Spitzer and the Hubble Space Telescope, provided data that is enabling scientists to “weigh” the stars in several distant galaxies. One of these galaxies, among the most distant ever seen, appears to be unusually massive and mature for its place in the young universe. This came as a surprise to astronomers since the earliest galaxies in the universe are commonly thought to have been much smaller groups of stars that gradually merged to build large galaxies like the Milky Way.
A team of astronomers also used Spitzer to discover and catalog nearly 300 clusters of galaxies. Almost one third of the clusters are as far as 10 billion light-years away, dating back to when the universe was very young. Galaxy
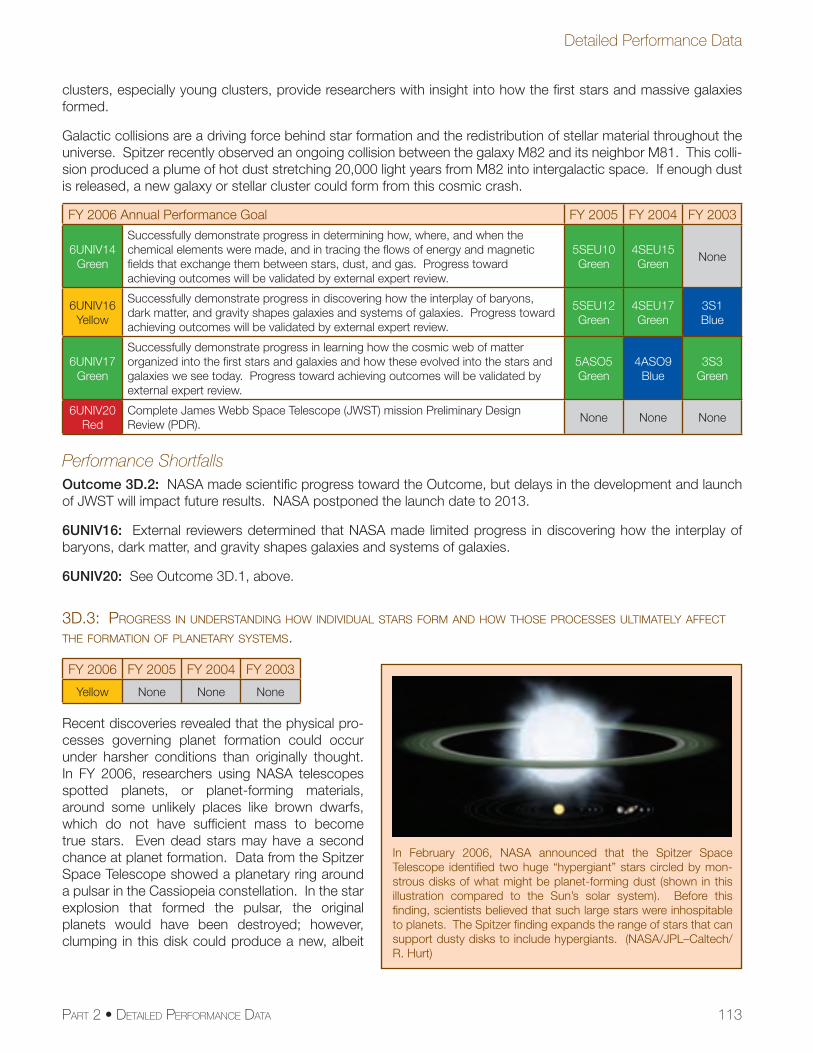
113
Detailed Performance Data
PART 2 • DETAILED PERFORMANCE DATA
clusters, especially young clusters, provide researchers with insight into how the fi rst stars and massive galaxies formed.
Galactic collisions are a driving force behind star formation and the redistribution of stellar material throughout the universe. Spitzer recently observed an ongoing collision between the galaxy M82 and its neighbor M81. This colli-sion produced a plume of hot dust stretching 20,000 light years from M82 into intergalactic space. If enough dust is released, a new galaxy or stellar cluster could form from this cosmic crash.
FY 2006 Annual Performance Goal FY 2005 FY 2004 FY 2003
6UNIV14Green
Successfully demonstrate progress in determining how, where, and when the chemical elements were made, and in tracing the fl ows of energy and magnetic fi elds that exchange them between stars, dust, and gas. Progress toward achieving outcomes will be validated by external expert review.
5SEU10Green
4SEU15Green
None
6UNIV16Yellow
Successfully demonstrate progress in discovering how the interplay of baryons, dark matter, and gravity shapes galaxies and systems of galaxies. Progress toward achieving outcomes will be validated by external expert review.
5SEU12Green
4SEU17Green
3S1Blue
6UNIV17Green
Successfully demonstrate progress in learning how the cosmic web of matter organized into the fi rst stars and galaxies and how these evolved into the stars and galaxies we see today. Progress toward achieving outcomes will be validated by external expert review.
5ASO5Green
4ASO9Blue
3S3Green
6UNIV20Red
Complete James Webb Space Telescope (JWST) mission Preliminary Design Review (PDR).
None None None
Performance ShortfallsOutcome 3D.2: NASA made scientifi c progress toward the Outcome, but delays in the development and launch of JWST will impact future results. NASA postponed the launch date to 2013.
6UNIV16: External reviewers determined that NASA made limited progress in discovering how the interplay of baryons, dark matter, and gravity shapes galaxies and systems of galaxies.
6UNIV20: See Outcome 3D.1, above.
3D.3: PROGRESS IN UNDERSTANDING HOW INDIVIDUAL STARS FORM AND HOW THOSE PROCESSES ULTIMATELY AFFECT THE FORMATION OF PLANETARY SYSTEMS.
FY 2006 FY 2005 FY 2004 FY 2003
Yellow None None None
Recent discoveries revealed that the physical pro-cesses governing planet formation could occur under harsher conditions than originally thought. In FY 2006, researchers using NASA telescopes spotted planets, or planet-forming materials, around some unlikely places like brown dwarfs, which do not have suffi cient mass to become true stars. Even dead stars may have a second chance at planet formation. Data from the Spitzer Space Telescope showed a planetary ring around a pulsar in the Cassiopeia constellation. In the star explosion that formed the pulsar, the original planets would have been destroyed; however, clumping in this disk could produce a new, albeit
In February 2006, NASA announced that the Spitzer Space Telescope identifi ed two huge “hypergiant” stars circled by mon-strous disks of what might be planet-forming dust (shown in this illustration compared to the Sun’s solar system). Before this fi nding, scientists believed that such large stars were inhospitable to planets. The Spitzer fi nding expands the range of stars that can support dusty disks to include hypergiants. (NASA/JPL–Caltech/R. Hurt)
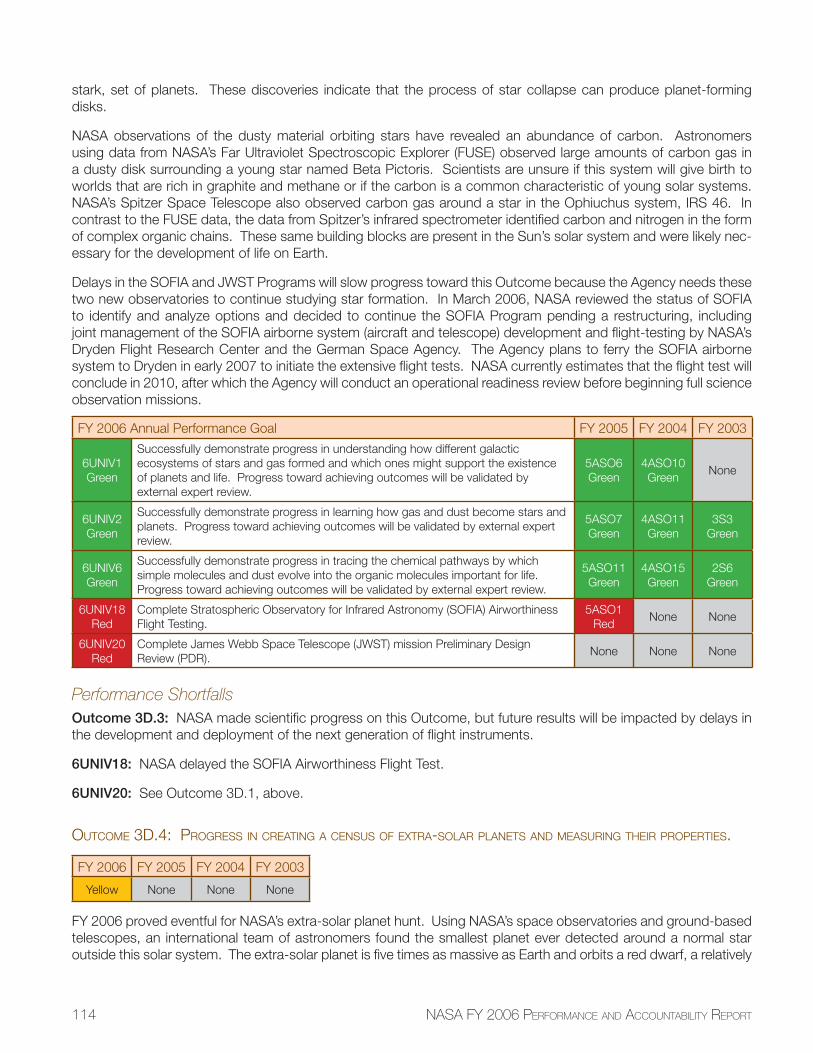
114 NASA FY 2006 PERFORMANCE AND ACCOUNTABILITY REPORT
stark, set of planets. These discoveries indicate that the process of star collapse can produce planet-forming disks.
NASA observations of the dusty material orbiting stars have revealed an abundance of carbon. Astronomers using data from NASA’s Far Ultraviolet Spectroscopic Explorer (FUSE) observed large amounts of carbon gas in a dusty disk surrounding a young star named Beta Pictoris. Scientists are unsure if this system will give birth to worlds that are rich in graphite and methane or if the carbon is a common characteristic of young solar systems. NASA’s Spitzer Space Telescope also observed carbon gas around a star in the Ophiuchus system, IRS 46. In contrast to the FUSE data, the data from Spitzer’s infrared spectrometer identifi ed carbon and nitrogen in the form of complex organic chains. These same building blocks are present in the Sun’s solar system and were likely nec-essary for the development of life on Earth.
Delays in the SOFIA and JWST Programs will slow progress toward this Outcome because the Agency needs these two new observatories to continue studying star formation. In March 2006, NASA reviewed the status of SOFIA to identify and analyze options and decided to continue the SOFIA Program pending a restructuring, including joint management of the SOFIA airborne system (aircraft and telescope) development and fl ight-testing by NASA’s Dryden Flight Research Center and the German Space Agency. The Agency plans to ferry the SOFIA airborne system to Dryden in early 2007 to initiate the extensive fl ight tests. NASA currently estimates that the fl ight test will conclude in 2010, after which the Agency will conduct an operational readiness review before beginning full science observation missions.
FY 2006 Annual Performance Goal FY 2005 FY 2004 FY 2003
6UNIV1Green
Successfully demonstrate progress in understanding how different galactic ecosystems of stars and gas formed and which ones might support the existence of planets and life. Progress toward achieving outcomes will be validated by external expert review.
5ASO6Green
4ASO10Green
None
6UNIV2Green
Successfully demonstrate progress in learning how gas and dust become stars and planets. Progress toward achieving outcomes will be validated by external expert review.
5ASO7Green
4ASO11Green
3S3Green
6UNIV6Green
Successfully demonstrate progress in tracing the chemical pathways by which simple molecules and dust evolve into the organic molecules important for life. Progress toward achieving outcomes will be validated by external expert review.
5ASO11Green
4ASO15Green
2S6Green
6UNIV18Red
Complete Stratospheric Observatory for Infrared Astronomy (SOFIA) Airworthiness Flight Testing.
5ASO1Red
None None
6UNIV20Red
Complete James Webb Space Telescope (JWST) mission Preliminary Design Review (PDR).
None None None
Performance ShortfallsOutcome 3D.3: NASA made scientifi c progress on this Outcome, but future results will be impacted by delays in the development and deployment of the next generation of fl ight instruments.
6UNIV18: NASA delayed the SOFIA Airworthiness Flight Test.
6UNIV20: See Outcome 3D.1, above.
OUTCOME 3D.4: PROGRESS IN CREATING A CENSUS OF EXTRA-SOLAR PLANETS AND MEASURING THEIR PROPERTIES.
FY 2006 FY 2005 FY 2004 FY 2003
Yellow None None None
FY 2006 proved eventful for NASA’s extra-solar planet hunt. Using NASA’s space observatories and ground-based telescopes, an international team of astronomers found the smallest planet ever detected around a normal star outside this solar system. The extra-solar planet is fi ve times as massive as Earth and orbits a red dwarf, a relatively
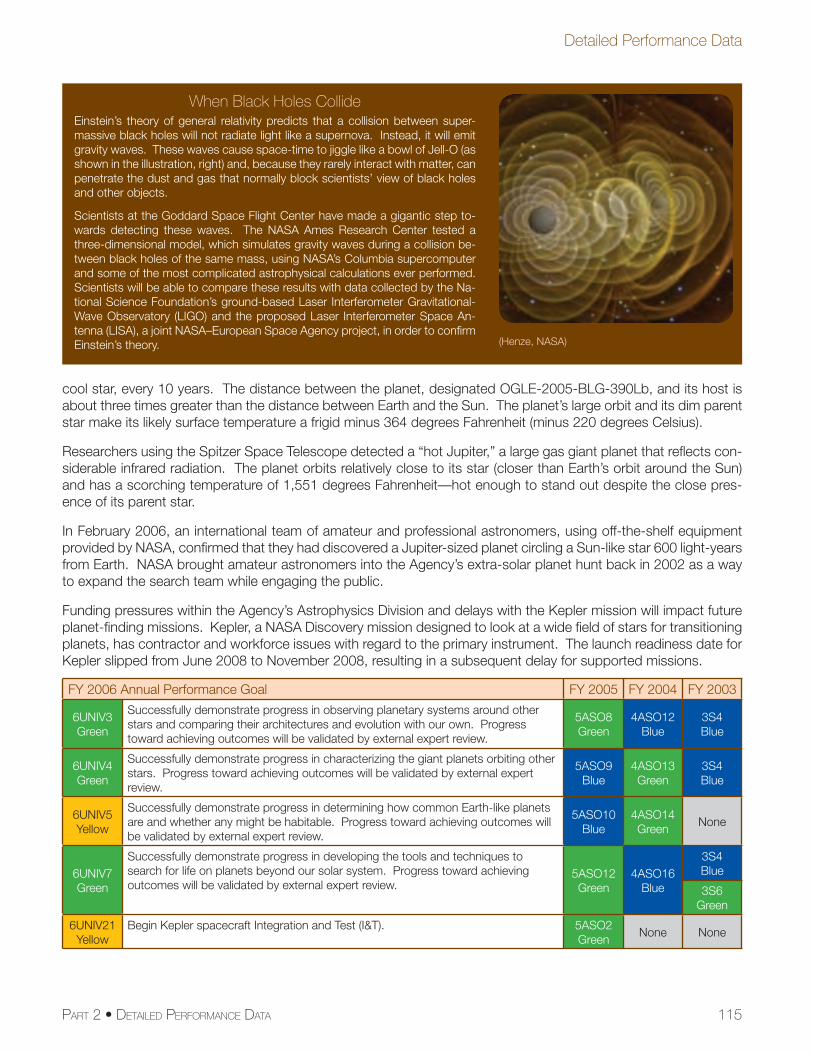
115
Detailed Performance Data
PART 2 • DETAILED PERFORMANCE DATA
cool star, every 10 years. The distance between the planet, designated OGLE-2005-BLG-390Lb, and its host is about three times greater than the distance between Earth and the Sun. The planet’s large orbit and its dim parent star make its likely surface temperature a frigid minus 364 degrees Fahrenheit (minus 220 degrees Celsius).
Researchers using the Spitzer Space Telescope detected a “hot Jupiter,” a large gas giant planet that refl ects con-siderable infrared radiation. The planet orbits relatively close to its star (closer than Earth’s orbit around the Sun) and has a scorching temperature of 1,551 degrees Fahrenheit—hot enough to stand out despite the close pres-ence of its parent star.
In February 2006, an international team of amateur and professional astronomers, using off-the-shelf equipment provided by NASA, confi rmed that they had discovered a Jupiter-sized planet circling a Sun-like star 600 light-years from Earth. NASA brought amateur astronomers into the Agency’s extra-solar planet hunt back in 2002 as a way to expand the search team while engaging the public.
Funding pressures within the Agency’s Astrophysics Division and delays with the Kepler mission will impact future planet-fi nding missions. Kepler, a NASA Discovery mission designed to look at a wide fi eld of stars for transitioning planets, has contractor and workforce issues with regard to the primary instrument. The launch readiness date for Kepler slipped from June 2008 to November 2008, resulting in a subsequent delay for supported missions.
FY 2006 Annual Performance Goal FY 2005 FY 2004 FY 2003
6UNIV3Green
Successfully demonstrate progress in observing planetary systems around other stars and comparing their architectures and evolution with our own. Progress toward achieving outcomes will be validated by external expert review.
5ASO8Green
4ASO12Blue
3S4Blue
6UNIV4Green
Successfully demonstrate progress in characterizing the giant planets orbiting other stars. Progress toward achieving outcomes will be validated by external expert review.
5ASO9Blue
4ASO13Green
3S4Blue
6UNIV5Yellow
Successfully demonstrate progress in determining how common Earth-like planets are and whether any might be habitable. Progress toward achieving outcomes will be validated by external expert review.
5ASO10Blue
4ASO14Green
None
6UNIV7Green
Successfully demonstrate progress in developing the tools and techniques to search for life on planets beyond our solar system. Progress toward achieving outcomes will be validated by external expert review.
5ASO12Green
4ASO16Blue
3S4Blue
3S6Green
6UNIV21Yellow
Begin Kepler spacecraft Integration and Test (I&T). 5ASO2Green
None None
When Black Holes CollideEinstein’s theory of general relativity predicts that a collision between super-massive black holes will not radiate light like a supernova. Instead, it will emit gravity waves. These waves cause space-time to jiggle like a bowl of Jell-O (as shown in the illustration, right) and, because they rarely interact with matter, can penetrate the dust and gas that normally block scientists’ view of black holes and other objects.
Scientists at the Goddard Space Flight Center have made a gigantic step to-wards detecting these waves. The NASA Ames Research Center tested a three-dimensional model, which simulates gravity waves during a collision be-tween black holes of the same mass, using NASA’s Columbia supercomputer and some of the most complicated astrophysical calculations ever performed. Scientists will be able to compare these results with data collected by the Na-tional Science Foundation’s ground-based Laser Interferometer Gravitational-Wave Observatory (LIGO) and the proposed Laser Interferometer Space An-tenna (LISA), a joint NASA–European Space Agency project, in order to confi rm Einstein’s theory. (Henze, NASA)
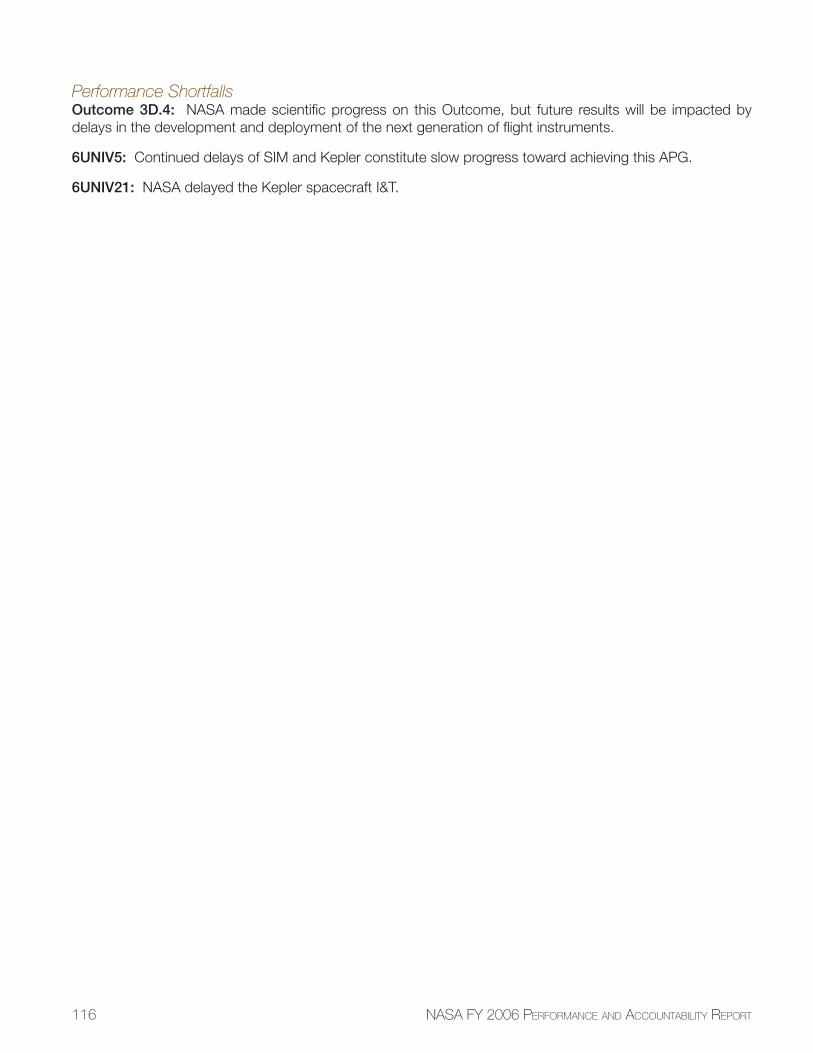
116 NASA FY 2006 PERFORMANCE AND ACCOUNTABILITY REPORT
Performance ShortfallsOutcome 3D.4: NASA made scientifi c progress on this Outcome, but future results will be impacted by delays in the development and deployment of the next generation of fl ight instruments.
6UNIV5: Continued delays of SIM and Kepler constitute slow progress toward achieving this APG.
6UNIV21: NASA delayed the Kepler spacecraft I&T.
117
Detailed Performance Data
PART 2 • DETAILED PERFORMANCE DATA
Sub-goal 3E Advance knowledge in the fundamental disciplines of aeronautics, and develop technologies for safer aircraft and higher capacity airspace systems.
NASA is the Nation’s leading government organization for aeronautical research. This world-class capability is built on a tradition of expertise in core disciplines like aerodynamics, acoustics, combustion, materials and struc-tures, and dynamics and control. NASA’s Aeronautics Research Mission Directorate conducts research that will enhance signifi cantly aircraft performance, environmental compatibility, and safety, and that will also enhance the capacity, fl exibility, and safety of the future air transportation system.
In FY 2006, NASA substantially restructured the Aeronautics Research Mission Directorate to focus on cutting-edge fundamental research and revolutionary capabilities that will benefi t NASA, other government agencies, the broad aeronautics community, and the Nation. As part of this restructuring, NASA created the following four new programs:
• The Fundamental Aeronautics Program develops system-level, multi-disciplinary capabilities in critical core areas of aeronautics technology for both civilian and military applications;
• The Aviation Safety Program develops principles, guidelines, concepts, tools, methods, and technologies to improve aviation safety;
• The Airspace Systems Program develops technologies, concepts, and capabilities for operational manage-ment of the National Airspace System and the aircraft that fl y within it; and
• The Aeronautics Test Program stewards the Agency’s key aeronautics test facilities, some of which are considered national assets.
Risks to Achieving Sub-goal 3ENASA identifi es highly challenging, cutting-edge aeronautics research goals which, by their nature, are inherently high risk. Even if each milestone is not met fully, the information NASA gains advances knowledge of aeronau-tics and helps the Agency make informed decisions to realign research to the appropriate areas. Redirection of resources to meet other national priorities is another major risk to NASA’s programs and schedules. Should this occur, the Aeronautics Research Mission Directorate will re-align program milestones and schedules as needed to respond to such changes.
The Fundamental Aeronautics, Aviation Safety, and Airspace Systems Programs partner with other government agencies, industry, and universities to meet program objectives. These partnerships provide many benefi ts, but also introduce external dependencies that could infl uence schedules and research output. The programs will miti-gate this risk through close coordination with these partners.
Resources, Major Facilities, and AssetsNASA maintains several national aeronautics research assets, including wind tunnels at the Ames, Glenn, and Langley Research Centers. Facilities like the Icing Research Tunnel, the 8-foot High Temperature Tunnel, and the Thermal/Acoustic Facility allow NASA and Agency partners to test aircraft under various conditions.
In addition to ground-based test and research facilities, NASA maintains a number of research aircraft, including F-15 and F-18 jets used to test new systems, icing research aircraft like the twin-engine turboprop Twin Otter, sub-sonic research aircraft like the twin turbo-fan Gulfstream III, and the C-17 transport aircraft. NASA houses most of these aircraft at the Dryden Flight Research Center, the Agency’s fl ight research and test hub.
The estimated cost of performance for Sub-goal 3E was $1,050.00 million.
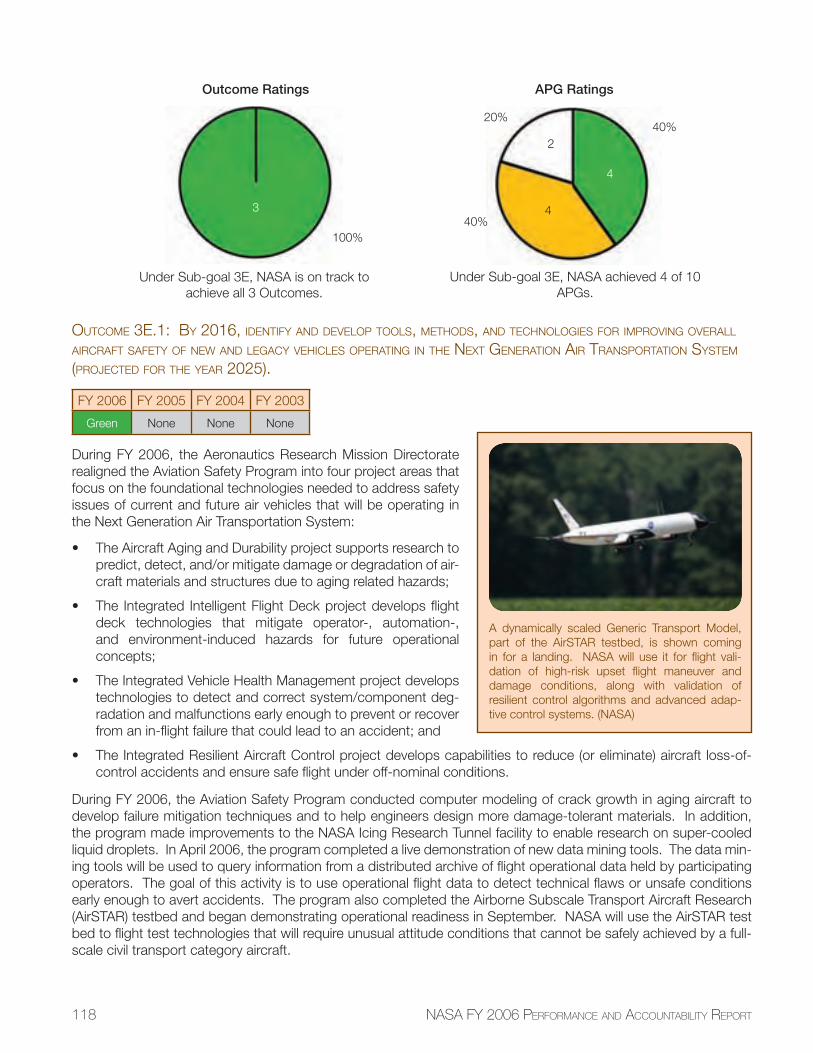
118 NASA FY 2006 PERFORMANCE AND ACCOUNTABILITY REPORT
OUTCOME 3E.1: BY 2016, IDENTIFY AND DEVELOP TOOLS, METHODS, AND TECHNOLOGIES FOR IMPROVING OVERALL AIRCRAFT SAFETY OF NEW AND LEGACY VEHICLES OPERATING IN THE NEXT GENERATION AIR TRANSPORTATION SYSTEM (PROJECTED FOR THE YEAR 2025).
FY 2006 FY 2005 FY 2004 FY 2003
Green None None None
During FY 2006, the Aeronautics Research Mission Directorate realigned the Aviation Safety Program into four project areas that focus on the foundational technologies needed to address safety issues of current and future air vehicles that will be operating in the Next Generation Air Transportation System:
• The Aircraft Aging and Durability project supports research to predict, detect, and/or mitigate damage or degradation of air-craft materials and structures due to aging related hazards;
• The Integrated Intelligent Flight Deck project develops fl ight deck technologies that mitigate operator-, automation-, and environment-induced hazards for future operational concepts;
• The Integrated Vehicle Health Management project develops technologies to detect and correct system/component deg-radation and malfunctions early enough to prevent or recover from an in-fl ight failure that could lead to an accident; and
• The Integrated Resilient Aircraft Control project develops capabilities to reduce (or eliminate) aircraft loss-of-control accidents and ensure safe fl ight under off-nominal conditions.
During FY 2006, the Aviation Safety Program conducted computer modeling of crack growth in aging aircraft to develop failure mitigation techniques and to help engineers design more damage-tolerant materials. In addition, the program made improvements to the NASA Icing Research Tunnel facility to enable research on super-cooled liquid droplets. In April 2006, the program completed a live demonstration of new data mining tools. The data min-ing tools will be used to query information from a distributed archive of fl ight operational data held by participating operators. The goal of this activity is to use operational fl ight data to detect technical fl aws or unsafe conditions early enough to avert accidents. The program also completed the Airborne Subscale Transport Aircraft Research (AirSTAR) testbed and began demonstrating operational readiness in September. NASA will use the AirSTAR test bed to fl ight test technologies that will require unusual attitude conditions that cannot be safely achieved by a full-scale civil transport category aircraft.
A dynamically scaled Generic Transport Model, part of the AirSTAR testbed, is shown coming in for a landing. NASA will use it for fl ight vali-dation of high-risk upset fl ight maneuver and damage conditions, along with validation of resilient control algorithms and advanced adap-tive control systems. (NASA)
Outcome Ratings
Under Sub-goal 3E, NASA is on track to achieve all 3 Outcomes.
3
APG Ratings
4
40%
Under Sub-goal 3E, NASA achieved 4 of 10 APGs.
20%
440%
100%
2
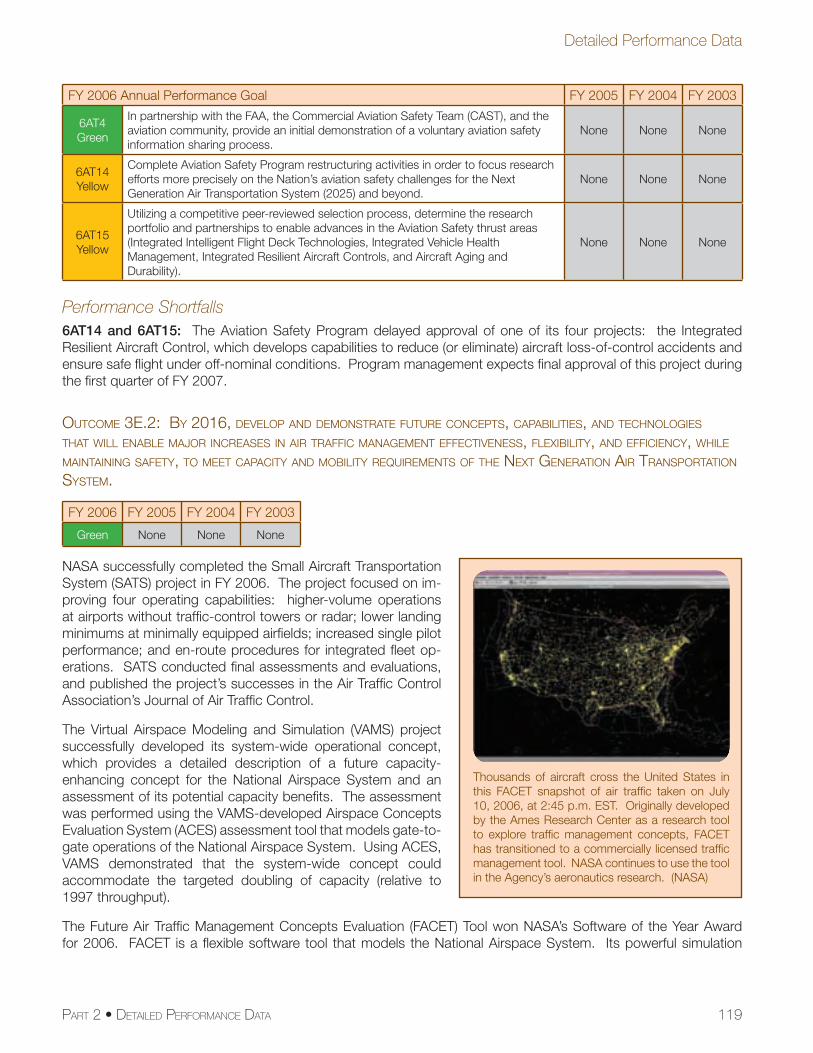
119
Detailed Performance Data
PART 2 • DETAILED PERFORMANCE DATA
FY 2006 Annual Performance Goal FY 2005 FY 2004 FY 2003
6AT4Green
In partnership with the FAA, the Commercial Aviation Safety Team (CAST), and the aviation community, provide an initial demonstration of a voluntary aviation safety information sharing process.
None None None
6AT14Yellow
Complete Aviation Safety Program restructuring activities in order to focus research efforts more precisely on the Nation’s aviation safety challenges for the Next Generation Air Transportation System (2025) and beyond.
None None None
6AT15Yellow
Utilizing a competitive peer-reviewed selection process, determine the research portfolio and partnerships to enable advances in the Aviation Safety thrust areas (Integrated Intelligent Flight Deck Technologies, Integrated Vehicle Health Management, Integrated Resilient Aircraft Controls, and Aircraft Aging and Durability).
None None None
Performance Shortfalls6AT14 and 6AT15: The Aviation Safety Program delayed approval of one of its four projects: the Integrated Resilient Aircraft Control, which develops capabilities to reduce (or eliminate) aircraft loss-of-control accidents and ensure safe fl ight under off-nominal conditions. Program management expects fi nal approval of this project during the fi rst quarter of FY 2007.
OUTCOME 3E.2: BY 2016, DEVELOP AND DEMONSTRATE FUTURE CONCEPTS, CAPABILITIES, AND TECHNOLOGIES THAT WILL ENABLE MAJOR INCREASES IN AIR TRAFFIC MANAGEMENT EFFECTIVENESS, FLEXIBILITY, AND EFFICIENCY, WHILE MAINTAINING SAFETY, TO MEET CAPACITY AND MOBILITY REQUIREMENTS OF THE NEXT GENERATION AIR TRANSPORTATION SYSTEM.
FY 2006 FY 2005 FY 2004 FY 2003
Green None None None
NASA successfully completed the Small Aircraft Transportation System (SATS) project in FY 2006. The project focused on im-proving four operating capabilities: higher-volume operations at airports without traffi c-control towers or radar; lower landing minimums at minimally equipped airfi elds; increased single pilot performance; and en-route procedures for integrated fl eet op-erations. SATS conducted fi nal assessments and evaluations, and published the project’s successes in the Air Traffi c Control Association’s Journal of Air Traffi c Control.
The Virtual Airspace Modeling and Simulation (VAMS) project successfully developed its system-wide operational concept, which provides a detailed description of a future capacity-enhancing concept for the National Airspace System and an assessment of its potential capacity benefi ts. The assessment was performed using the VAMS-developed Airspace Concepts Evaluation System (ACES) assessment tool that models gate-to-gate operations of the National Airspace System. Using ACES, VAMS demonstrated that the system-wide concept could accommodate the targeted doubling of capacity (relative to 1997 throughput).
The Future Air Traffi c Management Concepts Evaluation (FACET) Tool won NASA’s Software of the Year Award for 2006. FACET is a fl exible software tool that models the National Airspace System. Its powerful simulation
Thousands of aircraft cross the United States in this FACET snapshot of air traffi c taken on July 10, 2006, at 2:45 p.m. EST. Originally developed by the Ames Research Center as a research tool to explore traffi c management concepts, FACET has transitioned to a commercially licensed traffi c management tool. NASA continues to use the tool in the Agency’s aeronautics research. (NASA)
120 NASA FY 2006 PERFORMANCE AND ACCOUNTABILITY REPORT
capabilities can rapidly generate thousands of aircraft trajectories to enable effi cient planning of traffi c fl ows at the national level.
NASA restructured the Airspace Systems Program to align research efforts with the Joint Planning and Development Offi ce’s Next Generation Air Transportation System (NGATS) goals for 2025. (The Joint Planning and Development Offi ce is a collaboration among government agencies, industry, and the public sector to plan and enable NGATS.) NASA identifi ed major research thrust areas: the NGATS Air Traffi c Management Airspace project and the NGATS Air Traffi c Management Airportal project. The program focuses on fi nding technological solutions for automated air traffi c management as a step toward creating a safe, effi cient, high-capacity, and integrated NGATS.
FY 2006 Annual Performance Goal FY 2005 FY 2004 FY 2003
6AT7Green
Successfully complete the SATS integrated technology demonstration and fi nal assessment.
None None None
6AT16Yellow
Complete Airspace Systems Program restructuring activities in order to align research efforts to address the Joint Planning and Development Offi ce’s Next Generation Air Transportation System (NGATS) capability requirements for 2025.
None None None
6AT17Yellow
Utilizing a competitive peer-reviewed selection process, determine the research portfolio and partnerships to enable advances in the Airspace Systems thrust areas (Next Generation Air Transportation Systems and Super Density Surface Management).
None None None
Performance Shortfalls6AT16 and 6AT17: The Airspace Systems Program delayed approval of a portion of its project portfolio (the NGATS Air Traffi c Management Airportal project) that will develop capabilities to increase throughput in terminal and airport domains enabling NGATS. Program management expects fi nal approval of this project, including its peer-reviewed research portfolio and partnerships, during the fi rst quarter of FY 2007.
OUTCOME 3E.3: BY 2016, DEVELOP MULTIDISCIPLINARY DESIGN, ANALYSIS, AND OPTIMIZATION CAPABILITIES FOR USE IN TRADE STUDIES OF NEW TECHNOLOGIES, ENABLING BETTER QUANTIFICATION OF VEHICLE PERFORMANCE IN ALL FLIGHT REGIMES AND WITHIN A VARIETY OF TRANSPORTATION SYSTEM ARCHITECTURES.
FY 2006 FY 2005 FY 2004 FY 2003
Green None None None
The Fundamental Aeronautics Program is focusing on long-term investments in cutting-edge fundamental research in traditional aeronautics disciplines. The key objectives guiding this new focus are to re-establish NASA’s com-mitment to mastering the fundamental technology of subsonic (rotary and fi xed wing), supersonic, and hypersonic fl ight, and to focus NASA’s unique research capabilities in areas that have the potential to expand the capabilities of future aircraft for the greatest national benefi t (e.g., higher performance, lower noise, and reduced emissions). All four projects within the program had signifi cant accomplishments, including those listed below.
The Rotary Wing project conducted a helicopter fl ight test to provide data for rotorcraft acoustic analysis validation and to develop low-noise fl ight profi les. NASA conducted the test with project partners: the U.S. Army, the Center for Rotorcraft Innovation, Bell Helicopter, and the University of Maryland. The project team will use the results of these tests to validate advanced prediction models that can be used for future design exercises.
NASA’s Fixed Wing project, in collaboration with Pratt & Whitney, completed the design of geared turbofan compo-nents. Based on studies, the project partners selected a design—a low fan-pressure-ratio geared turbofan with a lightweight Variable Area Fan Nozzle—that reduces both noise and emissions relative to current engines.
The Supersonics project completed an initial study of the impact of atmospheric turbulence on very-low-noise sonic boom waveforms. NASA used F-18 aircraft, fl ying a specially designed fl ight profi le, to generate the booms,
121
Detailed Performance Data
PART 2 • DETAILED PERFORMANCE DATA
which occur when aircraft fl y faster than the speed of sound. NASA recorded indoor and outdoor waveform shapes, noise levels, and building vibration data for use in model validation studies. This research will help project engineers develop ways to reduce the sonic-boom noise produced by supersonic aircraft.
The Hypersonics project completed the Mach 5 testing of the Ground Demonstration Engine–2 in the NASA 8-Foot High Temperature Tunnel. NASA teamed with the Air Force Research Laboratory and Pratt & Whitney Rocketdyne to complete the tests. The NASA tests marked the fi rst time a closed-loop, hydrocarbon-fueled, fuel-cooled scramjet was tested at hypersonic conditions. Fuel cooling of the scramjet is essential for the hardware to survive the temperatures found in hypersonics fl ight.
FY 2006 Annual Performance Goal FY 2005 FY 2004 FY 2003
6AT8White
Identify and document engine confi guration and noise reduction technologies needed to enable 10 dB reduction in aircraft system noise. (APG revised based on FY06 Appropriation.)
5AT4Green
None None
6AT11White
Complete trade study of unconventional propulsion concepts for a zero-emissions vehicle.
None None None
6AT18Green
Complete Fundamental Aeronautics Program restructuring activities in order to focus efforts on fundamental research to develop physics-based multidisciplinary design, analysis, and optimization tools.
None None None
6AT19Green
Utilizing a competitive peer-reviewed selection process, determine the research portfolio and partnerships to enable advances in the Fundamental Aeronautics thrust areas (fi xed wing, rotary wing, supersonics, and hypersonics).
None None None
Performance Shortfalls6AT8 and 6AT11: NASA canceled these APGs because they no longer aligned with the Agency’s aeronautics research goals.
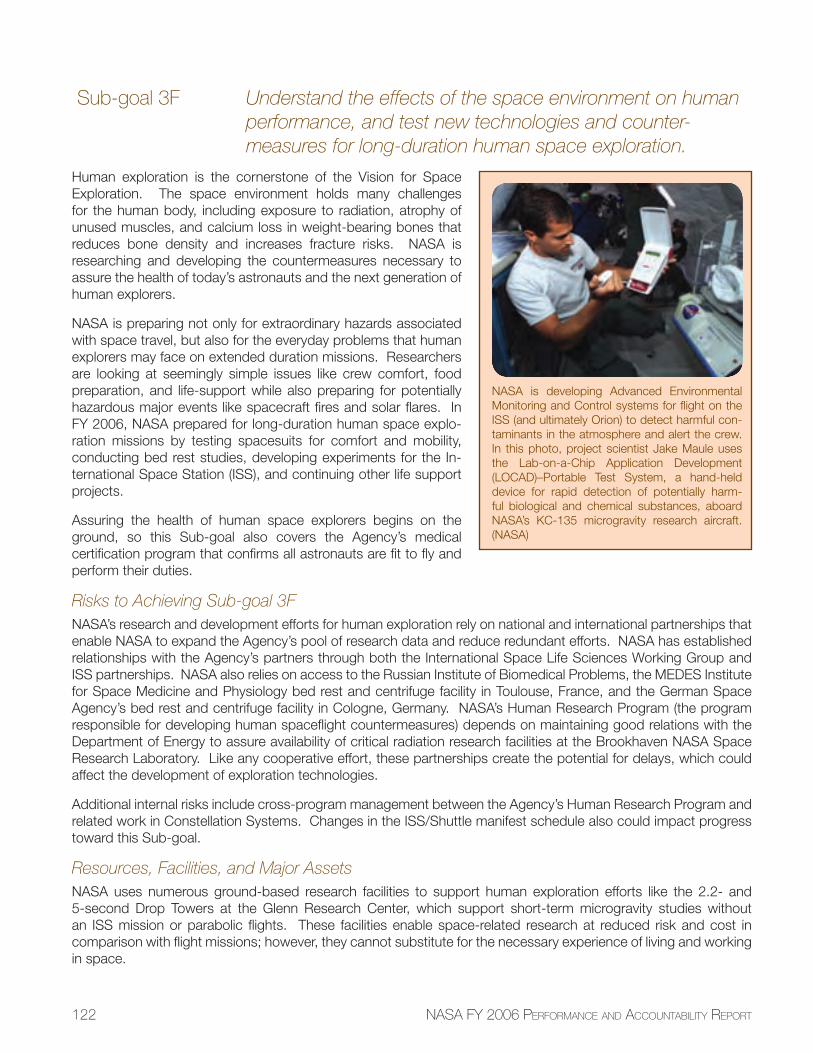
122 NASA FY 2006 PERFORMANCE AND ACCOUNTABILITY REPORT
Sub-goal 3F Understand the effects of the space environment on human performance, and test new technologies and counter-measures for long-duration human space exploration.
Human exploration is the cornerstone of the Vision for Space Exploration. The space environment holds many challenges for the human body, including exposure to radiation, atrophy of unused muscles, and calcium loss in weight-bearing bones that reduces bone density and increases fracture risks. NASA is researching and developing the countermeasures necessary to assure the health of today’s astronauts and the next generation of human explorers.
NASA is preparing not only for extraordinary hazards associated with space travel, but also for the everyday problems that human explorers may face on extended duration missions. Researchers are looking at seemingly simple issues like crew comfort, food preparation, and life-support while also preparing for potentially hazardous major events like spacecraft fi res and solar fl ares. In FY 2006, NASA prepared for long-duration human space explo-ration missions by testing spacesuits for comfort and mobility, conducting bed rest studies, developing experiments for the In-ternational Space Station (ISS), and continuing other life support projects.
Assuring the health of human space explorers begins on the ground, so this Sub-goal also covers the Agency’s medical certifi cation program that confi rms all astronauts are fi t to fl y and perform their duties.
Risks to Achieving Sub-goal 3FNASA’s research and development efforts for human exploration rely on national and international partnerships that enable NASA to expand the Agency’s pool of research data and reduce redundant efforts. NASA has established relationships with the Agency’s partners through both the International Space Life Sciences Working Group and ISS partnerships. NASA also relies on access to the Russian Institute of Biomedical Problems, the MEDES Institute for Space Medicine and Physiology bed rest and centrifuge facility in Toulouse, France, and the German Space Agency’s bed rest and centrifuge facility in Cologne, Germany. NASA’s Human Research Program (the program responsible for developing human spacefl ight countermeasures) depends on maintaining good relations with the Department of Energy to assure availability of critical radiation research facilities at the Brookhaven NASA Space Research Laboratory. Like any cooperative effort, these partnerships create the potential for delays, which could affect the development of exploration technologies.
Additional internal risks include cross-program management between the Agency’s Human Research Program and related work in Constellation Systems. Changes in the ISS/Shuttle manifest schedule also could impact progress toward this Sub-goal.
Resources, Facilities, and Major AssetsNASA uses numerous ground-based research facilities to support human exploration efforts like the 2.2- and 5-second Drop Towers at the Glenn Research Center, which support short-term microgravity studies without an ISS mission or parabolic fl ights. These facilities enable space-related research at reduced risk and cost in comparison with fl ight missions; however, they cannot substitute for the necessary experience of living and working in space.
NASA is developing Advanced Environmental Monitoring and Control systems for fl ight on the ISS (and ultimately Orion) to detect harmful con-taminants in the atmosphere and alert the crew. In this photo, project scientist Jake Maule uses the Lab-on-a-Chip Application Development (LOCAD)–Portable Test System, a hand-held device for rapid detection of potentially harm-ful biological and chemical substances, aboard NASA’s KC-135 microgravity research aircraft. (NASA)
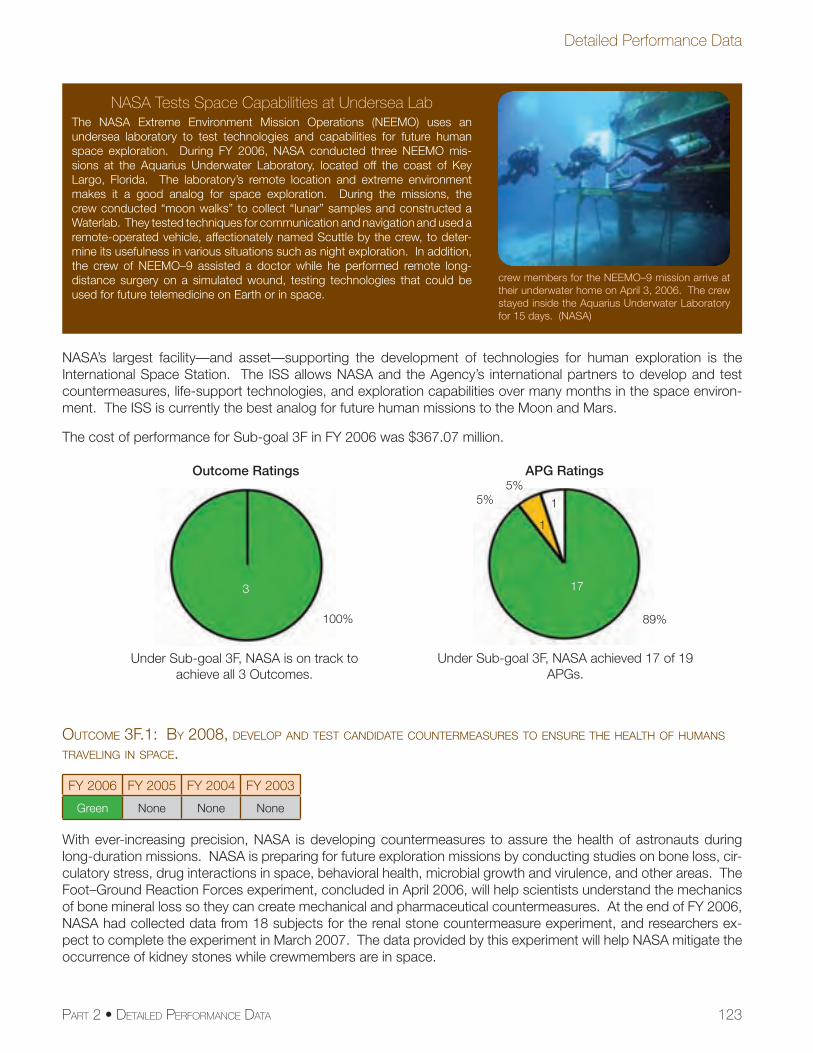
123
Detailed Performance Data
PART 2 • DETAILED PERFORMANCE DATA
NASA’s largest facility—and asset—supporting the development of technologies for human exploration is the International Space Station. The ISS allows NASA and the Agency’s international partners to develop and test countermeasures, life-support technologies, and exploration capabilities over many months in the space environ-ment. The ISS is currently the best analog for future human missions to the Moon and Mars.
The cost of performance for Sub-goal 3F in FY 2006 was $367.07 million.
OUTCOME 3F.1: BY 2008, DEVELOP AND TEST CANDIDATE COUNTERMEASURES TO ENSURE THE HEALTH OF HUMANS TRAVELING IN SPACE.
FY 2006 FY 2005 FY 2004 FY 2003
Green None None None
With ever-increasing precision, NASA is developing countermeasures to assure the health of astronauts during long-duration missions. NASA is preparing for future exploration missions by conducting studies on bone loss, cir-culatory stress, drug interactions in space, behavioral health, microbial growth and virulence, and other areas. The Foot–Ground Reaction Forces experiment, concluded in April 2006, will help scientists understand the mechanics of bone mineral loss so they can create mechanical and pharmaceutical countermeasures. At the end of FY 2006, NASA had collected data from 18 subjects for the renal stone countermeasure experiment, and researchers ex-pect to complete the experiment in March 2007. The data provided by this experiment will help NASA mitigate the occurrence of kidney stones while crewmembers are in space.
NASA Tests Space Capabilities at Undersea LabThe NASA Extreme Environment Mission Operations (NEEMO) uses an undersea laboratory to test technologies and capabilities for future human space exploration. During FY 2006, NASA conducted three NEEMO mis-sions at the Aquarius Underwater Laboratory, located off the coast of Key Largo, Florida. The laboratory’s remote location and extreme environment makes it a good analog for space exploration. During the missions, the crew conducted “moon walks” to collect “lunar” samples and constructed a Waterlab. They tested techniques for communication and navigation and used a remote-operated vehicle, affectionately named Scuttle by the crew, to deter-mine its usefulness in various situations such as night exploration. In addition, the crew of NEEMO–9 assisted a doctor while he performed remote long-distance surgery on a simulated wound, testing technologies that could be used for future telemedicine on Earth or in space.
crew members for the NEEMO–9 mission arrive at their underwater home on April 3, 2006. The crew stayed inside the Aquarius Underwater Laboratory for 15 days. (NASA)
Outcome Ratings
Under Sub-goal 3F, NASA is on track to achieve all 3 Outcomes.
3
APG Ratings
17
89%
Under Sub-goal 3F, NASA achieved 17 of 19 APGs.
5%5%
100%
1
1
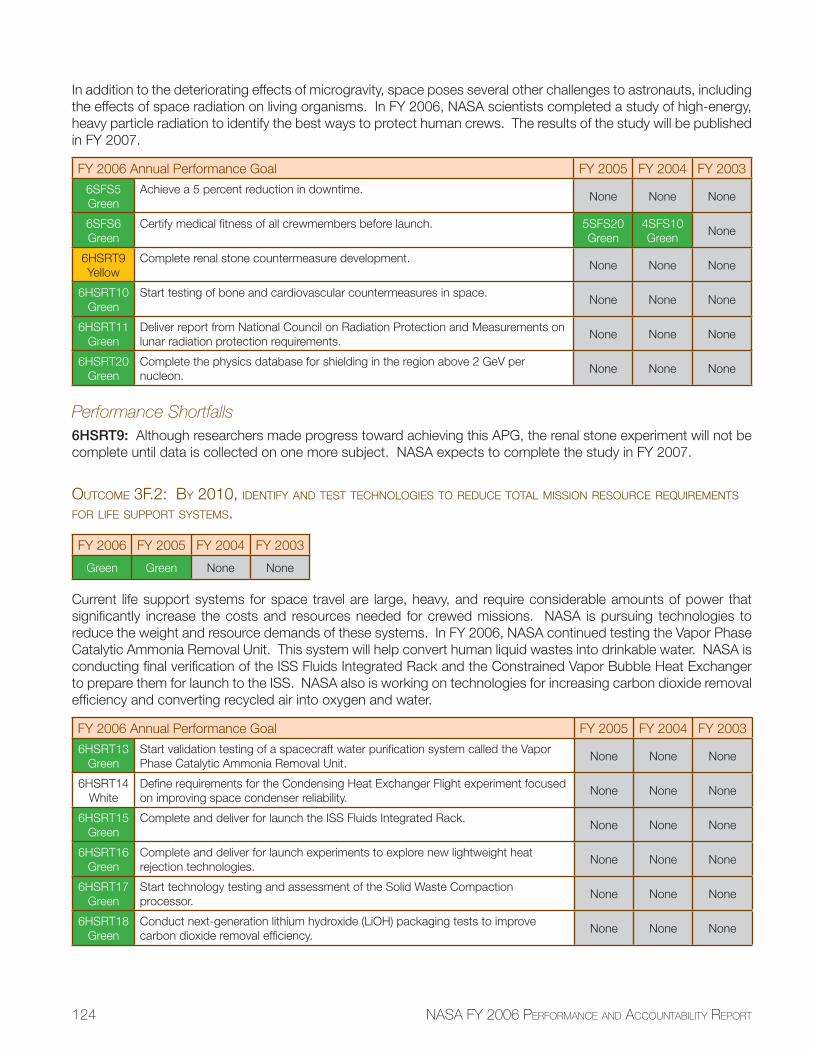
124 NASA FY 2006 PERFORMANCE AND ACCOUNTABILITY REPORT
In addition to the deteriorating effects of microgravity, space poses several other challenges to astronauts, including the effects of space radiation on living organisms. In FY 2006, NASA scientists completed a study of high-energy, heavy particle radiation to identify the best ways to protect human crews. The results of the study will be published in FY 2007.
FY 2006 Annual Performance Goal FY 2005 FY 2004 FY 2003
6SFS5Green
Achieve a 5 percent reduction in downtime.None None None
6SFS6Green
Certify medical fi tness of all crewmembers before launch. 5SFS20Green
4SFS10Green
None
6HSRT9Yellow
Complete renal stone countermeasure development.None None None
6HSRT10Green
Start testing of bone and cardiovascular countermeasures in space.None None None
6HSRT11Green
Deliver report from National Council on Radiation Protection and Measurements on lunar radiation protection requirements.
None None None
6HSRT20Green
Complete the physics database for shielding in the region above 2 GeV per nucleon.
None None None
Performance Shortfalls6HSRT9: Although researchers made progress toward achieving this APG, the renal stone experiment will not be complete until data is collected on one more subject. NASA expects to complete the study in FY 2007.
OUTCOME 3F.2: BY 2010, IDENTIFY AND TEST TECHNOLOGIES TO REDUCE TOTAL MISSION RESOURCE REQUIREMENTS FOR LIFE SUPPORT SYSTEMS.
FY 2006 FY 2005 FY 2004 FY 2003
Green Green None None
Current life support systems for space travel are large, heavy, and require considerable amounts of power that signifi cantly increase the costs and resources needed for crewed missions. NASA is pursuing technologies to reduce the weight and resource demands of these systems. In FY 2006, NASA continued testing the Vapor Phase Catalytic Ammonia Removal Unit. This system will help convert human liquid wastes into drinkable water. NASA is conducting fi nal verifi cation of the ISS Fluids Integrated Rack and the Constrained Vapor Bubble Heat Exchanger to prepare them for launch to the ISS. NASA also is working on technologies for increasing carbon dioxide removal effi ciency and converting recycled air into oxygen and water.
FY 2006 Annual Performance Goal FY 2005 FY 2004 FY 2003
6HSRT13Green
Start validation testing of a spacecraft water purifi cation system called the Vapor Phase Catalytic Ammonia Removal Unit.
None None None
6HSRT14White
Defi ne requirements for the Condensing Heat Exchanger Flight experiment focused on improving space condenser reliability.
None None None
6HSRT15Green
Complete and deliver for launch the ISS Fluids Integrated Rack.None None None
6HSRT16Green
Complete and deliver for launch experiments to explore new lightweight heat rejection technologies.
None None None
6HSRT17Green
Start technology testing and assessment of the Solid Waste Compaction processor.
None None None
6HSRT18Green
Conduct next-generation lithium hydroxide (LiOH) packaging tests to improve carbon dioxide removal effi ciency.
None None None
125
Detailed Performance Data
PART 2 • DETAILED PERFORMANCE DATA
FY 2006 Annual Performance Goal FY 2005 FY 2004 FY 2003
6HSRT19Green
Conduct ground testing of the Sabatier unit to demonstrate reliability in recovering oxygen and water from carbon dioxide.
None None None
Performance Shortfalls6HSRT14: NASA canceled the Condensing Heat Exchanger Flight experiment.
OUTCOME 3F.3: BY 2010, DEVELOP RELIABLE SPACECRAFT TECHNOLOGIES FOR ADVANCED ENVIRONMENTAL MONITORING AND CONTROL AND FIRE SAFETY.
FY 2006 FY 2005 FY 2004 FY 2003
Green None None None
Fires, air quality, and environmental monitoring are signifi cant challenges in the high oxygen environment and close quarters of a spacecraft. To mitigate these risks, NASA is developing technologies to monitor cabin air quality and water quality and to improve ways to detect and extinguish fi res. Technologies under development in FY 2006 included the Vehicle Cabin Air Monitoring System, a hand-held water monitoring system, and advanced smoke detection tools using data from the Dust and Aerosol Measurement Feasibility Tests experiment fl own on the ISS. In addition, the Droplet Flame Extinguishment Experiment and the ISS Combustion Integrated Rack are undergoing fi nal verifi cation for fl ight and installation on the ISS. This equipment will enable further combustion and fi re sup-pression experiments in microgravity.
FY 2006 Annual Performance Goal FY 2005 FY 2004 FY 2003
6HSRT3Green
Demonstrate the ability of the advanced spacecraft air monitoring system to detect 90 percent of the high-priority air contaminants in ground testing.
None None None
6HSRT4Green
Demonstrate the ability of the hand-held water monitoring system to detect space-craft water biocides and high-priority metal contaminants in ground testing.
None None None
6HSRT5Green
Support development of a new generation of reliable spacecraft smoke detectors by fi nishing measurements of ISS background particulates using the DAFT experi-ment and delivering for launch the Smoke and Aerosol Measurement Experiment (SAME).
None None None
6HSRT6Green
Complete and deliver for launch the ISS Combustion Integrated Rack (CIR).None None None
6HSRT7Green
Complete and deliver for launch the Droplet Flame Extinguishment in Microgravity Experiment aimed at quantifying fi re suppressant effectiveness.
None None None
6HSRT8Green
Develop a revised space materials fl ammability characterization test method and update NASA-STD-6001 accordingly.
None None None
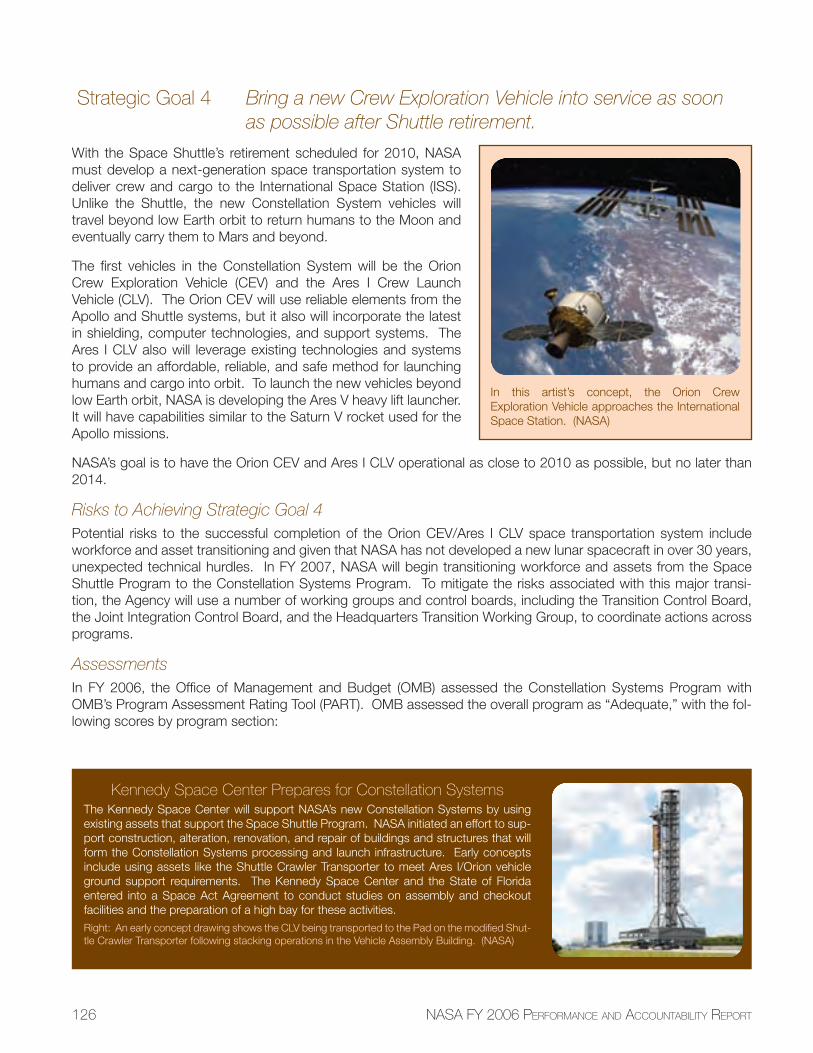
126 NASA FY 2006 PERFORMANCE AND ACCOUNTABILITY REPORT
Strategic Goal 4 Bring a new Crew Exploration Vehicle into service as soon as possible after Shuttle retirement.
With the Space Shuttle’s retirement scheduled for 2010, NASA must develop a next-generation space transportation system to deliver crew and cargo to the International Space Station (ISS). Unlike the Shuttle, the new Constellation System vehicles will travel beyond low Earth orbit to return humans to the Moon and eventually carry them to Mars and beyond.
The fi rst vehicles in the Constellation System will be the Orion Crew Exploration Vehicle (CEV) and the Ares I Crew Launch Vehicle (CLV). The Orion CEV will use reliable elements from the Apollo and Shuttle systems, but it also will incorporate the latest in shielding, computer technologies, and support systems. The Ares I CLV also will leverage existing technologies and systems to provide an affordable, reliable, and safe method for launching humans and cargo into orbit. To launch the new vehicles beyond low Earth orbit, NASA is developing the Ares V heavy lift launcher. It will have capabilities similar to the Saturn V rocket used for the Apollo missions.
NASA’s goal is to have the Orion CEV and Ares I CLV operational as close to 2010 as possible, but no later than 2014.
Risks to Achieving Strategic Goal 4Potential risks to the successful completion of the Orion CEV/Ares I CLV space transportation system include workforce and asset transitioning and given that NASA has not developed a new lunar spacecraft in over 30 years, unexpected technical hurdles. In FY 2007, NASA will begin transitioning workforce and assets from the Space Shuttle Program to the Constellation Systems Program. To mitigate the risks associated with this major transi-tion, the Agency will use a number of working groups and control boards, including the Transition Control Board, the Joint Integration Control Board, and the Headquarters Transition Working Group, to coordinate actions across programs.
AssessmentsIn FY 2006, the Offi ce of Management and Budget (OMB) assessed the Constellation Systems Program with OMB’s Program Assessment Rating Tool (PART). OMB assessed the overall program as “Adequate,” with the fol-lowing scores by program section:
In this artist’s concept, the Orion Crew Exploration Vehicle approaches the International Space Station. (NASA)
Kennedy Space Center Prepares for Constellation SystemsThe Kennedy Space Center will support NASA’s new Constellation Systems by using existing assets that support the Space Shuttle Program. NASA initiated an effort to sup-port construction, alteration, renovation, and repair of buildings and structures that will form the Constellation Systems processing and launch infrastructure. Early concepts include using assets like the Shuttle Crawler Transporter to meet Ares I/Orion vehicle ground support requirements. The Kennedy Space Center and the State of Florida entered into a Space Act Agreement to conduct studies on assembly and checkout facilities and the preparation of a high bay for these activities.Right: An early concept drawing shows the CLV being transported to the Pad on the modifi ed Shut-tle Crawler Transporter following stacking operations in the Vehicle Assembly Building. (NASA)
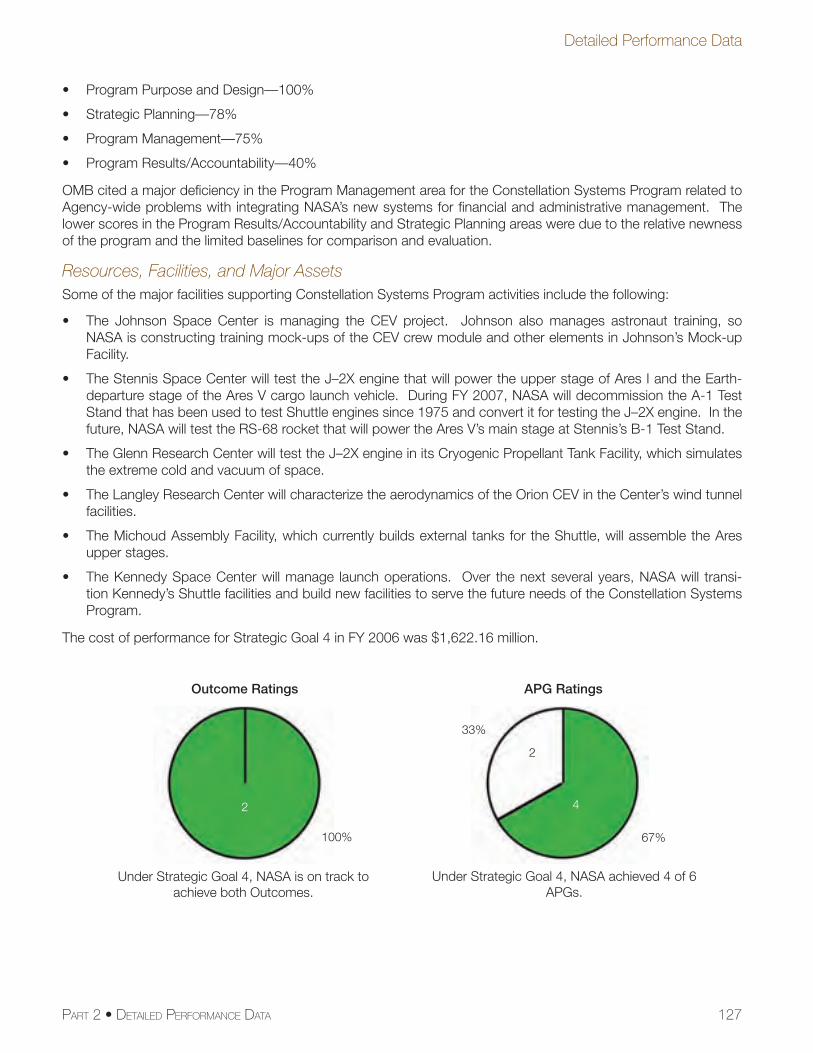
127
Detailed Performance Data
PART 2 • DETAILED PERFORMANCE DATA
• Program Purpose and Design—100%
• Strategic Planning—78%
• Program Management—75%
• Program Results/Accountability—40%
OMB cited a major defi ciency in the Program Management area for the Constellation Systems Program related to Agency-wide problems with integrating NASA’s new systems for fi nancial and administrative management. The lower scores in the Program Results/Accountability and Strategic Planning areas were due to the relative newness of the program and the limited baselines for comparison and evaluation.
Resources, Facilities, and Major AssetsSome of the major facilities supporting Constellation Systems Program activities include the following:
• The Johnson Space Center is managing the CEV project. Johnson also manages astronaut training, so NASA is constructing training mock-ups of the CEV crew module and other elements in Johnson’s Mock-up Facility.
• The Stennis Space Center will test the J–2X engine that will power the upper stage of Ares I and the Earth-departure stage of the Ares V cargo launch vehicle. During FY 2007, NASA will decommission the A-1 Test Stand that has been used to test Shuttle engines since 1975 and convert it for testing the J–2X engine. In the future, NASA will test the RS-68 rocket that will power the Ares V’s main stage at Stennis’s B-1 Test Stand.
• The Glenn Research Center will test the J–2X engine in its Cryogenic Propellant Tank Facility, which simulates the extreme cold and vacuum of space.
• The Langley Research Center will characterize the aerodynamics of the Orion CEV in the Center’s wind tunnel facilities.
• The Michoud Assembly Facility, which currently builds external tanks for the Shuttle, will assemble the Ares upper stages.
• The Kennedy Space Center will manage launch operations. Over the next several years, NASA will transi-tion Kennedy’s Shuttle facilities and build new facilities to serve the future needs of the Constellation Systems Program.
The cost of performance for Strategic Goal 4 in FY 2006 was $1,622.16 million.
Outcome Ratings
Under Strategic Goal 4, NASA is on track to achieve both Outcomes.
2
APG Ratings
4
67%
Under Strategic Goal 4, NASA achieved 4 of 6 APGs.
33%
100%
2
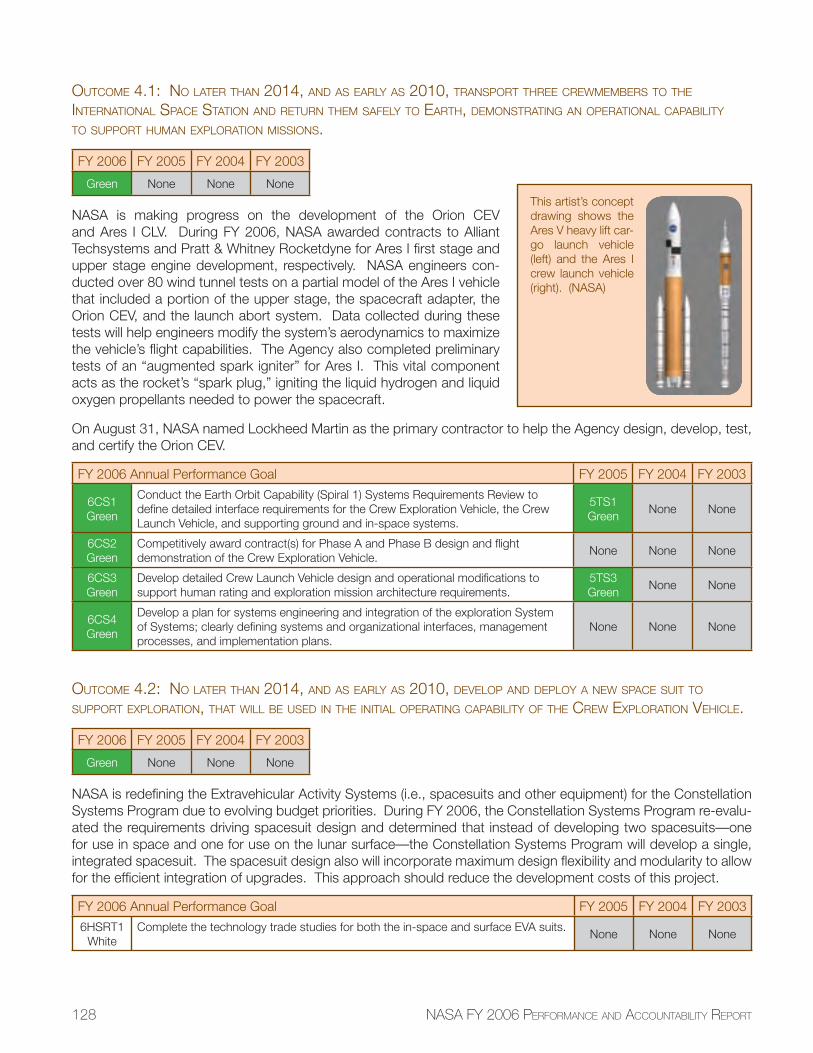
128 NASA FY 2006 PERFORMANCE AND ACCOUNTABILITY REPORT
OUTCOME 4.1: NO LATER THAN 2014, AND AS EARLY AS 2010, TRANSPORT THREE CREWMEMBERS TO THE INTERNATIONAL SPACE STATION AND RETURN THEM SAFELY TO EARTH, DEMONSTRATING AN OPERATIONAL CAPABILITY TO SUPPORT HUMAN EXPLORATION MISSIONS.
FY 2006 FY 2005 FY 2004 FY 2003
Green None None None
NASA is making progress on the development of the Orion CEV and Ares I CLV. During FY 2006, NASA awarded contracts to Alliant Techsystems and Pratt & Whitney Rocketdyne for Ares I fi rst stage and upper stage engine development, respectively. NASA engineers con-ducted over 80 wind tunnel tests on a partial model of the Ares I vehicle that included a portion of the upper stage, the spacecraft adapter, the Orion CEV, and the launch abort system. Data collected during these tests will help engineers modify the system’s aerodynamics to maximize the vehicle’s fl ight capabilities. The Agency also completed preliminary tests of an “augmented spark igniter” for Ares I. This vital component acts as the rocket’s “spark plug,” igniting the liquid hydrogen and liquid oxygen propellants needed to power the spacecraft.
On August 31, NASA named Lockheed Martin as the primary contractor to help the Agency design, develop, test, and certify the Orion CEV.
FY 2006 Annual Performance Goal FY 2005 FY 2004 FY 2003
6CS1Green
Conduct the Earth Orbit Capability (Spiral 1) Systems Requirements Review to defi ne detailed interface requirements for the Crew Exploration Vehicle, the Crew Launch Vehicle, and supporting ground and in-space systems.
5TS1Green
None None
6CS2Green
Competitively award contract(s) for Phase A and Phase B design and fl ight demonstration of the Crew Exploration Vehicle.
None None None
6CS3Green
Develop detailed Crew Launch Vehicle design and operational modifi cations to support human rating and exploration mission architecture requirements.
5TS3Green
None None
6CS4Green
Develop a plan for systems engineering and integration of the exploration System of Systems; clearly defi ning systems and organizational interfaces, management processes, and implementation plans.
None None None
OUTCOME 4.2: NO LATER THAN 2014, AND AS EARLY AS 2010, DEVELOP AND DEPLOY A NEW SPACE SUIT TO SUPPORT EXPLORATION, THAT WILL BE USED IN THE INITIAL OPERATING CAPABILITY OF THE CREW EXPLORATION VEHICLE.
FY 2006 FY 2005 FY 2004 FY 2003
Green None None None
NASA is redefi ning the Extravehicular Activity Systems (i.e., spacesuits and other equipment) for the Constellation Systems Program due to evolving budget priorities. During FY 2006, the Constellation Systems Program re-evalu-ated the requirements driving spacesuit design and determined that instead of developing two spacesuits—one for use in space and one for use on the lunar surface—the Constellation Systems Program will develop a single, integrated spacesuit. The spacesuit design also will incorporate maximum design fl exibility and modularity to allow for the effi cient integration of upgrades. This approach should reduce the development costs of this project.
FY 2006 Annual Performance Goal FY 2005 FY 2004 FY 2003
6HSRT1White
Complete the technology trade studies for both the in-space and surface EVA suits.None None None
This artist’s concept drawing shows the Ares V heavy lift car-go launch vehicle (left) and the Ares I crew launch vehicle (right). (NASA)
129
Detailed Performance Data
PART 2 • DETAILED PERFORMANCE DATA
FY 2006 Annual Performance Goal FY 2005 FY 2004 FY 2003
6HSRT2White
Complete the system requirements review for both the in-space and surface explo-ration EVA suits.
None None None
Performance Shortfalls6HSRT1 and 6HSRT2: Due to changes in the Extravehicular Activity Systems architecture, NASA management canceled these APGs. NASA will include appropriately revised APGs in the FY 2007 Performance Plan.
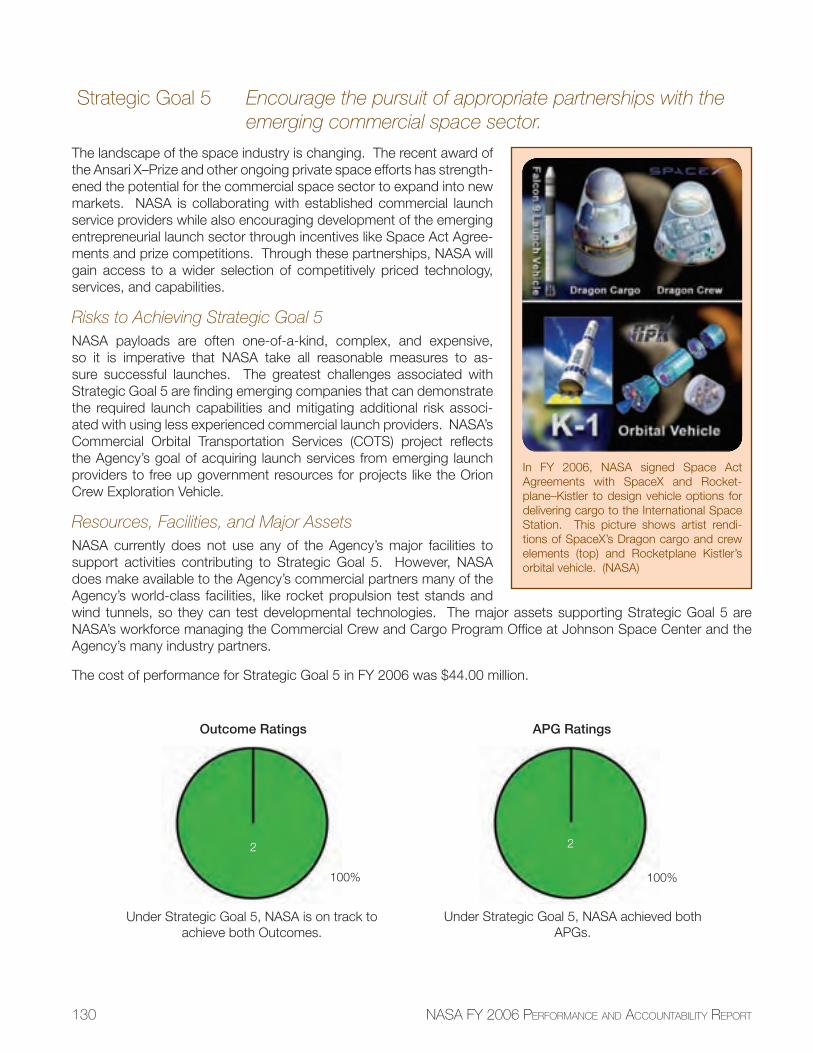
130 NASA FY 2006 PERFORMANCE AND ACCOUNTABILITY REPORT
Strategic Goal 5 Encourage the pursuit of appropriate partnerships with the emerging commercial space sector.
The landscape of the space industry is changing. The recent award of the Ansari X–Prize and other ongoing private space efforts has strength-ened the potential for the commercial space sector to expand into new markets. NASA is collaborating with established commercial launch service providers while also encouraging development of the emerging entrepreneurial launch sector through incentives like Space Act Agree-ments and prize competitions. Through these partnerships, NASA will gain access to a wider selection of competitively priced technology, services, and capabilities.
Risks to Achieving Strategic Goal 5NASA payloads are often one-of-a-kind, complex, and expensive, so it is imperative that NASA take all reasonable measures to as-sure successful launches. The greatest challenges associated with Strategic Goal 5 are fi nding emerging companies that can demonstrate the required launch capabilities and mitigating additional risk associ-ated with using less experienced commercial launch providers. NASA’s Commercial Orbital Transportation Services (COTS) project refl ects the Agency’s goal of acquiring launch services from emerging launch providers to free up government resources for projects like the Orion Crew Exploration Vehicle.
Resources, Facilities, and Major AssetsNASA currently does not use any of the Agency’s major facilities to support activities contributing to Strategic Goal 5. However, NASA does make available to the Agency’s commercial partners many of the Agency’s world-class facilities, like rocket propulsion test stands and wind tunnels, so they can test developmental technologies. The major assets supporting Strategic Goal 5 are NASA’s workforce managing the Commercial Crew and Cargo Program Offi ce at Johnson Space Center and the Agency’s many industry partners.
The cost of performance for Strategic Goal 5 in FY 2006 was $44.00 million.
In FY 2006, NASA signed Space Act Agreements with SpaceX and Rocket-plane–Kistler to design vehicle options for delivering cargo to the International Space Station. This picture shows artist rendi-tions of SpaceX’s Dragon cargo and crew elements (top) and Rocketplane Kistler’s orbital vehicle. (NASA)
Outcome Ratings
Under Strategic Goal 5, NASA is on track to achieve both Outcomes.
2
APG Ratings
2
100%
Under Strategic Goal 5, NASA achieved both APGs.
100%
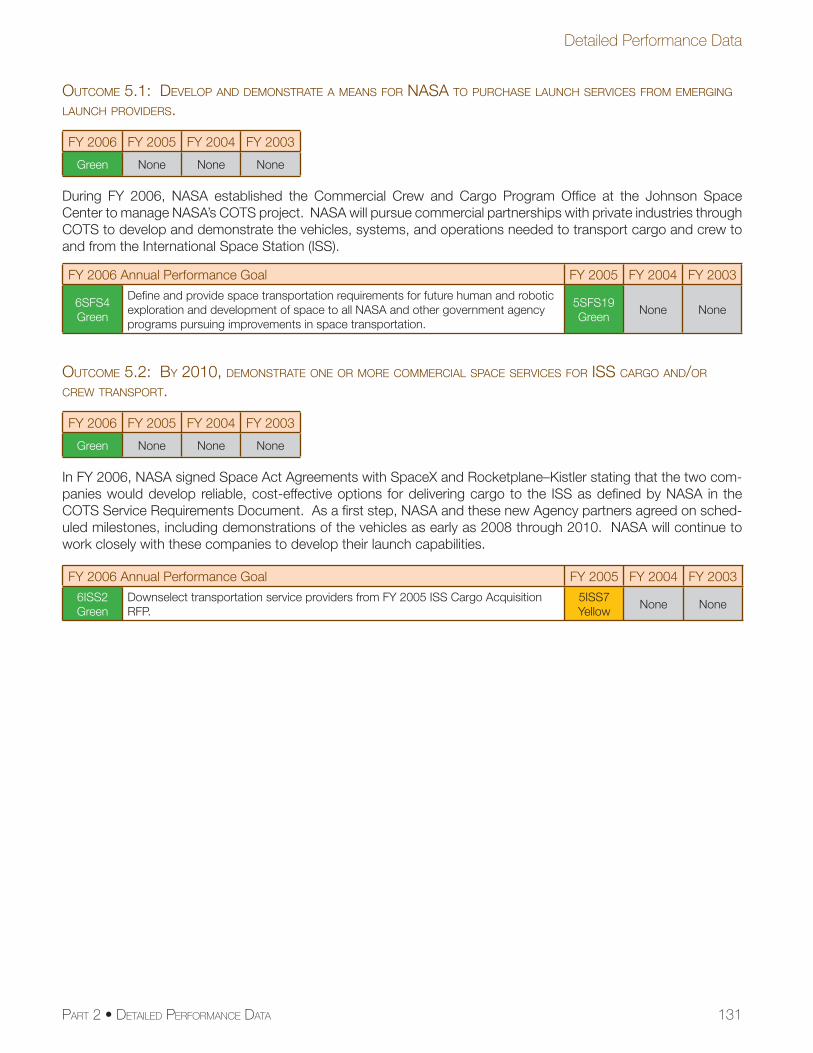
131
Detailed Performance Data
PART 2 • DETAILED PERFORMANCE DATA
OUTCOME 5.1: DEVELOP AND DEMONSTRATE A MEANS FOR NASA TO PURCHASE LAUNCH SERVICES FROM EMERGING LAUNCH PROVIDERS.
FY 2006 FY 2005 FY 2004 FY 2003
Green None None None
During FY 2006, NASA established the Commercial Crew and Cargo Program Offi ce at the Johnson Space Center to manage NASA’s COTS project. NASA will pursue commercial partnerships with private industries through COTS to develop and demonstrate the vehicles, systems, and operations needed to transport cargo and crew to and from the International Space Station (ISS).
FY 2006 Annual Performance Goal FY 2005 FY 2004 FY 2003
6SFS4Green
Defi ne and provide space transportation requirements for future human and robotic exploration and development of space to all NASA and other government agency programs pursuing improvements in space transportation.
5SFS19Green
None None
OUTCOME 5.2: BY 2010, DEMONSTRATE ONE OR MORE COMMERCIAL SPACE SERVICES FOR ISS CARGO AND/OR CREW TRANSPORT.
FY 2006 FY 2005 FY 2004 FY 2003
Green None None None
In FY 2006, NASA signed Space Act Agreements with SpaceX and Rocketplane–Kistler stating that the two com-panies would develop reliable, cost-effective options for delivering cargo to the ISS as defi ned by NASA in the COTS Service Requirements Document. As a fi rst step, NASA and these new Agency partners agreed on sched-uled milestones, including demonstrations of the vehicles as early as 2008 through 2010. NASA will continue to work closely with these companies to develop their launch capabilities.
FY 2006 Annual Performance Goal FY 2005 FY 2004 FY 2003
6ISS2Green
Downselect transportation service providers from FY 2005 ISS Cargo Acquisition RFP.
5ISS7Yellow
None None
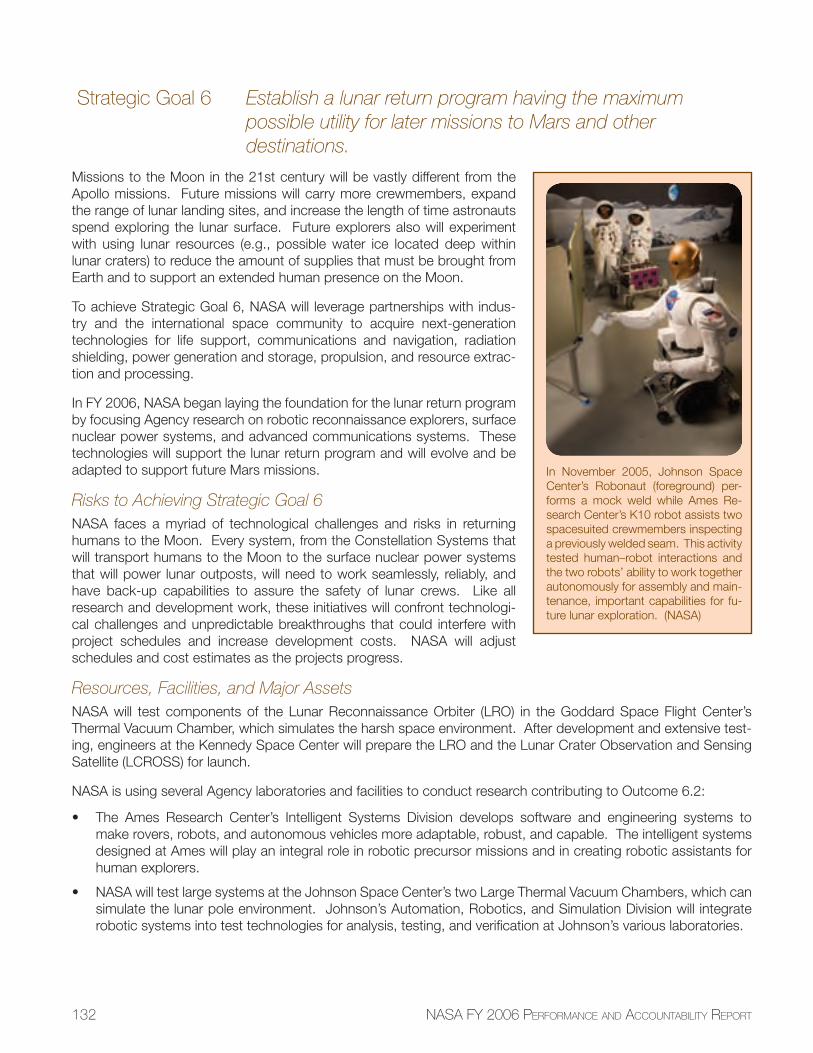
132 NASA FY 2006 PERFORMANCE AND ACCOUNTABILITY REPORT
Strategic Goal 6 Establish a lunar return program having the maximum possible utility for later missions to Mars and other destinations.
Missions to the Moon in the 21st century will be vastly different from the Apollo missions. Future missions will carry more crewmembers, expand the range of lunar landing sites, and increase the length of time astronauts spend exploring the lunar surface. Future explorers also will experiment with using lunar resources (e.g., possible water ice located deep within lunar craters) to reduce the amount of supplies that must be brought from Earth and to support an extended human presence on the Moon.
To achieve Strategic Goal 6, NASA will leverage partnerships with indus-try and the international space community to acquire next-generation technologies for life support, communications and navigation, radiation shielding, power generation and storage, propulsion, and resource extrac-tion and processing.
In FY 2006, NASA began laying the foundation for the lunar return program by focusing Agency research on robotic reconnaissance explorers, surface nuclear power systems, and advanced communications systems. These technologies will support the lunar return program and will evolve and be adapted to support future Mars missions.
Risks to Achieving Strategic Goal 6NASA faces a myriad of technological challenges and risks in returning humans to the Moon. Every system, from the Constellation Systems that will transport humans to the Moon to the surface nuclear power systems that will power lunar outposts, will need to work seamlessly, reliably, and have back-up capabilities to assure the safety of lunar crews. Like all research and development work, these initiatives will confront technologi-cal challenges and unpredictable breakthroughs that could interfere with project schedules and increase development costs. NASA will adjust schedules and cost estimates as the projects progress.
Resources, Facilities, and Major AssetsNASA will test components of the Lunar Reconnaissance Orbiter (LRO) in the Goddard Space Flight Center’s Thermal Vacuum Chamber, which simulates the harsh space environment. After development and extensive test-ing, engineers at the Kennedy Space Center will prepare the LRO and the Lunar Crater Observation and Sensing Satellite (LCROSS) for launch.
NASA is using several Agency laboratories and facilities to conduct research contributing to Outcome 6.2:
• The Ames Research Center’s Intelligent Systems Division develops software and engineering systems to make rovers, robots, and autonomous vehicles more adaptable, robust, and capable. The intelligent systems designed at Ames will play an integral role in robotic precursor missions and in creating robotic assistants for human explorers.
• NASA will test large systems at the Johnson Space Center’s two Large Thermal Vacuum Chambers, which can simulate the lunar pole environment. Johnson’s Automation, Robotics, and Simulation Division will integrate robotic systems into test technologies for analysis, testing, and verifi cation at Johnson’s various laboratories.
In November 2005, Johnson Space Center’s Robonaut (foreground) per-forms a mock weld while Ames Re-search Center’s K10 robot assists two spacesuited crewmembers inspecting a previously welded seam. This activity tested human–robot interactions and the two robots’ ability to work together autonomously for assembly and main-tenance, important capabilities for fu-ture lunar exploration. (NASA)
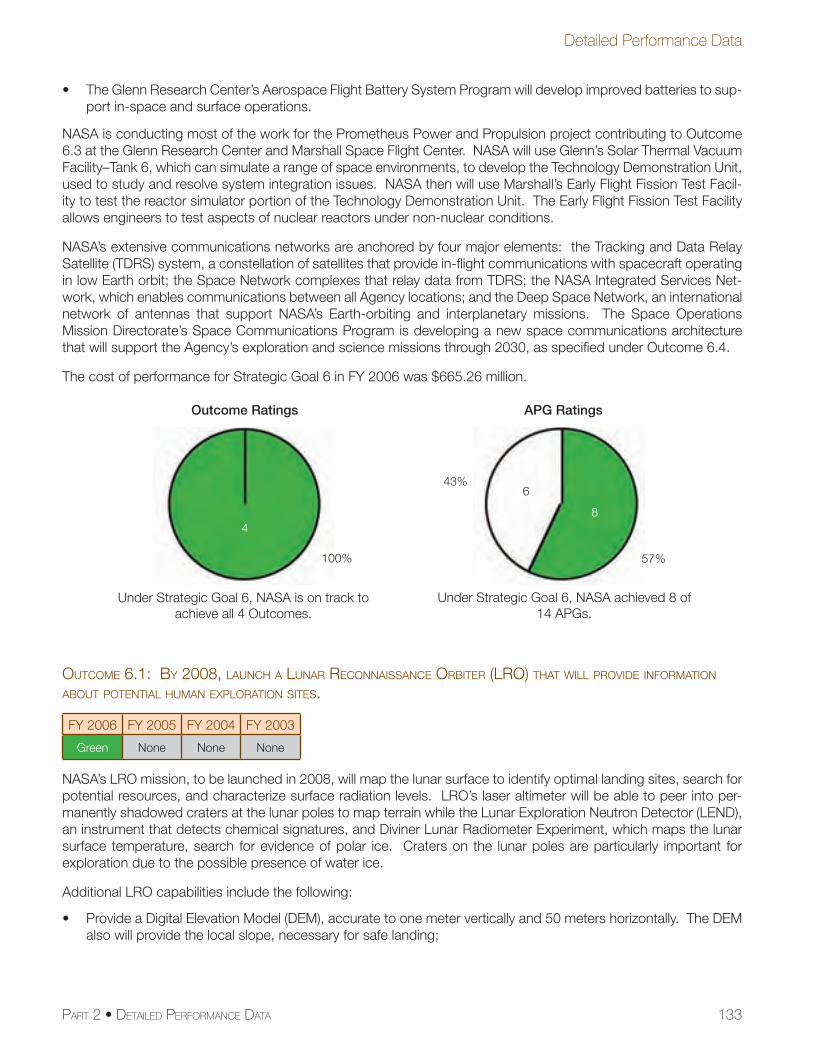
133
Detailed Performance Data
PART 2 • DETAILED PERFORMANCE DATA
• The Glenn Research Center’s Aerospace Flight Battery System Program will develop improved batteries to sup-port in-space and surface operations.
NASA is conducting most of the work for the Prometheus Power and Propulsion project contributing to Outcome 6.3 at the Glenn Research Center and Marshall Space Flight Center. NASA will use Glenn’s Solar Thermal Vacuum Facility–Tank 6, which can simulate a range of space environments, to develop the Technology Demonstration Unit, used to study and resolve system integration issues. NASA then will use Marshall’s Early Flight Fission Test Facil-ity to test the reactor simulator portion of the Technology Demonstration Unit. The Early Flight Fission Test Facility allows engineers to test aspects of nuclear reactors under non-nuclear conditions.
NASA’s extensive communications networks are anchored by four major elements: the Tracking and Data Relay Satellite (TDRS) system, a constellation of satellites that provide in-fl ight communications with spacecraft operating in low Earth orbit; the Space Network complexes that relay data from TDRS; the NASA Integrated Services Net-work, which enables communications between all Agency locations; and the Deep Space Network, an international network of antennas that support NASA’s Earth-orbiting and interplanetary missions. The Space Operations Mission Directorate’s Space Communications Program is developing a new space communications architecture that will support the Agency’s exploration and science missions through 2030, as specifi ed under Outcome 6.4.
The cost of performance for Strategic Goal 6 in FY 2006 was $665.26 million.
OUTCOME 6.1: BY 2008, LAUNCH A LUNAR RECONNAISSANCE ORBITER (LRO) THAT WILL PROVIDE INFORMATION ABOUT POTENTIAL HUMAN EXPLORATION SITES.
FY 2006 FY 2005 FY 2004 FY 2003
Green None None None
NASA’s LRO mission, to be launched in 2008, will map the lunar surface to identify optimal landing sites, search for potential resources, and characterize surface radiation levels. LRO’s laser altimeter will be able to peer into per-manently shadowed craters at the lunar poles to map terrain while the Lunar Exploration Neutron Detector (LEND), an instrument that detects chemical signatures, and Diviner Lunar Radiometer Experiment, which maps the lunar surface temperature, search for evidence of polar ice. Craters on the lunar poles are particularly important for exploration due to the possible presence of water ice.
Additional LRO capabilities include the following:
• Provide a Digital Elevation Model (DEM), accurate to one meter vertically and 50 meters horizontally. The DEM also will provide the local slope, necessary for safe landing;
Outcome Ratings
Under Strategic Goal 6, NASA is on track to achieve all 4 Outcomes.
4
APG Ratings
8
57%
Under Strategic Goal 6, NASA achieved 8 of 14 APGs.
100%
643%
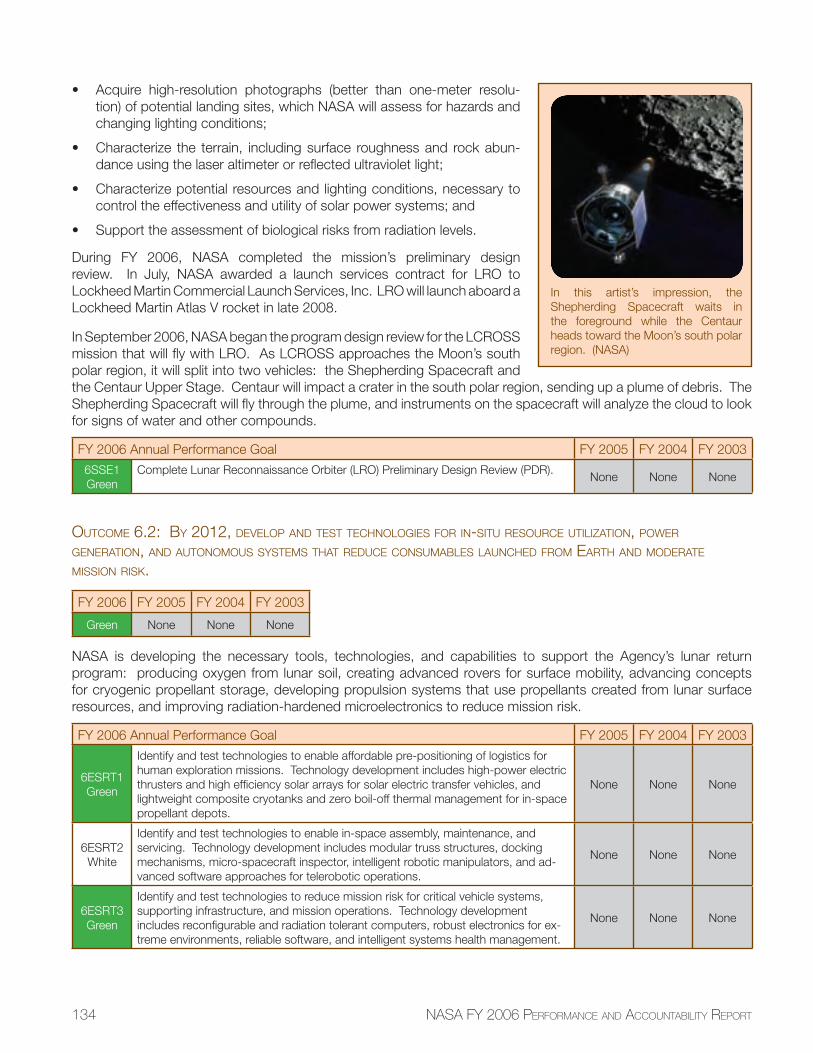
134 NASA FY 2006 PERFORMANCE AND ACCOUNTABILITY REPORT
• Acquire high-resolution photographs (better than one-meter resolu-tion) of potential landing sites, which NASA will assess for hazards and changing lighting conditions;
• Characterize the terrain, including surface roughness and rock abun-dance using the laser altimeter or refl ected ultraviolet light;
• Characterize potential resources and lighting conditions, necessary to control the effectiveness and utility of solar power systems; and
• Support the assessment of biological risks from radiation levels.
During FY 2006, NASA completed the mission’s preliminary design review. In July, NASA awarded a launch services contract for LRO to Lockheed Martin Commercial Launch Services, Inc. LRO will launch aboard a Lockheed Martin Atlas V rocket in late 2008.
In September 2006, NASA began the program design review for the LCROSS mission that will fl y with LRO. As LCROSS approaches the Moon’s south polar region, it will split into two vehicles: the Shepherding Spacecraft and the Centaur Upper Stage. Centaur will impact a crater in the south polar region, sending up a plume of debris. The Shepherding Spacecraft will fl y through the plume, and instruments on the spacecraft will analyze the cloud to look for signs of water and other compounds.
FY 2006 Annual Performance Goal FY 2005 FY 2004 FY 2003
6SSE1Green
Complete Lunar Reconnaissance Orbiter (LRO) Preliminary Design Review (PDR).None None None
OUTCOME 6.2: BY 2012, DEVELOP AND TEST TECHNOLOGIES FOR IN-SITU RESOURCE UTILIZATION, POWER GENERATION, AND AUTONOMOUS SYSTEMS THAT REDUCE CONSUMABLES LAUNCHED FROM EARTH AND MODERATE MISSION RISK.
FY 2006 FY 2005 FY 2004 FY 2003
Green None None None
NASA is developing the necessary tools, technologies, and capabilities to support the Agency’s lunar return program: producing oxygen from lunar soil, creating advanced rovers for surface mobility, advancing concepts for cryogenic propellant storage, developing propulsion systems that use propellants created from lunar surface resources, and improving radiation-hardened microelectronics to reduce mission risk.
FY 2006 Annual Performance Goal FY 2005 FY 2004 FY 2003
6ESRT1Green
Identify and test technologies to enable affordable pre-positioning of logistics for human exploration missions. Technology development includes high-power electric thrusters and high effi ciency solar arrays for solar electric transfer vehicles, and lightweight composite cryotanks and zero boil-off thermal management for in-space propellant depots.
None None None
6ESRT2White
Identify and test technologies to enable in-space assembly, maintenance, and servicing. Technology development includes modular truss structures, docking mechanisms, micro-spacecraft inspector, intelligent robotic manipulators, and ad-vanced software approaches for telerobotic operations.
None None None
6ESRT3Green
Identify and test technologies to reduce mission risk for critical vehicle systems, supporting infrastructure, and mission operations. Technology development includes reconfi gurable and radiation tolerant computers, robust electronics for ex-treme environments, reliable software, and intelligent systems health management.
None None None
In this artist’s impression, the Shepherding Spacecraft waits in the foreground while the Centaur heads toward the Moon’s south polar region. (NASA)
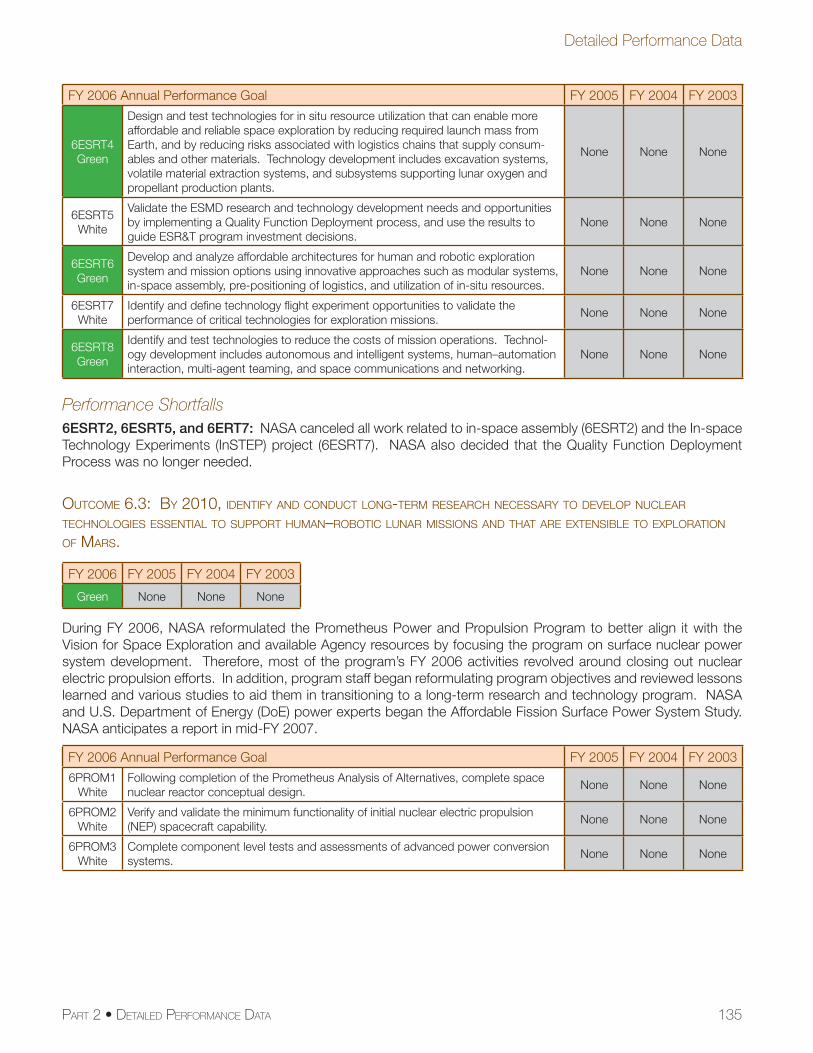
135
Detailed Performance Data
PART 2 • DETAILED PERFORMANCE DATA
FY 2006 Annual Performance Goal FY 2005 FY 2004 FY 2003
6ESRT4Green
Design and test technologies for in situ resource utilization that can enable more affordable and reliable space exploration by reducing required launch mass from Earth, and by reducing risks associated with logistics chains that supply consum-ables and other materials. Technology development includes excavation systems, volatile material extraction systems, and subsystems supporting lunar oxygen and propellant production plants.
None None None
6ESRT5White
Validate the ESMD research and technology development needs and opportunities by implementing a Quality Function Deployment process, and use the results to guide ESR&T program investment decisions.
None None None
6ESRT6Green
Develop and analyze affordable architectures for human and robotic exploration system and mission options using innovative approaches such as modular systems, in-space assembly, pre-positioning of logistics, and utilization of in-situ resources.
None None None
6ESRT7White
Identify and defi ne technology fl ight experiment opportunities to validate the performance of critical technologies for exploration missions.
None None None
6ESRT8Green
Identify and test technologies to reduce the costs of mission operations. Technol-ogy development includes autonomous and intelligent systems, human–automation interaction, multi-agent teaming, and space communications and networking.
None None None
Performance Shortfalls6ESRT2, 6ESRT5, and 6ERT7: NASA canceled all work related to in-space assembly (6ESRT2) and the In-space Technology Experiments (InSTEP) project (6ESRT7). NASA also decided that the Quality Function Deployment Process was no longer needed.
OUTCOME 6.3: BY 2010, IDENTIFY AND CONDUCT LONG-TERM RESEARCH NECESSARY TO DEVELOP NUCLEAR TECHNOLOGIES ESSENTIAL TO SUPPORT HUMAN–ROBOTIC LUNAR MISSIONS AND THAT ARE EXTENSIBLE TO EXPLORATION OF MARS.
FY 2006 FY 2005 FY 2004 FY 2003
Green None None None
During FY 2006, NASA reformulated the Prometheus Power and Propulsion Program to better align it with the Vision for Space Exploration and available Agency resources by focusing the program on surface nuclear power system development. Therefore, most of the program’s FY 2006 activities revolved around closing out nuclear electric propulsion efforts. In addition, program staff began reformulating program objectives and reviewed lessons learned and various studies to aid them in transitioning to a long-term research and technology program. NASA and U.S. Department of Energy (DoE) power experts began the Affordable Fission Surface Power System Study. NASA anticipates a report in mid-FY 2007.
FY 2006 Annual Performance Goal FY 2005 FY 2004 FY 2003
6PROM1White
Following completion of the Prometheus Analysis of Alternatives, complete space nuclear reactor conceptual design.
None None None
6PROM2White
Verify and validate the minimum functionality of initial nuclear electric propulsion (NEP) spacecraft capability.
None None None
6PROM3White
Complete component level tests and assessments of advanced power conversion systems.
None None None
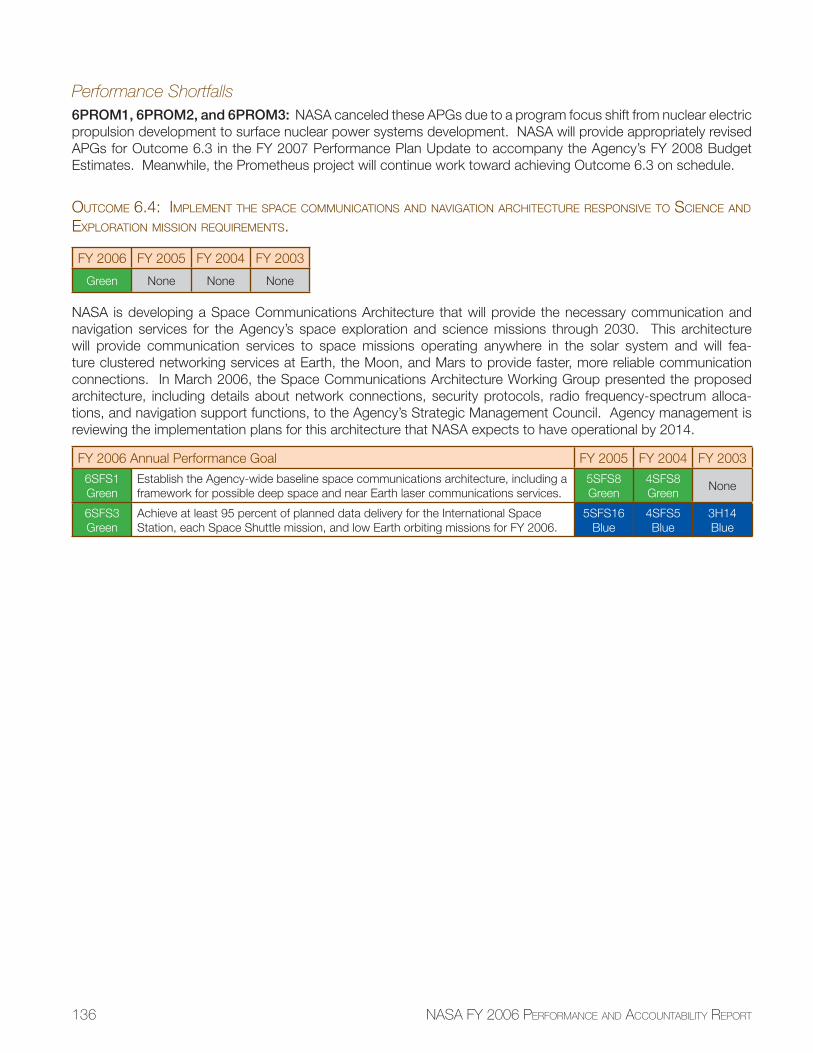
136 NASA FY 2006 PERFORMANCE AND ACCOUNTABILITY REPORT
Performance Shortfalls6PROM1, 6PROM2, and 6PROM3: NASA canceled these APGs due to a program focus shift from nuclear electric propulsion development to surface nuclear power systems development. NASA will provide appropriately revised APGs for Outcome 6.3 in the FY 2007 Performance Plan Update to accompany the Agency’s FY 2008 Budget Estimates. Meanwhile, the Prometheus project will continue work toward achieving Outcome 6.3 on schedule.
OUTCOME 6.4: IMPLEMENT THE SPACE COMMUNICATIONS AND NAVIGATION ARCHITECTURE RESPONSIVE TO SCIENCE AND EXPLORATION MISSION REQUIREMENTS.
FY 2006 FY 2005 FY 2004 FY 2003
Green None None None
NASA is developing a Space Communications Architecture that will provide the necessary communication and navigation services for the Agency’s space exploration and science missions through 2030. This architecture will provide communication services to space missions operating anywhere in the solar system and will fea-ture clustered networking services at Earth, the Moon, and Mars to provide faster, more reliable communication connections. In March 2006, the Space Communications Architecture Working Group presented the proposed architecture, including details about network connections, security protocols, radio frequency-spectrum alloca-tions, and navigation support functions, to the Agency’s Strategic Management Council. Agency management is reviewing the implementation plans for this architecture that NASA expects to have operational by 2014.
FY 2006 Annual Performance Goal FY 2005 FY 2004 FY 2003
6SFS1Green
Establish the Agency-wide baseline space communications architecture, including a framework for possible deep space and near Earth laser communications services.
5SFS8Green
4SFS8Green
None
6SFS3Green
Achieve at least 95 percent of planned data delivery for the International Space Station, each Space Shuttle mission, and low Earth orbiting missions for FY 2006.
5SFS16Blue
4SFS5Blue
3H14Blue
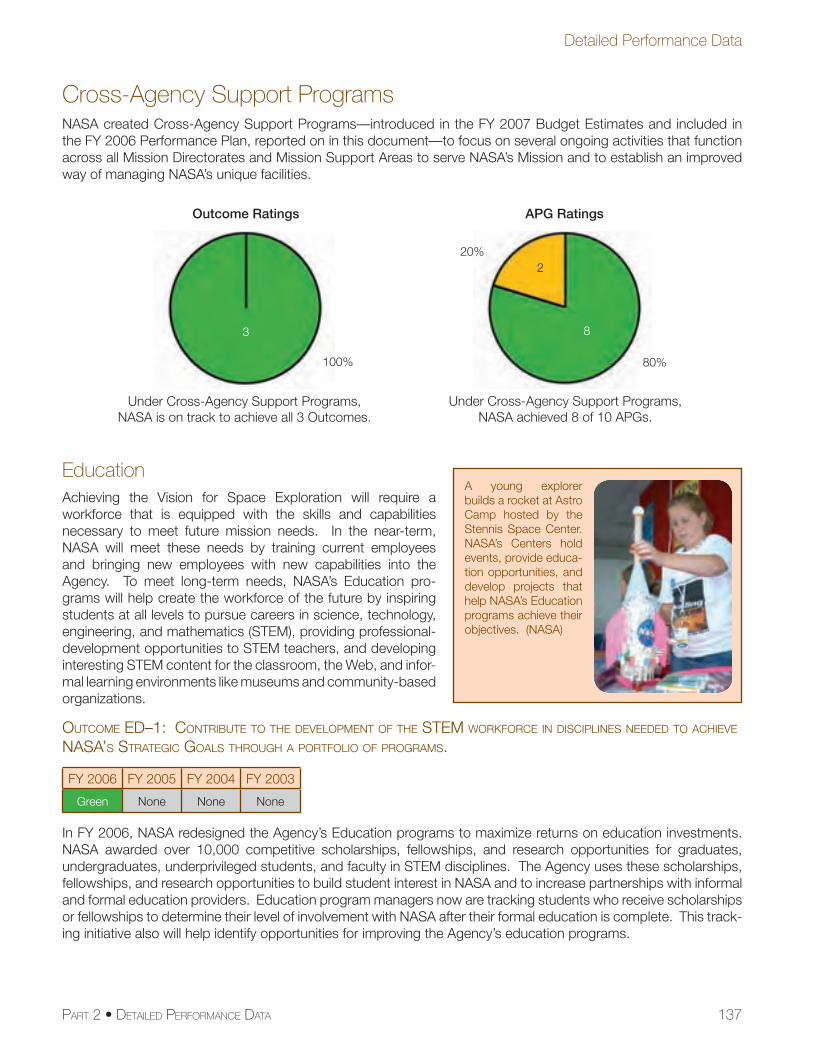
137
Detailed Performance Data
PART 2 • DETAILED PERFORMANCE DATA
Cross-Agency Support ProgramsNASA created Cross-Agency Support Programs—introduced in the FY 2007 Budget Estimates and included in the FY 2006 Performance Plan, reported on in this document—to focus on several ongoing activities that function across all Mission Directorates and Mission Support Areas to serve NASA’s Mission and to establish an improved way of managing NASA’s unique facilities.
EducationAchieving the Vision for Space Exploration will require a workforce that is equipped with the skills and capabilities necessary to meet future mission needs. In the near-term, NASA will meet these needs by training current employees and bringing new employees with new capabilities into the Agency. To meet long-term needs, NASA’s Education pro-grams will help create the workforce of the future by inspiring students at all levels to pursue careers in science, technology, engineering, and mathematics (STEM), providing professional-development opportunities to STEM teachers, and developing interesting STEM content for the classroom, the Web, and infor-mal learning environments like museums and community-based organizations.
OUTCOME ED–1: CONTRIBUTE TO THE DEVELOPMENT OF THE STEM WORKFORCE IN DISCIPLINES NEEDED TO ACHIEVE NASA’S STRATEGIC GOALS THROUGH A PORTFOLIO OF PROGRAMS.
FY 2006 FY 2005 FY 2004 FY 2003
Green None None None
In FY 2006, NASA redesigned the Agency’s Education programs to maximize returns on education investments. NASA awarded over 10,000 competitive scholarships, fellowships, and research opportunities for graduates, undergraduates, underprivileged students, and faculty in STEM disciplines. The Agency uses these scholarships, fellowships, and research opportunities to build student interest in NASA and to increase partnerships with informal and formal education providers. Education program managers now are tracking students who receive scholarships or fellowships to determine their level of involvement with NASA after their formal education is complete. This track-ing initiative also will help identify opportunities for improving the Agency’s education programs.
A young explorer builds a rocket at Astro Camp hosted by the Stennis Space Center. NASA’s Centers hold events, provide educa-tion opportunities, and develop projects that help NASA’s Education programs achieve their objectives. (NASA)
Outcome Ratings
Under Cross-Agency Support Programs, NASA is on track to achieve all 3 Outcomes.
3
APG Ratings
8
80%
Under Cross-Agency Support Programs, NASA achieved 8 of 10 APGs.
100%
220%
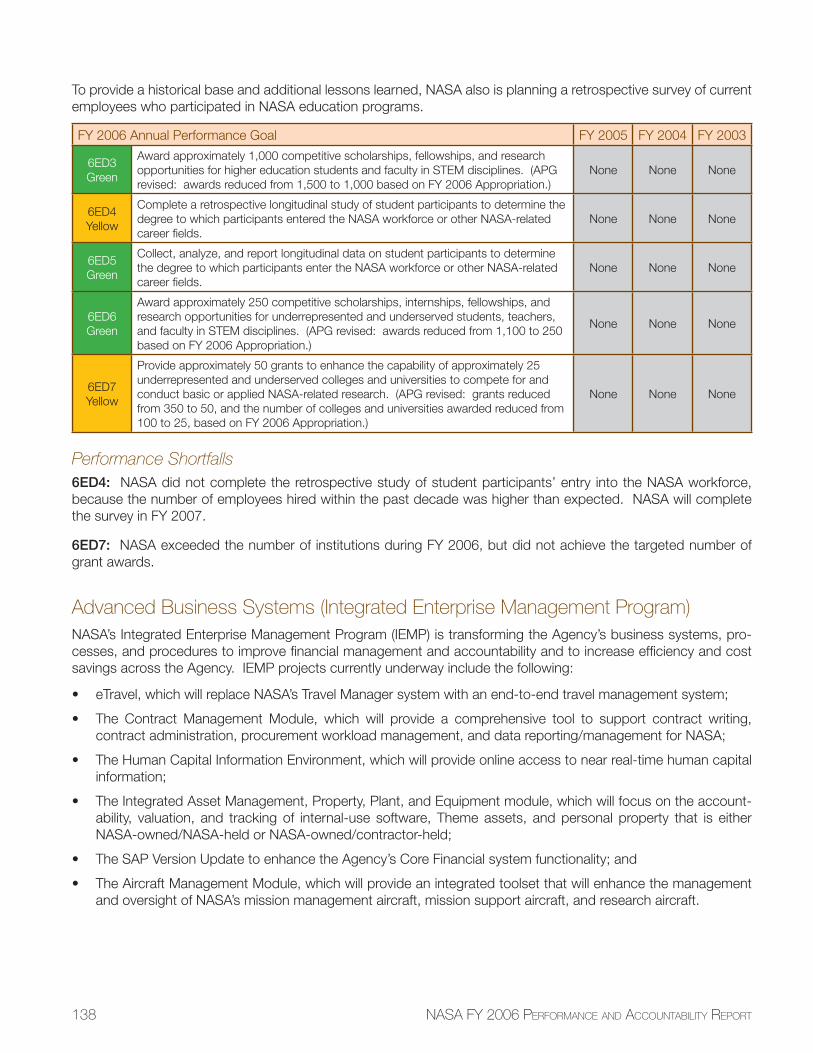
138 NASA FY 2006 PERFORMANCE AND ACCOUNTABILITY REPORT
To provide a historical base and additional lessons learned, NASA also is planning a retrospective survey of current employees who participated in NASA education programs.
FY 2006 Annual Performance Goal FY 2005 FY 2004 FY 2003
6ED3Green
Award approximately 1,000 competitive scholarships, fellowships, and research opportunities for higher education students and faculty in STEM disciplines. (APG revised: awards reduced from 1,500 to 1,000 based on FY 2006 Appropriation.)
None None None
6ED4Yellow
Complete a retrospective longitudinal study of student participants to determine the degree to which participants entered the NASA workforce or other NASA-related career fi elds.
None None None
6ED5Green
Collect, analyze, and report longitudinal data on student participants to determine the degree to which participants enter the NASA workforce or other NASA-related career fi elds.
None None None
6ED6Green
Award approximately 250 competitive scholarships, internships, fellowships, and research opportunities for underrepresented and underserved students, teachers, and faculty in STEM disciplines. (APG revised: awards reduced from 1,100 to 250 based on FY 2006 Appropriation.)
None None None
6ED7Yellow
Provide approximately 50 grants to enhance the capability of approximately 25 underrepresented and underserved colleges and universities to compete for and conduct basic or applied NASA-related research. (APG revised: grants reduced from 350 to 50, and the number of colleges and universities awarded reduced from 100 to 25, based on FY 2006 Appropriation.)
None None None
Performance Shortfalls6ED4: NASA did not complete the retrospective study of student participants’ entry into the NASA workforce, because the number of employees hired within the past decade was higher than expected. NASA will complete the survey in FY 2007.
6ED7: NASA exceeded the number of institutions during FY 2006, but did not achieve the targeted number of grant awards.
Advanced Business Systems (Integrated Enterprise Management Program)NASA’s Integrated Enterprise Management Program (IEMP) is transforming the Agency’s business systems, pro-cesses, and procedures to improve fi nancial management and accountability and to increase effi ciency and cost savings across the Agency. IEMP projects currently underway include the following:
• eTravel, which will replace NASA’s Travel Manager system with an end-to-end travel management system;
• The Contract Management Module, which will provide a comprehensive tool to support contract writing, contract administration, procurement workload management, and data reporting/management for NASA;
• The Human Capital Information Environment, which will provide online access to near real-time human capital information;
• The Integrated Asset Management, Property, Plant, and Equipment module, which will focus on the account-ability, valuation, and tracking of internal-use software, Theme assets, and personal property that is either NASA-owned/NASA-held or NASA-owned/contractor-held;
• The SAP Version Update to enhance the Agency’s Core Financial system functionality; and
• The Aircraft Management Module, which will provide an integrated toolset that will enhance the management and oversight of NASA’s mission management aircraft, mission support aircraft, and research aircraft.
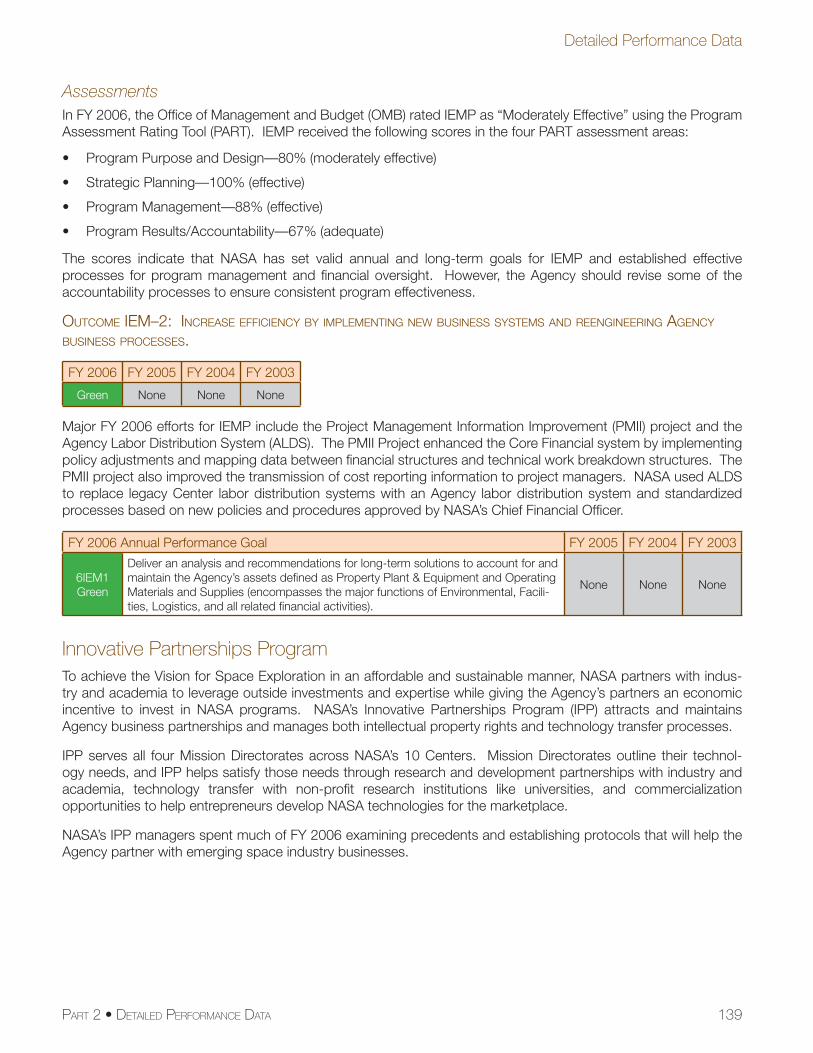
139
Detailed Performance Data
PART 2 • DETAILED PERFORMANCE DATA
AssessmentsIn FY 2006, the Offi ce of Management and Budget (OMB) rated IEMP as “Moderately Effective” using the Program Assessment Rating Tool (PART). IEMP received the following scores in the four PART assessment areas:
• Program Purpose and Design—80% (moderately effective)
• Strategic Planning—100% (effective)
• Program Management—88% (effective)
• Program Results/Accountability—67% (adequate)
The scores indicate that NASA has set valid annual and long-term goals for IEMP and established effective processes for program management and fi nancial oversight. However, the Agency should revise some of the accountability processes to ensure consistent program effectiveness.
OUTCOME IEM–2: INCREASE EFFICIENCY BY IMPLEMENTING NEW BUSINESS SYSTEMS AND REENGINEERING AGENCY BUSINESS PROCESSES.
FY 2006 FY 2005 FY 2004 FY 2003
Green None None None
Major FY 2006 efforts for IEMP include the Project Management Information Improvement (PMII) project and the Agency Labor Distribution System (ALDS). The PMII Project enhanced the Core Financial system by implementing policy adjustments and mapping data between fi nancial structures and technical work breakdown structures. The PMII project also improved the transmission of cost reporting information to project managers. NASA used ALDS to replace legacy Center labor distribution systems with an Agency labor distribution system and standardized processes based on new policies and procedures approved by NASA’s Chief Financial Offi cer.
FY 2006 Annual Performance Goal FY 2005 FY 2004 FY 2003
6IEM1Green
Deliver an analysis and recommendations for long-term solutions to account for and maintain the Agency’s assets defi ned as Property Plant & Equipment and Operating Materials and Supplies (encompasses the major functions of Environmental, Facili-ties, Logistics, and all related fi nancial activities).
None None None
Innovative Partnerships ProgramTo achieve the Vision for Space Exploration in an affordable and sustainable manner, NASA partners with indus-try and academia to leverage outside investments and expertise while giving the Agency’s partners an economic incentive to invest in NASA programs. NASA’s Innovative Partnerships Program (IPP) attracts and maintains Agency business partnerships and manages both intellectual property rights and technology transfer processes.
IPP serves all four Mission Directorates across NASA’s 10 Centers. Mission Directorates outline their technol-ogy needs, and IPP helps satisfy those needs through research and development partnerships with industry and academia, technology transfer with non-profi t research institutions like universities, and commercialization opportunities to help entrepreneurs develop NASA technologies for the marketplace.
NASA’s IPP managers spent much of FY 2006 examining precedents and establishing protocols that will help the Agency partner with emerging space industry businesses.
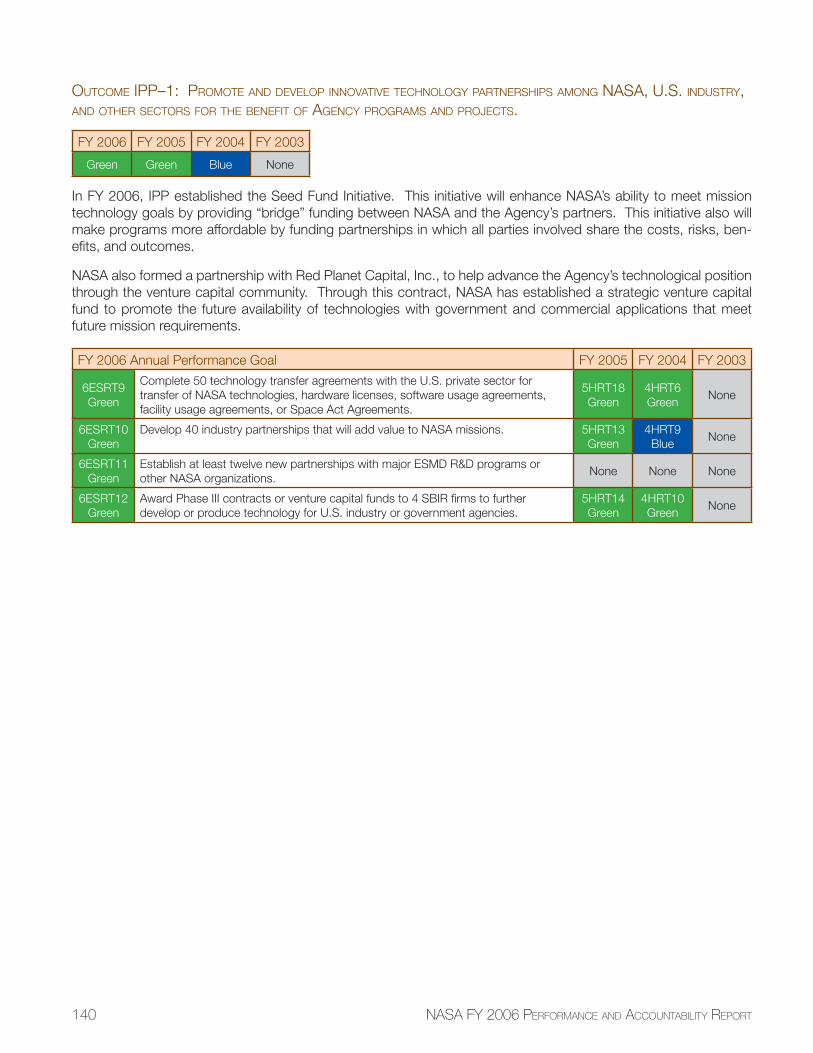
140 NASA FY 2006 PERFORMANCE AND ACCOUNTABILITY REPORT
OUTCOME IPP–1: PROMOTE AND DEVELOP INNOVATIVE TECHNOLOGY PARTNERSHIPS AMONG NASA, U.S. INDUSTRY, AND OTHER SECTORS FOR THE BENEFIT OF AGENCY PROGRAMS AND PROJECTS.
FY 2006 FY 2005 FY 2004 FY 2003
Green Green Blue None
In FY 2006, IPP established the Seed Fund Initiative. This initiative will enhance NASA’s ability to meet mission technology goals by providing “bridge” funding between NASA and the Agency’s partners. This initiative also will make programs more affordable by funding partnerships in which all parties involved share the costs, risks, ben-efi ts, and outcomes.
NASA also formed a partnership with Red Planet Capital, Inc., to help advance the Agency’s technological position through the venture capital community. Through this contract, NASA has established a strategic venture capital fund to promote the future availability of technologies with government and commercial applications that meet future mission requirements.
FY 2006 Annual Performance Goal FY 2005 FY 2004 FY 2003
6ESRT9Green
Complete 50 technology transfer agreements with the U.S. private sector for transfer of NASA technologies, hardware licenses, software usage agreements, facility usage agreements, or Space Act Agreements.
5HRT18Green
4HRT6Green
None
6ESRT10Green
Develop 40 industry partnerships that will add value to NASA missions. 5HRT13Green
4HRT9Blue
None
6ESRT11Green
Establish at least twelve new partnerships with major ESMD R&D programs or other NASA organizations.
None None None
6ESRT12Green
Award Phase III contracts or venture capital funds to 4 SBIR fi rms to further develop or produce technology for U.S. industry or government agencies.
5HRT14Green
4HRT10Green
None
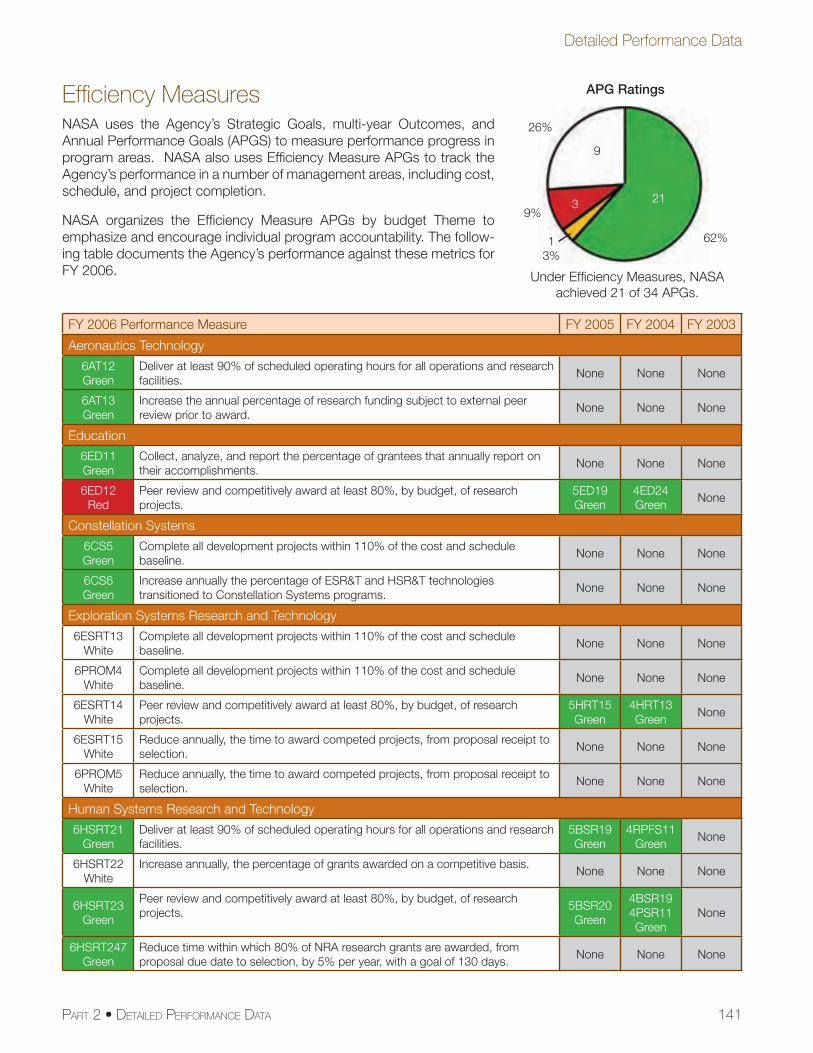
141
Detailed Performance Data
PART 2 • DETAILED PERFORMANCE DATA
Effi ciency MeasuresNASA uses the Agency’s Strategic Goals, multi-year Outcomes, and Annual Performance Goals (APGS) to measure performance progress in program areas. NASA also uses Effi ciency Measure APGs to track the Agency’s performance in a number of management areas, including cost, schedule, and project completion.
NASA organizes the Effi ciency Measure APGs by budget Theme to emphasize and encourage individual program accountability. The follow-ing table documents the Agency’s performance against these metrics for FY 2006.
FY 2006 Performance Measure FY 2005 FY 2004 FY 2003
Aeronautics Technology
6AT12Green
Deliver at least 90% of scheduled operating hours for all operations and research facilities.
None None None
6AT13Green
Increase the annual percentage of research funding subject to external peer review prior to award.
None None None
Education
6ED11Green
Collect, analyze, and report the percentage of grantees that annually report on their accomplishments.
None None None
6ED12Red
Peer review and competitively award at least 80%, by budget, of research projects.
5ED19Green
4ED24Green
None
Constellation Systems
6CS5Green
Complete all development projects within 110% of the cost and schedule baseline.
None None None
6CS6Green
Increase annually the percentage of ESR&T and HSR&T technologies transitioned to Constellation Systems programs.
None None None
Exploration Systems Research and Technology
6ESRT13White
Complete all development projects within 110% of the cost and schedule baseline.
None None None
6PROM4White
Complete all development projects within 110% of the cost and schedule baseline.
None None None
6ESRT14White
Peer review and competitively award at least 80%, by budget, of research projects.
5HRT15Green
4HRT13Green
None
6ESRT15White
Reduce annually, the time to award competed projects, from proposal receipt to selection.
None None None
6PROM5White
Reduce annually, the time to award competed projects, from proposal receipt to selection.
None None None
Human Systems Research and TechnologyHuman Systems Research and Technology
6HSRT21Green
Deliver at least 90% of scheduled operating hours for all operations and research facilities.
5BSR19Green
4RPFS11Green
None
6HSRT22White
Increase annually, the percentage of grants awarded on a competitive basis.None None None
6HSRT23Green
Peer review and competitively award at least 80%, by budget, of research projects.
5BSR20Green
4BSR194PSR11Green
None
6HSRT247Green
Reduce time within which 80% of NRA research grants are awarded, from proposal due date to selection, by 5% per year, with a goal of 130 days.
None None None
APG Ratings
21
62%
Under Effi ciency Measures, NASA achieved 21 of 34 APGs.
9
26%
13%
39%
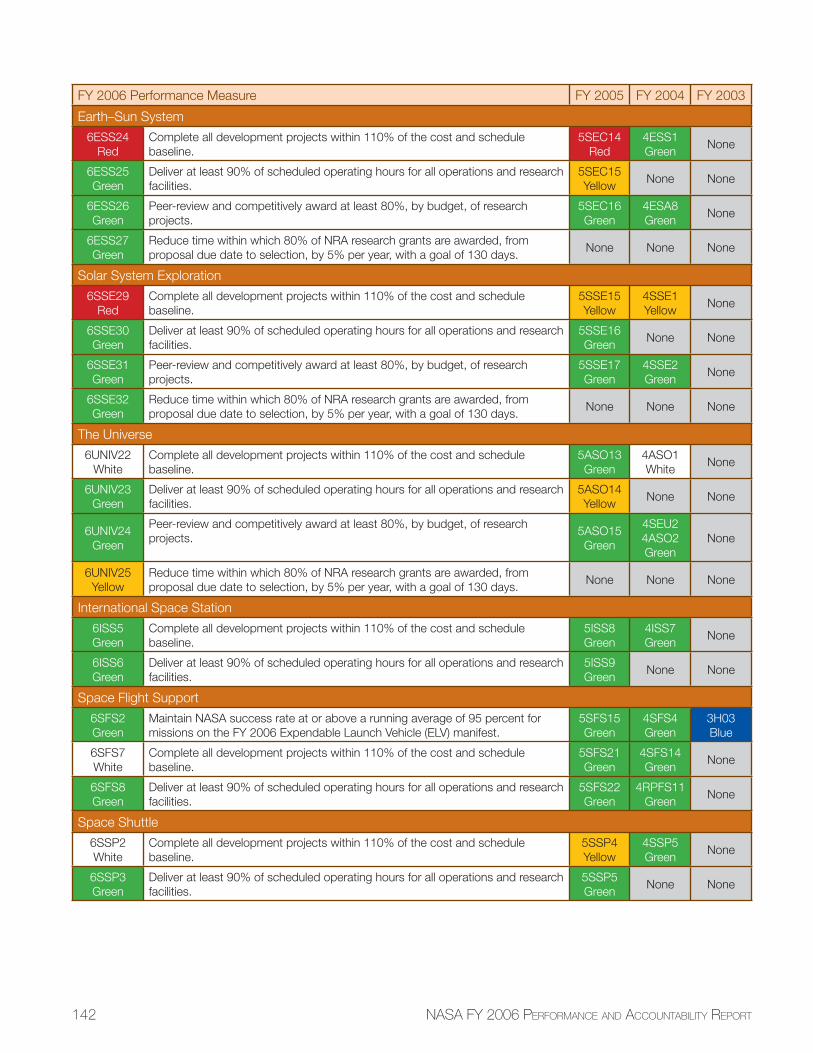
142 NASA FY 2006 PERFORMANCE AND ACCOUNTABILITY REPORT
FY 2006 Performance Measure FY 2005 FY 2004 FY 2003
Earth–Sun System
6ESS24Red
Complete all development projects within 110% of the cost and schedule baseline.
5SEC14Red
4ESS1Green
None
6ESS25Green
Deliver at least 90% of scheduled operating hours for all operations and research facilities.
5SEC15Yellow
None None
6ESS26Green
Peer-review and competitively award at least 80%, by budget, of research projects.
5SEC16Green
4ESA8Green
None
6ESS27Green
Reduce time within which 80% of NRA research grants are awarded, from proposal due date to selection, by 5% per year, with a goal of 130 days.
None None None
Solar System Exploration
6SSE29Red
Complete all development projects within 110% of the cost and schedule baseline.
5SSE15Yellow
4SSE1Yellow
None
6SSE30Green
Deliver at least 90% of scheduled operating hours for all operations and research facilities.
5SSE16Green
None None
6SSE31Green
Peer-review and competitively award at least 80%, by budget, of research projects.
5SSE17Green
4SSE2Green
None
6SSE32Green
Reduce time within which 80% of NRA research grants are awarded, from proposal due date to selection, by 5% per year, with a goal of 130 days.
None None None
The Universe
6UNIV22White
Complete all development projects within 110% of the cost and schedule baseline.
5ASO13Green
4ASO1White
None
6UNIV23Green
Deliver at least 90% of scheduled operating hours for all operations and research facilities.
5ASO14Yellow
None None
6UNIV24Green
Peer-review and competitively award at least 80%, by budget, of research projects.
5ASO15Green
4SEU24ASO2Green
None
6UNIV25Yellow
Reduce time within which 80% of NRA research grants are awarded, from proposal due date to selection, by 5% per year, with a goal of 130 days.
None None None
International Space Station
6ISS5Green
Complete all development projects within 110% of the cost and schedule baseline.
5ISS8Green
4ISS7Green
None
6ISS6Green
Deliver at least 90% of scheduled operating hours for all operations and research facilities.
5ISS9Green
None None
Space Flight Support
6SFS2Green
Maintain NASA success rate at or above a running average of 95 percent for missions on the FY 2006 Expendable Launch Vehicle (ELV) manifest.
5SFS15Green
4SFS4Green
3H03Blue
6SFS7White
Complete all development projects within 110% of the cost and schedule baseline.
5SFS21Green
4SFS14Green
None
6SFS8Green
Deliver at least 90% of scheduled operating hours for all operations and research facilities.
5SFS22Green
4RPFS11Green
None
Space Shuttle
6SSP2White
Complete all development projects within 110% of the cost and schedule baseline.
5SSP4Yellow
4SSP5Green
None
6SSP3Green
Deliver at least 90% of scheduled operating hours for all operations and research facilities.
5SSP5Green
None None
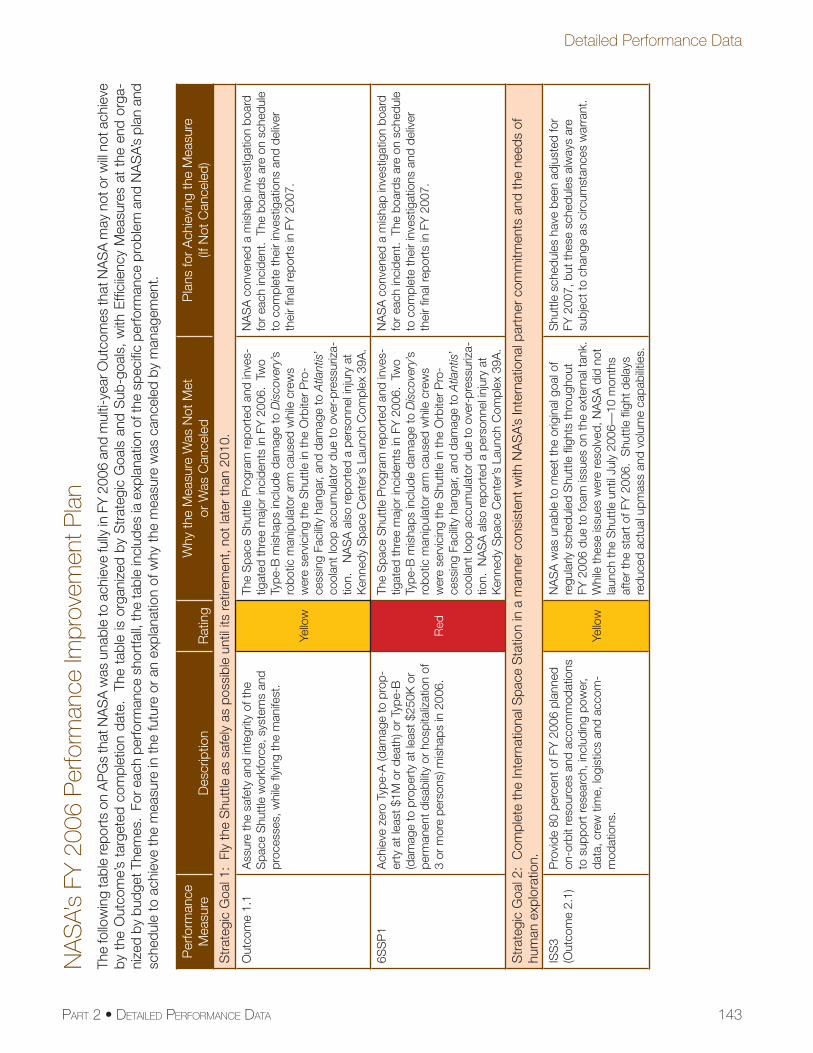
143PART 2 • DETAILED PERFORMANCE DATA
Detailed Performance Data
NA
SA’
s FY
200
6 P
erfo
rman
ce Im
prov
emen
t Pla
nTh
e fo
llow
ing
tabl
e re
port
s on
AP
Gs
that
NA
SA
was
una
ble
to a
chie
ve fu
lly in
FY
200
6 an
d m
ulti-
year
Out
com
es th
at N
AS
A m
ay n
ot o
r will
not a
chie
ve
by t
he O
utco
me’
s ta
rget
ed c
ompl
etio
n da
te.
The
tab
le is
org
aniz
ed b
y S
trat
egic
Goa
ls a
nd S
ub-g
oals
, w
ith E
ffi ci
ienc
y M
easu
res
at t
he e
nd o
rga-
nize
d by
bud
get T
hem
es.
For e
ach
perfo
rman
ce s
hort
fall,
the
tabl
e in
clud
es ia
exp
lana
tion
of th
e sp
ecifi
c pe
rform
ance
pro
blem
and
NA
SA’
s pl
an a
nd
sche
dule
to a
chie
ve th
e m
easu
re in
the
futu
re o
r an
exp
lana
tion
of w
hy th
e m
easu
re w
as c
ance
led
by m
anag
emen
t.
Per
form
ance
Mea
sure
Des
crip
tion
Rat
ing
Why
the
Mea
sure
Was
Not
Met
or
Was
Can
cele
dP
lans
for
Ach
ievi
ng th
e M
easu
re
(If N
ot C
ance
led)
Str
ateg
ic G
oal 1
: Fl
y th
e S
hutt
le a
s sa
fely
as
poss
ible
unt
il its
retir
emen
t, no
t lat
er th
an 2
010.
Out
com
e 1.
1A
ssur
e th
e sa
fety
and
inte
grity
of t
he
Spa
ce S
hutt
le w
orkf
orce
, sys
tem
s an
d pr
oces
ses,
whi
le fl
ying
the
man
ifest
.
Yello
w
The
Spa
ce S
hutt
le P
rogr
am re
port
ed a
nd in
ves-
tigat
ed th
ree
maj
or in
cide
nts
in F
Y 2
006.
Tw
o Ty
pe-B
mis
haps
incl
ude
dam
age
to D
isco
very
’s
robo
tic m
anip
ulat
or a
rm c
ause
d w
hile
cre
ws
wer
e se
rvic
ing
the
Shu
ttle
in th
e O
rbite
r P
ro-
cess
ing
Faci
lity
hang
ar, a
nd d
amag
e to
Atla
ntis
’ co
olan
t loo
p ac
cum
ulat
or d
ue to
ove
r-pr
essu
riza-
tion.
N
AS
A a
lso
repo
rted
a p
erso
nnel
inju
ry a
t K
enne
dy S
pace
Cen
ter’s
Lau
nch
Com
plex
39A
.
NA
SA
con
vene
d a
mis
hap
inve
stig
atio
n bo
ard
for
each
inci
dent
. Th
e bo
ards
are
on
sche
dule
to
com
plet
e th
eir
inve
stig
atio
ns a
nd d
eliv
er
thei
r fi n
al re
port
s in
FY
200
7.
6SS
P1
Ach
ieve
zer
o Ty
pe-A
(dam
age
to p
rop-
erty
at l
east
$1M
or
deat
h) o
r Ty
pe-B
(d
amag
e to
pro
pert
y at
leas
t $25
0K o
r pe
rman
ent d
isab
ility
or h
ospi
taliz
atio
n of
3
or m
ore
pers
ons)
mis
haps
in 2
006.
Red
The
Spa
ce S
hutt
le P
rogr
am re
port
ed a
nd in
ves-
tigat
ed th
ree
maj
or in
cide
nts
in F
Y 2
006.
Tw
o Ty
pe-B
mis
haps
incl
ude
dam
age
to D
isco
very
’s
robo
tic m
anip
ulat
or a
rm c
ause
d w
hile
cre
ws
wer
e se
rvic
ing
the
Shu
ttle
in th
e O
rbite
r P
ro-
cess
ing
Faci
lity
hang
ar, a
nd d
amag
e to
Atla
ntis
’ co
olan
t loo
p ac
cum
ulat
or d
ue to
ove
r-pr
essu
riza-
tion.
NA
SA
als
o re
port
ed a
per
sonn
el in
jury
at
Ken
nedy
Spa
ce C
ente
r’s L
aunc
h C
ompl
ex 3
9A.
NA
SA
con
vene
d a
mis
hap
inve
stig
atio
n bo
ard
for
each
inci
dent
. Th
e bo
ards
are
on
sche
dule
to
com
plet
e th
eir
inve
stig
atio
ns a
nd d
eliv
er
thei
r fi n
al re
port
s in
FY
200
7.
Str
ateg
ic G
oal 2
: C
ompl
ete
the
Inte
rnat
iona
l Spa
ce S
tatio
n in
a m
anne
r co
nsis
tent
with
NA
SA’
s In
tern
atio
nal p
artn
er c
omm
itmen
ts a
nd th
e ne
eds
of
hum
an e
xplo
ratio
n.
ISS
3(O
utco
me
2.1)
Pro
vide
80
perc
ent o
f FY
200
6 pl
anne
d on
-orb
it re
sour
ces
and
acco
mm
odat
ions
to
sup
port
rese
arch
, inc
ludi
ng p
ower
, da
ta, c
rew
tim
e, lo
gist
ics
and
acco
m-
mod
atio
ns.
Yello
w
NA
SA
was
una
ble
to m
eet t
he o
rigin
al g
oal o
f re
gula
rly s
ched
uled
Shu
ttle
fl ig
hts
thro
ugho
ut
FY 2
006
due
to fo
am is
sues
on
the
exte
rnal
tank
. W
hile
thes
e is
sues
wer
e re
solv
ed, N
AS
A d
id n
ot
laun
ch th
e S
hutt
le u
ntil
July
200
6—10
mon
ths
afte
r th
e st
art o
f FY
200
6. S
hutt
le fl
ight
del
ays
redu
ced
actu
al u
pmas
s an
d vo
lum
e ca
pabi
litie
s.
Shu
ttle
sch
edul
es h
ave
been
adj
uste
d fo
r FY
200
7, b
ut th
ese
sche
dule
s al
way
s ar
e su
bjec
t to
chan
ge a
s ci
rcum
stan
ces
war
rant
.
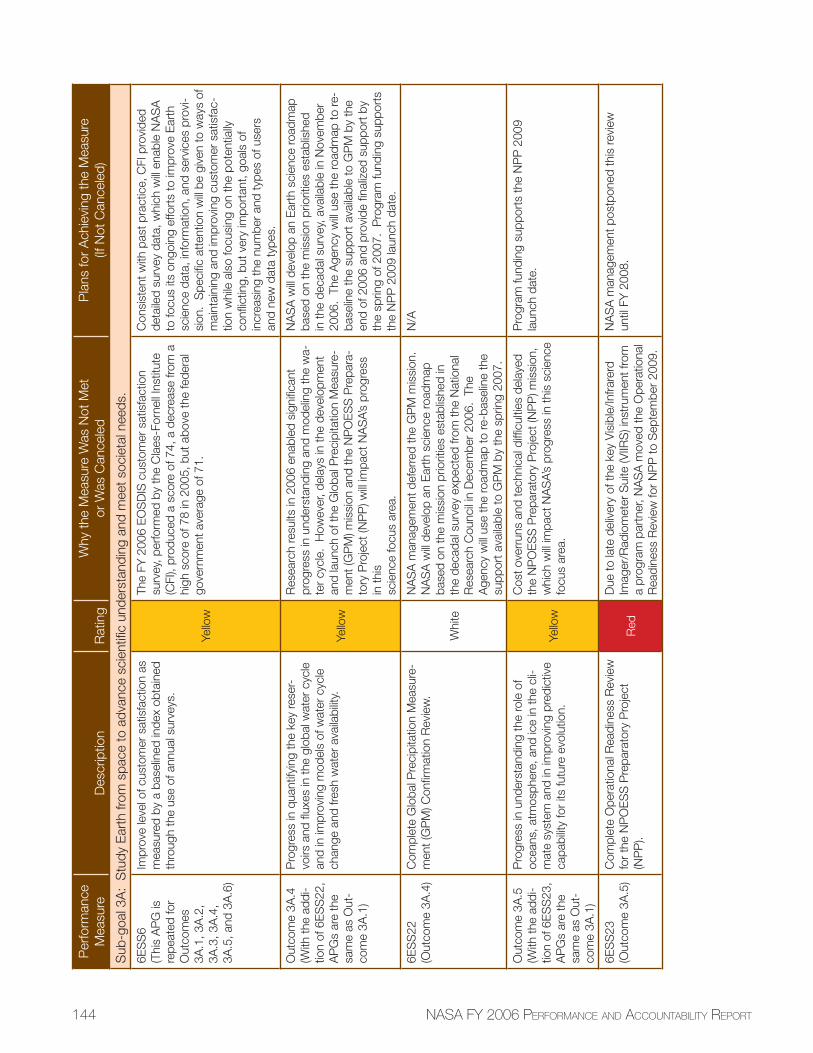
144 NASA FY 2006 PERFORMANCE AND ACCOUNTABILITY REPORT
Per
form
ance
Mea
sure
Des
crip
tion
Rat
ing
Why
the
Mea
sure
Was
Not
Met
or
Was
Can
cele
dP
lans
for
Ach
ievi
ng th
e M
easu
re
(If N
ot C
ance
led)
Sub
-goa
l 3A
: S
tudy
Ear
th fr
om s
pace
to a
dvan
ce s
cien
tifi c
und
erst
andi
ng a
nd m
eet s
ocie
tal n
eeds
.
6ES
S6
(Thi
s A
PG
is
repe
ated
for
Out
com
es
3A.1
, 3A
.2,
3A.3
, 3A
.4,
3A.5
, and
3A
.6)
Impr
ove
leve
l of c
usto
mer
sat
isfa
ctio
n as
m
easu
red
by a
bas
elin
ed in
dex
obta
ined
th
roug
h th
e us
e of
ann
ual s
urve
ys.
Yello
w
The
FY 2
006
EO
SD
IS c
usto
mer
sat
isfa
ctio
n su
rvey
, per
form
ed b
y th
e C
laes
-For
nell
Inst
itute
(C
FI),
prod
uced
a s
core
of 7
4, a
dec
reas
e fro
m a
hi
gh s
core
of 7
8 in
200
5, b
ut a
bove
the
fede
ral
gove
rnm
ent a
vera
ge o
f 71.
Con
sist
ent w
ith p
ast p
ract
ice,
CFI
pro
vide
d de
taile
d su
rvey
dat
a, w
hich
will
enab
le N
AS
A
to fo
cus
its o
ngoi
ng e
ffort
s to
impr
ove
Ear
th
scie
nce
data
, inf
orm
atio
n, a
nd s
ervi
ces
prov
i-si
on.
Spe
cifi c
att
entio
n w
ill be
giv
en to
way
s of
m
aint
aini
ng a
nd im
prov
ing
cust
omer
sat
isfa
c-tio
n w
hile
als
o fo
cusi
ng o
n th
e po
tent
ially
co
nfl ic
ting,
but
ver
y im
port
ant,
goal
s of
in
crea
sing
the
num
ber
and
type
s of
use
rs
and
new
dat
a ty
pes.
Out
com
e 3A
.4(W
ith th
e ad
di-
tion
of 6
ES
S22
, A
PG
s ar
e th
e sa
me
as O
ut-
com
e 3A
.1)
Pro
gres
s in
qua
ntify
ing
the
key
rese
r-vo
irs a
nd fl
uxes
in th
e gl
obal
wat
er c
ycle
an
d in
impr
ovin
g m
odel
s of
wat
er c
ycle
ch
ange
and
fres
h w
ater
ava
ilabi
lity.
Ye
llow
Res
earc
h re
sults
in 2
006
enab
led
sign
ifi ca
nt
prog
ress
in u
nder
stan
ding
and
mod
elin
g th
e w
a-te
r cy
cle.
How
ever
, del
ays
in th
e de
velo
pmen
t an
d la
unch
of t
he G
loba
l Pre
cipi
tatio
n M
easu
re-
men
t (G
PM
) mis
sion
and
the
NP
OE
SS
Pre
para
-to
ry P
roje
ct (N
PP
) will
impa
ct N
AS
A’s
prog
ress
in
this
sc
ienc
e fo
cus
area
.
NA
SA
will
deve
lop
an E
arth
sci
ence
road
map
ba
sed
on th
e m
issi
on p
riorit
ies
esta
blis
hed
in th
e de
cada
l sur
vey,
ava
ilabl
e in
Nov
embe
r 20
06.
The
Age
ncy
will
use
the
road
map
to re
-ba
selin
e th
e su
ppor
t ava
ilabl
e to
GP
M b
y th
e en
d of
200
6 an
d pr
ovid
e fi n
aliz
ed s
uppo
rt b
y th
e sp
ring
of 2
007.
Pro
gram
fund
ing
supp
orts
th
e N
PP
200
9 la
unch
dat
e.
6ES
S22
(Out
com
e 3A
.4)
Com
plet
e G
loba
l Pre
cipi
tatio
n M
easu
re-
men
t (G
PM
) Con
fi rm
atio
n R
evie
w.
Whi
te
NA
SA
man
agem
ent d
efer
red
the
GP
M m
issi
on.
NA
SA
will
deve
lop
an E
arth
sci
ence
road
map
ba
sed
on th
e m
issi
on p
riorit
ies
esta
blis
hed
in
the
deca
dal s
urve
y ex
pect
ed fr
om th
e N
atio
nal
Res
earc
h C
ounc
il in
Dec
embe
r 20
06.
The
Age
ncy
will
use
the
road
map
to re
-bas
elin
e th
e su
ppor
t ava
ilabl
e to
GP
M b
y th
e sp
ring
2007
.
N/A
Out
com
e 3A
.5(W
ith th
e ad
di-
tion
of 6
ES
S23
, A
PG
s ar
e th
e sa
me
as O
ut-
com
e 3A
.1)
Pro
gres
s in
und
erst
andi
ng th
e ro
le o
f oc
eans
, atm
osph
ere,
and
ice
in th
e cl
i-m
ate
syst
em a
nd in
impr
ovin
g pr
edic
tive
capa
bilit
y fo
r its
futu
re e
volu
tion.
Ye
llow
Cos
t ove
rrun
s an
d te
chni
cal d
iffi c
ultie
s de
laye
d th
e N
PO
ES
S P
repa
rato
ry P
roje
ct (N
PP
) mis
sion
, w
hich
will
impa
ct N
AS
A’s
prog
ress
in th
is s
cien
ce
focu
s ar
ea.
Pro
gram
fund
ing
supp
orts
the
NP
P 2
009
laun
ch d
ate.
6ES
S23
(Out
com
e 3A
.5)
Com
plet
e O
pera
tiona
l Rea
dine
ss R
evie
w
for
the
NP
OE
SS
Pre
para
tory
Pro
ject
(N
PP
).R
ed
Due
to la
te d
eliv
ery
of th
e ke
y V
isib
le/In
frare
rd
Imag
er/R
adio
met
er S
uite
(VIIR
S) i
nstr
umen
t fro
m
a pr
ogra
m p
artn
er, N
AS
A m
oved
the
Ope
ratio
nal
Rea
dine
ss R
evie
w fo
r N
PP
to S
epte
mbe
r 20
09.
NA
SA
man
agem
ent p
ostp
oned
this
revi
ew
until
FY
200
8.
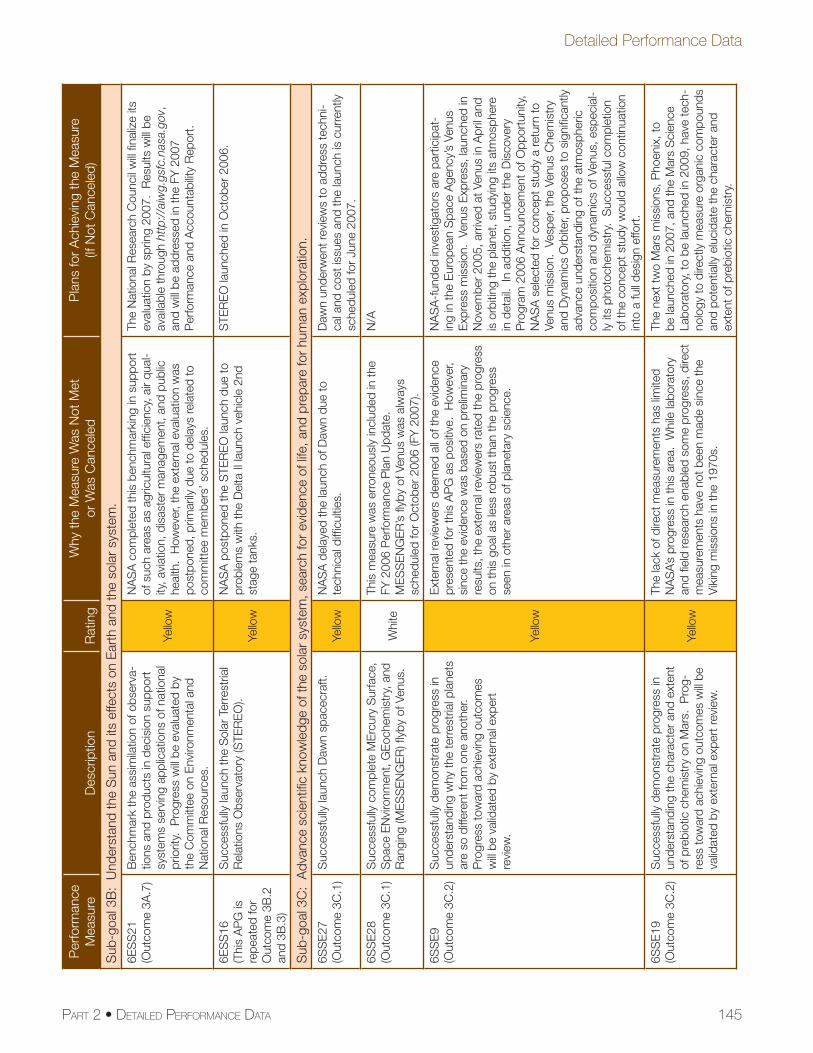
145PART 2 • DETAILED PERFORMANCE DATA
Detailed Performance Data
Per
form
ance
Mea
sure
Des
crip
tion
Rat
ing
Why
the
Mea
sure
Was
Not
Met
or
Was
Can
cele
dP
lans
for
Ach
ievi
ng th
e M
easu
re
(If N
ot C
ance
led)
Sub
-goa
l 3B
: U
nder
stan
d th
e S
un a
nd it
s ef
fect
s on
Ear
th a
nd th
e so
lar
syst
em.
6ES
S21
(Out
com
e 3A
.7)
Ben
chm
ark
the
assi
mila
tion
of o
bser
va-
tions
and
pro
duct
s in
dec
isio
n su
ppor
t sy
stem
s se
rvin
g ap
plic
atio
ns o
f nat
iona
l pr
iorit
y. P
rogr
ess
will
be e
valu
ated
by
the
Com
mitt
ee o
n E
nviro
nmen
tal a
nd
Nat
iona
l Res
ourc
es.
Yello
w
NA
SA
com
plet
ed th
is b
ench
mar
king
in s
uppo
rt
of s
uch
area
s as
agr
icul
tura
l effi
cien
cy, a
ir qu
al-
ity, a
viat
ion,
dis
aste
r m
anag
emen
t, an
d pu
blic
he
alth
. H
owev
er, t
he e
xter
nal e
valu
atio
n w
as
post
pone
d, p
rimar
ily d
ue to
del
ays
rela
ted
to
com
mitt
ee m
embe
rs’ s
ched
ules
.
The
Nat
iona
l Res
earc
h C
ounc
il w
ill fi n
aliz
e its
ev
alua
tion
by s
prin
g 20
07.
Res
ults
will
be
avai
labl
e th
roug
h ht
tp:/
/aiw
g.gs
fc.n
asa.
gov,
an
d w
ill be
add
ress
ed in
the
FY 2
007
Per
form
ance
and
Acc
ount
abilit
y R
epor
t.
6ES
S16
(Thi
s A
PG
is
repe
ated
for
Out
com
e 3B
.2
and
3B.3
)
Suc
cess
fully
laun
ch th
e S
olar
Ter
rest
rial
Rel
atio
ns O
bser
vato
ry (S
TER
EO
).
Yello
w
NA
SA
pos
tpon
ed th
e S
TER
EO
laun
ch d
ue to
pr
oble
ms
with
the
Del
ta II
laun
ch v
ehic
le 2
nd
stag
e ta
nks.
STE
RE
O la
unch
ed in
Oct
ober
200
6.
Sub
-goa
l 3C
: A
dvan
ce s
cien
tifi c
kno
wle
dge
of th
e so
lar
syst
em, s
earc
h fo
r ev
iden
ce o
f life
, and
pre
pare
for
hum
an e
xplo
ratio
n.
6SS
E27
(Out
com
e 3C
.1)
Suc
cess
fully
laun
ch D
awn
spac
ecra
ft.Ye
llow
NA
SA
del
ayed
the
laun
ch o
f Daw
n du
e to
te
chni
cal d
iffi c
ultie
s.
Daw
n un
derw
ent r
evie
ws
to a
ddre
ss te
chni
-ca
l and
cos
t iss
ues
and
the
laun
ch is
cur
rent
ly
sche
dule
d fo
r Ju
ne 2
007.
6SS
E28
(Out
com
e 3C
.1)
Suc
cess
fully
com
plet
e M
Erc
ury
Sur
face
, S
pace
EN
viro
nmen
t, G
Eoc
hem
istr
y, a
nd
Ran
ging
(ME
SS
EN
GE
R) fl
yby
of V
enus
.W
hite
This
mea
sure
was
err
oneo
usly
incl
uded
in th
e FY
200
6 P
erfo
rman
ce P
lan
Upd
ate.
M
ES
SE
NG
ER
’s fl
yby
of V
enus
was
alw
ays
sche
dule
d fo
r O
ctob
er 2
006
(FY
200
7).
N/A
6SS
E9
(Out
com
e 3C
.2)
Suc
cess
fully
dem
onst
rate
pro
gres
s in
un
ders
tand
ing
why
the
terr
estr
ial p
lane
ts
are
so d
iffer
ent f
rom
one
ano
ther
. P
rogr
ess
tow
ard
achi
evin
g ou
tcom
es
will
be v
alid
ated
by
exte
rnal
exp
ert
revi
ew.
Yello
w
Ext
erna
l rev
iew
ers
deem
ed a
ll of
the
evid
ence
pr
esen
ted
for
this
AP
G a
s po
sitiv
e. H
owev
er,
sinc
e th
e ev
iden
ce w
as b
ased
on
prel
imin
ary
resu
lts, t
he e
xter
nal r
evie
wer
s ra
ted
the
prog
ress
on
this
goa
l as
less
robu
st th
an th
e pr
ogre
ss
seen
in o
ther
are
as o
f pla
neta
ry s
cien
ce.
NA
SA
-fun
ded
inve
stig
ator
s ar
e pa
rtic
ipat
-in
g in
the
Eur
opea
n S
pace
Age
ncy’
s Ve
nus
Exp
ress
mis
sion
. Ve
nus
Exp
ress
, lau
nche
d in
N
ovem
ber
2005
, arr
ived
at V
enus
in A
pril
and
is o
rbiti
ng th
e pl
anet
, stu
dyin
g its
atm
osph
ere
in d
etai
l. In
add
ition
, und
er th
e D
isco
very
P
rogr
am 2
006
Ann
ounc
emen
t of O
ppor
tuni
ty,
NA
SA
sel
ecte
d fo
r co
ncep
t stu
dy a
retu
rn to
Ve
nus
mis
sion
. Ve
sper
, the
Ven
us C
hem
istr
y an
d D
ynam
ics
Orb
iter,
prop
oses
to s
igni
fi can
tly
adva
nce
unde
rsta
ndin
g of
the
atm
osph
eric
co
mpo
sitio
n an
d dy
nam
ics
of V
enus
, esp
ecia
l-ly
its
phot
oche
mis
try.
Suc
cess
ful c
ompl
etio
n of
the
conc
ept s
tudy
wou
ld a
llow
con
tinua
tion
into
a fu
ll de
sign
effo
rt.
6SS
E19
(Out
com
e 3C
.2)
Suc
cess
fully
dem
onst
rate
pro
gres
s in
un
ders
tand
ing
the
char
acte
r an
d ex
tent
of
pre
biot
ic c
hem
istr
y on
Mar
s. P
rog-
ress
tow
ard
achi
evin
g ou
tcom
es w
ill be
va
lidat
ed b
y ex
tern
al e
xper
t rev
iew
.
Yello
w
The
lack
of d
irect
mea
sure
men
ts h
as li
mite
d N
AS
A’s
prog
ress
in th
is a
rea.
Whi
le la
bora
tory
an
d fi e
ld re
sear
ch e
nabl
ed s
ome
prog
ress
, dire
ct
mea
sure
men
ts h
ave
not b
een
mad
e si
nce
the
Vik
ing
mis
sion
s in
the
1970
s.
The
next
two
Mar
s m
issi
ons,
Pho
enix
, to
be la
unch
ed in
200
7, a
nd th
e M
ars
Sci
ence
La
bora
tory
, to
be la
unch
ed in
200
9, h
ave
tech
-no
logy
to d
irect
ly m
easu
re o
rgan
ic c
ompo
unds
an
d po
tent
ially
elu
cida
te th
e ch
arac
ter
and
exte
nt o
f pre
biot
ic c
hem
istr
y.
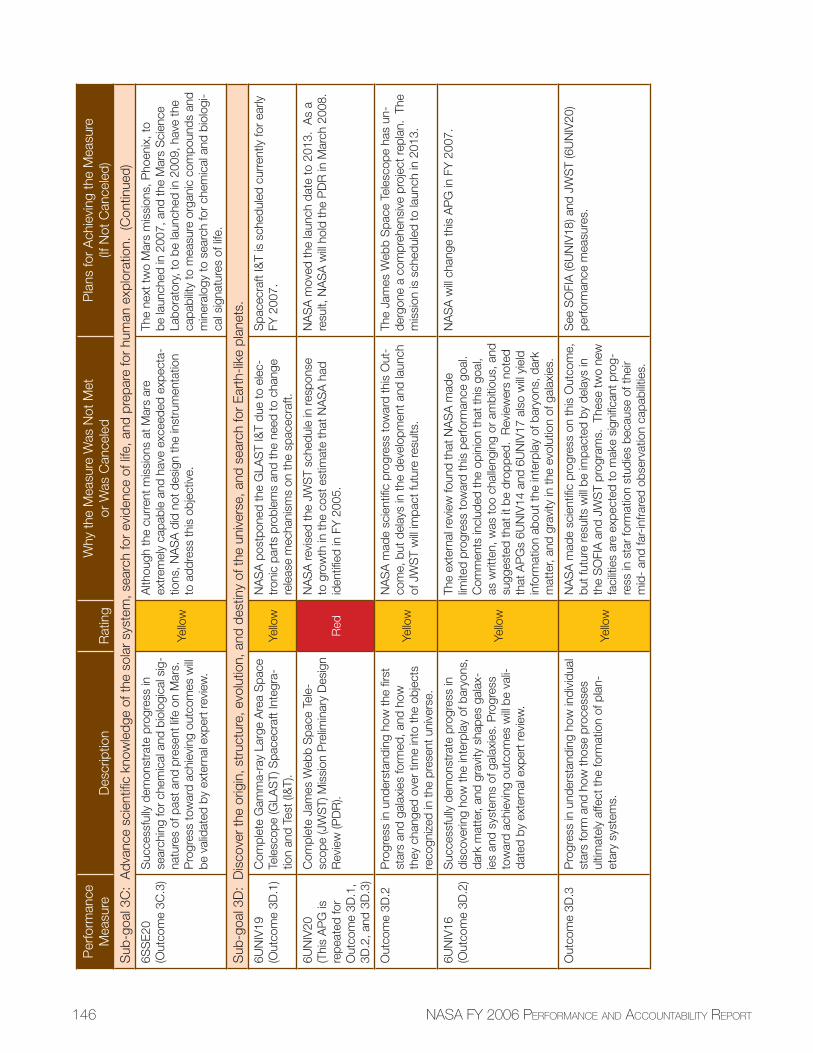
146 NASA FY 2006 PERFORMANCE AND ACCOUNTABILITY REPORT
Per
form
ance
Mea
sure
Des
crip
tion
Rat
ing
Why
the
Mea
sure
Was
Not
Met
or
Was
Can
cele
dP
lans
for
Ach
ievi
ng th
e M
easu
re
(If N
ot C
ance
led)
Sub
-goa
l 3C
: A
dvan
ce s
cien
tifi c
kno
wle
dge
of th
e so
lar
syst
em, s
earc
h fo
r ev
iden
ce o
f life
, and
pre
pare
for
hum
an e
xplo
ratio
n. (
Con
tinue
d)
6SS
E20
(Out
com
e 3C
.3)
Suc
cess
fully
dem
onst
rate
pro
gres
s in
se
arch
ing
for
chem
ical
and
bio
logi
cal s
ig-
natu
res
of p
ast a
nd p
rese
nt li
fe o
n M
ars.
P
rogr
ess
tow
ard
achi
evin
g ou
tcom
es w
ill be
val
idat
ed b
y ex
tern
al e
xper
t rev
iew
.
Yello
w
Alth
ough
the
curr
ent m
issi
ons
at M
ars
are
extr
emel
y ca
pabl
e an
d ha
ve e
xcee
ded
expe
cta-
tions
, NA
SA
did
not
des
ign
the
inst
rum
enta
tion
to a
ddre
ss th
is o
bjec
tive.
The
next
two
Mar
s m
issi
ons,
Pho
enix
, to
be la
unch
ed in
200
7, a
nd th
e M
ars
Sci
ence
La
bora
tory
, to
be la
unch
ed in
200
9, h
ave
the
capa
bilit
y to
mea
sure
org
anic
com
poun
ds a
nd
min
eral
ogy
to s
earc
h fo
r ch
emic
al a
nd b
iolo
gi-
cal s
igna
ture
s of
life
.
Sub
-goa
l 3D
: D
isco
ver
the
orig
in, s
truc
ture
, evo
lutio
n, a
nd d
estin
y of
the
univ
erse
, and
sea
rch
for
Ear
th-li
ke p
lane
ts.
6UN
IV19
(Out
com
e 3D
.1)
Com
plet
e G
amm
a-ra
y La
rge
Are
a S
pace
Te
lesc
ope
(GLA
ST)
Spa
cecr
aft I
nteg
ra-
tion
and
Test
(I&
T).
Yello
wN
AS
A p
ostp
oned
the
GLA
ST
I&T
due
to e
lec-
tron
ic p
arts
pro
blem
s an
d th
e ne
ed to
cha
nge
rele
ase
mec
hani
sms
on th
e sp
acec
raft.
Spa
cecr
aft I
&T
is s
ched
uled
cur
rent
ly fo
r ea
rly
FY 2
007.
6UN
IV20
(Thi
s A
PG
is
repe
ated
for
Out
com
e 3D
.1,
3D.2
, and
3D
.3)
Com
plet
e Ja
mes
Web
b S
pace
Tel
e-sc
ope
(JW
ST)
Mis
sion
Pre
limin
ary
Des
ign
Rev
iew
(PD
R).
Red
NA
SA
revi
sed
the
JWS
T sc
hedu
le in
resp
onse
to
gro
wth
in th
e co
st e
stim
ate
that
NA
SA
had
id
entifi
ed
in F
Y 2
005.
NA
SA
mov
ed th
e la
unch
dat
e to
201
3. A
s a
resu
lt, N
AS
A w
ill ho
ld th
e P
DR
in M
arch
200
8.
Out
com
e 3D
.2P
rogr
ess
in u
nder
stan
ding
how
the
fi rst
st
ars
and
gala
xies
form
ed, a
nd h
ow
they
cha
nged
ove
r tim
e in
to th
e ob
ject
s re
cogn
ized
in th
e pr
esen
t uni
vers
e.
Yello
w
NA
SA
mad
e sc
ient
ifi c
prog
ress
tow
ard
this
Out
-co
me,
but
del
ays
in th
e de
velo
pmen
t and
laun
ch
of J
WS
T w
ill im
pact
futu
re re
sults
.
The
Jam
es W
ebb
Spa
ce T
eles
cope
has
un-
derg
one
a co
mpr
ehen
sive
pro
ject
repl
an.
The
mis
sion
is s
ched
uled
to la
unch
in 2
013.
6UN
IV16
(Out
com
e 3D
.2)
Suc
cess
fully
dem
onst
rate
pro
gres
s in
di
scov
erin
g ho
w th
e in
terp
lay
of b
aryo
ns,
dark
mat
ter,
and
grav
ity s
hape
s ga
lax-
ies
and
syst
ems
of g
alax
ies.
Pro
gres
s to
war
d ac
hiev
ing
outc
omes
will
be v
ali-
date
d by
ext
erna
l exp
ert r
evie
w.
Yello
w
The
exte
rnal
revi
ew fo
und
that
NA
SA
mad
e lim
ited
prog
ress
tow
ard
this
per
form
ance
goa
l.
Com
men
ts in
clud
ed th
e op
inio
n th
at th
is g
oal,
as w
ritte
n, w
as to
o ch
alle
ngin
g or
am
bitio
us, a
nd
sugg
este
d th
at it
be
drop
ped.
Rev
iew
ers
note
d th
at A
PG
s 6U
NIV
14 a
nd 6
UN
IV17
als
o w
ill yi
eld
info
rmat
ion
abou
t the
inte
rpla
y of
bar
yons
, dar
k m
atte
r, an
d gr
avity
in th
e ev
olut
ion
of g
alax
ies.
NA
SA
will
chan
ge th
is A
PG
in F
Y 2
007.
Out
com
e 3D
.3P
rogr
ess
in u
nder
stan
ding
how
indi
vidu
al
star
s fo
rm a
nd h
ow th
ose
proc
esse
s ul
timat
ely
affe
ct th
e fo
rmat
ion
of p
lan-
etar
y sy
stem
s.Ye
llow
NA
SA
mad
e sc
ient
ifi c
prog
ress
on
this
Out
com
e,
but f
utur
e re
sults
will
be im
pact
ed b
y de
lays
in
the
SO
FIA
and
JW
ST
prog
ram
s. T
hese
two
new
fa
cilit
ies
are
expe
cted
to m
ake
sign
ifi ca
nt p
rog-
ress
in s
tar
form
atio
n st
udie
s be
caus
e of
thei
r m
id-
and
far-
infra
red
obse
rvat
ion
capa
bilit
ies.
See
SO
FIA
(6U
NIV
18) a
nd J
WS
T (6
UN
IV20
) pe
rform
ance
mea
sure
s.
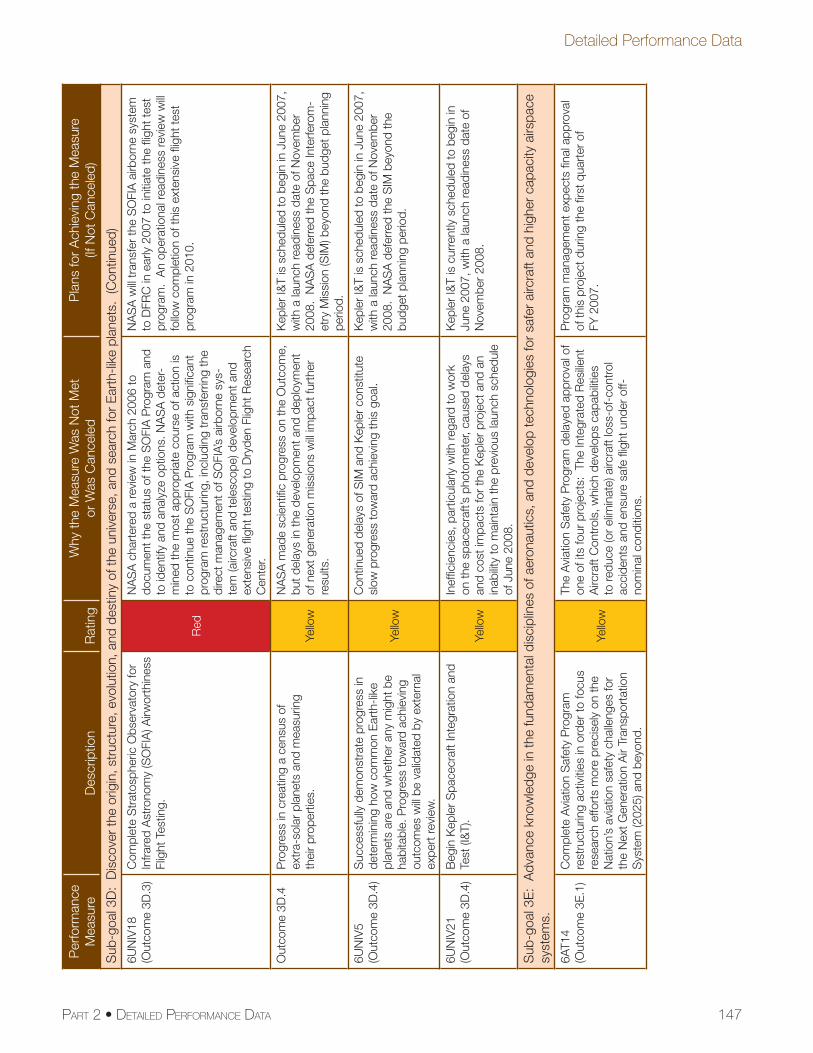
147PART 2 • DETAILED PERFORMANCE DATA
Detailed Performance Data
Per
form
ance
Mea
sure
Des
crip
tion
Rat
ing
Why
the
Mea
sure
Was
Not
Met
or
Was
Can
cele
dP
lans
for
Ach
ievi
ng th
e M
easu
re
(If N
ot C
ance
led)
Sub
-goa
l 3D
: D
isco
ver
the
orig
in, s
truc
ture
, evo
lutio
n, a
nd d
estin
y of
the
univ
erse
, and
sea
rch
for
Ear
th-li
ke p
lane
ts.
(Con
tinue
d)
6UN
IV18
(Out
com
e 3D
.3)
Com
plet
e S
trat
osph
eric
Obs
erva
tory
for
Infra
red
Ast
rono
my
(SO
FIA
) Airw
orth
ines
s Fl
ight
Tes
ting.
Red
NA
SA
cha
rter
ed a
revi
ew in
Mar
ch 2
006
to
docu
men
t the
sta
tus
of th
e S
OFI
A P
rogr
am a
nd
to id
entif
y an
d an
alyz
e op
tions
. NA
SA
det
er-
min
ed th
e m
ost a
ppro
pria
te c
ours
e of
act
ion
is
to c
ontin
ue th
e S
OFI
A P
rogr
am w
ith s
igni
fi can
t pr
ogra
m re
stru
ctur
ing,
incl
udin
g tr
ansf
errin
g th
e di
rect
man
agem
ent o
f SO
FIA’
s ai
rbor
ne s
ys-
tem
(airc
raft
and
tele
scop
e) d
evel
opm
ent a
nd
exte
nsiv
e fl i
ght t
estin
g to
Dry
den
Flig
ht R
esea
rch
Cen
ter.
NA
SA
will
tran
sfer
the
SO
FIA
airb
orne
sys
tem
to
DFR
C in
ear
ly 2
007
to in
itiat
e th
e fl i
ght t
est
prog
ram
. A
n op
erat
iona
l rea
dine
ss re
view
will
follo
w c
ompl
etio
n of
this
ext
ensi
ve fl
ight
test
pr
ogra
m in
201
0.
Out
com
e 3D
.4P
rogr
ess
in c
reat
ing
a ce
nsus
of
extr
a-so
lar
plan
ets
and
mea
surin
g th
eir
prop
ertie
s.Ye
llow
NA
SA
mad
e sc
ient
ifi c
prog
ress
on
the
Out
com
e,
but d
elay
s in
the
deve
lopm
ent a
nd d
eplo
ymen
t of
nex
t gen
erat
ion
mis
sion
s w
ill im
pact
furt
her
resu
lts.
Kep
ler
I&T
is s
ched
uled
to b
egin
in J
une
2007
, w
ith a
laun
ch re
adin
ess
date
of N
ovem
ber
2008
. N
AS
A d
efer
red
the
Spa
ce In
terfe
rom
-et
ry M
issi
on (S
IM) b
eyon
d th
e bu
dget
pla
nnin
g pe
riod.
6UN
IV5
(Out
com
e 3D
.4)
Suc
cess
fully
dem
onst
rate
pro
gres
s in
de
term
inin
g ho
w c
omm
on E
arth
-like
pl
anet
s ar
e an
d w
heth
er a
ny m
ight
be
habi
tabl
e. P
rogr
ess
tow
ard
achi
evin
g ou
tcom
es w
ill be
val
idat
ed b
y ex
tern
al
expe
rt re
view
.
Yello
w
Con
tinue
d de
lays
of S
IM a
nd K
eple
r co
nstit
ute
slow
pro
gres
s to
war
d ac
hiev
ing
this
goa
l.K
eple
r I&
T is
sch
edul
ed to
beg
in in
Jun
e 20
07,
with
a la
unch
read
ines
s da
te o
f Nov
embe
r 20
08.
NA
SA
def
erre
d th
e S
IM b
eyon
d th
e bu
dget
pla
nnin
g pe
riod.
6UN
IV21
(Out
com
e 3D
.4)
Beg
in K
eple
r S
pace
craf
t Int
egra
tion
and
Test
(I&
T).
Yello
w
Inef
fi cie
ncie
s, p
artic
ular
ly w
ith re
gard
to w
ork
on th
e sp
acec
raft’
s ph
otom
eter
, cau
sed
dela
ys
and
cost
impa
cts
for
the
Kep
ler
proj
ect a
nd a
n in
abilit
y to
mai
ntai
n th
e pr
evio
us la
unch
sch
edul
e of
Jun
e 20
08.
Kep
ler
I&T
is c
urre
ntly
sch
edul
ed to
beg
in in
Ju
ne 2
007,
with
a la
unch
read
ines
s da
te o
f N
ovem
ber
2008
.
Sub
-goa
l 3E
: A
dvan
ce k
now
ledg
e in
the
fund
amen
tal d
isci
plin
es o
f aer
onau
tics,
and
dev
elop
tech
nolo
gies
for
safe
r ai
rcra
ft an
d hi
gher
cap
acity
airs
pace
sy
stem
s.
6AT1
4(O
utco
me
3E.1
)C
ompl
ete
Avi
atio
n S
afet
y P
rogr
am
rest
ruct
urin
g ac
tiviti
es in
ord
er to
focu
s re
sear
ch e
ffort
s m
ore
prec
isel
y on
the
Nat
ion’
s av
iatio
n sa
fety
cha
lleng
es fo
r th
e N
ext G
ener
atio
n A
ir Tr
ansp
orta
tion
Sys
tem
(202
5) a
nd b
eyon
d.
Yello
w
The
Avi
atio
n S
afet
y P
rogr
am d
elay
ed a
ppro
val o
f on
e of
its
four
pro
ject
s: T
he In
tegr
ated
Res
ilient
A
ircra
ft C
ontr
ols,
whi
ch d
evel
ops
capa
bilit
ies
to re
duce
(or
elim
inat
e) a
ircra
ft lo
ss-o
f-co
ntro
l ac
cide
nts
and
ensu
re s
afe
fl igh
t und
er o
ff-no
min
al c
ondi
tions
.
Pro
gram
man
agem
ent e
xpec
ts fi
nal a
ppro
val
of th
is p
roje
ct d
urin
g th
e fi r
st q
uart
er o
f FY
200
7.
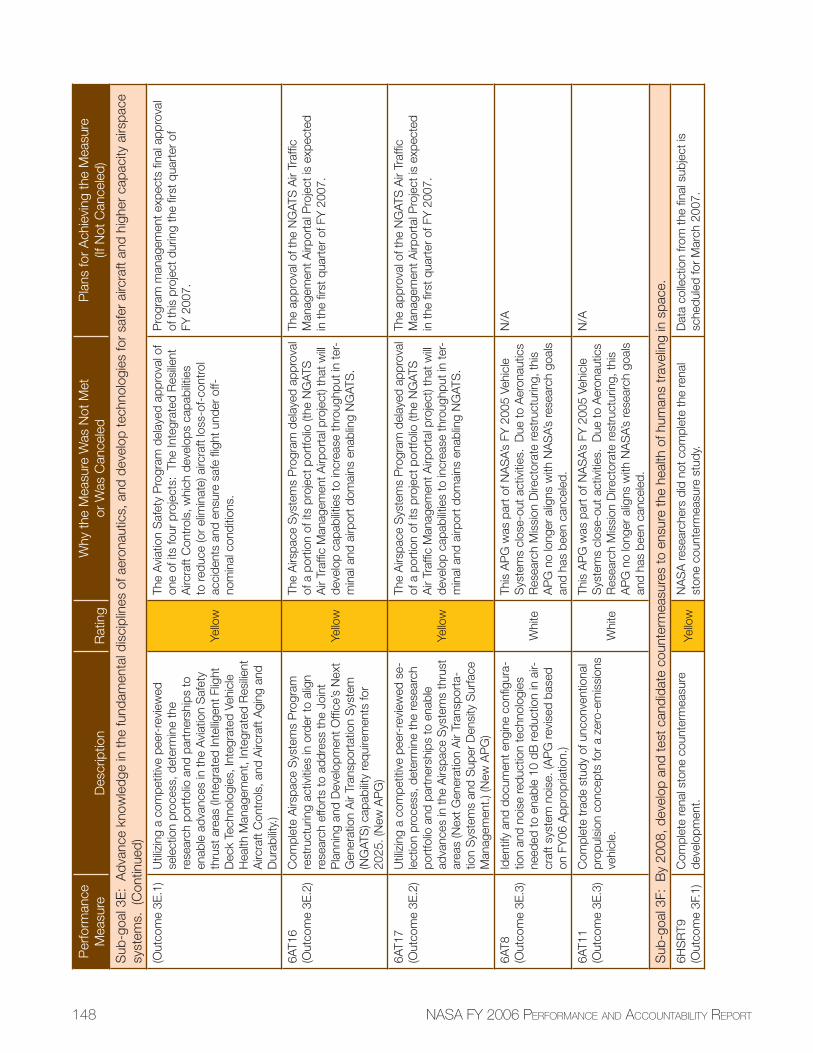
148 NASA FY 2006 PERFORMANCE AND ACCOUNTABILITY REPORT
Per
form
ance
Mea
sure
Des
crip
tion
Rat
ing
Why
the
Mea
sure
Was
Not
Met
or
Was
Can
cele
dP
lans
for
Ach
ievi
ng th
e M
easu
re
(If N
ot C
ance
led)
Sub
-goa
l 3E
: A
dvan
ce k
now
ledg
e in
the
fund
amen
tal d
isci
plin
es o
f aer
onau
tics,
and
dev
elop
tech
nolo
gies
for
safe
r ai
rcra
ft an
d hi
gher
cap
acity
airs
pace
sy
stem
s. (
Con
tinue
d)
(Out
com
e 3E
.1)
Util
izin
g a
com
petit
ive
peer
-rev
iew
ed
sele
ctio
n pr
oces
s, d
eter
min
e th
e re
sear
ch p
ortfo
lio a
nd p
artn
ersh
ips
to
enab
le a
dvan
ces
in th
e A
viat
ion
Saf
ety
thru
st a
reas
(Int
egra
ted
Inte
lligen
t Flig
ht
Dec
k Te
chno
logi
es, I
nteg
rate
d Ve
hicl
e H
ealth
Man
agem
ent,
Inte
grat
ed R
esilie
nt
Airc
raft
Con
trol
s, a
nd A
ircra
ft A
ging
and
D
urab
ility.
)
Yello
w
The
Avi
atio
n S
afet
y P
rogr
am d
elay
ed a
ppro
val o
f on
e of
its
four
pro
ject
s: T
he In
tegr
ated
Res
ilient
A
ircra
ft C
ontr
ols,
whi
ch d
evel
ops
capa
bilit
ies
to re
duce
(or
elim
inat
e) a
ircra
ft lo
ss-o
f-co
ntro
l ac
cide
nts
and
ensu
re s
afe
fl igh
t und
er o
ff-no
min
al c
ondi
tions
.
Pro
gram
man
agem
ent e
xpec
ts fi
nal a
ppro
val
of th
is p
roje
ct d
urin
g th
e fi r
st q
uart
er o
f FY
200
7.
6AT1
6(O
utco
me
3E.2
)C
ompl
ete
Airs
pace
Sys
tem
s P
rogr
am
rest
ruct
urin
g ac
tiviti
es in
ord
er to
alig
n re
sear
ch e
ffort
s to
add
ress
the
Join
t P
lann
ing
and
Dev
elop
men
t Offi
ce’s
Nex
t G
ener
atio
n A
ir Tr
ansp
orta
tion
Sys
tem
(N
GAT
S) c
apab
ility
requ
irem
ents
for
2025
. (N
ew A
PG
)
Yello
w
The
Airs
pace
Sys
tem
s P
rogr
am d
elay
ed a
ppro
val
of a
por
tion
of it
s pr
ojec
t por
tfolio
(the
NG
ATS
A
ir Tr
affi c
Man
agem
ent A
irpor
tal p
roje
ct) t
hat w
ill de
velo
p ca
pabi
litie
s to
incr
ease
thro
ughp
ut in
ter-
min
al a
nd a
irpor
t dom
ains
ena
blin
g N
GAT
S.
The
appr
oval
of t
he N
GAT
S A
ir Tr
affi c
M
anag
emen
t Airp
orta
l Pro
ject
is e
xpec
ted
in th
e fi r
st q
uart
er o
f FY
200
7.
6AT1
7(O
utco
me
3E.2
)U
tiliz
ing
a co
mpe
titiv
e pe
er-r
evie
wed
se-
lect
ion
proc
ess,
det
erm
ine
the
rese
arch
po
rtfo
lio a
nd p
artn
ersh
ips
to e
nabl
e ad
vanc
es in
the
Airs
pace
Sys
tem
s th
rust
ar
eas
(Nex
t Gen
erat
ion
Air
Tran
spor
ta-
tion
Sys
tem
s an
d S
uper
Den
sity
Sur
face
M
anag
emen
t.) (N
ew A
PG
)
Yello
w
The
Airs
pace
Sys
tem
s P
rogr
am d
elay
ed a
ppro
val
of a
por
tion
of it
s pr
ojec
t por
tfolio
(the
NG
ATS
A
ir Tr
affi c
Man
agem
ent A
irpor
tal p
roje
ct) t
hat w
ill de
velo
p ca
pabi
litie
s to
incr
ease
thro
ughp
ut in
ter-
min
al a
nd a
irpor
t dom
ains
ena
blin
g N
GAT
S.
The
appr
oval
of t
he N
GAT
S A
ir Tr
affi c
M
anag
emen
t Airp
orta
l Pro
ject
is e
xpec
ted
in th
e fi r
st q
uart
er o
f FY
200
7.
6AT8
(Out
com
e 3E
.3)
Iden
tify
and
docu
men
t eng
ine
confi
gur
a-tio
n an
d no
ise
redu
ctio
n te
chno
logi
es
need
ed to
ena
ble
10 d
B re
duct
ion
in a
ir-cr
aft s
yste
m n
oise
. (A
PG
revi
sed
base
d on
FY
06 A
ppro
pria
tion.
)
Whi
te
This
AP
G w
as p
art o
f NA
SA’
s FY
200
5 Ve
hicl
e S
yste
ms
clos
e-ou
t act
iviti
es.
Due
to A
eron
autic
s R
esea
rch
Mis
sion
Dire
ctor
ate
rest
ruct
urin
g, th
is
AP
G n
o lo
nger
alig
ns w
ith N
AS
A’s
rese
arch
goa
ls
and
has
been
can
cele
d.
N/A
6AT1
1(O
utco
me
3E.3
)C
ompl
ete
trad
e st
udy
of u
ncon
vent
iona
l pr
opul
sion
con
cept
s fo
r a
zero
-em
issi
ons
vehi
cle.
Whi
te
This
AP
G w
as p
art o
f NA
SA’
s FY
200
5 Ve
hicl
e S
yste
ms
clos
e-ou
t act
iviti
es.
Due
to A
eron
autic
s R
esea
rch
Mis
sion
Dire
ctor
ate
rest
ruct
urin
g, th
is
AP
G n
o lo
nger
alig
ns w
ith N
AS
A’s
rese
arch
goa
ls
and
has
been
can
cele
d.
N/A
Sub
-goa
l 3F:
By
2008
, dev
elop
and
test
can
dida
te c
ount
erm
easu
res
to e
nsur
e th
e he
alth
of h
uman
s tr
avel
ing
in s
pace
.
6HS
RT9
(Out
com
e 3F
.1)
Com
plet
e re
nal s
tone
cou
nter
mea
sure
de
velo
pmen
t.Ye
llow
NA
SA
rese
arch
ers
did
not c
ompl
ete
the
rena
l st
one
coun
term
easu
re s
tudy
.D
ata
colle
ctio
n fro
m th
e fi n
al s
ubje
ct is
sc
hedu
led
for
Mar
ch 2
007.
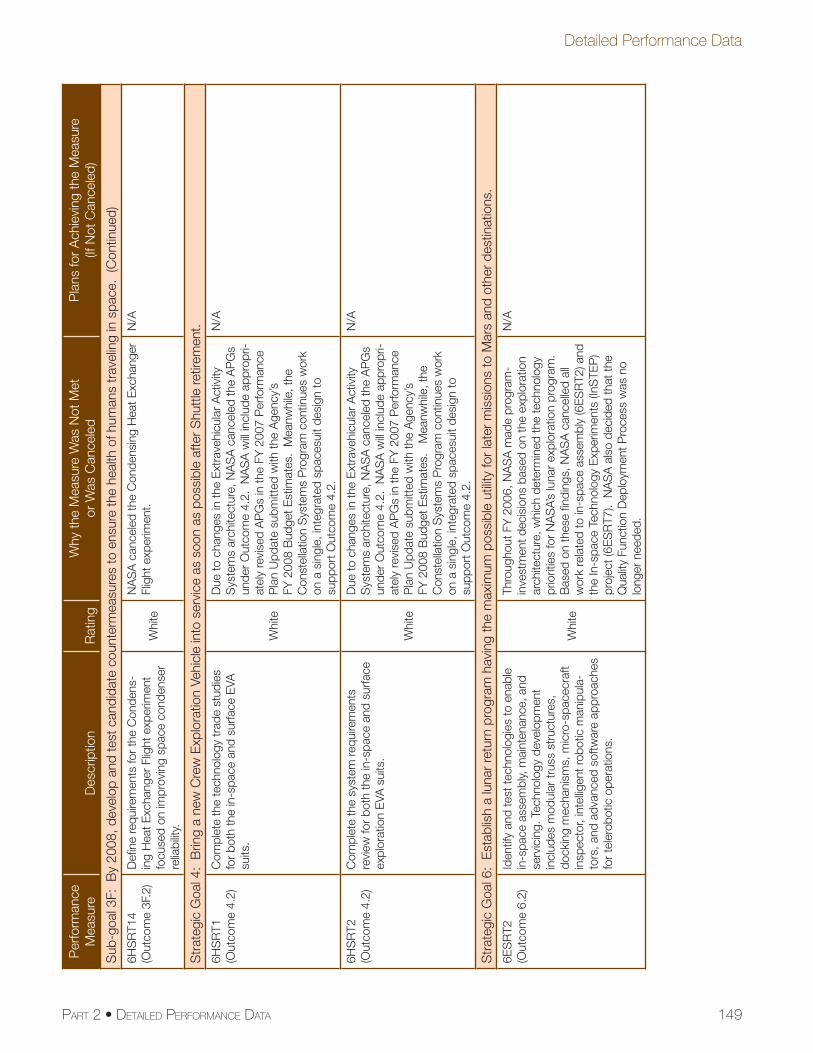
149PART 2 • DETAILED PERFORMANCE DATA
Detailed Performance Data
Per
form
ance
Mea
sure
Des
crip
tion
Rat
ing
Why
the
Mea
sure
Was
Not
Met
or
Was
Can
cele
dP
lans
for
Ach
ievi
ng th
e M
easu
re
(If N
ot C
ance
led)
Sub
-goa
l 3F:
By
2008
, dev
elop
and
test
can
dida
te c
ount
erm
easu
res
to e
nsur
e th
e he
alth
of h
uman
s tr
avel
ing
in s
pace
. (C
ontin
ued)
6HS
RT1
4(O
utco
me
3F.2
)D
efi n
e re
quire
men
ts fo
r th
e C
onde
ns-
ing
Hea
t Exc
hang
er F
light
exp
erim
ent
focu
sed
on im
prov
ing
spac
e co
nden
ser
relia
bilit
y.
Whi
te
NA
SA
can
cele
d th
e C
onde
nsin
g H
eat E
xcha
nger
Fl
ight
exp
erim
ent.
N/A
Str
ateg
ic G
oal 4
: B
ring
a ne
w C
rew
Exp
lora
tion
Vehi
cle
into
ser
vice
as
soon
as
poss
ible
afte
r S
hutt
le re
tirem
ent.
6HS
RT1
(Out
com
e 4.
2)C
ompl
ete
the
tech
nolo
gy tr
ade
stud
ies
for
both
the
in-s
pace
and
sur
face
EVA
su
its.
Whi
te
Due
to c
hang
es in
the
Ext
rave
hicu
lar
Act
ivity
S
yste
ms
arch
itect
ure,
NA
SA
can
cele
d th
e A
PG
s un
der
Out
com
e 4.
2. N
AS
A w
ill in
clud
e ap
prop
ri-at
ely
revi
sed
AP
Gs
in th
e FY
200
7 P
erfo
rman
ce
Pla
n U
pdat
e su
bmitt
ed w
ith th
e A
genc
y’s
FY 2
008
Bud
get E
stim
ates
. M
eanw
hile
, the
C
onst
ella
tion
Sys
tem
s P
rogr
am c
ontin
ues
wor
k on
a s
ingl
e, in
tegr
ated
spa
cesu
it de
sign
to
supp
ort O
utco
me
4.2.
N/A
6HS
RT2
(Out
com
e 4.
2)C
ompl
ete
the
syst
em re
quire
men
ts
revi
ew fo
r bo
th th
e in
-spa
ce a
nd s
urfa
ce
expl
orat
ion
EVA
sui
ts.
Whi
te
Due
to c
hang
es in
the
Ext
rave
hicu
lar
Act
ivity
S
yste
ms
arch
itect
ure,
NA
SA
can
cele
d th
e A
PG
s un
der
Out
com
e 4.
2. N
AS
A w
ill in
clud
e ap
prop
ri-at
ely
revi
sed
AP
Gs
in th
e FY
200
7 P
erfo
rman
ce
Pla
n U
pdat
e su
bmitt
ed w
ith th
e A
genc
y’s
FY 2
008
Bud
get E
stim
ates
. M
eanw
hile
, the
C
onst
ella
tion
Sys
tem
s P
rogr
am c
ontin
ues
wor
k on
a s
ingl
e, in
tegr
ated
spa
cesu
it de
sign
to
supp
ort O
utco
me
4.2.
N/A
Str
ateg
ic G
oal 6
: E
stab
lish
a lu
nar
retu
rn p
rogr
am h
avin
g th
e m
axim
um p
ossi
ble
utilit
y fo
r la
ter
mis
sion
s to
Mar
s an
d ot
her
dest
inat
ions
.
6ES
RT2
(Out
com
e 6.
2)Id
entif
y an
d te
st te
chno
logi
es to
ena
ble
in-s
pace
ass
embl
y, m
aint
enan
ce, a
nd
serv
icin
g. T
echn
olog
y de
velo
pmen
t in
clud
es m
odul
ar tr
uss
stru
ctur
es,
dock
ing
mec
hani
sms,
mic
ro-s
pace
craf
t in
spec
tor,
inte
lligen
t rob
otic
man
ipul
a-to
rs, a
nd a
dvan
ced
softw
are
appr
oach
es
for
tele
robo
tic o
pera
tions
.
Whi
te
Thro
ugho
ut F
Y 2
006,
NA
SA
mad
e pr
ogra
m-
inve
stm
ent d
ecis
ions
bas
ed o
n th
e ex
plor
atio
n ar
chite
ctur
e, w
hich
det
erm
ined
the
tech
nolo
gy
prio
ritie
s fo
r N
AS
A’s
luna
r ex
plor
atio
n pr
ogra
m.
Bas
ed o
n th
ese
fi ndi
ngs,
NA
SA
can
celle
d al
l w
ork
rela
ted
to in
-spa
ce a
ssem
bly
(6E
SR
T2) a
nd
the
In-s
pace
Tec
hnol
ogy
Exp
erim
ents
(InS
TEP
) pr
ojec
t (6E
SR
T7).
NA
SA
als
o de
cide
d th
at th
e Q
ualit
y Fu
nctio
n D
eplo
ymen
t Pro
cess
was
no
long
er n
eede
d.
N/A
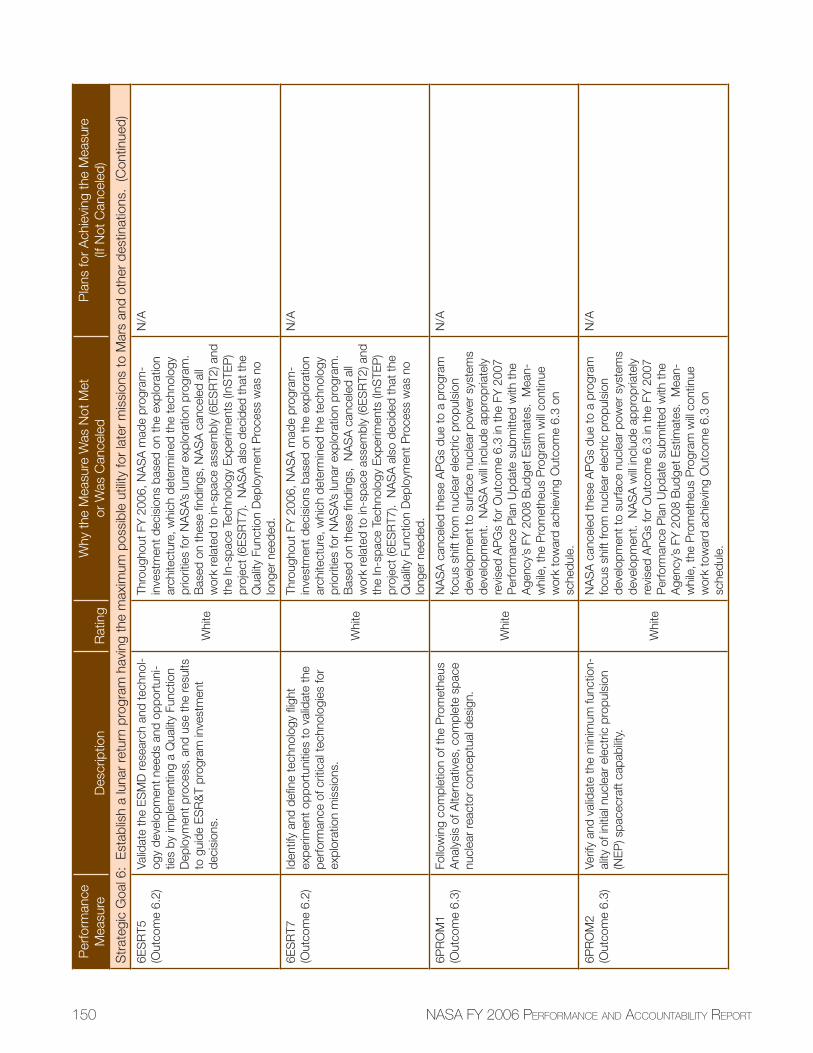
150 NASA FY 2006 PERFORMANCE AND ACCOUNTABILITY REPORT
Per
form
ance
Mea
sure
Des
crip
tion
Rat
ing
Why
the
Mea
sure
Was
Not
Met
or
Was
Can
cele
dP
lans
for
Ach
ievi
ng th
e M
easu
re
(If N
ot C
ance
led)
Str
ateg
ic G
oal 6
: E
stab
lish
a lu
nar
retu
rn p
rogr
am h
avin
g th
e m
axim
um p
ossi
ble
utilit
y fo
r la
ter
mis
sion
s to
Mar
s an
d ot
her
dest
inat
ions
. (C
ontin
ued)
6ES
RT5
(Out
com
e 6.
2)Va
lidat
e th
e E
SM
D re
sear
ch a
nd te
chno
l-og
y de
velo
pmen
t nee
ds a
nd o
ppor
tuni
-tie
s by
impl
emen
ting
a Q
ualit
y Fu
nctio
n D
eplo
ymen
t pro
cess
, and
use
the
resu
lts
to g
uide
ES
R&
T pr
ogra
m in
vest
men
t de
cisi
ons.
Whi
te
Thro
ugho
ut F
Y 2
006,
NA
SA
mad
e pr
ogra
m-
inve
stm
ent d
ecis
ions
bas
ed o
n th
e ex
plor
atio
n ar
chite
ctur
e, w
hich
det
erm
ined
the
tech
nolo
gy
prio
ritie
s fo
r N
AS
A’s
luna
r ex
plor
atio
n pr
ogra
m.
Bas
ed o
n th
ese
fi ndi
ngs,
NA
SA
can
cele
d al
l w
ork
rela
ted
to in
-spa
ce a
ssem
bly
(6E
SR
T2) a
nd
the
In-s
pace
Tec
hnol
ogy
Exp
erim
ents
(InS
TEP
) pr
ojec
t (6E
SR
T7).
NA
SA
als
o de
cide
d th
at th
e Q
ualit
y Fu
nctio
n D
eplo
ymen
t Pro
cess
was
no
long
er n
eede
d.
N/A
6ES
RT7
(Out
com
e 6.
2)Id
entif
y an
d de
fi ne
tech
nolo
gy fl
ight
ex
perim
ent o
ppor
tuni
ties
to v
alid
ate
the
perfo
rman
ce o
f crit
ical
tech
nolo
gies
for
expl
orat
ion
mis
sion
s.
Whi
te
Thro
ugho
ut F
Y 2
006,
NA
SA
mad
e pr
ogra
m-
inve
stm
ent d
ecis
ions
bas
ed o
n th
e ex
plor
atio
n ar
chite
ctur
e, w
hich
det
erm
ined
the
tech
nolo
gy
prio
ritie
s fo
r N
AS
A’s
luna
r ex
plor
atio
n pr
ogra
m.
Bas
ed o
n th
ese
fi ndi
ngs,
NA
SA
can
cele
d al
l w
ork
rela
ted
to in
-spa
ce a
ssem
bly
(6E
SR
T2) a
nd
the
In-s
pace
Tec
hnol
ogy
Exp
erim
ents
(InS
TEP
) pr
ojec
t (6E
SR
T7).
NA
SA
als
o de
cide
d th
at th
e Q
ualit
y Fu
nctio
n D
eplo
ymen
t Pro
cess
was
no
long
er n
eede
d.
N/A
6PR
OM
1(O
utco
me
6.3)
Follo
win
g co
mpl
etio
n of
the
Pro
met
heus
A
naly
sis
of A
ltern
ativ
es, c
ompl
ete
spac
e nu
clea
r re
acto
r co
ncep
tual
des
ign.
Whi
te
NA
SA
can
cele
d th
ese
AP
Gs
due
to a
pro
gram
fo
cus
shift
from
nuc
lear
ele
ctric
pro
puls
ion
deve
lopm
ent t
o su
rface
nuc
lear
pow
er s
yste
ms
deve
lopm
ent.
NA
SA
will
incl
ude
appr
opria
tely
re
vise
d A
PG
s fo
r O
utco
me
6.3
in th
e FY
200
7 P
erfo
rman
ce P
lan
Upd
ate
subm
itted
with
the
Age
ncy’
s FY
200
8 B
udge
t Est
imat
es.
Mea
n-w
hile
, the
Pro
met
heus
Pro
gram
will
cont
inue
w
ork
tow
ard
achi
evin
g O
utco
me
6.3
on
sche
dule
.
N/A
6PR
OM
2(O
utco
me
6.3)
Verif
y an
d va
lidat
e th
e m
inim
um fu
nctio
n-al
ity o
f ini
tial n
ucle
ar e
lect
ric p
ropu
lsio
n (N
EP
) spa
cecr
aft c
apab
ility.
Whi
te
NA
SA
can
cele
d th
ese
AP
Gs
due
to a
pro
gram
fo
cus
shift
from
nuc
lear
ele
ctric
pro
puls
ion
deve
lopm
ent t
o su
rface
nuc
lear
pow
er s
yste
ms
deve
lopm
ent.
NA
SA
will
incl
ude
appr
opria
tely
re
vise
d A
PG
s fo
r O
utco
me
6.3
in th
e FY
200
7 P
erfo
rman
ce P
lan
Upd
ate
subm
itted
with
the
Age
ncy’
s FY
200
8 B
udge
t Est
imat
es.
Mea
n-w
hile
, the
Pro
met
heus
Pro
gram
will
cont
inue
w
ork
tow
ard
achi
evin
g O
utco
me
6.3
on
sche
dule
.
N/A
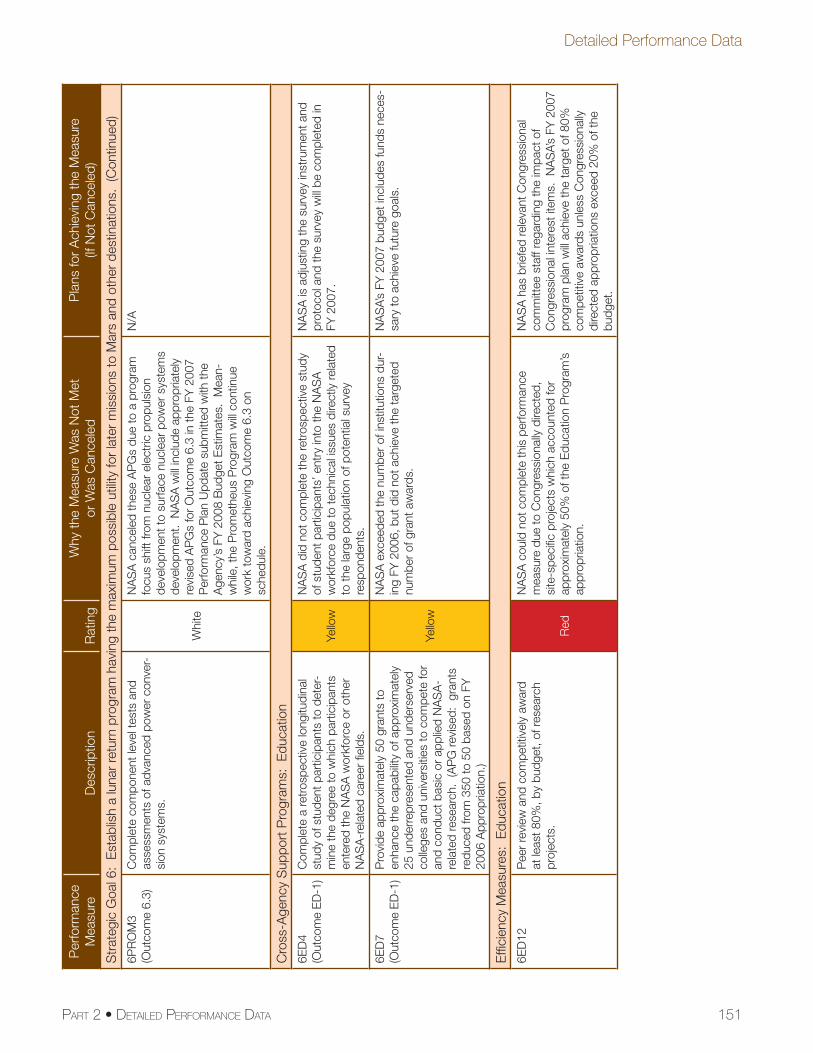
151PART 2 • DETAILED PERFORMANCE DATA
Detailed Performance Data
Per
form
ance
Mea
sure
Des
crip
tion
Rat
ing
Why
the
Mea
sure
Was
Not
Met
or
Was
Can
cele
dP
lans
for
Ach
ievi
ng th
e M
easu
re
(If N
ot C
ance
led)
Str
ateg
ic G
oal 6
: E
stab
lish
a lu
nar
retu
rn p
rogr
am h
avin
g th
e m
axim
um p
ossi
ble
utilit
y fo
r la
ter
mis
sion
s to
Mar
s an
d ot
her
dest
inat
ions
. (C
ontin
ued)
6PR
OM
3(O
utco
me
6.3)
Com
plet
e co
mpo
nent
leve
l tes
ts a
nd
asse
ssm
ents
of a
dvan
ced
pow
er c
onve
r-si
on s
yste
ms.
Whi
te
NA
SA
can
cele
d th
ese
AP
Gs
due
to a
pro
gram
fo
cus
shift
from
nuc
lear
ele
ctric
pro
puls
ion
deve
lopm
ent t
o su
rface
nuc
lear
pow
er s
yste
ms
deve
lopm
ent.
NA
SA
will
incl
ude
appr
opria
tely
re
vise
d A
PG
s fo
r O
utco
me
6.3
in th
e FY
200
7 P
erfo
rman
ce P
lan
Upd
ate
subm
itted
with
the
Age
ncy’
s FY
200
8 B
udge
t Est
imat
es.
Mea
n-w
hile
, the
Pro
met
heus
Pro
gram
will
cont
inue
w
ork
tow
ard
achi
evin
g O
utco
me
6.3
on
sche
dule
.
N/A
Cro
ss-A
genc
y S
uppo
rt P
rogr
ams:
Edu
catio
n
6ED
4(O
utco
me
ED
-1)
Com
plet
e a
retr
ospe
ctiv
e lo
ngitu
dina
l st
udy
of s
tude
nt p
artic
ipan
ts to
det
er-
min
e th
e de
gree
to w
hich
par
ticip
ants
en
tere
d th
e N
AS
A w
orkf
orce
or
othe
r N
AS
A-r
elat
ed c
aree
r fi e
lds.
Yello
w
NA
SA
did
not
com
plet
e th
e re
tros
pect
ive
stud
y of
stu
dent
par
ticip
ants
’ ent
ry in
to th
e N
AS
A
wor
kfor
ce d
ue to
tech
nica
l iss
ues
dire
ctly
rela
ted
to th
e la
rge
popu
latio
n of
pot
entia
l sur
vey
resp
onde
nts.
NA
SA
is a
djus
ting
the
surv
ey in
stru
men
t and
pr
otoc
ol a
nd th
e su
rvey
will
be c
ompl
eted
in
FY 2
007.
6ED
7(O
utco
me
ED
-1)
Pro
vide
app
roxi
mat
ely
50 g
rant
s to
en
hanc
e th
e ca
pabi
lity
of a
ppro
xim
atel
y
25 u
nder
repr
esen
ted
and
unde
rser
ved
colle
ges
and
univ
ersi
ties
to c
ompe
te fo
r an
d co
nduc
t bas
ic o
r ap
plie
d N
AS
A-
rela
ted
rese
arch
. (A
PG
revi
sed:
gra
nts
redu
ced
from
350
to 5
0 ba
sed
on F
Y
2006
App
ropr
iatio
n.)
Yello
w
NA
SA
exc
eede
d th
e nu
mbe
r of
inst
itutio
ns d
ur-
ing
FY 2
006,
but
did
not
ach
ieve
the
targ
eted
nu
mbe
r of
gra
nt a
war
ds.
NA
SA’
s FY
200
7 bu
dget
incl
udes
fund
s ne
ces-
sary
to a
chie
ve fu
ture
goa
ls.
Effi
cien
cy M
easu
res:
Edu
catio
n
6ED
12P
eer
revi
ew a
nd c
ompe
titiv
ely
awar
d at
leas
t 80%
, by
budg
et, o
f res
earc
h pr
ojec
ts.
Red
NA
SA
cou
ld n
ot c
ompl
ete
this
per
form
ance
m
easu
re d
ue to
Con
gres
sion
ally
dire
cted
, si
te-s
peci
fi c p
roje
cts
whi
ch a
ccou
nted
for
appr
oxim
atel
y 50
% o
f the
Edu
catio
n P
rogr
am’s
ap
prop
riatio
n.
NA
SA
has
brie
fed
rele
vant
Con
gres
sion
al
com
mitt
ee s
taff
rega
rdin
g th
e im
pact
of
Con
gres
sion
al in
tere
st it
ems.
NA
SA’
s FY
200
7 pr
ogra
m p
lan
will
achi
eve
the
targ
et o
f 80%
co
mpe
titiv
e aw
ards
unl
ess
Con
gres
sion
ally
di
rect
ed a
ppro
pria
tions
exc
eed
20%
of t
he
budg
et.
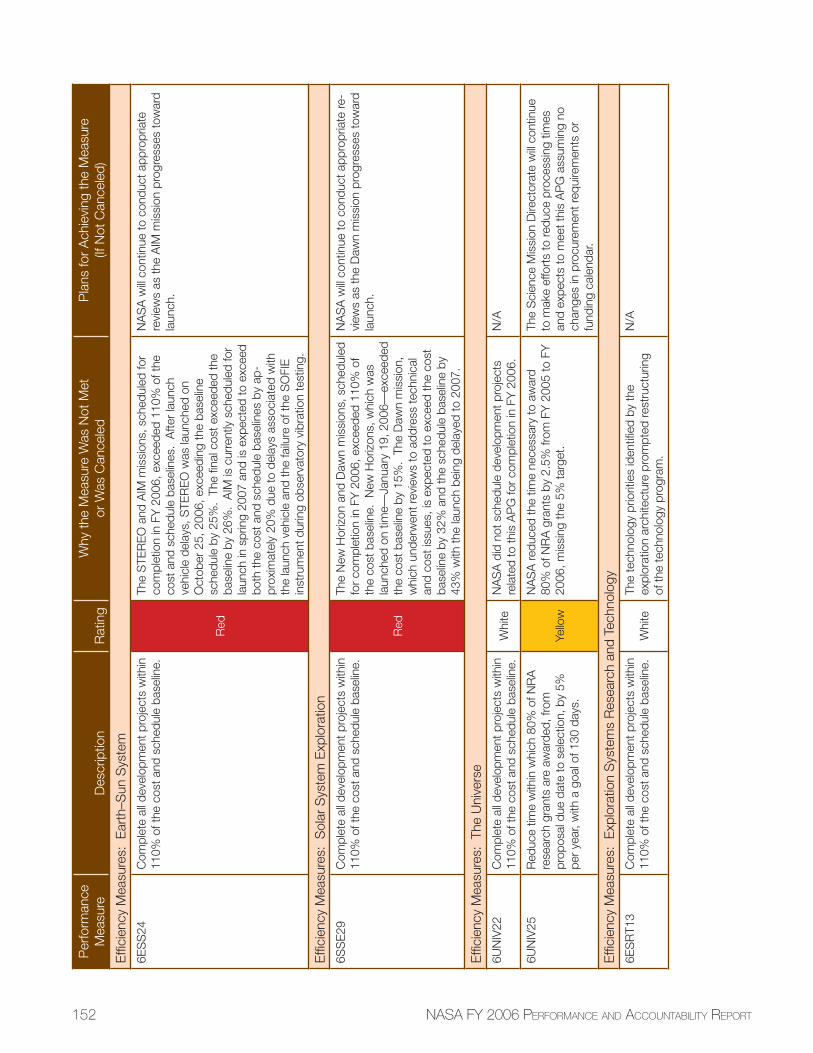
152 NASA FY 2006 PERFORMANCE AND ACCOUNTABILITY REPORT
Per
form
ance
Mea
sure
Des
crip
tion
Rat
ing
Why
the
Mea
sure
Was
Not
Met
or
Was
Can
cele
dP
lans
for
Ach
ievi
ng th
e M
easu
re
(If N
ot C
ance
led)
Effi
cien
cy M
easu
res:
Ear
th–S
un S
yste
m
6ES
S24
Com
plet
e al
l dev
elop
men
t pro
ject
s w
ithin
11
0% o
f the
cos
t and
sch
edul
e ba
selin
e.
Red
The
STE
RE
O a
nd A
IM m
issi
ons,
sch
edul
ed fo
r co
mpl
etio
n in
FY
200
6, e
xcee
ded
110%
of t
he
cost
and
sch
edul
e ba
selin
es.
Afte
r la
unch
ve
hicl
e de
lays
, STE
RE
O w
as la
unch
ed o
n O
ctob
er 2
5, 2
006,
exc
eedi
ng th
e ba
selin
e sc
hedu
le b
y 25
%.
The
fi nal
cos
t exc
eede
d th
e ba
selin
e by
26%
. A
IM is
cur
rent
ly s
ched
uled
for
laun
ch in
spr
ing
2007
and
is e
xpec
ted
to e
xcee
d bo
th th
e co
st a
nd s
ched
ule
base
lines
by
ap-
prox
imat
ely
20%
due
to d
elay
s as
soci
ated
with
th
e la
unch
veh
icle
and
the
failu
re o
f the
SO
FIE
in
stru
men
t dur
ing
obse
rvat
ory
vibr
atio
n te
stin
g.
NA
SA
will
cont
inue
to c
ondu
ct a
ppro
pria
te
revi
ews
as th
e A
IM m
issi
on p
rogr
esse
s to
war
d la
unch
.
Effi
cien
cy M
easu
res:
Sol
ar S
yste
m E
xplo
ratio
n
6SS
E29
Com
plet
e al
l dev
elop
men
t pro
ject
s w
ithin
11
0% o
f the
cos
t and
sch
edul
e ba
selin
e.
Red
The
New
Hor
izon
and
Daw
n m
issi
ons,
sch
edul
ed
for
com
plet
ion
in F
Y 2
006,
exc
eede
d 11
0% o
f th
e co
st b
asel
ine.
New
Hor
izon
s, w
hich
was
la
unch
ed o
n tim
e—Ja
nuar
y 19
, 200
6—ex
ceed
ed
the
cost
bas
elin
e by
15%
. Th
e D
awn
mis
sion
, w
hich
und
erw
ent r
evie
ws
to a
ddre
ss te
chni
cal
and
cost
issu
es, i
s ex
pect
ed to
exc
eed
the
cost
ba
selin
e by
32%
and
the
sche
dule
bas
elin
e by
43
% w
ith th
e la
unch
bei
ng d
elay
ed to
200
7.
NA
SA
will
cont
inue
to c
ondu
ct a
ppro
pria
te re
-vi
ews
as th
e D
awn
mis
sion
pro
gres
ses
tow
ard
laun
ch.
Effi
cien
cy M
easu
res:
The
Uni
vers
e
6UN
IV22
Com
plet
e al
l dev
elop
men
t pro
ject
s w
ithin
11
0% o
f the
cos
t and
sch
edul
e ba
selin
e.W
hite
NA
SA
did
not
sch
edul
e de
velo
pmen
t pro
ject
s re
late
d to
this
AP
G fo
r co
mpl
etio
n in
FY
200
6.N
/A
6UN
IV25
Red
uce
time
with
in w
hich
80%
of N
RA
re
sear
ch g
rant
s ar
e aw
arde
d, fr
om
prop
osal
due
dat
e to
sel
ectio
n, b
y 5%
pe
r ye
ar, w
ith a
goa
l of 1
30 d
ays.
Yello
w
NA
SA
redu
ced
the
time
nece
ssar
y to
aw
ard
80%
of N
RA
gra
nts
by 2
.5%
from
FY
200
5 to
FY
20
06, m
issi
ng th
e 5%
targ
et.
The
Sci
ence
Mis
sion
Dire
ctor
ate
will
cont
inue
to
mak
e ef
fort
s to
redu
ce p
roce
ssin
g tim
es
and
expe
cts
to m
eet t
his
AP
G a
ssum
ing
no
chan
ges
in p
rocu
rem
ent r
equi
rem
ents
or
fund
ing
cale
ndar
.
Effi
cien
cy M
easu
res:
Exp
lora
tion
Sys
tem
s R
esea
rch
and
Tech
nolo
gy
6ES
RT1
3C
ompl
ete
all d
evel
opm
ent p
roje
cts
with
in
110%
of t
he c
ost a
nd s
ched
ule
base
line.
Whi
teTh
e te
chno
logy
prio
ritie
s id
entifi
ed
by th
e ex
plor
atio
n ar
chite
ctur
e pr
ompt
ed re
stru
ctur
ing
of th
e te
chno
logy
pro
gram
.
N/A
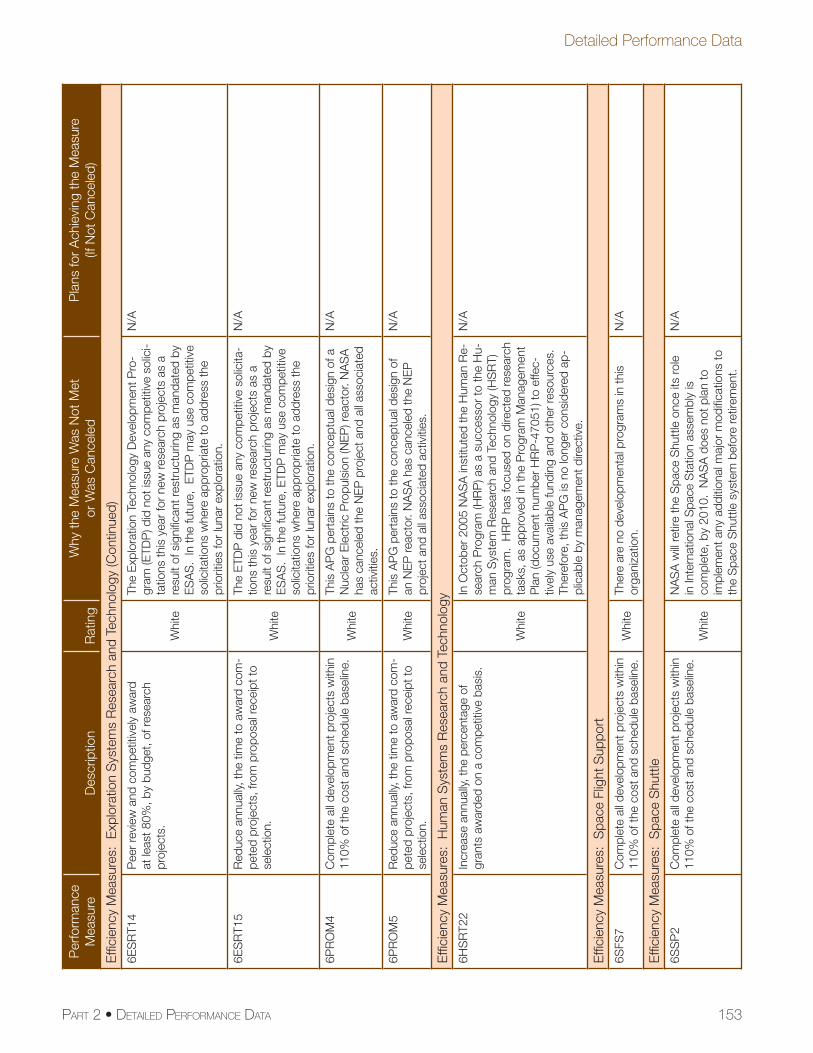
153PART 2 • DETAILED PERFORMANCE DATA
Detailed Performance Data
Per
form
ance
Mea
sure
Des
crip
tion
Rat
ing
Why
the
Mea
sure
Was
Not
Met
or
Was
Can
cele
dP
lans
for
Ach
ievi
ng th
e M
easu
re
(If N
ot C
ance
led)
Effi
cien
cy M
easu
res:
Exp
lora
tion
Sys
tem
s R
esea
rch
and
Tech
nolo
gy (C
ontin
ued)
6ES
RT1
4P
eer
revi
ew a
nd c
ompe
titiv
ely
awar
d at
leas
t 80%
, by
budg
et, o
f res
earc
h pr
ojec
ts.
Whi
te
The
Exp
lora
tion
Tech
nolo
gy D
evel
opm
ent P
ro-
gram
(ETD
P) d
id n
ot is
sue
any
com
petit
ive
solic
i-ta
tions
this
yea
r fo
r ne
w re
sear
ch p
roje
cts
as a
re
sult
of s
igni
fi can
t res
truc
turin
g as
man
date
d by
E
SA
S.
In th
e fu
ture
, E
TDP
may
use
com
petit
ive
solic
itatio
ns w
here
app
ropr
iate
to a
ddre
ss th
e pr
iorit
ies
for
luna
r ex
plor
atio
n.
N/A
6ES
RT1
5R
educ
e an
nual
ly, th
e tim
e to
aw
ard
com
-pe
ted
proj
ects
, fro
m p
ropo
sal r
ecei
pt to
se
lect
ion.
Whi
te
The
ETD
P d
id n
ot is
sue
any
com
petit
ive
solic
ita-
tions
this
yea
r fo
r ne
w re
sear
ch p
roje
cts
as a
re
sult
of s
igni
fi can
t res
truc
turin
g as
man
date
d by
E
SA
S.
In th
e fu
ture
, ETD
P m
ay u
se c
ompe
titiv
e so
licita
tions
whe
re a
ppro
pria
te to
add
ress
the
prio
ritie
s fo
r lu
nar
expl
orat
ion.
N/A
6PR
OM
4C
ompl
ete
all d
evel
opm
ent p
roje
cts
with
in
110%
of t
he c
ost a
nd s
ched
ule
base
line.
Whi
te
This
AP
G p
erta
ins
to th
e co
ncep
tual
des
ign
of a
N
ucle
ar E
lect
ric P
ropu
lsio
n (N
EP
) rea
ctor
. NA
SA
ha
s ca
ncel
ed th
e N
EP
pro
ject
and
all
asso
ciat
ed
activ
ities
.
N/A
6PR
OM
5R
educ
e an
nual
ly, th
e tim
e to
aw
ard
com
-pe
ted
proj
ects
, fro
m p
ropo
sal r
ecei
pt to
se
lect
ion.
Whi
teTh
is A
PG
per
tain
s to
the
conc
eptu
al d
esig
n of
an
NE
P re
acto
r. N
AS
A h
as c
ance
led
the
NE
P
proj
ect a
nd a
ll as
soci
ated
act
iviti
es.
N/A
Effi
cien
cy M
easu
res:
Hum
an S
yste
ms
Res
earc
h an
d Te
chno
logy
6HS
RT2
2In
crea
se a
nnua
lly, t
he p
erce
ntag
e of
gr
ants
aw
arde
d on
a c
ompe
titiv
e ba
sis.
Whi
te
In O
ctob
er 2
005
NA
SA
inst
itute
d th
e H
uman
Re-
sear
ch P
rogr
am (H
RP
) as
a su
cces
sor
to th
e H
u-m
an S
yste
m R
esea
rch
and
Tech
nolo
gy (H
SR
T)
prog
ram
. H
RP
has
focu
sed
on d
irect
ed re
sear
ch
task
s, a
s ap
prov
ed in
the
Pro
gram
Man
agem
ent
Pla
n (d
ocum
ent n
umbe
r H
RP
-470
51) t
o ef
fec-
tivel
y us
e av
aila
ble
fund
ing
and
othe
r re
sour
ces.
Th
eref
ore,
this
AP
G is
no
long
er c
onsi
dere
d ap
-pl
icab
le b
y m
anag
emen
t dire
ctiv
e.
N/A
Effi
cien
cy M
easu
res:
Spa
ce F
light
Sup
port
6SFS
7C
ompl
ete
all d
evel
opm
ent p
roje
cts
with
in
110%
of t
he c
ost a
nd s
ched
ule
base
line.
Whi
teTh
ere
are
no d
evel
opm
enta
l pro
gram
s in
this
or
gani
zatio
n.N
/A
Effi
cien
cy M
easu
res:
Spa
ce S
hutt
le
6SS
P2
Com
plet
e al
l dev
elop
men
t pro
ject
s w
ithin
11
0% o
f the
cos
t and
sch
edul
e ba
selin
e.W
hite
NA
SA
will
retir
e th
e S
pace
Shu
ttle
onc
e its
role
in
Inte
rnat
iona
l Spa
ce S
tatio
n as
sem
bly
is
com
plet
e, b
y 20
10.
NA
SA
doe
s no
t pla
n to
im
plem
ent a
ny a
dditi
onal
maj
or m
odifi
catio
ns to
th
e S
pace
Shu
ttle
sys
tem
bef
ore
retir
emen
t.
N/A

154 NASA FY 2006 PERFORMANCE AND ACCOUNTABILITY REPORT
Part
3: Fi
nanc
ials
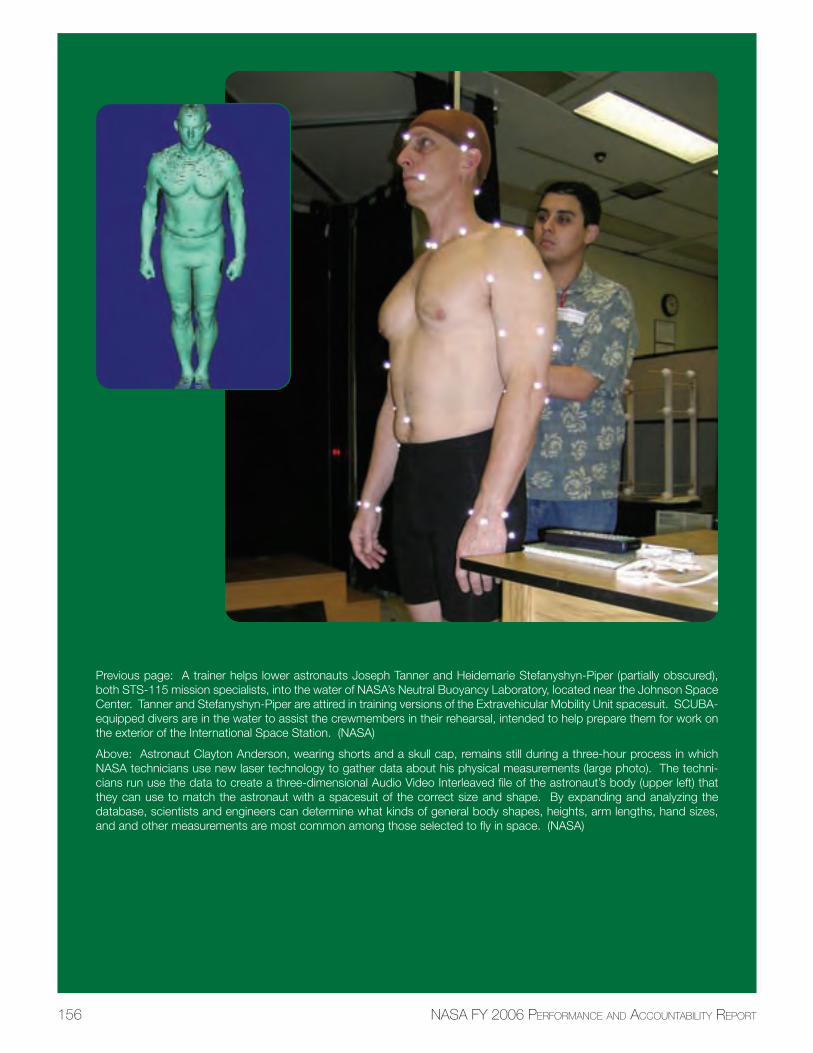
Previous page: A trainer helps lower astronauts Joseph Tanner and Heidemarie Stefanyshyn-Piper (partially obscured), both STS-115 mission specialists, into the water of NASA’s Neutral Buoyancy Laboratory, located near the Johnson Space Center. Tanner and Stefanyshyn-Piper are attired in training versions of the Extravehicular Mobility Unit spacesuit. SCUBA-equipped divers are in the water to assist the crewmembers in their rehearsal, intended to help prepare them for work on the exterior of the International Space Station. (NASA)
Above: Astronaut Clayton Anderson, wearing shorts and a skull cap, remains still during a three-hour process in which NASA technicians use new laser technology to gather data about his physical measurements (large photo). The techni-cians run use the data to create a three-dimensional Audio Video Interleaved fi le of the astronaut’s body (upper left) that they can use to match the astronaut with a spacesuit of the correct size and shape. By expanding and analyzing the database, scientists and engineers can determine what kinds of general body shapes, heights, arm lengths, hand sizes, and and other measurements are most common among those selected to fl y in space. (NASA)
156 NASA FY 2006 PERFORMANCE AND ACCOUNTABILITY REPORT
PART 3 • FINANCIALS 157
NASA’s fi nancial community enters fi scal year (FY) 2007 with an unwavering commit-ment to achieving fi nancial management excellence. Recognizing the progress we have made over the past year, we acknowledge continued room for improvement and fully accept responsibility for improving the health and operation of the Agency’s fi nan-cial management processes.
In FY 2006, the Agency implemented a broad program of corrective actions to address its fi nancial management weaknesses. Progress on those corrective actions is the result of signifi cant cross-Agency effort. Much of the work that remains is in the stabilization of improved processes so that they consistently and regularly deliver expected results. In their report, the Agency’s independent auditors acknowledged the progress made in NASA’s fi nancial management processes, particularly in the areas of differences in Fund Balance with Treasury and the estimation of Unfunded Environmental Liabilities. I am pleased to report that both of these weaknesses were resolved in FY 2006. NASA will continue to monitor reconciliation processes and other associated controls to ensure that these accounts remain fi rmly in control.
While the Agency has made progress, signifi cant challenges remain. The Agency’s independent auditors, have noted two modifi ed repeat conditions, both material weaknesses, for FY 2006: Financial Systems, Analyses and Oversight; and Property, Plant and Equipment. System and process limitations continue to require compensating controls, and have limited NASA’s ability to accumulate, analyze, and distribute reliable fi nancial information. The Agency recognizes these defi ciencies and continues to work diligently toward their resolution. We invite you to read the expanded fi nancial management section that follows to learn more about these weaknesses and the improve-ment actions we completed in FY 2006.
In addition to the corrective actions taken, FY 2006 was also a year of preparation for a major update to NASA’s Core Financial system. Enhancements to the system, to be implemented with the beginning of FY 2007, will further integrate our process changes and improve our systems. Also, we will continue to use the practice initiated last year to develop a FY 2006 Financial Audit Corrective Action Plan. We are working diligently to meet the require-ments for an opinion to be rendered on our FY 2007 fi nancial statements.
NASA’s mission success includes healthy fi nancial management and effective reporting on the resources entrusted to the Agency. We remain dedicated to achieving that mission.
Sincerely,
Gwendolyn Sykes Chief Financial Offi cer
Message from the Chief Financial Offi cer
158 NASA FY 2006 PERFORMANCE AND ACCOUNTABILITY REPORT
Financial Management Improvement In FY 2006, NASA implemented a Financial Audit Corrective Action Plan (CAP) to address weaknesses identifi ed in the 2005 fi nancial audit. The steps the Agency took in support of the CAP leveraged the stabilization gains made in 2005. As of the 3rd Quarter of FY 2006, the Offi ce of Management and Budget (OMB) acknowledged NASA’s progress toward improved fi nancial management by upgrading its measure for NASA’s Financial Management PMA progress to “Yellow.”
The Agency recognizes that there is much work to be done as it continues to improve NASA’s fi nancial man-agement performance. NASA is aggressively working toward eliminating all fi nancial weaknesses as a part of the Agency’s effort toward achieving auditable fi nancial records and actionable fi nancial information for decision making. A summary of progress and accomplishments, by FY 2005 audit weakness, follows.
2006 Financial Management Improvement Efforts1. Financial Systems, Analyses, and OversightTo improve NASA’s ability to accumulate, analyze and distribute reliable fi nancial information, the Agency has developed and is implementing procedures to validate fi nancial data and processes in the Agency’s Core Financial system, strengthened internal controls to ensure consistency with authoritative guidance, and aligned its external fi nancial reporting with federal requirements.
Following NASA’s Financial Management Requirements, Volume 19—Periodic Monitoring Controls Activities, each NASA Center conducts regular reconciliations of key fi nancial accounts or activities. The results of these reconciliations, including associated corrective action plans, are certifi ed by Center CFOs and reported to NASA Headquarters on a monthly basis. As a result, NASA is given a view of any emerg-ing systemic data integrity issues, which facilitates coordi-nated improvements designed to eliminate the root causes of issues.
In addition, the Agency prepares monthly and quarterly Agency fi nancial statements within 30 days of period close. This process includes the documentation of any data anomalies or corrections, and statement analyses. Monthly fi nancial statements are used to ensure appropriate processing of fi nancial information. Also, compared to FY 2005, NASA modifi ed the presentation of its Statement of Net Costs to provide a breakdown of net costs by major lines of business, consistent with Offi ce of Management and Budget Circular A-136. The ability to associate costs to major lines of business is a result of a major account structure change that NASA introduced at the begin-ning of the fi scal year.
Finally, the Agency developed and published monthly fi nancial metrics, providing both process and outcome measures of NASA’s fi nancial performance. These metrics are reviewed at monthly fi nancial management senior leader-ship meetings to discuss performance and trends, and to share best practices.
Throughout 2007, the Agency will continue to review and certify Center-level fi nancial accounts and activities on a monthly basis. Financial statements and metrics, also on a monthly basis, will be prepared and reviewed by management.
2. Property, Plant and EquipmentTo address material weaknesses in Property, Plant and Equipment accounting, NASA has taken steps in FY 2006 to rectify policy and process weaknesses.
NASA is considering a change in its accounting policy for Theme Assets to reclassify some costs previously categorized as General Property, Plant & Equipment (PP&E) as Research and Development (R&D) expenses. In
Statement of Material Weakness: Financial Systems, Analyses, and Oversight
Summary Auditor Finding: “Although progress was made [since the 2004 audit], signifi cant fi nancial management issues continue to impair NASA’s ability to accumu-late, analyze, and distribute reliable fi nancial information.” (Reference: NASA FY 2005 Performance and Accountability Report (PAR), Part 3, page 193)
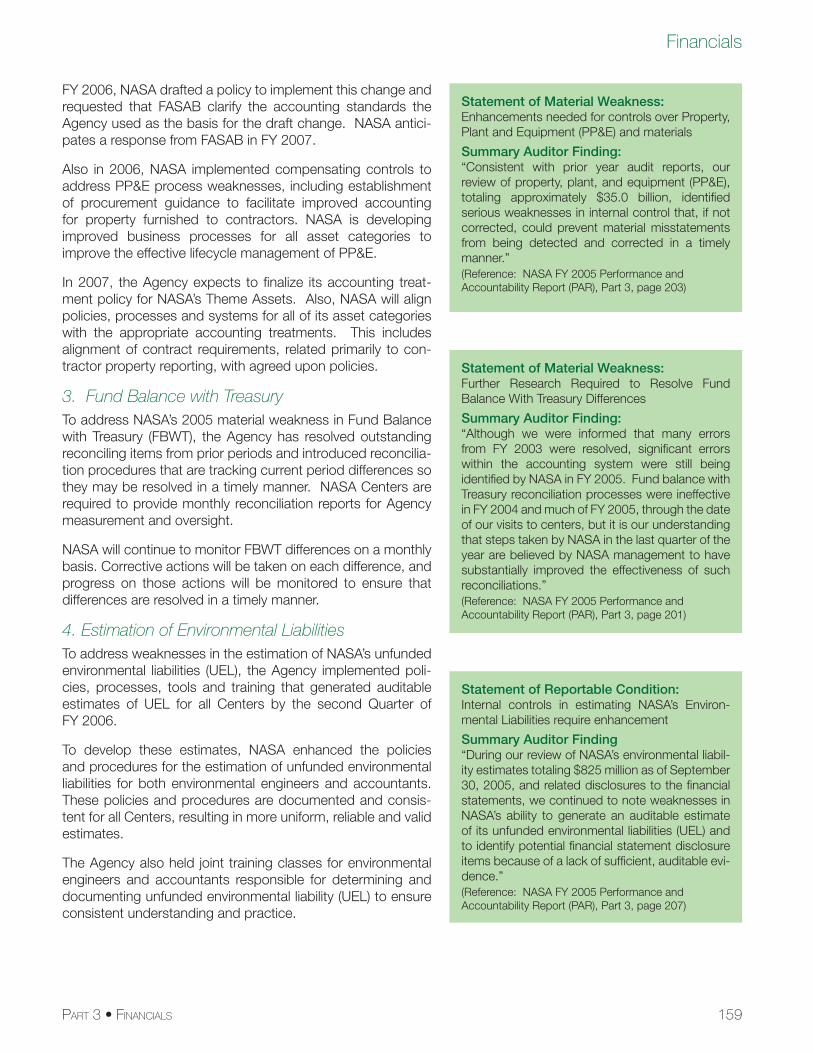
159
Financials
PART 3 • FINANCIALS
FY 2006, NASA drafted a policy to implement this change and requested that FASAB clarify the accounting standards the Agency used as the basis for the draft change. NASA antici-pates a response from FASAB in FY 2007.
Also in 2006, NASA implemented compensating controls to address PP&E process weaknesses, including establishment of procurement guidance to facilitate improved accounting for property furnished to contractors. NASA is developing improved business processes for all asset categories to improve the effective lifecycle management of PP&E.
In 2007, the Agency expects to fi nalize its accounting treat-ment policy for NASA’s Theme Assets. Also, NASA will align policies, processes and systems for all of its asset categories with the appropriate accounting treatments. This includes alignment of contract requirements, related primarily to con-tractor property reporting, with agreed upon policies.
3. Fund Balance with TreasuryTo address NASA’s 2005 material weakness in Fund Balance with Treasury (FBWT), the Agency has resolved outstanding reconciling items from prior periods and introduced reconcilia-tion procedures that are tracking current period differences so they may be resolved in a timely manner. NASA Centers are required to provide monthly reconciliation reports for Agency measurement and oversight.
NASA will continue to monitor FBWT differences on a monthly basis. Corrective actions will be taken on each difference, and progress on those actions will be monitored to ensure that differences are resolved in a timely manner.
4. Estimation of Environmental LiabilitiesTo address weaknesses in the estimation of NASA’s unfunded environmental liabilities (UEL), the Agency implemented poli-cies, processes, tools and training that generated auditable estimates of UEL for all Centers by the second Quarter of FY 2006.
To develop these estimates, NASA enhanced the policies and procedures for the estimation of unfunded environmental liabilities for both environmental engineers and accountants. These policies and procedures are documented and consis-tent for all Centers, resulting in more uniform, reliable and valid estimates.
The Agency also held joint training classes for environmental engineers and accountants responsible for determining and documenting unfunded environmental liability (UEL) to ensure consistent understanding and practice.
Statement of Material Weakness: Enhancements needed for controls over Property, Plant and Equipment (PP&E) and materials
Summary Auditor Finding: “Consistent with prior year audit reports, our review of property, plant, and equipment (PP&E), totaling approximately $35.0 billion, identifi ed serious weaknesses in internal control that, if not corrected, could prevent material misstatements from being detected and corrected in a timely manner.” (Reference: NASA FY 2005 Performance and Accountability Report (PAR), Part 3, page 203)
Statement of Material Weakness: Further Research Required to Resolve Fund Balance With Treasury Differences
Summary Auditor Finding: “Although we were informed that many errors from FY 2003 were resolved, signifi cant errors within the accounting system were still being identifi ed by NASA in FY 2005. Fund balance with Treasury reconciliation processes were ineffective in FY 2004 and much of FY 2005, through the date of our visits to centers, but it is our understanding that steps taken by NASA in the last quarter of the year are believed by NASA management to have substantially improved the effectiveness of such reconciliations.” (Reference: NASA FY 2005 Performance and Accountability Report (PAR), Part 3, page 201)
Statement of Reportable Condition:Internal controls in estimating NASA’s Environ-mental Liabilities require enhancement
Summary Auditor Finding“During our review of NASA’s environmental liabil-ity estimates totaling $825 million as of September 30, 2005, and related disclosures to the fi nancial statements, we continued to note weaknesses in NASA’s ability to generate an auditable estimate of its unfunded environmental liabilities (UEL) and to identify potential fi nancial statement disclosure items because of a lack of suffi cient, auditable evi-dence.” (Reference: NASA FY 2005 Performance and Accountability Report (PAR), Part 3, page 207)
160 NASA FY 2006 PERFORMANCE AND ACCOUNTABILITY REPORT
Introduction to the Principal Financial StatementsThe Principal Financial Statements have been prepared to report the fi nancial position and results of operations of the National Aeronautics and Space Administration (NASA). The Statements have been prepared from the books and records of NASA in accordance with formats prescribed by the Offi ce of Management and Budget (OMB) in Circular A-136, Financial Reporting Requirements. The statements are in addition to fi nancial reports prepared by the Agency in accordance with OMB and U.S. Department of the Treasury (Treasury) directives to monitor and control the status and use of budgetary resources, which are prepared from the same books and records. The statements should be read with the understanding that they are for a components of the U.S. Government, a sov-ereign entity. The Agency has no authority to pay liabilities not covered by budgetary resources. Liquidation of such liabilities requires enactment of an appropriation. Comparative data for 2005 are included where available.
NASA’s Principal Financial Statements include the following:
The Consolidated Balance Sheet provides information on assets, liabilities, and net position similar to balance sheets reported in the private sector. Assets must equal the sum of liabilities and net position.
The Consolidated Statement of Net Cost reports the components of the net costs of the Agency’s operations for the period. The net cost of operations consists of the gross cost incurred by the Agency less any exchange (i.e., earned) revenue from activities.
The Consolidated Statement of Changes in Net Position reports the beginning net position, the transactions that affect net position for the period, and the ending net position.
The Combined Statement of Budgetary Resources provides information on how budgetary resources were made available and their status at the end of the year. Information in this statement is reported on the budgetary basis of accounting.
The Consolidated Statement of Financing reports the relationship between budgetary transactions and fi nancial transactions.
Required Supplementary Stewardship Information provides information on the Agency’s Research and Development costs.
Required Supplementary Information contains a Combined Statement of Budgetary Resources and information on Deferred Maintenance.
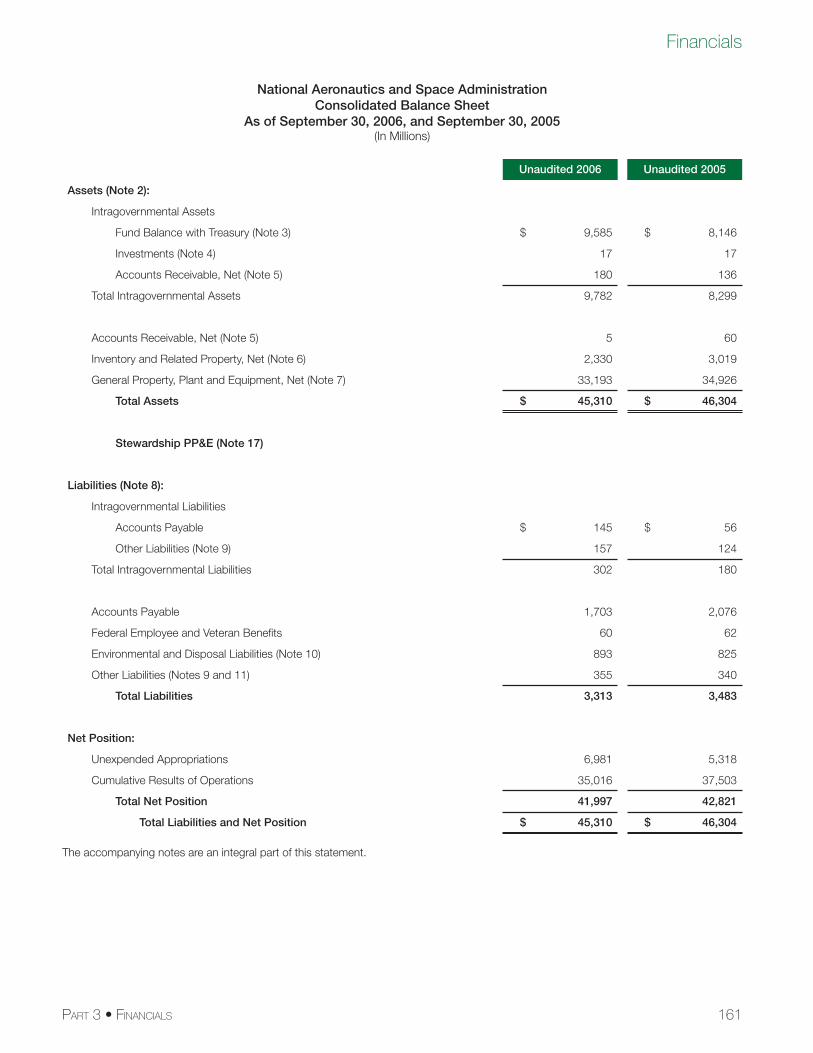
161
Financials
PART 3 • FINANCIALS
National Aeronautics and Space AdministrationConsolidated Balance Sheet
As of September 30, 2006, and September 30, 2005(In Millions)
Unaudited 2006 Unaudited 2005
Assets (Note 2):
Intragovernmental Assets
Fund Balance with Treasury (Note 3) $ 9,585 $ 8,146
Investments (Note 4) 17 17
Accounts Receivable, Net (Note 5) 180 136
Total Intragovernmental Assets 9,782 8,299
Accounts Receivable, Net (Note 5) 5 60
Inventory and Related Property, Net (Note 6) 2,330 3,019
General Property, Plant and Equipment, Net (Note 7) 33,193 34,926
Total Assets $ 45,310 $ 46,304
Stewardship PP&E (Note 17)
Liabilities (Note 8):
Intragovernmental Liabilities
Accounts Payable $ 145 $ 56
Other Liabilities (Note 9) 157 124
Total Intragovernmental Liabilities 302 180
Accounts Payable 1,703 2,076
Federal Employee and Veteran Benefi ts 60 62
Environmental and Disposal Liabilities (Note 10) 893 825
Other Liabilities (Notes 9 and 11) 355 340
Total Liabilities 3,313 3,483
Net Position:
Unexpended Appropriations 6,981 5,318
Cumulative Results of Operations 35,016 37,503
Total Net Position 41,997 42,821
Total Liabilities and Net Position $ 45,310 $ 46,304
The accompanying notes are an integral part of this statement.
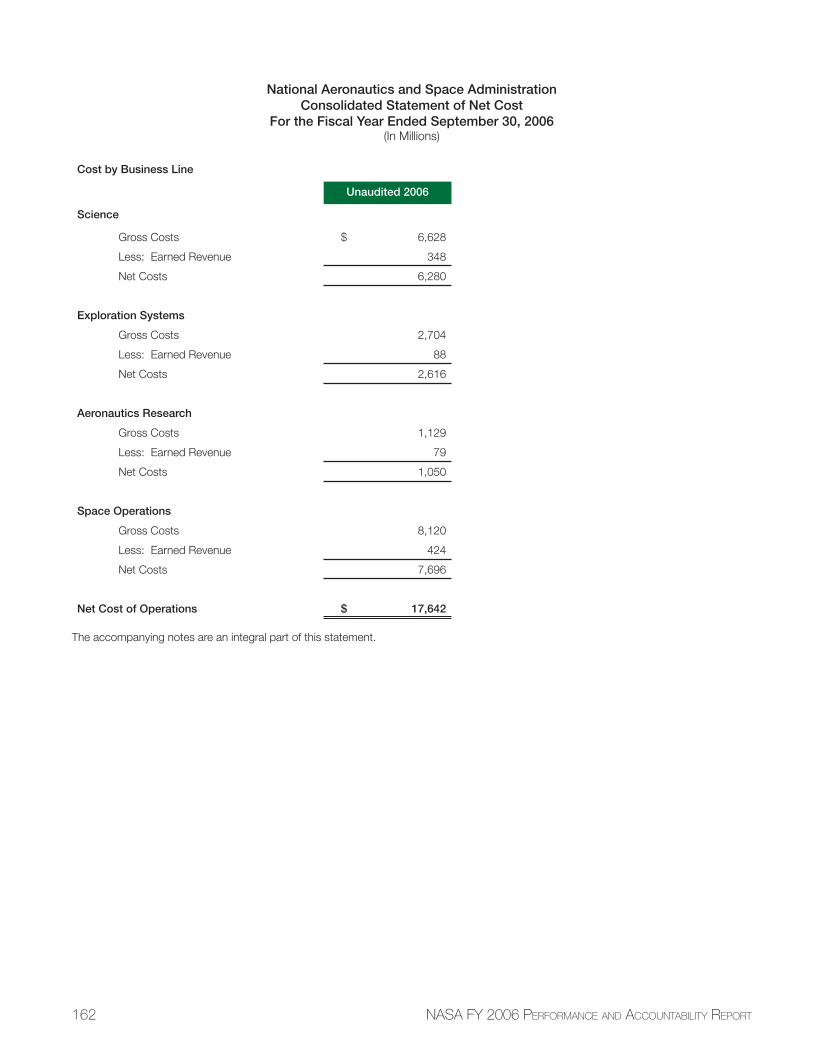
162 NASA FY 2006 PERFORMANCE AND ACCOUNTABILITY REPORT
National Aeronautics and Space AdministrationConsolidated Statement of Net Cost
For the Fiscal Year Ended September 30, 2006(In Millions)
Cost by Business Line
Unaudited 2006
Science
Gross Costs $ 6,628
Less: Earned Revenue 348
Net Costs 6,280
Exploration Systems
Gross Costs 2,704
Less: Earned Revenue 88
Net Costs 2,616
Aeronautics Research
Gross Costs 1,129
Less: Earned Revenue 79
Net Costs 1,050
Space Operations
Gross Costs 8,120
Less: Earned Revenue 424
Net Costs 7,696
Net Cost of Operations $ 17,642
The accompanying notes are an integral part of this statement.
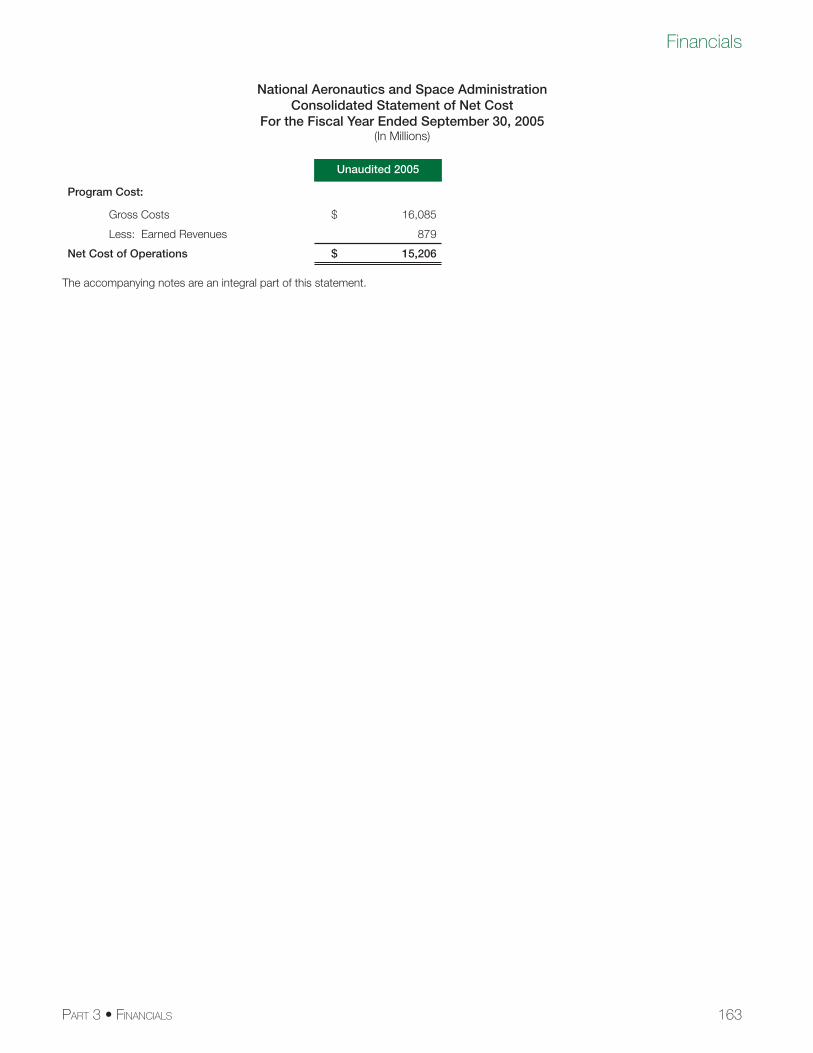
163
Financials
PART 3 • FINANCIALS
National Aeronautics and Space AdministrationConsolidated Statement of Net Cost
For the Fiscal Year Ended September 30, 2005(In Millions)
Unaudited 2005
Program Cost:
Gross Costs $ 16,085
Less: Earned Revenues 879
Net Cost of Operations $ 15,206
The accompanying notes are an integral part of this statement.
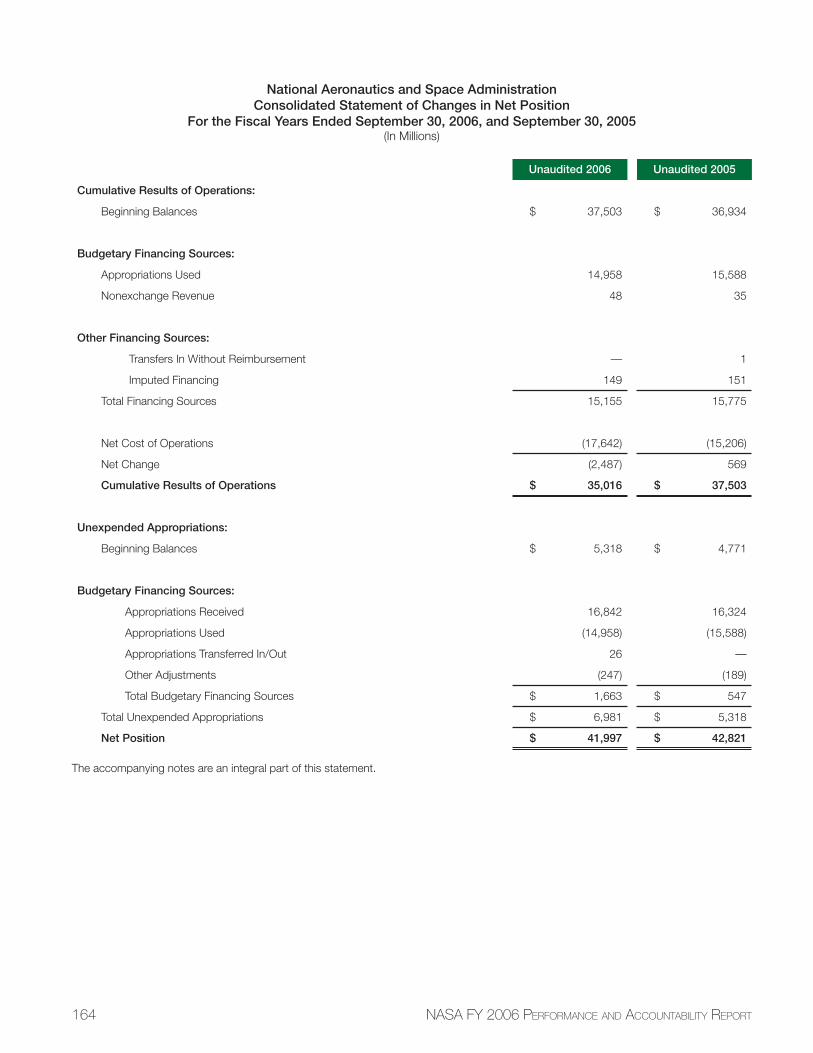
164 NASA FY 2006 PERFORMANCE AND ACCOUNTABILITY REPORT
National Aeronautics and Space AdministrationConsolidated Statement of Changes in Net Position
For the Fiscal Years Ended September 30, 2006, and September 30, 2005(In Millions)
Unaudited 2006 Unaudited 2005
Cumulative Results of Operations:
Beginning Balances $ 37,503 $ 36,934
Budgetary Financing Sources:
Appropriations Used 14,958 15,588
Nonexchange Revenue 48 35
Other Financing Sources:
Transfers In Without Reimbursement — 1
Imputed Financing 149 151
Total Financing Sources 15,155 15,775
Net Cost of Operations (17,642) (15,206)
Net Change (2,487) 569
Cumulative Results of Operations $ 35,016 $ 37,503
Unexpended Appropriations:
Beginning Balances $ 5,318 $ 4,771
Budgetary Financing Sources:
Appropriations Received 16,842 16,324
Appropriations Used (14,958) (15,588)
Appropriations Transferred In/Out 26 —
Other Adjustments (247) (189)
Total Budgetary Financing Sources $ 1,663 $ 547
Total Unexpended Appropriations $ 6,981 $ 5,318
Net Position $ 41,997 $ 42,821
The accompanying notes are an integral part of this statement.
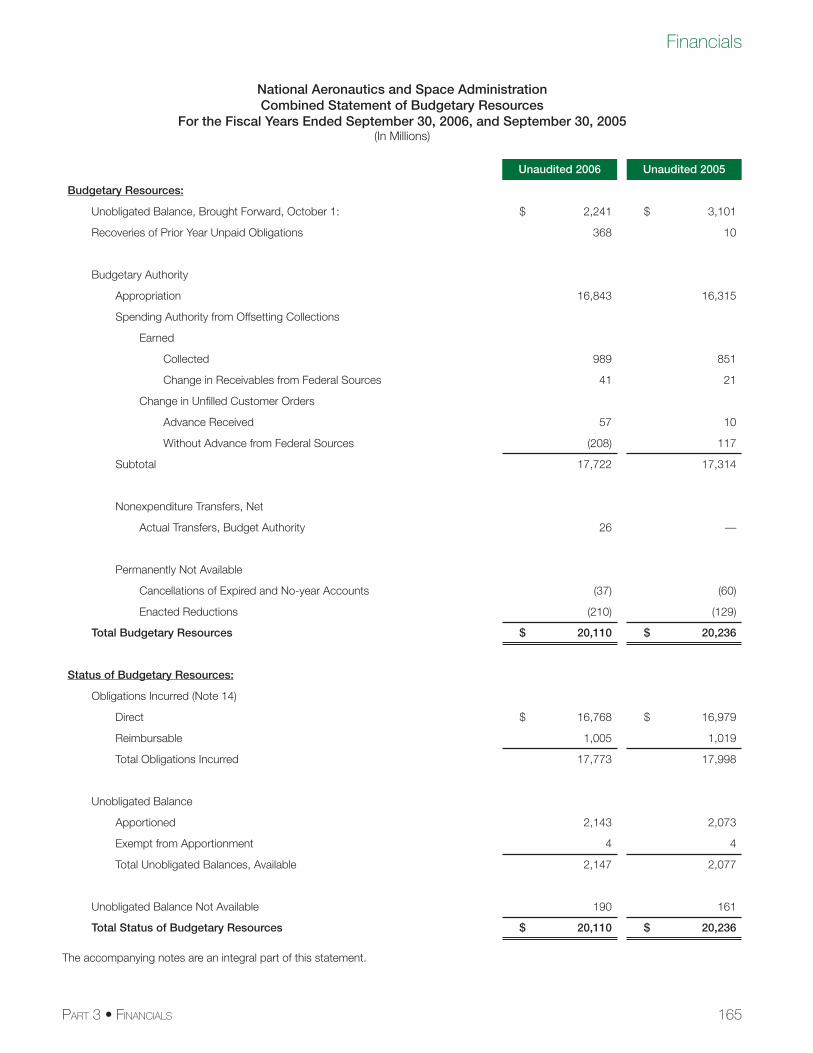
165
Financials
PART 3 • FINANCIALS
National Aeronautics and Space AdministrationCombined Statement of Budgetary Resources
For the Fiscal Years Ended September 30, 2006, and September 30, 2005(In Millions)
Unaudited 2006 Unaudited 2005
Budgetary Resources:
Unobligated Balance, Brought Forward, October 1: $ 2,241 $ 3,101
Recoveries of Prior Year Unpaid Obligations 368 10
Budgetary Authority
Appropriation 16,843 16,315
Spending Authority from Offsetting Collections
Earned
Collected 989 851
Change in Receivables from Federal Sources 41 21
Change in Unfi lled Customer Orders
Advance Received 57 10
Without Advance from Federal Sources (208) 117
Subtotal 17,722 17,314
Nonexpenditure Transfers, Net
Actual Transfers, Budget Authority 26 —
Permanently Not Available
Cancellations of Expired and No-year Accounts (37) (60)
Enacted Reductions (210) (129)
Total Budgetary Resources $ 20,110 $ 20,236
Status of Budgetary Resources:
Obligations Incurred (Note 14)
Direct $ 16,768 $ 16,979
Reimbursable 1,005 1,019
Total Obligations Incurred 17,773 17,998
Unobligated Balance
Apportioned 2,143 2,073
Exempt from Apportionment 4 4
Total Unobligated Balances, Available 2,147 2,077
Unobligated Balance Not Available 190 161
Total Status of Budgetary Resources $ 20,110 $ 20,236
The accompanying notes are an integral part of this statement.
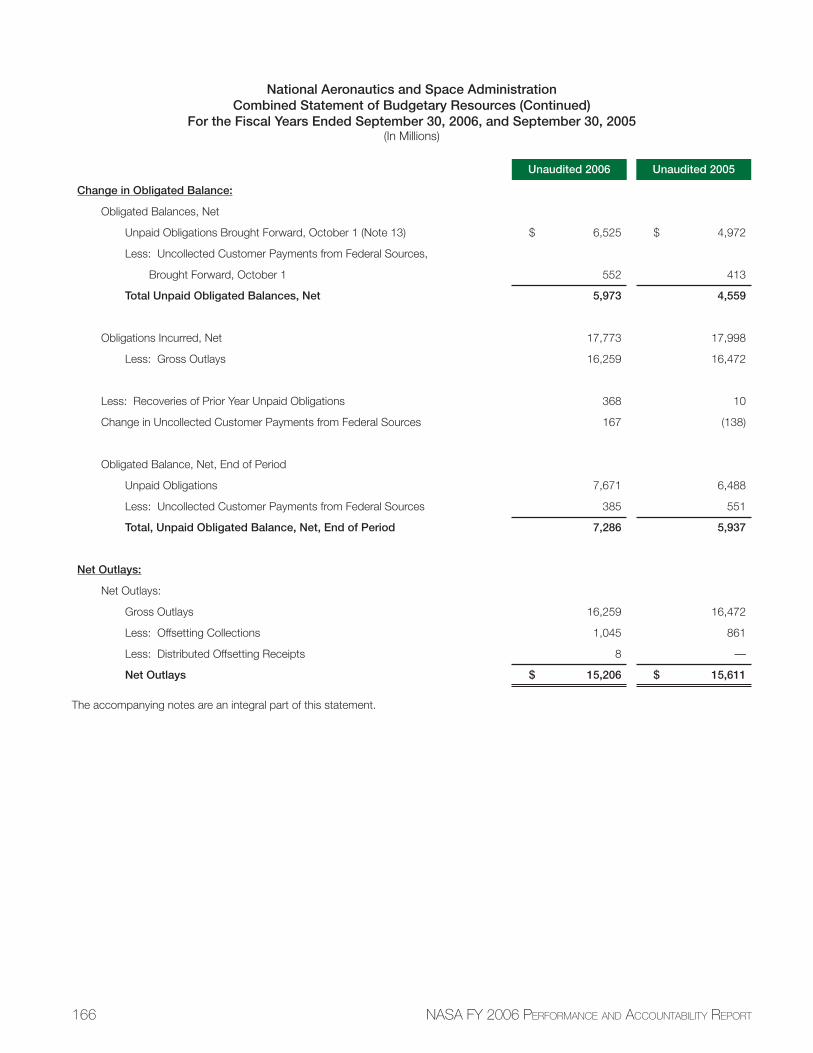
166 NASA FY 2006 PERFORMANCE AND ACCOUNTABILITY REPORT
National Aeronautics and Space AdministrationCombined Statement of Budgetary Resources (Continued)
For the Fiscal Years Ended September 30, 2006, and September 30, 2005(In Millions)
Unaudited 2006 Unaudited 2005
Change in Obligated Balance:
Obligated Balances, Net
Unpaid Obligations Brought Forward, October 1 (Note 13) $ 6,525 $ 4,972
Less: Uncollected Customer Payments from Federal Sources,
Brought Forward, October 1 552 413
Total Unpaid Obligated Balances, Net 5,973 4,559
Obligations Incurred, Net 17,773 17,998
Less: Gross Outlays 16,259 16,472
Less: Recoveries of Prior Year Unpaid Obligations 368 10
Change in Uncollected Customer Payments from Federal Sources 167 (138)
Obligated Balance, Net, End of Period
Unpaid Obligations 7,671 6,488
Less: Uncollected Customer Payments from Federal Sources 385 551
Total, Unpaid Obligated Balance, Net, End of Period 7,286 5,937
Net Outlays:
Net Outlays:
Gross Outlays 16,259 16,472
Less: Offsetting Collections 1,045 861
Less: Distributed Offsetting Receipts 8 —
Net Outlays $ 15,206 $ 15,611
The accompanying notes are an integral part of this statement.
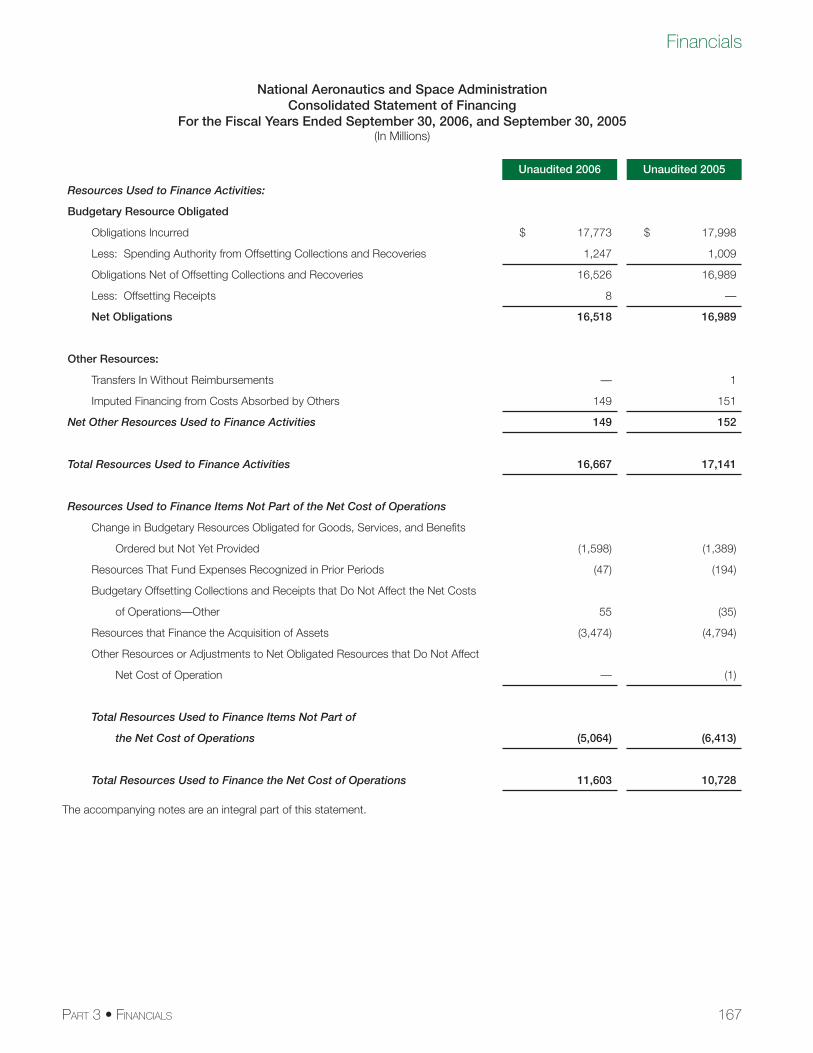
167
Financials
PART 3 • FINANCIALS
National Aeronautics and Space AdministrationConsolidated Statement of Financing
For the Fiscal Years Ended September 30, 2006, and September 30, 2005(In Millions)
Unaudited 2006 Unaudited 2005
Resources Used to Finance Activities:
Budgetary Resource Obligated
Obligations Incurred $ 17,773 $ 17,998
Less: Spending Authority from Offsetting Collections and Recoveries 1,247 1,009
Obligations Net of Offsetting Collections and Recoveries 16,526 16,989
Less: Offsetting Receipts 8 —
Net Obligations 16,518 16,989
Other Resources:
Transfers In Without Reimbursements — 1
Imputed Financing from Costs Absorbed by Others 149 151
Net Other Resources Used to Finance Activities 149 152
Total Resources Used to Finance Activities 16,667 17,141
Resources Used to Finance Items Not Part of the Net Cost of Operations
Change in Budgetary Resources Obligated for Goods, Services, and Benefi ts
Ordered but Not Yet Provided (1,598) (1,389)
Resources That Fund Expenses Recognized in Prior Periods (47) (194)
Budgetary Offsetting Collections and Receipts that Do Not Affect the Net Costs
of Operations—Other 55 (35)
Resources that Finance the Acquisition of Assets (3,474) (4,794)
Other Resources or Adjustments to Net Obligated Resources that Do Not Affect
Net Cost of Operation — (1)
Total Resources Used to Finance Items Not Part of
the Net Cost of Operations (5,064) (6,413)
Total Resources Used to Finance the Net Cost of Operations 11,603 10,728
The accompanying notes are an integral part of this statement.
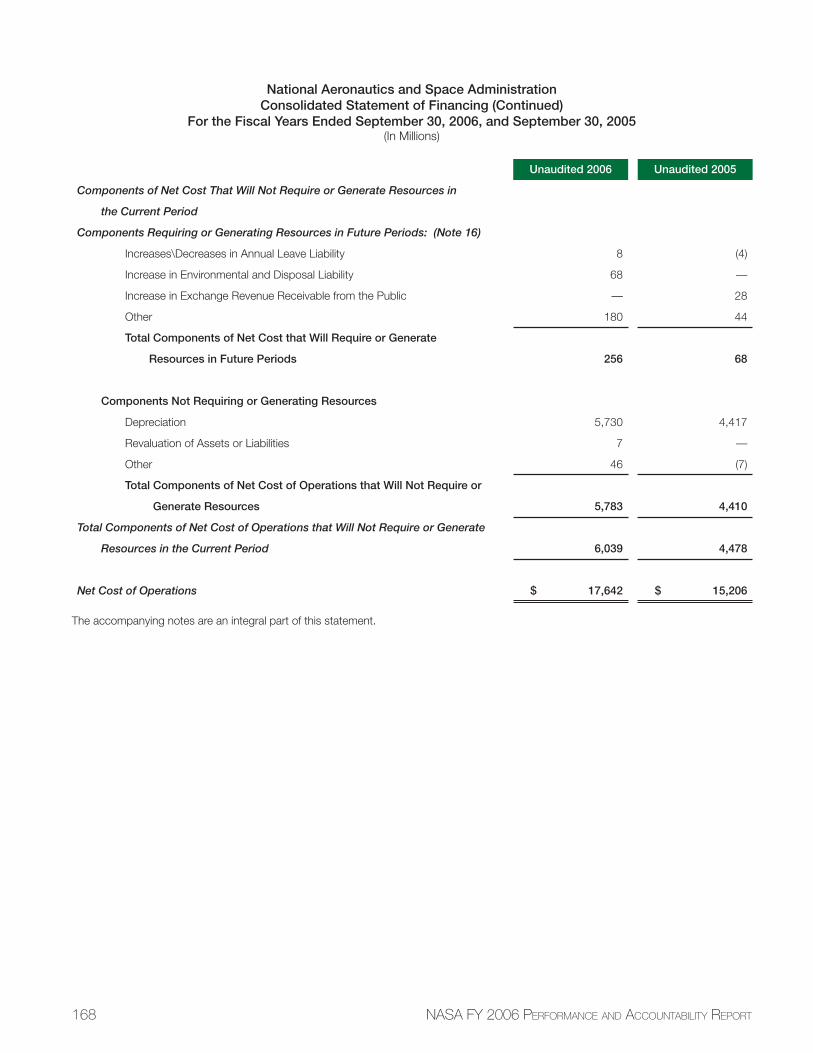
168 NASA FY 2006 PERFORMANCE AND ACCOUNTABILITY REPORT
National Aeronautics and Space AdministrationConsolidated Statement of Financing (Continued)
For the Fiscal Years Ended September 30, 2006, and September 30, 2005(In Millions)
Unaudited 2006 Unaudited 2005
Components of Net Cost That Will Not Require or Generate Resources in
the Current Period
Components Requiring or Generating Resources in Future Periods: (Note 16)
Increases\Decreases in Annual Leave Liability 8 (4)
Increase in Environmental and Disposal Liability 68 —
Increase in Exchange Revenue Receivable from the Public — 28
Other 180 44
Total Components of Net Cost that Will Require or Generate
Resources in Future Periods 256 68
Components Not Requiring or Generating Resources
Depreciation 5,730 4,417
Revaluation of Assets or Liabilities 7 —
Other 46 (7)
Total Components of Net Cost of Operations that Will Not Require or
Generate Resources 5,783 4,410
Total Components of Net Cost of Operations that Will Not Require or Generate
Resources in the Current Period 6,039 4,478
Net Cost of Operations $ 17,642 $ 15,206
The accompanying notes are an integral part of this statement.
169
Financials
PART 3 • FINANCIALS
National Aeronautics and Space AdministrationNotes to Financial Statements(Fiscal Years 2006 and 2005 Are Unaudited)
NOTE 1. SUMMARY OF SIGNIFICANT ACCOUNTING POLICIES
Reporting Entity
The National Aeronautics and Space Administration (NASA) is an independent Agency that was established by Congress on October 1, 1958 by the National Aeronautics and Space Act of 1958. NASA was incorporated from the Agency’s predecessor or-ganization, the National Advisory Committee for Aeronautics, which provided technical advice to the United States aviation industry and performed aeronautics research. Today, NASA serves as the fulcrum for initiatives by the U.S. in civil space and aviation.
As of August 2004, NASA is organized into four Business Lines which focus on the following objectives:
• Exploration Systems: creating new capabilities, supporting technologies and foundational research for affordable, sus-tainable human and robotic exploration;
• Space Operations: providing critical enabling technologies for much of the rest of NASA through the Space Shuttle, the International Space Station, and fl ight support;
• Science: exploring the Earth, moon, Mars, and beyond; charting the best route of discovery, and reaping the benefi ts of Earth and space exploration for society; and
• Aeronautics Research: conducting research that will enhance signifi cantly aircraft performance, environmental compat-ibility, and safety, and that also will enhance the capacity, fl exibility, and safety of the future air transportation system.
In addition, NASA has nine Business Line (Mission) Support Offi ces, including the Offi ce of the Chief Financial Offi cer and Institutions & Management. The Agency’s transformed structure includes a Strategic Management Council, an Operations Management Council and a Program Management Council to integrate NASA’s strategic, tactical and operational decisions, and a number of new or reconstituted committees that support NASA’s focus and direction. The transformed organizational structure is designed to streamline the Agency and position it to better implement the Vision for Space Exploration.
The nine NASA Centers, NASA Headquarters, and the Jet Propulsion Laboratory carry out the activities of the Mission Director-ates. The Jet Propulsion Laboratory is a federally funded Research and Development Center owned by NASA but managed by an independent contractor.
The accompanying fi nancial statements of NASA include the accounts of all funds which have been established and maintained to account for the resources under the control of NASA management.
Basis of Accounting and Presentation
These consolidated fi nancial statements are prepared in accordance with generally accepted accounting principles (GAAP) in the United States of America as promulgated by the Federal Accounting Standards Advisory Board (FASAB) and the Offi ce of Management and Budget (OMB) Circular A-136, Financial Reporting Requirements. FASAB is recognized by the American Institute of Certifi ed Public Accountants (AICPA) as the offi cial accounting standards-setting body of the United States government entities. The statements include the fi nancial position, net cost of operations, changes in net position, budgetary resources, and fi nancing of NASA, as required by the Chief Financial Offi cers Act of 1990 and the Government Management Reform Act of 1994.
The fi nancial statements should be read with the realization they are a component of the U.S. government, a sovereign entity. One implication of this is that liabilities cannot be liquidated without legislation providing resources and legal authority to do so. The ac-counting structure of federal agencies is designed to refl ect both accrual and budgetary accounting transactions. Under the accrual method of accounting, revenues are recognized when earned and expenses are recognized when a liability is incurred, without regard to receipt or payment of cash. Budgetary accounting facilitates compliance with legal constraints and controls over the use of federal funds.
Budgets and Budgetary Accounting
NASA follows standard Federal budgetary accounting policies and practices in accordance with OMB Circular A-11, Preparation, Submission and Execution of the Budget. Budgetary accounting facilitates compliance with legal constraints and controls over the use of Federal Funds. Congress funds NASA using three appropriations: Science, Aeronautics and Exploration; Exploration Capabilities; and Offi ce of Inspector General.
170 NASA FY 2006 PERFORMANCE AND ACCOUNTABILITY REPORT
The Science, Aeronautics and Exploration appropriation supports the following Business Lines: Science; Exploration Systems; and Aeronautics Research. The Exploration Capabilities appropriation supports the Space Operations Business Line which includes the Space Station, Space Shuttle, and Space and Flight Support. The Offi ce of Inspector General appropriation funds the audit and investigation activities of the Agency.
Reimbursements to NASA appropriations are used to fund agreements between the Agency and other federal entities or the public. As part of its reimbursable program, NASA launches devices into space and provides tracking and data relay services for the U.S. Department of Defense, the National Oceanic and Atmosphere Administration, and the National Weather Service.
Use of Estimates
The preparation of fi nancial statements requires management to make estimates and assumptions that affect the reported amounts of assets and liabilities as of the date of the fi nancial statements and the reported amounts of revenues and expenses during the reporting period. Actual results could differ from these estimates.
NASA requires major contractors to provide an estimate of their anticipated billing prior to their sending the actual invoice to the agency. In addition, NASA also requires the contractors to provide an estimate for the next month’s anticipated work. When NASA receives these estimates they are compared to the contract under which the work is performed. If the estimate exceeds a specifi ed funding line item the program manager and the procurement offi cial, as necessary, review the estimate prior to posting in the general ledger as an estimated liability. If the review is not completed within the timeframe for quarterly or yearly reporting, the Agency uses the estimates of activity through the current period to establish an estimated liability, however, in this instance the agency fully recognizes that “no agency has the authority to pay liabilities not covered by budgetary resources.” Liability to the contractor is not established by receipt of these estimates, but only when accepted by the Agency.
Fund Balance with Treasury
Treasury processes cash receipts and disbursements for NASA. Fund Balance with Treasury includes appropriated funds, trust funds, deposit funds, and budget clearing accounts.
Investments in U.S. Government Securities
Investments include the following Intragovernmental non-marketable securities:
(1) National Aeronautics and Space Administration Endeavor Teacher Fellowship Trust Fund established from public donations in tribute to the crew of the Space Shuttle Challenger.
(2) Science, Space and Technology Education Trust Fund established for programs to improve science and technology education.
Accounts Receivable
Most receivables are for reimbursement of research and development costs related to satellites and launch services. The allowance for uncollectible accounts is based upon evaluation of public accounts receivable, considering the probability of failure to collect based upon current status, fi nancial and other relevant characteristics of debtors, and the relationship with the debtor. Under a cross-servicing agreement with the Department of Treasury, public accounts receivable over 180 days delinquent are turned over to Treasury for collection. The receivable remains on NASA’s books until Treasury determines the receivable is uncollectible or the receivable is internally written off and closed out.
Inventory and Related Property
Inventory held by Centers and contractors that are repetitively procured, stored and issued on the basis of demand are considered Operating Materials and Supplies, a category of Inventory and Related Property. Certain NASA contractors’ inventory management systems do not distinguish between items that should be classifi ed as materials and those that should be classifi ed as depreciable property. NASA reclassifi es as property, all materials valued at $100,000 or greater, in support of large-scale assets such as the Space Shuttle and the International Space Station.
National Aeronautics and Space AdministrationNotes to Financial Statements(Fiscal Years 2006 and 2005 Are Unaudited)
NOTE 1. SUMMARY OF SIGNIFICANT ACCOUNTING POLICIES (CONTINUED)
171
Financials
PART 3 • FINANCIALS
General Property, Plant and Equipment
The Agency and its contractors and grantees hold NASA-owned property, plant, and equipment. Property with a unit cost of $100,000 or more and a useful life of 2 years or more is capitalized; all other property is expensed when purchased. Capitalized costs include all costs incurred by NASA to bring the property to a form and location suitable for its intended use. Under provisions of the Federal Acquisition Regulation (FAR), contractors are responsible for control over accountability for Government-owned prop-erty in their possession. NASA’s contractors and grantees report on NASA property in their custody annually and its top contractors report monthly.
Capitalized costs for internally developed software include the full costs (direct and indirect) incurred during the software develop-ment stage only. For purchased software, capitalized costs include amounts paid to vendors for the software and material internal costs incurred by the Agency to implement and make the software ready for use through acceptance testing. When NASA pur-chases software as part of a package of products and services (for example: training, maintenance, data conversion, reengineering, site licenses, and rights to future upgrades and enhancements), capitalized and non-capitalized costs of the package are allocated among individual elements on the basis of a reasonable estimate of their relative fair market values. Costs that are not susceptible to allocation between maintenance and relatively minor enhancements are expensed.
NASA capitalizes costs for internal use software when the total projected cost is $1,000,000 or more and the expected useful life of the software is 2 years or more. These Financial Statements report depreciation expense using the straight-line method.
NASA began depreciating the International Space Station in FY 2001 when manned by the fi rst permanent crew. Only the Station’s major elements in space are depreciated; any on-ground elements are reported as Assets Under Construction (AUC) until launched and incorporated into the existing Station structure.
Working Capital Fund
Congress established the NASA Working Capital Fund (WCF) during fi scal year 2003 with the enactment of the FY 2003 Appropria-tions Act (P.L. 108-7). The Department of Treasury established a unique account for NASA that same fi scal year. During FY 2006 the NASA WCF consisted of two entities: 1) a Government-Wide Acquisition Contract (GWAC) that provides the latest in Information Technology (IT) products. This provided a simplifi ed process for obtaining high-end commercial IT hardware and software at favor-able prices through volume buying. 2) An agency-wide Service Center, NASA Shared Services Center (NSSC).
NASA Shared Service Center
NASA Shared Services Center opened March 1, 2006 on the grounds of Stennis Space Center. The NSSC is a public/private partnership between NASA and Computer Sciences Corporation Service Providers. The mixed staff of civil service and contractor personnel, performs a variety of consolidated transactional and administrative activities that were once carried out at each NASA center and Headquarters. These functions consisted of responsibilities in the following areas: Financial Management (FM), Human Resources (HR), Information Technology (IT) and Procurement.
Liabilities Covered by Budgetary Resources
Liabilities covered by budgetary resources are liabilities that are covered by realized budgetary resources as of the balance sheet date. Realized budgetary resources include new budget authority, unobligated balances of budgetary resources at the beginning of the year, and spending authority from offsetting collections. Examples include accounts payable and salaries. Accounts Payable includes amounts recorded for the receipt of goods or services furnished.
Liabilities and Contingencies Not Covered by Budgetary Resources
Generally liabilities not covered by budgetary resources are liabilities for which Congressional action is needed before budgetary resources can be provided. Examples include the Federal Employees’ Compensation Act (FECA) actuarial liability and contingen-cies.
Liabilities not covered by budgetary resources include certain environmental matters, legal claims, pensions and other retirement benefi ts (ORB), workers’ compensation, annual leave, and closed appropriations.
National Aeronautics and Space AdministrationNotes to Financial Statements(Fiscal Years 2006 and 2005 Are Unaudited)
NOTE 1. SUMMARY OF SIGNIFICANT ACCOUNTING POLICIES, CONTINUED
172 NASA FY 2006 PERFORMANCE AND ACCOUNTABILITY REPORT
Reclassifi cations of 2005 Information
Certain reclassifi cations have been made to Fiscal Year 2005 fi nancial statements and footnotes to conform to OMB’s changes to Circular A-136 effective in Fiscal Year 2006.
Annual, Sick, and Other Leave
Annual leave is accrued as it is earned; the accrual is reduced as leave is taken. Each year, the balance in the accrued annual leave account is adjusted to refl ect current pay rates. To the extent current or prior year appropriations are not available to fund annual leave earned but not taken, funding will be obtained from future fi nancing sources. Sick leave and other types of non-vested leave are expensed as taken.
Federal Employee and Veterans’ Benefi ts
Agency employees participate in the Civil Service Retirement System (CSRS), a defi ned benefi t plan, or the Federal Employees Re-tirement System (FERS), a defi ned benefi t and contribution plan. For CSRS employees, NASA makes contributions of 8.51 percent of pay. For FERS employees, NASA makes contributions of 10.7 percent to the defi ned benefi t plan, contributes 1 percent of pay to a retirement saving plan (contribution plan), and matches employee contributions up to an additional 4 percent of pay. For FERS employees, NASA also contributes to employer’s matching share for Social Security.
Statement of Federal Financial Accounting Standards No. 5, “Accounting for Liabilities of the Federal Government,” require Govern-ment agencies to report the full cost of employee health benefi ts (FEHB), and the Federal Employees Group Life Insurance (FEGLI) Programs. NASA used the applicable cost factors and imputed fi nancing sources from the Offi ce of Personnel and Management Letter For Chief Financial Offi cers, dated August 16, 2004, in these Financial Statements.
Environmental and Disposal Liabilities
The Agency records a liability for environmental and disposal clean-up costs from NASA operations that resulted in contamination from waste disposal methods, leaks, spills, and other past activity that created a public health or environmental risk. These liabilities are assessed by the engineers and fi nance staff to be probable, reasonably possible or remote. Mid-year determinations are made of the status of these unfunded liabilities and year end updates are made for any changes up or down that exceed $200,000 and probable losses for which an estimate of remediation costs can be made are recorded. More details are also found in Note 10.
National Aeronautics and Space AdministrationNotes to Financial Statements(Fiscal Years 2006 and 2005 Are Unaudited)
NOTE 1. SUMMARY OF SIGNIFICANT ACCOUNTING POLICIES, CONTINUED
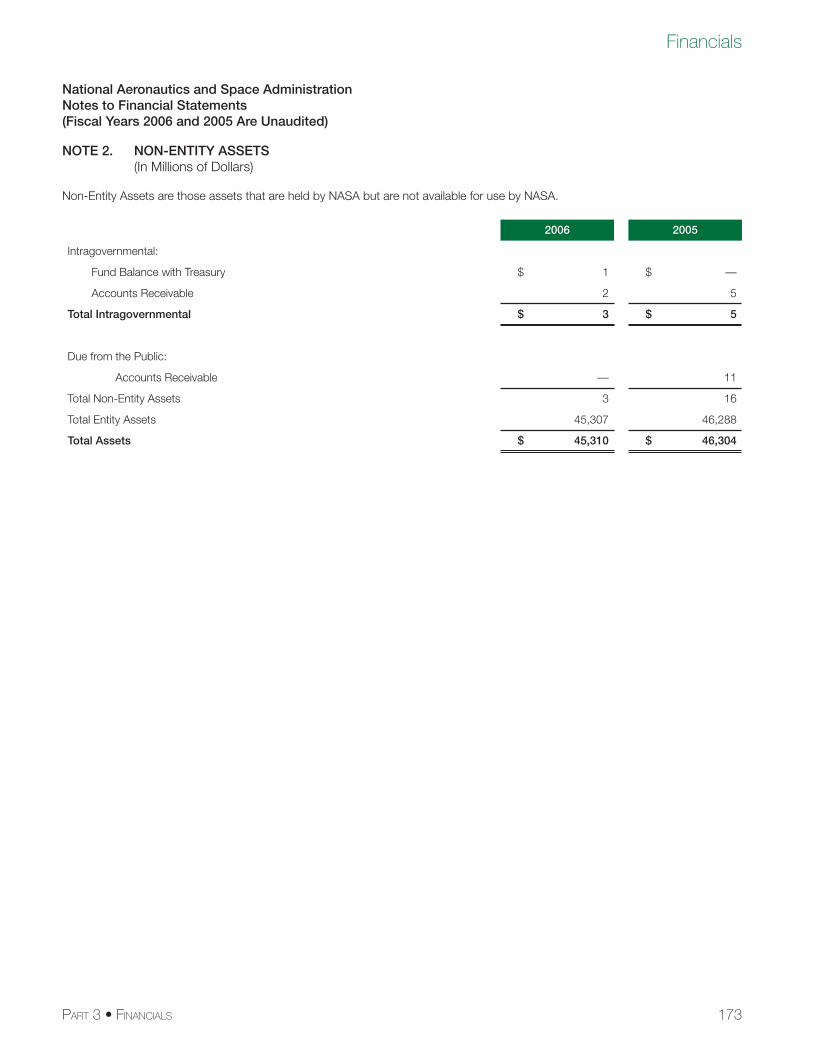
173
Financials
PART 3 • FINANCIALS
National Aeronautics and Space AdministrationNotes to Financial Statements(Fiscal Years 2006 and 2005 Are Unaudited)
NOTE 2. NON-ENTITY ASSETS (In Millions of Dollars)
Non-Entity Assets are those assets that are held by NASA but are not available for use by NASA.
2006 2005
Intragovernmental:
Fund Balance with Treasury $ 1 $ —
Accounts Receivable 2 5
Total Intragovernmental $ 3 $ 5
Due from the Public:
Accounts Receivable — 11
Total Non-Entity Assets 3 16
Total Entity Assets 45,307 46,288
Total Assets $ 45,310 $ 46,304
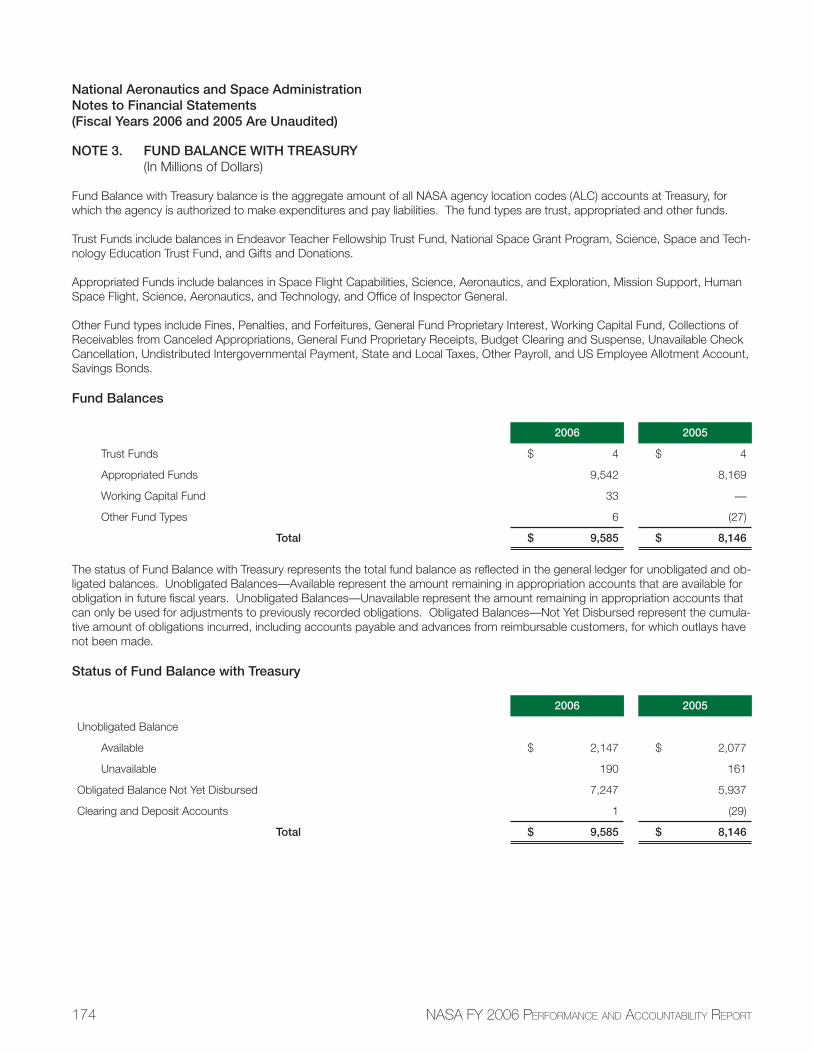
174 NASA FY 2006 PERFORMANCE AND ACCOUNTABILITY REPORT
National Aeronautics and Space AdministrationNotes to Financial Statements(Fiscal Years 2006 and 2005 Are Unaudited)
NOTE 3. FUND BALANCE WITH TREASURY (In Millions of Dollars)
Fund Balance with Treasury balance is the aggregate amount of all NASA agency location codes (ALC) accounts at Treasury, for which the agency is authorized to make expenditures and pay liabilities. The fund types are trust, appropriated and other funds.
Trust Funds include balances in Endeavor Teacher Fellowship Trust Fund, National Space Grant Program, Science, Space and Tech-nology Education Trust Fund, and Gifts and Donations.
Appropriated Funds include balances in Space Flight Capabilities, Science, Aeronautics, and Exploration, Mission Support, Human Space Flight, Science, Aeronautics, and Technology, and Offi ce of Inspector General.
Other Fund types include Fines, Penalties, and Forfeitures, General Fund Proprietary Interest, Working Capital Fund, Collections of Receivables from Canceled Appropriations, General Fund Proprietary Receipts, Budget Clearing and Suspense, Unavailable Check Cancellation, Undistributed Intergovernmental Payment, State and Local Taxes, Other Payroll, and US Employee Allotment Account, Savings Bonds.
Fund Balances
2006 2005
Trust Funds $ 4 $ 4
Appropriated Funds 9,542 8,169
Working Capital Fund 33 —
Other Fund Types 6 (27)
Total $ 9,585 $ 8,146
The status of Fund Balance with Treasury represents the total fund balance as refl ected in the general ledger for unobligated and ob-ligated balances. Unobligated Balances—Available represent the amount remaining in appropriation accounts that are available for obligation in future fi scal years. Unobligated Balances—Unavailable represent the amount remaining in appropriation accounts that can only be used for adjustments to previously recorded obligations. Obligated Balances—Not Yet Disbursed represent the cumula-tive amount of obligations incurred, including accounts payable and advances from reimbursable customers, for which outlays have not been made.
Status of Fund Balance with Treasury
2006 2005
Unobligated Balance
Available $ 2,147 $ 2,077
Unavailable 190 161
Obligated Balance Not Yet Disbursed 7,247 5,937
Clearing and Deposit Accounts 1 (29)
Total $ 9,585 $ 8,146
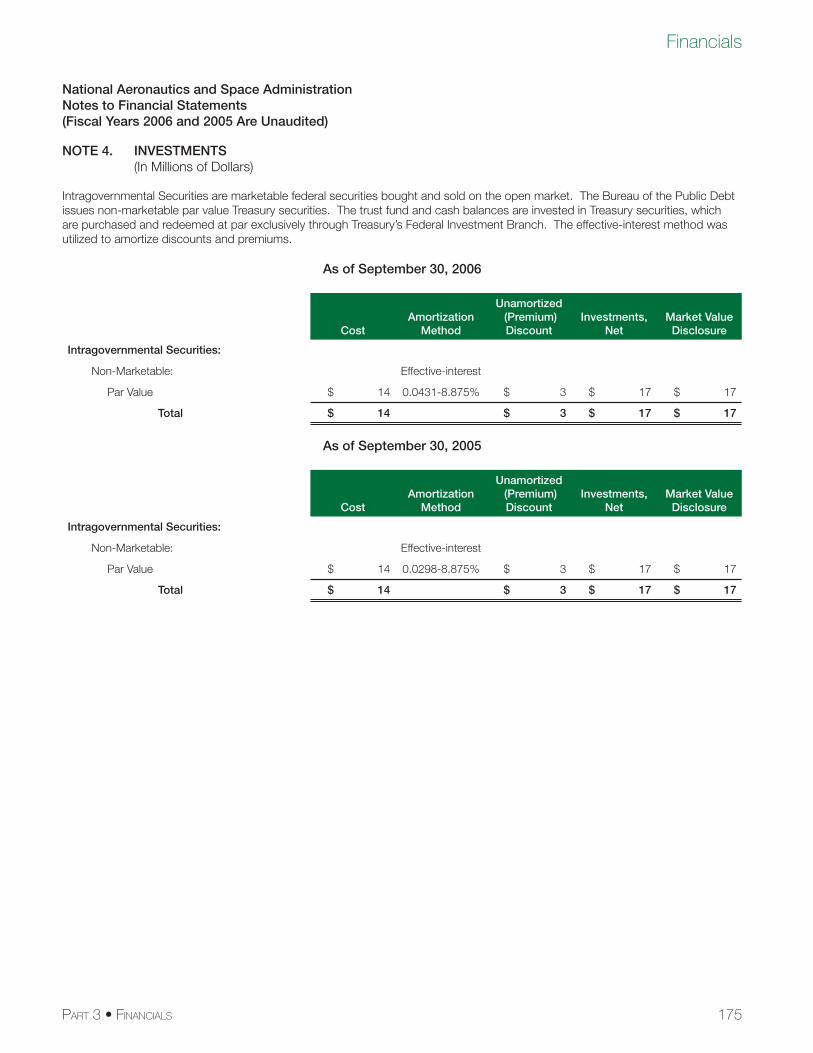
175
Financials
PART 3 • FINANCIALS
National Aeronautics and Space AdministrationNotes to Financial Statements(Fiscal Years 2006 and 2005 Are Unaudited)
NOTE 4. INVESTMENTS (In Millions of Dollars)
Intragovernmental Securities are marketable federal securities bought and sold on the open market. The Bureau of the Public Debt issues non-marketable par value Treasury securities. The trust fund and cash balances are invested in Treasury securities, which are purchased and redeemed at par exclusively through Treasury’s Federal Investment Branch. The effective-interest method was utilized to amortize discounts and premiums.
As of September 30, 2006
CostAmortization
Method
Unamortized (Premium) Discount
Investments,Net
Market Value Disclosure
Intragovernmental Securities:
Non-Marketable: Effective-interest
Par Value $ 14 0.0431-8.875% $ 3 $ 17 $ 17
Total $ 14 $ 3 $ 17 $ 17
As of September 30, 2005
CostAmortization
Method
Unamortized (Premium) Discount
Investments,Net
Market Value Disclosure
Intragovernmental Securities:
Non-Marketable: Effective-interest
Par Value $ 14 0.0298-8.875% $ 3 $ 17 $ 17
Total $ 14 $ 3 $ 17 $ 17
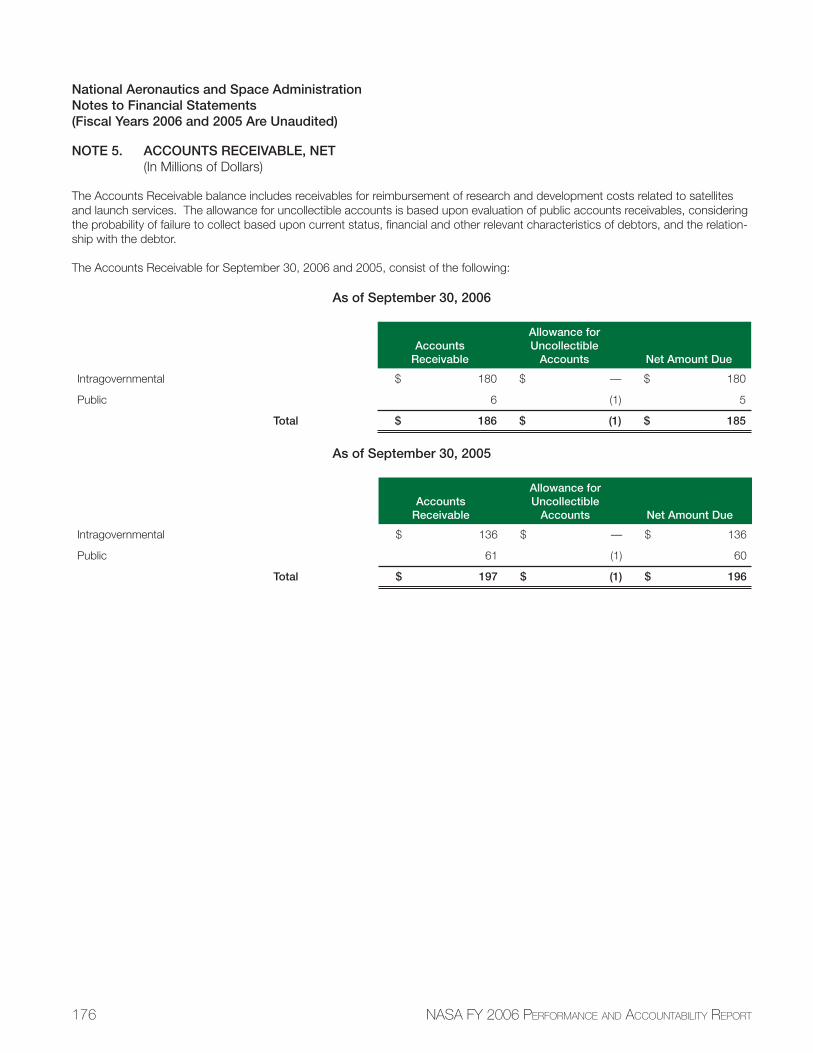
176 NASA FY 2006 PERFORMANCE AND ACCOUNTABILITY REPORT
National Aeronautics and Space AdministrationNotes to Financial Statements(Fiscal Years 2006 and 2005 Are Unaudited)
NOTE 5. ACCOUNTS RECEIVABLE, NET (In Millions of Dollars)
The Accounts Receivable balance includes receivables for reimbursement of research and development costs related to satellites and launch services. The allowance for uncollectible accounts is based upon evaluation of public accounts receivables, considering the probability of failure to collect based upon current status, fi nancial and other relevant characteristics of debtors, and the relation-ship with the debtor.
The Accounts Receivable for September 30, 2006 and 2005, consist of the following:
As of September 30, 2006
Accounts Receivable
Allowance for Uncollectible
Accounts Net Amount Due
Intragovernmental $ 180 $ — $ 180
Public 6 (1) 5
Total $ 186 $ (1) $ 185
As of September 30, 2005
Accounts Receivable
Allowance for Uncollectible
Accounts Net Amount Due
Intragovernmental $ 136 $ — $ 136
Public 61 (1) 60
Total $ 197 $ (1) $ 196
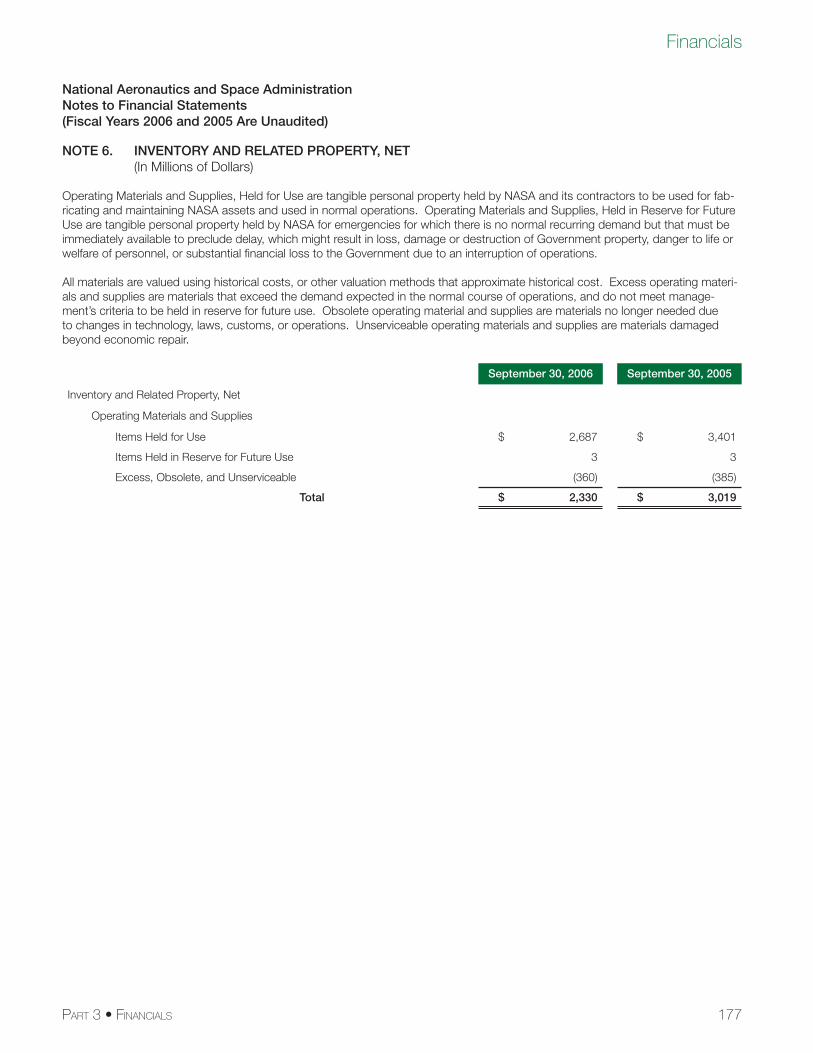
177
Financials
PART 3 • FINANCIALS
National Aeronautics and Space AdministrationNotes to Financial Statements(Fiscal Years 2006 and 2005 Are Unaudited)
NOTE 6. INVENTORY AND RELATED PROPERTY, NET (In Millions of Dollars)
Operating Materials and Supplies, Held for Use are tangible personal property held by NASA and its contractors to be used for fab-ricating and maintaining NASA assets and used in normal operations. Operating Materials and Supplies, Held in Reserve for Future Use are tangible personal property held by NASA for emergencies for which there is no normal recurring demand but that must be immediately available to preclude delay, which might result in loss, damage or destruction of Government property, danger to life or welfare of personnel, or substantial fi nancial loss to the Government due to an interruption of operations.
All materials are valued using historical costs, or other valuation methods that approximate historical cost. Excess operating materi-als and supplies are materials that exceed the demand expected in the normal course of operations, and do not meet manage-ment’s criteria to be held in reserve for future use. Obsolete operating material and supplies are materials no longer needed due to changes in technology, laws, customs, or operations. Unserviceable operating materials and supplies are materials damaged beyond economic repair.
September 30, 2006 September 30, 2005
Inventory and Related Property, Net
Operating Materials and Supplies
Items Held for Use $ 2,687 $ 3,401
Items Held in Reserve for Future Use 3 3
Excess, Obsolete, and Unserviceable (360) (385)
Total $ 2,330 $ 3,019
178 NASA FY 2006 PERFORMANCE AND ACCOUNTABILITY REPORT
National Aeronautics and Space AdministrationNotes to Financial Statements(Fiscal Years 2006 and 2005 Are Unaudited)
NOTE 7. GENERAL PROPERTY, PLANT, AND EQUIPMENT, NET (In Millions of Dollars)
Theme Assets consist of assets specifi cally designed for use in a NASA program. Equipment includes special tooling, special test equipment, and Agency-peculiar property, such as the Space Shuttle and other confi gurations of spacecraft: engines, satellites, rockets, and other scientifi c components unique to NASA space programs. Structures, Facilities, and Leasehold Improvements include buildings with collateral equipment, and capital improvements, such as airfi elds, power distribution systems, fl ood con-trol, utility systems, roads, and bridges. NASA also has use of certain properties at no cost. These properties include land at the Kennedy Space Center withdrawn from the public domain, land, and facilities at the Marshall Space Flight Center under a no cost 99-year lease with the U.S. Department of the Army. Work-in-Process (WIP) includes equipment and facilities that are being con-structed. WIP includes the fabrication of assets that may or may not be capitalized once completed and operational. Projects that do not meet the capitalization criteria of two years of useful life and in excess of $100,000 are expensed. All other project costs are capitalized in the year placed into operation.
NASA has International Space Station bartering agreements with international agencies including the European Space Agency and the National Space Agency of Japan. NASA barters with these space agencies to obtain International Space Station hardware elements in exchange for providing goods and services such as Space Shuttle transportation and a share of NASA’s International Space Station utilization rights. The intergovernmental agreements state that the parties will seek to minimize the exchange of funds in the cooperative program, including the use of barters to provide goods and services. As of September 30, 2006, NASA has received some assets from these parties in exchange for future services. The fair value is indeterminable; therefore no value was ascribed to these transactions in accordance with APB No. 29. Accounting for Nonmonetary Transactions. Under all agreements to date, NASA’s International Space Station Program’s International Partners Offi ce expects that NASA will eventually receive future NASA-required elements as well with no exchange of funds.
Prior to fi scal year 2006, President Bush announced a new vision for the Nation’s space exploration program. Implementation of this initiative has required NASA to prioritize and restructure existing programs and missions, and to phase out or eliminate sooner than originally planned some programs and missions. These programs and missions include the Shuttle, which was originally planned to continue to the year 2020 but now will retire as soon as assembly of the International Space Station is completed (planned for the end of this decade). NASA will make an announcement in early FY 2007 regarding the future of planned servicing missions to the Hubble Space Telescope.
Management is exploring whether a signifi cant portion of PP&E costs should be classifi ed as research and development and there-fore should be expensed. NASA is considering a change in its accounting policy for Theme Assets to reclassify some Theme Asset costs previously categorized as General Property, Plant, and Equipment (PP&E) as Research and Development (R&D) expenses. In the development of the revised policy, NASA followed standards established by the Financial Accounting Standards Board (FASB) in its Statement of Financial Accounting Standards No. 2, Accounting for Research and Development Costs. NASA believes that this change will result in fi nancial reporting that is more relevant and timely to the readers of its fi nancial statements. NASA requested that FASAB clarify the accounting standards the Agency used as the basis for its draft change in accounting policy. NASA antici-pates a response from FASAB in FY 2007.
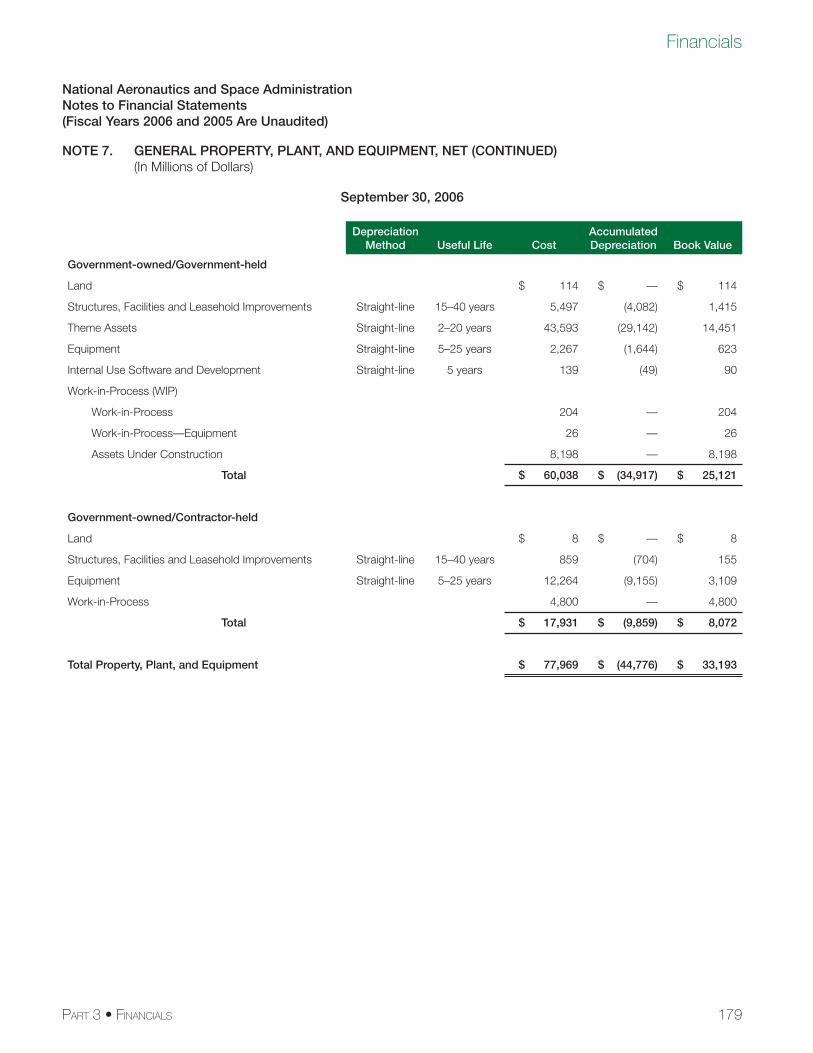
179
Financials
PART 3 • FINANCIALS
National Aeronautics and Space AdministrationNotes to Financial Statements(Fiscal Years 2006 and 2005 Are Unaudited)
NOTE 7. GENERAL PROPERTY, PLANT, AND EQUIPMENT, NET (CONTINUED) (In Millions of Dollars)
September 30, 2006
Depreciation Method Useful Life Cost
Accumulated Depreciation Book Value
Government-owned/Government-held
Land $ 114 $ — $ 114
Structures, Facilities and Leasehold Improvements Straight-line 15–40 years 5,497 (4,082) 1,415
Theme Assets Straight-line 2–20 years 43,593 (29,142) 14,451
Equipment Straight-line 5–25 years 2,267 (1,644) 623
Internal Use Software and Development Straight-line 5 years 139 (49) 90
Work-in-Process (WIP)
Work-in-Process 204 — 204
Work-in-Process—Equipment 26 — 26
Assets Under Construction 8,198 — 8,198
Total $ 60,038 $ (34,917) $ 25,121
Government-owned/Contractor-held
Land $ 8 $ — $ 8
Structures, Facilities and Leasehold Improvements Straight-line 15–40 years 859 (704) 155
Equipment Straight-line 5–25 years 12,264 (9,155) 3,109
Work-in-Process 4,800 — 4,800
Total $ 17,931 $ (9,859) $ 8,072
Total Property, Plant, and Equipment $ 77,969 $ (44,776) $ 33,193
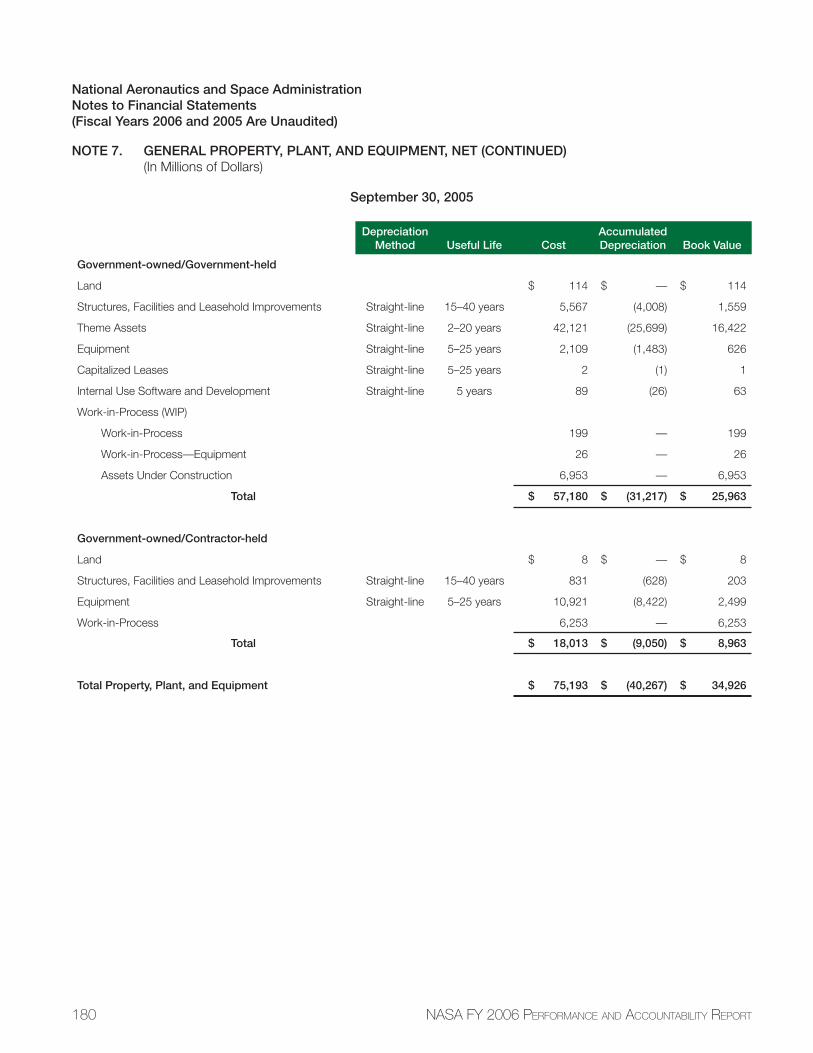
180 NASA FY 2006 PERFORMANCE AND ACCOUNTABILITY REPORT
National Aeronautics and Space AdministrationNotes to Financial Statements(Fiscal Years 2006 and 2005 Are Unaudited)
NOTE 7. GENERAL PROPERTY, PLANT, AND EQUIPMENT, NET (CONTINUED) (In Millions of Dollars)
September 30, 2005
Depreciation Method Useful Life Cost
Accumulated Depreciation Book Value
Government-owned/Government-held
Land $ 114 $ — $ 114
Structures, Facilities and Leasehold Improvements Straight-line 15–40 years 5,567 (4,008) 1,559
Theme Assets Straight-line 2–20 years 42,121 (25,699) 16,422
Equipment Straight-line 5–25 years 2,109 (1,483) 626
Capitalized Leases Straight-line 5–25 years 2 (1) 1
Internal Use Software and Development Straight-line 5 years 89 (26) 63
Work-in-Process (WIP)
Work-in-Process 199 — 199
Work-in-Process—Equipment 26 — 26
Assets Under Construction 6,953 — 6,953
Total $ 57,180 $ (31,217) $ 25,963
Government-owned/Contractor-held
Land $ 8 $ — $ 8
Structures, Facilities and Leasehold Improvements Straight-line 15–40 years 831 (628) 203
Equipment Straight-line 5–25 years 10,921 (8,422) 2,499
Work-in-Process 6,253 — 6,253
Total $ 18,013 $ (9,050) $ 8,963
Total Property, Plant, and Equipment $ 75,193 $ (40,267) $ 34,926
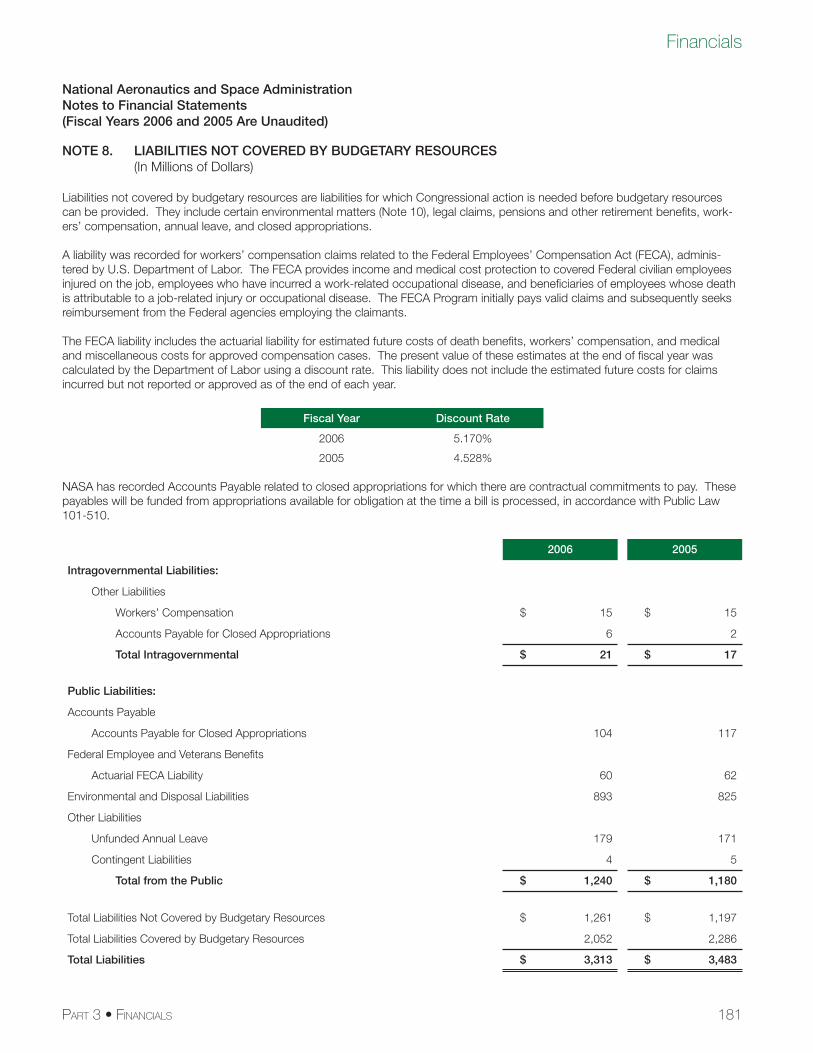
181
Financials
PART 3 • FINANCIALS
National Aeronautics and Space AdministrationNotes to Financial Statements(Fiscal Years 2006 and 2005 Are Unaudited)
NOTE 8. LIABILITIES NOT COVERED BY BUDGETARY RESOURCES (In Millions of Dollars)
Liabilities not covered by budgetary resources are liabilities for which Congressional action is needed before budgetary resources can be provided. They include certain environmental matters (Note 10), legal claims, pensions and other retirement benefi ts, work-ers’ compensation, annual leave, and closed appropriations.
A liability was recorded for workers’ compensation claims related to the Federal Employees’ Compensation Act (FECA), adminis-tered by U.S. Department of Labor. The FECA provides income and medical cost protection to covered Federal civilian employees injured on the job, employees who have incurred a work-related occupational disease, and benefi ciaries of employees whose death is attributable to a job-related injury or occupational disease. The FECA Program initially pays valid claims and subsequently seeks reimbursement from the Federal agencies employing the claimants.
The FECA liability includes the actuarial liability for estimated future costs of death benefi ts, workers’ compensation, and medical and miscellaneous costs for approved compensation cases. The present value of these estimates at the end of fi scal year was calculated by the Department of Labor using a discount rate. This liability does not include the estimated future costs for claims incurred but not reported or approved as of the end of each year.
Fiscal Year Discount Rate
2006 5.170%
2005 4.528%
NASA has recorded Accounts Payable related to closed appropriations for which there are contractual commitments to pay. These payables will be funded from appropriations available for obligation at the time a bill is processed, in accordance with Public Law 101-510.
2006 2005
Intragovernmental Liabilities:
Other Liabilities
Workers’ Compensation $ 15 $ 15
Accounts Payable for Closed Appropriations 6 2
Total Intragovernmental $ 21 $ 17
Public Liabilities:
Accounts Payable
Accounts Payable for Closed Appropriations 104 117
Federal Employee and Veterans Benefi ts
Actuarial FECA Liability 60 62
Environmental and Disposal Liabilities 893 825
Other Liabilities
Unfunded Annual Leave 179 171
Contingent Liabilities 4 5
Total from the Public $ 1,240 $ 1,180
Total Liabilities Not Covered by Budgetary Resources $ 1,261 $ 1,197
Total Liabilities Covered by Budgetary Resources 2,052 2,286
Total Liabilities $ 3,313 $ 3,483
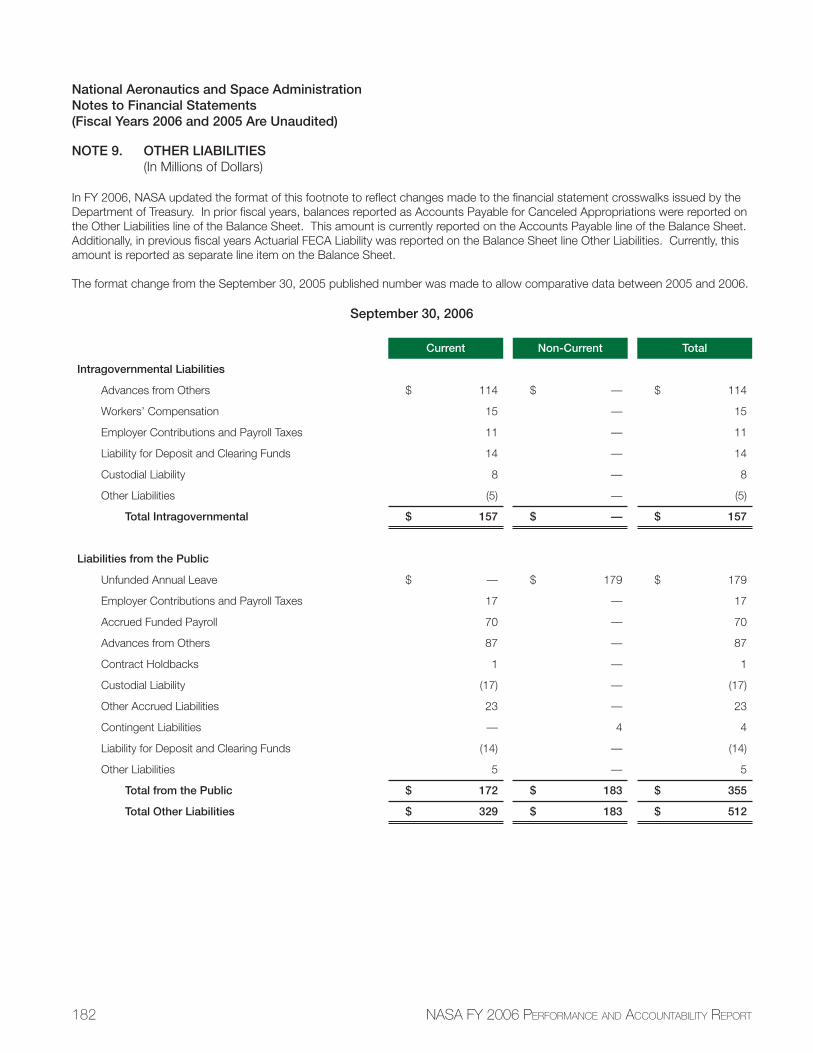
182 NASA FY 2006 PERFORMANCE AND ACCOUNTABILITY REPORT
National Aeronautics and Space AdministrationNotes to Financial Statements(Fiscal Years 2006 and 2005 Are Unaudited)
NOTE 9. OTHER LIABILITIES (In Millions of Dollars)
In FY 2006, NASA updated the format of this footnote to refl ect changes made to the fi nancial statement crosswalks issued by the Department of Treasury. In prior fi scal years, balances reported as Accounts Payable for Canceled Appropriations were reported on the Other Liabilities line of the Balance Sheet. This amount is currently reported on the Accounts Payable line of the Balance Sheet. Additionally, in previous fi scal years Actuarial FECA Liability was reported on the Balance Sheet line Other Liabilities. Currently, this amount is reported as separate line item on the Balance Sheet.
The format change from the September 30, 2005 published number was made to allow comparative data between 2005 and 2006.
September 30, 2006
Current Non-Current Total
Intragovernmental Liabilities
Advances from Others $ 114 $ — $ 114
Workers’ Compensation 15 — 15
Employer Contributions and Payroll Taxes 11 — 11
Liability for Deposit and Clearing Funds 14 — 14
Custodial Liability 8 — 8
Other Liabilities (5) — (5)
Total Intragovernmental $ 157 $ — $ 157
Liabilities from the Public
Unfunded Annual Leave $ — $ 179 $ 179
Employer Contributions and Payroll Taxes 17 — 17
Accrued Funded Payroll 70 — 70
Advances from Others 87 — 87
Contract Holdbacks 1 — 1
Custodial Liability (17) — (17)
Other Accrued Liabilities 23 — 23
Contingent Liabilities — 4 4
Liability for Deposit and Clearing Funds (14) — (14)
Other Liabilities 5 — 5
Total from the Public $ 172 $ 183 $ 355
Total Other Liabilities $ 329 $ 183 $ 512
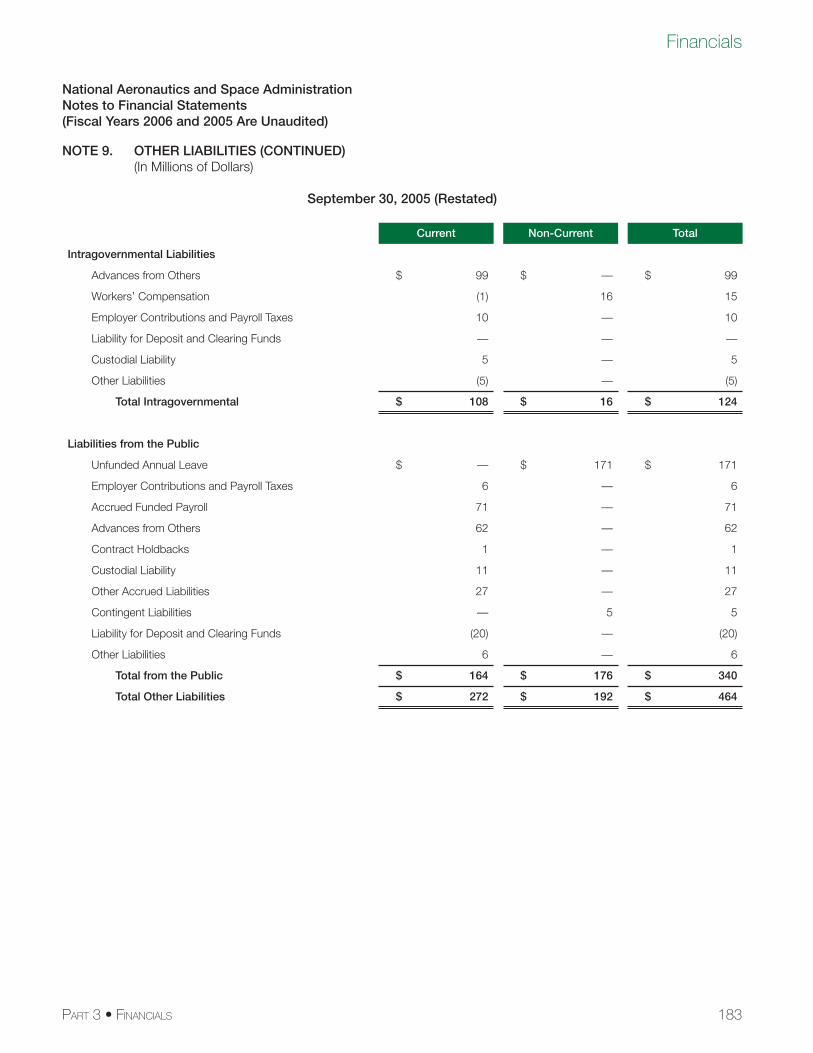
183
Financials
PART 3 • FINANCIALS
National Aeronautics and Space AdministrationNotes to Financial Statements(Fiscal Years 2006 and 2005 Are Unaudited)
NOTE 9. OTHER LIABILITIES (CONTINUED) (In Millions of Dollars)
September 30, 2005 (Restated)
Current Non-Current Total
Intragovernmental Liabilities
Advances from Others $ 99 $ — $ 99
Workers’ Compensation (1) 16 15
Employer Contributions and Payroll Taxes 10 — 10
Liability for Deposit and Clearing Funds — — —
Custodial Liability 5 — 5
Other Liabilities (5) — (5)
Total Intragovernmental $ 108 $ 16 $ 124
Liabilities from the Public
Unfunded Annual Leave $ — $ 171 $ 171
Employer Contributions and Payroll Taxes 6 — 6
Accrued Funded Payroll 71 — 71
Advances from Others 62 — 62
Contract Holdbacks 1 — 1
Custodial Liability 11 — 11
Other Accrued Liabilities 27 — 27
Contingent Liabilities — 5 5
Liability for Deposit and Clearing Funds (20) — (20)
Other Liabilities 6 — 6
Total from the Public $ 164 $ 176 $ 340
Total Other Liabilities $ 272 $ 192 $ 464
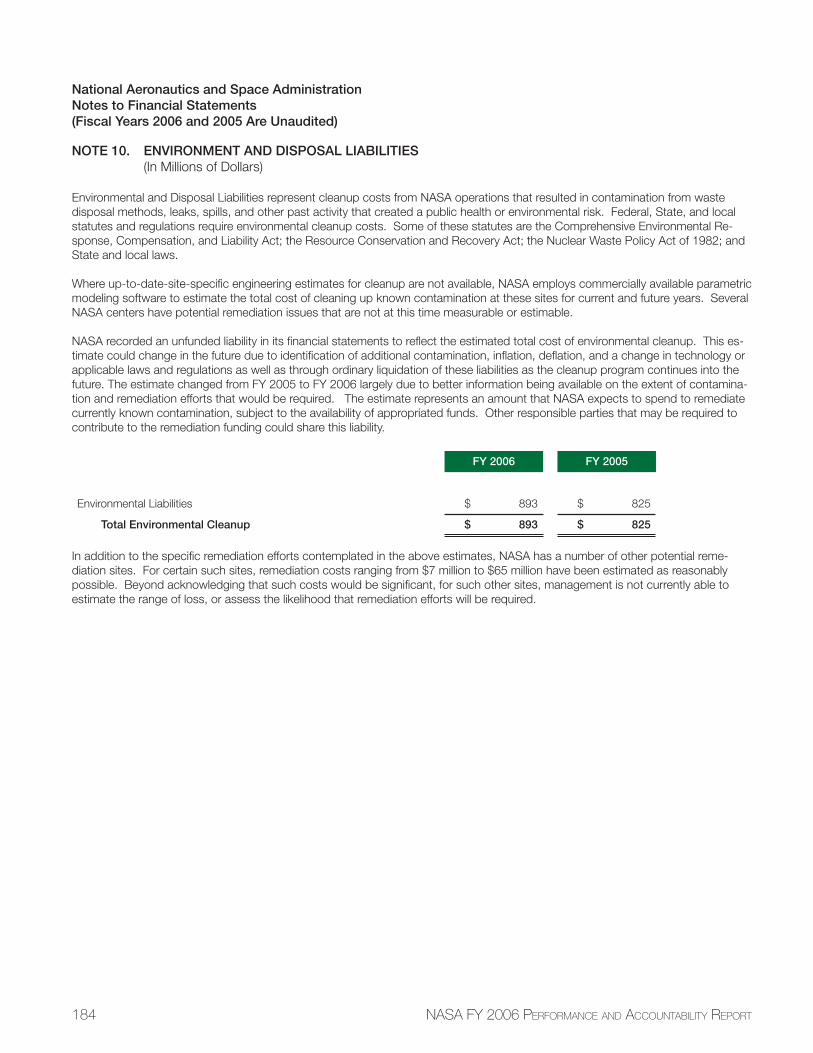
184 NASA FY 2006 PERFORMANCE AND ACCOUNTABILITY REPORT
National Aeronautics and Space AdministrationNotes to Financial Statements(Fiscal Years 2006 and 2005 Are Unaudited)
NOTE 10. ENVIRONMENT AND DISPOSAL LIABILITIES (In Millions of Dollars)
Environmental and Disposal Liabilities represent cleanup costs from NASA operations that resulted in contamination from waste disposal methods, leaks, spills, and other past activity that created a public health or environmental risk. Federal, State, and local statutes and regulations require environmental cleanup costs. Some of these statutes are the Comprehensive Environmental Re-sponse, Compensation, and Liability Act; the Resource Conservation and Recovery Act; the Nuclear Waste Policy Act of 1982; and State and local laws.
Where up-to-date-site-specifi c engineering estimates for cleanup are not available, NASA employs commercially available parametric modeling software to estimate the total cost of cleaning up known contamination at these sites for current and future years. Several NASA centers have potential remediation issues that are not at this time measurable or estimable.
NASA recorded an unfunded liability in its fi nancial statements to refl ect the estimated total cost of environmental cleanup. This es-timate could change in the future due to identifi cation of additional contamination, infl ation, defl ation, and a change in technology or applicable laws and regulations as well as through ordinary liquidation of these liabilities as the cleanup program continues into the future. The estimate changed from FY 2005 to FY 2006 largely due to better information being available on the extent of contamina-tion and remediation efforts that would be required. The estimate represents an amount that NASA expects to spend to remediate currently known contamination, subject to the availability of appropriated funds. Other responsible parties that may be required to contribute to the remediation funding could share this liability.
FY 2006 FY 2005
Environmental Liabilities $ 893 $ 825
Total Environmental Cleanup $ 893 $ 825
In addition to the specifi c remediation efforts contemplated in the above estimates, NASA has a number of other potential reme-diation sites. For certain such sites, remediation costs ranging from $7 million to $65 million have been estimated as reasonably possible. Beyond acknowledging that such costs would be signifi cant, for such other sites, management is not currently able to estimate the range of loss, or assess the likelihood that remediation efforts will be required.
185
Financials
PART 3 • FINANCIALS
National Aeronautics and Space AdministrationNotes to Financial Statements(Fiscal Years 2006 and 2005 Are Unaudited)
NOTE 11. CONTINGENT LIABILITIES (In Millions of Dollars)
No balances have been recorded in the fi nancial statements for contingencies related to proceedings, actions, and claims where management and legal counsel believe that it is possible but not probable that some costs will be incurred. There were certain cases that the lawyers reviewed and determined a loss was probable but could not estimate the amount of a future loss.
NASA is a party in various administrative proceedings, court actions (including tort suits), and claims brought by or against it. In the opinion of management and legal counsel, the ultimate resolution of these proceedings, actions, and claims will not materially affect the fi nancial position, net cost, changes in net position, budgetary resources, or fi nancing of NASA. Liabilities have been recorded for $4 million and $5 million for these matters as of September 30, 2006 and September 30, 2005, respectively.
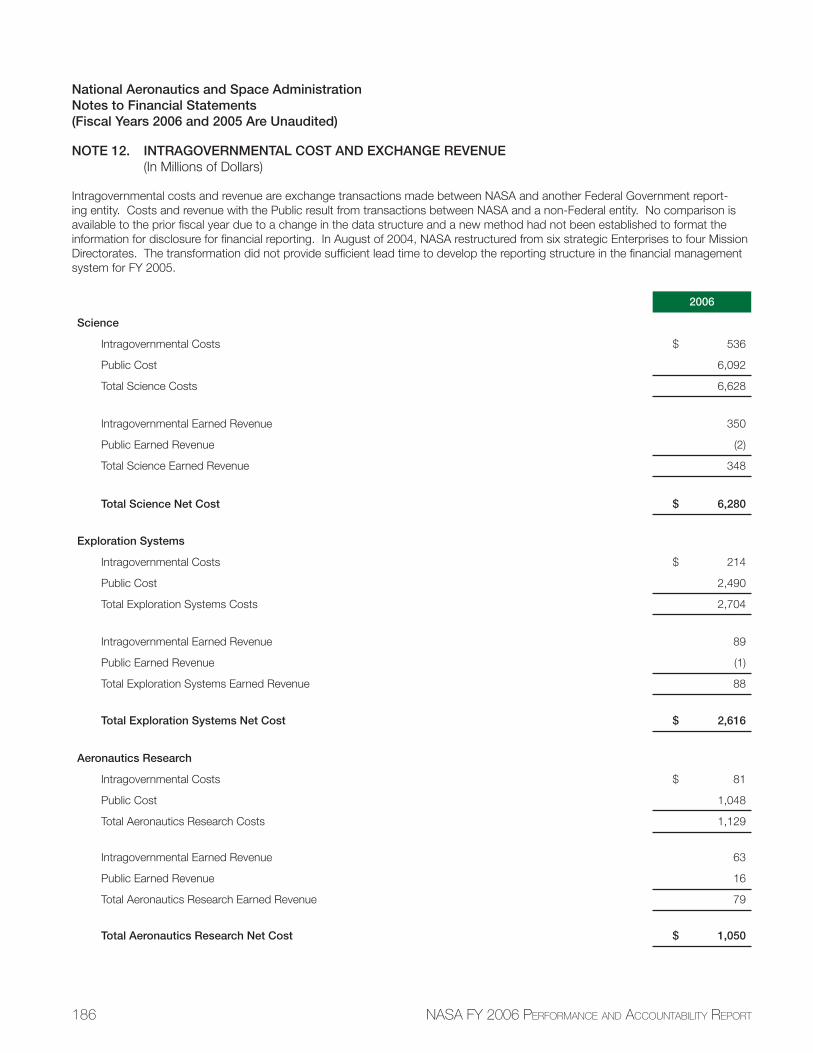
186 NASA FY 2006 PERFORMANCE AND ACCOUNTABILITY REPORT
National Aeronautics and Space AdministrationNotes to Financial Statements(Fiscal Years 2006 and 2005 Are Unaudited)
NOTE 12. INTRAGOVERNMENTAL COST AND EXCHANGE REVENUE (In Millions of Dollars)
Intragovernmental costs and revenue are exchange transactions made between NASA and another Federal Government report-ing entity. Costs and revenue with the Public result from transactions between NASA and a non-Federal entity. No comparison is available to the prior fi scal year due to a change in the data structure and a new method had not been established to format the information for disclosure for fi nancial reporting. In August of 2004, NASA restructured from six strategic Enterprises to four Mission Directorates. The transformation did not provide suffi cient lead time to develop the reporting structure in the fi nancial management system for FY 2005.
2006
Science
Intragovernmental Costs $ 536
Public Cost 6,092
Total Science Costs 6,628
Intragovernmental Earned Revenue 350
Public Earned Revenue (2)
Total Science Earned Revenue 348
Total Science Net Cost $ 6,280
Exploration Systems
Intragovernmental Costs $ 214
Public Cost 2,490
Total Exploration Systems Costs 2,704
Intragovernmental Earned Revenue 89
Public Earned Revenue (1)
Total Exploration Systems Earned Revenue 88
Total Exploration Systems Net Cost $ 2,616
Aeronautics Research
Intragovernmental Costs $ 81
Public Cost 1,048
Total Aeronautics Research Costs 1,129
Intragovernmental Earned Revenue 63
Public Earned Revenue 16
Total Aeronautics Research Earned Revenue 79
Total Aeronautics Research Net Cost $ 1,050
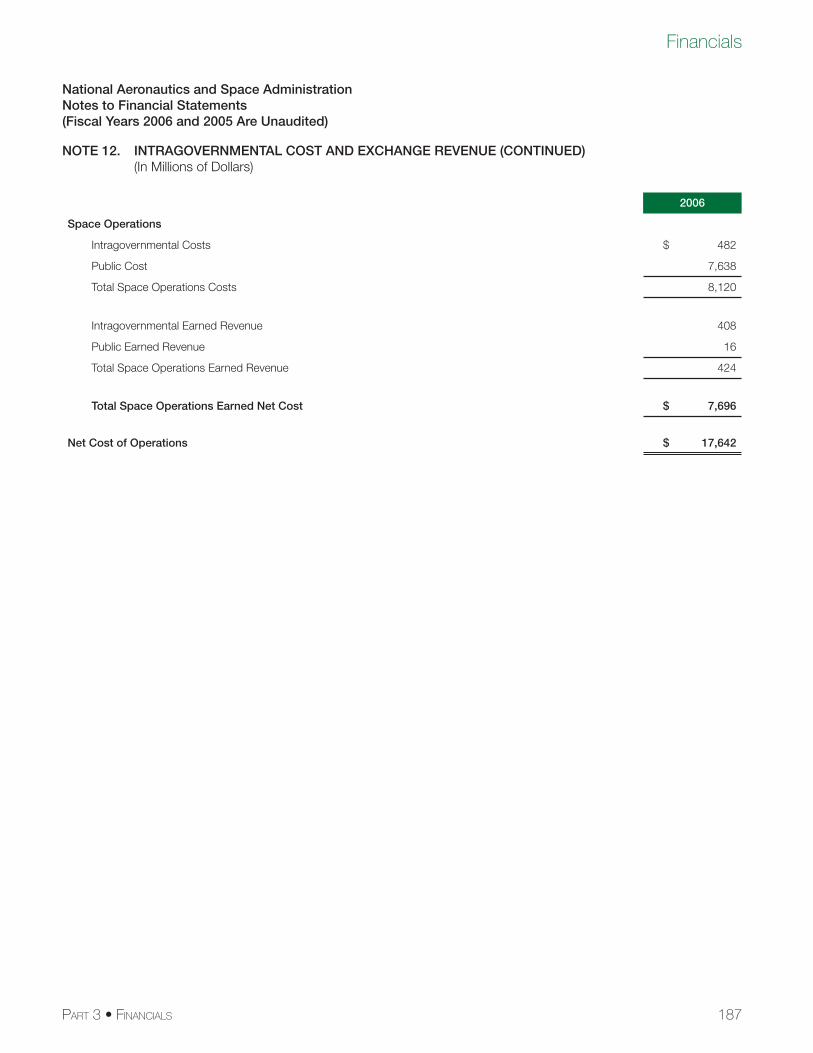
187
Financials
PART 3 • FINANCIALS
National Aeronautics and Space AdministrationNotes to Financial Statements(Fiscal Years 2006 and 2005 Are Unaudited)
NOTE 12. INTRAGOVERNMENTAL COST AND EXCHANGE REVENUE (CONTINUED) (In Millions of Dollars)
2006
Space Operations
Intragovernmental Costs $ 482
Public Cost 7,638
Total Space Operations Costs 8,120
Intragovernmental Earned Revenue 408
Public Earned Revenue 16
Total Space Operations Earned Revenue 424
Total Space Operations Earned Net Cost $ 7,696
Net Cost of Operations $ 17,642
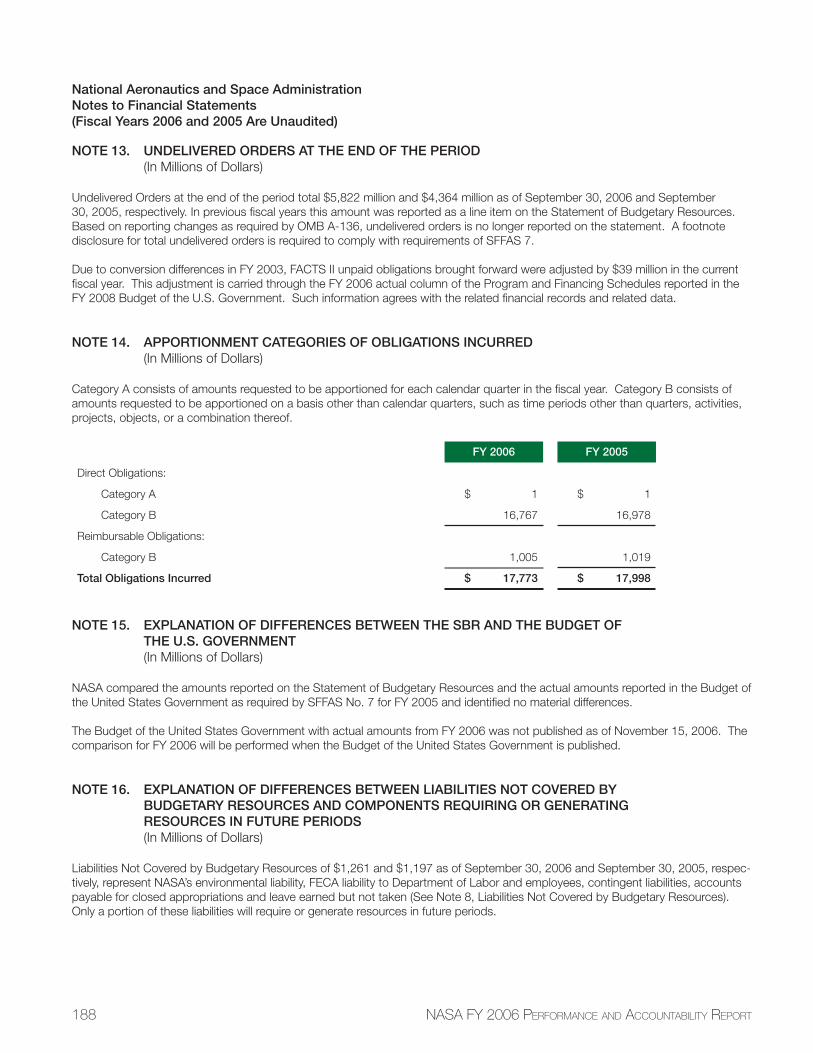
188 NASA FY 2006 PERFORMANCE AND ACCOUNTABILITY REPORT
National Aeronautics and Space AdministrationNotes to Financial Statements(Fiscal Years 2006 and 2005 Are Unaudited)
NOTE 13. UNDELIVERED ORDERS AT THE END OF THE PERIOD (In Millions of Dollars)
Undelivered Orders at the end of the period total $5,822 million and $4,364 million as of September 30, 2006 and September 30, 2005, respectively. In previous fi scal years this amount was reported as a line item on the Statement of Budgetary Resources. Based on reporting changes as required by OMB A-136, undelivered orders is no longer reported on the statement. A footnote disclosure for total undelivered orders is required to comply with requirements of SFFAS 7.
Due to conversion differences in FY 2003, FACTS II unpaid obligations brought forward were adjusted by $39 million in the current fi scal year. This adjustment is carried through the FY 2006 actual column of the Program and Financing Schedules reported in the FY 2008 Budget of the U.S. Government. Such information agrees with the related fi nancial records and related data.
NOTE 14. APPORTIONMENT CATEGORIES OF OBLIGATIONS INCURRED (In Millions of Dollars)
Category A consists of amounts requested to be apportioned for each calendar quarter in the fi scal year. Category B consists of amounts requested to be apportioned on a basis other than calendar quarters, such as time periods other than quarters, activities, projects, objects, or a combination thereof.
FY 2006 FY 2005
Direct Obligations:
Category A $ 1 $ 1
Category B 16,767 16,978
Reimbursable Obligations:
Category B 1,005 1,019
Total Obligations Incurred $ 17,773 $ 17,998
NOTE 15. EXPLANATION OF DIFFERENCES BETWEEN THE SBR AND THE BUDGET OF THE U.S. GOVERNMENT
(In Millions of Dollars)
NASA compared the amounts reported on the Statement of Budgetary Resources and the actual amounts reported in the Budget of the United States Government as required by SFFAS No. 7 for FY 2005 and identifi ed no material differences.
The Budget of the United States Government with actual amounts from FY 2006 was not published as of November 15, 2006. The comparison for FY 2006 will be performed when the Budget of the United States Government is published.
NOTE 16. EXPLANATION OF DIFFERENCES BETWEEN LIABILITIES NOT COVERED BY BUDGETARY RESOURCES AND COMPONENTS REQUIRING OR GENERATING RESOURCES IN FUTURE PERIODS
(In Millions of Dollars)
Liabilities Not Covered by Budgetary Resources of $1,261 and $1,197 as of September 30, 2006 and September 30, 2005, respec-tively, represent NASA’s environmental liability, FECA liability to Department of Labor and employees, contingent liabilities, accounts payable for closed appropriations and leave earned but not taken (See Note 8, Liabilities Not Covered by Budgetary Resources). Only a portion of these liabilities will require or generate resources in future periods.
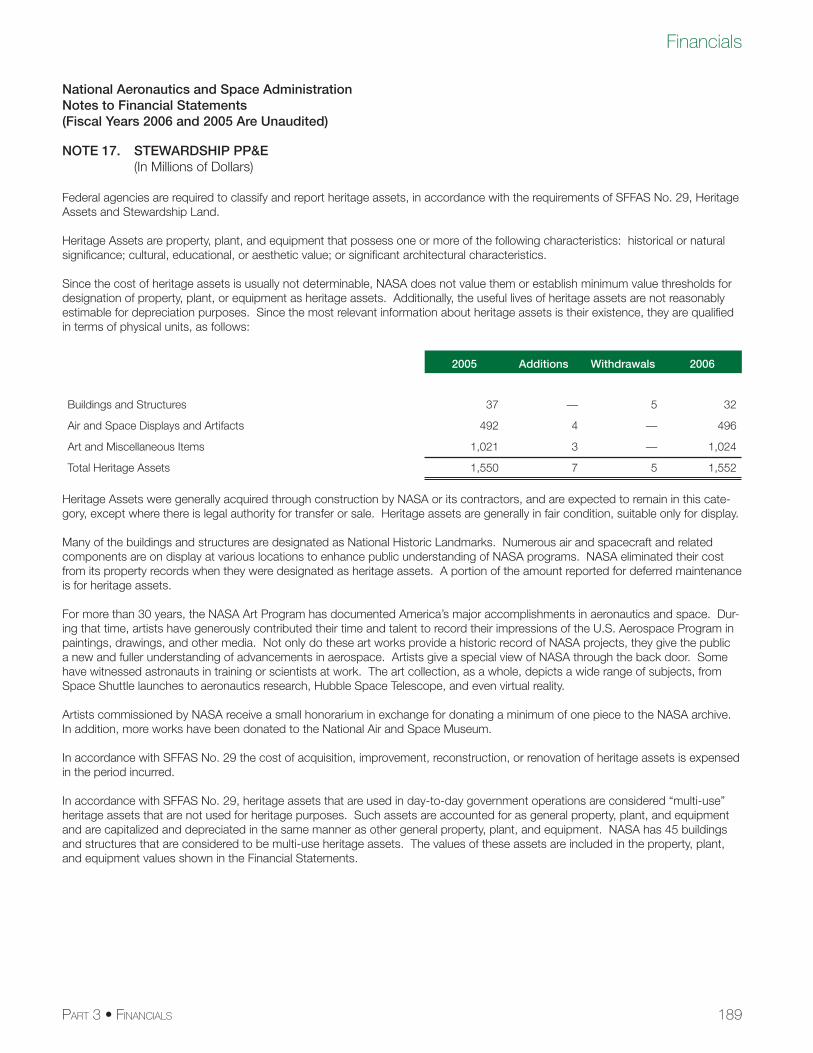
189
Financials
PART 3 • FINANCIALS
National Aeronautics and Space AdministrationNotes to Financial Statements(Fiscal Years 2006 and 2005 Are Unaudited)
NOTE 17. STEWARDSHIP PP&E (In Millions of Dollars)
Federal agencies are required to classify and report heritage assets, in accordance with the requirements of SFFAS No. 29, Heritage Assets and Stewardship Land.
Heritage Assets are property, plant, and equipment that possess one or more of the following characteristics: historical or natural signifi cance; cultural, educational, or aesthetic value; or signifi cant architectural characteristics.
Since the cost of heritage assets is usually not determinable, NASA does not value them or establish minimum value thresholds for designation of property, plant, or equipment as heritage assets. Additionally, the useful lives of heritage assets are not reasonably estimable for depreciation purposes. Since the most relevant information about heritage assets is their existence, they are qualifi ed in terms of physical units, as follows:
2005 Additions Withdrawals 2006
Buildings and Structures 37 — 5 32
Air and Space Displays and Artifacts 492 4 — 496
Art and Miscellaneous Items 1,021 3 — 1,024
Total Heritage Assets 1,550 7 5 1,552
Heritage Assets were generally acquired through construction by NASA or its contractors, and are expected to remain in this cate-gory, except where there is legal authority for transfer or sale. Heritage assets are generally in fair condition, suitable only for display.
Many of the buildings and structures are designated as National Historic Landmarks. Numerous air and spacecraft and related components are on display at various locations to enhance public understanding of NASA programs. NASA eliminated their cost from its property records when they were designated as heritage assets. A portion of the amount reported for deferred maintenance is for heritage assets.
For more than 30 years, the NASA Art Program has documented America’s major accomplishments in aeronautics and space. Dur-ing that time, artists have generously contributed their time and talent to record their impressions of the U.S. Aerospace Program in paintings, drawings, and other media. Not only do these art works provide a historic record of NASA projects, they give the public a new and fuller understanding of advancements in aerospace. Artists give a special view of NASA through the back door. Some have witnessed astronauts in training or scientists at work. The art collection, as a whole, depicts a wide range of subjects, from Space Shuttle launches to aeronautics research, Hubble Space Telescope, and even virtual reality.
Artists commissioned by NASA receive a small honorarium in exchange for donating a minimum of one piece to the NASA archive. In addition, more works have been donated to the National Air and Space Museum.
In accordance with SFFAS No. 29 the cost of acquisition, improvement, reconstruction, or renovation of heritage assets is expensed in the period incurred.
In accordance with SFFAS No. 29, heritage assets that are used in day-to-day government operations are considered “multi-use” heritage assets that are not used for heritage purposes. Such assets are accounted for as general property, plant, and equipment and are capitalized and depreciated in the same manner as other general property, plant, and equipment. NASA has 45 buildings and structures that are considered to be multi-use heritage assets. The values of these assets are included in the property, plant, and equipment values shown in the Financial Statements.
190 NASA FY 2006 PERFORMANCE AND ACCOUNTABILITY REPORT
National Aeronautics and Space AdministrationNotes to Financial Statements(Fiscal Years 2006 and 2005 Are Unaudited)
NOTE 18. GENERAL INFORMATION (In Millions of Dollars)
During fi scal year 2003, NASA replaced ten disparate accounting systems and over 120 ancillary subsystems that had been in operation at our Centers for the past two decades, with a commercial off-the-shelf, Agency-wide, Integrated Financial Management system (SAP Core Financials application module).
Due to data anomalies in the FY 2003 conversion and known system limitations, NASA made a decision not to make prior period adjustments in fi scal years 2004 and 2005, and accordingly, processed all corrections in current year operations.
During fi scal year 2006, management recorded as current year expenses prior years property transactions for such items as equip-ment found during routine inventory processes, components of buildings removed and no longer in use, and the correction of manual processing errors.
In FY 2006, NASA continued to resolve a number of known reconciling items. Some resolutions required processing corrective transactions in the fi nancial management system that impact line items on the fi nancial statements.
191
Financials
PART 3 • FINANCIALS
National Aeronautics and Space AdministrationRequired Supplementary Stewardship Information(Fiscal Years 2006 and 2005 Are Unaudited)Stewardship Investments: Research and DevelopmentFor the Fiscal Year Ended September 30, 2006(In Millions of Dollars)
Research and Development Expenses by Business Lines
In August 2004, NASA restructured from six strategic Enterprises to four Business Lines: Science, Exploration Systems, Aeronautics Research and Space Operations. Each Business Line is comprised of multiple themes and numerous programs comprise each theme. NASA’s former enterprise structure has been mapped to the new Business Line structure and NASA will report Research and Development (R&D) expenses using the new structure. Therefore, R&D expenses will now be reported on a Program not Enterprise basis. This is NASA’s fi rst year reporting under this new structure. A description of NASA’s R&D programs accompanies this reporting.
To provide the reader with a full picture of NASA expenses, both R&D and non-R&D, NASA has included expenses for non R&D costs associated with NASA activities such as Education and Outreach, Space Operations Programs. Descriptions for the work associated with these costs also accompany this reporting.
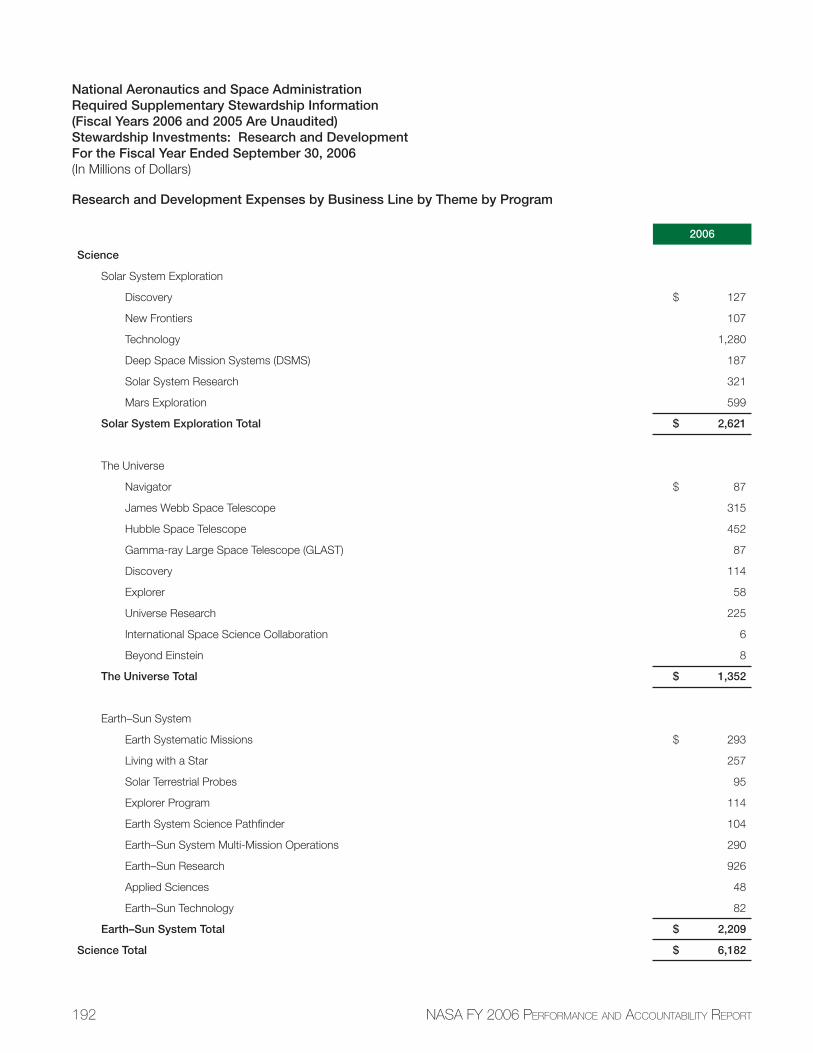
192 NASA FY 2006 PERFORMANCE AND ACCOUNTABILITY REPORT
National Aeronautics and Space AdministrationRequired Supplementary Stewardship Information(Fiscal Years 2006 and 2005 Are Unaudited)Stewardship Investments: Research and DevelopmentFor the Fiscal Year Ended September 30, 2006(In Millions of Dollars)
Research and Development Expenses by Business Line by Theme by Program
2006
Science
Solar System Exploration
Discovery $ 127
New Frontiers 107
Technology 1,280
Deep Space Mission Systems (DSMS) 187
Solar System Research 321
Mars Exploration 599
Solar System Exploration Total $ 2,621
The Universe
Navigator $ 87
James Webb Space Telescope 315
Hubble Space Telescope 452
Gamma-ray Large Space Telescope (GLAST) 87
Discovery 114
Explorer 58
Universe Research 225
International Space Science Collaboration 6
Beyond Einstein 8
The Universe Total $ 1,352
Earth–Sun System
Earth Systematic Missions $ 293
Living with a Star 257
Solar Terrestrial Probes 95
Explorer Program 114
Earth System Science Pathfi nder 104
Earth–Sun System Multi-Mission Operations 290
Earth–Sun Research 926
Applied Sciences 48
Earth–Sun Technology 82
Earth–Sun System Total $ 2,209
Science Total $ 6,182
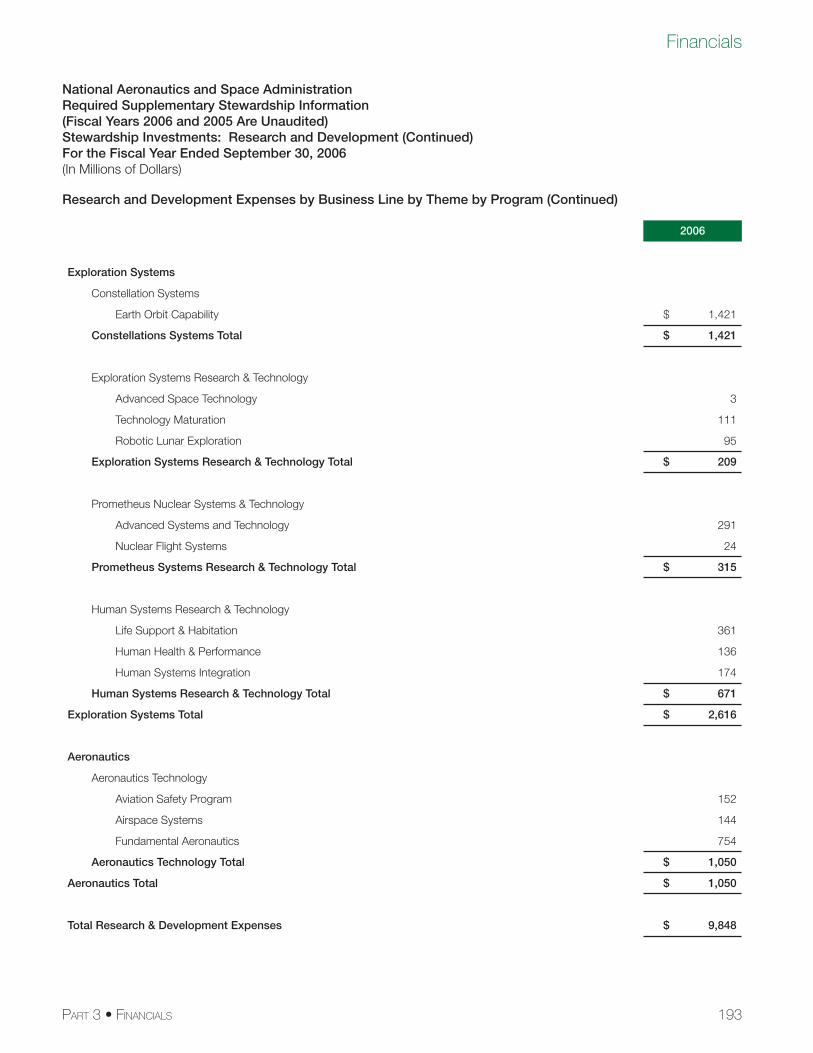
193
Financials
PART 3 • FINANCIALS
National Aeronautics and Space AdministrationRequired Supplementary Stewardship Information(Fiscal Years 2006 and 2005 Are Unaudited)Stewardship Investments: Research and Development (Continued)For the Fiscal Year Ended September 30, 2006(In Millions of Dollars)
Research and Development Expenses by Business Line by Theme by Program (Continued)
2006
Exploration Systems
Constellation Systems
Earth Orbit Capability $ 1,421
Constellations Systems Total $ 1,421
Exploration Systems Research & Technology
Advanced Space Technology 3
Technology Maturation 111
Robotic Lunar Exploration 95
Exploration Systems Research & Technology Total $ 209
Prometheus Nuclear Systems & Technology
Advanced Systems and Technology 291
Nuclear Flight Systems 24
Prometheus Systems Research & Technology Total $ 315
Human Systems Research & Technology
Life Support & Habitation 361
Human Health & Performance 136
Human Systems Integration 174
Human Systems Research & Technology Total $ 671
Exploration Systems Total $ 2,616
Aeronautics
Aeronautics Technology
Aviation Safety Program 152
Airspace Systems 144
Fundamental Aeronautics 754
Aeronautics Technology Total $ 1,050
Aeronautics Total $ 1,050
Total Research & Development Expenses $ 9,848
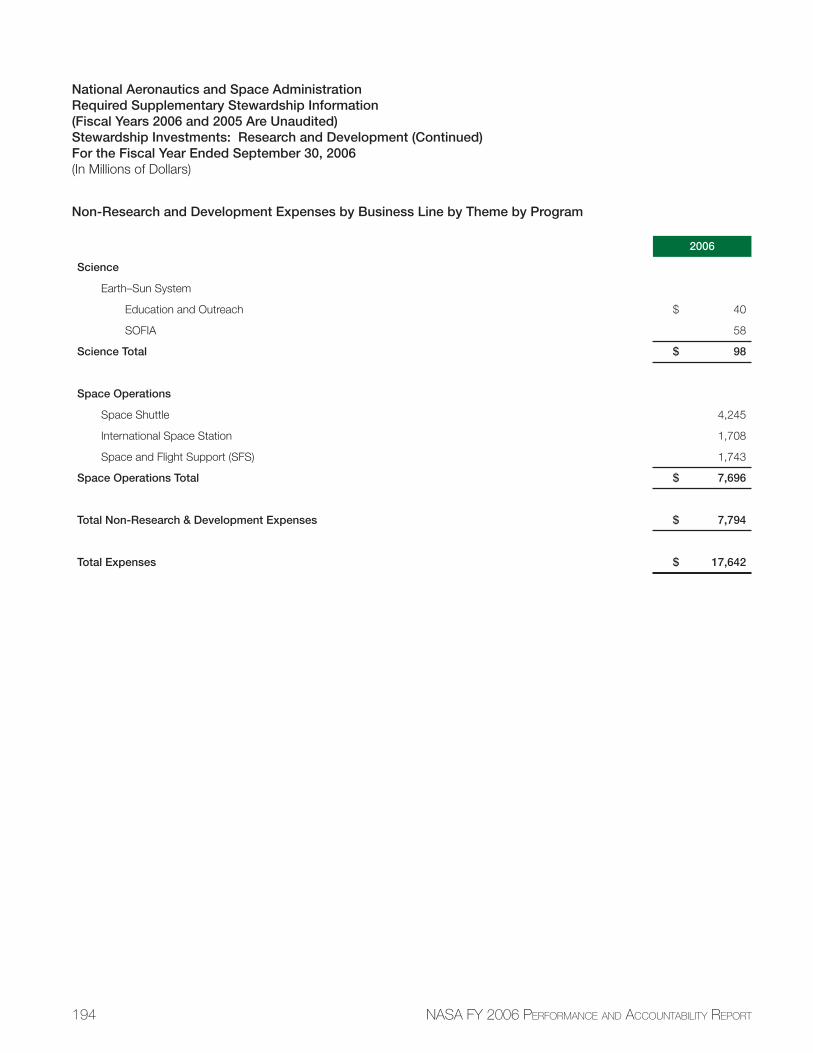
194 NASA FY 2006 PERFORMANCE AND ACCOUNTABILITY REPORT
National Aeronautics and Space AdministrationRequired Supplementary Stewardship Information(Fiscal Years 2006 and 2005 Are Unaudited)Stewardship Investments: Research and Development (Continued)For the Fiscal Year Ended September 30, 2006(In Millions of Dollars)
Non-Research and Development Expenses by Business Line by Theme by Program
2006
Science
Earth–Sun System
Education and Outreach $ 40
SOFIA 58
Science Total $ 98
Space Operations
Space Shuttle 4,245
International Space Station 1,708
Space and Flight Support (SFS) 1,743
Space Operations Total $ 7,696
Total Non-Research & Development Expenses $ 7,794
Total Expenses $ 17,642
195
Financials
PART 3 • FINANCIALS
National Aeronautics and Space AdministrationRequired Supplementary Stewardship Information(Fiscal Years 2006 and 2005 Are Unaudited)Stewardship Investments: Research and Development (Continued)For the Fiscal Year Ended September 30, 2006(In Millions of Dollars)
NASA makes substantial research and development investments for the benefi t of the United States. These amounts are expensed as incurred in determining the net cost of operations.
NASA’s research and development programs include activities to extend our knowledge of Earth, its space environment, and the universe, and to invest in new aeronautics and advanced space transportation technologies that support the development and application of technologies critical to the economic, scientifi c, and technical competitiveness of the United States.
Investment in research and development refers to those expenses incurred to support the search for new or refi ned knowledge and ideas and for the application or use of such knowledge and ideas for the development of new or improved products and processes with the expectation of maintaining or increasing national economic productive capacity or yielding other future benefi ts. Research and development is composed of the following:
Basic Research: Systematic study to gain knowledge or understanding of the fundamental aspects of phenomena and of observable facts without specifi c applications toward processes or products in mind;
Applied Research: Systematic study to gain knowledge or understanding necessary for determining the means by which a recognized and specifi c need may be met; and
Development: Systematic use of the knowledge and understanding gained from research for the production of useful materials, devices, systems or methods, including the design and development of prototypes and processes.
Business Line Theme and Program Descriptions
BUSINESS LINE: SCIENCE
Theme: Solar System ExplorationThe Solar System Exploration (SSE) Theme seeks to understand how the solar system formed and evolved, and whether there might be life in the solar system beyond Earth.
Program: Discovery NASA’s Discovery program represents a breakthrough in the way NASA explores space, with lower-cost, highly focused
planetary science investigations designed to enhance our understanding of the solar system.
Program: New Frontiers The New Frontiers program, a class of competed medium-sized missions, represents a critical step in the advancement of
the solar system exploration. Proposed science targets for the New Frontiers program include Pluto and the Kuiper Belt, Jupiter, Venus, and sample returns from Earth’s Moon and a comet nucleus.
Program: Technology Robotic spacecraft use electrical power for propulsion, data acquisition, and communication to accurately place them-
selves in orbit around and onto the surfaces of bodies about which we may know relatively little. These systems ensure that they survive and function in hostile and unknown environments, acquire and transmit data throughout their lifetimes, and sometimes transport samples back to Earth. Since successful completion of these missions is so dependent on power, the future SSE portfolio of missions will demand advances in power and propulsion systems.
Program: Deep Space Mission System (DSMS) This program seeks to enable NASA exploration, both human and robotic, of the solar system and beyond by providing
reliable, high performance, and cost effective telecommunications and navigation services to its lunar and deep space missions.
Program: Solar Systems Research The Solar System Exploration (SSE) Research Program develops the theoretical tools and laboratory data needed to
analyze fl ight data, makes possible new and better instruments to fl y on future missions, and analyzes the data returned so that SSE can answer specifi c questions posed and fi t this new knowledge into the overall picture of the solar system.
196 NASA FY 2006 PERFORMANCE AND ACCOUNTABILITY REPORT
National Aeronautics and Space AdministrationRequired Supplementary Stewardship Information(Fiscal Years 2006 and 2005 Are Unaudited)Stewardship Investments: Research and Development (Continued)For the Fiscal Year Ended September 30, 2006(In Millions of Dollars)
Program: Mars Exploration The Mars Exploration Program has been developed to conduct a rigorous, incremental, discovery-driven exploration of
Mars to determine the planet’s physical, dynamic, and geological characteristics, investigate the Martian climate in the context of understanding habitability, and investigate whether Mars ever had the potential to develop and harbor any kind of life.
Theme: The UniverseThe Universe Theme supports NASA’s mission to “explore the universe and search for life” by attempting to understand the origin and evolution of life, searching for evidence of life elsewhere and exploring the universe beyond.
Program: Navigator The Navigator program consists of a coherent series of increasingly challenging projects, each complementary to the
others and each mission building on the results and capabilities of those that preceded it as NASA searches for habitable planets outside of the solar system.
Program: The James Webb Space Telescope (JWST) The program identifi ed by the National Research Council as the top priority for astronomy and physics for the current
decade—is a large, deployable infrared astronomical space-based observatory. The mission is a logical successor to the HST, extending beyond Hubble’s discoveries into the infrared, where the highly redshifted early universe must be observed, where cool objects like protostars and protoplanetary disks emit strongly, and where dust obscures shorter wavelengths.
Program: Hubble Space Telescope Since 1990, the HST has used its pointing precision, powerful optics, and state-of-the-art instruments to explore the vis-
ible, ultraviolet and near-infrared regions of the electromagnetic spectrum. Until such time that Hubble is no longer able to carry out its scientifi c mission, the observatory will continue to investigate the formation, structure, and evolution of stars and galaxies, studying the history of the universe, and providing a space-based research facility for optical astronomy.
Hubble development funding supports a suite of life extension activities, which will maximize science return as the tele-scope’s capabilities degrade over time. In addition, a robotic spacecraft is under development to be launched on an expendable launch vehicle, rendezvous with HST, and safely deorbit the observatory at the end of its useful science life. While this development activity is underway, modifi cation and upkeep of ground operations systems will continue.
Program: Gamma-ray Large Area Space Telescope (GLAST) A collaboration with the Department of Energy, France, Italy, Sweden, Japan, and Germany, the Gamma-ray Large Area
Space Telescope (GLAST) will improve researchers’ understanding of the structure of the universe, from its earliest begin-nings to its ultimate fate. By measuring the direction, energy, and arrival time of celestial high-energy gamma rays, GLAST will map the sky with 50 times the sensitivity of previous missions, with corresponding improvements in resolution and coverage. Yielding new insights into the sources of high-energy cosmic gamma rays, GLAST will reveal the nature of astrophysical jets and relativistic fl ows and study the sources of gamma-ray bursts.
Program: Discovery The Discovery program gives scientists the opportunity to dig deep into their imaginations and fi nd innovative ways to
unlock the mysteries of the solar system. Discovery is an ongoing program that offers the scientifi c community the op-portunity to assemble a team and design exciting, focused science investigations that complement NASA’s larger planetary science explorations.
Program: Explorer The Explorer program provides frequent fl ight opportunities for world-class astrophysics and space physics investigations,
utilizing innovative, streamlined and effi cient management approaches to spacecraft development and operations. The program (including Future Explorers) is managed within the Earth–Sun Theme, but selected projects are managed under the Universe Theme.
197
Financials
PART 3 • FINANCIALS
National Aeronautics and Space AdministrationRequired Supplementary Stewardship Information(Fiscal Years 2006 and 2005 Are Unaudited)Stewardship Investments: Research and Development (Continued)For the Fiscal Year Ended September 30, 2006(In Millions of Dollars)
Program: Universe Research The Universe Theme’s Research program strives to answer critical questions about the nature of the universe with a host
of operating missions led by investigators from academia and industry, as well as funding grants for basic research, tech-nology development, and data analysis from past and current missions. All data collected by missions are archived in data centers located at universities and NASA centers throughout the country.
Program: International Space Science Collaboration (SSC) Herschel and Planck, two projects in the International Space Science Collaboration (SSC) Program, are European Space
Agency (ESA)-led missions. Herschel has been designed to unveil a face of the early universe that has remained hidden until now. Planck will help provide answers to one of the most important sets of questions asked in modern science: how did the universe begin, how did it evolve to the state we observe today, and how will it continue to evolve in the future?
Program: Beyond Einstein Beyond Einstein (BE) fl agship missions are the Laser Interferometer Space Antenna (LISA) & Constellation-X (Con-X). LISA,
a joint effort NASA/ESA effort, will be the fi rst space-based gravitational wave observatory. LISA will study the death spirals of stars, colliding black holes, and echoes from the universe all the way back to the Big Bang. Con-X will be a combination of several separate spacecraft working in unison as 1 giant X-ray telescope far more powerful than any previous. Con-X will investigate black holes, galaxy formation, the evolution of the universe on the largest scales, the recycling of matter and energy, and the nature of “dark matter.”
Theme: Earth–Sun SystemNASA uses the unique vantage point of space to understand and explore Earth and the Sun. The relationship between the Sun and the Earth is at the heart of a complex, dynamic system that researchers do not yet fully understand. The Earth–Sun system, like the human body, is comprised of diverse components that interact in complex ways, requiring unique capabilities for characterizing, understanding, and predicting change. Therefore, researchers need to understand the Sun, the heliosphere, and Earth’s atmo-sphere, lithosphere, hydrosphere, cryosphere, and biosphere as a single connected system.
Program: Earth Systematic Missions Earth Systematic Missions provide Earth observing satellites that contribute to the provision of long-term environmental
data sets that can be used to study the evolution of the Earth system on a range of temporal scales. This information is used to analyze, model, and improve understanding of the Earth system.
Program: Living with a Star The Living With a Star (LWS) program seeks to understand how and why the Sun varies, how Earth and other planets
respond, and how the variability and response affect humanity. Achieving these goals will enable a reliable space weather prediction so undesirable space weather effects can be accommodated or mitigated before they occur.
Program: Solar Terrestrial Probes (STP) The primary goal of the Solar Terrestrial Probes (STP) Program is to understand how the Sun, heliosphere, and planetary
environments are connected in a single system.
Program: Explorer The mission of the Explorer program is to provide frequent fl ight opportunities for world-class astrophysics and space
physics investigations, utilizing innovative, streamlined and effi cient management approaches to spacecraft development and operations.
Program: Earth System Science Pathfi nder (ESSP) This program addresses unique, specifi c, highly-focused mission requirements in Earth science research. ESSP includes a
series of relatively low to moderate cost, small to medium sized, competitively selected, principal investigator led missions that are built, tested, and launched in a short time interval. These missions are capable of supporting a variety of scientifi c objectives related to Earth science, involving the atmosphere, oceans, land surface, polar ice regions and solid earth.
198 NASA FY 2006 PERFORMANCE AND ACCOUNTABILITY REPORT
National Aeronautics and Space AdministrationRequired Supplementary Stewardship Information(Fiscal Years 2006 and 2005 Are Unaudited)Stewardship Investments: Research and Development (Continued)For the Fiscal Year Ended September 30, 2006(In Millions of Dollars)
Program: Earth–Sun System Multi-Mission Operations This program acquires, preserves, and delivers the observation data for the Science Mission Directorate/Earth–Sun System
scientifi c focus areas in conformance with national science objectives.
Program: Earth–Sun System Division (ESSD) The program observations and research aim to improve our capability for predicting weather, climate and natural hazards,
including space weather. The focus of NASA’s efforts in ESSD is the development and demonstration of space-based measurements, providing information about the Earth–Sun system not available by other means.
Program: Applied Sciences The Applied Sciences program bridges the gap between scientifi c discoveries and practical applications that benefi t soci-
ety through partnerships that integrate the observations and predictions resulting from NASA Earth–Sun system science into solutions.
Program: Earth–Sun System Education and Outreach The program uses NASA’s results from studying the Earth system and the Sun to enhance the teaching and learning of
Earth, space, and environmental sciences through partnerships with educational institutions and organizations.
Program: Earth–Sun Technology NASA’s ESSD is dedicated to understanding the total Earth–Sun system and the effects of natural and human-induced
changes on the global environment.
BUSINESS LINE: EXPLORATION SYSTEMS
Theme: Constellation SystemsThrough the Constellation Systems Theme NASA will develop, demonstrate, and deploy the collection of systems that will enable sustained human and robotic exploration of the Moon, Mars, and beyond.
Program: Earth Orbit Capability The Earth Orbit Capability program is responsible for developing, demonstrating, and deploying the capability for crew
transportation to Earth orbit.
Theme: Exploration Systems Research and Technology The Exploration Systems Research and Technology (ESR&T) Theme represents NASA’s commitment to investing in the technologies and capabilities that will make the national vision for space exploration possible.
Program: Advanced Space Technology The Advanced Space Technology program develops new technologies that will enable NASA to conduct new human and
robotic exploration missions, gather new types of scientifi c data, and reduce mission risk and cost.
Program: Technology Maturation The Technology Maturation program develops and validates the most promising advanced space technology concepts and
matures them to the level of demonstration and space fl ight validation, to enable safe, affordable, effective and sustainable human-robotic exploration.
Program: Robotic Lunar Exploration (RLE) This program will undertake lunar exploration activities that enable sustained human and robotic exploration of the Moon.
These activities will further science, and develop and test new approaches, technologies, and systems, including use of lunar and other space resources, to support sustained human space exploration.
Theme: Prometheus Nuclear Systems and Technology Prometheus Nuclear Systems and Technology represents NASA’s effort to develop an advanced technology capability for more complex operations and exploration of the solar system.
199
Financials
PART 3 • FINANCIALS
National Aeronautics and Space AdministrationRequired Supplementary Stewardship Information(Fiscal Years 2006 and 2005 Are Unaudited)Stewardship Investments: Research and Development (Continued)For the Fiscal Year Ended September 30, 2006(In Millions of Dollars)
Program: Advanced Systems and Technology The Advanced Systems and Technology program develops and demonstrates advanced nuclear technologies and engi-
neered systems. This technology development will be necessary to support NASA’s goal of more distant, more ambitious, and longer duration human and robotic exploration of Mars and other destinations.
Program: Nuclear Flight Systems The Nuclear Flight Systems program continues NASA’s development of nuclear reactor power and associated spacecraft
systems to enhance NASA’s abilities to conduct robotic exploration and science operations.
Theme: Human Systems Research and TechnologyThis Theme focuses on ensuring the health, safety, and security of humans through the course of solar system exploration.
Program: Life Support and Habitation The Life Support and Habitation program focuses on enabling human exploration beyond low Earth orbit by developing
technologies to support human activity in and beyond low Earth orbit.
Program: Human Health and Performance The Human Health and Performance program delivers research, technology, knowledge, and tools that will enable
human space exploration. Specifi cally, the Human Health and Performance program will guide the development of various countermeasures to aid astronauts counteract any deleterious effects of long-duration missions in the space environment; develop tools and techniques to improve medical care delivery to space exploration crews; increase our biomedical knowl-edge and improve understanding of radiation effects to reduce the uncertainty in estimating space radiation health risks to human crews; and, acquire new information in exploration biology, which will identify and defi ne the scope of problems that will face future human space explorers during long periods of exposure to space.
Program: Human Systems Integration The Human-Systems Integration program conducts research and technology development driven by Agency needs for
crew health; design of human spacecraft, space suits, and habitats; effi cient crew operations; medical operations; and technology development to enable safe and productive human space exploration.
BUSINESS LINE: AERONAUTICS RESEARCH
Theme: Aeronautics Technology (AT) Aeronautics Technology conducts high-quality, innovative research that will lead to revolutionary concepts, technologies, and capa-bilities that enable radical change to both the airspace system and the aircraft that fl y within it.
Program: Aviation Safety The Aviation Safety program builds upon the unique safety-related research capabilities of NASA to develop tools, meth-
ods, and technologies that will improve the intrinsic safety attributes of current and future aircraft, and to overcome aircraft safety technological barriers that would otherwise constrain the full realization of Next Generation Air Transportation System (NGATS).
Program: Airspace Systems The Airspace Systems Program conducts cutting-edge air traffi c management research that will enable the NGATS. In
partnership with the Joint Planning and Development Offi ce (JPDO), the ASP will help develop the concepts, capabilities and technologies that will lead to the signifi cant enhancements in capacity, effi ciency and fl exibility needed to meet the Nation’s airspace and airportal requirements for decades to come.
200 NASA FY 2006 PERFORMANCE AND ACCOUNTABILITY REPORT
National Aeronautics and Space AdministrationRequired Supplementary Stewardship Information(Fiscal Years 2006 and 2005 Are Unaudited)Stewardship Investments: Research and Development (Continued)For the Fiscal Year Ended September 30, 2006(In Millions of Dollars)
Program: Fundamental Aeronautics The Fundamental Aeronautics program will conduct cutting-edge research that will enable the design of vehicles that fl y
through any atmosphere at any speed. Because aircraft of the future will need to address multiple and often confl icting design challenges such as noise, emissions, and performance, a key focus will be the development of physics-based, multidisciplinary design, analysis, and optimization (MDAO) tools. Such tools will make it possible to evaluate radically new vehicle designs and to assess, with known uncertainties, the potential impact of innovative concepts and technologies on a vehicle’s overall performance.
NON-R&D Programs
BUSINESS LINE: SCIENCE
Theme: Earth–Sun System
Program: Education and Outreach The program uses NASA’s results from studying the Earth system and the Sun to enhance the teaching and learning of
Earth, space, and environmental sciences through partnerships with educational institutions and organizations.
Program: SOFIA Stratospheric Observatory for Infrared Astronomy (SOFIA) is a telescope mounted onto a specially designed Boeing 747.
The project has considered the use of SOFIA as a platform for pursuits other than its primary mission of astronomy/astro-physics. According to SOFIA’s Project Manager, a concept has been developed for SOFIA to be used for Earth Science investigations, simultaneously with SOFIA’s prime mission. Also, additional in depth studies include using SOFIA as an experimental platform to test high bandwidth communications with Mars spacecraft or as a testbed for high-bandwidth earth communications.
BUSINESS LINE: SPACE OPERATIONS
Theme: Space ShuttleThe Space Shuttle is currently the only launch capability owned by the United States that enables human access to space, and the only vehicle that can support the assembly of the International Space Station (ISS). NASA will phase-out the Space Shuttle in 2010 when its role in ISS assembly is complete.
Theme: International Space StationThis Theme supports the construction and operations of a research facility in low Earth orbit as NASA’s fi rst step in achieving the Vision for Space Exploration. The ISS provides a unique, continuously operating capability to develop medical countermeasures for long-term human space travel: develop and test technologies and engineering solutions in support of exploration; and provide ongo-ing practical experience in living and working in space. It also supports a variety of pure and applied research for the U.S. and its International Partners. ISS assembly will be completed by the end of the decade. NASA is examining confi gurations for the Space Station that meet the needs of both the new space exploration vision and our international partners using as few Shuttle fl ights as possible. A key element of the ISS program is the crew and cargo services project, which will purchase services for cargo and crew transport using existing and emerging capabilities.
Theme: Space and Flight SupportThis theme encompasses Space Communications, Launch Services, Rocket Propulsion Testing, and Crew Health and Safety. Space Communications consists of (1) the Tracking and Data Relay Satellite System (TDRSS), which supports activities such as the Space Shuttle, ISS, Expendable Launch Vehicles, and research aircraft, and (2) the NASA Integrated Services Network, which provides telecommunications services at facilities, such as fl ight support networks, mission control centers and science facilities, and administrative communications networks for NASA Centers. The Launch Services program focuses on meeting the Agency’s launch and payload processing requirements by assuring safe and cost-effective access to space via the Space Shuttle and expendable launch vehicles.
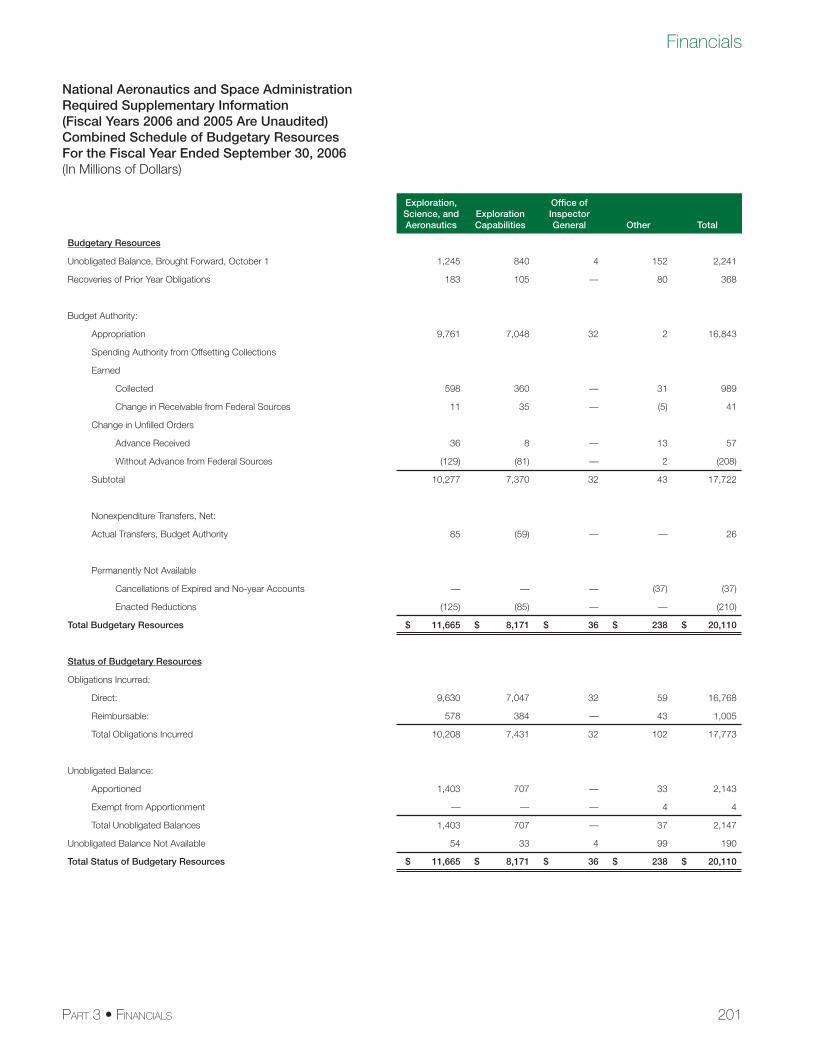
201
Financials
PART 3 • FINANCIALS
National Aeronautics and Space AdministrationRequired Supplementary Information(Fiscal Years 2006 and 2005 Are Unaudited)Combined Schedule of Budgetary ResourcesFor the Fiscal Year Ended September 30, 2006(In Millions of Dollars)
Exploration, Science, and Aeronautics
ExplorationCapabilities
Offi ce of Inspector General Other Total
Budgetary Resources
Unobligated Balance, Brought Forward, October 1 1,245 840 4 152 2,241
Recoveries of Prior Year Obligations 183 105 — 80 368
Budget Authority:
Appropriation 9,761 7,048 32 2 16,843
Spending Authority from Offsetting Collections
Earned
Collected 598 360 — 31 989
Change in Receivable from Federal Sources 11 35 — (5) 41
Change in Unfi lled Orders
Advance Received 36 8 — 13 57
Without Advance from Federal Sources (129) (81) — 2 (208)
Subtotal 10,277 7,370 32 43 17,722
Nonexpenditure Transfers, Net:
Actual Transfers, Budget Authority 85 (59) — — 26
Permanently Not Available
Cancellations of Expired and No-year Accounts — — — (37) (37)
Enacted Reductions (125) (85) — — (210)
Total Budgetary Resources $ 11,665 $ 8,171 $ 36 $ 238 $ 20,110
Status of Budgetary Resources
Obligations Incurred:
Direct: 9,630 7,047 32 59 16,768
Reimbursable: 578 384 — 43 1,005
Total Obligations Incurred 10,208 7,431 32 102 17,773
Unobligated Balance:
Apportioned 1,403 707 — 33 2,143
Exempt from Apportionment — — — 4 4
Total Unobligated Balances 1,403 707 — 37 2,147
Unobligated Balance Not Available 54 33 4 99 190
Total Status of Budgetary Resources $ 11,665 $ 8,171 $ 36 $ 238 $ 20,110

202 NASA FY 2006 PERFORMANCE AND ACCOUNTABILITY REPORT
National Aeronautics and Space AdministrationRequired Supplementary Information(Fiscal Years 2006 and 2005 Are Unaudited)Combined Schedule of Budgetary ResourcesFor the Fiscal Year Ended September 30, 2006 (Continued)(In Millions of Dollars)
Exploration, Science, and Aeronautics
ExplorationCapabilities
Offi ce of Inspector General Other Total
Change in Obligated Balance
Obligated Balances, Net, October 1 3,454 1,950 6 563 5,973
Obligations Incurred, Net 10,209 7,431 32 101 17,773
Less: Gross Outlays 8,486 7,484 33 256 16,259
Less: Recoveries of Prior Year Unpaid Obligations 183 105 — 80 368
Change in Uncollected Customer Payments from Federal Sources 118 46 — 3 167
Obligated Balance, Net, End of Period
Unpaid Obligations 5,343 1,984 5 339 7,671
Less: Uncollected Customer Payments from Federal Sources 231 146 — 8 385
Total, Unpaid Obligated Balance, Net, End of Period $ 5,112 $ 1,838 $ 5 $ 331 $ 7,286
Outlays
Net Outlays
Gross Outlays 8,486 7,484 33 256 16,259
Less: Offsetting Collections 633 367 — 45 1,045
Subtotal 7,853 7,117 33 211 15,214
Less: Distributed Offsetting Receipts — — — 8 8
Net Outlays $ 7,853 $ 7,117 $ 33 $ 203 $ 15,206

203
Financials
PART 3 • FINANCIALS
National Aeronautics and Space AdministrationRequired Supplementary Information(Fiscal Years 2006 and 2005 Are Unaudited)Combined Schedule of Budgetary ResourcesFor the Fiscal Year Ended September 30, 2005(In Millions of Dollars)
Exploration, Science, and Aeronautics
ExplorationCapabilities
Offi ce of Inspector General Other Total
Budgetary Resources
Unobligated Balance, Brought Forward, October 1 1,203 560 — 1,338 3,101
Recoveries of Prior Year Obligations — — — 10 10
Budget Authority:
Appropriation 7,743 8,552 32 (12) 16,315
Spending Authority from Offsetting Collections
Earned
Collected 476 338 — 37 851
Change in Receivable from Federal Sources 25 8 — (12) 21
Change in Unfi lled Orders
Advance Received — 15 — (5) 10
Without Advance from Federal Sources 26 107 — (16) 117
Subtotal 8,270 9,020 32 (8) 17,314
Nonexpenditure Transfers, Net:
Actual Transfers, Budget Authority 197 (197) — — —
Permanently Not Available
Cancellations of Expired and No-year Accounts — — — (60) (60)
Enacted Reductions (62) (67) — — (129)
Total Budgetary Resources $ 9,608 $ 9,316 $ 32 $ 1,280 $ 20,236
Status of Budgetary Resources
Obligations Incurred:
Direct: 7,817 8,088 29 1,045 16,979
Reimbursable: 546 388 — 85 1,019
Total Obligations Incurred 8,363 8,476 29 1,130 17,998
Unobligated Balance:
Apportioned 1,270 771 2 30 2,073
Exempt from Apportionment — — — 4 4
Total Unobligated Balances 1,270 771 2 34 2,077
Unobligated Balance Not Available (25) 69 1 116 161
Total Status of Budgetary Resources $ 9,608 $ 9,316 $ 32 $ 1,280 $ 20,236
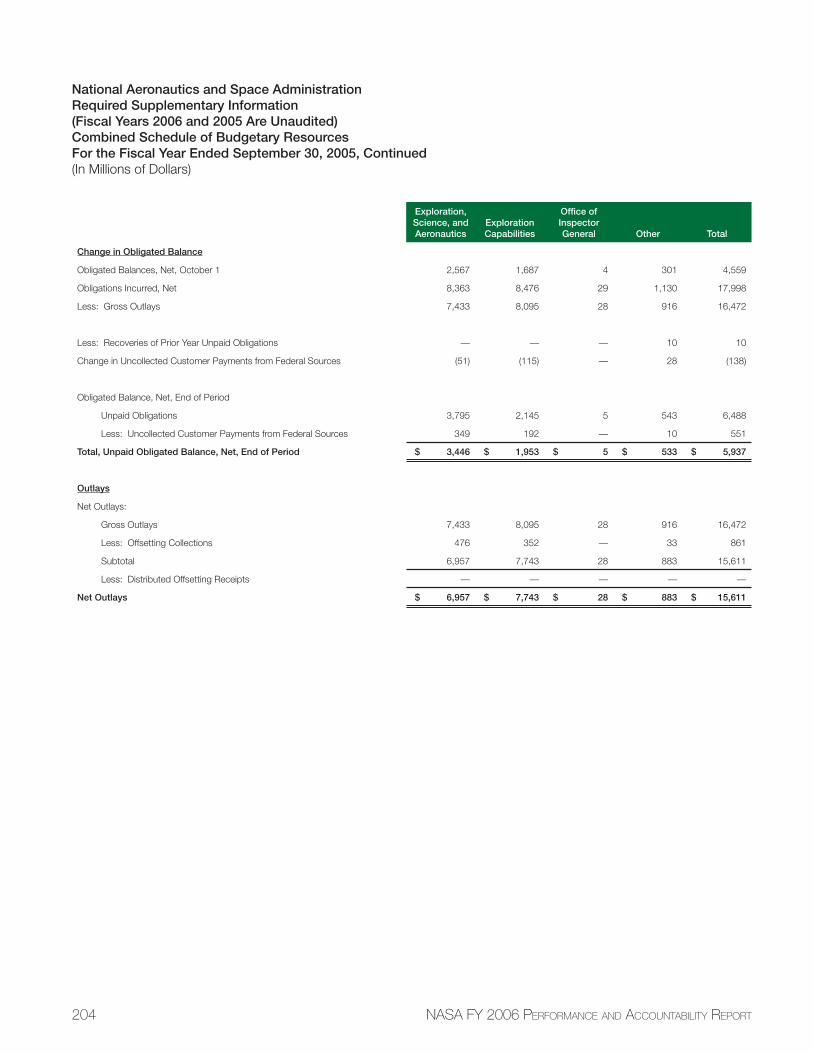
204 NASA FY 2006 PERFORMANCE AND ACCOUNTABILITY REPORT
National Aeronautics and Space AdministrationRequired Supplementary Information(Fiscal Years 2006 and 2005 Are Unaudited)Combined Schedule of Budgetary ResourcesFor the Fiscal Year Ended September 30, 2005, Continued(In Millions of Dollars)
Exploration, Science, and Aeronautics
ExplorationCapabilities
Offi ce of Inspector General Other Total
Change in Obligated Balance
Obligated Balances, Net, October 1 2,567 1,687 4 301 4,559
Obligations Incurred, Net 8,363 8,476 29 1,130 17,998
Less: Gross Outlays 7,433 8,095 28 916 16,472
Less: Recoveries of Prior Year Unpaid Obligations — — — 10 10
Change in Uncollected Customer Payments from Federal Sources (51) (115) — 28 (138)
Obligated Balance, Net, End of Period
Unpaid Obligations 3,795 2,145 5 543 6,488
Less: Uncollected Customer Payments from Federal Sources 349 192 — 10 551
Total, Unpaid Obligated Balance, Net, End of Period $ 3,446 $ 1,953 $ 5 $ 533 $ 5,937
Outlays
Net Outlays:
Gross Outlays 7,433 8,095 28 916 16,472
Less: Offsetting Collections 476 352 — 33 861
Subtotal 6,957 7,743 28 883 15,611
Less: Distributed Offsetting Receipts — — — — —
Net Outlays $ 6,957 $ 7,743 $ 28 $ 883 $ 15,611
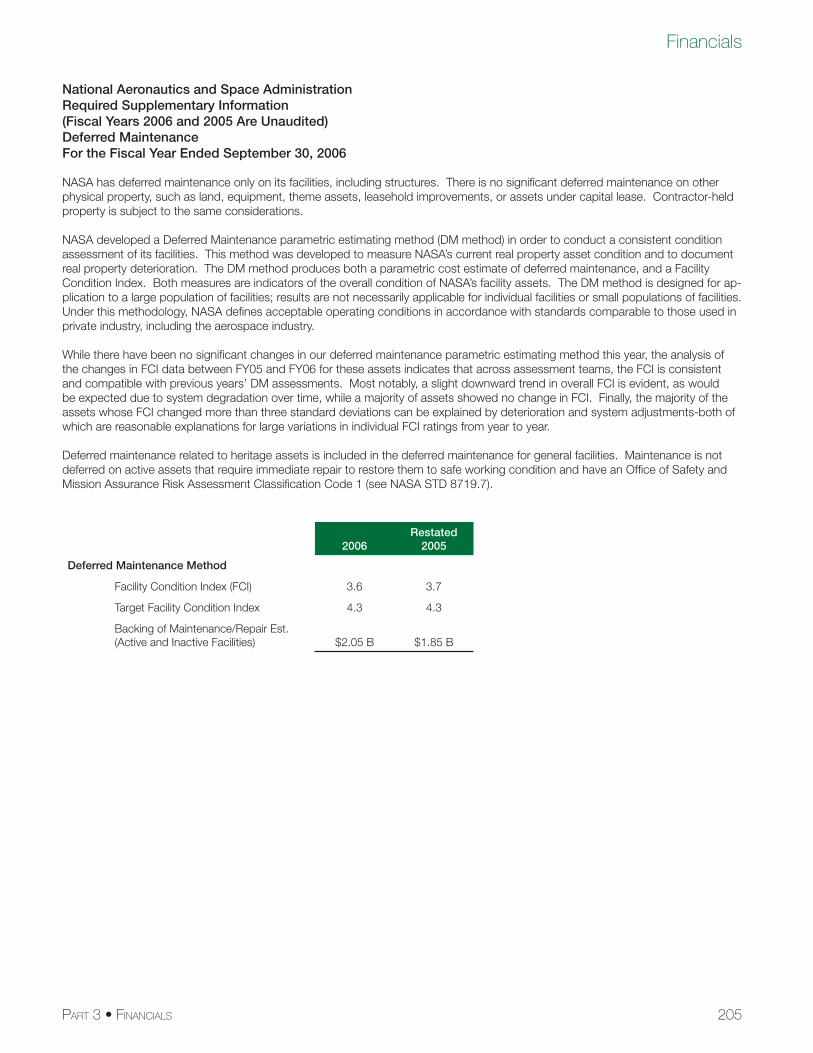
205
Financials
PART 3 • FINANCIALS
National Aeronautics and Space AdministrationRequired Supplementary Information(Fiscal Years 2006 and 2005 Are Unaudited)Deferred MaintenanceFor the Fiscal Year Ended September 30, 2006
NASA has deferred maintenance only on its facilities, including structures. There is no signifi cant deferred maintenance on other physical property, such as land, equipment, theme assets, leasehold improvements, or assets under capital lease. Contractor-held property is subject to the same considerations.
NASA developed a Deferred Maintenance parametric estimating method (DM method) in order to conduct a consistent condition assessment of its facilities. This method was developed to measure NASA’s current real property asset condition and to document real property deterioration. The DM method produces both a parametric cost estimate of deferred maintenance, and a Facility Condition Index. Both measures are indicators of the overall condition of NASA’s facility assets. The DM method is designed for ap-plication to a large population of facilities; results are not necessarily applicable for individual facilities or small populations of facilities. Under this methodology, NASA defi nes acceptable operating conditions in accordance with standards comparable to those used in private industry, including the aerospace industry. While there have been no signifi cant changes in our deferred maintenance parametric estimating method this year, the analysis of the changes in FCI data between FY05 and FY06 for these assets indicates that across assessment teams, the FCI is consistent and compatible with previous years’ DM assessments. Most notably, a slight downward trend in overall FCI is evident, as would be expected due to system degradation over time, while a majority of assets showed no change in FCI. Finally, the majority of the assets whose FCI changed more than three standard deviations can be explained by deterioration and system adjustments-both of which are reasonable explanations for large variations in individual FCI ratings from year to year.
Deferred maintenance related to heritage assets is included in the deferred maintenance for general facilities. Maintenance is not deferred on active assets that require immediate repair to restore them to safe working condition and have an Offi ce of Safety and Mission Assurance Risk Assessment Classifi cation Code 1 (see NASA STD 8719.7).
2006Restated
2005
Deferred Maintenance Method
Facility Condition Index (FCI) 3.6 3.7
Target Facility Condition Index 4.3 4.3
Backing of Maintenance/Repair Est.(Active and Inactive Facilities) $2.05 B $1.85 B
206 NASA FY 2006 PERFORMANCE AND ACCOUNTABILITY REPORT
Offi ce of Inspector General Letter on Audit of NASA’s Financial Statements
207
Financials
PART 3 • FINANCIALS
208 NASA FY 2006 PERFORMANCE AND ACCOUNTABILITY REPORT
Report of the Independent Auditors
209
Financials
PART 3 • FINANCIALS
210 NASA FY 2006 PERFORMANCE AND ACCOUNTABILITY REPORT
211
Financials
PART 3 • FINANCIALS
212 NASA FY 2006 PERFORMANCE AND ACCOUNTABILITY REPORT
213
Financials
PART 3 • FINANCIALS
214 NASA FY 2006 PERFORMANCE AND ACCOUNTABILITY REPORT
215
Financials
PART 3 • FINANCIALS
216 NASA FY 2006 PERFORMANCE AND ACCOUNTABILITY REPORT
217
Financials
PART 3 • FINANCIALS
218 NASA FY 2006 PERFORMANCE AND ACCOUNTABILITY REPORT
219
Financials
PART 3 • FINANCIALS
220 NASA FY 2006 PERFORMANCE AND ACCOUNTABILITY REPORT
221
Financials
PART 3 • FINANCIALS
222 NASA FY 2006 PERFORMANCE AND ACCOUNTABILITY REPORT
223
Financials
PART 3 • FINANCIALS
224 NASA FY 2006 PERFORMANCE AND ACCOUNTABILITY REPORT
225
Financials
PART 3 • FINANCIALS
226 NASA FY 2006 PERFORMANCE AND ACCOUNTABILITY REPORT
227
Financials
PART 3 • FINANCIALS
228 NASA FY 2006 PERFORMANCE AND ACCOUNTABILITY REPORT
229
Financials
PART 3 • FINANCIALS
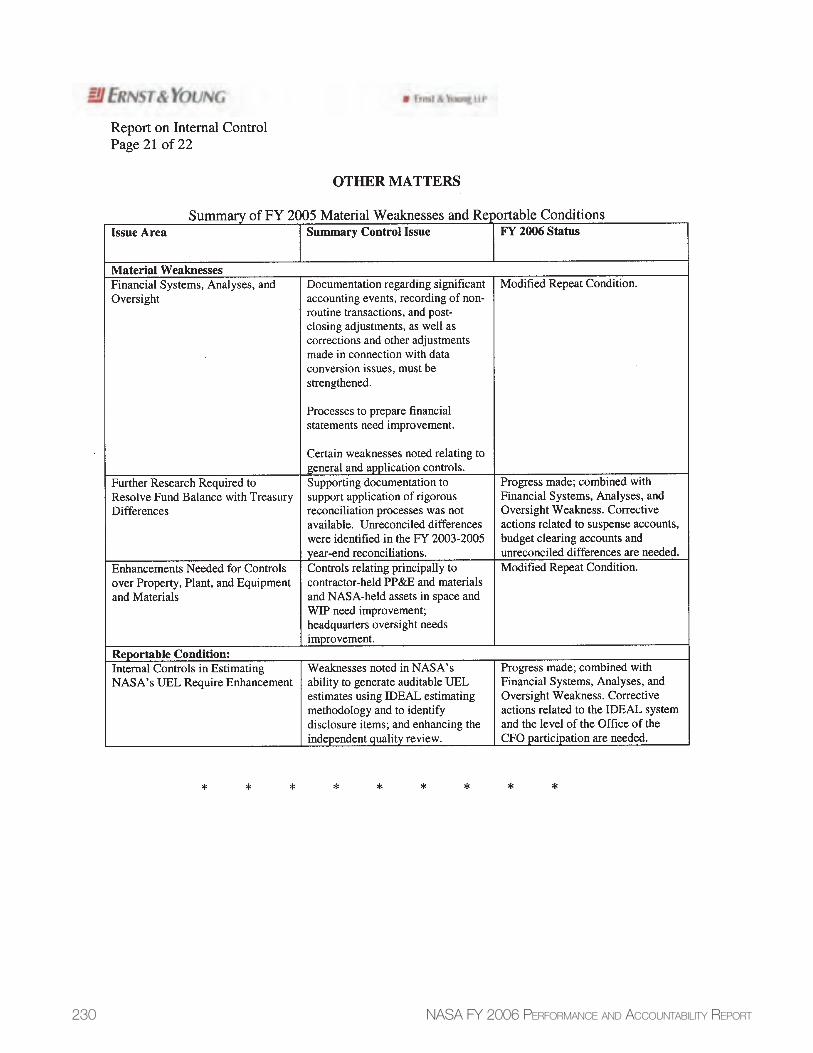
230 NASA FY 2006 PERFORMANCE AND ACCOUNTABILITY REPORT
231
Financials
PART 3 • FINANCIALS
232 NASA FY 2006 PERFORMANCE AND ACCOUNTABILITY REPORT
233
Financials
PART 3 • FINANCIALS
234 NASA FY 2006 PERFORMANCE AND ACCOUNTABILITY REPORT
235
Financials
PART 3 • FINANCIALS
Chief Financial Offi cer’s Response to the Audit Report of the Independent Auditors

236 NASA FY 2006 PERFORMANCE AND ACCOUNTABILITY REPORT
Appe
ndice
s
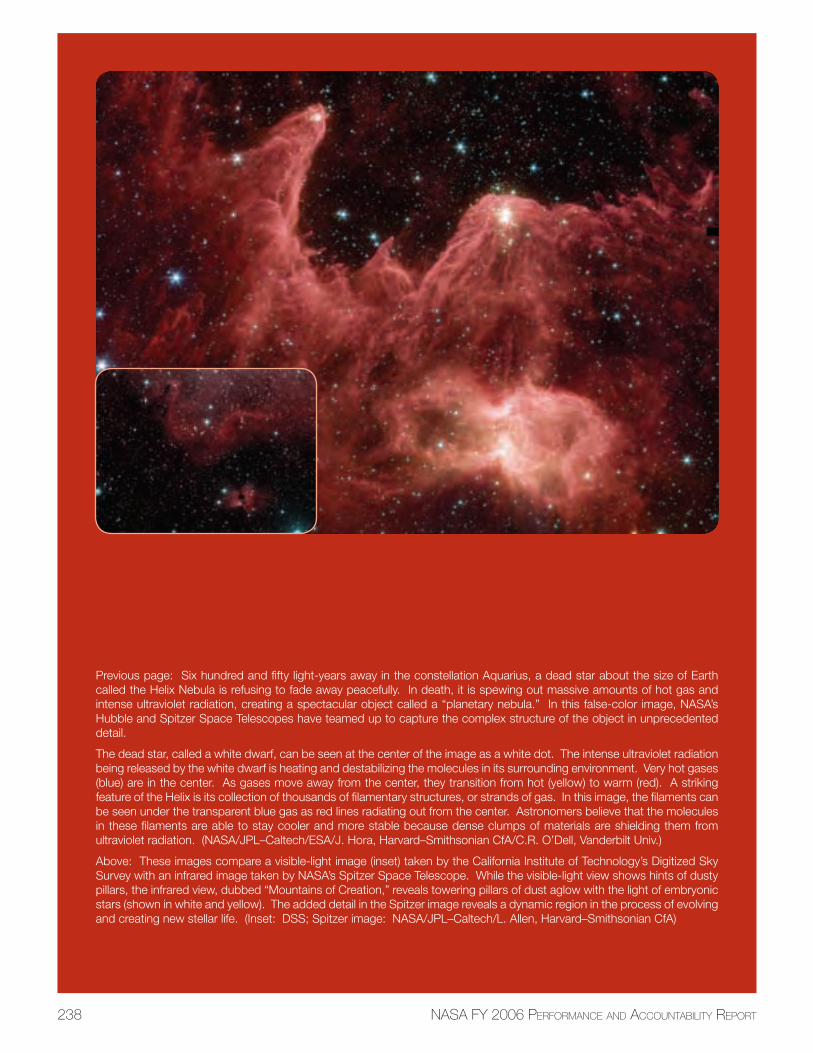
Previous page: Six hundred and fi fty light-years away in the constellation Aquarius, a dead star about the size of Earth called the Helix Nebula is refusing to fade away peacefully. In death, it is spewing out massive amounts of hot gas and intense ultraviolet radiation, creating a spectacular object called a “planetary nebula.” In this false-color image, NASA’s Hubble and Spitzer Space Telescopes have teamed up to capture the complex structure of the object in unprecedented detail.
The dead star, called a white dwarf, can be seen at the center of the image as a white dot. The intense ultraviolet radiation being released by the white dwarf is heating and destabilizing the molecules in its surrounding environment. Very hot gases (blue) are in the center. As gases move away from the center, they transition from hot (yellow) to warm (red). A striking feature of the Helix is its collection of thousands of fi lamentary structures, or strands of gas. In this image, the fi laments can be seen under the transparent blue gas as red lines radiating out from the center. Astronomers believe that the molecules in these fi laments are able to stay cooler and more stable because dense clumps of materials are shielding them from ultraviolet radiation. (NASA/JPL–Caltech/ESA/J. Hora, Harvard–Smithsonian CfA/C.R. O’Dell, Vanderbilt Univ.)
Above: These images compare a visible-light image (inset) taken by the California Institute of Technology’s Digitized Sky Survey with an infrared image taken by NASA’s Spitzer Space Telescope. While the visible-light view shows hints of dusty pillars, the infrared view, dubbed “Mountains of Creation,” reveals towering pillars of dust aglow with the light of embryonic stars (shown in white and yellow). The added detail in the Spitzer image reveals a dynamic region in the process of evolving and creating new stellar life. (Inset: DSS; Spitzer image: NASA/JPL–Caltech/L. Allen, Harvard–Smithsonian CfA)
238 NASA FY 2006 PERFORMANCE AND ACCOUNTABILITY REPORT
APPENDICES A-1
The Inspector General Act AmendmentsThe Inspector General Act of 1978 (as amended), requires that the head of each federal agency make management
decisions on all audit recommendations issued by the Offi ce of Inspector General (OIG) within a maximum of six months
after the issuance of an audit report. The Act further requires that the head of each federal agency complete fi nal action
on each management decision required with regard to a recommendation in an OIG report within 12 months after issu-
ance of a report.
The Inspector General Act Amendments of 1988 (P.L. 100-504), require that federal agency heads report on the status of
management decisions and fi nal management action with regard to audit reports issued by the OIG. Under the Reports
Consolidation Act (RCA) of 2000, NASA consolidates and annualizes all relevant information on fi nal management deci-
sions and fi nal management action for inclusion in the annual Performance and Accountability Report (PAR). Following
is NASA’s submission in compliance with these requirements.
Report on Audit Follow-upNASA management is committed to ensuring the timely resolution (management decision) and implementation of OIG
audit recommendations and believes that audit follow-up is essential to improving the effi ciency and effectiveness of
NASA programs, projects, and operations. Therefore, NASA has implemented a comprehensive program of audit liaison,
resolution, and follow-up to assure that OIG audit recommendations are resolved and implemented promptly.
NASA uses the Corrective Action Tracking System version 2.0 (CATS II), as the Agency’s primary database for monitoring
the status of OIG audit recommendations. CATS II is a Web-based application developed and managed by NASA.
NASA’s program of audit follow-up is a joint effort between NASA management and the NASA OIG. Periodic reconcilia-
tions between the OIG’s Offi ce of Audits Central Information System (OACIS) and NASA’s CATS system assure complete
and accurate status reporting of open OIG audit reports and related recommendations.
During FY 2006, the Offi ce of Infrastructure and Administration, Management Systems Division partnered with the NASA
Offi ce of Inspector General, Quality Assurance Directorate on a joint effort to conduct post-closure follow-up reviews
to assess the effi ciency and effectiveness of agency audit follow-up processes and to identify trends and/or systemic
defi ciencies. Reviewers derived their objectives from requirements outlined in the Offi ce of Management and Budget’s
(OMB) Circular A-50, “Audit Follow-up,” dated September 29, 1982. The scope of the work performed was limited to
NASA OIG audit recommendations resolved and closed during the period January 1, 2000 through December 31, 2005.
On September 11, 2006, the Management Systems Division issued its initial report on post-closure follow-up. The report
concluded that while the work performed by the Management Systems Division did not support a conclusion as to the
overall effectiveness and effi ciency of NASA’s audit follow-up system in its entirety, the system did assure the effi cient,
prompt, and proper resolution and implementation of corrective action on the recommendation included in the review.
Furthermore, there was no indication of recurring defi ciencies or systemic trends relating to the subject matter reviewed
(NASA’s foreign national management system).
Appendix A:Audit Follow-up Actions
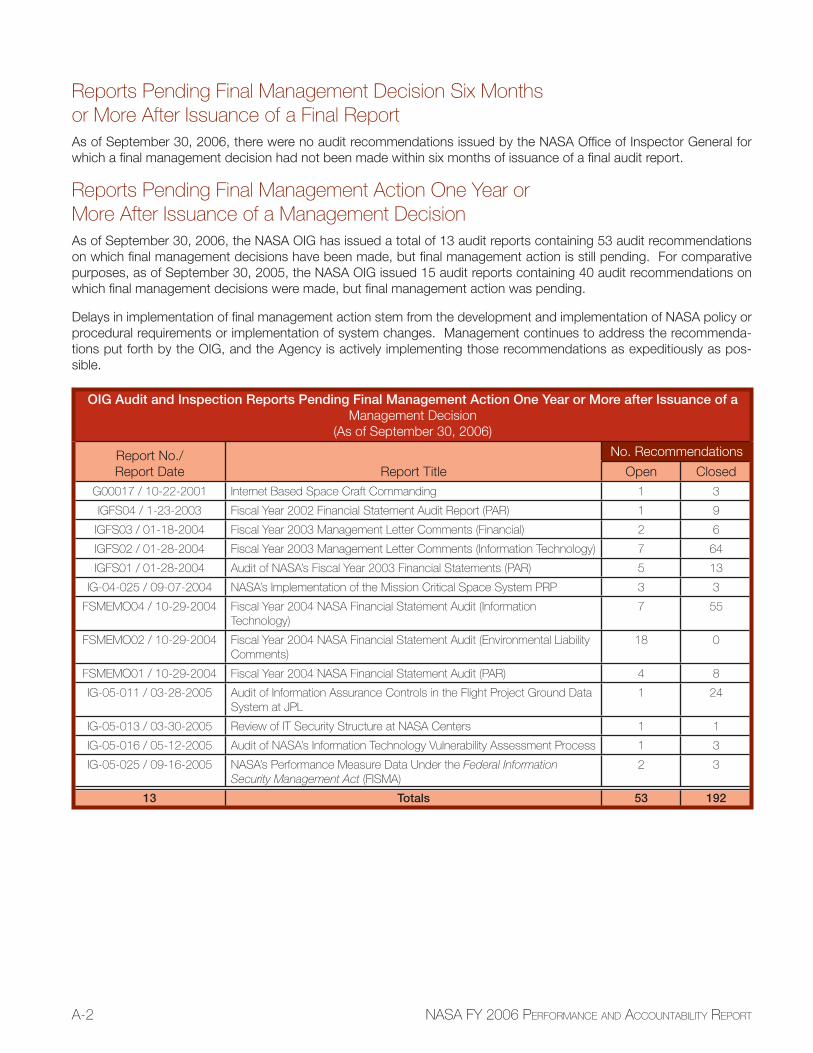
A-2 NASA FY 2006 PERFORMANCE AND ACCOUNTABILITY REPORT
Reports Pending Final Management Decision Six Months or More After Issuance of a Final ReportAs of September 30, 2006, there were no audit recommendations issued by the NASA Offi ce of Inspector General for
which a fi nal management decision had not been made within six months of issuance of a fi nal audit report.
Reports Pending Final Management Action One Year or More After Issuance of a Management DecisionAs of September 30, 2006, the NASA OIG has issued a total of 13 audit reports containing 53 audit recommendations
on which fi nal management decisions have been made, but fi nal management action is still pending. For comparative
purposes, as of September 30, 2005, the NASA OIG issued 15 audit reports containing 40 audit recommendations on
which fi nal management decisions were made, but fi nal management action was pending.
Delays in implementation of fi nal management action stem from the development and implementation of NASA policy or
procedural requirements or implementation of system changes. Management continues to address the recommenda-
tions put forth by the OIG, and the Agency is actively implementing those recommendations as expeditiously as pos-
sible.
OIG Audit and Inspection Reports Pending Final Management Action One Year or More after Issuance of a Management Decision
(As of September 30, 2006)
Report No./
Report Date Report Title
No. Recommendations
Open Closed
G00017 / 10-22-2001 Internet Based Space Craft Commanding 1 3
IGFS04 / 1-23-2003 Fiscal Year 2002 Financial Statement Audit Report (PAR) 1 9
IGFS03 / 01-18-2004 Fiscal Year 2003 Management Letter Comments (Financial) 2 6
IGFS02 / 01-28-2004 Fiscal Year 2003 Management Letter Comments (Information Technology) 7 64
IGFS01 / 01-28-2004 Audit of NASA’s Fiscal Year 2003 Financial Statements (PAR) 5 13
IG-04-025 / 09-07-2004 NASA’s Implementation of the Mission Critical Space System PRP 3 3
FSMEMO04 / 10-29-2004 Fiscal Year 2004 NASA Financial Statement Audit (Information Technology)
7 55
FSMEMO02 / 10-29-2004 Fiscal Year 2004 NASA Financial Statement Audit (Environmental Liability Comments)
18 0
FSMEMO01 / 10-29-2004 Fiscal Year 2004 NASA Financial Statement Audit (PAR) 4 8
IG-05-011 / 03-28-2005 Audit of Information Assurance Controls in the Flight Project Ground Data System at JPL
1 24
IG-05-013 / 03-30-2005 Review of IT Security Structure at NASA Centers 1 1
IG-05-016 / 05-12-2005 Audit of NASA’s Information Technology Vulnerability Assessment Process 1 3
IG-05-025 / 09-16-2005 NASA’s Performance Measure Data Under the Federal InformationSecurity Management Act (FISMA)
2 3
13 Totals 53 192
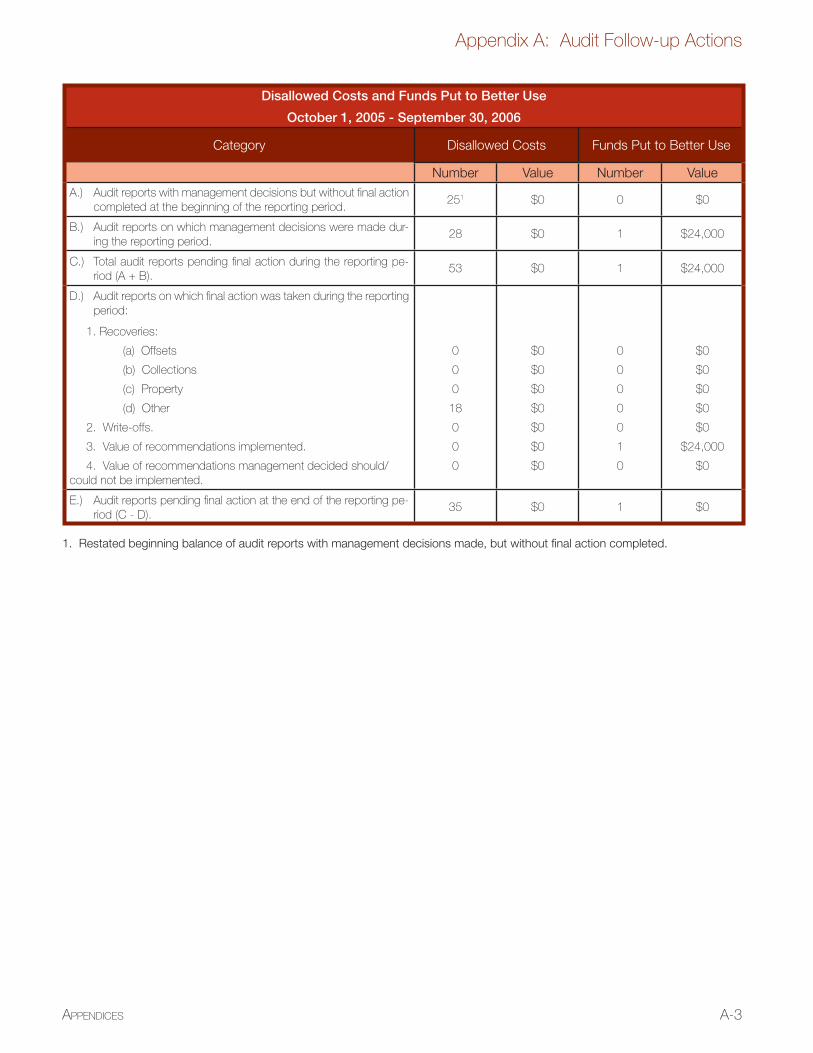
A-3
Appendix A: Audit Follow-up Actions
APPENDICES
Disallowed Costs and Funds Put to Better Use
October 1, 2005 - September 30, 2006
Category Disallowed Costs Funds Put to Better Use
Number Value Number Value
A.) Audit reports with management decisions but without fi nal action completed at the beginning of the reporting period.
251 $0 0 $0
B.) Audit reports on which management decisions were made dur-ing the reporting period.
28 $0 1 $24,000
C.) Total audit reports pending fi nal action during the reporting pe-riod (A + B).
53 $0 1 $24,000
D.) Audit reports on which fi nal action was taken during the reporting period:
1. Recoveries:
(a) Offsets 0 $0 0 $0
(b) Collections 0 $0 0 $0
(c) Property 0 $0 0 $0
(d) Other 18 $0 0 $0
2. Write-offs. 0 $0 0 $0
3. Value of recommendations implemented. 0 $0 1 $24,000
4. Value of recommendations management decided should/could not be implemented.
0 $0 0 $0
E.) Audit reports pending fi nal action at the end of the reporting pe-riod (C - D).
35 $0 1 $0
1. Restated beginning balance of audit reports with management decisions made, but without fi nal action completed.

A-4 NASA FY 2006 PERFORMANCE AND ACCOUNTABILITY REPORT
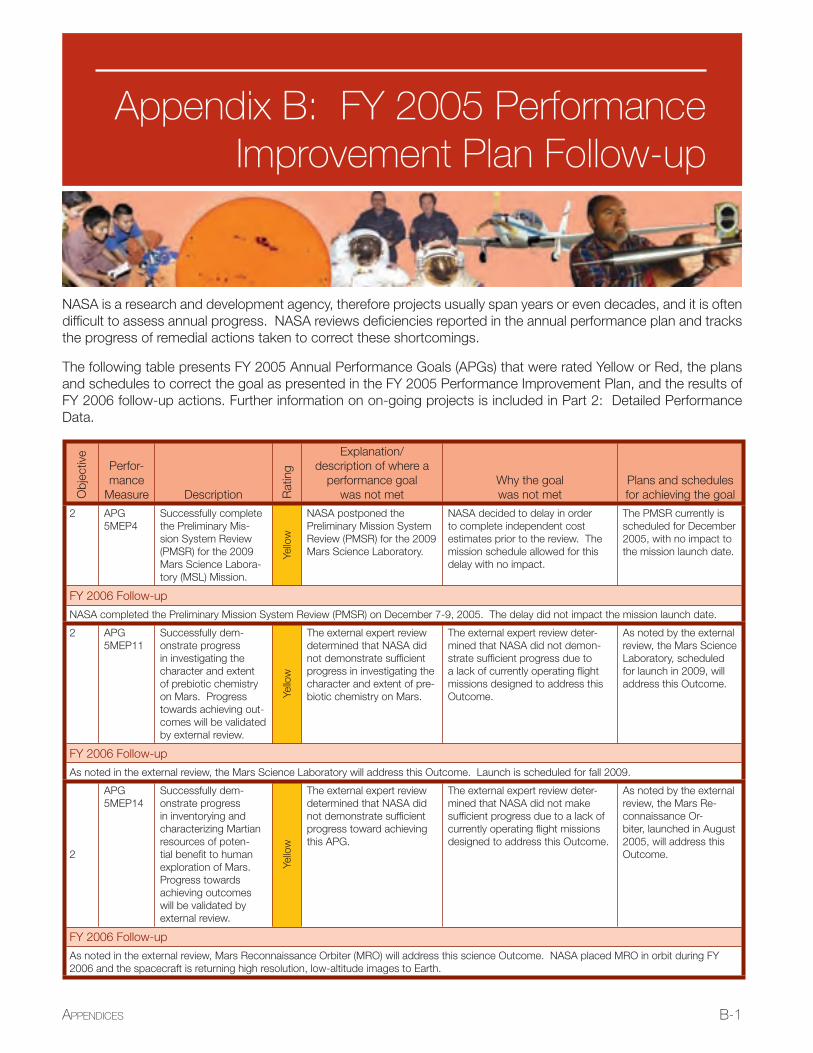
APPENDICES B-1
NASA is a research and development agency, therefore projects usually span years or even decades, and it is often
diffi cult to assess annual progress. NASA reviews defi ciencies reported in the annual performance plan and tracks
the progress of remedial actions taken to correct these shortcomings.
The following table presents FY 2005 Annual Performance Goals (APGs) that were rated Yellow or Red, the plans
and schedules to correct the goal as presented in the FY 2005 Performance Improvement Plan, and the results of
FY 2006 follow-up actions. Further information on on-going projects is included in Part 2: Detailed Performance
Data.
Ob
jective
Perfor-
mance
Measure Description Rating
Explanation/
description of where a
performance goal
was not met
Why the goal
was not met
Plans and schedules
for achieving the goal
2 APG
5MEP4
Successfully complete
the Preliminary Mis-
sion System Review
(PMSR) for the 2009
Mars Science Labora-
tory (MSL) Mission.
Yello
w
NASA postponed the
Preliminary Mission System
Review (PMSR) for the 2009
Mars Science Laboratory.
NASA decided to delay in order
to complete independent cost
estimates prior to the review. The
mission schedule allowed for this
delay with no impact.
The PMSR currently is
scheduled for December
2005, with no impact to
the mission launch date.
FY 2006 Follow-up
NASA completed the Preliminary Mission System Review (PMSR) on December 7-9, 2005. The delay did not impact the mission launch date.
2 APG
5MEP11
Successfully dem-
onstrate progress
in investigating the
character and extent
of prebiotic chemistry
on Mars. Progress
towards achieving out-
comes will be validated
by external review.
Yello
w
The external expert review
determined that NASA did
not demonstrate suffi cient
progress in investigating the
character and extent of pre-
biotic chemistry on Mars.
The external expert review deter-
mined that NASA did not demon-
strate suffi cient progress due to
a lack of currently operating fl ight
missions designed to address this
Outcome.
As noted by the external
review, the Mars Science
Laboratory, scheduled
for launch in 2009, will
address this Outcome.
FY 2006 Follow-up
As noted in the external review, the Mars Science Laboratory will address this Outcome. Launch is scheduled for fall 2009.
2
APG
5MEP14
Successfully dem-
onstrate progress
in inventorying and
characterizing Martian
resources of poten-
tial benefi t to human
exploration of Mars.
Progress towards
achieving outcomes
will be validated by
external review.
Yello
w
The external expert review
determined that NASA did
not demonstrate suffi cient
progress toward achieving
this APG.
The external expert review deter-
mined that NASA did not make
suffi cient progress due to a lack of
currently operating fl ight missions
designed to address this Outcome.
As noted by the external
review, the Mars Re-
connaissance Or-
biter, launched in August
2005, will address this
Outcome.
FY 2006 Follow-up
As noted in the external review, Mars Reconnaissance Orbiter (MRO) will address this science Outcome. NASA placed MRO in orbit during FY
2006 and the spacecraft is returning high resolution, low-altitude images to Earth.
Appendix B: FY 2005 Performance Improvement Plan Follow-up
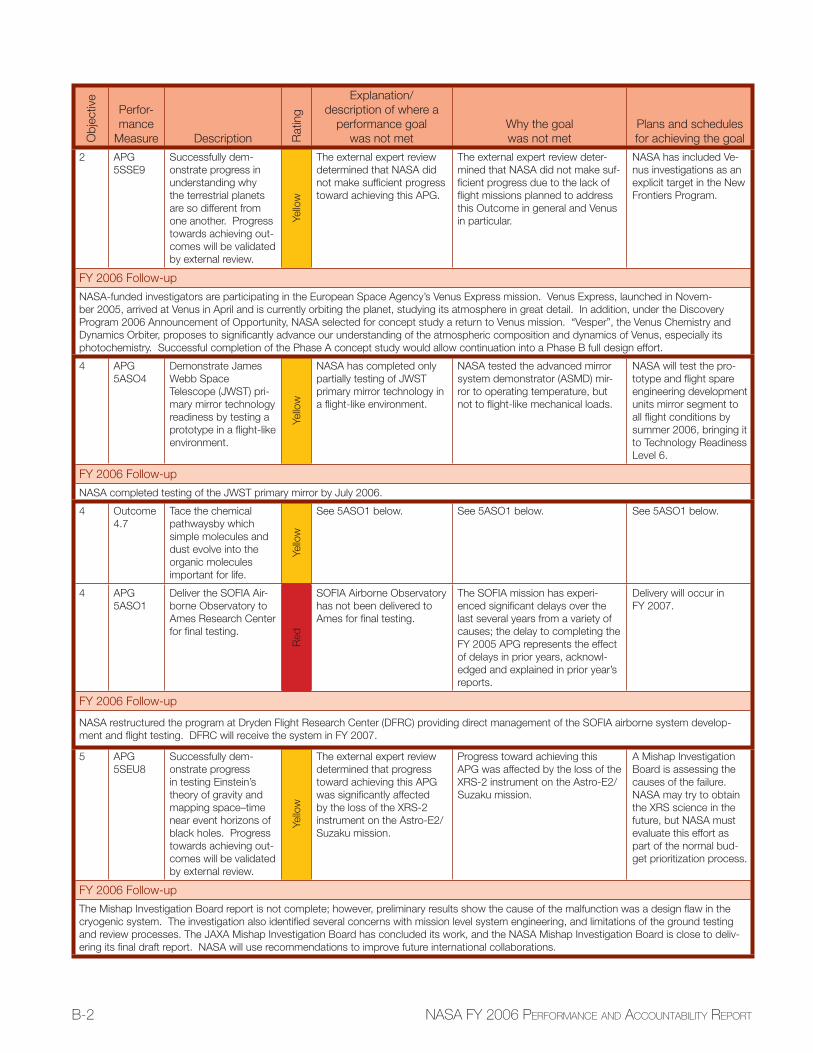
B-2 NASA FY 2006 PERFORMANCE AND ACCOUNTABILITY REPORT
Ob
jective
Perfor-
mance
Measure Description Rating
Explanation/
description of where a
performance goal
was not met
Why the goal
was not met
Plans and schedules
for achieving the goal
2 APG
5SSE9
Successfully dem-
onstrate progress in
understanding why
the terrestrial planets
are so different from
one another. Progress
towards achieving out-
comes will be validated
by external review.
Yello
w
The external expert review
determined that NASA did
not make suffi cient progress
toward achieving this APG.
The external expert review deter-
mined that NASA did not make suf-
fi cient progress due to the lack of
fl ight missions planned to address
this Outcome in general and Venus
in particular.
NASA has included Ve-
nus investigations as an
explicit target in the New
Frontiers Program.
FY 2006 Follow-up
NASA-funded investigators are participating in the European Space Agency’s Venus Express mission. Venus Express, launched in Novem-
ber 2005, arrived at Venus in April and is currently orbiting the planet, studying its atmosphere in great detail. In addition, under the Discovery
Program 2006 Announcement of Opportunity, NASA selected for concept study a return to Venus mission. “Vesper”, the Venus Chemistry and
Dynamics Orbiter, proposes to signifi cantly advance our understanding of the atmospheric composition and dynamics of Venus, especially its
photochemistry. Successful completion of the Phase A concept study would allow continuation into a Phase B full design effort.
4 APG
5ASO4
Demonstrate James
Webb Space
Telescope (JWST) pri-
mary mirror technology
readiness by testing a
prototype in a fl ight-like
environment.
Yello
w
NASA has completed only
partially testing of JWST
primary mirror technology in
a fl ight-like environment.
NASA tested the advanced mirror
system demonstrator (ASMD) mir-
ror to operating temperature, but
not to fl ight-like mechanical loads.
NASA will test the pro-
totype and fl ight spare
engineering development
units mirror segment to
all fl ight conditions by
summer 2006, bringing it
to Technology Readiness
Level 6.
FY 2006 Follow-up
NASA completed testing of the JWST primary mirror by July 2006.
4 Outcome
4.7
Tace the chemical
pathwaysby which
simple molecules and
dust evolve into the
organic molecules
important for life.
Yello
w
See 5ASO1 below. See 5ASO1 below. See 5ASO1 below.
4 APG
5ASO1
Deliver the SOFIA Air-
borne Observatory to
Ames Research Center
for fi nal testing.
Red
SOFIA Airborne Observatory
has not been delivered to
Ames for fi nal testing.
The SOFIA mission has experi-
enced signifi cant delays over the
last several years from a variety of
causes; the delay to completing the
FY 2005 APG represents the effect
of delays in prior years, acknowl-
edged and explained in prior year’s
reports.
Delivery will occur in
FY 2007.
FY 2006 Follow-up
NASA restructured the program at Dryden Flight Research Center (DFRC) providing direct management of the SOFIA airborne system develop-
ment and fl ight testing. DFRC will receive the system in FY 2007.
5 APG
5SEU8
Successfully dem-
onstrate progress
in testing Einstein’s
theory of gravity and
mapping space–time
near event horizons of
black holes. Progress
towards achieving out-
comes will be validated
by external review.
Yello
w
The external expert review
determined that progress
toward achieving this APG
was signifi cantly affected
by the loss of the XRS-2
instrument on the Astro-E2/
Suzaku mission.
Progress toward achieving this
APG was affected by the loss of the
XRS-2 instrument on the Astro-E2/
Suzaku mission.
A Mishap Investigation
Board is assessing the
causes of the failure.
NASA may try to obtain
the XRS science in the
future, but NASA must
evaluate this effort as
part of the normal bud-
get prioritization process.
FY 2006 Follow-up
The Mishap Investigation Board report is not complete; however, preliminary results show the cause of the malfunction was a design fl aw in the
cryogenic system. The investigation also identifi ed several concerns with mission level system engineering, and limitations of the ground testing
and review processes. The JAXA Mishap Investigation Board has concluded its work, and the NASA Mishap Investigation Board is close to deliv-
ering its fi nal draft report. NASA will use recommendations to improve future international collaborations.
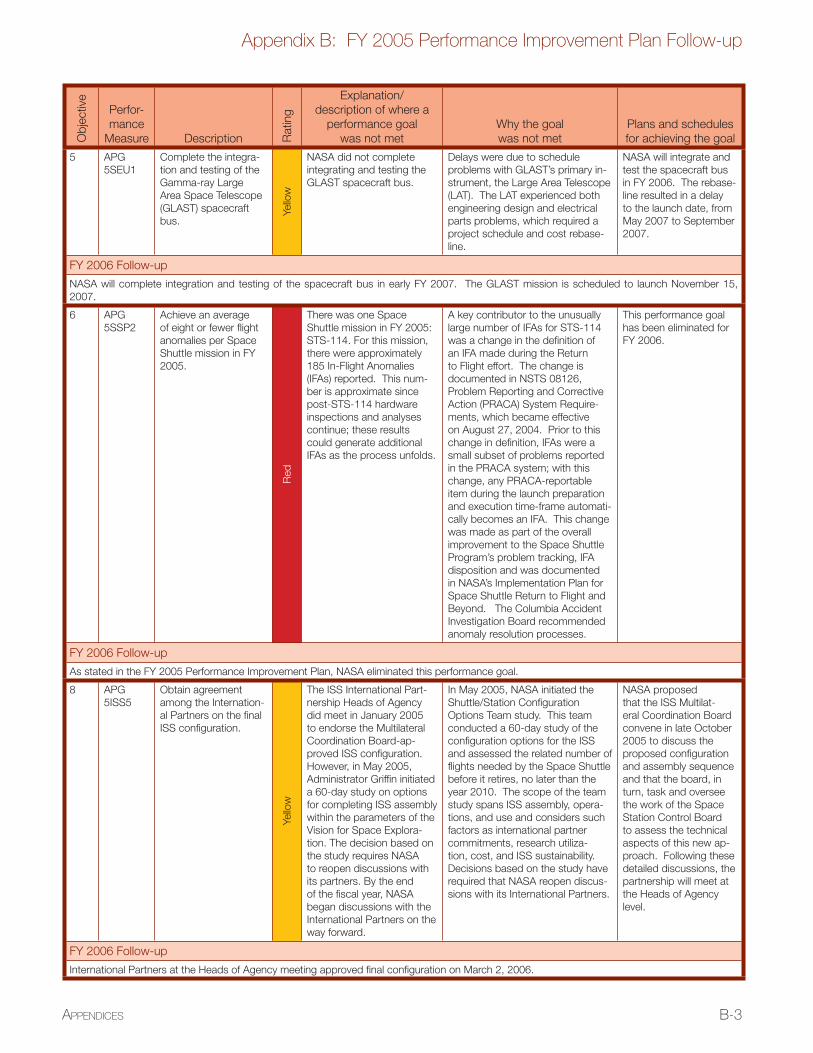
B-3
Appendix B: FY 2005 Performance Improvement Plan Follow-up
APPENDICES
Ob
jective
Perfor-
mance
Measure Description Rating
Explanation/
description of where a
performance goal
was not met
Why the goal
was not met
Plans and schedules
for achieving the goal
5 APG
5SEU1
Complete the integra-
tion and testing of the
Gamma-ray Large
Area Space Telescope
(GLAST) spacecraft
bus.
Yello
w
NASA did not complete
integrating and testing the
GLAST spacecraft bus.
Delays were due to schedule
problems with GLAST’s primary in-
strument, the Large Area Telescope
(LAT). The LAT experienced both
engineering design and electrical
parts problems, which required a
project schedule and cost rebase-
line.
NASA will integrate and
test the spacecraft bus
in FY 2006. The rebase-
line resulted in a delay
to the launch date, from
May 2007 to September
2007.
FY 2006 Follow-up
NASA will complete integration and testing of the spacecraft bus in early FY 2007. The GLAST mission is scheduled to launch November 15,
2007.
6 APG
5SSP2
Achieve an average
of eight or fewer fl ight
anomalies per Space
Shuttle mission in FY
2005.
Red
There was one Space
Shuttle mission in FY 2005:
STS-114. For this mission,
there were approximately
185 In-Flight Anomalies
(IFAs) reported. This num-
ber is approximate since
post-STS-114 hardware
inspections and analyses
continue; these results
could generate additional
IFAs as the process unfolds.
A key contributor to the unusually
large number of IFAs for STS-114
was a change in the defi nition of
an IFA made during the Return
to Flight effort. The change is
documented in NSTS 08126,
Problem Reporting and Corrective
Action (PRACA) System Require-
ments, which became effective
on August 27, 2004. Prior to this
change in defi nition, IFAs were a
small subset of problems reported
in the PRACA system; with this
change, any PRACA-reportable
item during the launch preparation
and execution time-frame automati-
cally becomes an IFA. This change
was made as part of the overall
improvement to the Space Shuttle
Program’s problem tracking, IFA
disposition and was documented
in NASA’s Implementation Plan for
Space Shuttle Return to Flight and
Beyond. The Columbia Accident
Investigation Board recommended
anomaly resolution processes.
This performance goal
has been eliminated for
FY 2006.
FY 2006 Follow-up
As stated in the FY 2005 Performance Improvement Plan, NASA eliminated this performance goal.
8 APG
5ISS5
Obtain agreement
among the Internation-
al Partners on the fi nal
ISS confi guration.
Yello
w
The ISS International Part-
nership Heads of Agency
did meet in January 2005
to endorse the Multilateral
Coordination Board-ap-
proved ISS confi guration.
However, in May 2005,
Administrator Griffi n initiated
a 60-day study on options
for completing ISS assembly
within the parameters of the
Vision for Space Explora-
tion. The decision based on
the study requires NASA
to reopen discussions with
its partners. By the end
of the fi scal year, NASA
began discussions with the
International Partners on the
way forward.
In May 2005, NASA initiated the
Shuttle/Station Confi guration
Options Team study. This team
conducted a 60-day study of the
confi guration options for the ISS
and assessed the related number of
fl ights needed by the Space Shuttle
before it retires, no later than the
year 2010. The scope of the team
study spans ISS assembly, opera-
tions, and use and considers such
factors as international partner
commitments, research utiliza-
tion, cost, and ISS sustainability.
Decisions based on the study have
required that NASA reopen discus-
sions with its International Partners.
NASA proposed
that the ISS Multilat-
eral Coordination Board
convene in late October
2005 to discuss the
proposed confi guration
and assembly sequence
and that the board, in
turn, task and oversee
the work of the Space
Station Control Board
to assess the technical
aspects of this new ap-
proach. Following these
detailed discussions, the
partnership will meet at
the Heads of Agency
level.
FY 2006 Follow-up
International Partners at the Heads of Agency meeting approved fi nal confi guration on March 2, 2006.
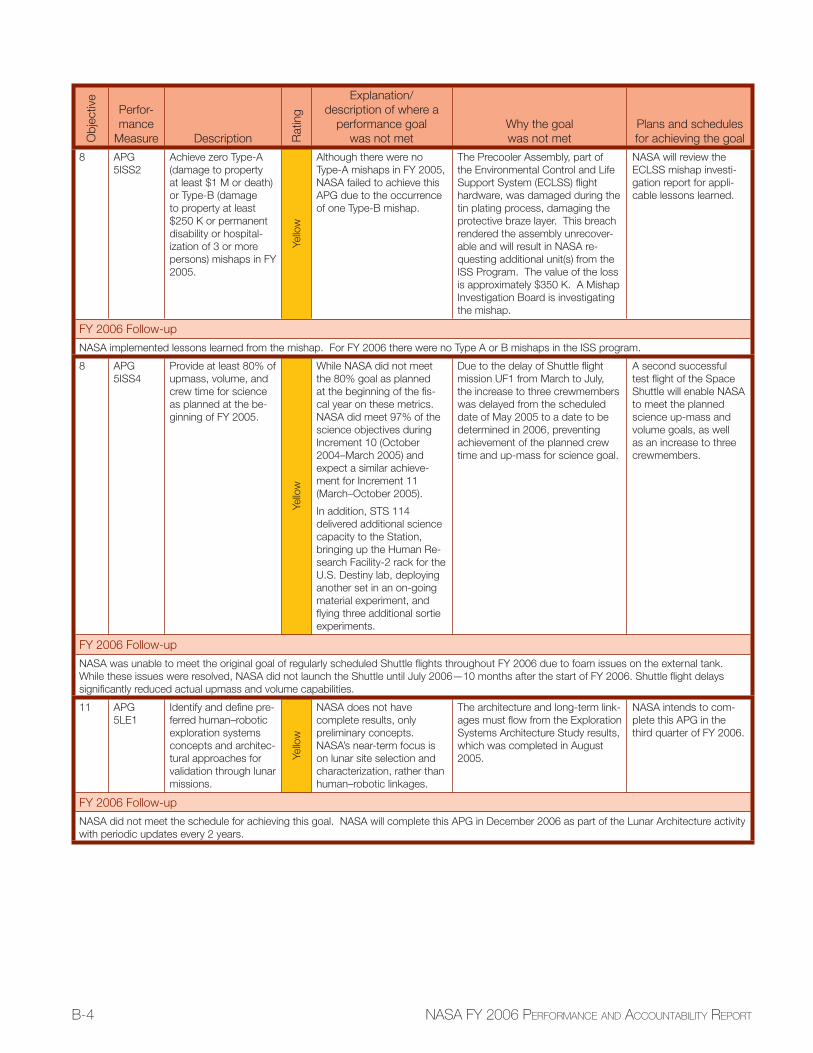
B-4 NASA FY 2006 PERFORMANCE AND ACCOUNTABILITY REPORT
Ob
jective
Perfor-
mance
Measure Description Rating
Explanation/
description of where a
performance goal
was not met
Why the goal
was not met
Plans and schedules
for achieving the goal
8 APG
5ISS2
Achieve zero Type-A
(damage to property
at least $1 M or death)
or Type-B (damage
to property at least
$250 K or permanent
disability or hospital-
ization of 3 or more
persons) mishaps in FY
2005.
Yello
w
Although there were no
Type-A mishaps in FY 2005,
NASA failed to achieve this
APG due to the occurrence
of one Type-B mishap.
The Precooler Assembly, part of
the Environmental Control and Life
Support System (ECLSS) fl ight
hardware, was damaged during the
tin plating process, damaging the
protective braze layer. This breach
rendered the assembly unrecover-
able and will result in NASA re-
questing additional unit(s) from the
ISS Program. The value of the loss
is approximately $350 K. A Mishap
Investigation Board is investigating
the mishap.
NASA will review the
ECLSS mishap investi-
gation report for appli-
cable lessons learned.
FY 2006 Follow-up
NASA implemented lessons learned from the mishap. For FY 2006 there were no Type A or B mishaps in the ISS program.
8 APG
5ISS4
Provide at least 80% of
upmass, volume, and
crew time for science
as planned at the be-
ginning of FY 2005.
Yello
w
While NASA did not meet
the 80% goal as planned
at the beginning of the fi s-
cal year on these metrics.
NASA did meet 97% of the
science objectives during
Increment 10 (October
2004–March 2005) and
expect a similar achieve-
ment for Increment 11
(March–October 2005).
In addition, STS 114
delivered additional science
capacity to the Station,
bringing up the Human Re-
search Facility-2 rack for the
U.S. Destiny lab, deploying
another set in an on-going
material experiment, and
fl ying three additional sortie
experiments.
Due to the delay of Shuttle fl ight
mission UF1 from March to July,
the increase to three crewmembers
was delayed from the scheduled
date of May 2005 to a date to be
determined in 2006, preventing
achievement of the planned crew
time and up-mass for science goal.
A second successful
test fl ight of the Space
Shuttle will enable NASA
to meet the planned
science up-mass and
volume goals, as well
as an increase to three
crewmembers.
FY 2006 Follow-up
NASA was unable to meet the original goal of regularly scheduled Shuttle fl ights throughout FY 2006 due to foam issues on the external tank.
While these issues were resolved, NASA did not launch the Shuttle until July 2006—10 months after the start of FY 2006. Shuttle fl ight delays
signifi cantly reduced actual upmass and volume capabilities.
11 APG
5LE1
Identify and defi ne pre-
ferred human–robotic
exploration systems
concepts and architec-
tural approaches for
validation through lunar
missions.
Yello
w
NASA does not have
complete results, only
preliminary concepts.
NASA’s near-term focus is
on lunar site selection and
characterization, rather than
human–robotic linkages.
The architecture and long-term link-
ages must fl ow from the Exploration
Systems Architecture Study results,
which was completed in August
2005.
NASA intends to com-
plete this APG in the
third quarter of FY 2006.
FY 2006 Follow-up
NASA did not meet the schedule for achieving this goal. NASA will complete this APG in December 2006 as part of the Lunar Architecture activity
with periodic updates every 2 years.
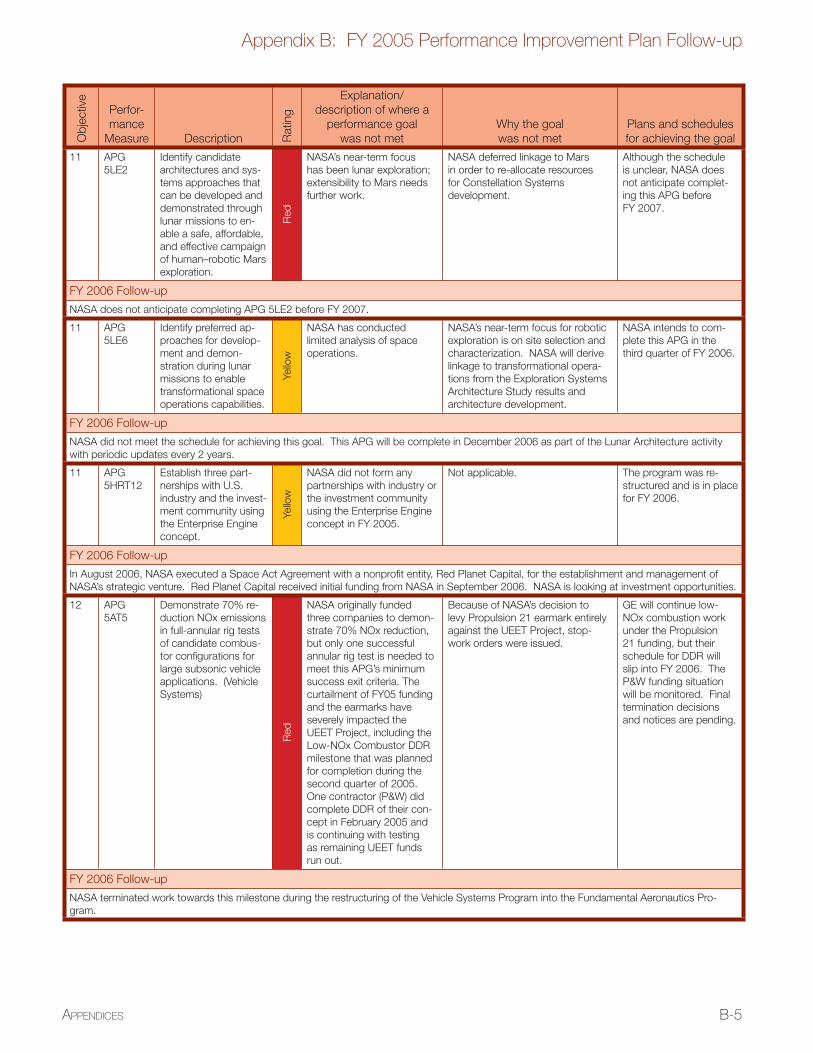
B-5
Appendix B: FY 2005 Performance Improvement Plan Follow-up
APPENDICES
Ob
jective
Perfor-
mance
Measure Description Rating
Explanation/
description of where a
performance goal
was not met
Why the goal
was not met
Plans and schedules
for achieving the goal
11 APG
5LE2
Identify candidate
architectures and sys-
tems approaches that
can be developed and
demonstrated through
lunar missions to en-
able a safe, affordable,
and effective campaign
of human–robotic Mars
exploration.
Red
NASA’s near-term focus
has been lunar exploration;
extensibility to Mars needs
further work.
NASA deferred linkage to Mars
in order to re-allocate resources
for Constellation Systems
development.
Although the schedule
is unclear, NASA does
not anticipate complet-
ing this APG before
FY 2007.
FY 2006 Follow-up
NASA does not anticipate completing APG 5LE2 before FY 2007.
11 APG
5LE6
Identify preferred ap-
proaches for develop-
ment and demon-
stration during lunar
missions to enable
transformational space
operations capabilities.
Yello
w
NASA has conducted
limited analysis of space
operations.
NASA’s near-term focus for robotic
exploration is on site selection and
characterization. NASA will derive
linkage to transformational opera-
tions from the Exploration Systems
Architecture Study results and
architecture development.
NASA intends to com-
plete this APG in the
third quarter of FY 2006.
FY 2006 Follow-up
NASA did not meet the schedule for achieving this goal. This APG will be complete in December 2006 as part of the Lunar Architecture activity
with periodic updates every 2 years.
11 APG
5HRT12
Establish three part-
nerships with U.S.
industry and the invest-
ment community using
the Enterprise Engine
concept.
Yello
w
NASA did not form any
partnerships with industry or
the investment community
using the Enterprise Engine
concept in FY 2005.
Not applicable. The program was re-
structured and is in place
for FY 2006.
FY 2006 Follow-up
In August 2006, NASA executed a Space Act Agreement with a nonprofi t entity, Red Planet Capital, for the establishment and management of
NASA’s strategic venture. Red Planet Capital received initial funding from NASA in September 2006. NASA is looking at investment opportunities.
12 APG
5AT5
Demonstrate 70% re-
duction NOx emissions
in full-annular rig tests
of candidate combus-
tor confi gurations for
large subsonic vehicle
applications. (Vehicle
Systems)
Red
NASA originally funded
three companies to demon-
strate 70% NOx reduction,
but only one successful
annular rig test is needed to
meet this APG’s minimum
success exit criteria. The
curtailment of FY05 funding
and the earmarks have
severely impacted the
UEET Project, including the
Low-NOx Combustor DDR
milestone that was planned
for completion during the
second quarter of 2005.
One contractor (P&W) did
complete DDR of their con-
cept in February 2005 and
is continuing with testing
as remaining UEET funds
run out.
Because of NASA’s decision to
levy Propulsion 21 earmark entirely
against the UEET Project, stop-
work orders were issued.
GE will continue low-
NOx combustion work
under the Propulsion
21 funding, but their
schedule for DDR will
slip into FY 2006. The
P&W funding situation
will be monitored. Final
termination decisions
and notices are pending.
FY 2006 Follow-up
NASA terminated work towards this milestone during the restructuring of the Vehicle Systems Program into the Fundamental Aeronautics Pro-
gram.
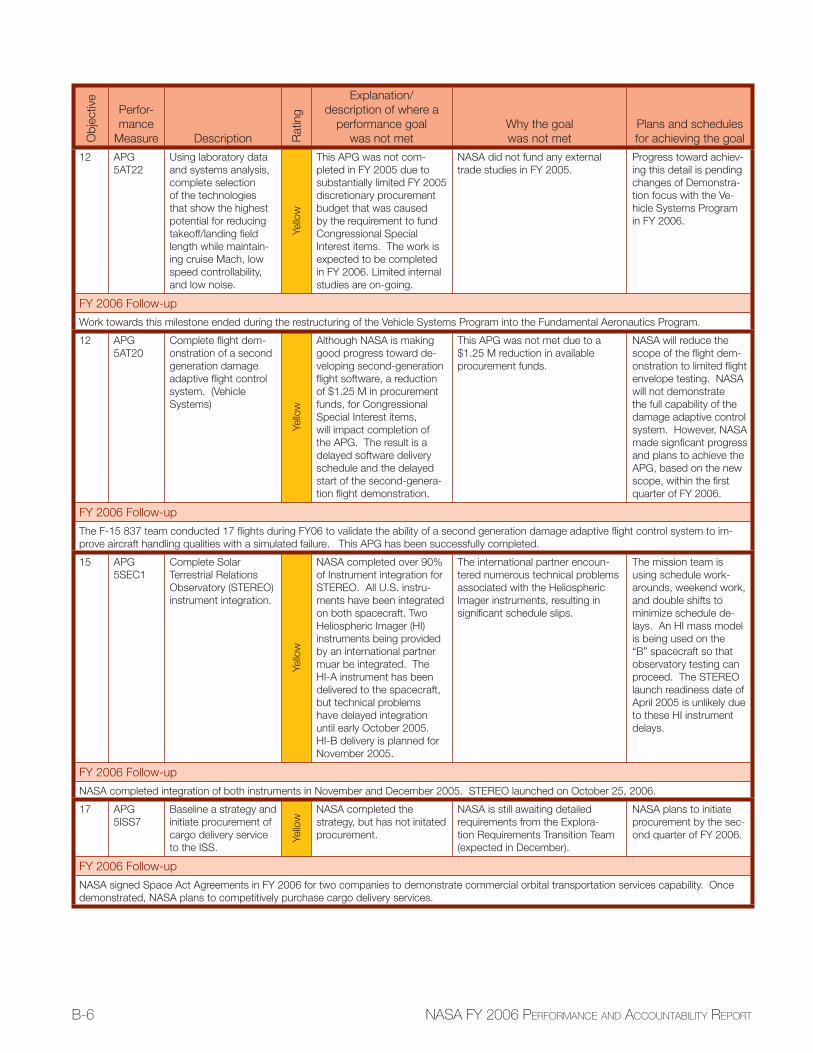
B-6 NASA FY 2006 PERFORMANCE AND ACCOUNTABILITY REPORT
Ob
jective
Perfor-
mance
Measure Description Rating
Explanation/
description of where a
performance goal
was not met
Why the goal
was not met
Plans and schedules
for achieving the goal
12 APG
5AT22
Using laboratory data
and systems analysis,
complete selection
of the technologies
that show the highest
potential for reducing
takeoff/landing fi eld
length while maintain-
ing cruise Mach, low
speed controllability,
and low noise.Yello
w
This APG was not com-
pleted in FY 2005 due to
substantially limited FY 2005
discretionary procurement
budget that was caused
by the requirement to fund
Congressional Special
Interest items. The work is
expected to be completed
in FY 2006. Limited internal
studies are on-going.
NASA did not fund any external
trade studies in FY 2005.
Progress toward achiev-
ing this detail is pending
changes of Demonstra-
tion focus with the Ve-
hicle Systems Program
in FY 2006.
FY 2006 Follow-up
Work towards this milestone ended during the restructuring of the Vehicle Systems Program into the Fundamental Aeronautics Program.
12 APG
5AT20
Complete fl ight dem-
onstration of a second
generation damage
adaptive fl ight control
system. (Vehicle
Systems)
Yello
w
Although NASA is making
good progress toward de-
veloping second-generation
fl ight software, a reduction
of $1.25 M in procurement
funds, for Congressional
Special Interest items,
will impact completion of
the APG. The result is a
delayed software delivery
schedule and the delayed
start of the second-genera-
tion fl ight demonstration.
This APG was not met due to a
$1.25 M reduction in available
procurement funds.
NASA will reduce the
scope of the fl ight dem-
onstration to limited fl ight
envelope testing. NASA
will not demonstrate
the full capability of the
damage adaptive control
system. However, NASA
made signfi cant progress
and plans to achieve the
APG, based on the new
scope, within the fi rst
quarter of FY 2006.
FY 2006 Follow-up
The F-15 837 team conducted 17 fl ights during FY06 to validate the ability of a second generation damage adaptive fl ight control system to im-
prove aircraft handling qualities with a simulated failure. This APG has been successfully completed.
15 APG
5SEC1
Complete Solar
Terrestrial Relations
Observatory (STEREO)
instrument integration.
Yello
w
NASA completed over 90%
of Instrument integration for
STEREO. All U.S. instru-
ments have been integrated
on both spacecraft. Two
Heliospheric Imager (HI)
instruments being provided
by an international partner
muar be integrated. The
HI-A instrument has been
delivered to the spacecraft,
but technical problems
have delayed integration
until early October 2005.
HI-B delivery is planned for
November 2005.
The international partner encoun-
tered numerous technical problems
associated with the Heliospheric
Imager instruments, resulting in
signifi cant schedule slips.
The mission team is
using schedule work-
arounds, weekend work,
and double shifts to
minimize schedule de-
lays. An HI mass model
is being used on the
“B” spacecraft so that
observatory testing can
proceed. The STEREO
launch readiness date of
April 2005 is unlikely due
to these HI instrument
delays.
FY 2006 Follow-up
NASA completed integration of both instruments in November and December 2005. STEREO launched on October 25, 2006.
17 APG
5ISS7
Baseline a strategy and
initiate procurement of
cargo delivery service
to the ISS.
Yello
w
NASA completed the
strategy, but has not initated
procurement.
NASA is still awaiting detailed
requirements from the Explora-
tion Requirements Transition Team
(expected in December).
NASA plans to initiate
procurement by the sec-
ond quarter of FY 2006.
FY 2006 Follow-up
NASA signed Space Act Agreements in FY 2006 for two companies to demonstrate commercial orbital transportation services capability. Once
demonstrated, NASA plans to competitively purchase cargo delivery services.
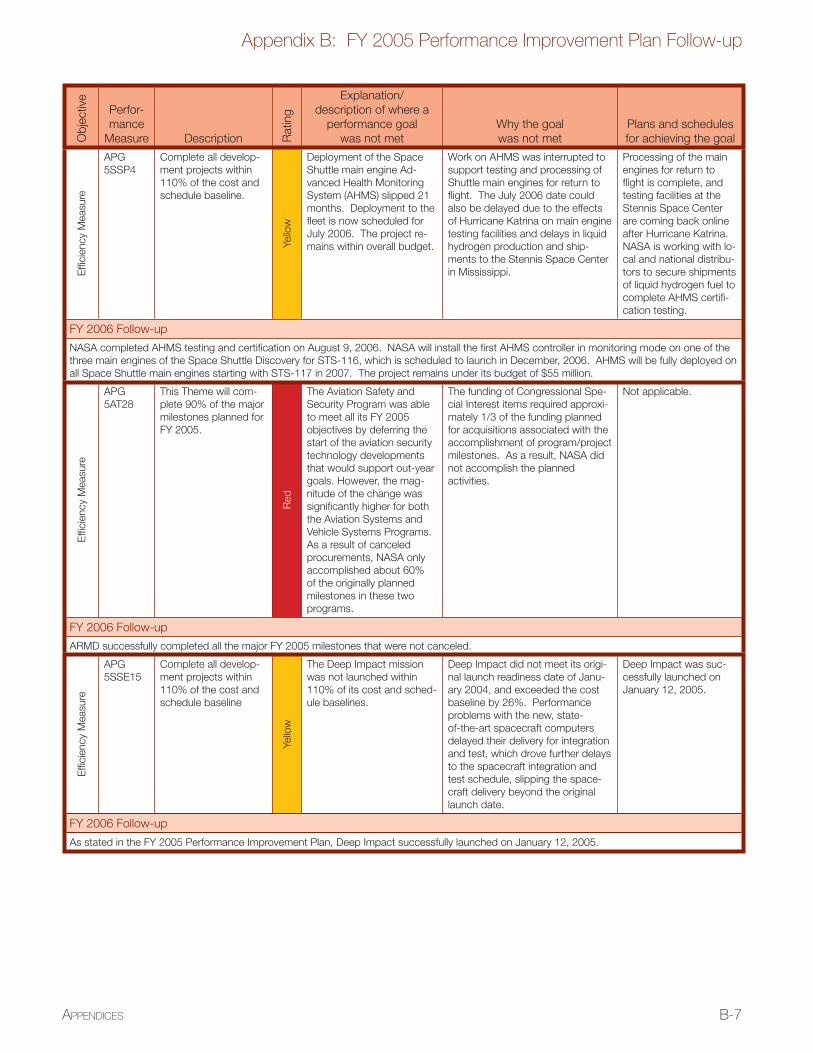
B-7
Appendix B: FY 2005 Performance Improvement Plan Follow-up
APPENDICES
Ob
jective
Perfor-
mance
Measure Description Rating
Explanation/
description of where a
performance goal
was not met
Why the goal
was not met
Plans and schedules
for achieving the goal
Effi
cie
ncy
Measure
APG
5SSP4
Complete all develop-
ment projects within
110% of the cost and
schedule baseline.
Yello
w
Deployment of the Space
Shuttle main engine Ad-
vanced Health Monitoring
System (AHMS) slipped 21
months. Deployment to the
fl eet is now scheduled for
July 2006. The project re-
mains within overall budget.
Work on AHMS was interrupted to
support testing and processing of
Shuttle main engines for return to
fl ight. The July 2006 date could
also be delayed due to the effects
of Hurricane Katrina on main engine
testing facilities and delays in liquid
hydrogen production and ship-
ments to the Stennis Space Center
in Mississippi.
Processing of the main
engines for return to
fl ight is complete, and
testing facilities at the
Stennis Space Center
are coming back online
after Hurricane Katrina.
NASA is working with lo-
cal and national distribu-
tors to secure shipments
of liquid hydrogen fuel to
complete AHMS certifi -
cation testing.
FY 2006 Follow-up
NASA completed AHMS testing and certifi cation on August 9, 2006. NASA will install the fi rst AHMS controller in monitoring mode on one of the
three main engines of the Space Shuttle Discovery for STS-116, which is scheduled to launch in December, 2006. AHMS will be fully deployed on
all Space Shuttle main engines starting with STS-117 in 2007. The project remains under its budget of $55 million.
Effi
cie
ncy
Measure
APG
5AT28
This Theme will com-
plete 90% of the major
milestones planned for
FY 2005.
Red
The Aviation Safety and
Security Program was able
to meet all its FY 2005
objectives by deferring the
start of the aviation security
technology developments
that would support out-year
goals. However, the mag-
nitude of the change was
signifi cantly higher for both
the Aviation Systems and
Vehicle Systems Programs.
As a result of canceled
procurements, NASA only
accomplished about 60%
of the originally planned
milestones in these two
programs.
The funding of Congressional Spe-
cial Interest items required approxi-
mately 1/3 of the funding planned
for acquisitions associated with the
accomplishment of program/project
milestones. As a result, NASA did
not accomplish the planned
activities.
Not applicable.
FY 2006 Follow-up
ARMD successfully completed all the major FY 2005 milestones that were not canceled.
Effi
cie
ncy
Measure
APG
5SSE15
Complete all develop-
ment projects within
110% of the cost and
schedule baseline
Yello
w
The Deep Impact mission
was not launched within
110% of its cost and sched-
ule baselines.
Deep Impact did not meet its origi-
nal launch readiness date of Janu-
ary 2004, and exceeded the cost
baseline by 26%. Performance
problems with the new, state-
of-the-art spacecraft computers
delayed their delivery for integration
and test, which drove further delays
to the spacecraft integration and
test schedule, slipping the space-
craft delivery beyond the original
launch date.
Deep Impact was suc-
cessfully launched on
January 12, 2005.
FY 2006 Follow-up
As stated in the FY 2005 Performance Improvement Plan, Deep Impact successfully launched on January 12, 2005.
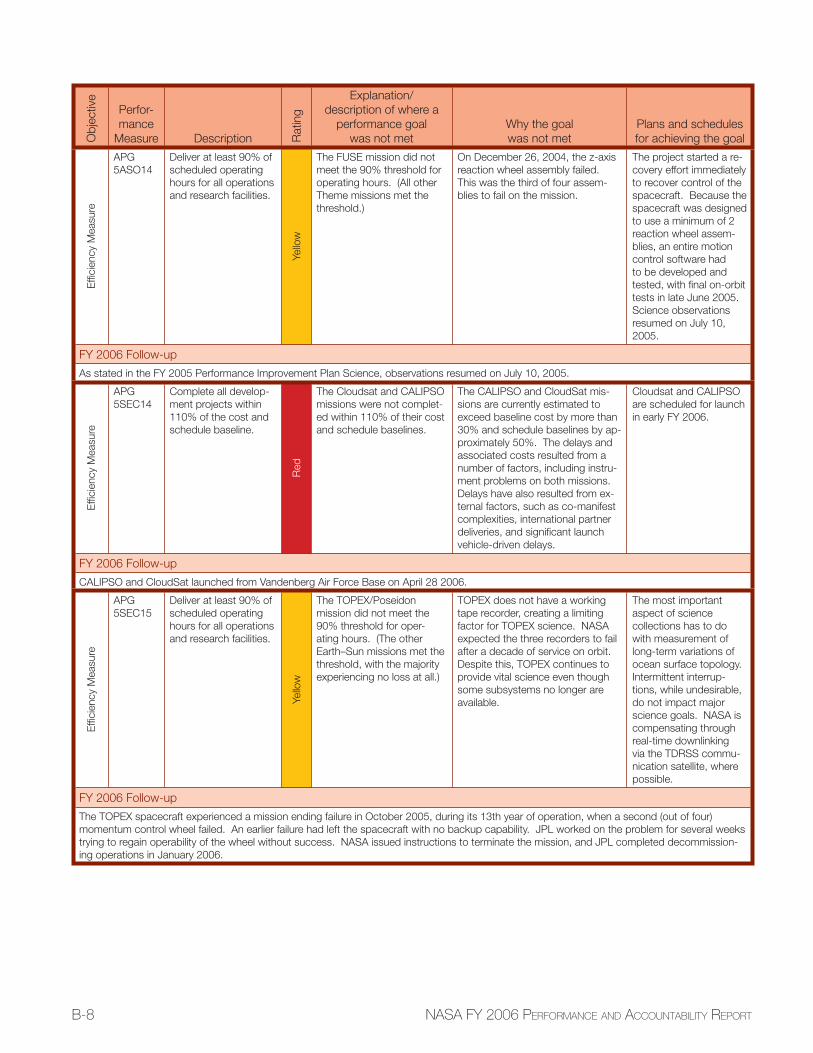
B-8 NASA FY 2006 PERFORMANCE AND ACCOUNTABILITY REPORT
Ob
jective
Perfor-
mance
Measure Description Rating
Explanation/
description of where a
performance goal
was not met
Why the goal
was not met
Plans and schedules
for achieving the goal
Effi
cie
ncy
Measure
APG
5ASO14
Deliver at least 90% of
scheduled operating
hours for all operations
and research facilities.
Yello
w
The FUSE mission did not
meet the 90% threshold for
operating hours. (All other
Theme missions met the
threshold.)
On December 26, 2004, the z-axis
reaction wheel assembly failed.
This was the third of four assem-
blies to fail on the mission.
The project started a re-
covery effort immediately
to recover control of the
spacecraft. Because the
spacecraft was designed
to use a minimum of 2
reaction wheel assem-
blies, an entire motion
control software had
to be developed and
tested, with fi nal on-orbit
tests in late June 2005.
Science observations
resumed on July 10,
2005.
FY 2006 Follow-up
As stated in the FY 2005 Performance Improvement Plan Science, observations resumed on July 10, 2005.
Effi
cie
ncy
Measure
APG
5SEC14
Complete all develop-
ment projects within
110% of the cost and
schedule baseline.
Red
The Cloudsat and CALIPSO
missions were not complet-
ed within 110% of their cost
and schedule baselines.
The CALIPSO and CloudSat mis-
sions are currently estimated to
exceed baseline cost by more than
30% and schedule baselines by ap-
proximately 50%. The delays and
associated costs resulted from a
number of factors, including instru-
ment problems on both missions.
Delays have also resulted from ex-
ternal factors, such as co-manifest
complexities, international partner
deliveries, and signifi cant launch
vehicle-driven delays.
Cloudsat and CALIPSO
are scheduled for launch
in early FY 2006.
FY 2006 Follow-up
CALIPSO and CloudSat launched from Vandenberg Air Force Base on April 28 2006.
Effi
cie
ncy
Measure
APG
5SEC15
Deliver at least 90% of
scheduled operating
hours for all operations
and research facilities.
Yello
w
The TOPEX/Poseidon
mission did not meet the
90% threshold for oper-
ating hours. (The other
Earth–Sun missions met the
threshold, with the majority
experiencing no loss at all.)
TOPEX does not have a working
tape recorder, creating a limiting
factor for TOPEX science. NASA
expected the three recorders to fail
after a decade of service on orbit.
Despite this, TOPEX continues to
provide vital science even though
some subsystems no longer are
available.
The most important
aspect of science
collections has to do
with measurement of
long-term variations of
ocean surface topology.
Intermittent interrup-
tions, while undesirable,
do not impact major
science goals. NASA is
compensating through
real-time downlinking
via the TDRSS commu-
nication satellite, where
possible.
FY 2006 Follow-up
The TOPEX spacecraft experienced a mission ending failure in October 2005, during its 13th year of operation, when a second (out of four)
momentum control wheel failed. An earlier failure had left the spacecraft with no backup capability. JPL worked on the problem for several weeks
trying to regain operability of the wheel without success. NASA issued instructions to terminate the mission, and JPL completed decommission-
ing operations in January 2006.
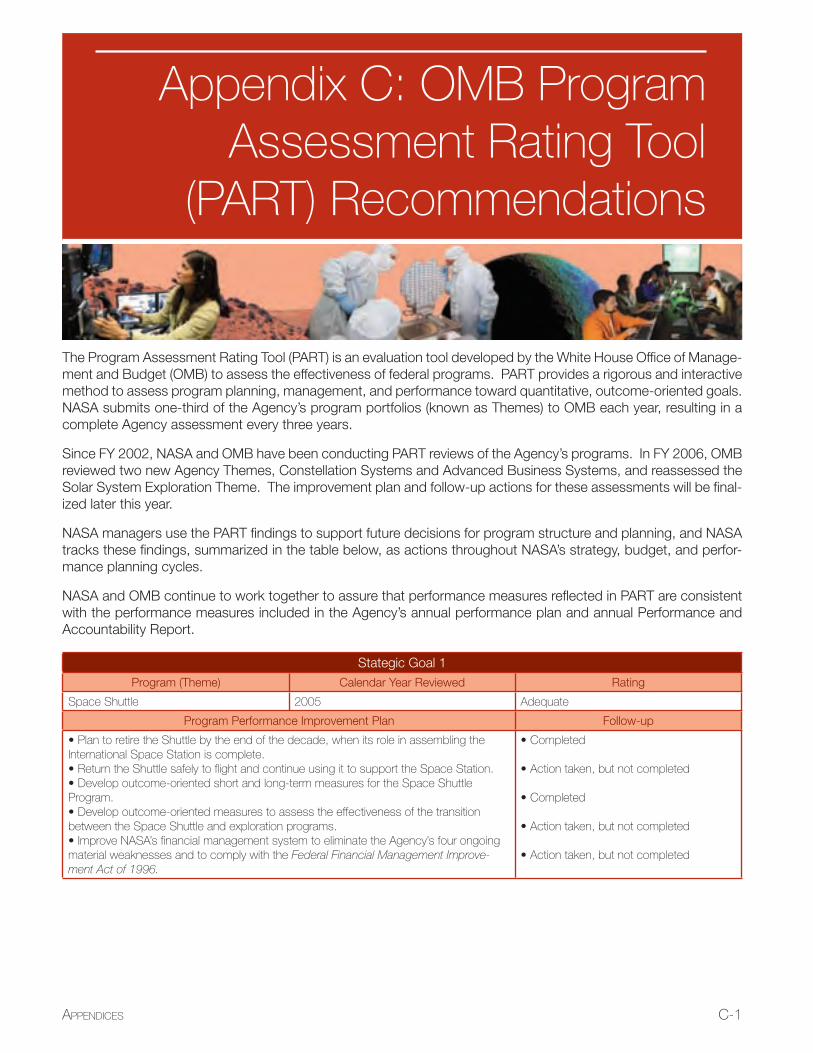
APPENDICES C-1
The Program Assessment Rating Tool (PART) is an evaluation tool developed by the White House Offi ce of Manage-
ment and Budget (OMB) to assess the effectiveness of federal programs. PART provides a rigorous and interactive
method to assess program planning, management, and performance toward quantitative, outcome-oriented goals.
NASA submits one-third of the Agency’s program portfolios (known as Themes) to OMB each year, resulting in a
complete Agency assessment every three years.
Since FY 2002, NASA and OMB have been conducting PART reviews of the Agency’s programs. In FY 2006, OMB
reviewed two new Agency Themes, Constellation Systems and Advanced Business Systems, and reassessed the
Solar System Exploration Theme. The improvement plan and follow-up actions for these assessments will be fi nal-
ized later this year.
NASA managers use the PART fi ndings to support future decisions for program structure and planning, and NASA
tracks these fi ndings, summarized in the table below, as actions throughout NASA’s strategy, budget, and perfor-
mance planning cycles.
NASA and OMB continue to work together to assure that performance measures refl ected in PART are consistent
with the performance measures included in the Agency’s annual performance plan and annual Performance and
Accountability Report.
Stategic Goal 1
Program (Theme) Calendar Year Reviewed Rating
Space Shuttle 2005 Adequate
Program Performance Improvement Plan Follow-up
Plan to retire the Shuttle by the end of the decade, when its role in assembling the International Space Station is complete.
Return the Shuttle safely to fl ight and continue using it to support the Space Station.Develop outcome-oriented short and long-term measures for the Space Shuttle
Program.Develop outcome-oriented measures to assess the effectiveness of the transition
between the Space Shuttle and exploration programs.Improve NASA’s fi nancial management system to eliminate the Agency’s four ongoing
material weaknesses and to comply with the Federal Financial Management Improve-ment Act of 1996.
•
••
•
•
Completed
Action taken, but not completed
Completed
Action taken, but not completed
Action taken, but not completed
•
•
•
•
•
Appendix C: OMB Program Assessment Rating Tool
(PART) Recommendations
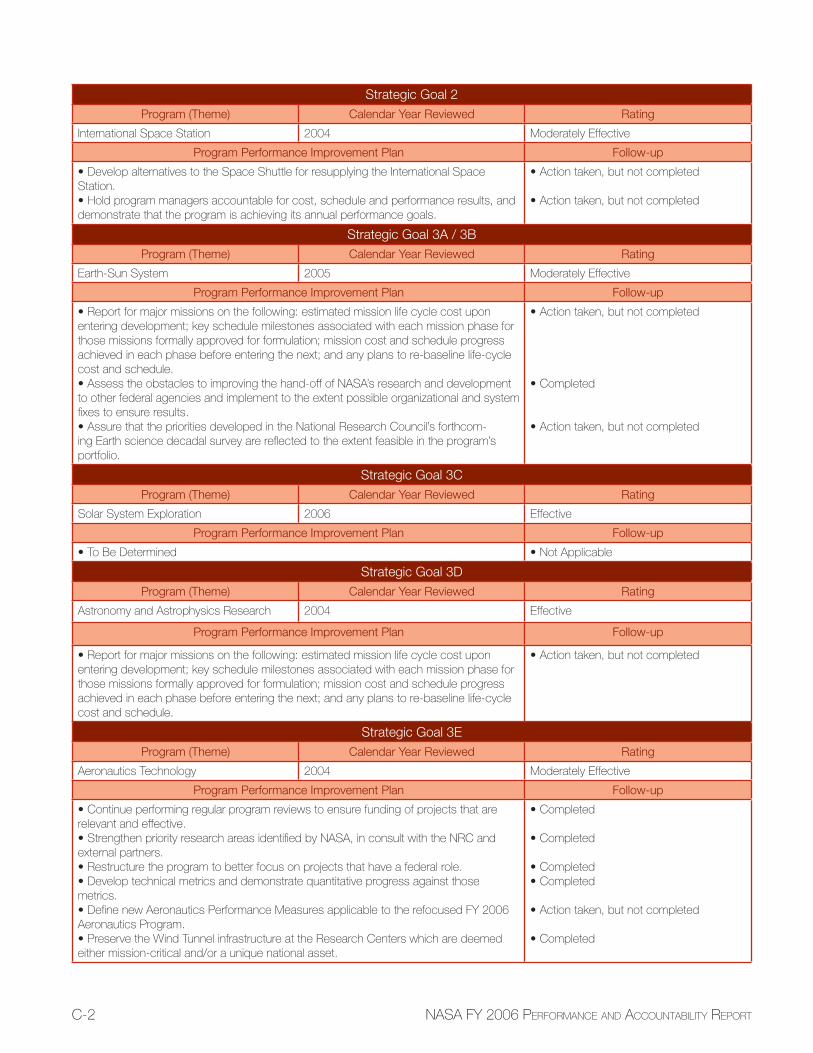
C-2 NASA FY 2006 PERFORMANCE AND ACCOUNTABILITY REPORT
Strategic Goal 2
Program (Theme) Calendar Year Reviewed Rating
International Space Station 2004 Moderately Effective
Program Performance Improvement Plan Follow-up
Develop alternatives to the Space Shuttle for resupplying the International Space Station.
Hold program managers accountable for cost, schedule and performance results, and demonstrate that the program is achieving its annual performance goals.
•
•
Action taken, but not completed
Action taken, but not completed
•
•
Strategic Goal 3A / 3B
Program (Theme) Calendar Year Reviewed Rating
Earth-Sun System 2005 Moderately Effective
Program Performance Improvement Plan Follow-up
Report for major missions on the following: estimated mission life cycle cost upon entering development; key schedule milestones associated with each mission phase for those missions formally approved for formulation; mission cost and schedule progress achieved in each phase before entering the next; and any plans to re-baseline life-cycle cost and schedule.
Assess the obstacles to improving the hand-off of NASA’s research and development to other federal agencies and implement to the extent possible organizational and system fi xes to ensure results.
Assure that the priorities developed in the National Research Council’s forthcom-ing Earth science decadal survey are refl ected to the extent feasible in the program’s portfolio.
•
•
•
Action taken, but not completed
Completed
Action taken, but not completed
•
•
•
Strategic Goal 3C
Program (Theme) Calendar Year Reviewed Rating
Solar System Exploration 2006 Effective
Program Performance Improvement Plan Follow-up
To Be Determined• Not Applicable•
Strategic Goal 3D
Program (Theme) Calendar Year Reviewed Rating
Astronomy and Astrophysics Research 2004 Effective
Program Performance Improvement Plan Follow-up
Report for major missions on the following: estimated mission life cycle cost upon entering development; key schedule milestones associated with each mission phase for those missions formally approved for formulation; mission cost and schedule progress achieved in each phase before entering the next; and any plans to re-baseline life-cycle cost and schedule.
• Action taken, but not completed•
Strategic Goal 3E
Program (Theme) Calendar Year Reviewed Rating
Aeronautics Technology 2004 Moderately Effective
Program Performance Improvement Plan Follow-up
Continue performing regular program reviews to ensure funding of projects that are relevant and effective.
Strengthen priority research areas identifi ed by NASA, in consult with the NRC and external partners.
Restructure the program to better focus on projects that have a federal role.Develop technical metrics and demonstrate quantitative progress against those
metrics.Defi ne new Aeronautics Performance Measures applicable to the refocused FY 2006
Aeronautics Program.Preserve the Wind Tunnel infrastructure at the Research Centers which are deemed
either mission-critical and/or a unique national asset.
•
•
••
•
•
Completed
Completed
Completed Completed
Action taken, but not completed
Completed
•
•
••
•
•
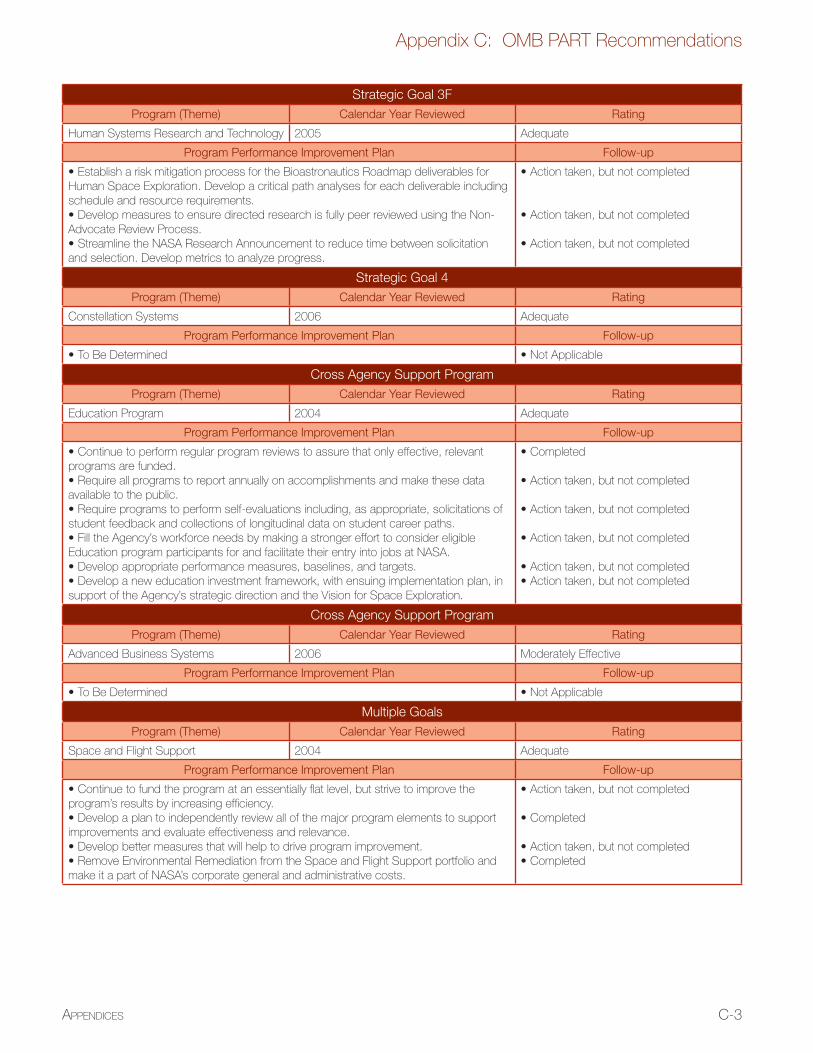
C-3
Appendix C: OMB PART Recommendations
APPENDICES
Strategic Goal 3F
Program (Theme) Calendar Year Reviewed Rating
Human Systems Research and Technology 2005 Adequate
Program Performance Improvement Plan Follow-up
Establish a risk mitigation process for the Bioastronautics Roadmap deliverables for Human Space Exploration. Develop a critical path analyses for each deliverable including schedule and resource requirements.
Develop measures to ensure directed research is fully peer reviewed using the Non-Advocate Review Process.
Streamline the NASA Research Announcement to reduce time between solicitation and selection. Develop metrics to analyze progress.
•
•
•
Action taken, but not completed
Action taken, but not completed
Action taken, but not completed
•
•
•
Strategic Goal 4
Program (Theme) Calendar Year Reviewed Rating
Constellation Systems 2006 Adequate
Program Performance Improvement Plan Follow-up
To Be Determined• Not Applicable•
Cross Agency Support Program
Program (Theme) Calendar Year Reviewed Rating
Education Program 2004 Adequate
Program Performance Improvement Plan Follow-up
Continue to perform regular program reviews to assure that only effective, relevant programs are funded.
Require all programs to report annually on accomplishments and make these data available to the public.
Require programs to perform self-evaluations including, as appropriate, solicitations of student feedback and collections of longitudinal data on student career paths.
Fill the Agency’s workforce needs by making a stronger effort to consider eligible Education program participants for and facilitate their entry into jobs at NASA.
Develop appropriate performance measures, baselines, and targets.Develop a new education investment framework, with ensuing implementation plan, in
support of the Agency’s strategic direction and the Vision for Space Exploration.
•
•
•
•
••
Completed
Action taken, but not completed
Action taken, but not completed
Action taken, but not completed
Action taken, but not completedAction taken, but not completed
•
•
•
•
••
Cross Agency Support Program
Program (Theme) Calendar Year Reviewed Rating
Advanced Business Systems 2006 Moderately Effective
Program Performance Improvement Plan Follow-up
To Be Determined• Not Applicable•
Multiple Goals
Program (Theme) Calendar Year Reviewed Rating
Space and Flight Support 2004 Adequate
Program Performance Improvement Plan Follow-up
Continue to fund the program at an essentially fl at level, but strive to improve the program’s results by increasing effi ciency.
Develop a plan to independently review all of the major program elements to support improvements and evaluate effectiveness and relevance.
Develop better measures that will help to drive program improvement.Remove Environmental Remediation from the Space and Flight Support portfolio and
make it a part of NASA’s corporate general and administrative costs.
•
•
••
Action taken, but not completed
Completed
Action taken, but not completedCompleted
•
•
••

C-4 NASA FY 2006 PERFORMANCE AND ACCOUNTABILITY REPORT
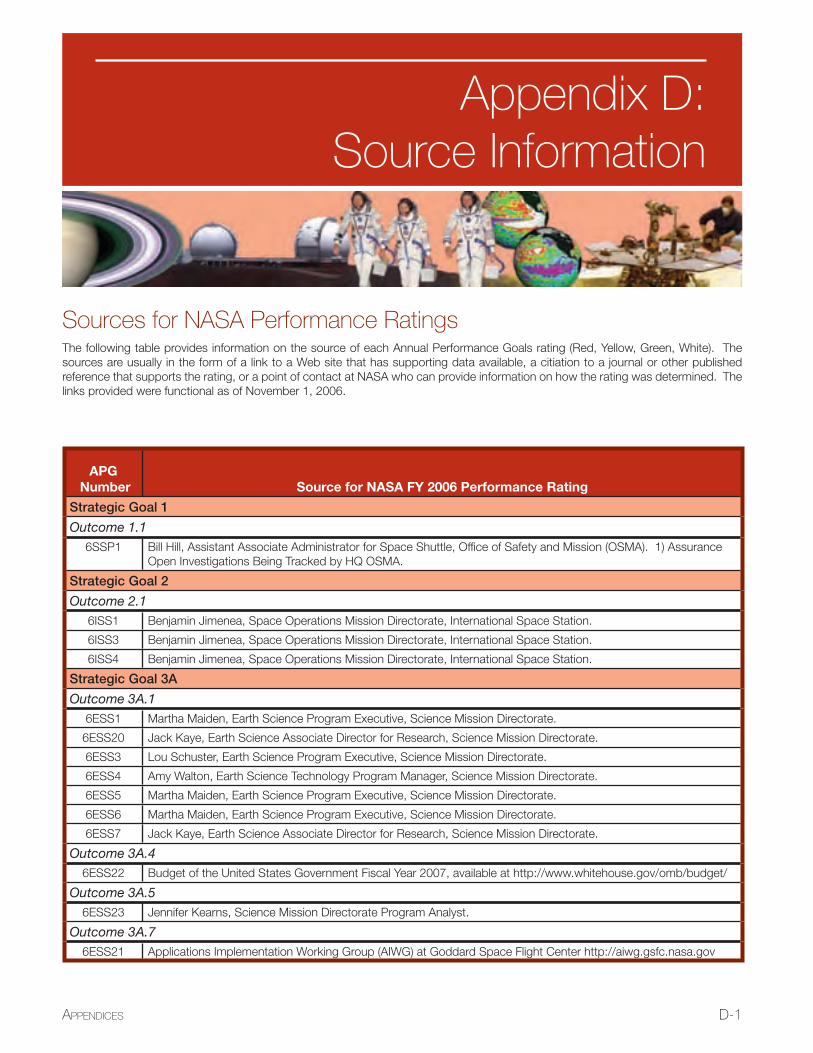
APPENDICES D-1
Sources for NASA Performance RatingsThe following table provides information on the source of each Annual Performance Goals rating (Red, Yellow, Green, White). The
sources are usually in the form of a link to a Web site that has supporting data available, a citiation to a journal or other published
reference that supports the rating, or a point of contact at NASA who can provide information on how the rating was determined. The
links provided were functional as of November 1, 2006.
Appendix D:Source Information
APG Number Source for NASA FY 2006 Performance Rating
Strategic Goal 1
Outcome 1.1
6SSP1 Bill Hill, Assistant Associate Administrator for Space Shuttle, Office of Safety and Mission (OSMA). 1) Assurance
Open Investigations Being Tracked by HQ OSMA.
Strategic Goal 2
Outcome 2.1
6ISS1 Benjamin Jimenea, Space Operations Mission Directorate, International Space Station.
6ISS3 Benjamin Jimenea, Space Operations Mission Directorate, International Space Station.
6ISS4 Benjamin Jimenea, Space Operations Mission Directorate, International Space Station.
Strategic Goal 3A
Outcome 3A.1
6ESS1 Martha Maiden, Earth Science Program Executive, Science Mission Directorate.
6ESS20 Jack Kaye, Earth Science Associate Director for Research, Science Mission Directorate.
6ESS3 Lou Schuster, Earth Science Program Executive, Science Mission Directorate.
6ESS4 Amy Walton, Earth Science Technology Program Manager, Science Mission Directorate.
6ESS5 Martha Maiden, Earth Science Program Executive, Science Mission Directorate.
6ESS6 Martha Maiden, Earth Science Program Executive, Science Mission Directorate.
6ESS7 Jack Kaye, Earth Science Associate Director for Research, Science Mission Directorate.
Outcome 3A.4
6ESS22 Budget of the United States Government Fiscal Year 2007, available at http://www.whitehouse.gov/omb/budget/
Outcome 3A.5
6ESS23 Jennifer Kearns, Science Mission Directorate Program Analyst.
Outcome 3A.7
6ESS21 Applications Implementation Working Group (AIWG) at Goddard Space Flight Center http://aiwg.gsfc.nasa.gov
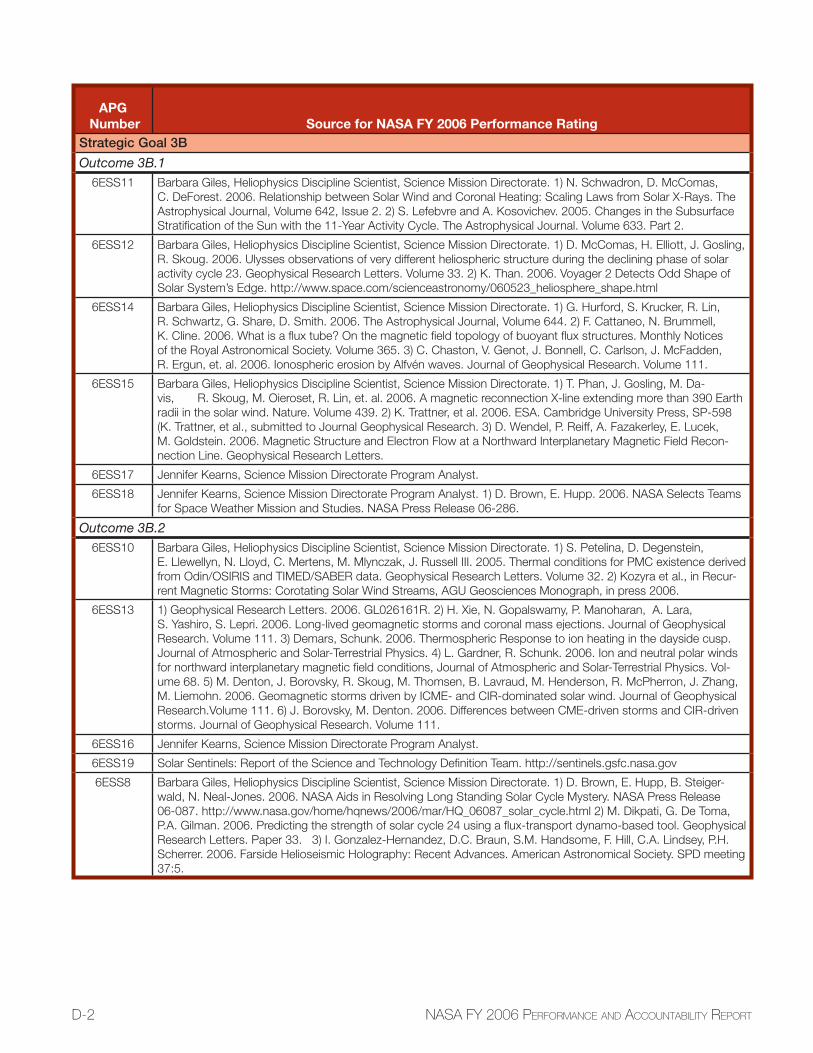
D-2 NASA FY 2006 PERFORMANCE AND ACCOUNTABILITY REPORT
APG Number Source for NASA FY 2006 Performance Rating
Strategic Goal 3B
Outcome 3B.1
6ESS11 Barbara Giles, Heliophysics Discipline Scientist, Science Mission Directorate. 1) N. Schwadron, D. McComas,
C. DeForest. 2006. Relationship between Solar Wind and Coronal Heating: Scaling Laws from Solar X-Rays. The
Astrophysical Journal, Volume 642, Issue 2. 2) S. Lefebvre and A. Kosovichev. 2005. Changes in the Subsurface
Stratification of the Sun with the 11-Year Activity Cycle. The Astrophysical Journal. Volume 633. Part 2.
6ESS12 Barbara Giles, Heliophysics Discipline Scientist, Science Mission Directorate. 1) D. McComas, H. Elliott, J. Gosling,
R. Skoug. 2006. Ulysses observations of very different heliospheric structure during the declining phase of solar
activity cycle 23. Geophysical Research Letters. Volume 33. 2) K. Than. 2006. Voyager 2 Detects Odd Shape of
Solar System’s Edge. http://www.space.com/scienceastronomy/060523_heliosphere_shape.html
6ESS14 Barbara Giles, Heliophysics Discipline Scientist, Science Mission Directorate. 1) G. Hurford, S. Krucker, R. Lin,
R. Schwartz, G. Share, D. Smith. 2006. The Astrophysical Journal, Volume 644. 2) F. Cattaneo, N. Brummell,
K. Cline. 2006. What is a flux tube? On the magnetic field topology of buoyant flux structures. Monthly Notices
of the Royal Astronomical Society. Volume 365. 3) C. Chaston, V. Genot, J. Bonnell, C. Carlson, J. McFadden,
R. Ergun, et. al. 2006. Ionospheric erosion by Alfvén waves. Journal of Geophysical Research. Volume 111.
6ESS15 Barbara Giles, Heliophysics Discipline Scientist, Science Mission Directorate. 1) T. Phan, J. Gosling, M. Da-
vis, R. Skoug, M. Oieroset, R. Lin, et. al. 2006. A magnetic reconnection X-line extending more than 390 Earth
radii in the solar wind. Nature. Volume 439. 2) K. Trattner, et al. 2006. ESA. Cambridge University Press, SP-598
(K. Trattner, et al., submitted to Journal Geophysical Research. 3) D. Wendel, P. Reiff, A. Fazakerley, E. Lucek,
M. Goldstein. 2006. Magnetic Structure and Electron Flow at a Northward Interplanetary Magnetic Field Recon-
nection Line. Geophysical Research Letters.
6ESS17 Jennifer Kearns, Science Mission Directorate Program Analyst.
6ESS18 Jennifer Kearns, Science Mission Directorate Program Analyst. 1) D. Brown, E. Hupp. 2006. NASA Selects Teams
for Space Weather Mission and Studies. NASA Press Release 06-286.
Outcome 3B.2
6ESS10 Barbara Giles, Heliophysics Discipline Scientist, Science Mission Directorate. 1) S. Petelina, D. Degenstein,
E. Llewellyn, N. Lloyd, C. Mertens, M. Mlynczak, J. Russell III. 2005. Thermal conditions for PMC existence derived
from Odin/OSIRIS and TIMED/SABER data. Geophysical Research Letters. Volume 32. 2) Kozyra et al., in Recur-
rent Magnetic Storms: Corotating Solar Wind Streams, AGU Geosciences Monograph, in press 2006.
6ESS13 1) Geophysical Research Letters. 2006. GL026161R. 2) H. Xie, N. Gopalswamy, P. Manoharan, A. Lara,
S. Yashiro, S. Lepri. 2006. Long-lived geomagnetic storms and coronal mass ejections. Journal of Geophysical
Research. Volume 111. 3) Demars, Schunk. 2006. Thermospheric Response to ion heating in the dayside cusp.
Journal of Atmospheric and Solar-Terrestrial Physics. 4) L. Gardner, R. Schunk. 2006. Ion and neutral polar winds
for northward interplanetary magnetic field conditions, Journal of Atmospheric and Solar-Terrestrial Physics. Vol-
ume 68. 5) M. Denton, J. Borovsky, R. Skoug, M. Thomsen, B. Lavraud, M. Henderson, R. McPherron, J. Zhang,
M. Liemohn. 2006. Geomagnetic storms driven by ICME- and CIR-dominated solar wind. Journal of Geophysical
Research.Volume 111. 6) J. Borovsky, M. Denton. 2006. Differences between CME-driven storms and CIR-driven
storms. Journal of Geophysical Research. Volume 111.
6ESS16 Jennifer Kearns, Science Mission Directorate Program Analyst.
6ESS19 Solar Sentinels: Report of the Science and Technology Definition Team. http://sentinels.gsfc.nasa.gov
6ESS8 Barbara Giles, Heliophysics Discipline Scientist, Science Mission Directorate. 1) D. Brown, E. Hupp, B. Steiger-
wald, N. Neal-Jones. 2006. NASA Aids in Resolving Long Standing Solar Cycle Mystery. NASA Press Release
06-087. http://www.nasa.gov/home/hqnews/2006/mar/HQ_06087_solar_cycle.html 2) M. Dikpati, G. De Toma,
P.A. Gilman. 2006. Predicting the strength of solar cycle 24 using a flux-transport dynamo-based tool. Geophysical
Research Letters. Paper 33. 3) I. Gonzalez-Hernandez, D.C. Braun, S.M. Handsome, F. Hill, C.A. Lindsey, P.H.
Scherrer. 2006. Farside Helioseismic Holography: Recent Advances. American Astronomical Society. SPD meeting
37:5.
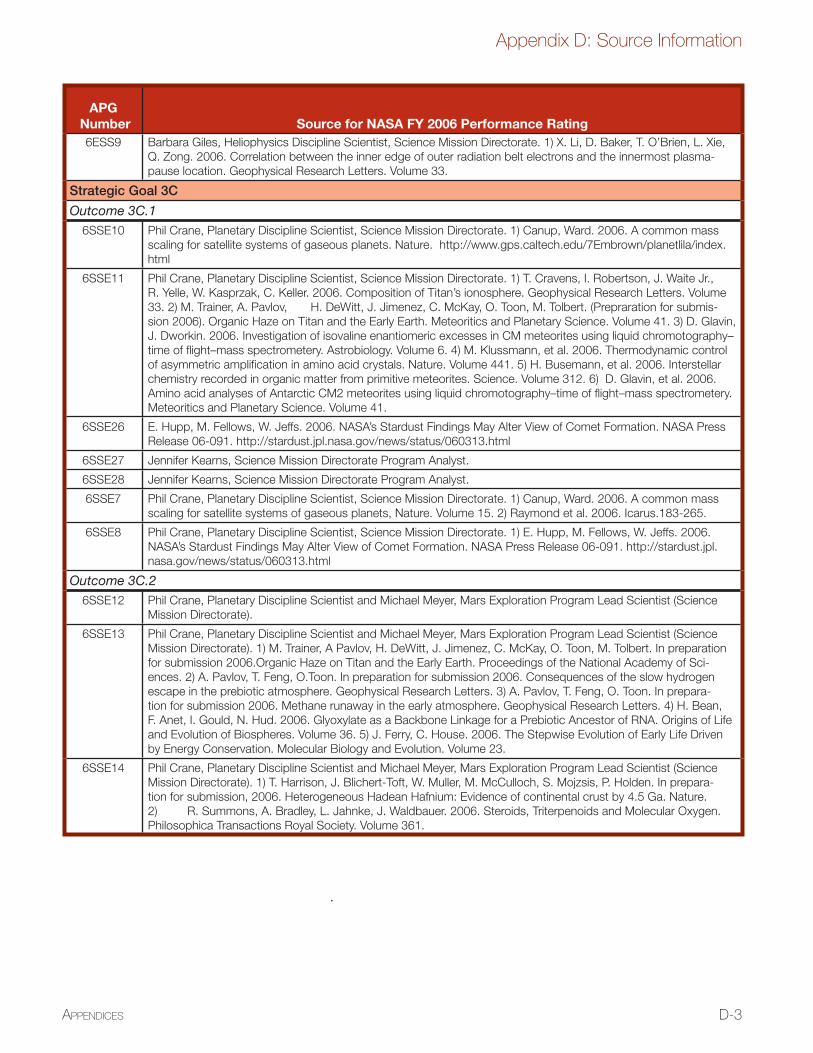
D-3
Appendix D: Source Information
APPENDICES
APG Number Source for NASA FY 2006 Performance Rating
6ESS9 Barbara Giles, Heliophysics Discipline Scientist, Science Mission Directorate. 1) X. Li, D. Baker, T. O’Brien, L. Xie,
Q. Zong. 2006. Correlation between the inner edge of outer radiation belt electrons and the innermost plasma-
pause location. Geophysical Research Letters. Volume 33.
Strategic Goal 3C
Outcome 3C.1
6SSE10 Phil Crane, Planetary Discipline Scientist, Science Mission Directorate. 1) Canup, Ward. 2006. A common mass
scaling for satellite systems of gaseous planets. Nature. http://www.gps.caltech.edu/7Embrown/planetlila/index.
html
6SSE11 Phil Crane, Planetary Discipline Scientist, Science Mission Directorate. 1) T. Cravens, I. Robertson, J. Waite Jr.,
R. Yelle, W. Kasprzak, C. Keller. 2006. Composition of Titan’s ionosphere. Geophysical Research Letters. Volume
33. 2) M. Trainer, A. Pavlov, H. DeWitt, J. Jimenez, C. McKay, O. Toon, M. Tolbert. (Prepraration for submis-
sion 2006). Organic Haze on Titan and the Early Earth. Meteoritics and Planetary Science. Volume 41. 3) D. Glavin,
J. Dworkin. 2006. Investigation of isovaline enantiomeric excesses in CM meteorites using liquid chromotography–
time of flight–mass spectrometery. Astrobiology. Volume 6. 4) M. Klussmann, et al. 2006. Thermodynamic control
of asymmetric amplification in amino acid crystals. Nature. Volume 441. 5) H. Busemann, et al. 2006. Interstellar
chemistry recorded in organic matter from primitive meteorites. Science. Volume 312. 6) D. Glavin, et al. 2006.
Amino acid analyses of Antarctic CM2 meteorites using liquid chromotography–time of flight–mass spectrometery.
Meteoritics and Planetary Science. Volume 41.
6SSE26 E. Hupp, M. Fellows, W. Jeffs. 2006. NASA’s Stardust Findings May Alter View of Comet Formation. NASA Press
Release 06-091. http://stardust.jpl.nasa.gov/news/status/060313.html
6SSE27 Jennifer Kearns, Science Mission Directorate Program Analyst.
6SSE28 Jennifer Kearns, Science Mission Directorate Program Analyst.
6SSE7 Phil Crane, Planetary Discipline Scientist, Science Mission Directorate. 1) Canup, Ward. 2006. A common mass
scaling for satellite systems of gaseous planets, Nature. Volume 15. 2) Raymond et al. 2006. Icarus.183-265.
6SSE8 Phil Crane, Planetary Discipline Scientist, Science Mission Directorate. 1) E. Hupp, M. Fellows, W. Jeffs. 2006.
NASA’s Stardust Findings May Alter View of Comet Formation. NASA Press Release 06-091. http://stardust.jpl.
nasa.gov/news/status/060313.html
Outcome 3C.2
6SSE12 Phil Crane, Planetary Discipline Scientist and Michael Meyer, Mars Exploration Program Lead Scientist (Science
Mission Directorate).
6SSE13 Phil Crane, Planetary Discipline Scientist and Michael Meyer, Mars Exploration Program Lead Scientist (Science
Mission Directorate). 1) M. Trainer, A Pavlov, H. DeWitt, J. Jimenez, C. McKay, O. Toon, M. Tolbert. In preparation
for submission 2006.Organic Haze on Titan and the Early Earth. Proceedings of the National Academy of Sci-
ences. 2) A. Pavlov, T. Feng, O.Toon. In preparation for submission 2006. Consequences of the slow hydrogen
escape in the prebiotic atmosphere. Geophysical Research Letters. 3) A. Pavlov, T. Feng, O. Toon. In prepara-
tion for submission 2006. Methane runaway in the early atmosphere. Geophysical Research Letters. 4) H. Bean,
F. Anet, I. Gould, N. Hud. 2006. Glyoxylate as a Backbone Linkage for a Prebiotic Ancestor of RNA. Origins of Life
and Evolution of Biospheres. Volume 36. 5) J. Ferry, C. House. 2006. The Stepwise Evolution of Early Life Driven
by Energy Conservation. Molecular Biology and Evolution. Volume 23.
6SSE14 Phil Crane, Planetary Discipline Scientist and Michael Meyer, Mars Exploration Program Lead Scientist (Science
Mission Directorate). 1) T. Harrison, J. Blichert-Toft, W. Muller, M. McCulloch, S. Mojzsis, P. Holden. In prepara-
tion for submission, 2006. Heterogeneous Hadean Hafnium: Evidence of continental crust by 4.5 Ga. Nature.
2) R. Summons, A. Bradley, L. Jahnke, J. Waldbauer. 2006. Steroids, Triterpenoids and Molecular Oxygen.
Philosophica Transactions Royal Society. Volume 361.
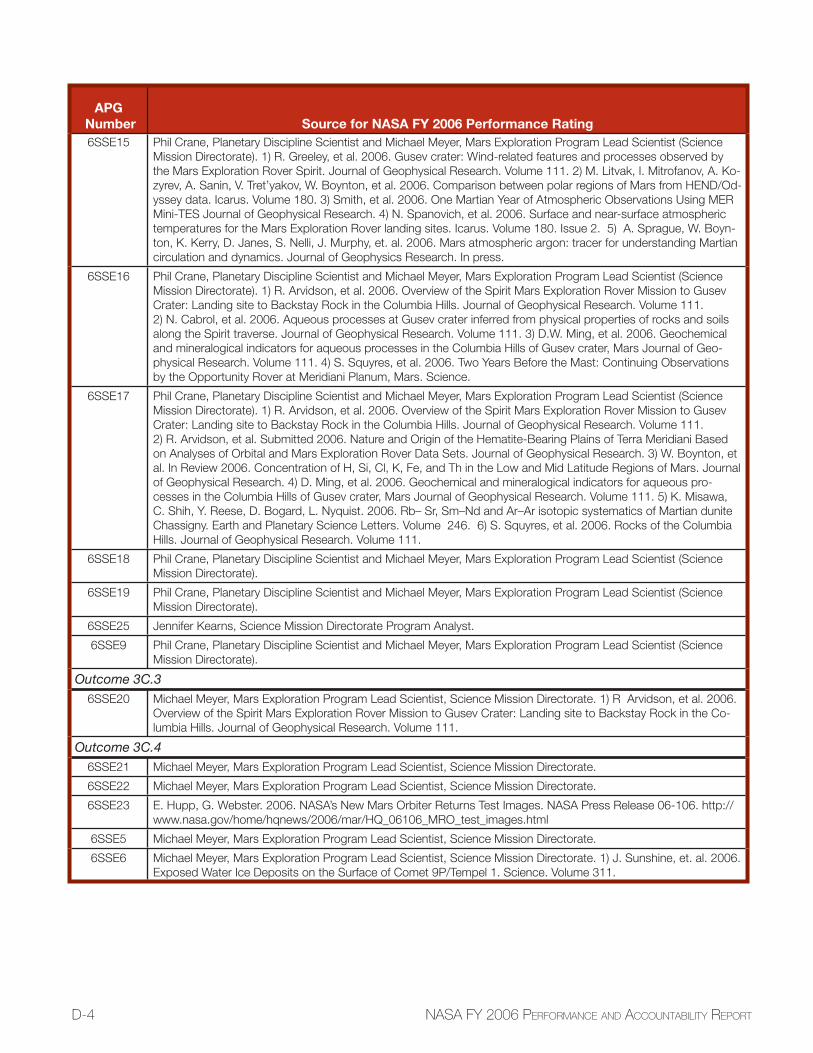
D-4 NASA FY 2006 PERFORMANCE AND ACCOUNTABILITY REPORT
APG Number Source for NASA FY 2006 Performance Rating6SSE15 Phil Crane, Planetary Discipline Scientist and Michael Meyer, Mars Exploration Program Lead Scientist (Science
Mission Directorate). 1) R. Greeley, et al. 2006. Gusev crater: Wind-related features and processes observed by
the Mars Exploration Rover Spirit. Journal of Geophysical Research. Volume 111. 2) M. Litvak, I. Mitrofanov, A. Ko-
zyrev, A. Sanin, V. Tret’yakov, W. Boynton, et al. 2006. Comparison between polar regions of Mars from HEND/Od-
yssey data. Icarus. Volume 180. 3) Smith, et al. 2006. One Martian Year of Atmospheric Observations Using MER
Mini-TES Journal of Geophysical Research. 4) N. Spanovich, et al. 2006. Surface and near-surface atmospheric
temperatures for the Mars Exploration Rover landing sites. Icarus. Volume 180. Issue 2. 5) A. Sprague, W. Boyn-
ton, K. Kerry, D. Janes, S. Nelli, J. Murphy, et. al. 2006. Mars atmospheric argon: tracer for understanding Martian
circulation and dynamics. Journal of Geophysics Research. In press.
6SSE16 Phil Crane, Planetary Discipline Scientist and Michael Meyer, Mars Exploration Program Lead Scientist (Science
Mission Directorate). 1) R. Arvidson, et al. 2006. Overview of the Spirit Mars Exploration Rover Mission to Gusev
Crater: Landing site to Backstay Rock in the Columbia Hills. Journal of Geophysical Research. Volume 111.
2) N. Cabrol, et al. 2006. Aqueous processes at Gusev crater inferred from physical properties of rocks and soils
along the Spirit traverse. Journal of Geophysical Research. Volume 111. 3) D.W. Ming, et al. 2006. Geochemical
and mineralogical indicators for aqueous processes in the Columbia Hills of Gusev crater, Mars Journal of Geo-
physical Research. Volume 111. 4) S. Squyres, et al. 2006. Two Years Before the Mast: Continuing Observations
by the Opportunity Rover at Meridiani Planum, Mars. Science.
6SSE17 Phil Crane, Planetary Discipline Scientist and Michael Meyer, Mars Exploration Program Lead Scientist (Science
Mission Directorate). 1) R. Arvidson, et al. 2006. Overview of the Spirit Mars Exploration Rover Mission to Gusev
Crater: Landing site to Backstay Rock in the Columbia Hills. Journal of Geophysical Research. Volume 111.
2) R. Arvidson, et al. Submitted 2006. Nature and Origin of the Hematite-Bearing Plains of Terra Meridiani Based
on Analyses of Orbital and Mars Exploration Rover Data Sets. Journal of Geophysical Research. 3) W. Boynton, et
al. In Review 2006. Concentration of H, Si, Cl, K, Fe, and Th in the Low and Mid Latitude Regions of Mars. Journal
of Geophysical Research. 4) D. Ming, et al. 2006. Geochemical and mineralogical indicators for aqueous pro-
cesses in the Columbia Hills of Gusev crater, Mars Journal of Geophysical Research. Volume 111. 5) K. Misawa,
C. Shih, Y. Reese, D. Bogard, L. Nyquist. 2006. Rb– Sr, Sm–Nd and Ar–Ar isotopic systematics of Martian dunite
Chassigny. Earth and Planetary Science Letters. Volume 246. 6) S. Squyres, et al. 2006. Rocks of the Columbia
Hills. Journal of Geophysical Research. Volume 111.
6SSE18 Phil Crane, Planetary Discipline Scientist and Michael Meyer, Mars Exploration Program Lead Scientist (Science
Mission Directorate).
6SSE19 Phil Crane, Planetary Discipline Scientist and Michael Meyer, Mars Exploration Program Lead Scientist (Science
Mission Directorate).
6SSE25 Jennifer Kearns, Science Mission Directorate Program Analyst.
6SSE9 Phil Crane, Planetary Discipline Scientist and Michael Meyer, Mars Exploration Program Lead Scientist (Science
Mission Directorate).
Outcome 3C.3
6SSE20 Michael Meyer, Mars Exploration Program Lead Scientist, Science Mission Directorate. 1) R Arvidson, et al. 2006.
Overview of the Spirit Mars Exploration Rover Mission to Gusev Crater: Landing site to Backstay Rock in the Co-
lumbia Hills. Journal of Geophysical Research. Volume 111.
Outcome 3C.4
6SSE21 Michael Meyer, Mars Exploration Program Lead Scientist, Science Mission Directorate.
6SSE22 Michael Meyer, Mars Exploration Program Lead Scientist, Science Mission Directorate.
6SSE23 E. Hupp, G. Webster. 2006. NASA’s New Mars Orbiter Returns Test Images. NASA Press Release 06-106. http://
www.nasa.gov/home/hqnews/2006/mar/HQ_06106_MRO_test_images.html
6SSE5 Michael Meyer, Mars Exploration Program Lead Scientist, Science Mission Directorate.
6SSE6 Michael Meyer, Mars Exploration Program Lead Scientist, Science Mission Directorate. 1) J. Sunshine, et. al. 2006.
Exposed Water Ice Deposits on the Surface of Comet 9P/Tempel 1. Science. Volume 311.
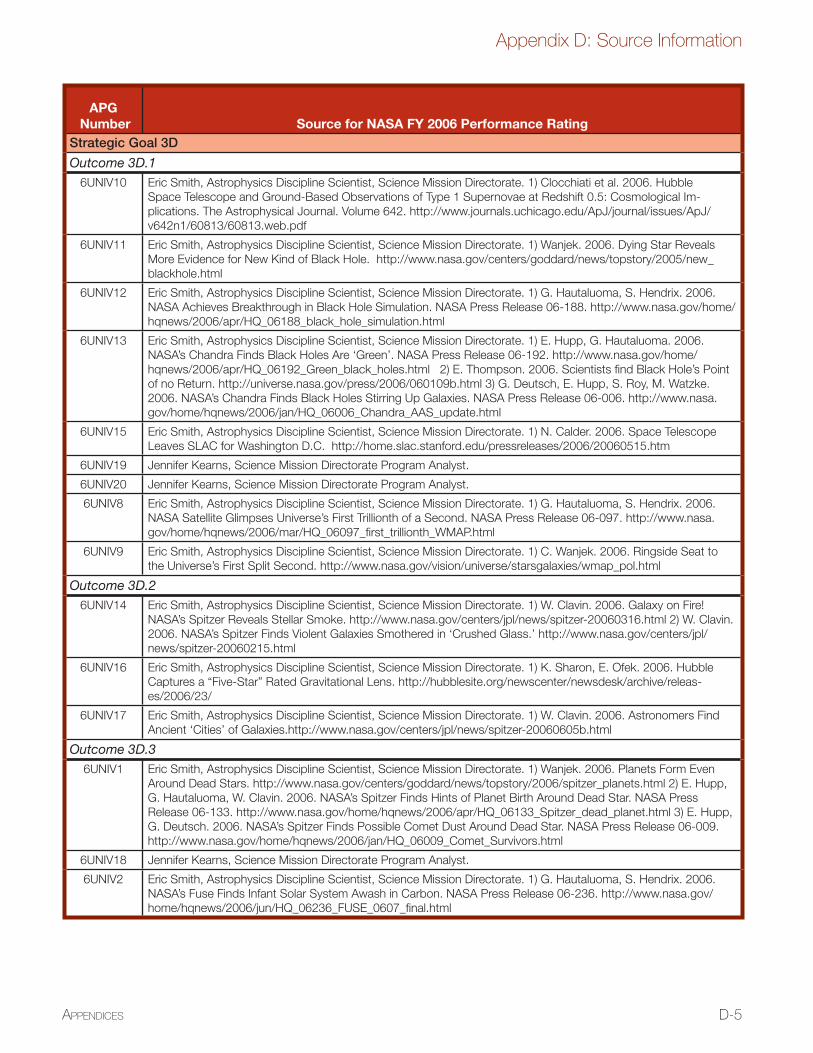
D-5
Appendix D: Source Information
APPENDICES
APG Number Source for NASA FY 2006 Performance Rating
Strategic Goal 3D
Outcome 3D.1
6UNIV10 Eric Smith, Astrophysics Discipline Scientist, Science Mission Directorate. 1) Clocchiati et al. 2006. Hubble
Space Telescope and Ground-Based Observations of Type 1 Supernovae at Redshift 0.5: Cosmological Im-
plications. The Astrophysical Journal. Volume 642. http://www.journals.uchicago.edu/ApJ/journal/issues/ApJ/
v642n1/60813/60813.web.pdf
6UNIV11 Eric Smith, Astrophysics Discipline Scientist, Science Mission Directorate. 1) Wanjek. 2006. Dying Star Reveals
More Evidence for New Kind of Black Hole. http://www.nasa.gov/centers/goddard/news/topstory/2005/new_
blackhole.html
6UNIV12 Eric Smith, Astrophysics Discipline Scientist, Science Mission Directorate. 1) G. Hautaluoma, S. Hendrix. 2006.
NASA Achieves Breakthrough in Black Hole Simulation. NASA Press Release 06-188. http://www.nasa.gov/home/
hqnews/2006/apr/HQ_06188_black_hole_simulation.html
6UNIV13 Eric Smith, Astrophysics Discipline Scientist, Science Mission Directorate. 1) E. Hupp, G. Hautaluoma. 2006.
NASA’s Chandra Finds Black Holes Are ‘Green’. NASA Press Release 06-192. http://www.nasa.gov/home/
hqnews/2006/apr/HQ_06192_Green_black_holes.html 2) E. Thompson. 2006. Scientists find Black Hole’s Point
of no Return. http://universe.nasa.gov/press/2006/060109b.html 3) G. Deutsch, E. Hupp, S. Roy, M. Watzke.
2006. NASA’s Chandra Finds Black Holes Stirring Up Galaxies. NASA Press Release 06-006. http://www.nasa.
gov/home/hqnews/2006/jan/HQ_06006_Chandra_AAS_update.html
6UNIV15 Eric Smith, Astrophysics Discipline Scientist, Science Mission Directorate. 1) N. Calder. 2006. Space Telescope
Leaves SLAC for Washington D.C. http://home.slac.stanford.edu/pressreleases/2006/20060515.htm
6UNIV19 Jennifer Kearns, Science Mission Directorate Program Analyst.
6UNIV20 Jennifer Kearns, Science Mission Directorate Program Analyst.
6UNIV8 Eric Smith, Astrophysics Discipline Scientist, Science Mission Directorate. 1) G. Hautaluoma, S. Hendrix. 2006.
NASA Satellite Glimpses Universe’s First Trillionth of a Second. NASA Press Release 06-097. http://www.nasa.
gov/home/hqnews/2006/mar/HQ_06097_first_trillionth_WMAP.html
6UNIV9 Eric Smith, Astrophysics Discipline Scientist, Science Mission Directorate. 1) C. Wanjek. 2006. Ringside Seat to
the Universe’s First Split Second. http://www.nasa.gov/vision/universe/starsgalaxies/wmap_pol.html
Outcome 3D.2
6UNIV14 Eric Smith, Astrophysics Discipline Scientist, Science Mission Directorate. 1) W. Clavin. 2006. Galaxy on Fire!
NASA’s Spitzer Reveals Stellar Smoke. http://www.nasa.gov/centers/jpl/news/spitzer-20060316.html 2) W. Clavin.
2006. NASA’s Spitzer Finds Violent Galaxies Smothered in ‘Crushed Glass.’ http://www.nasa.gov/centers/jpl/
news/spitzer-20060215.html
6UNIV16 Eric Smith, Astrophysics Discipline Scientist, Science Mission Directorate. 1) K. Sharon, E. Ofek. 2006. Hubble
Captures a “Five-Star” Rated Gravitational Lens. http://hubblesite.org/newscenter/newsdesk/archive/releas-
es/2006/23/
6UNIV17 Eric Smith, Astrophysics Discipline Scientist, Science Mission Directorate. 1) W. Clavin. 2006. Astronomers Find
Ancient ‘Cities’ of Galaxies.http://www.nasa.gov/centers/jpl/news/spitzer-20060605b.html
Outcome 3D.3
6UNIV1 Eric Smith, Astrophysics Discipline Scientist, Science Mission Directorate. 1) Wanjek. 2006. Planets Form Even
Around Dead Stars. http://www.nasa.gov/centers/goddard/news/topstory/2006/spitzer_planets.html 2) E. Hupp,
G. Hautaluoma, W. Clavin. 2006. NASA’s Spitzer Finds Hints of Planet Birth Around Dead Star. NASA Press
Release 06-133. http://www.nasa.gov/home/hqnews/2006/apr/HQ_06133_Spitzer_dead_planet.html 3) E. Hupp,
G. Deutsch. 2006. NASA’s Spitzer Finds Possible Comet Dust Around Dead Star. NASA Press Release 06-009.
http://www.nasa.gov/home/hqnews/2006/jan/HQ_06009_Comet_Survivors.html
6UNIV18 Jennifer Kearns, Science Mission Directorate Program Analyst.
6UNIV2 Eric Smith, Astrophysics Discipline Scientist, Science Mission Directorate. 1) G. Hautaluoma, S. Hendrix. 2006.
NASA’s Fuse Finds Infant Solar System Awash in Carbon. NASA Press Release 06-236. http://www.nasa.gov/
home/hqnews/2006/jun/HQ_06236_FUSE_0607_final.html
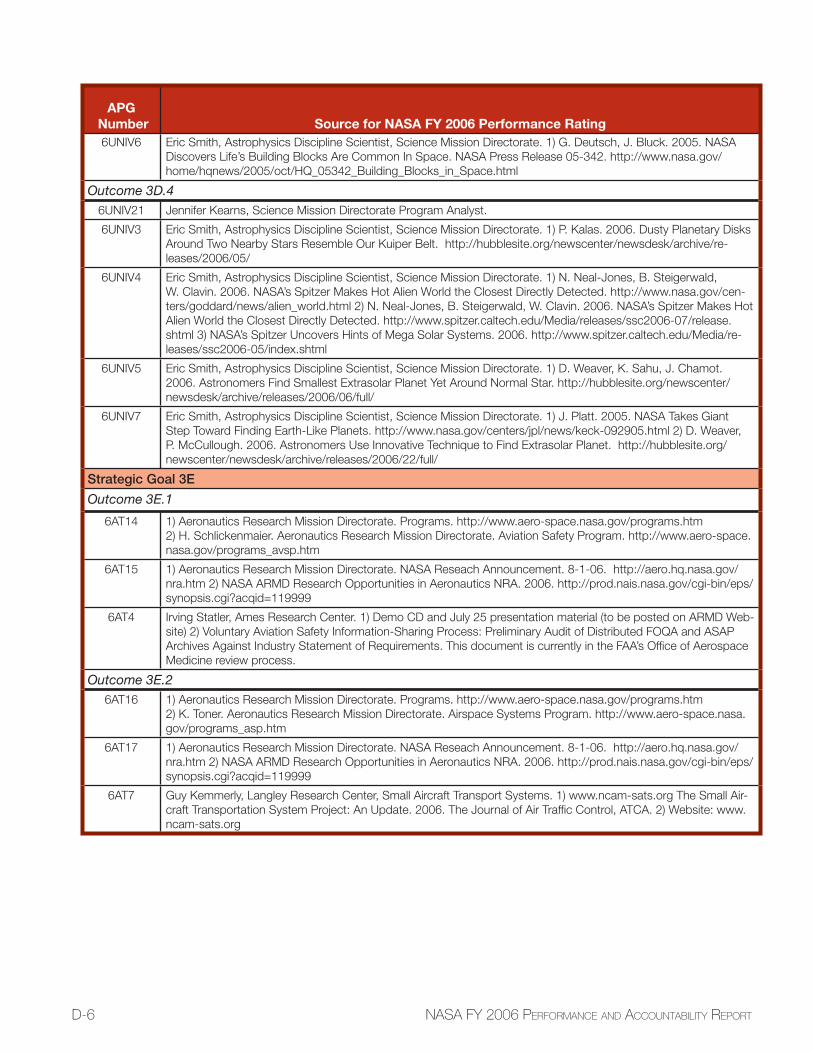
D-6 NASA FY 2006 PERFORMANCE AND ACCOUNTABILITY REPORT
APG Number Source for NASA FY 2006 Performance Rating
6UNIV6 Eric Smith, Astrophysics Discipline Scientist, Science Mission Directorate. 1) G. Deutsch, J. Bluck. 2005. NASA
Discovers Life’s Building Blocks Are Common In Space. NASA Press Release 05-342. http://www.nasa.gov/
home/hqnews/2005/oct/HQ_05342_Building_Blocks_in_Space.html
Outcome 3D.4
6UNIV21 Jennifer Kearns, Science Mission Directorate Program Analyst.
6UNIV3 Eric Smith, Astrophysics Discipline Scientist, Science Mission Directorate. 1) P. Kalas. 2006. Dusty Planetary Disks
Around Two Nearby Stars Resemble Our Kuiper Belt. http://hubblesite.org/newscenter/newsdesk/archive/re-
leases/2006/05/
6UNIV4 Eric Smith, Astrophysics Discipline Scientist, Science Mission Directorate. 1) N. Neal-Jones, B. Steigerwald,
W. Clavin. 2006. NASA’s Spitzer Makes Hot Alien World the Closest Directly Detected. http://www.nasa.gov/cen-
ters/goddard/news/alien_world.html 2) N. Neal-Jones, B. Steigerwald, W. Clavin. 2006. NASA’s Spitzer Makes Hot
Alien World the Closest Directly Detected. http://www.spitzer.caltech.edu/Media/releases/ssc2006-07/release.
shtml 3) NASA’s Spitzer Uncovers Hints of Mega Solar Systems. 2006. http://www.spitzer.caltech.edu/Media/re-
leases/ssc2006-05/index.shtml
6UNIV5 Eric Smith, Astrophysics Discipline Scientist, Science Mission Directorate. 1) D. Weaver, K. Sahu, J. Chamot.
2006. Astronomers Find Smallest Extrasolar Planet Yet Around Normal Star. http://hubblesite.org/newscenter/
newsdesk/archive/releases/2006/06/full/
6UNIV7 Eric Smith, Astrophysics Discipline Scientist, Science Mission Directorate. 1) J. Platt. 2005. NASA Takes Giant
Step Toward Finding Earth-Like Planets. http://www.nasa.gov/centers/jpl/news/keck-092905.html 2) D. Weaver,
P. McCullough. 2006. Astronomers Use Innovative Technique to Find Extrasolar Planet. http://hubblesite.org/
newscenter/newsdesk/archive/releases/2006/22/full/
Strategic Goal 3E
Outcome 3E.1
6AT14 1) Aeronautics Research Mission Directorate. Programs. http://www.aero-space.nasa.gov/programs.htm
2) H. Schlickenmaier. Aeronautics Research Mission Directorate. Aviation Safety Program. http://www.aero-space.
nasa.gov/programs_avsp.htm
6AT15 1) Aeronautics Research Mission Directorate. NASA Reseach Announcement. 8-1-06. http://aero.hq.nasa.gov/
nra.htm 2) NASA ARMD Research Opportunities in Aeronautics NRA. 2006. http://prod.nais.nasa.gov/cgi-bin/eps/
synopsis.cgi?acqid=119999
6AT4 Irving Statler, Ames Research Center. 1) Demo CD and July 25 presentation material (to be posted on ARMD Web-
site) 2) Voluntary Aviation Safety Information-Sharing Process: Preliminary Audit of Distributed FOQA and ASAP
Archives Against Industry Statement of Requirements. This document is currently in the FAA’s Office of Aerospace
Medicine review process.
Outcome 3E.2
6AT16 1) Aeronautics Research Mission Directorate. Programs. http://www.aero-space.nasa.gov/programs.htm
2) K. Toner. Aeronautics Research Mission Directorate. Airspace Systems Program. http://www.aero-space.nasa.
gov/programs_asp.htm
6AT17 1) Aeronautics Research Mission Directorate. NASA Reseach Announcement. 8-1-06. http://aero.hq.nasa.gov/
nra.htm 2) NASA ARMD Research Opportunities in Aeronautics NRA. 2006. http://prod.nais.nasa.gov/cgi-bin/eps/
synopsis.cgi?acqid=119999
6AT7 Guy Kemmerly, Langley Research Center, Small Aircraft Transport Systems. 1) www.ncam-sats.org The Small Air-
craft Transportation System Project: An Update. 2006. The Journal of Air Traffic Control, ATCA. 2) Website: www.
ncam-sats.org
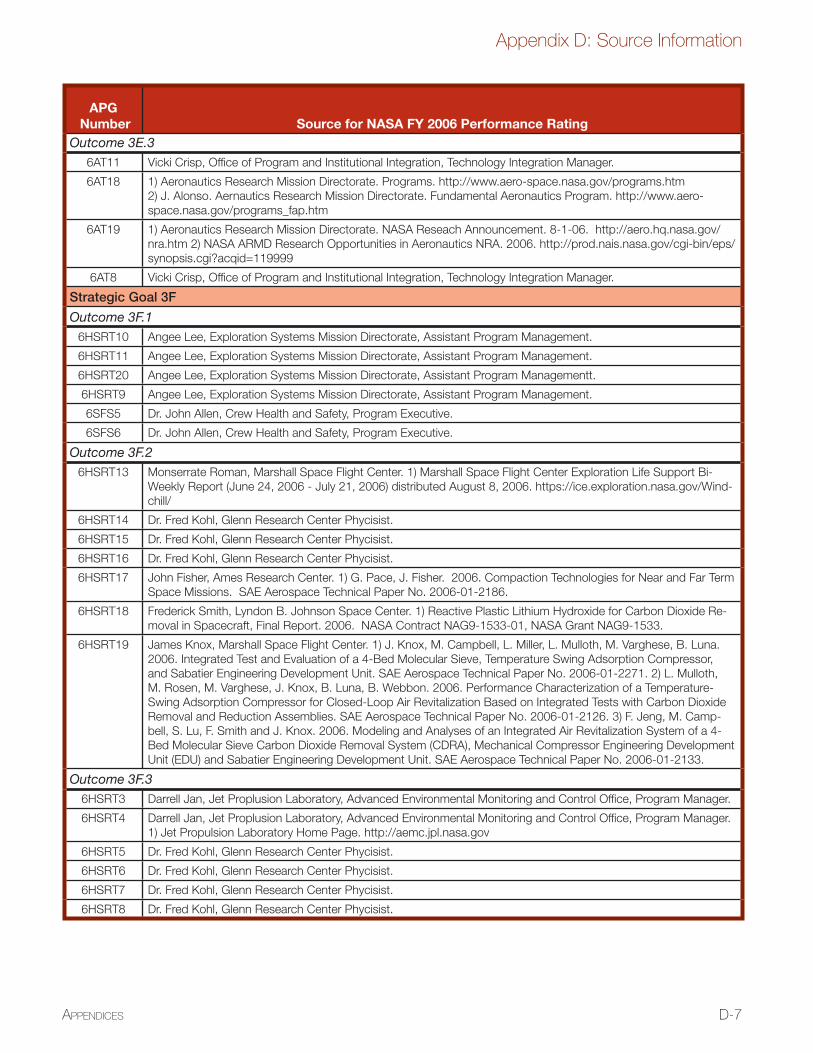
D-7
Appendix D: Source Information
APPENDICES
APG Number Source for NASA FY 2006 Performance Rating
Outcome 3E.3
6AT11 Vicki Crisp, Office of Program and Institutional Integration, Technology Integration Manager.
6AT18 1) Aeronautics Research Mission Directorate. Programs. http://www.aero-space.nasa.gov/programs.htm
2) J. Alonso. Aernautics Research Mission Directorate. Fundamental Aeronautics Program. http://www.aero-
space.nasa.gov/programs_fap.htm
6AT19 1) Aeronautics Research Mission Directorate. NASA Reseach Announcement. 8-1-06. http://aero.hq.nasa.gov/
nra.htm 2) NASA ARMD Research Opportunities in Aeronautics NRA. 2006. http://prod.nais.nasa.gov/cgi-bin/eps/
synopsis.cgi?acqid=119999
6AT8 Vicki Crisp, Office of Program and Institutional Integration, Technology Integration Manager.
Strategic Goal 3F
Outcome 3F.1
6HSRT10 Angee Lee, Exploration Systems Mission Directorate, Assistant Program Management.
6HSRT11 Angee Lee, Exploration Systems Mission Directorate, Assistant Program Management.
6HSRT20 Angee Lee, Exploration Systems Mission Directorate, Assistant Program Managementt.
6HSRT9 Angee Lee, Exploration Systems Mission Directorate, Assistant Program Management.
6SFS5 Dr. John Allen, Crew Health and Safety, Program Executive.
6SFS6 Dr. John Allen, Crew Health and Safety, Program Executive.
Outcome 3F.2
6HSRT13 Monserrate Roman, Marshall Space Flight Center. 1) Marshall Space Flight Center Exploration Life Support Bi-
Weekly Report (June 24, 2006 - July 21, 2006) distributed August 8, 2006. https://ice.exploration.nasa.gov/Wind-
chill/
6HSRT14 Dr. Fred Kohl, Glenn Research Center Phycisist.
6HSRT15 Dr. Fred Kohl, Glenn Research Center Phycisist.
6HSRT16 Dr. Fred Kohl, Glenn Research Center Phycisist.
6HSRT17 John Fisher, Ames Research Center. 1) G. Pace, J. Fisher. 2006. Compaction Technologies for Near and Far Term
Space Missions. SAE Aerospace Technical Paper No. 2006-01-2186.
6HSRT18 Frederick Smith, Lyndon B. Johnson Space Center. 1) Reactive Plastic Lithium Hydroxide for Carbon Dioxide Re-
moval in Spacecraft, Final Report. 2006. NASA Contract NAG9-1533-01, NASA Grant NAG9-1533.
6HSRT19 James Knox, Marshall Space Flight Center. 1) J. Knox, M. Campbell, L. Miller, L. Mulloth, M. Varghese, B. Luna.
2006. Integrated Test and Evaluation of a 4-Bed Molecular Sieve, Temperature Swing Adsorption Compressor,
and Sabatier Engineering Development Unit. SAE Aerospace Technical Paper No. 2006-01-2271. 2) L. Mulloth,
M. Rosen, M. Varghese, J. Knox, B. Luna, B. Webbon. 2006. Performance Characterization of a Temperature-
Swing Adsorption Compressor for Closed-Loop Air Revitalization Based on Integrated Tests with Carbon Dioxide
Removal and Reduction Assemblies. SAE Aerospace Technical Paper No. 2006-01-2126. 3) F. Jeng, M. Camp-
bell, S. Lu, F. Smith and J. Knox. 2006. Modeling and Analyses of an Integrated Air Revitalization System of a 4-
Bed Molecular Sieve Carbon Dioxide Removal System (CDRA), Mechanical Compressor Engineering Development
Unit (EDU) and Sabatier Engineering Development Unit. SAE Aerospace Technical Paper No. 2006-01-2133.
Outcome 3F.3
6HSRT3 Darrell Jan, Jet Proplusion Laboratory, Advanced Environmental Monitoring and Control Office, Program Manager.
6HSRT4 Darrell Jan, Jet Proplusion Laboratory, Advanced Environmental Monitoring and Control Office, Program Manager.
1) Jet Propulsion Laboratory Home Page. http://aemc.jpl.nasa.gov
6HSRT5 Dr. Fred Kohl, Glenn Research Center Phycisist.
6HSRT6 Dr. Fred Kohl, Glenn Research Center Phycisist.
6HSRT7 Dr. Fred Kohl, Glenn Research Center Phycisist.
6HSRT8 Dr. Fred Kohl, Glenn Research Center Phycisist.
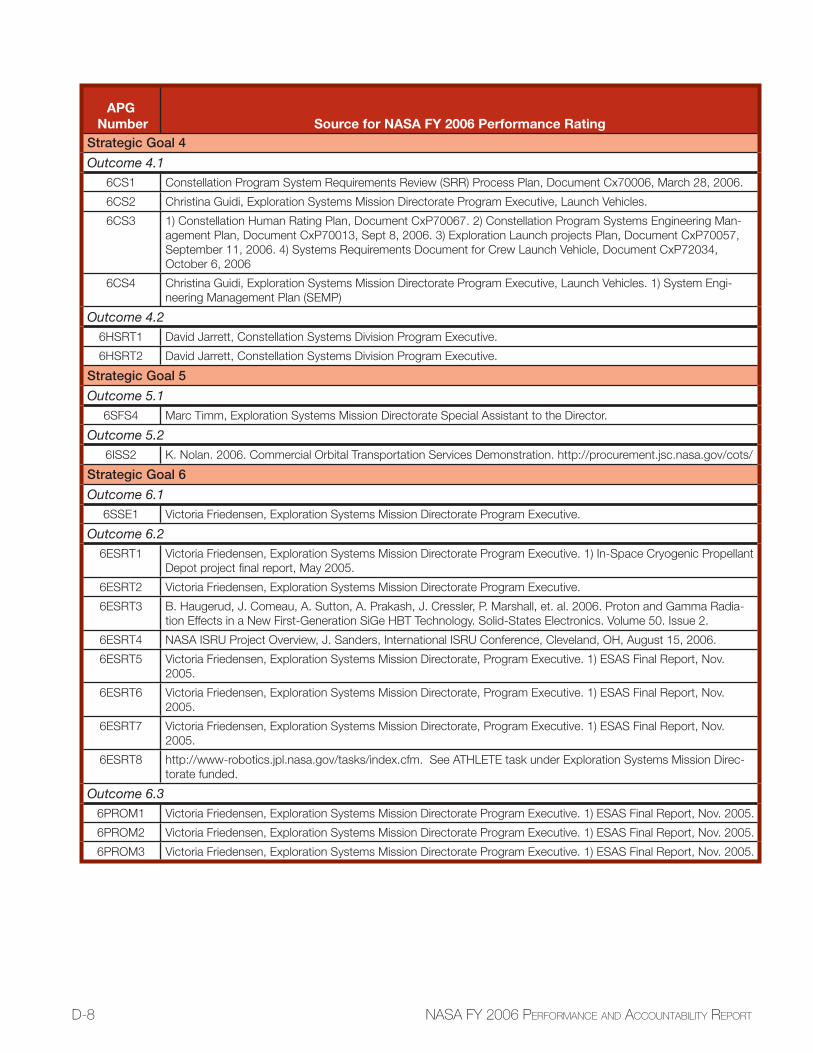
D-8 NASA FY 2006 PERFORMANCE AND ACCOUNTABILITY REPORT
APG Number Source for NASA FY 2006 Performance Rating
Strategic Goal 4
Outcome 4.1
6CS1 Constellation Program System Requirements Review (SRR) Process Plan, Document Cx70006, March 28, 2006.
6CS2 Christina Guidi, Exploration Systems Mission Directorate Program Executive, Launch Vehicles.
6CS3 1) Constellation Human Rating Plan, Document CxP70067. 2) Constellation Program Systems Engineering Man-
agement Plan, Document CxP70013, Sept 8, 2006. 3) Exploration Launch projects Plan, Document CxP70057,
September 11, 2006. 4) Systems Requirements Document for Crew Launch Vehicle, Document CxP72034,
October 6, 2006
6CS4 Christina Guidi, Exploration Systems Mission Directorate Program Executive, Launch Vehicles. 1) System Engi-
neering Management Plan (SEMP)
Outcome 4.2
6HSRT1 David Jarrett, Constellation Systems Division Program Executive.
6HSRT2 David Jarrett, Constellation Systems Division Program Executive.
Strategic Goal 5
Outcome 5.1
6SFS4 Marc Timm, Exploration Systems Mission Directorate Special Assistant to the Director.
Outcome 5.2
6ISS2 K. Nolan. 2006. Commercial Orbital Transportation Services Demonstration. http://procurement.jsc.nasa.gov/cots/
Strategic Goal 6
Outcome 6.1
6SSE1 Victoria Friedensen, Exploration Systems Mission Directorate Program Executive.
Outcome 6.2
6ESRT1 Victoria Friedensen, Exploration Systems Mission Directorate Program Executive. 1) In-Space Cryogenic Propellant
Depot project final report, May 2005.
6ESRT2 Victoria Friedensen, Exploration Systems Mission Directorate Program Executive.
6ESRT3 B. Haugerud, J. Comeau, A. Sutton, A. Prakash, J. Cressler, P. Marshall, et. al. 2006. Proton and Gamma Radia-
tion Effects in a New First-Generation SiGe HBT Technology. Solid-States Electronics. Volume 50. Issue 2.
6ESRT4 NASA ISRU Project Overview, J. Sanders, International ISRU Conference, Cleveland, OH, August 15, 2006.
6ESRT5 Victoria Friedensen, Exploration Systems Mission Directorate, Program Executive. 1) ESAS Final Report, Nov.
2005.
6ESRT6 Victoria Friedensen, Exploration Systems Mission Directorate, Program Executive. 1) ESAS Final Report, Nov.
2005.
6ESRT7 Victoria Friedensen, Exploration Systems Mission Directorate, Program Executive. 1) ESAS Final Report, Nov.
2005.
6ESRT8 http://www-robotics.jpl.nasa.gov/tasks/index.cfm. See ATHLETE task under Exploration Systems Mission Direc-
torate funded.
Outcome 6.3
6PROM1 Victoria Friedensen, Exploration Systems Mission Directorate Program Executive. 1) ESAS Final Report, Nov. 2005.
6PROM2 Victoria Friedensen, Exploration Systems Mission Directorate Program Executive. 1) ESAS Final Report, Nov. 2005.
6PROM3 Victoria Friedensen, Exploration Systems Mission Directorate Program Executive. 1) ESAS Final Report, Nov. 2005.
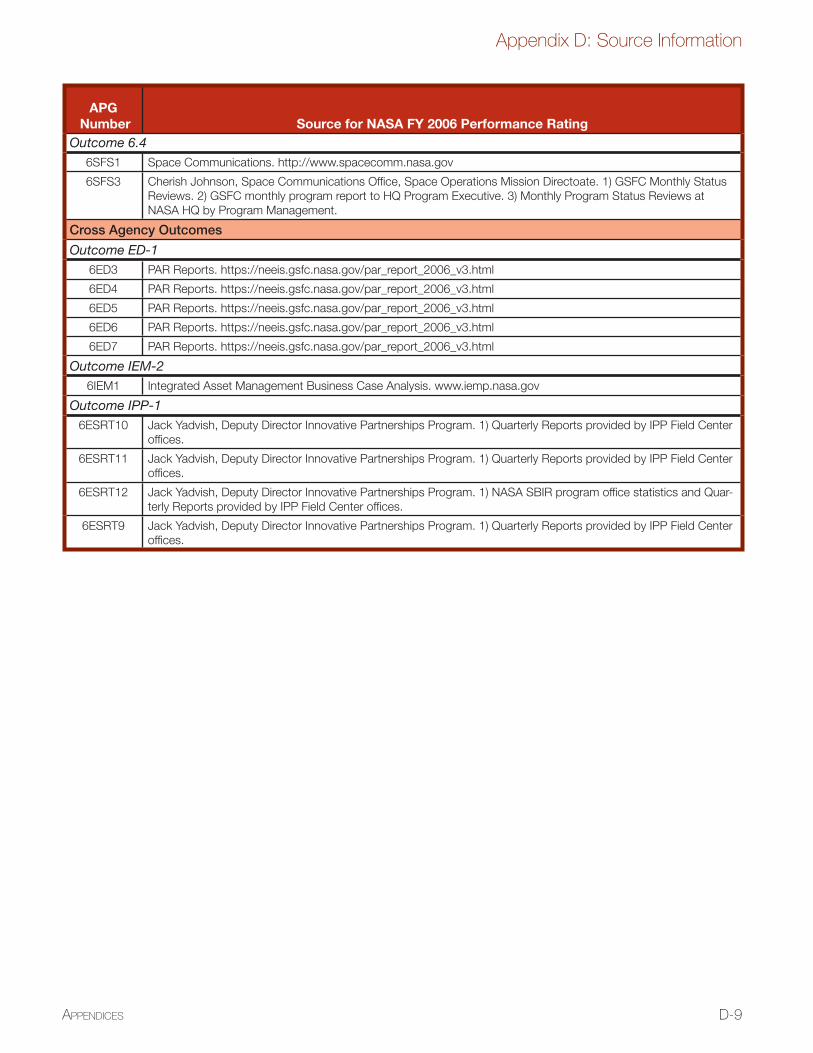
D-9
Appendix D: Source Information
APPENDICES
APG Number Source for NASA FY 2006 Performance Rating
Outcome 6.4
6SFS1 Space Communications. http://www.spacecomm.nasa.gov
6SFS3 Cherish Johnson, Space Communications Office, Space Operations Mission Directoate. 1) GSFC Monthly Status
Reviews. 2) GSFC monthly program report to HQ Program Executive. 3) Monthly Program Status Reviews at
NASA HQ by Program Management.
Cross Agency Outcomes
Outcome ED-1
6ED3 PAR Reports. https://neeis.gsfc.nasa.gov/par_report_2006_v3.html
6ED4 PAR Reports. https://neeis.gsfc.nasa.gov/par_report_2006_v3.html
6ED5 PAR Reports. https://neeis.gsfc.nasa.gov/par_report_2006_v3.html
6ED6 PAR Reports. https://neeis.gsfc.nasa.gov/par_report_2006_v3.html
6ED7 PAR Reports. https://neeis.gsfc.nasa.gov/par_report_2006_v3.html
Outcome IEM-2
6IEM1 Integrated Asset Management Business Case Analysis. www.iemp.nasa.gov
Outcome IPP-1
6ESRT10 Jack Yadvish, Deputy Director Innovative Partnerships Program. 1) Quarterly Reports provided by IPP Field Center
offices.
6ESRT11 Jack Yadvish, Deputy Director Innovative Partnerships Program. 1) Quarterly Reports provided by IPP Field Center
offices.
6ESRT12 Jack Yadvish, Deputy Director Innovative Partnerships Program. 1) NASA SBIR program office statistics and Quar-
terly Reports provided by IPP Field Center offices.
6ESRT9 Jack Yadvish, Deputy Director Innovative Partnerships Program. 1) Quarterly Reports provided by IPP Field Center
offices.
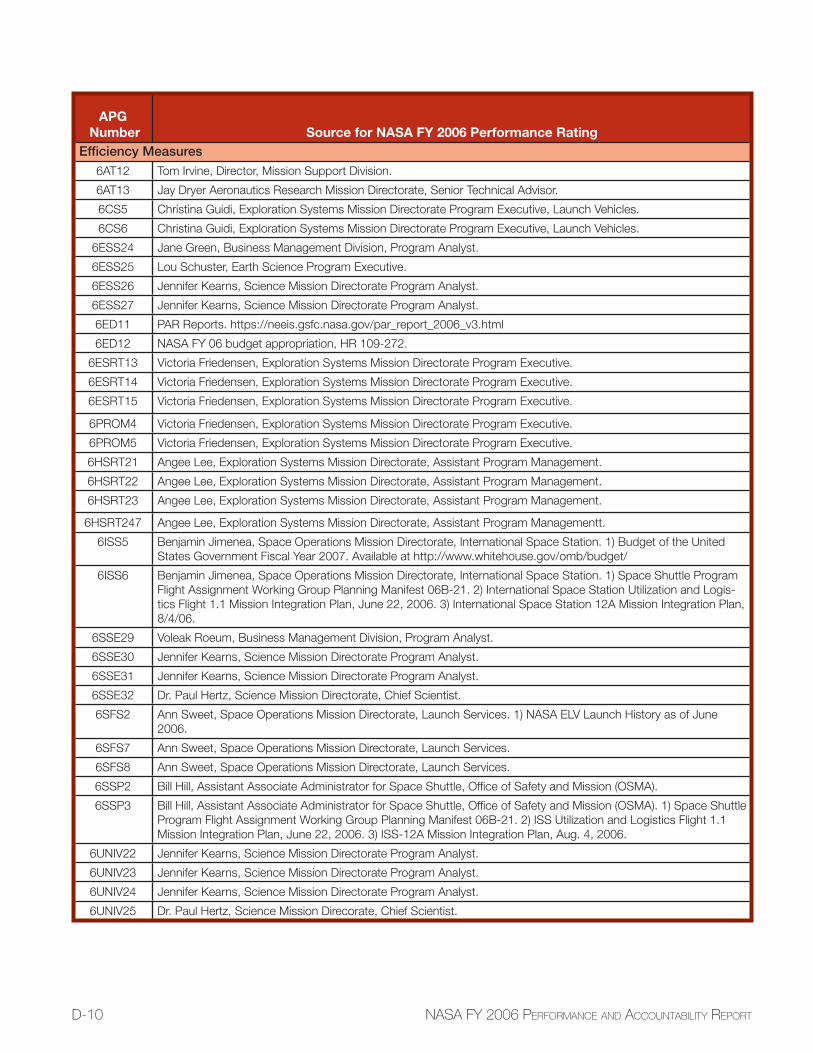
D-10 NASA FY 2006 PERFORMANCE AND ACCOUNTABILITY REPORT
APG Number Source for NASA FY 2006 Performance Rating
Efficiency Measures6AT12 Tom Irvine, Director, Mission Support Division.
6AT13 Jay Dryer Aeronautics Research Mission Directorate, Senior Technical Advisor.
6CS5 Christina Guidi, Exploration Systems Mission Directorate Program Executive, Launch Vehicles.
6CS6 Christina Guidi, Exploration Systems Mission Directorate Program Executive, Launch Vehicles.
6ESS24 Jane Green, Business Management Division, Program Analyst.
6ESS25 Lou Schuster, Earth Science Program Executive.
6ESS26 Jennifer Kearns, Science Mission Directorate Program Analyst.
6ESS27 Jennifer Kearns, Science Mission Directorate Program Analyst.
6ED11 PAR Reports. https://neeis.gsfc.nasa.gov/par_report_2006_v3.html
6ED12 NASA FY 06 budget appropriation, HR 109-272.
6ESRT13 Victoria Friedensen, Exploration Systems Mission Directorate Program Executive.
6ESRT14 Victoria Friedensen, Exploration Systems Mission Directorate Program Executive.
6ESRT15 Victoria Friedensen, Exploration Systems Mission Directorate Program Executive.
6PROM4 Victoria Friedensen, Exploration Systems Mission Directorate Program Executive.
6PROM5 Victoria Friedensen, Exploration Systems Mission Directorate Program Executive.
6HSRT21 Angee Lee, Exploration Systems Mission Directorate, Assistant Program Management.
6HSRT22 Angee Lee, Exploration Systems Mission Directorate, Assistant Program Management.
6HSRT23 Angee Lee, Exploration Systems Mission Directorate, Assistant Program Management.
6HSRT247 Angee Lee, Exploration Systems Mission Directorate, Assistant Program Managementt.
6ISS5 Benjamin Jimenea, Space Operations Mission Directorate, International Space Station. 1) Budget of the United
States Government Fiscal Year 2007. Available at http://www.whitehouse.gov/omb/budget/
6ISS6 Benjamin Jimenea, Space Operations Mission Directorate, International Space Station. 1) Space Shuttle Program
Flight Assignment Working Group Planning Manifest 06B-21. 2) International Space Station Utilization and Logis-
tics Flight 1.1 Mission Integration Plan, June 22, 2006. 3) International Space Station 12A Mission Integration Plan,
8/4/06.
6SSE29 Voleak Roeum, Business Management Division, Program Analyst.
6SSE30 Jennifer Kearns, Science Mission Directorate Program Analyst.
6SSE31 Jennifer Kearns, Science Mission Directorate Program Analyst.
6SSE32 Dr. Paul Hertz, Science Mission Directorate, Chief Scientist.
6SFS2 Ann Sweet, Space Operations Mission Directorate, Launch Services. 1) NASA ELV Launch History as of June
2006.
6SFS7 Ann Sweet, Space Operations Mission Directorate, Launch Services.
6SFS8 Ann Sweet, Space Operations Mission Directorate, Launch Services.
6SSP2 Bill Hill, Assistant Associate Administrator for Space Shuttle, Office of Safety and Mission (OSMA).
6SSP3 Bill Hill, Assistant Associate Administrator for Space Shuttle, Office of Safety and Mission (OSMA). 1) Space Shuttle
Program Flight Assignment Working Group Planning Manifest 06B-21. 2) ISS Utilization and Logistics Flight 1.1
Mission Integration Plan, June 22, 2006. 3) ISS-12A Mission Integration Plan, Aug. 4, 2006.
6UNIV22 Jennifer Kearns, Science Mission Directorate Program Analyst.
6UNIV23 Jennifer Kearns, Science Mission Directorate Program Analyst.
6UNIV24 Jennifer Kearns, Science Mission Directorate Program Analyst.
6UNIV25 Dr. Paul Hertz, Science Mission Direcorate, Chief Scientist.
NASA Contact Information
NASA Headquarters (HQ)Washington, DC 20546-0001(202) 358-0000Hours: 7:30-4:30 ESThttp://www.nasa.gov/centers/hq/home/index.html
NASA Ames Research Center (ARC)Moffett Field, CA 94035-1000(650) 604-5000Hours: 7:00-5:00 PSThttp://www.nasa.gov/centers/ames/home/index.html
NASA Dryden Flight Research Center (DFRC)P.O. Box 273Edwards, CA 93523-0273(661) 276-3311Hours: 7:30-4:30 PSThttp://www.nasa.gov/centers/dryden/home/index.html
NASA John H. Glenn Research Centerat Lewis Field (GRC)21000 Brookpark RoadCleveland, OH 44135-3191(216) 433-4000Hours: 7:30-4:30 ESThttp://www.nasa.gov/centers/glenn/home/index.html
NASA Goddard Space Flight Center (GSFC)8800 Greenbelt RoadGreenbelt, MD 20771-0001(301) 286-2000Hours: 8-5:00 ESThttp://www.nasa.gov/centers/goddard/home/index.html
NASA Jet Propulsion Laboratory (JPL)4800 Oak Grove DrivePasadena, CA 91109-8099(818) 354-4321Hours: 24 hours a dayhttp://www.nasa.gov/centers/jpl/home/index.html
NASA Lyndon B. Johnson Space Center (JSC)Houston, TX 77058-3696(281) 483-0123Hours: 6:00-6:00 CSThttp://www.nasa.gov/centers/johnson/home/index.html
NASA John F. Kennedy Space Center (KSC)Kennedy Space Center, FL 32899-0001(321) 867-5000Hours: 8:00-6:00 ESThttp://www.nasa.gov/centers/kennedy/home/index.html
NASA Langley Research Center (LaRC)Hampton, VA 23681-2199(757) 864-1000Hours: 7:00-5:00 ESThttp://www.nasa.gov/centers/langley/home/index.html
NASA George C. Marshall Space Flight Center (MSFC)Huntsville, AL 35812-0001(265) 544-2121Hours: available 24 hourshttp://www.nasa.gov/centers/marshall/home/index.html
NASA John C. Stennis Space Center (SSC)NASA Public AffairsIA10Stennis Space Center, MS 39529-6000(228) 688-2211Hours: 6:00-6:00 CSThttp://www.nasa.gov/centers/stennis/home/index.html
NASA Wallops Flight Facility (WFF)Goddard Space Flight CenterWallops Island, VA 23337-5099(757) 824-1000Hours: 8:00-5:00 ESThttp://www.wff.nasa.gov
Produced by NASA Headquarters and The Tauri Group, LLC.
Back cover: Lights of vehicles and service structures pierce the fog as Space Shuttle Atlantis approaches Launch Pad 39B on August 2, 2006. Atlantis launched on September 9, beginning mission STS-115 to International Space Station (ISS). During the mission, the six Shuttle crewmembers delivered cargo and continued ISS construction. (NASA)
National Aeronautics and Space Administration
NASA HeadquartersWashington, DC 20546
NP-2006-11-451-HQ
http://www.nasa.gov
Related Documents