Performance analysis of proton exchange membrane fuel cell in automotive applications E. Pahon 1 , D. Bouquain 2 , D. Hissel 2 , A. Rouet 3 , C. Vacquier 3 1 FEMTO-ST Institute, FCLAB, Univ. Bourgogne Franche-Comté, UTBM, CNRS, Belfort, France 2 FEMTO-ST Institute, FCLAB, Univ. Bourgogne Franche-Comté, CNRS, Belfort, France 3 SYMBIO, Vénissieux, France. [email protected], [email protected], [email protected], [email protected], [email protected] Abstract: This paper deals with the performance analysis of a proton exchange membrane fuel cell in automotive applications and especially for start/stop phases. Start-Stop cycles are one of the main sources of degradation for fuel cell systems, embedded in the automotive applications, among other dynamic conditions as idling, load cycling or high power. In this study, polarization curves and electrochemical impedance spectra are used to analyze the degradation mechanisms inside fuel cell stack during start/stop cycling. Obviously, the carbon support of the catalyst layer is the main constituent that suffers performance degradation during the 2,600 successive cycles performed. The impedance measurement of a 5kW PEM fuel cell stack revealed that the ohmic resistance does not vary whereas the charger transfer and mass transfer resistances increase drastically depending on the number of cycle repetitions. The oxygen reduction reaction impact due to the fuel/air interface is also visible even if the reactants are consumed with a dummy load for the shutdowns. Keywords: Proton exchange membrane fuel cell; start/stop cycling; durability; performance analysis; degradation mechanisms; oxygen reduction reaction. 1. Introduction Even if the smog pollution emission standards have been strengthened over time making the air substantially cleaner and healthier, NOx pollution is still a problem [1], [2]. Indeed, in the recent years,

Welcome message from author
This document is posted to help you gain knowledge. Please leave a comment to let me know what you think about it! Share it to your friends and learn new things together.
Transcript
Performance analysis of proton exchange membrane fuel cell in automotive applications
E. Pahon1, D. Bouquain2, D. Hissel2, A. Rouet3, C. Vacquier3
1FEMTO-ST Institute, FCLAB, Univ. Bourgogne Franche-Comté, UTBM, CNRS, Belfort, France
2FEMTO-ST Institute, FCLAB, Univ. Bourgogne Franche-Comté, CNRS, Belfort, France
3SYMBIO, Vénissieux, France.
[email protected], [email protected], [email protected],
[email protected], [email protected]
Abstract: This paper deals with the performance analysis of a proton exchange membrane fuel cell in
automotive applications and especially for start/stop phases. Start-Stop cycles are one of the main
sources of degradation for fuel cell systems, embedded in the automotive applications, among other
dynamic conditions as idling, load cycling or high power. In this study, polarization curves and
electrochemical impedance spectra are used to analyze the degradation mechanisms inside fuel cell
stack during start/stop cycling. Obviously, the carbon support of the catalyst layer is the main
constituent that suffers performance degradation during the 2,600 successive cycles performed. The
impedance measurement of a 5kW PEM fuel cell stack revealed that the ohmic resistance does not vary
whereas the charger transfer and mass transfer resistances increase drastically depending on the
number of cycle repetitions. The oxygen reduction reaction impact due to the fuel/air interface is also
visible even if the reactants are consumed with a dummy load for the shutdowns.
Keywords: Proton exchange membrane fuel cell; start/stop cycling; durability; performance analysis;
degradation mechanisms; oxygen reduction reaction.
1. Introduction
Even if the smog pollution emission standards have been strengthened over time making the air
substantially cleaner and healthier, NOx pollution is still a problem [1], [2]. Indeed, in the recent years,
there has been a steady overall reduction in greenhouse gas (GHG) emissions in the EU, except for the
transport sector as its relative contribution to overall GHG emissions in Europe has become more
significant [3], [4]. Therefore, actions are needed in order to meet emission reduction targets (nitrogen
oxides (NOx) and ultra-fine particles), especially in transport applications [5]. As given by the European
Environment Agency (EEA), the projected trends suggest that the transport sector is unlikely to
contribute to the emission reductions needed to achieve the EU’s new targets for 2030 or to achieving
climate neutrality by 2050 [6]. Therefore, further restrictive standards will be implemented for
transport (i.e., Euro-7 standard) as road transport constitutes the highest proportion of overall
transport emissions (around 71% in 2018). Decarbonized actions must be taken to move towards
carbon neutrality. The Euro 7 emission standard proposed by the European Commission aims to ensure
that a vehicle does not produce emissions throughout its life cycle, for all vehicles produced from 2025
[7], [8]. There are no precise figures yet, but the limits will be lower than those in the Euro 6 standard,
which set NOx emissions at 60mg/km for petrol vehicles and 80mg/km for diesel vehicles, as well as
carbon monoxide emissions at 500 and 1,000mg/km, for petrol and diesel respectively. Other
pollutants could complete the standards, including ammonia (NH3). Less widely, there are also ultra-
fine particles (PM<0.1), nitrogen oxide (N2O) and even particles emitted by brakes.
Nowadays, hydrogen-energy and fuel cell systems appear as one relevant solution to face fuel
dependency and GHG emissions [9]–[12]. Various studies consider hydrogen as a valuable option to
face fossil fuel dependency and reduce global warming. In [13], Oldenbroek et al. addressed the
question of the fuel cell electric vehicles and hydrogen balancing 100% renewable and integrated
national transportation and energy systems for five countries in Europe. They assumed that hydrogen
plays an important role in the transition toward a future- 100% renewable- energy and transport
system. Other studies focused on the distribution system of hydrogen [14] as well as on the societal
acceptability of this energy vector [15] [15]. Another point on which improvements are expected is the
lifetime of the fuel cell system. In fact, the U.S. Department of Energy (DoE) requires a durability in
automotive drive cycle of 8,000 hours with a performance loss of less than 10% of power [16]. An
additional aspect to take into account in the transport applications is the start-up/shutdown durability.
Again, based on US DoE figures, the target is set at 5,000 start/stop cycles. It is important to know that
the start-up and shut-down phases of a PEM fuel cell are one of the most degrading according to Pei
et al. in [17]. They are therefore among the issues to be studied in order to drastically improve the
lifetime of the electrochemical system. In [18], authors reviewed the start/stop experiments from
literature and from developed models. it is observed that the range of degradation during the
start/stop phases is between 15 and 65µV/cell/cycle with a mean degradation value determined as
25µV/cell/cycle. This degradation rate is twice as high as that encountered during the idling and high
current phases for one hour of operation. Therefore, and obviously, it is necessary to optimize the
duration and the frequency of these start/stop phases. Another tricky point when studying start/stop
cycles is the method of purging the system when it stops. Oyarce et al. [19] compared PEMFC shutdown
strategies to mitigate carbon corrosion of the catalyst support. The comparison is based of 1100
start/stop cycles with five different strategies including: without any purge, air purge, fuel
consumption, air consumption and fuel purge. This comparative study shows that the best solution is
to purge the cathode with fuel because the cathode is protected from high electrode potentials by
hydrogen. However, two fuel/air fronts occur on both cathode and anode sides with the safety
problems related to fuel/air mixture and the fuel could not be used as a gas purge in a transport
framework. Thus, the oxygen consumption should be a good strategy for the shutdown process but it
requires having a dummy load to consume oxygen at the cathode side. Lin et al. [20] also studied
shutdown strategies to limit carbon corrosion and local starvation. Their method combines auxiliary
load and air purge steps. Yang et al. [21] study the interest of using a dummy load to limit the
degradation of the fuel cell during shutdown. The result shows that the dummy load can effectively
reduce the duration of fuel/air interface, so that the reverse current effect is relieved. Zhang et al. [22]
propose an extension of Yang's method with a two-phase dummy load strategy. The first main load
declined at a certain linear rate, accompanied by the consumption of residual oxygen in the cathode
in order to avoid air starvation. Then, the following fixed dummy load aimed to consume the residual
small amount of oxygen still located in the catalyst layer and gas diffusion layer.
The main contribution of this paper is to investigate the degradation rate of a PEM fuel cell stack, with
a power of 5 kW dedicated to transport applications, undergoing a succession of start/stop cycles for
2,600 hours. Moreover, the PEM fuel cell shutdown strategy discussed in this paper is done without
any purge. Both anode and cathode compartments are closed simultaneously so that they are no
longer supplied with gas when the dummy load is connected. By adding this device, all residual amount
of oxygen in the catalyst layer and gas diffusion layer are consumed quickly to limit the fuel/air
interface as much as possible as explained in [22].
From this aim, this paper first introduces the experimental setup with PEMFC and test bench
specifications and then the experimental protocol is described in detail in Section 2. The experimental
results are given in Section 3 by considering the voltage degradation, the characterization
measurements as well as the degradation rate observed on this automotive PEMFC short stack. Finally,
results are discussed integrating degradation rates observed for start/stop cycles and long resting
times. A conclusion is proposed in Section 4.
2. Experimental setup
2.1. Fuel cell stack specifications and test bench
In this study a 5 kW-PEMFC stack is devoted to start/stop duration tests. As it is a Symbio fuel cell stack,
all values are normalized by cell in order to maintain the confidentiality of such sensitive data.
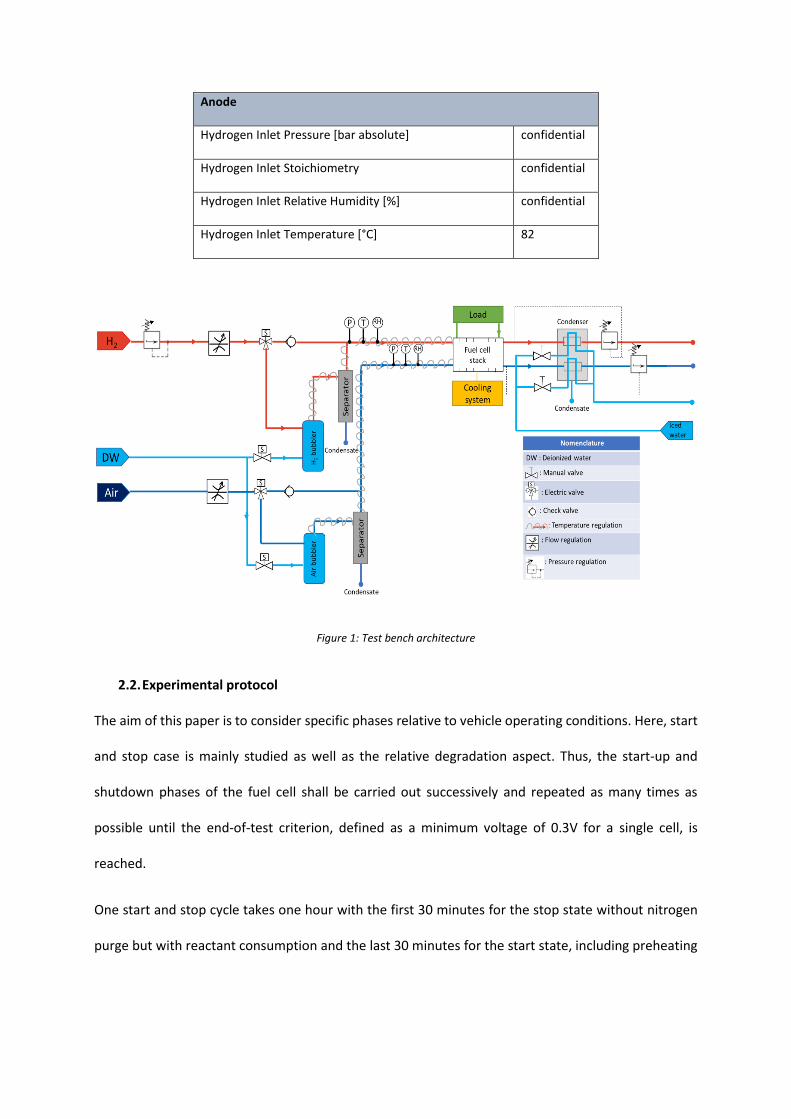
The nominal specifications are detailed in Table 1 and Figure 1 presents the general architecture of the
dedicated test bench. Both gas lines are equipped with mass flow regulators and pressure regulators.
The gases are humidified by passing through thermoregulated bubblers and they are saturated with
water vapor. Condensates are evacuated thanks to gravity separators. Both gas lines are then heated
until the fuel cell inlet with the help of self-regulating heating cables. The cooling system is composed
of two circuits connected by a water/water heat exchanger. Gas and coolant temperature, pressure
and relative humidity are measured at the inlet and the outlet of the fuel cell stack. The stack
temperature is considered as the outlet coolant temperature. All fluidic, electric and thermal
parameters are recorded all along the experiments at an acquisition frequency of 1Hz.
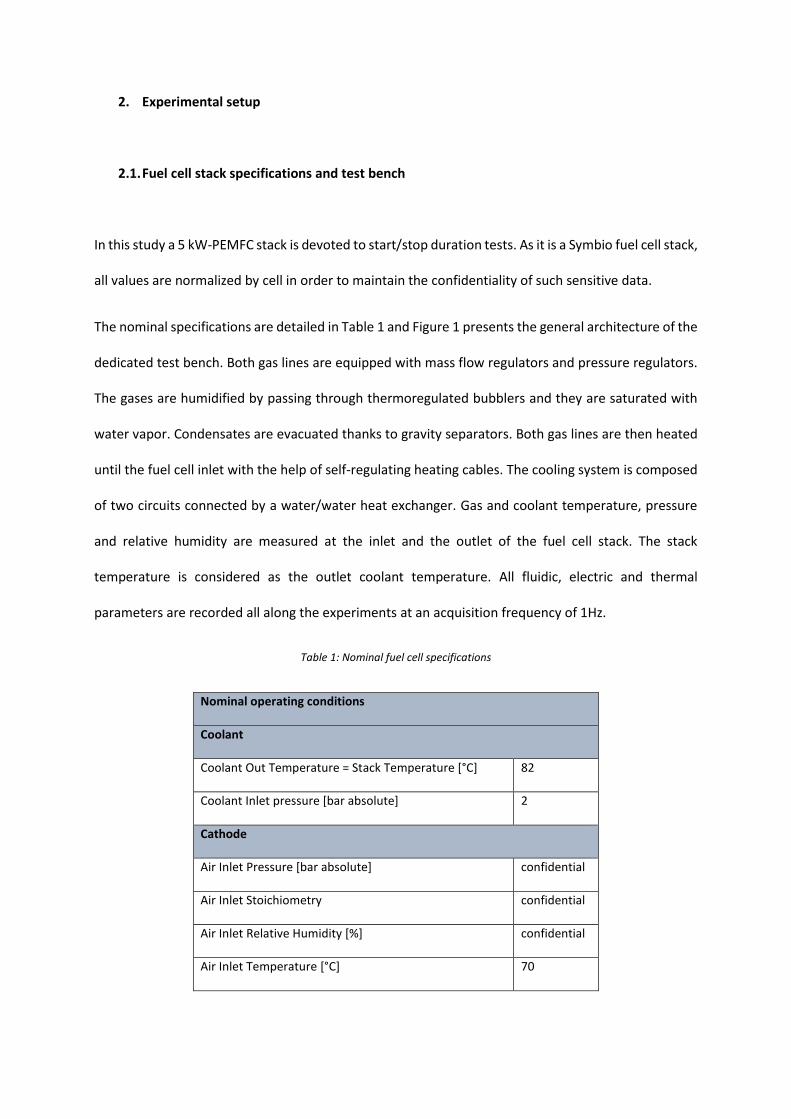
Table 1: Nominal fuel cell specifications
Nominal operating conditions
Coolant
Coolant Out Temperature = Stack Temperature [°C] 82
Coolant Inlet pressure [bar absolute] 2
Cathode
Air Inlet Pressure [bar absolute] confidential
Air Inlet Stoichiometry confidential
Air Inlet Relative Humidity [%] confidential
Air Inlet Temperature [°C] 70
Anode
Hydrogen Inlet Pressure [bar absolute] confidential
Hydrogen Inlet Stoichiometry confidential
Hydrogen Inlet Relative Humidity [%] confidential
Hydrogen Inlet Temperature [°C] 82
Figure 1: Test bench architecture
2.2. Experimental protocol
The aim of this paper is to consider specific phases relative to vehicle operating conditions. Here, start
and stop case is mainly studied as well as the relative degradation aspect. Thus, the start-up and
shutdown phases of the fuel cell shall be carried out successively and repeated as many times as
possible until the end-of-test criterion, defined as a minimum voltage of 0.3V for a single cell, is
reached.
One start and stop cycle takes one hour with the first 30 minutes for the stop state without nitrogen
purge but with reactant consumption and the last 30 minutes for the start state, including preheating
the stack coolant. The maximal reaching load during the startup step is set at 1.5A/cm². The dummy
load allows the consumption of residual oxygen in the cathode, which avoided air starvation.
The start-up and shut-down repetition (2,600 cycles) was carried out with the following steps:
1. The fuel cell is running at a current density of 1.5A/cm². The relative humidity, the pressure
and stoichiometry at anode and cathode sides are both regulated and fixed for the needs of
the fuel cell stack. The stack temperature is 82°C. After at least 30 minutes of stabilization
under these operating conditions, the shutdown procedure can start.
2. The load is shut off as well as the reactants supply. The pressure, gas temperature and
humidity regulations are also shut off. The coolant flow is maintained, and the stack
temperature decreased until reaching the ambient temperature (approx. 25°C). When
ambient temperature is reached, the cooling system is shut off. Both gas inlet solenoid valves
are closed to limit the oxygen suction from the pipe located between the valves and the stack
inlet and hence, the oxygen diffusion to the anode side. After that, the dummy load is
connected with constant current density of 0.02A/cm². The cell voltages dropped under 0.1V
indicating a primary depletion of the oxygen in the cathode side. This step of air consumption
with the dummy load is repeated 3 times to avoid the restrike of the cell voltages by consuming
the residual small amount of oxygen still located in the catalyst layer and gas diffusion layer,
as well as in the pipes upstream of the stack inlet (which have a significant length). The fuel
cell remains in these shutdown conditions for 30 minutes.
3. For the startup phase, a pre-heating step is advised just in order to discriminate damages due
to cold starts from damages due to start/stop cycling. The stack temperature is set to 82°C,
the gas temperature and humidity are shut on. A minimum reactants flow corresponding to a
current density of 0.3A/cm² is set. Then, the pressure regulation is turn on and the load is
increase stepwise (with a 0.2A.cm-².s-1 ramp) until gas flows and load reached the setpoint of
1.5A/cm². The operating conditions are stabilized for 30 minutes.
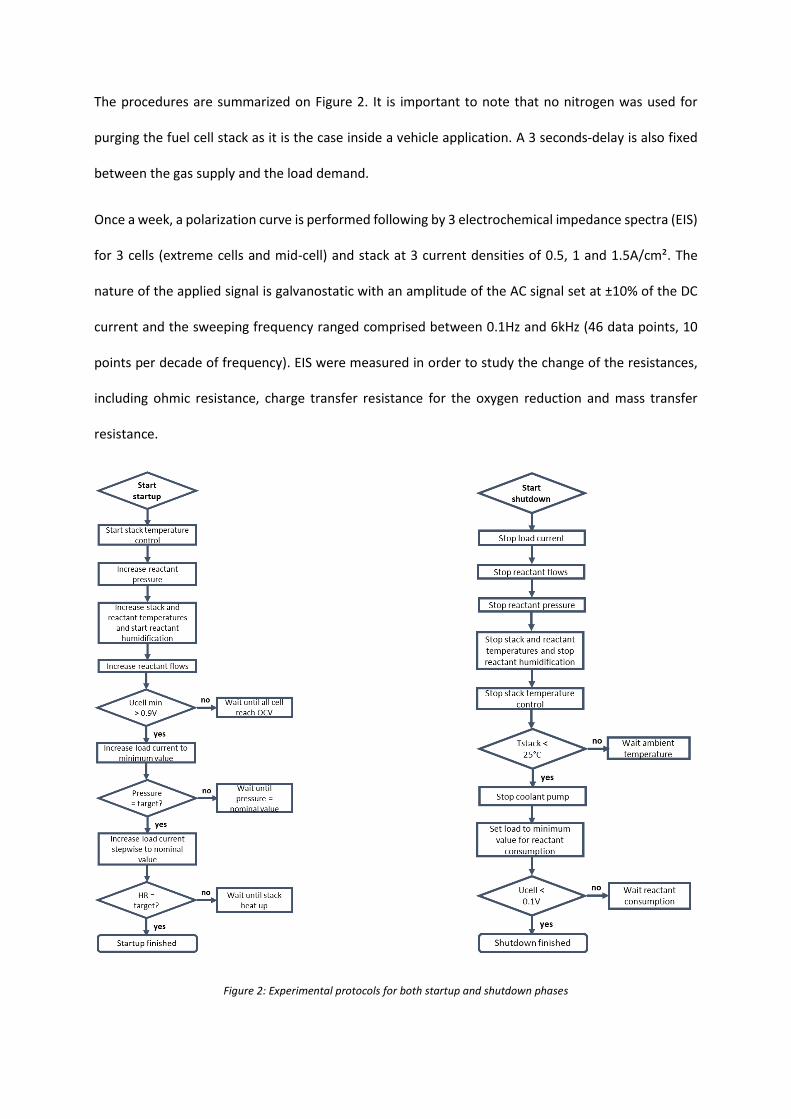
The procedures are summarized on Figure 2. It is important to note that no nitrogen was used for
purging the fuel cell stack as it is the case inside a vehicle application. A 3 seconds-delay is also fixed
between the gas supply and the load demand.
Once a week, a polarization curve is performed following by 3 electrochemical impedance spectra (EIS)
for 3 cells (extreme cells and mid-cell) and stack at 3 current densities of 0.5, 1 and 1.5A/cm². The
nature of the applied signal is galvanostatic with an amplitude of the AC signal set at ±10% of the DC
current and the sweeping frequency ranged comprised between 0.1Hz and 6kHz (46 data points, 10
points per decade of frequency). EIS were measured in order to study the change of the resistances,
including ohmic resistance, charge transfer resistance for the oxygen reduction and mass transfer
resistance.
Figure 2: Experimental protocols for both startup and shutdown phases
3. Experimental results and discussion
3.1. Performance degradation of the fuel cell with start/stop cycles – Voltage vs. current
analysis
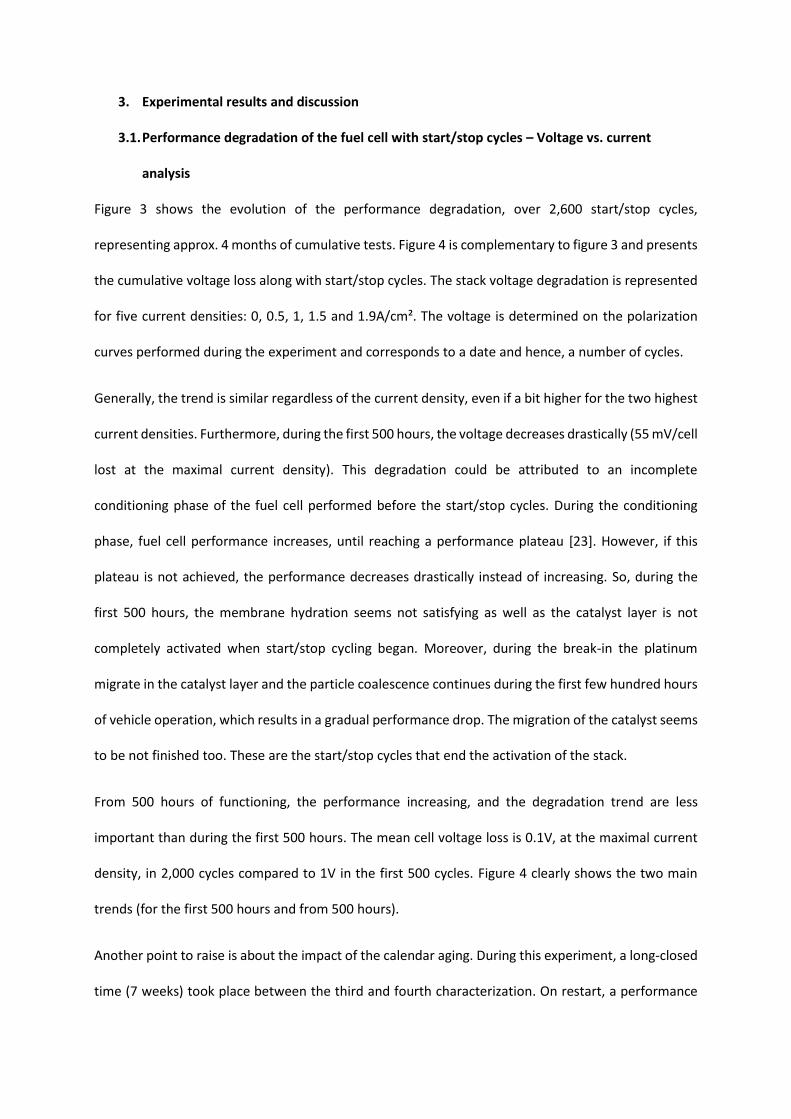
Figure 3 shows the evolution of the performance degradation, over 2,600 start/stop cycles,
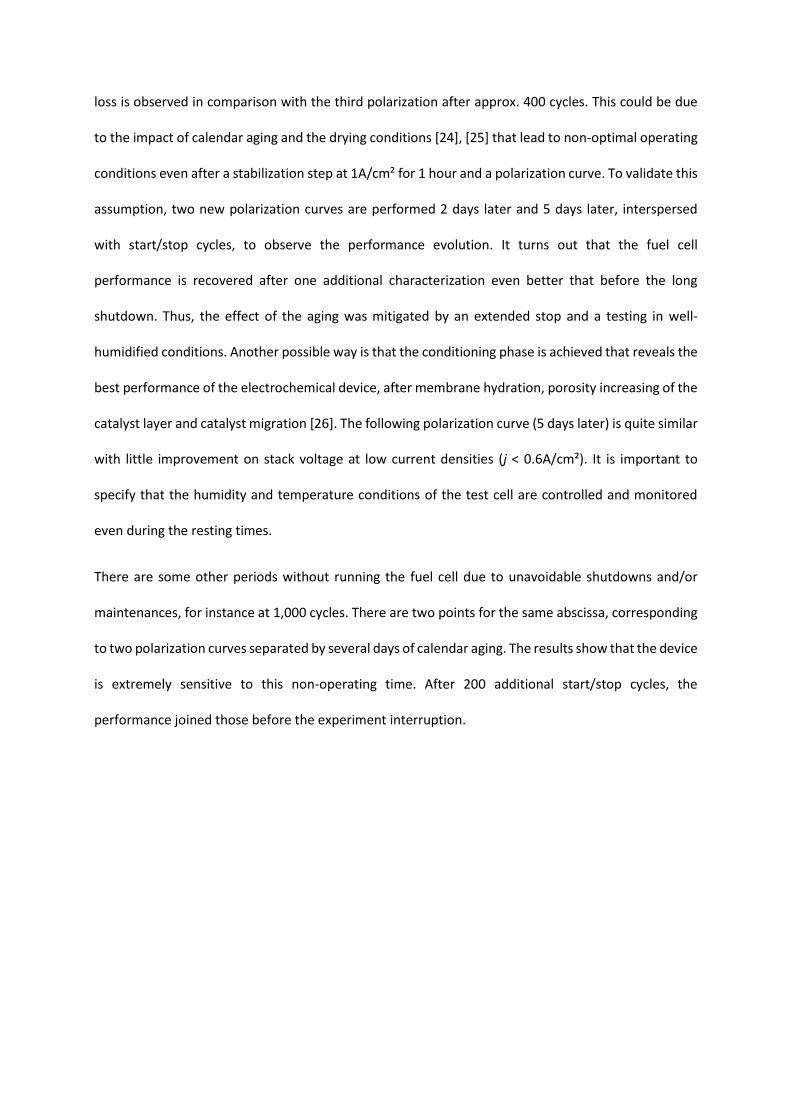
representing approx. 4 months of cumulative tests. Figure 4 is complementary to figure 3 and presents
the cumulative voltage loss along with start/stop cycles. The stack voltage degradation is represented
for five current densities: 0, 0.5, 1, 1.5 and 1.9A/cm². The voltage is determined on the polarization
curves performed during the experiment and corresponds to a date and hence, a number of cycles.
Generally, the trend is similar regardless of the current density, even if a bit higher for the two highest
current densities. Furthermore, during the first 500 hours, the voltage decreases drastically (55 mV/cell
lost at the maximal current density). This degradation could be attributed to an incomplete
conditioning phase of the fuel cell performed before the start/stop cycles. During the conditioning
phase, fuel cell performance increases, until reaching a performance plateau [23]. However, if this
plateau is not achieved, the performance decreases drastically instead of increasing. So, during the
first 500 hours, the membrane hydration seems not satisfying as well as the catalyst layer is not
completely activated when start/stop cycling began. Moreover, during the break-in the platinum
migrate in the catalyst layer and the particle coalescence continues during the first few hundred hours
of vehicle operation, which results in a gradual performance drop. The migration of the catalyst seems
to be not finished too. These are the start/stop cycles that end the activation of the stack.
From 500 hours of functioning, the performance increasing, and the degradation trend are less
important than during the first 500 hours. The mean cell voltage loss is 0.1V, at the maximal current
density, in 2,000 cycles compared to 1V in the first 500 cycles. Figure 4 clearly shows the two main
trends (for the first 500 hours and from 500 hours).
Another point to raise is about the impact of the calendar aging. During this experiment, a long-closed
time (7 weeks) took place between the third and fourth characterization. On restart, a performance
loss is observed in comparison with the third polarization after approx. 400 cycles. This could be due
to the impact of calendar aging and the drying conditions [24], [25] that lead to non-optimal operating
conditions even after a stabilization step at 1A/cm² for 1 hour and a polarization curve. To validate this
assumption, two new polarization curves are performed 2 days later and 5 days later, interspersed
with start/stop cycles, to observe the performance evolution. It turns out that the fuel cell
performance is recovered after one additional characterization even better that before the long
shutdown. Thus, the effect of the aging was mitigated by an extended stop and a testing in well-
humidified conditions. Another possible way is that the conditioning phase is achieved that reveals the
best performance of the electrochemical device, after membrane hydration, porosity increasing of the
catalyst layer and catalyst migration [26]. The following polarization curve (5 days later) is quite similar
with little improvement on stack voltage at low current densities (j < 0.6A/cm²). It is important to
specify that the humidity and temperature conditions of the test cell are controlled and monitored
even during the resting times.
There are some other periods without running the fuel cell due to unavoidable shutdowns and/or
maintenances, for instance at 1,000 cycles. There are two points for the same abscissa, corresponding
to two polarization curves separated by several days of calendar aging. The results show that the device
is extremely sensitive to this non-operating time. After 200 additional start/stop cycles, the
performance joined those before the experiment interruption.
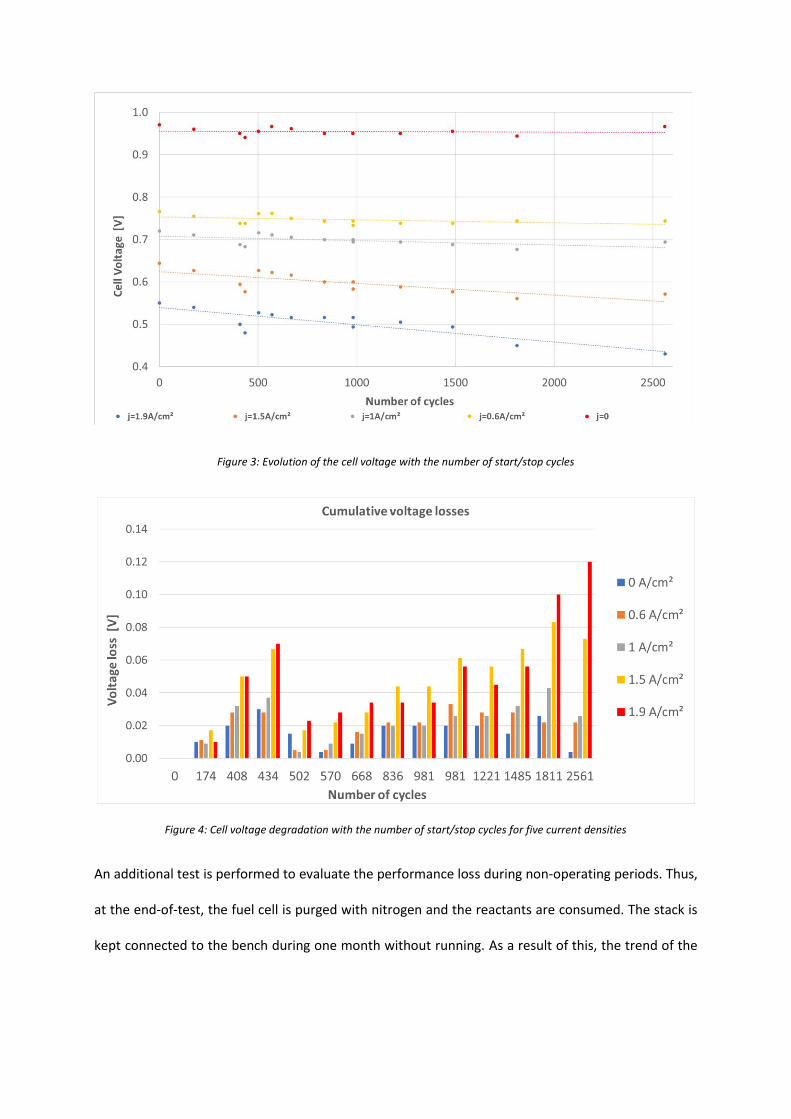
Figure 3: Evolution of the cell voltage with the number of start/stop cycles
Figure 4: Cell voltage degradation with the number of start/stop cycles for five current densities
An additional test is performed to evaluate the performance loss during non-operating periods. Thus,
at the end-of-test, the fuel cell is purged with nitrogen and the reactants are consumed. The stack is
kept connected to the bench during one month without running. As a result of this, the trend of the
polarization curve is lower than one month before. The influence of the calendar aging is thus clearly
visible on Figure 5.
Figure 5: Comparison between polarization curves along start/stop cycles
Based on Figure 3, the degradation rate can be calculated to Equation 1.
𝐷𝑒𝑔𝑟𝑎𝑑𝑎𝑡𝑖𝑜𝑛 𝑟𝑎𝑡𝑒 [µV/cell/h] = 𝑣𝑜𝑙𝑡𝑎𝑔𝑒 𝑎𝑡 𝐸𝑜𝑇 [µ𝑉]−𝑣𝑜𝑙𝑡𝑎𝑔𝑒 𝑎𝑡 𝐵𝑜𝑇 [µ𝑉]
𝑇𝑖𝑚𝑒 [ℎ]/𝑁𝑢𝑚𝑏𝑒𝑟 𝑜𝑓 𝑐𝑒𝑙𝑙𝑠 (1)
The voltage at 0.5A/cm² decreased from 0.76V/cell to 0.74V/cell, with the degradation rate of
10µV/cell/h. For the nominal current density at 1A/cm², the voltage decreased from 13V to 12.4V that
leads to a degradation rate of 13µV/cell/h. While at 1.5A/cm², the rate is 28 µV/cell/h and 49µV/cell/h
for the maximal current density of 1.9A/cm². As one might expect, the degradation is higher at a high
current density than at a lower current density as the MEA could not provide enough active sites for
electrochemical reaction at high current density [27].
3.2. Performance degradation of the fuel cell with start/stop cycles – EIS analysis
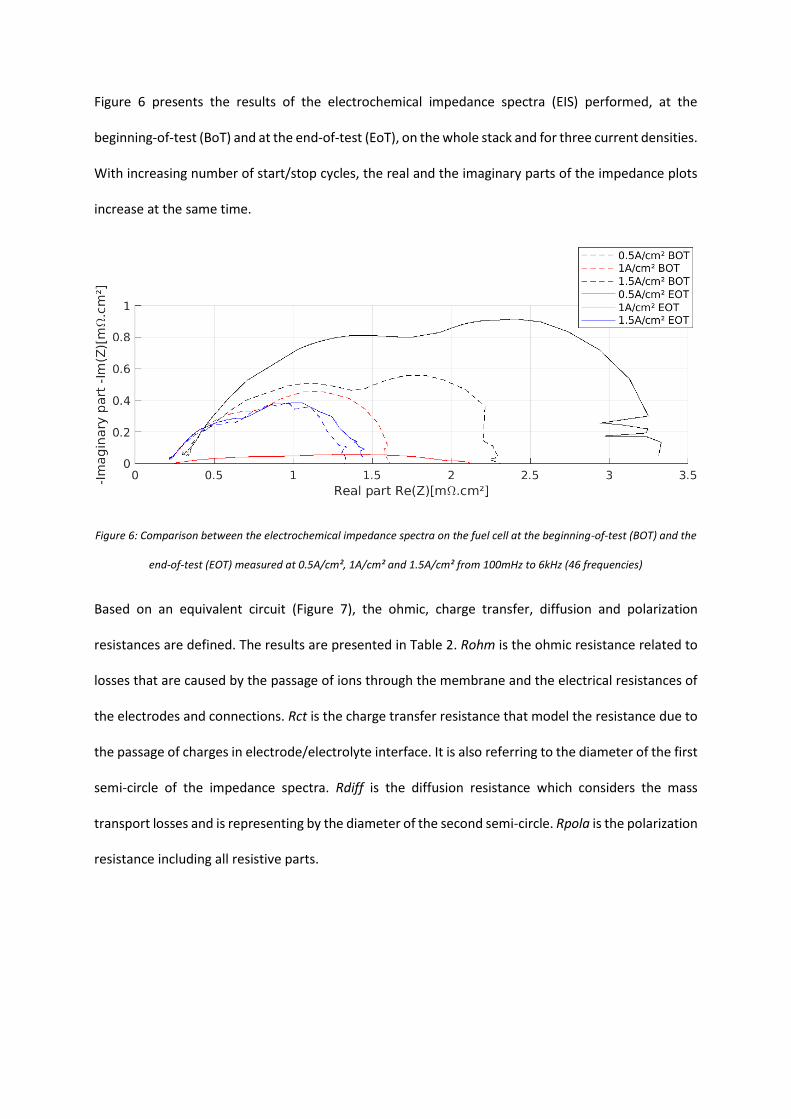
Figure 6 presents the results of the electrochemical impedance spectra (EIS) performed, at the
beginning-of-test (BoT) and at the end-of-test (EoT), on the whole stack and for three current densities.
With increasing number of start/stop cycles, the real and the imaginary parts of the impedance plots
increase at the same time.
Figure 6: Comparison between the electrochemical impedance spectra on the fuel cell at the beginning-of-test (BOT) and the
end-of-test (EOT) measured at 0.5A/cm², 1A/cm² and 1.5A/cm² from 100mHz to 6kHz (46 frequencies)
Based on an equivalent circuit (Figure 7), the ohmic, charge transfer, diffusion and polarization
resistances are defined. The results are presented in Table 2. Rohm is the ohmic resistance related to
losses that are caused by the passage of ions through the membrane and the electrical resistances of
the electrodes and connections. Rct is the charge transfer resistance that model the resistance due to
the passage of charges in electrode/electrolyte interface. It is also referring to the diameter of the first
semi-circle of the impedance spectra. Rdiff is the diffusion resistance which considers the mass
transport losses and is representing by the diameter of the second semi-circle. Rpola is the polarization
resistance including all resistive parts.
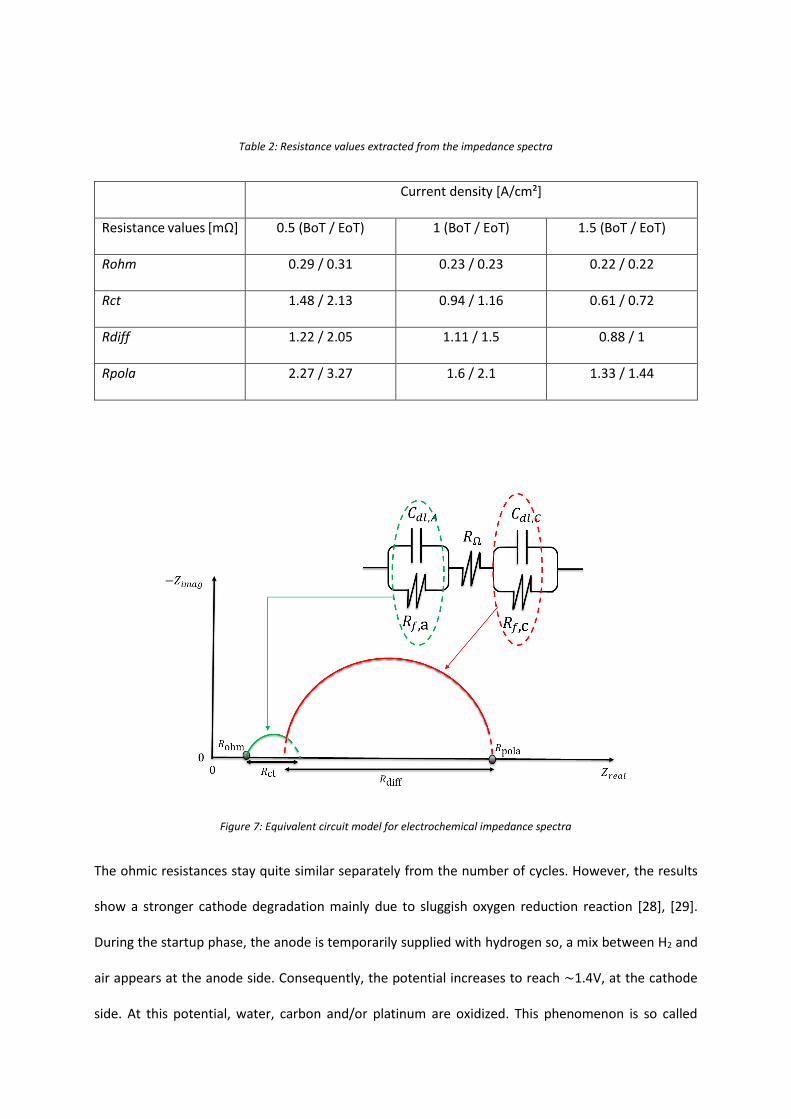
Table 2: Resistance values extracted from the impedance spectra
Current density [A/cm²]
Resistance values [mΩ] 0.5 (BoT / EoT) 1 (BoT / EoT) 1.5 (BoT / EoT)
Rohm 0.29 / 0.31 0.23 / 0.23 0.22 / 0.22
Rct 1.48 / 2.13 0.94 / 1.16 0.61 / 0.72
Rdiff 1.22 / 2.05 1.11 / 1.5 0.88 / 1
Rpola 2.27 / 3.27 1.6 / 2.1 1.33 / 1.44
Figure 7: Equivalent circuit model for electrochemical impedance spectra
The ohmic resistances stay quite similar separately from the number of cycles. However, the results
show a stronger cathode degradation mainly due to sluggish oxygen reduction reaction [28], [29].
During the startup phase, the anode is temporarily supplied with hydrogen so, a mix between H2 and
air appears at the anode side. Consequently, the potential increases to reach ~1.4V, at the cathode
side. At this potential, water, carbon and/or platinum are oxidized. This phenomenon is so called
“reverse current decay mechanism” [28], [30], [31]. During start/stop phase, the fuel cell degradation
is related with the high open circuit voltage which implies that the main degradation is related to the
corrosion of the carbon support [18], [32]. The polarization resistance is higher at low current density
because of the limiting gas flows that increase the charge transfer resistance (first semi-circle) and the
diffusion resistance because the produced water is far less evacuated with the aging. It was found that
carbon corrosion reduced the hydrophobicity of the pores in the catalytic layer, making it more prone
to flooding [33].
4. Conclusion
This study deals with a long duration tests of a PEMFC stack under start/stop cycling. The main purpose
is to propose a scientific analysis of the impact of such repetitive cycles on the fuel cell performance.
The study rests on several measurements such as voltage, polarization curve, impedance spectra and
also the degradation rate calculation depending on the number of cycles and the current density. It is
shown that startup and shutdown phases clearly impact the MEA and especially the carbon support
which is exposed to corrosion during air/fuel boundaries. This leads to an increase of the global
resistance (Rpola) of 50% at the lower current density. Another phenomenon observed during this
experiment is the aging due to long resting time. During these periods, the fuel cell is drying out, which
is leading to a performance loss at the restart. The performance recovery is achieved after several
operating hours and a remoisturing of the membrane. Indeed, the performance after 2,600 start/stop
cycles remains in the degradation ranges obtained in the literature [18], with 5% and 10% loss of
performance versus fresh MEA, respectively for a nominal current density of 1A/cm² and 1.5A/cm²
(maximal current during start phase). Moreover, the Fuel Cell Technical Team Roadmap defined by the
US DoE [34] targeted several degradation rates when considering unmitigated start/stop durability
protocol with:
- less than 5% change for a voltage at 1.2A/cm²;
- less than 5% change for the high frequency resistance (Rohm) at 1.2A/cm²;
- less than 10% change for the low frequency resistance (Rpola) at 1.2A/cm².
In our experiment, no information is collected for a current density of 1.2A/cm². However, both points
at 1A/cm² and 1.5A/cm² can be considered as they are very close to 1.2A/cm². Our results showed that
the voltage loss at 1A/cm² is 3.6% change, the resistance Rohm has not changed at either 1A/cm² or
1.5A/cm², while Rpola is 8% change at 1.5A/cm². All these results concur to say that the degradation
levels respect the target degradations given by the US DoE.
Apart from start/stop cycles, 1,300 hours of operation have been performed, corresponding to the
cumulative start phases (30 minutes for each). As future work, further investigations need to be
achieved in order to be able to decorrelate the degradations related to the starts and stops, to OCV
phases and load demand states.
5. Acknowledgment
Symbio a Faurecia Michelin hydrogen company since November 2019 is a global technology partner
for fuel cell systems. This work is carried out in the framework of a general agreement and a scientific
collaboration between SYMBIO and FEMTO-ST/FCLAB since 2018. This work has been supported by
the EIPHI Graduate School (contract ANR-17-EURE-0002) and the Region Bourgogne Franche-Comté
and the French National H2 & Fuel Cell Network (FRH2 CNRS).
References
[1] J. Seo, J. Park, J. Park, and S. Park, “Emission factor development for light-duty vehicles based
on real-world emissions using emission map-based simulation,” Environ. Pollut., vol. 270, p.
116081, 2021.
[2] J. Park, M. Shin, J. Lee, and J. Lee, “Estimating the effectiveness of vehicle emission
regulations for reducing NOx from light-duty vehicles in Korea using on-road measurements,”
Sci. Total Environ., vol. 767, no. 2, p. 144250, 2021.
[3] J. J. Hernández, J. Rodríguez-Fernández, and A. Calle-Asensio, “Performance and regulated
gaseous emissions of a Euro 6 diesel vehicle with Lean NOx Trap at different ambient
conditions: Sensitivity to the type of fuel,” Energy Convers. Manag., vol. 219, no. May, p.
113023, 2020.
[4] R. García-Contreras et al., “Impact of regulated pollutant emissions of Euro 6d-Temp light-
duty diesel vehicles under real driving conditions,” J. Clean. Prod., vol. 286, 2021.
[5] E. Commission, “CO2 emission performance standards for cars and vans (2020 onwards),”
2020. [Online]. Available:
https://ec.europa.eu/clima/policies/transport/vehicles/regulation_en#tab-0-0.
[6] European environment Agency, “Greenhouse gas emissions from transport in Europe,” 2020.
[Online]. Available: https://www.eea.europa.eu/data-and-maps/indicators/transport-
emissions-of-greenhouse-gases-7/assessment.
[7] J. Claßen et al., “Statistically supported real driving emission calibration: Using cycle
generation to provide vehicle-specific and statistically representative test scenarios for Euro
7,” Int. J. Engine Res., vol. 21, no. 10, pp. 1783–1799, Dec. 2020.
[8] M. Puškár and M. Kopas, “System based on thermal control of the HCCI technology developed
for reduction of the vehicle NOX emissions in order to fulfil the future standard Euro 7,” Sci.
Total Environ., vol. 643, pp. 674–680, 2018.
[9] Q. S. Wei, X. Zhang, and B. S. Oh, “The effect of driving cycles and H2 production pathways on
the lifecycle analysis of hydrogen fuel cell vehicle: A case study in South Korea,” Int. J.
Hydrogen Energy, vol. 46, no. 10, pp. 7622–7633, 2021.
[10] A. Ferrara, S. Jakubek, and C. Hametner, “Energy management of heavy-duty fuel cell vehicles
in real-world driving scenarios: Robust design of strategies to maximize the hydrogen
economy and system lifetime,” Energy Convers. Manag., vol. 232, p. 113795, 2021.
[11] F. Liu, D. L. Mauzerall, F. Zhao, and H. Hao, “ScienceDirect Deployment of fuel cell vehicles in
China : Greenhouse gas emission reductions from converting the heavy-duty truck fleet from
diesel and natural gas to hydrogen,” Int. J. Hydrogen Energy, no. xxxx, 2021.
[12] U. Khan, T. Yamamoto, and H. Sato, “An insight into potential early adopters of hydrogen fuel-
cell vehicles in Japan,” Int. J. Hydrogen Energy, vol. 46, no. 18, pp. 10589–10607, 2021.
[13] V. Oldenbroek, S. Wijtzes, K. Blok, and A. J. M. van Wijk, “Fuel cell electric vehicles and
hydrogen balancing 100 percent renewable and integrated national transportation and
energy systems,” Energy Convers. Manag. X, vol. 9, no. September 2020, p. 100077, 2021.
[14] D. L. Greene, J. M. Ogden, and Z. Lin, “Challenges in the designing, planning and deployment
of hydrogen refueling infrastructure for fuel cell electric vehicles,” eTransportation, vol. 6, p.
100086, 2020.
[15] R. Stotts, O. G. Lopez-Jaramillo, S. Kelley, A. Krafft, and M. Kuby, “How drivers decide whether
to get a fuel cell vehicle: An ethnographic decision model,” Int. J. Hydrogen Energy, vol. 46,
no. 12, pp. 8736–8748, 2021.
[16] Hydrogen and Fuel Cell Technologies Office, “DOE Technical Targets for Fuel Cell Systems and
Stacks for Transportation Applications.” [Online]. Available:
https://www.energy.gov/eere/fuelcells/doe-technical-targets-fuel-cell-systems-and-stacks-
transportation-applications.
[17] P. Pei, Q. Chang, and T. Tang, “A quick evaluating method for automotive fuel cell lifetime,”
Int. J. Hydrogen Energy, vol. 33, no. 14, pp. 3829–3836, 2008.
[18] C. Lorenzo, D. Bouquain, S. Hibon, and D. Hissel, “Synthesis of degradation mechanisms and of
their impacts on degradation rates on proton-exchange membrane fuel cells and lithium-ion
nickel–manganese–cobalt batteries in hybrid transport applications,” Reliab. Eng. Syst. Saf.,
vol. 212, p. 107369, Aug. 2021.
[19] A. Oyarce et al., “Comparing shut-down strategies for proton exchange membrane fuel cells,”
J. Power Sources, vol. 254, pp. 232–240, 2014.
[20] R. Lin, D. Liu, S. Xia, T. Ma, and B. Dutruel, “Stack shut-down strategy optimisation of proton
exchange membrane fuel cell with the segment stack technology,” Int. J. Hydrogen Energy,
vol. 45, no. 1, pp. 1030–1044, 2020.
[21] Y. Yang, W. Li, R. Lin, S. Xia, and Z. Jiang, “Impact of dummy load shut-down strategy on
performance and durability of proton exchange membrane fuel cell stack,” J. Power Sources,
vol. 404, no. October 2017, pp. 126–134, 2018.
[22] Q. Zhang, R. Lin, X. Cui, S. X. Xia, Z. Yang, and Y. T. Chang, “Study of the two-phase dummy
load shut-down strategy for proton exchange membrane fuel cells,” J. Power Sources, vol.
341, pp. 230–239, Feb. 2017.
[23] F. Van der Linden, E. Pahon, S. Morando, and D. Bouquain, “Optimizing Proton Exchange
Membrane Fuel Cell manufacturing process to reduce break-in time,” in 2020 IEEE Vehicle
Power and Propulsion Conference (VPPC), 2020, pp. 1–5.
[24] E. Pahon, S. Jemei, J. P. Chabriat, and D. Hissel, “Impact of the temperature on calendar aging
of an open cathode fuel cell stack,” J. Power Sources, vol. 488, no. January, p. 229436, 2021.
[25] Z. Qi, H. Tang, Q. Guo, and B. Du, “Investigation on ‘saw-tooth’ behavior of PEM fuel cell
performance during shutdown and restart cycles,” J. Power Sources, vol. 161, no. 2, pp. 864–
871, 2006.
[26] S. Ueda, S. Koizumi, and Y. Tsutsumi, “Initial conditioning of a polymer electrolyte fuel cells:
The relationship between microstructure development and cell performance, investigated by
small-angle neutron scattering,” Results Phys., vol. 12, no. October 2018, pp. 1871–1879,
2019.
[27] J. Parra-Restrepo et al., “Influence of the porous transport layer properties on the mass and
charge transfer in a segmented PEM electrolyzer,” Int. J. Hydrogen Energy, vol. 45, no. 15, pp.
8094–8106, Mar. 2020.
[28] R. Lin, X. Cui, J. Shan, L. Técher, F. Xiong, and Q. Zhang, “Investigating the effect of start-up
and shut-down cycles on the performance of the proton exchange membrane fuel cell by
segmented cell technology,” Int. J. Hydrogen Energy, vol. 40, no. 43, pp. 14952–14962, 2015.
[29] P. Ren, P. Pei, Y. Li, Z. Wu, D. Chen, and S. Huang, “Degradation mechanisms of proton
exchange membrane fuel cell under typical automotive operating conditions,” Prog. Energy
Combust. Sci., vol. 80, p. 100859, Sep. 2020.
[30] H. Tang, Z. Qi, M. Ramani, and J. F. Elter, “PEM fuel cell cathode carbon corrosion due to the
formation of air/fuel boundary at the anode,” J. Power Sources, vol. 158, no. 2, pp. 1306–
1312, 2006.
[31] F. Jia, F. Liu, L. Guo, and H. Liu, “Mechanisms of reverse current and mitigation strategies in
proton exchange membrane fuel cells during startups,” Int. J. Hydrogen Energy, vol. 41, no.
15, pp. 6469–6475, 2016.
[32] J. Zhao, Z. Tu, and S. H. Chan, “Carbon corrosion mechanism and mitigation strategies in a
proton exchange membrane fuel cell (PEMFC): A review,” J. Power Sources, vol. 488, no.
January, p. 229434, 2021.
[33] S.R. Dhanushkodi, S. Kundu, M.W. Fowler, M.D. Pritzke, “Use of mechanistic carbon corrosion
model to predict performance loss in Polymer Electrolyte Membrane fuel cells“, J. Power
Sources, vol. 267, pp. 171-181, 2014.
[34] DOE Hydrogen, “Fuel Cell Technical Team Roadmap,” 2017.
Related Documents


