http://jim.sagepub.com/ Structures Journal of Intelligent Material Systems and http://jim.sagepub.com/content/early/2013/06/12/1045389X13491019 The online version of this article can be found at: DOI: 10.1177/1045389X13491019 published online 18 June 2013 Journal of Intelligent Material Systems and Structures Abdessattar Abdelkefi, Zhimiao Yan and Muhammad R Hajj cross-section geometries Performance analysis of galloping-based piezoaeroelastic energy harvesters with different Published by: http://www.sagepublications.com can be found at: Journal of Intelligent Material Systems and Structures Additional services and information for http://jim.sagepub.com/cgi/alerts Email Alerts: http://jim.sagepub.com/subscriptions Subscriptions: http://www.sagepub.com/journalsReprints.nav Reprints: http://www.sagepub.com/journalsPermissions.nav Permissions: What is This? - Jun 18, 2013 OnlineFirst Version of Record >> at Virginia Tech on June 18, 2013 jim.sagepub.com Downloaded from

Welcome message from author
This document is posted to help you gain knowledge. Please leave a comment to let me know what you think about it! Share it to your friends and learn new things together.
Transcript

http://jim.sagepub.com/Structures
Journal of Intelligent Material Systems and
http://jim.sagepub.com/content/early/2013/06/12/1045389X13491019The online version of this article can be found at:
DOI: 10.1177/1045389X13491019
published online 18 June 2013Journal of Intelligent Material Systems and StructuresAbdessattar Abdelkefi, Zhimiao Yan and Muhammad R Hajj
cross-section geometriesPerformance analysis of galloping-based piezoaeroelastic energy harvesters with different
Published by:
http://www.sagepublications.com
can be found at:Journal of Intelligent Material Systems and StructuresAdditional services and information for
http://jim.sagepub.com/cgi/alertsEmail Alerts:
http://jim.sagepub.com/subscriptionsSubscriptions:
http://www.sagepub.com/journalsReprints.navReprints:
http://www.sagepub.com/journalsPermissions.navPermissions:
What is This?
- Jun 18, 2013OnlineFirst Version of Record >>
at Virginia Tech on June 18, 2013jim.sagepub.comDownloaded from

Original Article
Journal of Intelligent Material Systemsand Structures0(0) 1–11� The Author(s) 2013Reprints and permissions:sagepub.co.uk/journalsPermissions.navDOI: 10.1177/1045389X13491019jim.sagepub.com
Performance analysis ofgalloping-based piezoaeroelasticenergy harvesters with differentcross-section geometries
Abdessattar Abdelkefi, Zhimiao Yan and Muhammad R Hajj
AbstractThe concept of harvesting energy from galloping oscillations of a bluff body with different cross-section geometriesattached to a cantilever beam is investigated. To convert these oscillations into electrical power, a piezoelectric transdu-cer is attached to the transverse degree of freedom of the prismatic structure. Modal analysis is performed to determinethe exact mode shapes of the structure. A coupled nonlinear distributed-parameter model is developed to determinethe effects of the cross-section geometry, load resistance, and wind speed on the level of the harvester power. Thequasi-steady approximation is used to model the aerodynamic loads. Linear analysis is performed to investigate theeffects of the electrical load resistance and the cross-section geometry on the onset speed of galloping. The results showthat the electrical load resistance and the cross-section geometry affect significantly the onset speed of galloping.Nonlinear analysis is performed to determine the effects of the electrical load resistance, cross-section geometry, andwind speed on the system’s outputs and particularly the level of the harvested power. A comparison of the performanceof the different cross sections in terms of displacement and harvested power is presented. The results show that differ-ent sections are better for harvesting energy over different regions of the flow speed. The results also show that maxi-mum levels of harvested power are accompanied with minimum transverse displacement amplitudes for all considered(square, D, and triangular) cross-section geometries.
KeywordsEnergy harvesting, galloping phenomenon, piezoelectric material, nonlinear analysis
Introduction
Harvesting energy from aeroelastic responses has beenthe topic of several recent investigations (Abdelkefi etal., 2012a, 2012b, 2012c, 2012d, 2012e; Bryant andGarcia, 2009; De Marqui et al., 2010; Erturk et al.,2010). Different aeroelastic phenomena including wingflutter and vortex-induced vibrations were considered.Erturk et al. (2010) presented a frequency domainanalysis and experimental validations for a two-degree-of-freedom (DOF) airfoil section as a wing-basedpiezoaeroelastic energy harvester. They focused on har-vesting energy near the flutter boundary and reported aharvested power of 10.7 mW for an electrical load resis-tance of 100 kO for a freestream velocity close to thelinear flutter speed that is 9.30 m/s. Abdelkefi et al.(2012a, 2012b, 2012c) focused on the nonlinear aspectsof piezoaeroelastic energy harvesters and on generatingenergy at low freestream velocities through limit cycleoscillations (LCO). Akaydin et al. (2010) investigated
the possibility of harvesting energy from vortex-inducedvibrations. They performed experiments on energy har-vesting from a turbulent flow exhibiting a large degreeof coherence in its spatial and temporal scales. Theyconsidered several orientations of a thin flexible cantile-ver beam consisting of a polyvinylidene difluoride(PVDF) layer and a mylar substrate. They demon-strated that the best orientation is when the beam isparallel to the upstream flow. They reported that themaximum levels of energy harvesting are obtained whenthe natural frequency of the piezoelectric generator is
Department of Engineering Science and Mechanics, Virginia Polytechnic
Institute and State University, Blacksburg, VA, USA
Corresponding author:
Abdessattar Abdelkefi, Department of Engineering Science and
Mechanics, Virginia Polytechnic Institute and State University, MC 0219,
Blacksburg, VA 24061, USA.
Email: [email protected]
at Virginia Tech on June 18, 2013jim.sagepub.comDownloaded from

tuned to the vortex shedding frequency. Abdelkefi et al.(2012d) investigated the concept of harvesting energyfrom vortex-induced vibrations of a circular cylinder.They developed a phenomenological model thataccounts for the coupled lift force, cylinder motion, andgenerated voltage. They performed linear and nonlinearanalyses to determine the effects of the load resistanceand wind speed on the onset of synchronization andlevel of harvested power. They also showed that theassociated nonlinearity with the vortex-induced oscilla-tions results in a hardening behavior and hysteresis.Mehmood et al. (2013) investigated the possibility ofharvesting energy from vortex-induced vibrations of cir-cular cylinders at low Reynolds numbers. They per-formed tightly coupled simulations of the fluid,cylinder’s response, and piezoelectric transduction anddetermined that the synchronization region widenswhen the load resistance is increased. They showed thatthere is an optimum value of the load resistance forwhich the harvested power is maximum, which doesnot correspond to the largest cylinder oscillations.
Another aeroelastic phenomenon that has shownpremise for harvesting energy is the galloping of pris-matic structures. Sirohi and Mahadik (2011) proposedharvesting energy from transverse galloping of a struc-ture that has an equilateral triangle section. Surface-bonded piezoelectric sheets that are attached to twobeams connected to the structure were used to generatepower. Their device generated more than 50 mW at awind speed of 11.6 mile/h; a power level that is suffi-cient to supply most of the commercially availablewireless sensors. Abdelkefi et al. (2013a) derived a non-linear distributed-parameter model for galloping-basedpiezoaeroelastic energy harvesters. They validated theirnumerical results with the experimental measurementsof Sirohi and Mahadik (2011). To this end, they mod-eled the low frontal area in the clamped side of thebeams by a nonlinear torsional spring. They showedthat the nonlinear contribution of the torsional springaffects significantly the level of the harvested power.They also reported that maximum levels of harvestedpower are accompanied by minimum transverse displa-cement amplitudes for a band of load resistances.Abdelkefi et al. (2012f) investigated the concept ofexploiting the galloping of square cylinders to harvestenergy. Their focus was on the effect of the Reynoldsnumber on the aerodynamic force, the onset of gallop-ing, and the level of the harvested power. Their resultsshowed that the electrical load resistance and theReynolds number play an important role in determin-ing the level of the harvested power and the onset ofgalloping. Furthermore, they showed that the maxi-mum levels of harvested power are accompanied withminimum transverse displacements for both low- andhigh-Reynolds number configurations.
The cross-section geometry of the prismatic gallopingstructure affects both the onset speed of instability and
ensuing oscillation amplitudes of the galloping-aeroelastic system (Abdelkefi et al., 2013b; Barrero-Gilet al., 2010). The concept of harvesting energy fromtransverse galloping oscillations of an elasticallymounted prismatic structure with different cross-sectiongeometries was investigated by Abdelkefi et al. (2013b).A single-degree-of-freedom (SDOF) modeling approach(lumped-parameter model) was used. In this modelingapproach, the cantilevered beam is considered as amass–spring–damper system. These lumped models arevery helpful because they simplify the equations ofmotion of the system and give a general overview intothe problem. However, such models are limited to thefundamental frequency of the structure and do notaccount for the characteristics of the piezoelectric andsubstrate layers as well as the placement of the piezoelec-tric sheets. Furthermore, these lumped models do notaccount for the effects of the dynamic mode shapes andstrain distribution on the electrical response of the har-vester. To design enhanced real piezoaeroelastic energyharvesters, the effects of the placement of the piezoelec-tric sheets, characteristics of the layers, and mode shapeshave to be considered. To this end, we develop, in thiswork, a nonlinear distributed-parameter model that iscapable of predicting levels of harvested power that canbe generated from galloping oscillations of elastic beamswith different cross-section geometries, wind speeds, andload resistances. Particularly, we aim to determine theeffects of the cross-section geometry and electrical loadresistance on the performance of a galloping-basedpiezoaeroelastic energy harvester. The proposed harvest-er’s design and the governing equations are presented insection ‘‘Modeling of the galloping-based piezoaeroelas-tic system.’’ The quasi-steady approximation is used tomodel the aerodynamic loads. The background and jus-tification for using this representation are discussed insection ‘‘Modeling of the aerodynamic galloping forceand moment.’’ In section ‘‘Representative model of theharvester’s response,’’ modal analysis is performed and arepresentative model for the galloping-based harvester isderived. Linear and nonlinear analyses of the system areperformed in sections ‘‘Linear analysis’’ and ‘‘Nonlinearanalysis: effects of the load resistance, cross-section geo-metry, and wind speed on the harvester’s performance,’’respectively, to investigate the effects of the cross-sectiongeometry and electrical load resistance on the onset ofgalloping and the harvested power, voltage output, anddisplacement amplitude. The conclusions are presentedin section ‘‘Conclusions.’’
Modeling of the galloping-basedpiezoaeroelastic system
The energy harvester is composed of a tip mass pris-matic structure attached to a multilayered cantileverbeam. This system undergoes galloping in the
2 Journal of Intelligent Material Systems and Structures 0(0)
at Virginia Tech on June 18, 2013jim.sagepub.comDownloaded from

transverse direction when subjected to an incomingflow, as shown in the schematic presented in Figure 1.The cantilever beam consists of aluminum and piezo-electric layers. The piezoelectric sheets are bounded bytwo in-plane electrodes of negligible thicknesses con-nected in parallel with opposite polarity to an electricalload resistance. The geometric and physical propertiesof the harvester used in the current analysis are pre-sented in Table 1.
The transverse vibration y = y(x, t) of the cantileverbeam is obtained by using the Euler–Bernoulli beamassumptions, which yields
∂2M(x, t)
∂x2+ ca
∂y(x, t)
∂t+m
∂2y(x, t)
∂t2
=Ftipd(x� L)�Mtip
dd(x� L)
dx
ð1Þ
where d(x) is the Dirac delta function; Ftip and Mtip arethe galloping aerodynamic force and moment,
respectively, at the tip of the beam that are caused by theoscillation of the structure; L is the length of the beam; ca
is the viscous air damping coefficient; m is the mass of thebeam per unit length; and M(x, t) is the internal momentthat has three components. The first of these componentsis the resistance to bending and is given by EI(∂2y(x, t)=∂x2). The second component is due to strain rate dampingeffect and is represented by csI(∂
3y(x, t)=∂x2∂t). The thirdcomponent is the contribution of the piezoelectric sheets,which are connected in parallel. This contribution is rep-resented by qp(H(x� L1)� H(x� L2))V (t) where H(x) isthe Heaviside step function, V (t) is the generated voltage,L1 is the distance from the left end of cantilever beam tothe starting location of the piezoelectric sheet, L2 is thedistance from the left end of cantilever beam to the end-ing location of the piezoelectric sheet, and qp is the piezo-electric coupling term (Erturk and Inman, 2009). Thisterm is given by
qp = � e31b2(hp + hs) ð2Þ
where e31 =Epd31 is the piezoelectric stress coefficient,b2 is the width of the piezoelectric layer, and hs and hp
are the thicknesses of the aluminum and piezoelectriclayers, respectively.
Substituting for the moment M(x, t) its three compo-nents in equation (1), the equation of motion of theelectromechanical system is written as
EI∂4v(x, t)
∂x4+ csI
∂5v(x, t)
∂x4∂t+ ca
∂v(x, t)
∂t+m
∂2v(x, t)
∂t2
+dd(x� L1)
dx� dd(x� L2)
dx
� �qpV (t)
=Ftipd(x� L)�Mtip
dd(x� L)
dx
ð3Þ
where the stiffness EI and mass of the beam per unitlength m are given by
EI =EI1 =1
12b1Eshs
3 andm=m1 = b1rshs
for 0 < x\L1 orL2\x < L
Figure 1. A schematic diagram of the piezoaeroelastic energy harvester.
Table 1. Physical and geometric properties of the cantileverbeam and the tip body.
Es Aluminum Young’s modulus (GN=m2) 70Ep Piezoelectric material Young’s modulus
(GN=m2)62
rs Aluminum density (kg=m3) 2700rp Piezoelectric material density (kg=m3) 7800L Length of the beam (mm) 90L1 Left of the beam to starting of the
piezoelectric layer (mm)0
L2 Left of the beam to ending of thepiezoelectric layer (mm)
72:2
b1 Width of the aluminum layer (mm) 38b2 Width of the piezoelectric layer (mm) 36:2hs Aluminum layer thickness (mm) 0:635hp Piezoelectric layer thickness (mm) 0:267Mt Tip mass (g) 65Lstruc Length of the tip body (mm) 235bstruc Width of the tip body (mm) 30d31 Strain coefficient of piezoelectric layer
(pC=N)�320
es33 Permittivity component at constant
strain (nF=m)27:3
Abdelkefi et al. 3
at Virginia Tech on June 18, 2013jim.sagepub.comDownloaded from

and
EI =EI2 =1
12b1Eshs
3 +2
3b2Ep hp +
hs
2
� �3
� hs3
8
" #
and m=m2 = b1rshs + 2b2rphp forL1 < x < L2
where Es and Ep are Young’s modulus of the aluminumand piezoelectric layers, respectively, and rs and rp arethe respective densities of these layers.
To complete the problem formulation, we relate themechanical and electrical variables by the Gauss law(IEEE, 1987)
d
dt
ðA
D:n dA=d
dt
ðA
D3 dA=V
Rð4Þ
where D is the electric displacement vector and n is thenormal vector to the plane of the beam. The electric dis-placement component D3 is given by the following rela-tion (Erturk and Inman, 2009)
D3(x, t)= e31e11(x, t)+ es33E3 ð5Þ
where e11 is the axial strain component in the piezoelec-tric layers and is given by e11(x, y, t)= � y(∂2y(x, t)=∂x2)and es
33 is the permittivity component at constantstrain.
Substituting equation (5) into equation (4), we obtainthe equation governing the strain–voltage relation
�e31(hp + hs)b2
ðL2
L1
∂3v(x, t)
∂t∂x2dx
� 2es33b2(L2 � L1)
hp
dV (t)
dt=
V (t)
R
ð6Þ
Modeling of the aerodynamic gallopingforce and moment
The use of the quasi-steady hypothesis to evaluate theaerodynamic loads has been justified by the fact thatthe characteristic time scale of the oscillations is muchlarger than the characteristic time scale of the flowmotion (Barrero-Gil et al., 2010; Naudascher andRockwell, 1994). As such, the lift force FL and the dragforce FD per unit length are written as
FL =12
rairU2bstrucCL
FD = 12
rairU2bstrucCD
ð7Þ
where rair is the density of air, U is the incoming windspeed, bstruc is the width of the bluff body at the tip,and CL and CD are the lift and drag coefficients, respec-tively. The tip force and moment are determined by
integrating the aerodynamic loads over the wholelength of the galloping structure as
Ftip = �ðLstruc
0
(FL cosa+FD sina)ds
Mtip = �ðLstruc
0
s(FL cosa+FD sina)ds
ð8Þ
where Lstruc is the length of the prismatic structure ands is the length coordinate along the tip body. Thesecoefficients depend on the angle of attack, a, as well asthe Reynolds number. The angle of attack is expressedas
a=tan�1 _v(L, t)+ s _v0(L, t)
U
� �
The total aerodynamic force per unit length, Fy,applied to the prismatic structure in the direction nor-mal to the incoming flow is directly related to the liftand drag forces and is given by
Fy =1
2rairU
2bstrucCy =
� 1
2rairU
2bstruc½CL cos (a)+CD sin (a)�ð9Þ
where Cy is the total aerodynamic force coefficient inthe direction normal to the incoming flow. Barrero-Gilet al. (2010) showed that for applications where theReynolds number is relatively high, the total aerody-namic force coefficient can be expressed by a polyno-mial function of tan(a) in the form
Cy = a1 tana+ a3( tana)3 ð10Þ
where a1 and a3 are empirical coefficients obtained bypolynomial fitting of Cy versus tan (a). A positive valuefor a1 indicates that the structure is susceptible to gal-loping (Den Hartog, 1956). The nonlinear coefficient a3
is always negative because Cy always has a maximumvalue, which decreases as a function of the angle ofattack. Both the linear and nonlinear coefficientsdepend on the geometry of the cross section and theaspect ratio of the prismatic structure. We considerfour different cross-section geometries, namely, thesquare, isosceles triangles with d= 308 and 538, and Dsections. The empirical values of a1 and a3, as deter-mined by Barrero-Gil et al. (2010) and used here for allconsidered cross-section geometries, are presented inTable 2.
Using the above equations, the aerodynamic forceand moment at the tip are expressed as
4 Journal of Intelligent Material Systems and Structures 0(0)
at Virginia Tech on June 18, 2013jim.sagepub.comDownloaded from
Ftip =1
2rairU
2bstruc
ðLstruc
0
a1
_v(L, t)+ s _v0(L, t)
U
� �
+ a3
_v(L, t)+ s _v0(L, t)
U
� �3
ds
Mtip =1
2rairU
2bstruc
ðLstruc
0
s a1
_v(L, t)+ s _v0(L, t)
U
� ��
+ a3
_v(L, t)+ s _v0(L, t)
U
� �3�ds ð11Þ
Representative model of the harvester’sresponse
To perform the linear and nonlinear analyses, we dis-cretize the system using the Galerkin procedure, whichrequires the exact mode shapes of the structure. Thesemode shapes are determined by dropping the damping,forcing, and polarization from equation (3) and lettingy(x, t)=f(x)eivt. Because the piezoelectric layers arenot covering the whole cantilever beam, we divide themode shape into three different regions
f(x)=f1(x) for 0 < x\L1
f(x)=f2(x) forL1 < x < L2
f(x)=f3(x) forL2\x < L
The resulting eigenvalue problem for each region isgiven by
EI1fiv1 � m1v2f1 = 0 ð12Þ
EI2fiv2 � m2v2f2 = 0 ð13Þ
EI1f3iv � m1v2f3 = 0 ð14Þ
with the boundary conditions
f1(0)= 0, f01(0)= 0, f1(L1)=f2(L1) ð15Þ
f01(L1)=f02(L1), EI1f001(L1)=EI2f002(L1) ð16Þ
EI1f0001(L1)=EI2f0002(L1), f2(L2)=f3(L2), f02(L2)=f03(L2)
ð17Þ
EI2f002(L2)=EI1f003(L2), EI2f0002(L2)=EI1f0003(L2) ð18Þ
EI1f003(L)� v2MtLcf3(L)� v2Itf03(L)= 0 ð19Þ
EI1f0003(L)+v2Mtf3(L)+v2MtLcf03(L)= 0 ð20Þ
where It is the rotary inertia of the tip mass Mt and Lc ishalf of the length of the tip mass. The mode shapes forthe three different regions are then written as
f1(x)=A1 sinb1x+B1 cosb1x+C1sinhb1x+K1 coshb1x
ð21Þ
f2(x)=A2 sinb2x+B2 cosb2x+C2 sinhb2x+K2 coshb2x
ð22Þ
f3(x)=A3 sinb1x+B3 cosb1x+C3 sinhb1x+K3 coshb1x
ð23Þ
where the coefficients of b1 and b2 are related byb1 =
ffiffiffiffiffiffiffiffiffiffiffiffiffiffiffiffiffiffiffiffiffiffiffiffiffiffiffiffiffiffi(EI2m1=EI1m2)
4p
b2. Normalizing the eigenfunc-tions using the following orthogonality conditionsyields the relation between the different coefficients inequations (10) to (15)
ðL1
0
f1s(x)m1f1r(x)dx+
ðL2
L1
f2s(x)m2f2r(x)dx
+
ðL3
L2
f3s(x)m1f3r(x)dx+f3s(L)Mtf3r(L)+f03s(L)Itf03r(L)
+f3s(L)MtLcf03r (L)+f03s(L)MtLcf3r(L)= drs
ð24Þ
ðL1
0
d2f1s(x)
dx2EI1
d2f1r(x)
dx2dx+
ðL2
L1
d2f2s(x)
dx2EI2
d2f2r(x)
dx2dx
+
ðLL2
d2f3s(x)
dx2EI1
d2f3r(x)
dx2dx= drsv
2r
ð25Þ
where s and r are used to represent the vibration modesand drs is the Kronecker delta, defined as unity when s
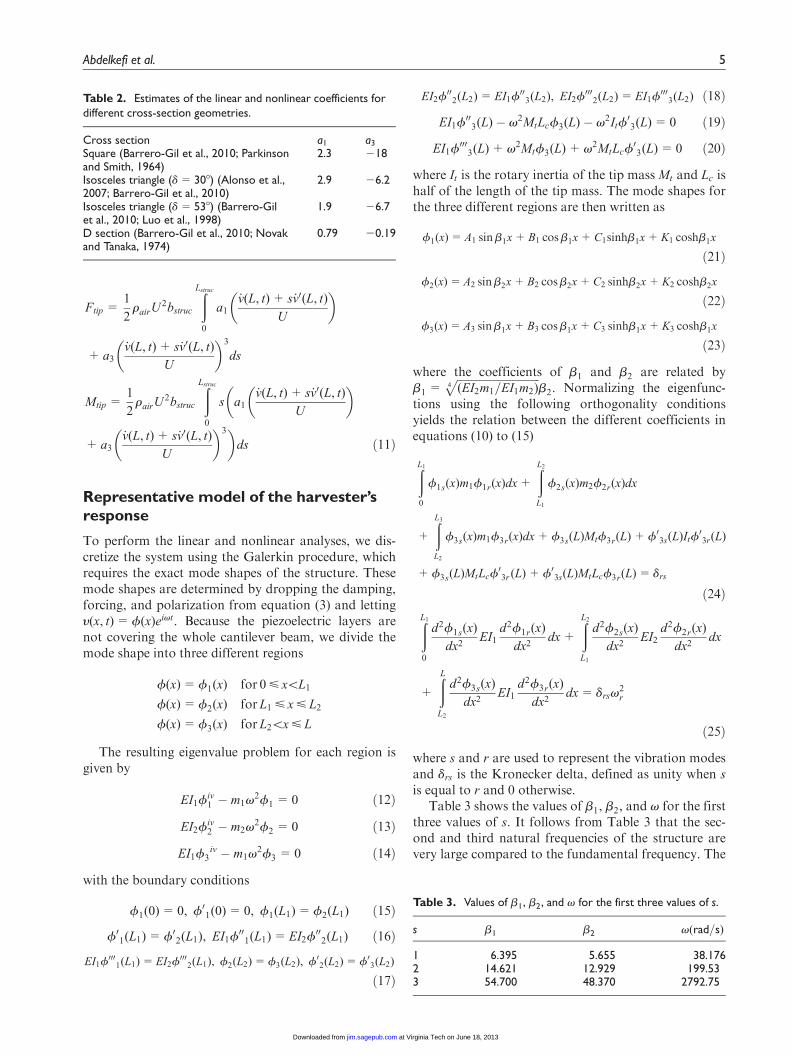
is equal to r and 0 otherwise.Table 3 shows the values of b1, b2, and v for the first
three values of s. It follows from Table 3 that the sec-ond and third natural frequencies of the structure arevery large compared to the fundamental frequency. The
Table 2. Estimates of the linear and nonlinear coefficients fordifferent cross-section geometries.
Cross section a1 a3
Square (Barrero-Gil et al., 2010; Parkinsonand Smith, 1964)
2.3 218
Isosceles triangle (d= 308) (Alonso et al.,2007; Barrero-Gil et al., 2010)
2.9 26.2
Isosceles triangle (d= 538) (Barrero-Gilet al., 2010; Luo et al., 1998)
1.9 26.7
D section (Barrero-Gil et al., 2010; Novakand Tanaka, 1974)
0.79 20.19
Table 3. Values of b1, b2, and v for the first three values of s.
s b1 b2 v(rad=s)
1 6.395 5.655 38.1762 14.621 12.929 199.533 54.700 48.370 2792.75
Abdelkefi et al. 5
at Virginia Tech on June 18, 2013jim.sagepub.comDownloaded from

associated mode shapes of these natural frequencies areplotted in Figure 2.
To derive a model of the considered energy har-vester, we express the displacement y(x, t) using theGalerkin procedure in the form
y(x, t)=X‘
i= 1
fi(x)qi(t) ð26Þ
where qi(t) are the modal coordinates and fi(x) are themode shapes. Substituting equation (26) into equations(3) and (6) and considering one mode in the Galerkinapproach, we obtain the following coupled equationsof motions
€q(t)+ 2jv _q(t)+v2q(t)+ xV (t)= f (t) ð27Þ
Cp_V (t)+
V (t)
R� x _q(t)= 0 ð28Þ
where j is the mechanical damping coefficient, which isconsidered equal to 0.003; f (t) is the galloping force ofthe first mode, which is given by f (t)=f(L)Ftip +f0(L)Mtip; v is the fundamental natural frequency ofthe structure; and the coefficients x and Cp are thepiezoelectric coupling term and the capacitance of theharvester, respectively, which are given byx =(f0(L2)� f0(L1))qp and Cp =(2es
33b2(L2 � L1))=hp.Substituting the discretized form in equation (11),
the combined term of the galloping force and momentis rewritten as
f (t)=f(L)Ftip +f0(L)Mtip
=1
2rairU
2bstruc k1
_q
U+ k3
_q
U
� �3" #
ð29Þ
where k1 and k3 are given by
k1 = a1 f2(L)Lstruc +f(L)f0(L)L2struc +
1
3f0
2(L)L3
struc
� �
k3 = a3(f(L)
ðLstruc
0
(f(L)+ sf0(L))3ds+f0(L)
ðLstruc
0
s(f(L)+ sf0(L))3ds) ð30Þ
Introducing the following state variables
X=X1
X2
X3
24
35=
q
_qV
24
35 ð31Þ
the equations of motion are rewritten as
_X 1 =X2 ð32Þ
_X 2 = � 2jv� rUbstrucLstruck1
2
� �X2 � v2X1 � xX3
+rbstrucLstruck3
2UX 3
2
ð33Þ_X 3 = � 1
RCpX3 +
x
CpX2 ð34Þ
Clearly, these equations have the form
_X=BX+C(X3) ð35Þ
where
B=
0 1 0
�v2 � 2jv� rUbstrucLstruck1
2
� ��x
0 x
Cp� 1
RCp
24
35
and C(X3) is a cubic vector of the state variables, whichis given by CT = 0, (rbstrucLstruck3=2U )X 3
2 , 0� �
.
Linear analysis
The onset speed of galloping, Ug, can be determined froma linear analysis of the equations of motion. This speed isdirectly related to the electromechanical damping of theharvester. When the coupled damping changes sign frompositive to negative, self-excited oscillations take place,and Ug corresponds to the wind speed value at which thereal part of one of the eigenvalues of the matrix B is 0.
Inspecting matrix B, we note that the natural fre-quency, electrical load resistance, and value of k1 affectthe onset speed of galloping. We investigate first theeffects of considering the first, second, or third modeshapes in the governing equations. To this end, wepresent in Table 4, the values of k1, which are associ-ated to different values of s. It is noted that k1 decreaseswhen the value of s is increased. Furthermore, as stated
0 20 40 60 80 90−0.2
0
0.2
0.4
0.6
0.8
1
L (mm)
φ(x)/φ(
L)
First mode
Second mode
Third mode
Figure 2. First three mode shapes of the structure.
6 Journal of Intelligent Material Systems and Structures 0(0)
at Virginia Tech on June 18, 2013jim.sagepub.comDownloaded from

in Table 3, an increase in the value of s is accompaniedby a significant increase in the natural frequency of thestructure. Consequently, higher values of the windspeed are required to get self-excited oscillations whenconsidering higher values of s. This result is presentedin detail in Table 5 for the four cross-section geometriesand when R= 103 O. In the rest of this work, only thefirst mode is considered in the Galerkin procedure.
The plotted curves in Figure 3 show variations of theonset speed of galloping with the load resistance for thefour cross-section geometries for a system having thephysical and geometric properties described in Table 1.Inspecting this figure, we find that for all cross sections,the onset speed of galloping strongly depends on theload resistance. In the lower range (R\103 O), the varia-tion of the onset of galloping with the load resistance isrelatively small. This variation increases significantlyover the middle range of resistance values and yields apeak for the onset speed when the load resistance isbetween 104 and 105 O. Over the range of higher load
resistances (R.107 O), the onset speed drops again tovalues that are close to those obtained in the low-resistance range (R\103 O). These obtained minimumvalues for the onset speed of galloping in the low- andhigh-resistance ranges are due to the fact that minimumvalues of the coupled electromechanical damping areobtained over the same range of load resistances. Theplots also show that the onset of instability stronglydepends on the geometry of the cross section. Indeed,the isosceles triangle with d= 308 has the lowest speedfor any load resistance. The square, isosceles trianglewith d= 538, and D cross sections have progressivelylarger values. The D section has the largest onset speedin comparison to the other cross-section geometries.Inspecting the relation between the onset speed and thelinear system parameters, it is noted that the larger thevalue of the linear coefficient a1, the smaller the onsetspeed.
Nonlinear analysis: effects of the load resistance,cross-section geometry, and wind speed on theharvester’s performance
The nonlinear response of the harvester when consider-ing different cross-section geometries is analyzed nextto determine the effects of the load resistance, cross-section geometry, and wind speed on the system’sresponse and particularly on the level of the harvestedpower. The effects of the load resistance and the cross-section geometry on the tip displacement and har-vested power are shown in Figures 4 and 5, respec-tively. The plots in Figure 4 show that the largest tipdisplacements for the same range of wind speeds areobtained when considering the D section. Furthermore,lower tip displacements are progressively obtained forthe isosceles triangle section with d= 308, the isoscelestriangle section with d= 538, and the square cross sec-tions. It follows from Figure 4(a) to (d) that the tip dis-placement is smaller in the middle range of resistancevalues, which are between 104 and 105 O. This is thesame region over which the onset speed of gallopingwas delayed. These results show that the additionaldamping of the load resistance has the greatest impacton the structure’s displacement over this region of loadresistances.
To investigate the effects of the wind speed on thelevel of the harvested power for different cross-section
Table 4. Values of k1=a1 for the first three values of s.
s 1 2 3k1=a1 4.900 2.157 0.106
1
3
6
10
20
50
Ug (m
/s)
D−section
Square
lsosceles triangle (δ=30o)
lsosceles triangle (δ=53o)
102 103 104 105 106 107 108
R (Ω)
Figure 3. Variations of the onset of galloping speeds with theelectrical load resistance for the different cross-sectiongeometries.
Table 5. Variations of the onset speed of galloping with the values of s for different cross-section geometries and when R= 103 O.
s Square Isosceles triangle (d= 308) Isosceles triangle (d= 538) D section
1 1.355 m/s 1.074 m/s 1.640 m/s 3.944 m/s2 27.319 m/s 21.667 m/s 33.07 m/s 79.538 m/s3 7631.06 m/s 6052.22 m/s 9237.6 m/s 22,217 m/s
Abdelkefi et al. 7
at Virginia Tech on June 18, 2013jim.sagepub.comDownloaded from

geometries, we plot in Figure 5, the bifurcation dia-grams of the harvested power for different values of theelectrical load resistance and for the four cross-sectiongeometries. It follows from Figure 5(a) that the isoscelestriangle section with d= 308 yields the highest level ofharvested power when the load resistance is around105 O at speeds larger than 10 m/s. Furthermore,through comparison of power levels in all figures, it isdeduced that this cross section is the best one to harvestpower at relatively low wind speeds. Based on the devel-oped coupled-global analysis, of particular interest is tonote that when the load resistance is between 104 and105 O, minimum values of the displacement areobtained, as shown in the plotted curves in Figure 4(a)to (c), which correspond to maximum values in the har-vested power.
To investigate more the effects of the electricalload resistance on the system outputs, we present in
Figures 6 and 7 the variations of the tip displacementand harvested power, respectively, with the load resis-tance for three values of the wind speed, namely,U = 3m=s, U = 7m=s, and U = 12m=s, and for twocross-section geometries that give the opportunity toharvest energy at low wind speeds, namely, the iso-sceles triangle section with d= 308 and the square sec-tion. The plots in Figure 6 show that the tipdisplacement, for U = 3m=s, is almost 0 when theload resistance is between 63103 and 43105 O forboth cross-section geometries. This result can beexplained due to the fact that the onset speed of gal-loping in this region of electrical load resistances islarger than U = 3m=s. When increasing the windspeed to U = 7m=s, the range of zero displacement isdecreased progressively for both cross-section geome-tries. These zero-displacement values are expectedbecause of the maximum values of the coupled
0 3 6 9 12 150
10
20
30
40
50
60
U (m/s)
Dis
plac
emen
t (m
m)
(a)
0 3 6 9 12 150
5
10
15
20
25
30
U (m/s)
Dis
plac
emen
t (m
m)
(b)
0 3 6 9 12 150
10
20
30
40
50
U (m/s)
Dis
plac
emen
t (m
m)
(c)
0 3 6 9 12 150
30
60
90
120
150
180
U (m/s)
Dis
plac
emen
t (m
m)
(d)
R=103Ω
R=104Ω
R=105Ω
R=106Ω
R=107Ω
R=103Ω
R=104Ω
R=105Ω
R=106Ω
R=107Ω
R=103Ω
R=104Ω
R=105Ω
R=106Ω
R=107Ω
R=103Ω
R=104Ω
R=105Ω
R=106Ω
R=107Ω
Figure 4. Bifurcation diagrams of the tip displacement of the harvester for different values of the load resistance and cross-sectiongeometries: (a) isosceles triangle section with d= 308, (b) square section, (c) isosceles triangle section with d= 538, and (d) Dsection.
8 Journal of Intelligent Material Systems and Structures 0(0)
at Virginia Tech on June 18, 2013jim.sagepub.comDownloaded from
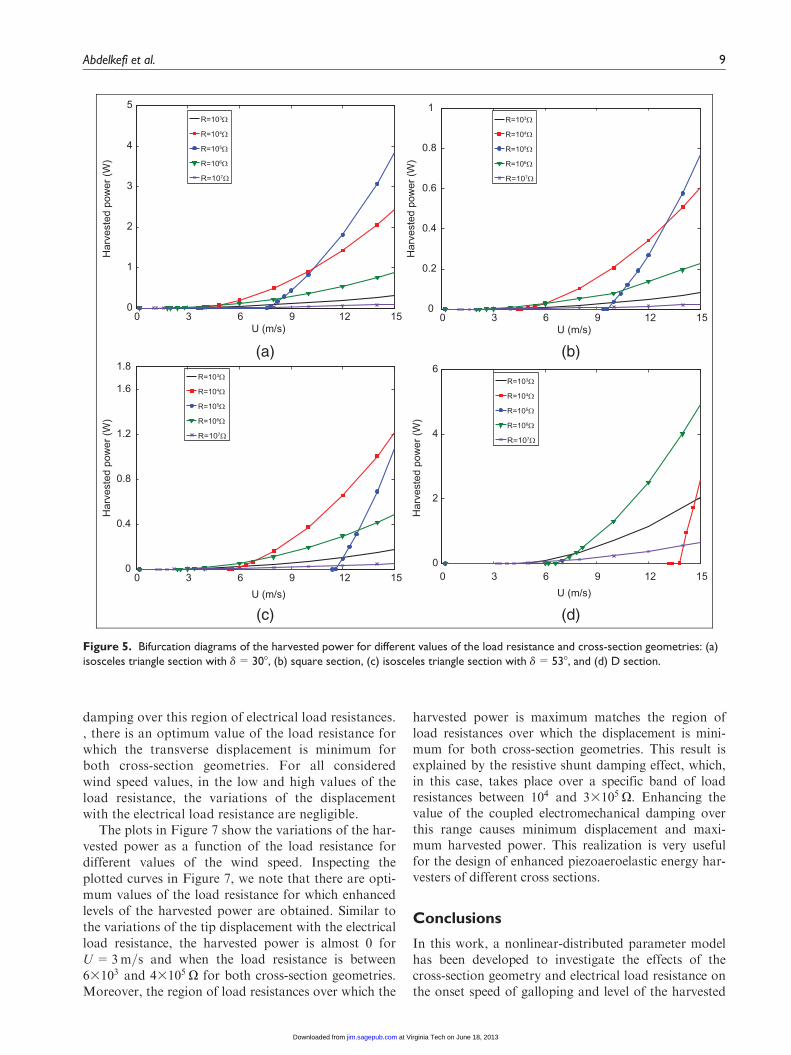
damping over this region of electrical load resistances., there is an optimum value of the load resistance forwhich the transverse displacement is minimum forboth cross-section geometries. For all consideredwind speed values, in the low and high values of theload resistance, the variations of the displacementwith the electrical load resistance are negligible.
The plots in Figure 7 show the variations of the har-vested power as a function of the load resistance fordifferent values of the wind speed. Inspecting theplotted curves in Figure 7, we note that there are opti-mum values of the load resistance for which enhancedlevels of the harvested power are obtained. Similar tothe variations of the tip displacement with the electricalload resistance, the harvested power is almost 0 forU = 3m=s and when the load resistance is between63103 and 43105 O for both cross-section geometries.Moreover, the region of load resistances over which the
harvested power is maximum matches the region ofload resistances over which the displacement is mini-mum for both cross-section geometries. This result isexplained by the resistive shunt damping effect, which,in this case, takes place over a specific band of loadresistances between 104 and 33105 O. Enhancing thevalue of the coupled electromechanical damping overthis range causes minimum displacement and maxi-mum harvested power. This realization is very usefulfor the design of enhanced piezoaeroelastic energy har-vesters of different cross sections.
Conclusions
In this work, a nonlinear-distributed parameter modelhas been developed to investigate the effects of thecross-section geometry and electrical load resistance onthe onset speed of galloping and level of the harvested
0 3 6 9 12 150
1
2
3
4
5
U (m/s)
Har
vest
ed p
ower
(W)
(a)
0 3 6 9 12 150
0.2
0.4
0.6
0.8
1
U (m/s)
Har
vest
ed p
ower
(W)
(b)
0 3 6 9 12 150
0.4
0.8
1.2
1.6
1.8
U (m/s)
Har
vest
ed p
ower
(W)
(c)
0 3 6 9 12 150
2
4
6
U (m/s)
Har
vest
ed p
ower
(W)
(d)
R=103Ω
R=104Ω
R=105Ω
R=106Ω
R=107Ω
R=103Ω
R=104Ω
R=105Ω
R=106Ω
R=107Ω
R=103Ω
R=104Ω
R=105Ω
R=106Ω
R=107Ω
R=103Ω
R=104Ω
R=105Ω
R=106Ω
R=107Ω
Figure 5. Bifurcation diagrams of the harvested power for different values of the load resistance and cross-section geometries: (a)isosceles triangle section with d= 308, (b) square section, (c) isosceles triangle section with d= 538, and (d) D section.
Abdelkefi et al. 9
at Virginia Tech on June 18, 2013jim.sagepub.comDownloaded from

power. The galloping-based piezoaeroelastic energyharvester is composed of a bimorph piezoelectric canti-lever beam with a prismatic-structure tip mass. We per-formed a modal analysis to calculate the exact modeshapes of the structure. The quasi-steady approxima-tion was used to model the galloping force andmoment. A linear analysis was performed to investigatethe effects of the electrical load resistance and thecross-section geometry on the onset of instability. Theresults show that the isosceles triangle with d= 308 andsquare cross sections are the best cross sections to har-vest energy at low wind speeds. A nonlinear analysis
was performed to determine the importance of choos-ing the cross-section geometry of the prismatic struc-ture in order to design enhanced piezoaeroelasticenergy harvesters. It is demonstrated that for smallwind speeds, the isosceles triangle with d= 308 crosssection is the best cross section for enhancing the levelof harvested power. However, at relatively high windspeeds, the D section is the best cross section for powerharvesting. It is also demonstrated that for a specificfreestream velocity, maximum levels of harvestedpower are obtained for minimum values of the tip dis-placement when the load resistance is varied. This is
0
10
20
30
40
50
60D
ispl
acem
ent (
mm
)
U=3 m/sU=7 m/sU=12 m/s
(a)
0
5
10
15
20
25
30
Dis
plac
emen
t (m
m)
U=3 m/sU=7 m/sU=12 m/s
(b)
102 103 104 105 106 107 108 102 103 104 105 106 107 108
R (Ω) R (Ω)
Figure 6. Variations of the tip displacement with the load resistance when U= 3 m=s, U= 7 m=s, and U= 12 m=s for two cross-section geometries: (a) isosceles triangle section with d= 308 and (b) square section.
102 103 104 105 106 107 108 102 103 104 105 106 107 1080
0.4
0.8
1.2
1.6
2
2.2
R (Ω)
Har
vest
ed p
ower
(W)
U=3 m/sU=7 m/sU=12 m/s
(a)
0
0.1
0.2
0.3
0.4
0.5
R (Ω)
Har
vest
ed p
ower
(W)
U=3 m/sU=7 m/sU=12 m/s
(b)
Figure 7. Variations of the harvested power with the load resistance when U= 3 m=s, U= 7 m=s, and U= 12 m=s for two cross-section geometries: (a) isosceles triangle section with d= 308 and (b) square section.
10 Journal of Intelligent Material Systems and Structures 0(0)
at Virginia Tech on June 18, 2013jim.sagepub.comDownloaded from

due to the global coupling in the electromechanical sys-tem and to the fact that harvesting energy acts to dam-pen the system’s response.
Declaration of conflicting interests
The authors declare that there is no conflict of interest.
Funding
This research received no specific grant from any fundingagency in the public, commercial, or not-for-profit sectors.
References
Abdelkefi A, Hajj MR and Nayfeh AH (2012a) Modeling andanalysis of piezoaeroelastic energy harvesters, Nonlinear
Dynamics 67: 925–939.Abdelkefi A, Hajj MR and Nayfeh AH (2012b) Design of
piezoaeroelastic energy harvesters, Nonlinear Dynamics 68:519–530.
Abdelkefi A, Hajj MR and Nayfeh AH (2012c) Enhancementof power harvesting from piezoaeroelastic systems, Non-
linear Dynamics 68: 531–541.Abdelkefi A, Hajj MR and Nayfeh AH (2013a) Modeling and
nonlinear analysis of piezoelectric energy harvesting fromtransverse galloping, Smart Materials and Structures 22:
025016.Abdelkefi A, Nayfeh AH and Hajj MR (2012d) Phenomena
and modeling of piezoelectric energy harvesting from freelyoscillating cylinders, Nonlinear Dynamics 70: 1355–1363.
Abdelkefi A, Nayfeh AH and Hajj MR (2012e) Sensitivityanalysis of piezoaeroelastic energy harvesters, Journal ofIntelligent Material Systems and Structures 23: 1523–1531.
Abdelkefi A, Nayfeh AH and Hajj MR (2012f) Power har-vesting from transverse galloping of square cylinder, Non-
linear Dynamics 70: 1377–1388.Abdelkefi A, Yan Z and Hajj MR (2013b) Piezoelectric
energy harvesting from transverse galloping of bluff bod-ies, Smart Materials and Structures 22: 015014.
Akaydin HD, Elvin N and Andrepoulos Y (2010) Energyharvesting from highly unsteady fluid flows using piezo-electric materials. Journal of Intelligent Material Systems
and Structures 21: 1263–1278.
Alonso G, Meseguer J and Prez-Grande I (2007) Galloping
stabilities of two-dimensional triangular cross-section bod-
ies: a systematic approach. Journal of Wind Engineering
and Industrial Aerodynamics 95: 928–940.Barrero-Gil A, Alonso G and Sanz-Andres A (2010) Energy
harvesting from transverse galloping. Journal of Sound and
Vibration 329: 2873–2883.Bryant M and Garcia E (2009) Energy harvesting: a key to
wireless sensor nodes. Proceedings of SPIE 7493: 74931W.De Marqui C, Erturk A and Inman DJ (2010) Piezoaeroelas-
tic modeling and analysis of a generator wing with contin-
uous and segmented electrodes. Journal of Intelligent
Material Systems and Structures 21: 983–993.Den Hartog JP (1956) Mechanical Vibrations. New York:
McGraw-Hill.Erturk A and Inman DJ (2009) An experimentally validated
bimorph cantilever model for piezoelectric energy harvest-
ing from base excitations. Smart Materials and Structures
18: 025009.Erturk A, Vieira WGR, De Marqui C, et al. (2010) On the
energy harvesting potential of piezoaeroelastic systems.
Applied Physics Letters 96: 184103.IEEE (1987) Standard on piezoelectricity.Luo SC, Chew YT, Lee TS, et al. (1998) Stability to transla-
tional galloping vibration of cylinders at different mean
angles of attack. Journal of Sound and Vibration 215:
1183–1194.Mehmood A, Abdelkefi A, Hajj MR, et al. (2013) Piezoelec-
tric energy harvesting from vortex-induced vibrations of
circular cylinder. Journal of Sound and Vibration. available
at: http://dx.doi.org/10.1016/j.jsv.2013.03.033Naudascher E and Rockwell D (1994) Flow-Induced
Vibrations: An Engineering Guide. New York: Dover
Publications.Novak M and Tanaka H (1974) Effect of turbulence on gal-
loping instability. Journal of the Engineering Mechanics
Division: ACSE 100: 27–47.Parkinson GV and Smith JD (1964) The square prism as an
aeroelastic nonlinear oscillator. Quarterly Journal of
Mechanics and Applied Mathematics 17: 225–239.Sirohi J and Mahadik R (2011) Piezoelectric wind energy har-
vester for low-power sensors. Journal of Intelligent Mate-
rial Systems and Structures 22: 2215–2228.
Abdelkefi et al. 11
at Virginia Tech on June 18, 2013jim.sagepub.comDownloaded from
Related Documents