Performance Analysis Q4 & Full Year FY 2018 May 25, 2018

Welcome message from author
This document is posted to help you gain knowledge. Please leave a comment to let me know what you think about it! Share it to your friends and learn new things together.
Transcript

Performance AnalysisQ4 & Full Year FY 2018
May 25, 2018

Safe Harbor
Page | 2
This presentation has been prepared by Bank of Baroda (the
“Bank”) solely for information purposes, without regard to any
specific objectives, financial situations or informational needs of
any particular person.
Except for the historical information contained herein, statements
in this release which contain words or phrases such as “will”,
“aim”, “will likely result”, “would”, “believe”, “may”, “expect”, “will
continue”, “anticipate”, “estimate”, “intend”, “plan”, “contemplate”,
“seek to”, “future”, “objective”, “goal”, “strategy”, “philosophy”,
“project”, “should”, “will pursue” and similar expressions or
variations of such expressions may constitute "forward-looking
statements". These forward-looking statements involve a number
of risks, uncertainties and other factors that could cause actual
results to differ materially from those suggested by the forward-
looking statements. These risks and uncertainties include, but are
not limited to our ability to successfully implement our strategy,
future levels of non-performing loans, our growth and expansion,
the adequacy of our allowance for credit losses, our provisioning
policies, technological changes, investment income, cash flow
projections, our exposure to market risks as well as other risks.
Bank of Baroda undertakes no obligation to update the forward-
looking statements to reflect events or circumstances after the
date thereof.
Note: All financial numbers in the presentation are from Audited
Financials or Limited Reviewed financials or based on
Management estimates.
© 2018 Bank of Baroda. All Rights Reserved.

Contents
© 2018 Bank of Baroda. All Rights Reserved. Page | 3
Major Highlights
Business Performance
Financial Performance
Asset Quality
Capital Adequacy & Shareholding
Strengths & Initiatives
Consolidated Financials

Page | 4
Performance Highlights
© 2018 Bank of Baroda. All Rights Reserved.

Major Highlights: Q4 FY 18
© 2018 Bank of Baroda. All Rights Reserved. Page | 5
1
2
3
4
5
Operating Profit for Q4 FY 18 was INR 2,665 crore; adjusted to the accounting policy change on
depreciation, it was flat compared to corresponding period last year. Net Interest Income (NII) for Q4 FY 18
increased by 11.73% YOY. Operating Income increased by 2.50% YOY.
Domestic credit registered YoY growth of 17.97% within which the retail loans growth was 42.44%.
Domestic CASA ratio improves to 41.18% from 40.57% last quarter and 39.44% from last year.
Bank posted net loss of INR 3,102 crore due to higher provisions on account of RBI guidelines on revised
framework for stressed assets and large corporate slippages.
PCR including TWO continues to be high and stood at 67.21% as on March 31,2018. PCR excluding TWO
stood at 58.42% as on March 31,2017.
6
7
Recovery in TWO accounts increased from INR 172 crore in Q4 FY 17 to INR 254 crore in Q4 FY 18
registering a growth of 47.67% YOY.
Capital Adequacy Ratio of the Bank at 12.13% and CET-1 at 9.23% continues to be above regulatory norms.
Bank’s Transformation journey on track.

Page | 6
Business Performance
© 2018 Bank of Baroda. All Rights Reserved.

Business Performance (1/2)
Particulars
(INR crore)Mar ’17 Dec’17 Mar’18 YOY (%)
Total Business 10,10,186 10,01,983 10,52,059 4.15
Domestic Business 7,37,847 7,58,445 8,18,243 10.90
Total Deposits 6,01,675 5,73,265 5,91,315 (1.72)
Domestic Deposits 4,40,092 4,43,469 4,66,974 6.11
CASA Deposits 1,93,496 1,98,487 2,11,779 9.45
Domestic CASA Deposits 1,73,594 1,79,911 1,92,323 10.79
Total Saving Deposits 1,50,977 1,55,946 1,65,717 9.76
Domestic Saving Deposits 1,46,832 1,51,540 1,61,130 9.74
Total Current Deposits 42,519 42,541 46,062 8.33
Domestic Current Deposits 26,762 28,371 31,193 16.56
Advances (Gross) 4,08,511 4,28,718 4,60,744 12.79
Domestic Advances (Gross) 2,97,755 3,14,976 3,51,269 17.97
Domestic CASA(%) 39.44% 40.57% 41.18% -
Global CASA (%) 32.16% 34.62% 35.81% -
Terminal Figures
© 2018 Bank of Baroda. All Rights Reserved. Page | 7

Business Performance (2/2)
Particulars
(INR crore)Mar’17 Dec’17 Mar’18 YOY (%)
Total Business 9,56,304 9,90,561 10,01,778 4.76
Domestic Business 7,09,286 7,49,189 7,54,043 6.31
Total Deposits 5,75,645 5,72,759 5,75,114 (0.09)
Domestic Deposits 4,34,022 4,43,840 4,44,428 2.40
CASA Deposits 1,85,673 1,89,054 1,94,914 4.98
Domestic CASA Deposits 1,68,347 1,71,490 1,75,500 4.25
Total Saving Deposits 1,50,155 1,52,421 1,56,757 4.40
Domestic Saving Deposits 1,46,189 1,48,093 1,52,266 4.16
Total Current Deposits 35,518 36,633 38,157 7.43
Domestic Current Deposits 22,158 23,397 23,234 4.86
Advances (Gross) 3,80,659 4,17,802 4,26,664 12.09
Domestic Advances (Gross) 2,75,264 3,05,349 3,09,615 12.48
Domestic CASA(%) 38.79% 38.64% 39.49% -
Global CASA (%) 32.25% 33.01% 33.89% -
Average Figures*
© 2018 Bank of Baroda. All Rights Reserved. Page | 8
* Average business data is based on daily averages for the respective quarter.

Sustained CASA Growth
© 2018 Bank of Baroda. All Rights Reserved. Page | 9
168,347
164,768
168,684
171,490
175,500
185,673
182,170
186,730
189,054
194,914
Mar ’17 Jun ’17 Sep’17 Dec'17 Mar'18
Domestic CASA Deposits Global CASA Deposits
173,594
168,796
175,563
179,911
192,323193,496
188,280
194,935
198,487
211,779
Mar ’17 Jun ’17 Sep’17 Dec'17 Mar ’18
Domestic CASA Deposits Global CASA Deposits
Terminal Figures Average Figures*
* Average business data is based on daily averages for the respective quarter.
Term Deposits have granularity
© 2018 Bank of Baroda. All Rights Reserved. Page | 10
Large Value Deposits are of amount above INR 1 crore. Retail Term Deposits constitute 82.25% of total domestic term deposits as on 31.03.2018.
Further Domestic CASA and Retail Term Deposits constitute 89.56% of the total domestic deposits as on 31.03.2018
Particulars (INR crore) Mar ’16 Mar ’17 Mar’18
Retail Term Deposits 1,86,623 2,06,993 2,25,888
Large Value Deposits 75,682 59,505 48,763
Total Term Deposits 2,62,305 2,66,498 2,74,651
186623
206,993
225,888
Mar'16 Mar ’17 Mar ’18Retail Term Deposits

Cost of Deposits
© 2018 Bank of Baroda. All Rights Reserved. Page | 11
5.88%
5.72%
5.52%
5.31%5.37%
4.74%
4.61%4.54%
4.43%4.50%
Mar ’17 Jun ’17 Sep’17 Dec'17 Mar'18
Domestic Deposits Global Deposits
6.82%
6.08%
5.48%
5.05%
4.78%
4.50%
Mar ’16 Mar' 17 Mar'18
Domestic Deposits Global Deposits
Quarterly Yearly
Wealth Management
© 2018 Bank of Baroda. All Rights Reserved. Page | 12
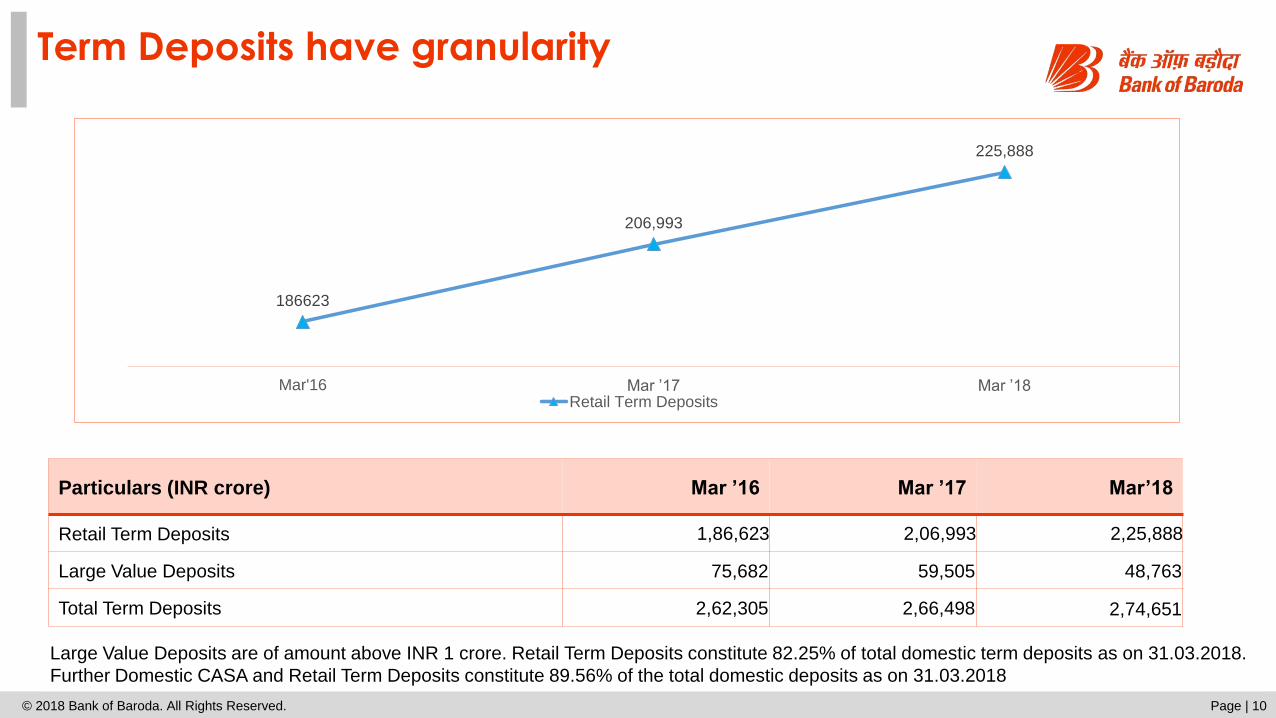
Baroda Radiance Customers- Programme launched based on
Net Relationship Value
Key Prepositions
• Financial Planning of customers to provide need base
products
• Evaluating risk profiling of the customers
• Refining and enhancing products aligned to customer
needs and preferences
• Better customer acquisition & retention by superior
business intelligence
• Augmented cross-selling and up-selling generating higher
fee based income
• Increased profitability and expanded market share
• Dedicated man power for providing Banking and Wealth
Service to the above customers
Resource
Count
(On Board)
Wealth Executive 340
Senior Relationship
Manager24
Territory Head 2
Investment Counsellor 13

Credit Portfolio- well diversified
© 2018 Bank of Baroda. All Rights Reserved. Page | 13
% share in Gross Domestic Credit in Mar’ 18
% share in Gross Domestic Credit in Mar’ 17
Corporate 47%
MSME 15%
Retail 23%
Agriculture 14%
Others 1%
Corporate 47%
MSME 16%
Retail 20%
Agriculture 16%
Others 1%
Particulars
(INR crore)Mar ’16 Mar ’17 Mar’18
Corporate 1,30,005 1,41,069 1,64,783
MSME 54,990 48,545 51,730
Retail 50,850 57,994 82,604
Agriculture 40,984 47,297 49,583
Others 4,086 2,850 2,569
Gross Domestic
Advances2,80,915 2,97,755 3,51,269

Steady Progress in Retail Asset Growth
© 2018 Bank of Baroda. All Rights Reserved. Page | 14
24,96830,169
44,711
4,428
4,394
5,727
2,122
2,054
2,043
19,332
21,377
30,123
Mar'16 Mar '17 Mar'18
Other Retail loans. Education Auto Home
57,994
82,604
50,850
Retail Credit – By Segment (INR crore)
-3.12%
14.05%
42.44%
10.77%
20.83%
48.20%
Mar'16 Mar '17 Mar'18
Growth in Retail Loans (YOY) Growth in Home Loans (YOY)
Percentage Growth in Retail and Home loans

Building Blocks in place for Sustainable Growth
Simplified retail loan approval and underwriting process
Introduced Risk based pricing based on credit bureau score of customer
Consistency in under writing through a centralized mortgage loan processing
Digitized the loan processing and approval by migrating it to Loan Management System
Expanded the distribution channels for sourcing
Centralized retail loans collections – phone and field basis
Enablers put in place for sustained retail asset growth
Page I 15© 2018 Bank of Baroda. All Rights Reserved

Robust Retail loan growth: 2.4X loan value sanctioned and contribution from new-to-bank customers holding strong
© 2018 Bank of Baroda. All Rights Reserved. Page | 16
9,589
22,925
Apr May Jun Jul Aug Sep Oct Nov Dec Jan Feb Mar
Valu
e o
f lo
ans s
anctioned c
um
ula
tive (
INR
Cr)
FY17 FY18
8%
10%
11%
Jun'16 Sep'16 Dec'16 Mar'17 Jun'17 Sep'17 Dec'17 Mar'18
% s
hare
of
New
-To
-Ban
k c
usto
mers
cu
mu
lati
ve
NTB (%)
2.4X value of loan amount sanctioned – INR 22,925 Cr in FY 2018
as against INR 9,589 Cr in FY 2017
Contribution from New-to-Bank (NTB) customers to overall
sourcing continued to increase in FY 2018

Portfolio health well positioned for future with improvement in composition of new acquisitions
© 2018 Bank of Baroda. All Rights Reserved. Page | 17
40%
19%11%
30%
Pre-Risk Based sourcing
-1 and 0 < 725 725-760 760+
36%
1%6%
57%
Post-Risk Based sourcing
-1 and 0 < 725 725-760 760+
Pre-Risk Based Sourcing (Before 1st April 2016) % of customers
with less than 725 CIBIL score was 19% and above 725 was 41%
Post-Risk Based Sourcing (After 1st April 2016) % of customers with less
than 725 CIBIL score reduced to 1% and above 725 has improved to 63%
DPD Bucket Apr|2016 Sep|2017 Dec|2017 Mar|2018
Current 75.6% 82.7% 80.8% 81.9%
1-30 11.2% 10.2% 10.7% 10.9%
31-60 3.0% 3.4% 3.8% 4.3%
61-90 2.9% 2.3% 2.7% 2.0%
90-120 1.1% 0.3% 0.4% 0.2%
120-150 0.7% 0.2% 0.2% 0.2%
150-180 0.5% 0.2% 0.2% 0.1%
180+ 4.8% 0.6% 1.2% 0.4%
% account distribution FY2018 :
By Delinquency Bucket
Overall Portfolio Delinquency has declined: trend is
observed across all DPD buckets

Credit Cards-Significant re-engineering completed to build ‘solid foundations’ for rapid growth
© 2018 Bank of Baroda. All Rights Reserved. Page | 18
Technology foundation
laid on private cloud
• Core platforms – Card Management System, Merchant Management System, Loan Management System
• Advanced Origination systems implemented for Credit Cards & Personal Loans
• New customer website launched to enable lead generation, product comparison, new acquisition, cross-sell & customer service
Highlights (2017-18)
New Products launched
with best in class features
& Brand identity
refreshed
White Label Launch
New 5x Rewards range of Bank of Baroda Credit Cards launched with superior features
Brand Identity Refresh
• Cash Discounts and No Extra Cost EMI from leading brands like Apple, Samsung etc
• An ongoing Dining Program offering attractive discounts at restaurants across India
• Accelerated reward points on segment focussed categories
• Multiple reward redemption options
• Retail product suite upgraded with clear customer segmentation, and targeted benefits for each segment
Anticipated impact (2018-19)
Active Credit cards (‘000)
125
245
2017-18 2018-19
Loan Book (Rs Crores)
PLCC
2017-18 2018-19
172 240
101
Tripartite agreement with BoB & TransUnion CIBIL signed to leverage BoB’s huge credit worthy retail customer base
Rapid customer acquisition through cross sell of cards by BoB branches
Exponential growth thereafter based on refined risk models derived from first year’s data and analytics
Personal Loans being launched in Jun’18
Card base to be doubled by over next one year, through:
~2x

Corporate Banking: Target market and coverage model
of
▪ Clearly defined target markets completed; sectors identified having high demand generation potential and
superior credit quality track-record
▪ Integrated coverage model executed with a focus on new client acquisition
▪ Simplified target account plans in place at major metro centers covering 80%
the corporate credit and executed through dedicated Relationship Managers (RMs)
▪ Number of layers for approval of corporate credit proposals reduced to one
for Corporate Financial Services (CFS) branches
▪ Launched the integrated Supply Chain Finance solution with fully digitized transaction processing capability -
feeder for new client acquisition including the MSME segment
▪ Launched the Cash Management-Baroda DigiNext product to create efficiencies in working capital through
digitization of cash management
Page I 19© 2018 Bank of Baroda. All Rights Reserved

New Products launched-Supply Chain Finance Accelerating Business Momentum
© 2018 Bank of Baroda. All Rights Reserved. Page | 20
• 20+ Anchors signed up and Live
• 10+ New to Bank Customers
• Rs.750 crore+ limits to 49 spokes already sanctioned
• Rs.500 crore + limits under approval for disbursement
• No of Anchors Clients in Pipeline
• Appreciation & Honour Received by from World Trade Center for launching the best “Digitized Supply Chain
Finance Platform” at Global Economic Summit 2018
• Felicitated by University of Southern California for launching the state-of-art Digitized Supply Chain Finance
Platform
• Generating new stream of revenue for the bank
• Empowering the Bank to acquire new A+ & above rated corporates
• Digitized SCF with best in class features in the market

New Product launched- Cash Management-Baroda DigiNext
© 2018 Bank of Baroda. All Rights Reserved. Page | 21
Electronic Collections &
Payments
RTGS / NEFT
NACH
Direct debits
IMPS
UPI
Taxes
Bill Payments
Paper Collections & Payments
Cash at Branches
Local cheques
Outstation cheques
Transaction Initiation Transaction processing and mining Information delivery
Centralized
Processor
Report
generation
Tools:
Single sign-on for accounts
Online inquiry
Cheque images
Analytics, dashboards & reports
Third party interfaces
Key Benefits:
End-to-end digitization of working
capital
Single collection & payment
account
Accelerate accounts receivables
Centralization of accounts payable
Automated credit application
Just-in-time funding
Real time information
Omni-channel access
Baroda DigiNext will creates efficiencies in working capital through digitization of Cash Management
It will seamlessly connect corporates with their customers, suppliers, employees and revenue departments
Online authentications, search options, advising and reconciliation will enable shift of financial transactions from paper-to-
digital
CORPORATE

Rating Profile
© 2018 Bank of Baroda. All Rights Reserved. Page | 22
*External Rating Distribution of Domestic Advances above INR 5 Crore
42.86%36.88%
23.16%13.01%
13.22%19.42%
21.80%
19.72%
12.24% 14.45%
15.77%
14.90%
31.69% 29.26%39.27%
52.37%
Mar' 15 Mar' 16 Mar' 17 Mar' 18
A & Above BBB Below BBB Unrated
Capital optimization in Corporate Book
© 2018 Bank of Baroda. All Rights Reserved. Page | 23
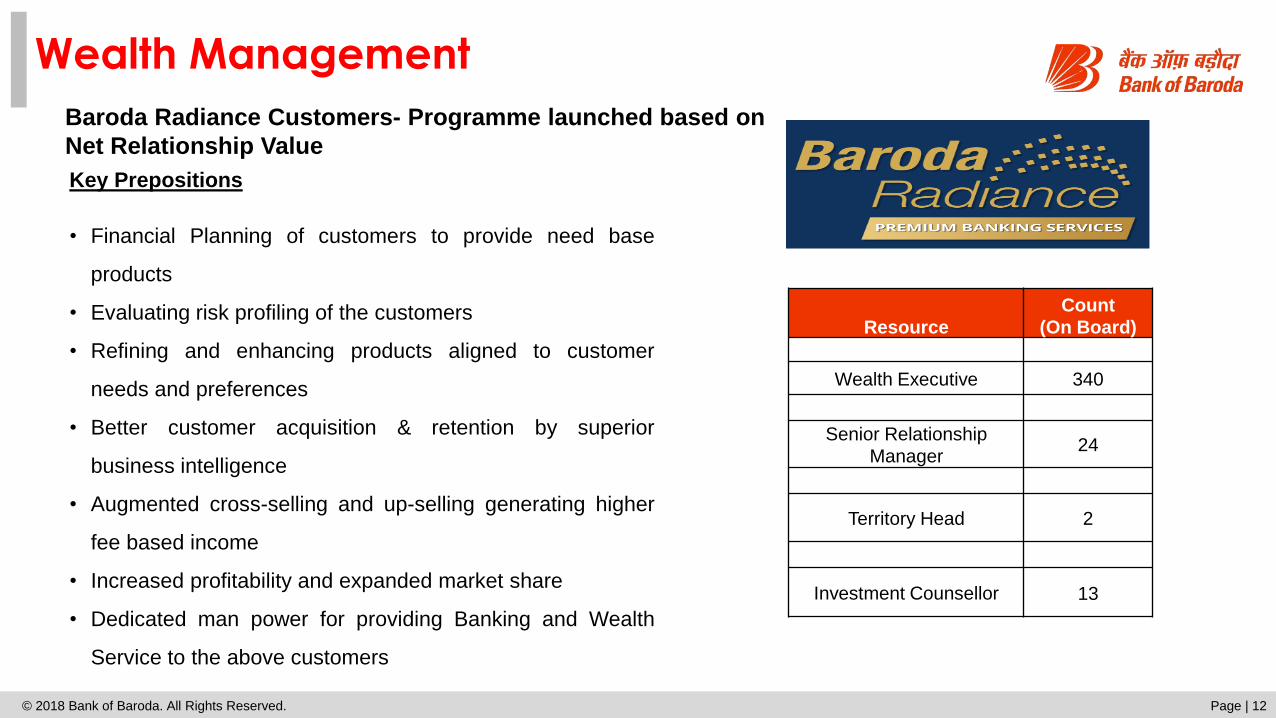
61% 62%
49%
19%
12% 12%
Mar'16 Mar ’17 Mar'18
RWA to Coporate Exposure ratio Ratio of RWA to Un-utilised Exposures

Industry-wise Exposure
© 2018 Bank of Baroda. All Rights Reserved. Page | 24
Industry (INR crore)Mar ’17 Mar’18
Outstanding % share Outstanding % share
Infrastructure of which 28,021 9.41 33,511 9.54
1. Power of which 15,968 5.36 20,506 5.84
a) SEBs 1,740 0.58 1,643 0.47
b) Others 14,228 4.78 18,863 5.37
2. Telecom 3,622 1.22 4,427 1.26
3. Roads & Ports 4,536 1.52 6,271 1.79
4. Other Infrastructure 3,895 1.31 2,307 0.66
Basic Metals & Metal Industry
of which 16,202 5.44 19,847 5.65
1. Iron & Steel 12,760 4.29 18,327 5.22
Textiles 14,403 4.84 16,998 4.84
Petroleum & Petrochemicals 696 0.23 3,348 0.95
All Engineering 6,555 2.20 5,962 1.70
Food Processing 2,054 0.69 10,484 2.98
Chemicals and Chemical Products 6,669 2.24 4,433 1.26
Trade 7,252 2.44 3,864 1.10
Commercial Real Estate 5,381 1.81 7,798 2.22
Other Industries / Sectors 1,05,231 35.34 1,12,837 32.12
Retail Loans 57,994 19.48 82,604 23.52
Agriculture 47,297 15.88 49,583 14.12
Gross Domestic Advances 2,97,755 100.00 3,51,269 100.00

Yield on Advances
© 2018 Bank of Baroda. All Rights Reserved. Page | 25
9.95%
9.10%8.87%
7.35% 7.27%7.13%
Mar' 16 Mar' 17 Mar' 18
Domestic Global
8.78%
8.52%8.59%
8.79%8.68%
7.13%
6.93% 6.93%
7.15% 7.09%
Mar' 17 Jun' 17 Sep' 17 Dec' 17 Mar' 18
Domestic Global
Quarterly Yearly

Financial Inclusion (1/2)
Page | 26
3,458
4,925
7,757
9,689
2,1172,391
2,8733,105
Mar'15 Mar'16 Mar'17 Mar'18
Balance/ Average Balance in Financial Inclusion accounts
Balance in Financial Inclusion Accounts (in INR Crore) Average Balance (in INR)
2,700
11,923
32,633
58,033
Mar'15 Mar'16 Mar'17 Mar'18
Transactions – By Amount (in INR crore)
152
588
1,455
2,229
Mar'15 Mar'16 Mar'17 Mar'18
Number of Transactions through Business Correspondents (in Lakh)
163
206
271
312
Mar'15 Mar'16 Mar'17 Mar'18
Total Financial Inclusion Accounts (in Lakh)
© 2018 Bank of Baroda. All Rights Reserved.

Financial Inclusion (2/2)
Page | 27
In Q4 FY 18, the Bank’s 51 FLC centres across the country conducted 836 meetings/camps to educate 71,569 people.
Our 49 BSVS (Baroda RSETI) centres have trained 13,858 youth through 501 training programmes during the quarter.
Particulars (in Lakh)Enrolment up to
Mar’17 Mar’18
Pradhan Mantri Suraksha Bima Yojana 44.37 59.52
Pradhan Mantri Jeevan Jyoti Bima Yojana 15.88 18.14
Atal Pension Yojana 3.56 6.33
47.0%
17.0% 16.9%11.5%
Mar'15 Mar'16 Mar’17 Mar’18
Zero Balance Accounts (%)
© 2018 Bank of Baroda. All Rights Reserved.
Social Security Schemes

Treasury operations
© 2018 Bank of Baroda. All Rights Reserved. Page | 28
Particulars
(INR crore)Mar ’17 Dec ’17 Mar’18
Domestic
Investments1,22,169 1,56,007 1,55,514
of which
SLR1,10,986 1,40,352 1,34,810
Non SLR 11,183 15,655 20,704
Held To Maturity
(HTM)88,686 87,066 92,694
Available For Sale
(AFS)32,726 67,137 62,665
Held For trading (HFT) 757 1,804 155
International
Investments 8,550 9,065 9,518
Global
Investments1,30,719 1,65,072 1,65,032
• Domestic investment book comprises of 59.60%
in HTM; 40.30% in AFS and 0.1% in HFT.
• The percent of SLR Securities to NDTL at March
31, 2018 was at 28.10%.
• As on March 31, 2018, the modified duration of
AFS investments was 1.44 & that of HTM
securities was 5.47.
• The Bank reduced PV01 of domestic investment
book from 17.60 in May 17 to 7.70 in Mar 18 in
AFS and HFT portfolio.
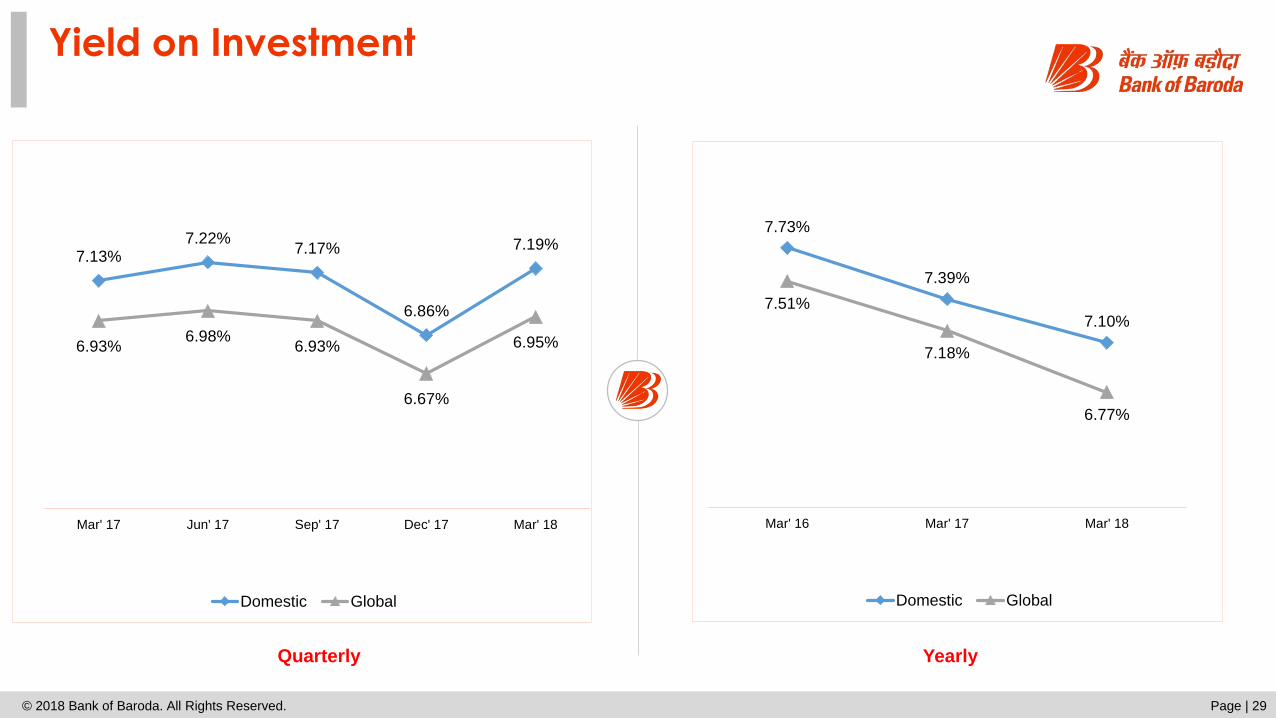
Yield on Investment
© 2018 Bank of Baroda. All Rights Reserved. Page | 29
7.73%
7.39%
7.10%7.51%
7.18%
6.77%
Mar' 16 Mar' 17 Mar' 18
Domestic Global
7.13%7.22%
7.17%
6.86%
7.19%
6.93%6.98%
6.93%
6.67%
6.95%
Mar' 17 Jun' 17 Sep' 17 Dec' 17 Mar' 18
Domestic Global
Quarterly Yearly

Business Performance-International
© 2018 Bank of Baroda. All Rights Reserved. Page | 30
Particulars
(INR crore)Mar’17 Mar’18 YOY (%)
Liabilities
Total Deposits 1,61,583 1,24,341 (23.05)
Customer Deposits 1,01,169 96,583 (4.53)
Inter Bank Deposits 60,414 27,758 (54.05)
CASA Deposits 19,902 19,456 (2.24)
Total Saving Deposits 4,145 4,587 10.66
Total Current Deposits 15,757 14,869 (5.64)
MTN 8,430 6,517 (22.69)
Assets
Advances (Gross) 1,10,756 1,09,475 (1.16)
Investments 7,749 8,611 11.12
Placements 85,850 51,839 (39.61)
Advances against exposure on Banks 53,918 47,324 (12.22)
ECBs (India Related Exposure) 25,239 25,045 (0.01)
Local credit and Syndicated Loans to Non
Indian Entities 32,848 36,223 10.27

Page | 31
Financial Performance
© 2018 Bank of Baroda. All Rights Reserved.

Net Interest Margin (%)
© 2018 Bank of Baroda. All Rights Reserved. Page | 32
2.50% 2.48%
2.68%
2.97%
2.81%
2.17%2.12%
2.31%
2.52%
2.43%
3.24%
2.92%
2.72%
2.51%
Mar' 17 Jun' 17 Sep' 17 Dec' 17 Mar' 18
Domestic Global
* Excluding exceptional items.
• Global NIM during Q4 FY 18 declined by 21 bps but excluding impact (20bps) of interest on Income Tax refund aggregating to INR 134.11 crore, the decline is
9 bps . NIM during FY 18 improved by 24 bps both domestic and global.
2.60%2.64%
2.88%
2.05%
2.19%
2.43%
Mar' 16 Mar' 17 Mar' 18
Domestic Global
Quarterly Yearly
*
*
*
*

Operating Performance
© 2018 Bank of Baroda. All Rights Reserved. Page | 33
Particulars
(INR crore)Q4 FY 17 Q3 FY 18 Q4 FY 18 YOY (%) FY 17 FY 18 YOY (%)
Interest Income 10,875 11,303 11,039 1.51 42,200 43,649 3.43
Other Income 1,977 1,673 1,696 (14.21) 6,758 6,657 (1.49)
Total Income 12,852 12,976 12,735 (0.91) 48,958 50,306 2.75
Interest Expenses 7,293 6,909 7,037 (3.51) 28,687 28,127 (1.95)
Net Interest Income
(NII)3,582 4,394 4,002 11.73 13,513 15,522 14.87
Operating Income
(NII + Other Income)5,559 6,067 5,698 2.50 20,271 22,179 9.41
Operating Expenses 2,539 2,417 3,033 19.46 9,296 10,173 9.43
Operating Profit 3,020 3,650 2,665 (11.75) 10,975 12,006 9.39
Cost to Income Ratio (%) 45.67% 39.84% 53.23%* - 45.86% 45.87% -
* Cost to income ratio was impacted on account of accounting policy change on depreciation. Adjusted to the change the ratio was 47.01%.

Interest Income & Expenses
© 2018 Bank of Baroda. All Rights Reserved. Page | 34
Particulars
(INR crore)Q4 FY 17 Q3 FY 18 Q4 FY 18 YOY (%) FY 17 FY 18 YOY (%)
Interest on advances 6,786 7,533 7,457 9.89 27,524 29,070 5.62
Interest on investments 2,850 2,721 2,781 (2.42) 10,596 10,420 (1.66)
Other Interest income 1,239 1,049 801 (35.35) 4,080 4,159 1.94
Total Interest Income 10,875 11,303 11,039 1.51 42,200 43,649 3.43
Interest on Deposits 6,827 6,390 6,383 (6.50) 26,784 26,008 (2.90)
Interest on borrowings 85 118 283 232.94 315 576 82.86
Other Interest paid 381 401 371 (2.62) 1,588 1,543 (2.83)
Total Interest Expenses 7,293 6,909 7,037 (3.51) 28,687 28,127 (1.95)

Non-Interest Income
© 2018 Bank of Baroda. All Rights Reserved. Page | 35
Particulars
(INR crore)Q4 FY 17 Q3 FY 18 Q4 FY 18 YOY (%) FY 17 FY 18 YOY (%)
Commission, Exchange, Brokerage 486 427 504 3.70 1,566 1,785 13.98
Incidental Charges 178 160 141 (20.79) 562 563 0.18
Other Miscellaneous Income 280 184 340 21.43 709 901 27.08
Total Fee Income 944 771 985 4.34 2,837 3,249 14.52
Forex Income 184 213 287 55.98 976 909 (6.86)
Trading Gains – Profit from Sale of
Investments677 509 170 (74.89) 2,618 1,878 (28.27)
Recovery from TWO 172 180 254 47.67 327 621 89.91
Total Non-Interest Income 1,977 1,673 1,696 (14.21) 6,758 6,657 (1.49)

Operating Expenses
© 2018 Bank of Baroda. All Rights Reserved. Page | 36
Particulars (INR crore) Q4 FY 17 Q3 FY 18 Q4 FY 18 YOY (%) FY 17 FY 18 YOY (%)
Employee Cost 1,222 1,110 1,268 3.76 4,638 4,607 (0.67)
of which: Salaries 1,056 1,021 1,152 9.09 3,960 4,199 6.04
Provisions for employees 166 89 116 (30.12) 678 408 (39.82)
Other Operating Expenses 1,317 1,307 1,765 33.99 4,658 5,566 19.50
of which :
Rent, Taxes and Lighting258 257 268 3.88 940 1,011 7.55
Printing and Stationery 28 18 24 (14.29) 83 77 (7.23)
Depreciation 132 121 495 275.00 511 863 68.88
Law charges 21 24 32 52.38 63 91 44.44
Postage, Telegrams, Telephone etc 45 23 32 (28.89) 167 156 (6.59)
Repairs and Maintenance 135 216 183 35.56 613 742 21.04
Insurance 134 160 167 24.63 506 610 20.55
NFS charges/Fees 65 73 73 12.31 275 274 (0.36)
Sundry charges 258 248 295 14.34 879 1,077 22.53
Other Expenditure 241 167 196 (18.81) 621 665 7.14
Operating Expenses 2,539 2,417 3,033 19.44 9,296 10,173 9.44

Profit Position
© 2018 Bank of Baroda. All Rights Reserved. Page | 37
Particulars
(INR crore)Q4 FY 17 Q3 FY 18 Q4 FY 18 YOY (%) FY 17 FY 18 YOY (%)
Operating Profit 3,020 3,650 2,665 (11.75) 10,975 12,006 9.39
Total Provisions 2,865 3,538 5,768 101.33 9,592 14,437 50.51
of which
Provision for NPA & Bad Debts
Written-off
2,425 3,155 7,053 190.85 7,680 14,212 85.05
Provision for Standard Advances 255 93 (911) - 777 (369) -
Provision for Depreciation on
Investment(83) 173 332 - 19 768 3,942.11
Other Provisions 26 5 199 665.38 26 185 611.54
Tax Provisions 242 112 (905) - 1,090 (359) -
Net Profit 155 112 (3,102) - 1,383 (2,432) -
• Provision made in for accounts under NCLT 1 & 2 list is INR 309 crore during Q4 FY 18.

Page | 38
Asset Quality
© 2018 Bank of Baroda. All Rights Reserved.
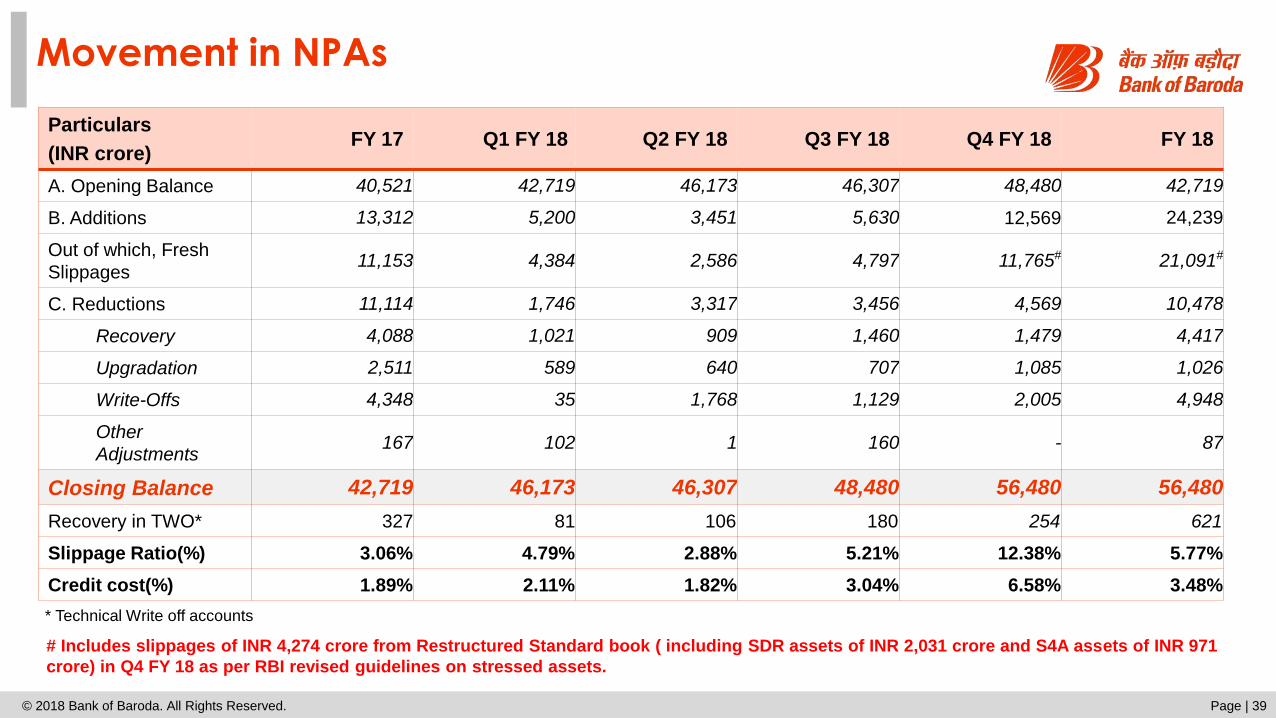
Movement in NPAs
© 2018 Bank of Baroda. All Rights Reserved. Page | 39
Particulars
(INR crore)FY 17 Q1 FY 18 Q2 FY 18 Q3 FY 18 Q4 FY 18 FY 18
A. Opening Balance 40,521 42,719 46,173 46,307 48,480 42,719
B. Additions 13,312 5,200 3,451 5,630 12,569 24,239
Out of which, Fresh
Slippages11,153 4,384 2,586 4,797 11,765# 21,091#
C. Reductions 11,114 1,746 3,317 3,456 4,569 10,478
Recovery 4,088 1,021 909 1,460 1,479 4,417
Upgradation 2,511 589 640 707 1,085 1,026
Write-Offs 4,348 35 1,768 1,129 2,005 4,948
Other
Adjustments167 102 1 160 - 87
Closing Balance 42,719 46,173 46,307 48,480 56,480 56,480
Recovery in TWO* 327 81 106 180 254 621
Slippage Ratio(%) 3.06% 4.79% 2.88% 5.21% 12.38% 5.77%
Credit cost(%) 1.89% 2.11% 1.82% 3.04% 6.58% 3.48%
* Technical Write off accounts
# Includes slippages of INR 4,274 crore from Restructured Standard book ( including SDR assets of INR 2,031 crore and S4A assets of INR 971
crore) in Q4 FY 18 as per RBI revised guidelines on stressed assets.

Provision Coverage Ratio
© 2018 Bank of Baroda. All Rights Reserved. Page | 40
Particulars Mar’16 Mar’17 Jun’17 Sep’17 Dec’17 Mar’18
Gross Advances (INR crore) 4,05,517 4,08,511 4,04,982 4,14,885 4,28,718 4,60,744
Gross NPA (INR crore) 40,521 42,719 46,173 46,307 48,480 56,480
Outstanding Provisions on NPAs/
Eligible deductions (INR crore)21,115 24,639 26,654 26,734 28,628 32,997
Net NPA (INR crore) 19,406 18,080 19,519 19,573 19,852 23,483
Gross NPA Ratio (%) 9.99% 10.46% 11.40% 11.16% 11.31% 12.26%
Net NPA Ratio (%) 5.06% 4.72% 5.17% 5.05% 4.97% 5.49%
Provision Coverage Ratio (Including
Technical Write off accounts) (%)60.09% 66.83% 66.28% 67.18% 68.03% 67.21%
Provision Coverage Ratio (Excluding
Technical Write off accounts) (%)52.11% 57.68% 57.73% 57.73% 59.05% 58.42%

NPA Ratios
© 2018 Bank of Baroda. All Rights Reserved. Page | 41
9.99%
10.46%
11.40%11.16% 11.31%
12.26%
5.06%4.72%
5.17% 5.05% 4.97%
5.49%
Mar'16 Mar ’17 Jun ’17 Sep’17 Dec'17 Mar'18
Gross NPA Ratio Net NPA Ratio

© 2018 Bank of Baroda. All Rights Reserved. Page | 42
Sectoral & Industry wise Contribution of NPAs
Particulars
(INR crore)Mar ’17 Dec ’17 Mar ’18
Corporate 18,629 23,315 30,792
MSME 8,129 8,410 7,439
Retail 2,025 2,326 1,964
Agriculture 5,266 6,963 6,753
Others 886 635 1,241
Total
Domestic34,935 41,649 48,189
International 7,784 6,831 8,291
Global 42,719 48,480 56,480
Industry (INR crore) Mar ’17 Dec ’17 Mar ’18
Infrastructure of which 2,895 4,790 8,941
1. Power 1,508 1,862 4,007
2. Telecom 127 2,008 3,690
3. Roads & Ports 547 715 1,015
4. Other Infrastructure 713 205 229
Basic Metals & Metal Industry
of which 8,267 8,408 8,374
1. Iron & Steel 7,769 7,826 7,925
Textiles 2,282 2,526 3,318
Petroleum & Petrochemicals 37 36 30
All Engineering 685 2,232 2,134
Food Processing 410 1,876 2,158
Chemicals and Chemical
Products559 593 277
Trade 1,828 1,775 1,775
Commercial Real Estate 290 320 575

Exposure to NCLT accounts
© 2018 Bank of Baroda. All Rights Reserved. Page | 43
7,158
3,830
10,988
NCLT 1 List NCLT 2 List Total
Exposure in INR crore
55.18%55.20%
55.19%
NCLT 1 List NCLT 2 List Total
Provision Coverage (%)
• The resolution in most accounts of NCLT-1 list likely to be in first half of FY 19.
• The resolution in most accounts of NCLT-2 list likely to be by end of FY 19.
• Resolution of NCLT accounts to lead to lower GNPAs, in addition to better margins.
• Bank has made provision of 40% of secured portion plus 100% of unsecured portion or provision already held
whichever is higher, in respect of exposures to specific accounts under NCLT 1 and NCLT 2 lists of RBI. Balance
amount of provision to be made in such accounts in June 2018 quarter is INR 519.86 crore.

Asset Quality – Watch list
© 2018 Bank of Baroda. All Rights Reserved. Page | 44
All accounts from SMA 2 and stressed SMA 1 list are
included in the watchlist.
S4A accounts continuing as standard are included in the
watchlist.
Last year recovery & upgrades of INR 5,443 crore was
without NCLT resolutions. Recovery & upgrades in FY 19
to be higher on account of NCLT resolutions.
2045
2215
274374
5131
Watchlist for FY19
Power Road & EPC Iron & Steel Textile Others
10039
INR in Crore

Page | 45
Capital Adequacy & Shareholding
© 2018 Bank of Baroda. All Rights Reserved.

Capital Adequacy
© 2018 Bank of Baroda. All Rights Reserved. Page | 46
Particulars (INR crore) Mar ’17 Dec ’17 Mar’18
Common Equity Tier I Capital (CET 1) 35,881 34,609 37,646
Tier I Capital 39,709 39,831 42,650
Tier II Capital 9,202 8,464 6,813
Total Capital 48,911 48,295 49,463
• Capital Adequacy of the Bank continues to be above regulatory norms.
8.98% 8.28%9.23%
0.95%1.24%
1.23%
2.31%2.03%
1.67%
Mar '17 Dec '17 Mar'18
Tier IIAT-1CET-1
12.24%
9.93%
11.55%
9.52%
12.13%
10.46%
Tier I

Shareholding Pattern as on March 31, 2018
Page | 47
Government of India, 64.03%
Mutual Funds, 11.25%
Insurance Companies,
2.54%
FIIs & FPIs, 14.37%
Indian Public, 4.88%
Corporate Bodies, 1.92%
Others, 1.01%
As on March 31, 2018
Bank of Baroda is a part of the following Indices:
BSE 100, BSE 200, BSE 500 & Bankex
BankNifty, Nifty 100, Nifty 200, Nifty 500
Bank of Baroda’s shares are also listed on BSE and NSE in
the ‘Future and Options’ segment
Share Capital: INR 529.10 crore
On March 27, 2018, Bank made preferential allotment of 3,413.56
lakh shares of INR 2 paid up value at an issue price of INR
157.46 per share amounting to INR 5,375 crore to Government of
India.
© 2018 Bank of Baroda. All Rights Reserved.

Page | 48
Strengths & Initiatives
© 2018 Bank of Baroda. All Rights Reserved.

Key Strengths
© 2018 Bank of Baroda. All Rights Reserved. Page | 49
A well recognized brand in the Indian Banking Industry
with strong retail franchise
Subsidiaries and JVs cover the entire Financial Spectrum -
Insurance, Asset Management, Capital Markets Pioneer in many customer centric initiatives
Capital Adequacy Ratio of 12.13% which is above the
regulatory requirements
Strong domestic presence through 5,467 branches &
9,704 ATMs and Cash Recyclers supported by
self-service channels
Deep Financial Inclusion Coverage – 31.20 million accounts,
with a total deposits of INR 9,689 crore and average
balance of INR 3,105
Customer base of ~78 million
Committed Workforce of 55,662
Global presence across 105 overseas offices spanning 23
countries
Well distributed branch network with 34% coverage in Rural,
28% in Semi-urban, 21% Metro and 17% Urban
Established on July 20, 1908, Bank of Baroda is a 109 year old Bank with 64.03% stake held by the Government of India.

Pan India Presence
© 2018 Bank of Baroda. All Rights Reserved. Page | 50
Domestic Branch Network
989 1,008 1,166 1,167
903 933 921 930
1,386 1,4251,523 1,537
1,912 1,9641,812 1,833
*Mar'15 *Mar'16 ** Mar'17 **Mar'18
Metro Urban Semi Urban Rural
5,190 5,4225,330 5,467
ATM Network
*Total : 9,704 ATMs and Cash Recyclers
*Mar’15 and Mar’16 data as per 2001 census.
** Mar’17, Mar’18 data as per the 2011 census .
Bank had 346 e-lobbies, with 24*7 facilities for cash withdrawal, cash deposit,
cheque deposit, passbook printing and internet banking. Including express
e-lobbies the total number of e-lobbies are 1,006 as on 31st March 2018.

International Presence spanning 105 overseas offices across 23 countries
© 2018 Bank of Baroda. All Rights Reserved Page | 51
58 Branches in 15 countries (territories).
8 Subsidiaries having 47 Branches.
1 Joint Venture, 1 Associate with 31 branches.
In addition to above, there is 1 International Banking Unit (IBU) in GIFT City (SEZ), Gandhinagar, Gujarat, India, opened on 23.11.2017
Branches at Bahamas and Bahrain are in the process of closure.
Formation of subsidiary at UK for retail business viz. Bank of Baroda (UK) Ltd. is at advanced stage and necessary approval has been received from Prudential
Regulatory Authority (PRA).
Americas
USA
Bahamas
Guyana
Trinidad & Tobago
Europe
UK
Brussels
Africa
Uganda
Kenya
Botswana
Tanzania
South Africa
Mauritius
Seychelles
Ghana
Zambia
Middle East
UAE
DIFC
Oman
Bahrain
South East Asia
China
Hong Kong
Singapore
Malaysia
Far East
FijiAustralia
New Zealand
Color Codes
• Wholesale business
• Full Banking Centres
• Offshore Banking Units
• Joint Venture
• Associate
India
IBU GIFT City

Shared Services building process consistency, controlled environment and scalable architecture (1/2)
© 2018 Bank of Baroda. All Rights Reserved Page | 52
1. Inward Remittances
2. Advance Remittance
against Imports
3. Import LC
4. Export Financing
5. Import Bill Payments
6. Outward Remittances
7. Export bills for
collection
8. EEFC Conversion
Global Trade Services
(TFBO)
Account Management
Services (RLBO)Retail Assets (CPC)
Processes &
Transactions
Zones/ Branches 13 Zones/ 144 Branches
1. NRI Overseas
2. NRI/ NRO
3. FCNR*
4. Current Accounts
5. Cheque book
processing
6. Welcome letter
7. Savings Accounts
1. Baroda Traders Loan
2. Baroda Education Loan
3. Baroda Mortgage Loan
4. Additional Assured
Advance
5. Home Improvement
6. Baroda Home Loan
7. Staff Housing Loan
11/13 Zones/ 4900/54509/13 Zones/ 50/77- SMS
Initiatives Quality Control & Help Desk
Customer Owners
Priority Desk
Quality Control & Help Desk
Priority Desk
Quality Control & Help Desk
1. 24x7x365 capabilities
2. Appropriate, trained &
adequate staffing
3. Dedicated & specialized
subsidiary
4. Focus on freeing branch
time for sales
At GIFT City
Next ProjectsAccount Management Services (Wave 2), CMS, Clearing, Digital Banking, ATM management,
Analytics, Bank HR Ops and various other back office functions.
Over 1,400 workforce in place

Shared Services Centre (2/2)
© 2018 Bank of Baroda. All Rights Reserved Page | 53
Implementation of world class workflow tools like Baroda Insta (Trade & Forex), LLPS – Newgen (Retail lending) & Omni flow – Newgen(Account Opening) as a part of digital transformation.
Six Sigma performance improvement model kicked off. Performance dashboards on overall health of organization has already taken life.
Quality Control, RCSA, Information Security, & KRIs has been designed and Implemented with robust centralized monitoring systemacross verticals.
Bank’s wholly owned captive has more than 600 FTEs in non-voice ( transaction processing ) and ~ 750 FTEs in voice ( Call Centre ) ,expected to scale to over 2000+ FTEs by year end.
Rolled out robust Operational framework to enhance preventive and detective controls built in prior to migration of any process suchas segregation of duties , no end to end dominance , 3 layers of defence or 6 eye principle .
Customer connect through branch visits, Customer visits to Trade & Forex back office, Video conference has been initiated. Transformingcustomer experience is going to be a theme and mission of the entity.
Migrated to completely paperless process at GIFT City, yielding significant cost save for the Bank. Also Robotics and Digitization isexplored at various corners to encourage STP, leading to error free processing, further cost saves and customer delight.

Digital Footprint
© 2018 Bank of Baroda. All Rights Reserved. Page | 54
~ 14 lakh new Debit cards were issued during Q4 FY 18 out of which 37.10% were issued in
existing accounts. Apart from Debit Cards, Bank also offers Credit, Forex and Gift Cards
Recent Product Suite
8364
1340 1006452
ATM Cash Recycler E-lobbies (Inclexpress E-
lobbies)
Active DebitCard (in lac)
Digital Network Mobile Banking (F+NF)
(YOY growth)
63.71%POS/ECOM
(YOY growth)
UPI Outward txns
(QOQ growth)
Net Banking (F+NF)
(YOY growth)
142.92%
20.62%30.07%
Multi Function Kiosk Account Opening Kiosk BHIM Baroda
Aadhaar PayBaroda
Reloadable Card
Co Branded
Debit Card
* Alternate Delivery Transactions data includes Financial
and Non-Financial transactions.
Dig
ita
l P
ort
ab
le B
ran
ch
ATM28.93%
CR5.11%
POS-ECOM14.08%
Net Banking7.79%
Mobile Banking19.48% UPI
2.39%
SSPBP10.05%
Miss Call11.01%
Contact Center1.14%
Other22.23%
ADC Transactions* (FY18)
Total Transaction- 95.13 Crore (F+NF)

Page I 18
Digital Initiatives: TAB Banking for instant paperless account opening
Page | 50© 2018 Bank of Baroda. All Rights Reserved
• Tab Banking offers a secure, fast, robust, real-time cross-platform with the best in class user experience which can be enabled
for 35+ banking services like anytime anywhere instant account opening, mini statement, balance enquiry, bank details update,
debit card & cheque related services, etc. at the tip of finger
• All branches pan India have been enabled with fully digitized account opening process flow though Tab Banking
• Account opening is e-KYC enabled with biometric identification fetching Aadhar details from its data base
© 2018 Bank of Baroda. All Rights Reserved

The Fintech Alliances
Baroda Finathon received more than 4600 registrations and
330 plus applications out of which 12 were shortlisted.
The themes for Finathon included: Innovation, customer
acquisition, customer experience, conversational banking,
collections, compliance, operational efficiency.
The Hackathon Finale was conducted on 26th February,’18 at Baroda Corporate
Centre with winners adjudged from the shortlisted teams:
* In collaboration with Rural & Agri Banking and CSR Department
*
• The Fintech Alliance is 25 partnerships strong
• Bank is the founding member of the Bankchain Consortium formed
for exploring, building and implementing Blockchain solutions in
Banks
• First Bank to support RBI driven Fintech initiative for easing MSMEs’
access to working capital by being on-boarded on all -3- TReDS
platforms - Mynd solutions, RXIL and A.TREDS
• Business in embryonic stage and significant traction seen.
• Bank’s Hackathon – “Baroda Finathon”
1st prize - Innovative in app payments solution
2nd prize - Conversational + video banking
3rd prize - facial recognition based CX
Key Highlights
© 2018 Bank of Baroda. All Rights Reserved. Page | 56

HR Initiatives (1/2)
▪ New PMS Baroda GEMS – Growth & Empowerment Management
System designed on the four principles of the Balanced Score Card
covering Business, Risk & Controls, Customer and Employee
Perspectives, under implementation
▪ Comprehensive Bank-wide leadership program under ‘WeLead’ rolled
out covering all cadre of officers
▪ Rollout of employee engagement initiatives under ‘Baroda Anubhuti’ with
social impact
▪ Unveiling of the Bank’s core values post internal workshops with staff
and alignment with leadership competencies
© 2018 Bank of Baroda. All Rights Reserved Page | 57
Strengthening People Capabilities through multiple HR interventions
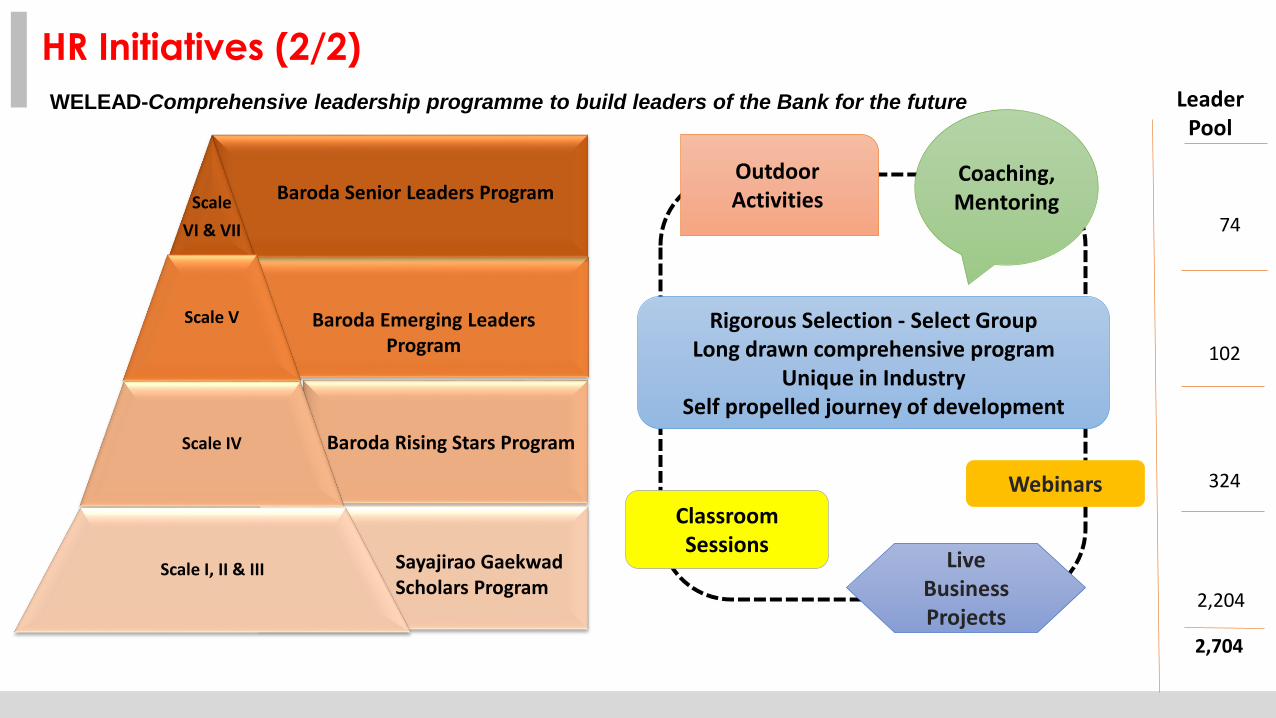
WELEAD-Comprehensive leadership programme to build leaders of the Bank for the future
Scale
VI & VII
Scale V
Scale IV
Scale I, II & III Sayajirao GaekwadScholars Program
Baroda Rising Stars Program
Baroda Emerging Leaders Program
Baroda Senior Leaders Program
Leader Pool
74
102
324
2,204
2,704
Rigorous Selection - Select GroupLong drawn comprehensive program
Unique in IndustrySelf propelled journey of development
Classroom Sessions
Outdoor Activities
Coaching, Mentoring
Webinars
Live Business Projects
HR Initiatives (2/2)

Page | 59
Consolidated Financials
© 2018 Bank of Baroda. All Rights Reserved.

Subsidiaries, Joint Ventures and Associates
Page | 60
Domestic Subsidiaries, Joint Ventures
and Associates
Proportion of
Ownership
Subsidiaries
BOB Financial Solutions Limited 100.00%
BOB Capital Markets Limited 100.00%
Baroda Global Shared Services Limited 100.00%
Baroda Sun Technologies Ltd. 100.00%
Associate Bank
Nainital Bank Limited 98.57%
Joint Ventures
India First Life Insurance Company Limited 44.00%
India Infradebt Limited 36.86%
Associates
Baroda Pioneer Asset Management Company Ltd 49.00%
Baroda Pioneer Trustee Co. Pvt. Limited 49.00%
Regional Rural Banks
Baroda Uttar Pradesh Gramin Bank 35.00%
Baroda Rajasthan Gramin Bank 35.00%
Baroda Gujarat Gramin Bank 35.00%
International Subsidiaries, Joint
Ventures and Associates
Proportion of
Ownership
Subsidiaries
Bank of Baroda (Botswana) Limited 100.00%
Bank of Baroda (Kenya) Limited 86.70%
Bank of Baroda (Uganda) Limited 80.00%
Bank of Baroda (Guyana) Inc 100.00%
Bank of Baroda (New Zealand) Limited 100.00%
Bank of Baroda (Tanzania) Limited 100.00%
Bank of Baroda (Trinidad & Tobago) Limited 100.00%
Bank of Baroda (Ghana) Limited 100.00%
Bank of Baroda (UK) Limited 100.00%
Joint Venture
India International Bank (Malaysia), Berhad 40.00%
Associate
Indo-Zambia Bank Limited 20.00%
Overseas Non-Banking Subsidiary
BOB (UK) Limited 100.00%
© 2018 Bank of Baroda. All Rights Reserved

Balance Sheet – Consolidated
Page | 61
Particulars
(INR crore)Mar ’17 Dec ’17 Mar ’18
CAPITAL & LIABILITIES
Capital 462 462 530
Reserves & Surplus 42,605 43,184 46,036
Minority Interest 233 258 273
Deposits 6,17,257 5,88,753 6,07,451
Borrowings 31,242 47,330 64,860
Other Liabilities & Provisions 27,421 29,378 28,655
T O T A L 7,19,220 7,09,365 7,47,805
ASSETS
Cash and Balances with RBI 23,915 23,587 24,035
Balances with Banks 1,30,200 67,695 73,388
Investments 1,40,716 1,75,191 1,75,137
Loans & Advances 3,92,262 4,09,503 4,37,941
Fixed Assets 5,930 5,652 5,532
Other Assets 26,197 27,737 31,772
T O T A L 7,19,220 7,09,365 7,47,805
© 2018 Bank of Baroda. All Rights Reserved.

Profit & Loss – Consolidated
Page | 62
Particulars
(INR crore)Q4 FY 17 Q3 FY 18 Q4 FY 18 YOY (%) FY 17 FY 18 YOY (%)
Net Interest Income 3,950 4,801 4,275 8.23 14,877 16,896 13.57
Non Interest Income 2,342 1,974 2,224 (5.04) 7,937 7,992 0.69
Fee Income 527 459 548 3.98 1,691 1,927 13.96
Premium Income 342 232 440 28.65 977 993 1.64
Other Income 1,473 1,284 1,235 (16.16) 5,269 5,072 (3.74)
Total Income 6,292 6,776 6,498 3.27 22,814 24,888 9.09
Operating Expenses 2,855 2,661 3,425 19.96 10,350 11,327 9.44
Operating Profit 3,437 4,115 3,073 (10.59) 12,464 13,561 8.80
Provisions 2,953 3,716 6,892 133.39 9,440 15,667 65.96
Profit before Tax 484 399 (3,819) - 3,024 (2,106) -
Tax 259 167 (889) - 1,247 (194) -
Minority Interest 7 13 16 128.57 40 51 27.50
Share of Earning in Associates 37 8 39 5.41 78 76 (2.56)
Profit after Tax 255 227 (2,907) - 1,815 (1,887) -
Return on Equity (%) (Annualised) 3.07% 2.68% (0.33)% - 5.44% (0.05)% -
EPS (INR) 1.11 0.99 (12.60) - 7.88 (8.17) -
© 2018 Bank of Baroda. All Rights Reserved.

Capital Adequacy - Consolidated
Page | 63
Key ratios (Consolidated) Mar’ 17 Dec’ 17 Mar’ 18
Common Equity Tier I Capital (CET 1) (INR crore) 40,014 38,969 42,348
Tier I (INR crore) 43,842 44,191 47,352
Tier II (INR crore) 9,293 8,417 6,715
Total Capital (INR crore) 53,135 52,608 54,067
CET 1 Ratio (%) 9.64% 8.95% 10.08%
Tier I Ratio (%) 10.56% 10.15% 11.27%
Tier II Ratio (%) 2.24% 1.93% 1.60%
Capital Adequacy Ratio (%)- Basel-III 12.80% 12.08% 12.87%
© 2018 Bank of Baroda. All Rights Reserved.

Awards and Accolades
Page | 64© 2018 Bank of Baroda. All Rights Reserved.
Bank has been awarded winner in
Agricultural Banking in the large class bank
category in ASSOCHAM social banking
excellence award 2017.
Bank received Banking Frontiers Finnoviti 2018
award for Financial Inclusion.
Bank was awarded “Makers of Excellence
APY (Atal Pension Yojana) Campaign (7th
to 20th December, 2017)” award to MD &
CEO Mr. P. S. Jayakumar in a function on
22.02.2018.
Bank has been ranked among the top 50 companies in India on People Capital Index(PCI) which is brought out by HR analytics and assessment firm, Jombay in
partnership with Job portal site Naukri.com and British Standards Institute (BSI)

Disclaimer
© 2018 Bank of Baroda. All Rights Reserved. Page | 65
The information contained in this presentation is provided by Bank of Baroda (the “Bank”) to you solely for your information. This document is highly confidential and being given solely for your use
and may not be retained by you and neither this presentation nor any part thereof may be (i) used or relied upon by any other party or for any other purpose; (ii) copied, photocopied, duplicated or
otherwise reproduced in any form or by any means; or (iii) re-circulated, redistributed, passed on, published in any media, website or otherwise disseminated, to any other person, in any form or
manner, in part or as a whole, without the prior written consent of the Bank. Any unauthorized use, disclosure or public dissemination of information contained herein is prohibited. This presentation
does not purport to be a complete description of the markets’ conditions or developments referred to in the material.
This presentation is for private circulation only and does not constitute and should not be construed as an offer or invitation or inducement to sell or issue, or any solicitation of any offer to purchase
or subscribe for, any securities of the Bank, nor shall it or any part of it or the fact of its distribution form the basis of, or be relied on in connection with, any contract or commitment therefor. This
presentation is for general information purposes only, without regard to any specific objectives, financial situations or informational needs of any particular person.
No representation, warranty, guarantee or undertaking, express or implied, is or will be made or any assurance given as to, and no reliance should be placed on, the fairness, accuracy,
completeness or correctness of any information, estimates, projections or opinions contained herein. Potential investors must make their own assessment of the relevance, accuracy and adequacy
of the information contained in this presentation and must make such independent investigation as they may consider necessary or appropriate for such purpose. The statements contained in this
presentation speak only as at the date as of which they are made, and the Bank expressly disclaims any obligation or undertaking to supplement, amend or disseminate any updates or revisions to
any statements contained herein to reflect any change in events, conditions or circumstances on which any such statements are based. Neither the Bank nor any of its respective affiliates, its board
of directors, its management, advisers or representatives, including any lead managers and their affiliates, or any other persons that may participate in any offering of securities of the Bank, shall
have any responsibility or liability whatsoever (in negligence or otherwise) for any loss howsoever arising from any use of this presentation or its contents or otherwise arising in connection with this
presentation.
The Bank may alter, modify or otherwise change in any manner the contents of this presentation, without obligation to notify any person of such revision or changes. Certain statements made in this
presentation may be “forward looking statements” for purposes of laws and regulations of India and other than India. These statements include descriptions regarding the intent, belief or current
expectations of the Bank or its directors and officers with respect to the results of operations and financial condition, general business plans and strategy, the industry in which the Bank operates
and the competitive and regulatory environment of the Bank. These statements can be recognized by the use of words such as “expects,” “plans,” “will,” “estimates,” “projects,” or other words of
similar meaning. Such forward-looking statements are not guarantees of future performance and involve risks and uncertainties, and actual results may differ from those in such forward-looking
statements as a result of various factors and assumptions, including future changes or developments in the Bank’s business, its competitive environment, information technology and political,
economic, legal, regulatory and social conditions in India, which the Bank believes to be reasonable in light of its operating experience in recent years. The Bank does not undertake to revise any
forward-looking statement that may be made from time to time by or on behalf of the Bank.
This presentation is not an offer to sell or a solicitation of any offer to buy the securities of the Bank in the United States or in any other jurisdiction where such offer or sale would be unlawful.
Securities may not be offered, sold, resold, pledged, delivered, distributed or transferred, directly or indirectly, in to or within the United States absent registration under the United States Securities
Act of 1933, as amended (the “Securities Act”), except pursuant to an exemption from, or in a transaction not subject to, the registration requirements of the Securities Act and in compliance with
any applicable securities laws of any state or other jurisdiction of the United States. The Banks’s securities have not been and will not be registered under the Securities Act.
Neither this document nor any part or copy of it may be distributed, directly or indirectly, in the United States. The distribution of this document in certain jurisdictions may be restricted by law and
persons in to whose possession this presentation comes should inform themselves about and observe any such restrictions. By reviewing this presentation, you agree to be bound by the foregoing
limitations. You further represent and agree that you are located outside the United States and you are permitted under the laws of your jurisdiction to receive this presentation.
The financial figures and ratios, are based on the audited financials or limited review financials or based on management estimates.

Thank You
© 2018 Bank of Baroda. All Rights Reserved. Page | 66
Related Documents