Journal of Physics: Conference Series OPEN ACCESS Perfmon2: a leap forward in performance monitoring To cite this article: S Jarp et al 2008 J. Phys.: Conf. Ser. 119 042017 View the article online for updates and enhancements. You may also like Design Of Server Performance Monitoring Application Integrated Administration Service System In Electronic Engineering Department Elfi Tasrif, Asrul Huda, Hadi Kurnia Saputra et al. - On the use of high-frequency SCADA data for improved wind turbine performance monitoring E Gonzalez, B Stephen, D Infield et al. - Implementation of high concentration photovoltaic grid connected power plant for training, research, innovation and solar electricity production A Barhdadi, A Benazzouz, B Fabrizio et al. - This content was downloaded from IP address 121.179.179.30 on 31/01/2022 at 23:13

Welcome message from author
This document is posted to help you gain knowledge. Please leave a comment to let me know what you think about it! Share it to your friends and learn new things together.
Transcript

Journal of Physics Conference Series
OPEN ACCESS
Perfmon2 a leap forward in performancemonitoringTo cite this article S Jarp et al 2008 J Phys Conf Ser 119 042017
View the article online for updates and enhancements
You may also likeDesign Of Server Performance MonitoringApplication Integrated AdministrationService System In Electronic EngineeringDepartmentElfi Tasrif Asrul Huda Hadi KurniaSaputra et al
-
On the use of high-frequency SCADA datafor improved wind turbine performancemonitoringE Gonzalez B Stephen D Infield et al
-
Implementation of high concentrationphotovoltaic grid connected power plantfor training research innovation and solarelectricity productionA Barhdadi A Benazzouz B Fabrizio et al
-
This content was downloaded from IP address 12117917930 on 31012022 at 2313
Perfmon2 A leap forward in Performance Monitoring
Sverre Jarp Ryszard Jurga Andrzej Nowak
CERN Geneva Switzerland
SverreJarpcernch
Abstract This paper describes the software component perfmon2 that is about to be added to the Linux kernel as the standard interface to the Performance Monitoring Unit (PMU) on common processors including x86 (AMD and Intel) Sun SPARC MIPS IBM Power and Intel Itanium It also describes a set of tools for doing performance monitoring in practice and details how the CERN openlab team has participated in the testing and development of these tools
1 Introduction Justifying performance monitoring There are multiple reasons why performance tuning of an application or a subsystem is still worth the effort even in an era where hardware is seen as ldquocheaprdquo and manpower is considered expensive The first case is when computers are purchased for tens of millions of euros so that even economies of just a few percent can compensate for the salaries of the people doing performance work
A second case which is fairly recent is when computer centres fill up to their power and thermal limits with the consequence that no more servers can be installed If additional capacity is nevertheless needed one may either be forced to exchange some of the equipment with more thermally-efficient hardware (if it exists) or turn to performance tuning in order to squeeze out more performance
A third case is when high-cost personnel wait for computers to complete their calculations Percentage gains in turn-around time can then be translated directly into more efficient manpower
An additional incentive is no doubt personal pride of the software designerprogrammer Ideally one wants performance analysis to be performed throughout the entire development cycle of an application so that the application does not exhibit ldquoinefficientrdquo behaviour or excessive consumption of computing resources
2 The initial Itanium development When the Itanium processor was designed (jointly by HP and Intel) a Performance Monitoring Unit (PMU) was added to the processor architecture as a complete and consistent facility The PMU presented a well-defined interface to the operating system for both the programming and the corresponding data collection For counting events a vast number of counters were added ndash so that for instance every cycle in the execution pipelines could be accounted for or every action in the cache hierarchy could be explained In addition several advanced features such as Branch Trace Buffers were introduced
When Linux was initially ported to the Itanium in the late nineties [1] Steacutephane Eranian from HP Labs took on the task of developing the required software to exploit the PMU in order to monitor the
International Conference on Computing in High Energy and Nuclear Physics (CHEPrsquo07) IOP PublishingJournal of Physics Conference Series 119 (2008) 042017 doi1010881742-65961194042017
ccopy 2008 IOP Publishing Ltd 1
performance of applications or even the kernel itself The tool became an important instrument in the effort to port applications to the Itanium platform
3 A bright idea comes along As a natural extension to the work he had done on the Itanium Steacutephane then decided to extend the Linux kernel support to cover all modern processor families He called the successor product perfmon2 [2] In addition to providing a broad support for hardware variants he negotiated with the Linux kernel maintainers to get the patch added to the main kernel tree In the beginning the maintainers were sceptical primarily because the kernel hooks for perfmon2 sit in very sensitive areas of the kernel such as the dispatcher and the interrupt handler The community did not want any unnecessary overhead to be added to such time-critical kernel areas and it took several kernel releases to introduce the appropriate infrastructure for perfmon2 without upsetting the community At the time of writing it seems that perfmon2 will be entirely added as of kernel version 2624 later this autumn
4 Detailed description of perfmon2pfmon Perfmon2 aims to be a portable interface across all modern processors [3][4] It is designed to give full access to a given PMU and all the corresponding hardware performance counters Typically the PMU hardware implementations use a different number of registers counters with different length and possibly other unique features a complexity that the software has to cope with Although processors have different PMU implementations they usually use configurations registers and data registers Perfmon2 provides a uniform abstract model of these registers and exports readwrite operations accordingly The software supports a wide variety of processor architectures including Intel Itanium Intel P6 P4 P2 Pentium M Core and Core 2 processors the AMD Opteron (Dual and Quad-core) IBM Cell processor and a range of MIPS processors [5]
Figure 1 One tool on all supported platforms
International Conference on Computing in High Energy and Nuclear Physics (CHEPrsquo07) IOP PublishingJournal of Physics Conference Series 119 (2008) 042017 doi1010881742-65961194042017
2
The interface is implemented using system calls in order to support per-thread monitoring
implying a costly context switch by the kernel The interface provides support for system-wide measurements Multiple per-thread perfmon2 contexts can coexist at the same time on a system Multiple system-wide sessions can co-exist as long as they monitor different processors Per-thread mode and system-wide mode cannot exist at the same time For each mode it is possible to collect simple counts or create full sampling measurements in both cases using 64-bit counters in either user or kernel mode Perfmon2 uses the number of events in order to determine the sampling period In sampling mode the interface uses a kernel sampling buffer in order to minimize the overhead since this reduces the communication between user and kernel levels on each sampling counter overflow
Figure 2 What is where regarding pfmon For the cases where the performance units have too few counters or when some events can not be
measured together perfmon2 supports event sets and multiplexing The perfmon2 interface is complemented by the libpfm library as well as with the pfmon tool The
library provides the actual access to the interface for user applications since it contains a set of functions adapted to each processor for readwrite operations to the perfmon2 exported registers The library also provides the API in order to take advantage of more complex PMU features like the Branch Trace Buffer (BTB) and ldquoopcode matchingrdquo on Itanium
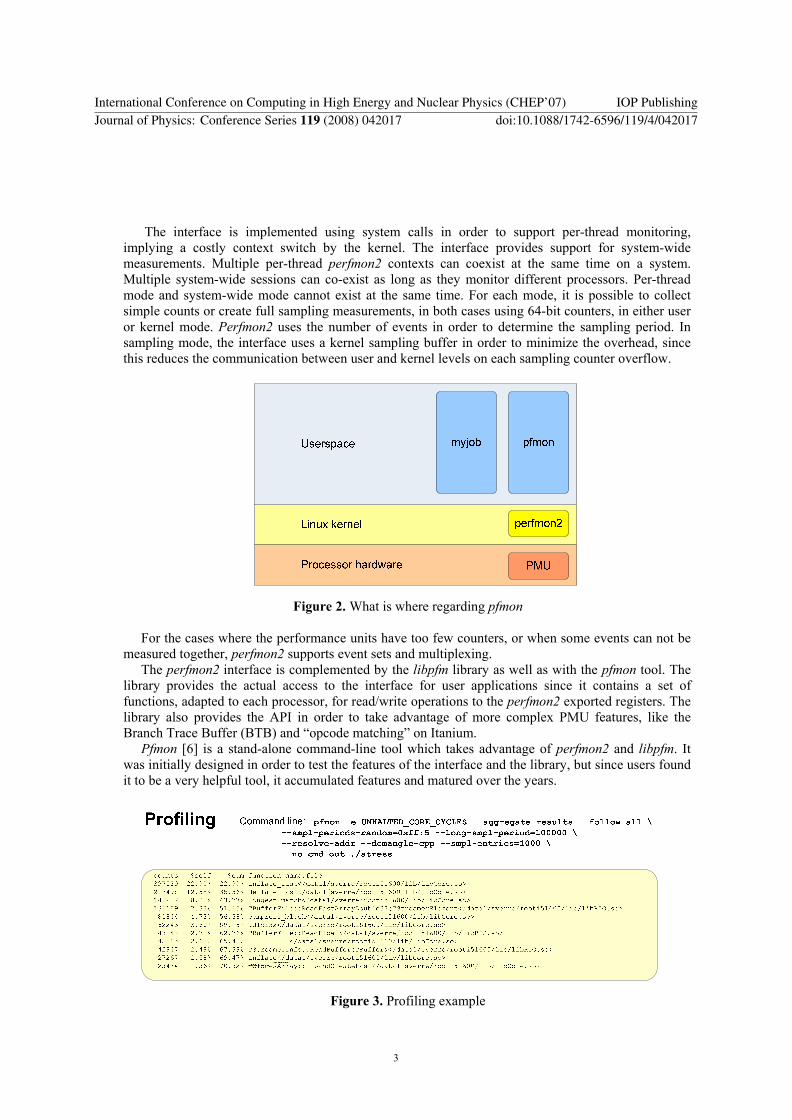
Pfmon [6] is a stand-alone command-line tool which takes advantage of perfmon2 and libpfm It was initially designed in order to test the features of the interface and the library but since users found it to be a very helpful tool it accumulated features and matured over the years
Figure 3 Profiling example
International Conference on Computing in High Energy and Nuclear Physics (CHEPrsquo07) IOP PublishingJournal of Physics Conference Series 119 (2008) 042017 doi1010881742-65961194042017
3
Pfmon can do system-wide or per-thread measurements by monitoring across pthread_create fork
and exec function calls Such measurements can be done for a new process or for an existing one by attaching dynamically to the process The measurements can be triggered at a specific code location if desired This can be useful if for instance one wants to skip the initialization phase of a program and only monitor the rest In addition to counting PMU events pfmon supports profiling without requiring a recompilation of the application It can report which addresses from the application contribute to the overall number of cycles instructions cache misses etc With the CERN openlab [7] extensions to pfmon it can map these addresses to symbol names across multiple processes and shared libraries dynamically loaded or linked against the application For C++ and Java symbols pfmon can demangle symbols and produce more user-friendly names In order to avoid pathological patterns in sampling mode pfmon provides the possibility to randomize sampling periods All results can be aggregated across different measurement domains and can be either printed on the screen or saved into a file for further analysis
5 Complexity of CERN benchmarks - Shared library support in perfmon2 The High Energy Physics (HEP) community develops a great deal of in-house software There is a wide spectrum of components involved in the programming process including programming languages such as CC++ Java and even FORTRAN in addition to scripting languages such as python or bash The applications are run on top of multiple hardware configurations and set-ups The global development effort produces software that has a wide variety of functionality and complexity from simple applications to huge simulation frameworks built with hundreds of shared libraries These complex frameworks are based on a multitude of components developed by different teams inside HEP or by the open source community As already mentioned in the introduction there are multiple reasons for wanting to tune the performance of such frameworks
Both pfmon and the underlying perfmon2 offer many features that should be useful in the HEP computing environment in terms of performance monitoring and profiling The portability and scalability across different hardware platforms is of particular value However pfmon was also found to have some limitations especially related to dynamic libraries [8] The HEP applications make extensive use of such libraries and because they spend most of their execution time in these libraries the weaknesses in pfmon become problematic In addition if dynamic libraries are loaded and unloaded in various ways (ie from CC++ program or from python script) in different parts of the application pfmonrsquos raw addresses can be misleading Further problems are caused by the fact that a lot of HEP applications run as a consecutive series of smaller processes which is reported as a series of forkexec events
6 Bugs and other issues dealt with by CERN openlab As already described pfmon does not handle dynamic libraries correctly It reports raw addresses from dynamic libraries instead of function names which makes the analysis difficult almost impossible There is also the issue of multiple processes (created via fork or exec) that causes problems when we want to observe symbols instead of virtual addresses since pfmon initially could perform symbol resolution only from the main executable Given that pfmon nevertheless has a lot of other useful features we have contributed some extensions in order to meet our requirements
We have extended pfmonrsquos functionality [9] allowing it to handle all libraries both those that were linked against applications as well as those that were dynamically loaded during the execution As a result our extended pfmon is able to deal with all symbols from such libraries and report profiling results with function names Thanks to our improvement we are also able to see these symbols across all processes started from the main executable Our extensions are fully portable and run on IA-32 Intel-64 and AMD64 as well as on IA-64 platforms In the process of working on these improvements we also solved a few additional issues related to pfmon Since the HEP applicationsrsquo set-up and resource requirements are very demanding our tests helped us to find and solve memory
International Conference on Computing in High Energy and Nuclear Physics (CHEPrsquo07) IOP PublishingJournal of Physics Conference Series 119 (2008) 042017 doi1010881742-65961194042017
4
leak problems We have also solved a ldquodangling file handlerrdquo issue when we reached more than five thousand open files while running profiling During various tests we have discovered a few bugs in verbose mode where in some cases pfmon tries to print data which is not accessible We have also found an issue with automatic inheritance of debug registers on fork call which is acceptable for the x86 architecture but not for IA-64
7 GPFMON Gpfmon [10] is a graphical front-end to pfmon written in Python and GTK-2 running on Linux systems The concept for this application developed by CERN openlab stems from the need to provide a convenient and user friendly way to launch pfmonperfmon2 monitoring sessions The front-end nearing the beta phase as of this writing not only does this but also brings additional value on top of the original program Most notably it provides an advantage to less advanced users as well as advanced users requiring visualization capabilities
Apart from the fact that gpfmon relieves users from writing 250-character long command lines the tool provides some aid in event selection by visualizing available PMU events their descriptions dependencies and counters independently of the architecture The event selection process is assisted according to the amount and availability of counters in the PMU Moreover scenarios consisting of event ratios may be selected such as cycles per instructions or the percentage of missed branch predictions Gpfmon automatically selects events needed to produce the selected ratios in order to eventually produce either a single figure or time-dependent data In effect it is easy to gain a more complex insight into the monitored program and see how some ratios change over time In addition gpfmon supports remote monitoring sessions via plain SSH without the need to install any additional software In this scenario the client (gpfmon) uses the SSH protocol to connect to a remote machine running perfmon2 and pfmon and shows the results locally on the users computer This solution not only lifts the burden of supporting the GUI from the monitored machine but also enables monitoring in GUI mode on less robust network links which might not be able to support the GUI displayed via X-forwarding or VNC Gpfmon also generates several types of plots for flat profile and sampling data enabling users to see the characteristics of their applications at a glance
Figure 4 A gpfmon session and a produced graph The tool will continue to evolve towards a robust user interface adding even further value to
pfmon and including such features as advanced scenario support results and profile management and enhanced plot generation A fully stable 10 version of the program is expected in the fourth quarter of 2007
International Conference on Computing in High Energy and Nuclear Physics (CHEPrsquo07) IOP PublishingJournal of Physics Conference Series 119 (2008) 042017 doi1010881742-65961194042017
5
8 Conclusions Perfmon2 is an exciting development that is about to be included in the Linux kernel as the standard interface to the PMU on modern microprocessors In our opinions it is likely that performance tuning will remain an important activity in the years to come due to problems such as the capping of processor frequency because of power leakage issues or the saturation of cooling capacity in computer centres for the same reason Once perfmon2 has been integrated with all the required hooks tools like pfmon and gpfmon can be used without difficulty to monitor the performance of software applications Thanks to the development in CERN openlab the demands of the complex LHC applications will be fully covered
References [1] DMosberger SEranian ldquoIA-64 Linux Kernel Design and Implementationrdquo Prentice Hall
2002 [2] The perfmon2 home page httpperfmon2sourceforgenet [3] S Eranian ldquoQuick overview of the perfmon2 interfacerdquo
httpwwwgelatounsweduauarchiveslinux-ia64051216211html [4] S Eranian ldquoThe perfmon2 interface specificationrdquo 2005 [5] S Eranian ldquoUpdate on the perfmon2 monitoring interfacerdquo [6] The pfmon tool home page httpperfmon2sourceforgenetpfmon_usersguidehtml [7] CERN openlab webpage httpcernchopenlab [8] R Jurga Practical experience with performance monitors on Xeon and Itanium October 2006 [9] R Jurga ldquoRecent developments in performance monitoringrdquo openlab Quarterly Review
Meeting 31 Jan 2007 [10] The gpfmon home page httpcernchandrzejnowak
International Conference on Computing in High Energy and Nuclear Physics (CHEPrsquo07) IOP PublishingJournal of Physics Conference Series 119 (2008) 042017 doi1010881742-65961194042017
6

Perfmon2 A leap forward in Performance Monitoring
Sverre Jarp Ryszard Jurga Andrzej Nowak
CERN Geneva Switzerland
SverreJarpcernch
Abstract This paper describes the software component perfmon2 that is about to be added to the Linux kernel as the standard interface to the Performance Monitoring Unit (PMU) on common processors including x86 (AMD and Intel) Sun SPARC MIPS IBM Power and Intel Itanium It also describes a set of tools for doing performance monitoring in practice and details how the CERN openlab team has participated in the testing and development of these tools
1 Introduction Justifying performance monitoring There are multiple reasons why performance tuning of an application or a subsystem is still worth the effort even in an era where hardware is seen as ldquocheaprdquo and manpower is considered expensive The first case is when computers are purchased for tens of millions of euros so that even economies of just a few percent can compensate for the salaries of the people doing performance work
A second case which is fairly recent is when computer centres fill up to their power and thermal limits with the consequence that no more servers can be installed If additional capacity is nevertheless needed one may either be forced to exchange some of the equipment with more thermally-efficient hardware (if it exists) or turn to performance tuning in order to squeeze out more performance
A third case is when high-cost personnel wait for computers to complete their calculations Percentage gains in turn-around time can then be translated directly into more efficient manpower
An additional incentive is no doubt personal pride of the software designerprogrammer Ideally one wants performance analysis to be performed throughout the entire development cycle of an application so that the application does not exhibit ldquoinefficientrdquo behaviour or excessive consumption of computing resources
2 The initial Itanium development When the Itanium processor was designed (jointly by HP and Intel) a Performance Monitoring Unit (PMU) was added to the processor architecture as a complete and consistent facility The PMU presented a well-defined interface to the operating system for both the programming and the corresponding data collection For counting events a vast number of counters were added ndash so that for instance every cycle in the execution pipelines could be accounted for or every action in the cache hierarchy could be explained In addition several advanced features such as Branch Trace Buffers were introduced
When Linux was initially ported to the Itanium in the late nineties [1] Steacutephane Eranian from HP Labs took on the task of developing the required software to exploit the PMU in order to monitor the
International Conference on Computing in High Energy and Nuclear Physics (CHEPrsquo07) IOP PublishingJournal of Physics Conference Series 119 (2008) 042017 doi1010881742-65961194042017
ccopy 2008 IOP Publishing Ltd 1
performance of applications or even the kernel itself The tool became an important instrument in the effort to port applications to the Itanium platform
3 A bright idea comes along As a natural extension to the work he had done on the Itanium Steacutephane then decided to extend the Linux kernel support to cover all modern processor families He called the successor product perfmon2 [2] In addition to providing a broad support for hardware variants he negotiated with the Linux kernel maintainers to get the patch added to the main kernel tree In the beginning the maintainers were sceptical primarily because the kernel hooks for perfmon2 sit in very sensitive areas of the kernel such as the dispatcher and the interrupt handler The community did not want any unnecessary overhead to be added to such time-critical kernel areas and it took several kernel releases to introduce the appropriate infrastructure for perfmon2 without upsetting the community At the time of writing it seems that perfmon2 will be entirely added as of kernel version 2624 later this autumn
4 Detailed description of perfmon2pfmon Perfmon2 aims to be a portable interface across all modern processors [3][4] It is designed to give full access to a given PMU and all the corresponding hardware performance counters Typically the PMU hardware implementations use a different number of registers counters with different length and possibly other unique features a complexity that the software has to cope with Although processors have different PMU implementations they usually use configurations registers and data registers Perfmon2 provides a uniform abstract model of these registers and exports readwrite operations accordingly The software supports a wide variety of processor architectures including Intel Itanium Intel P6 P4 P2 Pentium M Core and Core 2 processors the AMD Opteron (Dual and Quad-core) IBM Cell processor and a range of MIPS processors [5]
Figure 1 One tool on all supported platforms
International Conference on Computing in High Energy and Nuclear Physics (CHEPrsquo07) IOP PublishingJournal of Physics Conference Series 119 (2008) 042017 doi1010881742-65961194042017
2
The interface is implemented using system calls in order to support per-thread monitoring
implying a costly context switch by the kernel The interface provides support for system-wide measurements Multiple per-thread perfmon2 contexts can coexist at the same time on a system Multiple system-wide sessions can co-exist as long as they monitor different processors Per-thread mode and system-wide mode cannot exist at the same time For each mode it is possible to collect simple counts or create full sampling measurements in both cases using 64-bit counters in either user or kernel mode Perfmon2 uses the number of events in order to determine the sampling period In sampling mode the interface uses a kernel sampling buffer in order to minimize the overhead since this reduces the communication between user and kernel levels on each sampling counter overflow
Figure 2 What is where regarding pfmon For the cases where the performance units have too few counters or when some events can not be
measured together perfmon2 supports event sets and multiplexing The perfmon2 interface is complemented by the libpfm library as well as with the pfmon tool The
library provides the actual access to the interface for user applications since it contains a set of functions adapted to each processor for readwrite operations to the perfmon2 exported registers The library also provides the API in order to take advantage of more complex PMU features like the Branch Trace Buffer (BTB) and ldquoopcode matchingrdquo on Itanium
Pfmon [6] is a stand-alone command-line tool which takes advantage of perfmon2 and libpfm It was initially designed in order to test the features of the interface and the library but since users found it to be a very helpful tool it accumulated features and matured over the years
Figure 3 Profiling example
International Conference on Computing in High Energy and Nuclear Physics (CHEPrsquo07) IOP PublishingJournal of Physics Conference Series 119 (2008) 042017 doi1010881742-65961194042017
3
Pfmon can do system-wide or per-thread measurements by monitoring across pthread_create fork
and exec function calls Such measurements can be done for a new process or for an existing one by attaching dynamically to the process The measurements can be triggered at a specific code location if desired This can be useful if for instance one wants to skip the initialization phase of a program and only monitor the rest In addition to counting PMU events pfmon supports profiling without requiring a recompilation of the application It can report which addresses from the application contribute to the overall number of cycles instructions cache misses etc With the CERN openlab [7] extensions to pfmon it can map these addresses to symbol names across multiple processes and shared libraries dynamically loaded or linked against the application For C++ and Java symbols pfmon can demangle symbols and produce more user-friendly names In order to avoid pathological patterns in sampling mode pfmon provides the possibility to randomize sampling periods All results can be aggregated across different measurement domains and can be either printed on the screen or saved into a file for further analysis
5 Complexity of CERN benchmarks - Shared library support in perfmon2 The High Energy Physics (HEP) community develops a great deal of in-house software There is a wide spectrum of components involved in the programming process including programming languages such as CC++ Java and even FORTRAN in addition to scripting languages such as python or bash The applications are run on top of multiple hardware configurations and set-ups The global development effort produces software that has a wide variety of functionality and complexity from simple applications to huge simulation frameworks built with hundreds of shared libraries These complex frameworks are based on a multitude of components developed by different teams inside HEP or by the open source community As already mentioned in the introduction there are multiple reasons for wanting to tune the performance of such frameworks
Both pfmon and the underlying perfmon2 offer many features that should be useful in the HEP computing environment in terms of performance monitoring and profiling The portability and scalability across different hardware platforms is of particular value However pfmon was also found to have some limitations especially related to dynamic libraries [8] The HEP applications make extensive use of such libraries and because they spend most of their execution time in these libraries the weaknesses in pfmon become problematic In addition if dynamic libraries are loaded and unloaded in various ways (ie from CC++ program or from python script) in different parts of the application pfmonrsquos raw addresses can be misleading Further problems are caused by the fact that a lot of HEP applications run as a consecutive series of smaller processes which is reported as a series of forkexec events
6 Bugs and other issues dealt with by CERN openlab As already described pfmon does not handle dynamic libraries correctly It reports raw addresses from dynamic libraries instead of function names which makes the analysis difficult almost impossible There is also the issue of multiple processes (created via fork or exec) that causes problems when we want to observe symbols instead of virtual addresses since pfmon initially could perform symbol resolution only from the main executable Given that pfmon nevertheless has a lot of other useful features we have contributed some extensions in order to meet our requirements
We have extended pfmonrsquos functionality [9] allowing it to handle all libraries both those that were linked against applications as well as those that were dynamically loaded during the execution As a result our extended pfmon is able to deal with all symbols from such libraries and report profiling results with function names Thanks to our improvement we are also able to see these symbols across all processes started from the main executable Our extensions are fully portable and run on IA-32 Intel-64 and AMD64 as well as on IA-64 platforms In the process of working on these improvements we also solved a few additional issues related to pfmon Since the HEP applicationsrsquo set-up and resource requirements are very demanding our tests helped us to find and solve memory
International Conference on Computing in High Energy and Nuclear Physics (CHEPrsquo07) IOP PublishingJournal of Physics Conference Series 119 (2008) 042017 doi1010881742-65961194042017
4
leak problems We have also solved a ldquodangling file handlerrdquo issue when we reached more than five thousand open files while running profiling During various tests we have discovered a few bugs in verbose mode where in some cases pfmon tries to print data which is not accessible We have also found an issue with automatic inheritance of debug registers on fork call which is acceptable for the x86 architecture but not for IA-64
7 GPFMON Gpfmon [10] is a graphical front-end to pfmon written in Python and GTK-2 running on Linux systems The concept for this application developed by CERN openlab stems from the need to provide a convenient and user friendly way to launch pfmonperfmon2 monitoring sessions The front-end nearing the beta phase as of this writing not only does this but also brings additional value on top of the original program Most notably it provides an advantage to less advanced users as well as advanced users requiring visualization capabilities
Apart from the fact that gpfmon relieves users from writing 250-character long command lines the tool provides some aid in event selection by visualizing available PMU events their descriptions dependencies and counters independently of the architecture The event selection process is assisted according to the amount and availability of counters in the PMU Moreover scenarios consisting of event ratios may be selected such as cycles per instructions or the percentage of missed branch predictions Gpfmon automatically selects events needed to produce the selected ratios in order to eventually produce either a single figure or time-dependent data In effect it is easy to gain a more complex insight into the monitored program and see how some ratios change over time In addition gpfmon supports remote monitoring sessions via plain SSH without the need to install any additional software In this scenario the client (gpfmon) uses the SSH protocol to connect to a remote machine running perfmon2 and pfmon and shows the results locally on the users computer This solution not only lifts the burden of supporting the GUI from the monitored machine but also enables monitoring in GUI mode on less robust network links which might not be able to support the GUI displayed via X-forwarding or VNC Gpfmon also generates several types of plots for flat profile and sampling data enabling users to see the characteristics of their applications at a glance
Figure 4 A gpfmon session and a produced graph The tool will continue to evolve towards a robust user interface adding even further value to
pfmon and including such features as advanced scenario support results and profile management and enhanced plot generation A fully stable 10 version of the program is expected in the fourth quarter of 2007
International Conference on Computing in High Energy and Nuclear Physics (CHEPrsquo07) IOP PublishingJournal of Physics Conference Series 119 (2008) 042017 doi1010881742-65961194042017
5
8 Conclusions Perfmon2 is an exciting development that is about to be included in the Linux kernel as the standard interface to the PMU on modern microprocessors In our opinions it is likely that performance tuning will remain an important activity in the years to come due to problems such as the capping of processor frequency because of power leakage issues or the saturation of cooling capacity in computer centres for the same reason Once perfmon2 has been integrated with all the required hooks tools like pfmon and gpfmon can be used without difficulty to monitor the performance of software applications Thanks to the development in CERN openlab the demands of the complex LHC applications will be fully covered
References [1] DMosberger SEranian ldquoIA-64 Linux Kernel Design and Implementationrdquo Prentice Hall
2002 [2] The perfmon2 home page httpperfmon2sourceforgenet [3] S Eranian ldquoQuick overview of the perfmon2 interfacerdquo
httpwwwgelatounsweduauarchiveslinux-ia64051216211html [4] S Eranian ldquoThe perfmon2 interface specificationrdquo 2005 [5] S Eranian ldquoUpdate on the perfmon2 monitoring interfacerdquo [6] The pfmon tool home page httpperfmon2sourceforgenetpfmon_usersguidehtml [7] CERN openlab webpage httpcernchopenlab [8] R Jurga Practical experience with performance monitors on Xeon and Itanium October 2006 [9] R Jurga ldquoRecent developments in performance monitoringrdquo openlab Quarterly Review
Meeting 31 Jan 2007 [10] The gpfmon home page httpcernchandrzejnowak
International Conference on Computing in High Energy and Nuclear Physics (CHEPrsquo07) IOP PublishingJournal of Physics Conference Series 119 (2008) 042017 doi1010881742-65961194042017
6
Related Documents