RESEARCH ARTICLE Open Access Perceptual organization of auditory streaming-task relies on neural entrainment of the stimulus-presentation rate: MEG evidence Ivan Chakalov 1,2† , Rossitza Draganova 2† , Andreas Wollbrink 1 , Hubert Preissl 2 and Christo Pantev 1* Abstract Background: Humans are able to extract regularities from complex auditory scenes in order to form perceptually meaningful elements. It has been shown previously that this process depends critically on both the temporal integration of the sensory input over time and the degree of frequency separation between concurrent sound sources. Our goal was to examine the relationship between these two aspects by means of magnetoencephalography (MEG). To achieve this aim, we combined time-frequency analysis on a sensor space level with source analysis. Our paradigm consisted of asymmetric ABA-tone triplets wherein the B-tones were presented temporally closer to the first A-tones, providing different tempi within the same sequence. Participants attended to the slowest B-rhythm whilst the frequency separation between tones was manipulated (0-, 2-, 4- and 10-semitones). Results: The results revealed that the asymmetric ABA-triplets spontaneously elicited periodic-sustained responses corresponding to the temporal distribution of the A-B and B-A tone intervals in all conditions. Moreover, when attending to the B-tones, the neural representations of the A- and B-streams were both detectable in the scenarios which allow perceptual streaming (2-, 4- and 10-semitones). Alongside this, the steady-state responses tuned to the presentation of the B-tones enhanced significantly with increase of the frequency separation between tones. However, the strength of the B-tones related steady-state responses dominated the strength of the A-tones responses in the 10-semitones condition. Conversely, the representation of the A-tones dominated the B-tones in the cases of 2- and 4-semitones conditions, in which a greater effort was required for completing the task. Additionally, the P1 evoked fields’ component following the B-tones increased in magnitude with the increase of inter-tonal frequency difference. Conclusions: The enhancement of the evoked fields in the source space, along with the B-tones related activity of the time-frequency results, likely reflect the selective enhancement of the attended B-stream. The results also suggested a dissimilar efficiency of the temporal integration of separate streams depending on the degree of frequency separation between the sounds. Overall, the present findings suggest that the neural effects of auditory streaming could be directly captured in the time-frequency spectrum at the sensor-space level. Keywords: MEG, Time-frequency spectrum, Auditory scene analysis, Task-driven entrainment * Correspondence: [email protected] † Equal contributors 1 Institute for Biomagnetism and Biosignalanalysis, University of Münster, Malmedyweg 15, 48149 Münster, Germany Full list of author information is available at the end of the article © 2013 Chakalov et al.; licensee BioMed Central Ltd. This is an open access article distributed under the terms of the Creative Commons Attribution License (http://creativecommons.org/licenses/by/2.0), which permits unrestricted use, distribution, and reproduction in any medium, provided the original work is properly cited. Chakalov et al. BMC Neuroscience 2013, 14:120 http://www.biomedcentral.com/1471-2202/14/120

Welcome message from author
This document is posted to help you gain knowledge. Please leave a comment to let me know what you think about it! Share it to your friends and learn new things together.
Transcript
RESEARCH ARTICLE Open Access
Perceptual organization of auditory streaming-taskrelies on neural entrainment of thestimulus-presentation rate: MEG evidenceIvan Chakalov1,2†, Rossitza Draganova2†, Andreas Wollbrink1, Hubert Preissl2 and Christo Pantev1*
Abstract
Background: Humans are able to extract regularities from complex auditory scenes in order to form perceptuallymeaningful elements. It has been shown previously that this process depends critically on both the temporalintegration of the sensory input over time and the degree of frequency separation between concurrent soundsources. Our goal was to examine the relationship between these two aspects by means ofmagnetoencephalography (MEG). To achieve this aim, we combined time-frequency analysis on a sensor spacelevel with source analysis. Our paradigm consisted of asymmetric ABA-tone triplets wherein the B-tones werepresented temporally closer to the first A-tones, providing different tempi within the same sequence. Participantsattended to the slowest B-rhythm whilst the frequency separation between tones was manipulated (0-, 2-, 4- and10-semitones).
Results: The results revealed that the asymmetric ABA-triplets spontaneously elicited periodic-sustained responsescorresponding to the temporal distribution of the A-B and B-A tone intervals in all conditions. Moreover, whenattending to the B-tones, the neural representations of the A- and B-streams were both detectable in the scenarioswhich allow perceptual streaming (2-, 4- and 10-semitones). Alongside this, the steady-state responses tuned to thepresentation of the B-tones enhanced significantly with increase of the frequency separation between tones.However, the strength of the B-tones related steady-state responses dominated the strength of the A-tonesresponses in the 10-semitones condition. Conversely, the representation of the A-tones dominated the B-tones inthe cases of 2- and 4-semitones conditions, in which a greater effort was required for completing the task.Additionally, the P1 evoked fields’ component following the B-tones increased in magnitude with the increase ofinter-tonal frequency difference.
Conclusions: The enhancement of the evoked fields in the source space, along with the B-tones related activity ofthe time-frequency results, likely reflect the selective enhancement of the attended B-stream. The results alsosuggested a dissimilar efficiency of the temporal integration of separate streams depending on the degree offrequency separation between the sounds. Overall, the present findings suggest that the neural effects of auditorystreaming could be directly captured in the time-frequency spectrum at the sensor-space level.
Keywords: MEG, Time-frequency spectrum, Auditory scene analysis, Task-driven entrainment
* Correspondence: [email protected]†Equal contributors1Institute for Biomagnetism and Biosignalanalysis, University of Münster,Malmedyweg 15, 48149 Münster, GermanyFull list of author information is available at the end of the article
© 2013 Chakalov et al.; licensee BioMed Central Ltd. This is an open access article distributed under the terms of the CreativeCommons Attribution License (http://creativecommons.org/licenses/by/2.0), which permits unrestricted use, distribution, andreproduction in any medium, provided the original work is properly cited.
Chakalov et al. BMC Neuroscience 2013, 14:120http://www.biomedcentral.com/1471-2202/14/120
BackgroundHumans are able to organize perceptually meaningful ele-ments from the mixture of competing sounds in the envir-onment. Albert Bregman has described this phenomenonin the well-known framework of Auditory Scene Analysis[1]. The vast majority of researchers interpret the strea-ming effect in terms of tonotopic organization of theauditory system [2-17]. According to this interpretation,frequency-distant sounds are processed into distinctneural populations and therefore heard as separatestreams, and frequency adjacent sounds are processed inneighboring neural channels leading to their perceptualintegration into one unified auditory object. However, ithas recently been shown that streams compiled fromfrequency-remote tones can no longer be heard as distinctsound streams if the tones are presented synchronouslyrather than successively, despite the enhanced neuralactivity [18,19]. Therefore, the tonotopic organizationper se does not explain completely the perception ofstreaming [18,19]. The formation of different auditorystreams requires temporal integration of sound inputover time [20,21].On the other hand, numerous studies have evaluated
the use of the event-related oscillations to indicate theprocess of sensory integration in the brain [22-32]. Lins &Picton, for instance, found that multiple auditory stimulievoke steady-state activity following their repetition rate[23]. More recent research showed that selective attentioncould modulate the steady-state responses within the audi-tory system [33,34] and between different sensory modal-ities (e.g. between visual and auditory [35,36]). In addition,an electroencephalographic study by Nozaradan and col-leagues demonstrated that musical beat could elicit asteady-state response tuned to the beat frequency and, fur-thermore, that binary and ternary metric interpretation ofthis beat evoked frequencies tuned to the correspondingimagery meter [37].With regard to auditory stream segregation, it has been
demonstrated that attending to a certain rhythm enhancesthe magnitude of the steady-state response correspondingto its presentation rate [20]. Nevertheless, these authorsinvestigated the neural representation of two recurringsound sequences separated by a relatively large inter-tonalfrequency difference [20] paradigm which primarily pro-duces two auditory streams. An intriguing question, there-fore, is how different degrees of inter-tonal frequencyseparation between the sounds, and respectively differentperceptual states, affect the spectral distribution of oneand the same polyrhythmic structure.The present study used magnetoencephalography (MEG)
to address this question. Experimental block of threesubsequent parts was carried out in which the rhythmicelements were kept constant but the frequency separ-ation between the sounds was systematically manipulated.
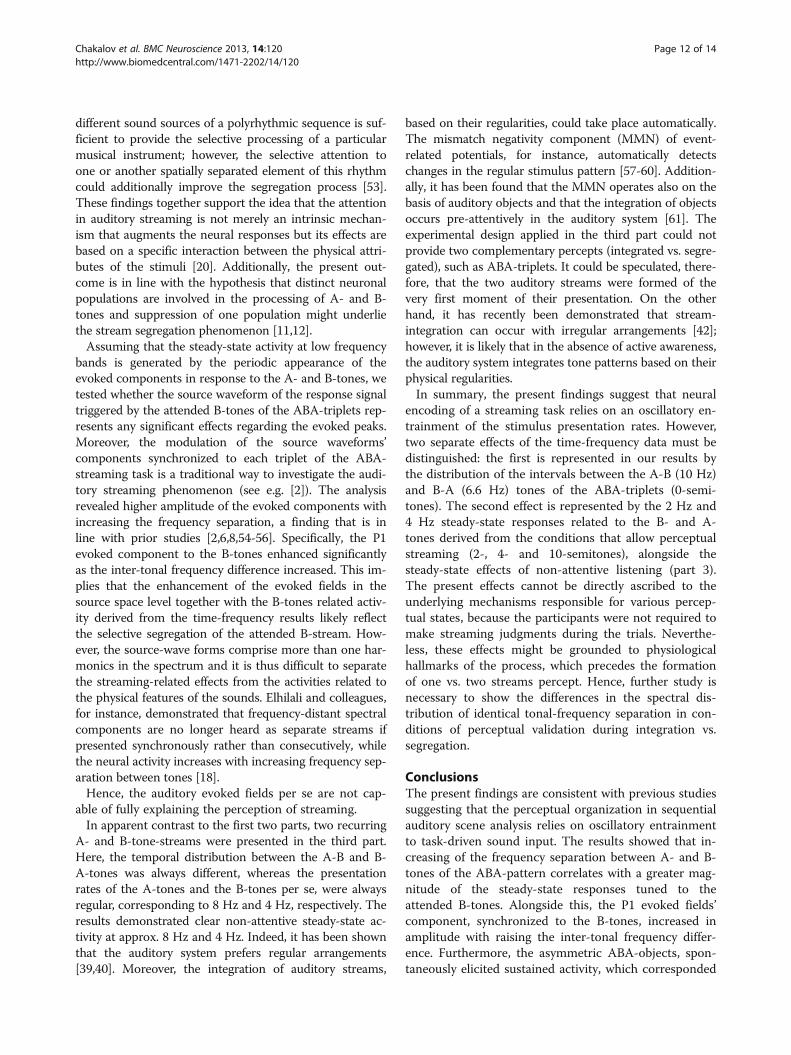
Specifically, in the first two parts a variation of the stan-dard ABA-triplet paradigm was used [38], wherein theB-tones were set temporally closer to the first A-tonesthan to the second A-tones, forming dissimilar rhythmswithin the same sequence. In the first part, two extremefrequency separations between A- and B-tones, whichare respectively known to form the perception of onestream vs. two streams [38], were contrasted (0- vs. 10-semitones). In the second part, small (2-semitones) vs.intermediate (4-semitones) frequency separations wereopposed, ensuring bi-stable perception [38]. In order tokeep sustained attention during all these conditions, theparticipants were asked to follow the presentation of theB-tones and indicate the switching of their perceptionfrom the ABA-rhythm to two separate A- and B-tonestreams by pressing a button. A combination of time-frequency analysis on a sensor space level and source ana-lysis were used to analyze the results. We anticipated thatin the first part our analysis would capture activity cor-responding to the temporal distribution of the A-B andB-A-tone intervals of the ABA-triplets in the single-stream condition (0-semitones). In the streaming con-dition (10-semitones) presentation frequencies of clearB-tones and A-tones were expected. In the second part (2-and 4-semitones) all presentation rates were expected inthe spectrum (responses, relevant to presentation rates ofboth B- and A-tones and to the asymmetric ABA-triplets).Therefore, the present design provides a complementarymodel for investigation of stream integration versusstream segregation by varying the inter-tonal frequencyseparation between the A- and B-tones in a classicalstreaming task. Accordingly, based on the different pres-entation rates we could access different perceptual states(integrated versus segregated) by capturing the corre-sponding frequencies to these different rates in the time-frequency spectrum. Additionally, for the first two parts,source waveforms synchronized to the B-tones of theABA-structure were extracted, in order to be associatedwith the time-frequency data.The third part consisted of a sequence compiled from
two independent, simultaneously presented A- and B-tonestreams (not as ABA-triplet). In this part the participantswere not required to follow any of the rhythms. TheA- and B-tones of the two presented sequences appearedalways at different temporal relation to each other. Con-versely, the temporal distributions between the A- and theB-tones per se were always regular. The auditory systemprefers to organize separate streams based on regular-ities such as pitch [2] and regular temporal arrangement[39,40]. On the other hand, it has recently been demon-strated that streaming can occur without any difference inthe fundamental frequency [41] and an integrated perceptcan occur with irregular arrangements [42]. Therefore, ifthe auditory system is capable of integrating simultaneously
Chakalov et al. BMC Neuroscience 2013, 14:120 Page 2 of 14http://www.biomedcentral.com/1471-2202/14/120
the A- and B-tones into separate streams, based on theirregular presentation rates and identical tone-frequencies,then two steady-state responses related to their frequencydistribution would be captured in the spectrum.
MethodsParticipantsFourteenth right-handed participants (5 males), aged be-tween 22 and 30 years, participated in this study. Noneof them had a history of otological or neurological disor-ders. A normal audiological status was verified by pure-tone audiometry in terms of air conduction hearingthresholds less than 10 dB. Pure-tone thresholds weremeasured for octave frequency from 250 to 4000 Hz. Allparticipants gave a written, informed consent in accord-ance with the Declaration of Helsinki. The study proto-col was approved by the Ethics Commission of theUniversity of Münster, Germany (WWU-Muenster).
Experimental proceduresThe experiments were organized as experimental block ofthree following parts. 5 min. silent gaps divided the parts.Non-regular ABA-triplet sequences were used in the firsttwo parts. The stimuli were sinusoidal tone-pips of 25 msduration, including 10 ms rise and decay times. The loud-ness of the stimuli was set to 60 dB above the individualhearing thresholds. The duration of each trial was 5 s. Theinter trial interval (ITI) was set to 3 s and the total record-ing time of one experimental part was 10.6 minutes.In the first part, the single auditory-stream (object) con-
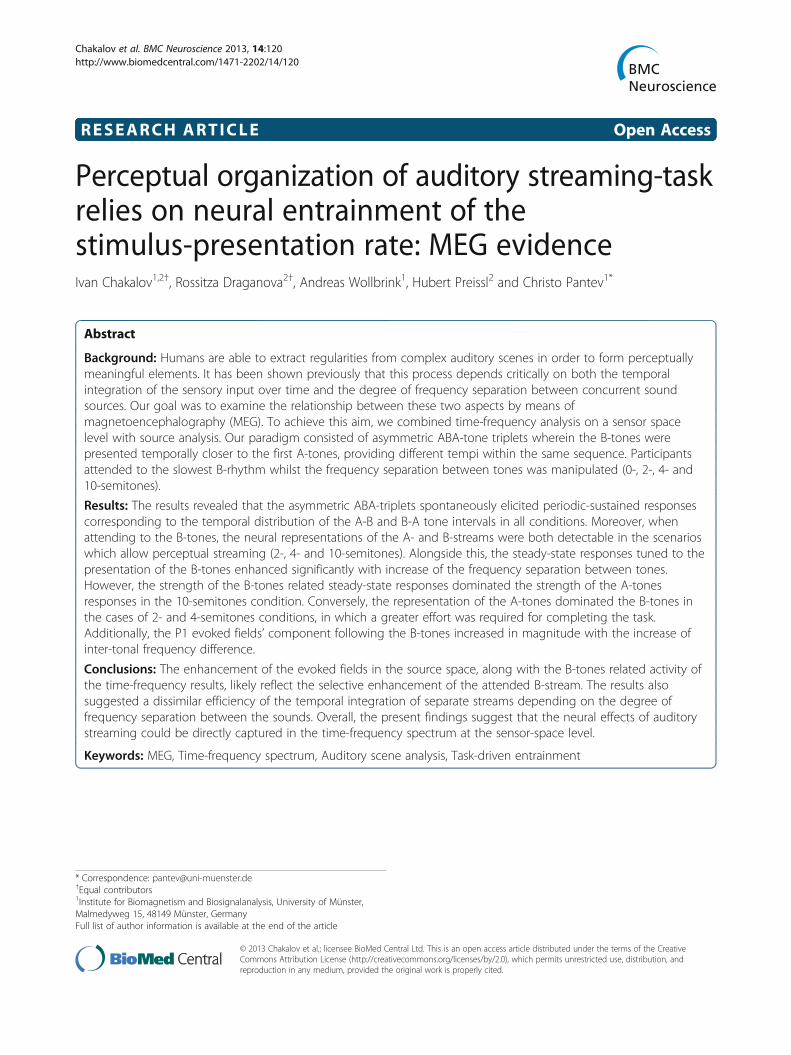
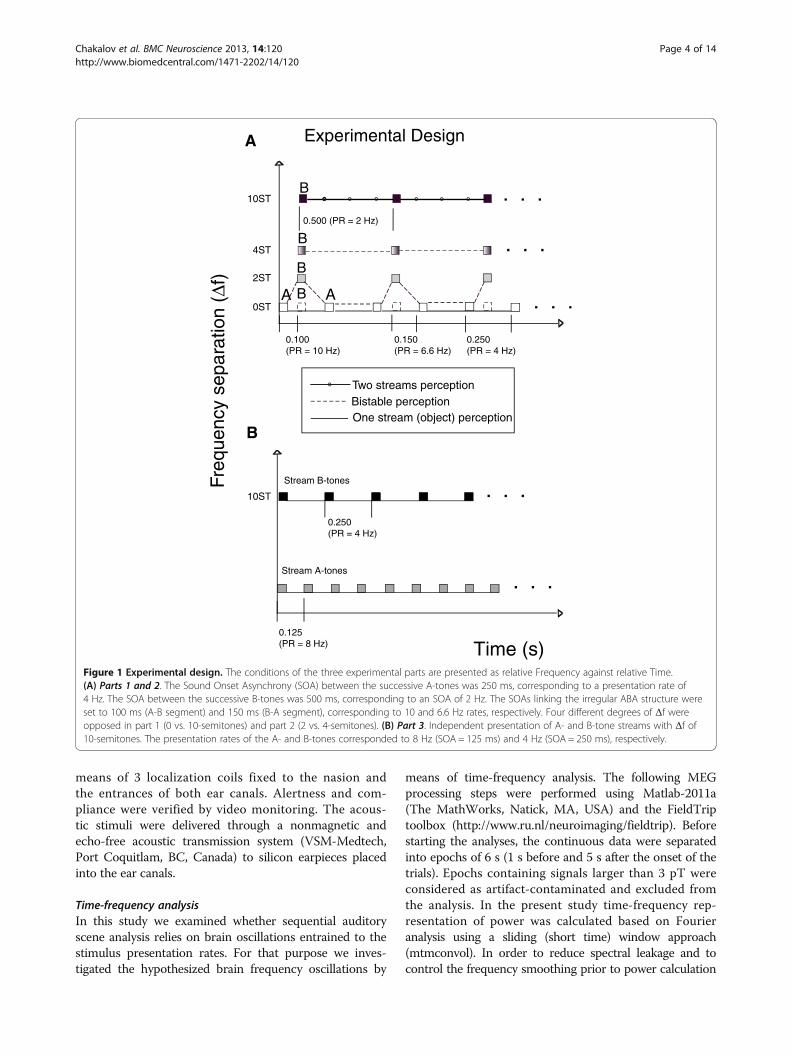
dition was compared with the streaming-condition (0 vs.10-semitones Δf [frequency difference]), with the exactordering of these conditions randomized. The second partcompared small (2-semitones) versus intermediate (4-semitones) Δf, in the same way. In all conditions, the fre-quency of tone A was 500 Hz, but the B-tones were500 Hz (single-object condition), 561 Hz (small Δf ),630 Hz (intermediate Δf) and 891 Hz for the streamingcondition, Figure 1A. In the first two parts, the SoundOnset Asynchrony (SOA) between the successive A-toneswas always 250 ms, which corresponds to a presentationrate of 4 Hz. The SOA between the successive B-toneswas 500 ms, which corresponds to 2 Hz presentation rate.The SOA linking the first A-tone and the next B-tone ofthe asymmetric ABA-structure was 100 ms, thus the SOAbetween the B-tone and the second A-tone was 150 ms,which corresponds to presentation rates of 10 Hz and6.6 Hz, respectively. The SOA between the ABA- tripletswas also set to 250 ms (4 Hz), Figure 1A. In each experi-mental part, 80 trials were presented: 40 trials of each con-dition. The presentation order of the first and secondparts was counterbalanced across subjects.The asymmetric ABA-triplet paradigm used in this
study allows two competing perceptual states (integrated
vs. segregated). In order to provide an objective estimateof stream integration versus stream segregation we ma-nipulate the Δf between the A- and B-tones whilst keepingsustained attention. Therefore, before the main experi-ment, the participants were exercised with 10 trials ofeach condition that allows perceptual streaming (2-,4- and 10-semitones) from parts 1 and 2 in order tosegregate the asymmetric ABA- structure into separateA- and B-streams at the very first moment and to keepthe perception as stable as possible. Accordingly, the par-ticipants were instructed to focus on the B-tones sequence(in all conditions) and to indicate if their perceptionswitched from the repeated ABA-objects to two segre-gated B- and A-tone streams by pressing a mouse buttonafter the presentation of each trial. However, we were notinterested in the overall level of performance of this taskbut in maintaining sustained attention. Moreover, 10 ofthe present 14 participants took part in our previousresearch in which all of them were able to hear twostreams in case of 2-, 4- and 10-semitones conditions [43].The 0-semitones condition is assumed to be always heardas one object.In the third part, two sequences of independent A- and
B-sound-streams (instead of the triplet structure) werepresented simultaneously for 5 seconds with an ITI of3 seconds (80 trials for 15 minutes). The presentation rateof the A-tones, therefore, corresponded to 8 Hz (SOA=125 ms) and the B-tones to 4 Hz (SOA = 250 ms). The fre-quency separation was set each time to 10-semitones (toneA = 500 Hz;-tone B = 891 Hz), Figure 1B. The subjectswere not supposed to pay attention to the stimuli and, in-stead, watched a silent movie of their choice. However, be-fore the main experiment all of the participants hadreported that they can hear two streams in that condition.In additional five-minute part, the spontaneous brain ac-tivity was recorded in order to distinguish between thespectral power that corresponds to the expected target fre-quencies in the third part and the resting brain-state [44].During the resting state recordings the same experimentaldesign as in part 3 was presented to the participants, how-ever, without audio output to the MEG-room. In that waythe same conditions’ triggers were available for furtherepochnig.
MEG data acquisitionThe MEG recording was performed using a 275-channelwhole-head system (Omega2005, VSM-Medtech, PortCoquitlam, BC, Canada), sampled at 600 Hz. The partici-pants were seated comfortably in an upright position. Thesensors were configured as first-order gradiometers with abaseline of 50 mm. In addition to the MEG, the electrooc-ulogram (EOG) was recorded for subsequent artifact re-jection. The participants’ head positions were determinedat the beginning and at the end of each recording block by
Chakalov et al. BMC Neuroscience 2013, 14:120 Page 3 of 14http://www.biomedcentral.com/1471-2202/14/120
means of 3 localization coils fixed to the nasion andthe entrances of both ear canals. Alertness and com-pliance were verified by video monitoring. The acous-tic stimuli were delivered through a nonmagnetic andecho-free acoustic transmission system (VSM-Medtech,Port Coquitlam, BC, Canada) to silicon earpieces placedinto the ear canals.
Time-frequency analysisIn this study we examined whether sequential auditoryscene analysis relies on brain oscillations entrained to thestimulus presentation rates. For that purpose we inves-tigated the hypothesized brain frequency oscillations by
means of time-frequency analysis. The following MEGprocessing steps were performed using Matlab-2011a(The MathWorks, Natick, MA, USA) and the FieldTriptoolbox (http://www.ru.nl/neuroimaging/fieldtrip). Beforestarting the analyses, the continuous data were separatedinto epochs of 6 s (1 s before and 5 s after the onset of thetrials). Epochs containing signals larger than 3 pT wereconsidered as artifact-contaminated and excluded fromthe analysis. In the present study time-frequency rep-resentation of power was calculated based on Fourieranalysis using a sliding (short time) window approach(mtmconvol). In order to reduce spectral leakage and tocontrol the frequency smoothing prior to power calculation
Experimental Design
Stream A-tones
Stream B-tonesFreq
uenc
y se
para
tion
(Δf)
Time (s)
. . . AA
B
B
B
B
2ST
0ST
4ST
10ST
10ST
One stream (object) perception
Two streams perceptionBistable perception
0.150(PR = 6.6 Hz)
0.250(PR = 4 Hz)
0.100(PR = 10 Hz)
0.500 (PR = 2 Hz)
0.125(PR = 8 Hz)
0.250 (PR = 4 Hz)
A
B
oo o o
o
o o o
. . .
. . .
. . .
. . .
Figure 1 Experimental design. The conditions of the three experimental parts are presented as relative Frequency against relative Time.(A) Parts 1 and 2. The Sound Onset Asynchrony (SOA) between the successive A-tones was 250 ms, corresponding to a presentation rate of4 Hz. The SOA between the successive B-tones was 500 ms, corresponding to an SOA of 2 Hz. The SOAs linking the irregular ABA structure wereset to 100 ms (A-B segment) and 150 ms (B-A segment), corresponding to 10 and 6.6 Hz rates, respectively. Four different degrees of Δf wereopposed in part 1 (0 vs. 10-semitones) and part 2 (2 vs. 4-semitones). (B) Part 3. Independent presentation of A- and B-tone streams with Δf of10-semitones. The presentation rates of the A- and B-tones corresponded to 8 Hz (SOA = 125 ms) and 4 Hz (SOA = 250 ms), respectively.
Chakalov et al. BMC Neuroscience 2013, 14:120 Page 4 of 14http://www.biomedcentral.com/1471-2202/14/120
the data were multiplied with a single taper (HanningWindow). The length of the sliding window was set to afixed number of periods resulting in shorter time win-dows with increasing frequency. To compensate the ex-pense of frequency smoothing for higher frequencieswhilst keeping a constant time window (from −1 to 5 s)we chose to independently analyze the data for two sep-arate frequency ranges: one from 1 to 6 Hz and anotherone from 6 to 14 Hz. Frequency-dependent time win-dow of 2 cycles was used to calculate the activity of thefirst range (from 1 to 6 Hz) and frequency-dependenttime window of 13 cycles to calculate the second range(from 6 to 14 Hz). For each range the time-frequencypower representation was calculated using a frequency
resolution of 0.67 Hz and a temporal resolution of50 ms.The topographic maps were also analyzed across the
conditions depicting the averaged time course of eachstimulus condition and each frequency range (seeAdditional file 1A), although the goal of the presentstudy was not to focus on concrete brain structures.Based on the prior assumption of different hemisphericspecialization in streaming [43] and the obtained dissimi-lar distribution of the grand averaged topography maps,the magnitudes of the proposed frequency ranges wereanalyzed separately for the left and right hemisphericchannels (cf. Figure 2). The external frontal channels(above the supra-orbital ridges) and the EOG-channels
A
B
2
4
6
6
10
14
0 54321 0 54321 0 54321 0 54321
0 54321 0 54321 0 54321 0 54321
0 54321 0 54321 0 54321 0 54321
Left Hemisphere Right Hemisphere
Time (s)
2ST (small) 4ST (intermediate) 2ST (small) 4ST (intermediate)
1.85
12.9
0.08
7.21
0.1
7
0.46
3.94
-0.4
11.2
0
5
Fre
quen
cy (
Hz)
0ST (one object)10ST (two streams) 0ST (one object)10ST (two streams)
Stream A-tones
Stream B-tones
Stream A-tones
Stream B-tones
Resting state Resting state
2
4
6
6
10
14
2
4
6
6
10
14
2
4
6
6
10
14
2
4
6
6
10
14
2
4
6
6
10
14
C
Resting state Resting state
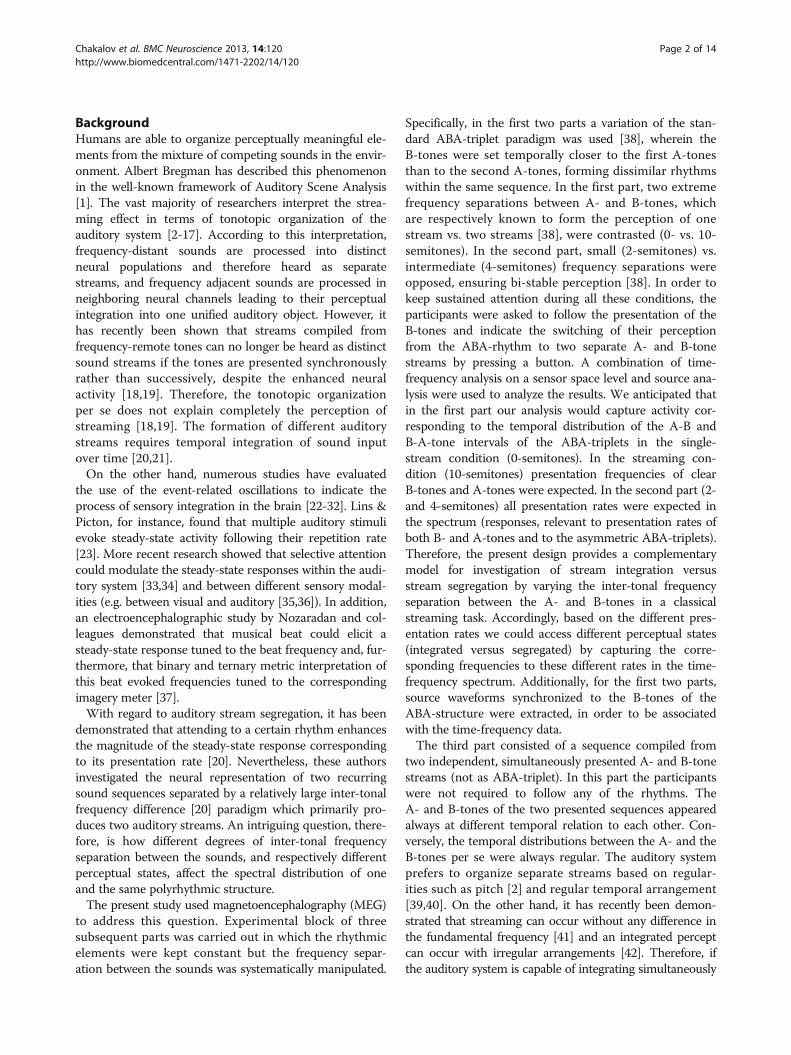
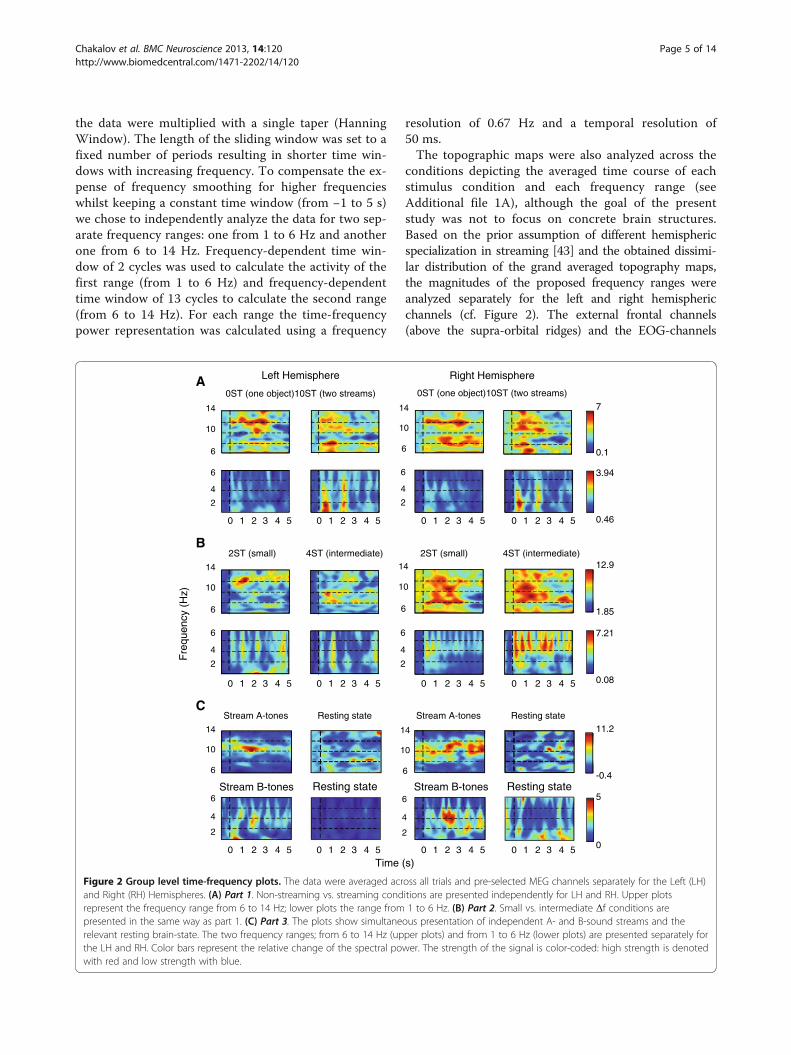
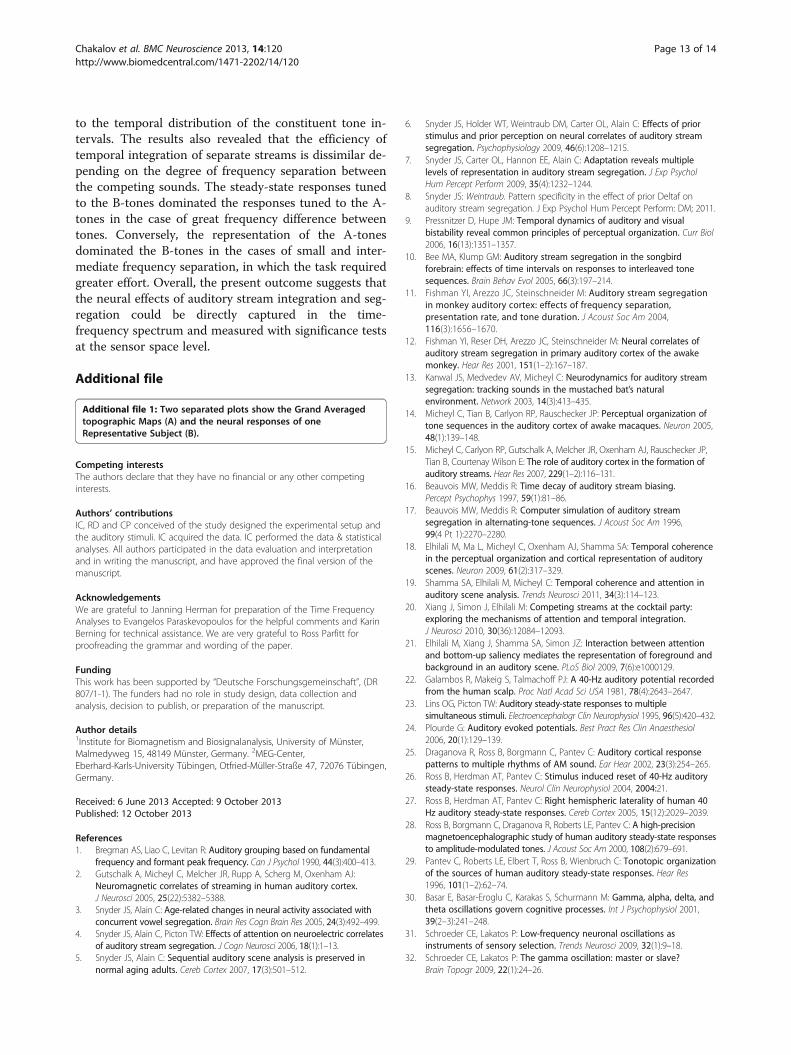
Figure 2 Group level time-frequency plots. The data were averaged across all trials and pre-selected MEG channels separately for the Left (LH)and Right (RH) Hemispheres. (A) Part 1. Non-streaming vs. streaming conditions are presented independently for LH and RH. Upper plotsrepresent the frequency range from 6 to 14 Hz; lower plots the range from 1 to 6 Hz. (B) Part 2. Small vs. intermediate Δf conditions arepresented in the same way as part 1. (C) Part 3. The plots show simultaneous presentation of independent A- and B-sound streams and therelevant resting brain-state. The two frequency ranges; from 6 to 14 Hz (upper plots) and from 1 to 6 Hz (lower plots) are presented separately forthe LH and RH. Color bars represent the relative change of the spectral power. The strength of the signal is color-coded: high strength is denotedwith red and low strength with blue.
Chakalov et al. BMC Neuroscience 2013, 14:120 Page 5 of 14http://www.biomedcentral.com/1471-2202/14/120
were excluded from further analyses in order to addition-ally diminish the effects of eye blinks and frontal muscle ac-tivities. The most occipital channels were less active relatedto the other channels and therefore excluded from furtheranalyses. At the end, 70 channels of each hemisphere wereanalyzed. The large number of channels used minimizedthe side effects of possible individual channel deviation. Itshould be noted here, that in order to avoid canceling theactivities locked to stimulus rate in case of phase difference,the time-frequency representations were calculated forevery trial of each individual (40 trials per condition) beforeaveraging the data across the different conditions and par-ticipants. Therefore, we expected to capture the activity ofapproximately 2 Hz (B-tones presentation rate) and 4 Hz(A-tones presentation rate) that corresponds to streamingin the cases of the 10-, 4- and 2-semitones conditions(parts 1 and 2) into the first frequency range. In contrast,the activity reflecting the processing of A-B (10 Hz) and B-A (6.6 Hz) time intervals of the unified ABA objects wasexpected into the second frequency range. The same fre-quency ranges were analyzed for the third part and theresting state measurements, in order to capture the steady-state activity corresponding to the independent pre-sentation rates of A- and B-tone streams and the relevantspontaneous activity at 8 Hz and 4 Hz. The time-frequencyanalyzed epochs were then averaged for each condition (40epochs per condition in part 1 and part 2 and 80 epochs inpart 3) across the channels. This was done independentlyfor the left and right hemispheric channels. In order to ex-tract unrelated outstanding noise, such as spontaneousbrain activity, baseline-normalization was applied in termsof Relative Change of Spectral Power (RCSP). The RCSPexpresses, for each frequency, the relative increase or de-crease of the raw power values with respect to the powerin the baseline interval. Thus, if Pa is the spectral power ofthe post-trigger time-period (from 0 to 5 s) and Pb is thespectral power of the pre-trigger period (from −1 to 0 s)the RSCP value is calculated as:
RCSP ¼ Pa−Pbð Þ=Pb:
In addition, the analyzed mean epochs of each condi-tion were averaged across all the participants with theintention of presenting the group-averaged effects. Thisprocedure provided the grand average RCSP values, sep-arately for the two frequency ranges (from 1 to 6 Hz andfrom 6 to 14 Hz), in the time window from −1 to 5 s, foreach condition and hemisphere. It has been shown thatthe formation of different auditory streams needs a vari-able amount of time to build-up [16] therefore averagingacross the participants could lead to cancelation of someeffects based on the dissimilar individual percept overtime. Thus, time-frequency responses of one participantwere additionally analyzed (Additional file 1B).
Before entering statistical analysis, the mean RCSPvalues in the time window from 0 to 5 s post-triggerperiod were collected for each participant, condition andhemisphere in the following way: (1) for parts 1 and 2, theactivity was extracted and averaged between 1.5 and2.5 Hz and between 3.5 and 4.5 Hz, looking for the 2 HzB-tones and the 4 Hz A-tones related steady-state evokedactivity; (2) the activity was also averaged between 5.5 and8 Hz and between 9 and 11.5 Hz, to identify frequenciesof approximately 6.6 Hz and 10 Hz corresponding to thedistribution of the tone intervals in the asymmetric ABA-triplets; (3) for part 3, the frequency bands between 3.5and 4.5 Hz and between 7 and 9.5 Hz were used, with theexpectation of finding 4 Hz B-tones and 8 Hz A-tones re-lated steady-state evoked activity. The mean RCSP valuesof the resting state measurements between 3.5 and 4.5 Hzand between 7 and 9.5 Hz were also averaged from theadditional resting-state part, in order to compare themwith the relevant activity derived from part 3. The calcu-lated mean values of the baseline corrected spectral powerfor each target frequency were then entered into statisticalanalysis.To investigate whether the activity related to the distri-
bution of the ABA-structure depends on the activity re-lated to separate perception of A- and B-tone-streams(parts 1 and 2), the mean spectral power values of the dif-ferent target frequencies across the different conditionswere entered into 4 × 4 repeated-measure ANOVA usingwithin-subject factors Target Frequency (10, 6.6, 4 and2 Hz) and Condition (0, 2, 4 and 10-semitones). There-after, the mean spectral power of each target frequencyfrom part 1 and part 2 were separately entered into a 2 × 4repeated-measures ANOVAs, using within-subject factorsHemisphere (left, right) and Conditions (0-, 2-, 4- and 10-semitones). Thus, we were also able to explore how thespectral power of identical target frequencies changesacross conditions, as well as their effects between thehemispheres.Additionally, the mean values of the baseline corrected
spectral power from part 3 were compared with the rele-vant mean values of spontaneous activity derived fromthe resting state-part (approx. 8 Hz and 4 Hz). There-fore, a separate 2 × 4 model ANOVA was applied hereusing within-subject factors Hemisphere (left, right) andActivity (spontaneous activity at approx. 8 Hz and 4 Hzand evoked activity at approx. 8 Hz and 4 Hz).When significant, post hoc pairwise comparisons were
performed using paired-samples t-tests. The alpha levelwas set at 0.05 and Bonferroni correction was applied inall analyses.
Analysis of source waveform dataThe analysis was performed using the BESA softwarepackage (BESA GmbH, Version 5.7.3) and Matlab-2011a
Chakalov et al. BMC Neuroscience 2013, 14:120 Page 6 of 14http://www.biomedcentral.com/1471-2202/14/120
(The MathWorks, Natick, MA, USA), waveform-toolbox.Before starting the preprocessing procedure, the data werehigh pass-filtered with the lowest frequency limit of 1 Hz.The data were separated into epochs corresponding to theB-tones of the ABA-triplets, starting 50 ms before andending 400 ms after the B-tone onset. Epochs containingsignals larger than 3 pT were considered as artifacts andexcluded from further analysis. Before averaging, the re-sponse signals were low pass filtered at 30 Hz. Each dif-ferent condition was then averaged, in order to achievethe best signal-to-noise ratio. These procedures wereperformed only for the first two parts. The data of part 3could not be epoched because no baseline could be de-rived as a result of the independent presentation of A- andB-tone streams.The signal space projection technique [45] was used for
the analysis of the MEG data. The interval used for theECD fit (~30 ms) was placed around the local maximumof the N1 component of the AEF. The N1 dipolar sourcesevoked by B-tones of the ABA-triplets were less variableacross conditions compared to the P1, P2 or N2 sourcesand, thus, provided a better signal-to-noise ratio. Each N1dipole parameter was represented by the average of alldata points (30 ms interval) around the maximum of theGlobal Field Power of the magnetic field calculated acrossthe respective subsets of channels. Thereafter, the sourcespace projection method was applied to calculate the com-ponents of the transient evoked response (P1, N1, P2 andetc.) [45]. For each participant and condition, two ECDs(one in each hemisphere) were determined by their dipolemoment, orientation and spatial coordinates (a goodnessof fit larger than 90% was imposed), a technique justifiedby other authors (e.g. see [29,46-48]).A time window of 30 ms was placed around the individ-
ual peaks of P1 and N1 of the calculated AEFs in order tocollect their amplitudes and latencies for further statisticalanalysis. Two participants in which the expected N1-responses could not be fitted into two dipoles were ex-cluded from further analysis hence the responses of elevenparticipants were entered into statistics. The averaged am-plitudes and latencies of P1 and N1 components at the30 ms interval were then entered into repeated measuresANOVA with the within-subject factors Hemisphere (Left,Right) and Conditions (0-, 2-, 4- and 10-semitones). Whensignificant, post hoc pairwise comparisons were performedusing paired-samples t-tests. Bonferroni correction wasapplied for all analyses.
ResultsTime-frequency dataInteractions between the spectral distribution of theABA-structure and A- and B-streamsThe polyrhythmic structure used in the present studyconsisted only of two tones (A and B) organized as an
asymmetric ABA-triplet. These two tones could formdifferent rhythms, depending on the listener’s currentperceptual state [49]. This perceptual state is directlyinfluenced by the inter-tonal frequency separation be-tween the A- and B-tones. Therefore, when the percep-tion is integrated as an ABA-stream, one would expectto capture the corresponding presentation frequenciesinto the spectrum. Conversely, in case of segregation(streaming), one should be able to capture, separately,the temporal distribution of the A- and B-streams in thespectrum. Hence, by varying the inter-tonal frequencyseparations, we expected to access integrated versus seg-regated percepts in the time-frequency spectrum.As shown at the group data-plots (Figure 2AB), the
presentation rate of the B-tones of the ABA-triplet se-quences elicited a clear increase of the spectral power atabout 2 Hz in the streaming (10-semitones) and in theintermediate frequency separation (4-semitones) con-ditions from the first and second parts. Additionally, theA-tones presentation elicited a steady-state like activity atabout 4 Hz in the intermediate (4-semitones) and smallfrequency separation (2-semitones) conditions. The asym-metric ABA-objects induced enhanced activity in all fourconditions (parts 1 and 2) at approximately 10 Hz and6 Hz (Figure 2AB).The ANOVAs revealed significant interaction between
the spectral distribution of the ABA-objects and those ofthe separated A- and B-streams on the basis of the dif-ferent frequency separation between the competingtones (main effect Conditions [F(3,39) = 5.335, p < .001],Target Frequency [F(3,39) = 18.550, p < .001] and inter-action Conditions x Target Frequency [F(9,117) = 2.217,p < .05]).Post hoc pairwise comparisons showed that the mean
spectral power corresponding to separate perception ofA- and B-streams has lower amplitude compared to theactivity related to the distribution of the ABA-triplets inthe conditions of small inter-tonal frequency separation. Inparticular, the B-tones related activity (2 Hz) of the non-streaming scenario (0-semitones) was significantly lowercompared to spectral power of the A-B (approx. 10 Hz)and B-A (approx. 6 Hz) tone intervals, t(13) = −3.434,p < .001 and t(13) = −5.620, p < .001. The A-tones (4 Hz)related spectral power of the same condition was alsosignificantly lower compared to the activity related tothe distribution of the ABA-triplets (A-B [approx.10 Hz], [t(13) = −4.125, p < .001] and B-A [approx.6 Hz], [t(13) = −4.312, p < .001]). Furthermore, the 2 Hzspectral power (B-tones) in the small frequency-separation condition (2-semitones) was significantlylower compared to the spectral power corresponding toA-B (approx. 10 Hz), (t(13) = −3.702, p < .05) and B-Atones (approx. 6 Hz) ,(t(13) = −8.068, p < .001). Regard-ing the 2-semitones condition, the corresponding
Chakalov et al. BMC Neuroscience 2013, 14:120 Page 7 of 14http://www.biomedcentral.com/1471-2202/14/120
activity to a separate A-stream perception at approx.4 Hz was also significantly lower than the 10 Hz(t(13) = −3,320, p < .001) and 6.6 Hz (t(13) = 8,044,p < .001) spectral power. Similarly, concerning the inter-mediate frequency separation condition (4-semitones),post hoc comparisons revealed decreased activities cor-responding to separate presentation of A-tones (approx.4 Hz) and B-tones (approx. 2 Hz) as compared to spec-tral power of the A-B target frequency (approx. 10 Hz),(t(13) = −2.321, p < .05) and (t(13) = −2.321, p < .05),respectively.In order to understand better the source of significant
interactions from the previous 4 × 4 ANOVA and to ex-plore the effect between the hemispheres, four additionalANOVAs were conducted wherein the mean spectralpower of each target frequency was entered separatelyinto repeated-measures 2 × 4 ANOVA using within-subject factors Hemisphere (left, right) and Conditions(0-, 2-, 4- and 10-semitones).
Activity related to a perception of separate A- andB-streams (parts 1 and 2)The time-frequency outcome demonstrated that the2 Hz activity (B-tones related) in the 10-semitonescondition evolved at about 0.5 s and reached its max-imum at about 0.8 s and 2 s. This was not so wellpronounced in the case of 2- and 4-semitones and didnot occur during 0-semitones condition (Figure 2AB,Table 1).Regarding the 2 Hz activity (B-tones related), the
ANOVAs revealed a significant difference between the con-ditions (main effect Condition [F(3,39) = 10.063, p < .001]).The following Post hoc pairwise comparisons showed thatthe activity at approx. 2 Hz (B-tones related rhythm)increased significantly with increasing the inter-tonal
frequency separation between A- and B-tones. The 2 Hz-activity of the 10-semitones condition was significantlygreater than in the 0-semitones condition (t(13) = −3.169,p < .05) and the 2-semitones condition (t(13) = 2.937,p < .05). The mean spectral power at 2 Hz of the 4-semitones condition was also significantly higher comparedto the 2-semitones condition (t(13) = −3.967, p < .05) andthe 0-semitones condition (t(13) = −3.934, p < .05). Thecomparison of the mean spectral power at 2 Hz, betweenthe conditions with close inter-tonal frequency difference,did not reveal significance; 2-semitones vs. 0-semitones(t(13) = −0.812, p = .431) and 10-semitones vs. 4-semitones(t(13) = −1.901, p = .080).As seen on the group level time-frequency plots, the
4 Hz-activity (A-tones related) showed greater enhance-ment in the second part (Figure 2B), wherein the fre-quency difference between the A- and B-tones wasrelatively small (2- and 4-semitones) when compared tothe first part. The power of the signal at approximately4 Hz was therefore more pronounced and better visiblethan at 2 Hz in the second part (Table 1, Figure 2B).The baseline corrected mean spectral power here dif-fered significantly across conditions (main effect Condi-tions [F(3,39) = 6.115, p < .05]). Post hoc comparisonsrevealed that the spectral power at 4 Hz in case of4-semitones was significantly greater than in case of2-semitones condition (t(13) = -2.333, p < .05), the 10-semitones condition (t(13) = −2.709, p < .05) and the0-semitones condition (t(13) = -2.618, p < .05). The 4Hz-activity was also significantly greater in case of 2-semitones compared to t 10-semitones (t(13) = -2.173,p < .05).Figure 3 summarizes the differences of the spectral
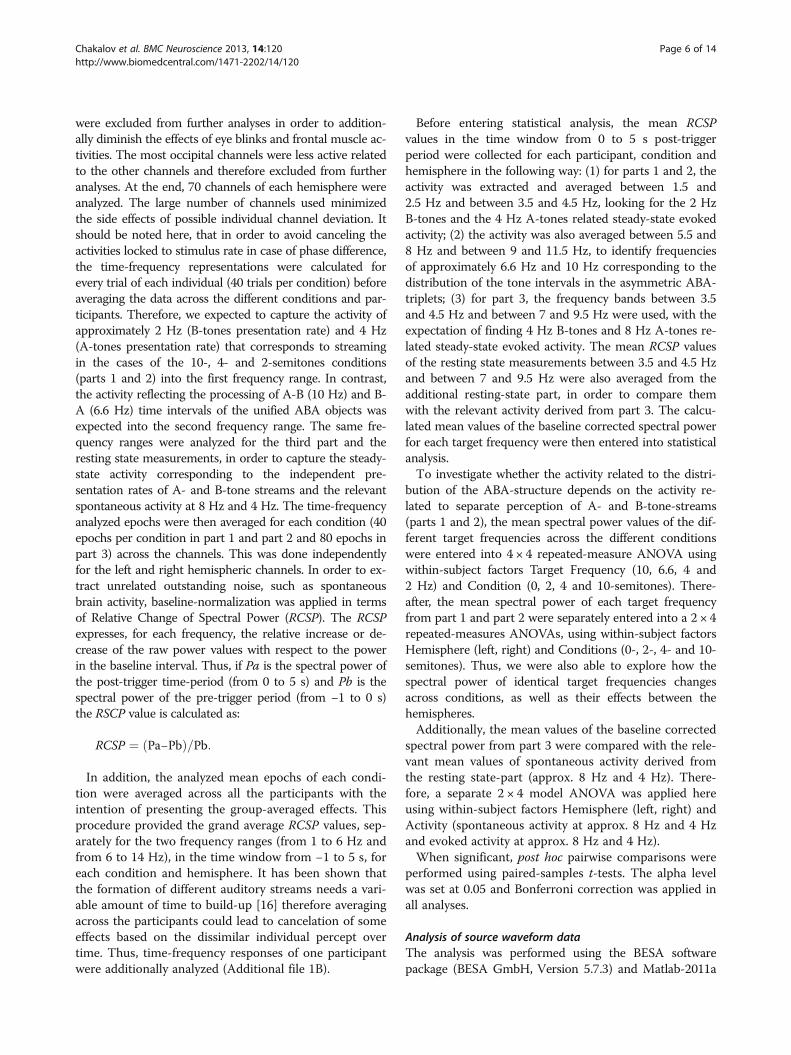
power related to the separate perception of the A-tones(4 Hz) and B-tones (2 Hz) of all conditions (0-, 2-, 4- and
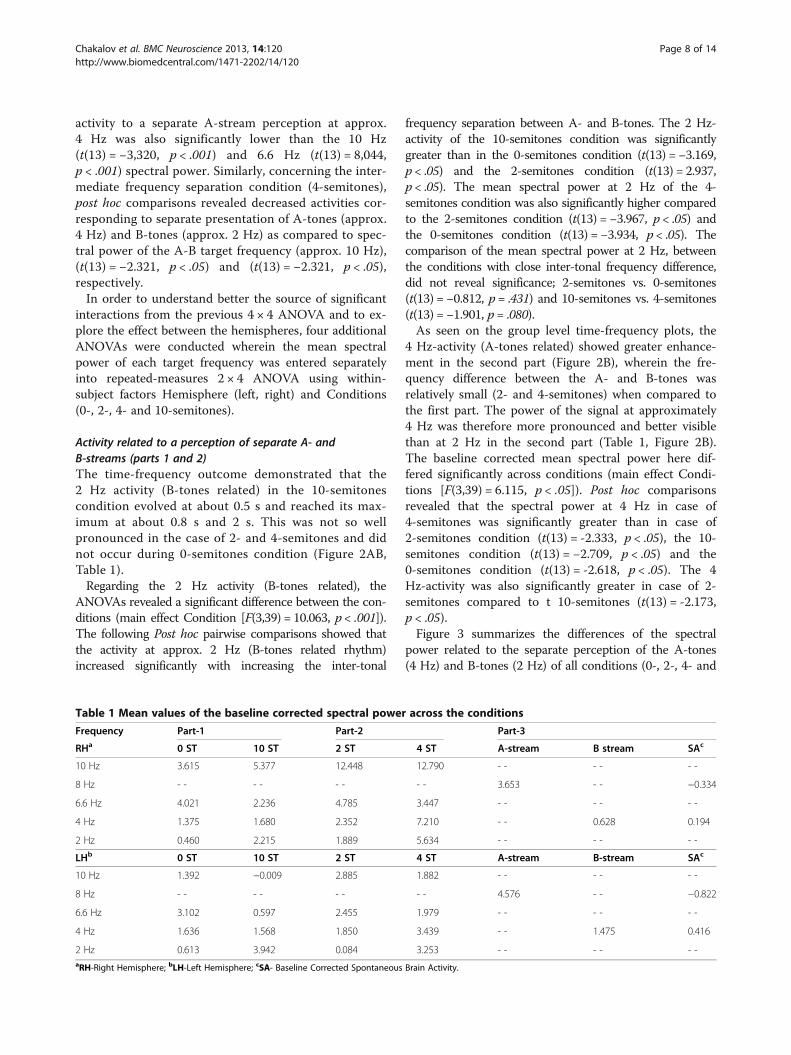
Table 1 Mean values of the baseline corrected spectral power across the conditions
Frequency Part-1 Part-2 Part-3
RHa 0 ST 10 ST 2 ST 4 ST A-stream B stream SAc
10 Hz 3.615 5.377 12.448 12.790 - - - - - -
8 Hz - - - - - - - - 3.653 - - −0.334
6.6 Hz 4.021 2.236 4.785 3.447 - - - - - -
4 Hz 1.375 1.680 2.352 7.210 - - 0.628 0.194
2 Hz 0.460 2.215 1.889 5.634 - - - - - -
LHb 0 ST 10 ST 2 ST 4 ST A-stream B-stream SAc
10 Hz 1.392 −0.009 2.885 1.882 - - - - - -
8 Hz - - - - - - - - 4.576 - - −0.822
6.6 Hz 3.102 0.597 2.455 1.979 - - - - - -
4 Hz 1.636 1.568 1.850 3.439 - - 1.475 0.416
2 Hz 0.613 3.942 0.084 3.253 - - - - - -aRH-Right Hemisphere; bLH-Left Hemisphere; cSA- Baseline Corrected Spontaneous Brain Activity.
Chakalov et al. BMC Neuroscience 2013, 14:120 Page 8 of 14http://www.biomedcentral.com/1471-2202/14/120
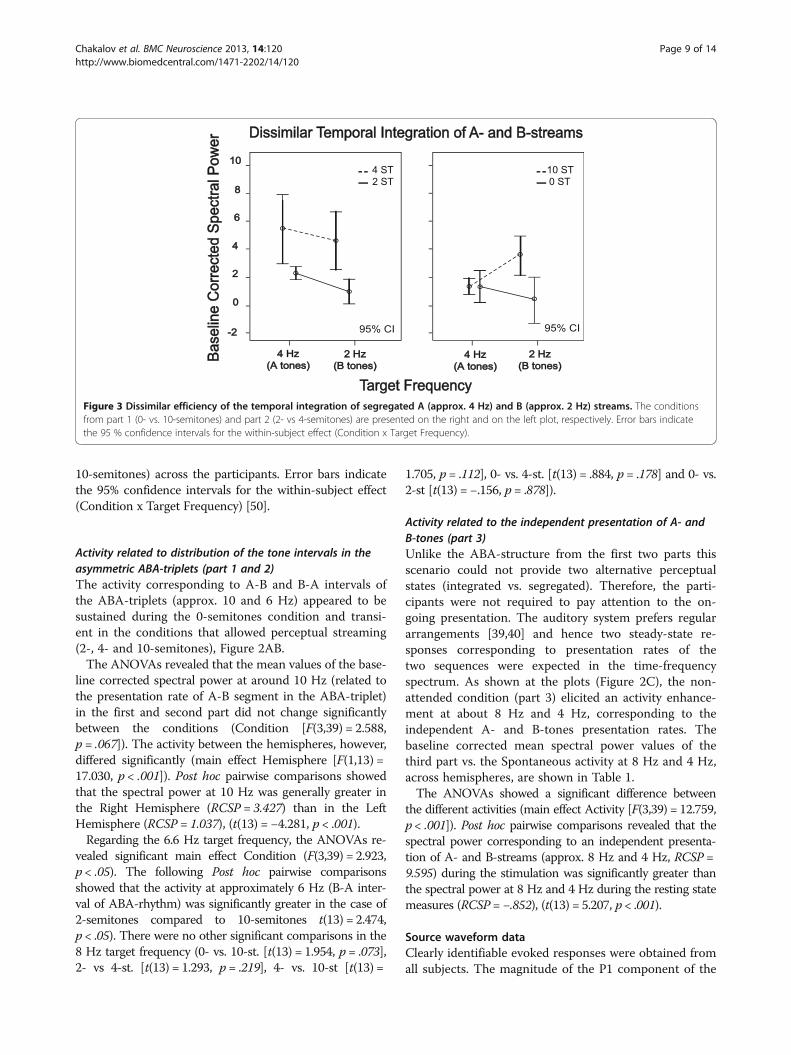
10-semitones) across the participants. Error bars indicatethe 95% confidence intervals for the within-subject effect(Condition x Target Frequency) [50].
Activity related to distribution of the tone intervals in theasymmetric ABA-triplets (part 1 and 2)The activity corresponding to A-B and B-A intervals ofthe ABA-triplets (approx. 10 and 6 Hz) appeared to besustained during the 0-semitones condition and transi-ent in the conditions that allowed perceptual streaming(2-, 4- and 10-semitones), Figure 2AB.The ANOVAs revealed that the mean values of the base-
line corrected spectral power at around 10 Hz (related tothe presentation rate of A-B segment in the ABA-triplet)in the first and second part did not change significantlybetween the conditions (Condition [F(3,39) = 2.588,p = .067]). The activity between the hemispheres, however,differed significantly (main effect Hemisphere [F(1,13) =17.030, p < .001]). Post hoc pairwise comparisons showedthat the spectral power at 10 Hz was generally greater inthe Right Hemisphere (RCSP = 3.427) than in the LeftHemisphere (RCSP = 1.037), (t(13) = −4.281, p < .001).Regarding the 6.6 Hz target frequency, the ANOVAs re-
vealed significant main effect Condition (F(3,39) = 2.923,p < .05). The following Post hoc pairwise comparisonsshowed that the activity at approximately 6 Hz (B-A inter-val of ABA-rhythm) was significantly greater in the case of2-semitones compared to 10-semitones t(13) = 2.474,p < .05). There were no other significant comparisons in the8 Hz target frequency (0- vs. 10-st. [t(13) = 1.954, p = .073],2- vs 4-st. [t(13) = 1.293, p = .219], 4- vs. 10-st [t(13) =
1.705, p = .112], 0- vs. 4-st. [t(13) = .884, p = .178] and 0- vs.2-st [t(13) = −.156, p = .878]).
Activity related to the independent presentation of A- andB-tones (part 3)Unlike the ABA-structure from the first two parts thisscenario could not provide two alternative perceptualstates (integrated vs. segregated). Therefore, the parti-cipants were not required to pay attention to the on-going presentation. The auditory system prefers regulararrangements [39,40] and hence two steady-state re-sponses corresponding to presentation rates of thetwo sequences were expected in the time-frequencyspectrum. As shown at the plots (Figure 2C), the non-attended condition (part 3) elicited an activity enhance-ment at about 8 Hz and 4 Hz, corresponding to theindependent A- and B-tones presentation rates. Thebaseline corrected mean spectral power values of thethird part vs. the Spontaneous activity at 8 Hz and 4 Hz,across hemispheres, are shown in Table 1.The ANOVAs showed a significant difference between
the different activities (main effect Activity [F(3,39) = 12.759,p < .001]). Post hoc pairwise comparisons revealed that thespectral power corresponding to an independent presenta-tion of A- and B-streams (approx. 8 Hz and 4 Hz, RCSP =9.595) during the stimulation was significantly greater thanthe spectral power at 8 Hz and 4 Hz during the resting statemeasures (RCSP=−.852), (t(13) = 5.207, p < .001).
Source waveform dataClearly identifiable evoked responses were obtained fromall subjects. The magnitude of the P1 component of the
Figure 3 Dissimilar efficiency of the temporal integration of segregated A (approx. 4 Hz) and B (approx. 2 Hz) streams. The conditionsfrom part 1 (0- vs. 10-semitones) and part 2 (2- vs 4-semitones) are presented on the right and on the left plot, respectively. Error bars indicatethe 95 % confidence intervals for the within-subject effect (Condition x Target Frequency).
Chakalov et al. BMC Neuroscience 2013, 14:120 Page 9 of 14http://www.biomedcentral.com/1471-2202/14/120
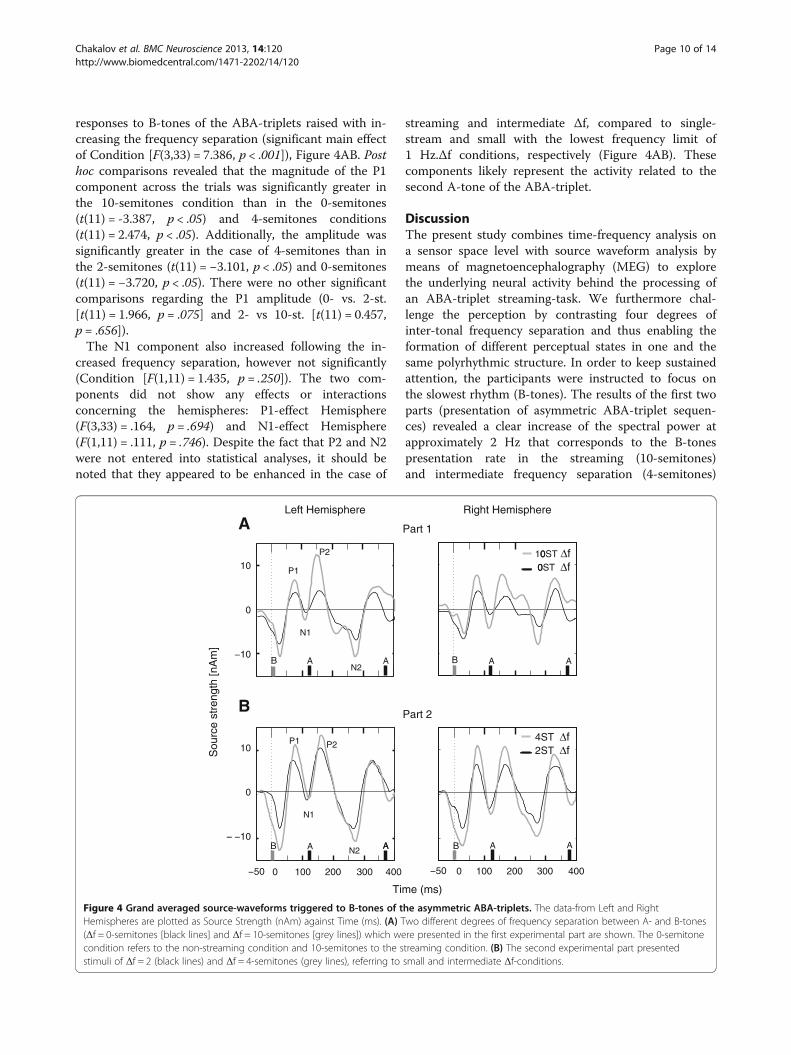
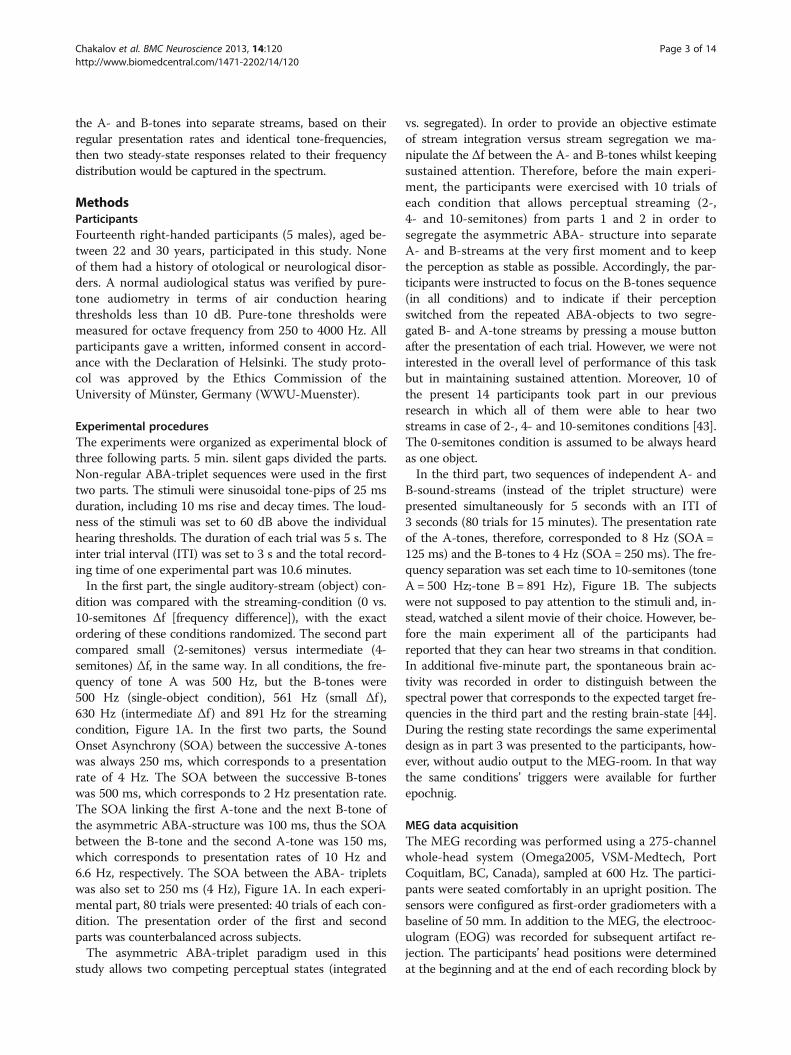
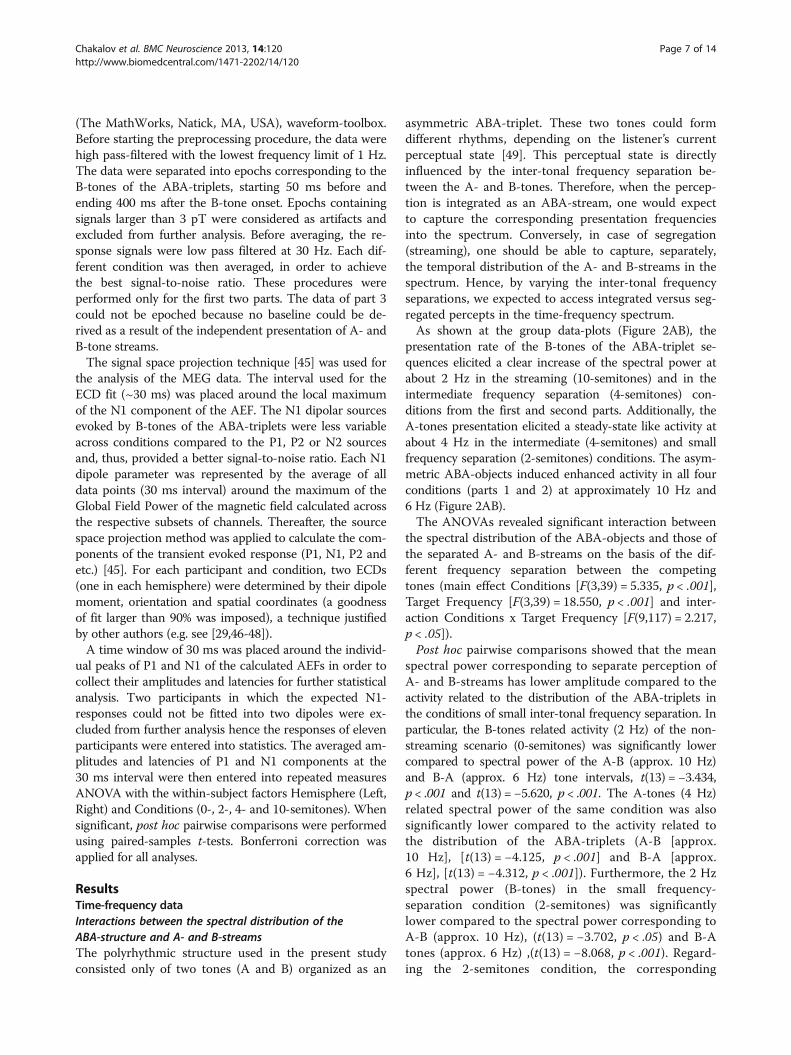
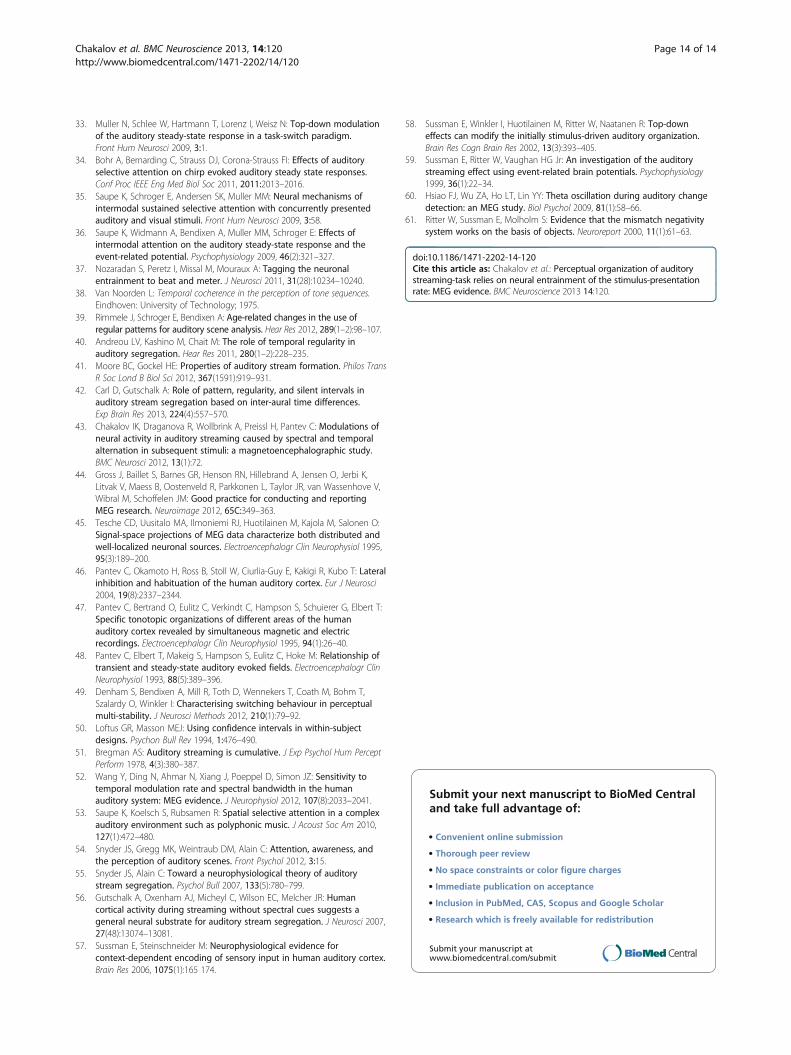
responses to B-tones of the ABA-triplets raised with in-creasing the frequency separation (significant main effectof Condition [F(3,33) = 7.386, p < .001]), Figure 4AB. Posthoc comparisons revealed that the magnitude of the P1component across the trials was significantly greater inthe 10-semitones condition than in the 0-semitones(t(11) = -3.387, p < .05) and 4-semitones conditions(t(11) = 2.474, p < .05). Additionally, the amplitude wassignificantly greater in the case of 4-semitones than inthe 2-semitones (t(11) = −3.101, p < .05) and 0-semitones(t(11) = −3.720, p < .05). There were no other significantcomparisons regarding the P1 amplitude (0- vs. 2-st.[t(11) = 1.966, p = .075] and 2- vs 10-st. [t(11) = 0.457,p = .656]).The N1 component also increased following the in-
creased frequency separation, however not significantly(Condition [F(1,11) = 1.435, p = .250]). The two com-ponents did not show any effects or interactionsconcerning the hemispheres: P1-effect Hemisphere(F(3,33) = .164, p = .694) and N1-effect Hemisphere(F(1,11) = .111, p = .746). Despite the fact that P2 and N2were not entered into statistical analyses, it should benoted that they appeared to be enhanced in the case of
streaming and intermediate Δf, compared to single-stream and small with the lowest frequency limit of1 Hz.Δf conditions, respectively (Figure 4AB). Thesecomponents likely represent the activity related to thesecond A-tone of the ABA-triplet.
DiscussionThe present study combines time-frequency analysis ona sensor space level with source waveform analysis bymeans of magnetoencephalography (MEG) to explorethe underlying neural activity behind the processing ofan ABA-triplet streaming-task. We furthermore chal-lenge the perception by contrasting four degrees ofinter-tonal frequency separation and thus enabling theformation of different perceptual states in one and thesame polyrhythmic structure. In order to keep sustainedattention, the participants were instructed to focus onthe slowest rhythm (B-tones). The results of the first twoparts (presentation of asymmetric ABA-triplet sequen-ces) revealed a clear increase of the spectral power atapproximately 2 Hz that corresponds to the B-tonespresentation rate in the streaming (10-semitones)and intermediate frequency separation (4-semitones)
−10−
0
10
−50 0 100 200 300 400
−10
0
10
Time (ms)
P1
N1
Sou
rce
stre
ngth
[nA
m]
10ST0 Δf 0ST 0 Δf
4ST Δf2ST Δf
AB N2
Part 1
Part 2
Left Hemisphere Right Hemisphere
AB AB
AB
P1
N1
−50 0 100 200 300 400
A A
AA A
P2
N2
P2
A
B
Figure 4 Grand averaged source-waveforms triggered to B-tones of the asymmetric ABA-triplets. The data-from Left and RightHemispheres are plotted as Source Strength (nAm) against Time (ms). (A) Two different degrees of frequency separation between A- and B-tones(Δf = 0-semitones [black lines] and Δf = 10-semitones [grey lines]) which were presented in the first experimental part are shown. The 0-semitonecondition refers to the non-streaming condition and 10-semitones to the streaming condition. (B) The second experimental part presentedstimuli of Δf = 2 (black lines) and Δf = 4-semitones (grey lines), referring to small and intermediate Δf-conditions.
Chakalov et al. BMC Neuroscience 2013, 14:120 Page 10 of 14http://www.biomedcentral.com/1471-2202/14/120
conditions. This was in line with our hypothesis.Additionally, the A-tones presentation rate elicitedsteady-state like activity at approximately 4 Hz. TheABA-triplet sequence used in the present study is usu-ally heard as a galloping rhythm and the A- and B-streams are enclosed into the ABA-pattern [38]. Hencethe A- and B-tones related activities at 4 Hz and 2 Hzare only accessible in the spectrum if the two streamsare segregated. Our results, therefore, likely reflect theselective segregation of the polyrhythmic ABA-patterninto two monorhythmic A- and B- streams. The activityat approximately 10 Hz and 6 Hz that corresponds to A-B and B-A-tone intervals of the ABA-triplets also in-creased across the trials in the first two parts. In thelight of the present findings, one might speculate thatthe neural representation of different auditory sequencesrelies on neural entrainment of the temporal intervalsbetween the composed stimuli. Therefore, when the per-ception is in favor of one-stream condition (0-semitones)one could capture the corresponding presentation ratesin the spectrum (10 Hz and 6.6 Hz), whereas the otherrhythms would be suppressed (2 Hz and 4 Hz) and viceversa in the case of segregation (10-semitones). Add-itionally, the time-frequency results demonstrated thatthe responses to the ABA-frequency distribution(approx.10 Hz and 6.6 Hz) appeared to be sustainedacross the entire presentation of the non-streaming con-dition (0-semitones), whereas the B-tone related activity(2 Hz) emerged at approximately 0.5 s and reached itsmaxima at approx. 0.8 s and 2 s only during the stream-ing condition (10-semitones). Conversely, the spectralpower at 10 Hz and 6.6 Hz was rather transient in allother conditions that allowed perceptual streaming (2-,4- and 10-semitones). The streaming phenomenon is cu-mulative [51] and needs variable amount of time tobuild-up [16] and therefore the appearance of the 2 Hzactivity at about 0.5 s in the time-frequency plots likelyreflects the streaming built-up period. Alongside this,the vanishing of the activity at approx. 10 Hz and 6 Hzcould match the periods wherein the perceptionalternated in favor of stream segregation. Indeed, thestatistical analysis revealed that the spectral power corre-sponding to the A-B and B-A time intervals of the ABA-triplets is significantly enhanced compared to theresponses tuned to the separated A- and B-tones in thenon-streaming scenario (0-semitones) and the condi-tions of small and intermediate inter-tonal frequencyseparations (2- and 4-semitones).The statistical analysis showed furthermore that the
steady-state activity related to the attended B-stream(2 Hz) increased significantly with enlarging the inter-tonal frequency difference between A- and B-tones(from 0- to 10-semitones). This result lends further sup-port to the idea that attention is a crucial factor in
auditory streaming because it biases the auditory systemtowards particular grouping or binding of sound-sourceelements in favor of the listener’s intention [19,21]. Aprevious study by Xiang and colleagues, for instance, ex-plored the mechanisms of temporal integration and itsinteraction with attention in the auditory system byusing a streaming paradigm with two competing tones[20]. The authors demonstrated that focusing the lis-teners’ attention on one of the two competing tempi en-hances significantly its steady-state power. However, thetwo competing tones they used could primarily producetwo auditory streams [20], unlike the asymmetric ABA-triplets used in the present study. Furthermore, it hasbeen demonstrated previously that the steady-state re-sponses could be modulated by attention [35,36]. Ourexperimental design, therefore, allowed us to explore theinteraction between the temporal rates in one integratedpolyrhythmic pattern and two segregated monorhythmicstreams in one and the same tone-sequence. On theother hand, our results revealed a higher spectral powertuned to the A-tones presentation rate (4 Hz) in com-parison with the B-tones related responses (2 Hz) in thecases of intermediate and small frequency separation be-tween tones, although the attention was focused on theB-rhythm. It might be suggested that in cases of smallfrequency differences between tones, such as those usedin the second part (2- and 4-semitones), the perceptionof the B-tone is not able to dominate the perception ofthe A-tones, and that this produces considerably higheractivity at approximately 4 Hz target frequency. It couldbe speculated therefore, that a greater effort is needed tosegregate the ABA-structure onto separate A- and B-tone streams in the cases of small and intermediate fre-quency differences than in the pure streaming condition(10-semitones). In addition, it might be more difficult tofollow the slower B-stream (2 Hz) instead of the twice asfast A-stream (4 Hz) in the cases of intermediate andsmall frequency separations than in the greater frequencydifferences. Besides that, previous studies showed that thesteady-state responses are stronger in low frequency rates(below 16 Hz) when mediated by attention [21,52]. Al-though the attention was focused on the B-tones in ourexperiment, changing the inter-tonal frequency separationinto the ABA-tone pattern revealed dissimilar efficiency oftemporal integration of separate A- and B-streams. It hasbeen demonstrated previously that the P1 and N1 compo-nents of the human AEFs are larger when listeners per-ceive two segregated streams than one integrated streamand this magnitude augmentation is consistent with theincreasing frequency separation between the A- andB-tones [2]. However, these authors showed that theB-tones’ related responses were always enhanced, regard-less of the attended stream (A- or B-tones) [2]. Similarly, ithas been proposed that the frequency separation between
Chakalov et al. BMC Neuroscience 2013, 14:120 Page 11 of 14http://www.biomedcentral.com/1471-2202/14/120
different sound sources of a polyrhythmic sequence is suf-ficient to provide the selective processing of a particularmusical instrument; however, the selective attention toone or another spatially separated element of this rhythmcould additionally improve the segregation process [53].These findings together support the idea that the attentionin auditory streaming is not merely an intrinsic mechan-ism that augments the neural responses but its effects arebased on a specific interaction between the physical attri-butes of the stimuli [20]. Additionally, the present out-come is in line with the hypothesis that distinct neuronalpopulations are involved in the processing of A- and B-tones and suppression of one population might underliethe stream segregation phenomenon [11,12].Assuming that the steady-state activity at low frequency
bands is generated by the periodic appearance of theevoked components in response to the A- and B-tones, wetested whether the source waveform of the response signaltriggered by the attended B-tones of the ABA-triplets rep-resents any significant effects regarding the evoked peaks.Moreover, the modulation of the source waveforms’components synchronized to each triplet of the ABA-streaming task is a traditional way to investigate the audi-tory streaming phenomenon (see e.g. [2]). The analysisrevealed higher amplitude of the evoked components withincreasing the frequency separation, a finding that is inline with prior studies [2,6,8,54-56]. Specifically, the P1evoked component to the B-tones enhanced significantlyas the inter-tonal frequency difference increased. This im-plies that the enhancement of the evoked fields in thesource space level together with the B-tones related activ-ity derived from the time-frequency results likely reflectthe selective segregation of the attended B-stream. How-ever, the source-wave forms comprise more than one har-monics in the spectrum and it is thus difficult to separatethe streaming-related effects from the activities related tothe physical features of the sounds. Elhilali and colleagues,for instance, demonstrated that frequency-distant spectralcomponents are no longer heard as separate streams ifpresented synchronously rather than consecutively, whilethe neural activity increases with increasing frequency sep-aration between tones [18].Hence, the auditory evoked fields per se are not cap-
able of fully explaining the perception of streaming.In apparent contrast to the first two parts, two recurring
A- and B-tone-streams were presented in the third part.Here, the temporal distribution between the A-B and B-A-tones was always different, whereas the presentationrates of the A-tones and the B-tones per se, were alwaysregular, corresponding to 8 Hz and 4 Hz, respectively. Theresults demonstrated clear non-attentive steady-state ac-tivity at approx. 8 Hz and 4 Hz. Indeed, it has been shownthat the auditory system prefers regular arrangements[39,40]. Moreover, the integration of auditory streams,
based on their regularities, could take place automatically.The mismatch negativity component (MMN) of event-related potentials, for instance, automatically detectschanges in the regular stimulus pattern [57-60]. Addition-ally, it has been found that the MMN operates also on thebasis of auditory objects and that the integration of objectsoccurs pre-attentively in the auditory system [61]. Theexperimental design applied in the third part could notprovide two complementary percepts (integrated vs. segre-gated), such as ABA-triplets. It could be speculated, there-fore, that the two auditory streams were formed of thevery first moment of their presentation. On the otherhand, it has recently been demonstrated that stream-integration can occur with irregular arrangements [42];however, it is likely that in the absence of active awareness,the auditory system integrates tone patterns based on theirphysical regularities.In summary, the present findings suggest that neural
encoding of a streaming task relies on an oscillatory en-trainment of the stimulus presentation rates. However,two separate effects of the time-frequency data must bedistinguished: the first is represented in our results bythe distribution of the intervals between the A-B (10 Hz)and B-A (6.6 Hz) tones of the ABA-triplets (0-semi-tones). The second effect is represented by the 2 Hz and4 Hz steady-state responses related to the B- and A-tones derived from the conditions that allow perceptualstreaming (2-, 4- and 10-semitones), alongside thesteady-state effects of non-attentive listening (part 3).The present effects cannot be directly ascribed to theunderlying mechanisms responsible for various percep-tual states, because the participants were not required tomake streaming judgments during the trials. Neverthe-less, these effects might be grounded to physiologicalhallmarks of the process, which precedes the formationof one vs. two streams percept. Hence, further study isnecessary to show the differences in the spectral dis-tribution of identical tonal-frequency separation in con-ditions of perceptual validation during integration vs.segregation.
ConclusionsThe present findings are consistent with previous studiessuggesting that the perceptual organization in sequentialauditory scene analysis relies on oscillatory entrainmentto task-driven sound input. The results showed that in-creasing of the frequency separation between A- and B-tones of the ABA-pattern correlates with a greater mag-nitude of the steady-state responses tuned to theattended B-tones. Alongside this, the P1 evoked fields’component, synchronized to the B-tones, increased inamplitude with raising the inter-tonal frequency differ-ence. Furthermore, the asymmetric ABA-objects, spon-taneously elicited sustained activity, which corresponded
Chakalov et al. BMC Neuroscience 2013, 14:120 Page 12 of 14http://www.biomedcentral.com/1471-2202/14/120
to the temporal distribution of the constituent tone in-tervals. The results also revealed that the efficiency oftemporal integration of separate streams is dissimilar de-pending on the degree of frequency separation betweenthe competing sounds. The steady-state responses tunedto the B-tones dominated the responses tuned to the A-tones in the case of great frequency difference betweentones. Conversely, the representation of the A-tonesdominated the B-tones in the cases of small and inter-mediate frequency separation, in which the task requiredgreater effort. Overall, the present outcome suggests thatthe neural effects of auditory stream integration and seg-regation could be directly captured in the time-frequency spectrum and measured with significance testsat the sensor space level.
Additional file
Additional file 1: Two separated plots show the Grand Averagedtopographic Maps (A) and the neural responses of oneRepresentative Subject (B).
Competing interestsThe authors declare that they have no financial or any other competinginterests.
Authors’ contributionsIC, RD and CP conceived of the study designed the experimental setup andthe auditory stimuli. IC acquired the data. IC performed the data & statisticalanalyses. All authors participated in the data evaluation and interpretationand in writing the manuscript, and have approved the final version of themanuscript.
AcknowledgementsWe are grateful to Janning Herman for preparation of the Time FrequencyAnalyses to Evangelos Paraskevopoulos for the helpful comments and KarinBerning for technical assistance. We are very grateful to Ross Parfitt forproofreading the grammar and wording of the paper.
FundingThis work has been supported by “Deutsche Forschungsgemeinschaft”, (DR807/1-1). The funders had no role in study design, data collection andanalysis, decision to publish, or preparation of the manuscript.
Author details1Institute for Biomagnetism and Biosignalanalysis, University of Münster,Malmedyweg 15, 48149 Münster, Germany. 2MEG-Center,Eberhard-Karls-University Tübingen, Otfried-Müller-Straße 47, 72076 Tübingen,Germany.
Received: 6 June 2013 Accepted: 9 October 2013Published: 12 October 2013
References1. Bregman AS, Liao C, Levitan R: Auditory grouping based on fundamental
frequency and formant peak frequency. Can J Psychol 1990, 44(3):400–413.2. Gutschalk A, Micheyl C, Melcher JR, Rupp A, Scherg M, Oxenham AJ:
Neuromagnetic correlates of streaming in human auditory cortex.J Neurosci 2005, 25(22):5382–5388.
3. Snyder JS, Alain C: Age-related changes in neural activity associated withconcurrent vowel segregation. Brain Res Cogn Brain Res 2005, 24(3):492–499.
4. Snyder JS, Alain C, Picton TW: Effects of attention on neuroelectric correlatesof auditory stream segregation. J Cogn Neurosci 2006, 18(1):1–13.
5. Snyder JS, Alain C: Sequential auditory scene analysis is preserved innormal aging adults. Cereb Cortex 2007, 17(3):501–512.
6. Snyder JS, Holder WT, Weintraub DM, Carter OL, Alain C: Effects of priorstimulus and prior perception on neural correlates of auditory streamsegregation. Psychophysiology 2009, 46(6):1208–1215.
7. Snyder JS, Carter OL, Hannon EE, Alain C: Adaptation reveals multiplelevels of representation in auditory stream segregation. J Exp PsycholHum Percept Perform 2009, 35(4):1232–1244.
8. Snyder JS: Weintraub. Pattern specificity in the effect of prior Deltaf onauditory stream segregation. J Exp Psychol Hum Percept Perform: DM; 2011.
9. Pressnitzer D, Hupe JM: Temporal dynamics of auditory and visualbistability reveal common principles of perceptual organization. Curr Biol2006, 16(13):1351–1357.
10. Bee MA, Klump GM: Auditory stream segregation in the songbirdforebrain: effects of time intervals on responses to interleaved tonesequences. Brain Behav Evol 2005, 66(3):197–214.
11. Fishman YI, Arezzo JC, Steinschneider M: Auditory stream segregationin monkey auditory cortex: effects of frequency separation,presentation rate, and tone duration. J Acoust Soc Am 2004,116(3):1656–1670.
12. Fishman YI, Reser DH, Arezzo JC, Steinschneider M: Neural correlates ofauditory stream segregation in primary auditory cortex of the awakemonkey. Hear Res 2001, 151(1–2):167–187.
13. Kanwal JS, Medvedev AV, Micheyl C: Neurodynamics for auditory streamsegregation: tracking sounds in the mustached bat’s naturalenvironment. Network 2003, 14(3):413–435.
14. Micheyl C, Tian B, Carlyon RP, Rauschecker JP: Perceptual organization oftone sequences in the auditory cortex of awake macaques. Neuron 2005,48(1):139–148.
15. Micheyl C, Carlyon RP, Gutschalk A, Melcher JR, Oxenham AJ, Rauschecker JP,Tian B, Courtenay Wilson E: The role of auditory cortex in the formation ofauditory streams. Hear Res 2007, 229(1–2):116–131.
16. Beauvois MW, Meddis R: Time decay of auditory stream biasing.Percept Psychophys 1997, 59(1):81–86.
17. Beauvois MW, Meddis R: Computer simulation of auditory streamsegregation in alternating-tone sequences. J Acoust Soc Am 1996,99(4 Pt 1):2270–2280.
18. Elhilali M, Ma L, Micheyl C, Oxenham AJ, Shamma SA: Temporal coherencein the perceptual organization and cortical representation of auditoryscenes. Neuron 2009, 61(2):317–329.
19. Shamma SA, Elhilali M, Micheyl C: Temporal coherence and attention inauditory scene analysis. Trends Neurosci 2011, 34(3):114–123.
20. Xiang J, Simon J, Elhilali M: Competing streams at the cocktail party:exploring the mechanisms of attention and temporal integration.J Neurosci 2010, 30(36):12084–12093.
21. Elhilali M, Xiang J, Shamma SA, Simon JZ: Interaction between attentionand bottom-up saliency mediates the representation of foreground andbackground in an auditory scene. PLoS Biol 2009, 7(6):e1000129.
22. Galambos R, Makeig S, Talmachoff PJ: A 40-Hz auditory potential recordedfrom the human scalp. Proc Natl Acad Sci USA 1981, 78(4):2643–2647.
23. Lins OG, Picton TW: Auditory steady-state responses to multiplesimultaneous stimuli. Electroencephalogr Clin Neurophysiol 1995, 96(5):420–432.
24. Plourde G: Auditory evoked potentials. Best Pract Res Clin Anaesthesiol2006, 20(1):129–139.
25. Draganova R, Ross B, Borgmann C, Pantev C: Auditory cortical responsepatterns to multiple rhythms of AM sound. Ear Hear 2002, 23(3):254–265.
26. Ross B, Herdman AT, Pantev C: Stimulus induced reset of 40-Hz auditorysteady-state responses. Neurol Clin Neurophysiol 2004, 2004:21.
27. Ross B, Herdman AT, Pantev C: Right hemispheric laterality of human 40Hz auditory steady-state responses. Cereb Cortex 2005, 15(12):2029–2039.
28. Ross B, Borgmann C, Draganova R, Roberts LE, Pantev C: A high-precisionmagnetoencephalographic study of human auditory steady-state responsesto amplitude-modulated tones. J Acoust Soc Am 2000, 108(2):679–691.
29. Pantev C, Roberts LE, Elbert T, Ross B, Wienbruch C: Tonotopic organizationof the sources of human auditory steady-state responses. Hear Res1996, 101(1–2):62–74.
30. Basar E, Basar-Eroglu C, Karakas S, Schurmann M: Gamma, alpha, delta, andtheta oscillations govern cognitive processes. Int J Psychophysiol 2001,39(2–3):241–248.
31. Schroeder CE, Lakatos P: Low-frequency neuronal oscillations asinstruments of sensory selection. Trends Neurosci 2009, 32(1):9–18.
32. Schroeder CE, Lakatos P: The gamma oscillation: master or slave?Brain Topogr 2009, 22(1):24–26.
Chakalov et al. BMC Neuroscience 2013, 14:120 Page 13 of 14http://www.biomedcentral.com/1471-2202/14/120
33. Muller N, Schlee W, Hartmann T, Lorenz I, Weisz N: Top-down modulationof the auditory steady-state response in a task-switch paradigm.Front Hum Neurosci 2009, 3:1.
34. Bohr A, Bernarding C, Strauss DJ, Corona-Strauss FI: Effects of auditoryselective attention on chirp evoked auditory steady state responses.Conf Proc IEEE Eng Med Biol Soc 2011, 2011:2013–2016.
35. Saupe K, Schroger E, Andersen SK, Muller MM: Neural mechanisms ofintermodal sustained selective attention with concurrently presentedauditory and visual stimuli. Front Hum Neurosci 2009, 3:58.
36. Saupe K, Widmann A, Bendixen A, Muller MM, Schroger E: Effects ofintermodal attention on the auditory steady-state response and theevent-related potential. Psychophysiology 2009, 46(2):321–327.
37. Nozaradan S, Peretz I, Missal M, Mouraux A: Tagging the neuronalentrainment to beat and meter. J Neurosci 2011, 31(28):10234–10240.
38. Van Noorden L: Temporal cocherence in the perception of tone sequences.Eindhoven: University of Technology; 1975.
39. Rimmele J, Schroger E, Bendixen A: Age-related changes in the use ofregular patterns for auditory scene analysis. Hear Res 2012, 289(1–2):98–107.
40. Andreou LV, Kashino M, Chait M: The role of temporal regularity inauditory segregation. Hear Res 2011, 280(1–2):228–235.
41. Moore BC, Gockel HE: Properties of auditory stream formation. Philos TransR Soc Lond B Biol Sci 2012, 367(1591):919–931.
42. Carl D, Gutschalk A: Role of pattern, regularity, and silent intervals inauditory stream segregation based on inter-aural time differences.Exp Brain Res 2013, 224(4):557–570.
43. Chakalov IK, Draganova R, Wollbrink A, Preissl H, Pantev C: Modulations ofneural activity in auditory streaming caused by spectral and temporalalternation in subsequent stimuli: a magnetoencephalographic study.BMC Neurosci 2012, 13(1):72.
44. Gross J, Baillet S, Barnes GR, Henson RN, Hillebrand A, Jensen O, Jerbi K,Litvak V, Maess B, Oostenveld R, Parkkonen L, Taylor JR, van Wassenhove V,Wibral M, Schoffelen JM: Good practice for conducting and reportingMEG research. Neuroimage 2012, 65C:349–363.
45. Tesche CD, Uusitalo MA, Ilmoniemi RJ, Huotilainen M, Kajola M, Salonen O:Signal-space projections of MEG data characterize both distributed andwell-localized neuronal sources. Electroencephalogr Clin Neurophysiol 1995,95(3):189–200.
46. Pantev C, Okamoto H, Ross B, Stoll W, Ciurlia-Guy E, Kakigi R, Kubo T: Lateralinhibition and habituation of the human auditory cortex. Eur J Neurosci2004, 19(8):2337–2344.
47. Pantev C, Bertrand O, Eulitz C, Verkindt C, Hampson S, Schuierer G, Elbert T:Specific tonotopic organizations of different areas of the humanauditory cortex revealed by simultaneous magnetic and electricrecordings. Electroencephalogr Clin Neurophysiol 1995, 94(1):26–40.
48. Pantev C, Elbert T, Makeig S, Hampson S, Eulitz C, Hoke M: Relationship oftransient and steady-state auditory evoked fields. Electroencephalogr ClinNeurophysiol 1993, 88(5):389–396.
49. Denham S, Bendixen A, Mill R, Toth D, Wennekers T, Coath M, Bohm T,Szalardy O, Winkler I: Characterising switching behaviour in perceptualmulti-stability. J Neurosci Methods 2012, 210(1):79–92.
50. Loftus GR, Masson MEJ: Using confidence intervals in within-subjectdesigns. Psychon Bull Rev 1994, 1:476–490.
51. Bregman AS: Auditory streaming is cumulative. J Exp Psychol Hum PerceptPerform 1978, 4(3):380–387.
52. Wang Y, Ding N, Ahmar N, Xiang J, Poeppel D, Simon JZ: Sensitivity totemporal modulation rate and spectral bandwidth in the humanauditory system: MEG evidence. J Neurophysiol 2012, 107(8):2033–2041.
53. Saupe K, Koelsch S, Rubsamen R: Spatial selective attention in a complexauditory environment such as polyphonic music. J Acoust Soc Am 2010,127(1):472–480.
54. Snyder JS, Gregg MK, Weintraub DM, Alain C: Attention, awareness, andthe perception of auditory scenes. Front Psychol 2012, 3:15.
55. Snyder JS, Alain C: Toward a neurophysiological theory of auditorystream segregation. Psychol Bull 2007, 133(5):780–799.
56. Gutschalk A, Oxenham AJ, Micheyl C, Wilson EC, Melcher JR: Humancortical activity during streaming without spectral cues suggests ageneral neural substrate for auditory stream segregation. J Neurosci 2007,27(48):13074–13081.
57. Sussman E, Steinschneider M: Neurophysiological evidence forcontext-dependent encoding of sensory input in human auditory cortex.Brain Res 2006, 1075(1):165 174.
58. Sussman E, Winkler I, Huotilainen M, Ritter W, Naatanen R: Top-downeffects can modify the initially stimulus-driven auditory organization.Brain Res Cogn Brain Res 2002, 13(3):393–405.
59. Sussman E, Ritter W, Vaughan HG Jr: An investigation of the auditorystreaming effect using event-related brain potentials. Psychophysiology1999, 36(1):22–34.
60. Hsiao FJ, Wu ZA, Ho LT, Lin YY: Theta oscillation during auditory changedetection: an MEG study. Biol Psychol 2009, 81(1):58–66.
61. Ritter W, Sussman E, Molholm S: Evidence that the mismatch negativitysystem works on the basis of objects. Neuroreport 2000, 11(1):61–63.
doi:10.1186/1471-2202-14-120Cite this article as: Chakalov et al.: Perceptual organization of auditorystreaming-task relies on neural entrainment of the stimulus-presentationrate: MEG evidence. BMC Neuroscience 2013 14:120.
Submit your next manuscript to BioMed Centraland take full advantage of:
• Convenient online submission
• Thorough peer review
• No space constraints or color figure charges
• Immediate publication on acceptance
• Inclusion in PubMed, CAS, Scopus and Google Scholar
• Research which is freely available for redistribution
Submit your manuscript at www.biomedcentral.com/submit
Chakalov et al. BMC Neuroscience 2013, 14:120 Page 14 of 14http://www.biomedcentral.com/1471-2202/14/120
Related Documents


![Toronto, ON, Canada, M3J 1P3 arXiv:1803.01485v3 [cs.CV] 18 Oct … · 2018-10-22 · Toronto, ON, Canada, M3J 1P3 Abstract. Perceptual judgment of image similarity by humans relies](https://static.cupdf.com/doc/110x72/5f88a87f131af40aab2066fd/toronto-on-canada-m3j-1p3-arxiv180301485v3-cscv-18-oct-2018-10-22-toronto.jpg)

![Neural entrainment determines the words we hear · 46 influence sensory processing and perception [1]. Neural entrainment that relies on the 47 recruitment of endogenous oscillations](https://static.cupdf.com/doc/110x72/5f0a9e7a7e708231d42c8574/neural-entrainment-determines-the-words-we-hear-46-influence-sensory-processing.jpg)