PERCEPTUAL-COGNITIVE EXPERTISE IN CRICKET UMPIRES DURING LEG BEFORE WICKET DECISION MAKING PRAVINATH RAMACHANDRAN A thesis submitted in partial fulfilment of the requirements of Liverpool John Moores University for the degree of Doctor of Philosophy July 2021

Welcome message from author
This document is posted to help you gain knowledge. Please leave a comment to let me know what you think about it! Share it to your friends and learn new things together.
Transcript

PERCEPTUAL-COGNITIVE EXPERTISE IN CRICKET UMPIRES DURING
LEG BEFORE WICKET DECISION MAKING
PRAVINATH RAMACHANDRAN
A thesis submitted in partial fulfilment of the requirements of Liverpool John
Moores University for the degree of Doctor of Philosophy
July 2021
2
Contents
List of Tables and Figures ............................................................................................... 3
Abstract .......................................................................................................................... 5
Acknowledgements ......................................................................................................... 8
Chapter 1: Review of Expertise, Perceptual-Cognitive Skill, and Sports Officiating ....... 10
Chapter 2: Expertise Differences in LBW Decision Making and Perceptual-Cognitive
Skills............................................................................................................................. 61
Chapter 3: Task-Switching, Attentional Allocation and LBW decision making .............. 84
Chapter 4: The Effect of Quiet Eye Training on LBW Decision Making ...................... 105
Chapter 5: Epilogue .................................................................................................... 129
References .................................................................................................................. 155
Appendix .................................................................................................................... 176

3
List of Tables and Figures
1.1 Umpire viewpoint of the pitch. The bowler delivers from the ‘Non-Striker End’
towards the batter at the ‘Striker End…………………………………………….…11
1.2 a) off side of the stumps to a right-handed batter b) in-line with the stumps c) leg
side of the stumps to a right-handed batter……………………………...…………..13
1.3 Model of working memory adapted from Baddeley (2000)…………………….23
1.4 a) Legal delivery, b) Illegal delivery (no ball)……………………………….....39
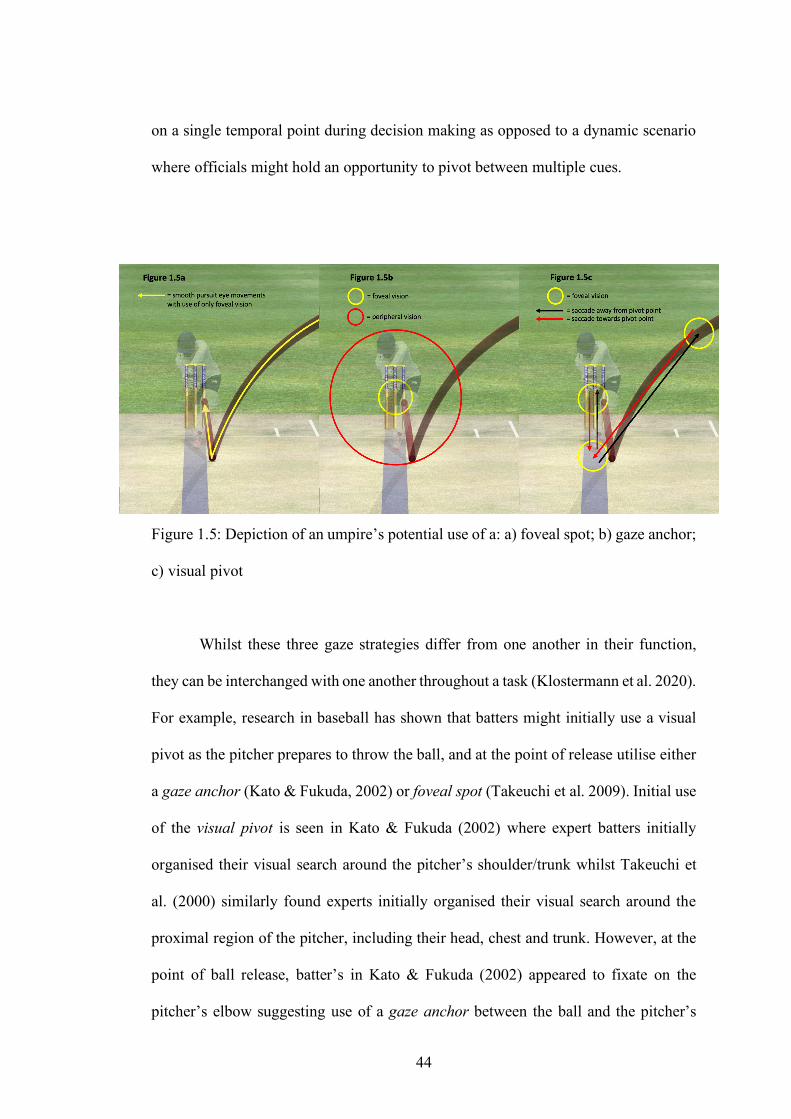
1.5 Depiction of an umpire’s potential use of a: a) foveal spot; b) gaze anchor; c)
visual pivot………………………………………………….………………………44
1.6 Visual representation of the expert performance approach (Ericsson & Smith,
1991)………………………………………………………………………...............55
2.1 Frames from test film with associated Hawk-Eye footage for: a) pitch, b)
pad, and c) stumps…………………………………………………………………..70
2.2 Final fixation locations: good length, full length, short length, stumps………...72
2.3 Radial error (cm) for expert and novice umpires, for pitch, impact and stumps
stumps……………………………………………………………………………….74
2.4 Final fixation locations (%) for experts and novices on correct and
incorrect trials for good, full length, short length, stumps and other locations……..77
3.1 Examples of a front foot ‘no ball’: a) legal delivery; b) ‘no ball’; and c)
‘no ball’……………………………………………………………………………..91
3.2 LBW decisions for: a) pitch; b) pad; and c) wickets. Panel ‘a’ includes
eye movement areas of interest: stumps, full length and good length. Panel ‘a’ also
includes labels for in-line, offside and legside……………………………………..93
3.3 Radial error (cm; SE) for pitch, pad and wickets in the task-switching and

4
control conditions………………………………………………………………..….96
3.4 Final fixation duration (ms; SE), pre-impact duration (ms) and post-
impact dwell time for successful and unsuccessful trials in the task-switching and
control conditions…………………………………………………………...............98
3.5 Final fixation location (%; SE) for successful and unsuccessful trials in the task-
switching and control conditions for stumps, full length, good length and other
locations....................................................................................................................100
4.1 ‘Empty’ Hawk-Eye grid where participants clicked on to submit their
‘pitch’, ‘pad’ and ‘wickets’ decisions……………………………………………..112
4.2 Step by step instructions for the QE and TT interventions……………………113
4.3 Radial error for pad in each group between the Pre-Test and Post-Test………117
4.4 Radial error for wickets in each group between the Pre-Test and Post-Test…..119
4.5 Radial error for wickets in each group between the Post-Test and Retention
Test……………………………………………………………………………...…121
5.1 An initial obstruction of a view of the bowler’s landing point………………..150
7.1: Gaze strategies used by elite sport officials and athletes……………………..177
7.2: Quiet Eye Training Studies……………………………………………………191

5
Abstract
Perceptual-cognitive skills have been shown to contribute towards elite
performance in multiple domains and sports, including cricket. However, research
examining these skills in cricket has predominantly focused on batters, with little
attention devoted to extensively exploring the factors that contribute towards expert
cricket umpiring. In this thesis the ‘expert performance approach’ proposed by
Ericsson & Smith (1991) was used to develop a series of studies that examined the
influence of perceptual-cognitive skills in leg before wicket (LBW) decisions made
by cricket umpires. In Chapter 2, eye movement data was collected from expert and
novice cricket umpires whilst they performed a simulated LBW decision making task.
In addition to making more accurate decisions, the expert umpires demonstrated a
tendency to anchor their gaze on the stumps, whereas the novices showcased a
preference to fixate on the pitch. In Chapter 3 a different sample of expert umpires
were required in one condition to make a ‘no-ball’ verdict prior to an LBW decision
and in another condition to exclusively make the LBW decision with no preceding
task. The ‘no-ball’ task aimed to engage the shifting function of the umpire’s working
memory, to better mirror match demands. The purpose of this Chapter was to examine
whether switching from the ‘no-ball’ task to the LBW task would negatively affect the
umpire’s decision-making performance in line with the ‘switch cost’ evidenced in
cognitive psychology literature. In corroboration with the switch-cost, umpires were
less accurate at determining where the ball bounced on the pitch when required to task-
switch. Also, in line with previous research, following the task-switch the umpires
were more likely to allocate their gaze towards ‘other locations’ compared to when
performing the LBW task exclusively on its own. Despite this, umpires still displayed
a tendency to anchor their gaze on the stumps in both conditions. Chapter 4 utilised
6
findings from Chapters 2 and 3, and involved the implementation of a Quiet Eye
training intervention in novice umpires with the aim of augmenting LBW decision
making. To compare the effectiveness of this intervention, novice umpires were
allocated to either a Quiet Eye Training, Technical Training or Control group. The
Quiet Eye intervention led to improved LBW performance across all components of
the task immediately following training, and these effects persisted in a one-week
retention test. Immediately after the intervention, the Technical Training group
reported improvements on determining where the ball would have travelled post ball-
pad impact however these effects were lost in a one-week retention test. The Control
group reported no changes in accuracy across all three experimental phases. With all
the experimental chapters considered, this thesis provides insights into the perceptual-
cognitive skills cricket umpires use to cope with the unique demands on LBW decision
making, and how these skills can be transferred to novice performers to expedite more
accurate decisions. These data have implications for improving decision making
throughout the cricketing pyramid, as well as theoretical implications for
understanding the role of visual attention in complex decision making tasks.
7
No portion of the work referred to in the thesis has been submitted in support of an
application for another degree or qualification of this or any other university or other
institute of learning.

8
Acknowledgements
First and foremost, I would like to thank my Director of Studies, Dr Joe Causer.
I have had the privilege of not only being supervised by Joe for the last four years of
this PhD, but have also been lucky enough to hold a ringside seat to observe an expert
in the field since beginning my undergraduate studies in 2014. Joe’s persistent support
during this programme leaves me indebted for his commitment to ensuring I develop
as a researcher. The assurances he has provided has been especially critical during this
pandemic which has threatened to severely disrupt many projects across the country,
however Joe did nothing but instil confidence that this programme would be
completed as planned. I would further like to express my gratitude to Dr Spencer
Hayes, Dr Robin Jackson and Dr Matt Watts and thank them for their continued
guidance and contribution of novel ideas towards this project. Specific thanks to Matt
Watts who willingly offered to let cricket balls travelling at 80mph consistently hit
him on the shins for 2 hours!
Next, I would like to convey my appreciation to Hugh Evans of the Merseyside
Cricket Umpires Association, and Colin Jennings of the Warwickshire Cricket League
for helping recruit umpires to take part in this project. Of the umpires whom I had the
pleasure of meeting, some officiated in modest forms of local league cricket, whilst
others adjudicated on matches including players considered to be amongst the greatest
to have played the game. Irrespective of the level they were operating, all those who
participated shared a common interest in bettering their own capabilities in addition to
furthering existing knowledge surrounding LBW decision making. I am also grateful
to the Marylebone Cricket Club and the staff at the Lord’s Cricket Ground Indoor
Cricket Centre who were kind enough to offer use of their facilities in 2018 which was
instrumental in helping develop the research design of each chapter. Thank you to Rob

9
Haines too who must now have viewed hundreds of LBW appeals for me over the last
three years whilst development of the chapter protocols took place during the pilot
testing phase.
Lastly, I would like to thank members of my family. Firstly, to my four
grandparents who achieved distinction in their respective fields and as a result set the
benchmark for future generations in my family to aspire to. Finally, to my parents.
This thesis and for that matter anything else that I am able to achieve in this lifetime
is a direct consequence of the opportunities my parents afforded, and continue to
afford me.

10
Chapter 1:
Review of Expertise, Perceptual-Cognitive Skill, and Sports Officiating
11
“The umpire at cricket is like the geyser in the bathroom; we cannot do without it,
yet we notice it only when it is out of order. The solemn truth is that the umpire is the
most important man on the field; he is like the conductor of an orchestra.”
(Neville Cardus, May 1934)
1.1 Umpiring
The abovementioned words were penned by Neville Cardus in the 1930’s,
however some 90 years later, the statement remains accurate. Whilst a number of
regulations within cricket have been amended and innovated over this period
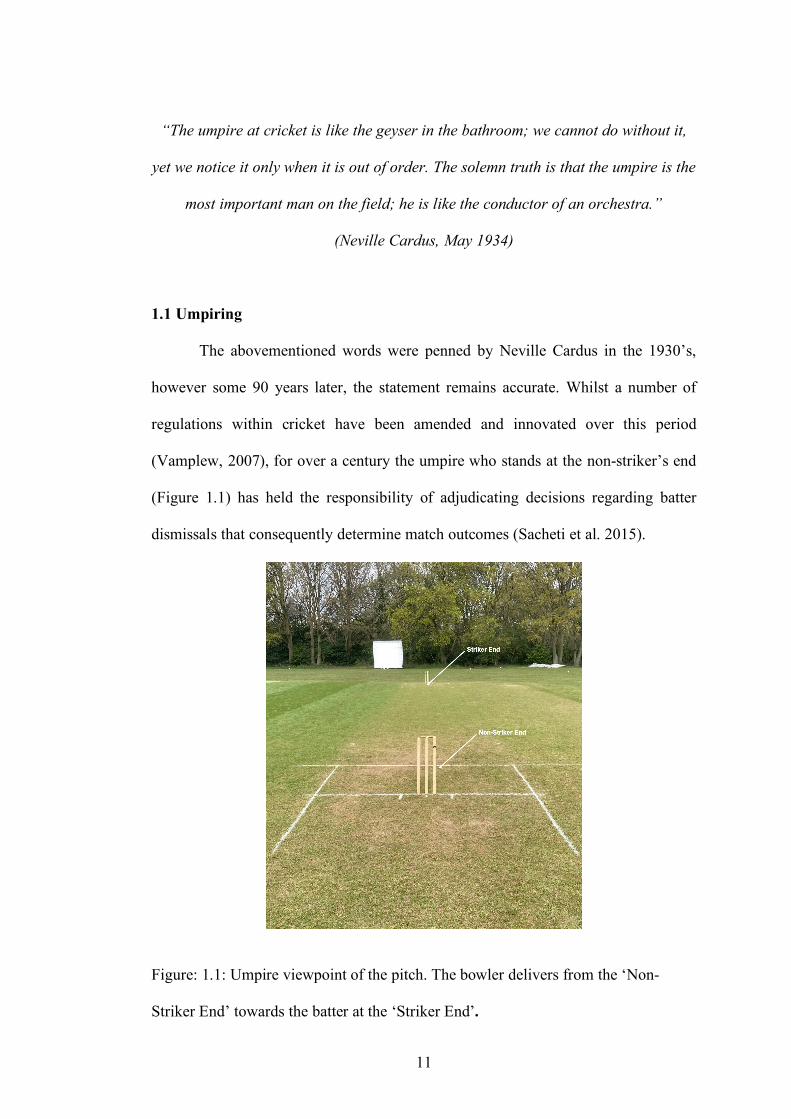
(Vamplew, 2007), for over a century the umpire who stands at the non-striker’s end
(Figure 1.1) has held the responsibility of adjudicating decisions regarding batter
dismissals that consequently determine match outcomes (Sacheti et al. 2015).
Figure: 1.1: Umpire viewpoint of the pitch. The bowler delivers from the ‘Non-
Striker End’ towards the batter at the ‘Striker End’.
12
Currently an appeal to dismiss a batter can be made via ten methods; caught,
bowled, leg before wicket, stumped, run out, timed out, hit wicket, obstructing the
field during play, handling the ball, and double hitting of the ball. Of these modes of
dismissals, none has consistently led to as much controversy and dispute as the leg
before wicket (LBW) (Chedzoy, 1997; Sancheti et al. 2015; Southgate et al. 2008).
LBW appeals occur when the ball impacts the batter on any part of their body (usually
leg pads) apart from the bat and hand(s) holding it (Craven, 1998). For a bowler to
dismiss a batter via LBW, the umpire must consider whether the delivery meets a
number of technicalities before reaching an out/not out decision (Crowe &
Middeldorp, 1996). However, Law 36 of the 2017 Marylebone Cricket Club (MCC)
laws of cricket states that before even considering an LBW appeal, an umpire must
determine the legality of the delivery, whereby part of the bowler’s shoe must land
behind the popping crease upon releasing the ball. Following this, for an LBW appeal
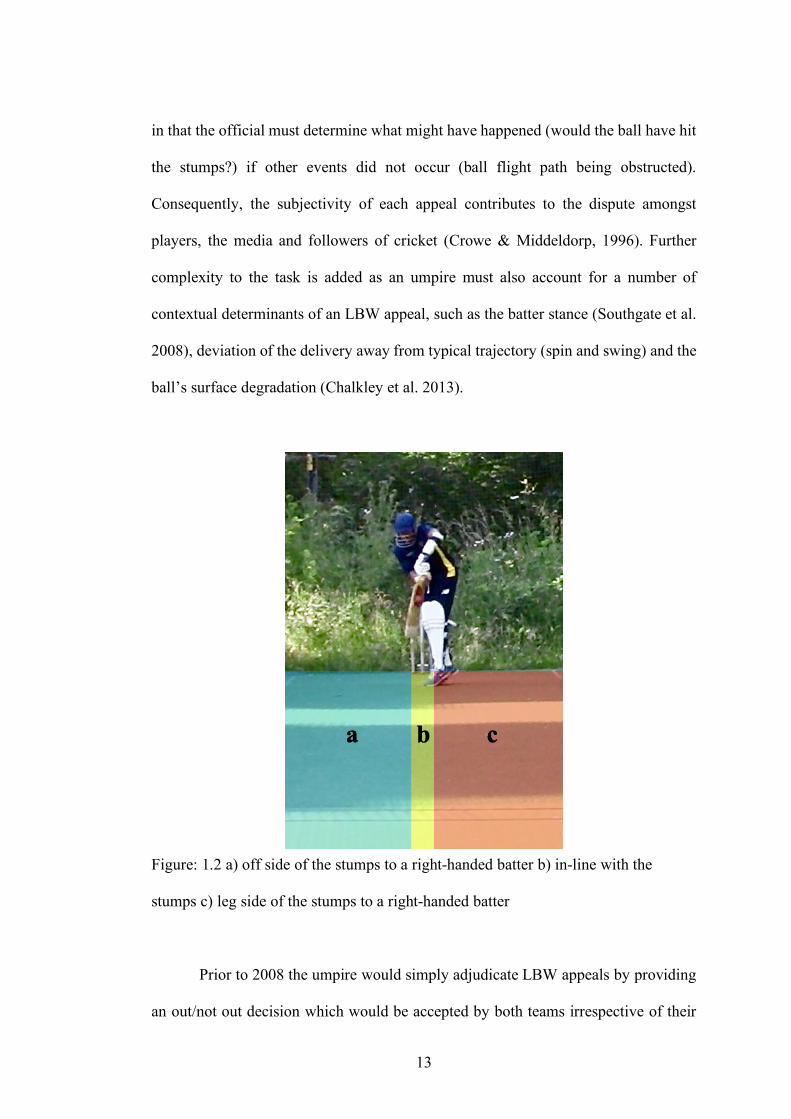
to be considered out, the ball must firstly pitch (bounce) in line or on the offside of the
stumps (Figure 1.2). If the ball pitches on the legside of the stumps then an umpire
must not deem the batter out under any circumstances (Figure 1.2). Law 36 provides
further technicalities surrounding where the ball strikes the batter in relation to the
stumps. Should the batter make a genuine attempt to hit the ball with the bat, then for
an umpire to consider giving them out the ball must strike them in front of one of the
stumps. Conversely, should the batter not attempt to hit the delivery, the umpire can
consider making an out decision even if they are struck by the ball outside the line of
off stump. Following the deliberation of these technicalities, the umpire must finally
arbitrate whether they believe the ball would have continued on its flight path to hit
the stumps had the obstruction with the batter not occurred (Southgate et al. 2008).
With this final rule considered, the LBW decision appears to be unique amongst sports
13
in that the official must determine what might have happened (would the ball have hit
the stumps?) if other events did not occur (ball flight path being obstructed).
Consequently, the subjectivity of each appeal contributes to the dispute amongst
players, the media and followers of cricket (Crowe & Middeldorp, 1996). Further
complexity to the task is added as an umpire must also account for a number of
contextual determinants of an LBW appeal, such as the batter stance (Southgate et al.
2008), deviation of the delivery away from typical trajectory (spin and swing) and the
ball’s surface degradation (Chalkley et al. 2013).
Figure: 1.2 a) off side of the stumps to a right-handed batter b) in-line with the
stumps c) leg side of the stumps to a right-handed batter
Prior to 2008 the umpire would simply adjudicate LBW appeals by providing
an out/not out decision which would be accepted by both teams irrespective of their
14
own opinions. However, the landscape of umpiring was to change forever in 2008 as
the International Cricket Council (ICC) introduced the Decision Review System
(DRS) into International Cricket. The DRS enables captains of either team to refer the
decisions made by the on-field umpires to the third umpire who has an array of replays
and technologies at their disposal to assess the accuracy of the original decision
(Borooah et al. 2016). Should there be sufficient evidence, the third umpire can
overturn the on-field umpire’s original decision in favour of the team who requested
the review (Borooah et al. 2016). Utilising statistics between the inception of DRS
(July 2008) and March 2017, ESPN Cricinfo analysed the reviews made in Test
Cricket (http://www.espn.co.uk/cricket/story/_/id/19835497/charles-davis-analyses-
use-drs-players-teams). It was found that approximately 74% of the reviews made by
players were for LBW appeals, with the overturn rate being at 22%. One such
technology at the third umpire’s disposal to assess LBW reviews is Hawk-Eye, a
Reconstructed Track Device which provides a 3D simulation of the ball’s flight path
had the obstruction not occurred (Collins, 2010). Hawk-Eye technology employs 6
cameras that feed images into a computer which enables the ball’s location to be
coordinated into a data point at every frame (Borooah, 2016). Based on the theory of
triangulation, Hawk-Eye then measures the angle between each data point to
ultimately create a 3D trajectory of the ball flight, whilst additionally helping
determine the deliveries’ speed, angle and deviation of the flight path (Duggal, 2014).
Whilst the benefits of Hawk-Eye are plentiful, Hawk-Eye is subject to statistical error
due to ‘gaps’ between each data point of each frame (Collins, 2010). Currently it is
estimated that the inaccuracy of Hawk-Eye is 55mm wide and thus, if any review
comes within this zone of the stumps and the on-field umpire’s call remains (Collins,
15
2010). Technology such as Hawk-Eye has inadvertently placed on-field umpires under
increasing scrutiny (Collins & Evans 2012).
As Neville Cardus highlighted, umpire’s decisions often garner attention only
at times of inaccurate judgement as opposed to the numerous instances where
successful verdicts are made. The increased use of technology which aimed to aid
umpire decision making has inadvertently led to poor decisions being further
scrutinised (Collins & Evans, 2012). In some instances, these inaccurate decisions
have led to umpires being labelled as inept and in extreme cases corrupt (Heffer,
2016). Whilst it would be easy to leap conclusions of unprofessionalism and ineptness
of umpires at the first sighting of an error in judgement, it must be emphasised that
these officials are often placed under acute time constraints in which to make these
decisions (Chalkley et al. 2013; Southgate et al. 2008). In some instances, the ball
(7.29cm) can travel at velocities up to 150kmh/93mph over 20m which serves them
approximately 543ms to process the visual information necessary to generate a
decision (Southgate et al. 2008). Despite these constraint’s, Adie et al. (2020) found
that elite cricket umpires are extremely accurate when making LBW decisions.
Examining 5578 LBW decisions in elite cricket between 2009-2016, umpires were
correct 98.08% of the time. Despite the overarching limitation that appeals were
retrospectively reviewed by the match referee subjectively without use of ball tracking
technology, it was clear that umpires are exceedingly accurate at making decisions in
response to LBW appeals. To help combat the enormous time constraints they are
faced with in order to make accurate decisions, it has been proposed expert umpires
employ specific visual behaviours to increase the likelihood of generating correct
decisions (Southgate et al. 2008). Whilst these visual skills have not been specifically
evidenced in expert cricket umpires, such behaviours have been evidenced to increase
16
decision making accuracy in a number of fast ball sports (Broadbent et al. 2015). Any
specialised visual skills that can be used to facilitate umpire decision making under
these immense time constraints must be explored in order to ensure justice prevails at
every level of the game, and that incorrect decisions which can affect player’s careers
and the outcome of matches (Craven, 1998) are minimised.
1.2 Visual System
It has been suggested that the primary purpose of the visual system is to enable
the construction of an ‘internal model’ of the external environment in order to guide
visually based thought and action (Milner & Goodale, 1995). Perhaps then, the
principal sensory system required for cricket umpiring is the visual system. Unlike
most sporting tasks, cricket umpiring has perceptual and cognitive elements, but not a
specific action outcome. Therefore, it is important to outline some of the background
theory relating to the differences between ‘vision for perception’ and ‘vision for
action’.
The visual system is responsible for converting electromagnetic waves from
the external environment into a series of synapses that carry visual information to
various regions of the brain for processing (Remington, 2011). The first cells found in
the visual pathway, known as photoreceptors, are responsible for the initial conversion
of light into a neuronal signal. Photoreceptors comprise of cones and rods; cones being
essential for high visual acuity and colour vision, whilst rods are responsible for
peripheral vision (Hubel, 1988). Around 4.6 million cones occupy the retina which
accounts for approximately 5% of the photoreceptors in both eyes (Lamb 2016). The
remaining 95% is comprised by over 85 million rods (Lamb 2016). The neuronal
signals in the photoreceptors are then transferred to the bipolar cell, then to the

17
amacrine cell and finally the ganglion cell before it leaves the retina (Remington,
2011). Upon exiting the retina, the signal travels via the optic nerve, to the optic
chiasm where information from each eye crosses to the alternate side of the brain,
before travelling into the lateral geniculate nucleus (LGN). From the LGN, the visual
information travels to the primary visual cortex located in the occipital lobe of the
brain, specifically in Brodmann area 17. From here, it has been suggested that visual
information is projected via two separate visual streams that can be distinguished on
both anatomical and functional grounds (Milner & Goodale, 1995).
In a series of lesion experiments on rhesus monkeys, results from Mishkin and
Ungerleider (1982) first established somewhat distinct cortical streams for processing
object features and their spatial positioning. Since then, a series of human studies have
found that like in rhesus monkeys, humans also possess two separate visual streams,
one for perceptual feature-based discrimination and the other for determining the
spatial positioning of objects within the environment to help guide visuo-motor
behaviours. Firstly, the ventral stream, which is projected from the visual cortex to the
inferior temporal cortex reportedly performs a critical role in providing an individual
with a comprehensive representation of the external world by enabling cognitive
operations such as identification and recognition of objects (Lee & Donkelaar, 2002;
Milner & Goodale, 2005; Valyear et al. 2006). Transformation of visual inputs into
these representations permit individuals to deliberate and contemplate about objects
and events in the real world (Milner & Goodale, 2008a). Conversely, the dorsal
stream, which is projected from the visual cortex to the posterior parietal cortex, is
reported to process spatial characteristics such as size, shape, disposition and
coordinates of objects to guide motor actions (Lee & Donkelaar, 2002; Milner &
Goodale, 2008a; Valyear et al. 2006). Therefore, the dorsal stream holds a critical role
18
in mediating actions such as reaching and grasping by constantly processing and
updating spatial information of an object in relation to other objects and the effector(s)
being used in the action (Milner & Goodale, 2008a). Evidence for the separate visual
streams has been evidenced in patients suffering from visual form agnosia and optic
ataxia (Milner & Goodale, 1995). Perhaps the most frequently studied patient with
visual form agnosia was patient D.F, a lady who was brain damaged due to accidental
carbon monoxide intoxication (James et al. 2003; Milner et al. 1991). In a number of
experiments, Milner et al. (1991) found that patient D.F maintained the ability to
anticipate and coordinate visually guided motor behaviours. Specifically, she was able
to insert both her hand and a card, into a 12.5cm x 3.8cm disk slot that was orientated
at 0°, 45°, 90° or 135°. However, patient D.F was incapable of making an accurate
perceptual judgement on the same task when required to express how she would
orientate her hand or the card verbally, nor by using tactile or visual feedback. Similar
findings were made by James et al. (2003) who additionally showed patient D.F
exhibited the expected neural activation in areas associated with the dorsal stream,
however a lack of activation of the lateral occipital cortex, a region attributed to the
ventral stream. Such results suggested patient D.F had lost visual form perception due
to a damaged ventral stream, whilst her visuomotor control remained due to an intact
dorsal stream.
Contrary to visual form agnosia, patients suffering from optic ataxia have been
shown to display impaired visuomotor control whereas their feature based
discrimination processes remain intact (Milner & Goodale, 1995). For example,
patients with optic ataxia who had parietal lesions in Perenin and Vighetto (1988)
performed a similar hand reaching task to that in Milner et al. (1991). Unlike patient
19
D.F, optic ataxia patients made several errors on this task suggesting damage to the
dorsal stream impaired their visuomotor ability.
Whilst the evidence is compelling for a dissociation between ‘vision for action’
and ‘vision for perception’ processing streams, Milner and Goodale (2008a) admitted
that lesion studies are somewhat imperfect due to damage very rarely being uniformly
localized in a specific region. Eysenck & Keane (2010) also further state that it is
difficult to make concrete predictions when testing this theory due to most visual tasks
requiring both visual streams to some degree. Nevertheless, they also stated that at the
time of writing the two-stream model remains the most influential theory to explain
visual processing and that no existing alternate theory was superior. (Milner &
Goodale, 2008a; Van Der Kamp et al. 2008; Abernethy & Mann, 2008).
Considering the dorsal stream functions primarily as a visuo-spatial processor,
numerous researchers have speculated on and studied its role in sporting activities. For
example, Sasada et al. (2015) found that college baseball players were less capable of
identifying the colour of a ball thrown at them than novice baseball players. The
authors suggested the expert’s utilised the dorsal stream to intercept the projectile at
the critical time point, and therefore were unable to report on its colour change
effectively due to reduced activation of the ventral stream. Milner & Goodale (2008b)
further suggest that the dorsal stream performs a critical role in sporting activities such
as fielding in cricket whereby it provides the performer with an unconscious
processing of visual information so that they can control the mechanics of their
movement in response to the trajectory of the ball. Based on the current evidence
within sport and additionally a commentary from Milner & Goodale themselves, the
dorsal stream has been offered as the principal visual system responsible for online
control of a motor action when intercepting a projectile. Whilst a motor component is
20
not a requisite of cricket umpiring, findings from Zachariou et al. (2014) highlight that
the dorsal stream also performs a role in identifying and differentiating the spatial
position of an object in relation to other objects (Zachariou et al. 2014). In the first
experiment of this study, using fMRI the researchers aimed to identify the contribution
of both visual streams in two distinct tasks. In one task, for each trial participants were
presented with two objects on either side of a screen, and were required to detect
whether they were identical or differed in shape. This task aimed to identify cortical
activity associated with detecting shape features. In the second task, participants were
presented the same objects on either side of a screen, but this time were required to
determine whether their spatial positionings were congruent or incongruent with each
other in relation to a central line. This task aimed to identify the cortical activity
associated with detecting object spatial characteristics in relation to other objects. In
line with the two streams theory, shape feature detection resulted in primary blood
oxygenation level dependent (BOLD) levels in the lateral occipital cortex located in
the occipital lobe and fusiform gyrus located in the temporal lobe, with both of these
regions forming parts of the ventral stream. Also in correspondence with the two
streams theory, detecting the spatial positioning of objects led to primary BOLD levels
in most anterior and posterior portions of the intraparietal sulcus located in the parietal
lobe, this region being part of the dorsal stream. However, shape detection also led to
non-primary, but significant, activity in regions associated with the dorsal stream
suggesting spatial processing also occurs during shape feature detection. However,
object spatial task performance did not result in increased BOLD levels in any ventral
stream regions. This asymmetry suggests that whilst some forms of feature detection
also rely on dorsal stream processes, the dorsal stream is solely responsible for
processing object locations with relation to other objects. Whilst most studies
21
examining the dorsal stream have focused on vision for action (usually grasping
movements) from an egocentric perspective, Zachariou et al. (2014) appeared to be
the first study to highlight that this visual system also contributes to identifying object
locations with relation to other objects from an allocentric perspective. This in turn
highlighted the dorsal stream’s function irrespective of whether the stimulus required
a coupled motor action or not. Despite these findings being novel, they correspond
with findings from animal studies where specific cells in the dorsal stream activate
when a monkey is required to either follow a moving object with their eyes or when
they are required to fixate on a stationary stimulus (Milner & Goodale, 1995). The
exclusivity of spatial discrimination in the dorsal stream likely suggests that cricket
umpiring relies predominantly on this visual system. Umpires decisions usually rely
on the umpire detecting the spatial positioning of the ball in relation to other objects
such as the stumps and the batter’s legs at critical moments including when it pitches
and where it strikes the bat and/or the batter’s body. This, in addition to other tasks,
such as determining the landing positioning of the bowler’s shoe in relation to the
crease, assessing whether the ball was caught by a fielder without it touching the
ground, and whether the fielders are positioned in placings that are in accordance with
the rules, all suggest the dorsal stream performs a principal role within cricket
umpiring decision making.
1.3 Working Memory
Throughout the history of cognitive psychology, it has been assumed that there
is a distinction between ‘short-term memory’ and ‘long term memory’ (Eysenck &
Keane, 2010). For example, in the context of cricket umpiring it would be assumed
there is a difference in the cognitive mechanisms involved in briefly remembering
22
specific events relating to an impending LBW appeal, and the longer-term recall of
the rules that must be applied to this appeal. Originally, one of the widely accepted
models of memory was a multi-store model proposed by Atkinson and Shiffrin (1968).
This model proposed memory comprising of separate stores; the sensory register,
short-term store and long-term store. The sensory register was described as the store
in which a stimulus is immediately registered via detection of the sensory organs
(Atkinson & Shiffrin, 1968). The information held in this sensory store was reported
to be extremely transient, and via a ‘selective scan’, overt attentional processes would
choose information to be fed into the short term-store (Atkinson & Shiffrin, 1968).
The ‘short-term store’ was reported to also hold information temporarily before
complete decay, with a capacity of 7±2 chunks of information (Miller, 1956). Whilst
residing in the short-term store, it was assumed that information would be transferred
to the long-term store via cognitive control processes (Atkinson & Shiffrin, 1968;
Jacoby & Bartz, 1972). Finally, information held in the long-term store was reported
to not face the same decay effects as the previous two components, and therefore
remained relatively permanent (Atkinson & Shiffrin, 1968).
Whilst the Atkinson & Shiffrin model was extremely dominant during the
period that it was proposed, limitations especially relating to the proposed short-term
store were exposed (Baddeley, 2012). Firstly, the model suggested that as long as
information reached the short-term store, it would eventually be transferred to the
long-term store, an assumption which has been refuted (Baddeley, 2012). The
oversimplified nature of the model perhaps also unreasonably implied both short and
long-term stores operate in a uniform way (Eysenck & Keane, 2010). Thirdly, should
the short-term store exist as a gateway to the long-term store, then it would be expected
that any impairments to short-term memory would also debilitate long-term memory

23
processes. However, lesion studies have since rejected this possibility as well
(Baddeley, 2012). Finally, it was suggested that the short-term store played an
imperative role in cognition, thus suggesting impairments to this store would lead to
intellectual deficits, however again evidence contradicted this idea (Baddeley, 2012).
To address the issues of the multi-store model, Baddeley & Hitch (1974)
proposed the ground-breaking model of ‘working memory’ which surpassed all other
ideas, and to date remains the dominant theory of attention, cognition and temporary
storage of information. This model is comprised of 4 components, with the
‘phonological loop’, ‘visuo-spatial sketchpad’, ‘central executive’ appearing in the
original model (Baddeley & Hitch, 1974), before a further component termed the
‘episodic buffer’ was added 26 years later (Baddeley, 2000) (see Figure 1.3).
Importantly, this model was perhaps the first to split attentional control processes from
temporary information storage.
Figure 1.3: Model of working memory adapted from Baddeley (2000)
24
The phonological loop has been proposed as the component which temporarily
holds information in a speech-based form via vocal or subvocal rehearsal (Baddeley,
2012; Eysenck & Keane, 2010). Two phenomena gave support to the phonological
loop; the ‘phonological similarity effect’ and the ‘word length effect’ (Baddeley,
2012). The phonological similarity effect is where serial recall performance of a list
of words is poorer when they are phonologically similar (Baddeley, 1998). The word
length effect is where longer words result in a lower memory span due to increased
time for decay, therefore rehearsal of each word is essential to revive and maintain
temporary verbal storage in the phonological loop. The visuo-spatial sketchpad is
where visual information, such as visual appearance of an object, and spatial
information, such as the location of an object, is temporarily maintained (Baddeley,
1998). Whilst less is known about this component compared to the phonological loop,
it was apparent that separate processes within the visuo-spatial sketchpad exist for the
processing of visual and spatial information. However, Baddeley (1998) pointed out
further research must examine possible components involved in temporary motor and
kinaesthetic informational storage too. Nevertheless, neuroimaging studies have
provided support for the distinction between transient phonological information
storage and spatial information storage (see Smith et al. 1996).
Whilst the two slave systems, the phonological loop and visuo-spatial
sketchpad, store separate information from one another, they are controlled
simultaneously by the central executive, perhaps the most important component of the
Baddeley & Hitch (1974) model. The central executive’s principal role is to determine
the attentional control of action. Whilst it is assumed to possess no storage capacity in
itself, it is capable of dictating attentional focus and storage within the two slave-
systems (Baddeley, 2012). Therefore, in each instance an individual engages in

25
complex cognitive activity the central executive is called upon. Whilst there has been
lengthy debate as to the specific roles of the central executive, Miyake et al. (2000)
found three widely accepted ‘executive functions’; inhibition, shifting and updating.
Firstly, the inhibition function refers to an individual being able, when required, to
prevent an automatic response to a stimulus. Evidence for this function has been seen
using the Stroop test (Eysecnk & Keane, 2010) and antisaccade task (Nieuwenhuis et
al. (2004). The shifting function enables the ability to shift attention between multiple
tasks, a process called ‘task-switching’. This executive function is utilised in human
behaviour frequently on a daily basis, and has been tested using ‘task-switching
paradigms’ (Vandierendonck et al. 2010) (this executive function will be discussed in
further detail in the ‘Task-switching’ section). Finally, the updating function involves,
as Morris & Jones (1990) quotes, ‘the act of modifying the current status of a
representation of schema in memory to accommodate new input’. The importance of
this function is that as opposed to simply permitting temporary storage of new
information, it allows manipulation and cognitive processing of it so an individual can
keep track of no longer relevant information (Miyake, 2000).
At the start of the century, it was argued that a further component was required
to account for instances where phonological and visuo-spatial information originate
from a single source (Baddeley, 2012). Therefore, Baddeley (2000) included the
‘episodic buffer’ which can be considered a fractionation of the central executive
(Furley & Memmert, 2010). The principal role of the episodic buffer is to retrieve
information from both slave systems which differentiate in code, and create cognitive
representations in the form of conscious awareness that permits the central executive
to reflect, manipulate and modify it (Baddeley, 2000). This enables an individual to
26
comprehend a coherent and complex structure that resembles a ‘scene’ or ‘episode’
(Eysenck & Keane, 2010).
Perhaps the biggest development of the working memory model created by
Baddeley & Hitch (1974) was not related simply to transient storage, but that it
provided an explanation as to how individuals were capable of allocating attention to
different sources of information and how they cognitively process and manipulate it.
With respect to the Baddeley and Hitch’s model, it is possible working memory
performs a principal role in umpire decision making. For example, the umpire must
temporarily hold spatial information surrounding the ball and its relative position to
the batter, pitch, stumps, boundary and ground, as these variables are essential in
decisions being generated such as out/not out, boundary/no boundary and runs/byes.
With this considered, the visuo-spatial sketchpad appears to be the most suitable slave-
system for storing such information (Baars & Gage, 2010). Baddeley (1997) further
highlights the visuo-spatial sketchpad is essential in helping an individual hold spatial
information of an object from an ego-centric perspective, this perhaps being useful
when one considers that umpire’s position themselves centrally to the batter’s middle
stump. Whilst important information related to umpiring might be held in the visuo-
spatial sketchpad, there is a possibility that the central executive is required in the
processing of the information. Firstly, it has been proposed that working memory is
important in attentional allocation. Should a target be pre-activated in working
memory, then this object will receive prioritised focus of attention should it appear in
the visual field (Furley & Memmert, 2013; Furley & Wood, 2016). In the context of
cricket, should the appearance of the ball be activated by the central executive prior to
the delivery, then this in turn might promote covert and overt attention being directed
towards critical cues related to the projectile. In addition to attention, the executive
27
functions might also hold a role in cricket umpiring. Whilst such statements remain
speculative until tested, the inhibition function might help prevent attention being
directed towards stimuli that are unrelated to the delivery, whereas the updating
function might be necessary when umpires are officiating on a match held in variable
environmental conditions. With respect to switching attention from adjudicating the
legality of the delivery to processing spatial information related to the delivery, it is
perhaps logical to speculate use of the shifting function (refer to task-switching section
for a more extensive examination of this function and its role in umpiring). Whilst
assessments of expertise advantages in central executive functioning have provided
mixed results (Furley & Memmert, 2015; Vestberg et al. 2012), it has been suggested
that superior performance in certain tasks might be predicted by the way in which
working memory and long-term memory interact with one another. Several years after
the introduction of the original working memory, it was proposed by Ericsson and
Kintsch (1995) that individuals with expertise within a specific domain are capable of
rapidly encoding task-relevant information and circumventing the limited capacity of
the working memory. This ability was attributed to the development of long-term
working memory (LT-WM). Due to extensive deliberate practice, it has been
suggested LT-WM provides experts with the ability to rapidly store task-relevant
information within their long-term memory. Additionally, LT-WM reportedly enables
the individual to directly retrieve task-relevant information temporarily into their
working memory once they encounter a specific retrieval cue (Ericsson & Kintsch,
1995; Gobet, 2000). Storage of domain specific information in the LT-WM provides
experts with the benefit of being able to retrieve unlimited amounts of information
upon stimulation from the retrieval cue, whereas normal information held in the
working memory is irretrievable once lost (Ericsson & Kintsch, 1995). Therefore,

28
experts hold direct access to domain-relevant information, this seemingly accounting
for the perception that they possess increased capacity for working memory functions
(Gobet, 2000).
It has been proposed that LT-WM offers experts an advantage over lesser
skilled contemporaries in complex domains, where they are capable of generating
faster and more accurate decisions due to rapid encoding of task relevant sensory
information via their developed retrieval structures. As a consequence, this reportedly
enables circumvention of the typical limitations of working memory and long-term
memory, therefore leading to faster decisions of higher quality (Gredin et al. (2020).
For example, in Experiment 1A of Belling et al. (2015), skilled and lesser skilled
football players were required to view footage of 24 temporally occluded match
simulations and in one condition assume the role of the attacking player (intervention
phase) and in the other condition to assume the role of the defender. In both conditions,
participants were required to generate as many options that the attacking player might
and should take. Findings from this experiment showed the skilled players generated
more task-relevant options in both assessment and intervention phases, suggesting
with significantly more practice they had more elaborate task relevant retrieval
structures which they could all upon into their working memory. Recent corroboration
of this finding can be seen in Roca et al (2021) who examined the verbal reports of
creative and less creative footballers who viewed 20 trials of professional German
football matches. Participants were required to perform a similar task to that of the
intervention phase in Belling et al. (2015), however at the point of occlusion the
participants physically executed the action they deemed most appropriate by playing
a ball situated in front of them. Following this they offered a verbal report of their
thoughts that led to this response. Finally, for each trial the participant was shown the
29
final frame of the video and were required to generate as many creative solutions as
possible for the scenario in 45 seconds. Compared to less creative players, the more
creative players generated a greater number of possible decisions whilst they executed
their selected action. Further, they were also able to offer more substantial
retrospective explanations as to the options the attacking player could have taken,
suggesting a greater repertoire of solutions being stored in their LT-WM.
These findings also appear to extend to golf, as Shaw et al. (2021) examined
the thought processes of skilled and lesser skilled golfers as they walked to the green
and as they ‘read’ the putt. Whilst walking to the green, the lesser skilled participants
verbalized more planning statements related to the putt than the skilled participants.
The authors of this study suggested that the skilled players likely deemed this
information less relevant to task outcome due to the distance from the putting green.
However, in support of the idea that LT-WM contributes to expertise, the skilled
golfers verbally reported more statements related to the trajectory they would aim to
hit the putt, whereas the lesser skilled players more often verbalised information
related to the mechanics of striking the ball. Taken together, these studies provide an
insight into the utility of LT-WM in sporting domains, and how it might contribute to
better and more efficient performance. These findings further correspond with
Ericsson & Kitsch (1995) who suggest skilled performers must be able to anticipate
future demands by refining the cues which enable retrieval of the desired information
into the working memory. Whilst Baddeley (2012) agreed with the notion of LT-WM,
he suggested that it should be regarded as an interaction between the working memory
and long-term memory stores as opposed to LT-WM being treated as a separate entity.
Nevertheless, working memory and specifically the executive functions of the central
executive as well as potential developed LT-WM structures, might possess a principal
30
role in the performance of cricket umpiring, a task in which the officials must hold
and process numerous information sources simultaneously.
1.4 Task Switching
In human behaviour, there is a demand for individuals to attend to multiple
tasks over a short period of time (Kiesel et al. 2010; Monsell, 2003), for example
switching between reading a newspaper and answering a telephone call
(Vandierendonck et al. 2010). Switching between tasks is also an essential part of
cricket umpiring, in which during a delivery the official must switch from determining
the spatial positioning of the bowler’s landing shoe, to perceptual judgments about the
ball flight trajectory and subsequent impact with the bat or pad (Chedzoy, 1997).
Human behaviour is reportedly largely able to cope with the demands of ‘task
switching’ due to the shifting function of the central executive described in Baddeley’s
working memory model (Eysenck et al. 2007). This shifting function permits
individuals to switch back and forth between distinct task sets. Task-sets are deemed
distinct from one another when they possess exclusive task-specific properties such as
perceptual encoding, memory retrieval, response selection or response execution
(Schneider & Logan 2007). Whilst the shifting function of the central executive
enables the cognitive processing of a succession of various task sets, laboratory studies
within the field of cognitive psychology have established that there are limitations to
the flexibility of this (Elchlepp et al. 2017). Specifically, research has shown that upon
switching to a second task set, an individual is prone to making more errors coupled
with a slower response time (RT) (Monsell, 2003; Vandierendock et al. 2010). This
effect has been termed the switch cost. Interestingly, the switch cost is not exhibited

31
when a task is performed in isolation or when an individual switches between task sets
that possess similar configurations (Monsell, 2003).
To examine the functions of the switch cost, Jersild (1927) was the first to
develop what is now termed the ‘switch cost paradigm’ which involves performing a
series of task-sets that either alternate or remain the same within a testing block.
Usually when performing in a task-switch block, both tasks are executed one after
another in quick succession (Pashler, 2000). The purpose of the methodology is to
examine behavioural and sometimes neurological correlates of task switching
compared to non-switching (Monsell, 2003). Generally within studies that employ
such methodology, the participants display ‘switch cost’ effects in task-switching
blocks where they often perform the second task slower and with more errors
(Arrington & Logan, 2004; Elchlepp et al. 2017; Rubinstein et al. 2001). To examine
the effect that preparation for a task-switch has on the switch cost, these methodologies
often manipulate the duration between offset of the first task-set and onset of the
second task-set, this being termed the ‘response-stimulus-interval’ (RSI). Another
method to examine preparatory effects of the switch cost involves manipulation of the
‘cue-stimulus-interval’ (CSI). This is specifically the interval between the participant
being instructed as to what the secondary task will be and the commencement of this
task. It has been consistently found that increasing either RSI and/or CSI periods leads
to a reduction in switch cost errors and RT, but fails to completely eliminate them
(Monsell, 2003). The switch cost in this instance has been termed the ‘residual switch
cost’.
To explain the mechanisms underlying the switch cost, two principal theories
have been proposed; the interference view and the reconfiguration view.
32
The interference view, proposed by Allport et al. (1994), suggests ‘task-set
inertia’ occurs where activation of the previous task-set interferes with the activation
of the task-set required for the second task. Therefore to overcome the activation of
the first task-set, the inhibition function of the central executive is required, and this
has been suggested to account for the switch-cost (Allport et al. 1994). This theory
also provides an explanation for preparation reducing the switch-cost, as it suggests
an increased RSI and CSI period provides an individual with sufficient time to
partially inhibit activation of the first task-set. In support of this theory, Allport et al.
(1994) found that in contrast to task-switching from easy to a difficult tasks, the switch
cost was significantly greater when individuals switched from a harder task to an
easier one. It was suggested that this asymmetric switch cost was caused by individuals
being required to use additional inhibitory processes to overcome the interference of
the more complex task-set prior to activation of the easier task-set. Some neurological
evidence also exists for this theory (Evans et al. 2015). The two tasks in this study
both involved presenting participants with a word, and required them to either recall
the word (memory task) or to discriminate the location that it appeared on the display
(perceptual task). Upon switching to the perceptual task, event-related potentials
(ERPs) that were active during the memory task initially remained active after
switching to the perceptual task. These task-irrelevant ERPs also correlated with the
switch cost. Carryover of the ERPs upon the task-switch were deemed a result of
executive processes inhibiting the memory task-set before enabling the switch to the
perceptual task-set.
The commonly cited alternative theory, the reconfiguration view, suggests that
upon switching task-sets, executive processes are required to reconfigure the new task-
set and/or retrieve it from the long term-memory (Monsell, 2003; Vandierendonck et
33
al. 2010). This theory proposes the switch cost reflects the time required to reconfigure
the new-task set, hence why preparation reduces the RT and error. Further, when an
individual performs the same task repeatedly there is supposedly no necessity for
reconfiguration of a new task-set and consequently, switch costs are not exhibited.
Task-set reconfiguration/retrieval processes reportedly take place in two separate
processes (Kiesel et al. 2010). Upon completion of the initial task, an endogenous
component of reconfiguration occurs prior to the onset of the second task. This
involves goal shifting where declarative memory deletes the previous goal and
replaces it with the goal of completing the second task. Upon commencement of the
second task, the exogeneous component reconfiguration takes place. During this stage,
rule activation of the second task activates via procedural memory. As the exogenous
component can only occur upon commencement of the second task, it is suggested the
residual switch cost occurs as no period of preparation can fully enable
reconfiguration. Whilst this theory is widely accepted as a possible mechanism,
research which has supported its predictions might also be explained by the
interference view (Vandierendonck et al. 2010). This is because the studies which
appear to support the reconfiguration view, come from results which find that
increased preparatory periods (Arrington & Logan, 2004) result in reduced switch
costs. However, whilst in theory increased preparatory periods could provide time for
endogenous reconfiguration processes to take place, it could also result in increased
periods of inhibition and decay of the previous task-set in support the interreference
view (Vandierendonck et al. 2010). Nevertheless, both theories find support from both
behavioural studies (see Vandierendonck et al. 2010), and neurological studies (see
Sakai, 2008).

34
Over the last 7 years, another potential but neglected contributor towards the
switch cost has garnered increased interest. Evidence has highlighted that concurrently
during task-set interference and/or reconfiguration, the task-switch might also cause
an impairment in visual attention re-allocation towards the critical cue(s) on the second
task (Longman et al. 2013; Longman et al. 2014; Longman et al. 2017). In Longman
et al. (2013), whilst wearing eye tracking glasses, participants were subjected to a task-
switching paradigm where they either had to recognise one of four different faces
presented on the display OR determine which of four letters (G, C, O, Q) were located
on the forehead of the face. Two CSI preparation periods were included (200ms and
800ms), and the RSI was kept constant at 1650ms between the initial task’s offset and
secondary task’s onset. On the task-switch trials, attention was less well oriented
towards the task-relevant stimulus from the onset of the secondary task. This attention
misorientation lasted around 400-500ms. The authors therefore suggested that task-
switching causes an ‘attentional inertia’ where attentional settings also require
reactivation towards the second task in a similar manner to task-set reconfiguration.
As a consequence, they suggested individuals were more likely to allocate attention
towards the previous task. In line with the residual switch-cost, when the CSI period
was increased, the likelihood of misorientation of visual attention towards irrelevant
cues was diminished but not completely eliminated. However, the researchers
conceded that with only two tasks, they were unable to confidently conclude that
attentional settings were not fully reconfigured to the second task from the first task,
and that distraction was also a possibility.
To address this, in two experiments the researchers used a task-switching
paradigm but with three distinct tasks (Longman et al. 2014). In experiment one,
participants were presented with three numbers (between 2 and 9) located on each

35
point of an equilateral triangle. The three tasks involved determining if the number
they were instructed to fixate on was; odd/even, higher than 5/less than 6, or whether
it was an inner (4, 5, 6, 7) or outer (2, 3, 8, 9) number. Employing three tasks allowed
a task-switch sequence of ABCABC compared to the 2013 study which only used an
ABAB sequence. This enabled the researchers to examine whether task-switching
would cause attention to be directed towards the previously relevant but now irrelevant
task in support of attentional inertia, or whether attention would be directed to both
irrelevant tasks equally. A lettered cue signalled to participants in the task-switching
group which number to attend to and which task, whilst a control group were cued on
the location of the number they should attend to. CSI preparation times were 120ms,
620ms, 1020ms and 1420ms and were kept constant between blocks of 72 trials. In
addition to the widely reported switch-costs, in line with attentional inertia the task-
switching participants were more likely to allocate their visual attention to the
previously relevant but now irrelevant task. Like the 2013 study, preparation helped
reduce but not eliminate attentional inertia. These results supported the idea that in
addition to task-related components, attentional parameters must also be reset from
the perceptual attributes of the initial task to that of the next task. Interestingly, the
control group who only shifted attention between different locations also appeared to
show a tendency to allocate attention towards the irrelevant tasks. This interesting
result led to the conclusion that in addition to attentional parameters, the oculomotor
system is also required to reset when attention is shifted between various locations.
However, this effect was eliminated when preparation times afforded between the cue
and the task were over a second.
In 2017, the same research group aimed to examine whether the attentional
inertia could be eliminated when participants self-paced the task-switch (Longman et
36
al. 2017). This methodology contrasted traditional task-switching paradigms where
experimenters typically manipulate the CSI time period. Utilising the same task as
Longman et al. (2014), it was found that with self-paced long preparation times
between the task-switch, attentional inertia was eliminated, however switch costs
remained. Whilst the attentional inertia was not evident, preparation did not eradicate
the tendency to fixate on task irrelevant cues during the task-switch. Importantly, the
researchers suggested that the task-switch might lead to an initial weak reconfiguration
of attentional settings towards the second task regardless of the previous task set’s
influence. With respect to the reconfiguration view then, this attentional impairment
might occur due to similar processes occurring like in the exogenous component of
task-set reconfiguration.
Whilst laboratory-based task-switching experiments provide an elegant
methodology of examining the cognitive processes that occur during task-switching,
they do not indicate whether switch costs and attentional impairments debilitate
performance of tasks performed in the real world. Whilst it can be expected that the
switch cost and attentional misallocation would not noticeably affect most behaviours,
cricket umpiring might prove to be different. Cricket umpires are successively
required to perform a number of perceptual tasks which can be considered to hold
distinct task-sets. When considering the definition of a ‘task-set’ outlined by
Schneider & Logan (2007), the front-foot no ball and LBW task likely possess a
number of separate processes that equate to them forming separate task-sets. For
example, both tasks possess separate perceptual-encoding processes as the no ball-
task’s primary stimulus is the bowler’s shoe, whereas the LBW appeal’s primary
stimulus is perhaps the ball itself. With regards to response selection, the front-foot no
ball requires a decision as to the bowler’s vertical foot placement in relation to the
37
crease, whereas the LBW task requires a response related to the ball’s radial spatial
positioning in relation to multiple environmental sources such as the pitch, stumps and
batter. As these two tasks must be performed whilst under extreme time constraints, it
is a possibility that the switch-cost might lead to consequences in their decision
making. In the instance of an LBW appeal, an umpire is required to perform a series
of tasks in rapid time (Chedzoy, 1997). According to Law 36 of the 2017 Marylebone
Cricket Club (MCC) laws of cricket, an umpire is required to determine the legality
of the delivery by determining if any part of the bowler’s shoe is grounded behind the
popping crease and inside the return crease (Figure 1.4ab). Next, they must determine
whether the ball ‘pitched’ in line, offside or legside of the stumps (Figure 1.2) before
determining the location it struck the batter’s pad in relation to the stumps, before
finally being required to extrapolate where the ball would have travelled had the
batter’s pad not obstructed the ball. These decisions must be made whilst the ball
travels around 20 metres at sometimes speeds over 90mph, thus, providing the umpire
with approximately 0.5s of visual information to decide (Chalkley et al. 2013). Whilst
it is unlikely that task-switching would see an umpire re-fixating on the crease like
that of attentional inertia, following initial adjudication of the front foot no ball, it is
possible that any attentional impairments like those seen in Longman et al. (2017)
might prove to be costly to LBW decision accuracy.
To date, only one study has examined whether the front foot no ball task affects
LBW decision making (Southgate et al. 2008). In this study, cricket umpires were
required to determine where a series of deliveries pitched with respect to the stumps.
However, prior to this, one condition required umpires to perform the front foot no
ball in task and in a second condition they were required to perform a back foot no
ball task (similar to the front foot no ball but examination of the position of the non-
38
striding leg). In the final condition umpires only determined where the ball pitched.
Interestingly when required to switch from making a no ball decision, umpires made
significantly more errors when assessing where the ball pitched compared to when
they performed this task in isolation. These results might provide some evidence that
a switch-cost occurs during cricket umpiring. However due to lack of eye tracking
technology the researchers were unable to examine whether task-switching also
rendered attentional misallocation. Results from Southgate et al. (2008) provide some
interesting questions related to the task-switching domain. Firstly, it would be of
interest to understand whether task-switching leads to a switch-cost across all three
LBW components or whether it solely affects the ‘pitch’ decision. Further, as
Southgate et al. (2008) highlight, umpires require a quick and accurate re-fixation from
the crease to areas related to the batter. Consequently, it would be of worth to examine
whether task-switching effects the attentional allocation of umpires (Longman et al.
2017).

39
Figure 1.4a: Legal delivery Figure 1.4b: Illegal delivery (no ball)
1.5 Gaze Strategies: Foveal Spot, Visual Pivot, Gaze Anchor
In recent times, research has highlighted the importance of both foveal and
peripheral vision in sport, and how they complement one another to detect and process
visual information from multiple sources in quick succession (Klostermann et al.
2020; Vater et al. 2019). It has come to light that both overt attentional processes,
where the locus of attention is directed towards foveal vision, alternates with covert
attentional processes where the locus of attention is directed towards the periphery of
the retina, to enhance information pickup from the whole field of view (Klostermann
et al. 2020). Use of peripheral vision at the expense of excessive eye saccades has been
proposed as an efficient strategy to prevent informational suppression (Klostermann

40
et al. 2020; Vater et al. 2017; Vater et al. 2019). In a review, Vater et al. (2019)
outlined 3 visual strategies which utilise a combination of foveal and peripheral vision
to prevent these excessive saccades. These 3 strategies were: the foveal spot, gaze
anchor and visual pivot (see Appendix 1).
Firstly, the foveal spot was proposed as a stable gaze strategy by which the
individual fixates their central vision towards an information source that requires a
high level of spatial acuity. Use of what appears to be a foveal spot has been exhibited
in elite football referees when making foul assessments (Spitz et al. 2016). Spitz et al.
(2016) compared the visual behaviours of 20 elite and 19 sub-elite referees during
open play and corner foul situations. Whilst no performance differences were
exhibited, during open play fouls the elite referees fixated significantly more on the
contact zones of the attacking player compared to the sub-elite referees. During corner
situations, both groups fixated significantly more on contact zones, however the elite
referees made more accurate foul assessments. The foveal spot was perhaps utilised to
process the highly important spatial information relating to regions on the attacking
player where infringements might take place. Use of the foveal spot in officiating
appears to be of use where a decision is made in response to a single information
source as foveal vision is highly attuned to processing spatial information with a high
visual acuity. Conversely, peripheral regions of the retina hold a higher level of motion
sensitivity due to greater eccentricity and consequently processes information with
lower acuity (Klostermann et al. 2020).
The second stable gaze behaviour described by Vater et al. (2019) termed, the
gaze anchor, involves an individual directing their central vision between multiple
information sources so that they can all be processed via covert attentional processes
simultaneously. Often, this strategy will involve stabilizing gaze in a free space
41
proximal to a number of cues that require processing in order to prevent information
suppression that would occur should the individual saccade to these multiple sources.
Therefore, unlike the foveal spot which relies on use of a single attentional spotlight,
the gaze anchor predominantly employs peripheral vision to deploy several attentional
spotlights on regions surrounding central vision. Evidence for this strategy has been
displayed in elite officials such as rugby union referees (Moore et al. 2019), assistant
football referees (Schnyder et al. 2017) and gymnastics judges (Pizzera et al. 2018),
as well as elite athletes from combat sports (Hausegger et al. 2019; Piras et al. 2014).
For example, Moore et al. (2019) examined the gaze behaviours of 9 elite rugby
referees, 9 trainee rugby referees and 9 rugby players (no refereeing experience).
Participants were required to view 10 video projected scrum situations, and make one
of four decisions. In addition to making more accurate decisions, the elite and trainee
referees fixated on central pack regions significantly more than the player group
during the critical moment of the scrum. Conversely, the non-referees directed their
visual attention more towards outer and non-pack locations. Whilst at the point of
writing the authors described this expert gaze behaviour as a visual pivot, it actually
appears to fall under the criteria of a gaze anchor. It was suggested this strategy was
an effective way of the referees processing cues related to the front rows, binds and
contact points concurrently. Schnyder et al. (2017) found that expert and near-expert
assistant referees in football were more likely to anchor their gaze on the ‘offside line’,
perhaps so peripheral vision could be used to monitor critical information surrounding
the passer and attacker simultaneously. Interestingly, both groups in this study were
more successful at calling offsides when implementing this strategy as opposed to
directing foveal vision towards the attacker, defender, passer or the ball, thus
endorsing use of the gaze anchor in such tasks. Despite use of a similar strategy, the
42
expert assistant referees still made significantly more accurate decisions than the near-
experts, suggesting an enhanced ability to utilise peripheral information. The gaze
anchor also appears to be of use to some elite athletes, as Piras et al. (2014) showed
that expert judo fighters fixated significantly more on the lapel of their opponent
compared to areas such as the jacket skirt, sleeve and hands. Interestingly, the region
where a performer orientates their gaze anchor also depends on the task relevant
information that requires processing. Hausegger et al. (2019) found that Qwan Ki Do
fighters, who can be struck by both fist and foot strikes, anchor their gaze towards
their opponent’s head whereas Korean Tae Kwon Do fighters, who can be struck
solely by foot strikes, anchor their gaze on the opponent’s upper torso. This suggests
whilst the gaze anchor is an effective method of processing various streams of
information concurrently, task context dictates the location it must be positioned to
enable optimal cue pickup.
The final visual strategy described by Vater et al. (2019) is termed, the visual
pivot. Similarly, to the gaze anchor, the visual pivot involves a performer anchoring
their gaze on a central cue, and using peripheral vision covertly to monitor various
streams of information. However, this strategy differs from the gaze anchor in that
once salient information is detected covertly via the periphery, an overt saccade
transfers gaze to its source so that it can be processed with high visual acuity via foveal
vision. Following this, a saccade back to the pivot point occurs so that peripheral
vision can be used to detect the next optimal target to fixate on. As gaze is only
transferred towards salient cues, unnecessary saccades to search for areas of interest
are therefore prevented. Klostermann et al. (2020) suggests that this strategy is
necessary when spatially distributed cues all require accurate visual processing of high
acuity. Use of this strategy might explain as to why sporting expertise is commonly
43
typified by fewer fixations of longer durations (Williams et al. 2011). Perhaps the first
study to have identified use of the visual pivot was conducted by Ripoll et al. (1995)
who used a video based French boxing task in a sample of 6 expert boxers, 6
intermediate boxers and 6 novices. As well as making significantly more accurate
decisions in complex conditions, the experts appeared to utilise an organised visual
search strategy around their opponent’s head where saccades were used to transfer
gaze to and from various regions of the opponent’s body. Whilst intermediate fighters
also looked at their opponent’s head, they also fixated more on other regions more
than the experts, whereas the novices fixated more on their opponent’s arm/fists. Use
of the visual pivot has since been reported in expert karate fighters (Milazzo et al.
2016) and skilled basketball players (Ryu et al. 2013). Milazzo et al. (2016) found that
compared to novices, international level karate fighters were not only significantly
faster to block opponent attacks and more accurate in executing attacks, but also
fixated significantly more on the head and upper torso of their opponent whilst using
‘short visual excursions’ towards peripheral regions. Using an interesting ‘gaze
contingent paradigm’ in a basketball video-based decision-making task, Ryu et al.
(2013) found expert basketballers made saccadic transitions from the ball-carrier to
various locations and back to the ball-carrier. This was evident when foveal and
peripheral vision were occluded separately in two different conditions as well as when
the basketballers were presented the full visual field. The skilled basketballers also
performed above chance level in all 3 conditions whereas the lesser skilled
basketballers only performed above chance level when the whole visual field was
presented. This further highlights an expertise-based ability to utilise both central and
peripheral information. However, the visual pivot remains to be a gaze strategy seen
in sports officiating, this is perhaps due to most studies in such populations focussing
44
on a single temporal point during decision making as opposed to a dynamic scenario
where officials might hold an opportunity to pivot between multiple cues.
Figure 1.5: Depiction of an umpire’s potential use of a: a) foveal spot; b) gaze anchor;
c) visual pivot
Whilst these three gaze strategies differ from one another in their function,
they can be interchanged with one another throughout a task (Klostermann et al. 2020).
For example, research in baseball has shown that batters might initially use a visual
pivot as the pitcher prepares to throw the ball, and at the point of release utilise either
a gaze anchor (Kato & Fukuda, 2002) or foveal spot (Takeuchi et al. 2009). Initial use
of the visual pivot is seen in Kato & Fukuda (2002) where expert batters initially
organised their visual search around the pitcher’s shoulder/trunk whilst Takeuchi et
al. (2000) similarly found experts initially organised their visual search around the
proximal region of the pitcher, including their head, chest and trunk. However, at the
point of ball release, batter’s in Kato & Fukuda (2002) appeared to fixate on the
pitcher’s elbow suggesting use of a gaze anchor between the ball and the pitcher’s

45
shoulder, whilst the batter’s in Takeuchi et al. (2009) fixated on the pitching arm and
release point of the ball, suggesting use of the foveal spot. The evidence of these three
stable gaze strategies in both sport officials and athletes highlight the integral role
peripheral vision holds within expert performance. In figure 1.5abc, a diagram can be
seen that outlines how cricket umpires might utilise these 3 gaze strategies to enable
processing of the multiple cues associated with making an LBW decision.
In addition to the strategy utilised, research examining automobile driving
suggests that expertise can result in an individual possessing a wider ‘functional field
of view’ (FFoV), this being the area of the retina which can process information
(Crundall et al. 1999). The principal finding of this study was that experienced drivers
were more likely to detect cues located in the periphery of the visual field than less
experienced and non-drivers. Interestingly, the ability to detect these cues decreased
in all groups when driving task complexity increased. This suggests that both cognitive
demands of a task and an individual’s task experience determines the width of the
FFoV. A theory, termed the ‘tunnel-vision model’ proposed that an individual’s
attention is narrower when there is a high cognitive load during information processing
of foveal information (Williams, 1989). Such a theory would explain why despite
using a similar gaze behaviour, expert assistant football referees in Schnyder et al
(2017) and basketballers (Ryu et al. 2013) were better able to utilise peripheral vision
to outperform their lesser skilled counterparts. Should the cognitive demands of the
tasks from both of these studies be reduced in the skilled participants due to extensive
deliberate practice, then in theory they might possess a broader FFoV. This would
permit the processing of more cues than lesser skilled counterparts who might require
additional cognitive resources to process a central cue’s information, consequently
resulting in a narrower field of vision to extract information.
46
1.6 Quiet Eye
Whilst visuo-spatial positioning of the fovea appears to be of high importance,
the duration that it remains fixated on the location has been also shown to dictate
performance outcomes (Gonzalez et al. 2017a). The Quiet Eye (QE) is defined as the
final fixation held within 1-3° of the visual angle for a duration of at least 100ms
(Gonzalez et al. 2017a; Moran et al. 2019; Nagano et al. 2006; Vickers, 2016). An
extended QE duration has been shown to enhance performance in a variety of sports
(Causer et al. 2010; Vickers & Williams 2007; Vickers et al. 2000), so it is of little
surprise that many elite sportspeople employ a longer QE period than lesser skilled
counterparts in fields such as; golf (Mann et al. 2011) ballet dancing (Panchuk &
Vickers, 2011), archery (Gonzalez et al. 2017b), rifle shooting (Janelle et al. 2000)
and surgery (Vickers et al. 2015; Wilson et al. 2011). Longer QE durations also appear
a predictor of motor coordination abilities in children (Wilson et al. 2013).
The first study that identified a prolonged final fixation can enhance
performance was conducted by Vickers (1992), who found that compared with high
handicap golfers, low handicap golfers fixated significantly more on the ball when
putting. Since this seminal study, extensive research into QE, a term coined in 1996,
has been conducted in a variety of fields. Whilst some studies have shown that QE
durations do not differ between populations of varying expertise, these studies remain
few and far between (refer to Klostermann & Moeinrad 2020). Therefore, it is fair to
suggest the performance benefits associated with a prolonged QE are fairly robust.
Whilst the descriptive studies examining performance and skill-based
differences generally yield similar results, the mechanisms that underlie the QE
remain somewhat unclear 29 years on from its discovery. Three principal theories exist
47
which aim to expound these mechanisms; the pre-programming, inhibition hypothesis,
and attentional focus hypothesis.
The pre-programming hypothesis postulates the QE enhances information
processing, and that its duration reflects the time period necessary to optimally
organise cortical resources. This supposedly enables synthesis of sensory information
that is essential to programme the final parameters of a motor action (Gonzalez et al.
2017a; Rodrigues & Navarro, 2016). Essentially this theory propounds that an
extended QE period is crucial for the fine tuning of motor responses which
consequently improves task performance. Initial evidence for this hypothesis was seen
in Williams et al (2002), who manipulated the complexity of billiards shots taken by
skilled and lesser skilled players. Results corroborated previous research as
participants employed longer QE periods compared to when their shots were
unsuccessful. In support of the pre-programming hypothesis, this study also found that
the QE of participants increased in relation to an increase in task complexity. It was
suggested that this increased QE duration arose as a result of increased response
programming being necessary to fine tune the movement on the more complex trials.
Some neurological evidence for this theory also presents itself in Mann et al. (2011),
who established that a prolonged QE duration in low and high handicap golfers was
associated with increased Bereitschaftspotential (BP), this being a slow rising of
negative electrocortical activity that precedes a motor action (Shibasaki & Hallett,
2006). Whilst association does not prove causality, this provides some support that the
QE might provide a function in effective pre-programming of a motor task.
Despite this evidence, the validity of the pre-programming theory has been
disputed by some due to the ‘efficiency paradox’, whereby its predictions contradict
the speed and efficiency of behaviour often associated with elite performance
48
(Klostermann & Hossner, 2018). Consequently, the inhibition hypothesis was posited
by Klostermann et al. (2014). This theory postulates that due to significantly more
experience, elite performers possess a greater number of movement options to respond
to a given stimulus/situation (Moran et al. 2019). Therefore, to select the appropriate
movement response, the prolonged QE duration supposedly inhibits alternative and
less optimal options from being executed. Further, Klostermann et al. (2014)
suggested inhibitory processes do not solely operate during pre-movement periods,
but are also active during movement execution in more complex tasks. Like the pre-
programming hypothesis, this also provides an explanation to why QE increases with
task complexity (Williams et al. 2002). To test this theory, Klostermann (2019)
examined whether increased movement variants would result in an extended QE
period. Participants were presented 16 discs, and were required to throw an object
towards them. In one group, 4 target discs were highlighted during the pre-movement
phase for the participants to throw the object at. In another group, just 1 disc was
highlighted, therefore removing three alternate movement variants. In line with the
inhibition hypothesis, participants who were presented with more target discs
exhibited a longer QE duration than those who were presented a single disc. It was
suggested that the longer QE period exhibited was a consequence of participants
inhibiting alternate movement variants that would have been necessary should they
have chosen to throw at the other three discs. In a follow up study, Klostermann (2020)
employed a similar procedure but manipulated the space between each of the discs.
Interestingly, the closer the target discs were together, the longer their QE period was.
It was suggested that when targets were close together, due to the spatial similarity
between targets, further cognitive resources were required to inhibit less optimal
movement variants that were similar to the optimal ones.

49
Whilst most theories have focused on motor-action related functions of the QE,
it has been also proposed that it might increase attentional focus optimally towards
task related properties (Gonzalez et al. 2017a). Vickers (2009) and Vickers (2016b)
suggest the QE might increase activation of the dorsal visual stream (refer to visual
systems section) so that attention is predominantly directed towards specific locations
in space, which in turn also helps prevent distractive stimuli from entering the working
memory via the ventral stream. Attentional Control Theory (ACT) postulates that
anxiety renders task performance decline as a direct consequence of attention being
allocated towards the source of stress via the ventral visual stream at the expense of
dorsal stream processing (Eysenck & Derakshan 2011). Behan and Wilson (2008)
found in a computer simulated archery task that when participants were faced with
anxiety not only did they perform worse, but their QE duration also significantly
reduced. A similar study by Wilson et al. (2009) examining 10 basketball players
replicated findings from Behan and Wilson’s study where both performance and QE
duration reduced in an anxiety condition. This provides some indication that anxiety
significantly reduces the duration of the QE. However, a line of research has provided
some support for the attentional benefits of the QE, as they have displayed that by
training participants to utilise an extended QE period, they can prevent the commonly
reported performance decline often associated with anxiety (Causer et al. 2014; Moore
et al. 2012; Vickers et al. 2017; Vine & Wilson, 2010; Vine et al. 2011). Further
support for QE enabling the increased activation of the of dorsal stream processing
comes from Harris et al. (2017), who examined the role of QE in states of flow in
basketball players. A small effect was found where QE enhanced states of flow during
basketball free throws, this according to the authors providing some evidence that QE
enhances task related attentional processes. Mann et al. (2011) also found in
50
comparison to high handicap golfers, low handicap golfers displayed longer QE
durations in addition to greater activation in the right parietal lobe, this being one of
the primary regions that the dorsal visual stream navigates through. The
abovementioned studies highlight a potential link between an extended QE duration
and enhanced attentional allocation that would potentially enable performers to ensure
all salient cues within the visual field are picked up before and during the sporting
action. However, at the time of writing no research has examined whether an increased
QE duration holds any utility in improving performance on an attentional task which
does not require movement pre-programming and/or inhibition. Research surrounding
umpiring decision making provides the perfect base to examine the attentional benefits
of QE. Whilst there is a necessity to process information from numerous sources in
little over half a second, should the QE prove to be a beneficial strategy when
providing verdicts on LBW appeals that require accurate spatial processing of the ball,
it could further support the notion that it increases visual processing via the dorsal
stream (Vickers, 2016a; Zachariou et al. 2014).
1.7 Quiet Eye Training
As well as trying to establish the mechanisms involved in the QE, as briefly
alluded to in the above section, researchers have dedicated much effort in aiming to
understand whether this gaze strategy can be translated into elucidating an acceleration
of skill learning via training techniques (Farrow & Panchuk, 2016). As Vickers
(2016a) highlights, the human brain is a slow visual processor and is therefore reliant
on a performer to uncover novel methods of accessing complex spatial information
earlier and more efficiently. Consequently, for just over a decade, researchers have
examined what visual skills can be trained to expedite expert performance. As the QE
51
appears to mediate expertise in a wide array of tasks (Vine et al. 2014), QE training
interventions have been developed and implemented in both novice and expert
populations in various sporting and non-sporting tasks (Vickers, 2016a).
Vickers (2016a) suggests a QE training programme should aim to abide by the
following 7 step model. Firstly, researchers should establish an ‘expert QE prototype’.
This involves identifying the optimal QE fixation location, onset, final critical
moment, offset and overall duration used by experts when performing a specific task.
These five prototype characteristics are fundamental to the intervention as they are
ultimately used to visually guide novice attentional allocation. To do this, skilled
performers are required to wear eye tracking technology whilst executing the task of
their expertise. The five QE characteristics can be further developed by comparing the
successful and unsuccessful trials of the skilled performers (Farrow & Panchuk, 2016).
The second step involves repeating methodologies from step one, but this time in the
novice group to establish how their QE behaviours differ from the experts. Results
from this step usually provide initial QE and performance outcomes that form the
novice baseline ‘pre-test’. The third step initiates the training intervention. Here, video
footage of gaze behaviours displayed by the experts in the first step is displayed to the
novices, with extra emphasis being placed on the five QE characteristics in a frame-
by-frame analysis. Next, video feedback of the participant’s QE behaviours from step
2 is presented visually and compared side-by-side to the expert’s footage. Vickers
(2016a) highlights the importance of this stage in examining the participant’s
understanding of their attentional focus during performance. The fifth stage involves
participants deciding which of the five QE characteristics they would prefer to work
on, however this view is contended by Farrow and Panchuk (2016), who suggest that
information minimization might be a more optimal solution. Further, they suggest an
52
implicit instruction would be more appropriate so that attentional control is subtly
learnt as opposed to use of explicit teaching methods that might be considered
detrimental to learning the task. Next, participants engage in blocked and random
training drills where they perform a series of trials similar to the pre-test with the aim
of practicing methods learnt in step three and four. Finally, in the seventh step,
participants perform a retention test to establish if the intervention augments better
task performance and whether it yields optimal QE behaviours. Whilst not mentioned
in the 7 step-model, a plethora of studies have also included a ‘transfer test’ whereby
participants perform the same task whilst under stressful conditions. This allows
researchers to assess whether they are able to maintain their attentional control when
anxious or they revert to a shorter QE duration in line with ACT. A number of these
interventions have been implemented in both expert and novice populations, and have
generally provided positive results. Such findings validate the use of QE interventions
as well as further supporting the consensus that the QE forms an imperative part of
elite performance (see Appendix 2).
The first pilot QE intervention study was conducted by Adolphe et al. (1997)
in 3 expert and 6 near-expert volleyball players. Over a 6-week training period,
participants were instructed to track small objects on a display and identify numbers
written on them (implicit learning technique). This instruction was based on findings
which highlighted tracking the ball for longer durations predicted higher service
reception. Following training, participants improved their tracking onset and offset
times as well as their overall QE durations. Importantly, improvements were evident
in serve reception accuracy over the next 3 seasons of international competition.
Despite the lack of control group in this pilot, a plethora of studies have since included
control groups and/or technical training groups and found QE training interventions

53
are effective at improving performance in tasks such as Olympic skeet shooting
(Causer et al. 2011), surgery (Causer et al. 2014a; Causer et al. 2014b), golf putting
(Vine et al. 2011) and soccer penalties (Wood & Wilson, 2011; Wood & Wilson
2012). Not only do such interventions improve attentional control of experts, but in
some instances also movement kinematics. For example, Causer et al. (2011)
implemented a QE training intervention in a sample of 10 international skeet shooters.
Participants initially made 30 shots which formed the pre-test as 5 hits and 5 misses
were chosen. Following this, participants completed an 8 week training programme.
In the retention-test, the training group significantly improved performance coupled
with significantly longer QE durations. Interestingly, the QE group also showed more
efficient gun movements by displaying smaller gun displacement and lower peak
velocities in the retention test. The QE group also improved their shooting accuracy
in an in-situ competition setting further providing evidence of the usefulness of such
interventions. This study also included a control group who in line with expectations
showed no gaze or performance differences across the pre-test and retention test. In
addition to highlighting the overall effectiveness of such interventions from a
performance standpoint, this study also provided further evidence that the QE is
mechanistically involved at a visuo-motor level by pre-programming the upcoming
movement and/or inhibiting less optimal movement variants. Studies following
similar intervention protocols have yielded performance increments for novice
participants in tasks such as golf putting (Moore et al. 2012; Moore et al. 2013; Vine
& Wilson, 2010; Vine et al. 2013), basketball free throws (Vine & Wilson, 2011),
marksman shooting (Moore et al. 2014) and throwing and catching (Miles et al. 2014;
Miles et al. 2015, Miles et al. 2017) (see Appendix 2). Interestingly, Vine & Wilson
(2011), Vine et al. (2013), Moore et al. (2012) and Moore et al. (2013) found that in
54
addition to improving performance of various tasks, the QE intervention shielded
novices from a decline in performance when they were subjected to performing under
stressful conditions. These findings again reiterate the potential attentional benefits of
such training.
As Wilson et al. (2016) summarises, QE training provides an easily accessible
method of accelerating skill learning in numerous domains and potentially via a
variety of mechanisms. Considering these mechanistic explanations target different
aspects of task execution, application of such programmes should be tested in as many
self-paced domains to examine their utility beyond typical laboratory settings.
1.8 The Expert Performance Approach
In order to examine expertise in any domain with rigour, Ericsson & Smith
(1991) drew upon their research in chess and extracted three steps for researchers to
follow. These three steps comprise ‘the expert performance approach’ (Figure 1.6).
The first step in this framework is, ‘capturing superior performance’. Here,
researchers are encouraged to identify or design a task in standardized laboratory
conditions that is representative of in-situ activity, so that the stable mechanisms of
expertise are displayed (Ericsson & Smith, 1991). Such tasks should also permit
experts to reproduce superior performance compared to novices in a similar manner
to the differences seen during real life performance (Starkes & Ericsson, 2003).
Consequently, the procedure should hold the capacity to be administered to both
beginners and experts so that measurements can be taken using a longitudinal design.
With use of a similar representative task, the second step, termed ‘analysing
expert performance’ can be considered (Ericsson & Smith, 1991). This stage of inquiry
involves extensive analysis of the mechanisms that underlie superior performance
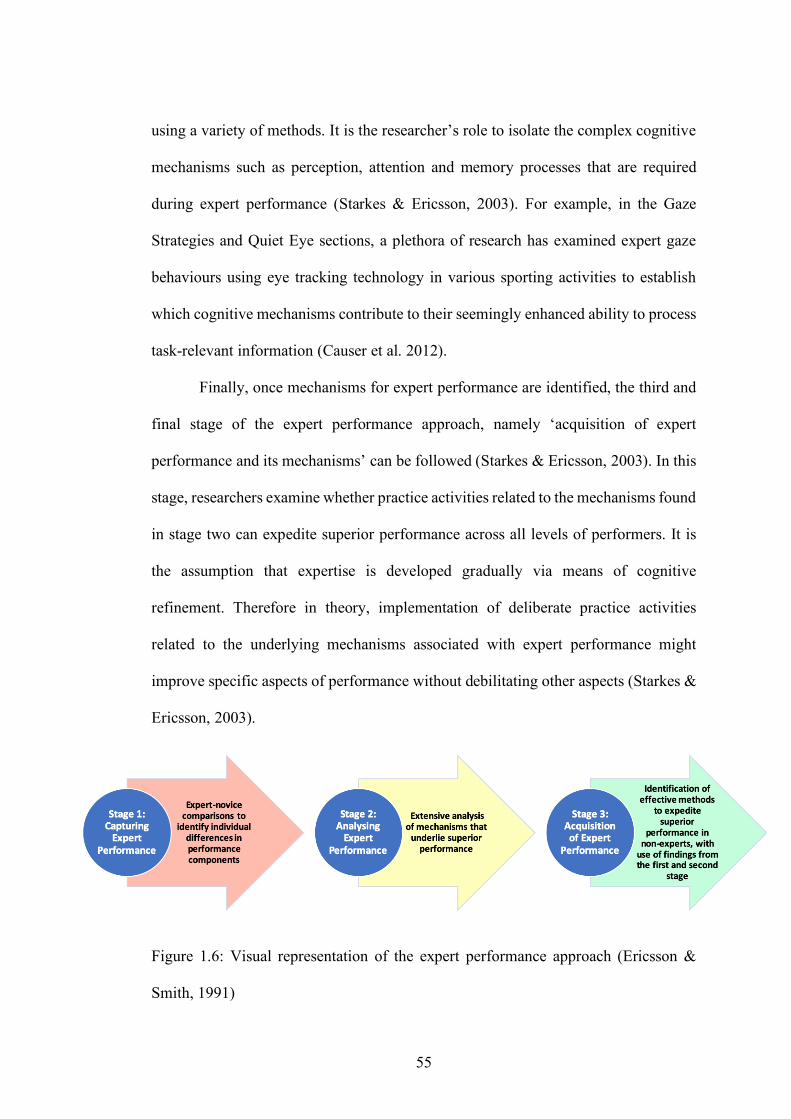
55
using a variety of methods. It is the researcher’s role to isolate the complex cognitive
mechanisms such as perception, attention and memory processes that are required
during expert performance (Starkes & Ericsson, 2003). For example, in the Gaze
Strategies and Quiet Eye sections, a plethora of research has examined expert gaze
behaviours using eye tracking technology in various sporting activities to establish
which cognitive mechanisms contribute to their seemingly enhanced ability to process
task-relevant information (Causer et al. 2012).
Finally, once mechanisms for expert performance are identified, the third and
final stage of the expert performance approach, namely ‘acquisition of expert
performance and its mechanisms’ can be followed (Starkes & Ericsson, 2003). In this
stage, researchers examine whether practice activities related to the mechanisms found
in stage two can expedite superior performance across all levels of performers. It is
the assumption that expertise is developed gradually via means of cognitive
refinement. Therefore in theory, implementation of deliberate practice activities
related to the underlying mechanisms associated with expert performance might
improve specific aspects of performance without debilitating other aspects (Starkes &
Ericsson, 2003).
Figure 1.6: Visual representation of the expert performance approach (Ericsson &
Smith, 1991)
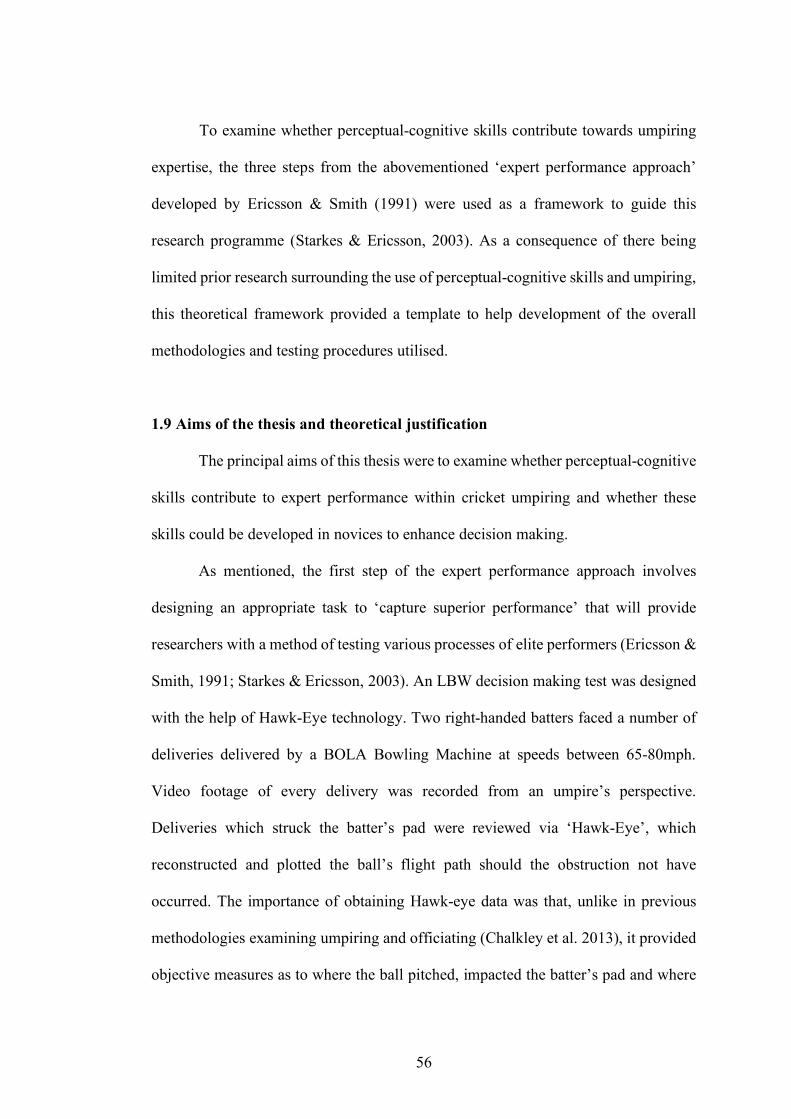
56
To examine whether perceptual-cognitive skills contribute towards umpiring
expertise, the three steps from the abovementioned ‘expert performance approach’
developed by Ericsson & Smith (1991) were used as a framework to guide this
research programme (Starkes & Ericsson, 2003). As a consequence of there being
limited prior research surrounding the use of perceptual-cognitive skills and umpiring,
this theoretical framework provided a template to help development of the overall
methodologies and testing procedures utilised.
1.9 Aims of the thesis and theoretical justification
The principal aims of this thesis were to examine whether perceptual-cognitive
skills contribute to expert performance within cricket umpiring and whether these
skills could be developed in novices to enhance decision making.
As mentioned, the first step of the expert performance approach involves
designing an appropriate task to ‘capture superior performance’ that will provide
researchers with a method of testing various processes of elite performers (Ericsson &
Smith, 1991; Starkes & Ericsson, 2003). An LBW decision making test was designed
with the help of Hawk-Eye technology. Two right-handed batters faced a number of
deliveries delivered by a BOLA Bowling Machine at speeds between 65-80mph.
Video footage of every delivery was recorded from an umpire’s perspective.
Deliveries which struck the batter’s pad were reviewed via ‘Hawk-Eye’, which
reconstructed and plotted the ball’s flight path should the obstruction not have
occurred. The importance of obtaining Hawk-eye data was that, unlike in previous
methodologies examining umpiring and officiating (Chalkley et al. 2013), it provided
objective measures as to where the ball pitched, impacted the batter’s pad and where
57
it would have travelled post impact, which could be used to judge performance of the
umpires.
Once the general task was designed, the second step, ‘identifying mechanisms
that mediate expert performance’ (Starkes & Ericsson, 2003), was used to guide
Chapter 2 and to a greater extent Chapter 3. In this step Starkes & Ericsson (2003)
suggest researchers should try and identify specific processes that account for expert
performance over lesser skilled individuals, for example, cognitive or anatomical
differences. With this in mind, the principal aims of Chapter 2 were to examine
whether expert cricket umpires use perceptual-cognitive skills to enhance their
decision making of LBW appeals, whether there would be a skill-based difference
between expert and novice umpires, and finally whether a representative task could be
developed to differentiate these skills between groups. Umpires were defined as
experts using Swann et al. (2015) as a framework. The umpires performed either at
National Level or developmental level, with over 8 years of umpiring experience at
these respective levels. To do this, expert umpires and novice umpires viewed a
number of the video-based LBW appeals, and were required to mark a location on an
‘empty’ Hawk-Eye image where they thought the ball pitched, impacted the batter’s
pad and where it would have travelled post obstruction. These decisions were
compared against Hawk-Eye data for each trial so that the researchers could measure
how accurate decisions were on each LBW component. Whilst they performed this
task, eye trackers were worn to enable the researchers to establish whether any
perceptual-cognitive skills were used. Novices were included in the first study for two
reasons: firstly to provide clarification on the representability of the task in line with
step 1, and also to provide a comparison of the attentional behaviours of the two groups
in line with step 2. If novices and experts performed at similar levels, then it might
58
have been the result of the task not meeting the first criteria of the expert performance
approach of mirroring in-situ cricket umpiring. It was hypothesised that expert
umpires would outperform novice umpires in decision accuracy on the ‘pitch’, ‘pad’
and ‘wickets’ aspects of the LBW (Chalkley et al. 2013). It was also hypothesised that
expert umpires would use a more efficient visual strategy consisting of fewer fixations
of longer durations that would be directed to more informative locations (Moore et al.
2019). It was also expected that a longer QE duration would lead to more successful
decision making (Schnyder et al. 2017). The final hypothesis was that expert umpires
would use a gaze anchor at the critical moments of ball pitching and impacting the
batter’s pad in a similar way to previous sporting officials (Vater et al. 2019; Schnyder
et al. 2017).
It was decided in Chapter 3 that further examination into the mechanisms of
expert umpiring performance would be of interest. Chapter 3 examined how the front
foot no ball rule affects umpire’s decision making. There has been a lot of controversy
in high level cricket surrounding the front foot no ball (D’Souza, 2019, March 29)
with several elite players weighing in on the debate, suggesting technology should be
used to make this decision whilst umpires concentrate on other aspects of the game.
Within the field of cognitive psychology, it has been found that switching between
different tasks can lead to an increased amount of errors on the second task as well as
slower response times (Monsell, 2003). Further, it has been found that upon task-
switching, individuals sometimes mis-orientate their visual attention towards
irrelevant cues (Longman et al. 2017).
Therefore, the aim of this study was to examine whether umpires would make
less accurate LBW decisions when required to switch to this task from calling the front
foot no ball. Umpires performed an adapted version of the task used in Chapter 2.
59
However, an experimental condition in this study required umpires to task-switch
whilst a ‘control’ other condition replicated the procedure from Chapter 2. First, it was
hypothesised that task switching from the front foot no ball decision task to the LBW
decision making task, would lead to increased decision-making error on the pitch
aspect (Southgate et al. 2008) and additionally the ‘pad’ and ‘wickets’ components. It
was also expected that irrespective of the condition, a longer QE duration on the
stumps would lead to more successful decision making (Vickers, 2016a). It was lastly
expected that when task-switching, umpires would direct their attention significantly
more to task-irrelevant locations (Longman et al. 2017).
Finally, Chapter 4 adhered to the third step of the expert performance
approach, where it aimed to examine whether expertise in cricket umpiring could be
acquired by non-experts by using expert eye movement behaviours (Starkes &
Ericsson, 2003). A plethora of research has found that ‘QE training’ can mediate
improved sporting performance (Farrow & Panchuk, 2016). A sample of novice-
umpires were split into a QE, technical training (TT) and control (CTRL) group. A
similar task to Chapter 3’s experimental condition formed trials across all phases of
this chapter. All participants made 8 pre-test LBW decisions before the intervention
was implemented. Within the intervention, the QE group was provided information as
to where they should fixate their gaze and the duration they should hold it in a certain
position for, the TT group were provided information surrounding LBW decision
making thought process, whilst the control group were provided no information.
Following this, participants took part in the acquisition phase where they practiced the
information they had been provided before taking part in the post-test where they
viewed a further 8 LBW appeals. It was firstly hypothesised that the QE and TT groups
would improve their LBW decision making accuracy significantly across all three

60
components (Vickers, 2017). However, it was predicted that only the QE group would
maintain learning effects in a one-week retention test (Miles et al. 2017). Finally, it
was expected that the control group would exhibit no significant changes in decision
making accuracy across all three phases.
61
Chapter 2:
Expertise Differences in LBW Decision Making and Perceptual-Cognitive Skills
62
Abstract
Cricket umpires are required to make high-pressure, match-changing decisions
based on multiple complex information sources under severe temporal constraints.
The aim of this study was to examine the decision-making and perceptual-cognitive
differences between expert and novice cricket umpires when judging leg before wicket
(LBW) decisions. Twelve expert umpires and nineteen novice umpires were fitted
with an eye-tracker before viewing video-based LBW appeals. Dependent variables
were radial error (cm), number of fixations, average fixation duration (ms), final
fixation duration (ms), and final fixation location (%). Expert umpires were
significantly more accurate at adjudicating on all aspects of the LBW law, compared
to the novice umpires (p < .05). The expert umpires’ final fixation prior to ball-pad
contact was directed significantly more towards the stumps (p < .05), whereas the
novice umpires directed their final fixation significantly more towards a good length
(p < .05). These data suggest that expert umpires utilise specialised perceptual-
cognitive skills, consisting of a gaze anchor on the stumps in order to overcome the
processing demands of the task. These data have implications for the training of
current and aspiring umpires in order to enhance the accuracy of LBW decision
making across all levels of the cricketing pyramid.
63
Cricket umpires make decisions regarding batter dismissals that consequently
determine match outcomes (Sacheti, et al. 2015). Of the modes of dismissals within
cricket (see Marylebone Cricket Club, 2017), none has led to as much controversy and
dispute as the leg before wicket (LBW) (Chedzoy, 1997; Sacheti et al., 2015;
Southgate et al. 2008). LBW appeals occur when the ball strikes the batter on any part
of their body (usually leg pads) apart from the bat and hands (Craven, 1998). For a
bowler to dismiss a batter via LBW, the umpire must consider whether the delivery
met a number of specific criteria (Crowe & Middeldorp, 1996). For every delivery,
the umpire must initially determine whether the bowler’s front foot grounds behind a
line termed the crease (Adie et al. 2020). Subsequently, the umpire must consider
where the ball bounced (pitched), where the ball impacted the batter in relation to the
stumps, and the more challenging judgement of whether the ball would have continued
on its flight path to hit the stumps had the obstruction with the batter not occurred
(Southgate et al., 2008). Therefore, the LBW rule appears to be one of the few
regulations in sport where an official must determine what might have happened
(would the ball have hit the stumps?) if other events did not occur (ball flight path
being obstructed by the leg), which contributes to the dispute amongst players, media
and followers of cricket (Crowe & Middeldorp, 1996). A number of contextual factors
further add to the difficulty of the umpire’s LBW verdict, such as the batter’s stance
(Southgate et al., 2008), dynamics of the delivery (spin and swing) and the ball’s
surface degradation (Chalkley et al. 2013). In spite of these challenges, it has been
shown that professional umpires are highly accurate at making LBW decisions. Adie
et al. (2020) examined 5578 decisions made in elite level cricket in Australia between
2009-2016 and found that umpires were correct 98.08% of the time. Further, when
64
they broke down the match format, 96.20% of ‘out’ decisions were correct in first
class cricket, 96.29% in One Day cricket and 86.15% in T20 cricket.
In 2008 the International Cricket Council (ICC) introduced the Decision
Review System (DRS) into international cricket. This permits the captains of either
team to refer a limited number of decisions made by the on-field umpires to the third
umpire who is able to utilise an array of replays and technologies to assess the
accuracy of the original decision (Borooah, 2013). Utilising statistics from the DRS in
international test cricket (July 2008 to March 2017) ESPN Cricinfo estimated that 74%
of the reviews involved LBW appeals, with the overturn rate being at 22% (Davis,
2017, June 1). Whilst initially this proportion seems high, it must be stressed that these
officials are often placed under severe constraints when making these decisions
(Chalkley et al., 2013; Southgate et al., 2008). More specifically, in certain scenarios,
umpires must process information related to the ball’s (7.29 cm) flight that can travel
at velocities up to 95 mph over 20 m. These constraints offer umpires approximately
543 ms to process the multitude of visual and auditory information required to make
a single decision (Southgate et al., 2008). To help combat these processing demands,
it has been suggested that umpires utilise specific perceptual-cognitive behaviours that
contribute to the increased likelihood of correct decisions (Southgate et al., 2008).
Cricket batters face similar temporal constraints, and researchers have
highlighted differing gaze behaviours to attempt to overcome these demands (Croft et
al. 2010; Land & McLeod, 2000; Mann et al. 2013). Upon ball release from the bowler,
expert batters generally make an anticipatory saccade to it its pitching point (Croft et
al., 2010). However, following the ball pitching, two distinct strategies have been
identified. Land and McLeod (2000) reported that batters made a saccade towards the
ball about 200 ms after its bounce before attempting to pursuit track the remainder of
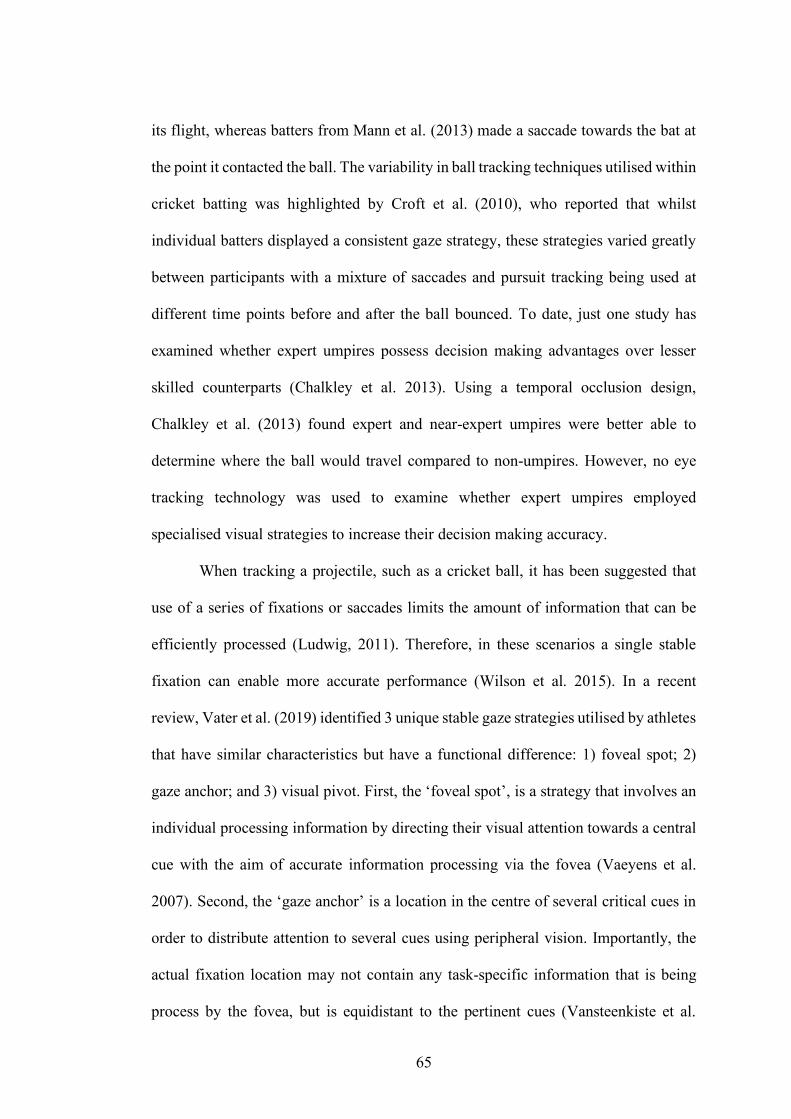
65
its flight, whereas batters from Mann et al. (2013) made a saccade towards the bat at
the point it contacted the ball. The variability in ball tracking techniques utilised within
cricket batting was highlighted by Croft et al. (2010), who reported that whilst
individual batters displayed a consistent gaze strategy, these strategies varied greatly
between participants with a mixture of saccades and pursuit tracking being used at
different time points before and after the ball bounced. To date, just one study has
examined whether expert umpires possess decision making advantages over lesser
skilled counterparts (Chalkley et al. 2013). Using a temporal occlusion design,
Chalkley et al. (2013) found expert and near-expert umpires were better able to
determine where the ball would travel compared to non-umpires. However, no eye
tracking technology was used to examine whether expert umpires employed
specialised visual strategies to increase their decision making accuracy.
When tracking a projectile, such as a cricket ball, it has been suggested that
use of a series of fixations or saccades limits the amount of information that can be
efficiently processed (Ludwig, 2011). Therefore, in these scenarios a single stable
fixation can enable more accurate performance (Wilson et al. 2015). In a recent
review, Vater et al. (2019) identified 3 unique stable gaze strategies utilised by athletes
that have similar characteristics but have a functional difference: 1) foveal spot; 2)
gaze anchor; and 3) visual pivot. First, the ‘foveal spot’, is a strategy that involves an
individual processing information by directing their visual attention towards a central
cue with the aim of accurate information processing via the fovea (Vaeyens et al.
2007). Second, the ‘gaze anchor’ is a location in the centre of several critical cues in
order to distribute attention to several cues using peripheral vision. Importantly, the
actual fixation location may not contain any task-specific information that is being
process by the fovea, but is equidistant to the pertinent cues (Vansteenkiste et al.
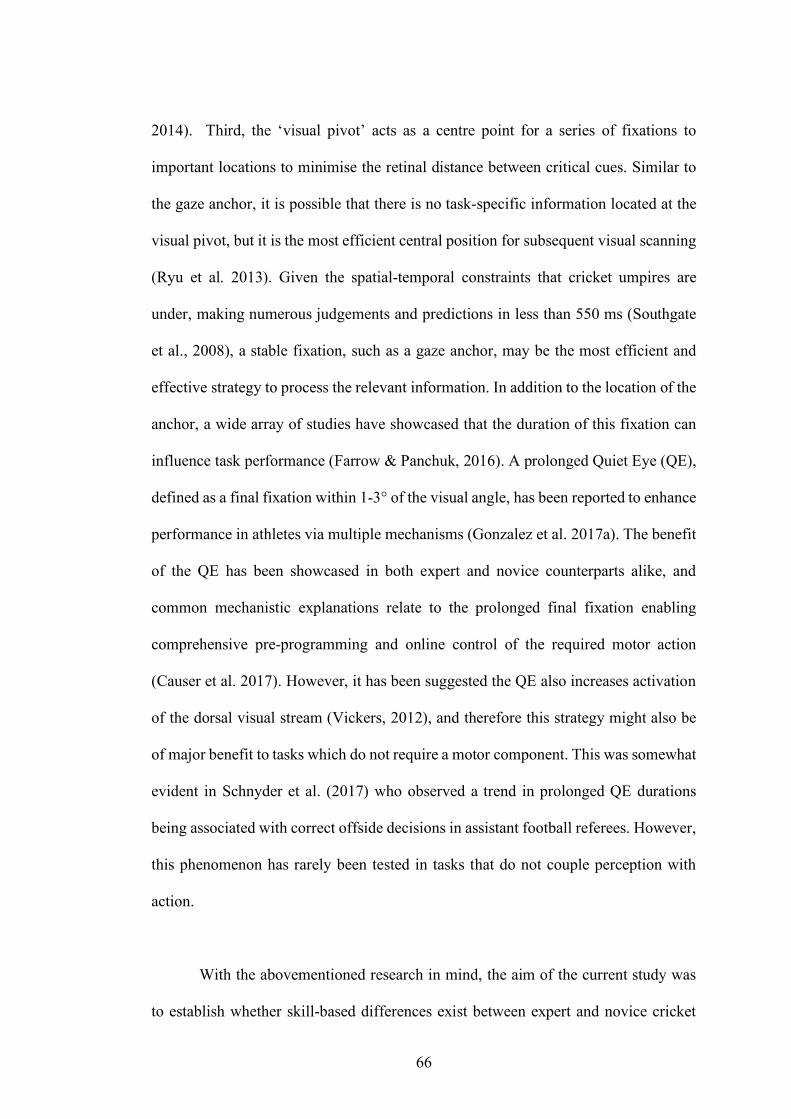
66
2014). Third, the ‘visual pivot’ acts as a centre point for a series of fixations to
important locations to minimise the retinal distance between critical cues. Similar to
the gaze anchor, it is possible that there is no task-specific information located at the
visual pivot, but it is the most efficient central position for subsequent visual scanning
(Ryu et al. 2013). Given the spatial-temporal constraints that cricket umpires are
under, making numerous judgements and predictions in less than 550 ms (Southgate
et al., 2008), a stable fixation, such as a gaze anchor, may be the most efficient and
effective strategy to process the relevant information. In addition to the location of the
anchor, a wide array of studies have showcased that the duration of this fixation can
influence task performance (Farrow & Panchuk, 2016). A prolonged Quiet Eye (QE),
defined as a final fixation within 1-3° of the visual angle, has been reported to enhance
performance in athletes via multiple mechanisms (Gonzalez et al. 2017a). The benefit
of the QE has been showcased in both expert and novice counterparts alike, and
common mechanistic explanations relate to the prolonged final fixation enabling
comprehensive pre-programming and online control of the required motor action
(Causer et al. 2017). However, it has been suggested the QE also increases activation
of the dorsal visual stream (Vickers, 2012), and therefore this strategy might also be
of major benefit to tasks which do not require a motor component. This was somewhat
evident in Schnyder et al. (2017) who observed a trend in prolonged QE durations
being associated with correct offside decisions in assistant football referees. However,
this phenomenon has rarely been tested in tasks that do not couple perception with
action.
With the abovementioned research in mind, the aim of the current study was
to establish whether skill-based differences exist between expert and novice cricket
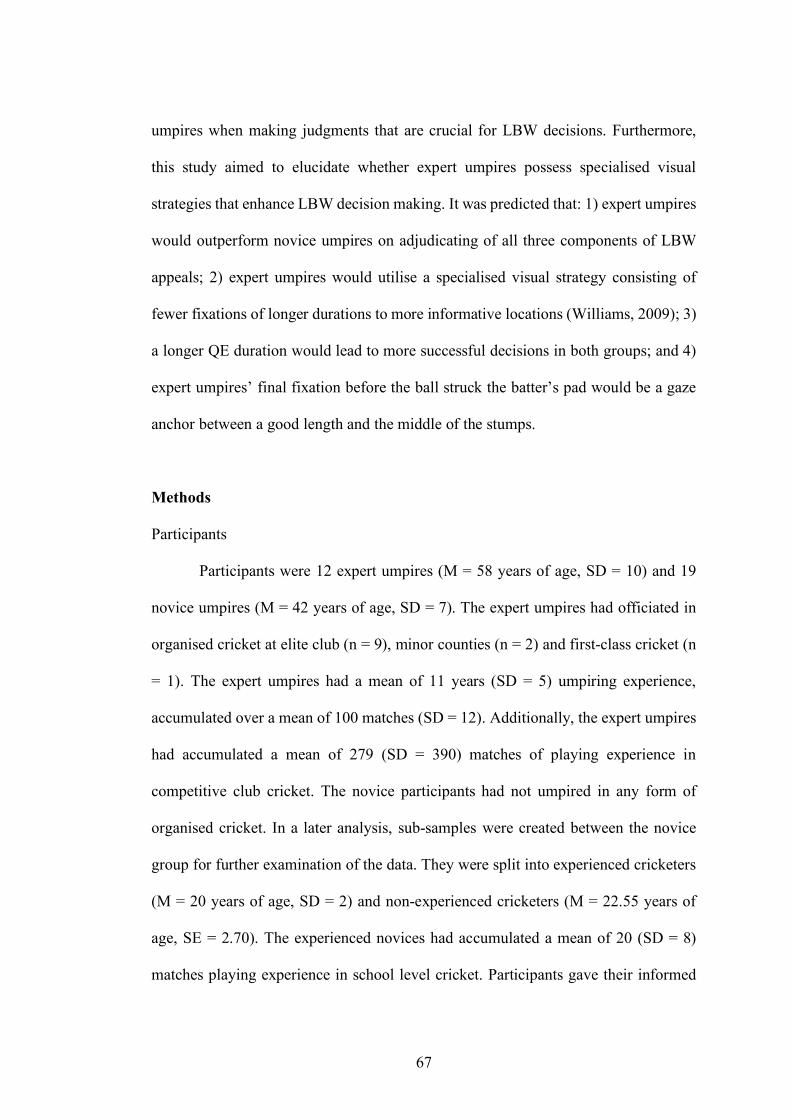
67
umpires when making judgments that are crucial for LBW decisions. Furthermore,
this study aimed to elucidate whether expert umpires possess specialised visual
strategies that enhance LBW decision making. It was predicted that: 1) expert umpires
would outperform novice umpires on adjudicating of all three components of LBW
appeals; 2) expert umpires would utilise a specialised visual strategy consisting of
fewer fixations of longer durations to more informative locations (Williams, 2009); 3)
a longer QE duration would lead to more successful decisions in both groups; and 4)
expert umpires’ final fixation before the ball struck the batter’s pad would be a gaze
anchor between a good length and the middle of the stumps.
Methods
Participants
Participants were 12 expert umpires (M = 58 years of age, SD = 10) and 19
novice umpires (M = 42 years of age, SD = 7). The expert umpires had officiated in
organised cricket at elite club (n = 9), minor counties (n = 2) and first-class cricket (n
= 1). The expert umpires had a mean of 11 years (SD = 5) umpiring experience,
accumulated over a mean of 100 matches (SD = 12). Additionally, the expert umpires
had accumulated a mean of 279 (SD = 390) matches of playing experience in
competitive club cricket. The novice participants had not umpired in any form of
organised cricket. In a later analysis, sub-samples were created between the novice
group for further examination of the data. They were split into experienced cricketers
(M = 20 years of age, SD = 2) and non-experienced cricketers (M = 22.55 years of
age, SE = 2.70). The experienced novices had accumulated a mean of 20 (SD = 8)
matches playing experience in school level cricket. Participants gave their informed

68
consent prior to taking part in the study and the study was approved by the Research
Ethics Committee of the lead institution.
Task & Apparatus
Visual search behaviours were recorded using the TobiiGlasses2 corneal
reflection eye movement system (Tobii Technology AB; Danderyd, Sweden). The test
film was recorded at the Marylebone Cricket Club Cricket Academy. Video footage
from an umpire’s perspective was recorded using a Canon VIXIA HFR706 camera
(Tokyo, Japan). The camera was positioned in line with middle stump 1.00 m away
from the non-strikers popping crease. A right-handed batter who competes in the
Worcestershire Premier League faced a number of deliveries delivered by a BOLA
Bowling Machine (Bola Manufacturing Ltd.; Bristol, UK), from both around and over
the wicket, at speeds between 65-80 mph. The batter was encouraged to play their
‘natural game’ whilst facing these deliveries. Deliveries that struck the batter’s pad
were termed ‘appeals’ and were reviewed via ‘Hawk-Eye’ (Basingstoke, UK), which
reconstructed the ball flight characteristics should the obstruction not have occurred
(Collins, 2010). Hawk-Eye technology utilises a theory of triangulation, which helps
predict post ball-pad impact by measuring angles from the known points of the
delivery’s pre-impact flight (Duggal, 2014). In total, 20 appeals were used for the
study with 11 being delivered from around the wicket, and 9 being delivered from
over the wicket. A total of 16 appeals were deemed ‘out’ and 4 deemed ‘not out’ by
Hawk-Eye. Based on the surface, 10 trials were deemed to have pitched on a ‘good
length’ and 10 trials were deemed to have pitched on a ‘full length’. According to
hawk-eye’s predictions, 6 trials would have struck off stump, 6 trials would have
struck middle stump, 6 trials would have struck leg stump and 2 trials would have
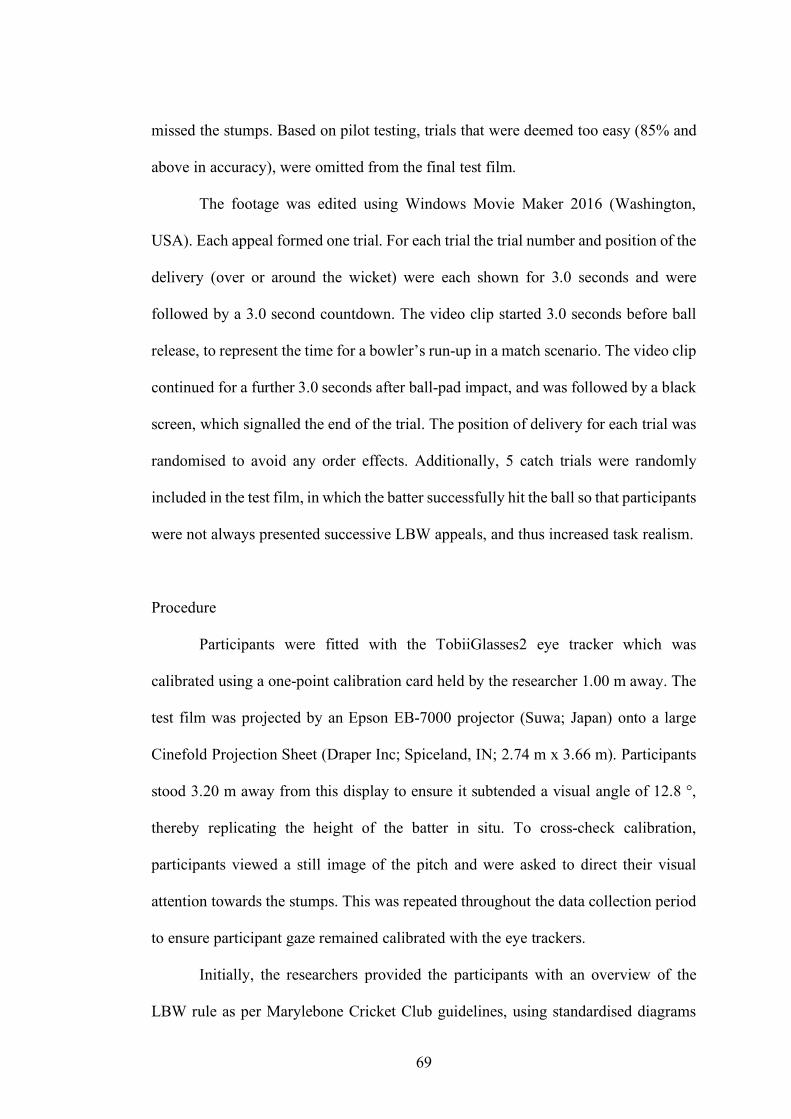
69
missed the stumps. Based on pilot testing, trials that were deemed too easy (85% and
above in accuracy), were omitted from the final test film.
The footage was edited using Windows Movie Maker 2016 (Washington,
USA). Each appeal formed one trial. For each trial the trial number and position of the
delivery (over or around the wicket) were each shown for 3.0 seconds and were
followed by a 3.0 second countdown. The video clip started 3.0 seconds before ball
release, to represent the time for a bowler’s run-up in a match scenario. The video clip
continued for a further 3.0 seconds after ball-pad impact, and was followed by a black
screen, which signalled the end of the trial. The position of delivery for each trial was
randomised to avoid any order effects. Additionally, 5 catch trials were randomly
included in the test film, in which the batter successfully hit the ball so that participants
were not always presented successive LBW appeals, and thus increased task realism.
Procedure
Participants were fitted with the TobiiGlasses2 eye tracker which was
calibrated using a one-point calibration card held by the researcher 1.00 m away. The
test film was projected by an Epson EB-7000 projector (Suwa; Japan) onto a large
Cinefold Projection Sheet (Draper Inc; Spiceland, IN; 2.74 m x 3.66 m). Participants
stood 3.20 m away from this display to ensure it subtended a visual angle of 12.8 °,
thereby replicating the height of the batter in situ. To cross-check calibration,
participants viewed a still image of the pitch and were asked to direct their visual
attention towards the stumps. This was repeated throughout the data collection period
to ensure participant gaze remained calibrated with the eye trackers.
Initially, the researchers provided the participants with an overview of the
LBW rule as per Marylebone Cricket Club guidelines, using standardised diagrams
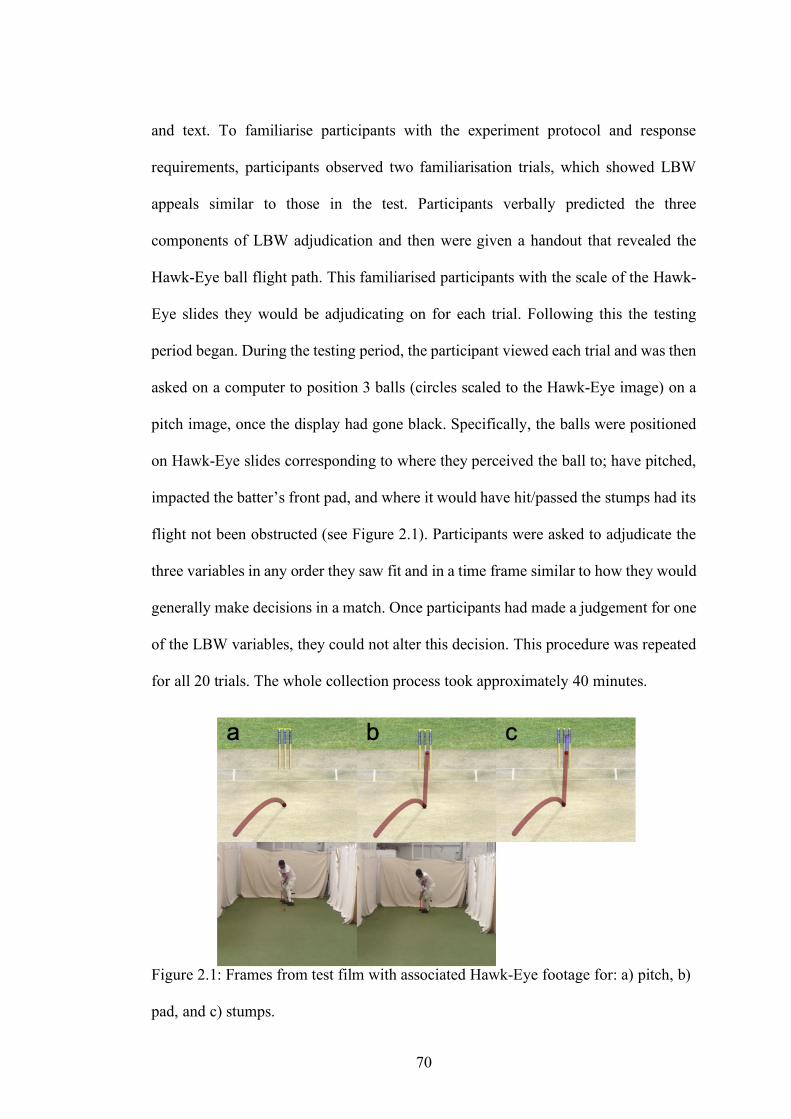
70
and text. To familiarise participants with the experiment protocol and response
requirements, participants observed two familiarisation trials, which showed LBW
appeals similar to those in the test. Participants verbally predicted the three
components of LBW adjudication and then were given a handout that revealed the
Hawk-Eye ball flight path. This familiarised participants with the scale of the Hawk-
Eye slides they would be adjudicating on for each trial. Following this the testing
period began. During the testing period, the participant viewed each trial and was then
asked on a computer to position 3 balls (circles scaled to the Hawk-Eye image) on a
pitch image, once the display had gone black. Specifically, the balls were positioned
on Hawk-Eye slides corresponding to where they perceived the ball to; have pitched,
impacted the batter’s front pad, and where it would have hit/passed the stumps had its
flight not been obstructed (see Figure 2.1). Participants were asked to adjudicate the
three variables in any order they saw fit and in a time frame similar to how they would
generally make decisions in a match. Once participants had made a judgement for one
of the LBW variables, they could not alter this decision. This procedure was repeated
for all 20 trials. The whole collection process took approximately 40 minutes.
Figure 2.1: Frames from test film with associated Hawk-Eye footage for: a) pitch, b)
pad, and c) stumps.
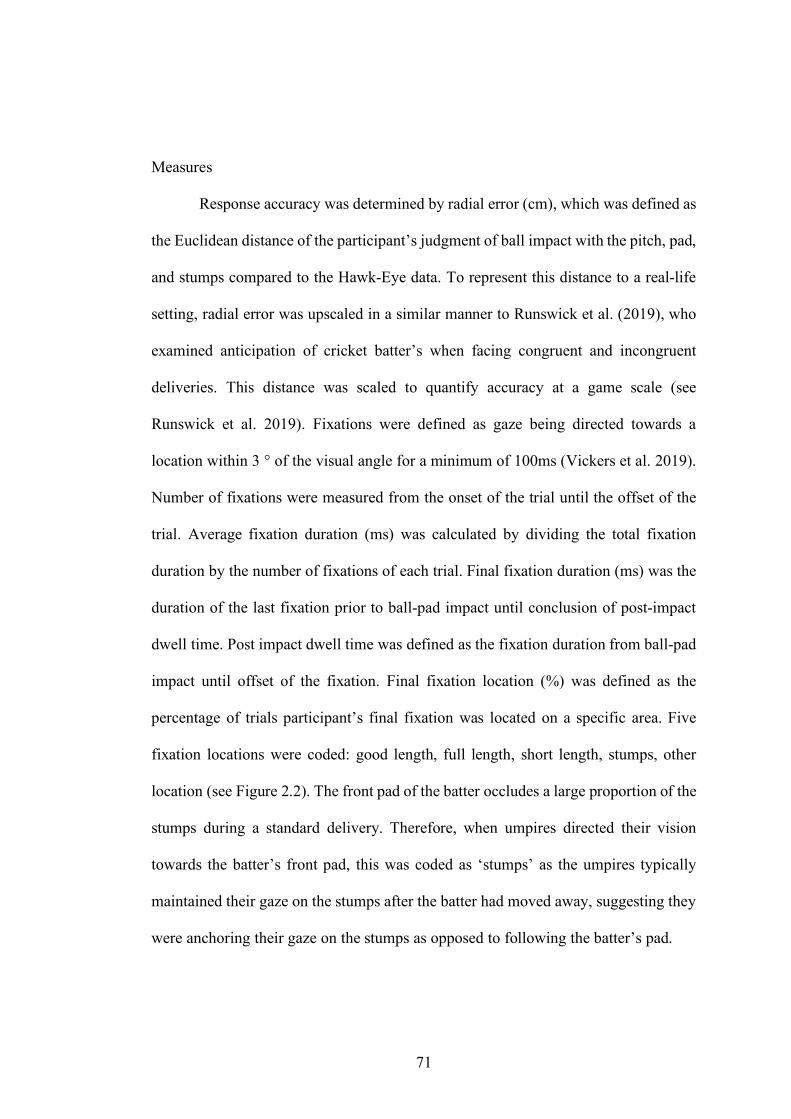
71
Measures
Response accuracy was determined by radial error (cm), which was defined as
the Euclidean distance of the participant’s judgment of ball impact with the pitch, pad,
and stumps compared to the Hawk-Eye data. To represent this distance to a real-life
setting, radial error was upscaled in a similar manner to Runswick et al. (2019), who
examined anticipation of cricket batter’s when facing congruent and incongruent
deliveries. This distance was scaled to quantify accuracy at a game scale (see
Runswick et al. 2019). Fixations were defined as gaze being directed towards a
location within 3 ° of the visual angle for a minimum of 100ms (Vickers et al. 2019).
Number of fixations were measured from the onset of the trial until the offset of the
trial. Average fixation duration (ms) was calculated by dividing the total fixation
duration by the number of fixations of each trial. Final fixation duration (ms) was the
duration of the last fixation prior to ball-pad impact until conclusion of post-impact
dwell time. Post impact dwell time was defined as the fixation duration from ball-pad
impact until offset of the fixation. Final fixation location (%) was defined as the
percentage of trials participant’s final fixation was located on a specific area. Five
fixation locations were coded: good length, full length, short length, stumps, other
location (see Figure 2.2). The front pad of the batter occludes a large proportion of the
stumps during a standard delivery. Therefore, when umpires directed their vision
towards the batter’s front pad, this was coded as ‘stumps’ as the umpires typically
maintained their gaze on the stumps after the batter had moved away, suggesting they
were anchoring their gaze on the stumps as opposed to following the batter’s pad.
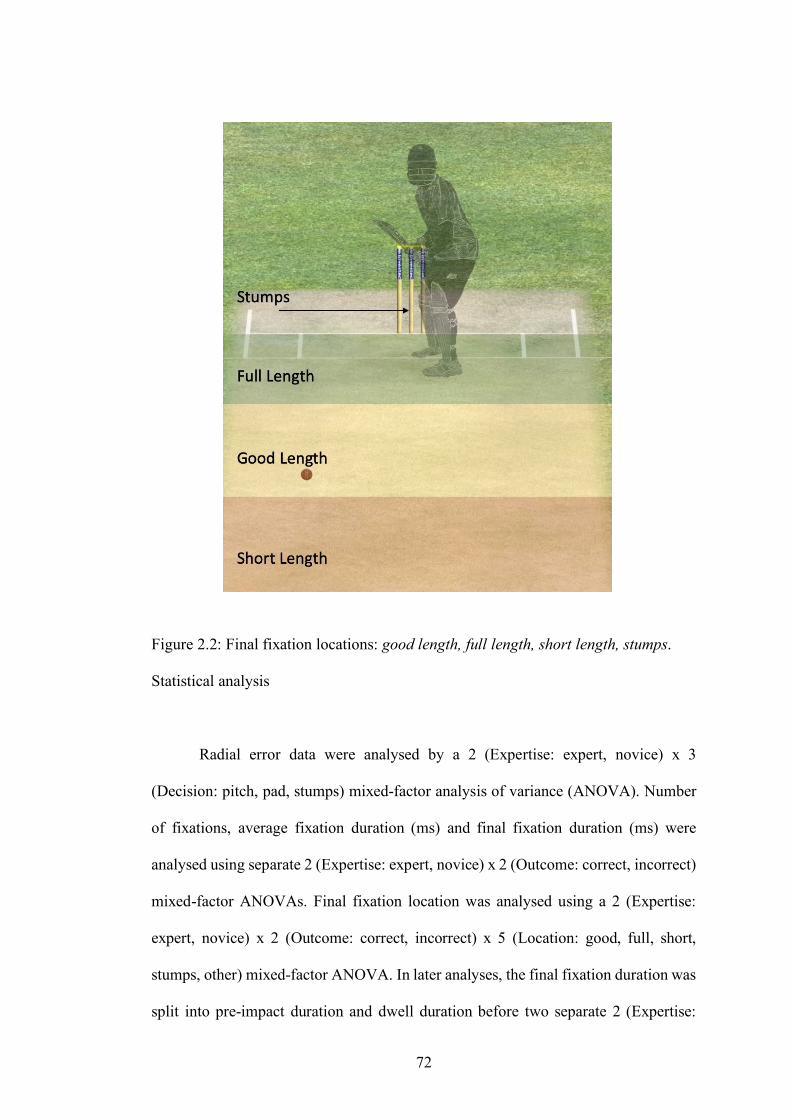
72
Figure 2.2: Final fixation locations: good length, full length, short length, stumps.
Statistical analysis
Radial error data were analysed by a 2 (Expertise: expert, novice) x 3
(Decision: pitch, pad, stumps) mixed-factor analysis of variance (ANOVA). Number
of fixations, average fixation duration (ms) and final fixation duration (ms) were
analysed using separate 2 (Expertise: expert, novice) x 2 (Outcome: correct, incorrect)
mixed-factor ANOVAs. Final fixation location was analysed using a 2 (Expertise:
expert, novice) x 2 (Outcome: correct, incorrect) x 5 (Location: good, full, short,
stumps, other) mixed-factor ANOVA. In later analyses, the final fixation duration was
split into pre-impact duration and dwell duration before two separate 2 (Expertise:

73
expert, novice) x 2 (Outcome: correct, incorrect) mixed-factor ANOVAs were used.
Separate analyses on the novice sample between experienced cricketers and non-
cricketers were also later conducted. Specifically, a 2 (Experience: experienced
cricketers, non-experienced cricketers) x 2 (Decision: pitch, pad, wickets) mixed-
factor ANOVA was used to analyse radial error. To analyse final fixation location, a
2 (Experience: experienced crickets, non-experienced cricketers) x 5 (Location: good,
full, short, stumps, other) mixed-factor ANOVA was used. Effect sizes were
calculated using partial eta squared values (ηp2). Greenhouse-Geisser epsilon was
used to control for violations of sphericity and the alpha level for significance was set
at .05 with Bonferroni adjustment to control for Type 1 errors.
A priori power analysis using G*Power (Faul et al. 2007) for a 3 x 2 within-
between ANOVA indicated a total sample size of 28 was needed to detect a medium
effect (f = 0.25) for the within-participant and interaction effects. The pool of expert
umpire participants was limited so it is important to note that statistical power for tests
of between-participant effects was only sufficient to detect larger effects (f > 0.42).
Results
Radial error (cm)
There was a large main effect of expertise, F1,29 = 8.88, p = .01, ηp2= .23 (see
Figure 2.3). Novice umpires had significantly higher error (M = 25.87 cm, SE = 1.31)
than the expert umpires (M = 19.61 cm, SE = 1.64). The novice group were less
accurate at determining the ball’s impact with the pitch (M = 24.60 cm, SE = 2.29),
pad (M = 22.65 cm, SE = 1.83) and stumps (M = 30.35 cm, SE = 2.02), compared to
the expert group (pitch: M = 20.57 cm, SE = 2.88; p < .05; pad: M = 16.15 cm, SE =
74
2.30; p < .05; stumps: M = 22.11 cm, SE = 2.55; p < .05). There was also a large main
effect of decision, F2,58 = 4.80, p = .01, ηp2= .14. Radial error was significantly higher
for stumps (M = 26.23 cm, SE = 1.63) compared to pad (M = 19.40 cm, SE = 1.47; p
< .05). There was no significant Group x Decision interaction F2,58 = .46, p = .63, ηp2=
.02. There were no main effects for experience, F1,17 = .26, p = .61, ηp2= .02. There
was a small main effect of decision, F2,34 = .3.27, p = .05, ηp2= .16. Radial error was
significantly higher for stumps (M = 30.56 cm, SE = 2.36) compared to pad (M =
22.86 cm, SE = 2.26; p < .05).
Figure 2.3: Radial error (cm) for expert and novice umpires, for pitch, impact and
stumps.
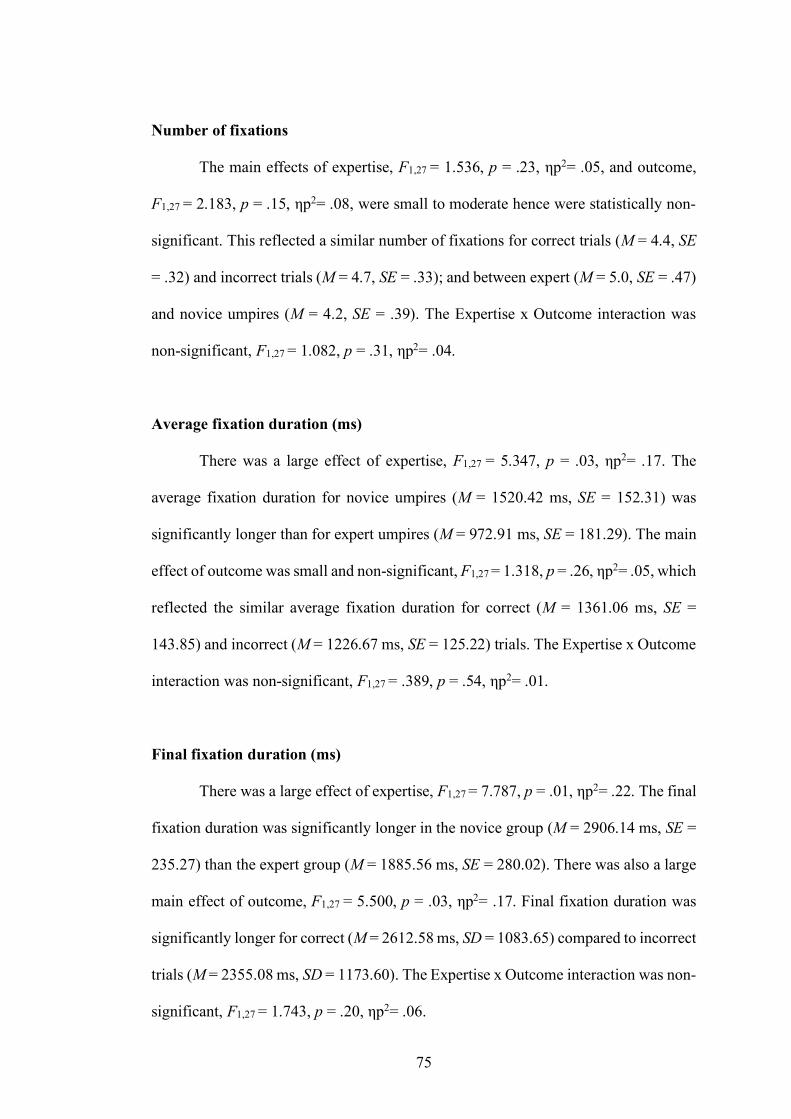
75
Number of fixations
The main effects of expertise, F1,27 = 1.536, p = .23, ηp2= .05, and outcome,
F1,27 = 2.183, p = .15, ηp2= .08, were small to moderate hence were statistically non-
significant. This reflected a similar number of fixations for correct trials (M = 4.4, SE
= .32) and incorrect trials (M = 4.7, SE = .33); and between expert (M = 5.0, SE = .47)
and novice umpires (M = 4.2, SE = .39). The Expertise x Outcome interaction was
non-significant, F1,27 = 1.082, p = .31, ηp2= .04.
Average fixation duration (ms)
There was a large effect of expertise, F1,27 = 5.347, p = .03, ηp2= .17. The
average fixation duration for novice umpires (M = 1520.42 ms, SE = 152.31) was
significantly longer than for expert umpires (M = 972.91 ms, SE = 181.29). The main
effect of outcome was small and non-significant, F1,27 = 1.318, p = .26, ηp2= .05, which
reflected the similar average fixation duration for correct (M = 1361.06 ms, SE =
143.85) and incorrect (M = 1226.67 ms, SE = 125.22) trials. The Expertise x Outcome
interaction was non-significant, F1,27 = .389, p = .54, ηp2= .01.
Final fixation duration (ms)
There was a large effect of expertise, F1,27 = 7.787, p = .01, ηp2= .22. The final
fixation duration was significantly longer in the novice group (M = 2906.14 ms, SE =
235.27) than the expert group (M = 1885.56 ms, SE = 280.02). There was also a large
main effect of outcome, F1,27 = 5.500, p = .03, ηp2= .17. Final fixation duration was
significantly longer for correct (M = 2612.58 ms, SD = 1083.65) compared to incorrect
trials (M = 2355.08 ms, SD = 1173.60). The Expertise x Outcome interaction was non-
significant, F1,27 = 1.743, p = .20, ηp2= .06.

76
Pre-Impact duration (ms)
There was no expertise main effect for pre-impact duration, F1,27 = 2.36, p =
.14, ηp2= .08. There was also no main effect of outcome, F1,27 = 3.06, p = .09, ηp2=
.10.
Dwell duration (ms)
There was a moderate effect of expertise for dwell duration, F1,27 = 10.30, p <
.01, ηp2= .28. The dwell duration was significantly longer in the novice group (M =
1567.27 ms, SE = 144.26) than the expert group (M = 847.58 ms, SE = 144.26). There
was no main effect for outcome, F1,27 = 1.51, p = .23, ηp2= .05.
Final fixation locations (%)
There was a very large main effect of location, F2.04, 53.09 = 17.80, p < .001,
ηp2= .41. (see Figure 2.4). A higher percentage of final fixations were directed towards
the stumps (M = 41.95%, SE = 4.97) than towards a good length (M = 21.51 %, SE =
4.01), a full length (M = 27.47 %, SE = 3.14) (p < .05), a short length (M = 2.54 %, SE
= 1.09) and other locations (M = 7.68 %, SE = 2.14) (all p < .01). A significantly
higher percentage of fixations were directed towards a good length and a full length
than towards a short length and other locations (all p < .01). There was also a large
interaction effect between expertise and location, F2.04, 53.09 = 7.04, p < .001, ηp2 = .21.
This reflected that the percentage of final fixations directed towards a good length was
higher in the novice group (M = 35.85 %, SE = 5.02) than the expert group (M = 7.17
%, SE = 6.24; p < .05), whereas the percentage of final fixations directed towards the
stumps was lower in the novice group (M = 28.89 %, SE = 6.24; p < .05) than in the
expert group (M = 55.51 %, SE = 7.75). When comparing experienced and non-

77
experienced cricketers within the novices, the group x location interaction was small
and statistically non-significant, F4,60= .75, p = .56, ηp2= .05. All other main effects
and interactions were non-significant (all p > .05).
Figure 2.4: Final fixation locations (%) for experts and novices on correct and
incorrect trials for good, full length, short length, stumps and other locations.
Discussion
In line with hypothesis 1, expert umpires were much more accurate on all
aspects of the decision-making task, compared to the novice group. Experts
demonstrated lower radial error when judging the location of the ball’s pitch and
impact with the batter’s pad, and when predicting the location the ball would have
passed the wickets had it not been obstructed. As well as providing predictive validity
for the task, these data demonstrate that umpires possess domain-specific expertise in
78
this complex decision making task similarly to Chalkley et al. (2013). Further to
Chalkley’s findings, this study highlights expert umpires possess domain specific
advantages on all three components of the LBW task as opposed to solely the wickets
aspect. These data also corroborate previous literature that has shown that expert
sports officials are able to make more accurate decisions, by developing refined
perceptual-cognitive strategies through deliberate practice activities, specifically
competitive match exposure (MacMahon et al. 2007). As performers become more
expert, they have been shown to use working memory more efficiently (Ericsson,
2008). In the current task, determination of pitch and pad primarily required the
umpires to accurately recall the ball’s spatial location, which might rely on the use of
working memory (Furley & Wood, 2016). Researchers have proposed that when
performing the task in which they are an expert in, performers are capable of
circumventing the limits of working memory by directly accessing domain-specific
information from long-term memory through retrieval cues in short-term working
memory (Ericsson & Kintsch, 1995). This may explain the more accurate decisions of
the experts in the pitch and pad judgements. Such an explanation would be in line with
the assumption that whilst elite officials do not have a greater working memory
capacity for general tasks, they acquire strategies that enable a more efficient use of
working memory in domain-specific activities (Spitz et al. 2016).
Despite their differences, both groups were less accurate when predicting
stumps compared to pad. This can be explained by the fact that judging ball flight path
after ball-pad contact requires a perceptual judgement based on a variety of factors
such as batter stance (Southgate et al., 2008), dynamics of the delivery (spin and
swing) and the ball’s surface degradation (Chalkley et al., 2013). Conversely, when

79
judging ball-pad impact, all visual information was present so the umpire did not need
to consider these contextual factors.
As well as accuracy differences, previous studies of expertise in sport have
consistently reported differences in the number of fixations and average fixation
duration between skill levels in a variety of tasks (Mann et al. 2007). It is generally
accepted that in a temporally constrained decision-making task, such as the current
study, a more efficient strategy consists of fewer fixations of longer duration (Mann
et al. 2019). This is predominantly to reduce suppression of information during
saccadic eye movements in order to maximise the information that can be gathered
(Ludwig, 2011). However, there was no significant difference in the number of
fixations between the groups. Furthermore, the average fixation duration for the
novice group was significantly longer than that of the expert umpires, although this
was not associated with more accurate decision making.
The finding that final fixation duration was significantly longer for the novices
compared to the experts, conflicts with hypothesis 2. Previous studies (Raab &
Laborde, 2011) have shown that experts are better able to generate the first and best
option, produce fewer overall options and are quicker to generate the first option than
near-experts and novices, therefore requiring a shorter final fixation. Conversely,
novices sometimes require a longer final fixation in order to extract the information
needed to make a judgement as they have less refined perceptual-cognitive strategies
(Mann et al., 2019). This is supported by reports that experts favour intuitive decision-
making, compared to novices, who tend to be more deliberative (Raab & Laborde,
2011). Novices have been shown to generate more options (Raab & Laborde, 2011)
and take longer to generate an initial response (Raab & Johnson, 2007). Conversely,
experts have been shown to generate fewer options and pick the first option more often
80
(Raab & Laborde, 2011), a strategy that has been shown to result in better and more
consistent decisions (Johnson & Raab, 2003). This take-the-first heuristic allows the
experts to make quick decisions under limitations of time, processing resources, or
information. Whilst these decisions are usually accurate, they can sometimes be
affected by biases (Raab & Johnson, 2007). Whilst cricket umpiring generally allows
some time for deliberation, it could be argued that the speed at which critical visual
information becomes available dictates that intuitive decision making plays a key role.
Whilst this argument corresponds with these unexpected findings and additionally the
expertise differences seen in hypothesis 1, an alternative explanation can be found in
Chirico et al. (2019). In the shooting section of the pentathlon laser run, experts
similarly adopted a shorter QE duration than the novices. It was proposed that this
atypical finding was a result of the experts being conditioned to perform under time
constraints where a compromise between the speed and accuracy of the task is
required. Similarly, it is possible that umpires select their decisions intuitively with
the intention of not slowing the match down. Despite this possibility, there is no
official ruling on the timeframe in which an umpire should select a decision, and
therefore comparisons with Chirico et al. (2018) remain unconvincing.
However, in support of hypothesis 3 and similarly to Chirico et al. (2018), a
longer QE duration in both groups led to more successful decisions. This finding
further supports the idea that the QE provides functional benefits in tasks which do
not require a motor component, perhaps due to increased dorsal visual stream
activation (Vickers, 2012) which is essential in determining an object’s location in the
environment (Zachariou et al. 2014). Further, this finding is in support of Schnyder et
al. (2017) who found preliminary evidence that the QE is of use in sporting officials
who are required to process multiple sources of information concurrently.
81
In hypothesis 4, it was predicted that expert umpires would use a perceptual-
cognitive strategy that consisted of a final fixation point (gaze anchor) in a location
central to the critical information sites. In support of this, the more accurate decisions
made by the expert group across all of the conditions could be explained by their
allocation of attention to the stumps significantly more than their novice counterparts,
who tended to allocate their final fixation towards a good length on the pitch. Such
differences also corroborate previous research within fast-ball sports (Broadbent et al.
2015), which have shown specialised perceptual-cognitive skills utilised by expert
performers enhance their ability to locate and identify salient cues which ultimately
aid decision making success. A gaze anchor is located in the centre of several critical
cues (pitch, pad, stumps) in order to distribute attention towards several information
points using peripheral vision. Use of the gaze anchor has been seen to enhance
decision making of football officials in expert and near-expert assistant football
referees, who anchored their gaze on the offside line as opposed directing foveal vision
on either the passer, the ball or the attacker (Schnyder et al. 2017). Such a strategy
might have held utility for this task and assistant football refereeing as both tasks do
not offer the official an abundance of time in which to make their decision, and
therefore peripheral vision acts as an additional attentional spotlight. Notably, the
actual fixation location (stumps) from the present study may not contain any task-
specific information that is being processed by the fovea, but is equidistant to the
pertinent cues (Vansteenkiste et al., 2014). Therefore, by anchoring their gaze toward
to stumps, the expert umpires are capable of utilising their peripheral vision to
ascertain the position the ball pitched as well as the initial angle of delivery using the
relative motion around the central point. Consequently, information processing via
foveal vision directed towards the stumps might have enhanced their ability to
82
perceive the height and line of impact with the pad and thus provided them with an
increased accuracy when judging the trajectory of the ball towards the stumps. The
expert’s ability to deploy a visual anchor might be a consequence of them possessing
a broader functional field of view (FFoV). In a driving task, Crundall (1999) found
experienced drivers identified more stimuli on the periphery of the display than lesser
experienced counterparts. Further, when cognitive demands were increased, both
samples suffered from a decrease in ability to pick up the peripheral stimuli. It has
been argued that domain specific experience enables a wider FFoV due to optimal
performance requiring lower processing demands being placed on the central task.
Such a view might also correspond with the capability of expert’s utilising the
aforementioned LT-WM, where some of the limitations of working memory are
reportedly circumvented. With this is translated to cricket umpiring, perhaps the
central LBW decision making requires lower cognitive effort on the cricket umpires
and as result they can employ the gaze anchor to process peripheral cues due to
possession of a broader FFoV.
Conversely, with a shrunken FFoV, the novice umpires might not have been
capable of utilising both foveal and peripheral vision to make the judgements, and
therefore might have fixated on a good length due to the pitch aspect being the first
consideration when applying the LBW law. In addition to a possible reduced FFoV,
the demands of processing multiple trajectories and impact points may have
overwhelmed the working memory capacity of the novices leading to less accurate
decisions on the later variables. The information reduction hypothesis (Haider &
Frensch, 1999) postulates that when individuals practice a task, they selectively
allocate attentional processes towards task-relevant information at the expense of task-
redundant information which limits the load on working memory processes, and as a

83
consequence enhances performance. In the current study, the expert’s anchoring their
vision on the stumps may have permitted them to selectively process critical
information related to pad and wickets and thus reduce task-redundant processing.
Consequently, load on the working memory will have been reduced and recall of all
three components of the LBW law may have been enhanced.
Summary
Taken together these data show that expert umpires have developed a
systematic perceptual-cognitive strategy, comprising a gaze anchor, that enables them
to overcome the processing demands and maximise accuracy in a complex decision
making task. These data provide an important first step toward the design of training
interventions to help less-skilled umpires develop a more refined and systematic visual
strategy to enhance decision making. However, further research is required to
determine the processing demands in umpires during a delivery, which includes other
elements, such as the front foot no ball call, and other external factors influencing
attentional control. For example, the use of a real-life bowler, and the front foot no
ball decision, would increase the representativeness of both the batter’s biomechanics
(Pinder et al. 2009) and the overall match demands of an umpire, which may alter the
umpires’ visual strategy. It is possible that the limited time between the front foot
grounding and the ball-pad impact might impair the use of the gaze anchor and require
umpires to implement an alternative gaze strategy. Understanding the development of
these domain-specific perceptual-cognitive skills and the effect of other attentional
and contextual factors will be critical in designing any future training interventions.

84
Chapter 3:
Task-Switching, Attentional Allocation and LBW decision making

85
Abstract
Cognitive psychologists have consistently shown that switching between
consecutive tasks can result in the misallocation of attention and poorer performance.
Cricket umpires are required to determine the legality of each delivery by considering
the landing position of the bowler’s front foot in relation to the crease, before
reallocating their attention to events related to the ball and batter. The aim of this study
was to examine whether this attentional switch would modulate performance when
adjudicating leg before wicket (LBW) decisions. Fifteen expert cricket umpires wore
an eye tracker as they performed a series of LBW decision tasks in two conditions
(task-switching, control), with and without the requirement to adjudicate the front foot
no ball’. Dependant variables were: radial error (cm), final fixation duration (ms), pre-
impact duration (ms), post-impact dwell time (ms), number of fixations, average
fixation duration (ms) and final fixation location (%). Overall radial error was not
significantly different between the ‘task-switching’ and ‘control’ conditions; however,
radial error was higher on the initial ‘pitch’ judgement in the task-switching, compared
to control condition. In successful trials, umpires employed a longer final fixation
duration and post-impact dwell time on the stumps. Task-switching led to shorter final
fixation and pre-impact durations as well as an increase number of final fixations to
less-relevant locations. These data suggest that expert umpires use adaptive gaze
strategies to maintain decision accuracy despite increases in processing demands and
the constraints of reallocating attention. These data have implications for
understanding expert perceptual-cognitive skill in complex decision-making tasks and
may have implications for the development of training protocols for sub-elite umpires.
86
Every day there is a demand for individuals to attend to multiple tasks
successively over a short period of time (Vandierendonck et al. 2010). Researchers
have highlighted the debilitative effect that task-switching can have on response time
and overall performance accuracy (Monsell, 2003). When switching between tasks
individuals can experience ‘attentional inertia’, where they require a longer period to
re-orientate their visual attention towards a secondary task, as well as being more
likely to orientate attention towards task-irrelevant cues (Longman et al. 2013). In
sport, athletes, coaches and officials are often placed under severe temporal
constraints, with high processing demands, whilst trying to navigate a complex and
transient environment (Mann et al. 2019). Therefore, individuals are required to switch
between multiple sources of information in order to achieve an optimal outcome.
In cricket, umpires must switch from determining the location of the bowler’s
landing foot at one end of the pitch, to monitoring the trajectory of a ball travelling up
to 95 mph towards the batter, before making a series of perceptual-cognitive
judgements approximately 22 yards away from the release point, all in under a second
(Chedzoy, 1997). The most complex decision for an umpire is the leg before wicket
(LBW) judgement (Craven, 1998). Firstly, according to Law 36 of the Marylebone
Cricket Club (2017) laws of cricket, an umpire is required to determine the legality of
the delivery by observing if any part of the bowler’s shoe is grounded behind the
popping crease and inside the return crease (see Figure 3.1). Next, umpires must
perform an accurate refixation towards the batter (Southgate et al. 2008) to determine
whether the ball: 1) ‘pitched’ (bounced) in line, offside or legside of the stumps (see
Figure 3.2); 2) impacted the batter’s pad in line with the stumps; and 3) would have
hit the wickets if the batter’s pad had not obstructed the ball. Umpires are required to
process all of this information, as well as account for environmental information, such
87
as ball condition and pitch degradation, with little over 500 ms of visual information
(Chalkley et al. 2013). In order to alleviate some of these constraints, it was suggested
in Chapter 2 that expert umpires use systematic and refined perceptual-cognitive
strategies, comprising a long final fixation (gaze anchor) on the stumps at ball-pad
impact.
A gaze anchor (Vater et al. 2019) involves a fixation located in the centre of
multiple critical cues in order to distribute attention to several sources of information
using peripheral vision. Importantly, the actual fixation location may not contain any
task-specific information that is being processed by the fovea, but is equidistant to the
pertinent cues (Vansteenkiste et al. 2014). A long, stable fixation before a critical
action, termed the quiet eye (QE) (Vickers, 1996), has been reported to be related to
more accurate performance in a range of targeting and interceptive tasks (Vickers,
2016a). Effective quiet eye is typically predicated by an earlier fixation onset on a
target (Causer et al. 2010), allowing for maximum information extraction of task-
relevant information from the critical source. Further, due to the immense time
constraints faced by umpires whilst each delivery is live (between the time the ball is
released and when it strikes the batter’s pad), it was suggested in Chapter 2 that there
was only an allowance for umpires to allocate one fixation on an area of interest, as
opposed to utilising strategies such as a visual pivot.
Researchers have shown reduced cognitive performance when switching
between different task-sets, this phenomenon being termed the ‘switch cost’, which
can lead to reduced overall performance and increased response time on the second
task (Vandierendonck et al., 2010). Task sets can be considered distinct from one
another should they possess task-specific processes such as perceptual encoding,
memory retrieval, response selection or response execution (Schneider & Logan,
88
2007). A potential explanation for switch costs is related to impaired reorientation of
visual attention (Longman et al., 2013; Longman et al. 2014), which occurs
concurrently during task-set inhibition and/or task-set reconfiguration (Longman et al.
2016). Specifically, there is evidence that task-switching impairs spatial attentional re-
allocation towards a secondary task (Longman et al., 2013; Longman et al. 2017;
Longman et al., 2014). Longman et al. (2013) found when participants had to switch
between a facial recognition task and letter recognition task, they were more likely to
fixate on the irrelevant location. The term ‘attentional inertia’ was coined where the
researchers suggested attentional parameters had not been fully reset towards the
second task, resulting in an increased tendency to fixate on the previously relevant but
now irrelevant task. In a follow-up study, Longman et al. (2014) provided further
evidence of ‘attentional inertia’ during the task-switch as participants were more likely
to fixate on the previously relevant task location as opposed to an irrelevant task that
was not performed previously, suggesting attentional parameters were not fully reset
as participants switched tasks. Longman et al. (2017) found that when the attentional
switch between the first and second task was self-paced, there was no explicit bias in
fixating on the previously relevant task, but the switch cost and attentional
impairments remained. Taken together these data suggest that task-switching,
regardless of preparatory periods, may modulate spatial attention allocation towards
the second task.
To date, few researchers have examined whether calling the front foot no ball
debilitates decision making in cricket umpires. One exception was Southgate et al.
(2008), who had first class umpires view simulated LBW appeals and determine
whether the ball pitched ‘in-line’ or ‘outside the line’ of the stumps. Prior to making
the decision, they were required to either make a front foot no ball decision, a back
89
foot no ball decision, or no additional decision. Results showed that when required to
attend to either no ball task first, umpires were significantly less accurate at
determining where the ball bounced in relation to the stumps. Such results are in line
with switch-cost literature, as performance on the LBW task was significantly poorer
when umpires switched from the no-ball task. However, there were no additional
attention measures that would have permitted a more detailed understanding of how
task switching influences umpire decision making.
The aim of the current study was to examine the effect of task-switching on
gaze behaviour and decision-making accuracy in expert cricket umpires. A
representative, sport-specific task was developed, which matched the processing
demands and temporal constraints of cricket umpiring. In the task-switching
condition, the umpires were required to make a front foot ‘no ball’ judgement, before
adjudicating three LBW-related judgments; where the ball pitched, impacted the
batter’s pad, and would have hit/passed the wicket. In the control condition, the
umpires only made the three LBW-related judgments. It was predicted that; 1) task-
switching would debilitate umpire performance on the ‘pitch’ component of the LBW
decision more than the pad and wicket decision of the task due to the timing and order
of critical cue availability (Southgate et al. 2008); 2) a longer quiet eye (gaze anchor)
on the stumps would lead to more accurate LBW judgements (Chapter 2); 3) the
additional task-switching requirement of the prior ‘no ball’ judgment would lead to
attention being allocated towards cues unrelated to the LBW decision making process
more often than when umpires made exclusively LBW decisions with no preceding
secondary task (Longman et al., 2017).
Methods
90
Participants
Participants were 15 expert umpires (M = 53 years, SD = 16) who had
officiated in organised cricket at elite club level (n = 11) and national level (n = 4).
The expert umpires had a mean of 11 years (SD = 7) of competitive umpiring
experience and had accumulated a mean of 274 matches (SD = 156). Participants gave
their informed consent prior to taking part in the study and the study was approved by
the Research Ethics Committee of the lead institution.
Task & Apparatus
Gaze behaviours were recorded using the TobiiGlasses2 corneal reflection eye
movement system (Tobii Technology AB; Danderyd, Sweden). The test film was
recorded at the Marylebone Cricket Club Cricket Academy. Video footage from an
umpire’s perspective was recorded using a Canon VIXIA HFR706 camera (Tokyo,
Japan). The camera was positioned in line with middle stump 1.00 m away from the
non-strikers popping crease. A right-handed batter who competes in the
Worcestershire Premier League faced a number of deliveries delivered by a BOLA
Bowling Machine (Bola Manufacturing Ltd.; Bristol, UK), from over the wicket, at
speeds between 65-80 mph. The batter was encouraged to play their ‘natural game’
whilst facing these deliveries. Deliveries that struck the batter’s pad were termed
‘appeals’ and were reviewed via ‘Hawk-Eye’ (Basingstoke, UK), which reconstructed
the ball flight characteristics should the obstruction not have occurred (Collins, 2010).
Hawk-Eye technology utilises a theory of triangulation, which helps predict post ball-
pad impact by measuring angles from the known points of the delivery’s pre-impact
flight (Duggal, 2014). In total, 16 appeals were used for the study, 12 appeals were
deemed ‘out’ and four deemed ‘not out’ by Hawk-Eye. Based on the surface, 4 trials

91
were deemed to have pitched on a ‘good length’ and 4 trials were deemed to have
pitched on a ‘full’ length in each condition. Each task-switching trial was paired with
a control trial which corresponded in the region the ball pitched, impacted the batter’s
pad and where it would have travelled post impact. As a result, in each condition hawk
eye predicted 3 trials would have middle stump, 3 trials would have struck leg stump
and 2 trials would have missed the stumps. Based on pilot testing, trials that were
deemed too easy (85% and above in accuracy), were omitted from the final test film.
To examine the effect of task-switching, 8 of the trials required umpires make
the front foot ‘no ball’ judgement prior to adjudicating the LBW appeal, whilst the
remaining 8 trials exclusively involved adjudication of the LBW appeal. In the task-
switching condition, umpires were required to direct their attention towards the
popping crease (see Figure 3.1) where a cricket shoe was superimposed. If any part of
the shoe appeared behind the popping crease the delivery was deemed legal. Based on
research by Felton et al. (2019), the shoe appeared 100-125 ms prior to ball release
from the bowling machine and remained grounded for a further 200 ms.
Figure 3.1: Examples of a front foot ‘no ball’: a) legal delivery; b) ‘no ball’; and c)
‘no ball’.
The footage was edited using Windows Movie Maker 2016 (Washington,
USA). Each appeal formed one trial. For each trial the trial number, position of the
92
delivery and condition (task-switching or control) were each shown for 3.0 seconds
and were followed by a 3-second countdown. The video clip started 3.0 seconds before
ball release, to represent the time for a bowler’s run-up in a match scenario. The video
clip continued for a further 3.0 seconds after ball-pad impact, and was followed by a
black screen, which signalled the end of the trial. Task-switching trials and control
trials were presented randomly.
Procedure
Participants were fitted with the TobiiGlasses2 (Tobii AB; Stockholm,
Sweden) eye tracker and were calibrated using a one-point calibration card held by the
researcher 1.00 m away. The test film was projected by an Epson EB-7000 projector
(Suwa; Japan) onto a large Cinefold Projection Sheet (Draper Inc; Spiceland, IN; 2.74
m x 3.66 m). Participants stood 3.20 m away from this display to ensure it subtended
a visual angle of 12.8°, thereby replicating the height of the batter in situ. To cross-
check calibration, participants viewed a still image of the pitch and were asked to
direct their visual attention towards the stumps. This was repeated throughout the data
collection period to ensure participant gaze remained calibrated with the eye trackers.
The researchers provided the participants with an overview of the LBW rule as per
Marylebone Cricket Club guidelines. To familiarise participants with the experiment
protocol and response requirements, they observed two familiarisation trials, which
showed LBW appeals similar to those in the test and an example of the front foot ‘no
ball’ task. Participants verbally predicted the three components of LBW adjudication
then viewed a handout that showed the Hawk-Eye ball flight path. This familiarised
participants with the scale of the Hawk-Eye slides they would use to record judgments
for each trial. Following this the testing period began. For the task-switching trials,
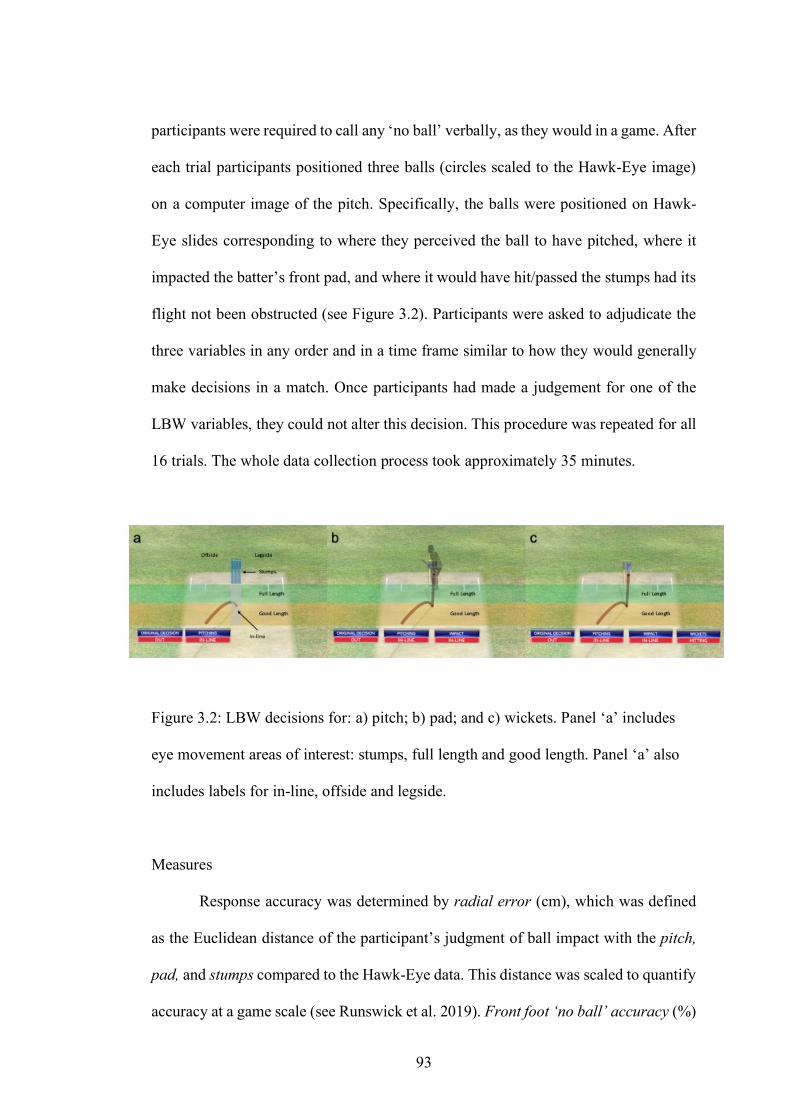
93
participants were required to call any ‘no ball’ verbally, as they would in a game. After
each trial participants positioned three balls (circles scaled to the Hawk-Eye image)
on a computer image of the pitch. Specifically, the balls were positioned on Hawk-
Eye slides corresponding to where they perceived the ball to have pitched, where it
impacted the batter’s front pad, and where it would have hit/passed the stumps had its
flight not been obstructed (see Figure 3.2). Participants were asked to adjudicate the
three variables in any order and in a time frame similar to how they would generally
make decisions in a match. Once participants had made a judgement for one of the
LBW variables, they could not alter this decision. This procedure was repeated for all
16 trials. The whole data collection process took approximately 35 minutes.
Figure 3.2: LBW decisions for: a) pitch; b) pad; and c) wickets. Panel ‘a’ includes
eye movement areas of interest: stumps, full length and good length. Panel ‘a’ also
includes labels for in-line, offside and legside.
Measures
Response accuracy was determined by radial error (cm), which was defined
as the Euclidean distance of the participant’s judgment of ball impact with the pitch,
pad, and stumps compared to the Hawk-Eye data. This distance was scaled to quantify
accuracy at a game scale (see Runswick et al. 2019). Front foot ‘no ball’ accuracy (%)
94
was defined as the percentage of correct responses. Fixations were defined as gaze
being directed towards a location within 3 ° of the visual angle for a minimum of
100ms (Vickers et al 2019). Number of fixations were measured from the onset of the
trial until the offset of the trial. Average fixation duration (ms) was calculated by
dividing the total fixation duration by the number of fixations of each trial. Final
fixation duration (ms) was the duration of the last fixation prior to ball-pad impact
until conclusion of post-impact dwell time. Based on previous research (Causer et al.
2017), the final fixation duration was then split into two components: pre-impact
duration and post-impact dwell time in order to identify changes in gaze strategy. Pre-
impact duration (ms) was defined as the duration from the onset of the final fixation
until ball-pad impact. Post-impact dwell time (ms) was defined as the fixation duration
from ball-pad impact until offset of the fixation. Final fixation location (%) was
defined as the percentage of trials participant’s final fixation was located on a specific
area. Four fixation locations were coded: good length, full length, stumps, and other
(see Figure 3.2). The front pad of the batter occludes a large proportion of the stumps
during a standard delivery. Therefore, when umpires directed their vision towards the
batter’s front pad, this was coded as ‘stumps’ as the umpires typically maintained their
gaze on the stumps after the batter had moved away, suggesting they were anchoring
their gaze on the stumps as opposed to following the batter’s pad.
Statistical Analysis
For each participant, in each condition, the three trials with the lowest overall
radial error were classed as successful, whereas the three trials with the highest overall
radial error were classed as unsuccessful. Radial error data were analysed by a 2
(Condition: task-switching, control) x 3 (Decision: pitch, pad, wickets) repeated
95
measures analysis of variance (ANOVA). A paired t-test was conducted to examine
differences in the percentage of correct ‘no ball’ decisions in successful and
unsuccessful trials. Number of fixations, average fixation duration (ms), final fixation
duration (ms), pre-impact duration (ms) and post-impact dwell time (ms) were
analysed using separate 2 (Condition: task-switching, control) x 2 (Outcome:
successful, unsuccessful) repeated measures ANOVAs. Final fixation location was
analysed using a 2 (Condition: task-switching, control) x 2 (Outcome: successful,
unsuccessful) x 4 (Location: good, full, stumps, other) repeated measures ANOVA.
Effect sizes were calculated using eta squared (η2) partial eta squared (ηp2) and
Cohen’s d values, as appropriate. Greenhouse-Geisser epsilon was used to control for
violations of sphericity and the alpha level for significance was set at .05 with
Bonferroni adjustment to control for Type 1 errors. A priori power analysis using
PANGEA (v0.2) (https://jakewestfall.shinyapps.io/pangea) for the 2 x 3 within-factors
ANOVA with eight replicates per data point indicated that 15 participants was
sufficient to detect a medium effect size (d = 0.5) interaction with a power of 0.85.
Power of 0.80 was attainable for detection of medium-large effect sizes for the main
effects of condition (d = 0.68) and decision (d = 0.66). For the 2 x 2 ANOVAs, 15
participants yielded power of 0.74 to detect a medium sized interaction (d = 0.5). For
the paired t-test comparisons, G*Power (Faul et al. 2007) showed that 15 participants
yielded power of 0.66 to detect a medium effect size (d = 0.5).
Results
Radial Error (cm)

96
Analysis of radial error data revealed a very large effect of decision, F2, 28 =
16.55 p < .001, ηp2 = .54, caused by significantly larger error on the judgments of
wickets (M = 24.05 cm, SE = 1.71), compared to those for pitch (M = 13.75 cm, SE =
1.28) and pad (M = 16.19 cm, SE = 1.0) (both p < .01). Consistent with the
experimental hypothesis, there was a significant interaction between condition and
decision, F2, 28 = 8.02 p = .002, ηp2 = .36 (see Figure 3.3). This reflected that in
judgements of pitch, as radial error was higher in the task-switching condition (M =
14.65 cm, SE = 1.08) compared to the control condition (M = 12.85 cm, SE = 1.56; d
= .35). Conversely, radial error for pad judgements was significantly lower in the task-
switching condition (M = 14.76 cm, SE = .84) than in the control condition (M = 17.61
cm, SE = 1.34; p = .05, d = .66). Judgments for wickets was not significantly different
between the task-switching condition (M = 23.69 cm, SE = 1.34) and the control
condition (M = 23.40 cm, SE = 2.16; p = .01, d = .04). The main effect of condition,
F1,14 = .66, p = .43, ηp2 = .05, was small and statistically non-significant.
Figure 3.3: Radial error (cm; SE) for pitch, pad and wickets in the task-switching
and control conditions.

97
Front foot ‘no ball’ accuracy (%)
There was no significant difference in the percentage of correct ‘no ball’
decisions in successful (M = 67.78 %, SE = 6.65) and unsuccessful trials (M = 66.67
%, SE = 5.27; d = .04) (t(14)= -.13, p = .90). This shows that higher performance on
the ‘no ball’ judgment task did not affect combined accuracy across the three LBW
judgments.
Number of Fixations
There was a very large effect of condition, F1,14 = 41.60, p < .001, ηp2 = .75,
caused by umpires making more fixations in the task-switching condition (M = 7.05,
SE = .41) than in the control condition (M = 4.76, SE = .33). The main effect of
outcome, F1,14 = .03, p = .87, ηp2 = .002, and condition x outcome interaction, F1,14 =
.04, p = .84, ηp2 = .003, were small and statistically non-significant.
Average fixation duration (ms)
There was a large effect of condition, F1,14 = 13.11, p = .003, ηp2 = .48. Average
fixation duration in the task-switching condition was significantly shorter (M = 980.83
ms, SE = 66.68) than in the control condition (M = 1515.83 ms, SE = 139.34). The
main effect of outcome, F1,14 = .38, p = .55, ηp2 = .03, and condition x outcome
interaction, F1,14 = .63, p = .44, ηp2 = .04, were small and statistically non-significant.
Final fixation duration (ms)
There was a very large effect of condition, F1,14 = 72.65, p < .001, ηp2 = .84
(see Figure 3.4). Final fixation duration was shorter in the task-switching condition
(M = 2197.11 ms, SE = 149.50) than in the control condition (M = 3344.89 ms, SE =
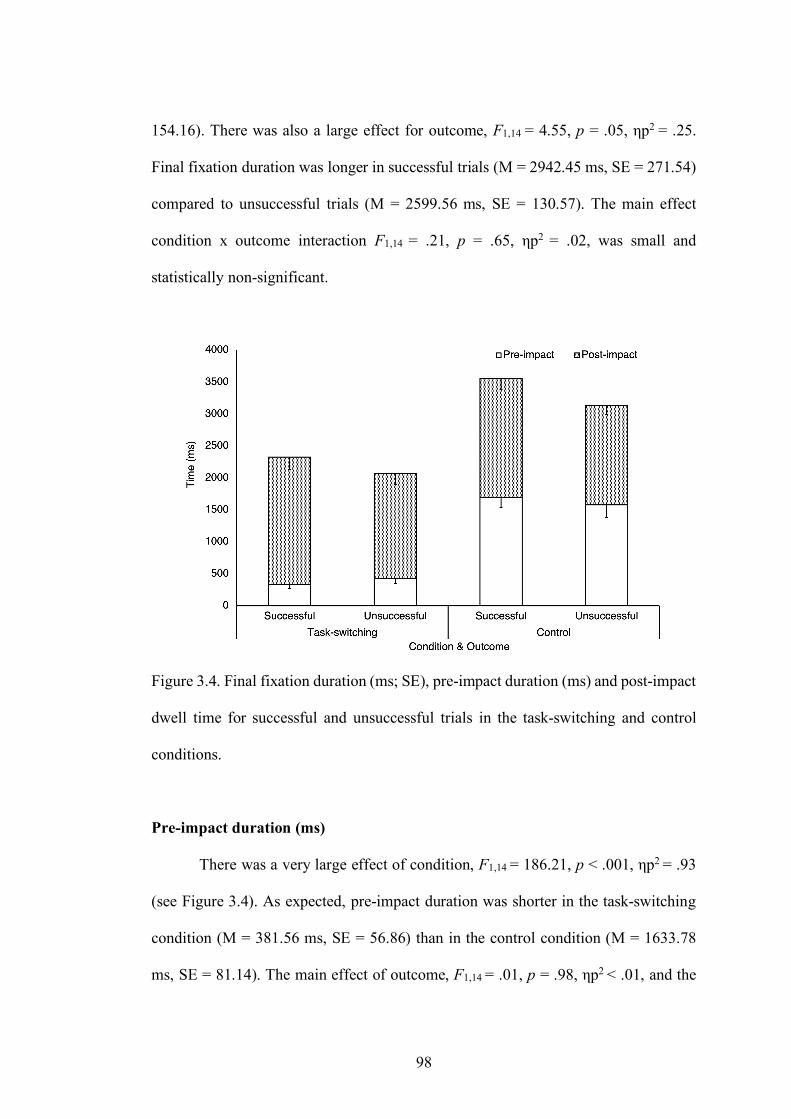
98
154.16). There was also a large effect for outcome, F1,14 = 4.55, p = .05, ηp2 = .25.
Final fixation duration was longer in successful trials (M = 2942.45 ms, SE = 271.54)
compared to unsuccessful trials (M = 2599.56 ms, SE = 130.57). The main effect
condition x outcome interaction F1,14 = .21, p = .65, ηp2 = .02, was small and
statistically non-significant.
Figure 3.4. Final fixation duration (ms; SE), pre-impact duration (ms) and post-impact
dwell time for successful and unsuccessful trials in the task-switching and control
conditions.
Pre-impact duration (ms)
There was a very large effect of condition, F1,14 = 186.21, p < .001, ηp2 = .93
(see Figure 3.4). As expected, pre-impact duration was shorter in the task-switching
condition (M = 381.56 ms, SE = 56.86) than in the control condition (M = 1633.78
ms, SE = 81.14). The main effect of outcome, F1,14 = .01, p = .98, ηp2 < .01, and the
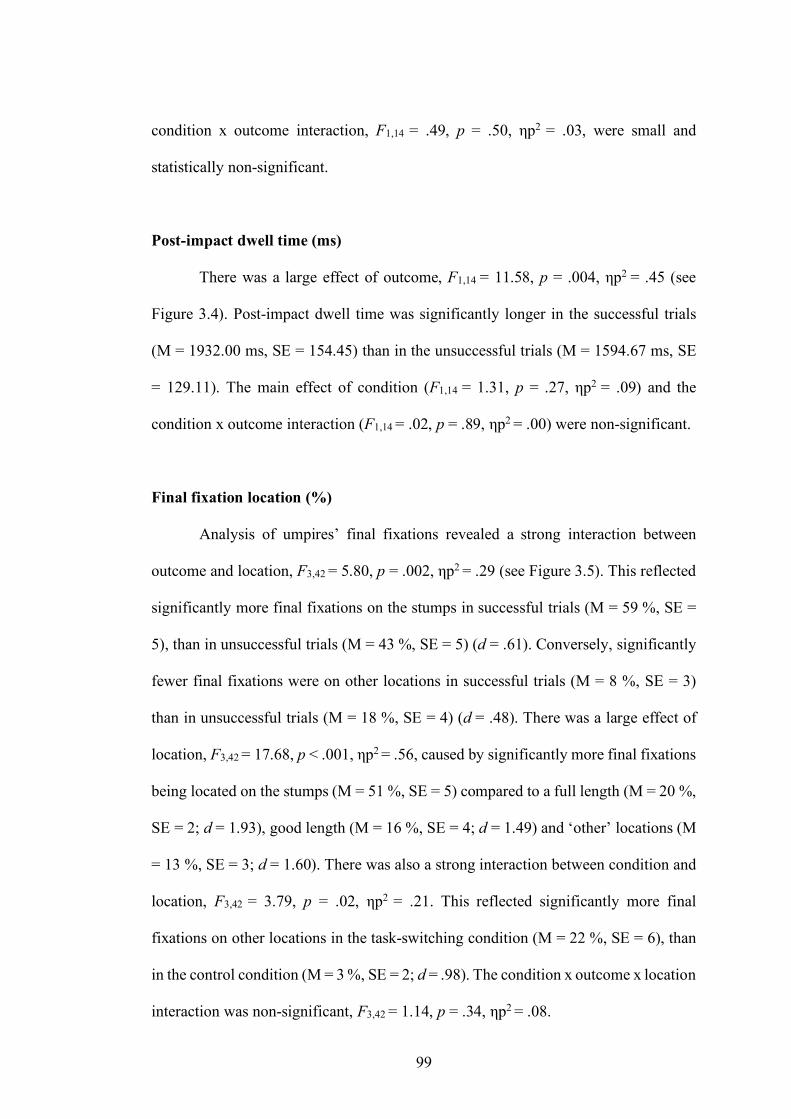
99
condition x outcome interaction, F1,14 = .49, p = .50, ηp2 = .03, were small and
statistically non-significant.
Post-impact dwell time (ms)
There was a large effect of outcome, F1,14 = 11.58, p = .004, ηp2 = .45 (see
Figure 3.4). Post-impact dwell time was significantly longer in the successful trials
(M = 1932.00 ms, SE = 154.45) than in the unsuccessful trials (M = 1594.67 ms, SE
= 129.11). The main effect of condition (F1,14 = 1.31, p = .27, ηp2 = .09) and the
condition x outcome interaction (F1,14 = .02, p = .89, ηp2 = .00) were non-significant.
Final fixation location (%)
Analysis of umpires’ final fixations revealed a strong interaction between
outcome and location, F3,42 = 5.80, p = .002, ηp2 = .29 (see Figure 3.5). This reflected
significantly more final fixations on the stumps in successful trials (M = 59 %, SE =
5), than in unsuccessful trials (M = 43 %, SE = 5) (d = .61). Conversely, significantly
fewer final fixations were on other locations in successful trials (M = 8 %, SE = 3)
than in unsuccessful trials (M = 18 %, SE = 4) (d = .48). There was a large effect of
location, F3,42 = 17.68, p < .001, ηp2 = .56, caused by significantly more final fixations
being located on the stumps (M = 51 %, SE = 5) compared to a full length (M = 20 %,
SE = 2; d = 1.93), good length (M = 16 %, SE = 4; d = 1.49) and ‘other’ locations (M
= 13 %, SE = 3; d = 1.60). There was also a strong interaction between condition and
location, F3,42 = 3.79, p = .02, ηp2 = .21. This reflected significantly more final
fixations on other locations in the task-switching condition (M = 22 %, SE = 6), than
in the control condition (M = 3 %, SE = 2; d = .98). The condition x outcome x location
interaction was non-significant, F3,42 = 1.14, p = .34, ηp2 = .08.
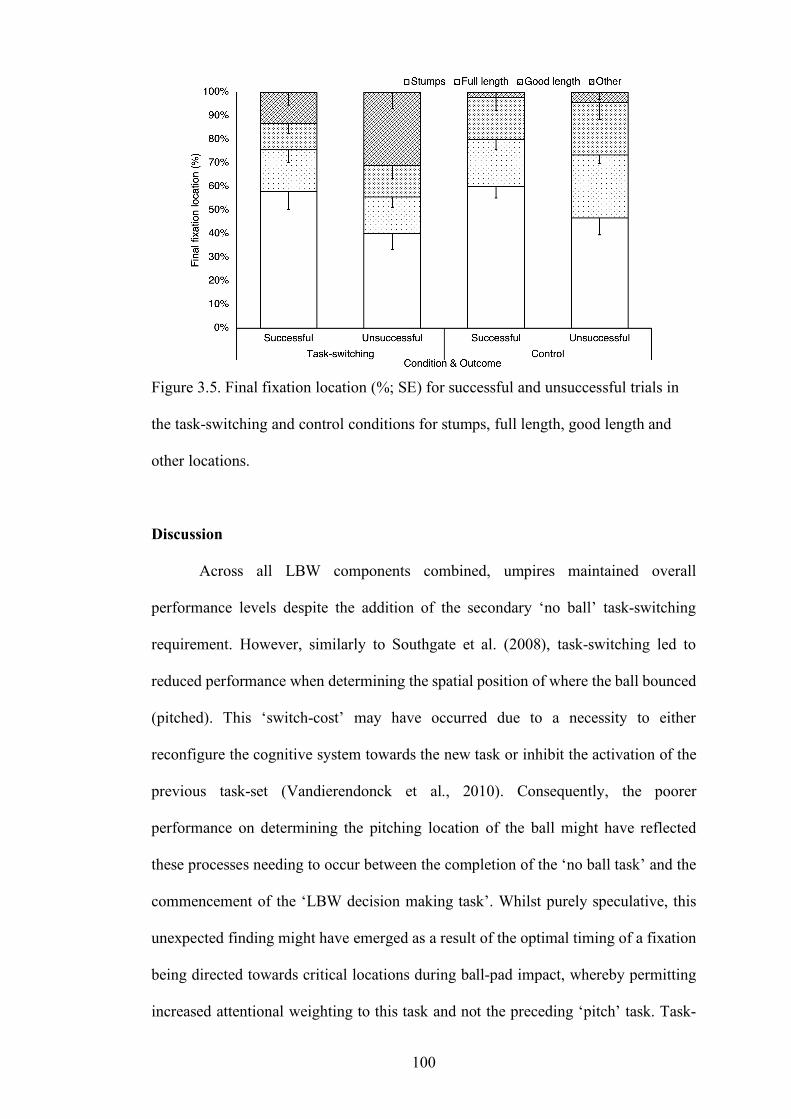
100
Figure 3.5. Final fixation location (%; SE) for successful and unsuccessful trials in
the task-switching and control conditions for stumps, full length, good length and
other locations.
Discussion
Across all LBW components combined, umpires maintained overall
performance levels despite the addition of the secondary ‘no ball’ task-switching
requirement. However, similarly to Southgate et al. (2008), task-switching led to
reduced performance when determining the spatial position of where the ball bounced
(pitched). This ‘switch-cost’ may have occurred due to a necessity to either
reconfigure the cognitive system towards the new task or inhibit the activation of the
previous task-set (Vandierendonck et al., 2010). Consequently, the poorer
performance on determining the pitching location of the ball might have reflected
these processes needing to occur between the completion of the ‘no ball task’ and the
commencement of the ‘LBW decision making task’. Whilst purely speculative, this
unexpected finding might have emerged as a result of the optimal timing of a fixation
being directed towards critical locations during ball-pad impact, whereby permitting
increased attentional weighting to this task and not the preceding ‘pitch’ task. Task-

101
switching also led to significantly more final fixations made on less-informative areas
(other). When moving between fixation locations using saccades there is typically a
spatial relocation error (Becker, 1972). Furthermore, researchers have consistently
reported an undershoot of the target location by 5-10%, as well as the requirements of
at least one ‘catch-up’ saccade to establish an accurate fixation on the intended target
(Aitsebaomo & Bedell, 1992; Kowler & Blaser, 1995; Poletti et al. 2020). This
inaccuracy can be explained by previous work reporting that task-switching results in
spatial attentional re-allocation being directed towards cues unrelated to the secondary
task when there is insufficient time to adjust attentional settings to completion
(Longman et al., 2013, 2017; Longman et al., 2014). This may explain why more final
fixations were made to less-relevant areas of the display when umpires made a saccade
from the ‘no ball’ task to the main LBW judgments.
Despite task-switching appearing to modulate attentional allocation, across
both conditions the umpires still utilised a gaze anchor on the stumps at the point of
ball-pad impact; a technique associated with expert cricket umpires (Chapter 2). A
gaze anchor is located in the centre of several critical cues (pitch, pad, stumps) in order
to distribute attention to several cues using peripheral vision. This strategy enables
multiple sources of information to be processed without the need for saccadic eye
movements, therefore maximising the information that can be acquired (Vater et al.,
2019). Final fixations were located on the stumps significantly more in successful
trials compared to unsuccessful trials, providing some evidence that the gaze anchor
on the stumps is the most effective strategy when required to consider the three
components of the LBW decision. Like in Chapter 2, predicting the wickets
component of the task resulted in less accuracy than the other two components. This
was likely due to the nature of the wickets decision requiring a perceptual estimation
102
based on aspects related to the delivery (Chalkley et al., 2013), whereas the other two
components rely less on estimation, as spatial information related to the ball’s impact
points were fully visible during the appeal. Therefore, the final fixation on the stumps
would have provided the umpires with more information to refine their estimation, on
what appears to be the most difficult component of LBW decisions.
Whilst the location of the final fixation is important, the duration of it also
critical to successful decision making. Whilst a longer QE duration led to more
successful LBW decisions, a shorter QE duration in the task-switching condition did
not impact overall LBW performance. This was due to the dwell component of the QE
being significantly longer in accurate decisions. A longer dwell time or final fixation
has long been associated with more successful performance, and was also reported in
the current study (Wilson et al. 2016). In tasks with clear perception-action coupling
the advantage is suggested to be with pre-programing of task-relevant information,
such as distance, force and environmental factors (Wilson et al. 2015). However, in
the current task, there is no clear action component, simply a perceptual judgment
task. Therefore, the longer dwell period in the current study may have enabled more
accurate processing of the ball flight characteristics as well as the prediction of the
ball flight path after impact with the pad.
Due to the constraints during the task-switching condition, compared to the
control condition, there were predictably more fixations of shorter duration and the
pre-impact QE duration was significantly shorter. This observation is typically
associated with a less efficient strategy in temporally constrained tasks (Mann et al.,
2019), however, in the current task this was necessary to allow umpires to attend to
both tasks. The timing of the ‘no ball’ decision enforced later onset of the final fixation
associated with the LBW judgments, reflected in the shorter pre-impact duration in

103
the task-switching condition (Figure 3.4). Earlier onset of final fixation has
consistently been found to be a characteristic of more accurate performance in a range
of targeting and interceptive tasks (for review see Vickers, 2016a). However, the onset
of the final fixation has been often linked to benefits in pre-programming of movement
parameters in a task that requires an action. Therefore, in the present task, which did
not require any movement related behaviours, the dwell period held the salient role in
information processing as the decision would have principally relied on the angle,
deviation, and spatial position of the ball as it struck the batter’s pad. This extended
dwell period may have also enabled maintenance of top-down dorsal stream
attentional control (Vickers et al. 2016b) so that all three LBW components were
processed in the absence of attention being directed towards distractive stimuli. In
addition to the applied implications, this finding extends theoretical understanding of
the QE in that optimal onset and offset is likely task-specific and that a number of
mechanisms related to attentional focus, pre-programming and inhibition (Gonzalez
et al. 2017a) might all be involved during the fixation at different temporal moments.
This perhaps points to a case for the development of an integrated model which
incorporates multiple mechanisms that might interact with one another, and how each
of them might possess a critical role in specific tasks.
Summary
Data from the current study show that prior attention to the bowler’s foot to
make a ‘no ball’ judgment did not impair overall LBW decision accuracy. However,
it significantly affected the gaze strategy used by umpires and the radial error shown
in the pitch judgment. Task-switching also led to shorter final fixation and pre-impact
durations, both of which have been shown to lead to more successful performance.
104
However, irrespective of condition, umpires maintained a gaze anchor on the stumps
in more successful trials. Despite attention being frequently directed to less relevant
locations in the ‘task-switching’ condition, this gaze strategy ensured there were
limited ‘switch-costs’ when performing the dual-task. Post-impact dwell duration was
also longer in accurate decisions in both conditions, suggesting it plays an essential
role in determining ball-flight characteristics related to velocity and angle of delivery,
as well as spatial information about the batter and stumps. Taken together, these results
partially support the ICC and their decision to remove the on field umpire’s
responsibility for calling front-foot no balls, and instead enabling the TV umpire to
make these decisions (refer to Chapter 1). However, it is important to acknowledge
that LBW decision making forms just one type of decision roles that an umpire is
required to make. As such, further examination of how task-switching affects
adjudication of catches and other types of decisions can help further establish whether
calling of no-balls should be governed by on field or TV umpires. Nevertheless, the
present study provides an indication that task-switching can affect decision making of
LBWs, which have often been suggested to be amongst the most complex of tasks in
sports officiating due to the umpires being required to extrapolate events that might
have arisen, had other events not transpired (Craven, 1998).

105
Chapter 4:
The Effect of Quiet Eye Training on LBW Decision Making
106
Abstract
Within the perceptual-cognitive skill domain, ‘Quiet Eye training’
interventions have been developed and implemented in novice samples. Whilst these
interventions have been extensively shown to improve performance in a variety of
motor tasks, to date no studies have examined their effectiveness in a solely perceptual
decision-making task. The aim of this study was to examine whether a Quiet Eye
training intervention would improve leg before wicket (LBW) decision making
accuracy in novice umpires. Participants (n = 72) were split into three groups: 1) Quiet
Eye (QE) Training; 2) Technical Training (TT); and 3) Control. Participants
performed 8 trials of a similar task to the experimental condition from Chapter 3,
which formed a pre-test. Following this, the QE group viewed training videos
providing instructions on expert umpire gaze behaviours whilst the TT group viewed
videos including standardised umpire coaching instructions. The Control group did
not receive any training. Participants then performed a further 8 trials of the LBW
decision making task which formed the post-test. A one-week retention test was also
completed. Findings showed that post-intervention, QE training improved decision-
making accuracy in all three LBW components, whilst TT only improved accuracy in
the ‘wickets’ component. However, in a one-week retention test, only the QE trained
group maintained performance gains. The Control group did not change in decision
accuracy across all three tests. These data have implications for the future training
programmes of cricket umpiring, and would suggest perceptual-cognitive training
interventions could be implemented alongside technical information to accelerate skill
learning and ensure higher quality decision making.

107
In 1967, it was proposed by Paul Fitts and Michael Posner that there are three
distinct stages of skill acquisition. The first stage, termed the cognitive stage,
“…involves encoding of the skill into a form sufficient to permit the learner to generate
the desired behaviour to at least some crude approximation” (Anderson, 1982). Here
learners consciously rehearse the skill mentally and often follow explicit instructions
step-by-step. Second, in the associative stage learners gain an increasing
understanding of the task and are able to consciously identify and iron out errors in
their execution (Anderson, 1982). Finally, the autonomous stage involves an indefinite
improvement of the skill (Anderson, 1982), whilst also involving improved execution
speed, accuracy and overall reduction of errors (Anson et al. 2005). Whilst it is widely
accepted that mastery of any task requires thousands of hours of deliberate practice
(Ericsson et al. 1993), attempts have been made to expedite this via various perceptual-
cognitive interventions with the purpose of accelerating skill acquisition (Faubert &
Sidebottom, 2012).
In Chapter 2 and Chapter 3, it was shown that an extended QE period on the
stumps following ball-pad contact appeared to facilitate more accurate decision
making in cricket umpires when making LBW decisions. With such results
considered, the question arises; can the QE behaviours exhibited by the experts be
practiced by novices to yield better performance and decision making (Farrow &
Panchuk, 2016)? This is a question that has been presented since the initial studies
examining perceptual-cognitive skill were published, and therefore ‘Quiet eye’
training interventions have been developed with the aim of enhancing skill acquisition
of both novices and experts in a variety of tasks (Miles et al. 2015; Miles et al. 2017;
Moore et al. 2012; Moore et al. 2013; Vine & Wilson, 2011; Vine et al. 2013; Vine et
al. 2014).

108
Perhaps the study which provides the most insight regards the mechanistic
benefits of QE training can be seen in Moore et al. (2012). In their study, novice
participants performed 40 putts which formed baseline results, before they underwent
QE or TT training depending on the group they were assigned to. In addition to
absolute putting success and radial error measures, this study also assessed kinematic
and physiological factors. Compared to baseline results, both groups significantly
improved putting performance in the two retention tests on day five and day seven,
highlighting the efficacy of both interventions. However, in the retention tests the QE
group significantly outperformed the TT group both in the number of balls putted and
by achieving lower radial error. Gaze behaviour analyses found that whilst both groups
increased QE durations in the retention tests, the QE group increased theirs
significantly longer than the TT group. The QE group also displayed more efficient
putting kinematics in the retention test, by reducing lateral and vertical clubhead
acceleration, which leads to better contact with the ball. Physiological changes were
also apparent after the QE intervention, as participants showcased an early
deceleration in heart rate prior to the putt, this being a characteristic of expert golfers.
Further, at the point of striking the ball, the QE group recorded half of the
electromyographic activity in the extensor carpi radialis of the left arm compared to
the TT group in the retention test. Taken together, these findings highlight the
effectiveness of QE interventions, as well as further mechanistic explanations as to
why these interventions often display superior results to TT interventions.
However, to date there have been no studies which explore the efficacy of a
QE intervention on a solely perceptual task which does not a possess a coupled motor
action. Upon finding the reduced muscle activity which followed QE training, Moore
et al. (2012) suggested that the intervention led to greater attentional resources being
109
allocated towards the task. Further, it has been proposed an elongated QE leads to
increased dorsal visual stream activity (Vickers, 2012; Vickers 2016a) and therefore
it is possible that QE training interventions might prove to be of benefit to cricket
umpiring. Therefore, the aim of this study was to examine whether QE training would
enhance decision making in novice cricket umpires when making leg before wicket
(LBW) decisions. As cricket umpiring does not involve an associated motor action in
response to a stimulus, it is one of the few fast ball tasks that likely relies
predominantly on optimal spatial attention allocation, a suggestion that is supported
in Chapter 2 and 3.
It was hypothesised that:
1: Both QE and TT training would lead to an improvement in decision making
performance across all Hawk-Eye components in the post-test (Vickers, 2017).
2: Only the QE group would maintain the beneficial effects in the retention test (Miles,
2017). 3: The control (CTRL) group would exhibit no changes across Hawk-Eye
components in the pre-test, post-test and retention test.
Methods
Participants
The participants were 72 novice umpires (mean age = 20.44, SD = 3.21) who
were randomly assigned into one of three groups. In total there were 21 participants
assigned to a QE training group (mean age = 20.19, SD = 2.99), 27 participants
assigned to a TT training group (mean age = 20.26, SD = 3.85) and 24 participants
assigned to a control (CTRL) group (mean age = 20.67, SD = 2.58). Participants had
no prior experience in cricket umpiring. Informed consent was provided prior to taking
110
part in the study and the study was approved by the Research Ethics Committee of the
lead institution.
Task & Apparatus
Visual Search Behaviours
Unlike in Chapter 2 and Chapter 3, visual search behaviours could not be
collected due to the study being based online due to Covid-19 restrictions.
Test Films
LBW appeals for the test films were recorded at the Marylebone Cricket Club
(MCC) Academy. Video footage from an umpire’s perspective was recorded using a
Canon VIXIA HFR706 camera (Tokyo, Japan). The camera was positioned in line
with middle stump 1 metre away from the non-strikers popping crease. A right-handed
batter from the MCC Academy faced a number of deliveries delivered by a BOLA
Bowling Machine (Bola Manufacturing Ltd.; Bristol, UK) from both around and over
the wicket at speeds between 65-80mph. In total, 8 unique appeals were used for the
pre-test, post-test, and retention test. In each condition, there were 4 out decisions and
4 not-out decisions (two deliveries missing the wickets and two pitching outside leg-
stump). Similarly to Chapter 3, in each phase 4 trials pitched on a ‘good length’
whereas the other 4 pitched on a ‘full length’. Further, in each phase, 2 trials would
have struck off stump, 2 trials would have struck middle stump and 2 trials would have
struck leg stump. As with Chapter 3, each trial corresponded with another trial in the
other two phases and were matched for both speed and the ‘wickets’ component of the
LBW. Each test-film was edited in a similar manner to that seen in Chapter 3. Each
trial commenced with a black screen with the trial number that was present for 3
111
seconds, before information was presented about the batter’s batting orientation (right
hand or left-hand batting grip) and the position of the delivery (over or around the
wicket), which again lasted for 3 seconds. A 3 second countdown was followed by
commencement of the trial. A 3 second lead in time was presented to the batter, before
the ball was released from the machine. Following ball-pad impact, the participant was
offered a further 3.0 seconds of visual information before a black screen signalled the
end of the trial. The position of delivery for each trial was randomised to avoid any
order effects.
Hawk-Eye
Hawk-Eye was used similarly to Chapter 2 and Chapter 3 to extrapolate where
the ball pitched, impacted the pad and where it would have travelled post-impact.
Qualtrics
To distribute the test to as many participants as possible, the pre-test,
acquisition phase, post-test and retention test were built into two separate surveys
using Qualtrics (Qualtrics 2005, Utah, USA). Each trial was presented on a separate
page of the survey.
Task
In the pre-test, post-test, and retention test, the following was presented; an
embedded video of an LBW appeal, an image displaying three shoes, and an ‘empty’
Hawk-Eye diagram which was split into a grid of 35 x 43 squares (see Figure 4.1).
The embedded video for each page was a different LBW appeal which participants
were only able to watch once. The image of three shoes formed the ‘no ball task’ and
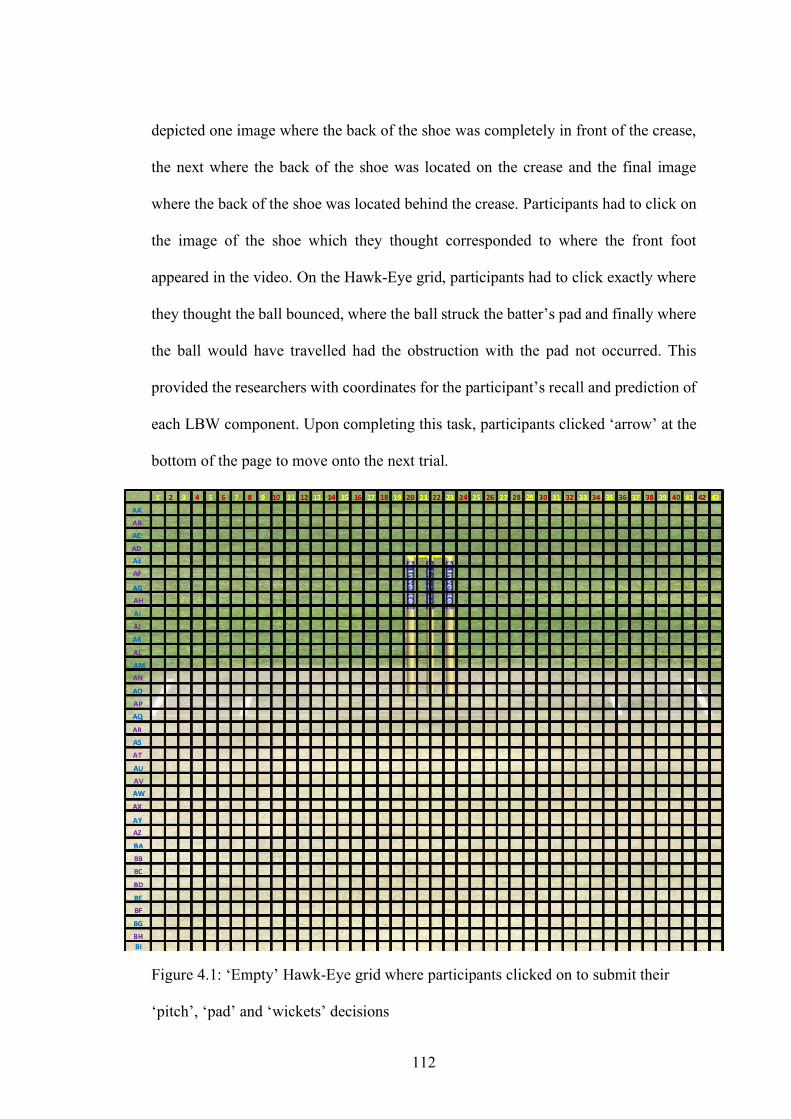
112
depicted one image where the back of the shoe was completely in front of the crease,
the next where the back of the shoe was located on the crease and the final image
where the back of the shoe was located behind the crease. Participants had to click on
the image of the shoe which they thought corresponded to where the front foot
appeared in the video. On the Hawk-Eye grid, participants had to click exactly where
they thought the ball bounced, where the ball struck the batter’s pad and finally where
the ball would have travelled had the obstruction with the pad not occurred. This
provided the researchers with coordinates for the participant’s recall and prediction of
each LBW component. Upon completing this task, participants clicked ‘arrow’ at the
bottom of the page to move onto the next trial.
Figure 4.1: ‘Empty’ Hawk-Eye grid where participants clicked on to submit their
‘pitch’, ‘pad’ and ‘wickets’ decisions
113
Procedure
The testing period for this study was 7 days. On Day 1, participants were
emailed a weblink which directed them to the correct test corresponding with the
group they were assigned to. After reading the information sheet and providing
informed consent they were shown an instruction sheet outlining the procedure.
Importantly, participants were instructed that the ball could bounce anywhere on the
pitch and that the ball might hit or miss the wickets, and that they could only view
each trial once. Following this, a practice trial with the corresponding LBW data was
presented so that participants could distinguish the scale between the simulated trials
and the Hawk-Eye prediction. Once the instructions had been read, the pre-test began.
After participants viewed an LBW appeal they were initially required to perform the
‘no ball task’ before they proceeded to provide LBW coordinates on the Hawk-Eye
grid situated below the video. The pre-test comprised of 8 trials. The pre-test took
approximately 15 minutes to complete.
Table 4.2: Step by step instructions for the QE and TT interventions
Quiet Eye Training Instructions Technical Training Instructions Fixate on the crease. The shoe will appear on the crease. Keeping your eyes still on the crease, determine whether ANY part of the shoe is BEHIND the line.
The shoe will appear on the crease. Determine whether ANY part of the shoe is BEHIND the line.
As soon as you have determined whether the shoe was behind the line, quickly transfer your gaze towards the stumps.
The ball will be released from the bowling machine after the shoe appears.
Keep a stable fixation on the stumps whilst the ball travels.
Take note of where the ball is travelling and where it might bounce

114
Continue to look at the stumps, even when the ball bounces. Determine where the ball pitches.
Determine whether the ball bounced to the left of the line of the stumps, in line with stumps or to the right of the line of the stumps. Consider imagining three lines on the pitch in front of the stumps to help you with this.
Maintain your gaze on the stumps even after the ball has impacted the pad. Determine where the ball hits the pad. Do not follow the ball post-impact.
It is a good idea to have doubts about any appeal that strikes the batter’s pad ¾ of the way up. Determine the spatial positions of where the ball would have gone and how far it had to travel post pad-ball impact.
Continue to fixate on the stumps even if the batter moves, and do this till the end of the trial.
Always take into account how far the ball has to travel after striking the batter’s pad as this will determine whether it will strike the stumps when it is travelling at an angle. Remember all of the components of the LBW when making your decision (where the ball bounced, where it impacted the batter, and where it would have travelled).
Upon completion of the pre-test, they next took part in the acquisition phase.
The QE group and TT group viewed a 5-minute training video (Table 4.2), before
viewing 16 LBW appeals so that they could practice what had been outlined in the
video. The training videos followed Vickers et al. (2017) who similarly provided both
QE and TT instruction via YouTube. The quantity of both instructional sets offered
participants a similar amount of information to a number of studies (Moore et al. 2012;
Moore et al. 2013; Vine et al. 2013) who used ‘6 training points’. This procedure was
repeated a further two times, as they re-watched the training video before viewing a
new set of LBW appeals. Like the other two groups, the CTRL group were required
to watch the three videos of 16 LBW appeals, however they were not shown any
training videos. The acquisition phase took approximately 30 minutes. A similar
procedure to the pre-test was then followed in the post-test where participants made
decisions on 8 new LBW appeals.
On day 7, all participants were sent a link which directed them to the retention
test. Participants were reminded to utilise the information they had learnt in the
acquisition phase on Day 1, before they performed 8 LBW decisions in a similar
115
manner to the pre-test and post-test. Finally, participants were taken to a page thanking
them and were debriefed.
Measures
Response accuracy was determined by radial error (cm), which was defined
as the Euclidean distance of the participant’s judgment of ball impact with the pitch,
pad, and stumps prediction compared to the Hawk-Eye data. This distance was scaled
to quantify accuracy at a game scale (see Runswick et al., 2019). The Rating Scale
Mental Effort (RSME) was used to measure participant’s subjective perception on
their cognitive workload throughout each phase of the study.
Statistical analysis
Radial error data between the pre-test and post-test was analysed by a 3
(Group: QE, TT, CTRL) x 2 (Phase: Pre-Test, Post-Test) mixed-factor analysis of
variance (ANOVA). Radial error data between the post-test and retention test was also
analysed by a 3 (Group: QE, TT, CTRL) x 2 (Phase: Post-Test, Retention Test) mixed-
factor analysis of variance (ANOVA). Radial error data between the pre-test and
retention test was also later analysed by a 3 (Group: QE, TT, CTRL) x 2 (Phase: Pre-
Test, Retention Test) mixed-factor analysis of variance (ANOVA). RSME data was
analysed using a 3 (Group: QE, TT, CTRL) x 3 (Phase: Pre-Test, Post-Test, Retention-
Test) mixed factor analysis of variance (ANOVA). Effect sizes were calculated using
partial eta squared values (ηp2). Greenhouse-Geisser epsilon was used to control for
violations of sphericity and the alpha level for significance was set at .05 with
Bonferroni adjustment to control for Type 1 errors.
116
Results
Radial error (cm)
Pre-Test to Post-Test
Pitch
There was a moderate between-subject main effect for pitch F2,69 = 3.27, p =
.04, ηp2 = .09. Pitch radial error was significantly higher in the TT group (M = 21.95
cm, SE = 1.17) compared to the QE group (M = 17.85 cm, SE = 1.33) (p = .02) and
CTRL group (18.50 cm, SE = 1.24) (p = .05). There was no significant difference in
pitch radial error between the QE and CTRL group. There was also a moderate phase
main effect F1,69 = 6.54, p = .01, ηp2 = .09.
Pitch radial error was significantly lower in the post-test (M = 18.27 cm, SE = .84)
compared to the pre-test (M = 20.59 cm, SE = .86) (p < .05). There was no significant
group x phase interaction for pitch F2,69 = 2.51, p = .09, ηp2 = .07. However, pitch
radial error for the QE group was significantly lower in the post-test (M = 15.41 cm,
SE = 1.56) compared to the pre-test (M = 20.30 cm, SE = 1.59) (t (20) = 3.08, p < .01).
There was no significant difference in pitch radial error in the TT group between the
pre-test (M = 21.91 cm, SE = 1.40) and post-test (M = 21.99 cm, SE = 1.37) (t (26) =
-.05, p = .96). Similarly, in the CTRL group there was also no significant pitch radial
error difference in the pre-test (M = 19.57cm, SE = 1.48) and post-test (M = 17.43 cm,
SE = 1.45) (t (23) = 1.46, p = .16).
Pad
The between-subject main effect for pad was non-significant F2,69 = .11, p =
.90, ηp2 = 003. There was no significant difference in pad radial error between the QE
group (M = 24.23 cm, SE = 1.61), TT group (24.74 cm, SE = 1.42) and CTRL group
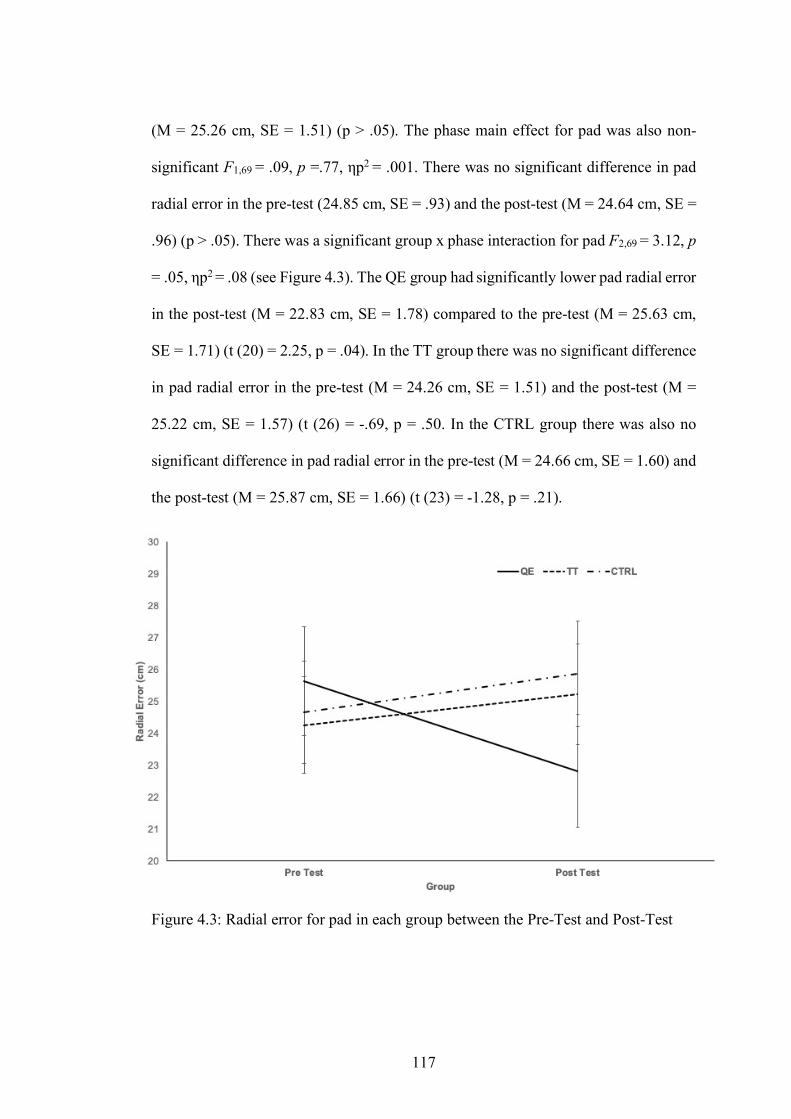
117
(M = 25.26 cm, SE = 1.51) (p > .05). The phase main effect for pad was also non-
significant F1,69 = .09, p =.77, ηp2 = .001. There was no significant difference in pad
radial error in the pre-test (24.85 cm, SE = .93) and the post-test (M = 24.64 cm, SE =
.96) (p > .05). There was a significant group x phase interaction for pad F2,69 = 3.12, p
= .05, ηp2 = .08 (see Figure 4.3). The QE group had significantly lower pad radial error
in the post-test (M = 22.83 cm, SE = 1.78) compared to the pre-test (M = 25.63 cm,
SE = 1.71) (t (20) = 2.25, p = .04). In the TT group there was no significant difference
in pad radial error in the pre-test (M = 24.26 cm, SE = 1.51) and the post-test (M =
25.22 cm, SE = 1.57) (t (26) = -.69, p = .50. In the CTRL group there was also no
significant difference in pad radial error in the pre-test (M = 24.66 cm, SE = 1.60) and
the post-test (M = 25.87 cm, SE = 1.66) (t (23) = -1.28, p = .21).
Figure 4.3: Radial error for pad in each group between the Pre-Test and Post-Test

118
Wickets
The between-subject main effect for wickets was moderate but statistically non-
significant F2,69 = 2.20, p = .12, ηp2 = .06. There was no significant difference in
wickets radial error between QE group (M = 27.26 cm, SE = 2.06), TT group (M =
26.57 cm, SE = 1.81) and the CTRL group (M = 31.77 cm, SE = 1.92) (p > .05). There
was a large phase main effect for wickets F1,69 = 19.50, p <.001, ηp2 = .22. Radial error
for wickets was significantly lower in the post-test (M = 26.78 cm, SE = 1.10)
compared to the pre-test (M = 30.29 cm, SE = 1.26) (p < .001). There was also a
moderate group x phase interaction for wickets F2,69 = 5.18, p = .01, ηp2 = .13 (see
Figure 4.4). The QE group improved significantly from the pre-test (M = 30.09 cm,
SE = 2.32) to the post-test (M = 24.42 cm, SE = 2.03) (t (20) = 3.89, p = 001). The TT
group also significantly improved from the pre-test (M = 29.04 cm, SE = 2.05) to the
post-test (M = 24.11 cm, SE = 1.79) (t (26) = 3.83, p = .001). However, the CTRL
group did not show any differences between the pre-test (M = 31.73 cm, SE = 2.17)
and the post-test (M = 31.82 cm, SE = 1.90) (t (23) = -.07, p = .95).

119
Figure 4.4: Radial error for wickets in each group between the Pre-Test and Post-
Test
Post-test to retention
Pitch
The between-subject main effects for pitch were moderate but statistically non-
significant F2,41 = 2.45, p = .10, ηp2 = .11. Pitch radial error was significantly higher
in the TT group (M = 21.51 cm, SE = 1.66) compared to the QE group (M = 15.84
cm, SE = 1.96) (p < .05). Pitch radial error in the CTRL group (M = 18.84 cm, SE =
1.96) was not significantly different to the QE group or the TT group (p > .05). The
phase main effects for pitch were small but statistically non-significant, F1,41 = .44, p
= .51, ηp2 = .01. There was no significant difference in pitch radial error between the
post-test (M = 18.39 cm, SE = 1.27) and the retention test (M = 19.08 cm, SE = 1.12)
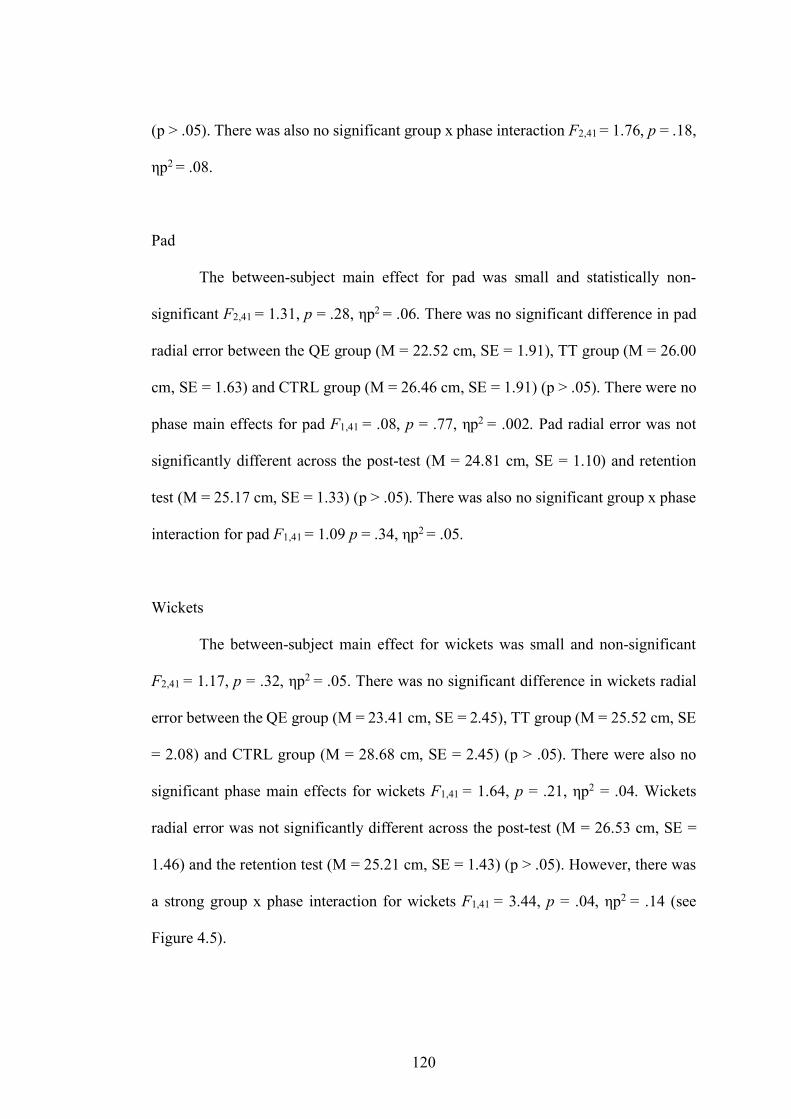
120
(p > .05). There was also no significant group x phase interaction F2,41 = 1.76, p = .18,
ηp2 = .08.
Pad
The between-subject main effect for pad was small and statistically non-
significant F2,41 = 1.31, p = .28, ηp2 = .06. There was no significant difference in pad
radial error between the QE group (M = 22.52 cm, SE = 1.91), TT group (M = 26.00
cm, SE = 1.63) and CTRL group (M = 26.46 cm, SE = 1.91) (p > .05). There were no
phase main effects for pad F1,41 = .08, p = .77, ηp2 = .002. Pad radial error was not
significantly different across the post-test (M = 24.81 cm, SE = 1.10) and retention
test (M = 25.17 cm, SE = 1.33) (p > .05). There was also no significant group x phase
interaction for pad F1,41 = 1.09 p = .34, ηp2 = .05.
Wickets
The between-subject main effect for wickets was small and non-significant
F2,41 = 1.17, p = .32, ηp2 = .05. There was no significant difference in wickets radial
error between the QE group (M = 23.41 cm, SE = 2.45), TT group (M = 25.52 cm, SE
= 2.08) and CTRL group (M = 28.68 cm, SE = 2.45) (p > .05). There were also no
significant phase main effects for wickets F1,41 = 1.64, p = .21, ηp2 = .04. Wickets
radial error was not significantly different across the post-test (M = 26.53 cm, SE =
1.46) and the retention test (M = 25.21 cm, SE = 1.43) (p > .05). However, there was
a strong group x phase interaction for wickets F1,41 = 3.44, p = .04, ηp2 = .14 (see
Figure 4.5).
121
In the post-test the QE group (M = 24.73 cm, SE = 2.65) and the TT Group (M
= 24.39 cm, SE = 2.25) had significantly lower wickets radial error compared to the
CTRL group (M = 30.48 cm, SE = 2.65). However, in the retention test, radial error
was significantly lower in the QE group (M = 22.09 cm, SE = 2.60), compared to the
TT Group (M = 26.66 cm, SE = 2.21) and the CTRL group (M = 26.87 cm, SE = 2.60)
(p < .05).
Figure 4.5: Radial error for wickets in each group between the Post-Test and
Retention Test
Pre-test to retention
Pitch
The between-subject main effect for pitch was small and statistically non-
significant, F2,41 = 1.20, p = .31, ηp2 = .06. There were also no main effects for phase,
F1,41 = .20, p = .66, ηp2 = .01. The group x phase interaction for pitch was also small
and statistically non-significant, F2,41 = 2.09, p = .14, ηp2 = .09.

122
Pad
The between-subject main effect for pad was small and statistically non-
significant F2,41 = .26, p = .78, ηp2 = .01. There were no phase main effects for pad
F1,41 = .34, p = .56, ηp2 = .01. However, there was a moderate group x phase interaction
for pad, F2,41 = 4.24, p = .02, ηp2 = .17. This was reflected in the QE group having
significantly lower pad radial error in the retention test (M = 21.20 cm, SE = 1.99)
compared to the pre-test (M = 27.19 cm, SE = 2.17). Conversely, in the TT group there
was no significant difference for pad radial error in the pre-test (M = 24.50 cm, SE =
1.84) and the retention-test (M = 21.02 cm, SE = 1.99). There was also no significant
difference for the CTRL group between pad radial error in the pre-test (M = 24.96 cm,
SE = 2.17) and the retention-test (M = 26.37 cm, SE = 1.99). The group x phase
interaction was also small and statistically non-significant, F2,41 = 2.09, p = .14, ηp2 =
.09.
Wickets
The between-subject main effect for wickets was small and statistically non-
significant F2,41 = .18, p = .84, ηp2 = .01. However, there was a moderate phase
main effect for wickets F1,41 = 23.67, p < .001, ηp2 = .11. This was reflected in radial
error being significantly higher in the pre-test (M = 31.24 cm, SE = 1.69) compared
to the retention test (M = 25.21 cm, SE = 1.43). The group x phase interaction for
wickets was small and statistically non-significant, F2,41 = 2.64, p = .08, ηp2 = .11.
123
Discussion
There were no differences between the groups in pre-test radial error measures
for pitch, pad and wickets, indicating all three groups started the study with a similar
level of umpiring ability, and therefore any changes in radial error could to be
attributed to the respective interventions. Only the QE group significantly reduced
radial error for ‘pitch’ and ‘pad’ in the post-test compared to pre-test. For ‘wickets’,
both the QE and TT group improved significantly in the post-test from pre-test, whilst
no changes were seen in the CTRL group. In the one-week retention test, the QE group
maintained the post-test improvements for the pitch, pad and wickets components.
However, the post-test wickets performance improvements in TT group were lost in
the retention test so that they were unable to significantly outperform the CTRL group
on this component. The CTRL group again showcased no differences in radial error
in all three components in the retention test compared to the pre-test and post-test.
In the post-test, the QE group were able to improve decision making accuracy
in the pitch and pad components of the LBW decision, whereas the other two group’s
radial error did not change from pre-test. This partially supported hypothesis 1, as
whilst the QE group were able to significantly improve accuracy on these two
components, it was also expected that the TT group would showcase similar
improvements. However, in support of hypothesis 1, the QE and TT group improved
their decision-making accuracy on ‘wickets’ in the post-test. It is possible that the TT
group were unable to improve the other two Hawk-Eye components as they might
have struggled to attend to all three tasks utilising the TT guidance which did not
explicitly state they should anchor their gaze onto a single critical location. As a result,
participants from this group might have been unable to transfer their attention towards
three separate tasks and therefore only managed to improve their ‘wickets’ prediction.
124
Technical instruction 5 and 6 also provided explicit information on how to interpret
the ball hitting the batter’s pad in relation to the wickets task, whereas instruction on
the other two Hawk-Eye components was less forthcoming. Conversely, the QE group
improving accuracy on all three Hawk-Eye components might be explained by the
intervention promoting the strategy of anchoring gaze onto the stumps.
The use of the gaze anchor (Vater et al. 2019) was proposed in Chapter 2 and
Chapter 3 to permit expert umpires to process information related to all three LBW
components concurrently, an idea similar to that offered by Schnyder et al. (2017).
The performance improvements related to the intervention might be explained by
theories relating to the two visual attention systems (Corbetta & Shulman, 2002;
Milner & Goodale, 2008b). Similarly to Vickers (2017), the present study was unable
to include the recording of eye movements to confirm the QE group anchored their
gaze on the stumps and increased their QE duration, however a number of studies
which utilised similar intervention protocols found they are effective at achieving this
outcome. It has been suggested that a prolonged QE duration exerts a greater level of
cognitive processing via the dorsal visual stream and therefore not only enhances
attentional allocation towards task related cues, but also provides an individual with
the ability to prevent distractive stimuli from being processed (Vickers, 2017). There
is some evidence to support this idea, as studies have shown QE interventions prevent
attention from being misallocated when participants are faced with pressurised
situations (Moore et al. 2012; Moore et al. 2013; Vine & Wilson, 2011). For example,
Miles et al. (2015) found that QE training led to children being better able to predict
the location the ball would bounce off the wall, this being somewhat like the umpires
being required to ascertain where the ball pitches and impacts the batter’s pad. The
idea that increased attention allocation towards task related cues via QE might

125
contribute towards augmented cricket umpiring decisions is perhaps best outlined by
Vickers (2012), who postulated that increased activation of the dorsal attentional
stream via the QE might enable participants to sustain spatial focus of attention on a
location in the external environment. Further, Moore et al. (2014) proposed that an
extended QE might be the optimal gaze strategy for effectively storing critical
locations in the visuo-spatial sketchpad of the working memory. As a result, it would
leave participants better placed to process the three critical location points that are
paramount in the decision making of cricket umpiring.
In support of hypothesis 2, the QE group were able to maintain performance
gains seen in the post-test across all three Hawk-Eye components, suggesting that QE
training can enhance the learning of LBW decision making. Also, in support of
hypothesis 2, the gains made by the TT group on the wickets judgement immediately
after the acquisition phase were lost one week later. Once again, the CTRL group
experience no change from post-test to retention test accuracy in any of the Hawk-Eye
components. Such results are somewhat replicated by Miles et al. (2017), who found
in a catching task that whilst both QE and TT training improved catching performance
of children in a one-week retention test, the QE group significantly outperformed the
TT group after six weeks. Similarly, Moore et al. (2012) found a one-week after a QE
intervention, novice golfers showcased a prolonged QE and lower radial error,
compared to a TT. Taken together with the results from the present study, it is apparent
that QE training expedites robust learning of both motor and perceptual tasks.
Perceptual learning is defined as an improvement in the ability to respond the
environment, and is explained through mechanisms such as optimization of attentional
weighting (Jackson & Farrow, 2005). It is possible that enduring performance benefits
related to QE training might be a result of the formation of implicit perceptual learning

126
where the individual does not solely focus on the external target (Vine & Wilson,
2010). Causer et al. (2014a) suggested QE training facilitated performance of surgical
knot tying in students due to it permitting a single relevant point of focus where
movements and actions could be orientated around. Therefore, whilst not being
explicitly instructed as to the successful technical related movement aspects of the
surgery, it was suggested the prolonged QE duration enabled the students to learn the
optimal method of organising their hands in a non-explicit manner. Although Fitts and
Posner’s model of skill acquisition relates to motor tasks like that of the surgeons in
Causer et al. (2014a), with respect to umpiring, a prolonged fixation on the stumps
might have provided the participants with a constant uninterrupted stream of
information (Moore et al. 2014). This may have enabled implicit learning of
information related to the ball, stumps, pitch and batter concurrently, and consequently
helped participants overcome the cognitive stage of learning. Conversely, the TT
group’s instructions emulated the ‘cognitive stage’ where they were required to
consciously consider the multiple permutations associated with each LBW component
in a step-by-step manner (Anderson, 1982). Therefore, it might have required a longer
intervention with further practice for the participants in this group to learn and
automate the skill of making three decisions simultaneously. Further, the TT group
might have relied on rule-based inferences which may have enhanced initial
performance in the post-test, but with decay of procedural memory relating to the task,
they may have been unable to maintain these improvements a week later. To some
degree the QE training might therefore have led to processes that are somewhat similar
to ‘external focus of attention’ theories, which report that providing learners with an
external cue related to the outcome of the task prevents debilitative step-by-step
consideration of task execution (Poolton & Zachry, 2007). When considering the

127
means in which each intervention led to varying types of learning, it is entirely
possible that the QE group received instructions that mirrored a ‘guided discovery’
approach. Specifically, the participants were directed towards a salient region on the
display but were not provided instructions as to how to integrate the multiple cues to
generate a decision. Conversely, the TT group were provided a greater number of rules
related to the ball, batter and pitch, therefore this type of intervention being somewhat
akin to an ‘explicit instruction’ approach (Jackson & Farrow, 2005). Vine et al. (2013)
provide some evidence for the use of QE training to enable acquisition of implicit
knowledge from a motor perspective, however one must be cautious of arising to
concrete conclusions in the present study until additional measures are recorded.
Whilst difficult to assess the degree of explicit and implicit learning of each group,
perhaps future perceptual task-based QE studies might record participant task related
confidence alongside each trial. Improved performance coupled with an absence of
increased confidence might provide some insight as to whether QE training leads to
the formation of implicit knowledge (Jackson & Farrow, 2005).
It is also somewhat difficult to make strong assertions as to the mechanisms
underpinning the current data due to the lack of eye tracking available, due to testing
restrictions. Whilst all studies examining the efficacy of QE interventions have led to
an increase in QE duration, performance enhancement of cricket umpiring that was
attributed to an increased final fixation duration on the stumps must be approached
with hesitancy until further eye tracking measures can be put in place to validate this
conclusion. Further, whilst several studies have included a one-week delayed retention
test (Moore et al. 2012; Moore et al. 2013), the testing period was relatively short with
respect to some other QE studies which have utilised an 8-week period (Miles et al.
2015; Miles et al. 2017) to test the efficacy of QE interventions.
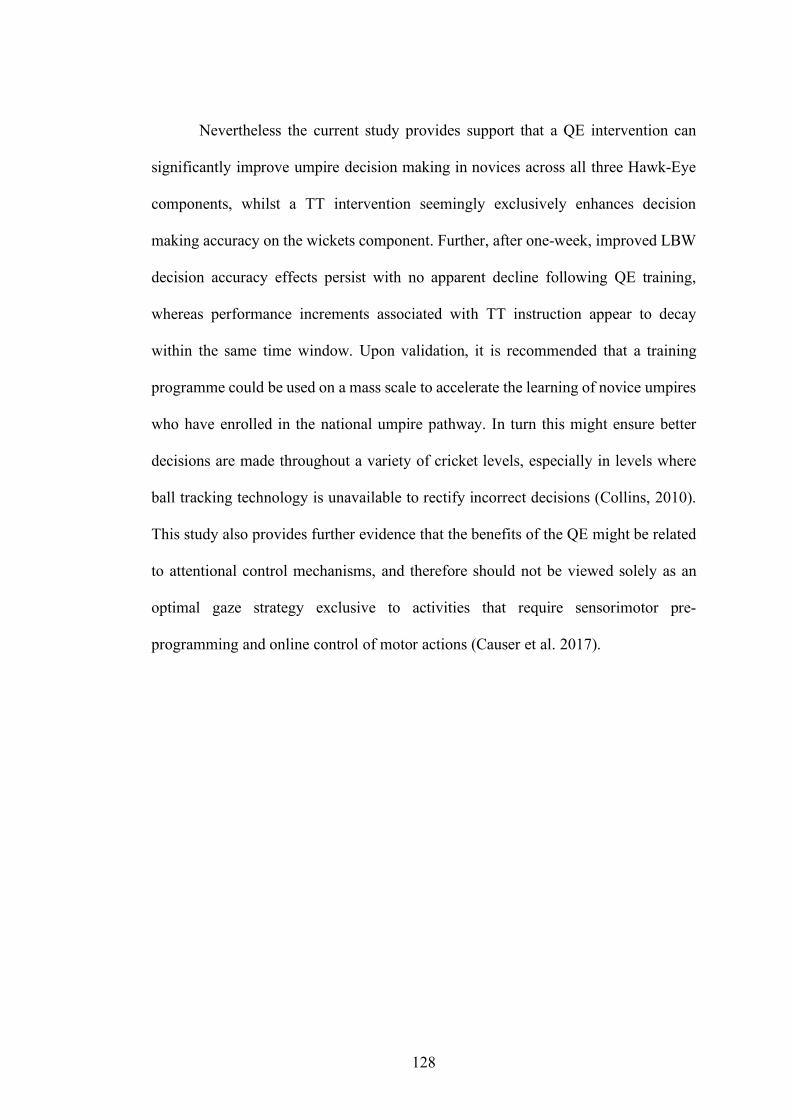
128
Nevertheless the current study provides support that a QE intervention can
significantly improve umpire decision making in novices across all three Hawk-Eye
components, whilst a TT intervention seemingly exclusively enhances decision
making accuracy on the wickets component. Further, after one-week, improved LBW
decision accuracy effects persist with no apparent decline following QE training,
whereas performance increments associated with TT instruction appear to decay
within the same time window. Upon validation, it is recommended that a training
programme could be used on a mass scale to accelerate the learning of novice umpires
who have enrolled in the national umpire pathway. In turn this might ensure better
decisions are made throughout a variety of cricket levels, especially in levels where
ball tracking technology is unavailable to rectify incorrect decisions (Collins, 2010).
This study also provides further evidence that the benefits of the QE might be related
to attentional control mechanisms, and therefore should not be viewed solely as an
optimal gaze strategy exclusive to activities that require sensorimotor pre-
programming and online control of motor actions (Causer et al. 2017).

129
Chapter 5:
Epilogue
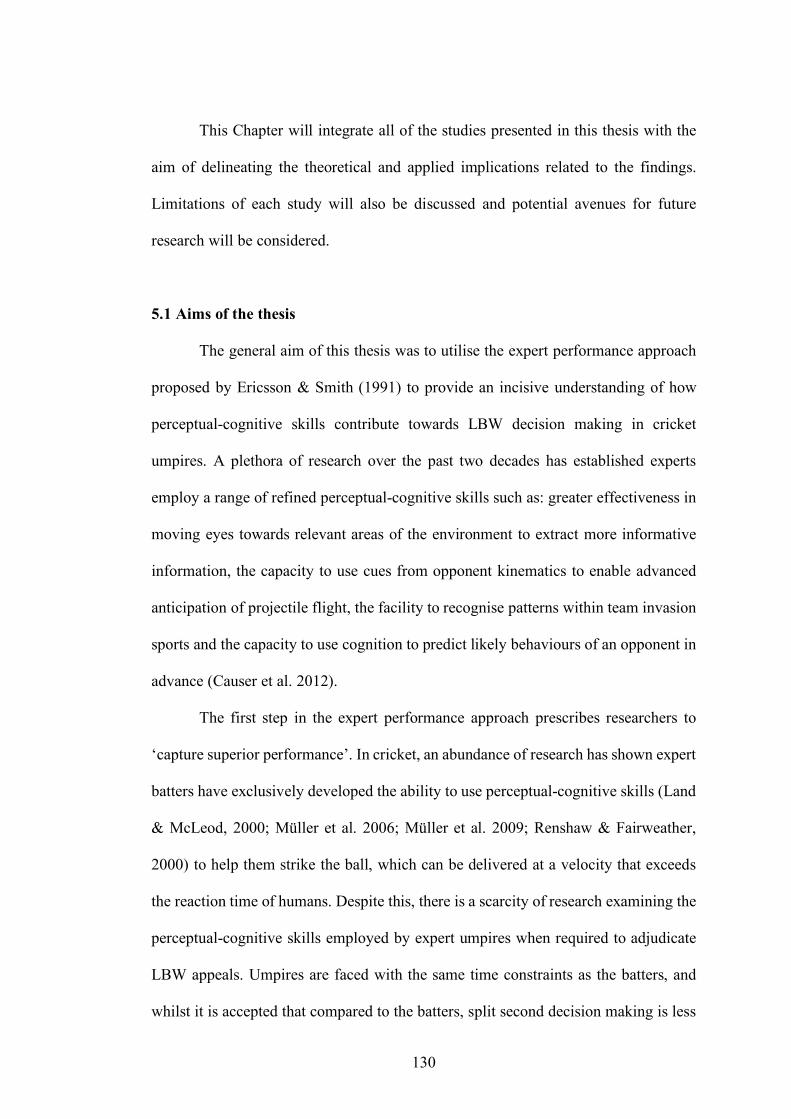
130
This Chapter will integrate all of the studies presented in this thesis with the
aim of delineating the theoretical and applied implications related to the findings.
Limitations of each study will also be discussed and potential avenues for future
research will be considered.
5.1 Aims of the thesis
The general aim of this thesis was to utilise the expert performance approach
proposed by Ericsson & Smith (1991) to provide an incisive understanding of how
perceptual-cognitive skills contribute towards LBW decision making in cricket
umpires. A plethora of research over the past two decades has established experts
employ a range of refined perceptual-cognitive skills such as: greater effectiveness in
moving eyes towards relevant areas of the environment to extract more informative
information, the capacity to use cues from opponent kinematics to enable advanced
anticipation of projectile flight, the facility to recognise patterns within team invasion
sports and the capacity to use cognition to predict likely behaviours of an opponent in
advance (Causer et al. 2012).
The first step in the expert performance approach prescribes researchers to
‘capture superior performance’. In cricket, an abundance of research has shown expert
batters have exclusively developed the ability to use perceptual-cognitive skills (Land
& McLeod, 2000; Müller et al. 2006; Müller et al. 2009; Renshaw & Fairweather,
2000) to help them strike the ball, which can be delivered at a velocity that exceeds
the reaction time of humans. Despite this, there is a scarcity of research examining the
perceptual-cognitive skills employed by expert umpires when required to adjudicate
LBW appeals. Umpires are faced with the same time constraints as the batters, and
whilst it is accepted that compared to the batters, split second decision making is less
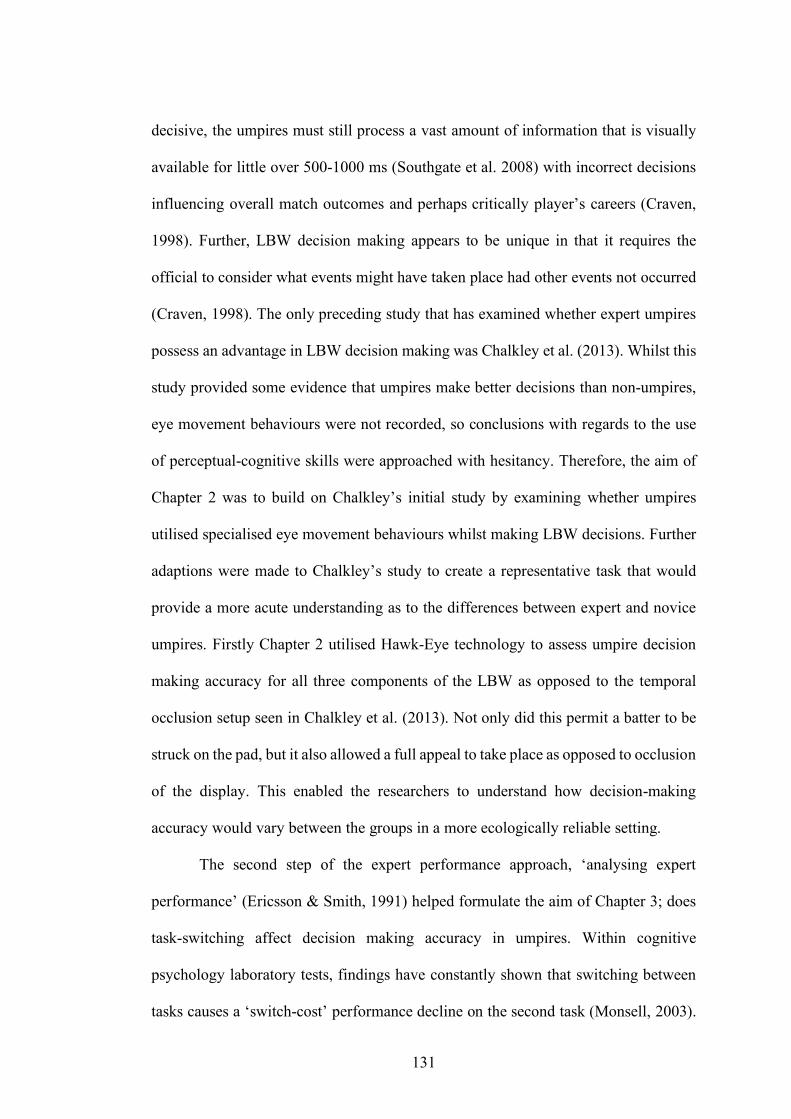
131
decisive, the umpires must still process a vast amount of information that is visually
available for little over 500-1000 ms (Southgate et al. 2008) with incorrect decisions
influencing overall match outcomes and perhaps critically player’s careers (Craven,
1998). Further, LBW decision making appears to be unique in that it requires the
official to consider what events might have taken place had other events not occurred
(Craven, 1998). The only preceding study that has examined whether expert umpires
possess an advantage in LBW decision making was Chalkley et al. (2013). Whilst this
study provided some evidence that umpires make better decisions than non-umpires,
eye movement behaviours were not recorded, so conclusions with regards to the use
of perceptual-cognitive skills were approached with hesitancy. Therefore, the aim of
Chapter 2 was to build on Chalkley’s initial study by examining whether umpires
utilised specialised eye movement behaviours whilst making LBW decisions. Further
adaptions were made to Chalkley’s study to create a representative task that would
provide a more acute understanding as to the differences between expert and novice
umpires. Firstly Chapter 2 utilised Hawk-Eye technology to assess umpire decision
making accuracy for all three components of the LBW as opposed to the temporal
occlusion setup seen in Chalkley et al. (2013). Not only did this permit a batter to be
struck on the pad, but it also allowed a full appeal to take place as opposed to occlusion
of the display. This enabled the researchers to understand how decision-making
accuracy would vary between the groups in a more ecologically reliable setting.
The second step of the expert performance approach, ‘analysing expert
performance’ (Ericsson & Smith, 1991) helped formulate the aim of Chapter 3; does
task-switching affect decision making accuracy in umpires. Within cognitive
psychology laboratory tests, findings have constantly shown that switching between
tasks causes a ‘switch-cost’ performance decline on the second task (Monsell, 2003).

132
One of the theories explaining the switch-cost suggests that during the period between
the two tasks, there is often insufficient time for complete reconfiguration of
attentional parameters towards the second task (Longman et al. 2013; Longman et al.
2014; Longman et al. 2017). This in turn reportedly leads to a less accurate saccadic
refixation towards the second task. Despite this evidence, all studies that have explored
the relationship between attention and the switch-cost have been laboratory-based and
therefore such effects remain untested in more representative tasks. Chapter 3 aimed
to understand whether the switch-cost occurs when cricket umpires shift attention
from a front foot no ball task to the LBW task. Further, Chapter 3 aimed to examine
whether eye movements would be directed to less informative areas on the during this
task-switch in line with Longman et al. (2017).
Finally, the third stage of the expert performance approach, ‘acquisition of
expert performance and its mechanisms’ (Ericsson & Smith, 1991), dictated the
approach of Chapter 4; would LBW decision making accuracy be improved in novice
umpires by training them expert eye movement behaviours identified in the earlier
chapters. In Chapter 2 and 3, during the critical ball-pad impact, two separate groups
of expert cricket umpires displayed a tendency to anchor their vision on the stumps at
the strikers end of the pitch. Further a longer QE duration was seen as an effective
strategy to increase decision making accuracy. These findings were used to design a
QE intervention that was compared against a TT intervention derived from an official
umpire’s handbook, as well as a control group. A one-week retention test was also
included to evaluate whether the intervention would render stable learning effects.
5.2 Summary of key findings
In Chapter 2, expert and novice umpires completed a simulated video-based
LBW decision making task. To assess skill-based differences between the groups,

133
participants were required to view 20 life sized LBW appeals and accurately determine
where the ball pitched, where the ball struck the batter’s pad, and where the ball would
have ultimately travelled. These decisions were then compared against Hawk-Eye
prediction data (Collins, 2010). Importantly this method provided a comprehensive
understanding of whether skill-based differences existed, as opposed to studies that
have relied on analysis of binary correct/incorrect decisions. Portable eye tracking
glasses were also worn by participants with the intention of examining the eye
strategies used by each group. Measures analysed included radial error and visual
search behaviours. Visual search behaviours comprised of; the number of fixations,
average fixation duration, final fixation duration and final fixation location.
Expert umpires displayed superior decision-making accuracy compared to
novice umpires across all three Hawk-Eye components. This was in line with previous
sports officiating research that outlines skilled officials typically make better decisions
than less-skilled officials (Moore et al. 2019; Pizzera et al. 2018; Schnyder et al. 2017).
Similarly to these studies, the expert umpires also appeared to also utilise a gaze
anchor (Vater et al. 2019), where they directed their gaze towards the stumps more
frequently than the pitch or other locations. It was suggested that this anchor was
located on the stumps to enable processing of multiple information sources
simultaneously via use of both foveal and peripheral vision. It was further proposed
that this was a superior strategy to use of a visual pivot, which might have been less
favourable due to information suppression that occurs as a result of saccades. Novices
contrastingly directed their vision towards a ‘good length’ more often than the experts.
It was suggested that they might have allocated attention towards a good length to
extract information related to the pitch component of the task, this being the first task
where visual information is presented.
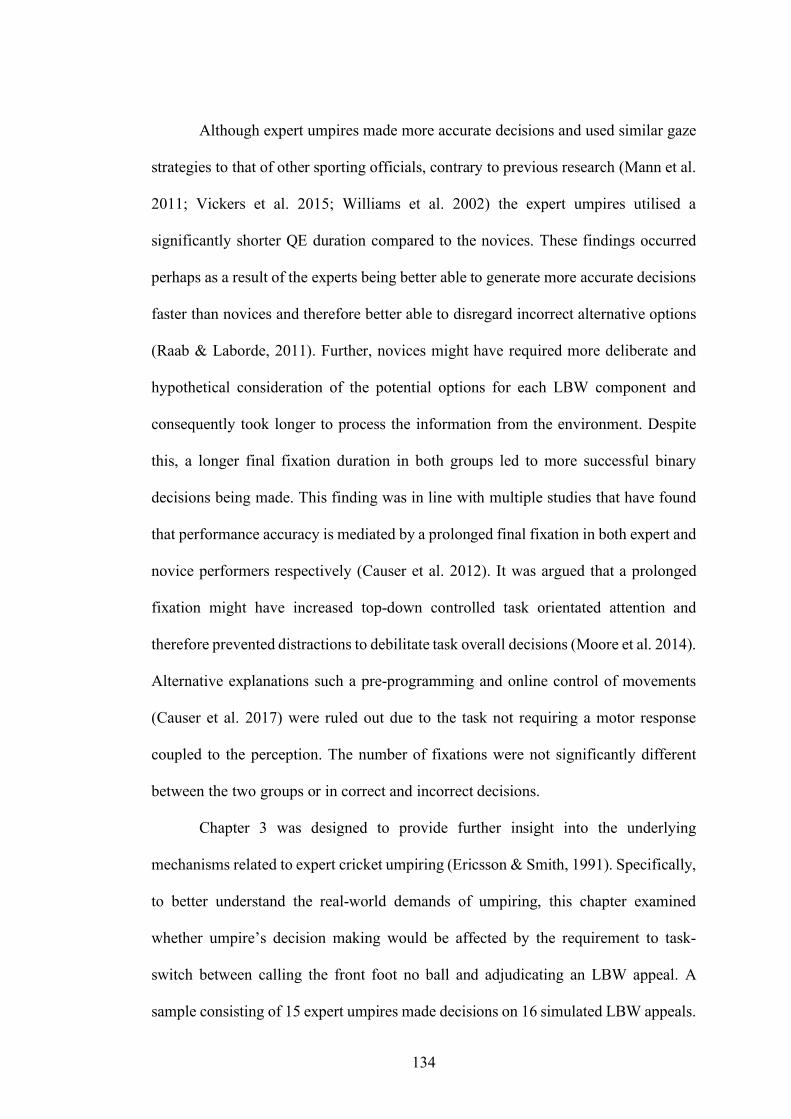
134
Although expert umpires made more accurate decisions and used similar gaze
strategies to that of other sporting officials, contrary to previous research (Mann et al.
2011; Vickers et al. 2015; Williams et al. 2002) the expert umpires utilised a
significantly shorter QE duration compared to the novices. These findings occurred
perhaps as a result of the experts being better able to generate more accurate decisions
faster than novices and therefore better able to disregard incorrect alternative options
(Raab & Laborde, 2011). Further, novices might have required more deliberate and
hypothetical consideration of the potential options for each LBW component and
consequently took longer to process the information from the environment. Despite
this, a longer final fixation duration in both groups led to more successful binary
decisions being made. This finding was in line with multiple studies that have found
that performance accuracy is mediated by a prolonged final fixation in both expert and
novice performers respectively (Causer et al. 2012). It was argued that a prolonged
fixation might have increased top-down controlled task orientated attention and
therefore prevented distractions to debilitate task overall decisions (Moore et al. 2014).
Alternative explanations such a pre-programming and online control of movements
(Causer et al. 2017) were ruled out due to the task not requiring a motor response
coupled to the perception. The number of fixations were not significantly different
between the two groups or in correct and incorrect decisions.
Chapter 3 was designed to provide further insight into the underlying
mechanisms related to expert cricket umpiring (Ericsson & Smith, 1991). Specifically,
to better understand the real-world demands of umpiring, this chapter examined
whether umpire’s decision making would be affected by the requirement to task-
switch between calling the front foot no ball and adjudicating an LBW appeal. A
sample consisting of 15 expert umpires made decisions on 16 simulated LBW appeals.
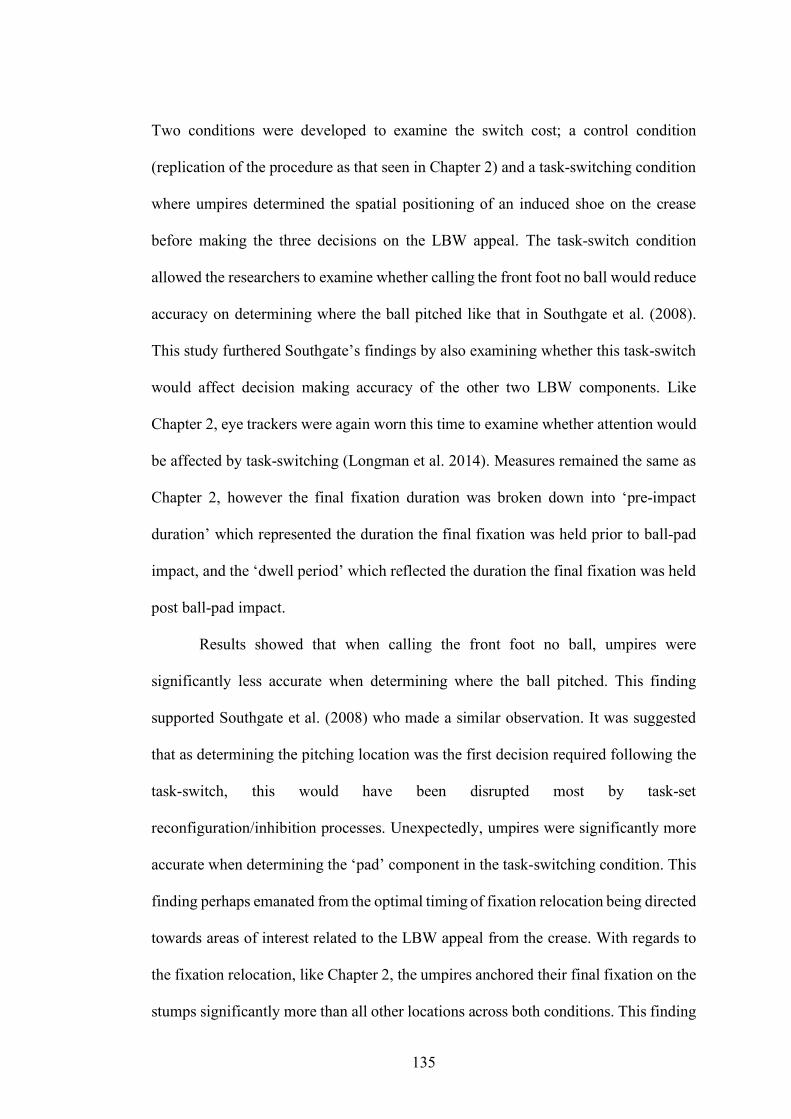
135
Two conditions were developed to examine the switch cost; a control condition
(replication of the procedure as that seen in Chapter 2) and a task-switching condition
where umpires determined the spatial positioning of an induced shoe on the crease
before making the three decisions on the LBW appeal. The task-switch condition
allowed the researchers to examine whether calling the front foot no ball would reduce
accuracy on determining where the ball pitched like that in Southgate et al. (2008).
This study furthered Southgate’s findings by also examining whether this task-switch
would affect decision making accuracy of the other two LBW components. Like
Chapter 2, eye trackers were again worn this time to examine whether attention would
be affected by task-switching (Longman et al. 2014). Measures remained the same as
Chapter 2, however the final fixation duration was broken down into ‘pre-impact
duration’ which represented the duration the final fixation was held prior to ball-pad
impact, and the ‘dwell period’ which reflected the duration the final fixation was held
post ball-pad impact.
Results showed that when calling the front foot no ball, umpires were
significantly less accurate when determining where the ball pitched. This finding
supported Southgate et al. (2008) who made a similar observation. It was suggested
that as determining the pitching location was the first decision required following the
task-switch, this would have been disrupted most by task-set
reconfiguration/inhibition processes. Unexpectedly, umpires were significantly more
accurate when determining the ‘pad’ component in the task-switching condition. This
finding perhaps emanated from the optimal timing of fixation relocation being directed
towards areas of interest related to the LBW appeal from the crease. With regards to
the fixation relocation, like Chapter 2, the umpires anchored their final fixation on the
stumps significantly more than all other locations across both conditions. This finding

136
provided further support for the utility of a gaze anchor in this task (Vater et al. 2019).
Despite this finding, when required to task-switch the umpires directed their final
fixation more towards ‘other’ irrelevant locations compared to the control condition.
This finding was in line with literature which has shown that upon task-switching,
attentional settings also require reconfiguration and therefore a switch between two
tasks can lead to an inaccurate fixation on the second task (Longman et al., 2013;
Longman et al., 2014; Longman et al. 2017). Results from this chapter also supported
Chapter 2 data in that a longer final fixation duration irrespective of condition led to
more successful LBW decisions. Upon further examination into the onset and offset
of this QE period, it was found that despite having a shorter ‘pre-impact’ final fixation
duration during the task-switching condition, decision making accuracy was
unaffected. This came as little surprise, as most literature surrounding the benefits of
an early onset of QE emphasise its role in pre-programming and online control of a
movement (Causer et al. 2017) and was therefore less relevant to umpiring. Instead, it
was found that the ‘dwell’ period of the QE was the principal predictor for in umpiring
success. It was suggested that this dwell period might have contributed to more
accurate processing of ball flight properties such as angle, deviation and spatial
positioning as it struck the batter’s pad. Like in Chapter 2, the number of fixations on
each trial did not appear to be a precursor to decision making accuracy on this task.
The final experimental chapter of this thesis, Chapter 4, examined whether the
eye movement behaviours that expert umpires displayed in Chapter 2 and Chapter 3
could be trained in novice umpires to generate better decision-making in an online
intervention. A cohort of 72 novice umpires were split into three groups: QE training
group, TT group, and CTRL group. Unlike Chapter 2 and Chapter 3, due to
government COIVD-19 regulations during the months that data was collected, eye

137
movement data was not recorded. Participants performed the same task as the task-
switching condition from Chapter 3. Upon making 8 initial decisions that formed the
pre-test, participants underwent a 30-minute intervention that differed based on which
group they were assigned to. Following training they immediately performed a post-
test and one-week retention test. The post-test and one-week retention tests were
similar to the pre-test but with previously unseen trials. The measures recorded were
radial error for each LBW component across the phases.
In the post-test, only the QE group improved performance on the pitch and pad
components of the LBW rule compared to pre-test results. However, both the QE and
TT groups improved on the wickets component between these two phases. This
finding arose, as it was proposed that the TT intervention primarily provided
instruction on how to perform the wickets aspect of the decision, and provided little
to no guidance on how to make accurate decisions on the other two components. By
contrast, the QE group improving accuracy of all three tasks furthered the idea that a
prolonged final fixation helps maintain top-down goal orientated attention during
umpiring (Corbetta & Shulman, 2002). This may have not only enhanced spatial focus
on the critical points of information, but in turn might have prevented distracting
stimuli from being processed (Vickers, 2017). Further, the intervention might have
enhanced storing of visual information related to the three critical location points of
the ball’s location in the visuo-spatial sketchpad (Moore et al. 2014). It was also found
in the one-week retention test, the QE group maintained performance levels from the
post-test, whereas the TT group’s wickets accuracy declined. It was argued that
similarly to tasks with a motor component QE training might have promoted a form
of implicit learning where they were able to identify multiple critical cues such as ball
flight properties, batter position and the stumps and how these factors would interact
138
with each other. Conversely, the TT intervention offered step-by-step explicit
information related to LBW appeals and therefore might have required further training
to fully automate the skill of processing numerous information points simultaneously.
This summary of findings has highlighted the principal findings made in
Chapters 2, 3 and 4. The following sections will consider the theoretical and applied
implications of the thesis.
5.3 Theoretical Implications
This thesis examined and extended the literature of a variety of theoretical
concepts related to perceptual-cognitive skill, task-switching and QE training. These
theoretical implications will be discussed below.
Perceptual-Cognitive Expertise/Gaze Strategies
This paragraph will discuss the implications related to the final fixation
location seen in Chapters 2 and 3, whilst theoretical implications surrounding the QE
will explored in depth in a later paragraph.
As is the case with the majority of research examining expertise, Chapter 2
demonstrated that expert umpires possess a distinct advantage over novice umpires in
determining the location of all three components of an LBW appeal. However, this
was one of the first studies within sports officiating to utilise an objective performance
measure in the form of Hawk-Eye, unlike those which have adopted subjective
measures (Pizzera et al. 2018; Spitz et al. 2016). A plethora of studies indicate that
superior performance seen in experts are often be underpinned by the use of
specialised visual strategies where they direct their vision to more salient cues in the
environment at the critical times (Mann et al. 2011). Of late, researchers have taken
further interest in examining the strategies engaged by expert officials who adjudicate
139
elite sport. In addition to specialised perceptual-cognitive skills, it has become
apparent that like elite athletes, the expert officials hold a decision-making
performance advantage over lesser skilled counterparts. The stable gaze strategies that
have been displayed in these expert performers have been termed the gaze anchor,
foveal spot and visual pivot (Vater et al. 2019). It has been recognized in this thesis
that the gaze anchor is the preferred strategy used by most expert officials that have
been examined (Moore et al. 2019; Schnyder et al. 2017), suggesting peripheral vision
plays a primary role in decision making. Chapter 2 and Chapter 3 furthered the case
for the gaze anchor as two separate groups of cricket umpires had a propensity to fixate
on the stumps as opposed to areas such as the pitch or the ball. This finding further
supports the idea that when determining the spatial location and timing of a projectile
in relation to other stationary and dynamic objects/people, this gaze strategy is perhaps
optimal. For example, elite and trainee rugby referees officiating on scrums fixated
more on central regions, perhaps to attend to the ball and front rows who might cause
infractions such as collapsing, standing up and wheeling (Moore et al. 2019). Similarly
in football, assistant referees fixated on an imaginary offside line between the passer
and the striker (Schnyder et al. 2017). It was put forward by the authors of this study
anchoring the gaze on this region at the decisive moment of the pass would enable a
better understanding of the attacker’s position relative to the second last defender and
the ball. Whilst cricket umpiring and these two tasks are distinct, they share similar
properties that might be explain why the gaze anchor is an optimal gaze strategy in
various sports officials. All three task require simultaneous processing of multiple
information sources from the display which must be considered in relation to each
other. Therefore, the stumps, offside line and central pack region might all provide a
central cue which the officials can allocate a stable gaze towards. Peripheral vision
140
might then be used to attend to all dynamic information sources such as the cricket
ball, attacker/passer and the back-row forwards in relation to the central anchor point.
This gaze strategy might be of less importance when the official must consider
information that need not be placed in relation to other objects in the display. This
type of task might instead benefit from strategies such as the foveal spot or visual pivot
which would promote higher acuity and depth processing of a single information
source.
Quiet Eye and Quiet Eye Training
Whilst the location of fixation appeared to be of importance, each experimental
chapter in this thesis furthered the idea that long stable QE is also of benefit for tasks
that do not require a motor response. Chapter 2 established that a longer QE duration
during the critical point of ball-pad led to more successful decisions in both expert and
umpire’s alike. This extended the current knowledge as it was the first study to identify
that QE might be a predictor of performance in perceptual-tasks in addition to the more
widely covered motor tasks. However, the principal explanation for the benefits of the
QE are pre-programming and online control of movement parameters, and therefore
the mechanisms as to how it promoted more accurate LBW decision making remained
somewhat unclear. It was suggested that the prolonged final fixation rendered an
increase in processing via the dorsal visual stream (Vickers, 2017), this being the
attentional network that has been attributed to successful object location identification
(Zachariou et al. 2014). Chapter 3 explored how the onset and offset of the QE would
affect decision making success. With the no-ball task being introduced into this
chapter, it was inevitable that the pre-impact duration of the QE would be significantly
reduced. However, this had no effect on decision making success. Instead, it was
141
shown that performance success was in fact predicted by a longer dwell period of the
QE. This finding suggested that not only might the QE be generally of benefit to
performers from a variety of disciplines, the importance of its onset and offset is likely
determined by the specific properties of the task. The final theoretical implication
surrounding the QE in this thesis came in Chapter 4, where the effectiveness of an
online QE intervention was tested. Findings from this study supported previous
literature which has found that QE training expedites better task performance in
novices in a similar manner to TT (Moore et al. 2012). As previously mentioned, this
finding further supported the idea mentioned in (Moore et al. 2012; Moore et al. 2013;
Vine et al. 2011) that an extended QE increases top-down goal orientated processing.
Also, in line with Moore et al. (2012), the QE intervention led to novices retaining
performance increments unlike those who underwent TT further supporting the idea
that QE training results in the formation of implicit knowledge that might be more
robust to effects of decay (Vine & Wilson, 2010). This was also the first study, to the
author’s knowledge, that highlighted the efficacy of an online QE training programme.
This provides researchers with a novel method of testing the effectiveness of
programmes in tasks which do not require a motor component, with online studies
being beneficial in that they might enable larger sample sizes to collect data from.
Further, for studies that aim to examine a motor related task, the training intervention
can be disseminated to participants online as opposed to being delivered in-situ, with
this method perhaps enabling more efficient data collection where on-site visits are
only required when collecting data.
Task-Switching
142
In Chapter 3, a number of findings provide theoretical implications related to
task-switching literature of cognitive psychology. Literature surrounding the topic has
consistently showcased that when a rapid switch is made from one task to another,
performance measures on the second task are usually lower than if the task were
performed in isolation (Monsell, 2003). This performance decline has been coupled
with a clear effect on attentional allocation when initially performing the second task
(Longman et al. 2017). However, the majority of studies to date which have tested
task-switching have employed the ‘task-switching paradigm’ which is primarily a
laboratory-based design. As such, to the researcher’s knowledge there are no studies
that have examined the switch-cost and its attentional impacts in a representative task.
This can perhaps be attributed to the fact that in most instances, when task-switching
between real world tasks, individuals can afford a higher response time and higher
error rate on the second task. Further, few day-to-day activities require an immediate
task-switch to the extent that the switch-cost will be noticeable. However, cricket
umpiring offered a chance to examine task-switching in an applied setting outside of
traditional methods. With umpires requiring to assess the bowler’s spatial positioning
in relation to the crease before performing a multitude of tasks related to the delivery,
this task offered an opportunity to examine whether the task-switching theory
translates to an applied setting. In corroboration of the predictions of the switch-cost,
Chapter 3 found that the umpires performed worse when determining where the ball
‘pitched’ upon task switching compared to when making LBW decisions exclusively.
This difference was attributed to the switch-cost, as the pitch aspect of the LBW is the
first component that required consideration following adjudication of the front foot no
ball. This study was perhaps the first to extend the task-switching literature by
showcasing potential switch-costs in an applied setting. Chapter 3 also found that upon
143
task-switching the umpires were more likely to allocate their attention to ‘other
locations’. This data furthered the idea that the task-switch affects attentional
allocation (Longman et al. 2017) and that this theory must be considered alongside the
more cited explanations of the switch-cost. This theoretical implication as well as the
ones previously mentioned provide a number of applied implications that will be
considered in the following section.
5.4 Applied Implications
Chapter 2
Chapter 2 was the first study to date that established a simulated LBW task
could be developed to differentiate decision making skill between groups of umpires.
An adaption of this task might therefore be considered as a tool to ascertain the more
competent umpires from lesser ones for future appointments. Specifically, this might
enable cricket boards around the world to establish which umpires are able to better
cope with the demands of the LBW appeal better than others. Further, in the
professional game umpires would be able to distinguish any existing weaknesses they
possess in each LBW component or when adjudicating specific types of deliveries.
Within the amateur game in the UK, some leagues exist where expert umpires
are not appointed to fixtures and consequently club members or players are required
to umpire a set number of overs. A similar task to this could be disseminated to cricket
clubs to enable identification of which players are be better suited to umpiring
matches. This chapter also established that a prolonged QE duration was beneficial for
both expert and novice umpires alike. Whilst the applied implications of QE training
will be explained later on, across the country, amateur club players can be instructed
to maintain a prolonged fixation on the stumps during LBW appeals should they be
144
required to officiate on their matches. This might ensure better decisions are made in
competitions which do not offer the technology for on field players to review the
umpire’s LBW decisions.
Chapter 3
The initial rationale behind this chapter arose when in 2020 the ICC announced
for the first time in Test cricket, as a trial the front foot no ball would be called by the
third umpire. This trial period was implemented to ascertain the benefits of umpires
exclusively adjudicating on ‘play situations’. Data gathered in Chapter 3 supports this
decision, as task-switching from the front foot no ball task to the LBW task appeared
to debilitate decision making accuracy on the pitch component of the decision. For
some deliveries, it is of major importance as to where the ball pitches in relation to the
stumps. More specifically any appeal that pitches outside the leg stump should always
be determined ‘not out’ and therefore it is of the highest importance that umpires
accurately make this decision. This also supported the applied implications of Chapter
2 which highlighted the potential benefits of allocating gaze towards the stumps are
the point of ball-pad impact. Further, a prolonged QE duration was associated with
more accurate decisions in both conditions examined within the chapter. As
technologies to adjudicate ‘no balls’ are not readily available to most leagues in
cricket, this result further emphasises the necessity for those adjudicating cricket
matches to utilise the abovementioned gaze behaviours to prevent the switch-cost
effect as much as possible.
Chapter 4

145
Chapter 4 demonstrates that QE training might provide another method of
improving umpire decision making in addition to the existing training courses. A
plethora of studies have established their effectiveness, and this chapter found that the
benefits of such training are also applicable to novice cricket umpires. Various cricket
boards across the world offer novice umpires training in the form of incremental
development phases, and therefore a similar intervention to that of Chapter 4 could be
delivered at an early stage to expedite immediate improvements. This course could
also be disseminated via an online platform similarly to Chapter 4 to ensure a wider
reach to all those enrolled on the courses. Such interventions might also be developed
and delivered to players by cricket clubs so that they are fully trained for instances
where they are required to officiate. This intervention should not be implemented as
an alternative to current training programmes as it is of extreme importance that new
umpires become familiar with the numerous technicalities associated with umpiring.
From an experiential account, an online approach provided several challenges that
should be addressed if such a design is implemented when following the expert
performance approach (Ericsson & Smith, 1991). Perhaps the first consideration that
future researchers must make is identifying a platform that offers methods of
collecting data that is sensitive as the first step of Ericsson & Smith’s framework
prescribes. The next challenge was to ensure participants were aware of the demands
of the task with the researcher’s being unable to provide 1 on 1 guidance prior to
initiation of the data collection. Whilst this might not pose an issue to studies utilising
self-report methodologies, the complex nature of this design, which involved the
execution of 4 decisions, increased the researcher’s consideration of how the
instructions would be interpreted by participants. Therefore, to assess the clarity of the
instructions, pilot testing was conducted on a number of students similar in their

146
cricket experience and age to that of the sample examined. The instructions were also
presented prior to the pre-test and importantly in the one-week retention test so that
any effects could be attributed to the intervention as opposed to individual differences
in declarative and procedural memory functions between the participants and groups.
5.5 Limitations and Future Research
As is the case with research, limitations of the methodology existed in this
thesis which help provide questions for future research. Each chapter possessed
general and specific limitations which will be discussed
General Limitations
In Chapter 2 and Chapter 3, most of the expert umpires examined, officiated
in elite club cricket, the highest form of amateur cricket. Whilst many of these umpires
had officiated in hundreds of matches including first class and international players,
they were unpaid and therefore deemed non-professionals. Within professional cricket
in England, each year the England Cricket Board (ECB) recruits a number of umpires
onto the ‘First Class Umpires List’ and another set of umpires onto the ‘Reserve First
Class Umpires List’. Whilst it remains to be seen whether these umpires retain a
performance advantage over the those tested within the thesis, in theory due to being
termed a ‘professional’ they would be assigned to a group termed ‘elite’. Further, a
selection of umpires considered to be the best from each first-class list globally are
appointed onto the International Cricket Council Elite Panel. As such, future research
must examine these two groups in a similar manner to Chapter 2 and Chapter 3 to
establish; whether they also use a gaze anchor, whether they also exhibit similar
behaviours when task-switching and ultimately whether their decision-making skills

147
exceed those of the present sample similarly to Spitz et al. (2016) and Hancock and
Ste-Marie (2013), or if performance accuracy in LBW decision making plateaus at the
sub-elite level.
Another limitation of each chapter was that deliveries utilised in this study
were released at speeds ranging between 65-80mph. Whilst each trial in the thesis did
vary in release point, angle of trajectory and swing, professional cricket can at times
involve bowlers delivering the ball at a velocity of over 95mph. On top of this,
professional spin bowlers are capable of implementing revolutions on the ball so that
it considerably deviates from a typical post bounce trajectory. As such, future research
should examine how these two contextual variables influence umpire decision making
and whether the strategies presented in this thesis can counter these extra demands.
Another future research direction would be to further examine peripheral vision
processing. Expert umpires in Chapter 2 and Chapter 3 appeared to use a gaze anchor
to process various information cues, however it remains to be seen whether they
possess an advantage for processing this information over lesser skilled counterparts.
Some evidence examining experienced and inexperienced motorcar drivers (Crundall
et al. 1999) suggests that deliberate practice might lead to an advantage in processing
cues located away from the fovea via an expanded FFoV. Such an advantage might
render umpires the ability to utilise a gaze anchor whereby they can process
information related to where the ball pitches and strikes the batter’s pad without
requiring additional fixations which might be suboptimal due to the unique time
constraints posed in cricket. Similar methodologies to that of Crundall et al. (1999)
with a umpiring task might be implemented to examine whether this is a phenomenon
that applies to cricket umpires and other expert performers. It was also suggested
throughout each experimental chapter that a prolonged QE might have enabled the

148
prevention of distractive stimuli being processed, however further measures can be
put in place to test this hypothesis. This might be achieved when it is possible to record
eye tracking, by adding a transfer condition where participants are placed under
stressful situations in Chapter 4 to enable understanding of whether the QE prevents
the predictions of ACT in which fixations distributed more frequently across the
display for shorter durations (Moore et al. 2012). Finally, to further validate the
findings from each chapter, an in-situ design might be of benefit. However, before
such a study design is implemented, some of the issues related to practicality must be
addressed. Perhaps the greatest challenge would be that each participant must view
the same amount of deliveries that possess the same contextual factors (where it
pitches, angle of deviation, where it would have travelled etc.) which would be
difficult to control for due to atmospheric conditions holding a principal role in this.
Despite being less practical than the methodologies used in this thesis, a design such
as this would potentially further emphasise the findings made in this thesis and might
also provide an indication of whether decision making accuracy varies throughout
different time periods of matches. Each chapter within this thesis also held their own
distinct limitations and areas for future research which will be considered below.
Chapter 2
Whilst the aims of Chapter 2 were to provide descriptive findings related to
expert-novice decision making accuracy and eye movements, and to provide
predictive validity of the task, some limitations were apparent. Firstly, unlike Chapter
3, the no-ball task was not included in this chapter. Whilst Chapter 3 confirmed expert
umpires still opted for a gaze anchor when required to perform the no-ball task, it is
possible that by including it within Chapter 2, the poorer performance seen in novice
149
umpires might have been further exacerbated. Future research might also seek to
examine umpire thought processes during decision making via qualitative methods to
examine whether the expert performance advantage was a result of distinct
contemplation of the appeal. This would be straightforward to implement unlike other
more dynamic sports, as umpires remain largely stationary throughout the task. It has
been reported that elite athletes possess superior working memory processing abilities
(Vaughan & Laborde, 2021). As cricket umpiring is a task that likely requires use of
the visuospatial and central executive functions, inspection of whether expert-novice
differences are predicted by working memory processes might be of some use. Should
general working memory advantages not exist, domain-specific LT-WM advantages
(Ericsson & Kintsch, 1995) can also be examined between groups. Examination of
both of these cognitive functions could be of high importance for both umpire training
and selection purposes. Further breakdown decision making with respect to delivery
type might also be of use, and whether increased deviation of the pitch via swing and
spin might lead to a greater understanding of where the expertise advantage lies within
the LBW appeal.
Chapter 3
The aim of Chapter 3 was to examine if task-switching affected LBW decision
making of expert umpires. Whilst including the front foot no ball task somewhat
alleviated a limitation of Chapter 2, this chapter only included expert and not novice
umpires. Limitations also surrounded the induced shoe that aimed to represent the no-
ball task. Firstly, the shoe was clearly visible on all task-switch trials from the instance
it appeared. However, from an umpire’s perspective the bowler’s body positioning
sometimes obstructs clear view of where they ground their shoe (Figure 5.1) for a
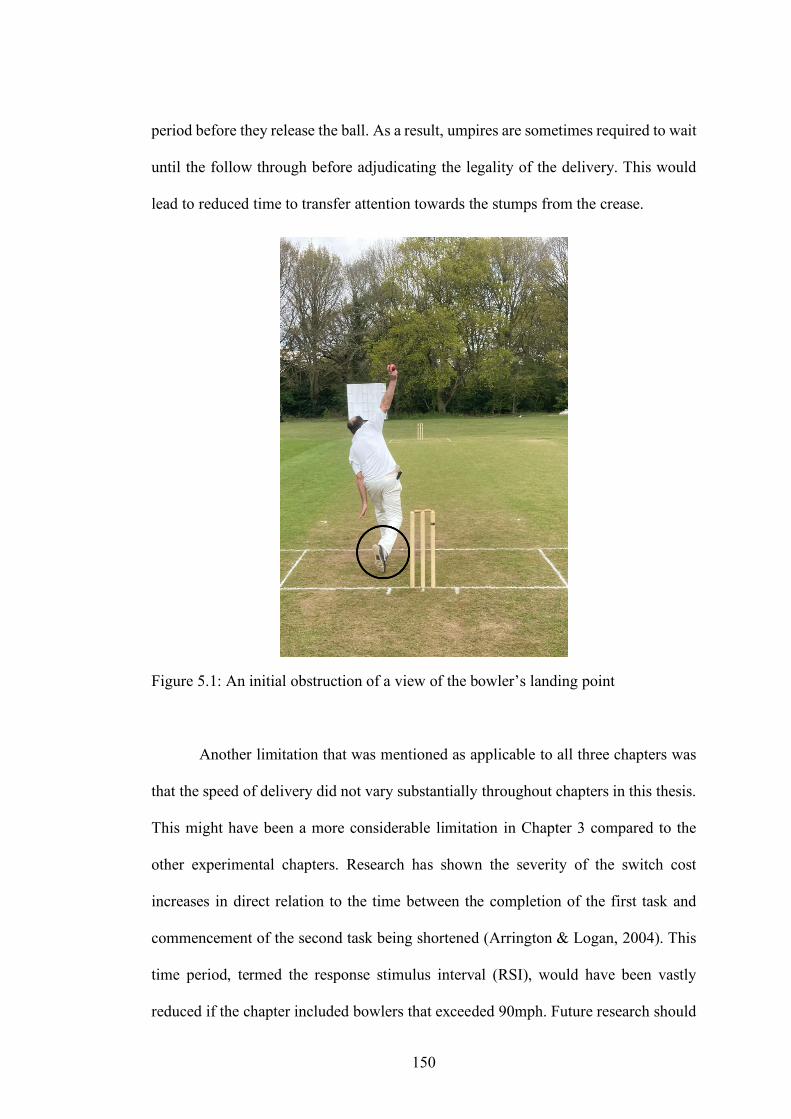
150
period before they release the ball. As a result, umpires are sometimes required to wait
until the follow through before adjudicating the legality of the delivery. This would
lead to reduced time to transfer attention towards the stumps from the crease.
Figure 5.1: An initial obstruction of a view of the bowler’s landing point
Another limitation that was mentioned as applicable to all three chapters was
that the speed of delivery did not vary substantially throughout chapters in this thesis.
This might have been a more considerable limitation in Chapter 3 compared to the
other experimental chapters. Research has shown the severity of the switch cost
increases in direct relation to the time between the completion of the first task and
commencement of the second task being shortened (Arrington & Logan, 2004). This
time period, termed the response stimulus interval (RSI), would have been vastly
reduced if the chapter included bowlers that exceeded 90mph. Future research should

151
therefore address this by manipulation of delivery speeds and investigate whether the
switch-cost related performance decline is further exacerbated in relation to delivery
speeds increasing. Finally, within Chapter 2, trials were controlled to only include
deliveries that were released from right arm over the wicket. With accuracy of the
‘pitch’ component decreasing whilst task-switching, there should be investigation of
whether the same effect occurs in ‘right arm around the wicket’ appeals. Unlike ‘over
the wicket trials’ the pitch component on these trials hold importance as one of the
principal considerations is whether the ball pitches outside the line of the leg stump.
Future research might also consider whether task-switching affects other important
umpiring decisions such as caught behind appeals, which likely require processing an
alchemy of visual and auditory information. Any attentional misallocation therefore
might negatively affect these decisions in addition to the pitch component of the LBW.
Chapter 4
Due to the government regulations, the researchers were unable to
physically collect data from participants. As such several limitations existed with
Chapter 4. However before considering these limitations, it would be appropriate to
broadly outline the intended design of Chapter 4 before COVID-19 restrictions came
into effect. Having identified an expert prototype in Chapter 2 and Chapter 3, the next
step was to collect eye movement data from the novices whilst they made the LBW
decisions in the pre-test. Results in this phase would have dictated which group they
would be allocated into. The next stage of the intervention would have involved
presenting the expert prototype alongside the novice’s own gaze behaviour so that a
comparison could be made between their respective QE characteristics. Participants
would have then performed training blocks, but unlike Chapter 4, eye movement data

152
would have been recorded again so that the researchers could trace learning of the
expert prototype. An ideal QE training study would have also included an anxiety
based transfer test following the retention-test like in Moore et al. (2012) and Moore
et al. (2013). This would have permitted the researchers to understand whether anxiety
affects attention in line with attentional control theory (ACT) to the extent that LBW
decision making accuracy is disrupted and whether QE training protects umpires from
this.
to measure whether participants would continue maintain a gaze anchor on the stumps
or their attention would be misallocated as per ACT. Depending on participant drop-
outs, a 6-week retention period like that seen in Miles et al. (2015). Whilst the online
methodology offered similar results to that expected from typical QE studies,
limitations existed that prevented definite conclusions from being made. Perhaps the
most obvious limitation related to this and other online methodologies, was that data
was collected online without presence of the researchers. Whilst this was the only
option at the time of collection and did provide the benefit of being able to disseminate
the study to a large sample, the researchers were to some degree unable to control
certain factors that would often be controlled in a typical experimental setting. First,
with respects to the pre-test, post-test and one-week retention test, the researchers were
unable to determine whether participants engaged in each trial. Should future
perceptual-cognitive training studies require distribution via an online platform,
perhaps following the training phase, the participants could be tested on the relevant
information from the intervention via a questionnaire. The other limitation related to
the online nature of the task was that eye tracking data was not collected. As a
consequence, performance increments seen in the QE group could only be
circumspectly explained by the intervention.

153
In addition to the issues surrounding COVID-19 regulations, some limitations
existed related to the protocol of the study which could be addressed in future research.
Like previous research, this Chapter included a one-week retention test (Vine &
Wilson, 2010; Vine & Wilson, 2011; Vine et al. 2013). However recently, studies such
as Miles et al. (2017) have collected data after one and six weeks respectively. This
six-week delayed retention further permitted the authors of this study to establish
whether their training intervention led to an enduring change in visual attention
processes and overall performance. Future studies around QE training in umpiring and
indeed other domains should follow Miles et al. (2017) as a template to gain further
understanding of skill learning. The chapter also did not combine TT and QE
interventions to understand whether such a combination further expedites learning in
the task. Finally, QE training studies might also prove to be useful in expert cricket
umpires, however this hypothesis requires testing. Should this type of training render
improved decision making capabilities in this group, then governing bodies can use
regular training and testing similarly to ‘Professional Game Match Officials Limited’
to ensure high standards are maintained at both professional and development pathway
levels.
5.6 Concluding Remarks
To summarise, this thesis utilised the expert-performance approach to provide
the first extensive investigation of the use of perceptual-cognitive skills in cricket
umpiring. Research has consistently established that perceptual-cognitive skills can
predict performance in elite and amateur sport (Causer et al. 2012). Some isolated
studies have highlighted perceptual-cognitive skills perform a role in mediating
decision making in sporting officials (Pizzera et al. 2018; Schnyder et al. 2017; Spitz
154
et al. 2016), however this area has received little attention in comparison to the
research surrounding athletes. The current thesis aimed to examine various processes
related to expert cricket umpires and whether these processes could be embedded in
novices to expedite learning. Literature surrounding sports officiating was extended
as two groups of expert umpires from separate leagues in different regions of the
United Kingdom utilised similar gaze behaviours suggesting this is a skill developed
through extensive deliberate practice. Literature surrounding the QE was also
extended as this thesis established that a prolonged final fixation can enhance the
performance of tasks that do not necessitate a movement response. This result was
consistently reported throughout the thesis suggesting an attentional component of the
QE exists in addition to the often-reported pre-programming (Causer et al. 2017) and
inhibition explanations (Klostermann et al. 2014). Importantly, the benefits of the QE
extended into the final experimental chapter which demonstrated that this perceptual-
cognitive skill could be taught to novice umpires for the advancement of their LBW
decision making accuracy. Overall this thesis provides theoretical implications that
can help navigate perceptual-cognitive skill research in a new direction that involves
examination of perceptual attributes more closely, whilst applied implications can be
readily implemented across the cricket pyramid to improve the standard of LBW
decision making.

155
References
156
Abernethy, B., & Mann, D.L. (2008). Dual Pathways or Dueling Pathways for Visual
Anticipation? A response to Van Der Kamp, Rivas, Van Doorn & Savelsbergh.
International Journal of Sport Psychology, 39(2), 136-141.
Adie, J. M., Renshaw, I., & Polman, R., Thompson, M. B., & Mann, D. L. (2020). When
in doubt, it’s not out: Match format is associated with differences in elite-level
cricket umpires’ leg-before-wicket decisions. Psychology of Sport and Exercise,
51, 101760.
Adolphe, R., Vickers, J.N., & Laplante, G. (1997). The Effects of Training Visual
Attention of Gaze Behaviour and Accuracy: A Pilot Study. International Journal
of Sport Vision, 4(1), 28-33.
Aitsebaomo, A. P., & Bedell, H. E. (1992). Psychophysical and saccadic information
about direction for briefly presented visual targets. Vision Research, 32(9), 1729-
1737.
Allport, A., Styles, E.A., & Hsieh, S. (1994). Shifting international set: Exploring the
dynamic control of tasks. In. Umilta, C. & M. Moscovitch, M. (Eds.), Attention
and performance XV (pp. 421-452). Cambridge, MA: MIT Press
Anderson, J. R. (1982). Acquisition of cognitive skill. Psychological Review, 89, 369-
406.
Anson, G., Elliott, D., & Davids, K. (2005). Information Processing and Constraints-
based Views of Skill Acquisition: Divergent or Complementary? Motor Control,
9, 217-241.
Arrington, C.M., & Logan, G.D. (2004). The Cost of a Voluntary Task Switch.
Psychological Science, 15(9), 610-615.
Atkinson, R.C., & Shiffrin, R.M. (1968). Human Memory: A Proposed System and its
Control Processes. Psychology of Learning and Motivation, 2, 89-195.
157
Baddeley, A., & Hitch, G. J. (1974). Working memory. In G. A. Bower (Ed.), Recent
Advances in Learning and Motivation (8th Volume). Academic Press.
Baddeley, A.D. (1997) Human Memory: Theory and Practice (Revised Edition).
Psychology Press, East Sussex.
Baddeley, A. (1998). Recent developments in working memory. Current Opinion in
Neurobiology, 8(2), 234-238.
Baddeley, A. (2000). The episodic buffer: a new component of working memory?
Trends in Cognitive Sciences, 4(11), 417-423.
Baddeley, A. (2012). Working Memory: Theories, Models, and Controversies. Annual
Review of Psychology, 63, 1-29.
Baars, B.J., & Gage, N.M. (2010). Cognition, Brain, and Consciousness: Introduction
to cognitive neuroscience (2nd edition). Elsevier Academic Press.
Becker, W. (1972). The control of eye movements in the saccadic system. Biblioteca
Ophthalmologica, 82, 233-243.
Behan, M., & Wilson, M. (2008). State anxiety and visual attention: The role of the quiet
eye period in aiming to a far target. Journal of Sports Sciences, 26(2), 207-215.
Belling, P.K., Suss, J., & Ward, P. (2015). Advancing theory and application of cognitive
research in sport: Using representative tasks to explain and predict skilled
anticipation, decision-making, and option-generation behaviour. Psychology of
Sport and Exercise, 16, 45-59.
Borooah, V. K. (2013). Upstairs and Downstairs: The Imperfections of Cricket’s
Decision Review System. Journal of Sports Economics, 17(1), 64-85.
Broadbent, D., Causer, J., Williams, A. M., & Ford, P. R. (2015). Perceptual-cognitive
skill training and its transfer to expert performance in the field: Future research
directions. European Journal of Sport Science, 15(4), 322-331.
158
Causer, J., Bennett, S.J., Holmes, P.S., Janelle, C.M., & Williams, A.M. (2010). Quiet
Eye Duration and Gun Motion in Elite Shotgun Shooting. Medicine & Science in
Sports & Exercise, 42(8), 1599-1608.
Causer, J., Holmes, P.S., & Williams, A.M. (2011). Quiet Eye Training in a Visuomotor
Control Task. Medicine & Science in Sports & Exercise, 43(6), 1042-1049.
Causer, J., Janelle, C. M., Vickers, J. N., & Williams, A. M. (2012). “Perceptual training:
what can be trained”. In. Hodges, N. J., and Williams, A. M. Skill acquisition in
sport: research, theory and practice (pp 306-324). London: Routledge.
Causer, J., Vickers, J.N., Snelgrove, R., Arsenault, G., & Harvey, A. (2014a).
Performing under pressure: Quiet eye training improves surgical knot-tying
performance. Surgery, 156(5), 1089-1096.
Causer, J., Harvey, A., Snelgrove, R., Arsenault, G., & Vickers, J.N. (2014b). Quiet eye
training improves surgical knot tying more than traditional technical training: a
randomized controlled study. The American Journal of Surgery, 208, 171-177.
Causer, J., Hayes, S.J., Hooper, J.M, & Bennett, S.J. (2017). Quiet eye facilitates
sensorimotor preprograming and online control of precision aiming in golf putting.
Cognitive Processing, 18(1), 47-54.
Chalkley, D., MacMahon, C., & Ball, K. (2013). Predicting Ball Flight in Cricket from
an Umpire's Perspective. International Journal of Sports Science & Coaching,
8(3), 445-454.
Chedzoy, O. B. (1997). The effect of umpiring errors in cricket. Journal of the Royal
Statistical Society: Series D (The Statistician), 46(4), 529-540.
Chirico, A., Fegatelli, D., Galli, F., Mallia, L., Alivernini, F., Cordone, S., Giancamilli,
F., Pecci, S., Tosi, G.M., Giordano, A., Lucidi, F., & Massaro, M. (2019). A study
159
of quiet eyeʼs phenomenon in the shooting section of “laser run” of modern
pentathlon. Journal of Cellular Psychology, 234(6), 9247-9254.
Collins, H. (2010). The Philosophy of Umpiring and the Introduction of Decision-Aid
Technology. Journal of the Philosophy of Sport, 37(2), 135-146.
Collins, H., & Evans, R. (2012). Sport-decision aids and the “CSI-effect”: Why cricket
uses Hawk-Eye well and tennis uses it badly. Public Understanding of Science,
21(8), 904-921.
Corbetta, M., & Shulman, G.L. (2002). Control of Goal-Directed and Stimulus-Driven
Attention in the Brain. Nature Reviews Neuroscience, 3, 201-215.
Craven, B. J. (1998). A psychophysical study of leg-before-wicket judgments in cricket.
British Journal of Psychology, 89(4), 555-578.
Croft, J. L., Button, C., & Dicks, M. (2010). Visual strategies of sub-elite cricket
batsmen in response to different ball velocities. Human Movement Science, 29,
751-763.
Crowe, S. M., & Middeldorp, J. (1996). A Comparison of Leg before Wicket Rates
between Australians and Their Visiting Teams for Test Cricket Series Played in
Australia, 1977–94. Journal of the Royal Statistical Society: Series D (The
Statistician), 45(2), 255-262.
Crundall, D., Underwood, G., & Chapman, P. (1999). Driving experience and the
functional field of view. Perception, 28, 1075-1087.
D’Souza, R. (2019). It’s IPL, not club cricket’ – Virat Kohli fumes after missed no-ball
mars thriller. Retrieved from https://wisden.com/stories/global-t20-
leagues/indian-premier-league-2019/ipl-club-cricket-virat-kohli
160
Davis, C. (2017, June 1). The art of the review. Retrieved from
http://www.espn.co.uk/cricket/story/_/id/19835497/charles-davis-analyses-use-
drs-players-teams
Duggal, M. (2014). Hawk Eye Technology. Journal of Global Research Computer
Science & Technology, 1(2), 30-36.
Elchlepp, H., Best, M., Lavric, A., & Monsell, S. (2017). Shifting Attention Between
Visual Dimensions as a Source of Switch Costs. Psychological Science, 28(4),
470-481.
Ericsson, K. A., & Smith, J. (1991). Prospects and limits of the empirical study of
expertise: An introduction. In K. A. Ericsson & J. Smith (Eds.), Toward a general
theory of expertise: Prospects and limits (pp. 1–38). Cambridge University Press.
Ericsson, K.A., Krampe, R.T., & Tesch-Romer, C. (1993). The Role of Deliberate
Practice in the Acquisition of Expert Performance. Psychological Review, 100(3),
363-406.
Ericsson, K.A., & Kintsch, W. (1995). Long-term working memory. Psychological
Review, 102(2), 211-245.
Ericsson, K. A. (2008). Deliberate practice and acquisition of expert performance: A
general overview. Academic Emergency Medicine, 15, 988-994.
Evans, L.H., Herron, J.E., & Wilding, E.L. (2015). Direct Real-Time Neural Evidence
for Task-Set Inertia. Psychological Science, 26(3), 284-290.
Eysenck, M.W., Derakshan, N., Santos, R., & Calvo, M.G. (2007). Anxiety and
Cognitive Performance: Attentional Control Theory. Emotion, 336-353.
Eysenck, M.W., & Derakshan, N. (2011). New perspectives in attentional control theory.
Personality and Individual Differences, 50, 955-960.
161
Eysenck, M.W., & Keane, M.T. (2010). Cognitive Psychology: A student’s handbook
(6th Edition), Hove, East Sussex: Psychology Press.
Farrow, D., & Panchuk, D. (2016). Using Quiet Eye training in an elite sport context –
comment on Vickers. Current Issues in Sport Science, 1(105).
Faubert, J., & Sidebottom, L. (2012). Perceptual-Cognitive Training of Athletes. Journal
of Clinical Psychology, 6, 85-102.
Faul, F., Erdfelder, E., Lang, A., & Buchner, A. (2007). G*Power 3: A flexible statistical
power analysis program for the social, behavioral, and biomedical sciences.
Behavior Research Methods, 39, 175-191.
Felton, P. J., Lister, S. L., Worthington, P. J., & King, M. A. (2019). Comparison of
biomechanical characteristics between male and female elite fast bowlers. Journal
of Sports Sciences, 37(6), 665-670.
Furley, P., & Wood, G. (2016). Working Memory, Attentional Control, and Expertise in
Sports: A Review of Current Literature and Directions for Future Research.
Journal of Applied Research in Memory and Cognition, 5(4), 415-425.
Furley, P.A., & Memmert, D. (2010). The role of working memory in sport.
International Review of Sport and Exercise Psychology, 3(2), 171-194.
Furley, P., & Memmert, D. (2013). ‘‘Whom Should I Pass To?’’ The More Options the
More Attentional Guidance from Working Memory. PLoS ONE, 8(5), 1-14.
Furley, P., & Memmert, D. (2015). Creativity and working memory capacity in sports:
working memory capacity is not a limiting factor in creative decision making
amongst skilled performers. Frontiers in Psychology, 6(115), 1-7.
Gobet, F. (2000). Long-term working memory: A computational implementation for
chess expertise. Proceedings of the 3rd International Conference on Cognitive
Modelling, 142-149.

162
Gonzalez, C.C., Causer J., Miall, R.C., Grey, M.J., Humphreys, G., & Williams, A.M.
(2017a). Identifying the causal mechanisms of the quiet eye. European Journal of
Sport Science, 17(1), 74-84.
Gonzalez, C.C., Causer, J., Grey, M.J., Humphreys, G.W., Miall, R.C., & Williams,
A.M. (2017b). Exploring the quiet eye in archery using field- and laboratory-based
tasks. Experimental Brain Research, 235(9), 2843-2855.
Gredin, N.V., Broadbent, D.P., Findon, J.L., Williams, A.M., & Bishop, D.T. (2019).
The impact of task load on the integration of explicit contextual priors and visual
information during anticipation. Psychophysiology, 57(4), 1-13.
Haider, H., & Frensch, P. A. (1999). Eye movement during skill acquisition: More
evidence for the information reduction hypothesis. Journal of Experimental
Psychology: Learning, Memory & Cognition, 25, 172–190.
Hancock, D. J., & Ste-Marie, D. M. (2013). Gaze behaviors and decision making
accuracy of higher- and lower-level ice hockey referees. Psychology of Sport and
Exercise, 14(1), 66–71.
Harris, D.J., Vine, S.J., & Wilson, M.R. (2017). Flow and quiet eye: the role of
attentional control in flow experience. Cognitive Processing, 18, 343-347.
Hausegger, T., Vater, C., & Hossner, E. (2019). Peripheral Vision in Martial Arts
Experts: The Cost-Dependent Anchoring of Gaze. Journal of Sport and Exercise
Psychology, 41(3), 137-145.
Heffer, S. (2016, October 31). DRS betrays the spirit of cricket and undermines the art
of umpiring. Retrieved from https://www.telegraph.co.uk/cricket/2016/10/31/drs-
betrays-the-spirit-of-cricket-and-undermines-the-art-of-umpi/
Hubel D.H. (1988). Eye, Brain and Vision (1st Edition). Scientific American Library.
163
Jacoby, L.L. & Bartz, W.H. (1972). Rehearsal and Transfer to LTM. Journal of Learning
and Verbal Behavior, 11, 561-565.
Jackson, R.C., & Farrow, D. (2005). Implicit perceptual training: How, when, and why?
Human Movement Science, 24, 308-325.
James, T.W., Culham, J., Humphrey, G.K. Milner, A.D., & Goodale, M.A. (2003).
Ventral occipital lesions impair object recognition but not object-directed
grasping: an fMRI study. Brain, 126, 2463-2475.
Janelle, C.M., Hillman, C.H., Apparies, R.J., Murray, N.P., Meili, L., Fallon, E.A., &
Hatfield, B.D. (2000). Expertise Differences in Cortical Activation and Gaze
Behavior During Rifle Shooting. Journal of Sport & Exercise Psychology, 22,
167-182.
Jersild, A.T. (1927). Mental set and shift. Archives of Psychology, 14, 5-92.
Johnson, J. G., & Raab, M. (2003). Take the first: option-generation and resulting
choices. Organizational Behavior and Human Decision Processes, 91, 215-229.
Kato, T., & Fukuda, T. (2002). Visual search strategies of baseball batters: Eye
movements during the preparatory phase of batting. Perceptual and Motor Skills,
94, 380-386.
Kiesel, A., Steinhauser, M., Wendt, M., Falkenstein, M., Jost, K., Phillip, A.M., & Koch,
I. (2010). Control and Interference in Task Switching-A Review. Psychological
Bulleting, 136(5), 849=874.
Klostermann, A. (2019). Picking an apple from a tree: Response-selection demands,
inhibition requirements, and the functionality of the Quiet Eye in a far-aiming task.
Quarterly Journal of Experimental Psychology, 72(5), 1233-1241.

164
Klostermann, A. (2020). Perception and action in a far-aiming task: Inhibition demands
and the functionality of the Quiet Eye in motor performance. Psychology of Sport
& Exercise, 50, 101736.
Klostermann, A. Vater, C., Kredel, R., & Hossner, E. (2020). Perception and Action in
Sports. On the Functionality of Foveal and Peripheral Vision. Frontiers in Sports
and Active Living, 1(66), 1-5.
Klostermann, A., & Hossner, E. (2018). The Quiet Eye and Motor Expertise: Explaining
the “Efficiency Paradox”. Frontiers in Psychology, 9(104).
Klostermann, A., & Moeinirad, S. (2020). Fewer fixations of longer duration? Expert
gaze behavior revisited. German Journal of Exercise and Sport Research, 50, 146-
161.
Klostermann, A., Kredel, R., & Hossner, E. (2014). On the Interaction of Attentional
Focus and Gaze: The Quiet Eye Inhibits Focus-Related Performance Decrements.
Journal of Sport & Exercise Psychology, 36, 392-400.
Kowler, E., & Blaser, E. (1995). The accuracy and precision of saccades to small and
large targets. Vision Research, 35(12), 1741-1754.
Lamb, T.D. (2016). Why rods and cones? Eye, 30, 179-185.
Land, M. F., & McLeod, P. (2000). From eye movements to actions: How batsmen hit
the ball. Nature Neuroscience, 3, 1340-1345.
Lee, J., & Donkelaar, P.V. (2002). Dorsal and ventral visual stream contributions to
perception-action interactions during pointing. Experimental Brain Research, 143,
440-446.
Longman, C. S., Lavric, A., & Monsell, S. (2013). More attention to attention? An eye-
tracking investigation of selection of perceptual attributes during a task switch.
165
Journal of Experimental Psychology: Learning, Memory, and Cognition, 39(4),
1142-1151.
Longman, C. S., Lavric, A., & Monsell, S. (2017). Self-paced preparation for a task
switch eliminates attentional inertia but not the performance switch cost. Journal
of Experimental Psychology: Learning, Memory, and Cognition, 43(6), 862-873.
Longman, C. S., Lavric, A., Munteanu, C., & Monsell, S. (2014). Attentional inertia and
delayed orienting of spatial attention in task-switching. Journal of Experimental
Psychology: Human Perception and Performance, 40(4), 1580-1602.
Ludwig, C. J. H. (2011). Saccadic decision making. In S. P. Liversedge, I. D. Gilchrist,
& S. Everling (Eds.), The Oxford Handbook of Eye Movements (pp. 425-437).
Oxford: Oxford University Press.
MacMahon, C., Helsen, W. F., Starkes, J. L., & Weston, M. (2007). Decision-making
skills and deliberate practice in elite association football referees. Journal of
Sports Sciences, 25(1), 65-78.
Mann, D. L., Causer, J., Nakamoto, H., & Runswick, O. R. (2019). Visual search
behaviors in expert perceptual judgements. In A. M. Williams & R. C. Jackson
(Eds.), Anticipation and Decision Making in Sport (pp. 59-78). Abingdon, Oxford:
Routledge.
Mann, D. T. Y., Williams, A. M., Ward, P., & Janelle, C. M. (2007). Perceptual-
cognitive expertise in sport: A Meta-Analysis. Journal of Sport & Exercise
Psychology, 29, 457-478.
Mann, D.T.Y., Coombes, S.A., Mousseau, M.B., & Janelle, C.M. (2011). Quiet eye and
the Bereitschaftspotential: visuomotor mechanisms of expert motor performance.
Cognitive Processing, 12, 223-234.
166
Mann, D. L., Spratford, W., & Abernethy, B. (2013). The head tracks and gaze predicts:
how the world's best batters hit a ball. PloS one, 8(3), e58289-e58289.
Marylebone Cricket Club. (2017). The Laws of Cricket 2017 code (2nd edition - 2019
ed.). London: Marylebone Cricket Club.
Milazzo, N., Farrow, D., Ruffault, A., & Fournier, J.F. (2016). Do karate fighters use
situational probability information to improve decision-making performance
during on-mat tasks? Journal of Sport Sciences, 34(16), 1547-1556.
Miles, C.A.L., Vine, S.J., Wood, G., Vickers, J.N., & Wilson, M.R. (2014). Quiet eye
training improves throw and catch performance in children. Psychology of Sport
and Exercise, 15, 511-515.
Miles, C.A.L., Wood, G., Vine, S.J., Vickers, J.N., & Wilson, M.R. (2015). Quiet eye
training facilitates visuomotor coordination in children with developmental
coordination disorder. Research in Developmental Disabilities, 40, 31-41.
Miles, C.A.L., Wood, G., Vine, S.J., Vickers, J.N., & Wilson, M.R. (2017). Quiet eye
training aids the long-term learning of throwing and catching in children:
Preliminary evidence for a predictive control strategy. European Journal of Sport
Science, 17(1), 100-108.
Miller, G.A. (1956). The Magical Number Seven, Plus or Minus Two: Some Limits on
Our Capacity for Processing Information. The Psychological Review, 63(2), 81-
97.
Milner, A. D., & Goodale, M. A. (1995). The visual brain in action. Oxford University
Press.
Milner, A.D., & Goodale, M.A. (2008a). Two visual systems re-viewed.
Neuropsychologia, 46, 774-785.
167
Milner, D., & Goodale, M. (2008b). The two visual streams: In the right ballpark?
International Journal of Sport Psychology, 39, 131-135.
Milner, A.D., Perrett, D.I., Johnston, R.S., Benson, P.J., Jordan, T.R., Heeley, D.W.,
Bettucci, D., Mortara, F., Mutani, R., Terazzi, E., & Davidson, D.L.W. (1991).
Perception and Action in ‘Visual Form Agnosia. Brain, 114, 405-428.
Mishkin, M., & Ungerleider, L.G. (1982). Behavioural Brain Research, 6, 57-77.
Miyake, A., Friedman, N.P., Emerson, M.J., Witzki, A.H., Howerter, A., & Wager, T.D.
(2000). The Unity and Diversity of Executive Functions and Their Contributions
to Complex ‘‘Frontal Lobe’’ Tasks: A Latent Variable Analysis. Cognitive
Psychology, 41, 49-100.
Monsell, S. (2003). Task switching. Trends in Cognitive Science, 7(3), 134-140.
Moore, L.J., Vine, S.J., Cooke, A., Ring, C., & Wilson, M.R. (2012). Quiet eye training
expedites motor learning and aids performance under heightened anxiety: The
roles of response programming and external attention. Psychophysiology, 49,
1005-1015.
Moore, L.J., Vine, S.J., Freeman, P., & Wilson, M.R. (2013). Quiet eye training
promotes challenge appraisals and aids performance under elevated anxiety.
International Journal of Sport and Exercise Psychology, 11(2), 169-183.
Moore, L., Vine, S.J., Smith, A.N., & Smith, S. (2014). Quiet eye training improves
small arms military marksmanship. Military Psychology, 26, 355-365.
Moore, L.J., Harris, D.J., Sharpe, B.T., Vine, S.J., & Wilson, M.R. (2019). Perceptual-
cognitive expertise when refereeing the scrum in rugby union. Journal of Sport
Sciences, 37(15), 1778-1786.

168
Moran, A., Campbell, M., & Toner, J. (2019). Exploring the cognitive mechanisms of
expertise in sport: Progress and prospects. Psychology of Sport & Exercise, 42, 8-
15.
Morris, N., & Jones, D.M. (1990). Memory updating in working memory: The role of
the central executive. British Journal of Psychology, 81, 111-121.
Müller, S., Abernethy, B., & Farrow, D. (2006). How do world-class cricket batsmen
anticipate a bowler's intention? The Quarterly Journal of Experimental
Psychology, 59(12), 2162-2186.
Müller, S., Abernethy, B., Reece, J., Rose, & M., Eid, M., McBean, R., Hart, T., &
Abreu, C. (2009). An in-situ examination of the timing of information pick-up for
interception by cricket batsmen of different skill levels. Psychology of Sport and
Exercise, 10, 644-652.
Nagano, T., Kato, T., & Fukuda, T. (2006). Visual behaviors of soccer players while
kicking with the inside of the foot. Perceptual and Motor Skills, 102, 147-156.
Nieuwenhuis, S., Broerse, A., Nielen, M.M.A., & de Jong, R. (2004). A goal activation
approach to the study of executive function: An application to antisaccade tasks.
Brain and Cognition, 56, 198-214.
Panchuk, D., & Vickers, J.N. (2011). Effect of narrowing the base of support on the gait,
gaze and quiet eye of elite ballet dancers and controls. Cognitive Processing, 12,
267-276.
Perenin, M.T., & Vighetto, A. (1988). Optic Ataxia: A Specific Disruption in
Visuomotor Mechanisms. Brain, 111, 643-674.
Pinder, R. A., Renshaw, I., & Davids, K. (2009). Information–movement coupling in
developing cricketers under changing ecological practice constraints. Human
Movement Science, 28(4), 468-479.
169
Piras, A., Pierantozzi, E., & Squatrito, S. (2014). Visual Search Strategy in Judo Fighters
During the Execution of the First Grip. International Journal of Sports Science &
Coaching, 9(1), 185-197.
Pizzera, A., Möller, C., & Plessner, H. (2018). Gaze Behavior of Gymnastics Judges:
Where Do Experienced Judges and Gymnasts Look While Judging? Research
Quarterly for Exercise and Sport, 89(1), 112-119.
Poletti, M., Intoy, J., & Rucci, M. (2020). Accuracy and precision of small saccades.
Scientific Reports, 10(1), 16097.
Poolton, J.M., & Zachry, T.L. (2007). So You Want To Learn Implicitly? Coaching and
Learning Through Implicit Motor Learning Techniques. International Journal of
Sports Science & Coaching, 2(1), 67-78.
Raab, M., & Johnson, J. G. (2007). Expertise-based differences in search and option-
generation strategies. Journal of Experimental Psychology: Applied, 13(3), 158-
170.
Raab, M., & Laborde, S. (2011). When to Blink and When to Think. Research Quarterly
for Exercise and Sport, 82(1), 89-98.
Remington, L.A., (2011). Clinical Anatomy and Physiology of the Visual System (3rd
Edition). Butterworth-Heinemann.
Renshaw, I., & Fairweather, M.M. (2000). Cricket bowling deliveries and the
discrimination ability of professional and amateur batters. Journal of Sport
Science, 18(12), 951-957.
Ripoll, H., Kerlirzin, Y., Stein, J., & Reine, B. (1995). Analysis of information
processing, decision making, and visual strategies in complex problem solving
sport situations. Human Movement Science, 14, 325-349.
170
Roca, A, Ford, P.R., & Memmert, D. (2021). Perceptual-cognitive processes underlying
creative expert performance in soccer. Psychological Research, 85, 1146-1155.
Rodrigues, S.T, & Navarro, M. (2016). What information is being acquired during the
period of Quiet Eye? Comment on Vickers. Current Issues in Sport Science, 112.
Rubinstein, J.S., Meyer, D.E., & Evans, J.E. (2001). The Cost of a Voluntary Task
Switch. Journal of Experimental Psychology, 27(4), 763-797.
Runswick, O. R., Roca, A., Williams, A. M., McRobert, A. P., & North, J. S. (2019).
Why do bad balls get wickets? The role of congruent and incongruent information
in anticipation. Journal of Sports Sciences, 37(5), 537-543.
Ryu, D., Abernethy, B., Mann, D.L., Poolton, J.M., & Gorman, A.D. (2013). The role
of central and peripheral vision in expert decision making. Perception, 42, 591-
607.
Sacheti, A., Gregory-Smith, I., & Paton, D. (2015). Home bias in officiating: evidence
from international cricket. Journal of the Royal Statistical Society: Series A
(Statistics in Society), 178(3), 741-755.
Sasada, M., Nakamoto, H., Ikudome, S., Unenaka, S., Mori, S. (2015). Color perception
is impaired in baseball batters while performing an interceptive action. Attention,
Perception, & Psychophysics, 77, 2074-2081.
Schneider, D.W., & Logan, G.D. (2007). Defining task-set reconfiguration: The case of
reference point switching. Psychonomic Bulleting, 14(1), 118-125.
Schnyder, U., Koedijker, J.M., Kredel, R., & Hossner, E. (2017). Gaze behaviour in
offside decision-making in football. German Journal of Exercise and Sport
Research, 47, 103-109.
171
Shaw, M., Birch, P.D.J., Runswick, O.R. (2021). An In-Situ Examination of Cognitive
Processes in Professional and Amateur Golfers During Green Reading. Sport,
Exercise, and Psychology, 10(2), 273-289.
Shibasaki, H., & Hallett, M. (2006). What is the Bereitschaftspotential? Clinical
Neurophysiology, 2341-2356.
Smith, E.E., Jonides, J., & Koeppe, R.A. (1996). Dissociating Verbal and Spatial
Working M Using PET. Cerebral Cortex, 6, 11-20.
Southgate, D. C., Barras, N., & Kummer, L. (2008). The effect of three different visual
monitoring strategies on the accuracy of leg-before-wicket decisions by cricket
umpires. Clinical and Experimental Optometry, 91(4), 385-393.
Spitz, J., Put, K., Wagemans, J., Williams, A.M., & Helsen, W.F. (2016). Visual search
behaviors of association football referees during assessment of foul play situations.
Cognitive Research: Principles and Implications, 1(12), 1-11.
Starkes, J. L, & Ericsson, K. A. (Eds.) (2003). Expert performance in sports: Advances
in research on sport expertise. Champaign, IL: Human Kinetics.
Swann, C., Moran, A., & Piggott, D. (2015). Defining elite athletes: Issues in the study
of expert performance in sport psychology. Psychology of Sport and Exercise, 16,
3-14.
Takeuchi, T., & Inomata, K. (2009). Visual search strategies and decision making in
baseball batting. Perceptual and Motor Skills, 108, 971-980.
Vaeyens, R., Lenoir, M., Williams, A. M., Mazyn, L., & Philippaerts, R. M. (2007). The
effects of task constraints on visual search behavior and decision-making skill in
youth soccer players. Journal of Sport & Exercise Psychology, 29, 147-169.
Valyear, K.F., Culham, J.C., Sharif, N., Westwood, D., & Goodale, M.A. (2006). A
double dissociation between sensitivity to changes in object identity and object
172
orientation in the ventral and dorsal visual streams: A human fMRI study.
Neuropsychologia, 44, 218-228.
Vamplew, W. (2007). Playing with the rules: Influences on the development of
regulation in sport. The International Journal of History of Sport, 24(7), 843-871.
Van Der Kamp, J., Rivas, F., Doorn, Van Doorn, H., & Savelsbergh, G.J. (2008). Ventral
and dorsal contributions in visual anticipation in fast ball sports. International
Journal of Sport Psychology, 39(2), 100.
Vandierendonck, A., Liefooghe, B., & Verbruggen, F. (2010). Task Switching: Interplay
of Reconfiguration and Interference Control. Psychological Bulletin, 136(4), 601-
626.
Vansteenkiste, P., Vaeyens, R., Zeuwts, L., Philippaerts, R. M., & Lenoir, M. (2014).
Cue usage in volleyball: A time course comparison of elite, intermediate and
novice female players. Biology of Sport, 31, 295-302.
Vater, C., Kredel, R., & Hossner, E. (2017). Examining the functionality of peripheral
vision: From fundamental understandings to applied sport science. Current Issues
in Sport Science, 2, 1-11.
Vater, C., Williams, A.M., & Hossner, E. (2019). What do we see out of the corner of
our eye? The role of visual pivots and gaze anchors in sport. International Review
of Sport and Exercise Psychology, 13(1), 81-103.
Vaughan, R.S., & Laborde, S. (2021). Attention, working-memory control, working-
memory capacity, and sport performance: The moderating role of athletic
expertise. European Journal of Sport Science, 21(2), 240-249.
Vestberg, T., Gustafson, R., Maurex, L., Ingvar, M., & Petrovic, P. (2012). Executive
Functions Predict the Success of Top-Soccer Players. PLoS ONE, 7(4), 1-5.
Vickers, J.N. (1992). Gaze control in putting. Perception, 21, 117-132.
173
Vickers, J. N. (1996). Visual control while aiming at a far target. Journal of
Experimental Psychology: Human Perception & Performance, 22, 342-354.
Vickers, J.N. (2009). Advances in coupling perception and action: the quiet eye as a
bidirectional link between gaze, attention, and action. Progress in Brain Research,
174, 279-288.
Vickers, J. (2012). Neuroscience of the Quiet Eye in Golf Putting. International Journal
of Golf Science, 1, 2-9.
Vickers (2016a) Origins and current issues in Quiet Eye research. Current Issues in
Sport Science, 1(101).
Vickers, J.N., (2016b). The Quiet Eye: Reply to sixteen commentaries. Current Issues
in Sport Science, 1(118).
Vickers, J.N., Causer, J., & Vanhooren, D. (2019). The Role of Quiet Eye Timing and
Location in the Basketball Three-Point Shot: A New Research Paradigm.
Frontiers in Psychology, 10, 1-16.
Vickers, J.N., & Williams, A.M. (2007). Performing Under Pressure: The Effects of
Physiological Arousal, Cognitive Anxiety, and Gaze Control in Biathlon. Journal
of Motor Behavior, 39(5), 381-394.
Vickers, J.N., Harvey, A., Snelgrove, R., Stewart, A., Arsenault, G., & Mackenzie, C.
(2015). Expertise differences in quiet eye duration and performance in surgical
knot tying. International Journal of Sport Psychology, 46, 528-541.
Vickers, J.N., Rodrigues, S.T., & Edworthy, G. (2000). Quiet eye and accuracy in the
dart throw. International Journal of Sports Vision, 6(1), 30-36.
Vickers, J.N., Vandervies, B., Kohut, C., & Ryley, B. (2017). Quiet eye training
improves accuracy in basketball field goal shooting. Progress in Brain Research,
234, 1-12.

174
Vine, S.J., & Wilson, M.R. (2010). Quiet Eye Training: Effects on Learning and
Performance Under Pressure. Journal of Applied Sport Psychology, 22, 361-376.
Vine, S.J., & Wilson, M.R. (2011). The influence of quiet eye training and pressure on
attention and visuo-motor control. Acta Psychologica, 136, 340-346.
Vine, S.J., Moore, L.J., & Wilson, M.R. (2011). Quiet eye training facilitates
competitive putting performance in elite golfers. Frontiers in Psychology, 2(8).
Vine, S.J., Moore, L.J., & Wilson, M.R. (2014). Quiet eye training: The acquisition,
refinement and resilient performance of targeting skills. European Journal of
Sport Science, 14(1), 235-242.
Vine, S.J., Moore, L.J., Cooke, A., Ring, C., & Wilson, M.R. (2013). Quiet eye training:
A means to implicit motor learning. International Journal of Sport Psychology,
44(4), 367-386.
Williams, A. M. (2009). Perceiving the intentions of others: how do skilled performers
make anticipation judgments? Progress in Brain Research, 174, 73-83.
Williams, A.M., Ford, P.R., Eccles, D.W., & Ward, P. (2011). Perceptual-Cognitive
Expertise in Sport and its Acquisition: Implications for Applied Cognitive
Psychology. Applied Cognitive Psychology, 25, 432-442.
Williams, A.M., Singer, R.N., & Frehlich, S.G. (2002). Quiet Eye Duration, Expertise,
and Task Complexity in Near and Far Aiming Tasks. Journal of Motor Behavior,
34(2), 197-207.
Williams, L.J. (1989). Foveal Load Affects the Functional Field of View. Human
Performance, 2(1), 1-28.
Wilson, M., Causer, J., & Vickers, J. N. (2015). Aiming for excellence: the quiet eye as
a characteristic of expertise. In D. Farrow & J. Baker (Eds.), Routledge Handbook
of Sport Expertise (pp. 22-37).

175
Wilson, M.R., McGrath, J.S., Vine, S.J., Brewer, J., Defriend, D., & Masters, R.S.W.
(2011). Perceptual impairment and psychomotor control in virtual laparoscopic
surgery. Surgical Endoscopy, 25, 2268-2274.
Wilson, M.R., Miles, C.A.L., Vine, S.J., & Vickers, J.N. (2013). Quiet Eye
Distinguishes Children of High and Low Motor Coordination Abilities. Medicine
& Science in Sports & Exercise, 45(6), 1144-1151.
Wilson, M.R., Vine, S.J., & Wood, G. (2009). The Influence of Anxiety on Visual
Attentional Control in Basketball Free Throw Shooting. Journal of Sport &
Exercise, 31, 152-168.
Wilson, M.R., Wood, G., & Vine, S.J. (2016). Say it quietly, but we still do not know
how Quiet Eye training works – comment on Vickers. Current Issues in Sport,
1(117).
Wood, G., & Wilson, M.R. (2011). Quiet-eye training for soccer penalty kicks.
Cognitive Processing, 12, 257-266.
Wood, G., & Wilson, M.R. (2012). Quiet-eye training, perceived control and performing
under pressure. Psychology of Sport and Exercise, 13, 721-728.
Zachariou, V., Klatzky, R., & Behrmann, M. (2014). Ventral and Dorsal Visual Stream
Contributions to the Perception of Object Shape and Object Location. Journal of
Cognitive Neuroscience, 26(1), 189-209.

176
Appendix
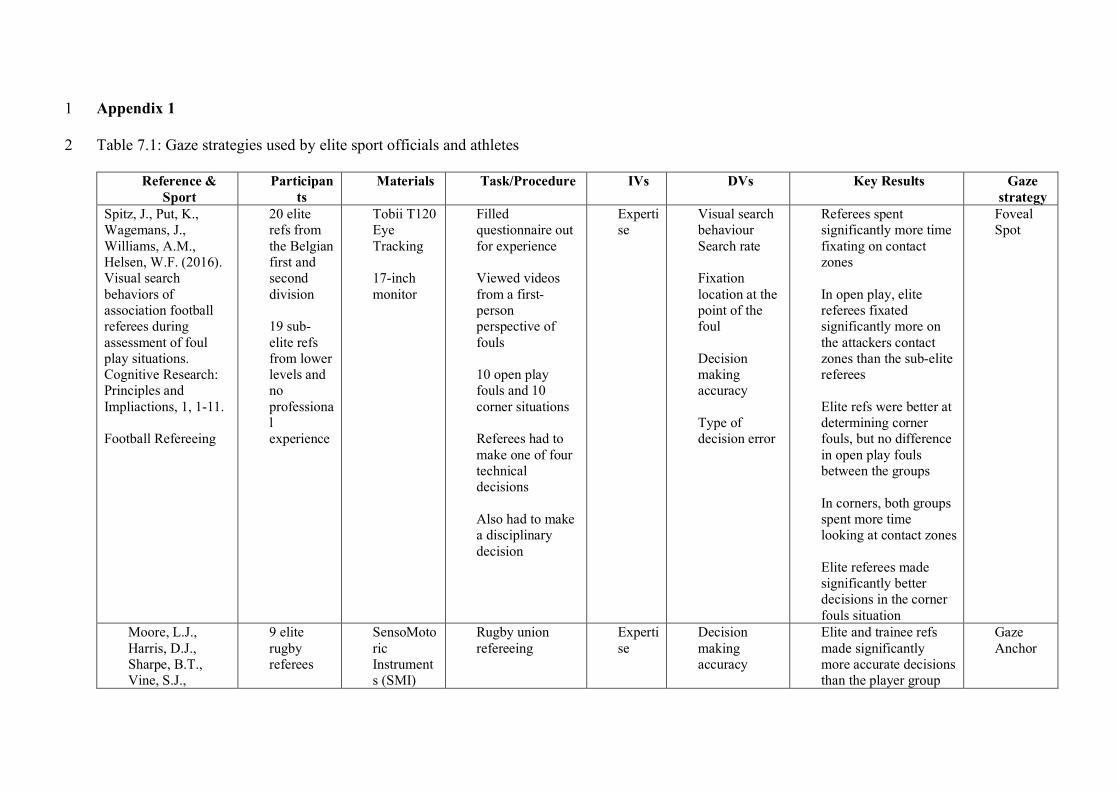
Appendix 1 1
Table 7.1: Gaze strategies used by elite sport officials and athletes 2
Reference & Sport
Participants
Materials Task/Procedure IVs DVs Key Results Gaze strategy
Spitz, J., Put, K., Wagemans, J., Williams, A.M., Helsen, W.F. (2016). Visual search behaviors of association football referees during assessment of foul play situations. Cognitive Research: Principles and Impliactions, 1, 1-11. Football Refereeing
20 elite refs from the Belgian first and second division
19 sub-elite refs from lower levels and no professional experience
Tobii T120 Eye Tracking
17-inch monitor
Filled questionnaire out for experience
Viewed videos from a first-person perspective of fouls
10 open play fouls and 10 corner situations
Referees had to make one of four technical decisions
Also had to make a disciplinary decision
Expertise
Visual search behaviour Search rate
Fixation location at the point of the foul
Decision making accuracy
Type of decision error
Referees spent significantly more time fixating on contact zones
In open play, elite referees fixated significantly more on the attackers contact zones than the sub-elite referees
Elite refs were better at determining corner fouls, but no difference in open play fouls between the groups
In corners, both groups spent more time looking at contact zones
Elite referees made significantly better decisions in the corner fouls situation
Foveal Spot
Moore, L.J., Harris, D.J., Sharpe, B.T., Vine, S.J.,
9 elite rugby referees
SensoMotoric Instruments (SMI)
Rugby union refereeing
Expertise
Decision making accuracy
Elite and trainee refs made significantly more accurate decisions than the player group
Gaze Anchor
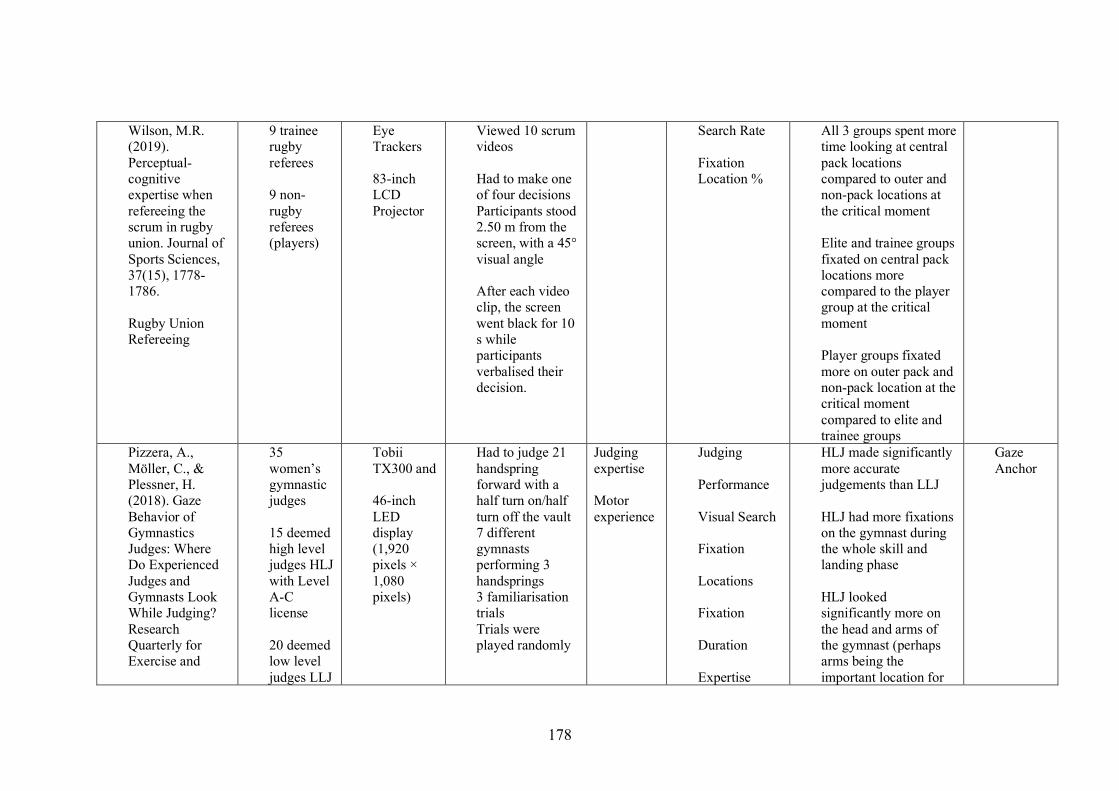
178
Wilson, M.R. (2019). Perceptual-cognitive expertise when refereeing the scrum in rugby union. Journal of Sports Sciences, 37(15), 1778-1786.
Rugby Union Refereeing
9 trainee rugby referees 9 non-rugby referees (players)
Eye Trackers 83-inch LCD Projector
Viewed 10 scrum videos Had to make one of four decisions Participants stood 2.50 m from the screen, with a 45° visual angle After each video clip, the screen went black for 10 s while participants verbalised their decision.
Search Rate Fixation Location %
All 3 groups spent more time looking at central pack locations compared to outer and non-pack locations at the critical moment Elite and trainee groups fixated on central pack locations more compared to the player group at the critical moment Player groups fixated more on outer pack and non-pack location at the critical moment compared to elite and trainee groups
Pizzera, A., Möller, C., & Plessner, H. (2018). Gaze Behavior of Gymnastics Judges: Where Do Experienced Judges and Gymnasts Look While Judging? Research Quarterly for Exercise and
35 women’s gymnastic judges 15 deemed high level judges HLJ with Level A-C license 20 deemed low level judges LLJ
Tobii TX300 and 46-inch LED display (1,920 pixels × 1,080 pixels)
Had to judge 21 handspring forward with a half turn on/half turn off the vault 7 different gymnasts performing 3 handsprings 3 familiarisation trials Trials were played randomly
Judging expertise
Motor experience
Judging Performance Visual Search Fixation Locations Fixation Duration Expertise
HLJ made significantly more accurate judgements than LLJ HLJ had more fixations on the gymnast during the whole skill and landing phase HLJ looked significantly more on the head and arms of the gymnast (perhaps arms being the important location for
Gaze Anchor
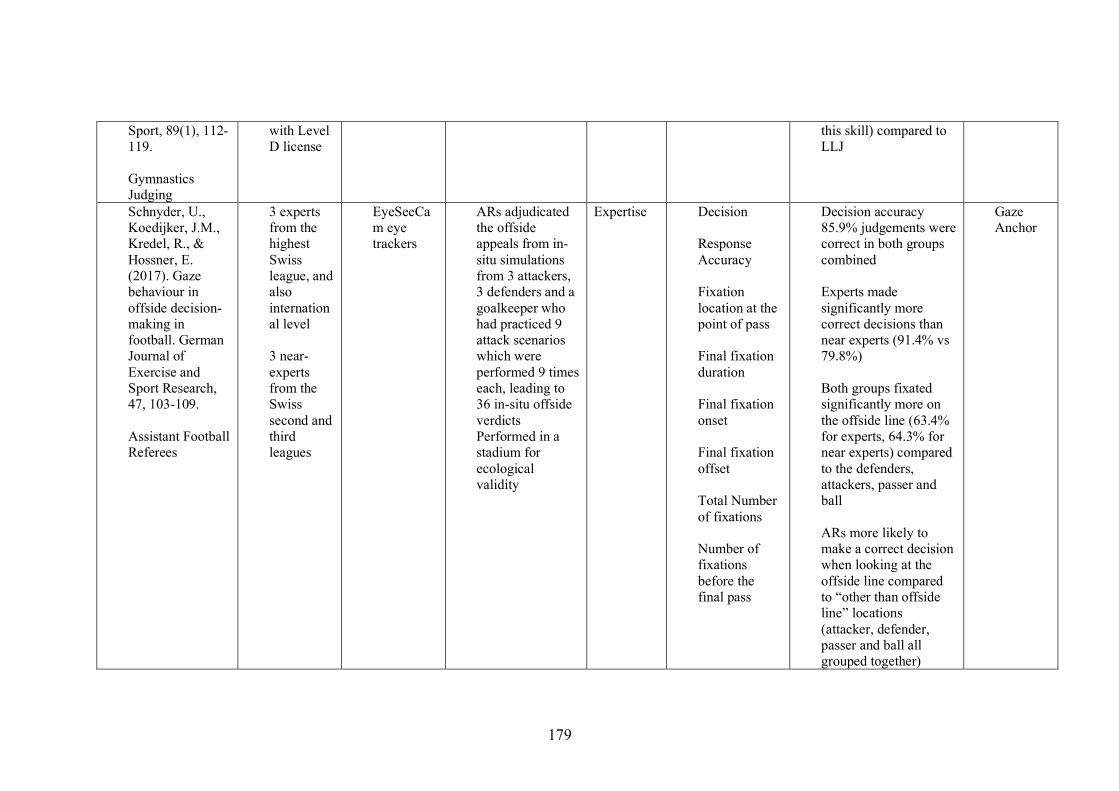
179
Sport, 89(1), 112-119.
Gymnastics Judging
with Level D license
this skill) compared to LLJ
Schnyder, U., Koedijker, J.M., Kredel, R., & Hossner, E. (2017). Gaze behaviour in offside decision-making in football. German Journal of Exercise and Sport Research, 47, 103-109.
Assistant Football Referees
3 experts from the highest Swiss league, and also international level 3 near-experts from the Swiss second and third leagues
EyeSeeCam eye trackers
ARs adjudicated the offside appeals from in-situ simulations from 3 attackers, 3 defenders and a goalkeeper who had practiced 9 attack scenarios which were performed 9 times each, leading to 36 in-situ offside verdicts Performed in a stadium for ecological validity
Expertise
Decision Response Accuracy Fixation location at the point of pass Final fixation duration Final fixation onset Final fixation offset Total Number of fixations Number of fixations before the final pass
Decision accuracy 85.9% judgements were correct in both groups combined Experts made significantly more correct decisions than near experts (91.4% vs 79.8%) Both groups fixated significantly more on the offside line (63.4% for experts, 64.3% for near experts) compared to the defenders, attackers, passer and ball ARs more likely to make a correct decision when looking at the offside line compared to “other than offside line” locations (attacker, defender, passer and ball all grouped together)
Gaze Anchor

180
No differences in number of fixations Total final fixation duration and final fixation offset at the point of pass, might have been significantly higher in correct decisions compared to incorrect decisions with a larger sample size (269ms difference), perhaps suggesting higher QE periods lead to better offside decision making
Hausegger, T., Vater, C., & Hossner, E. (2019). Peripheral Vision in Martial Arts Experts: The Cost-Dependent Anchoring of Gaze. Journal of Sport and Exercise Psychology, 41(3), 137-145
2 forms of Martial Arts
10 international Qwan Ki Do (QKD) experts (fist and foot strikes) 10 international Korean Tae Kwon Do (TKD) experts (foot strikes)
EyeSeeCam (ESC) eye tracker Three
Attacks included both fist and foot strikes Random attack sequences initiated by the attacker viewing a chart behind the participant Participant had to either defend or retreat from attacks
Type of martial arts
Gaze anchor height Percentage of location viewing time Number of saccades
QKD athletes anchored their gaze higher than the TKD athletes in the start phase and during the first attack QKD looked more at the opponent’s head than TKD athletes TKD athletes looked more at the upper torso QKD looked more at the head in the start phase, and more at the upper and lower torso and hips in the 3 attack phases
Gaze Anchor
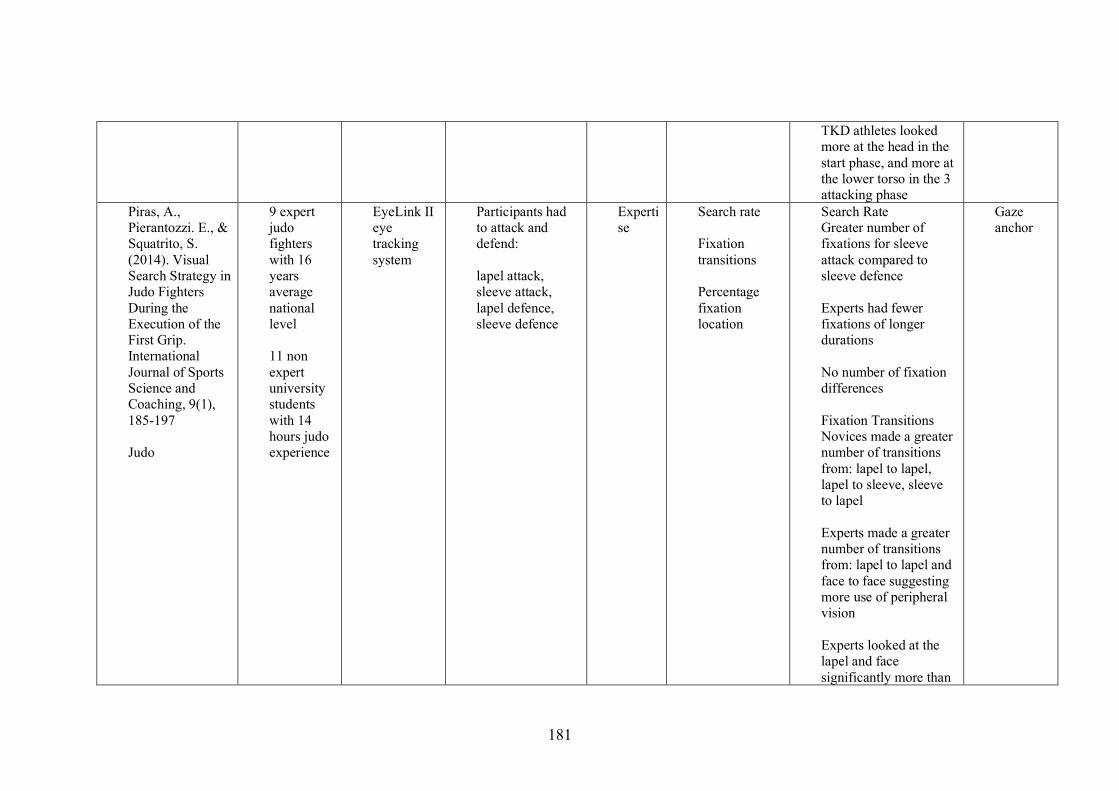
181
TKD athletes looked more at the head in the start phase, and more at the lower torso in the 3 attacking phase
Piras, A., Pierantozzi. E., & Squatrito, S. (2014). Visual Search Strategy in Judo Fighters During the Execution of the First Grip. International Journal of Sports Science and Coaching, 9(1), 185-197
Judo
9 expert judo fighters with 16 years average national level 11 non expert university students with 14 hours judo experience
EyeLink II eye tracking system
Participants had to attack and defend: lapel attack, sleeve attack, lapel defence, sleeve defence
Expertise
Search rate Fixation transitions Percentage fixation location
Search Rate Greater number of fixations for sleeve attack compared to sleeve defence Experts had fewer fixations of longer durations No number of fixation differences
Fixation Transitions Novices made a greater number of transitions from: lapel to lapel, lapel to sleeve, sleeve to lapel Experts made a greater number of transitions from: lapel to lapel and face to face suggesting more use of peripheral vision Experts looked at the lapel and face significantly more than
Gaze anchor
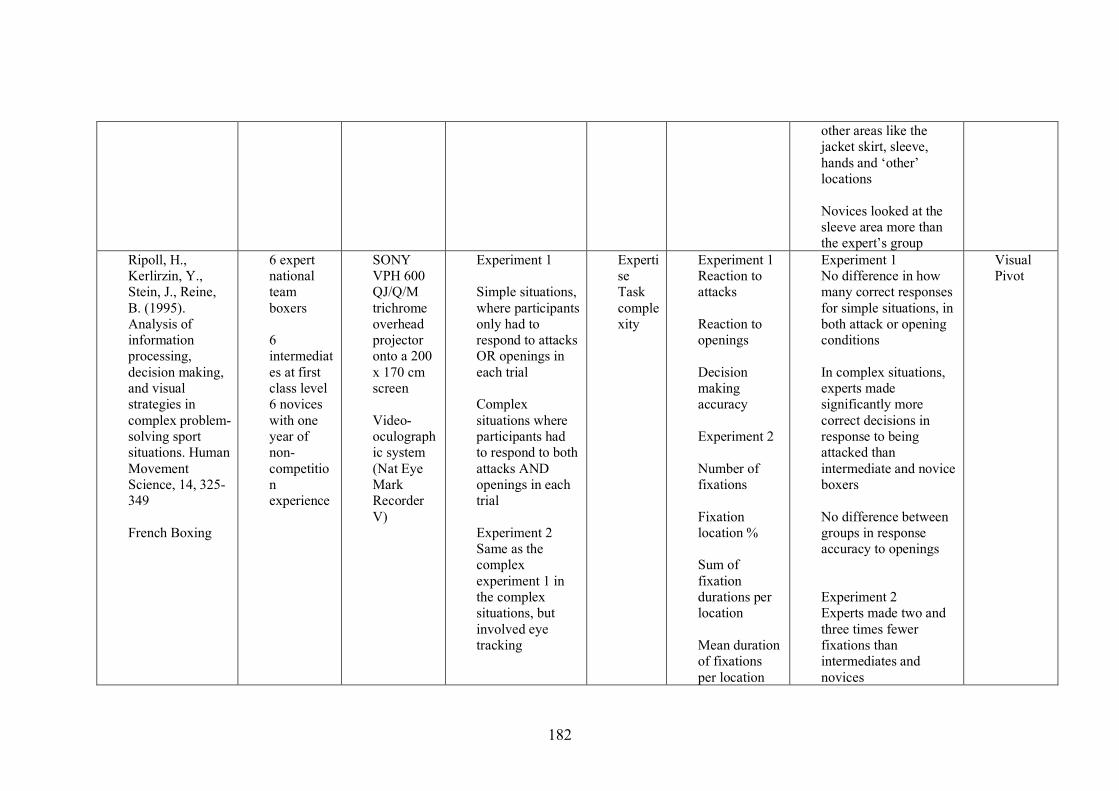
182
other areas like the jacket skirt, sleeve, hands and ‘other’ locations Novices looked at the sleeve area more than the expert’s group
Ripoll, H., Kerlirzin, Y., Stein, J., Reine, B. (1995). Analysis of information processing, decision making, and visual strategies in complex problem-solving sport situations. Human Movement Science, 14, 325-349
French Boxing
6 expert national team boxers 6 intermediates at first class level 6 novices with one year of non-competition experience
SONY VPH 600 QJ/Q/M trichrome overhead projector onto a 200 x 170 cm screen Video-oculographic system (Nat Eye Mark Recorder V)
Experiment 1 Simple situations, where participants only had to respond to attacks OR openings in each trial Complex situations where participants had to respond to both attacks AND openings in each trial
Experiment 2 Same as the complex experiment 1 in the complex situations, but involved eye tracking
Expertise Task complexity
Experiment 1 Reaction to attacks Reaction to openings Decision making accuracy
Experiment 2 Number of fixations Fixation location % Sum of fixation durations per location Mean duration of fixations per location
Experiment 1 No difference in how many correct responses for simple situations, in both attack or opening conditions In complex situations, experts made significantly more correct decisions in response to being attacked than intermediate and novice boxers No difference between groups in response accuracy to openings
Experiment 2 Experts made two and three times fewer fixations than intermediates and novices
Visual Pivot

183
Visual search
Experts mainly looked at the opponents head, whilst intermediates were more spread out across the head, upper torso and arms/fists Novices looked more at the opponents arms/fists Experts mean fixation on the head was much much longer than other regions Novice mean fixation was longer on the arm/fists than the head and trunk Intermediates also had longer mean fixations on the head, but they were more spread out across the 3 locations, and the difference wasn’t as great as the experts Experts had an organised visual search around the head, where they could use covert attention to saccade to
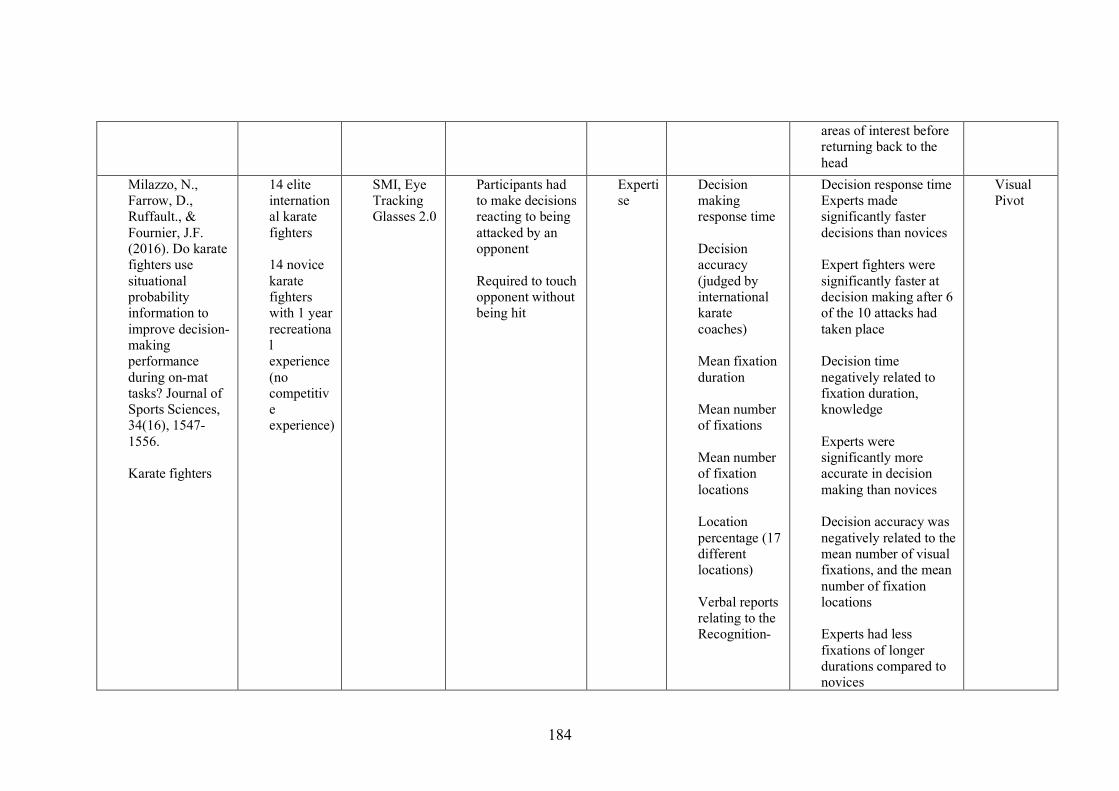
184
areas of interest before returning back to the head
Milazzo, N., Farrow, D., Ruffault., & Fournier, J.F. (2016). Do karate fighters use situational probability information to improve decision-making performance during on-mat tasks? Journal of Sports Sciences, 34(16), 1547-1556.
Karate fighters
14 elite international karate fighters 14 novice karate fighters with 1 year recreational experience (no competitive experience)
SMI, Eye Tracking Glasses 2.0
Participants had to make decisions reacting to being attacked by an opponent Required to touch opponent without being hit
Expertise
Decision making response time Decision accuracy (judged by international karate coaches) Mean fixation duration Mean number of fixations Mean number of fixation locations Location percentage (17 different locations) Verbal reports relating to the Recognition-
Decision response time Experts made significantly faster decisions than novices Expert fighters were significantly faster at decision making after 6 of the 10 attacks had taken place Decision time negatively related to fixation duration, knowledge Experts were significantly more accurate in decision making than novices Decision accuracy was negatively related to the mean number of visual fixations, and the mean number of fixation locations
Experts had less fixations of longer durations compared to novices
Visual Pivot

185
Experts fixated on less locations compared to novices Mean fixation duration was positively correlated to knowledge Number of fixations, and number of fixation locations were negatively related to knowledge
Experts looked significantly more at the head and torso of the opponent Novices looked significantly more at the pelvis and front hand of the opponent
Ryu, D., Abernethy, B., Mann, D.L., Poolton, J.M., & Gorman, A.D. (2013). The role of central and peripheral vision in expert decision making. Perception, 42, 591-607.
Basketballers
11 skilled basketballers from the top tier of their national league 11 less skilled recreational basketballers
Eyelink II eye tracking system Videos shown on eyelink II monitor (338 × 270 mm)
Participants sat 2ft from the eye tracker monitor 20 practice trials Participants had to decide whether the player in possession should pass to a teammate or drive to the basket at the point of occlusion 3 conditions were
Expertise Type of visual information
Response accuracy Search Rate Number of fixations on each area of interest Fixation location %
Response Accuracy Skilled players more accurate across all 3 conditions Skilled players performed above chance level in all 3 conditions, whereas less skilled players performed above chance levels only in the full vision condition Response time was faster in skilled players
Visual Pivot

186
Full image control- all visual information was shown Moving window condition- only foveal information was shown, and peripheral vision was occluded Moving mas condition- foveal vision was occluded, and participants could only see peripheral information
Fixation transitions (from the ball carrier, to another location and back to the ball carrier) Saccadic Amplitude Frequency of saccadic amplitudes
than less skilled across all 3 conditions
Search Rate No main effect for search rate Both groups had more fixations on the ball carrier and the defender marking him Skilled participants had the same number of fixations on the ball carrier in all 3 conditions, even when foveal information on him was occluded Less skilled participants made less fixations on the ball carrier, when foveal information was occluded
Fixation Location Skilled players looked at the ball carrier more when peripheral vision was occluded Less skilled players looked at the ball carrier less in both occlusion conditions
Fixation transitions
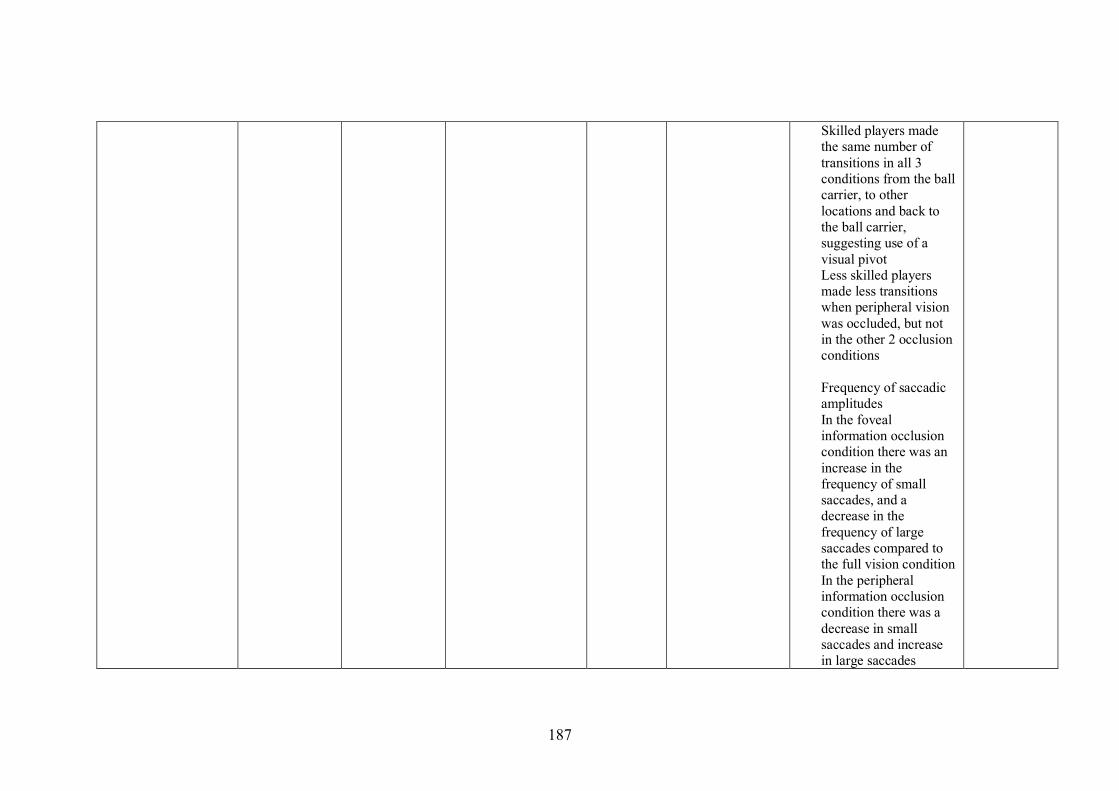
187
Skilled players made the same number of transitions in all 3 conditions from the ball carrier, to other locations and back to the ball carrier, suggesting use of a visual pivot Less skilled players made less transitions when peripheral vision was occluded, but not in the other 2 occlusion conditions
Frequency of saccadic amplitudes In the foveal information occlusion condition there was an increase in the frequency of small saccades, and a decrease in the frequency of large saccades compared to the full vision condition In the peripheral information occlusion condition there was a decrease in small saccades and increase in large saccades
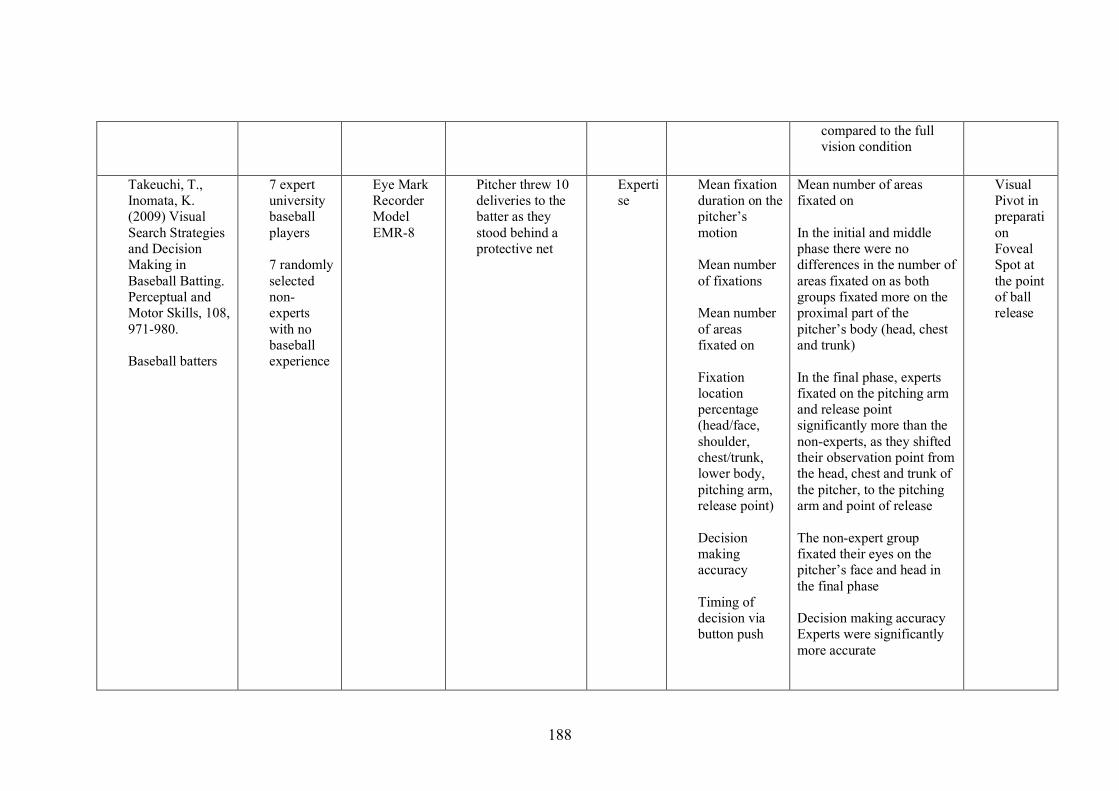
188
compared to the full vision condition
Takeuchi, T., Inomata, K. (2009) Visual Search Strategies and Decision Making in Baseball Batting. Perceptual and Motor Skills, 108, 971-980.
Baseball batters
7 expert university baseball players 7 randomly selected non-experts with no baseball experience
Eye Mark Recorder Model EMR-8
Pitcher threw 10 deliveries to the batter as they stood behind a protective net
Expertise
Mean fixation duration on the pitcher’s motion Mean number of fixations Mean number of areas fixated on Fixation location percentage (head/face, shoulder, chest/trunk, lower body, pitching arm, release point) Decision making accuracy Timing of decision via button push
Mean number of areas fixated on In the initial and middle phase there were no differences in the number of areas fixated on as both groups fixated more on the proximal part of the pitcher’s body (head, chest and trunk)
In the final phase, experts fixated on the pitching arm and release point significantly more than the non-experts, as they shifted their observation point from the head, chest and trunk of the pitcher, to the pitching arm and point of release The non-expert group fixated their eyes on the pitcher’s face and head in the final phase Decision making accuracy Experts were significantly more accurate
Visual Pivot in preparation Foveal Spot at the point of ball release
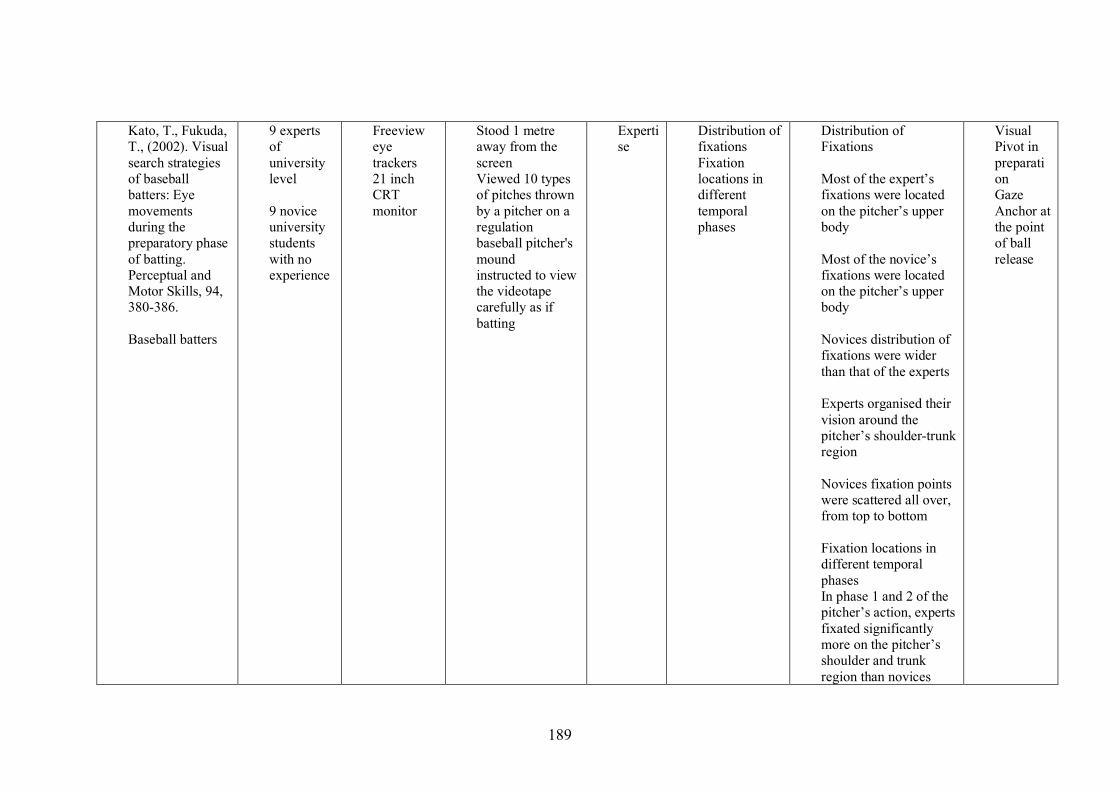
189
Kato, T., Fukuda, T., (2002). Visual search strategies of baseball batters: Eye movements during the preparatory phase of batting. Perceptual and Motor Skills, 94, 380-386.
Baseball batters
9 experts of university level 9 novice university students with no experience
Freeview eye trackers 21 inch CRT monitor
Stood 1 metre away from the screen Viewed 10 types of pitches thrown by a pitcher on a regulation baseball pitcher's mound instructed to view the videotape carefully as if batting
Expertise
Distribution of fixations Fixation locations in different temporal phases
Distribution of Fixations Most of the expert’s fixations were located on the pitcher’s upper body Most of the novice’s fixations were located on the pitcher’s upper body Novices distribution of fixations were wider than that of the experts Experts organised their vision around the pitcher’s shoulder-trunk region Novices fixation points were scattered all over, from top to bottom Fixation locations in different temporal phases In phase 1 and 2 of the pitcher’s action, experts fixated significantly more on the pitcher’s shoulder and trunk region than novices
Visual Pivot in preparation Gaze Anchor at the point of ball release
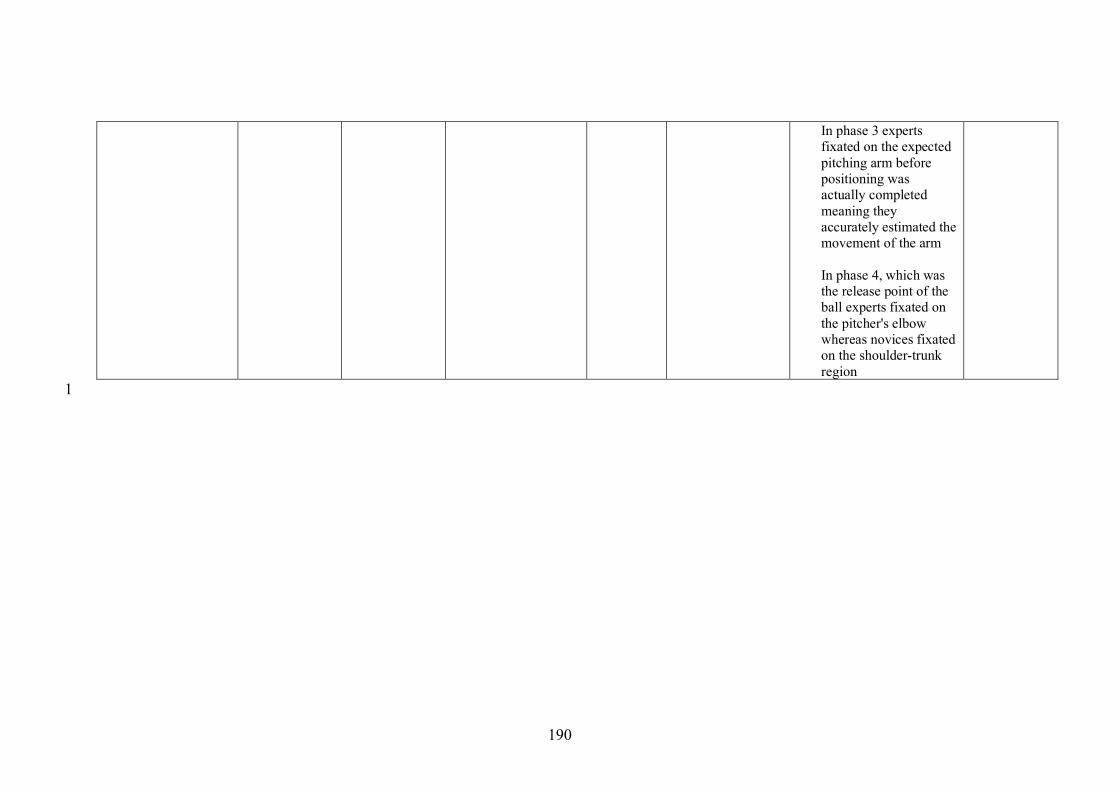
190
In phase 3 experts fixated on the expected pitching arm before positioning was actually completed meaning they accurately estimated the movement of the arm In phase 4, which was the release point of the ball experts fixated on the pitcher's elbow whereas novices fixated on the shoulder-trunk region
1

191
Appendix 2 1 Table 7.2: Quiet Eye Training Studies 2
Reference Participants and Procedure DVs Key Results Adophe, R.M., Vickers J.N., & Laplante, G. (1997). The Effects of Training Visual Attention on Gaze Behaviour and Accuracy: A Pilot Study. International Journal of Sports Vision, 4(1), 28-33. Volleyball
3 expert volleyball players and 6 near-expert volleyball players put into just a QE group 6-week testing period Pre-test, acquisition, retention
QE Duration Gaze Behaviours Performance Ball Flight Information Step and Pass Behaviours
Participants improved tracking onset, QE duration and offset Participants showed improvement in accuracy over 3 seasons of international competition
Harle, S.K., Vickers, J.N. (2001). Training Quiet Eye Improves Accuracy in the Basketball Free Throw. The Sport Psychologist, 15, 289-305.
Basketball Free Throws
3 teams of basketball players, Team A placed into QE group and Team B and Team C in control group 1. Pre-test 2. Season 1 3. Retention Test 4. Season 2
Season 1: Free Throws Made QE Duration QE Location Relative Shot Duration Season 2: League Free Throws Made between all three teams
Team A improved free throw performance significantly in the Retention-test compared to the pre-test Team A significantly improved free throw performance from season 1 to season 2. Team A had a significantly higher free throw performance in season 2 compared to Team B and Team C Team A had significantly longer QE in the retention-test compared to the pre-test Team A changed the timing of their shot in the retention-test, allocating 5% more time to the prep-down phase
Causer, J., Holmes, P.S., & Williams, A.M. (2011). Quiet Eye Training in a Visuomotor Control Task. Medicine and
20 international level skeet shooters split into QE and Control Group 8 week testing period
QE Duration Eye Movement Behaviours
QE group significantly improved their QE durations in the retention test compared to the pre-test QE group significantly improved their shooting accuracy in the retention test compared to the pre-test
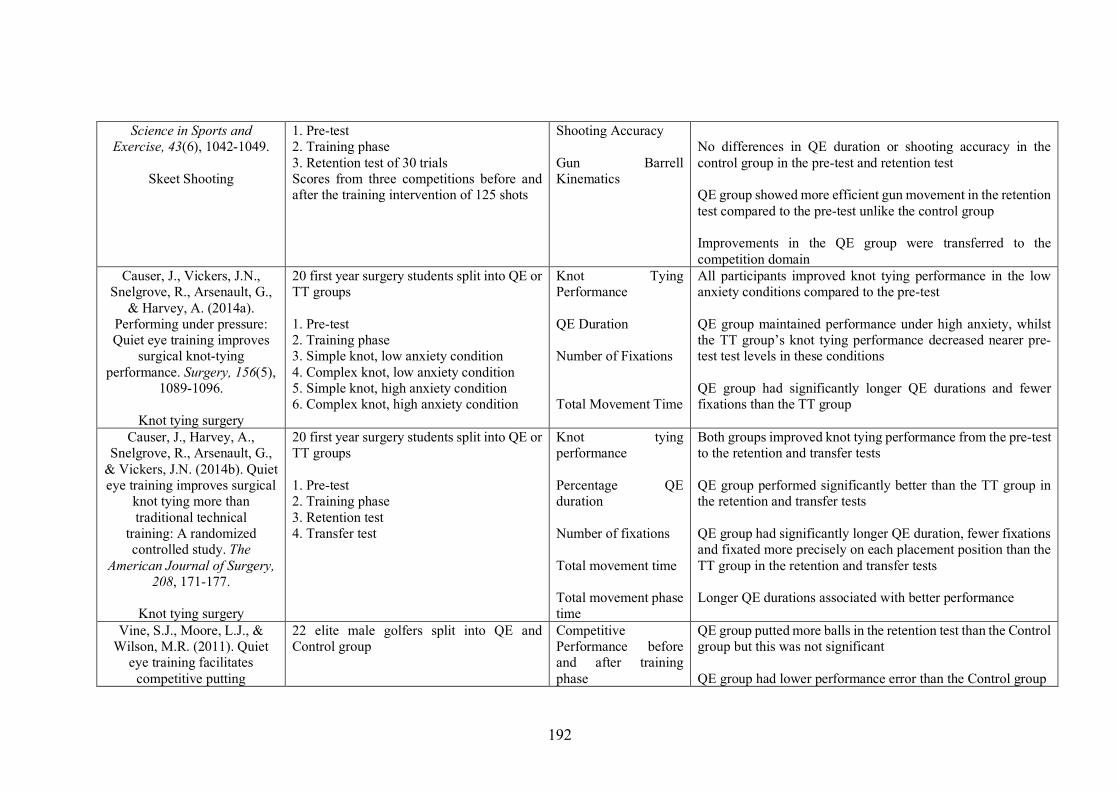
192
Science in Sports and Exercise, 43(6), 1042-1049.
Skeet Shooting
1. Pre-test 2. Training phase 3. Retention test of 30 trials Scores from three competitions before and after the training intervention of 125 shots
Shooting Accuracy Gun Barrell Kinematics
No differences in QE duration or shooting accuracy in the control group in the pre-test and retention test QE group showed more efficient gun movement in the retention test compared to the pre-test unlike the control group Improvements in the QE group were transferred to the competition domain
Causer, J., Vickers, J.N., Snelgrove, R., Arsenault, G.,
& Harvey, A. (2014a). Performing under pressure: Quiet eye training improves
surgical knot-tying performance. Surgery, 156(5),
1089-1096.
Knot tying surgery
20 first year surgery students split into QE or TT groups 1. Pre-test 2. Training phase 3. Simple knot, low anxiety condition 4. Complex knot, low anxiety condition 5. Simple knot, high anxiety condition 6. Complex knot, high anxiety condition
Knot Tying Performance QE Duration Number of Fixations Total Movement Time
All participants improved knot tying performance in the low anxiety conditions compared to the pre-test QE group maintained performance under high anxiety, whilst the TT group’s knot tying performance decreased nearer pre-test test levels in these conditions QE group had significantly longer QE durations and fewer fixations than the TT group
Causer, J., Harvey, A., Snelgrove, R., Arsenault, G.,
& Vickers, J.N. (2014b). Quiet eye training improves surgical
knot tying more than traditional technical
training: A randomized controlled study. The
American Journal of Surgery, 208, 171-177.
Knot tying surgery
20 first year surgery students split into QE or TT groups 1. Pre-test 2. Training phase 3. Retention test 4. Transfer test
Knot tying performance Percentage QE duration Number of fixations Total movement time Total movement phase time
Both groups improved knot tying performance from the pre-test to the retention and transfer tests QE group performed significantly better than the TT group in the retention and transfer tests QE group had significantly longer QE duration, fewer fixations and fixated more precisely on each placement position than the TT group in the retention and transfer tests Longer QE durations associated with better performance
Vine, S.J., Moore, L.J., & Wilson, M.R. (2011). Quiet
eye training facilitates competitive putting
22 elite male golfers split into QE and Control group
Competitive Performance before and after training phase
QE group putted more balls in the retention test than the Control group but this was not significant QE group had lower performance error than the Control group

193
performance in elite golfers. Frontiers in Pscyhology, 2(8).
Golf Putting
1. Recorded 10 competitive rounds prior to experimental session 2. Pre-test 3. Training phase 4. Another 10 competitive rounds within 3 months after the training session 5. Retention test 6. Anxiety transfer test
Experimental Performance Outcome (Balls Putted) Experimental Performance Error (Distance ball finished away from the hole) QE Duration State Anxiety
QE group had significantly higher QE duration in the retention test, whilst the Control group had no difference in QE duration between the pre-test and retention test Both groups had a significant reduction of QE duration in the transfer test QE group had a significantly longer QE duration in the transfer test compared to the Control group QE group had significantly better experimental performance outcome and experimental performance error in the transfer condition, compared to the Control group QE group made significantly less putts per round in competition after training, whilst the Control group showed no differences
Wood, G., Wilson, M.R. (2011). Quiet-eye training for
soccer penalty kicks. Cognitive Processing, 12, 257-
266.
Soccer Penalties
20 university level soccer players split into QE and Placebo groups 7 week testing period 1. Pre-test 2. Training phase 3. Retention test 4. Anxiety transfer test
Shooting accuracy QE Duration Success Rate Cognitive State Anxiety
After 3 weeks of training both group group improved their horizontal penalty placement QE group had less penalties saved during the training period than the Placebo group No difference in penalty success in retention test between groups QE group had increased fixation durations on the ball prior to initiating the kicking action QE group displayed more distal final aiming fixations which were 3x as long as the Placebo Group QE group maintained a more distal aiming fixation in the transfer test whereas the Placebo group showed an impaired centralized gaze

194
No difference in performance between groups in the transfer test (only 1 shot may have contributed to this) QE Group improved in the retention test and maintained this improvement in the transfer test
Wood, G., & Wilson, M.R. (2012). Quiet-eye training,
perceived control and performing under pressure.
Psychology of Sport and Exercise, 13, 721-728.
Soccer Penalties
20 university level soccer players split into QE and Practice groups 7 week testing period 1. Pre-test 2. Training phase 3. Retention test 4. Anxiety transfer test
Penalty shooting performance QE Duration Cognitive & Somatic Anxiety Control Beliefs
QE group adopted more distal aiming fixations with longer durations in the retention and transfer test QE group was significantly more accurate in penalty shooting in the retention and transfer test compared to the Practice group Both groups felt increased competence after training
Vine, S.J., & Wilson, M.R. (2010). Quiet Eye Training:
Effects on Learning and Performance Under Pressure.
Journal of Applied Sport Psychology, 22, 361-376.
Golf Putting
14 male undergraduate students split into QE and TT groups 8 day testing period 1. Pre test 2. Training phase 3. Retention test 4. Anxiety transfer test
Performance score (archery style target) QE Duration State Anxiety Movement durations
All groups significantly improved from the pre-test to retention test QE group had significantly longer QE durations in retention and transfer tests compared to TT group QE period of TT group also significantly increased in retention test QE group maintained performance in transfer test whilst TT group significantly declined in performance QE group had longer preparation and backswing durations than the TT group Both groups QE duration significantly reduced in the transfer condition, but the QE group’s QE duration was 2.8s and the TT group’s QE duration was 894ms suggesting QE group still was at the optimal level
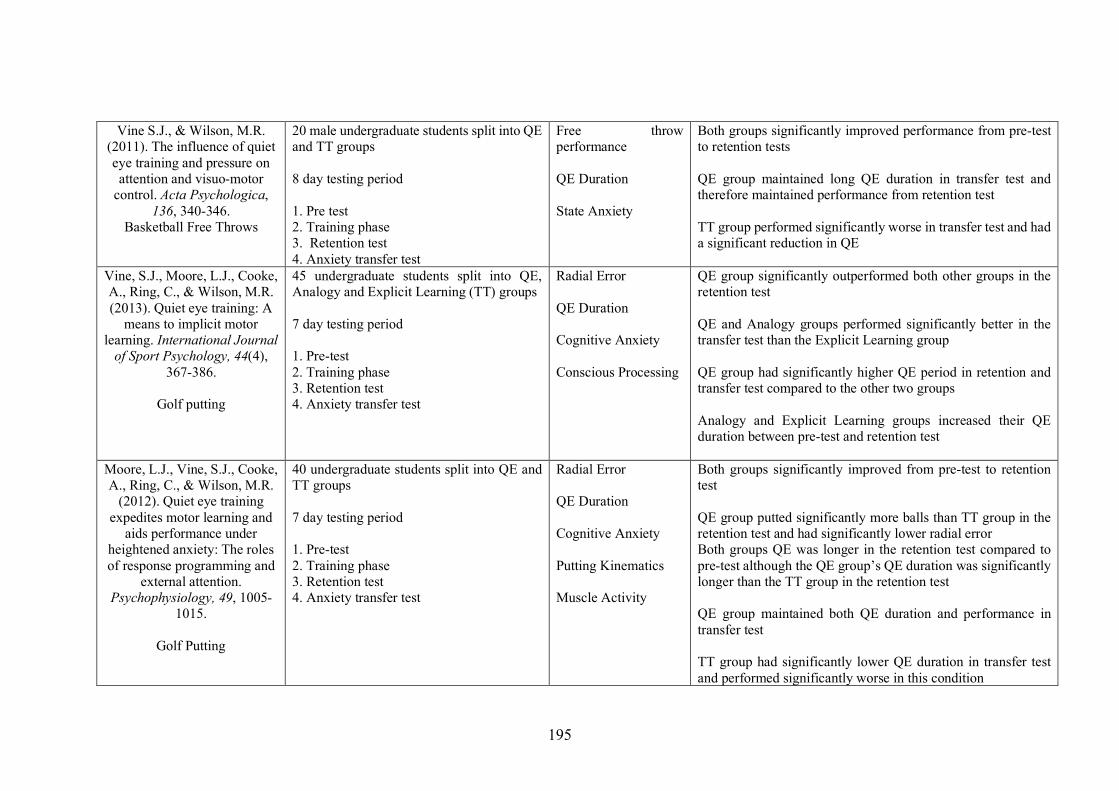
195
Vine S.J., & Wilson, M.R. (2011). The influence of quiet eye training and pressure on attention and visuo-motor
control. Acta Psychologica, 136, 340-346.
Basketball Free Throws
20 male undergraduate students split into QE and TT groups 8 day testing period 1. Pre test 2. Training phase 3. Retention test 4. Anxiety transfer test
Free throw performance QE Duration State Anxiety
Both groups significantly improved performance from pre-test to retention tests QE group maintained long QE duration in transfer test and therefore maintained performance from retention test TT group performed significantly worse in transfer test and had a significant reduction in QE
Vine, S.J., Moore, L.J., Cooke, A., Ring, C., & Wilson, M.R. (2013). Quiet eye training: A
means to implicit motor learning. International Journal
of Sport Psychology, 44(4), 367-386.
Golf putting
45 undergraduate students split into QE, Analogy and Explicit Learning (TT) groups 7 day testing period 1. Pre-test 2. Training phase 3. Retention test 4. Anxiety transfer test
Radial Error QE Duration Cognitive Anxiety Conscious Processing
QE group significantly outperformed both other groups in the retention test QE and Analogy groups performed significantly better in the transfer test than the Explicit Learning group QE group had significantly higher QE period in retention and transfer test compared to the other two groups Analogy and Explicit Learning groups increased their QE duration between pre-test and retention test
Moore, L.J., Vine, S.J., Cooke, A., Ring, C., & Wilson, M.R.
(2012). Quiet eye training expedites motor learning and
aids performance under heightened anxiety: The roles of response programming and
external attention. Psychophysiology, 49, 1005-
1015.
Golf Putting
40 undergraduate students split into QE and TT groups 7 day testing period 1. Pre-test 2. Training phase 3. Retention test 4. Anxiety transfer test
Radial Error QE Duration Cognitive Anxiety Putting Kinematics Muscle Activity
Both groups significantly improved from pre-test to retention test QE group putted significantly more balls than TT group in the retention test and had significantly lower radial error Both groups QE was longer in the retention test compared to pre-test although the QE group’s QE duration was significantly longer than the TT group in the retention test QE group maintained both QE duration and performance in transfer test TT group had significantly lower QE duration in transfer test and performed significantly worse in this condition
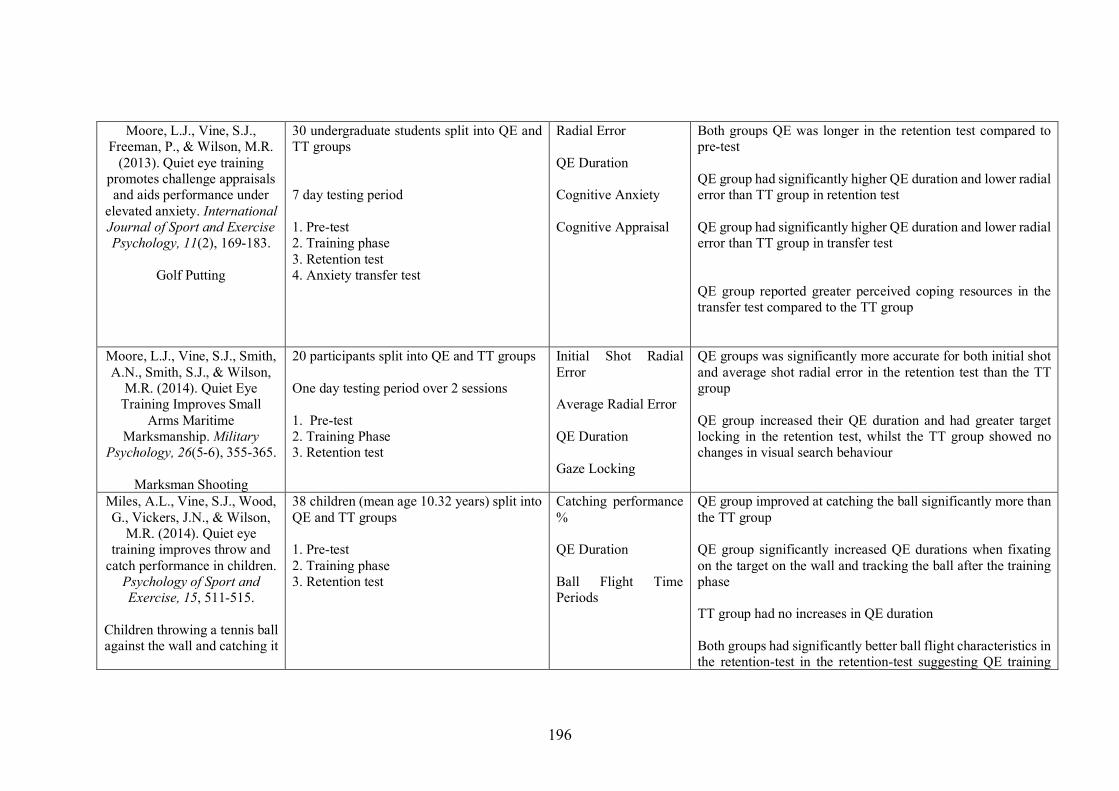
196
Moore, L.J., Vine, S.J., Freeman, P., & Wilson, M.R.
(2013). Quiet eye training promotes challenge appraisals and aids performance under
elevated anxiety. International Journal of Sport and Exercise Psychology, 11(2), 169-183.
Golf Putting
30 undergraduate students split into QE and TT groups 7 day testing period 1. Pre-test 2. Training phase 3. Retention test 4. Anxiety transfer test
Radial Error QE Duration Cognitive Anxiety Cognitive Appraisal
Both groups QE was longer in the retention test compared to pre-test QE group had significantly higher QE duration and lower radial error than TT group in retention test QE group had significantly higher QE duration and lower radial error than TT group in transfer test QE group reported greater perceived coping resources in the transfer test compared to the TT group
Moore, L.J., Vine, S.J., Smith, A.N., Smith, S.J., & Wilson,
M.R. (2014). Quiet Eye Training Improves Small
Arms Maritime Marksmanship. Military
Psychology, 26(5-6), 355-365.
Marksman Shooting
20 participants split into QE and TT groups One day testing period over 2 sessions 1. Pre-test 2. Training Phase 3. Retention test
Initial Shot Radial Error Average Radial Error QE Duration Gaze Locking
QE groups was significantly more accurate for both initial shot and average shot radial error in the retention test than the TT group QE group increased their QE duration and had greater target locking in the retention test, whilst the TT group showed no changes in visual search behaviour
Miles, A.L., Vine, S.J., Wood, G., Vickers, J.N., & Wilson,
M.R. (2014). Quiet eye training improves throw and
catch performance in children. Psychology of Sport and Exercise, 15, 511-515.
Children throwing a tennis ball against the wall and catching it
38 children (mean age 10.32 years) split into QE and TT groups 1. Pre-test 2. Training phase 3. Retention test
Catching performance % QE Duration Ball Flight Time Periods
QE group improved at catching the ball significantly more than the TT group QE group significantly increased QE durations when fixating on the target on the wall and tracking the ball after the training phase TT group had no increases in QE duration Both groups had significantly better ball flight characteristics in the retention-test in the retention-test suggesting QE training
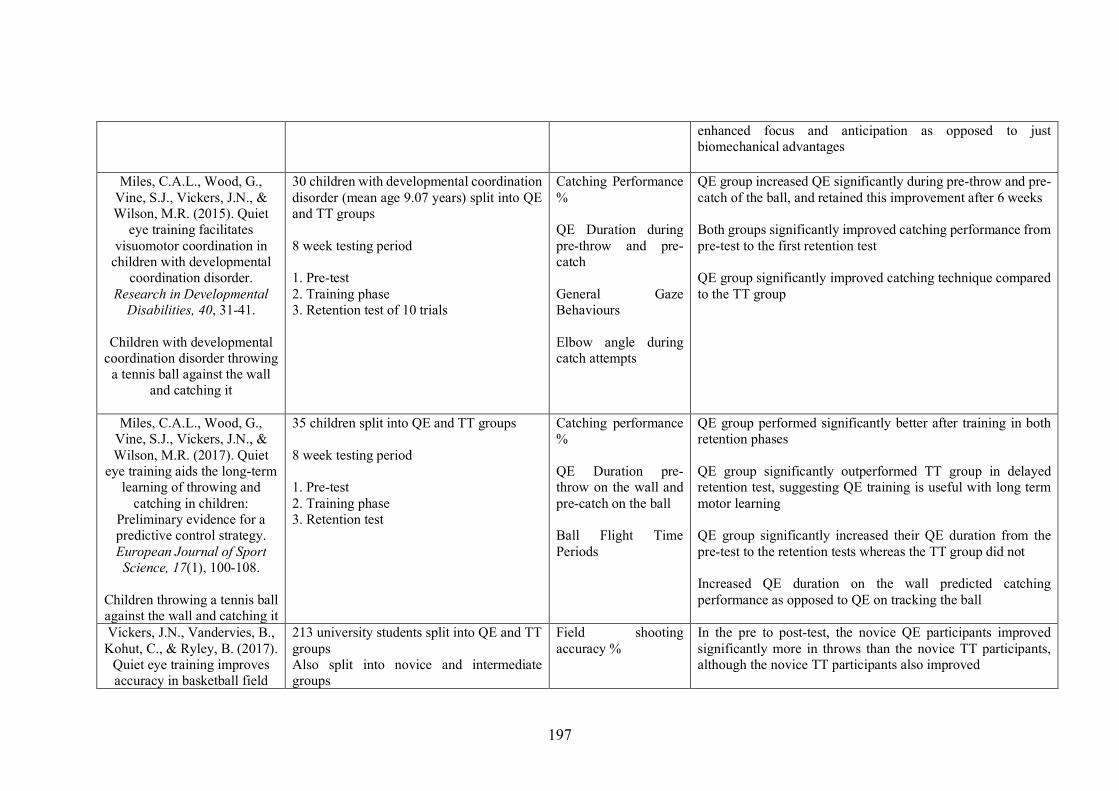
197
enhanced focus and anticipation as opposed to just biomechanical advantages
Miles, C.A.L., Wood, G., Vine, S.J., Vickers, J.N., & Wilson, M.R. (2015). Quiet
eye training facilitates visuomotor coordination in
children with developmental coordination disorder.
Research in Developmental Disabilities, 40, 31-41.
Children with developmental
coordination disorder throwing a tennis ball against the wall
and catching it
30 children with developmental coordination disorder (mean age 9.07 years) split into QE and TT groups 8 week testing period 1. Pre-test 2. Training phase 3. Retention test of 10 trials
Catching Performance % QE Duration during pre-throw and pre-catch General Gaze Behaviours Elbow angle during catch attempts
QE group increased QE significantly during pre-throw and pre-catch of the ball, and retained this improvement after 6 weeks Both groups significantly improved catching performance from pre-test to the first retention test QE group significantly improved catching technique compared to the TT group
Miles, C.A.L., Wood, G., Vine, S.J., Vickers, J.N., & Wilson, M.R. (2017). Quiet
eye training aids the long-term learning of throwing and
catching in children: Preliminary evidence for a predictive control strategy. European Journal of Sport Science, 17(1), 100-108.
Children throwing a tennis ball against the wall and catching it
35 children split into QE and TT groups 8 week testing period 1. Pre-test 2. Training phase 3. Retention test
Catching performance % QE Duration pre-throw on the wall and pre-catch on the ball Ball Flight Time Periods
QE group performed significantly better after training in both retention phases QE group significantly outperformed TT group in delayed retention test, suggesting QE training is useful with long term motor learning QE group significantly increased their QE duration from the pre-test to the retention tests whereas the TT group did not Increased QE duration on the wall predicted catching performance as opposed to QE on tracking the ball
Vickers, J.N., Vandervies, B., Kohut, C., & Ryley, B. (2017).
Quiet eye training improves accuracy in basketball field
213 university students split into QE and TT groups Also split into novice and intermediate groups
Field shooting accuracy %
In the pre to post-test, the novice QE participants improved significantly more in throws than the novice TT participants, although the novice TT participants also improved

198
goal shooting. Progress in Brain Research, 234, 1-12.
Basketball Throws (no eye
tracking)
One day testing period 1. Pre-Test 2. Training phase 3. Anxiety transfer test
In the pre to post-test, the intermediate QE and TT participants maintained but did not improve performance From post to transfer-test, all groups deteriorated but the intermediate QE group maintained a relatively high accuracy level compared to the other groups
1

Appendix 3 - Published papers1
2
+����,��"��-�)��� � �����.�$%%����$�������%$�����.�����$������(((��$��.��� ���%�"$%� ��&����$�/�.��"$� ��0&����$�)���1�&����
��������� ������ ������
� ������������������������������������������� �!����� ���������"��#$
%��&�'�()�������������������&����������*���������������������!��!���������+��������,���!�������
��*����-���!�.�/���0���.�-�+��1 ���,��.� ������� �%2���3����1����
4���������������������������� ����������������������� ����������������������������� �������!����"#$#%&'���()��*�+,�����!������!�����-�)������������������������������-���������.�/�-���.����(���������������!��/��.����������������012'%$�%$3$4$#56$6%6�#$#%�%7$3896
4����,������������������������� ��������������������������������
���� �������� ������ ��������
!��" ��#����$�� %�������� ��&����$��
' �(����$����$�� %����
' �(�)����"$�*��$�$

200
1 2
3
4
SPORTS PERFORMANCE
Howzat! Expert umpires use a gaze anchor to overcome the processing demands of leg before wicket decisionsPravinath Ramachandran a, Matt Watts b, Robin C. Jackson c, Spencer J. Hayes d and Joe Causer a
aResearch Institute of Sport and Exercise Sciences, Liverpool John Moores University, Liverpool, UK; bSchool of Life Sciences, Coventry University, Coventry, UK; cSchool of Sport, Exercise and Health Sciences, Loughborough University, Loughborough, UK; dDepartment of Psychology and Human Development, UCL Institute of Education, University College of London, London, UK
ABSTRACTCricket umpires are required to make high-pressure, match-changing decisions based on multiple complex information sources under severe temporal constraints. The aim of this study was to examine the decision-making and perceptual-cognitive di!erences between expert and novice cricket umpires when judging leg before wicket (LBW) decisions. Twelve expert umpires and 19 novice umpires were "tted with an eye-tracker before viewing video-based LBW appeals. Dependent variables were radial error (cm), number of "xations, average "xation duration (ms), "nal "xation duration (ms), and "nal "xation location (%). Expert umpires were signi"cantly more accurate at adjudicating on all aspects of the LBW law, compared to the novice umpires (p < .05). The expert umpires’ "nal "xation prior to ball-pad contact was directed signi"cantly more towards the stumps (p < .05), whereas the novice umpires directed their "nal "xation signi"cantly more towards a good length (p < .05). These data suggest that expert umpires utilize specialized perceptual-cognitive skills, consisting of a gaze anchor on the stumps in order to overcome the processing demands of the task. These data have implications for the training of current and aspiring umpires in order to enhance the accuracy of LBW decision-making across all levels of the cricketing pyramid.
ARTICLE HISTORY Accepted 23 March 2021
KEYWORDS Perceptual-cognitive skill; expertise; gaze behaviours; decision making; gaze anchor
Cricket umpires make decisions regarding batter dismissals that consequently determine match outcomes (Sacheti et al., 2015). Of the modes of dismissals within cricket (see Marylebone Cricket Club, 2017), none has led to as much controversy and dispute as the leg before wicket (LBW) (Chedzoy, 1997; Sacheti et al., 2015; Southgate et al., 2008). LBW appeals occur when the ball strikes the batter on any part of their body (usually leg pads) apart from the bat and hands (Craven, 1998). For a bowler to dismiss a batter via LBW, the umpire must consider whether the delivery met a number of speci"c criteria (Crowe & Middeldorp, 1996). For every delivery, the umpire must initially determine whether the bowler’s front foot grounds behind a line termed the crease (Adie et al., 2020).1 Subsequently, the umpire must consider where the ball bounced (pitched), where the ball impacted the batter in relation to the stumps, and the more challenging judgement of whether the ball would have continued on its #ight path to hit the stumps had the obstruc-tion with the batter not occurred (Southgate et al., 2008). Therefore, the LBW rule appears to be one of the few regula-tions in sport where an o$cial must determine what might have happened (would the ball have hit the stumps?) if other events did not occur (ball #ight path being obstructed by the leg), which contributes to the dispute amongst players, media and followers of cricket (Crowe & Middeldorp, 1996). A number of contextual factors further add to the di$culty of the umpire’s LBW verdict, such as the batter’s stance (Southgate et al., 2008),
dynamics of the delivery (spin and swing) and the ball’s surface degradation (Chalkley et al., 2013). In spite of these challenges, it has been shown that professional umpires are highly accu-rate at making LBW decisions. Adie et al. (2020) examined 5578 decisions made in elite level cricket in Australia between 2009–2016 and found that umpires were correct 98.08% of the time. Further, when they broke down the match format, 96.20% of “out” decisions were correct in "rst-class cricket, 96.29% in One Day cricket and 86.15% in T20 cricket.
In 2008, the International Cricket Council (ICC) introduced the Decision Review System (DRS) into international cricket. This permits the captains of either team to refer a limited number of decisions made by the on-"eld umpires to the third umpire who is able to utilize an array of replays and technologies to assess the accuracy of the original decision (Borooah, 2013). Utilizing statistics from the DRS in interna-tional test cricket (July 2008 to March 2017) ESPN Cricinfo estimated that 74% of the reviews involved LBW appeals, with the overturn rate being at 22% (Davis, 2017, June, p. 1). Whilst initially this proportion seems high, it must be stressed that these o$cials are often placed under severe constraints when making these decisions (Chalkley et al., 2013; Southgate et al., 2008). More speci"cally, in certain scenarios, umpires must process information related to the ball’s (7.29 cm) #ight that can travel at velocities up to 95 mph over 20 m. These con-straints o!er umpires approximately 543 ms to process the
CONTACT Joe Causer [email protected] Research Institute of Sport and Exercise Sciences, Liverpool John Moores University, Byrom Street, Liverpool L3 3AF, UK1Since 2020 this task was no longer performed by international umpires after a number of controversial events, and therefore this decision is made by the third umpire
with use of TV replays.
JOURNAL OF SPORTS SCIENCES https://doi.org/10.1080/02640414.2021.1908734
© 2021 Informa UK Limited, trading as Taylor & Francis Group
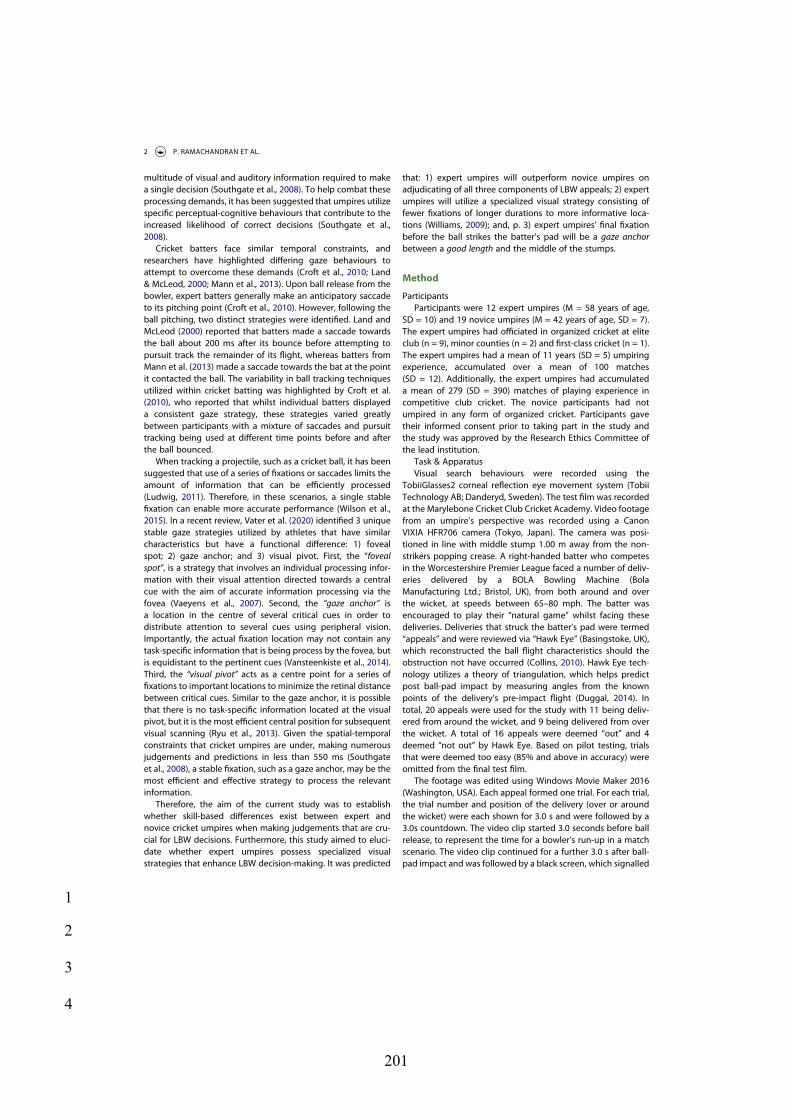
201
1
2
3
4
multitude of visual and auditory information required to make a single decision (Southgate et al., 2008). To help combat these processing demands, it has been suggested that umpires utilize speci!c perceptual-cognitive behaviours that contribute to the increased likelihood of correct decisions (Southgate et al., 2008).
Cricket batters face similar temporal constraints, and researchers have highlighted di"ering gaze behaviours to attempt to overcome these demands (Croft et al., 2010; Land & McLeod, 2000; Mann et al., 2013). Upon ball release from the bowler, expert batters generally make an anticipatory saccade to its pitching point (Croft et al., 2010). However, following the ball pitching, two distinct strategies were identi!ed. Land and McLeod (2000) reported that batters made a saccade towards the ball about 200 ms after its bounce before attempting to pursuit track the remainder of its #ight, whereas batters from Mann et al. (2013) made a saccade towards the bat at the point it contacted the ball. The variability in ball tracking techniques utilized within cricket batting was highlighted by Croft et al. (2010), who reported that whilst individual batters displayed a consistent gaze strategy, these strategies varied greatly between participants with a mixture of saccades and pursuit tracking being used at di"erent time points before and after the ball bounced.
When tracking a projectile, such as a cricket ball, it has been suggested that use of a series of !xations or saccades limits the amount of information that can be e$ciently processed (Ludwig, 2011). Therefore, in these scenarios, a single stable !xation can enable more accurate performance (Wilson et al., 2015). In a recent review, Vater et al. (2020) identi!ed 3 unique stable gaze strategies utilized by athletes that have similar characteristics but have a functional di"erence: 1) foveal spot; 2) gaze anchor; and 3) visual pivot. First, the “foveal spot”, is a strategy that involves an individual processing infor-mation with their visual attention directed towards a central cue with the aim of accurate information processing via the fovea (Vaeyens et al., 2007). Second, the “gaze anchor” is a location in the centre of several critical cues in order to distribute attention to several cues using peripheral vision. Importantly, the actual !xation location may not contain any task-speci!c information that is being process by the fovea, but is equidistant to the pertinent cues (Vansteenkiste et al., 2014). Third, the “visual pivot” acts as a centre point for a series of !xations to important locations to minimize the retinal distance between critical cues. Similar to the gaze anchor, it is possible that there is no task-speci!c information located at the visual pivot, but it is the most e$cient central position for subsequent visual scanning (Ryu et al., 2013). Given the spatial-temporal constraints that cricket umpires are under, making numerous judgements and predictions in less than 550 ms (Southgate et al., 2008), a stable !xation, such as a gaze anchor, may be the most e$cient and e"ective strategy to process the relevant information.
Therefore, the aim of the current study was to establish whether skill-based di"erences exist between expert and novice cricket umpires when making judgements that are cru-cial for LBW decisions. Furthermore, this study aimed to eluci-date whether expert umpires possess specialized visual strategies that enhance LBW decision-making. It was predicted
that: 1) expert umpires will outperform novice umpires on adjudicating of all three components of LBW appeals; 2) expert umpires will utilize a specialized visual strategy consisting of fewer !xations of longer durations to more informative loca-tions (Williams, 2009); and, p. 3) expert umpires’ !nal !xation before the ball strikes the batter’s pad will be a gaze anchor between a good length and the middle of the stumps.
Method
ParticipantsParticipants were 12 expert umpires (M = 58 years of age,
SD = 10) and 19 novice umpires (M = 42 years of age, SD = 7). The expert umpires had o$ciated in organized cricket at elite club (n = 9), minor counties (n = 2) and !rst-class cricket (n = 1). The expert umpires had a mean of 11 years (SD = 5) umpiring experience, accumulated over a mean of 100 matches (SD = 12). Additionally, the expert umpires had accumulated a mean of 279 (SD = 390) matches of playing experience in competitive club cricket. The novice participants had not umpired in any form of organized cricket. Participants gave their informed consent prior to taking part in the study and the study was approved by the Research Ethics Committee of the lead institution.
Task & ApparatusVisual search behaviours were recorded using the
TobiiGlasses2 corneal re#ection eye movement system (Tobii Technology AB; Danderyd, Sweden). The test !lm was recorded at the Marylebone Cricket Club Cricket Academy. Video footage from an umpire’s perspective was recorded using a Canon VIXIA HFR706 camera (Tokyo, Japan). The camera was posi-tioned in line with middle stump 1.00 m away from the non- strikers popping crease. A right-handed batter who competes in the Worcestershire Premier League faced a number of deliv-eries delivered by a BOLA Bowling Machine (Bola Manufacturing Ltd.; Bristol, UK), from both around and over the wicket, at speeds between 65–80 mph. The batter was encouraged to play their “natural game” whilst facing these deliveries. Deliveries that struck the batter’s pad were termed “appeals” and were reviewed via “Hawk Eye” (Basingstoke, UK), which reconstructed the ball #ight characteristics should the obstruction not have occurred (Collins, 2010). Hawk Eye tech-nology utilizes a theory of triangulation, which helps predict post ball-pad impact by measuring angles from the known points of the delivery’s pre-impact #ight (Duggal, 2014). In total, 20 appeals were used for the study with 11 being deliv-ered from around the wicket, and 9 being delivered from over the wicket. A total of 16 appeals were deemed “out” and 4 deemed “not out” by Hawk Eye. Based on pilot testing, trials that were deemed too easy (85% and above in accuracy) were omitted from the !nal test !lm.
The footage was edited using Windows Movie Maker 2016 (Washington, USA). Each appeal formed one trial. For each trial, the trial number and position of the delivery (over or around the wicket) were each shown for 3.0 s and were followed by a 3.0s countdown. The video clip started 3.0 seconds before ball release, to represent the time for a bowler’s run-up in a match scenario. The video clip continued for a further 3.0 s after ball- pad impact and was followed by a black screen, which signalled
2 P. RAMACHANDRAN ET AL.
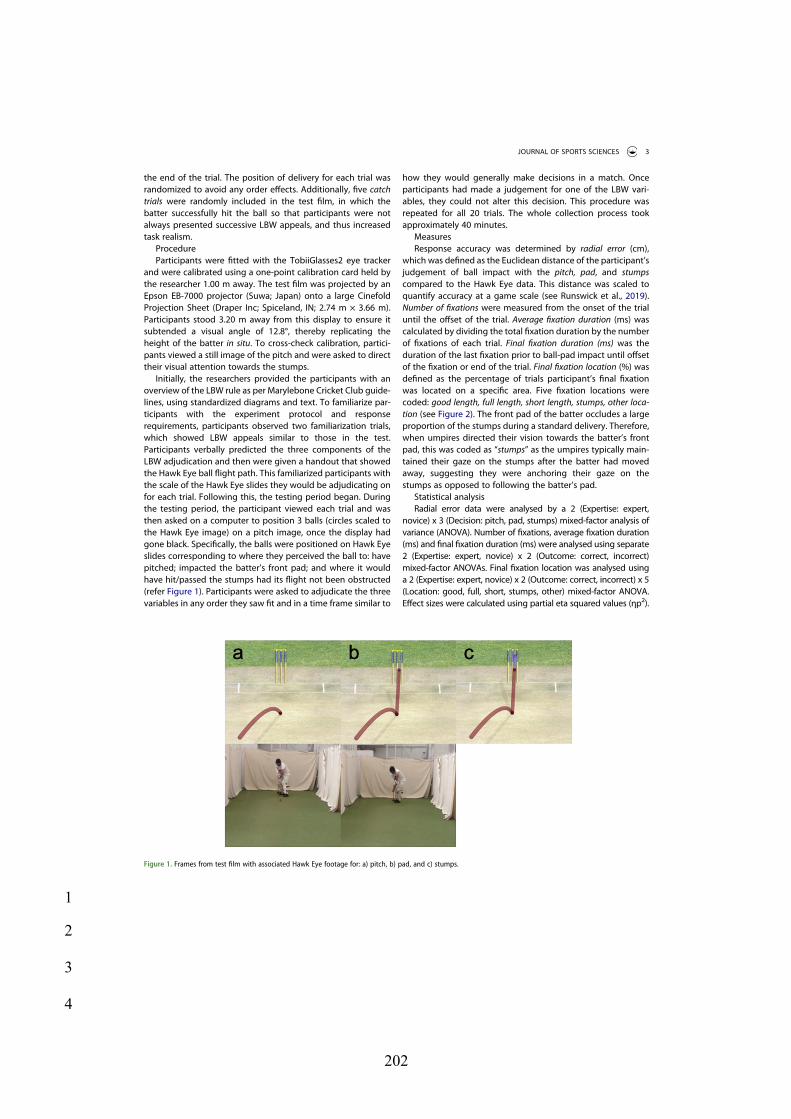
202
1
2
3
4
the end of the trial. The position of delivery for each trial was randomized to avoid any order e!ects. Additionally, "ve catch trials were randomly included in the test "lm, in which the batter successfully hit the ball so that participants were not always presented successive LBW appeals, and thus increased task realism.
ProcedureParticipants were "tted with the TobiiGlasses2 eye tracker
and were calibrated using a one-point calibration card held by the researcher 1.00 m away. The test "lm was projected by an Epson EB-7000 projector (Suwa; Japan) onto a large Cinefold Projection Sheet (Draper Inc; Spiceland, IN; 2.74 m # 3.66 m). Participants stood 3.20 m away from this display to ensure it subtended a visual angle of 12.8°, thereby replicating the height of the batter in situ. To cross-check calibration, partici-pants viewed a still image of the pitch and were asked to direct their visual attention towards the stumps.
Initially, the researchers provided the participants with an overview of the LBW rule as per Marylebone Cricket Club guide-lines, using standardized diagrams and text. To familiarize par-ticipants with the experiment protocol and response requirements, participants observed two familiarization trials, which showed LBW appeals similar to those in the test. Participants verbally predicted the three components of the LBW adjudication and then were given a handout that showed the Hawk Eye ball $ight path. This familiarized participants with the scale of the Hawk Eye slides they would be adjudicating on for each trial. Following this, the testing period began. During the testing period, the participant viewed each trial and was then asked on a computer to position 3 balls (circles scaled to the Hawk Eye image) on a pitch image, once the display had gone black. Speci"cally, the balls were positioned on Hawk Eye slides corresponding to where they perceived the ball to: have pitched; impacted the batter’s front pad; and where it would have hit/passed the stumps had its $ight not been obstructed (refer Figure 1). Participants were asked to adjudicate the three variables in any order they saw "t and in a time frame similar to
how they would generally make decisions in a match. Once participants had made a judgement for one of the LBW vari-ables, they could not alter this decision. This procedure was repeated for all 20 trials. The whole collection process took approximately 40 minutes.
MeasuresResponse accuracy was determined by radial error (cm),
which was de"ned as the Euclidean distance of the participant’s judgement of ball impact with the pitch, pad, and stumps compared to the Hawk Eye data. This distance was scaled to quantify accuracy at a game scale (see Runswick et al., 2019). Number of !xations were measured from the onset of the trial until the o!set of the trial. Average !xation duration (ms) was calculated by dividing the total "xation duration by the number of "xations of each trial. Final !xation duration (ms) was the duration of the last "xation prior to ball-pad impact until o!set of the "xation or end of the trial. Final !xation location (%) was de"ned as the percentage of trials participant’s "nal "xation was located on a speci"c area. Five "xation locations were coded: good length, full length, short length, stumps, other loca-tion (see Figure 2). The front pad of the batter occludes a large proportion of the stumps during a standard delivery. Therefore, when umpires directed their vision towards the batter’s front pad, this was coded as “stumps” as the umpires typically main-tained their gaze on the stumps after the batter had moved away, suggesting they were anchoring their gaze on the stumps as opposed to following the batter’s pad.
Statistical analysisRadial error data were analysed by a 2 (Expertise: expert,
novice) x 3 (Decision: pitch, pad, stumps) mixed-factor analysis of variance (ANOVA). Number of "xations, average "xation duration (ms) and "nal "xation duration (ms) were analysed using separate 2 (Expertise: expert, novice) x 2 (Outcome: correct, incorrect) mixed-factor ANOVAs. Final "xation location was analysed using a 2 (Expertise: expert, novice) x 2 (Outcome: correct, incorrect) x 5 (Location: good, full, short, stumps, other) mixed-factor ANOVA. E!ect sizes were calculated using partial eta squared values (%p2).
Figure 1. Frames from test film with associated Hawk Eye footage for: a) pitch, b) pad, and c) stumps.
JOURNAL OF SPORTS SCIENCES 3
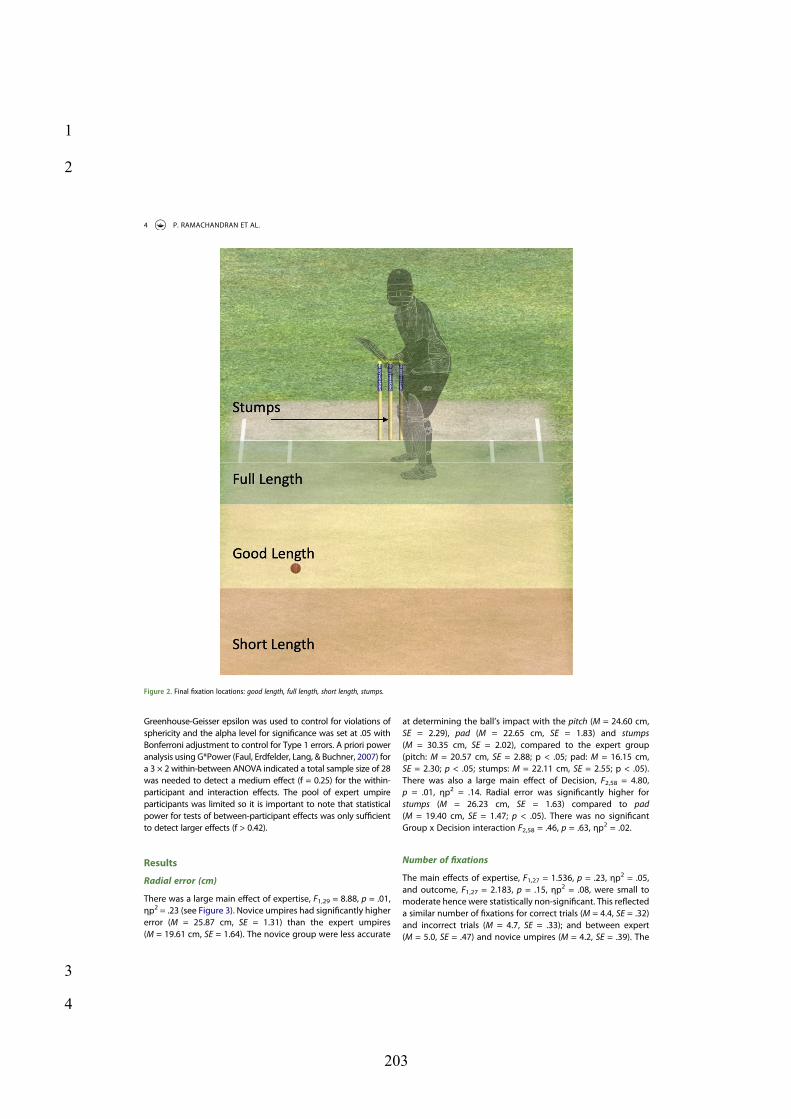
203
1
2
3
4
Greenhouse-Geisser epsilon was used to control for violations of sphericity and the alpha level for signi!cance was set at .05 with Bonferroni adjustment to control for Type 1 errors. A priori power analysis using G*Power (Faul, Erdfelder, Lang, & Buchner, 2007) for a 3 " 2 within-between ANOVA indicated a total sample size of 28 was needed to detect a medium e#ect (f = 0.25) for the within- participant and interaction e#ects. The pool of expert umpire participants was limited so it is important to note that statistical power for tests of between-participant e#ects was only su$cient to detect larger e#ects (f > 0.42).
Results
Radial error (cm)
There was a large main e#ect of expertise, F1,29 = 8.88, p = .01, %p2 = .23 (see Figure 3). Novice umpires had signi!cantly higher error (M = 25.87 cm, SE = 1.31) than the expert umpires (M = 19.61 cm, SE = 1.64). The novice group were less accurate
at determining the ball’s impact with the pitch (M = 24.60 cm, SE = 2.29), pad (M = 22.65 cm, SE = 1.83) and stumps (M = 30.35 cm, SE = 2.02), compared to the expert group (pitch: M = 20.57 cm, SE = 2.88; p < .05; pad: M = 16.15 cm, SE = 2.30; p < .05; stumps: M = 22.11 cm, SE = 2.55; p < .05). There was also a large main e#ect of Decision, F2,58 = 4.80, p = .01, %p2 = .14. Radial error was signi!cantly higher for stumps (M = 26.23 cm, SE = 1.63) compared to pad (M = 19.40 cm, SE = 1.47; p < .05). There was no signi!cant Group x Decision interaction F2,58 = .46, p = .63, %p2 = .02.
Number of !xations
The main e#ects of expertise, F1,27 = 1.536, p = .23, %p2 = .05, and outcome, F1,27 = 2.183, p = .15, %p2 = .08, were small to moderate hence were statistically non-signi!cant. This re&ected a similar number of !xations for correct trials (M = 4.4, SE = .32) and incorrect trials (M = 4.7, SE = .33); and between expert (M = 5.0, SE = .47) and novice umpires (M = 4.2, SE = .39). The
Figure 2. Final fixation locations: good length, full length, short length, stumps.
4 P. RAMACHANDRAN ET AL.
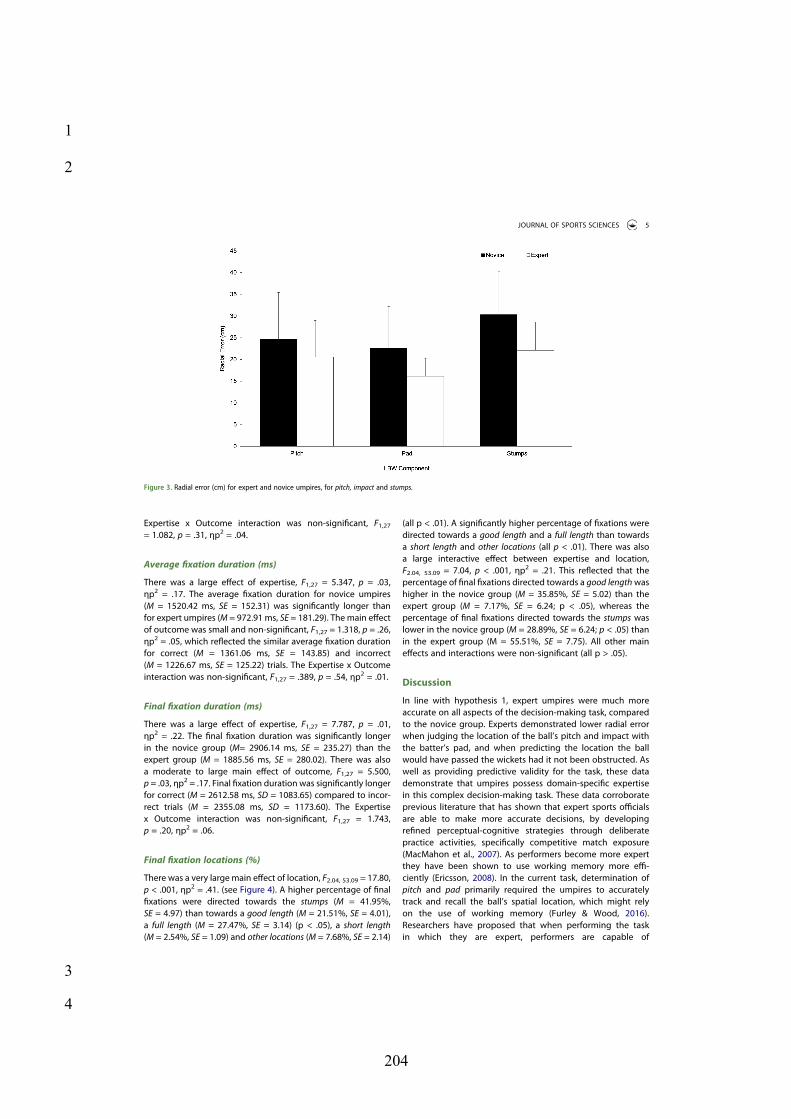
204
1
2
3
4
Expertise x Outcome interaction was non-signi!cant, F1,27
= 1.082, p = .31, "p2 = .04.
Average !xation duration (ms)
There was a large e#ect of expertise, F1,27 = 5.347, p = .03, "p2 = .17. The average !xation duration for novice umpires (M = 1520.42 ms, SE = 152.31) was signi!cantly longer than for expert umpires (M = 972.91 ms, SE = 181.29). The main e#ect of outcome was small and non-signi!cant, F1,27 = 1.318, p = .26, "p2 = .05, which re$ected the similar average !xation duration for correct (M = 1361.06 ms, SE = 143.85) and incorrect (M = 1226.67 ms, SE = 125.22) trials. The Expertise x Outcome interaction was non-signi!cant, F1,27 = .389, p = .54, "p2 = .01.
Final !xation duration (ms)
There was a large e#ect of expertise, F1,27 = 7.787, p = .01, "p2 = .22. The !nal !xation duration was signi!cantly longer in the novice group (M= 2906.14 ms, SE = 235.27) than the expert group (M = 1885.56 ms, SE = 280.02). There was also a moderate to large main e#ect of outcome, F1,27 = 5.500, p = .03, "p2 = .17. Final !xation duration was signi!cantly longer for correct (M = 2612.58 ms, SD = 1083.65) compared to incor-rect trials (M = 2355.08 ms, SD = 1173.60). The Expertise x Outcome interaction was non-signi!cant, F1,27 = 1.743, p = .20, "p2 = .06.
Final !xation locations (%)
There was a very large main e#ect of location, F2.04, 53.09 = 17.80, p < .001, "p2 = .41. (see Figure 4). A higher percentage of !nal !xations were directed towards the stumps (M = 41.95%, SE = 4.97) than towards a good length (M = 21.51%, SE = 4.01), a full length (M = 27.47%, SE = 3.14) (p < .05), a short length (M = 2.54%, SE = 1.09) and other locations (M = 7.68%, SE = 2.14)
(all p < .01). A signi!cantly higher percentage of !xations were directed towards a good length and a full length than towards a short length and other locations (all p < .01). There was also a large interactive e#ect between expertise and location, F2.04, 53.09 = 7.04, p < .001, "p2 = .21. This re$ected that the percentage of !nal !xations directed towards a good length was higher in the novice group (M = 35.85%, SE = 5.02) than the expert group (M = 7.17%, SE = 6.24; p < .05), whereas the percentage of !nal !xations directed towards the stumps was lower in the novice group (M = 28.89%, SE = 6.24; p < .05) than in the expert group (M = 55.51%, SE = 7.75). All other main e#ects and interactions were non-signi!cant (all p > .05).
Discussion
In line with hypothesis 1, expert umpires were much more accurate on all aspects of the decision-making task, compared to the novice group. Experts demonstrated lower radial error when judging the location of the ball’s pitch and impact with the batter’s pad, and when predicting the location the ball would have passed the wickets had it not been obstructed. As well as providing predictive validity for the task, these data demonstrate that umpires possess domain-speci!c expertise in this complex decision-making task. These data corroborate previous literature that has shown that expert sports o%cials are able to make more accurate decisions, by developing re!ned perceptual-cognitive strategies through deliberate practice activities, speci!cally competitive match exposure (MacMahon et al., 2007). As performers become more expert they have been shown to use working memory more e%-ciently (Ericsson, 2008). In the current task, determination of pitch and pad primarily required the umpires to accurately track and recall the ball’s spatial location, which might rely on the use of working memory (Furley & Wood, 2016). Researchers have proposed that when performing the task in which they are expert, performers are capable of
Figure 3. Radial error (cm) for expert and novice umpires, for pitch, impact and stumps.
JOURNAL OF SPORTS SCIENCES 5

205
1
2
3
4
circumventing the limits of working memory by directly acces-sing domain-speci!c information from long-term memory through retrieval cues in short-term working memory (Ericsson & Kintsch, 1995). This may explain the more accurate decisions of the experts in the pitch and pad judgements. Such an explanation would be in line with the assumption that whilst elite o"cials do not have a greater working mem-ory capacity for general tasks, they acquire strategies that enable a more e"cient use of working memory in domain- speci!c activities (Spitz et al., 2016).
Despite their di#erences, both groups were less accurate when predicting stumps compared to pad. This can be explained by the fact that judging ball $ight path after ball- pad contact requires a perceptual judgement based on a variety of factors such as batter stance (Southgate et al., 2008), dynamics of the delivery (spin and swing) and the ball’s surface degradation (Chalkley et al., 2013). Conversely, when judging ball-pad impact, all visual information was present so the umpire did not need to consider these contextual factors.
As well as accuracy di#erences, previous studies of expertise in sport have consistently reported di#erences in the number of !xations and average !xation duration between skill levels in a variety of task (Mann et al., 2007). It is generally accepted that in a temporally constrained decision-making task, such as the current study, a more e"cient strategy consists of fewer !xa-tions of longer duration (Mann et al., 2019). This is predomi-nantly to reduce suppression of information during saccadic eye movements in order to maximize the information that can be gathered (Ludwig, 2011). However, we found no signi!cant di#erence in the number of !xations between the groups. Furthermore, the average !xation duration for the novice group was signi!cantly longer than that of the expert umpires, although this was not associated with more accurate decision- making.
The !nding that !nal !xation duration was signi!cantly longer for the novices compared to the experts con$icts with
hypothesis 2. Previous studies (Raab & Laborde, 2011) have shown that experts are better able to generate the !rst and best option, produce fewer overall options and are quicker to generate the !rst option than near-experts and novices, there-fore requiring a shorter !nal !xation. Conversely, the novices require a much longer !nal !xation in order to extract the information needed to make a judgement as they have less re!ned perceptual-cognitive strategies (Mann et al., 2019). This is supported by reports that experts favour intuitive decision- making, compared to novices, who tend to be more delibera-tive (Raab & Laborde, 2011). Novices have been shown to generate more options (Raab & Laborde, 2011) and take longer to generate an initial response (Raab & Johnson, 2007). Conversely, experts have been shown to generate fewer options and pick the !rst option more often (Raab & Laborde, 2011), a strategy that has been shown to result in better and more consistent decisions (Johnson & Raab, 2003). This take-the -!rst heuristic allows the experts to make quick decisions under limitations of time, processing resources, or information. Whilst these decisions are usually accurate, they can sometimes be a#ected by biases (Raab & Johnson, 2007). Whilst cricket umpir-ing generally allows some time for deliberation, it could be argued that the speed at which critical visual information becomes available dictates that intuitive decision-making plays a key role.
In hypothesis 3, it was predicted that expert umpires would use a perceptual-cognitive strategy that consisted of a !nal !xation point (gaze anchor) on a location central to the critical information sites. In support of this, the more accurate deci-sions made by the expert group across all of the conditions could be explained by their allocation of attention to the stumps signi!cantly more than their novice counterparts, who tended to allocate their !nal !xation towards a good length on the pitch. Such di#erences also corroborate previous research within fast-ball sports (Broadbent et al., 2015), which have shown specialized perceptual-cognitive skills utilized by expert
Figure 4. Final fixation locations (%) for experts and novices on correct and incorrect trials for good, full length, short length, stumps and other locations.
6 P. RAMACHANDRAN ET AL.

206
1
2
3
4
performers enhance their ability to locate and identify salient cues, which ultimately aid decision-making success. A gaze anchor is located in the centre of several critical cues (pitch, pad, stumps) in order to distribute attention to several cues using peripheral vision. Use of the gaze anchor has been seen to enhance decision-making of football o!cials in expert and near-expert assistant football referees, who anchored their gaze on the o"side line as opposed directing foveal vision on either the passer, the ball or the attacker (Schnyder et al., 2017). Notably, the actual #xation location (stumps) from the present study may not contain any task-speci#c information that is being processed by the fovea, but is equidistant to the perti-nent cues (Vansteenkiste et al., 2014). Therefore, by anchoring their gaze towards the stumps, the expert umpires are capable of utilizing their peripheral vision to ascertain the position the ball pitched as well as the initial angle of delivery using the relative motion around the central point. Consequently, infor-mation processing via foveal vision directed towards the stumps might have enhanced their ability to perceive the height and line of impact with the pad and thus provided them with an increased accuracy when judging the trajectory of the ball towards the stumps.
Conversely, the novice umpires might not have utilized both foveal and peripheral vision to make the judgements and might have #xated on a good length due to pitch being the #rst consideration needed when applying the LBW law. Subsequently, due to the demands of processing multiple tra-jectories and impact points, working memory capacity of the novices may have been overwhelmed, leading to less accurate decisions on the later variables. The information reduction hypothesis (Haider & Frensch, 1999) postulates that when indi-viduals practice a task, they selectively allocate attentional processes towards task-relevant information at the expense of task-redundant information which limits the load on working memory processes, and as a consequence enhances perfor-mance. In the current study, the expert’s anchoring their vision on the stumps may have permitted them to selectively process critical information related to pad and stumps and thus reduce task-redundant processing. Consequently, load on the working memory will have been reduced and recall of all three compo-nents of the LBW law may have been enhanced.
Summary
Taken together, these data show that expert umpires have developed a systematic perceptual-cognitive strategy, com-prising a gaze anchor, that enables them to overcome the processing demands and maximize accuracy in a complex decision-making task. These data provide an important #rst step towards the design of training interventions to help less-skilled umpires develop a more re#ned and systematic visual strategy to enhance decision-making. However, further research is required to determine the processing demands in umpires during a delivery, which includes other elements, such as the front-foot no-ball call, and other external factors in$uencing attentional control. For example, the use of a real-life bowler, and the front-foot no- ball decision, would increase the representativeness of both the batter’s biomechanics (Pinder et al., 2009) and the
overall match demands of an umpire, which may alter the umpires’ visual strategy. It is possible that the limited time between the front-foot grounding and the ball-pad impact might impair the use of the gaze anchor and require umpires to implement an alternative gaze strategy. Understanding the development of these domain-speci#c perceptual-cognitive skills and the e"ect of other attentional and contextual factors will be critical in designing any future training interventions.
Disclosure statement
No potential con$ict of interest was reported by the authors.
ORCID
Pravinath Ramachandran http://orcid.org/0000-0003-2502-3105Matt Watts http://orcid.org/0000-0002-5814-8556Robin C. Jackson http://orcid.org/0000-0001-7983-3870Spencer J. Hayes http://orcid.org/0000-0002-8976-9232Joe Causer http://orcid.org/0000-0002-8939-8769
References
Adie, J. M., Renshaw, I., Polman, R., Thompson, M. B., & Mann, D. L. (2020). When in doubt, it’s not out: Match format is associated with di"erences in elite-level cricket umpires’ leg-before-wicket decisions. Psychology of Sport and Exercise, 51, 101760. https://doi.org/10.1016/j.psychsport. 2020.101760
Borooah, V. K. (2013). Upstairs and downstairs: The imperfections of crick-et’s decision review system. Journal of Sports Economics, 17(1), 64–85. https://doi.org/10.1177/1527002513511973
Broadbent, D., Causer, J., Williams, A. M., & Ford, P. R. (2015). Perceptual- cognitive skill training and its transfer to expert performance in the #eld: Future research directions. European Journal of Sport Science, 15(4), 322–331. https://doi.org/10.1080/17461391.2014.957727
Chalkley, D., MacMahon, C., & Ball, K. (2013). Predicting ball $ight in cricket from an umpire’s perspective. International Journal of Sports Science & Coaching, 8(3), 445–454. https://doi.org/10.1260/1747-9541.8.3.445
Chedzoy, O. B. (1997). The e"ect of umpiring errors in cricket. Journal of the Royal Statistical Society: Series D (The Statistician), 46(4), 529–540. https:// doi.org/10.1111/1467-9884.00107
Club, M. C. (2017). The laws of cricket 2017 code (2nd- 2019 ed.). Marylebone Cricket Club.
Collins, H. (2010). The philosophy of umpiring and the introduction of decision-aid technology. Journal of the Philosophy of Sport, 37(2), 135–146. https://doi.org/10.1080/00948705.2010.9714772
Craven, B. J. (1998). A psychophysical study of leg-before-wicket judgments in cricket. British Journal of Psychology, 89(4), 555–578. https://doi.org/ 10.1111/j.2044-8295.1998.tb02703.x
Croft, J. L., Button, C., & Dicks, M. (2010). Visual strategies of sub-elite cricket batsmen in response to di"erent ball velocities. Human Movement Science, 29(5), 751–763. https://doi.org/10.1016/j.humov.2009.10.004
Crowe, S. M., & Middeldorp, J. (1996). A comparison of leg before wicket rates between Australians and their visiting teams for test cricket series played in Australia, 1977–94. Journal of the Royal Statistical Society: Series D (The Statistician), 45(2), 255–262. https://doi.org/10.2307/2988414
Davis, C. (2017, June 1). The art of the review. http://www.espn.co.uk/cricket/ story/_/id/19835497/charles-davis-analyses-use-drs-players-teams
Duggal, M. (2014). Hawk Eye technology. Journal of Global Research Computer Science & Technology, 1(2), 30–36. http://oaji.net/articles/ 2014/1407-1415422826.pdf
Ericsson, K. A. (2008). Deliberate practice and acquisition of expert perfor-mance: A general overview. Academic Emergency Medicine, 15(11), 988–994. https://doi.org/10.1111/j.1553-2712.2008.00227.x
JOURNAL OF SPORTS SCIENCES 7
207
1
2
3
4
Ericsson, K. A., & Kintsch, W. (1995). Long-term working memory. Psychological Review, 102(2), 211–245. https://doi.org/10.1037/0033- 295X.102.2.211
Faul, F., Erdfelder, E., Lang, A. G., & Buchner, A. (2007). G*Power 3: A !exible statistical power analysis program for the social, behavioral, and biome-dical sciences. Behavior Research Methods, 39, 175–191. https://doi.org/ https://doi.org/10.3758/BF03193146
Furley, P., & Wood, G. (2016). Working memory, attentional control, and expertise in sports: A review of current literature and directions for future research. Journal of Applied Research in Memory and Cognition, 5 (4), 415–425. https://doi.org/10.1016/j.jarmac.2016.05.001
Haider, H., & Frensch, P. A. (1999). Eye movement during skill acquisition: More evidence for the information reduction hypothesis. Journal of Experimental Psychology: Learning, Memory & Cognition, 25(1), 172–190. https://doi.org/10.1037/0278-7393.25.1.172
Johnson, J. G., & Raab, M. (2003). Take the "rst: Option-generation and resulting choices. Organizational Behavior and Human Decision Processes, 91(2), 215–229. https://doi.org/10.1016/S0749-5978(03)00027-X
Land, M. F., & McLeod, P. (2000). From eye movements to actions: How batsmen hit the ball. Nature Neuroscience, 3(12), 1340–1345. https://doi. org/10.1038/81887
Ludwig, C. J. H. (2011). Saccadic decision making. In S. P. Liversedge, I. D. Gilchrist, & S. Everling (Eds.), The oxford handbook of eye movements (pp. 425–437). Oxford University Press.
MacMahon, C., Helsen, W. F., Starkes, J. L., & Weston, M. (2007). Decision- making skills and deliberate practice in elite association football referees. Journal of Sports Sciences, 25(1), 65–78. https://doi.org/10. 1080/02640410600718640
Mann, D. L., Causer, J., Nakamoto, H., & Runswick, O. R. (2019). Visual search behaviors in expert perceptual judgements. In A. M. Williams & R. C. Jackson (Eds.), Anticipation and decision making in sport (pp. 59–78). Routledge.
Mann, D. L., Spratford, W., & Abernethy, B. (2013). The head tracks and gaze predicts: How the world’s best batters hit a ball. PloS One, 8(3), e58289– e58289. https://doi.org/10.1371/journal.pone.0058289
Mann, D. T. Y., Williams, A. M., Ward, P., & Janelle, C. M. (2007). Perceptual- cognitive expertise in sport: A meta-analysis. Journal of Sport & Exercise Psychology, 29(4), 457–478. https://doi.org/10.1123/jsep.29.4.457
Pinder, R. A., Renshaw, I., & Davids, K. (2009). Information–movement coupling in developing cricketers under changing ecological practice constraints. Human Movement Science, 28(4), 468–479. https://doi.org/ 10.1016/j.humov.2009.02.003
Raab, M., & Johnson, J. G. (2007). Expertise-based di#erences in search and option-generation strategies. Journal of Experimental Psychology: Applied, 13(3), 158–170. https://doi.org/10.1037/1076-898x.13.3.158
Raab, M., & Laborde, S. (2011). When to blink and when to think. Research Quarterly for Exercise and Sport, 82(1), 89–98. https://doi.org/10.1080/ 02701367.2011.10599725
Runswick, O. R., Roca, A., Williams, A. M., McRobert, A. P., & North, J. S. (2019). Why do bad balls get wickets? The role of congruent and incongruent information in anticipation. Journal of Sports Sciences, 37(5), 537–543. https://doi.org/10.1080/02640414.2018.1514165
Ryu, D., Abernethy, B., Mann, D. L., Poolton, J. M., & Gorman, A. D. (2013). The role of central and peripheral vision in expert decision making. Perception, 42(6), 591–607. https://doi.org/10.1068/p7487
Sacheti, A., Gregory-Smith, I., & Paton, D. (2015). Home bias in o$ciating: Evidence from international cricket. Journal of the Royal Statistical Society: Series A (Statistics in Society), 178(3), 741–755. https://doi.org/ 10.1111/rssa.12086
Schnyder, U., Koedijker, J. M., Kredel, R., & Hossner, E.-J. (2017). Gaze behaviour in o#side decision-making in football. German Journal of Exercise and Sport Research, 47(2), 103–109. https://doi.org/10.1007/ s12662-017-0449-0
Southgate, D. C., Barras, N., & Kummer, L. (2008). The e#ect of three di#erent visual monitoring strategies on the accuracy of leg-before-wicket deci-sions by cricket umpires. Clinical and Experimental Optometry, 91(4), 385–393. https://doi.org/10.1111/j.1444-0938.2007.00223.x
Spitz, J., Put, K., Wagemans, J., Williams, A. M., & Helsen, W. F. (2016). Visual search behaviors of association football referees during assessment of foul play situations. Cognitive Research: Principles and Implications, 1(1), 12. https://doi.org/10.1186/s41235-016-0013-8
Vaeyens, R., Lenoir, M., Williams, A. M., Mazyn, L., & Philippaerts, R. M. (2007). The e#ects of task constraints on visual search behavior and decision-making skill in youth soccer players. Journal of Sport & Exercise Psychology, 29(2), 147–169. https://doi.org/10.1123/jsep.29. 2.147
Vansteenkiste, P., Vaeyens, R., Zeuwts, L., Philippaerts, R. M., & Lenoir, M. (2014). Cue usage in volleyball: A time course comparison of elite, intermediate and novice female players. Biology of Sport, 31(4), 295–302. https://doi.org/10.5604/20831862.1127288
Vater, C., Williams, A. M., & Hossner, E.-J. (2020). What do we see out of the corner of our eye? The role of visual pivots and gaze anchors in sport. International Review of Sport and Exercise Psychology, 13(1), 81–103. https://doi.org/10.1080/1750984x.2019.1582082
Williams, A. M. (2009). Perceiving the intentions of others: How do skilled performers make anticipation judgments? Progress in Brain Research, 174, 73–83. https://doi.org/10.1016/S0079-6123(09)01307-7
Wilson, M., Causer, J., & Vickers, J. N. (2015). Aiming for excellence: The quiet eye as a characteristic of expertise. In D. Farrow & J. Baker (Eds.), Routledge handbook of sport expertise (pp. 22–37). Routledge.
8 P. RAMACHANDRAN ET AL.
Related Documents