Creating Customer Value in Tourism and Hospitality Industry, pp. 778-790 E. H. Ekiz, K. Hussain, A. Bavik: PERCEPTIONS OF SERVICE QUALITY IN NORTH CYPRUS… 778 ERDOGAN H. EKIZ, Instructor Faculty of Economics and Administrative Sciences, Department of Tourism and Hospitality Management, Cyprus International University, Nicosia, Turkey KASHIF HUSSAIN, Research Assistant Department of Educational Sciences, Eastern Mediterranean University, Famagusta, North Cyprus ALI BAVIK, MSc, Student School of Tourism and Hospitality Management, Eastern Mediterranean University, Famagusta, North Cyprus PERCEPTIONS OF SERVICE QUALITY IN NORTH CYPRUS NATIONAL AIRLINE UDC 658.56:656.7](564.3) Preliminary communication This study diagnoses the perceived service quality of a national airline company in North Cyprus. Literature reveals that existing service quality measurement scales did not fit well in measurement e.g. SERVQUAL failed to maintain its particular five dimensions- tangibles, reliability, responsiveness, assurance, and empathy-in North Cyprus (Kozak, Karatepe and Avci, 2003; Johns, Karatepe and Avci, 2004; Nadiri and Hussain, 2005). Therefore, the present study adopts Bari et al.’s (2001) AIRQUAL scale which is developed in the guidance of Churchill (1979) and Parasuraman et al. (1985; 1988) to overcome the psychometrical application problems of the existing quality scales. A 44- items scale based on seven distinct dimensions; airline tangibles, terminal tangibles, personnel, empathy, image, perceived service quality, and customer satisfaction, fit well in this study maintaining its reliability, validity and dimensionality issues. 583 questionnaires were found to be useful and data from these questionnaires were tested through SPSS and LISREL statistical package programs. Results revealed that among the independent dimensions of this study, airline tangibles was found to be most significant for perceived service quality and perceived service quality is positively related to customer satisfaction in the case of national airline of North Cyprus. Results and implications are discussed in detail. Key words: Perceived Service Quality, Customer Satisfaction, Path Analysis, National Airline, and North Cyprus. INTRODUCTION As the new century begins the dominance of the market system is firmly established and the central role of consumer satisfaction, quality and loyalty is generally recognized. The prevalent belief that competition increases efficiency and

Welcome message from author
This document is posted to help you gain knowledge. Please leave a comment to let me know what you think about it! Share it to your friends and learn new things together.
Transcript
Creating Customer Value in Tourism and Hospitality Industry, pp. 778-790 E. H. Ekiz, K. Hussain, A. Bavik: PERCEPTIONS OF SERVICE QUALITY IN NORTH CYPRUS…
778
ERDOGAN H. EKIZ, Instructor Faculty of Economics and Administrative Sciences, Department of Tourism and Hospitality
Management, Cyprus International University, Nicosia, Turkey KASHIF HUSSAIN, Research Assistant
Department of Educational Sciences, Eastern Mediterranean University, Famagusta, North Cyprus
ALI BAVIK, MSc, Student School of Tourism and Hospitality Management, Eastern Mediterranean University,
Famagusta, North Cyprus
PERCEPTIONS OF SERVICE QUALITY IN NORTH CYPRUS NATIONAL AIRLINE
UDC 658.56:656.7](564.3) Preliminary communication
This study diagnoses the perceived service quality of a national airline company in North Cyprus. Literature reveals that existing service quality measurement scales did not fit well in measurement e.g. SERVQUAL failed to maintain its particular five dimensions-tangibles, reliability, responsiveness, assurance, and empathy-in North Cyprus (Kozak, Karatepe and Avci, 2003; Johns, Karatepe and Avci, 2004; Nadiri and Hussain, 2005). Therefore, the present study adopts Bari et al.’s (2001) AIRQUAL scale which is developed in the guidance of Churchill (1979) and Parasuraman et al. (1985; 1988) to overcome the psychometrical application problems of the existing quality scales. A 44-items scale based on seven distinct dimensions; airline tangibles, terminal tangibles, personnel, empathy, image, perceived service quality, and customer satisfaction, fit well in this study maintaining its reliability, validity and dimensionality issues. 583 questionnaires were found to be useful and data from these questionnaires were tested through SPSS and LISREL statistical package programs. Results revealed that among the independent dimensions of this study, airline tangibles was found to be most significant for perceived service quality and perceived service quality is positively related to customer satisfaction in the case of national airline of North Cyprus. Results and implications are discussed in detail. Key words: Perceived Service Quality, Customer Satisfaction, Path Analysis, National Airline, and North Cyprus.
INTRODUCTION As the new century begins the dominance of the market system is firmly
established and the central role of consumer satisfaction, quality and loyalty is generally recognized. The prevalent belief that competition increases efficiency and
Creating Customer Value in Tourism and Hospitality Industry, pp. 778-790 E. H. Ekiz, K. Hussain, A. Bavik: PERCEPTIONS OF SERVICE QUALITY IN NORTH CYPRUS…
779
standards of living has resulted in a focus on industry structure that has placed intense competitive pressures on both domestic and global organizations. In seeking competitive advantage, corporations find that they must not only be concerned with the creative positive elements related to consumer satisfaction but must focus on the critical problems associated with dissatisfaction, service failure and recovery (Singh, 1988; Smith, Bolton and Wagner, 1999).
Defining and measuring quality service is of importance to providers of airline services. This study diagnoses perceived service quality measurement scale to customers using national airline in North Cyprus. National Airline called Cyprus Turkish Airlines was established in 1974. Turkish Airlines cooperates as a sister Airline Company with Cyprus Turkish Airlines but actually is not a national airline for of North Cyprus. Beside, there are also new private airline companies such as Onur Air, TWI and Atlas Jet in North Cyprus market but still the dominance of the two main carriers continues, Cyprus Turkish Airlines and Turkish Airlines.
Cyprus is the third largest island in the Mediterranean after Sicily and Sardinia. It lays between latitudes 30.33 and 35.41 and longitudes 32.23 and 34.55. The Republic of Cyprus gained its independence from Britain in 1960. Today, the island has two parts: North-administered by Turks and South-administered by Greeks since 1974. The North Cyprus covers an area of 3,355 square kilometers. The neighbors of North Cyprus are Turkey, 65 km to the north, Syria, 100 km to the east and Egypt, 420 km to the south.
Tourist arrivals in the North Cyprus has been significantly influenced due to the 24th of April 2004 referendum for a peace solution between South and North on the island Cyprus. Tourism activity of the island has a special consequence that, although it has 10.000 bed capacity for tourist accommodation of which 40% is occupied, it produces 3 times larger volume of economic activity then Island’s total exports revenue. According to Tourism and Planning Office (2003) 589,544 tourists visited North Cyprus in 2003. A more recent report of the Tourism and Planning Office (October 2004, in process) showed that there was a 25.7% increase in tourist arrivals between October 2003 and 2004. These arrivals generate 178.8 million US dollars of revenue for the North Cyprus economy. Thus, it is clear that airline industry of North Cyprus has a fundamental effect on travel and tourism industry. In the wake of increasing competition and the dramatic changes occurring in the tourist arrivals in North Cyprus, there is a need for national airline managers to recognize the importance of service improvements in establishing a competitive advantage.
Service quality promotes customer satisfaction, stimulates intention to return, and encourages recommendations. Customer satisfaction increases profitability, market share, and return on investment (Barsky and Labagh, 1992; Stevens et al., 1995; Legoherel, 1998; Fornell, 1992; Halstead and Page, 1992). In a highly competitive airline industry, individual managers must find ways to make their services stand out among the others. To achieve this, managers must understand their customers’ needs-and then set out to meet (or exceed) these needs. If service quality is to be improved, it must be reliably assessed and measured. According to the SERVQUAL model (Parasuraman et al., 1988), service quality can be measured by identifying the gaps between customers’ expectations of the service to be rendered and their perceptions of the actual performance of the service. SERVQUAL is based on five dimensions of service (Parasuraman et al., 1988): tangibles-the physical surroundings represented by objects (for example, interior design) and subjects (for example, the appearance of
Creating Customer Value in Tourism and Hospitality Industry, pp. 778-790 E. H. Ekiz, K. Hussain, A. Bavik: PERCEPTIONS OF SERVICE QUALITY IN NORTH CYPRUS…
780
employees); reliability-the service provider's ability to provide accurate and dependable services; responsiveness-a firm’s willingness to assist its customers by providing fast and efficient service performances; assurance-diverse features that provide confidence to customers (such as the firm’s specific service knowledge polite and trustworthy behavior from employees); and empathy-the service firm's readiness to provide each customer with personal service.
Several researchers have sought to define and measure the concept of service quality (Carman, 1990; Cronin and Taylor, 1992; Parasuraman et al., 1985; 1988; 1991; Teas, 1994). It has also been argued that the number of dimensions and the nature of SERVQUAL construct may be industry specific. The fit of five-dimensions of SERVQUAL carried out in different service activities has always been an important question in several studies that these dimensions proposed by SERVQUAL do not replicate. Many times the SERVQUAL scale has been found uni-dimensional (Angur, et al., 1999; Babakus and Mangold, 1992; Babakus and Boller, 1992) and sometimes with even ten dimensions (Carman, 1990) and in some cases, it has been found to be two-dimensional (Nadiri and Hussain, 2005; Karatepe and Avci, 2002; Ekinci, et al., 2003). It has also been argued that performance-only (SERVPERF) measure explains more of the variance in an overall measure of service quality than SERVQUAL instrument (Cronin and Taylor, 1994). Therefore, the present study sets out to diagnose the perceived service quality of airline customers through SERVPERF option of SERVQUAL in North Cyprus.
This study is necessary, useful, and relevant because: a) it focuses on perceived service quality about national airline of an island (which have received little attention in the past); and b) North Cyprus is both an island and a virgin market in the Mediterranean where quality of airlines is a significant strategic issue for increasing the competitiveness of the Mediterranean islands on the international tourism market. Further, the results, managerial implications, and future research implications are discussed in detail.
1. BACKGROUND OF THE STUDY The debate regarding the differences between the concepts of the quality of
service and satisfaction has been vigorous and not entirely conclusive (Parasuraman et al., 1994; Oliver, 1994). According to Zeithaml and Bitner (2000) the main difference is that quality is considered to be a cause of satisfaction. Satisfaction is the umbrella concept and service quality refers to the specific attributes of the service. The service attributes relevant to the service quality are reliability, responsiveness, assurance, empathy and tangibles (SERVQUAL). The distinctiveness of the constructs of the perceived service quality and satisfaction is based on the antecedent factors. Parasuraman et al. (1985) suggest that quality can be measured as the gap (the degree and the direction of the differences) between the customers’ service perceptions and their expectations.
The SERVQUAL instrument with the various amendments and refinements (1991 and 1994) has been criticized because of the inclusion of expectations, suggesting that the disconfirmation approach is neither supported theoretically nor empirically (Babakus and Mangold, 1992; Cronin and Taylor, 1992). Spreng and Mackoy (1996) found that perceived service quality is not significantly influenced by
Creating Customer Value in Tourism and Hospitality Industry, pp. 778-790 E. H. Ekiz, K. Hussain, A. Bavik: PERCEPTIONS OF SERVICE QUALITY IN NORTH CYPRUS…
781
the failure to meet customer expectations and that satisfaction is dependent on the similarity of desires. Cronin and Taylor (1992) developed a new service quality instrument the SERVPERF, based on the performance outcomes of the service experience. Cronin and Taylor (1992), claim that the SERVPERF is more effective because it eliminates the issue of expectations. Avrikan (1999) developed the BANKSERV instrument which deals with perceptions and expectations of service quality at the same time. The relationship between the relative importance of the service quality and the actual performance has been attempted by Ennew et al. (1993), which was subsequently amended and adapted by Hemmasi et al. (1994). Newman (2001) identified a number of weaknesses, with the application of SERVQUAL in the financial sector, in terms of its appropriateness in organizational quality improvement. According to Newman (2001) SERVQUAL is rather unclear in measuring service quality and does not provide an assessment of the consumers’ priorities with different service attributes.
Also in the case of North Cyprus, Kozak, Karatepe and Avci (2003) and Johns, Karatepe and Avci (2004) both reported that dimensions of SERVQUAL scale: tangibles; reliability; responsiveness; assurance; and empathy, were not validating in measuring service quality and customer satisfaction. Authors also reported that SERVQUAL happen to be found a uni-dimensional scale in North Cyprus. Meanwhile, Bari et al. (2001) developed an AIRQUAL scale to overcome the psychometrical application problems of the existing quality scales, in the guidance of Churchill (1979) and Parasuraman et al. (1985; 1988). The results of AIRQUAL revealed that the scale had seven distinct dimensions which successfully managed to measure the quality perceptions of airline customers in North Cyprus. Therefore, this study as a standpoint continues on previous work incorporated with Bari et al. (2001) in North Cyprus using 44-items instrument in order to measure perceived service quality and customer satisfaction levels among national airline. The dimensions of service quality proposed by Bari et al. (2001) are as follow: airline tangibles (ATANG); terminal tangibles (TTANG); personnel (PER); empathy (EMP); and image (IMG) are used as independent variables where perceived service quality (PSQ); and customer satisfaction (CSAT) are used as dependent variables of the study. A synthesis of the literature shows that these dimensions are used in prior empirical studies (e.g., Parasuraman et al., 1988; Sultan and Simpson, 2000; Kozak, Karatepe and Avci, 2003).
Considering Bari et al.’s (2001) study as a benchmark of predicting perceived service quality and customer satisfaction for North Cyprus national airline, following hypotheses are developed: H1: A high level of perceived airline tangibles related quality will have a significant
positive effect on perceived service quality. H2: A high level of perceived terminal tangibles related quality will have a significant
positive effect on perceived service quality. H3: A high level of perceived personnel related quality will have a significant positive
effect on perceived service quality. H4: A high level of perceived empathy will have a significant positive effect on
perceived service quality. H5: A high level of perceived airline image will have a significant positive effect on
perceived service quality. H6: A high level of perceived service quality will have a significant positive effect on
customer satisfaction.
Creating Customer Value in Tourism and Hospitality Industry, pp. 778-790 E. H. Ekiz, K. Hussain, A. Bavik: PERCEPTIONS OF SERVICE QUALITY IN NORTH CYPRUS…
782
2. METHODOLOGY The sample of the study consists of customers using national airline of North
Cyprus during May-July 2005 with non-probability judgmental sampling technique. Judd, Smith, and Kidder (1991, p. 136) define judgmental sampling or purposive sampling as “picking cases that are judged to be typical of the population in which we are interested, assuming that errors of judgment in the selection will tend to counterbalance one another”.
The survey instrument was adopted from Bari et al. (2001). 700 questionnaires were distributed to airline passengers and respondents were requested to fill out the questionnaires in a self-administered manner. Of these, 610 questionnaires were returned. In all, 583 questionnaires were found to be useful, which represents a 78% response rate from the original sample of 400. The questionnaire was based on only service perceptions. There were 44 items in all-36 items for measuring service perception of perceived service quality (adopted from Bari et al., 2001) having 6-items for airline tangibles (ATANG), 12-items for terminal tangibles (TTANG), 8-items for personnel (PER), 7-items for empathy (EMP), and 3-items for image (IMG)-and also 3-items each for perceived service quality (PSQ) and customer satisfaction (CSAT), please see Table 2. A pilot test study was conducted with 100 customers. According to the results of the pilot study; two questions did not load to their underlying variables, specifically question seven from airport tangibles dimension about the ‘availability of wide range of newspaper selection’ and questions thirty-six from image dimension about the ‘price acceptability of the airline ticket prices’. Moreover, in the light of the results the instrument was reworded for measuring perceived service quality and customer satisfaction for national airline.
A five-point Likert scale (Likert, 1934) was used for data collection with ‘1’ being ‘strongly disagree’ and ‘5’ being ‘strongly agree’. The survey instrument was back-translated (Aulakh and Kotabe, 1993) for Turkish national customers. The survey instrument was applied in English to nationalities other than Turkish. SPSS 10.0 and LISREL 8.54 for windows were employed for the scale measurements. Descriptive analysis such as means, standard deviation and frequencies are calculated. Causal analyses are implied. Reliability issues are tested.
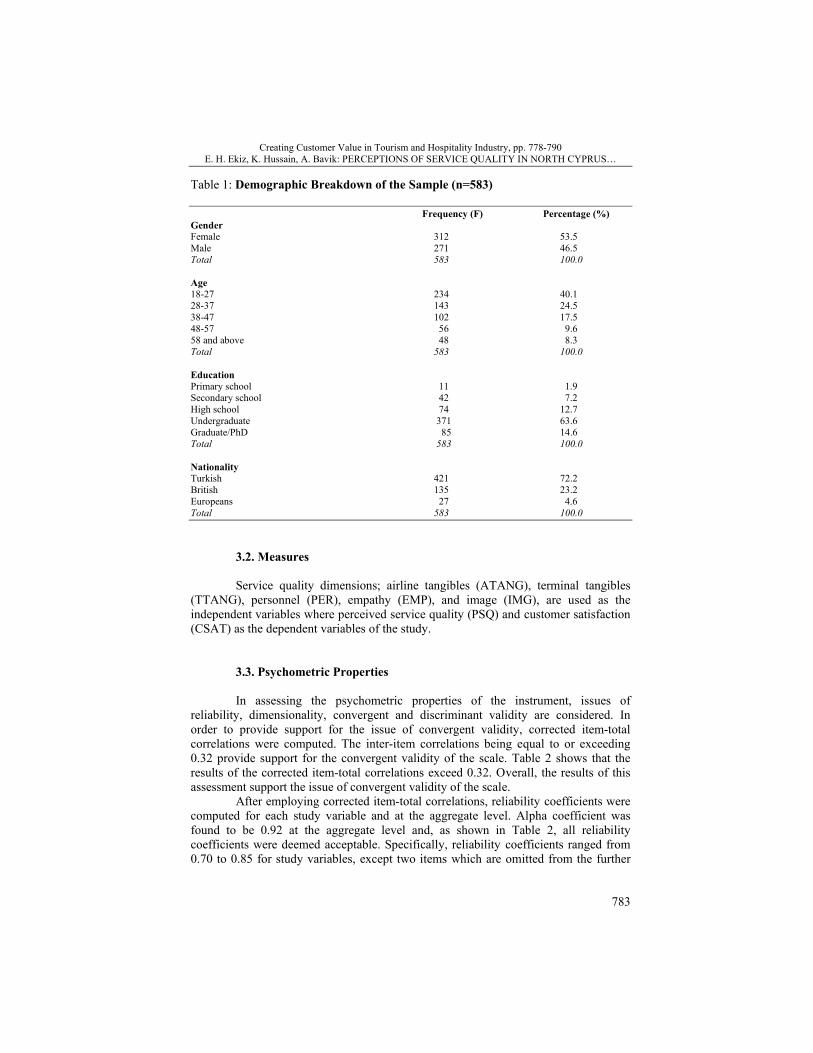
3. FINDINGS 3.1. The sample Demographic breakdown of the sample in Table 1 shows that 53.5% of the
respondents were females. As for the age distribution, the majority of respondents fall between the age group of “18-27” (40.1%), which proves that respondents in the sample are young in age. With respect to education, 63.6% of the respondents had formal tertiary education, defined as a minimum of an undergraduate degree. In terms of nationality 72.2% were Turkish, 23.2% were British and 4.6% were from various European countries (including Germany, Sweden, Finland, Scotland and Italy).
Creating Customer Value in Tourism and Hospitality Industry, pp. 778-790 E. H. Ekiz, K. Hussain, A. Bavik: PERCEPTIONS OF SERVICE QUALITY IN NORTH CYPRUS…
783
Table 1: Demographic Breakdown of the Sample (n=583)
Frequency (F) Percentage (%) Gender Female 312 53.5 Male 271 46.5 Total 583 100.0 Age 18-27 234 40.1 28-37 143 24.5 38-47 102 17.5 48-57 56 9.6 58 and above 48 8.3 Total 583 100.0 Education Primary school 11 1.9 Secondary school 42 7.2 High school 74 12.7 Undergraduate 371 63.6 Graduate/PhD 85 14.6 Total 583 100.0 Nationality Turkish 421 72.2 British 135 23.2 Europeans 27 4.6 Total 583 100.0
3.2. Measures Service quality dimensions; airline tangibles (ATANG), terminal tangibles
(TTANG), personnel (PER), empathy (EMP), and image (IMG), are used as the independent variables where perceived service quality (PSQ) and customer satisfaction (CSAT) as the dependent variables of the study.
3.3. Psychometric Properties In assessing the psychometric properties of the instrument, issues of
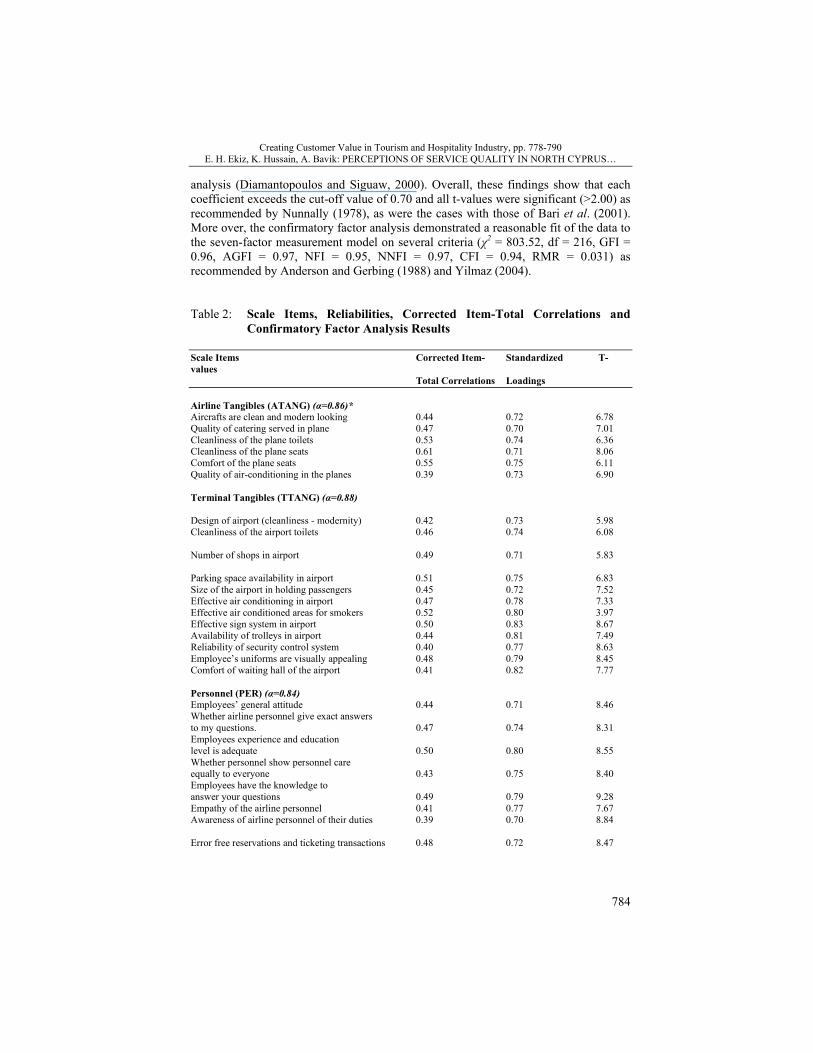
reliability, dimensionality, convergent and discriminant validity are considered. In order to provide support for the issue of convergent validity, corrected item-total correlations were computed. The inter-item correlations being equal to or exceeding 0.32 provide support for the convergent validity of the scale. Table 2 shows that the results of the corrected item-total correlations exceed 0.32. Overall, the results of this assessment support the issue of convergent validity of the scale.
After employing corrected item-total correlations, reliability coefficients were computed for each study variable and at the aggregate level. Alpha coefficient was found to be 0.92 at the aggregate level and, as shown in Table 2, all reliability coefficients were deemed acceptable. Specifically, reliability coefficients ranged from 0.70 to 0.85 for study variables, except two items which are omitted from the further
Creating Customer Value in Tourism and Hospitality Industry, pp. 778-790 E. H. Ekiz, K. Hussain, A. Bavik: PERCEPTIONS OF SERVICE QUALITY IN NORTH CYPRUS…
784
analysis (Diamantopoulos and Siguaw, 2000). Overall, these findings show that each coefficient exceeds the cut-off value of 0.70 and all t-values were significant (>2.00) as recommended by Nunnally (1978), as were the cases with those of Bari et al. (2001). More over, the confirmatory factor analysis demonstrated a reasonable fit of the data to the seven-factor measurement model on several criteria (χ2 = 803.52, df = 216, GFI = 0.96, AGFI = 0.97, NFI = 0.95, NNFI = 0.97, CFI = 0.94, RMR = 0.031) as recommended by Anderson and Gerbing (1988) and Yilmaz (2004). Table 2: Scale Items, Reliabilities, Corrected Item-Total Correlations and
Confirmatory Factor Analysis Results Scale Items Corrected Item- Standardized T-values Total Correlations Loadings Airline Tangibles (ATANG) (α=0.86)* Aircrafts are clean and modern looking 0.44 0.72 6.78 Quality of catering served in plane 0.47 0.70 7.01 Cleanliness of the plane toilets 0.53 0.74 6.36 Cleanliness of the plane seats 0.61 0.71 8.06 Comfort of the plane seats 0.55 0.75 6.11 Quality of air-conditioning in the planes 0.39 0.73 6.90 Terminal Tangibles (TTANG) (α=0.88) Design of airport (cleanliness - modernity) 0.42 0.73 5.98 Cleanliness of the airport toilets 0.46 0.74 6.08 Number of shops in airport 0.49 0.71 5.83 Parking space availability in airport 0.51 0.75 6.83 Size of the airport in holding passengers 0.45 0.72 7.52 Effective air conditioning in airport 0.47 0.78 7.33 Effective air conditioned areas for smokers 0.52 0.80 3.97 Effective sign system in airport 0.50 0.83 8.67 Availability of trolleys in airport 0.44 0.81 7.49 Reliability of security control system 0.40 0.77 8.63 Employee’s uniforms are visually appealing 0.48 0.79 8.45 Comfort of waiting hall of the airport 0.41 0.82 7.77 Personnel (PER) (α=0.84) Employees’ general attitude 0.44 0.71 8.46 Whether airline personnel give exact answers to my questions. 0.47 0.74 8.31 Employees experience and education level is adequate 0.50 0.80 8.55 Whether personnel show personnel care equally to everyone 0.43 0.75 8.40 Employees have the knowledge to answer your questions 0.49 0.79 9.28 Empathy of the airline personnel 0.41 0.77 7.67 Awareness of airline personnel of their duties 0.39 0.70 8.84 Error free reservations and ticketing transactions 0.48 0.72 8.47
Creating Customer Value in Tourism and Hospitality Industry, pp. 778-790 E. H. Ekiz, K. Hussain, A. Bavik: PERCEPTIONS OF SERVICE QUALITY IN NORTH CYPRUS…
785
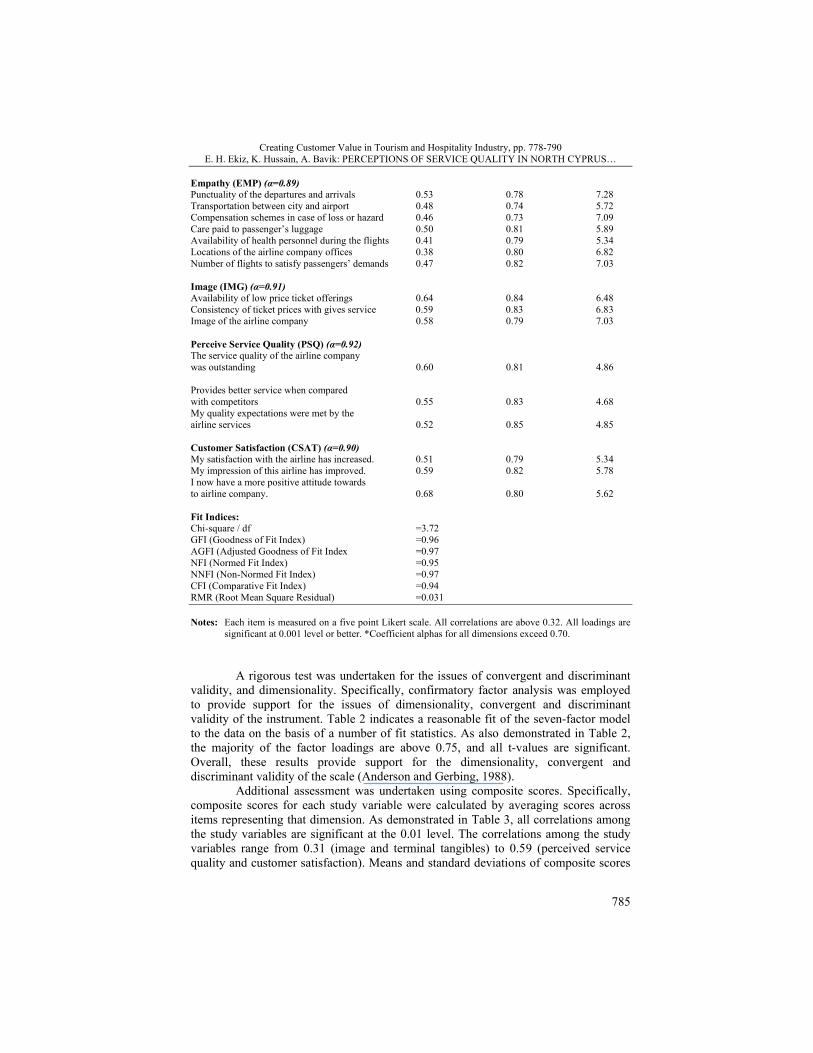
Empathy (EMP) (α=0.89) Punctuality of the departures and arrivals 0.53 0.78 7.28 Transportation between city and airport 0.48 0.74 5.72 Compensation schemes in case of loss or hazard 0.46 0.73 7.09 Care paid to passenger’s luggage 0.50 0.81 5.89 Availability of health personnel during the flights 0.41 0.79 5.34 Locations of the airline company offices 0.38 0.80 6.82 Number of flights to satisfy passengers’ demands 0.47 0.82 7.03 Image (IMG) (α=0.91) Availability of low price ticket offerings 0.64 0.84 6.48 Consistency of ticket prices with gives service 0.59 0.83 6.83 Image of the airline company 0.58 0.79 7.03 Perceive Service Quality (PSQ) (α=0.92) The service quality of the airline company was outstanding 0.60 0.81 4.86 Provides better service when compared with competitors 0.55 0.83 4.68 My quality expectations were met by the airline services 0.52 0.85 4.85 Customer Satisfaction (CSAT) (α=0.90) My satisfaction with the airline has increased. 0.51 0.79 5.34 My impression of this airline has improved. 0.59 0.82 5.78 I now have a more positive attitude towards to airline company. 0.68 0.80 5.62 Fit Indices: Chi-square / df =3.72 GFI (Goodness of Fit Index) =0.96 AGFI (Adjusted Goodness of Fit Index =0.97 NFI (Normed Fit Index) =0.95 NNFI (Non-Normed Fit Index) =0.97 CFI (Comparative Fit Index) =0.94 RMR (Root Mean Square Residual) =0.031 Notes: Each item is measured on a five point Likert scale. All correlations are above 0.32. All loadings are
significant at 0.001 level or better. *Coefficient alphas for all dimensions exceed 0.70.
A rigorous test was undertaken for the issues of convergent and discriminant validity, and dimensionality. Specifically, confirmatory factor analysis was employed to provide support for the issues of dimensionality, convergent and discriminant validity of the instrument. Table 2 indicates a reasonable fit of the seven-factor model to the data on the basis of a number of fit statistics. As also demonstrated in Table 2, the majority of the factor loadings are above 0.75, and all t-values are significant. Overall, these results provide support for the dimensionality, convergent and discriminant validity of the scale (Anderson and Gerbing, 1988).
Additional assessment was undertaken using composite scores. Specifically, composite scores for each study variable were calculated by averaging scores across items representing that dimension. As demonstrated in Table 3, all correlations among the study variables are significant at the 0.01 level. The correlations among the study variables range from 0.31 (image and terminal tangibles) to 0.59 (perceived service quality and customer satisfaction). Means and standard deviations of composite scores
Creating Customer Value in Tourism and Hospitality Industry, pp. 778-790 E. H. Ekiz, K. Hussain, A. Bavik: PERCEPTIONS OF SERVICE QUALITY IN NORTH CYPRUS…
786
of the study are also given in Table 3. Overall, these results provide additional support for the discriminant validity of the scale.
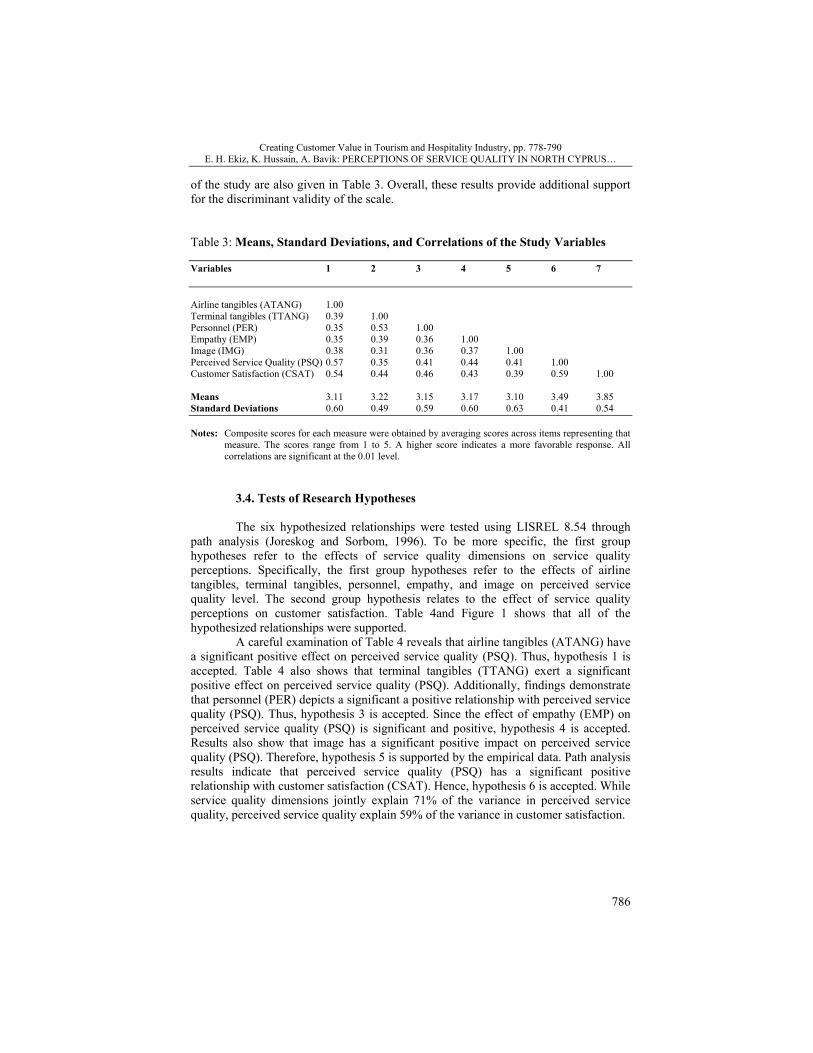
Table 3: Means, Standard Deviations, and Correlations of the Study Variables Variables 1 2 3 4 5 6 7 Airline tangibles (ATANG) 1.00 Terminal tangibles (TTANG) 0.39 1.00 Personnel (PER) 0.35 0.53 1.00 Empathy (EMP) 0.35 0.39 0.36 1.00 Image (IMG) 0.38 0.31 0.36 0.37 1.00 Perceived Service Quality (PSQ) 0.57 0.35 0.41 0.44 0.41 1.00 Customer Satisfaction (CSAT) 0.54 0.44 0.46 0.43 0.39 0.59 1.00 Means 3.11 3.22 3.15 3.17 3.10 3.49 3.85 Standard Deviations 0.60 0.49 0.59 0.60 0.63 0.41 0.54 Notes: Composite scores for each measure were obtained by averaging scores across items representing that
measure. The scores range from 1 to 5. A higher score indicates a more favorable response. All correlations are significant at the 0.01 level.
3.4. Tests of Research Hypotheses The six hypothesized relationships were tested using LISREL 8.54 through
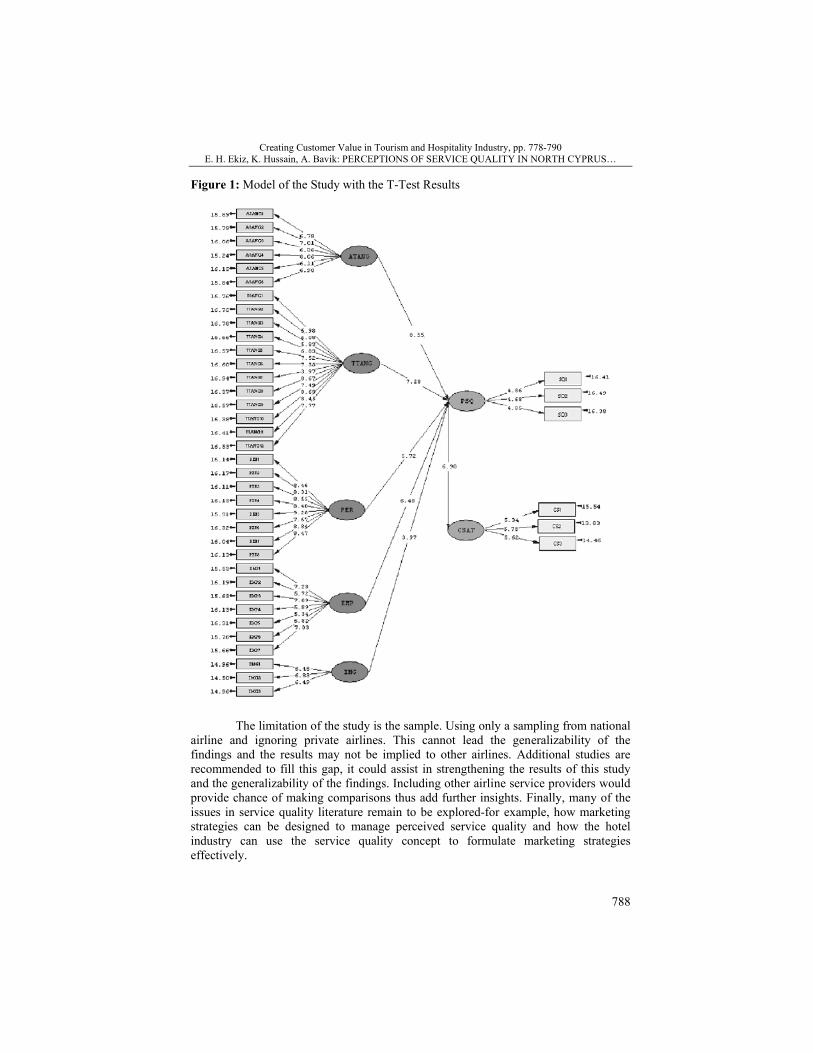
path analysis (Joreskog and Sorbom, 1996). To be more specific, the first group hypotheses refer to the effects of service quality dimensions on service quality perceptions. Specifically, the first group hypotheses refer to the effects of airline tangibles, terminal tangibles, personnel, empathy, and image on perceived service quality level. The second group hypothesis relates to the effect of service quality perceptions on customer satisfaction. Table 4and Figure 1 shows that all of the hypothesized relationships were supported.
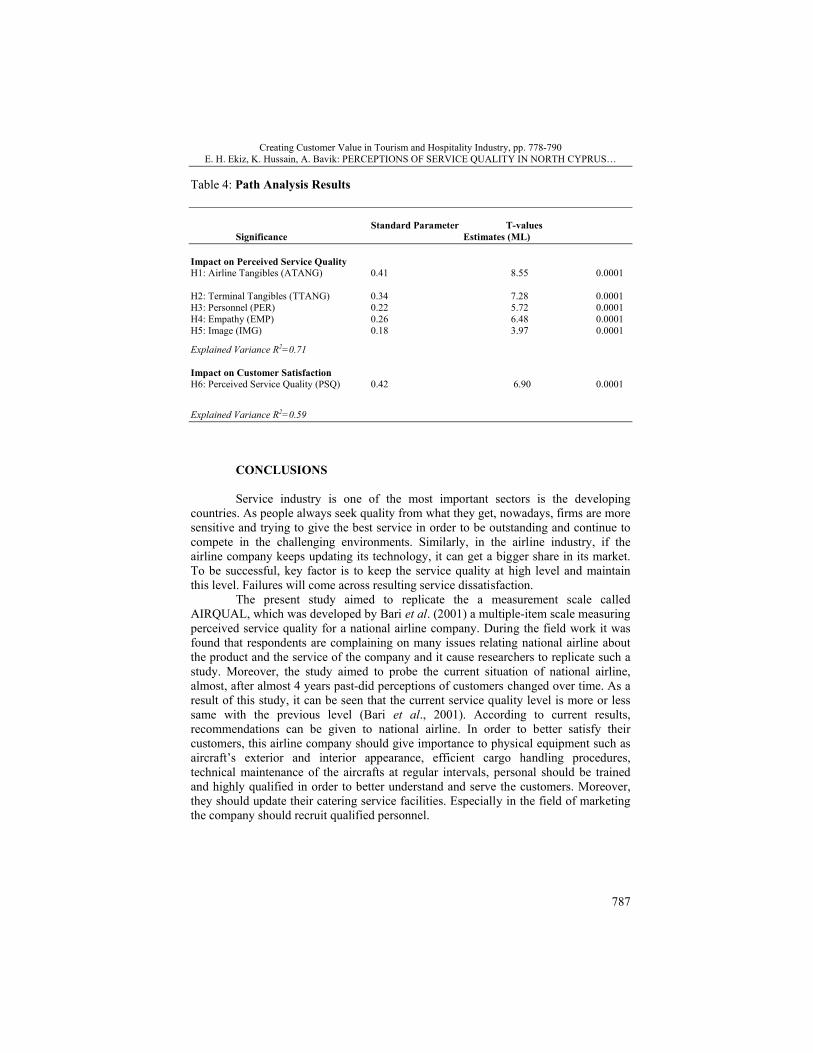
A careful examination of Table 4 reveals that airline tangibles (ATANG) have a significant positive effect on perceived service quality (PSQ). Thus, hypothesis 1 is accepted. Table 4 also shows that terminal tangibles (TTANG) exert a significant positive effect on perceived service quality (PSQ). Additionally, findings demonstrate that personnel (PER) depicts a significant a positive relationship with perceived service quality (PSQ). Thus, hypothesis 3 is accepted. Since the effect of empathy (EMP) on perceived service quality (PSQ) is significant and positive, hypothesis 4 is accepted. Results also show that image has a significant positive impact on perceived service quality (PSQ). Therefore, hypothesis 5 is supported by the empirical data. Path analysis results indicate that perceived service quality (PSQ) has a significant positive relationship with customer satisfaction (CSAT). Hence, hypothesis 6 is accepted. While service quality dimensions jointly explain 71% of the variance in perceived service quality, perceived service quality explain 59% of the variance in customer satisfaction.
Creating Customer Value in Tourism and Hospitality Industry, pp. 778-790 E. H. Ekiz, K. Hussain, A. Bavik: PERCEPTIONS OF SERVICE QUALITY IN NORTH CYPRUS…
787
Table 4: Path Analysis Results Standard Parameter T-values Significance Estimates (ML) Impact on Perceived Service Quality H1: Airline Tangibles (ATANG) 0.41 8.55 0.0001 H2: Terminal Tangibles (TTANG) 0.34 7.28 0.0001 H3: Personnel (PER) 0.22 5.72 0.0001 H4: Empathy (EMP) 0.26 6.48 0.0001 H5: Image (IMG) 0.18 3.97 0.0001
Explained Variance R2=0.71 Impact on Customer Satisfaction H6: Perceived Service Quality (PSQ) 0.42 6.90 0.0001
Explained Variance R2=0.59
CONCLUSIONS Service industry is one of the most important sectors is the developing
countries. As people always seek quality from what they get, nowadays, firms are more sensitive and trying to give the best service in order to be outstanding and continue to compete in the challenging environments. Similarly, in the airline industry, if the airline company keeps updating its technology, it can get a bigger share in its market. To be successful, key factor is to keep the service quality at high level and maintain this level. Failures will come across resulting service dissatisfaction.
The present study aimed to replicate the a measurement scale called AIRQUAL, which was developed by Bari et al. (2001) a multiple-item scale measuring perceived service quality for a national airline company. During the field work it was found that respondents are complaining on many issues relating national airline about the product and the service of the company and it cause researchers to replicate such a study. Moreover, the study aimed to probe the current situation of national airline, almost, after almost 4 years past-did perceptions of customers changed over time. As a result of this study, it can be seen that the current service quality level is more or less same with the previous level (Bari et al., 2001). According to current results, recommendations can be given to national airline. In order to better satisfy their customers, this airline company should give importance to physical equipment such as aircraft’s exterior and interior appearance, efficient cargo handling procedures, technical maintenance of the aircrafts at regular intervals, personal should be trained and highly qualified in order to better understand and serve the customers. Moreover, they should update their catering service facilities. Especially in the field of marketing the company should recruit qualified personnel.
Creating Customer Value in Tourism and Hospitality Industry, pp. 778-790 E. H. Ekiz, K. Hussain, A. Bavik: PERCEPTIONS OF SERVICE QUALITY IN NORTH CYPRUS…
788
Figure 1: Model of the Study with the T-Test Results
The limitation of the study is the sample. Using only a sampling from national
airline and ignoring private airlines. This cannot lead the generalizability of the findings and the results may not be implied to other airlines. Additional studies are recommended to fill this gap, it could assist in strengthening the results of this study and the generalizability of the findings. Including other airline service providers would provide chance of making comparisons thus add further insights. Finally, many of the issues in service quality literature remain to be explored-for example, how marketing strategies can be designed to manage perceived service quality and how the hotel industry can use the service quality concept to formulate marketing strategies effectively.
Creating Customer Value in Tourism and Hospitality Industry, pp. 778-790 E. H. Ekiz, K. Hussain, A. Bavik: PERCEPTIONS OF SERVICE QUALITY IN NORTH CYPRUS…
789
REFERENCES 1. Anderson, J. C., and Gerbing, D. W., “Structural Equation Modeling in Practice: A Review and
Recommended Two-step Approach”, Psychological Bulletin, Vol. 103, May, 1988, 411-423. 2. Angur, M. G., Nataraajan, R. and Jahera, Jr. J. S., “Service Quality in the Banking Industry: An
Assessment in a Developing Economy”, The Journal of Services Marketing, Vol. 13, 2, 1999, 132-150. 3. Aulakh, P. S. and Kotabe, M., “An Assessment of Theoretical and Methodological Developments in
International Marketing”, Journal of International Marketing, Vol. 1, 2, 1993, 5-28. 4. Avrikan, Necmi. K., “Quality Customer Service Demands Human Contact”, The International Journal
of Bank Marketing, Vol. 17, 2, 1999, 61-74. 5. Babakus, E. and Boller, G. W., “An Empirical Assessment of SERVQUAL Scale”, Journal of Business
Research, Vol. 24, 3, 1992, 253-268. 6. Babakus, E. and Mangold, G. W., “Adapting the SERVQUAL Scale to Hospital Services: An Empirical
Investigation”, Health Services Research, Vol. 26, 6, 1992, 767-86. 7. Bari, S., Bavik, A., Ekiz, H. E., Hussain, K. and Toner, S., “AIRQUAL: A Multiple-Item Scale for
Measuring Service Quality, Customer Satisfaction, and Repurchase Intention”, HOS-414 Graduation Project (Thesis), Gazimagusa: Eastern Mediterranean University, School of Tourism and Hospitality Management. 1992, 1-104.
8. Barsky, J. D. and Labagh, R., “A Strategy for Customer Satisfaction”, The Cornell Hotel and Restaurant Administration Quarterly, Vol. 35, 3, 1992, 32-40.
9. Carman, J. M., “Consumer Perceptions of Service Quality: An Assessment of the SERVQUAL Dimensions”, Journal of Retailing, Vol. 66, Spring, 1990, 33-5.
10. Churchill, G., “A Paradigm for Developing Better Measures of Marketing Constructs”, Journal of Marketing Research, Vol. 16, February, 1979, 64-73.
11. Cronin, J. J. and Taylor, S. A., “Measuring Service Quality: A Reexamination and Extension”, Journal of Marketing, Vol. 56, July, 1992, 55-68.
12. Cronin, J. J. and Taylor, S. A., “SERVPERF versus SERVQUAL: Reconciling Performance-Based and Perceptions-Minus-Expectations Measurement of Service Quality”, Journal of Marketing, Vol. 58, January, 1994, 125-131.
13. Diamantopoulos, A. and Siguaw, J. A., Introducing LISREL; A Guide for the Uninitiated, London: Sega Publication Inc., 2000.
14. Ekinci, Y., Prokopaki, P. and Cobanoglu, C., “Service Quality in Cretan Accommodations: Marketing Strategies for the UK Holiday Market”, International Journal of Hospitality Management, Vol. 22, 2003, 47-66.
15. Ennew, C. T., Reed, G. V. and Binks, M. R., “Importance-performance Analysis and the Measurement of Service Quality”, European Journal of Marketing, Vol. 27, 2, 1993, 59-70.
16. Fornell, C., “A National Customer Satisfaction Barometer: The Swedish Experience”, Journal of Marketing, Vol. 56, 1992, 6-21.
17. Halstead, D. and Page, T. J. Jr., “The Effects of Satisfaction and Complaining Behaviour on Consumers Repurchase Behavior”, Journal of Satisfaction, Dissatisfaction and Complaining Behavior, Vol 5, 1992, 1-11.
18. Hemmasi, M., Strong, K. and Taylor, S., “Measuring service quality for planning and analysis in service firms”, Journal of Applied Business Research, Vol. 10, 4, 1994, 24-34.
19. Johns, N., Avci T. and Karatepe, O. M., “Measuring Service Quality of Travel Agents: Evidence from Northern Cyprus”, The Service Industries Journal, Vol. 24, 3, 2004, 82-100
20. Joreskog, K. and Sorbom, D., LISREL 8: User’s Reference Guide, Chicago: Scientific Software International, Inc., 1996.
21. Judd, C. M., Smith, E. R. and Kidder, L. H., Research Methods in Social Relations, (6th ed.), Fort Worth, Holt: Rinehart and Winston, Inc., 1991.
22. Karatepe O. M. and Avci, T., “Measuring Service Quality in the Hotel Industry: Evidence from Northern Cyprus”, Anatolia: An International Journal of Tourism and Hospitality Research, Vol. 13, 1, 2002, 19-32.
23. Kozak, N., Karatepe, O. M. and Avci, T., “Measuring the Quality of Airline Services: Evidence From Northern Cyprus”, Tourism Analysis, Vol. 8, 2003, 75-87.
24. Legoherel, P., “Quality of Tourist Services; The Influence of each Participating Component on the Consumer’s Overall Satisfaction regarding Tourist Services during a Holiday”, Proceedings of the Third International Conference on Tourism and Hotel Industry in Indo-China and Southeast Asia: Development, Marketing and Sustainability, Thailand, 1998, 47-54.
25. Likert, R., “A Simple and Reliable Method of Scoring the Turnstone Attitude Scales”, Journal of Social Psychology, Vol. 5, 1934, 228.
Creating Customer Value in Tourism and Hospitality Industry, pp. 778-790 E. H. Ekiz, K. Hussain, A. Bavik: PERCEPTIONS OF SERVICE QUALITY IN NORTH CYPRUS…
790
26. Nadiri, H. and Hussain, K., “Diagnosing the Zone of Tolerance for Hotel Services”, Managing Service Quality, Vol. 15, 3, 2005, 259-277.
27. Newman, K., “Interrogating SERVQUAL: A Critical Assessment of Service Quality Measurement in a High Street Retail Bank”, International Journal of Bank Marketing, Vol. 19, 3, 2001, 126-139.
28. Nunnally, J. C., Psychometric theory, New York: McGraw-Hill Book Company, 1978. 29. Oliver, R. T., “A Conceptual Model of Service Quality and Service Satisfaction: Compatible Goals,
Different Concepts”, in Advances in Services Marketing and Management, Swartz, T. A., Bowen D. E. and Brown S. W. eds. Greenwich, CT: JAI Press, 1994, 65-85.
30. Parasuraman, A., Berry, L. L., & Zeithaml, V. A., “Refinement and Reassessment of the SERVQUAL Scale”, Journal of Retailing, Vol. 67, 4, Winter, 1991, 420-450.
31. Parasuraman, A., Zeithaml, V. A., Berry, L. L., “Reassessment of Expectations as a Comparison Standard in Measuring Service Quality: Implications for Future Research”, Journal of Marketing, Vol. 58, January, 1994, 111-124.
32. Parasuraman, A., Zeithaml, V. A., Berry, L. L., “A Conceptual Model of Service Quality and Its Implications for Future Research”, Journal of Marketing, Vol. 49, Fall, 1985, 41-50.
33. Parasuraman, A., Zeithaml V. A., Berry L. L., “SERVQUAL: A Multiple-Item Scale for Measuring Consumer Perceptions of Service Quality”, Journal of Retailing, Vol. 64, 1, Spring, 1988, 12-40.
34. Singh, J., “Consumer Complaint Intentions and Behavior: Definitional and Taxonomical Issues”, Journal of Marketing, Vol. 52, January, 1988, 93-107.
35. Smith, A. K., Bolton, R. N. and Wagner, J., “A Model of Customer Satisfaction with Service Encounters Involving Failure and Recovery”, Journal of Marketing Research, Vol. 36, August, 1999, 356-372.
36. Spreng, Richard A. and Mackoy, Robert D., “An Empirical Examination of a Model of Perceived Service Quality and Satisfaction”, Journal of Retailing. 72, 2, 1996, 201-215.
37. Stevens, P., Knutson, B. and Patton, M., “DINESERV: A Tool for Measuring Service Quality in Restaurants”, The Cornell Hotel and Restaurant Administration Quarterly, 1995, 56-60.
38. Sultan, F. and Simpson, M., “International service variants: airline passenger expectations and Perceptions of service quality”, Journal of Services Marketing, Vol. 14, 3, 2000, 188-216.
39. Teas, K. R., “Expectations as a Comparison Standard in Measuring Service Quality: An Assessment of a Reassessment”, Journal of Marketing, Vol. 58, January, 1994, 132-139.
40. Tourism and Planning Office, Statistical Yearbook of Tourism: Turkish Republic of Northern Cyprus, State Printing House, Nicosia, 2003.
41. Tourism and Planning Office, Statistical Yearbook of Tourism: Turkish Republic of Northern Cyprus, State Printing House, Nicosia, 2004, in press.
42. Yilmaz, V., “Lisrel ile Yapısal Eşitlik Modelleri: Tüketici Şikayetlerine Uygulanması”, Anadolu Üniversitesi Sosyal Bilimler Dergisi, Vol. 4, 1, 2004, 77-90.
43. Zeithaml, V. A. and Bitner M. J., Services Marketing: Integrating Customer Focus Across Firms, 2nd edn., Boston: McGraw-Hill, 2000.
Related Documents