Multisensory Research 27 (2014) 111–125 brill.com/msr Perception of Tactile Graphics: Embossings Versus Cutouts Amy Kalia 1,∗ , Rose Hopkins 2 , David Jin 1 , Lindsay Yazzolino 3 , Svena Verma 4 , Lotfi Merabet 3 , Flip Phillips 2 and Pawan Sinha 1 1 Department of Brain and Cognitive Sciences, Massachusetts Institute of Technology, 77 Massachusetts Avenue, Cambridge, MA 02139, USA 2 Department of Psychology, Skidmore College, Saratoga Springs, NY, USA 3 Massachusetts Eye and Ear Infirmary, Harvard Medical School, Boston, MA, USA 4 Acton Boxborough Regional High School, Acton, MA, USA Received 11 October 2013; accepted 13 June 2014 Abstract Graphical information, such as illustrations, graphs, and diagrams, are an essential complement to text for conveying knowledge about the world. Although graphics can be communicated well via the visual modality, conveying this information via touch has proven to be challenging. The lack of easily comprehensible tactile graphics poses a problem for the blind. In this paper, we advance a hy- pothesis for the limited effectiveness of tactile graphics. The hypothesis contends that conventional graphics that rely upon embossings on two-dimensional surfaces do not allow the deployment of tac- tile exploratory procedures that are crucial for assessing global shape. Besides potentially accounting for some of the shortcomings of current approaches, this hypothesis also serves a prescriptive pur- pose by suggesting a different strategy for conveying graphical information via touch, one based on cutouts. We describe experiments demonstrating the greater effectiveness of this approach for conveying shape and identity information. These results hold the potential for creating more compre- hensible tactile drawings for the visually impaired while also providing insights into shape estimation processes in the tactile modality. Keywords Shape, haptics, low vision, blindnesss, object recognition * To whom correspondence should be addressed. E-mail: [email protected] © Koninklijke Brill NV, Leiden, 2014 DOI:10.1163/22134808-00002450

Welcome message from author
This document is posted to help you gain knowledge. Please leave a comment to let me know what you think about it! Share it to your friends and learn new things together.
Transcript

Multisensory Research 27 (2014) 111–125 brill.com/msr
Perception of Tactile Graphics:Embossings Versus Cutouts
Amy Kalia 1,∗, Rose Hopkins 2, David Jin 1, Lindsay Yazzolino 3, Svena Verma 4,
Lotfi Merabet 3, Flip Phillips 2 and Pawan Sinha 1
1 Department of Brain and Cognitive Sciences, Massachusetts Institute of Technology,77 Massachusetts Avenue, Cambridge, MA 02139, USA
2 Department of Psychology, Skidmore College, Saratoga Springs, NY, USA3 Massachusetts Eye and Ear Infirmary, Harvard Medical School, Boston, MA, USA
4 Acton Boxborough Regional High School, Acton, MA, USA
Received 11 October 2013; accepted 13 June 2014
AbstractGraphical information, such as illustrations, graphs, and diagrams, are an essential complement totext for conveying knowledge about the world. Although graphics can be communicated well viathe visual modality, conveying this information via touch has proven to be challenging. The lack ofeasily comprehensible tactile graphics poses a problem for the blind. In this paper, we advance a hy-pothesis for the limited effectiveness of tactile graphics. The hypothesis contends that conventionalgraphics that rely upon embossings on two-dimensional surfaces do not allow the deployment of tac-tile exploratory procedures that are crucial for assessing global shape. Besides potentially accountingfor some of the shortcomings of current approaches, this hypothesis also serves a prescriptive pur-pose by suggesting a different strategy for conveying graphical information via touch, one basedon cutouts. We describe experiments demonstrating the greater effectiveness of this approach forconveying shape and identity information. These results hold the potential for creating more compre-hensible tactile drawings for the visually impaired while also providing insights into shape estimationprocesses in the tactile modality.
KeywordsShape, haptics, low vision, blindnesss, object recognition
* To whom correspondence should be addressed. E-mail: [email protected]
© Koninklijke Brill NV, Leiden, 2014 DOI:10.1163/22134808-00002450

112 A. Kalia et al. / Multisensory Research 27 (2014) 111–125
1. Introduction
“The more techniques we can develop to access visual information, the betteroff we will be, not just in science classes but in all areas of study.”
Dr Cary Supalo, Purdue University(Dr Supalo is blind and a prominent proponent ofdeveloping tools for enhancing access to science,math, and technology education for blind students.)
Visual graphics, such as illustrations, graphs, and diagrams, are an essentialcomplement to text for conveying information about the world. Blind individ-uals are disadvantaged by the lack of access to visual graphics, which is mostapparent in the realm of education. The National Science Foundation in theUnited States acknowledges that people with disabilities are underrepresentedin the fields of math and science compared to the general workforce (Ebert,2005). Because these fields make extensive use of visual graphics, they are es-pecially challenging for individuals with impaired vision. Therefore, makinggraphical information accessible to blind people would significantly increasetheir educational and career opportunities.
One method of creating accessible graphics for blind individuals is to con-vert them into two-dimensional tactile graphics. Tactile graphics are advanta-geous compared to verbal descriptions of graphics because they allow usersto actively explore the image. Consequently, tactile graphics are especiallyappealing for educational purposes in which students need to learn new infor-mation from a potentially complex image.
Although it seems that the translation of visual graphics into tactile imagesshould be straightforward, the rehabilitation and education communities find itquite challenging to provide effective tactile graphics to blind individuals. Thephysical conversion of visual into tactile graphics can be accomplished in avariety of ways. Graphics can be scanned and printed on Braille embossers orswell paper. An embossed template can be made on thin metal sheets and thepattern can then be transferred to plastic (thermoform). Even more straightfor-wardly, an instructor can trace the graphics by hand on to specialized tactiledrawing film. All of these superficially distinct techniques for creating tactilegraphics lead to a similar outcome — an embossed version of a visual linedrawing. Given the ease with which the visual line drawings can be recog-nized, one might expect that this recognizability would transfer to the tactilemodality as well. However, systematic experimental tests suggest otherwise.
Several researchers (Heller et al., 1996; Kalia and Sinha, 2011; Klatzky etal., 1993; Lederman et al., 1990; Loomis, 1981; Magee and Kennedy, 1980)have evaluated the recognizability of tactile drawings of common objects (suchas those in the Snodgrass and Vanderwart (1980) set shown in Fig. 1A).

A. Kalia et al. / Multisensory Research 27 (2014) 111–125 113
Figure 1. (A) Examples of line drawings of common objects used in studies of visual andtactile recognition. (B) Subjects’ drawings (lower row) of felt embossings (upper row) highlightinaccuracies in shape perception (Kalia and Sinha, 2011).
Whereas the drawings are trivially easy to recognize visually, average per-formance with their tactile counterparts (by blindfolded sighted individuals)drops to less than 35%. Performance of congenitally blind subjects on thesedrawings is comparable (Heller, 1989) or worse still (Heller et al., 1996; Led-erman et al., 1990). Evidently, simply creating an embossed version of a linedrawing is not sufficient to ensure its recognition via touch. What might be thesource of this difficulty?
1.1. Hypothesis
Results from our recent studies suggest that the difficulty in recognizingembossed tactile graphics is largely due to inaccurate perception of shape(Kalia and Sinha, 2011). Figure 1B illustrates this point. As their drawingsdemonstrate, even with extensive time for exploration (two minutes per tac-tile drawing), subjects are often unable to acquire accurate shape estimates ofthe embossed images. The poor recognition performance with tactile draw-ings could be a direct consequence of inaccurate shape perception. If this isthe case, then how might shape estimation of tactile drawings be improved?
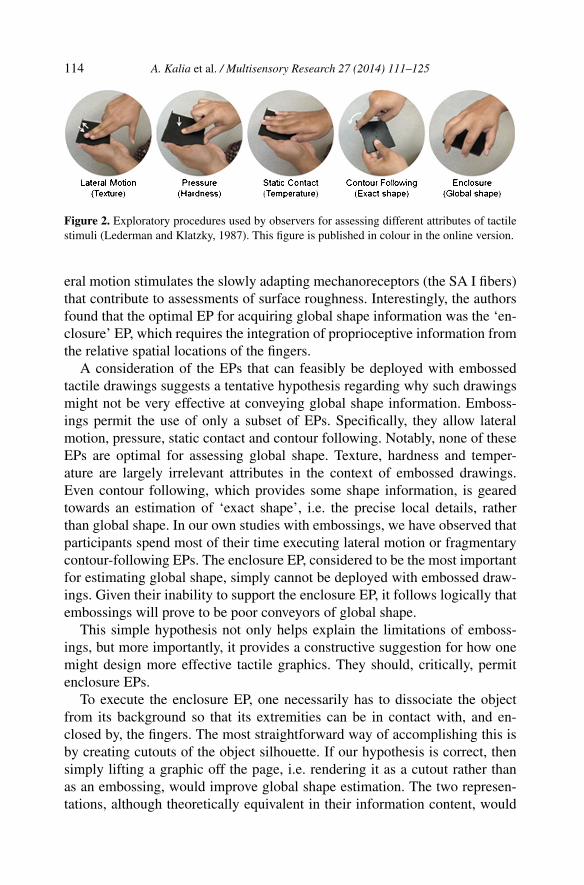
A possible answer may be found in the pioneering work on hand move-ments conducted by Lederman and Klatzky (1987). The researchers observedthat when people were required to extract specific object properties using onlytheir haptic sense, their hand movements fell into clear categories, which theycalled ‘exploratory procedures’ (EPs). Figure 2 shows the primary EPs thatLederman and Klatzky identified. Each EP was “defined by its invariant andtypical properties” and was used for a particular task not simply because itwas sufficient, but because it was optimal or necessary for acquiring the appro-priate knowledge about the object in hand. Tactile receptor distributions andresponse properties help explain the linkages between the EPs and the objectproperties they are best suited to assess (Johnson, 2002). For instance, lat-
114 A. Kalia et al. / Multisensory Research 27 (2014) 111–125
Figure 2. Exploratory procedures used by observers for assessing different attributes of tactilestimuli (Lederman and Klatzky, 1987). This figure is published in colour in the online version.
eral motion stimulates the slowly adapting mechanoreceptors (the SA I fibers)that contribute to assessments of surface roughness. Interestingly, the authorsfound that the optimal EP for acquiring global shape information was the ‘en-closure’ EP, which requires the integration of proprioceptive information fromthe relative spatial locations of the fingers.
A consideration of the EPs that can feasibly be deployed with embossedtactile drawings suggests a tentative hypothesis regarding why such drawingsmight not be very effective at conveying global shape information. Emboss-ings permit the use of only a subset of EPs. Specifically, they allow lateralmotion, pressure, static contact and contour following. Notably, none of theseEPs are optimal for assessing global shape. Texture, hardness and temper-ature are largely irrelevant attributes in the context of embossed drawings.Even contour following, which provides some shape information, is gearedtowards an estimation of ‘exact shape’, i.e. the precise local details, ratherthan global shape. In our own studies with embossings, we have observed thatparticipants spend most of their time executing lateral motion or fragmentarycontour-following EPs. The enclosure EP, considered to be the most importantfor estimating global shape, simply cannot be deployed with embossed draw-ings. Given their inability to support the enclosure EP, it follows logically thatembossings will prove to be poor conveyors of global shape.
This simple hypothesis not only helps explain the limitations of emboss-ings, but more importantly, it provides a constructive suggestion for how onemight design more effective tactile graphics. They should, critically, permitenclosure EPs.
To execute the enclosure EP, one necessarily has to dissociate the objectfrom its background so that its extremities can be in contact with, and en-closed by, the fingers. The most straightforward way of accomplishing this isby creating cutouts of the object silhouette. If our hypothesis is correct, thensimply lifting a graphic off the page, i.e. rendering it as a cutout rather thanas an embossing, would improve global shape estimation. The two represen-tations, although theoretically equivalent in their information content, would

A. Kalia et al. / Multisensory Research 27 (2014) 111–125 115
thus yield different levels of performance. This simple idea is the crux of thiswork.
Below we describe two experiments designed to test whether cutouts doindeed provide better shape estimates than the corresponding embossings. InExperiment 1, we tested tactile identification of cutout versus embossed depic-tions of familiar objects. In Experiment 2, we explored whether tactile shapeassessment improved with cutout versus embossed depictions of unfamiliarobjects.
2. Experiment 1
The goal of the first experiment was to assess relative efficacies of embossedand cutout depictions for recognition of familiar objects. This experimentbuilds on the results that have accumulated in the field of tactile object recog-nition. Several past studies have assessed recognition of embossed versions ofsimple line drawings, such as those in the Snodgrass and Vanderwart (1980)set. The typical finding has been that although the line drawings are triviallyeasy to recognize visually, tactile exploration of their embossed versions yieldsmuch lower performance. Would presenting these tactile stimuli as cutouts en-hance recognition performance? In this experiment, subjects were presentedwith cutout versions of object stimuli, and their recognition performance wascompared to recognition of embossed drawings reported previously (Kalia andSinha, 2011).
2.1. Method
2.1.1. StimuliOur stimulus set comprised cutout versions of 28 line drawings of commonobjects (Fig. 1A) obtained from the Snodgrass and Vanderwart (1980) set. Weselected images that we have previously used in tests of tactile embossingrecognizability (Kalia and Sinha, 2011). The cutout images were producedusing a 3D printer.
2.1.2. SubjectsThe subject pool comprised 21 normally sighted college students in the Bostonarea with a mean age of 20 years. All subjects were right-handed except forone. These subjects had not been tested with the embossed drawings in thestudy reported previously (Kalia and Sinha, 2011).
2.1.3. ProcedureEach subject was presented with all 28 cutout stimuli. The experimenter gavethe cutout stimuli to the subjects in the correct orientation. Subjects wereblindfolded during the experimental session and had two minutes to tactuallyexplore and recognize a given stimulus. They were asked to name the object

116 A. Kalia et al. / Multisensory Research 27 (2014) 111–125
verbally and were not provided any feedback. The experimenter recorded theirresponses and also the time elapsed between the start of the exploration andthe response.
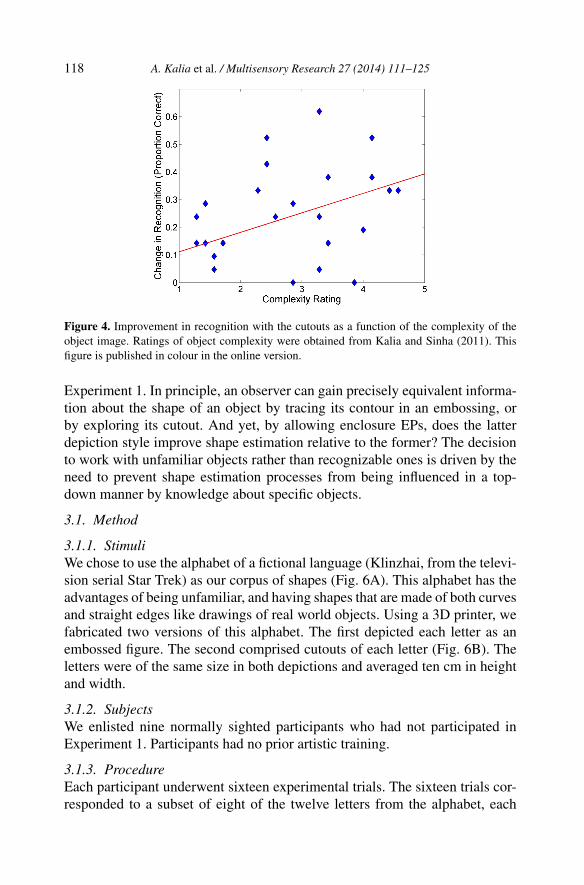
2.1.4. Data AnalysisWe compared recognition of the cutout objects to the recognition of embosseddrawings reported previously, and also the time taken to explore both typesof stimuli. We conducted a paired t-test across all 28 objects to determinewhether recognition accuracy and exploration time differed significantly be-tween the two types of depictions. Also, we correlated the difference in recog-nition between the cutouts and embossings with the complexity of the object,determined by the ratings of naïve observers described by Kalia and Sinha(2011). Observers rated object complexity (described as the level of detail inthe image) on a scale of 1 (low complexity) to 5 (high complexity); becauseratings of complexity by vision and touch were highly correlated (Kalia andSinha, 2011), we used the visual complexity ratings for our analyses. Accord-ing to our hypothesis, there should be a greater improvement in recognitionfor high complexity images when presented as cutouts versus embossings.
2.2. Results
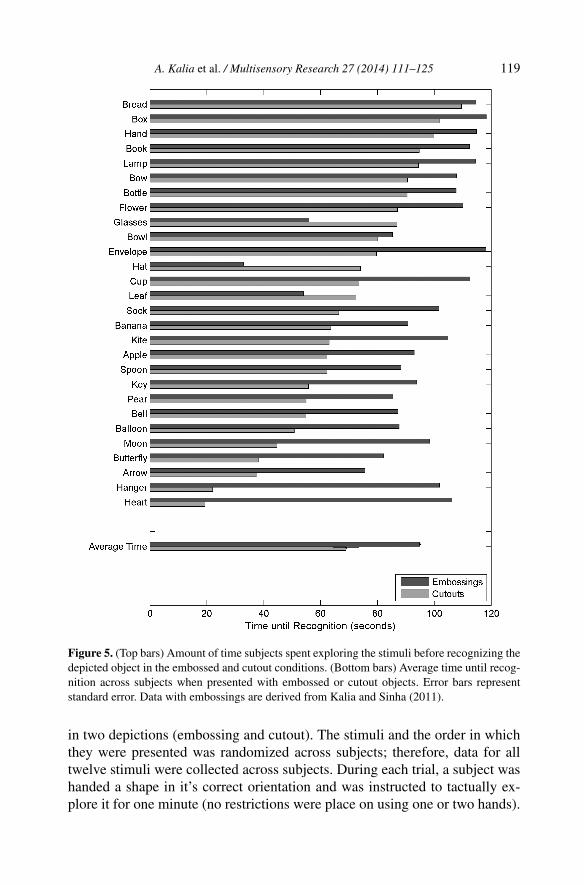
Our results reveal significantly higher recognition rates with cutouts comparedto embossings (Fig. 3). On average, subjects who were presented with thecutouts recognized a significantly greater number of objects compared to sub-jects who were presented with embossings [t (39) = 4.055, p < 0.001]. Anobject-by-object comparison also shows that the cutout versions of the objectswere recognized by more subjects compared to the embossed versions of theobjects [t (27) = 6.744, p < 0.001], although some objects show a greater im-provement in recognizability compared to other objects. This variability canbe partially accounted for by the complexity of the image; the improvement inrecognition for a particular object when presented as a cutout was significantlycorrelated with its complexity (Fig. 4, r = 0.437, p = 0.02). Furthermore, sub-jects spent significantly less time exploring the cutout objects compared to theembossings [t (27) = 5.042, p < 0.001; Fig. 5].
2.3. Discussion
These results indicate that presenting the same tactile images as cutouts ratherthan embossings significantly improves recognition of the depicted objects.The fact that the improvement in recognition is correlated with the complexityof the image suggests that the cutouts improve access to the global shape ofthe image. Better access to the global shape may also guide exploration oflocal shape with the fingertips, thereby allowing observers to better understanddetails in complex images. In Experiment 2, we further probed how perceptionof shape is altered when exploring cutouts versus embossings.

A. Kalia et al. / Multisensory Research 27 (2014) 111–125 117
Figure 3. (Top bars) Recognition performance (proportion of subjects who successfully recog-nized a given object) in the embossed condition and cutout condition. (Bottom bars) Averageperformance (proportion of objects correctly recognized) of subjects when presented with em-bossed or cutout objects. Error bars represent standard error. Data with embossings are derivedfrom Kalia and Sinha (2011).
3. Experiment 2
The goal of the second experiment was to determine whether cutout graphicsbetter enable subjects to perceive the shape of images via touch compared toembossings, thereby accounting for the improved recognition performance in
118 A. Kalia et al. / Multisensory Research 27 (2014) 111–125
Figure 4. Improvement in recognition with the cutouts as a function of the complexity of theobject image. Ratings of object complexity were obtained from Kalia and Sinha (2011). Thisfigure is published in colour in the online version.
Experiment 1. In principle, an observer can gain precisely equivalent informa-tion about the shape of an object by tracing its contour in an embossing, orby exploring its cutout. And yet, by allowing enclosure EPs, does the latterdepiction style improve shape estimation relative to the former? The decisionto work with unfamiliar objects rather than recognizable ones is driven by theneed to prevent shape estimation processes from being influenced in a top-down manner by knowledge about specific objects.
3.1. Method
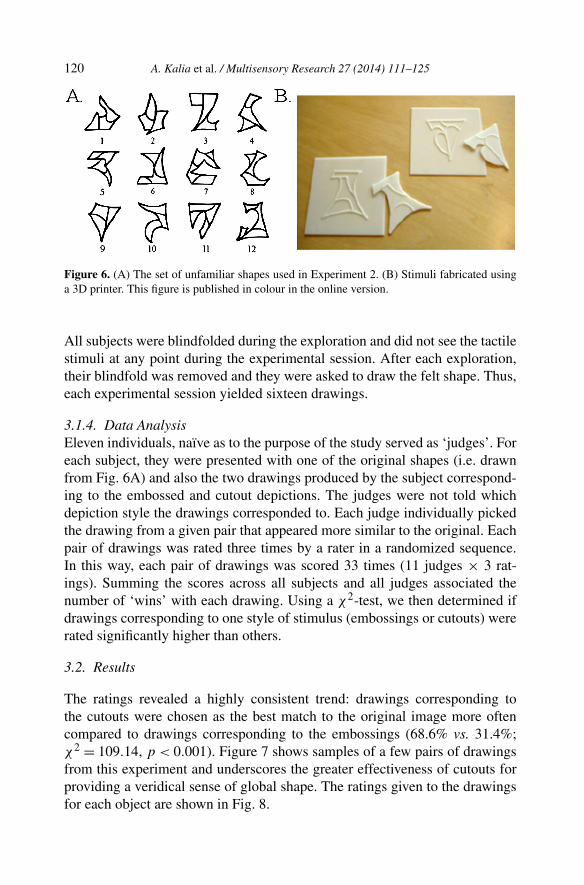
3.1.1. StimuliWe chose to use the alphabet of a fictional language (Klinzhai, from the televi-sion serial Star Trek) as our corpus of shapes (Fig. 6A). This alphabet has theadvantages of being unfamiliar, and having shapes that are made of both curvesand straight edges like drawings of real world objects. Using a 3D printer, wefabricated two versions of this alphabet. The first depicted each letter as anembossed figure. The second comprised cutouts of each letter (Fig. 6B). Theletters were of the same size in both depictions and averaged ten cm in heightand width.
3.1.2. SubjectsWe enlisted nine normally sighted participants who had not participated inExperiment 1. Participants had no prior artistic training.
3.1.3. ProcedureEach participant underwent sixteen experimental trials. The sixteen trials cor-responded to a subset of eight of the twelve letters from the alphabet, each
A. Kalia et al. / Multisensory Research 27 (2014) 111–125 119
Figure 5. (Top bars) Amount of time subjects spent exploring the stimuli before recognizing thedepicted object in the embossed and cutout conditions. (Bottom bars) Average time until recog-nition across subjects when presented with embossed or cutout objects. Error bars representstandard error. Data with embossings are derived from Kalia and Sinha (2011).
in two depictions (embossing and cutout). The stimuli and the order in whichthey were presented was randomized across subjects; therefore, data for alltwelve stimuli were collected across subjects. During each trial, a subject washanded a shape in it’s correct orientation and was instructed to tactually ex-plore it for one minute (no restrictions were place on using one or two hands).
120 A. Kalia et al. / Multisensory Research 27 (2014) 111–125
Figure 6. (A) The set of unfamiliar shapes used in Experiment 2. (B) Stimuli fabricated usinga 3D printer. This figure is published in colour in the online version.
All subjects were blindfolded during the exploration and did not see the tactilestimuli at any point during the experimental session. After each exploration,their blindfold was removed and they were asked to draw the felt shape. Thus,each experimental session yielded sixteen drawings.
3.1.4. Data AnalysisEleven individuals, naïve as to the purpose of the study served as ‘judges’. Foreach subject, they were presented with one of the original shapes (i.e. drawnfrom Fig. 6A) and also the two drawings produced by the subject correspond-ing to the embossed and cutout depictions. The judges were not told whichdepiction style the drawings corresponded to. Each judge individually pickedthe drawing from a given pair that appeared more similar to the original. Eachpair of drawings was rated three times by a rater in a randomized sequence.In this way, each pair of drawings was scored 33 times (11 judges × 3 rat-ings). Summing the scores across all subjects and all judges associated thenumber of ‘wins’ with each drawing. Using a χ2-test, we then determined ifdrawings corresponding to one style of stimulus (embossings or cutouts) wererated significantly higher than others.
3.2. Results
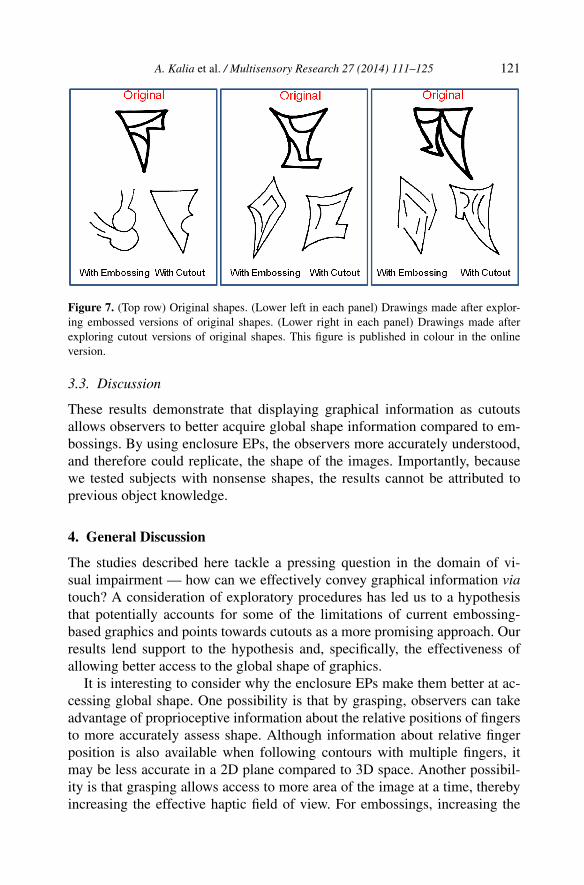
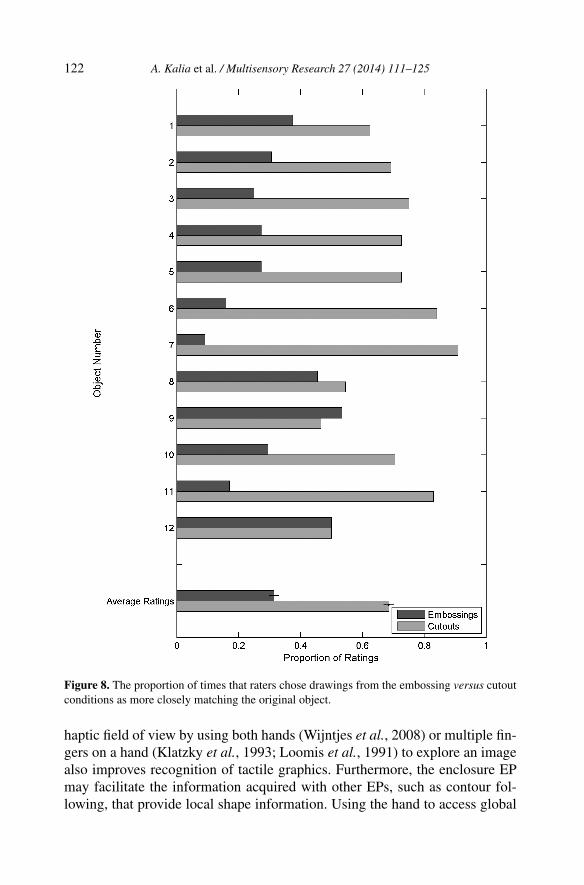
The ratings revealed a highly consistent trend: drawings corresponding tothe cutouts were chosen as the best match to the original image more oftencompared to drawings corresponding to the embossings (68.6% vs. 31.4%;χ2 = 109.14, p < 0.001). Figure 7 shows samples of a few pairs of drawingsfrom this experiment and underscores the greater effectiveness of cutouts forproviding a veridical sense of global shape. The ratings given to the drawingsfor each object are shown in Fig. 8.
A. Kalia et al. / Multisensory Research 27 (2014) 111–125 121
Figure 7. (Top row) Original shapes. (Lower left in each panel) Drawings made after explor-ing embossed versions of original shapes. (Lower right in each panel) Drawings made afterexploring cutout versions of original shapes. This figure is published in colour in the onlineversion.
3.3. Discussion
These results demonstrate that displaying graphical information as cutoutsallows observers to better acquire global shape information compared to em-bossings. By using enclosure EPs, the observers more accurately understood,and therefore could replicate, the shape of the images. Importantly, becausewe tested subjects with nonsense shapes, the results cannot be attributed toprevious object knowledge.
4. General Discussion
The studies described here tackle a pressing question in the domain of vi-sual impairment — how can we effectively convey graphical information viatouch? A consideration of exploratory procedures has led us to a hypothesisthat potentially accounts for some of the limitations of current embossing-based graphics and points towards cutouts as a more promising approach. Ourresults lend support to the hypothesis and, specifically, the effectiveness ofallowing better access to the global shape of graphics.
It is interesting to consider why the enclosure EPs make them better at ac-cessing global shape. One possibility is that by grasping, observers can takeadvantage of proprioceptive information about the relative positions of fingersto more accurately assess shape. Although information about relative fingerposition is also available when following contours with multiple fingers, itmay be less accurate in a 2D plane compared to 3D space. Another possibil-ity is that grasping allows access to more area of the image at a time, therebyincreasing the effective haptic field of view. For embossings, increasing the
122 A. Kalia et al. / Multisensory Research 27 (2014) 111–125
Figure 8. The proportion of times that raters chose drawings from the embossing versus cutoutconditions as more closely matching the original object.
haptic field of view by using both hands (Wijntjes et al., 2008) or multiple fin-gers on a hand (Klatzky et al., 1993; Loomis et al., 1991) to explore an imagealso improves recognition of tactile graphics. Furthermore, the enclosure EPmay facilitate the information acquired with other EPs, such as contour fol-lowing, that provide local shape information. Using the hand to access global

A. Kalia et al. / Multisensory Research 27 (2014) 111–125 123
shape information may provide a frame of reference to guide and contextual-ize local exploration with the fingertips, which may be especially helpful whenexploring more complex tactile graphics.
We must temper our enthusiasm for these findings with a few notes of cau-tion. First, we acknowledge that subjects could potentially have used otherexploration strategies instead of or in addition to the enclosure EP to explorethe stimuli. Observations during testing and a video recording of one subjectexploring a cutout object indicate that the lateral motion EP is used to explorethe internal lines with one hand while the object is grasped in the other hand.With embossings, lateral motion is used to explore both the internal and exter-nal contours of the image. Without video recordings of all subjects, we reliedon our observations during testing to confirm that subjects used enclosure EPsmore with the cutouts than with the embossings.
Secondly, the effectiveness of the cutout-based approach is likely depen-dent on the type of graphical information being displayed. The field wouldbe best served by knowing which approach is best suited for a given type ofgraphic. For instance, it is possible that one approach is better for conveyingmathematical graphs, while another is more effective for depicting real-worldobjects. The effectiveness of the approach may also depend on the availabilityof supplementary text descriptions of the graphic. We hope that future stud-ies will provide guidance regarding which approaches will be best suited forconveying a particular kind of graphical information. There are also logisticalchallenges with creating cutout graphics and providing ways for blind usersto explore them without assistance. For instance, blind users would need amethod to determine the correct orientation of the cutout, perhaps with anadditional tactile marker. Such issues should be solvable, especially as 3Dprinters are becoming more easily available.
Furthermore, these studies need to be replicated with blind individuals. Pre-vious literature has been mixed regarding whether blind and sighted individ-uals differ in haptic shape perception and recognition of tactile graphics. Forinstance, while there is some evidence (Theurel et al., 2013) that greater ex-perience with tactile graphics improves haptic recognition performance (sug-gesting that blind individuals should perform better on the task than sightedindividuals), there are other reports showing that late-blind individuals are bet-ter at recognizing embossed tactile graphics compared to congenitally blindpeople, arguing that previous visual experience may aid recognition (Heller,1989). A promising avenue for further research is to examine the relativeperformance of blindfolded sighted and blind individuals on shape estima-tion with cutouts and embossed depictions. Preliminary data that we collectedfrom two congenitally blind subjects (Supplementary Table S1), who ‘drew’the haptically felt shapes using bendable sticks, are consistent with the resultsfrom the blindfolded sighted subjects (Supplementary Fig. S1); reproductions

124 A. Kalia et al. / Multisensory Research 27 (2014) 111–125
corresponding to the cutouts were chosen as the best match to the original im-age more often compared to reproductions corresponding to the embossings(61.8% vs. 38.2%; χ2 = 5.65, p = 0.017; see online Supplementary Materialfor a description of the procedure).
Finally, we need to titrate out other ways in which cutouts make it eas-ier to access shape information besides allowing the use of enclosure EPs.The cutout graphics make it easier to distinguish between internal and ex-ternal contours, and to segment the inside of the figure from the backgroundcompared to the embossings. It has been found previously that clearly dis-tinguishing the inside from the outside of the shape, by filling the inside ofan embossed shape with texture, improves recognition of the depicted object(Thompson et al., 2003). Therefore, this difference between cutouts and em-bossings could be responsible for improving shape acquisition with the cutoutsrather than the ability to use the enclosure EP. Preliminary data from two addi-tional congenitally blind subjects (Supplementary Table S1) show that addinga textured background to an embossing does not improve their global shapeunderstanding; reproductions made after exploring embossings without a tex-tured background were more often chosen to more closely match the originalimage compared to reproductions that followed exploration of embossingswith a textured background (62.7% vs. 37.3%; χ2 = 6.63, p = 0.010; seeonline Supplementary Material for a description of the procedure). Althoughwe only tested a small sample, these results likely differ from Thompson et al.(2003) because: (1) we assessed global shape acquisition rather than recogni-tion of the images, and (2) we tested congenitally blind subjects who may beable to better separate the interior of the shape from the background. Furtherstudies with more subjects are required to determine whether these types ofembossings result in similar perceptual benefits as cutouts.
Taken together, results from these studies point the way towards the designof tactile graphics that can better convey the content they are intended to. Inorder to best serve the interests of the community of visually impaired indi-viduals, it is imperative that we examine whether currently used approachesare able to adequately convey graphical information via the tactile modality. Ifthese approaches are found to have any shortcomings, then we need to under-stand the factors underlying their limitations. Such understanding would be aprecursor to devising new approaches that can more effectively convey graphi-cal information. Improving tactile graphics would translate to the developmentof better educational material and improved access to scholastic avenues, es-pecially those related to science, mathematics, and technology subjects, forvisually impaired children and adults.

A. Kalia et al. / Multisensory Research 27 (2014) 111–125 125
Acknowledgements
This study was supported by grants from the James McDonnell Foundation(PS) and the National Eye Institute (F32EY019622 to AK, R01EY020517to PS).
References
Ebert, J. (2005). Scientists with disabilities: Access all areas, Nature 435, 552–554.Heller, M. A. (1989). Picture and pattern perception in the sighted and the blind: The advantage
of the late blind, Perception 18, 379–389.Heller, M. A., Calcaterra, J. A., Burson, L. L. and Tyler, L. A. (1996). Tactual picture identi-
fication by blind and sighted people: Effects of providing categorical information, Percept.Psychophys. 58, 310–323.
Johnson, K. O. (2002). Neural basis of haptic perception, in: Stevens Handbook of ExperimentalPsychology, H. Pashler and S. Yantis (Eds), 3rd edn., Vol. 1, Sensation and Perception,pp. 537–583. Wiley, New York, NY, USA.
Kalia, A. A. and Sinha, P. (2011). Tactile picture recognition: Errors are in shape acquisition orobject matching? Seeing Perceiving 25, 287–302.
Klatzky, R. L., Loomis, J. M., Lederman, S. J., Wake, H. and Fujita, N. (1993). Haptic identifi-cation of objects and their depictions, Percept. Psychophys. 54, 170–178.
Lederman, S. J. and Klatzky, R. L. (1987). Hand movements: A window into haptic objectrecognition, Cogn. Psychol. 19, 342–368.
Lederman, S. J., Klatzky, R. L., Chataway, C. and Summers, C. D. (1990). Visual mediation andthe haptic recognition of two-dimensional pictures of common objects, Percept. Psychophys.47, 54–64.
Loomis, J. M. (1981). Tactile pattern perception, Perception 10, 5–27.Loomis, J. M., Klatzky, R. L. and Lederman, S. J. (1991). Similarity of tactual and visual picture
recognition with limited field of view, Perception 20, 167–177.Magee, L. E. and Kennedy, J. M. (1980). Exploring pictures tactually, Nature 283, 287–288.Snodgrass, J. G. and Vanderwart, M. (1980). A standardized set of 260 pictures: Norms for
name agreement, image agreement, familiarity, and visual complexity, J. Exp. Psychol. Hum.Learn. 6, 174–215.
Theurel, A., Witt, A., Claudet, P., Hatwell, Y. and Gentaz, E. (2013). Tactile picture recognitionby early blind children: The effect of illustration technique, J. Exp. Psychol. Appl. 19, 233–240.
Thompson, L. J., Chronicle, E. P. and Collins, A. F. (2003). The role of pictorial convenction inhaptic picture perception, Perception 32, 887–893.
Wijntjes, M. W. A., van Lienen, T., Verstijnen, I. M. and Kappers, A. M. L. (2008). Look what Ihave felt: Unidentified haptic line drawings are identified after sketching, Acta Psychol. 128,255–263.
Related Documents