PERCEPTION OF SERVICE QUALITY: A CASE OF JOMO KENYATTA INTERNATIONAL AIRPORT By: Gituanja E. W. D61/P/7813/99 fWLVOF*rFrtIF 'NAIRO& AOCT«= I ! » » * » * • Supervised By: Catherine Ngahu A management research project submitted in partial fulfillment of the requirement for the award of the Degree in Master of Business and Administration, School of Business, University of Nairobi Date: 21 August 2006 University of NAIROBI Library

Welcome message from author
This document is posted to help you gain knowledge. Please leave a comment to let me know what you think about it! Share it to your friends and learn new things together.
Transcript

PERCEPTION OF SERVICE QUALITY: A CASE OF JOMO KENYATTA
INTERNATIONAL AIRPORT
By:
Gituanja E. W.
D 61/P /7813/99
fWLVOF*rFrtIF 'NAIRO&AOCT«= I !» » * » * •
Supervised By:
Catherine Ngahu
A management research project submitted in partial fulfillment of the requirement for the award of
the Degree in Master of Business and Administration, School of Business, University of Nairobi
Date: 21 August 2006
University of NAIROBI Library

DECLARATION:
This management project is my original work and has not been presented for a degree in any other
University.
Signed:t u
Date:
Gituanja E. W.
D6 l/P/7813/99
This management project has been submitted for examination with my approval as University
supervisor.
Department of Business Administration
University of Nairobi
Date:

DEDICATION
To my late father Peter Gituanja and my loving mother Margaret Wanjiru and all my sisters and
brothers.
Special dedication to my mum who always encouraged me to study in order to be a better person in
life and be able to meet all challenges. Thank you so much mum.

ACKNOWLEDGEMENT
Special thanks to my supervisor senior lecturer Ngahu Catherine for the guidance she gave me when
writing this project.
Special thanks to all my friends and colleagues for their input throughout the course period. Sincere
gratitude to my parents, brothers and sisters for their selfless dedication in ensuring that I received the
best possible education.
To Mr. Michael Mulwa who provided transport from JKIA to University of Nairobi in order to ensure
I complete the course. He also gave me his Lap top computer to use while typing this project.
To my sister Ann Mukoma for ensuring the project is printed in her office.
To my niece Jaclyn Wangari and nephew Roy Mwangi for their immense love, patience, co-operation
and dedication to my education and we would always do homework together.
Special thanks to Mr. Joseph Methu, corporate office of Kenya Airports Authority from whom I
leamt a lot on modalities of analyzing questionnaire.
Last but not least, my gratitude goes to Mama Ken who provided me with internet facilities in her
house throughout the project research. Special thanks to her family for accommodating me in their
house.
May almighty God bless them all.
IV

Table of ContentsDeclaration .................................................................................................................. iiDedication .................................................................. ;............................................. iiiAcknowledgement.................................................................................................................ivList Of Figures ................................................................................................................ viiList of Diagrams ................................................................................................................viiList of Tables ............................................................................................................... viiiAbstract ix
CHAPTER ONE: INTRODUCTION................................................................................... 11.1 Background................................................................................................................... 1
1.1.1 Overview of Recent Development Trends in the Aviation Industry......................11.1.2 Quality Of Service and Operational Performance Indicators.............................. 2
1.2 Jomo Kenyatta International Airport (JKIA)................................................................. 31.3 Statement Of The Problem........................................................................................... 41.4 Objectives of the Study................................................................................................ 61.5 Importance of the study................................................................................................ 61.6 Concepts and Terms.....................................................................................................6
CHAPTER TWO: LITERATURE REVIEW.........................................................................82.1 The Nature of Services................................................................................................. 82.2 Characteristics of services.............................................................................................8
2.2.1 Intangibility..........................................................................................................82.2.2 Inseparability.......................................................................................................92.2.3 Variability............................................................................................................92.2.4 Perish ability........................................................................................................9
2.3 Service Quality............................................................................................................102.3.1 Dimensions of Service Quality...........................................................................112.3.2 Customer Perception of Quality........................................................................ 122.3.3 Satisfying Customer Preferences........................................................................122.3.4 Perception Value and Expectations.................................................................... 13
2.4. The Gap Theory..........................................................................................................152.5 Measuring Service Quality..........................................................................................17
2.5.1 Discontinuation models.....................................................................................182.5.2 Perception models..............................................................................................192.5.3 Weighted versus Unweighted Models................................................................202.5.4 Dimensions of Service Quality.......................................................................... 222.5.6 Difficult challenges............................................................................................ 23
2.6 Customer Satisfaction and Service Quality at Jomo Kenyatta International Airport.... 24
CHAPTER THREE: RESEARCH METHODOLOGY....................................................... 263.1 Research Design................................ 263.2 Population...................................................................................................................263.3 Sample design............................................................................................................ 263.4 Sample size.................................................................................................................263.5 Data Collection Method..............................................................................................263.6 Data Analysis Method................................................................................................ 27

CHAPTER FOUR: DATA PRESENTATION AND ANALYSIS.......................................284.1 Introduction................................................................................................................ 284.2 Summary of General Information (Part 1 of the questionnaire)...................................284.3 Customer’s expectations regarding each of the service quality dimensions................. 294.4 Customer’s perception of service quality dimensions along the airport services center344.5 Customer perception of customer care and waiting time at the airlines desk............... 404.6 Customer perception of customer care and waiting time at the security desk..............414.7 Customer perception of customer care and waiting time at the immigration desk......434.8 Customer perception of customer care and waiting time at the Customs desk............. 44
CHAPTER FIVE: CONCLUSIONS AND RECOMMENDATIONS.................................475.1 Introduction................................................................................................................ 475.2 Summary of Findings................................................................................................. 475.3 Limitations of the Research........................................................................................ 495.4 Recommendations for further research....................................................................... 495.5 Overall Conclusion..................................................................................................... 49
References .................................................................................................................50Appendix One: Introduction Letter......................................................................................... IAppendix Two Questionnaire................................................................................................II

LIST OF FIGURES
Figure 1: Determinants of Perceived Service Quality---------------------------------------------- 14
Figure 2: Service Quality Model----------------------------------------------------------------------- 16
LIST OF DIAGRAMS
Diagram 4.3.1: Customer Expectation: Importance of Airport Cleanliness--------------- -------- 30Diagram 4.3.2 Customer Expectation: Importance of Signage------------- ------------ ---- ------ 30
Diagram 4.3.3: Customer Expectation: Importance of Availability of Business Centre---------31Diagram 4.3.4: Customer Expectation: Importance Lounge Comfort-------- --------------------- 31
Diagram 4.3.5: Customer Expectation: Importance of Transport to and from Airport.... .........32Diagram 4.3.6: Customer Expectation: Importance of Banking Services................ 32
Diagram 4.3.7: Customer Expectation: Importance of Customer Care Services----------------- 33
Diagram 4.3.8: Customer Expectation: Waiting Time to Receive Services----------- 33Diagram 4.4.1: Customer Perception: Rating of Airport Cleanliness------ ----- —..........—....... 34
Diagram 4.4.2: Customer Perception: Rating of Airport Signage---------------- 35
Diagram 4.4.3: Customer Perception: Rating of Airport Business Centre------------------ 36Diagram 4.4.4: Customer Perception: Airport lounge comfort-------------- ------- ---------------36Diagram 4.4.5: Customer Perception: Rating of Airport transport to and from airport — .........37
Diagram 4.4.6: Customer Perception: Airport banking services----------------------------- 38Diagram 4.4.7: Customer Perception: Airport customer care services............... 38Diagram 4.4.8 Customer Perception: Airport waiting time to receive services--------- ----- — 39
Diagram 4.4.9: Perceived-Expected Service Gap- General Airport Services-------- ---- —...... -40
Diagram 4.5.1: Customer Perception: Airlines customer care services---------------------------- 40Diagram 4.5.2: Customer Perception: Airlines waiting time to receive services--------- -41
Diagram 4.6.1: Customer Perception: Security customer care services.............. 42Diagram 4.6.2: Customer Perception: Security waiting time to receive services -........—...........42
Diagram 4.7.1: Customer Perception: Immigration customer care services............ 43Diagram 4.7.2: Customer Perception: Immigration waiting time to receive services................ 44
Diagram 4.8.1: Customer Perception: Customs customer care services......................... ....... —44Diagram 4.8.2: Customer Perception: Customs waiting time to receive services--------- 45Diagram 4.8.3: Perceived -Expected Service Gap- Specific Service Providers/Services-.........-46

LIST OF TABLES
Table 4.2.1: Distribution of Respondents by Gender......... .................-.................................28Table 4.2.2: Distribution of Respondents by Visits- First time users vs. Multi-users-----------28Table 4.2.3: Distribution of Respondents by Frequent Users..................-................... -........ 28Table 4.2.4: Respondents by Age Bracket........................................................ ..................29Table 4.2.5: Respondents by Level of Education.......................................... -....... -.............29Table 4.3.1: Customer Expectation: Importance of Airport Cleanliness..................................29Table 4.3.2: Customers Expectation: Importance of Airport Signage.................................... 30Table 4.3.3: Customer Expectation: Importance of Availability of Business Centre-.— 30Table 4.3.4: Customer Expectation: Importance of Lounge Comfort— ...... 31Table 4.3.5: Customer Expectation: Importance of Transport to and from Airport..— 31Table 4.3.6: Customer Expectation: Importance of Banking Services.......................... 32Table 4.3.7: Customer Expectation: Importance of Customer Care Services..........— 32Table 4.3.8: Customer Expectation: Importance of Waiting Time to Receive Services -......... 33Table 4.3.9: Customer expectation: Mean Score of Key Variables. Descriptive Statistics------34Table 4.4.1: Customer Perceptions: Airport Cleanliness-................................................ 34Table 4.4.2: Customer Perception: Airport Signage.......-.............................. -......................35Table 4.4.3: Customer Perception: Airport business centre availability.....— ................. 35Table 4.4.4: Customer Perception: Airport lounge comfort..................... -.......-................... 36Table 4.4.5: Customer Perception: Airport transport to and from airport---------- -..........— 37Table 4.4.6: Customer Perception: Airport banking services........... -.....................—............37Table 4.4.7: Customer Perception: Airport customer care services..................................— 38Table 4.4.8: Customer Perception: Airport waiting time to receive services--------------------39Table 4.4.9: Customer Perceptions Mean Score of Key Variables for General Airport
Services. Descriptive Statistics-.............. -....... -................-........................ -......39Table 4.5.1: Customer Perception: Airlines customer care services..... ........................... 40Table 4.5.2: Customer Perception: Airlines waiting time to receive services.................... 41Table 4.6.1: Customer Perception: Security customer care services..... -......... -................... 41Table 4.6.2: Customer Perception: Security waiting time to receive services.............-.......—42Table 4.7.1: Customer Perception: Immigration customer care services............................... 43Table 4.7.2: Customer Perception: Immigration waiting time to receive services..................43Table 4.8.1: Customer Perception: Customs customer care services.............................. — 44Table 4.8.2: Customer Perception: Customs waiting time to receive services........................ 45Table 4.8.3: Customer Perceptions Mean Score of Key Variables for Specific Services/
Providers. Descriptive Statistics -..................... .................................... ............64

ABSTRACT
This study looked at the issue of service quality delivery at Jomo Kenyatta International Airport as
perceived by airline passengers using the airport.. The study had two objectives, namely:
1. To determine the level of service quality as perceived by airline passengers at JKIA.
2. To establish challenges the Kenya Airports Authority faces in order to ensure high quality
service delivery to airline passengers using Jomo Kenyatta International Airport.
The researcher examined the SERVQUAL model as developed by Parasuraman, Zeithaml, and Berry
in 1985 (Figure 2, page 16). The conceptual framework they developed helped to elucidate the
various gaps that can exist in the service delivery process. GAP 5, which is the gap between the
customer’s expectations and perceived service quality, was the main theme of interest in this research
(as explained in Figure 1, page 14). The review also looked at other paradigms that have been
developed in the area of service quality measurement.
A survey research design was used. The population of interest was seen to be composed of airline
passengers using the J. K. I. A. airport. A convenient sample size of 90 passengers was randomly
selected on the basis of whether they were arrivals, transit and departures, with 30 respondents for
each category. The research instrument was a questionnaire that consisted of open-ended questions,
closed-ended questions and five-point Likert scales.
Data analysis using descriptive statistics that involved measures of central tendency, measures of
spread and graphical methods was used. The simple disconfirmation model as originally elucidated
by Parasuraman et al. (1985) was adopted This model looked at perceived service quality (Q) as
being the difference between perceived service (P) and expected service (E) or Q=P-E.
A negative value of P-E was observed for all the eight variables under investigation. This was due to
congestion, too many regulators who are poorly trained in customer service, old and plastic passenger
seats, poor toilet infrastructure, congested departure lounge, cumbersome procurement procedures,
poorly scheduled airline arrival and departures, too many taxi and tour operators and inefficient
complaint handling were noted.
IX
CHAPTER ONE
1.0 INTRODUCTION
1.1 BACKGROUND
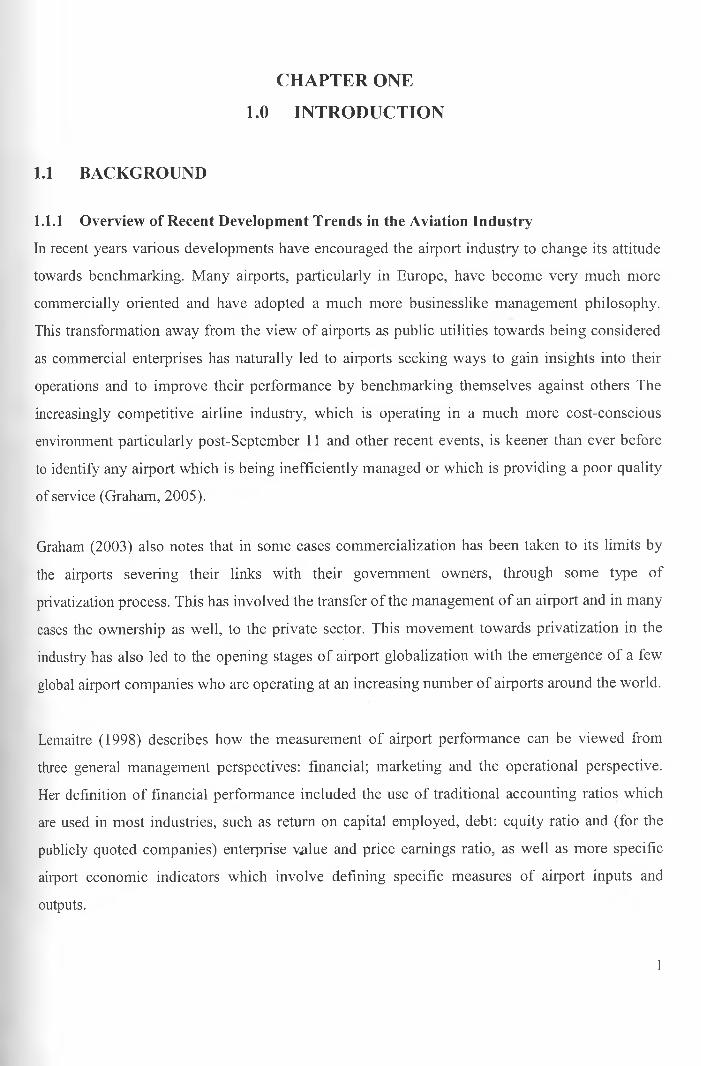
1.1.1 Overview of Recent Development Trends in the Aviation Industry
In recent years various developments have encouraged the airport industry to change its attitude
towards benchmarking. Many airports, particularly in Europe, have become very much more
commercially oriented and have adopted a much more businesslike management philosophy.
This transformation away from the view of airports as public utilities towards being considered
as commercial enterprises has naturally led to airports seeking ways to gain insights into their
operations and to improve their performance by benchmarking themselves against others The
increasingly competitive airline industry, which is operating in a much more cost-conscious
environment particularly post-September 11 and other recent events, is keener than ever before
to identify any airport which is being inefficiently managed or which is providing a poor quality
of service (Graham, 2005).
Graham (2003) also notes that in some cases commercialization has been taken to its limits by
the airports severing their links with their government owners, through some type of
privatization process. This has involved the transfer of the management of an airport and in many
cases the ownership as well, to the private sector. This movement towards privatization in the
industry has also led to the opening stages of airport globalization with the emergence of a few
global airport companies who are operating at an increasing number of airports around the world.
Lemaitre (1998) describes how the measurement of airport performance can be viewed from
three general management perspectives: financial; marketing and the operational perspective.
Her definition of financial performance included the use of traditional accounting ratios which
are used in most industries, such as return on capital employed, debt: equity ratio and (for the
publicly quoted companies) enterprise value and price earnings ratio, as well as more specific
airport economic indicators which involve defining specific measures of airport inputs and
outputs.
1

Lemaitre (1998) also defines the marketing measures as those which look at passenger
satisfaction with airport services in tenns of, for example, crowding, comfort and signing or
those relevant to perception of service quality by the airports users. These are based on passenger
perception, usually using passenger surveys. By contrast operational measures, such as capacity
utilization, waiting time and queue length are indicators based on the operator's measurements of
the service provided or delivered service. In recent years the environmental perspective and the
measurement of environmental good practice has also become increasingly important
particularly in the key areas of noise and emission, and in terms of waste/energy management
and use of public transport.
Likewise, Gronroos (1982) identified two service-quality dimensions-a technical aspect (“what”
service is provided) and a functional aspect (“how” the service is provided). Technical (outcome)
quality involves what a customer actually receives from a service or a service encounter or what
Lemaitre (1998) classifies as operational measures. Functional (process) quality concerns the
way a service is delivered to a consumer-that is, the customer's perception of the interaction that
takes place during service delivery. The functional aspect conforms to Lemaitre’s (1998)
definition of marketing measures of airport performance
Finally, in support of the literature, Parasuraman et al. (1985) suggested that quality evaluations
are not made solely on the outcome of service, but also involve evaluations of the service-
delivery process. Although the dimensions of these evaluations are related, the difference
depends upon when the evaluation occurs. For process quality, the evaluation occurs while the
service is being performed; whereas, for outcome quality, evaluation occurs after service
performance, and focuses on “what” service has been delivered.
1.1.2 Quality of Service and Operational Performance Indicators
Lehtinen and Lehtinen (1982) defined service quality in terms of physical quality, interactive
quality and corporate (image) quality. Physical quality relates to the tangible aspects of a service.
Interactive quality refers to the two-way interaction between a customer and a service provider
(or the provider's representative), including both automated and animated interactions. Corporate
quality refers to the image attributed to a service provider by its current and potential customers.
2
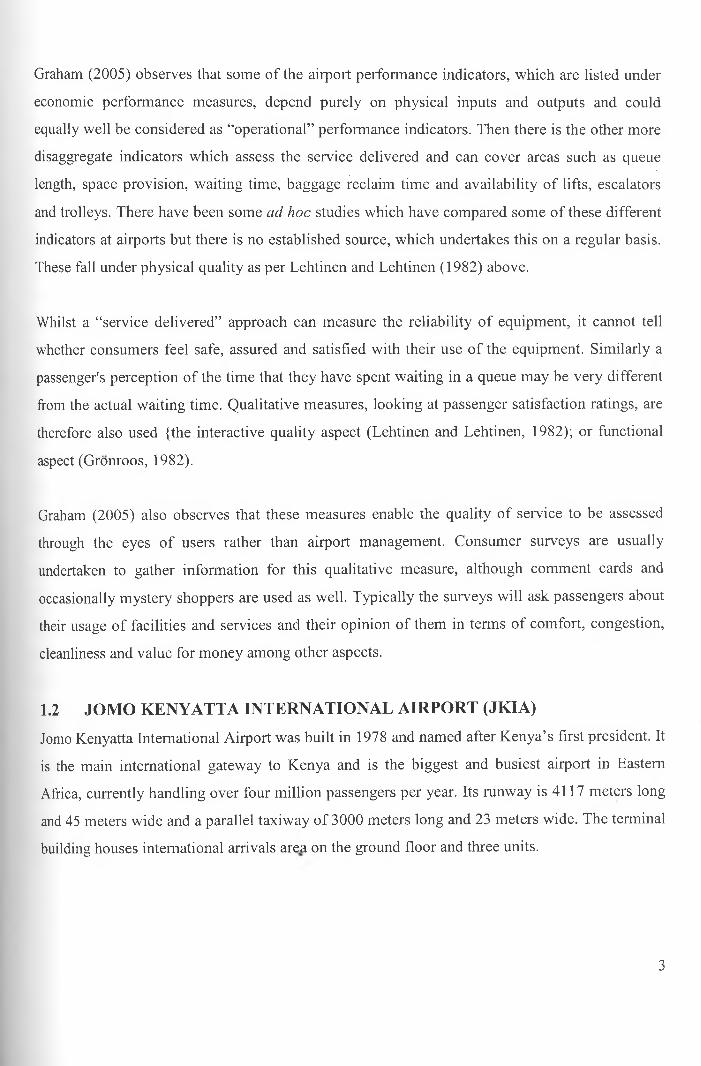
Graham (2005) observes that some of the airport performance indicators, which are listed under
economic performance measures, depend purely on physical inputs and outputs and could
equally well be considered as “operational” performance indicators. Then there is the other more
disaggregate indicators which assess the service delivered and can cover areas such as queue
length, space provision, waiting time, baggage reclaim time and availability of lifts, escalators
and trolleys. There have been some ad hoc studies which have compared some of these different
indicators at airports but there is no established source, which undertakes this on a regular basis.
These fall under physical quality as per Lehtinen and Lehtinen (1982) above.
Whilst a “service delivered” approach can measure the reliability of equipment, it cannot tell
whether consumers feel safe, assured and satisfied with their use of the equipment. Similarly a
passenger's perception of the time that they have spent waiting in a queue may be very different
from the actual waiting time. Qualitative measures, looking at passenger satisfaction ratings, are
therefore also used {the interactive quality aspect (Lehtinen and Lehtinen, 1982); or functional
aspect (Gronroos, 1982).
Graham (2005) also observes that these measures enable the quality of service to be assessed
through the eyes of users rather than airport management. Consumer surveys are usually
undertaken to gather information for this qualitative measure, although comment cards and
occasionally mystery shoppers are used as well. Typically the surveys will ask passengers about
their usage of facilities and services and their opinion of them in terms of comfort, congestion,
cleanliness and value for money among other aspects.
1.2 JOMO KENYATTA INTERNATIONAL AIRPORT (JKIA)Jomo Kenyatta International Airport was built in 1978 and named after Kenya’s first president. It
is the main international gateway to Kenya and is the biggest and busiest airport in Eastern
Africa, currently handling over four million passengers per year. Its runway is 4117 meters long
and 45 meters wide and a parallel taxiway of 3000 meters long and 23 meters wide. The terminal
building houses international arrivals area on the ground floor and three units.
3

Unit one and two are used for International departures and unit three for domestic arrivals and
departures. Jomo Kenyatta International Airport is served by about forty airlines .Some of these
airlines are Kenya Airways, British Airways, Qatar airways, Air India, Emirates, South African
Airways, KLM, Saudia Airways, Precision Airways and Ethiopia Airways. The main focus of
JKIA is on improved efficiency, superior quality services and increased capacity.
1.3 STATEMENT OF THE PROBLEMAs stated earlier, globalization has forced many airport managers to rethink the fundamental
manner in which they approach business. Competition is no longer domestic; it is international.
One faces competitors from all sides of the globe. Taylor (1994) in an interview with Bob
Coleman, Director of Customer Services, Air UK Ltd notes that key airport customers, airlines,
have ingrained in them a philosophy of good customer service and quality management in all the
non-technical board members and management. Reasons are that if they do not provide good
customer service, then the passengers will go with the airlines that do: the competition has
always been there. There have always been too many passenger seats chasing too few
passengers, so an airline has got to be good. Taylor (1994) further notes that the second reason
follows on from that: the kind of people who get into senior positions in airlines recognize the
need for good standards of customer service, and are the type who naturally want to deliver it-
and get a great deal of job satisfaction from doing so.
Perrin (1991) notes that almost 90 percent of the US airline executives questioned in a survey
said that establishing their carrier, as a leader in service quality was a top priority. Evelyn and
DeCarlo (1992) argue that determining optimum levels of customer service is understood to
depend on accurately assessing customer expectations, so that companies are able to meet highly
valued customer expectations and avoid employing those services that customers do not value;
regular customer feedback has been determined essential to such successful customer satisfaction
strategies.
4

Peters and Waterman (1982) observe that successful customer service focused companies
measure their service to ascertain how well they are satisfying their customers and Albrecht
(1992) notes that superior companies have been shown to be consistently excellent listeners to
their customers. All these and more conceptual and contextual literature points to the fact that
airport managers must strive to offer quality service to their customers in order to attract and
retain their custom. With this in mind, the purpose of this study is to determine the quality of
service delivery by the Jomo Kenyatta International Airport management as perceived by airline
passengers.
Several studies have been carried out locally on perceived quality of service in a number of
organizations. Maina (2001) studied the perceived service quality: the case of mobile phone
services whose first objective was to investigate whether customers perceived quality of mobile
phone services coincided with their expectations of these services (GAP 5, see page 19 of this
study). The findings reflect a significant perceived service quality gap. The service provider did
not meet the customers’ expectations on many of the service descriptors. Maina also examined
GAP 1 and discovered no significant statistical difference between managers’ perceptions of
customer expectations and the customers’ expectations.
Kandie (2002) conducted an investigation of GAP 5 in selected banks in Kenya. This revealed a
negative value between customers’ expectation and perception of service delivered. This was
significant in that bank customers may not necessarily see banks investments in quality as
contributing to quality. Maina (2003) investigated factors that determine perceived quality of
service in the insurance industry in Kenya, specifically in Nairobi province and concluded that
company efficiency, fast action on complaints, prompt service and understanding of customer
needs were important to customers in judging service quality.
Other researches include Masinde (1986) who studied the perceived quality of service: the case
of Kenya Airways; Mwenda (1987) who studied the perceived quality of port services: the case
of Kenya Ports Authority; Muriithi (1996) conducted an analysis of customer service offered by
Kenyan commercial banks; Njoroge (2005) looks at customers perception of service quality in a
decentralized system in the public utility sector in Kenya:
5

The case of KPLC Ltd Murugu (2003) looks at the perceived quality of service in the mortgage
sector: The case of HFCK and Mwaura (2001) studied the impact of perceived service quality:
the case of matatu industry.
None of these studies touch on the issue of service quality at J.K.I.A. To the best of the
researcher’s knowledge, there is no known study that has been carried out studying the
perception of service delivery at J. K. I. A as perceived by airline passengers.
1.4 OBJECTIVES OF THE STUDYThe main objectives of the study will be:
1. To determine the level of service quality as perceived by airline passengers at J. K. I. A.
2. To establish challenges the Kenya Airports Authority faces in order to ensure high
quality service delivery to airline passengers using Jomo Kenyatta International Airport.
1.5 IMPORTANCE OF THE STUDYThe findings of this study will be of benefit to the following: -
1. The management of Kenya Airports Authority will benefit through identifying passenger
needs in terms of various services offered by different agencies at the airport
2. The various government agencies that provide services to passengers using Jomo
Kenyatta International Airport will get feedback on how passengers’ perceive the quality
of these services
3. Academics and research scholars can use this study as a basis for further research
1.6 CONCEPTS AND TERMS• International Civil Aviation Organization (ICAO): The International Civil Aviation
Organization was formed in 1944 as a means to ensure secure international co-operation and
highest possible degree of uniformity in regulations and standards procedures and
organization regarding civil aviation matters. Its mandate is to ensure safe, efficient and
orderly evolution of international civil aviation. There are one hundred and eighty-eight I. C.
A. O contracting states and Kenya is one of them. Therefore, Jomo Kenyatta international
airport must meet all the standards and recommended practices set by I. C. A. O.
6

A standard is defined as any specification for physical characteristics, configuration,
material, performance, personnel, the uniform application of which recognized as necessary
for the safety or regularity of international air navigation and to which contracting states will
conform in accordance with the convention, in the event of impossibility compliance,
notification to the council is compulsory under article 38 of the convention.
A recommended practice is any specification for physical characteristics, configuration,
material, performance, personnel or procedure, the uniform application of which is
recognized as desirable in the interest of safety, regularity or efficiency of international air
navigation and to which contracting states will endeavor to conform in accordance with the
convention. States are invited to inform the council of non-compliance.

CHAPTER TWO
2.0 LITERATURE REVIEW
2.1 THE NATURE OF SERVICESService has traditionally been difficult to define. Kotler (1999) defines a service as any “act or
performance that one party can offer another, which is essentially intangible and does not result
in the ownership of anything. Its production may or may not be tied to a physical product.” Rust
et al (1996) defines services as any acts or performances that one party offer to another that is
essentially intangible and does not result in ownership of anything. For the purpose of this study,
the researcher will adopt the definition given by Kotler (1999) above. This definition has the
following implications: There is no transfer of title as there is no physical good; the entity that is
under consideration must be intangible although perceived
Marketing exchange occurs; the purchaser as an activity, benefit or satisfaction acquires
something of value.
2.2 CHARACTERISTICS OF SERVICESWhen evaluating service quality, every company must consider four unique service
characteristics. These are:
2.2.1 IntangibilityServices are intangible; they cannot be seen, tested, heard or smelled before they are purchased.
Services are performances that can be experienced only as they are delivered (Maina, 2001).
Kotler (1999) states that the work of the services provider is to make the service more tangible
by associating it with tangible products. Ennew (1990, as reported in Bateson, 1977) and others
point out that intangibility has essentially two meanings. At one level, it is concerned with the
fact that services are impalpable in the sense that they have no physical form, but it also
recognizes that many services are intangible from a conceptual point of view in that they are not
easily defined and may be difficult to understand. Many services will display both aspects of
intangibility and the problem is particularly acute with many professional and financial services
(Donnelly, Berry and Thompson, 1985).
8

2.2.2 Inseparability
Services cannot be separated from their providers. If an employee provides the service, then the
employee is part of the service because the customer is also present as the service is produced.
Provider-customer interaction is a special feature of service marketing. Quiroz (1995) argues that
customer service is the sum of interactions between the airport and its customers; customer
service is also the offerings (services, facilities) that will ensure the satisfaction of the customer.
The customer is increasingly demanding and aware; he/she is willing to pay to receive quality
that can be relied upon, and to be considered as a person worthy of respect. Ennew (1990) and
others observe that to a large extent, the qualities of inseparability and heterogeneity arise
because of the intangible nature of services. They go on to point out that the characterization of
services as an act rather than as an object leads to an emphasis on the individuals providing the
service and their interaction with the organization’s customers.
2.2.3 Variability
Variability or heterogeneity of a service arises because of the high dependence of service quality
on personal interactions. Service quality will be affected in turn by the fact that different
frontline personnel have different abilities. Even the same service provider has good and bad
days, or may be less focused at different times along the day. Unlike tangible products, which are
manufactured in the same way, services are produced differently to different customers (Maina,
2003; Kotler and Armstrong, 2000). In essence, therefore, the quality of service product is
typically highly dependent on the quality of the personnel conducting the transaction. The
challenge to the service provider is to as much as possible create uniformity.
2.2.4 Perishability
Services cannot be inventoried. They are performed in real time and are consumed as they are
produced. One cannot inventory them and once consumed they leave nothing with the consumer
except memories. Perish ability of services put pressure on service marketers to match services
capacity to demand patterns. Idle capacity during service delivery represents revenue-earning
potential lost (Ennew, 1990).
9

2.3 SERVICE QUALITYIt is generally agreed that service quality is an attitude or global judgment about the superiority
of a service, although the exact nature of this attitude is not agreed (Robinson, 1999). Some
suggest that it stems from a comparison of expectations with performance perceptions
(discontinuation) (Parasuraman el al., 1988), while others argue that it is derived from a
comparison of performance with ideal standards (Teas, 1993) or from perceptions of
performance alone (Cronin and Taylor, 1992). It is also agreed that service quality is distinct
from customer satisfaction, although the exact nature of this distinction seems to be somewhat
blurred (Robinson, 1999).
Some argue that, while service quality is an overall attitude towards a service firm, customer
satisfaction is specific to an individual service encounter (Bolton and Drew, 1991; Parasuraman
et al., 1988). For instance, a customer may be very satisfied with an individual service encounter
in a bank, but his/her overall attitude towards that bank might be one of offering poor service.
Berry, Parasuraman and Zeithaml et al. (1994) have outlined the following ten critical lessons for
improving service quality: listening, reliability, basic service, service design, recovery, surprising
customers, fair play, teamwork, and employee research and servant leadership. This concurs with
current research that suggests that consumer’s judge service quality based on five broad
dimensions: reliability, responsiveness, assurance, empathy, and tangibles.
The most important of these dimensions is reliability or the ability to perform as promised in a
dependable and reliable manner. Delivering reliable service is difficult without a clear
understanding of the design of the service system itself. A service map not only outlines the
process involved in delivery but also identifies processes that are visible to customers and those
that are not. The map also focuses on identifying fail points in the system that require special
attention such as redesign, staff training, etc. Mistakes happen and this is where responsiveness
(willingness to help), assurance (employee knowledge and courtesy), and empathy (caring,
individualized attention) come into play. The ability to recover from a service failure can be
critical to keeping and/or restoring customer confidence (Berry et al., 1994).
10

Successful service quality strategies are generally characterized by customer segmentation,
customized service, guarantees, continuous customer feedback, and comprehensive measurement
of company performance. The experience in many industries and companies demonstrates that
this process, although generally acknowledged, is not universally implemented. Market
segmentation by customer expectations, to create a separate level of service that exceed those
levels of expectations, has also been found essential to attract customers and create customer
loyalty (Porter, 1980). Knowing accurately what customers prefer, successful service companies
are able to give customers exactly what they want by customizing the product or service, to
surprise and “delight” them (Porter, 1980 and Albrecht, 1992).
2.3.1 Dimensions of Service Quality
Customer use basically similar criteria to determine service quality regardless of the type of
service (Parasuraman et. ah, 1985). The ten service quality dimensions are: -
1. Access: Approachability and ease of contact, waiting time to receive service is not
extensive. Convenient hours of operations and location of service facility.
2. Communication: Keeping customers informed in language they understand and listening
to them.
3. Competence: Possession of required skills and knowledge to perform the service
involving contact personnel, the operational support personnel and the service
organization i.e. research capability of the organization
4. Courtesy: Politeness, respect, consideration and friendliness of contact personnel. Clean
and neat appearance of public contact personnel. Friendly and polite reception.
5. Credibility: Trustworthiness, believability, honest and having customer’s best interest at
heart.
6. Reliability: Consistency in performance and dependability e.g. performance of service at
the designated time.
7. Responsiveness: Willingness or readiness of employees to provide service e.g. giving
prompt service.
8. Security: The service is free from danger risk or doubt.
9. Tangibles: Physical evidence of the service, which includes physical facilities,
appearance of personnel, tools or equipment used to provide the service.
11
tiWiVEREBTHr OF MAlHOer. SNffBRk K/fiEIE LIBRAS ■

10. Understanding/Knowing the Customer: Making the effort to understand the customer
needs, learning the customer’s specific requirements. Providing individualized attention
and recognizing the regular customer.
For criticism of this model, please refer to section 2.5.4, pg. 26.
2.3.2 Customer Perception of Quality
Customer perceptions and expectations of service quality are increasingly used to forecast
company profitability and prospects for improved market share. Although many other “quality-
focused” initiatives have often failed to enhance company performance, customer-perceived
service improvements have been shown empirically to improve profitability (Buzzell and Gale,
1987). The shift from an industrial to a customer-value paradigm (Albrecht, 1992) places service
at the center of company efforts to improve profitability.
As virtually all organizations compete to some degree on a basis of service (Zeithaml et al.,
1990), and as the US economy has become a predominantly “service economy” (Albrecht and
Zemke, 1985), service quality then becomes significantly important to achieve a genuine and
sustainable competitive advantage. Service-based companies are compelled by their nature to
provide excellent service in order to prosper in increasingly competitive domestic and global
marketplaces, i.e. there is no “tangible” product to equate otherwise to quality.
2.3.3 Satisfying Customer PreferencesQuiroz (1995) defines customer satisfaction or non-satisfaction is the difference between how the
customer expected to be treated and how he/she perceives the treatment received. Customer-
driven strategies require satisfying customer preferences; it is first necessary to identify the
customer (Sonnenberg, 1991), which is also found to be prerequisite to successful global
competition (Butterworth, 1990) and service competition generally (Parasuraman et al., 1988).
Many companies intending to employ a customer service-based strategy find the process of
identifying and measuring customer preferences very difficult, often owing to mistaken business
perceptions of customer wants (Fomell, 1992).
12

Nonetheless, providing superior service quality requires creating a distinct relationship between
what the customer wants and that which the company provides, or a relationship between
customer requirements and essential business elements (Evelyn and DeCarlo, 1992). Service
quality literature recognizes expectations as an instrumental influence in consumer evaluations of
service quality (Brown and Swartz, 1989). Expectations are understood as the desires or wants of
customers, i.e. what the service provider should offer (Parasuraman et al., 1988), and studying
companies understood to be leaders in various industries (and not limited to direct competitors),
i.e. “benchmarking” or “studying the winners”, has become a vital source in identifying gaps that
exist between customer expectations and company performance (Albrecht, 1992) as perceived by
its customers (Miller, 1992).
Maina (2001, as reported in Christopher et al., 1991) views customer service as being concerned
with the building of bonds with customers and other markets or groups to ensure long-term
relationships of mutual advantage. He looks at customer service as a process which provides
time and place utilities for the customer and which involves pre-transaction considerations,
transaction and post-transaction considerations relating to the exchange process with the
customer. He notes that provision of quality customer service involves understanding what the
customer buys and determining how additional value can be added to the product or service
being offered.
2.3.4 Perception Value and ExpectationsFigure 1 below is a flow diagram that demonstrates the relationship between the 10 dimensions
of service quality set out by Parasuraman et al. (1985) as forming the basis upon which the
customer builds their expectations in terms of service based on what other customers say (word
of mouth), customers personal needs and past experience (if any); the same variables form the
basis of how the service received is perceived (or judged by the customer); the gap between these
two constitutes the perceived service quality.
Sultan and Simpson (2000) found that both expectations and perceptions of service quality vary
by nationality, as do overall service-quality assessments. Perceived value is a construct that goes
beyond perceived service quality (Bolton and Drew, 1991). As an antecedent to value, perceived
service quality addresses the get components in the service delivery process (Zeithaml, 1988).
13

Perceived value may be conceptualized as the result of the customer’s trade-off between quality
perception and the monetary and non-monetary sacrifices (Bolton and Drew, 1991). Yet, value
can be extended in its conception to capture functional, social, emotional and epistemic
components on both sides (Hartmann, 1967). The input components other than money (evolved
through customer participation) have been investigated recently by Kellogg et al. (1997).
However, the development of reliable and valid scales to measure sacrifices other than money
(e.g. time,
Figure 1: DETERMINANTS OF PERCEIVED SERVICE QUALITY
Source: Martin Christopher, Adrian Payne and David Ballantyne, 1991, Relationship Marketing:
Bringing quality, Customer Service and Marketing Together.\
Physical, or psychological effort) still remain a rich field of research (Zins, 1998).
It was shown that in a pre-purchase situation value perceptions exercise a direct influence on the
re-purchase intention (Bolton and Drew, 1991) or the willingness to buy (Dodds et al., 1991). In
the post-purchase situation, where extensive service experience is available, it can be assumed
that the influence of the value-for-money evaluation on behavioural intention will be-partly or
fully-mediated by the customer satisfaction (Petterson and Spreng, 1997). While there seems to
evolve some consensus on the fact that expectations may be split into two groups (i.e. quality
norms or should-expectations and quality estimates or will-expectations) (Cadotte et al.,, 1987)
there is no certainty about the role of them in.
14

Service quality assessments (Johnson and Mathews, 1997).
Generally speaking, most researchers acknowledge that customers have expectations and that
they play a certain role as standards or reference points used by consumers to evaluate the
performance of a company (e.g. Bolton and Drew, 1991; Zeithaml et al., 1990; Parasuraman et
al., 1988, 1994). Models of the type of subtractive disconfirmation approach (e.g. Parasuraman et
al., 1988) make use of this component. Criticism of the expectancy-based models is
predominantly targeted towards the negligible contribution to the overall evaluation (Cronin and
Taylor, 1994) and not toward the possible important role. Zins (2001) observes that on the
transactional level it is conceivable that expectations are more correlated with perceptions than
on the relationship level as expectations are formed and adjusted for every transaction
individually.
2.4. THE GAP THEORYDonnelly et al. (1995) observe that in principle, the SERVQUAL model can be extended to
investigate five possible gaps in the process of service delivery in meeting customer
expectations. These are illustrated in Figure 2. The service quality gap (GAP 5) is the gap
between customer expectations of the service and the perceived service delivered and is the gap
on which many service
15

Figure 2: Service Quality Model
Source: A. Parasuraman, Valarie A. Zeithaml and Leonard L. Berry (1985), A Conceptual Model of
Service Quality and its Implications for Future Research, Journal o f marketing, p. 44
Organizations frequently focus. However, simply looking at this gap and searching for solutions
to help close it might not, by itself, be adequate in terms of matching customer expectations.
Other gaps in the service process may be contributing to such service shortfalls and must be
identified and dealt with directly by managers if service quality is ultimately to be improved.
The understanding gap (GAP 1) is the gap between customer expectations and management
perceptions of what these customer expectations are. If there is a mismatch then management in
the service provider organization must understand customer expectations adequately if the right
priorities are to be set, the right resource allocations made, and the right corrective actions taken.
16

Such a gap may be caused by inadequate research into customer needs, poor internal
communications, or inadequate management structures. The design gap (GAP 2) is the gap
between management’s understanding of customer expectations and the design and specification
of service quality. Management understanding of customer expectations must be accurately
translated into appropriate quality specifications and performance standards. Such a gap might be
caused by an inadequate commitment to service quality; inappropriate goal setting; or by
management who are inexperienced or inadequate in this area.
The delivery gap (GAP 3) is that between the specification of service quality and the actual
quality of the service delivered. Such a gap may arise because of a shortage of resources in key
areas, lack of commitment and motivation, inadequate quality control procedures or inadequate
staff training.
Finally, the communications gap (GAP 4) is that between what is actually delivered and what has
been promised in terms of external communications such as media, service publicity, local and
national charters, customer contracts and the like. Essentially, the SERVQUAL approach
assesses the size of each of these gaps and their resulting impact on the imbalance between
customers' expectations and experiences as measured in the service quality gap (Donnelly et al.,
1995).
2.5 MEASURING SERVICE QUALITYRobledo (2001) notes that the inclusion or not of expectations as a determinant of perceived
service quality has resulted in two conflicting paradigms:
a. The disconfmnation paradigm: according to this approach customers evaluate a service
by comparing their perceptions of the service received with their expectations.
b. The perception paradigm: supporters of this paradigm maintain that expectations are
irrelevant and even misleading information for a model intended to evaluate perceived
service quality. They maintain that the perception of the customer is the only measure
required.
17

As a result of the lack of agreement in that area, customer expectations of service quality have
not been successfully understood and examined. In particular, sources of expectations remain
largely unexplored and expectations
Management is an area of study yet to be developed. However, the debate that has originated the
greatest amount of attention among service quality experts is the one related to the measurement
of service quality. Basically there are three areas of debate when it comes to determining the
ideal method of measuring service quality, the first one of them directly related to the problem of
expectations (Robledo, 2001).
2.5.1 Disconfirmation models
Disconfirmation models are based on the disconfirmation paradigm (Bolton and Drew, 1991).
Quality is therefore defined as the gap between customers’ expectations and perceptions of
actual service delivered (Q = P - E), and a customer will perceive quality positively only when
the service provider meets or exceeds his expectations (Robledo, 2001).
The most important model developed upon this theory is SERVQUAL (Parasuraman et al.,
1985). The original SERVQUAL model identifies specific criteria by which customers evaluate
service quality. These criteria are classed in five major dimensions: tangibles, the appearance of
physical facilities, equipment, personnel, and communications materials; reliability, the ability to
perform the promised service dependably and accurately; responsiveness, the willingness to help
customers and provide prompt service; assurance, the competence of the system and its
credibility in providing a courteous and secure service and empathy or the approachability, ease
of access and effort taken to understand customers' needs.
The model begins with the assumption that customers are able to articulate both their
expectations of the general characteristics and determinants of quality service and also their
perceptions of actual and current service quality for a specific service provider. The model
therefore not only provides an assessment of customer views of current service quality; it also
provides a yardstick in terms of their expectations of what that service quality should be.
18

For each statement, the respondent is provided with a seven-point Likert scale ranging from
“strongly agree” to “strongly disagree” (1, Strongly disagree; 2, Disagree; 3, Tend to disagree; 4,
Neutral; 5, Tend to agree; 6, Agree; 7, Strongly agree). They are then asked to score their
expectations of the service and later to score their perceptions of the service actually experienced
from the organization under examination. So, for example, a question relating to the reliability
dimension might be: “An excellent housing repair service will provide their services at the time
they promise to do so”.
Later in the questionnaire the related statement appears: “Midtown housing department provides
its services at the time it promises to do so.” Such a questionnaire structure - comprising
between 20 and 30 statements around the five dimensions - allows analysis in a number of ways:
assessing which service dimensions score highly in terms of customer expectations-for example
whether customers place more value on tangibles or on reliability; assessing how these different
service features are rated by the customer-on the basis of their actual experience-for the specific
service provider being investigated; and assessing the gap between customers' expectations of
the service and their perceived experience of the service actually delivered overall and for each
of the service quality dimensions.
This last point is a particularly important outcome of the SERVQUAL model. If, in the
illustrative question used earlier, the customer had strongly agreed with the statement in the
expectation section but strongly disagreed with the corresponding statement in relation to the
actual service received, then clearly a major gap exists-in the customers mind-between the
service that should be provided and the service that is currently being delivered (Parasuraman et
al., 1985). This approach may sound unduly simplistic but it is in fact supported through the
model with sophisticated statistical analysis. This allows a rigorous and testable analysis of the
customer responses (Robledo, 2001).
2.5.2 Perception models
This second model, mainly resulting from examinations and assessments of the gap theory, is
based only on perceptions of performance. Frameworks for service quality measurement
following that approach are, for example, SERVPERF (Cronin and Taylor, 1992) and EP (Teas,
19

1993). Despite its popularity, a number of criticisms are leveled at the SERVQUAL instrument,
aimed at both the conceptual and the operational level. Cronin and Taylor (1992) and Teas
(1993a) are particularly vociferous in their critique, both developing their own measurement
instruments. Based on a review of the service quality and customer satisfaction literature, Cronin
and Taylor (1992) conclude that current performance best reflects a customer’s perception of
service quality and that expectations are not part of this concept. They perform an empirical test
with four alternative service quality models:
a. Service quality = performance - expectations
b. SERVQUAL: Service quality = importance x (performance - expectations)
c. Service quality = performance
d. SERVPERF: Service quality = importance x performance
A survey instrument is developed using the same 22 items as the SERVQUAL scale; indeed,
Cronin and Taylor (1992) concur with the reliability of Parasuraman et al.’s (1991) scale items.
A third section is added that measures the importance of each item using a similar set of 22
statements and a seven-point Likert scale. From the results of their empirical investigation
Cronin and Taylor (1992) conclude that the unweighted SERVPERF measure (performance
only) performs better than any other measure of service quality.
Teas (1993a) discuss the conceptual and operational difficulties of using the performance-minus-
expectations approach, with a particular emphasis on expectations. He proposes and empirically
tests two alternative perceived service quality models, evaluated performance and normed
quality. He concludes that the evaluated performance model outperforms SERVQUAL and the
normed quality model. In this model service quality is measured by the gap between perceived
performance and the ideal amount of a feature, rather than the customer’s expectations.
2.5.3 Weighted versus Unweighted ModelsThe discussion is about the convenience of weighting or not weighting the specific criteria by
which customers evaluate service quality according to the importance they assign to each of
those criteria. Hence, we find weighted models and unweighted models. The initial version of the
SERVQUAL instrument simply measures expectations and performance, and does not measure
20

the importance of the various features (Parasuraman et al., 1988). Carman (1990), however,
argues that since the importance of each item is quite distinct from the customer’s expectations,
it is relevant to the assessment of service quality.
Indeed, Parasuraman et al. (1991) introduce importance weights to the SERVQUAL instrument.
Respondents are asked to assign importance weights, out of 100, to descriptions of the five
dimensions, these weights then being used to provide a weighted average of the overall service
quality score. Parasuraman et al. (1991) demonstrate the validity of their revised instrument, but
say little more than this in relation to the benefits of importance weights.
Cronin and Taylor (1992) test the use of importance weights in conjunction with both
SERVQUAL and SERVPERF. They adopt a different approach to Parasuraman et al. (1991).
Respondents are asked to assign an importance score, between one and seven, to each of the 22
items. Following empirical tests, they conclude that this does not add to the predictive power of
the instruments, and in fact reduces it.
Teas (1993a) also conclude that weighted models perform worse than the unweighted versions.
Parasuraman et al. (1994) argue against individually weighting every item. They believe that
using individual importance scores as independent variables in regression analysis is a form of
double counting, since the primary purpose of regression analysis is to derive the importance
weights through the beta coefficients.
Cronin and Taylor (1994) consider the opposite to be true, seeing the mathematical derivation as
being quite distinct from directly asking respondents to state their perceptions of importance.
What is surprising is that no one notes the problems of weighting importance on an interval,
rather than a ratio, scale. Meanwhile, Cronin and Taylor (1994) believe that weighting by
dimension is dangerous because of the uncertainty over the dimensionality of service quality (see
the next sub-section) and because of the intercorrelation between the dimensions.
21

hnce Parasuraman et al. (1994) regard importance weighting merely as a means for providing an
ndication of the overall service quality gap, they do not perceive this to be a problem. In a later
?aper, Taylor (1995) uses evidence from the literature to suggest that explicitly asking for
mportance weights is an unreliable approach. Instead he suggests that indirect methods, in
which the importance weights are statistically derived, are more appropriate; that is, implicit
importance weights. He demonstrates the efficacy of the method by using a weighted
multidimensional scaling technique with the SERVPERF instrument. Lewis and Mitchell (1990)
also suggest that an indirect method should be employed in which the level of expectations and
perceived performance indicates the importance of each item.
2.5.4 Dimensions of Service Quality
Consumers evaluate providers of services along dimensions, which are groupings of criteria. The
question is one of determining those. Dimensions, and if they are general for any service
company or, rather, are context specific. Despite Parasuraman et al.'s (1988) initial claim that
their five service quality dimensions are generic, it is generally agreed that this is not the case,
and that the number and definition of the dimensions varies depending on the context. When
measuring the quality of accounting firms, Freeman and Dart (1993) conclude that service
quality is a seven-dimensional construct. Robinson and Pidd (1998) propose 19 dimensions of
service quality in the context of management science projects.
Babakus and Boiler (1992) perform an empirical study on an electric and gas utility company
using the SERVQUAL instrument. They conclude that the proposed dimensionality of
SERVQUAL is problematic and that in the industry under investigation service quality is
probably a unidimensional rather than a five-dimensional construct. Babakus and Boiler believe
that this is due to the service being delivered on a continuous basis, without face-to-face contact,
by a monopolistic company. As a result of this finding, they argue that the dimensionality of
service quality is a function of the service under investigation, and therefore it is not worth
pursuing the development of a standard measurement instrument. Different measures should be
developed for different services, and the classification of services into continuous/discrete and
low/high involvement may prove a useful line of enquiry.
22
What is less clear is whether the five dimensions are correct for the services studied by
Parasuraman et al. Carman (1990) confirms the existence of the dimensions in the SERVQUAL
scale, but he believes that two additional dimensions should be included: courtesy and access.
These are two of Parasuraman et n/.’s (1985) original ten determinants of service quality, which,
through their empirical research, are later, reduced to their five dimensions (Parasuraman et al.,
1988).
Cronin and Taylor (1992) conclude that the five-component structure of SERVQUAL is
incorrect and, in fact, service quality is a unidimensional construct. Parasuraman et al. (1994)
argue, however, that Cronin and Taylor reach this conclusion because they ignore the
intercorrelation between the variables representing the five dimensions in their analysis.
2.5.6 Difficult challenges.
Meeting rising customer expectations has proved to be one of the most difficult challenges to
service businesses (Sonnenberg, 1991). Quality is found to be measured most accurately through
the eyes of the customer (Miller, 1992), and it is not found to improve unless it is regularly
measured (Reichheld and Sasser, 1990). Customers are therefore never mistaken when they say
that (service) quality is bad, because if they perceive it so, it necessarily is so (Schneider and
Bowen, 1995).
Companies that actively search for and incorporate the best service methods and processes to
improve the performance, regardless of sources and ultimately the perceptions of their
customers, are found to excel in relation to their competitors (Sellers, 1991). In practice,
companies that exceed customer expectations without impairing profit margins have frequently
been found to develop a solid foundation of customer loyalty, based on segmented service
(Drucker, 1964 and Porter, 1980). Customer satisfaction and customer retentions are always at
risk. Therefore managers must be vigilant if they are to maintain sufficient high quality in order
to maintain customer loyalty (Rust, 1996).
23

2.6 CUSTOMER SATISFACTION AND SERVICE QUALITY AT JOMO
KENYATTA INTERNATIONAL AIRPORT.
In July 2001, the Kenya Airports Authority conducted a customer services survey whose
objective was to determine passenger perception of facilities and services at the JKIA (Kenya
Airports Authority, 2001). This study was done in the middle of a major rehabilitation and
expansion project at the JKIA airport. This project was a response to increased usage of air travel
and the subsequent stiffer competition in the aviation industry marked by continual service- and
facility-improvement with a view to retaining and expanding market share.
The JKIA study made use of descriptive techniques of analysis, using frequencies and
percentages to analyze data. Out of a total of 1000 questionnaires distributed, 527 responded (a
response rate of 52.7%). The gender ratio was 38% female and 62% male respondents spanning
over 50 nationalities. Over 50% of the respondents fell under the upper middle age group (26-45
years). Over 60% indicated that they were regular users of the airport. The survey captured 30%
transit and 40% holiday airport users respectively. The very young (under 18) had a particularly
poor response rate of about 0.8%.
With regard to signage, 38% voted JKIA, as above average, 11.5% as inadequate and 5.9% did
not rate this service. Under Flight Infonnation displays, 41% rated this service, as above average
while 15% were dissatisfied. The dissatisfied segment complained of few display screens, poorly
manned information counters and lack of real time flight information. 41% and 32% rated
availability and quality of baggage trolleys as excellent while 14% and 15% felt availability and
quality of the same was poor. A point to note was that passengers were more concerned about the
quality as opposed to the availability of trolleys
The customs service desk was rated as above average by 40% of the respondents, 13% were
dissatisfied and 9% did not rate this service. Notably, the study established a drop in customs
rating compared to an earlier study conducted in 1997. Respondents who were dissatisfied
evaluated customs staff as unfriendly, gloomy-faced, bribe seeking and inefficient in service
delivery. 53% of passengers rated the check-in counters as excellent, 9% as poor and 5.5% did
not rate this service. Comments among the 9% who rated the service as poor included colour
24

discrimination, rude staff and slow processing. Immigration desk was rated by 38%, as
satisfactory and 13% was dissatisfied. Among the latter, immigration staff were seen as rude,
unconcerned, corrupt and generally uninspiring. 17% and 25% of passengers rated availability
and quality of washrooms as below expectations. The mean scores were 3.9 for the latter and 3.5
for the former indicating that users were more disappointed with quality as opposed to
availability. These users pointed that the washrooms were untidy, lacking toilet tissue and
showers or had non-functional shower systems. Transit lounges were also noted as lacking
bathrooms. Duty free shops were rated by 50% as superb, 10% as dissatisfactory while 7% did
not respond. Dissatisfies were issues like overpricing, lack of variety, lack of innovativeness and
a small shopping area.
Ground catering service was rated as excellent by 28%, by 52% as average, 20% as poor.
Complaints here included too expensive meals, lack of a “local” touch, lack of snack bars at the
departure gates and food on offer lacking an enticing variety. 44% and 48% of transit passengers
felt that the transit lounges were fairly adequate and comfortable respectively; 27% and 22%
rated the facility as above average respectively. 29% and 30% thought that availability and
comfort of the lounges was poor while 14% and 16% were indifferent regarding the adequacy
and comfort of lounges respectively. Complaints were that the lounges needed bathrooms, were
small, had few, aged and uncomfortable seats, did not provide for special cases such as prayer
rooms for Muslims, no designated area for smokers and were congested.
Overall 65%, 63% and 53% rated JKIA as average in terms of overall facilities, services and
cleanliness. 14%, 12% and 10% rated the airport poorly in terms of general facilities, services
and cleanliness. 22%, 25% and 37% of the users felt that the airport was excellent in terms of
facilities, services and cleanliness. Given that the survey was done in a period of restructuring, it
will be interesting to see what kind of result would be generated by this study in comparison with
the KAA 2001 survey on the different service parameters.
25

CHAPTER THREE
3.0 RESEARCH METHODOLOGY
3.1 RESEARCH DESIGN
A survey research design was used to obtain data for this study.
3.2 POPULATION
The population of study was composed of International airline passengers using Jomo Kenyatta
International Airport. These were further split into arrivals, departures and transit passengers.
3.3 SAMPLE DESIGN
The respondents were randomly selected on the basis of whether they were arrivals, transit and
departures.
3.4 SAMPLE SIZE
A sample size of 90 airline passengers was selected. Passengers were grouped into three
destination categories: arrivals, transit and departures. 30 were included in each category. On the
Kenya Airports Authority management side, one senior manager in the area of Customer Service
was chosen by the researcher to provide information on Part III.
3.5 DATA COLLECTION METHOD
Data was collected via means of a questionnaire. This consisted of open-ended questions, closed-
ended questions and matrix questions. The questionnaire was administered to the respondents by
the researcher. The operational definition of variables put forward by Parasuraman et al. (1985)
was being adopted. The questionnaire was divided into Part I, II and III. Part I captured general
data about the respondent, Part II addressed objective 1. In Part II, the questionnaire was
stnictured so as to obtain information on what service quality attributes customers considered
important and then proceeded to seek out information on whether these were delivered in the%
actual service delivery. Part III investigated objective 2.
26

3.6 DATA ANALYSIS METHOD
Data analysis was conducted using descriptive statistics that involved measures of central
tendency, measures of spread and graphical methods. For purposes of analysis, the simple
disconfirmation model as originally elucidated by Parasuraman et al. (1985) was adopted. This
model looks at perceived service quality (Q) as being the difference between perceived service
(P) and expected service (E) or Q=P-E.
27

CHAPTER FOUR
4.0 DATA PRESENTATION AND ANALYSIS
4.1 INTRODUCTION
This chapter sets out to present in summary and statistically analyze the primary data that was
gathered from the study. A total of 90 questionnaires were completed. This marked a 100%
response rate. Summaries are presented in form of frequencies, mean scores and graphical
format.
4.2 SUMMARY OF GENERAL INFORMATION (PART 1 OF THE QUESTIONNAIRE)
Table 4.2.1: Distribution of Respondents by Gender
Frequency Percent Valid percent Cumulative PercentValid Male 39 43.3 43.3 43.3
Female 51 56.7 56.7 100.0Total 90 100.0 100.0
43.3% of the respondents were male while 56.7% were female
Table 4.2.2: Distribution of Respondents by Visits- First time users vs. Multi-users
Frequency Percent Valid Percent Cumulative PercentValid Yes 15 16.7 16.7 16.7
No 60 66.7 66.7 83.3No Response 15 16.7 16.7 100.0Total 90 100.0 100.0
16.7% of the respondents were using the JKIA airport for the first time, while 66.7% had used it
before. 16.7% did not respond.
Table 4.2.3: Distribution of Respondents by Frequent Users
Frequency Percent Valid Percent Cumulative PercentValid Once 21 23.3 23.3 23.3
Twice 39 43.3 43.3 66.7Thrice 3 3.3 3.3 70.0More than Three times 18 20.0 20.0 90.0No response 9 10.0 10.0 100.0Total 90 100.0 100.0
Of the 66.7% who had used JKIA before (Table 4.2.3 above), 23.3% had used it only once
before; 43.3% had used it twice; 3.3% had used it thrice and 20% had used more than three
times. 10% did not respond to this question.
28

Table 4.2.4: Respondents by Age Bracket
Frequency Percent Valid Percent Cumulative PercentValid Under 18 9 10.0 10.0 10.0
18-25 9 10.0 10.0 20.026-35 12 13.3 13.3 33.336-45 24 26.7 26.7 60.046-55 33 36.7 36.7 96.7Above 55 3 3.3 3.3 100.0Total 90 100.0 100.0
Under age bracket, 10% of the respondents were under 18 years of age; 10% between 18-25
years; 13.3% between 26-35 years; 26.7% between 36-45 years and 36.7% between the ages of
46-55 years. 3.3% registered above 55 years.
Table 4.2.5: Respondents by Level of Education
Frequency Percent Valid Percent Cumulative PercentValid Primary 9 10.0 10.0 10.0
Secondary 36 40.0 40.0 50.0Tertiary 45 50.0 50.0 100.0Total 90 100.0 100.0
10.0% of the respondents were of primary school level education; 40% secondary and 50%
tertiary level.
4.3 CUSTOMER’S EXPECTATIONS REGARDING EACH OF THE SERVICE
QUALITY DIMENSIONS.
Table 4.3.1: Customer Expectation: Importance of Airport Cleanliness
Frequency Percent Valid Percent Cumulative PercentValid Important 9 10.0 10.0 10.0
Very Important 81 90.0 90.0 100.0Total 90 100.0 100.0
10% of the customers rated airport cleanliness as important; and 90% as very important.
29

Diagram 4.3.1: Customer Expectation: Importance of Airport CleanlinessAirport cleanliness
Table 4.3.2: Customers Expectation: Importance of Airport SignageFrequency Percent Valid Percent Cumulative Percent
Valid Important 54 60.0 60.0 60.0Very Important 36 40.0 40.0 100.0Total 90 100.0 100.0
Airport signage was rated by 60% of the respondents as important and by 40% as very important
Diagram 4.3.2 Customers Expectation: Importance of Airport SignageAirport sinage
Airport sinage
Table 4.3.3: Customer Expectation: Importance of Availability of Business Centre
Frequency Percent Valid Percent Cumulative PercentValid Not important 3 3.3 3.3 3.3
Somewhat important 27 30.0 30.0 33.3Important 51 56.7 56.7 90.0Very Important 9 10.0 10.0 100.0Total 90 100.0 100.0
Business center availability was rated by 3.3% of the respondents as not important; 30% as
somewhat important; 56.7% as important and by 10% as very important.
30

Diagram 4.3.3: Customer Expectation: Importance of Availability of Business CentreBusiness centre a va ila b ly
Not important Somewhal important Important Veiy important
Business centre availablity
Table 4.3.4: Customer Expectation: Importance of Lounge Comfort
Frequency Percent Valid Percent Cumulative PercentValid Important 36 40.0 40.0 40.0
Very Important 54 60.0 60.0 100.0Total 90 100.0 100.0
This dimension was rated by 40% as important and by 60% as very important.
Diagram 4.3.4: Customer Expectation: Importance of Lounge ComfortLounge Comfort
Lounge Comfort
Table 4.3.5: Customer Expectation: Importance of Transport to and from Airport
Frequency Percent Valid Percent Cumulative PercentValid Somewhat important 9 10.0 10.0 10.0
Important 60 66.7 66.7 76.7Very important 21 23.3 23.3 100.0Total 90 100.0 100.0
10% rated this dimension as somewhat important; 66.7% as important and 23.3% as very
important
31

Diagram 4.3.5: Customer Expectation: Importance of Transport to and from AirportTransport to and fro airport
70 -
Transport to and fro airport
Table 4.3.6: Customer Expectation: Importance of Banking ServicesFrequency Percent Valid Percent Cumulative Percent
Valid Not important 3 3.3 3.3 3.3Somewhat important 15 16.7 16.7 20.0Important 30 33.3 33.3 53.3Very important 42 46.7 46.7 100.0Total 90 100.0 100.0
3.3% rated banking services as not important; 16.7% as somewhat important; 33.3% as important
and 46.7% as very important. This is illustrated below.
Diagram 4.3.6: Customer Expectation: Importance of Banking Services
Banking services
Table 4.3.7: Customer Expectation: Importance of Customer Care ServicesFrequency Percent Valid Percent Cumulative Percent
Valid Somewhat Important 3 3.3 3.3 3.3Important 21 * 23.3 23.3 26.7Very important 66 73.3 73.3 100.0
Total 90 100.0 100.03.3% somewhat important; 23.3% as important and 73.3% as very important
32

Diagram 4.3.7: Customer Expectation: Importance of Customer Care ServicesCustomer care services
Customer care services
Table 4.3.8: Customer Expectation: Importance of Waiting Time to Receive Services
Frequency Percent Valid Percent Cumulative PercentValid Somewhat important 3 3.3 3.3 3.3
Important 18 20.0 20.0 23.3Very important 69 76.7 76.7 100.0Total 90 100.0 100.0
Waiting time: 3.3% somewhat important; 20% important and 76.7% very important as illustrated
below.
Diagram 4.3.8: Customer Expectation: Importance of Waiting Time to Receive Services
W aiting tim e to receive services
Somewhat important Important Very important
Waiting time to receive services
33

Table 4.3.9: Customer expectation: Mean Score of Key Variables. Descriptive StatisticsVariables N MINIMUM MAXIMUM MEAN STD DEVAirport Cleanliness 90 4.00 5.00 4.9000 0.3017Airport Signage 90 4.00 5.00 4.4000 0.4926Business centre availability 90 2.00 5.00 3.7333 0.6837Lounge comfort 90 4.00 5.00 4.6000 0.4926Transport to and from airport 90 3.00 5.00 4.1333 0.5649Banking services 90 2.00 5.00 4.2333 0.8487Customer care services 90 3.00 5.00 4.7000 0.5289Waiting time 90 3.00 5.00 4.7333 0.5149From the above, the customers attached the greatest importance on cleanliness and least on
business center availability. Waiting time, customer care and lounge comfort received similar
ratings.
4.4 C U ST O M E R ’S PER C EPTIO N OF SER V IC E Q U A LITY D IM EN SIO N S
A LO NG THE A IR PO R T SER V IC ES C EN TER .
Table 4.4.1: Customer Perceptions: Airport CleanlinessFrequency Percent Valid Percent Cumulative Percent
Valid Below Expectations 30 33.3 33.3 33.3Met expectations 30 33.3 33.3 66.7Above expectations 18 20.0 20.0 86.7Far above expectations 12 13.3 13.3 100.0Total 90 100.0 100.0
Airport cleanliness was rated as below expectations by 33.3% of the respondents; met
expectations by 33.3%; above expectations by 20% and far above expectations by 13.3%
Diagram 4.4.1: Customer Perception: Rating of Airport CleanlinessAirport cleanliness

Table 4.4.2: Customer Perception: Airport Signage
Frequency Percent Valid Percent Cumulative PercentValid Far below expectations 3 3.3 3.3 3.3
Below expectations 12 13.3 13.3 16.7Met expectations 66 73.3 73.3 90.0Above expectations 9 10.0 10.0 100.0Total 90 100.0 100.0
3.3% rated signage as far below expectations; 13.3% below expectations; 73.3% as met
expectations and 10% as above expectations
Diagram 4.4.2: Customer Perception: Rating of Airport Signage
Far below expectatio Below Expectations Met expectations Above Expectations
Airport sirtage
Table 4.4.3: Customer Perception: Airport business centre availability
Frequency Percent Valid Percent Cumulative PercentValid Far below expectations 30 33.3 33.3 33.3
Below expectations 27 30.0 30.0 63.3Met expectation 24 26.7 26.7 90.0Above expectations 9 10.0 10.0 100.0Total 90 100.0 100.0
33.3% rated this as far below expectations; 30% as below expectations; 26.7 as met expectations
and 10% as above expectations.
35
m-M Bmm of wAisor,./sSaStS<ABET£. LISRAR

Diagram 4.4.3: Customer Perception: Rating of Airport Business CentreAirport business centre a va ila b ly
Airport business centre availably
Table 4.4.4: Customer Perception: Airport lounge comfortFrequency Percent Valid Percent Cumulative Percent
Valid Far below expectations 18 20.0 20.0 20.0Below expectations 27 30.0 30.0 50.0Met expectations 36 40.0 40.0 90.0Above expectations 3 3.3 3.3 93.3Far above expectations 6 6.7 6.7 100.0Total 90 100.0 100.0
In table 4.4.4 above, lounge comfort was rated by 20% as far below expectations; 30% as below
expectations; 40% as meeting expectations; 3.3% as above expectations and 6.7% as far above
expectations
Diagram 4.4.4: Customer Perception: Airport lounge comfort
Airport lounge Comfort%
In table 4.4.5 below, Transport to and fro was rated by 10% as far below expectations; 46.7% as
below expectations; 33.3% as meeting expectations and by 10% as above expectations.
36

Table 4.4.5: Customer Perception: Airport transport to and from airportFrequency Percent Valid Percent Cumulative Percent
Valid ‘ Far below expectations 9 10.0 10.0 10.0Below expectations 42 46.7 46.7 56.7Met expectations 30 33.3 33.3 90.0Above expectations 9 10.0 10.0 100.0Total 90 100.0 100.0
Diagram 4.4.5: Customer Perception: Rating of Airport transport to and from airport
A irport tran sport to and fro a irport
■ 1 j .
’:
kKl-SS
P B Sn __
1 i l l:
Far below expectatio Below Expectations Met expectations Above Expectations
Airport transport to and fro airport
Table 4.4.6: Customer Perception: Airport banking servicesFrequency Percent Valid Percent Cumulative Percent
Valid Below expectations 3 3.3 3.3 3.3Met expectations 66 73.3 73.3 76.7Above expectations 21 23.3 23.3 100.0Total 90 100.0 100.0
These were rated as below expectations by 3.3% of the respondents; as meeting expectations by
73.3% and above expectations by 23.3%
37

Diagram 4.4.6: Customer Perception: Airport banking services
A irport banking services
Below Expectations Met expectations Above Expectations
Airport banking services
Table 4.4.7: Customer Perception: Airport customer care services
Frequency Percent Valid Percent Cumulative PercentValid Below expectations 27 30.0 30.0 30.0
Met expectations 51 56.7 56.7 86.7Above expectations 3 3.3 3.3 90.0Far above expectations 9 10.0 10.0 100.0Total 90 100.0 100.0
Airport customer care services was rated by 30% as below expectations; 56.7% as met
expectations; 3.3% above expectations and 10% as far above expectations
Diagram 4.4.7: Customer Perception: Airport customer care services
Airport custom er care services
Below Expectations Met expectations Above Expectations Far above Expectatio
Airport customer care services
38

Table 4.4.8: Customer Perception: Airport waiting time to receive servicesFrequency Percent Valid Percent Cumulative Percent
Valid Far below expectations 6 6.7 6.7 6.7Below expectations 21 23.3 23.3 30.0Met expectations 51 56.7 56.7 86.7Above expectations 3 3.3 3.3 90.0Far above expectations 9 10.0 10.0 100.0Total 90 100.0 100.0
Rated far below expectations by 6.7%; below expectations by 23.3%; met expectations by
56.7%; above expectations by 3.3% and far above expectations by 10%
Diagram 4.4.8 Customer Perception: Airport waiting time to receive services
Airport waiting time to receive services
Far below expectatio Below Expectations Met expectations Above Expectations Far above Expectatio
Airport waiting time to receive services
Table 4.4.9: Customer Perceptions Mean Score of Key Variables for General Airport Services. Descriptive Statistics
Descriptive Statistics
N Minimum Maximum Mean Std. DeviationCustomer care services 90 3.00 5.00 4.7000 .52894
Waiting time to receive services
90 3.00 5.00 4.7333 .51495
Airport cleanliness 90 2.00 5.00 3.1333 1.02989
Airport sinage 90 1.00 4.00 2.9000 .60056
Airport business centre availab ly 90 1.00 4.00 2.1333 .99662
Airport lounge Comfort 90 1.00 5.00 2.4667 1.06212
Airport transport to and fro airport 90 1.00 4.00 2.4333 .80797
Airport banking services 90 2.00 4.00 3.2000 .47876
Airport customer care services
90 2.00 5.00 2.9333 .85853
Airport waiting time to receive services
90 1.00 5.00 2.8667 .96221
Airlines customer care services
90 2.00 5.00 3.0333 .60800
Airlines waiting time to receive services
90 2.00 4.00 2.8000 .65686
Valid N (listwise) 90
From the table of means above, there was little customer variance on expectations for most of the airline
dimensions. Only airport cleanliness and lounge comfort scored variances greater than 1.00. Cleanliness
had the highest mean (4.9000) while airport business center availability the lowest (2.1333).
39

Diagram 4.4.9: Perceived-Expected Service Gap-General Airport Services
4.5 C U ST O M ER PER C EPTIO N OF C U ST O M ER CARE AND W A ITIN G TIM E
AT THE A IR L IN ES DESK.
Table 4.5.1: Customer Perception: Airlines customer care services
Frequency Percent Valid percent Cumulative PercentValid Below expectations 12 13.3 13.3 13.3
Met expectations 66 73.3 73.3 86.7Above expectations 9 10.0 10.0 96.7Far above expectations 3 3.3 3.3 100.0Total 90 100.0 100.0
Airline customer care was rated by 13.3% as below expectations; 73.3% as met expectations; 10% as
above expectations and 3.3% as far above expectations.
Diagram 4.5.1: Customer Perception: Airlines customer care servicesAirlines customer care services
Airlines customer care services
40

Table 4.5.2: Customer Perception: Airlines waiting time to receive servicesFrequency Percent Valid Percent Cumulative Percent
Valid Below expectations 30 33.3 33.3 33.3Met expectations 48 53.3 53.3 86.7Above expectations 12 13.3 13.3 100.0Total 90 100.0 100.0
Airline waiting time was rated below expectations by 33.3%; met expectations by 53.3% and above
expectations by 13.3% of the respondents.
Diagram 4.5.2: Customer Perception: Airlines waiting time to receive services
Airlines waiting time to receive services
Below Expectations
Airlines waiting time to receive services
4.6 CUSTOMER PERCEPTION OF CUSTOMER CARE AND WAITING TIME AT
THE SECURITY DESK.
Table 4.6.1: Customer Perception: Security customer care services
Frequency Percent Valid Percent Cumulative PercentValid Below Expectations 18 20.0 20.0 20.0
Met expectations 60 66.7 66.7 86.7Above expectations 3 3.3 3.3 90.0Far above expectations 9 10.0 10.0 100.0Total 90 100.0 100.0
Security customer care services were rated by 20% as below expectations; 66.7% as meeting
expectations; 3.3% as above expectations and by 10% as far above expectations.
41

Diagram 4.6.1: Customer Perception: Security customer care servicesSecurity customer care services
80 ------------------------------------------------------------------
70 -
Below Expectations Met expectations Above Expectations Far above Expectatio
Security customer care services
In table 4.5.2 below, 13.3% rated security waiting time as far below expectations; 43.3% as below
expectations; 33.3% as meeting expectations and 10% as above expectations
Table 4.6.2: Customer Perception: Security waiting time to receive servicesFrequency Percent Valid Percent Cumulative
PercentValid Far below expectations 12 13.3 13.3 13.3
Below expectations 39 43.3 43.3 56.7Met expectations 30 33.3 33.3 90.0Above expectations 9 10.0 10.0 100.0Total 90 100.0 100.0
Diagram 4.6.2: Customer Perception: Security waiting time to receive services
Security waiting time to receive services
Security waiting time to receive services
42
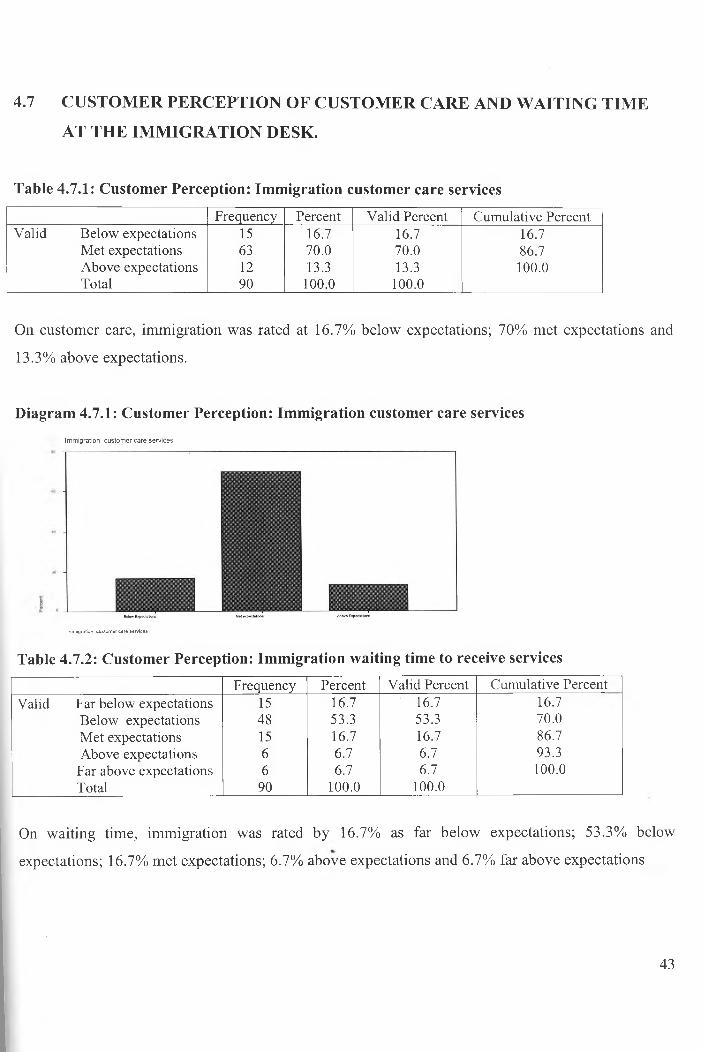
4.7 C U ST O M E R PER C EPTIO N OF C U ST O M ER CARE A N D W A IT IN G TIM E
AT TH E IM M IG R A T IO N DESK.
Table 4.7.1: Customer Perception: Immigration customer care services
Frequency Percent Valid Percent Cumulative PercentValid Below expectations 15 16.7 16.7 16.7
Met expectations 63 70.0 70.0 86.7Above expectations 12 13.3 13.3 100.0Total 90 100.0 100.0
On customer care, immigration was rated at 16.7% below expectations; 70% met expectations and
13.3% above expectations.
Diagram 4.7.1: Customer Perception: Immigration customer care servicesImmigration customer care services
Immigration customer care services
Table 4.7.2: Customer Perception: Immigration waiting time to receive servicesFrequency Percent Valid Percent Cumulative Percent
Valid Far below expectations 15 16.7 16.7 16.7Below expectations 48 53.3 53.3 70.0Met expectations 15 16.7 16.7 86.7Above expectations 6 6.7 6.7 93.3Far above expectations 6 6.7 6.7 100.0Total 90 100.0 100.0
On waiting time, immigration was rated by 16.7% as far below expectations; 53.3% below
expectations; 16.7% met expectations; 6.7% above expectations and 6.7% far above expectations
43

Diagram 4.7.2: Customer Perception: Immigration waiting time to receive servicesImmigration waiting time to receive services
Immigration waiting time to receive services
4.8 C U ST O M E R PE R C E PT IO N O F C U ST O M ER CARE A N D W A IT IN G TIM E
AT TH E C U STO M S DESK.
Table 4.8.1: Customer Perception: Customs customer care servicesFrequency Percent Valid percent Cumulative Percent
Valid Far below expectations 9 10.0 10.0 10.0Below expectations 33 36.7 36.7 46.7Met expectations 36 40.0 40.0 86.7Above expectations 9 10.0 10.0 96.7Far above expectations 3 3.3 3.3 100.0Total 90 100.0 100.0
On customer care, customs were rated by 10% of the respondents as far below expectations; by
36.7% as below expectations; 40% as meeting expectations; 10% as above expectations and 3.3% as
far above expectations.
Diagram 4.8.1: Customer Perception: Customs customer care services
Customs customer care services
Customs customer care services
44

Table 4.8.2: Customer Perception: Customs waiting time to receive servicesFrequency Percent Valid Percent Cumulative Percent
Valid Far below expectations 27 30.0 30.0 30.0Below expectations 30 33.3 33.3 63.3Met expectations 21 23.3 23.3 86.7Above expectations 9 10.0 10.0 96.7Far above expectations 3 3.3 3.3 100.0Total 90 100.0 100.0
On waiting time, customs were rated as far below expectations by 30% of the respondents; below
expectations by 33.3%; met expectations by 23.3%; above expectations by 10% and far above
expectations by 3.3%
Diagram 4.8.2: Customer Perception: Customs waiting time to receive servicesCustoms waiting time to receive services
Customs waiting time to receive services
Table 4.8.3: Customer Perceptions Mean Score of Key Variables for Specific Services/Providers. Descriptive Statistics
Descriptive Statistics
N M in im u m M a x im u m M e a n S td . D e v ia tio n
S e c u r ity c u s to m e r c a re
s e rv ic e s90 2 .0 0 5 .0 0 3 .0 3 3 3 .7 9 9 5 8
S e c u r ity w a it in g t im e to
re c e iv e s e rv ic e s90 1 .00 4 .0 0 2 .4 0 0 0 .8 4 5 3 4
Im m ig ra tio n c u s to m e r
c a re s e rv ic e s90 2 .0 0 4 .0 0 2 .9 6 6 7 .5 4 9 7 7
Im m ig ra tio n w a itin g
t im e to re c e iv e s e rv ic e s90 1.00 5 .0 0 2 .3 3 3 3 1 .0 4 93 4
C u s to m s c u s to m e r
c a re s e rv ic e s90 1.00 5 .0 0 2 .6 0 0 0 .9 2 1 6 5
C u s to m s w a it in g t im e to
re c e iv e s e rv ic e s9 0 1.00 5 .0 0 2 .2 3 3 3 1 .0 9 1 8 5
V a lid N ( lis tw is e ) 90
45

For the other outlets under investigation, security customer care services had the highest mean of
3.0333 the lowest ranked being immigration waiting time to receive services (mean of 1.04934).
Lowest standard deviation went to immigration customer care services (0.54977) and the highest to
customs waiting time to receive services (1.09185). For the airlines, the means for these two variables
(Table 4.3.9, Pg 51) average at 3, with similar S.D in the order of 0.6000.
Diagram 4.8.3: Perceived -Expected Service Gap- Specific Service Providers/Services
46

CHAPTER FIVE
5.0 CONCLUSIONS AND RECOMMENDATIONS
5.1 INTRODUCTION
This chapter will discuss the findings of the research in relation to the two objectives of the study.
5.2 SUMMARY OF FINDINGS
The first objective of the research was to determine the level of service quality as perceived by airline
passengers at JKIA.
V ariables Expected M ean (E)
ExpectedSD
Perceived M ean (P)
PerceivedSD Q (P-E)
Airport Cleanliness 4.9 0.3017 3.1333 1.02989 -1.7667Airport Signage 4.4 0.4926 2.9 0.60056 -1.5Business centre availability
3.7333 0.68372.1333
0.99662-1.6
Lounge comfort 4.6 0.4926 2.4667 1.06212 -2.1333Transport to and from airport
4.1333 0.56492.4333
0.80797-1.7
Banking services 4.2333 0.8487 3.2 0.47876 -1.0333Customer care services 4.7 0.5289 2.9333 0.85853 -1.7667Waiting time 4.7333 0.5149 2.8667 0.96221 -1.8666
Using the simple discontinuation model as originally elucidated by Parasuraman et al. (1985), where
perceived service quality (Q) is being the difference between perceived service (P) and expected
service (E) or Q=P-E, then a perceived mean of 3.1333 indicates a gap o f -1.7667 (3.1333-4.9). This
negative value indicates an overall drop in airport cleanliness quality as perceived by the customer. In
Table 5.2.1, this trend is observed in all the eight variables under investigation. Thus, the airport
service quality does not meet the customer expectations on all eight variables under investigation.
66.6% rated airport cleanliness as meeting or exceeding expectations. However, there are still a high
percentage of customers not pleased with this service (33.4%) and this is a major area for
improvement. This is particularly important, as
47

airport cleanliness was the highest ranked variable with a mean of 4.9 and the lowest standard
deviation of 0.3017. On the other extreme, business centre availability was rated by only 36.7% as
meeting or exceeding expectations. Again, this is an area for improvement.
Banking services performed best among the eight variables with the lowest perceived service quality
gap (-1.0333) indicating a high correlation between expectations and perception (actual service
received). 80% rated banking services as important or very important while 96.6% rated these
services as meeting or exceeding expectations.
The negative perception of service quality by customers could be as a result of increased awareness
of needs among the customers in general.
The second objective was to establish challenges the Kenya Airports Authority faces in order to
ensure high quality service delivery to airline passengers using Jomo Kenyatta International Airport.
The following were noted
a. Congestion. The airport was built in 1978 to handle 2.5 million passengers per year, but it
currently handles over 4 million passengers per year.
b. There are too many regulators at the airport who are poorly trained in customer service.
c. Passenger seats are plastic, too old and need urgent replacement.
d. The toilet infrastructure is in need of rehabilitation.
e. The departure lounge is congested with too many duty free shops selling the same items.
f. Procurement procedures are cumbersome.
g. Arrival and departure passengers are not well separated causing a major security threat to air
travel.
h. There are too many taxi and tour operators at the airport
i. Complaint handling is inefficient-takes too long to for instance, resolve issues of lost luggage.
j. Long queues during peak hours at the airport and almost no activity in some hours
48

5.3 LIMITATIONS OF THE RESEARCH
The study was limited by poor resource availability e.g. time and money. Also, the researcher was not
able to cover the entire scope of all the issues relating to service quality, only the eight variables.
Regarding the method of analysis, the research would have obtained more precise results had there
been weighting of the customer expectations (see Parasuraman et al., 1991)
5.4 RECOMMENDATIONS FOR FURTHER RESEARCH
On the area of airport perceived service quality, it is recommended that replications of this research
be done on all other international Airport’s in Kenya to provide a benchmark for comparison among
the airports. It would also be good for Jomo Kenyatta International Airports if the same were to be
done regionally.
5.5 OVERALL CONCLUSION
From the results of the research, it can be safely concluded that there is a need for marked overhaul of
airport services in order to improve service delivery. One way that this could be done is through
expansion and renovations to increase the service delivery interface area; enhance the ability of the
regulators; improve complaints handling process and procurement procedures; co-ordinate the
different airlines schedules to prevent periodical congestion and streamlining of auxiliary transport
services. These should as much as possible reflect the international standards for these services.
49

REFERENCES
Albrecht, K. (1992), The Only Thing That Matters. Harper Collins, New York, NY
Albrecht, K. and Zemke, R., Service America! Warner Books, New York, NY
Babakus, E., Boiler, G. W. (1992), An empirical assessment of the SERVQUAL scale, Journal of Business Research, Vol. 24 No. 3, pp. 253-68
Bolton, R. N, and Drew, J. H. (1991), A Multistage Model of Consumers’ Assessments of Service Quality and Value, Journal of Consumer Research. Vol. 17 pp. 375-84.
Brown, S. and Swartz, T. A. (1989), "A Gap Analysis Of Professional Service Quality’", Journal of Marketing, Vol. 53, pp. 92-8
Butterworth, K. (1990), To Compete Globally, American Firms Must Know Their Customers, American Manufacturing In A Global Market, Kluwer Academic Publishers, and Boston, MA
Buzzell, R. D. and Gale, B. T. (1987), The PIMS Principles, Free Press, New York, NY
Cadotte, E. R., Woodruff, R. B. and Jenkins, R. L. (1987), Expectations And Norms In Models Of Consumer Satisfaction, Journal of Marketing Research, Vol. 14, pp. 305-14
Carman, J. M. (1990), Consumer Perceptions of Service Quality: An Assessment Of The SERVQUAL Dimensions, Journal of Retailing, Vol. 66, pp. 33-55
Cronin, J. J. and Taylor, S. A. (1992), Measuring Service Quality: A Reexamination And Extension, Journal of Marketing, Vol. 56 pp. 55-68
Cronin, J. J. and Taylor, S. A. (1994), SERVPERF versus SERVQUAL: Reconciling Performance- Based And Perception-Minus-Expectations Measurement Of Service Quality, Journal of Marketing, Vol. 58, pp. 55-68
Dodds, W. B., Monroe, K. B. and Grewal, D (1991), The Effect Of Price, Brand And Store Information On Buyers’ Product Evaluations, Journal of Marketing Research, Vol. 28 pp. 307-19
Donnelly J. H., Berry L. L., and Thompson T. W. (1985), Marketing Financial Services, Dow Jones- Irwin, Homewood, Illinois
Donnelly, M., Wisniewski, M., Dalrymple, J. F. and Curry, A. C. (1995), Measuring Service Quality In Local Government: The SERVQUAL Approach, International Journal of Public Sector Management, Vol. 8, No. 7, pp. 15-20
Drucker, P. F. (1964), The Customer Is The Business, Harper and Row, New York, NY
Ennew, C., Watkins, T. and Wright, M. (1990), Marketing of Financial Services, Woburn, Oxford Press, United Kingdom
50

Evelyn, J. J. and DeCarlo, N. J. (1992), "Customer Focus Helps Utility See The Light", The Journal Of Business Strategy, pp. 8-12
Fomell, C. (1992), "A National Customer Satisfaction Barometer: The Swedish Experience", Journal of Marketing, Vol. 56 pp. 6-21
Freeman, K. D. and Dart, J. (1993), "Measuring the perceived quality of professional business services", Journal of Professional Services Marketing. Vol. 9, No. 1, pp. 27-47
Graham, A. (2003), Managing Airports, Second Edition, Butterworth-Heinemann, Oxford, London
Graham, A. (2005), Airport Benchmarking: A Review Of The Current Situation, Benchmarking: An International Journal, Vol. 12, No. 2, pp. 99-111
Gronroos, C. (1982), Strategic Management and Marketing in Service Sector, Marketing Science Institute, Cambridge, MA.
Hartmann, R. S. (1967), The Structure of Value: Foundations of a Scientific Axiology, Southern Illinois Press, Carbondale, IL
Johnson, C. and Mathews, B. P. (1997), The influence of experience on service expectations, International Journal of Service Industry Management, Vol. 8, No. 4, pp. 290-305
Kandie, P. (2002),”An Investigation Of Customer Perception and Expectation of Quality Service: The Case of Selected Banks in Kenya” Unpublished MBA Research Project, University Of Nairobi, Nairobi, Kenya
Kellogg, D. L., Youngdahl, W. E. and Bowen, D. E. (1997), On The Relationship Between Customer Participation And Satisfaction: Two Frameworks, International Journal of Service Industry Management, Vol. 8, No. 3, pp. 206-19
Kenya Airports Authority (2001), Jomo Kenyatta International Airport Customer Service Survey Draft Report
Kotler, P and Armstrong, G. (2000), Principles Of Marketing, Ninth Edition, Prentice-Hall, Inc., Upper Saddle River, New Jersey 07458
Kotler, P. (1999), Marketing Management, Analysis, Planning, Implementation and Control, Seventh Edition, Prentice-Hall of India Private Limited, New Delhi-110001
Lehtinen, J.R., Lehtinen, U. (1982). Service quality: a study of quality dimensions, Service Management Institute, Helsinki, unpublished working paper.
Lemaitre, A. (1998), "The Development Of Performance Indicators At Airports: A Management Perspective", Paper Presented At The 8th World Conference On Transport Research, Antwerp, July
Lewis, B. R. and Mitchell, V. W. (1990), "Defining and measuring the quality of customer service", Marketing Intelligence and Planning, Vol. 8 No. 6, pp. 11-17
Maina J. M. (2003),”Factors That Determine Perceived Quality Of Service In The Insurance Industry In Kenya,” Unpublished MBA Research Project, University Of Nairobi, Nairobi, Kenya
51

Maina, P. M. (2001),’’Perceived Service Quality: The Case Of Mobile Phone Services,” Unpublished MBA Research Project, University Of Nairobi, Nairobi, Kenya
Masinde, C. K. M (1986),’’Perceived Quality Of Service: The Case Of Kenya Airways,” ” Unpublished MBA Research Project, University Of Nairobi, Nairobi, Kenya
Miller, T. O. (1992), "A Customer’s Definition Of Quality", The Journal Of Business Strategy, pp. 4-7
Muriithi, R. N. (1996),’’Analysis Of Customer Service Offered By Kenyan Commercial Banks,” Unpublished MBA Research Project, University Of Nairobi, Nairobi, Kenya
Murugu, A. N. (2003), “Perceived Quality Of Service In The Mortgage Sector: The Case Of HFCK”, Unpublished MBA Research Project, University Of Nairobi, Nairobi, Kenya
Mwaura, A. K. (2002),’’Perceived Service Quality: The Case Of Matatu Industry,” Unpublished MBA Research Project, University Of Nairobi, Nairobi, Kenya
Mwenda, A. M. (1987),’’Perceived Quality Of Port Services: The Case Of Kenya Ports Authority,” Unpublished MBA Research Project, University Of Nairobi, Nairobi, Kenya
Njoroge, J. K. (2005), “Customers Perception Of Service Quality In A Decentralized System In The Public Utility Sector In Kenya: The Case Of KPLC Ltd” Unpublished MBA Research Project, University Of Nairobi, Nairobi, Kenya
Parasuraman, A., Zeithaml, V. A., Berry, L. L. (1985), A Conceptual Model of Service Quality and its implications for Future Research, Journal of Marketing, Vol. 49, pp. 41-50
Parasuraman, A., Zeithaml, V. A. and Berry, L. L. (1988), "SERVQUAL: A Multiple-Item Scale For Measuring Consumer Perceptions Of Service Quality", Journal of Retailing;, Vol. 64, pp. 12-40
Parasuraman, A., Berry, L. L., Zeithaml, V. A. (1991), Refinement and Reassessment of the SERVQUAL Scale, Journal of Retailing, Vol. 67 No. 4, pp. 420-50
Parasuraman, A., Zeithaml, V. A. and Berry, L. L. (1994), "Reassessment of expectations as a comparison standard in measuring service quality: implications for further research", Journal of Marketing, pp. 111-24
Patterson, P. G. and Spreng, R. A. (1997), Modeling The Relationship Between Perceived Value, Satisfaction And Repurchase Intentions In A Business-To-Business, Services Context: An Empirical Examination, International Journal of Service Industry Management, Vol. 8, No. 5, pp. 414-34
Perrin, T (1991), Competing In A New Market: Is Airline Management Prepared? San Francisco, CA.
Peters, T. J, Waterman Jr, R. H. (1982), In Search of Excellence, Harper and Row, New York, NY.
Porter, M. E. (1980), Competitive Strategy: Techniques for Analyzing Industries and Competitors, Free Press, New York, NY
Quiroz, A. (1995), Customer Service Improvement, Airport Management Development Program, International Aviation Management Training Institute, Montreal, Canada
52

Reichheld, F. F. and Sasser Jr., W. E. (1990), "Zero Defections: Quality Conies To Services", Flarvard Business Review, pp. 105-11
Robinson, S. (1999), Measuring Service Quality: Current Thinking and Future Requirements, Marketing Intelligence and Planning, Vol. 17, No. 1, pp. 21-32
Robinson, S. and Pidd, M. (1998), Provider and Customer Expectations of Successful Simulation Projects, Journal of the Operational Research Society. Vol. 49, No. 3, pp. 200-9
Robledo, M. A. (2001), Measuring and Managing Service Quality: Integrating Customer Expectations, Managing Service Quality. Vol. 11, No 1, pp. 22-31
Rust Ronald T., Anthony J. Zahovik and Timothy L. Keiningham (1996), Service Marketing, Harper- Collins College Publishers, New York
Schneider, B. and Bowen, D. E. (1995), Winning the Service Game, Harvard Business School Press, Boston, MA
Sellers, P. (1991), "Pepsi keeps going after No. 1", Fortune, pp. 62-70
Sonnenberg, F. K. (1991), Marketing To Win, Harper and Row, New York, NY
Sultan, F. and Simpson, M. C., Jnr (2000), International Service Variants: Airline Passenger Expectations And Perceptions Of Service Quality, Journal of Services Marketing. Vol. 14 No. 3, pp. 188-216
Taylor, C. (1994), The Editor Interviews... Bob Coleman, Director of Customer Services, Air UK Ltd, Managing Service Quality. Vol. 4 No. 1, pp. 11-13
Taylor, S. A. (1995), "Service Quality and Consumer Attitudes: Reconciling Theory and Measurement", in Swartz, T. A., Bowen, D. E., Brown, S.W. (Eds), Advances in Services Marketing and Management: Research and Practice, JAI Press, Greenwich, CT, Vol. 4 pp. -36
Teas, R. K. (1993a), Expectations, Performance Evaluation, And Consumers’ Perceptions Of Quality, Journal of Marketing. Vol. 57, No. 4, pp. 18-34
Zeithaml, V. A. (1988), Consumer perceptions of price, quality and value: a means-end model and synthesis of evidence, Journal of Marketing. Vol. 52 pp. 2-22.
Zeithaml, V. A., Parasuraman, A. and Berry, L. L. (1990), Delivering Quality Service, The Free Press, New York, NY
Zins, A. H. (1998), "Creating Customer Value In The Context Of Service Bundles", In Grey, B. J., Deans, K. R. (Eds), Marketing Connections, Proceedings of the ANZMAC Conference, University of Otago, Dunedin, pp. 2884-97
Zins, A. H. (2001), Relative Attitudes And Commitment In Customer Loyalty Models: SomeExperiences In The Commercial Airline Industry, International Journal of Service IndustryManagement, Vol. 12, No. 3, pp. 269-294
53

APPENDIX ONE
INTRODUCTION LETTER
Complimentary Letter to the Respondent.
University of Nairobi School Of Business Lower Kabete P. O. Box 30197 Nairobi 20th July 2006
Dear Sir/Madam,
I am a post graduate student at School of Business, University of Nairobi. In fulfillment of the requirements for attaining my degree, I am currently conducting a management research whose theme is determine the quality of service delivery by the Jomo Kenyatta International Airport management as perceived by airline passengers. To this end, I kindly request you to fill out the attached questionnaire to the best of your knowledge as soon as you can to facilitate this research.
I would like to assure you that all information provided will be used solely for the purpose of this research; be treated with the utmost confidence and in no way will your name be implicated in the research findings.
Your cooperation is highly appreciated. Thanking you in advance.
Yours respectfully,
Esther Gituanja:___________________
I

A PPEN D IX TW O
Q U ESTIO NN A IR E
Part I:
1. Kindly indicate your gender? [ ] Male; [ ] Female
2. Is this your first time to use this airport? [ ] Yes; [ ] No
3. If your answer in Q (3) above is No, then how often on average, do you use this airport in any given year?[ ]Once; [ ] Twice;[ ] Thrice; [ ] More than three times
4. Kindly indicate your age bracket below:[ ] under 18; [ ] 18-25; [ ] 26-35;[ ] 36-45; [ ] 46-55; [ ] above 55
5. Kindly indicate your level of education:[ ] Primary;[ ]Secondary;[ ] Tertiary
Part II:
1. Kindly rank the below service quality dimensions in order of their importance to you (expectations) __________ _________________________ ___ _________ _______
(5)VeryIm portan t
(4)Im portan t
(3)SomewhatIm portan t
(2)Not im portan t
(1)Not Im portan t at all
(a) Airport cleanliness(b) Airport signage(c)Business centre availability(d) Lounge comfort(e)Transport to and from airport(f)Banking services(g)Customer care services(h)Waiting time to receive services
II

2. Kindly rank the service you receive at various airport services centers (perceptions)
Airports(5)F a r Above Expectations
(4)AboveExpectations
(3)M etExpectations
(2)BelowExpectations
(1)F a r below Expectations
(a) Airport cleanliness(b) Airport signage(c)Business centre availability(d) Lounge comfort(e)Transport to and from airport(f)Banking services(g)Customer care services(h)Waiting time to receive services
Airlines(5)F a r Above Expectations
(4)AboveExpectations
(3)M etExpectations
(2)BelowExpectations
(1)F a r below Expectations
(a)Customer care services(b)Waiting time to receive services
Security(5)F a r Above Expectations
(4)AboveExpectations
(3)M etExpectations
(2)BelowExpectations
(1)F ar below Expectations
(a)Customer care services(b) Waiting time to receiveservices(Screening)
Immigration(5)F ar Above Expectations
(4)AboveExpectations
(3)M etExpectations
(2)BelowExpectations
(1)F a r below Expectations
(a)Customer care services(b)Waiting time to receive services
III

Customs(5)F ar Above Expectations
(4)AboveExpectations
(3)M etExpectations
(2)BelowExpectations
(1)F a r below Expectations
(a)Customer care services(b)Waiting time to receive services
Part III: (To be filled by the Kenya Airports Authority Management)
1. Kindly enumerate below the kinds of challenges faced by the K. A. A. in ensuring high
quality service delivery to airline passengers using Jomo Kenyatta International Airport.
IV
Related Documents