Fiscal Disparities Data for Pay 2019 The data Cities use the estimated distribution levy in setting their preliminary property tax levy. Three pieces of data are used in estimating these amounts. This data is presented in tables facilitated and reviewed by the Administrative Auditor (Anoka County serves this role for Metro Cities and St. Louis County does so for Iron Range cities). Tables will be posted to the LMC website once they become available. This preliminary data is provided in order to assist cities in the budgeting process. Each piece should be considered an estimate to aid in this process. Table V: Contribution net tax capacity (Column F for all counties) The following tables show the Contribution net tax capacity in column F for cities in the Iron Range. The data is organized by county. Calculated by multiplying the base year’s value by the previous year’s final contribution percentage. The product is then subtracted from the total previous year’s adjusted C/I tax capacity value. The final contribution percentage is calculated by multiplying the current year’s C/I non-preferred state classification percentage by the previous year’s C/I non- preferred state classification.

Welcome message from author
This document is posted to help you gain knowledge. Please leave a comment to let me know what you think about it! Share it to your friends and learn new things together.
Transcript
Fiscal Disparities Data for Pay 2019
The data
Cities use the estimated distribution levy in setting their preliminary property tax levy. Three
pieces of data are used in estimating these amounts. This data is presented in tables facilitated
and reviewed by the Administrative Auditor (Anoka County serves this role for Metro Cities and
St. Louis County does so for Iron Range cities). Tables will be posted to the LMC website once
they become available.
This preliminary data is provided in order to assist cities in the budgeting process. Each piece
should be considered an estimate to aid in this process.
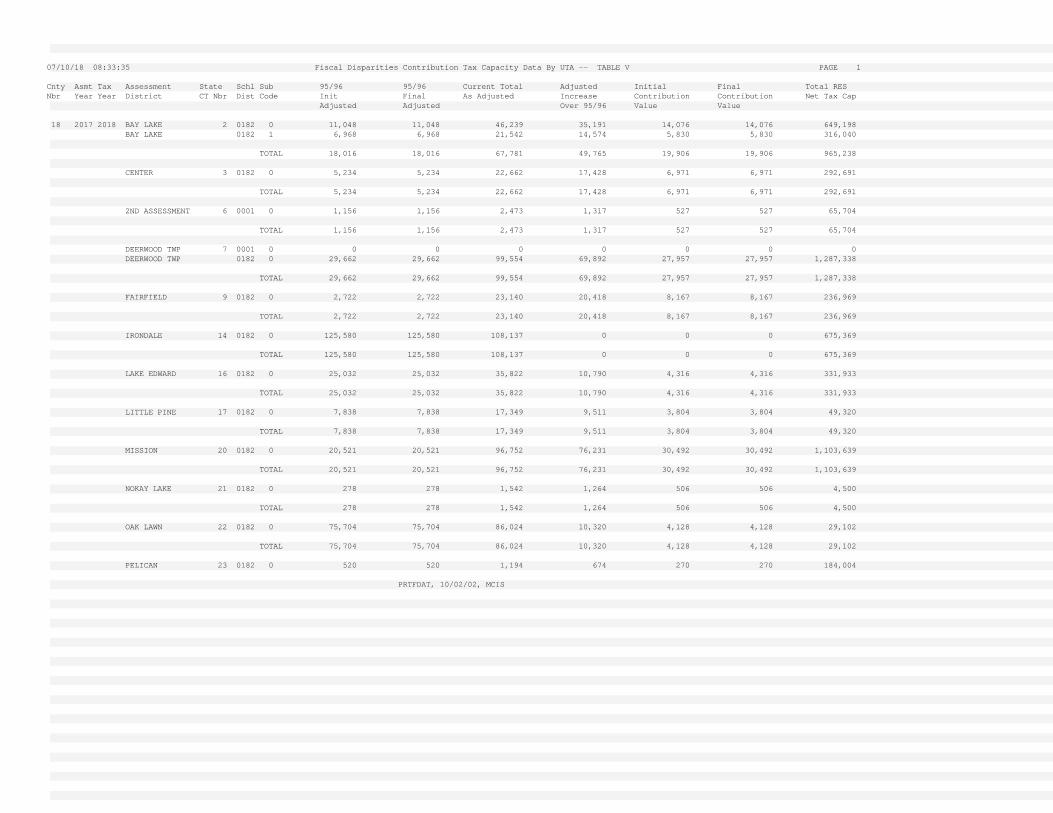
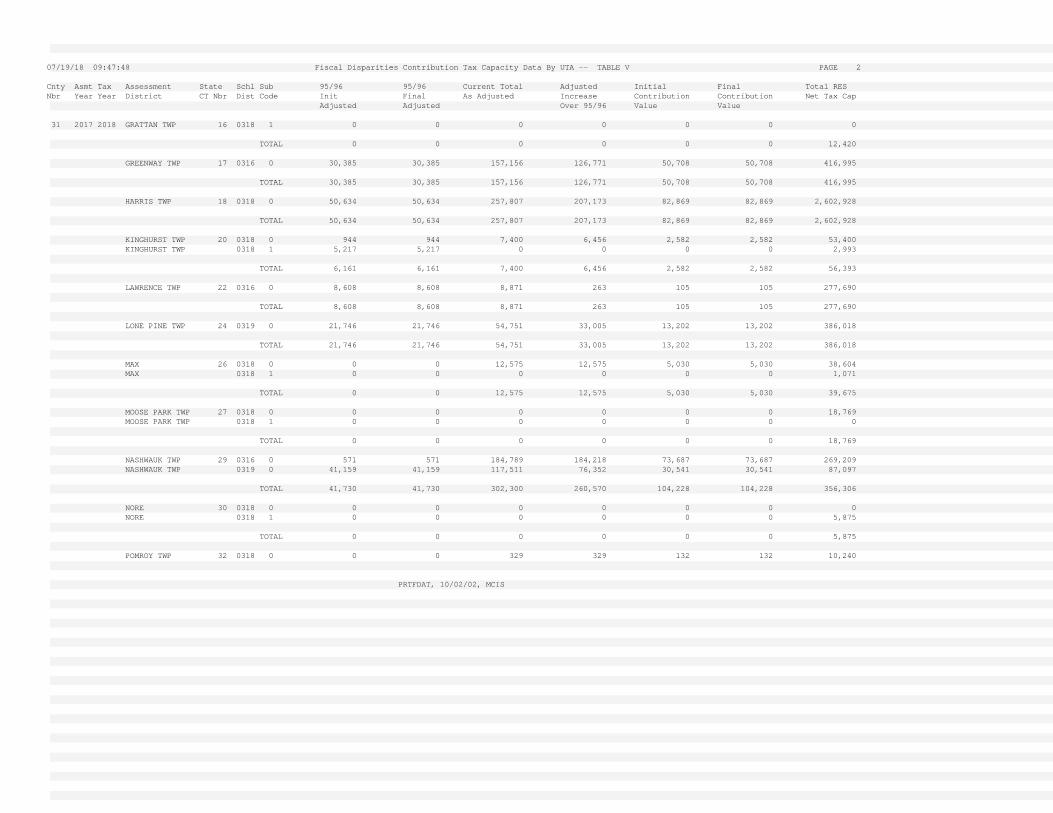
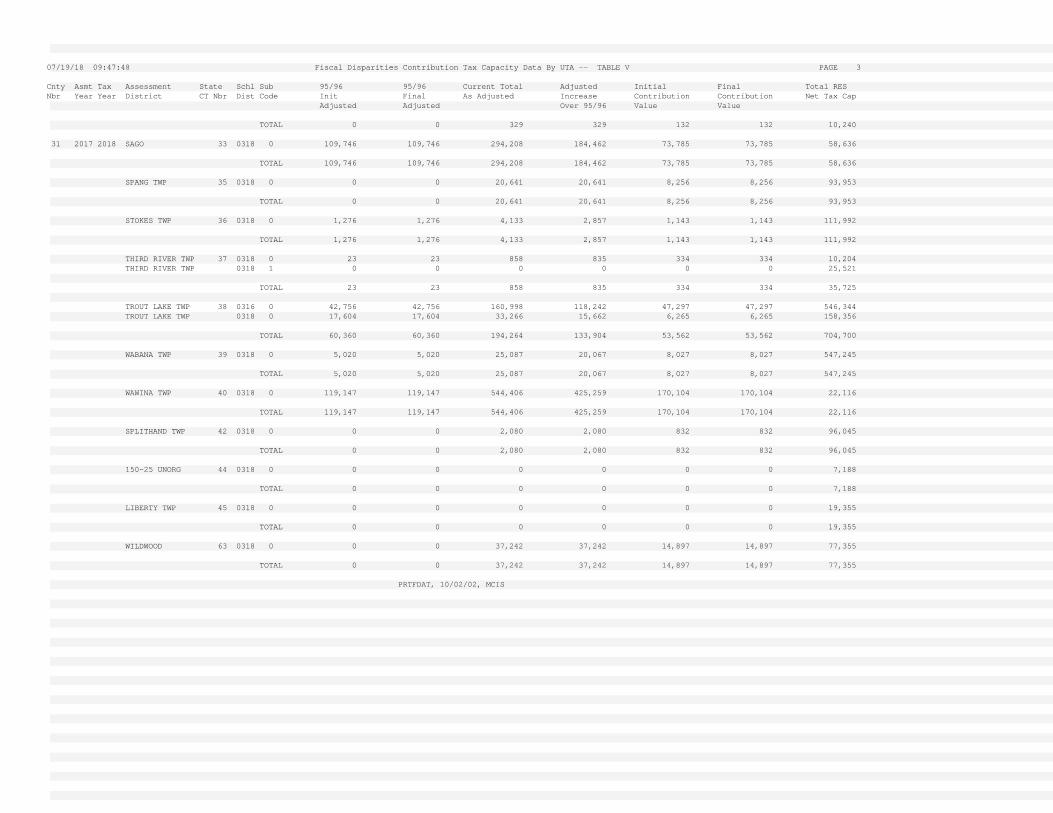
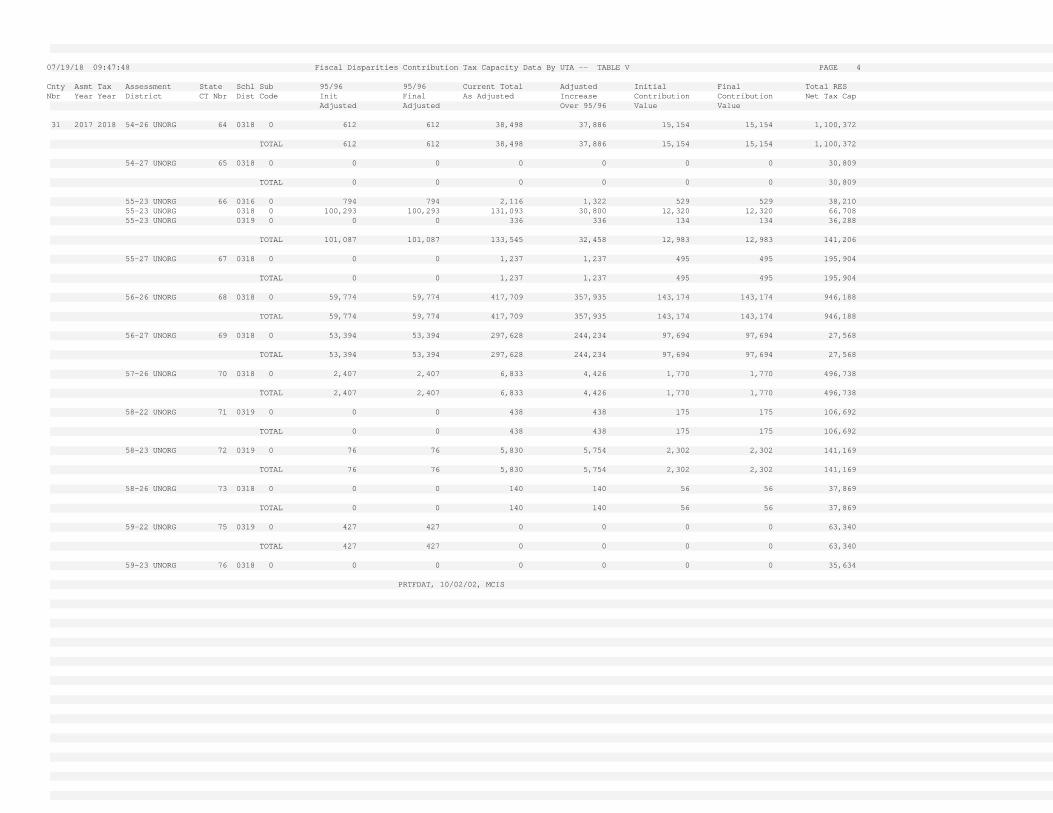
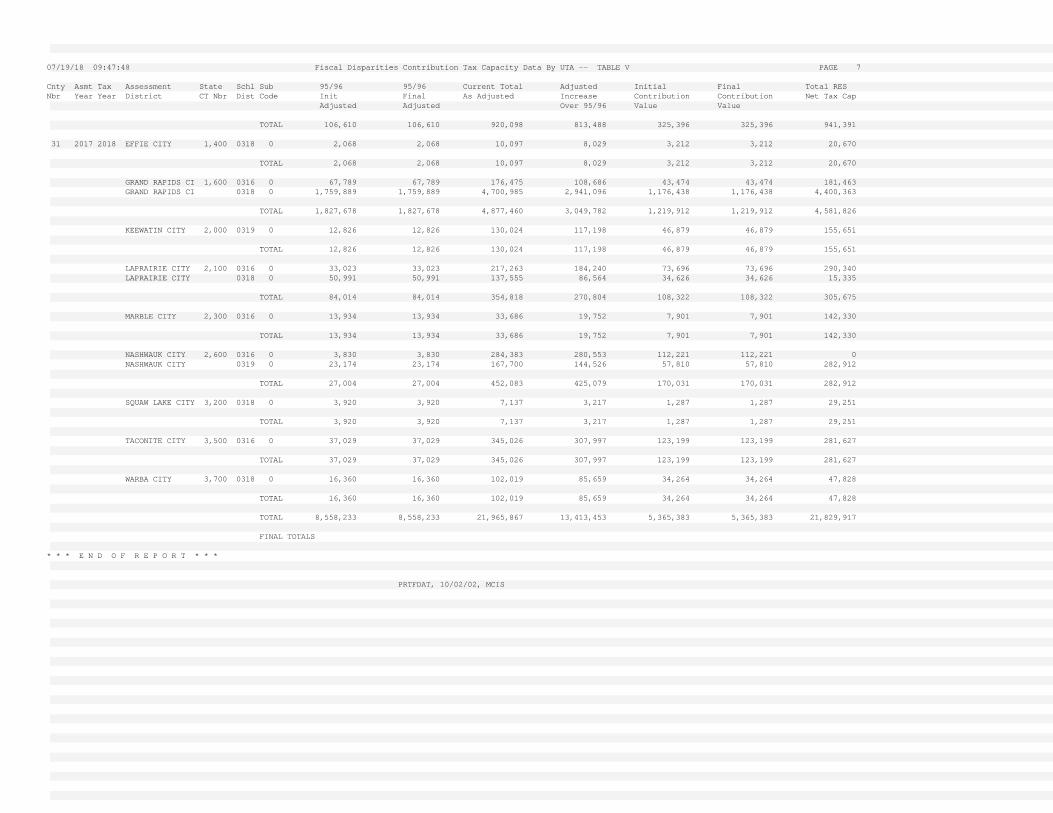
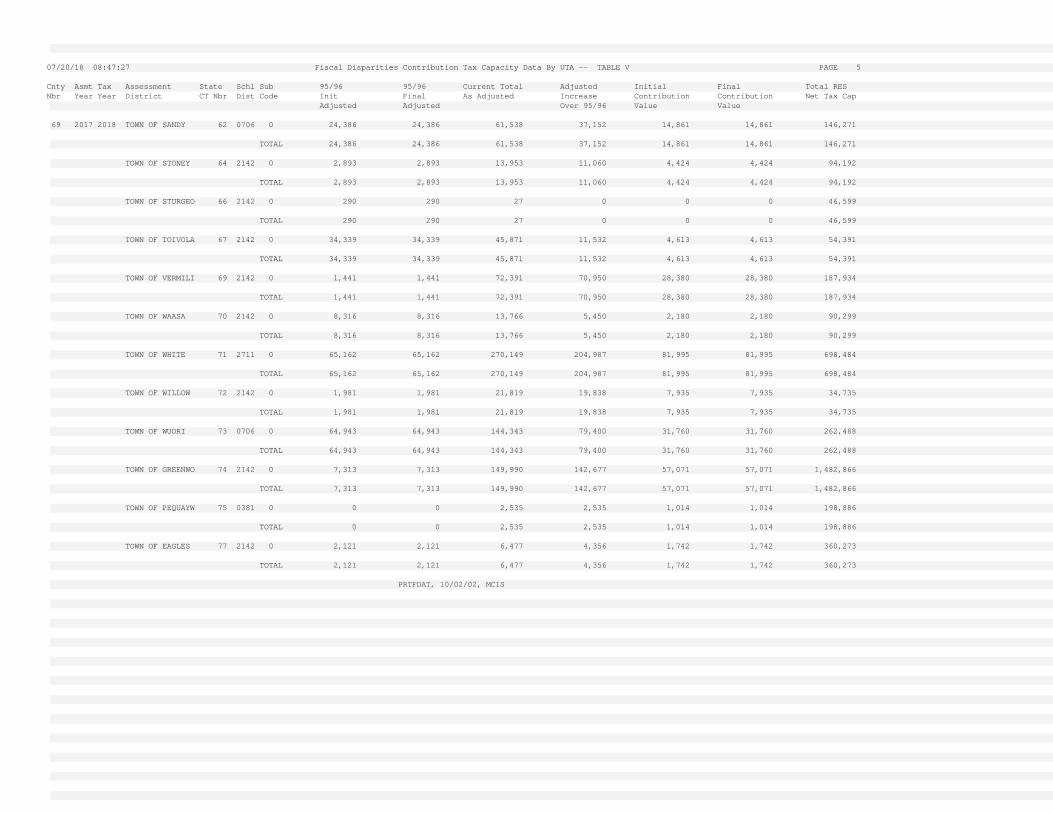
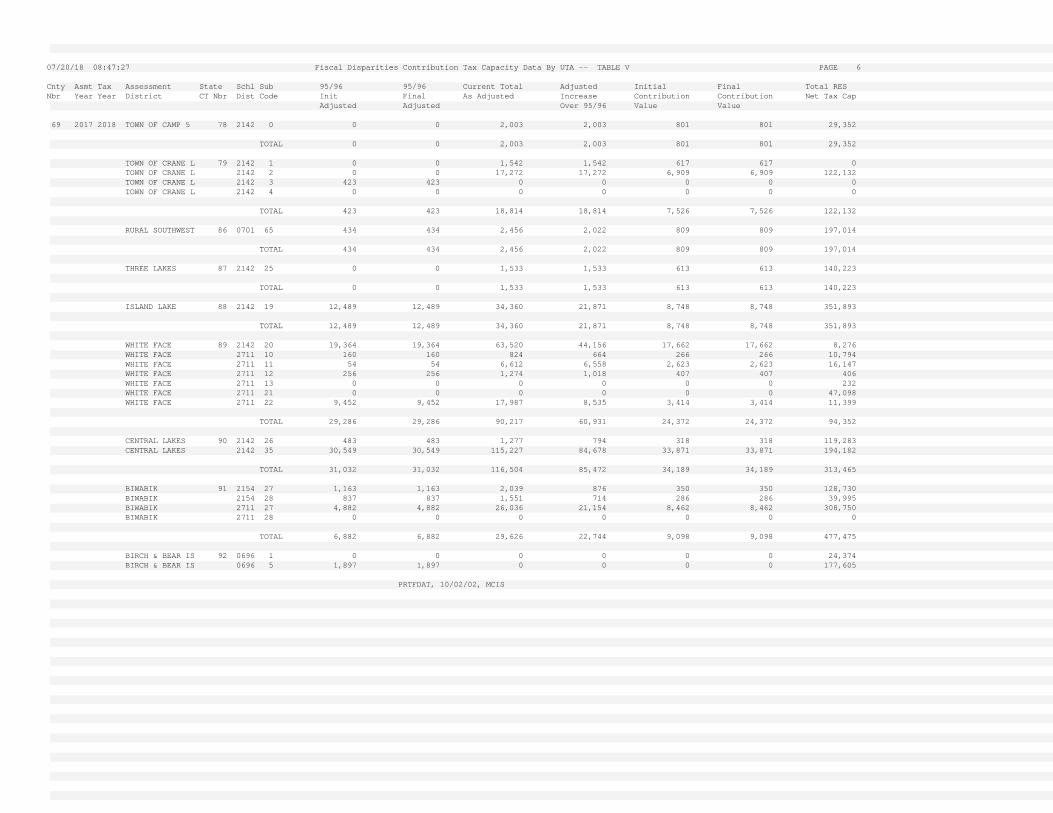
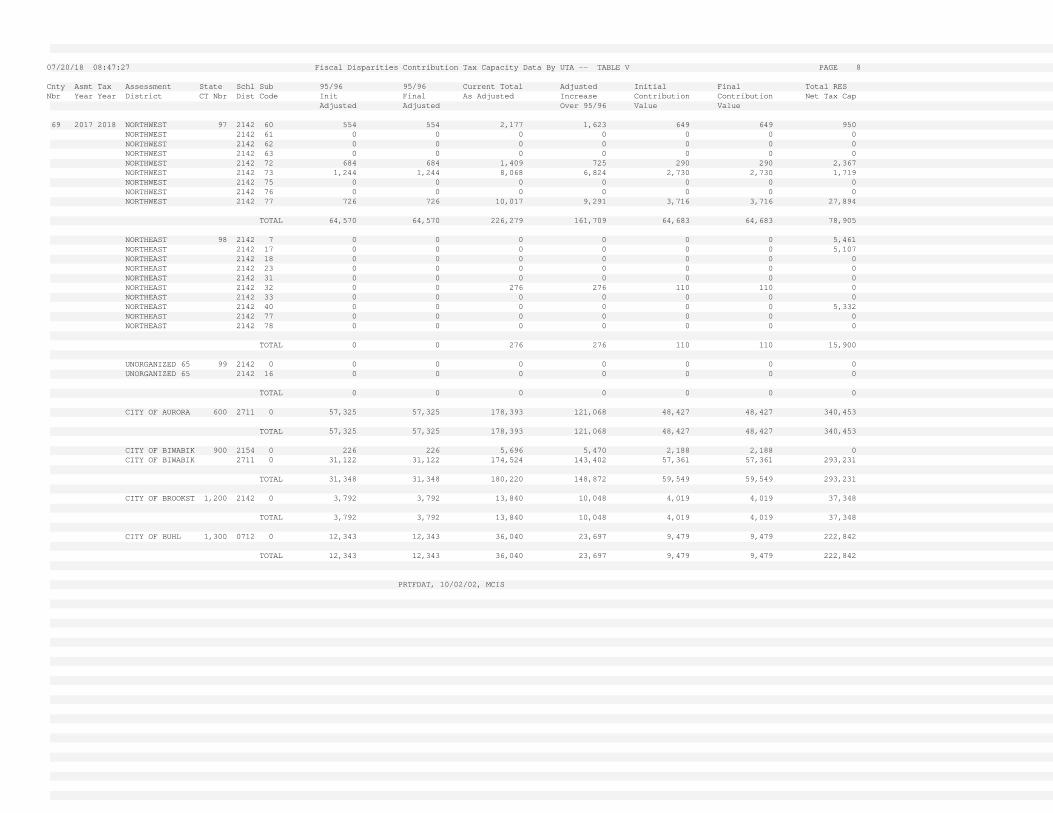
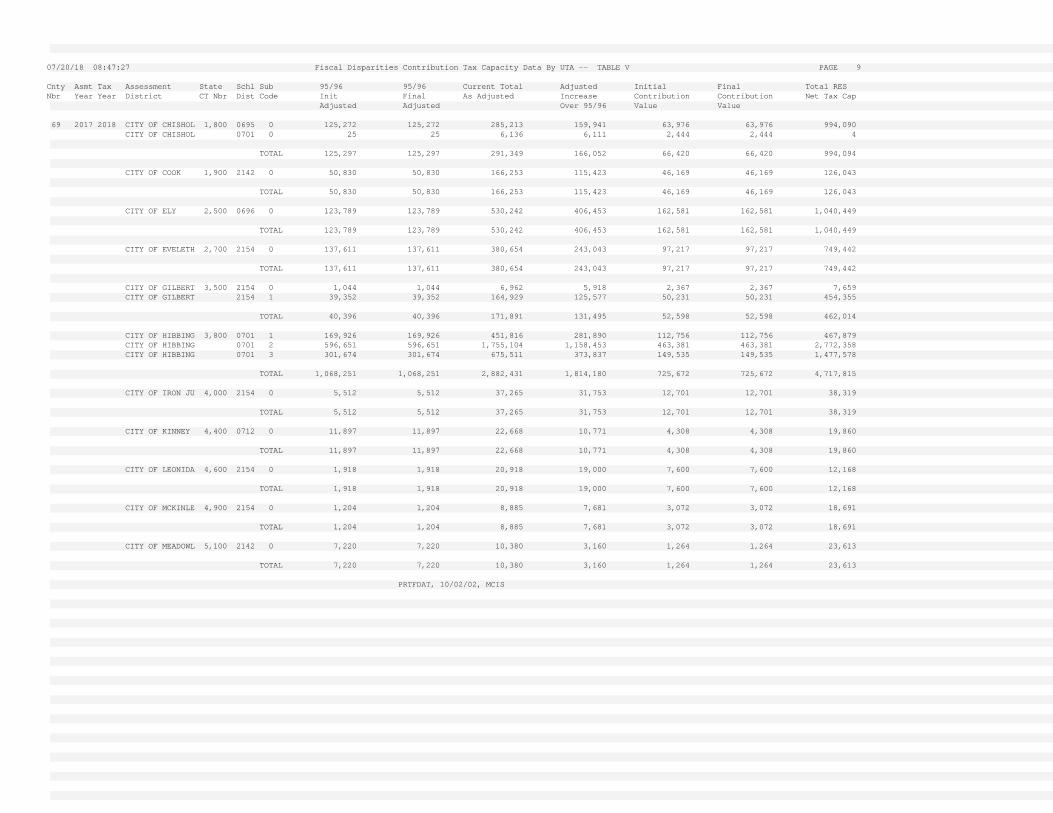
Table V: Contribution net tax capacity (Column F for all counties)
The following tables show the Contribution net tax capacity in column F for cities in the Iron
Range. The data is organized by county.
Calculated by multiplying the base year’s value by the previous year’s final contribution
percentage. The product is then subtracted from the total previous year’s adjusted C/I tax
capacity value. The final contribution percentage is calculated by multiplying the current
year’s C/I non-preferred state classification percentage by the previous year’s C/I non-
preferred state classification.

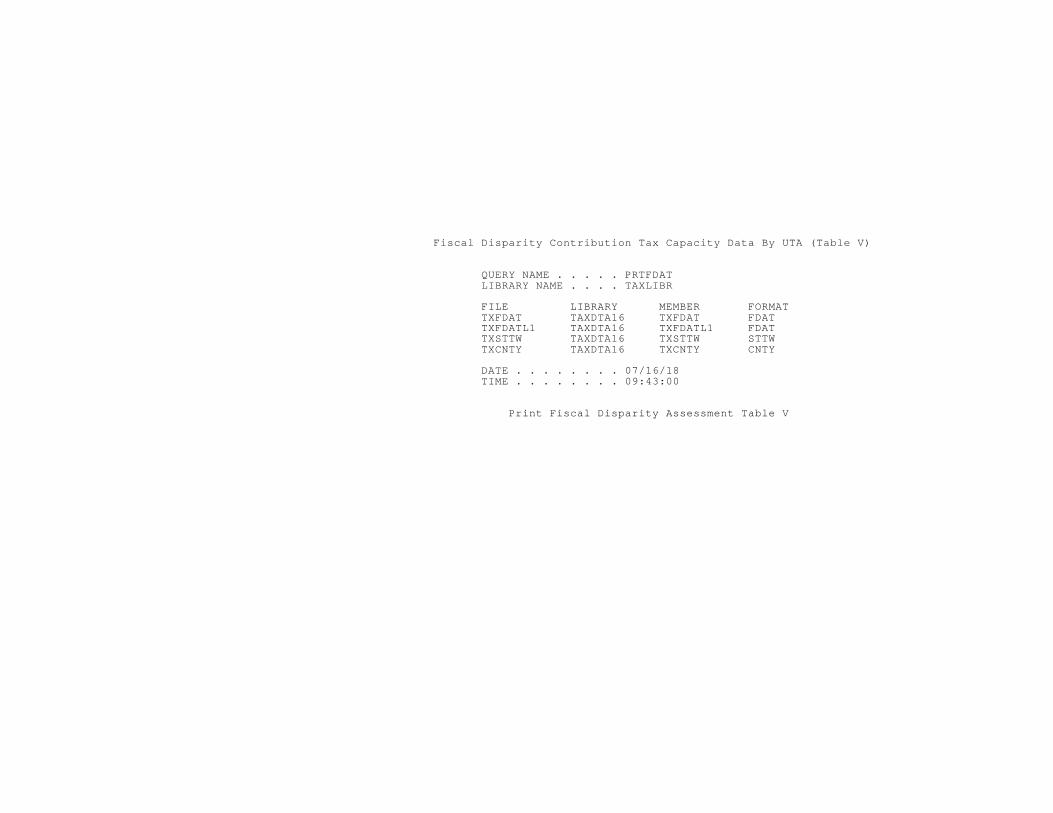
Fiscal Disparity Contribution Tax Capacity Data By UTA (Table V)
QUERY NAME . . . . . PRTFDAT LIBRARY NAME . . . . TAXLIBR
FILE LIBRARY MEMBER FORMAT TXFDAT TAXDTA01 TXFDAT FDAT TXFDATL1 TAXDTA01 TXFDATL1 FDAT TXSTTW TAXDTA01 TXSTTW STTW TXCNTY TAXDTA01 TXCNTY CNTY
DATE . . . . . . . . 07/10/18 TIME . . . . . . . . 10:56:45
Print Fiscal Disparity Assessment Table V

07/10/18 10:56:45 Fiscal Disparities Contribution Tax Capacity Data By UTA -- TABLE V PAGE 1
Cnty Asmt Tax Assessment State Schl Sub 95/96 95/96 Current Total Adjusted Initial Final Total RESNbr Year Year District CT Nbr Dist Code Init Final As Adjusted Increase Contribution Contribution Net Tax Cap Adjusted Adjusted Over 95/96 Value Value
1 2017 2018 AITKIN TWP 1 0001 0 30,333 30,333 132,070 101,737 40,695 40,695 589,058
TOTAL 30,333 30,333 132,070 101,737 40,695 40,695 589,058
FARM ISLAND TWP 8 0001 0 6,966 6,966 27,007 20,041 8,016 8,016 997,578
TOTAL 6,966 6,966 27,007 20,041 8,016 8,016 997,578
FLEMING TWP 9 0001 0 0 0 0 0 0 0 224,103
TOTAL 0 0 0 0 0 0 224,103
GLEN 10 0001 0 1,138 1,138 16,798 15,660 6,264 6,264 347,825
TOTAL 1,138 1,138 16,798 15,660 6,264 6,264 347,825
HAZELTON TWP 12 0001 0 3,997 3,997 22,080 18,083 7,233 7,233 748,667
TOTAL 3,997 3,997 22,080 18,083 7,233 7,233 748,667
KIMBERLY TWP 16 0001 0 15,707 15,707 50,665 34,958 13,983 13,983 96,845
TOTAL 15,707 15,707 50,665 34,958 13,983 13,983 96,845
LAKESIDE TWP 17 0001 0 690 690 19,215 18,525 7,410 7,410 27,862
TOTAL 690 690 19,215 18,525 7,410 7,410 27,862
LEE 18 0001 0 0 0 0 0 0 0 13,745
TOTAL 0 0 0 0 0 0 13,745
LIBBY TWP 19 0001 0 0 0 0 0 0 0 16,220
TOTAL 0 0 0 0 0 0 16,220
LOGAN TWP 20 0001 0 2,878 2,878 7,532 4,654 1,862 1,862 81,518
TOTAL 2,878 2,878 7,532 4,654 1,862 1,862 81,518
MALMO TWP 22 0001 0 7,879 7,879 32,846 24,967 9,987 9,987 243,927
TOTAL 7,879 7,879 32,846 24,967 9,987 9,987 243,927
MORRISON TWP 24 0001 0 154 154 4,247 4,093 1,637 1,637 57,249
TOTAL 154 154 4,247 4,093 1,637 1,637 57,249
PRTFDAT, 10/02/02, MCIS
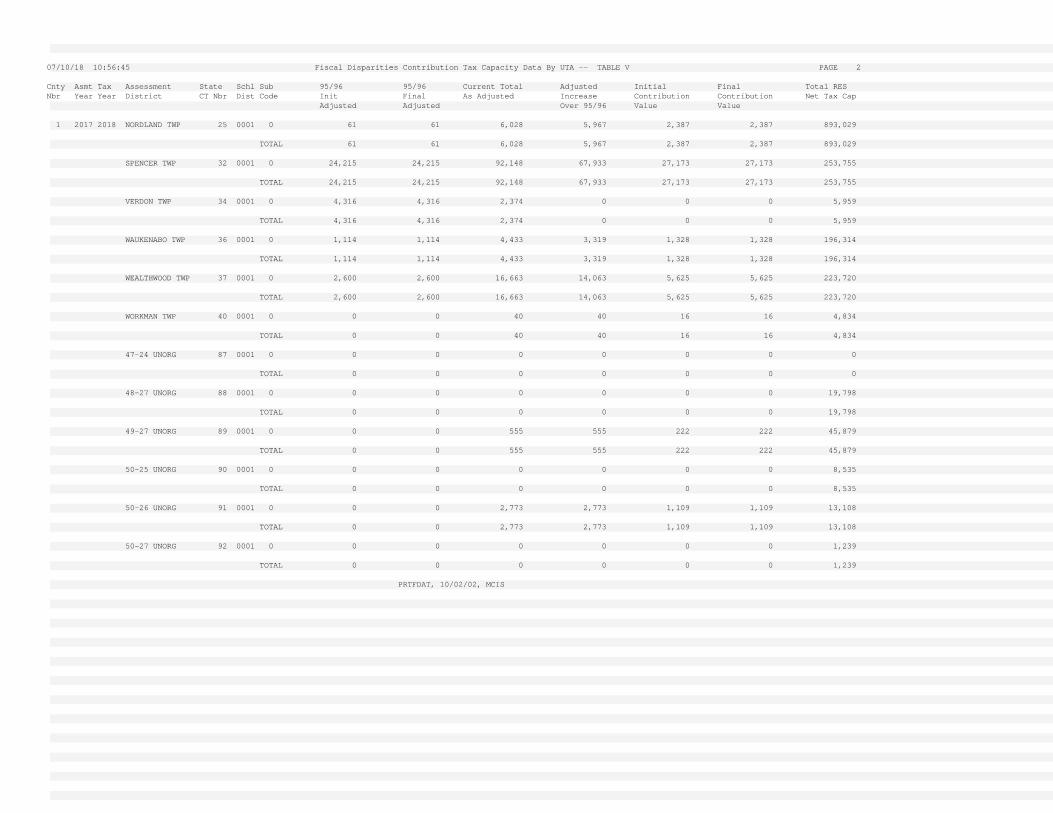
07/10/18 10:56:45 Fiscal Disparities Contribution Tax Capacity Data By UTA -- TABLE V PAGE 2
Cnty Asmt Tax Assessment State Schl Sub 95/96 95/96 Current Total Adjusted Initial Final Total RESNbr Year Year District CT Nbr Dist Code Init Final As Adjusted Increase Contribution Contribution Net Tax Cap Adjusted Adjusted Over 95/96 Value Value
1 2017 2018 NORDLAND TWP 25 0001 0 61 61 6,028 5,967 2,387 2,387 893,029
TOTAL 61 61 6,028 5,967 2,387 2,387 893,029
SPENCER TWP 32 0001 0 24,215 24,215 92,148 67,933 27,173 27,173 253,755
TOTAL 24,215 24,215 92,148 67,933 27,173 27,173 253,755
VERDON TWP 34 0001 0 4,316 4,316 2,374 0 0 0 5,959
TOTAL 4,316 4,316 2,374 0 0 0 5,959
WAUKENABO TWP 36 0001 0 1,114 1,114 4,433 3,319 1,328 1,328 196,314
TOTAL 1,114 1,114 4,433 3,319 1,328 1,328 196,314
WEALTHWOOD TWP 37 0001 0 2,600 2,600 16,663 14,063 5,625 5,625 223,720
TOTAL 2,600 2,600 16,663 14,063 5,625 5,625 223,720
WORKMAN TWP 40 0001 0 0 0 40 40 16 16 4,834
TOTAL 0 0 40 40 16 16 4,834
47-24 UNORG 87 0001 0 0 0 0 0 0 0 0
TOTAL 0 0 0 0 0 0 0
48-27 UNORG 88 0001 0 0 0 0 0 0 0 19,798
TOTAL 0 0 0 0 0 0 19,798
49-27 UNORG 89 0001 0 0 0 555 555 222 222 45,879
TOTAL 0 0 555 555 222 222 45,879
50-25 UNORG 90 0001 0 0 0 0 0 0 0 8,535
TOTAL 0 0 0 0 0 0 8,535
50-26 UNORG 91 0001 0 0 0 2,773 2,773 1,109 1,109 13,108
TOTAL 0 0 2,773 2,773 1,109 1,109 13,108
50-27 UNORG 92 0001 0 0 0 0 0 0 0 1,239
TOTAL 0 0 0 0 0 0 1,239
PRTFDAT, 10/02/02, MCIS

07/10/18 10:56:45 Fiscal Disparities Contribution Tax Capacity Data By UTA -- TABLE V PAGE 3
Cnty Asmt Tax Assessment State Schl Sub 95/96 95/96 Current Total Adjusted Initial Final Total RESNbr Year Year District CT Nbr Dist Code Init Final As Adjusted Increase Contribution Contribution Net Tax Cap Adjusted Adjusted Over 95/96 Value Value
1 2017 2018 51-25 UNORG 94 0001 0 0 0 0 0 0 0 364
TOTAL 0 0 0 0 0 0 364
AITKIN CITY 100 0001 0 136,365 136,365 718,760 582,395 232,958 232,958 750,154
TOTAL 136,365 136,365 718,760 582,395 232,958 232,958 750,154
PALISADE CITY 1,500 0001 0 4,321 4,321 10,478 6,157 2,463 2,463 40,214
TOTAL 4,321 4,321 10,478 6,157 2,463 2,463 40,214
TOTAL 242,734 242,734 1,166,712 925,920 370,368 370,368 5,901,499
FINAL TOTALS
* * * E N D O F R E P O R T * * *
PRTFDAT, 10/02/02, MCIS
Fiscal Disparity Contribution Tax Capacity Data By UTA (Table V)
QUERY NAME . . . . . PRTFDAT LIBRARY NAME . . . . TAXLIBR
FILE LIBRARY MEMBER FORMAT TXFDAT TAXDTA16 TXFDAT FDAT TXFDATL1 TAXDTA16 TXFDATL1 FDAT TXSTTW TAXDTA16 TXSTTW STTW TXCNTY TAXDTA16 TXCNTY CNTY
DATE . . . . . . . . 07/16/18 TIME . . . . . . . . 09:43:00
Print Fiscal Disparity Assessment Table V
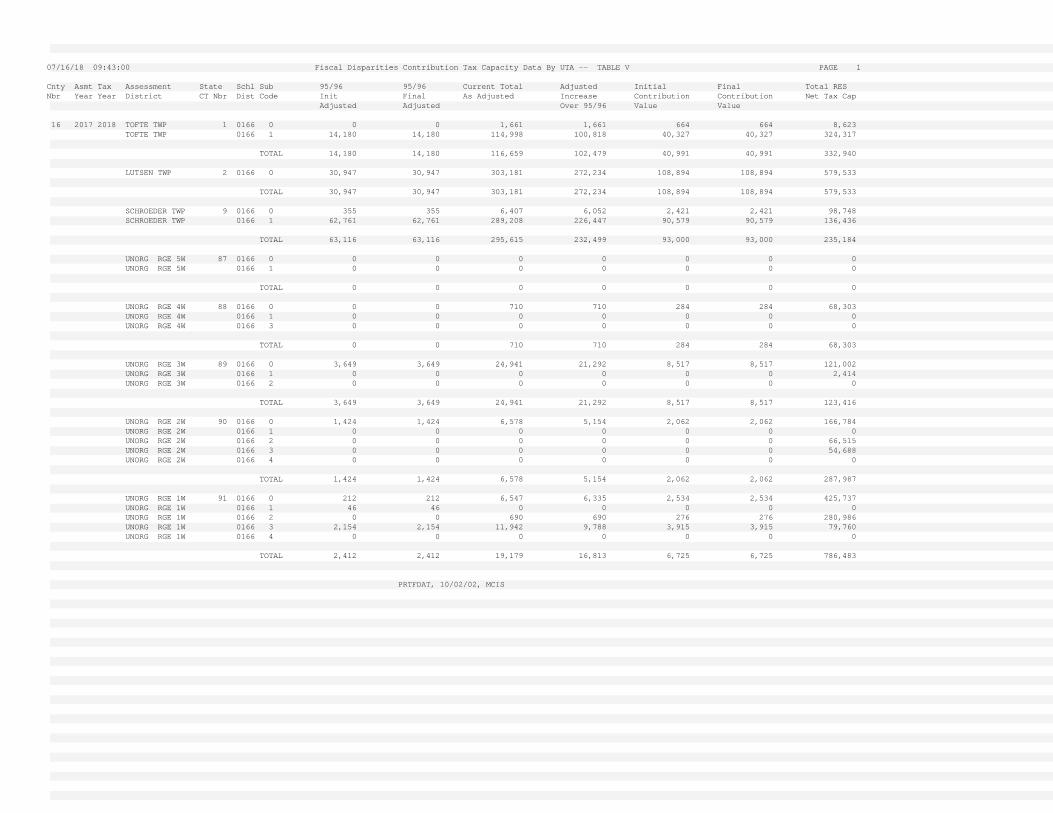
07/16/18 09:43:00 Fiscal Disparities Contribution Tax Capacity Data By UTA -- TABLE V PAGE 1
Cnty Asmt Tax Assessment State Schl Sub 95/96 95/96 Current Total Adjusted Initial Final Total RESNbr Year Year District CT Nbr Dist Code Init Final As Adjusted Increase Contribution Contribution Net Tax Cap Adjusted Adjusted Over 95/96 Value Value
16 2017 2018 TOFTE TWP 1 0166 0 0 0 1,661 1,661 664 664 8,623 TOFTE TWP 0166 1 14,180 14,180 114,998 100,818 40,327 40,327 324,317
TOTAL 14,180 14,180 116,659 102,479 40,991 40,991 332,940
LUTSEN TWP 2 0166 0 30,947 30,947 303,181 272,234 108,894 108,894 579,533
TOTAL 30,947 30,947 303,181 272,234 108,894 108,894 579,533
SCHROEDER TWP 9 0166 0 355 355 6,407 6,052 2,421 2,421 98,748 SCHROEDER TWP 0166 1 62,761 62,761 289,208 226,447 90,579 90,579 136,436
TOTAL 63,116 63,116 295,615 232,499 93,000 93,000 235,184
UNORG RGE 5W 87 0166 0 0 0 0 0 0 0 0 UNORG RGE 5W 0166 1 0 0 0 0 0 0 0
TOTAL 0 0 0 0 0 0 0
UNORG RGE 4W 88 0166 0 0 0 710 710 284 284 68,303 UNORG RGE 4W 0166 1 0 0 0 0 0 0 0 UNORG RGE 4W 0166 3 0 0 0 0 0 0 0
TOTAL 0 0 710 710 284 284 68,303
UNORG RGE 3W 89 0166 0 3,649 3,649 24,941 21,292 8,517 8,517 121,002 UNORG RGE 3W 0166 1 0 0 0 0 0 0 2,414 UNORG RGE 3W 0166 2 0 0 0 0 0 0 0
TOTAL 3,649 3,649 24,941 21,292 8,517 8,517 123,416
UNORG RGE 2W 90 0166 0 1,424 1,424 6,578 5,154 2,062 2,062 166,784 UNORG RGE 2W 0166 1 0 0 0 0 0 0 0 UNORG RGE 2W 0166 2 0 0 0 0 0 0 66,515 UNORG RGE 2W 0166 3 0 0 0 0 0 0 54,688 UNORG RGE 2W 0166 4 0 0 0 0 0 0 0
TOTAL 1,424 1,424 6,578 5,154 2,062 2,062 287,987
UNORG RGE 1W 91 0166 0 212 212 6,547 6,335 2,534 2,534 425,737 UNORG RGE 1W 0166 1 46 46 0 0 0 0 0 UNORG RGE 1W 0166 2 0 0 690 690 276 276 280,986 UNORG RGE 1W 0166 3 2,154 2,154 11,942 9,788 3,915 3,915 79,760 UNORG RGE 1W 0166 4 0 0 0 0 0 0 0
TOTAL 2,412 2,412 19,179 16,813 6,725 6,725 786,483
PRTFDAT, 10/02/02, MCIS
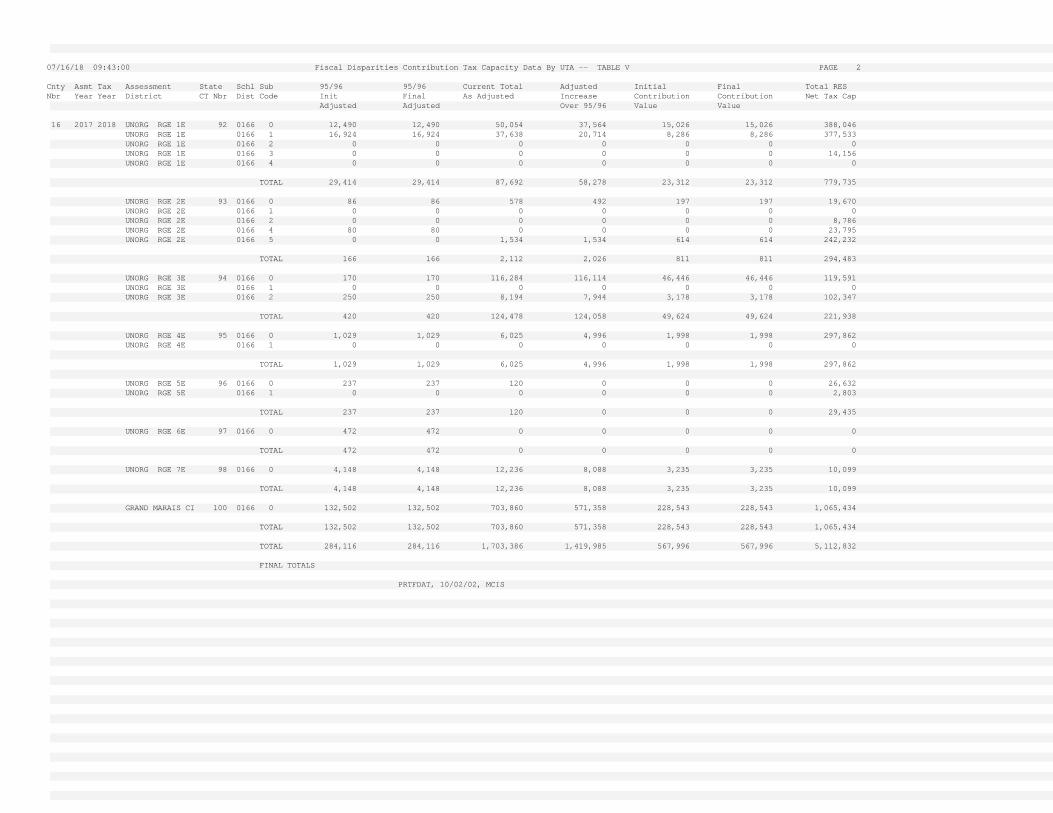
07/16/18 09:43:00 Fiscal Disparities Contribution Tax Capacity Data By UTA -- TABLE V PAGE 2
Cnty Asmt Tax Assessment State Schl Sub 95/96 95/96 Current Total Adjusted Initial Final Total RESNbr Year Year District CT Nbr Dist Code Init Final As Adjusted Increase Contribution Contribution Net Tax Cap Adjusted Adjusted Over 95/96 Value Value
16 2017 2018 UNORG RGE 1E 92 0166 0 12,490 12,490 50,054 37,564 15,026 15,026 388,046 UNORG RGE 1E 0166 1 16,924 16,924 37,638 20,714 8,286 8,286 377,533 UNORG RGE 1E 0166 2 0 0 0 0 0 0 0 UNORG RGE 1E 0166 3 0 0 0 0 0 0 14,156 UNORG RGE 1E 0166 4 0 0 0 0 0 0 0
TOTAL 29,414 29,414 87,692 58,278 23,312 23,312 779,735
UNORG RGE 2E 93 0166 0 86 86 578 492 197 197 19,670 UNORG RGE 2E 0166 1 0 0 0 0 0 0 0 UNORG RGE 2E 0166 2 0 0 0 0 0 0 8,786 UNORG RGE 2E 0166 4 80 80 0 0 0 0 23,795 UNORG RGE 2E 0166 5 0 0 1,534 1,534 614 614 242,232
TOTAL 166 166 2,112 2,026 811 811 294,483
UNORG RGE 3E 94 0166 0 170 170 116,284 116,114 46,446 46,446 119,591 UNORG RGE 3E 0166 1 0 0 0 0 0 0 0 UNORG RGE 3E 0166 2 250 250 8,194 7,944 3,178 3,178 102,347
TOTAL 420 420 124,478 124,058 49,624 49,624 221,938
UNORG RGE 4E 95 0166 0 1,029 1,029 6,025 4,996 1,998 1,998 297,862 UNORG RGE 4E 0166 1 0 0 0 0 0 0 0
TOTAL 1,029 1,029 6,025 4,996 1,998 1,998 297,862
UNORG RGE 5E 96 0166 0 237 237 120 0 0 0 26,632 UNORG RGE 5E 0166 1 0 0 0 0 0 0 2,803
TOTAL 237 237 120 0 0 0 29,435
UNORG RGE 6E 97 0166 0 472 472 0 0 0 0 0
TOTAL 472 472 0 0 0 0 0
UNORG RGE 7E 98 0166 0 4,148 4,148 12,236 8,088 3,235 3,235 10,099
TOTAL 4,148 4,148 12,236 8,088 3,235 3,235 10,099
GRAND MARAIS CI 100 0166 0 132,502 132,502 703,860 571,358 228,543 228,543 1,065,434
TOTAL 132,502 132,502 703,860 571,358 228,543 228,543 1,065,434
TOTAL 284,116 284,116 1,703,386 1,419,985 567,996 567,996 5,112,832
FINAL TOTALS
PRTFDAT, 10/02/02, MCIS
07/16/18 09:43:00 Fiscal Disparities Contribution Tax Capacity Data By UTA -- TABLE V PAGE 3
* * * E N D O F R E P O R T * * *
PRTFDAT, 10/02/02, MCIS

Fiscal Disparity Contribution Tax Capacity Data By UTA (Table V)
QUERY NAME . . . . . PRTFDAT LIBRARY NAME . . . . TAXLIBR
FILE LIBRARY MEMBER FORMAT TXFDAT TAXDTA18 TXFDAT FDAT TXFDATL1 TAXDTA18 TXFDATL1 FDAT TXSTTW TAXDTA18 TXSTTW STTW TXCNTY TAXDTA18 TXCNTY CNTY
DATE . . . . . . . . 07/10/18 TIME . . . . . . . . 08:33:35
Print Fiscal Disparity Assessment Table V
07/10/18 08:33:35 Fiscal Disparities Contribution Tax Capacity Data By UTA -- TABLE V PAGE 1
Cnty Asmt Tax Assessment State Schl Sub 95/96 95/96 Current Total Adjusted Initial Final Total RESNbr Year Year District CT Nbr Dist Code Init Final As Adjusted Increase Contribution Contribution Net Tax Cap Adjusted Adjusted Over 95/96 Value Value
18 2017 2018 BAY LAKE 2 0182 0 11,048 11,048 46,239 35,191 14,076 14,076 649,198 BAY LAKE 0182 1 6,968 6,968 21,542 14,574 5,830 5,830 316,040
TOTAL 18,016 18,016 67,781 49,765 19,906 19,906 965,238
CENTER 3 0182 0 5,234 5,234 22,662 17,428 6,971 6,971 292,691
TOTAL 5,234 5,234 22,662 17,428 6,971 6,971 292,691
2ND ASSESSMENT 6 0001 0 1,156 1,156 2,473 1,317 527 527 65,704
TOTAL 1,156 1,156 2,473 1,317 527 527 65,704
DEERWOOD TWP 7 0001 0 0 0 0 0 0 0 0 DEERWOOD TWP 0182 0 29,662 29,662 99,554 69,892 27,957 27,957 1,287,338
TOTAL 29,662 29,662 99,554 69,892 27,957 27,957 1,287,338
FAIRFIELD 9 0182 0 2,722 2,722 23,140 20,418 8,167 8,167 236,969
TOTAL 2,722 2,722 23,140 20,418 8,167 8,167 236,969
IRONDALE 14 0182 0 125,580 125,580 108,137 0 0 0 675,369
TOTAL 125,580 125,580 108,137 0 0 0 675,369
LAKE EDWARD 16 0182 0 25,032 25,032 35,822 10,790 4,316 4,316 331,933
TOTAL 25,032 25,032 35,822 10,790 4,316 4,316 331,933
LITTLE PINE 17 0182 0 7,838 7,838 17,349 9,511 3,804 3,804 49,320
TOTAL 7,838 7,838 17,349 9,511 3,804 3,804 49,320
MISSION 20 0182 0 20,521 20,521 96,752 76,231 30,492 30,492 1,103,639
TOTAL 20,521 20,521 96,752 76,231 30,492 30,492 1,103,639
NOKAY LAKE 21 0182 0 278 278 1,542 1,264 506 506 4,500
TOTAL 278 278 1,542 1,264 506 506 4,500
OAK LAWN 22 0182 0 75,704 75,704 86,024 10,320 4,128 4,128 29,102
TOTAL 75,704 75,704 86,024 10,320 4,128 4,128 29,102
PELICAN 23 0182 0 520 520 1,194 674 270 270 184,004
PRTFDAT, 10/02/02, MCIS
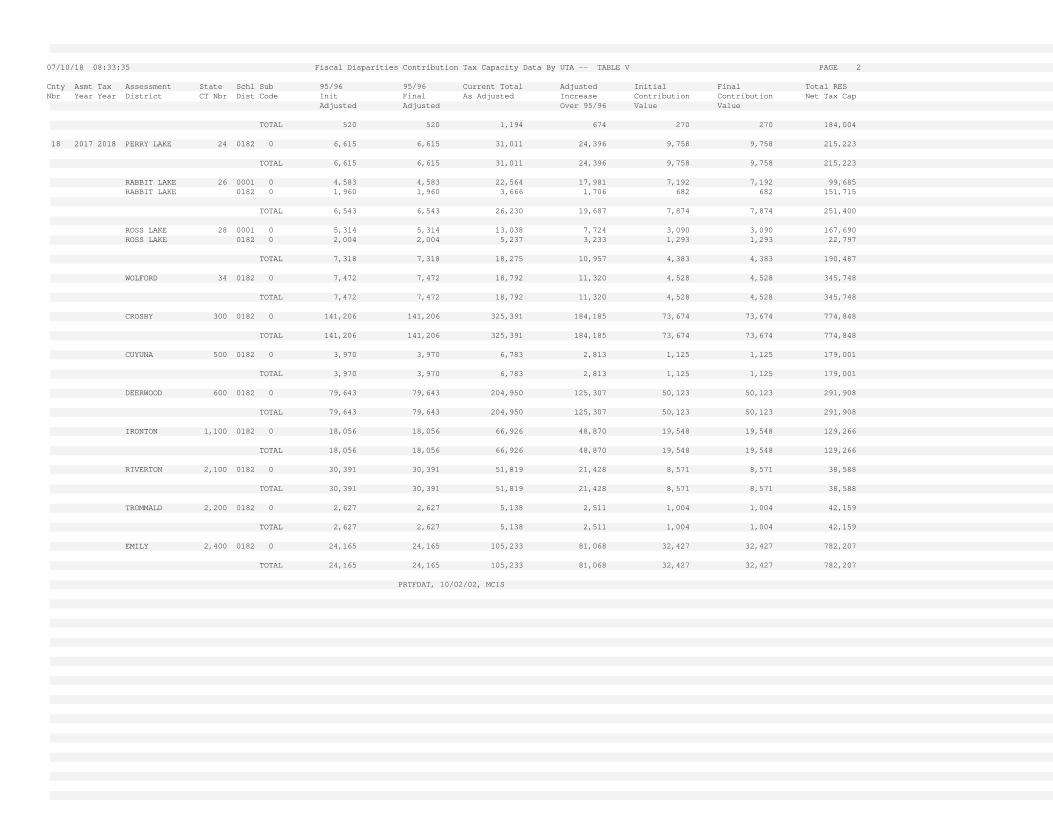
07/10/18 08:33:35 Fiscal Disparities Contribution Tax Capacity Data By UTA -- TABLE V PAGE 2
Cnty Asmt Tax Assessment State Schl Sub 95/96 95/96 Current Total Adjusted Initial Final Total RESNbr Year Year District CT Nbr Dist Code Init Final As Adjusted Increase Contribution Contribution Net Tax Cap Adjusted Adjusted Over 95/96 Value Value
TOTAL 520 520 1,194 674 270 270 184,004
18 2017 2018 PERRY LAKE 24 0182 0 6,615 6,615 31,011 24,396 9,758 9,758 215,223
TOTAL 6,615 6,615 31,011 24,396 9,758 9,758 215,223
RABBIT LAKE 26 0001 0 4,583 4,583 22,564 17,981 7,192 7,192 99,685 RABBIT LAKE 0182 0 1,960 1,960 3,666 1,706 682 682 151,715
TOTAL 6,543 6,543 26,230 19,687 7,874 7,874 251,400
ROSS LAKE 28 0001 0 5,314 5,314 13,038 7,724 3,090 3,090 167,690 ROSS LAKE 0182 0 2,004 2,004 5,237 3,233 1,293 1,293 22,797
TOTAL 7,318 7,318 18,275 10,957 4,383 4,383 190,487
WOLFORD 34 0182 0 7,472 7,472 18,792 11,320 4,528 4,528 345,748
TOTAL 7,472 7,472 18,792 11,320 4,528 4,528 345,748
CROSBY 300 0182 0 141,206 141,206 325,391 184,185 73,674 73,674 774,848
TOTAL 141,206 141,206 325,391 184,185 73,674 73,674 774,848
CUYUNA 500 0182 0 3,970 3,970 6,783 2,813 1,125 1,125 179,001
TOTAL 3,970 3,970 6,783 2,813 1,125 1,125 179,001
DEERWOOD 600 0182 0 79,643 79,643 204,950 125,307 50,123 50,123 291,908
TOTAL 79,643 79,643 204,950 125,307 50,123 50,123 291,908
IRONTON 1,100 0182 0 18,056 18,056 66,926 48,870 19,548 19,548 129,266
TOTAL 18,056 18,056 66,926 48,870 19,548 19,548 129,266
RIVERTON 2,100 0182 0 30,391 30,391 51,819 21,428 8,571 8,571 38,588
TOTAL 30,391 30,391 51,819 21,428 8,571 8,571 38,588
TROMMALD 2,200 0182 0 2,627 2,627 5,138 2,511 1,004 1,004 42,159
TOTAL 2,627 2,627 5,138 2,511 1,004 1,004 42,159
EMILY 2,400 0182 0 24,165 24,165 105,233 81,068 32,427 32,427 782,207
TOTAL 24,165 24,165 105,233 81,068 32,427 32,427 782,207
PRTFDAT, 10/02/02, MCIS
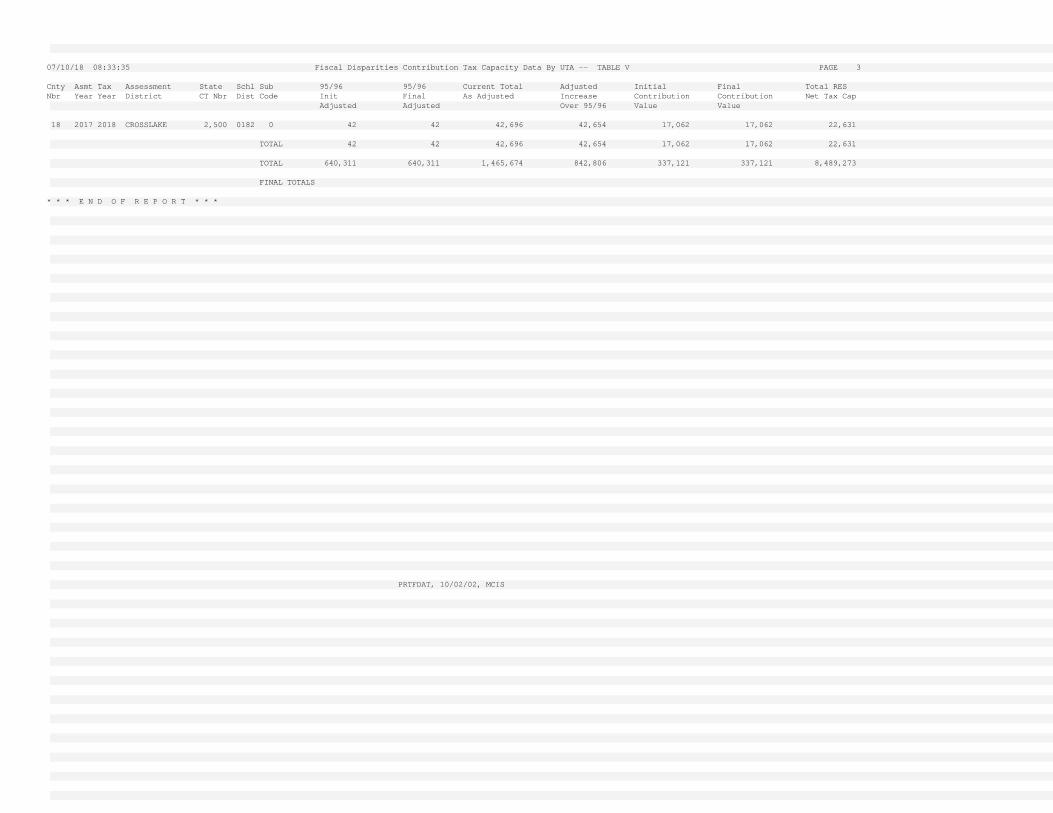
07/10/18 08:33:35 Fiscal Disparities Contribution Tax Capacity Data By UTA -- TABLE V PAGE 3
Cnty Asmt Tax Assessment State Schl Sub 95/96 95/96 Current Total Adjusted Initial Final Total RESNbr Year Year District CT Nbr Dist Code Init Final As Adjusted Increase Contribution Contribution Net Tax Cap Adjusted Adjusted Over 95/96 Value Value
18 2017 2018 CROSSLAKE 2,500 0182 0 42 42 42,696 42,654 17,062 17,062 22,631
TOTAL 42 42 42,696 42,654 17,062 17,062 22,631
TOTAL 640,311 640,311 1,465,674 842,806 337,121 337,121 8,489,273
FINAL TOTALS
* * * E N D O F R E P O R T * * *
PRTFDAT, 10/02/02, MCIS

Fiscal Disparity Contribution Tax Capacity Data By UTA (Table V)
QUERY NAME . . . . . PRTFDAT LIBRARY NAME . . . . TAXLIBR
FILE LIBRARY MEMBER FORMAT TXFDAT TAXDTA31 TXFDAT FDAT TXFDATL1 TAXDTA31 TXFDATL1 FDAT TXSTTW TAXDTA31 TXSTTW STTW TXCNTY TAXDTA31 TXCNTY CNTY
DATE . . . . . . . . 07/19/18 TIME . . . . . . . . 09:47:48
Print Fiscal Disparity Assessment Table V

07/19/18 09:47:48 Fiscal Disparities Contribution Tax Capacity Data By UTA -- TABLE V PAGE 1
Cnty Asmt Tax Assessment State Schl Sub 95/96 95/96 Current Total Adjusted Initial Final Total RESNbr Year Year District CT Nbr Dist Code Init Final As Adjusted Increase Contribution Contribution Net Tax Cap Adjusted Adjusted Over 95/96 Value Value
31 2017 2018 ALVWOOD TWP 1 0318 0 7,441 7,441 7,839 398 159 159 7,695
TOTAL 7,441 7,441 7,839 398 159 159 7,695
ARBO 2 0318 0 24,550 24,550 376,935 352,385 140,954 140,954 515,609
TOTAL 24,550 24,550 376,935 352,385 140,954 140,954 515,609
ARDENHURST TWP 3 0318 0 1,255 1,255 1,080 0 0 0 111,086
TOTAL 1,255 1,255 1,080 0 0 0 111,086
BALSAM TWP 4 0318 0 10,253 10,253 14,802 4,549 1,820 1,820 434,496
TOTAL 10,253 10,253 14,802 4,549 1,820 1,820 434,496
BEARVILLE TWP 6 0318 0 29,520 29,520 34,016 4,496 1,798 1,798 202,465
TOTAL 29,520 29,520 34,016 4,496 1,798 1,798 202,465
BIGFORK TWP 7 0318 0 16,138 16,138 50,137 33,999 13,600 13,600 140,936
TOTAL 16,138 16,138 50,137 33,999 13,600 13,600 140,936
BLACKBERRY TWP 8 0318 0 189,015 189,015 1,092,264 903,249 361,300 361,300 376,570
TOTAL 189,015 189,015 1,092,264 903,249 361,300 361,300 376,570
CARPENTER TWP 10 0318 0 183 183 1,733 1,550 620 620 78,580 CARPENTER TWP 0318 1 32,673 32,673 38,134 5,461 2,184 2,184 31,796
TOTAL 32,856 32,856 39,867 7,011 2,804 2,804 110,376
FEELEY TWP 12 0318 0 147,695 147,695 532,331 384,636 153,854 153,854 170,619
TOTAL 147,695 147,695 532,331 384,636 153,854 153,854 170,619
GOODHOPE TWP 13 0318 0 0 0 0 0 0 0 3,464 GOODHOPE TWP 0318 1 0 0 488 488 195 195 54,808
TOTAL 0 0 488 488 195 195 58,272
GOODLAND TWP 14 0319 0 16,438 16,438 45,447 29,009 11,604 11,604 291,266
TOTAL 16,438 16,438 45,447 29,009 11,604 11,604 291,266
GRATTAN TWP 16 0318 0 0 0 0 0 0 0 12,420
PRTFDAT, 10/02/02, MCIS
07/19/18 09:47:48 Fiscal Disparities Contribution Tax Capacity Data By UTA -- TABLE V PAGE 2
Cnty Asmt Tax Assessment State Schl Sub 95/96 95/96 Current Total Adjusted Initial Final Total RESNbr Year Year District CT Nbr Dist Code Init Final As Adjusted Increase Contribution Contribution Net Tax Cap Adjusted Adjusted Over 95/96 Value Value
31 2017 2018 GRATTAN TWP 16 0318 1 0 0 0 0 0 0 0
TOTAL 0 0 0 0 0 0 12,420
GREENWAY TWP 17 0316 0 30,385 30,385 157,156 126,771 50,708 50,708 416,995
TOTAL 30,385 30,385 157,156 126,771 50,708 50,708 416,995
HARRIS TWP 18 0318 0 50,634 50,634 257,807 207,173 82,869 82,869 2,602,928
TOTAL 50,634 50,634 257,807 207,173 82,869 82,869 2,602,928
KINGHURST TWP 20 0318 0 944 944 7,400 6,456 2,582 2,582 53,400 KINGHURST TWP 0318 1 5,217 5,217 0 0 0 0 2,993
TOTAL 6,161 6,161 7,400 6,456 2,582 2,582 56,393
LAWRENCE TWP 22 0316 0 8,608 8,608 8,871 263 105 105 277,690
TOTAL 8,608 8,608 8,871 263 105 105 277,690
LONE PINE TWP 24 0319 0 21,746 21,746 54,751 33,005 13,202 13,202 386,018
TOTAL 21,746 21,746 54,751 33,005 13,202 13,202 386,018
MAX 26 0318 0 0 0 12,575 12,575 5,030 5,030 38,604 MAX 0318 1 0 0 0 0 0 0 1,071
TOTAL 0 0 12,575 12,575 5,030 5,030 39,675
MOOSE PARK TWP 27 0318 0 0 0 0 0 0 0 18,769 MOOSE PARK TWP 0318 1 0 0 0 0 0 0 0
TOTAL 0 0 0 0 0 0 18,769
NASHWAUK TWP 29 0316 0 571 571 184,789 184,218 73,687 73,687 269,209 NASHWAUK TWP 0319 0 41,159 41,159 117,511 76,352 30,541 30,541 87,097
TOTAL 41,730 41,730 302,300 260,570 104,228 104,228 356,306
NORE 30 0318 0 0 0 0 0 0 0 0 NORE 0318 1 0 0 0 0 0 0 5,875
TOTAL 0 0 0 0 0 0 5,875
POMROY TWP 32 0318 0 0 0 329 329 132 132 10,240
PRTFDAT, 10/02/02, MCIS
07/19/18 09:47:48 Fiscal Disparities Contribution Tax Capacity Data By UTA -- TABLE V PAGE 3
Cnty Asmt Tax Assessment State Schl Sub 95/96 95/96 Current Total Adjusted Initial Final Total RESNbr Year Year District CT Nbr Dist Code Init Final As Adjusted Increase Contribution Contribution Net Tax Cap Adjusted Adjusted Over 95/96 Value Value
TOTAL 0 0 329 329 132 132 10,240
31 2017 2018 SAGO 33 0318 0 109,746 109,746 294,208 184,462 73,785 73,785 58,636
TOTAL 109,746 109,746 294,208 184,462 73,785 73,785 58,636
SPANG TWP 35 0318 0 0 0 20,641 20,641 8,256 8,256 93,953
TOTAL 0 0 20,641 20,641 8,256 8,256 93,953
STOKES TWP 36 0318 0 1,276 1,276 4,133 2,857 1,143 1,143 111,992
TOTAL 1,276 1,276 4,133 2,857 1,143 1,143 111,992
THIRD RIVER TWP 37 0318 0 23 23 858 835 334 334 10,204 THIRD RIVER TWP 0318 1 0 0 0 0 0 0 25,521
TOTAL 23 23 858 835 334 334 35,725
TROUT LAKE TWP 38 0316 0 42,756 42,756 160,998 118,242 47,297 47,297 546,344 TROUT LAKE TWP 0318 0 17,604 17,604 33,266 15,662 6,265 6,265 158,356
TOTAL 60,360 60,360 194,264 133,904 53,562 53,562 704,700
WABANA TWP 39 0318 0 5,020 5,020 25,087 20,067 8,027 8,027 547,245
TOTAL 5,020 5,020 25,087 20,067 8,027 8,027 547,245
WAWINA TWP 40 0318 0 119,147 119,147 544,406 425,259 170,104 170,104 22,116
TOTAL 119,147 119,147 544,406 425,259 170,104 170,104 22,116
SPLITHAND TWP 42 0318 0 0 0 2,080 2,080 832 832 96,045
TOTAL 0 0 2,080 2,080 832 832 96,045
150-25 UNORG 44 0318 0 0 0 0 0 0 0 7,188
TOTAL 0 0 0 0 0 0 7,188
LIBERTY TWP 45 0318 0 0 0 0 0 0 0 19,355
TOTAL 0 0 0 0 0 0 19,355
WILDWOOD 63 0318 0 0 0 37,242 37,242 14,897 14,897 77,355
TOTAL 0 0 37,242 37,242 14,897 14,897 77,355
PRTFDAT, 10/02/02, MCIS
07/19/18 09:47:48 Fiscal Disparities Contribution Tax Capacity Data By UTA -- TABLE V PAGE 4
Cnty Asmt Tax Assessment State Schl Sub 95/96 95/96 Current Total Adjusted Initial Final Total RESNbr Year Year District CT Nbr Dist Code Init Final As Adjusted Increase Contribution Contribution Net Tax Cap Adjusted Adjusted Over 95/96 Value Value
31 2017 2018 54-26 UNORG 64 0318 0 612 612 38,498 37,886 15,154 15,154 1,100,372
TOTAL 612 612 38,498 37,886 15,154 15,154 1,100,372
54-27 UNORG 65 0318 0 0 0 0 0 0 0 30,809
TOTAL 0 0 0 0 0 0 30,809
55-23 UNORG 66 0316 0 794 794 2,116 1,322 529 529 38,210 55-23 UNORG 0318 0 100,293 100,293 131,093 30,800 12,320 12,320 66,708 55-23 UNORG 0319 0 0 0 336 336 134 134 36,288
TOTAL 101,087 101,087 133,545 32,458 12,983 12,983 141,206
55-27 UNORG 67 0318 0 0 0 1,237 1,237 495 495 195,904
TOTAL 0 0 1,237 1,237 495 495 195,904
56-26 UNORG 68 0318 0 59,774 59,774 417,709 357,935 143,174 143,174 946,188
TOTAL 59,774 59,774 417,709 357,935 143,174 143,174 946,188
56-27 UNORG 69 0318 0 53,394 53,394 297,628 244,234 97,694 97,694 27,568
TOTAL 53,394 53,394 297,628 244,234 97,694 97,694 27,568
57-26 UNORG 70 0318 0 2,407 2,407 6,833 4,426 1,770 1,770 496,738
TOTAL 2,407 2,407 6,833 4,426 1,770 1,770 496,738
58-22 UNORG 71 0319 0 0 0 438 438 175 175 106,692
TOTAL 0 0 438 438 175 175 106,692
58-23 UNORG 72 0319 0 76 76 5,830 5,754 2,302 2,302 141,169
TOTAL 76 76 5,830 5,754 2,302 2,302 141,169
58-26 UNORG 73 0318 0 0 0 140 140 56 56 37,869
TOTAL 0 0 140 140 56 56 37,869
59-22 UNORG 75 0319 0 427 427 0 0 0 0 63,340
TOTAL 427 427 0 0 0 0 63,340
59-23 UNORG 76 0318 0 0 0 0 0 0 0 35,634
PRTFDAT, 10/02/02, MCIS

07/19/18 09:47:48 Fiscal Disparities Contribution Tax Capacity Data By UTA -- TABLE V PAGE 5
Cnty Asmt Tax Assessment State Schl Sub 95/96 95/96 Current Total Adjusted Initial Final Total RESNbr Year Year District CT Nbr Dist Code Init Final As Adjusted Increase Contribution Contribution Net Tax Cap Adjusted Adjusted Over 95/96 Value Value
31 2017 2018 59-23 UNORG 76 0319 0 0 0 0 0 0 0 10,941
TOTAL 0 0 0 0 0 0 46,575
59-24 UNORG 77 0318 0 16 16 4,784 4,768 1,907 1,907 208,247
TOTAL 16 16 4,784 4,768 1,907 1,907 208,247
59-25 UNORG 78 0318 0 0 0 2,447 2,447 979 979 137,060
TOTAL 0 0 2,447 2,447 979 979 137,060
60-23 UNORG 79 0318 0 0 0 492 492 197 197 40,850
TOTAL 0 0 492 492 197 197 40,850
60-24 UNORG 80 0318 0 0 0 804 804 322 322 100,285
TOTAL 0 0 804 804 322 322 100,285
60-25 UNORG 81 0318 0 0 0 0 0 0 0 37,401
TOTAL 0 0 0 0 0 0 37,401
61-23 UNORG 82 0318 0 0 0 0 0 0 0 2,887
TOTAL 0 0 0 0 0 0 2,887
61-24 UNORG 83 0318 0 0 0 0 0 0 0 0
TOTAL 0 0 0 0 0 0 0
61-25 UNORG 84 0318 0 0 0 0 0 0 0 10,867
TOTAL 0 0 0 0 0 0 10,867
62-25 UNORG 85 0318 0 0 0 284 284 114 114 66,630
TOTAL 0 0 284 284 114 114 66,630
62-26 UNORG 86 0318 0 0 0 0 0 0 0 10,708
TOTAL 0 0 0 0 0 0 10,708
62-27 UNORG 87 0318 0 0 0 18 18 7 7 842
TOTAL 0 0 18 18 7 7 842
PRTFDAT, 10/02/02, MCIS

07/19/18 09:47:48 Fiscal Disparities Contribution Tax Capacity Data By UTA -- TABLE V PAGE 6
Cnty Asmt Tax Assessment State Schl Sub 95/96 95/96 Current Total Adjusted Initial Final Total RESNbr Year Year District CT Nbr Dist Code Init Final As Adjusted Increase Contribution Contribution Net Tax Cap Adjusted Adjusted Over 95/96 Value Value
31 2017 2018 145-27 UNORG 91 0318 0 0 0 0 0 0 0 0
TOTAL 0 0 0 0 0 0 0
146-27 UNORG 93 0318 0 0 0 0 0 0 0 24,673
TOTAL 0 0 0 0 0 0 24,673
146-28 UNORG 94 0318 0 0 0 0 0 0 0 0
TOTAL 0 0 0 0 0 0 0
146-29 UNORG 95 0318 0 0 0 0 0 0 0 0
TOTAL 0 0 0 0 0 0 0
147-27 UNORG 97 0318 0 0 0 821 821 328 328 6,275
TOTAL 0 0 821 821 328 328 6,275
147-28 UNORG 98 0318 0 0 0 0 0 0 0 0
TOTAL 0 0 0 0 0 0 0
147-29 UNORG 99 0318 0 0 0 0 0 0 0 0
TOTAL 0 0 0 0 0 0 0
BIGFORK CITY 400 0318 0 31,888 31,888 81,330 49,442 19,777 19,777 91,622
TOTAL 31,888 31,888 81,330 49,442 19,777 19,777 91,622
BOVEY CITY 600 0316 0 15,273 15,273 52,654 37,381 14,952 14,952 167,377
TOTAL 15,273 15,273 52,654 37,381 14,952 14,952 167,377
CALUMET CITY 800 0316 0 11,916 11,916 46,000 34,084 13,634 13,634 54,340
TOTAL 11,916 11,916 46,000 34,084 13,634 13,634 54,340
COHASSET CITY 900 0318 0 5,219,923 5,219,923 9,522,613 4,302,690 1,721,076 1,721,076 2,369,253
TOTAL 5,219,923 5,219,923 9,522,613 4,302,690 1,721,076 1,721,076 2,369,253
COLERAINE CITY 1,000 0316 0 47,076 47,076 280,010 232,934 93,174 93,174 589,911 COLERAINE CITY 0316 1 59,534 59,534 640,088 580,554 232,222 232,222 351,480
PRTFDAT, 10/02/02, MCIS
07/19/18 09:47:48 Fiscal Disparities Contribution Tax Capacity Data By UTA -- TABLE V PAGE 7
Cnty Asmt Tax Assessment State Schl Sub 95/96 95/96 Current Total Adjusted Initial Final Total RESNbr Year Year District CT Nbr Dist Code Init Final As Adjusted Increase Contribution Contribution Net Tax Cap Adjusted Adjusted Over 95/96 Value Value
TOTAL 106,610 106,610 920,098 813,488 325,396 325,396 941,391
31 2017 2018 EFFIE CITY 1,400 0318 0 2,068 2,068 10,097 8,029 3,212 3,212 20,670
TOTAL 2,068 2,068 10,097 8,029 3,212 3,212 20,670
GRAND RAPIDS CI 1,600 0316 0 67,789 67,789 176,475 108,686 43,474 43,474 181,463 GRAND RAPIDS CI 0318 0 1,759,889 1,759,889 4,700,985 2,941,096 1,176,438 1,176,438 4,400,363
TOTAL 1,827,678 1,827,678 4,877,460 3,049,782 1,219,912 1,219,912 4,581,826
KEEWATIN CITY 2,000 0319 0 12,826 12,826 130,024 117,198 46,879 46,879 155,651
TOTAL 12,826 12,826 130,024 117,198 46,879 46,879 155,651
LAPRAIRIE CITY 2,100 0316 0 33,023 33,023 217,263 184,240 73,696 73,696 290,340 LAPRAIRIE CITY 0318 0 50,991 50,991 137,555 86,564 34,626 34,626 15,335
TOTAL 84,014 84,014 354,818 270,804 108,322 108,322 305,675
MARBLE CITY 2,300 0316 0 13,934 13,934 33,686 19,752 7,901 7,901 142,330
TOTAL 13,934 13,934 33,686 19,752 7,901 7,901 142,330
NASHWAUK CITY 2,600 0316 0 3,830 3,830 284,383 280,553 112,221 112,221 0 NASHWAUK CITY 0319 0 23,174 23,174 167,700 144,526 57,810 57,810 282,912
TOTAL 27,004 27,004 452,083 425,079 170,031 170,031 282,912
SQUAW LAKE CITY 3,200 0318 0 3,920 3,920 7,137 3,217 1,287 1,287 29,251
TOTAL 3,920 3,920 7,137 3,217 1,287 1,287 29,251
TACONITE CITY 3,500 0316 0 37,029 37,029 345,026 307,997 123,199 123,199 281,627
TOTAL 37,029 37,029 345,026 307,997 123,199 123,199 281,627
WARBA CITY 3,700 0318 0 16,360 16,360 102,019 85,659 34,264 34,264 47,828
TOTAL 16,360 16,360 102,019 85,659 34,264 34,264 47,828
TOTAL 8,558,233 8,558,233 21,965,867 13,413,453 5,365,383 5,365,383 21,829,917
FINAL TOTALS
* * * E N D O F R E P O R T * * *
PRTFDAT, 10/02/02, MCIS

Fiscal Disparity Contribution Tax Capacity Data By UTA (Table V)
QUERY NAME . . . . . PRTFDAT LIBRARY NAME . . . . TAXLIBR
FILE LIBRARY MEMBER FORMAT TXFDAT TAXDTA38 TXFDAT FDAT TXFDATL1 TAXDTA38 TXFDATL1 FDAT TXSTTW TAXDTA38 TXSTTW STTW TXCNTY TAXDTA38 TXCNTY CNTY
DATE . . . . . . . . 07/06/18 TIME . . . . . . . . 16:07:31
Print Fiscal Disparity Assessment Table V
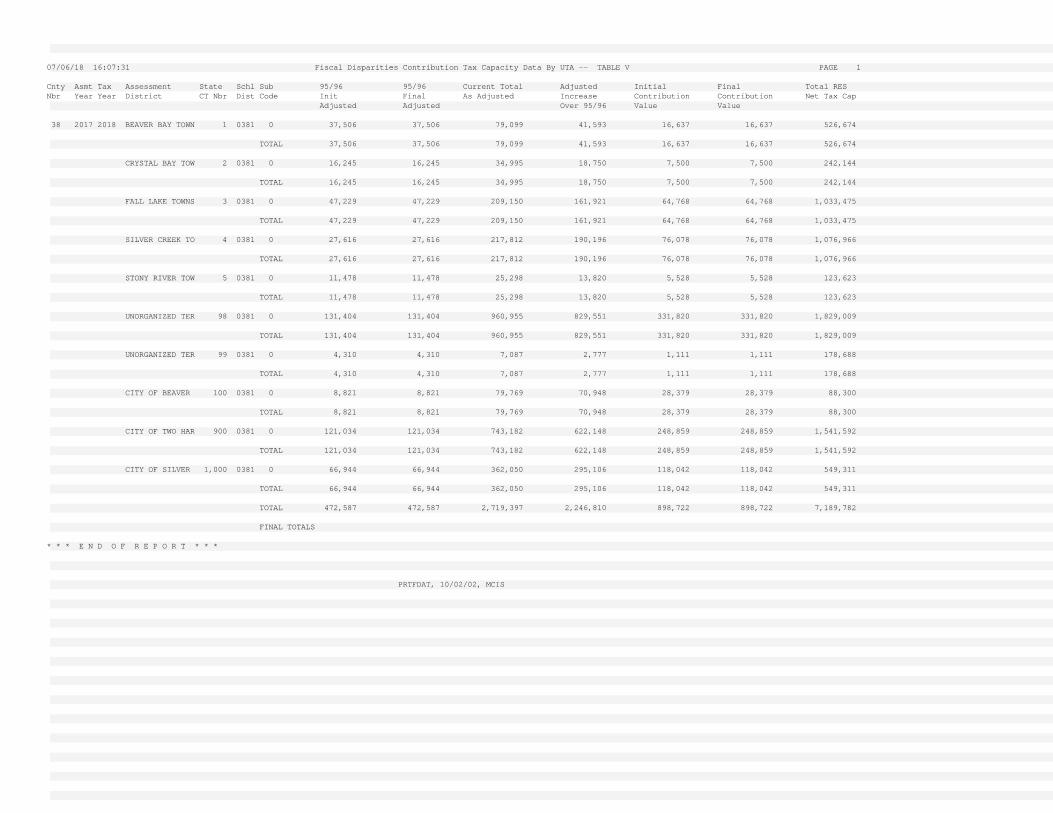
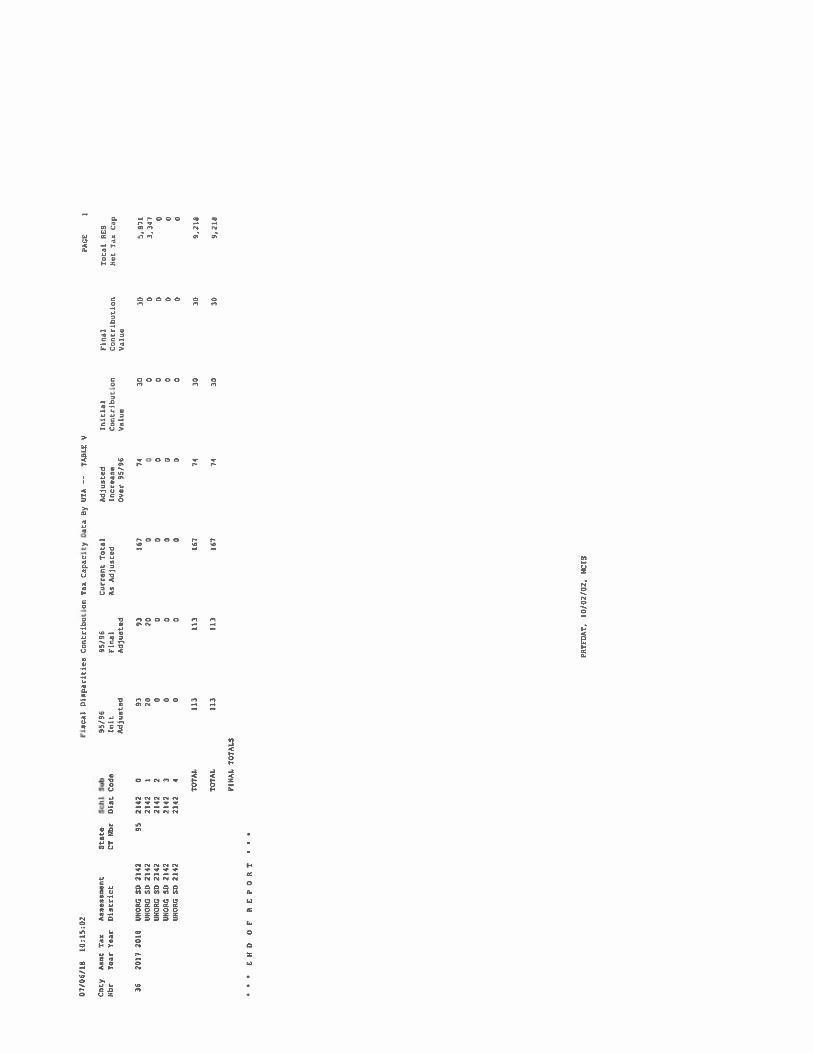
07/06/18 16:07:31 Fiscal Disparities Contribution Tax Capacity Data By UTA -- TABLE V PAGE 1
Cnty Asmt Tax Assessment State Schl Sub 95/96 95/96 Current Total Adjusted Initial Final Total RESNbr Year Year District CT Nbr Dist Code Init Final As Adjusted Increase Contribution Contribution Net Tax Cap Adjusted Adjusted Over 95/96 Value Value
38 2017 2018 BEAVER BAY TOWN 1 0381 0 37,506 37,506 79,099 41,593 16,637 16,637 526,674
TOTAL 37,506 37,506 79,099 41,593 16,637 16,637 526,674
CRYSTAL BAY TOW 2 0381 0 16,245 16,245 34,995 18,750 7,500 7,500 242,144
TOTAL 16,245 16,245 34,995 18,750 7,500 7,500 242,144
FALL LAKE TOWNS 3 0381 0 47,229 47,229 209,150 161,921 64,768 64,768 1,033,475
TOTAL 47,229 47,229 209,150 161,921 64,768 64,768 1,033,475
SILVER CREEK TO 4 0381 0 27,616 27,616 217,812 190,196 76,078 76,078 1,076,966
TOTAL 27,616 27,616 217,812 190,196 76,078 76,078 1,076,966
STONY RIVER TOW 5 0381 0 11,478 11,478 25,298 13,820 5,528 5,528 123,623
TOTAL 11,478 11,478 25,298 13,820 5,528 5,528 123,623
UNORGANIZED TER 98 0381 0 131,404 131,404 960,955 829,551 331,820 331,820 1,829,009
TOTAL 131,404 131,404 960,955 829,551 331,820 331,820 1,829,009
UNORGANIZED TER 99 0381 0 4,310 4,310 7,087 2,777 1,111 1,111 178,688
TOTAL 4,310 4,310 7,087 2,777 1,111 1,111 178,688
CITY OF BEAVER 100 0381 0 8,821 8,821 79,769 70,948 28,379 28,379 88,300
TOTAL 8,821 8,821 79,769 70,948 28,379 28,379 88,300
CITY OF TWO HAR 900 0381 0 121,034 121,034 743,182 622,148 248,859 248,859 1,541,592
TOTAL 121,034 121,034 743,182 622,148 248,859 248,859 1,541,592
CITY OF SILVER 1,000 0381 0 66,944 66,944 362,050 295,106 118,042 118,042 549,311
TOTAL 66,944 66,944 362,050 295,106 118,042 118,042 549,311
TOTAL 472,587 472,587 2,719,397 2,246,810 898,722 898,722 7,189,782
FINAL TOTALS
* * * E N D O F R E P O R T * * *
PRTFDAT, 10/02/02, MCIS

Fiscal Disparity Contribution Tax Capacity Data By UTA (Table V)
QUERY NAME . . . . . PRTFDAT LIBRARY NAME . . . . TAXLIBR
FILE LIBRARY MEMBER FORMAT TXFDAT TAXDTA69 TXFDAT FDAT TXFDATL1 TAXDTA69 TXFDATL1 FDAT TXSTTW TAXDTA69 TXSTTW STTW TXCNTY TAXDTA69 TXCNTY CNTY
DATE . . . . . . . . 07/20/18 TIME . . . . . . . . 08:47:27
Print Fiscal Disparity Assessment Table V
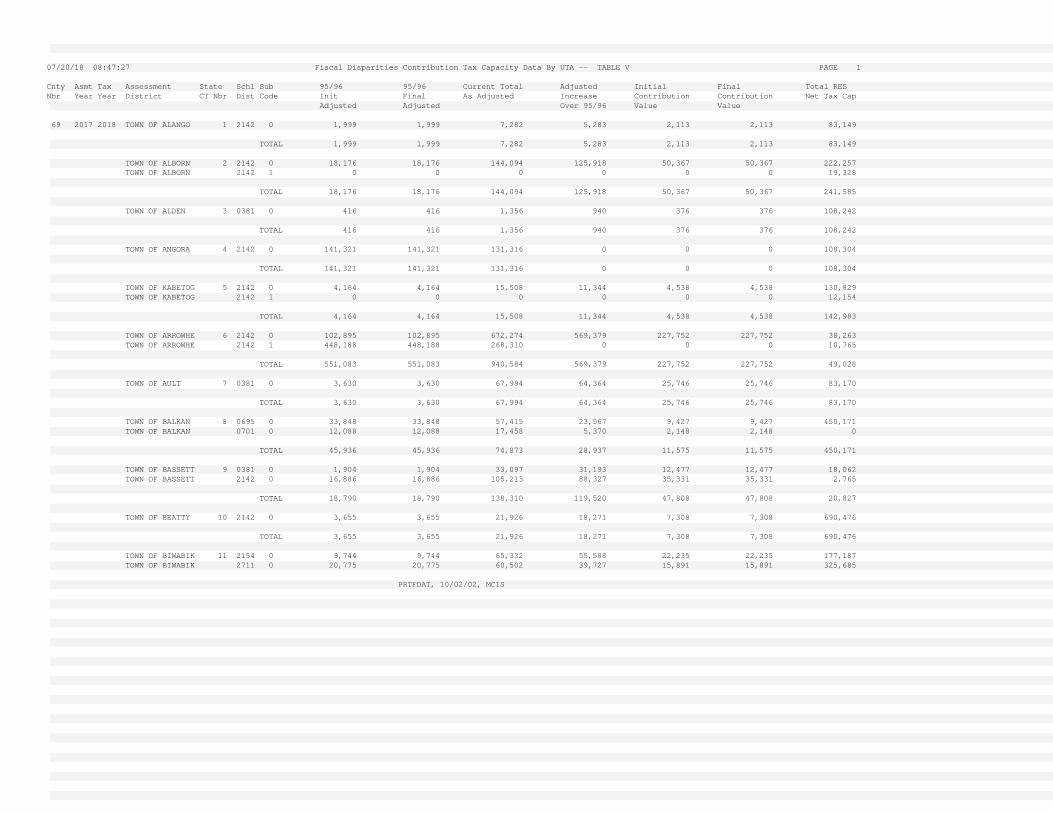
07/20/18 08:47:27 Fiscal Disparities Contribution Tax Capacity Data By UTA -- TABLE V PAGE 1
Cnty Asmt Tax Assessment State Schl Sub 95/96 95/96 Current Total Adjusted Initial Final Total RESNbr Year Year District CT Nbr Dist Code Init Final As Adjusted Increase Contribution Contribution Net Tax Cap Adjusted Adjusted Over 95/96 Value Value
69 2017 2018 TOWN OF ALANGO 1 2142 0 1,999 1,999 7,282 5,283 2,113 2,113 83,149
TOTAL 1,999 1,999 7,282 5,283 2,113 2,113 83,149
TOWN OF ALBORN 2 2142 0 18,176 18,176 144,094 125,918 50,367 50,367 222,257 TOWN OF ALBORN 2142 1 0 0 0 0 0 0 19,328
TOTAL 18,176 18,176 144,094 125,918 50,367 50,367 241,585
TOWN OF ALDEN 3 0381 0 416 416 1,356 940 376 376 108,242
TOTAL 416 416 1,356 940 376 376 108,242
TOWN OF ANGORA 4 2142 0 141,321 141,321 131,316 0 0 0 108,304
TOTAL 141,321 141,321 131,316 0 0 0 108,304
TOWN OF KABETOG 5 2142 0 4,164 4,164 15,508 11,344 4,538 4,538 130,829 TOWN OF KABETOG 2142 1 0 0 0 0 0 0 12,154
TOTAL 4,164 4,164 15,508 11,344 4,538 4,538 142,983
TOWN OF ARROWHE 6 2142 0 102,895 102,895 672,274 569,379 227,752 227,752 38,263 TOWN OF ARROWHE 2142 1 448,188 448,188 268,310 0 0 0 10,765
TOTAL 551,083 551,083 940,584 569,379 227,752 227,752 49,028
TOWN OF AULT 7 0381 0 3,630 3,630 67,994 64,364 25,746 25,746 83,170
TOTAL 3,630 3,630 67,994 64,364 25,746 25,746 83,170
TOWN OF BALKAN 8 0695 0 33,848 33,848 57,415 23,567 9,427 9,427 450,171 TOWN OF BALKAN 0701 0 12,088 12,088 17,458 5,370 2,148 2,148 0
TOTAL 45,936 45,936 74,873 28,937 11,575 11,575 450,171
TOWN OF BASSETT 9 0381 0 1,904 1,904 33,097 31,193 12,477 12,477 18,062 TOWN OF BASSETT 2142 0 16,886 16,886 105,213 88,327 35,331 35,331 2,765
TOTAL 18,790 18,790 138,310 119,520 47,808 47,808 20,827
TOWN OF BEATTY 10 2142 0 3,655 3,655 21,926 18,271 7,308 7,308 690,476
TOTAL 3,655 3,655 21,926 18,271 7,308 7,308 690,476
TOWN OF BIWABIK 11 2154 0 9,744 9,744 65,332 55,588 22,235 22,235 177,187 TOWN OF BIWABIK 2711 0 20,775 20,775 60,502 39,727 15,891 15,891 325,685
PRTFDAT, 10/02/02, MCIS
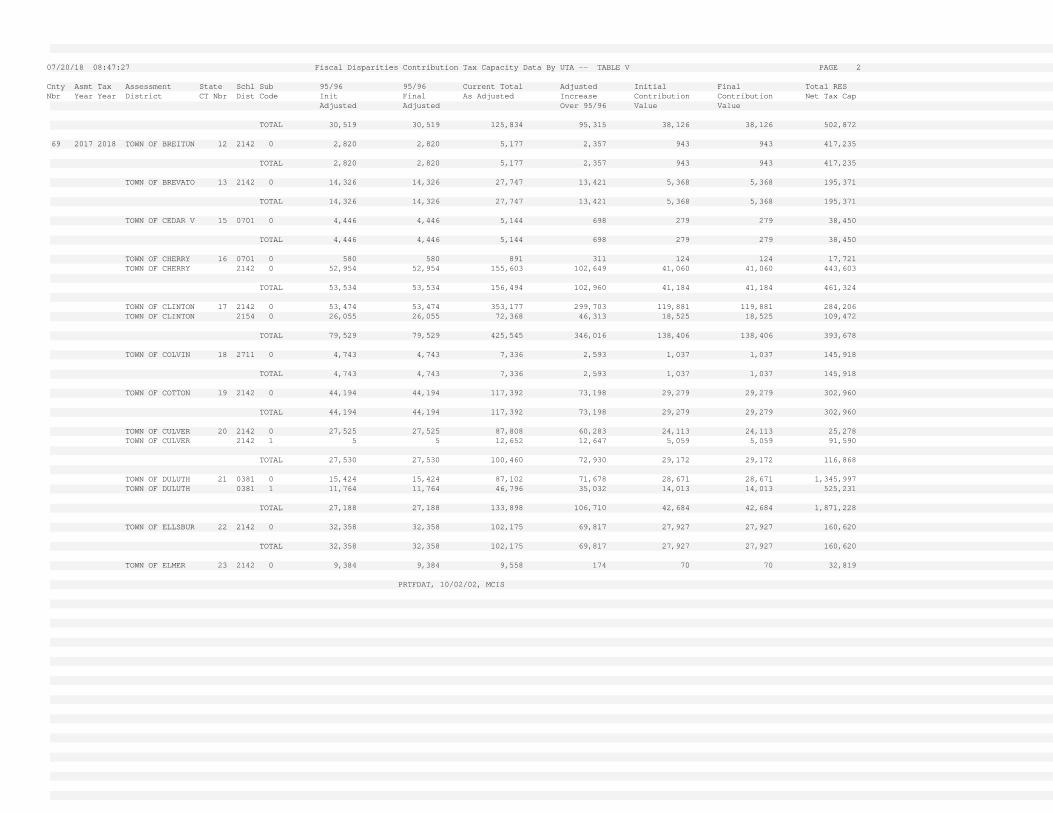
07/20/18 08:47:27 Fiscal Disparities Contribution Tax Capacity Data By UTA -- TABLE V PAGE 2
Cnty Asmt Tax Assessment State Schl Sub 95/96 95/96 Current Total Adjusted Initial Final Total RESNbr Year Year District CT Nbr Dist Code Init Final As Adjusted Increase Contribution Contribution Net Tax Cap Adjusted Adjusted Over 95/96 Value Value
TOTAL 30,519 30,519 125,834 95,315 38,126 38,126 502,872
69 2017 2018 TOWN OF BREITUN 12 2142 0 2,820 2,820 5,177 2,357 943 943 417,235
TOTAL 2,820 2,820 5,177 2,357 943 943 417,235
TOWN OF BREVATO 13 2142 0 14,326 14,326 27,747 13,421 5,368 5,368 195,371
TOTAL 14,326 14,326 27,747 13,421 5,368 5,368 195,371
TOWN OF CEDAR V 15 0701 0 4,446 4,446 5,144 698 279 279 38,450
TOTAL 4,446 4,446 5,144 698 279 279 38,450
TOWN OF CHERRY 16 0701 0 580 580 891 311 124 124 17,721 TOWN OF CHERRY 2142 0 52,954 52,954 155,603 102,649 41,060 41,060 443,603
TOTAL 53,534 53,534 156,494 102,960 41,184 41,184 461,324
TOWN OF CLINTON 17 2142 0 53,474 53,474 353,177 299,703 119,881 119,881 284,206 TOWN OF CLINTON 2154 0 26,055 26,055 72,368 46,313 18,525 18,525 109,472
TOTAL 79,529 79,529 425,545 346,016 138,406 138,406 393,678
TOWN OF COLVIN 18 2711 0 4,743 4,743 7,336 2,593 1,037 1,037 145,918
TOTAL 4,743 4,743 7,336 2,593 1,037 1,037 145,918
TOWN OF COTTON 19 2142 0 44,194 44,194 117,392 73,198 29,279 29,279 302,960
TOTAL 44,194 44,194 117,392 73,198 29,279 29,279 302,960
TOWN OF CULVER 20 2142 0 27,525 27,525 87,808 60,283 24,113 24,113 25,278 TOWN OF CULVER 2142 1 5 5 12,652 12,647 5,059 5,059 91,590
TOTAL 27,530 27,530 100,460 72,930 29,172 29,172 116,868
TOWN OF DULUTH 21 0381 0 15,424 15,424 87,102 71,678 28,671 28,671 1,345,997 TOWN OF DULUTH 0381 1 11,764 11,764 46,796 35,032 14,013 14,013 525,231
TOTAL 27,188 27,188 133,898 106,710 42,684 42,684 1,871,228
TOWN OF ELLSBUR 22 2142 0 32,358 32,358 102,175 69,817 27,927 27,927 160,620
TOTAL 32,358 32,358 102,175 69,817 27,927 27,927 160,620
TOWN OF ELMER 23 2142 0 9,384 9,384 9,558 174 70 70 32,819
PRTFDAT, 10/02/02, MCIS

07/20/18 08:47:27 Fiscal Disparities Contribution Tax Capacity Data By UTA -- TABLE V PAGE 3
Cnty Asmt Tax Assessment State Schl Sub 95/96 95/96 Current Total Adjusted Initial Final Total RESNbr Year Year District CT Nbr Dist Code Init Final As Adjusted Increase Contribution Contribution Net Tax Cap Adjusted Adjusted Over 95/96 Value Value
TOTAL 9,384 9,384 9,558 174 70 70 32,819
69 2017 2018 TOWN OF EMBARRA 24 2142 0 6,421 6,421 10,464 4,043 1,617 1,617 217,705
TOTAL 6,421 6,421 10,464 4,043 1,617 1,617 217,705
TOWN OF FAIRBAN 25 0381 0 4,446 4,446 75,392 70,946 28,378 28,378 43,026
TOTAL 4,446 4,446 75,392 70,946 28,378 28,378 43,026
TOWN OF FAYAL 26 2154 0 47,918 47,918 157,252 109,334 43,734 43,734 1,420,730 TOWN OF FAYAL 2154 1 0 0 0 0 0 0 806
TOTAL 47,918 47,918 157,252 109,334 43,734 43,734 1,421,536
TOWN OF FIELD 27 2142 0 26,576 26,576 174,511 147,935 59,174 59,174 158,531
TOTAL 26,576 26,576 174,511 147,935 59,174 59,174 158,531
TOWN OF FRENCH 31 0701 0 6,155 6,155 25,772 19,617 7,847 7,847 693,551
TOTAL 6,155 6,155 25,772 19,617 7,847 7,847 693,551
TOWN OF GREAT S 34 0712 0 59,510 59,510 201,156 141,646 56,658 56,658 215,857
TOTAL 59,510 59,510 201,156 141,646 56,658 56,658 215,857
TOWN OF INDUSTR 37 2142 0 24,153 24,153 113,887 89,734 35,894 35,894 61,636 TOWN OF INDUSTR 2142 1 3,965 3,965 38,870 34,905 13,962 13,962 372,660
TOTAL 28,118 28,118 152,757 124,639 49,856 49,856 434,296
TOWN OF KELSEY 38 2142 0 18,318 18,318 117,236 98,918 39,567 39,567 53,507
TOTAL 18,318 18,318 117,236 98,918 39,567 39,567 53,507
TOWN OF KUGLER 39 2142 0 288 288 87,024 86,736 34,694 34,694 33,123 TOWN OF KUGLER 2142 1 0 0 0 0 0 0 22,912
TOTAL 288 288 87,024 86,736 34,694 34,694 56,035
TOWN OF LAVELL 41 0701 0 3,482 3,482 12,002 8,520 3,408 3,408 9,211 TOWN OF LAVELL 2142 0 759,376 759,376 887,048 127,672 51,069 51,069 107,594
TOTAL 762,858 762,858 899,050 136,192 54,477 54,477 116,805
TOWN OF LEIDING 42 2142 0 39,415 39,415 168,150 128,735 51,494 51,494 174,316
PRTFDAT, 10/02/02, MCIS

07/20/18 08:47:27 Fiscal Disparities Contribution Tax Capacity Data By UTA -- TABLE V PAGE 4
Cnty Asmt Tax Assessment State Schl Sub 95/96 95/96 Current Total Adjusted Initial Final Total RESNbr Year Year District CT Nbr Dist Code Init Final As Adjusted Increase Contribution Contribution Net Tax Cap Adjusted Adjusted Over 95/96 Value Value
TOTAL 39,415 39,415 168,150 128,735 51,494 51,494 174,316
69 2017 2018 TOWN OF LINDEN 43 2142 0 2,082 2,082 5,206 3,124 1,250 1,250 41,641
TOTAL 2,082 2,082 5,206 3,124 1,250 1,250 41,641
TOWN OF MCDAVIT 44 2142 0 38,740 38,740 298,101 259,361 103,744 103,744 165,761
TOTAL 38,740 38,740 298,101 259,361 103,744 103,744 165,761
TOWN OF MEADOWL 45 2142 0 19,280 19,280 121,590 102,310 40,924 40,924 92,494
TOTAL 19,280 19,280 121,590 102,310 40,924 40,924 92,494
TOWN OF MORCOM 49 2142 0 2,060 2,060 4,237 2,177 871 871 25,861
TOTAL 2,060 2,060 4,237 2,177 871 871 25,861
TOWN OF MORSE 50 0696 0 6,545 6,545 66,520 59,975 23,990 23,990 1,755,208
TOTAL 6,545 6,545 66,520 59,975 23,990 23,990 1,755,208
TOWN OF NESS 51 2142 0 2,960 2,960 6,597 3,637 1,455 1,455 30,948
TOTAL 2,960 2,960 6,597 3,637 1,455 1,455 30,948
TOWN OF NEW IND 52 2142 0 10,400 10,400 33,314 22,914 9,166 9,166 184,272
TOTAL 10,400 10,400 33,314 22,914 9,166 9,166 184,272
TOWN OF NORTHLA 55 2142 0 9,234 9,234 20,339 11,105 4,442 4,442 148,536
TOTAL 9,234 9,234 20,339 11,105 4,442 4,442 148,536
TOWN OF OWENS 56 2142 0 11,795 11,795 50,567 38,772 15,509 15,509 114,701
TOTAL 11,795 11,795 50,567 38,772 15,509 15,509 114,701
TOWN OF PIKE 58 0706 0 4,578 4,578 12,797 8,219 3,288 3,288 180,707 TOWN OF PIKE 2142 0 0 0 0 0 0 0 1,212
TOTAL 4,578 4,578 12,797 8,219 3,288 3,288 181,919
TOWN OF PORTAGE 59 2142 0 1,016 1,016 6,989 5,973 2,389 2,389 107,444 TOWN OF PORTAGE 2142 1 0 0 0 0 0 0 0
TOTAL 1,016 1,016 6,989 5,973 2,389 2,389 107,444
PRTFDAT, 10/02/02, MCIS
07/20/18 08:47:27 Fiscal Disparities Contribution Tax Capacity Data By UTA -- TABLE V PAGE 5
Cnty Asmt Tax Assessment State Schl Sub 95/96 95/96 Current Total Adjusted Initial Final Total RESNbr Year Year District CT Nbr Dist Code Init Final As Adjusted Increase Contribution Contribution Net Tax Cap Adjusted Adjusted Over 95/96 Value Value
69 2017 2018 TOWN OF SANDY 62 0706 0 24,386 24,386 61,538 37,152 14,861 14,861 146,271
TOTAL 24,386 24,386 61,538 37,152 14,861 14,861 146,271
TOWN OF STONEY 64 2142 0 2,893 2,893 13,953 11,060 4,424 4,424 94,192
TOTAL 2,893 2,893 13,953 11,060 4,424 4,424 94,192
TOWN OF STURGEO 66 2142 0 290 290 27 0 0 0 46,599
TOTAL 290 290 27 0 0 0 46,599
TOWN OF TOIVOLA 67 2142 0 34,339 34,339 45,871 11,532 4,613 4,613 54,391
TOTAL 34,339 34,339 45,871 11,532 4,613 4,613 54,391
TOWN OF VERMILI 69 2142 0 1,441 1,441 72,391 70,950 28,380 28,380 187,934
TOTAL 1,441 1,441 72,391 70,950 28,380 28,380 187,934
TOWN OF WAASA 70 2142 0 8,316 8,316 13,766 5,450 2,180 2,180 90,299
TOTAL 8,316 8,316 13,766 5,450 2,180 2,180 90,299
TOWN OF WHITE 71 2711 0 65,162 65,162 270,149 204,987 81,995 81,995 698,484
TOTAL 65,162 65,162 270,149 204,987 81,995 81,995 698,484
TOWN OF WILLOW 72 2142 0 1,981 1,981 21,819 19,838 7,935 7,935 34,735
TOTAL 1,981 1,981 21,819 19,838 7,935 7,935 34,735
TOWN OF WUORI 73 0706 0 64,943 64,943 144,343 79,400 31,760 31,760 262,488
TOTAL 64,943 64,943 144,343 79,400 31,760 31,760 262,488
TOWN OF GREENWO 74 2142 0 7,313 7,313 149,990 142,677 57,071 57,071 1,482,866
TOTAL 7,313 7,313 149,990 142,677 57,071 57,071 1,482,866
TOWN OF PEQUAYW 75 0381 0 0 0 2,535 2,535 1,014 1,014 198,886
TOTAL 0 0 2,535 2,535 1,014 1,014 198,886
TOWN OF EAGLES 77 2142 0 2,121 2,121 6,477 4,356 1,742 1,742 360,273
TOTAL 2,121 2,121 6,477 4,356 1,742 1,742 360,273
PRTFDAT, 10/02/02, MCIS
07/20/18 08:47:27 Fiscal Disparities Contribution Tax Capacity Data By UTA -- TABLE V PAGE 6
Cnty Asmt Tax Assessment State Schl Sub 95/96 95/96 Current Total Adjusted Initial Final Total RESNbr Year Year District CT Nbr Dist Code Init Final As Adjusted Increase Contribution Contribution Net Tax Cap Adjusted Adjusted Over 95/96 Value Value
69 2017 2018 TOWN OF CAMP 5 78 2142 0 0 0 2,003 2,003 801 801 29,352
TOTAL 0 0 2,003 2,003 801 801 29,352
TOWN OF CRANE L 79 2142 1 0 0 1,542 1,542 617 617 0 TOWN OF CRANE L 2142 2 0 0 17,272 17,272 6,909 6,909 122,132 TOWN OF CRANE L 2142 3 423 423 0 0 0 0 0 TOWN OF CRANE L 2142 4 0 0 0 0 0 0 0
TOTAL 423 423 18,814 18,814 7,526 7,526 122,132
RURAL SOUTHWEST 86 0701 65 434 434 2,456 2,022 809 809 197,014
TOTAL 434 434 2,456 2,022 809 809 197,014
THREE LAKES 87 2142 25 0 0 1,533 1,533 613 613 140,223
TOTAL 0 0 1,533 1,533 613 613 140,223
ISLAND LAKE 88 2142 19 12,489 12,489 34,360 21,871 8,748 8,748 351,893
TOTAL 12,489 12,489 34,360 21,871 8,748 8,748 351,893
WHITE FACE 89 2142 20 19,364 19,364 63,520 44,156 17,662 17,662 8,276 WHITE FACE 2711 10 160 160 824 664 266 266 10,794 WHITE FACE 2711 11 54 54 6,612 6,558 2,623 2,623 16,147 WHITE FACE 2711 12 256 256 1,274 1,018 407 407 406 WHITE FACE 2711 13 0 0 0 0 0 0 232 WHITE FACE 2711 21 0 0 0 0 0 0 47,098 WHITE FACE 2711 22 9,452 9,452 17,987 8,535 3,414 3,414 11,399
TOTAL 29,286 29,286 90,217 60,931 24,372 24,372 94,352
CENTRAL LAKES 90 2142 26 483 483 1,277 794 318 318 119,283 CENTRAL LAKES 2142 35 30,549 30,549 115,227 84,678 33,871 33,871 194,182
TOTAL 31,032 31,032 116,504 85,472 34,189 34,189 313,465
BIWABIK 91 2154 27 1,163 1,163 2,039 876 350 350 128,730 BIWABIK 2154 28 837 837 1,551 714 286 286 39,995 BIWABIK 2711 27 4,882 4,882 26,036 21,154 8,462 8,462 308,750 BIWABIK 2711 28 0 0 0 0 0 0 0
TOTAL 6,882 6,882 29,626 22,744 9,098 9,098 477,475
BIRCH & BEAR IS 92 0696 1 0 0 0 0 0 0 24,374 BIRCH & BEAR IS 0696 5 1,897 1,897 0 0 0 0 177,605
PRTFDAT, 10/02/02, MCIS

07/20/18 08:47:27 Fiscal Disparities Contribution Tax Capacity Data By UTA -- TABLE V PAGE 7
Cnty Asmt Tax Assessment State Schl Sub 95/96 95/96 Current Total Adjusted Initial Final Total RESNbr Year Year District CT Nbr Dist Code Init Final As Adjusted Increase Contribution Contribution Net Tax Cap Adjusted Adjusted Over 95/96 Value Value
69 2017 2018 BIRCH & BEAR IS 92 2142 1 3,707 3,707 0 0 0 0 46,784 BIRCH & BEAR IS 2142 5 10,404 10,404 47,119 36,715 14,686 14,686 178,283 BIRCH & BEAR IS 2142 14 0 0 0 0 0 0 6,465
TOTAL 16,008 16,008 47,119 36,715 14,686 14,686 433,511
MT. IRON 93 0706 46 8,130 8,130 18,197 10,067 4,027 4,027 679,945 MT. IRON 2142 46 5,834 5,834 19,106 13,272 5,309 5,309 18,305
TOTAL 13,964 13,964 37,303 23,339 9,336 9,336 698,250
BALKAN 94 0701 66 107 107 1,306 1,199 480 480 117,865 BALKAN 0701 67 0 0 0 0 0 0 25,805 BALKAN 0712 51 233 233 1,890 1,657 663 663 118,836
TOTAL 340 340 3,196 2,856 1,143 1,143 262,506
LAKE VERMILION 95 0696 2 0 0 0 0 0 0 33,534 LAKE VERMILION 0696 6 0 0 0 0 0 0 28,340 LAKE VERMILION 2142 15 0 0 0 0 0 0 30,570 LAKE VERMILION 2142 22 0 0 683 683 273 273 15,024 LAKE VERMILION 2142 38 0 0 0 0 0 0 12,960 LAKE VERMILION 2142 39 98 98 2,303 2,205 882 882 361,489
TOTAL 98 98 2,986 2,888 1,155 1,155 481,917
ORR - LEIDING 96 2142 37 0 0 0 0 0 0 585 ORR - LEIDING 2142 52 16,001 16,001 53,958 37,957 15,183 15,183 5,779 ORR - LEIDING 2142 57 0 0 161 161 64 64 14,117 ORR - LEIDING 2142 67 2,122 2,122 9,798 7,676 3,070 3,070 39,219 ORR - LEIDING 2142 68 230 230 433 203 81 81 23,708 ORR - LEIDING 2142 69 0 0 265 265 106 106 14,874 ORR - LEIDING 2142 70 0 0 0 0 0 0 0 ORR - LEIDING 2142 71 0 0 30 30 12 12 0
TOTAL 18,353 18,353 64,645 46,292 18,516 18,516 98,282
NORTHWEST 97 2142 43 0 0 0 0 0 0 0 NORTHWEST 2142 47 0 0 0 0 0 0 1,136 NORTHWEST 2142 48 0 0 0 0 0 0 0 NORTHWEST 2142 49 35,088 35,088 114,428 79,340 31,736 31,736 0 NORTHWEST 2142 50 355 355 518 163 65 65 0 NORTHWEST 2142 53 0 0 0 0 0 0 0 NORTHWEST 2142 55 0 0 0 0 0 0 9,456 NORTHWEST 2142 56 0 0 0 0 0 0 0 NORTHWEST 2142 58 25,520 25,520 89,130 63,610 25,444 25,444 32,918 NORTHWEST 2142 59 399 399 532 133 53 53 2,465
PRTFDAT, 10/02/02, MCIS
07/20/18 08:47:27 Fiscal Disparities Contribution Tax Capacity Data By UTA -- TABLE V PAGE 8
Cnty Asmt Tax Assessment State Schl Sub 95/96 95/96 Current Total Adjusted Initial Final Total RESNbr Year Year District CT Nbr Dist Code Init Final As Adjusted Increase Contribution Contribution Net Tax Cap Adjusted Adjusted Over 95/96 Value Value
69 2017 2018 NORTHWEST 97 2142 60 554 554 2,177 1,623 649 649 950 NORTHWEST 2142 61 0 0 0 0 0 0 0 NORTHWEST 2142 62 0 0 0 0 0 0 0 NORTHWEST 2142 63 0 0 0 0 0 0 0 NORTHWEST 2142 72 684 684 1,409 725 290 290 2,367 NORTHWEST 2142 73 1,244 1,244 8,068 6,824 2,730 2,730 1,719 NORTHWEST 2142 75 0 0 0 0 0 0 0 NORTHWEST 2142 76 0 0 0 0 0 0 0 NORTHWEST 2142 77 726 726 10,017 9,291 3,716 3,716 27,894
TOTAL 64,570 64,570 226,279 161,709 64,683 64,683 78,905
NORTHEAST 98 2142 7 0 0 0 0 0 0 5,461 NORTHEAST 2142 17 0 0 0 0 0 0 5,107 NORTHEAST 2142 18 0 0 0 0 0 0 0 NORTHEAST 2142 23 0 0 0 0 0 0 0 NORTHEAST 2142 31 0 0 0 0 0 0 0 NORTHEAST 2142 32 0 0 276 276 110 110 0 NORTHEAST 2142 33 0 0 0 0 0 0 0 NORTHEAST 2142 40 0 0 0 0 0 0 5,332 NORTHEAST 2142 77 0 0 0 0 0 0 0 NORTHEAST 2142 78 0 0 0 0 0 0 0
TOTAL 0 0 276 276 110 110 15,900
UNORGANIZED 65 99 2142 0 0 0 0 0 0 0 0 UNORGANIZED 65 2142 16 0 0 0 0 0 0 0
TOTAL 0 0 0 0 0 0 0
CITY OF AURORA 600 2711 0 57,325 57,325 178,393 121,068 48,427 48,427 340,453
TOTAL 57,325 57,325 178,393 121,068 48,427 48,427 340,453
CITY OF BIWABIK 900 2154 0 226 226 5,696 5,470 2,188 2,188 0 CITY OF BIWABIK 2711 0 31,122 31,122 174,524 143,402 57,361 57,361 293,231
TOTAL 31,348 31,348 180,220 148,872 59,549 59,549 293,231
CITY OF BROOKST 1,200 2142 0 3,792 3,792 13,840 10,048 4,019 4,019 37,348
TOTAL 3,792 3,792 13,840 10,048 4,019 4,019 37,348
CITY OF BUHL 1,300 0712 0 12,343 12,343 36,040 23,697 9,479 9,479 222,842
TOTAL 12,343 12,343 36,040 23,697 9,479 9,479 222,842
PRTFDAT, 10/02/02, MCIS
07/20/18 08:47:27 Fiscal Disparities Contribution Tax Capacity Data By UTA -- TABLE V PAGE 9
Cnty Asmt Tax Assessment State Schl Sub 95/96 95/96 Current Total Adjusted Initial Final Total RESNbr Year Year District CT Nbr Dist Code Init Final As Adjusted Increase Contribution Contribution Net Tax Cap Adjusted Adjusted Over 95/96 Value Value
69 2017 2018 CITY OF CHISHOL 1,800 0695 0 125,272 125,272 285,213 159,941 63,976 63,976 994,090 CITY OF CHISHOL 0701 0 25 25 6,136 6,111 2,444 2,444 4
TOTAL 125,297 125,297 291,349 166,052 66,420 66,420 994,094
CITY OF COOK 1,900 2142 0 50,830 50,830 166,253 115,423 46,169 46,169 126,043
TOTAL 50,830 50,830 166,253 115,423 46,169 46,169 126,043
CITY OF ELY 2,500 0696 0 123,789 123,789 530,242 406,453 162,581 162,581 1,040,449
TOTAL 123,789 123,789 530,242 406,453 162,581 162,581 1,040,449
CITY OF EVELETH 2,700 2154 0 137,611 137,611 380,654 243,043 97,217 97,217 749,442
TOTAL 137,611 137,611 380,654 243,043 97,217 97,217 749,442
CITY OF GILBERT 3,500 2154 0 1,044 1,044 6,962 5,918 2,367 2,367 7,659 CITY OF GILBERT 2154 1 39,352 39,352 164,929 125,577 50,231 50,231 454,355
TOTAL 40,396 40,396 171,891 131,495 52,598 52,598 462,014
CITY OF HIBBING 3,800 0701 1 169,926 169,926 451,816 281,890 112,756 112,756 467,879 CITY OF HIBBING 0701 2 596,651 596,651 1,755,104 1,158,453 463,381 463,381 2,772,358 CITY OF HIBBING 0701 3 301,674 301,674 675,511 373,837 149,535 149,535 1,477,578
TOTAL 1,068,251 1,068,251 2,882,431 1,814,180 725,672 725,672 4,717,815
CITY OF IRON JU 4,000 2154 0 5,512 5,512 37,265 31,753 12,701 12,701 38,319
TOTAL 5,512 5,512 37,265 31,753 12,701 12,701 38,319
CITY OF KINNEY 4,400 0712 0 11,897 11,897 22,668 10,771 4,308 4,308 19,860
TOTAL 11,897 11,897 22,668 10,771 4,308 4,308 19,860
CITY OF LEONIDA 4,600 2154 0 1,918 1,918 20,918 19,000 7,600 7,600 12,168
TOTAL 1,918 1,918 20,918 19,000 7,600 7,600 12,168
CITY OF MCKINLE 4,900 2154 0 1,204 1,204 8,885 7,681 3,072 3,072 18,691
TOTAL 1,204 1,204 8,885 7,681 3,072 3,072 18,691
CITY OF MEADOWL 5,100 2142 0 7,220 7,220 10,380 3,160 1,264 1,264 23,613
TOTAL 7,220 7,220 10,380 3,160 1,264 1,264 23,613
PRTFDAT, 10/02/02, MCIS

07/20/18 08:47:27 Fiscal Disparities Contribution Tax Capacity Data By UTA -- TABLE V PAGE 10
Cnty Asmt Tax Assessment State Schl Sub 95/96 95/96 Current Total Adjusted Initial Final Total RESNbr Year Year District CT Nbr Dist Code Init Final As Adjusted Increase Contribution Contribution Net Tax Cap Adjusted Adjusted Over 95/96 Value Value
69 2017 2018 CITY OF MT IRON 5,400 0706 0 1,772 1,772 21,324 19,552 7,821 7,821 5,215 CITY OF MT IRON 0712 0 307,377 307,377 1,478,101 1,170,724 468,290 468,290 1,211,152 CITY OF MT IRON 2154 0 0 0 0 0 0 0 6,832
TOTAL 309,149 309,149 1,499,425 1,190,276 476,111 476,111 1,223,199
CITY OF ORR 5,600 2142 0 16,512 16,512 67,524 51,012 20,405 20,405 90,533
TOTAL 16,512 16,512 67,524 51,012 20,405 20,405 90,533
CITY OF TOWER 6,800 2142 0 25,084 25,084 73,017 47,933 19,173 19,173 190,388
TOTAL 25,084 25,084 73,017 47,933 19,173 19,173 190,388
CITY OF VIRGINI 6,900 0706 0 615,497 615,497 1,940,117 1,324,620 529,848 529,848 1,910,801 CITY OF VIRGINI 0712 0 31,722 31,722 85,751 54,029 21,612 21,612 8,937 CITY OF VIRGINI 2154 0 3,934 3,934 45,737 41,803 16,721 16,721 13,736 CITY OF VIRGINI 2154 1 4,430 4,430 12,091 7,661 3,064 3,064 0
TOTAL 655,583 655,583 2,083,696 1,428,113 571,245 571,245 1,933,474
CITY OF WINTON 7,100 0696 0 2,713 2,713 2,728 15 6 6 43,514
TOTAL 2,713 2,713 2,728 15 6 6 43,514
CITY OF HOYT LA 7,200 2711 0 532,596 532,596 1,349,515 816,919 326,768 326,768 442,374
TOTAL 532,596 532,596 1,349,515 816,919 326,768 326,768 442,374
CITY OF BABBITT 7,300 2142 0 76,468 76,468 169,861 93,393 37,357 37,357 351,879
TOTAL 76,468 76,468 169,861 93,393 37,357 37,357 351,879
TOTAL 5,932,356 5,932,356 17,112,395 11,376,212 4,550,483 4,550,483 33,875,566
FINAL TOTALS
* * * E N D O F R E P O R T * * *
PRTFDAT, 10/02/02, MCIS
Related Documents