University of Wollongong Research Online Faculty of Science, Medicine and Health - Papers Faculty of Science, Medicine and Health 2014 PerCEN: a cluster randomized controlled trial of person-centered residential care and environment for people with dementia Lynn Chenoweth University of Technology, Sydney, [email protected] Ian Forbes University of Technology, Sydney Richard Fleming University of Wollongong, rfl[email protected] Madeleine King University of Sydney Jane Stein-Parbury University of Technology Sydney See next page for additional authors Research Online is the open access institutional repository for the University of Wollongong. For further information contact the UOW Library: [email protected] Publication Details Chenoweth, L., Forbes, I., Fleming, R., King, M. T., Stein-Parbury, J., Luscombe, G., Kenny, P., Jeon, Y., Haas, M. & Brodaty, H. (2014). PerCEN: a cluster randomized controlled trial of person-centered residential care and environment for people with dementia. International Psychogeriatrics, 26 (7), 1147-1160.

Welcome message from author
This document is posted to help you gain knowledge. Please leave a comment to let me know what you think about it! Share it to your friends and learn new things together.
Transcript
University of WollongongResearch Online
Faculty of Science, Medicine and Health - Papers Faculty of Science, Medicine and Health
2014
PerCEN: a cluster randomized controlled trial ofperson-centered residential care and environmentfor people with dementiaLynn ChenowethUniversity of Technology, Sydney, [email protected]
Ian ForbesUniversity of Technology, Sydney
Richard FlemingUniversity of Wollongong, [email protected]
Madeleine KingUniversity of Sydney
Jane Stein-ParburyUniversity of Technology Sydney
See next page for additional authors
Research Online is the open access institutional repository for theUniversity of Wollongong. For further information contact the UOWLibrary: [email protected]
Publication DetailsChenoweth, L., Forbes, I., Fleming, R., King, M. T., Stein-Parbury, J., Luscombe, G., Kenny, P., Jeon, Y., Haas, M. & Brodaty, H.(2014). PerCEN: a cluster randomized controlled trial of person-centered residential care and environment for people with dementia.International Psychogeriatrics, 26 (7), 1147-1160.

PerCEN: a cluster randomized controlled trial of person-centeredresidential care and environment for people with dementia
AbstractBackground: There is good evidence of the positive effects of person-centered care (PCC) on agitation indementia. We hypothesized that a person-centered environment (PCE) would achieve similar outcomes byfocusing on positive environmental stimuli, and that there would be enhanced outcomes by combining PCCand PCE. Methods: 38 Australian residential aged care homes with scope for improvement in both PCC andPCE were stratified, then randomized to one of four intervention groups: (1) PCC; (2) PCE; (3) PCC+PCE; (4) no intervention. People with dementia, over 60 years of age and consented were eligible. Co-outcomes assessed pre and four months post-intervention and at 8 months follow-up were resident agitation,emotional responses in care, quality of life and depression, and care interaction quality. Results: From 38homes randomized, 601 people with dementia were recruited. At follow-up the mean change for quality of lifeand agitation was significantly different for PCE (p = 0.02, p = 0.05, respectively) and PCC (p = 0.0003, p =0.002 respectively), compared with the non-intervention group (p = 0.48, p = 0.93 respectively). Quality oflife improved non-significantly for PCC+PCE (p = 0.08), but not for agitation (p = 0.37). Improvements incare interaction quality (p = 0.006) and in emotional responses to care (p = 0.01) in PCC+PCE were notobserved in the other groups. Depression scores did not change in any of the groups. Intervention compliancefor PCC was 59%, for PCE 54% and for PCC+PCE 66%. Conclusion: The hypothesis that PCC+PCE wouldimprove quality of life and agitation even further was not supported, even though there were improvements inthe quality of care interactions and resident emotional responses to care for some of this group. The AustralianNew Zealand Clinical Trials Registry Number is ACTRN 12608000095369.
KeywordsAged care, dementia, residential facilities, randomized controlled trial (RCT)
DisciplinesMedicine and Health Sciences | Social and Behavioral Sciences
Publication DetailsChenoweth, L., Forbes, I., Fleming, R., King, M. T., Stein-Parbury, J., Luscombe, G., Kenny, P., Jeon, Y., Haas,M. & Brodaty, H. (2014). PerCEN: a cluster randomized controlled trial of person-centered residential careand environment for people with dementia. International Psychogeriatrics, 26 (7), 1147-1160.
AuthorsLynn Chenoweth, Ian Forbes, Richard Fleming, Madeleine King, Jane Stein-Parbury, Georgina Luscombe,Patricia Kenny, Yun-Hee Jeon, Marion Haas, and Henry Brodaty
This journal article is available at Research Online: http://ro.uow.edu.au/smhpapers/1809

International Psychogeriatrics (2014), 26:7, 1147–1160 C© International Psychogeriatric Association 2014doi:10.1017/S1041610214000398
PerCEN: a cluster randomized controlled trial ofperson-centered residential care and environmentfor people with dementia
...........................................................................................................................................................................................................................................................................................................................................................................................................................................................................................................................................................................................................................................
Lynn Chenoweth,1,2 Ian Forbes,3 Richard Fleming,4 Madeleine T. King,5
Jane Stein-Parbury,6 Georgina Luscombe,7 Patricia Kenny,8 Yun-Hee Jeon,9
Marion Haas8 and Henry Brodaty10
1Aged and Extended Care Nursing, Faculty of Health, University of Technology, Sydney, NSW, Australia2Centre for Healthy Brain Ageing, School of Psychiatry, University of New South Wales, Sydney, NSW, Australia3Faculty of Design, Architecture and Building, University of Technology Sydney, Sydney, NSW, Australia4Dementia Training Study Centre, University of Wollongong, Wollongong, Australia5Director Quality of Life Research Centre, University of Sydney, Sydney, NSW, Australia6Faculty of Health, University of Technology, Sydney, NSW, Australia7Sydney Medical School, University of Sydney, Sydney, NSW, Australia8Centre for Health Economics Research and Evaluation, University of Technology, Sydney, NSW, Australia9Faculty of Nursing and Midwifery, University of Sydney, Sydney, NSW, Australia10School of Psychiatry, University of New South Wales, Sydney, Australia
ABSTRACT
Background: There is good evidence of the positive effects of person-centered care (PCC) on agitation indementia. We hypothesized that a person-centered environment (PCE) would achieve similar outcomes byfocusing on positive environmental stimuli, and that there would be enhanced outcomes by combining PCCand PCE.
Methods: 38 Australian residential aged care homes with scope for improvement in both PCC and PCE werestratified, then randomized to one of four intervention groups: (1) PCC; (2) PCE; (3) PCC +PCE; (4) nointervention. People with dementia, over 60 years of age and consented were eligible. Co-outcomes assessedpre and four months post-intervention and at 8 months follow-up were resident agitation, emotional responsesin care, quality of life and depression, and care interaction quality.
Results: From 38 homes randomized, 601 people with dementia were recruited. At follow-up the meanchange for quality of life and agitation was significantly different for PCE (p = 0.02, p = 0.05, respectively)and PCC (p = 0.0003, p = 0.002 respectively), compared with the non-intervention group (p = 0.48, p =0.93 respectively). Quality of life improved non-significantly for PCC+PCE (p = 0.08), but not for agitation(p = 0.37). Improvements in care interaction quality (p = 0.006) and in emotional responses to care (p =0.01) in PCC+PCE were not observed in the other groups. Depression scores did not change in any of thegroups. Intervention compliance for PCC was 59%, for PCE 54% and for PCC+PCE 66%.
Conclusion: The hypothesis that PCC+PCE would improve quality of life and agitation even further was notsupported, even though there were improvements in the quality of care interactions and resident emotionalresponses to care for some of this group. The Australian New Zealand Clinical Trials Registry Number isACTRN 12608000095369.
Key words: aged care, dementia, residential facilities, randomized controlled trial (RCT)
Introduction
In Australia at least half the 180,000 people inresidential care have dementia (Australian Institute
Correspondence should be addressed to: Lynn Chenoweth, Professor of Aged Careand Extended Practice Nursing, Faculty of Health, University of Technology,Sydney, Australia. Professor of Nursing, Centre for Healthy Brain Ageing,School of Psychiatry, University of New South Wales, Sydney, Australia.Phone: +61 2 9514 5710. Email: [email protected]. Received9 May 2013; revision requested 2 Oct 2013; revised version received 13 Feb2014; accepted 17 Feb 2014. First published online 26 March 2014.
of Health and Welfare, 2012). These people areextremely vulnerable and require a great deal ofassistance with activities of living. Many have highrates of inappropriately managed symptoms such asagitation and depression (Edvardsson et al., 2008;Desborough et al., 2011). These symptoms canoccur when the care environment is unfamiliarand unpredictable (Edvardsson et al., 2008). Boththe care that is provided and the physical careenvironment are factors in the person’s ability

1148 L. Chenoweth et al.
to maintain a sense of well-being (Kitwood andBredin, 1992).
Agitation can be reduced with person centredcare (PCC) (Chenoweth et al., 2009; Desboroughet al., 2011), which is informed by the Social-Psychological Theory of Personhood in Dementia(Kitwood and Bredin, 1992). The theory explainshow agitation can result from negative contextualstimuli that disregard or deny personhood. Thequality of the care interactions occurring has agreat bearing on how people with dementia willfeel. Warm, empathetic care interactions help theperson to feel happy and relaxed, while negative,disrespectful and dis-engaged care interactions canlead to agitation and ill-being (Kitwood and Bredin,1992). The aim of PCC is to support personhoodand remaining abilities (Surr, 2006; Chenowethet al., 2009).
Direct care staff can acquire PCC skillsthrough training and supervision, but managementleadership and a supportive workplace culture areneeded to reinforce PCC (Jeon et al., 2012). Aperson-centred culture requires that executive andfront-line managers implement a person-centredorganisational framework in which quality dementiacare can be provided by direct care staff (Brooker,2004). When this occurs direct care staff willhave far greater opportunities to consider eachresident’s unique history in establishing a positiverelationships with them and their family, alteringwork routines to meet the resident’s needs andinvolving the resident in meaningful activities ofdaily care (Edvardsson et al., 2008; Stein-Parburyet al., 2012).
Empirical research has demonstrated that aspectsof the physical environment can assist carers tohelp the person with dementia to feel more secure(Bicket et al., 2010). The care environment canbe designed to reduce confusion, agitation anddepression while improving social interaction andengagement with others and the environment (Dayet al., 2000; Fleming and Purandare, 2010). Aperson-centred care environment (PCE) (Daviset al., 2009) can prompt the person to maintaintheir daily living abilities (Briller et al., 2001;Brooker et al., 2007; Brooker, et al., 2011) and cantrigger memory cues and other cognitive processesthat slow the decline in communication, socialfunction and mobility (Fleming and Purandare,2010). Recognisable features in the physical careenvironment have a great bearing on how peoplewith dementia will feel and behave (Surr, 2006;Edvardsson et al., 2008).
Unlike with PCC there have been no largescale dementia studies designed to determine theeffectiveness of PCE alone and combined withPCC. The PerCEN study aimed to address thisknowledge gap. Given that both PCC and PCE are
intrinsically site-level interventions, PerCEN wasdesigned as a group randomised controlled trial.
Study HypothesisWe hypothesised that both PCC and PCE wouldimprove resident agitation, quality of life, emotionalresponses in care and depression, and improve careinteraction quality, and that PCC+PCE would leadto even greater improvements in these outcomesrelative to usual care and usual environment.
Method
DesignIn a factorial group-randomised cohort design,assessments occurred at three time points (pre, postand eight months follow-up) to evaluate the effectsof PCC, PCE and PCC+PCE (Chenoweth et al.,2011).
Study sites and participants
RESIDENTIAL CARE HOME ELIGIBILITY
C R I T E R I A
Government accreditation and building certi-fication; high-level care homes; accessible bysealed road, located within a 500 km radius ofSydney, Australia; with room for improvement inboth PCE and PCC according to the Person-Centred Environment and Care Assessment Tool(PCECAT), a validated 44-item rating instrumentwith three domains designed for evaluation ofresidential aged care (Burke et al., 2012). ThePCECAT 4-point scale was rescored 0 (the bestpossible rating) and 1, 2, 3 (the worst possibleratings, ranked). A total “room for improvementscore” (RFI) was calculated by summing acrossitems (20 items in Domain 2 (Care Services), and19 in Domain 3 (Environment). Homes that scored1–3 for both Care Services and Environment RFIwere considered eligible. Of 150 homes approached,89 homes were suitable for screening and 38 wereeligible (Figure 1).
RESIDENT ELIGIBILITY CRITERIA
Self-consent, proxy consent or GuardianshipTribunal consent; recorded dementia diagnosis;permanent stay; admission at least 3 months priorto baseline; assessed high care needs and presenceof agitation; ability to participate over the life ofthe study (e.g. no florid mental illness or end-stagedementia). The 38 eligible facilities contained 1,474residents, of whom 789 were eligible and 601 wereconsented.
Sample size and samplingSample size calculations were informed by ourprevious study (Chenoweth et al., 2009): within

Person-centred residential care and environment for people with dementia 1149
RACF assessed for eligibility (N= 89)
Excluded (n= 51)
Completed and analysed 7 RACF (n=64) 48 deceased 13 transferred 3 pallia�ve
7 RACF (n=95) 1 RACF withdrew 33 deceased
UC+UE 8 RACF (n=142)
10 RACF (n= 118) 32 deceased
PCC + PCE 10 RACF (n= 150)
Allocation
8 month Follow-Up Analysis
Post-Test
Randomized: Eligible RACF (N= 38)
Eligible residents (N= 787)
Recruited residents (N=601)
Enrollment
PCC 10 RACF (n=155)
PCE 10 RACF (n= 154)
9 RACF (n=98) 1 RACF withdrew 42 deceased
10 RACF (n=105) 49 deceased
Completed and analysed 10 RACF (n=79) 57 deceased 17 transferred 1 pallia�ve
Completed and analysed 9 RACF (n=64) 61 deceased 13 transferred 2 pallia�ve
Completed and analysed 10 RACF (n= 89) 49 deceased 11 transferred 1 pallia�ve
Figure 1. (Colour online) Consort flow diagram/study protocol.
resident intra-class correlation (ICC) of 0.6;within-site ICC of 0.07; and relative benefit ofPCC versus usual care of 8%. Assuming thesame magnitude of effect for PCE versus usualcare and fixing Type 1 error rate at 5%, wedetermined that 38 homes, with 10 residentsper home at follow-up (380 in total), would
have 80% power to detect a clinically importantdifference of 8%, and 12 residents per homewould have 90% power (Murray, 1998). Ourprevious study dropout rate was 25% frombaseline to follow-up (Chenoweth et al., 2009),so the recruitment target was 15 residents perhome.

1150 L. Chenoweth et al.
Participant RecruitmentResearch ethics approval was granted by theUniversity of Technology Sydney Human ResearchEthics committee approval number: UTS-HREC2006-269A in November 2007, and also by theparticipating residential care homes. Proxy consentwas obtained for all participating residents and bothwritten and verbal consent were obtained froma small number of residents who were able tounderstand and remember the study’s purpose andprocedures prior to administering the measures thatrequired their direct involvement.
Randomisation and maskingEligible homes were stratified by: Care Servicesand Environmental RFI scores (3–10; >10);dementia specific unit (yes, no); location (innermetropolitan, outer metropolitan, rural); size(number of dementia beds – 10–20 beds (small),>20 beds (large); type (profit, not for profit).Theywere then randomly allocated to one of the fourtreatment groups (usual care and environment,i.e. non-intervention, PCC, PCE, PCC+PCE).Stratification, randomisation and analysis wereconducted by the study statisticians, masked tohomes’ identities. Data collectors were masked tointervention allocation.
Trial registrationThe PerCEN study (ACTRN 12608000095369)was registered on 20th February 2008 after ethicalapprovals were obtained. Registered amendmentsto the trial protocol prior to data collection includedthe addition of two research instruments. The trialcommenced in January 2009 following research stafftraining.
MeasurementThe study protocol publication (Chenoweth et al.,2011) gives full details of the study methodology,including: the intention-to-treat analysis of theco-primary resident outcomes and the qualitycare interaction measure; the relevant constructs,measures, purpose in analysis, and measurementtime points (Table 1).
Study interventionsPCC alone was planned to be implemented in9 homes, PCE alone in 10 homes and PCC+PCEin 10 homes. Written and verbal agreements wereobtained from the facility executive and managersto enable implementation of the study interventionsfour months after baseline assessment.
PE R S O N-C E N T R E D C A R E (PCC)Two experts in PCC and one PCC trainerfrom Alzheimer’s Australia used experiential andadult learning approaches to train five staff fromeach of the 19 PCC homes (one care manager,one Registered Nurse, two Enrolled Nurses orAssistants in Nursing, 1 Diversion/RecreationTherapist). These staff received 32 hours off-sitetraining which focused on paying attention tothe residents’ feelings when agitated, interactingwith residents in a person-centred way and usingperson-centred care planning to meet the residents’psychosocial needs, followed by on-site supervisionin these processes (range 2–16 hours) and telephonesupport.
PE R S O N-C E N T R E D DE M E N T I A
ENVIRONMENT (PCE)Two experts in PCE principles (Davis et al.,2009) planned and supervised implementation ofrecommended PCE interventions with a maximumbudget of AUD$10,000 per home in the 10 PCEalone homes and in 6 of 10 PCE and PCC homes.Prior to implementing PCE the EnvironmentalAudit Tool (EAT) scores identified features ineach home that could be improved (Fleming,2011). These included improvements to the safety,accessibility and utility of outdoor spaces, provisionof a greater variety of social spaces and using colourand objects for way-finding and to improve feelingsof familiarity.
USUAL CARE AND USUAL ENVIRONMENT
In the remaining 9 non-intervention homes(UC+UE) any unplanned changes in care practicesand environment that were initiated by the homemanagers between baseline and follow-up wereregularly monitored.
Data collection proceduresData collection occurred from February 2009 toFebruary 2011 at three times: pre-intervention(Pre); post-intervention (Post); and eight monthsfollow-up (FU).
Prior to recruitment two trained observersscreened 89 eligible homes with the PCECAT(IRR = 0.96) to identify their room for improve-ment and 38 of these homes were recruited.The Project Manager visited the 38 participatinghomes and obtained written agreements from theirmanagers that no staff would rotate between co-located intervention and control homes, or anyother care unit within these homes. Agreements

Person-centred residential care and environment for people with dementia 1151
Table 1. PerCEN study measures
CONSTRUCT M EASURE PRE 1 POST 2 F U 3 PURPOSE............................................................................................................................................................................................................................................................................................................................
FACILITY LEVELEnvironmental quality Person-Centred Environment and Care
Assessment Tool (PCECAT) Domain3
X X X Screening for siteinclusion
Care quality Person-Centred Environment and CareAssessment Tool (PCECAT) Domain2
X X X Screening for siteinclusion
PCE interventioncompliance
“Dose” (0, 1) variable derived byinvestigator IF based on extent ofimplementation of planned PCE ateach time point
X X Site-leveldescriptor
PCC interventionapplication
“Dose” variable derived by investigatorsLC & GM based on field notes andstaff interviews
X X Site-leveldescriptor
Observer 4 research assistants were observer/datacollectors, randomly allocated to siteat each time-point
X X X Covariate
RESIDENT LEVELDemographics Age, gender, marital status (1 = spouse/
partner; 0 = otherwise)X Covariate
Country of birth, preferred language,English-language ability, frequency ofvisitors
X Considered ascovariates∗
Clinical and Medications Dementia diagnosis; alcohol, drug andcigarette use (past and present);psychiatric history
X Considered ascovariates∗
Comorbid conditions at baseline (coded0 = 0–3; 1 = 4 or more)
X X X Covariate(baseline only)
Length of stay in facility at baseline(months)
X Covariate
Prescribed medications, coded as 4variables: Antipsychotics (0,1);Anxiolytics (0,1); Antidepressants(0,1); Antidementia (0,1)
X X X Covariate(baseline only)
Disease severity Global Deterioration Scale of PrimaryDegenerative Dementia (GDS)Coded: 0 = 3–5; 1 = 6–7
X X X Covariate(baseline only)
Function Resident activities of daily living (ACFI) X X X Considered ascovariate∗
Quality of life DEMQoL self-report (residentinterview) and proxy interview
X X X Co-primaryoutcome
Behavioural andpsychological symptomsof dementia
Cohen-Mansfield Agitation Inventory(CMAI)(total score)
X X X Co-primaryoutcome
Emotional Responses in Care (ERIC)observations (% positive interactions)
X X X Co-primaryoutcome
Cornell Scale for Depression inDementia (CSDD)
X X X Post hoc outcome
Care practice quality Quality of Interactions Schedule (QUIS)(% positive interactions)
X X X Secondaryoutcome
Assessment timepoints: pre-intervention (1, Pre); post-intervention (Post, 2); 8 months follow-up (FU, 3).∗Considered as covariate, but not included in final models.
were obtained from all staff that they would notdiscuss any aspect of the study interventions withothers outside their own care unit and with theresearch staff. A third trained assessor blind to
treatment allocation evaluated the 38 recruitedhomes’ care environments using the EAT (Fleming,2011) and four additional trained observers maskedto intervention allocation obtained resident data

1152 L. Chenoweth et al.
(inter-rater reliability (IRR) = 0.86), randomised todifferent homes in all data collection rounds. Post-intervention data were collected six months afterplanned intervention commencement and follow-up data were collected 8 months following post-test.
Data analysisDifferences between the randomly allocatedintervention groups in resident and homecharacteristics at baseline were tested with χ2 testsfor categorical variables, and one-way ANOVA forcontinuous variables. Resident study completerswere compared with non-completers on keybaseline characteristics.
Outcome measures were scored according tostandard algorithms: DemQOL (Smith et al., 2005)proxy total score (possible score range 31–124),DemQOL self-report total score (possible scorerange 28–112), higher score is better for both;Cohen-Mansfield Agitation Inventory (CMAI)(Cohen-Mansfield, 1999), possible score range 29–203, higher score is worse; and Cornell Scale forDepression in Dementia (CSDD) (Alexopouloset al., 1988), possible score range 0–38, higher scoreis worse. Emotional Responses in Care (ERIC)(Fleming, 2005) was analysed as the percentageof positive emotional responses, and Quality ofInteractions (QUIS) (Dean et al., 1993) as thepercentage of positive care interactions.
General linear mixed models were estimatedusing the methods for nested cohort designsdescribed by Murray (1998). All three timepoints were included as outcomes to test forglobal group differences and for trends overtime. Characteristics of homes and residentsconsidered to be potential confounders wereassessed for inclusion as covariates, based on criteriarecommended by Murray (1998). The final modelswere adjusted for resident cognitive function Globaldeterioration rating scale for assessment of primarydegenerative dementia (GDS) (Reisberg et al.,1982), co-morbidities, length of stay, age, gender,marital status and use of antipsychotics, ben-zodiazepines, antidepressants and anti-dementiadrugs at baseline. Intention-to-treat analyses wereperformed as per protocol (Chenoweth et al., 2011).Modelling was implemented with SASv9.3 ProcMixed, using maximum likelihood estimation (SASInstitute, 2011).
A post hoc analysis examined the effect of eachhome’s compliance (dose scores) with PCE andPCC interventions on its residents’ mean agitation(CMAI) change scores. Individual resident changescores were regressed and the same covariatesincluded in the mixed models, analysing post andfollow-up time-points separately. Adjusted mean
change scores and 95% confidence intervals wereplotted by home and intervention compliance.
Results
601 residents were recruited from 38 randomisedresidential care homes. Home characteristicsused in stratification were reasonably balancedacross randomisation groups, except for thePCECAT care service quality scores, wherethe majority randomised to PCC alone hadless room for improvement. Resident drop-outassessed at post-test and follow-up are shownin Figure 1. The majority of residents withsevere cognitive decline were female and aged 85on average. Their pre-intervention characteristicsdiffered by randomisation group in some respects(Table 2); a higher proportion of residents inPCC alone and PCE alone homes receivedantipsychotic medications, and co-morbidities weremost prevalent in non-intervention homes and leastprevalent in PCE alone homes. Resident completersand non-completers had similar characteristics andpre-intervention CMAI scores (for n = 185 missingat post, p = 0.37; for n = 305 missing at follow-up,p = 0.97), DEMQOL proxy scores (post, p = 0.76;follow-up, p = 0.98), ERIC ratings (Fleming, 2005)(post, p = 0.37; follow-up, p = 0.45), and for allother outcomes. Table 3 shows the adjusted meanscores for the co-primary and secondary outcomevariables.
Quality of lifeA small number of residents were sufficientlycompetent to complete the self-report DEMQOL(Pre n = 120; Post n = 99; Follow-up n = 17)and 47 completed both Pre and Post. There wereno statistically significant group differences for thissubset (p = 0.92 for group, p = 0.63 for time,p = 0.23 for group-by-time interaction). DEMQOLproxy data indicated there were improvements inquality of life for residents in PCC homes (p =0.0003 for change over time), PCE homes (p =0.02 for change over time) and in PC+PCE homes(p = 0.08), however, the group-by-time interactionwas not significant (p = 0.23).
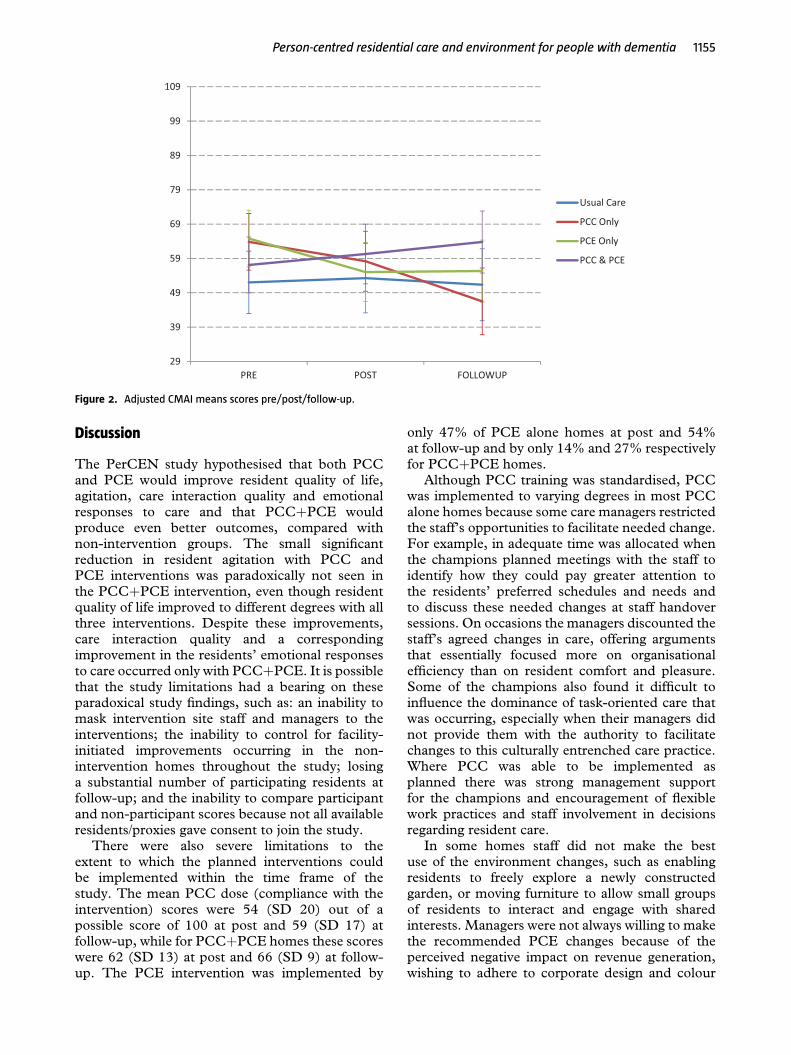
AgitationResidents in PCE homes and PCC homes hadsmall statistically significant decreases in agitation(CMAI, p = 0.5, p = 0.002 respectively), whilethose in PCC+PCE and in the non-interventionhomes had non- significant changes (see Table 3,significant group-by-time interaction, p = 0.01;

Person-centred residential care and environment for people with dementia 1153
Table 2. Characteristics of resident sample pre-intervention for n = 601
USUAL CARE PCC P CE PCC & PCE
n = 142 n = 155 n = 154 n = 150 pa
............................................................................................................................................................................................................................................................................................................................
Number of facilities 8 10 10 10Age - mean(SD) 86 (7) 84 (8) 84 (8) 84 (7) 0.05Gender male % 23 33 34 30 0.12Born elsewhere % 23 18 31 26 0.06Language not English % 11 7 14 9 0.37Marital/partner % 23 26 30 25 0.52Visit frequency weekly or more %d 80 76 77 81 0.73Length of stay (months) – mean(SD) 29 (27) 25 (25) 21 (22) 26 (25) 0.05GDS severe/very severe % 88 90 82 85 0.27Type of dementia Alzheimer’s % 30 36 33 35 0.74Comorbid conditions >3 % 68 51 35 55 <0.0001Psychiatric history %c 29 25 29 20 0.20Alcohol daily Prior %b 24 30 36 25 0.12Smoked prior %e 8 12 14 7 0.17Medicines %:
Antipsychotic 35 58 49 38 0.0002Anxiolytics 29 38 28 21 0.01Antidepressant 28 30 29 31 0.92Anti-dementia 16 14 9 13 0.32
aF for continuous variables and χ2 for categorical variables.bData missing for 20; c.Data missing for 13; d. Data missing for 8; e. Data missing for 15.Abbreviations: GDS = Global Deterioration Scale
Figure 2 for adjusted mean scores over time for eachgroup).
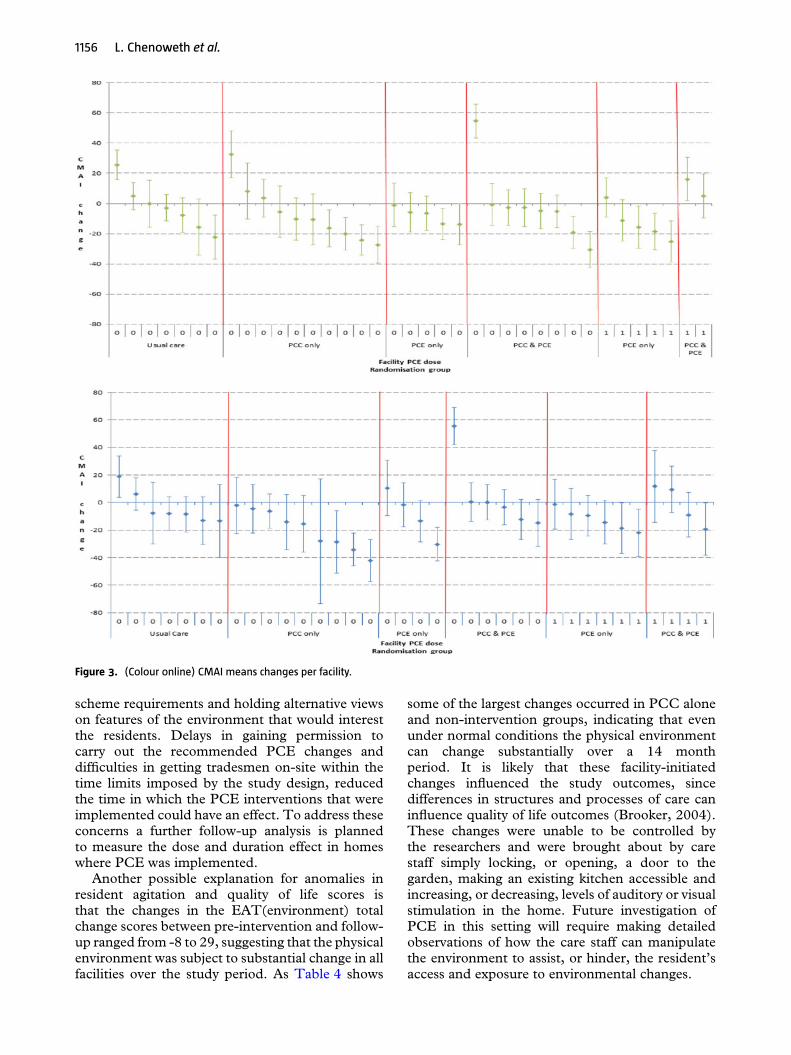
As homes varied in their implementation ofPCC and/or PCE, and CMAI scores improvedover time in PCC or PCE homes but not inPCC+PCE homes, we investigated the extentto which this might be related to compliancewith the interventions. Inspection of the plotsof mean CMAI change by home (Figure 3)revealed no clear evidence to link reducedagitation to variability in implementation of eitherplanned PCC or PCE. Homes with the highestPCC implementation scores did not show thegreatest reduction in agitation at Follow-Up andsome of the non-intervention homes showed asimilar level of improvement as some homeswith the highest PCC implementation (Figure 4).However, one home assigned to PCC+PCEshowed poor implementation of both interventionsand substantial worsening of agitation. Model re-estimation excluding this outlier did not changethe significance of any estimates, but did lowerthe mean agitation score in the PCC+PCE group,making it relatively stable over time rather thanworsening. A further post hoc analysis examinedthe difference between CMAI score changes inhomes with a substantial improvement in the EATtotal score (10 or more) and the other homes,while controlling for clustering and adjusting forcovariates. Both groups showed non-significantimprovements in agitation, although the change for
homes with improved EAT scores was larger thanfor other homes.
Emotional responsesThe percentage of positive emotional responses tocare (ERIC) improved significantly over time forthe PCC+PCE group (by 7% on average, p =0.01), but as the group-by-time interaction was notsignificant (p = 0.07), we cannot infer differencesamong groups for emotional responses. There wereno statistically significant differences in depression(CSDD) scores over time or between groups.
Quality of care interactionsCare interaction quality (QUIS) (Dean et al.,1993) improved in the PCC+PCE group post-intervention (p = 0.006, for change over time)(Table 3) but was not sustained at follow-up. QUISimprovements did not occur in the other groups(group-by-time interaction p = 0.007).
CostsThe total cost of delivering PCC to 19 homeswas $136,220 ($7,169 per home). This includedthe costs of trainers, replacement staff attendees,training materials, site visits and telephone support(see Table 4). Some recommended changes toPCE alone and PCE+PCC homes were notimplemented due to management safety concerns,council regulations and internal management

1154 L. Chenoweth et al.
Table 3. Pre-, Post-intervention and Follow-up adjusted mean scoresa (95% confidence intervals) for agitation,emotional responses to care, quality of life and quality of care interactions
PREINTERVENTION(n = 601)
POSTINTERVENTION(n = 416)
FOLLOW-UP(n = 296)
p WITHINGROUPCHANGEOVER TIME
p PAIRWISECONTRASTSWITH UC &UE
Pb GROUPCONTRASTS
............................................................................................................................................................................................................................................................................................................................
Agitation (CMAI): possible score range 29–203, higher score is worseUC+UE 52 (43–61) 53 (43–63) 51 (41–62) 0.93 Group = 0.43PCC only 64 (56–72) 58 (49–67) 46 (37–56) 0.002 0.06 Time = 0.13PCE only 65 (57–73) 55 (46–64) 55 (46–64) 0.05 0.04 GroupxTime = 0.01PCC+PCE 57 (49–65) 60 (52–69) 64 (55–73) 0.37 0.41PCE or PCC 61 (55–67) 57 (50–63) 59 (52–66) 0.52 Group = 0.15UE+UC or PCC 58 (52–65) 55 (48–62) 48 (40–56) 0.04 GroupxTime = 0.15
Time = 0.11PCC or PCE 60 (54–60) 58 (52–65) 55 (48–62) 0.41 Group = 0.37UC+UE or PCE 59 (52–65) 54 (46–61) 52 (45–59) 0.19 GroupxTime = 0.77Emotional responses in care (ERIC): % positiveUC+UE 25 (20–30) 18 (12–24) 25 (18–31) 0.15 Group = 0.15PCC only 16 (11–21) 22 (17–27) 24 (18–30) 0.06 0.01 Time = 0.05PCE only 23 (18–28) 25 (20–30) 26 (21–32) 0.63 0.0.63 GroupxTime = 0.07PCC+ PCE 20 (15–25) 29 (24–34) 27 (22–33) 0.01 0.17PCE or PCC 22 (18–25) 27 (23–31) 27 (23–31) 0.03 Group = 0.03UE+UC or PCC 20 (17–24) 20 (16–24) 24 (20–29) 0.23 GroupxTime = 0.22
Time = 0.04PCC or PCE 18 (15–21) 26 (22–29) 26 (21–30) 0.001 Group = 0.77UC+UE or PCE 24 (20–27) 22 (18–26) 26 (21–30) 0.30 GroupxTime = 0.01Quality of Life (DemQOL proxy): possible score range 31–124, higher score is betterUC+UE 101 (98–104) 100 (97–104) 103 (99–106) 0.48 Group = 0.69PCC only 99 (96–101) 103 (100–106) 106 (103–110) 0.0003 0.17 Time = <0.0001PCE only 101 (99–104) 102 (99–105) 106 (103–109) 0.02 0.96 GroupxTime = 0.23PCC+PCE 101 (99–104) 103 (100–106) 105 (102–108) 0.08 0.94PCE or PCC 101 (99–103) 103 (100–105) 106 (103–108) 0.004 Group = 0.32UE+UC or PCC 100 (98–102) 102 (100–104) 105 (102–107) 0.007 GroupxTime = 0.94
Time = <0.0001PCC or PCE 100 (98–102) 103 (101–106) 106 (103–108) 0.0002 Group = 0.54UC+UE or PCE 101 (99–103) 101 (99–103) 105 (102–107) 0.02 GroupxTime = 0.12Care interaction quality (Quality of Interactions Schedule) (QUIS): % positive)UC+UE 78 (73–83) 73 (68–79) 82 (76–88) 0.08 Group = 0.13PCC only 78 (74–83) 78 (73–83) 72 (66–78) 0.17 0.93 Time = 0.54PCE only 78 (74–83) 81 (76–85) 82 (76–87) 0.55 0.91 GroupxTime = 0.007PCC+PCE 76 (72–81) 86 (81–91) 80 (75–85) 0.006 0.64PCE or PCC 77 (74–80) 83 (80–87) 81 (77–85) 0.03 Group = 0.03UE+UC or PCC 78 (75–81) 76 (72–80) 77 (72–81) 0.57 GroupxTime = 0.03
Time = 0.58PCC or PCE 76 (72–80) 82 (78–86) 77 (74–80) 0.03 Group = 0.87UC+UE or PCE 81 (77–86) 77 (73–81) 78 (75–81) 0.18 GroupxTime = 0.01
Abbreviations: UC = usual care; UE = usual environment; PCC = person centred care; PCE = person centred environment; CMAI =Cohen-Mansfield agitation inventory; ERIC = Emotional Responses in Care; QUIS = Quality of interactions schedule.a. Predicted mean from a mixed model which accounted for clustering within facility and adjusted for covariates. Estimates for all groupsadjusted to the total sample mean levels for all covariates: Research Assistant; Global Deterioration Scale (severe/very severe); prescribedmedicines: antipsychotic, anxiolytics, antidepressant, anti-dementia; number of co-morbid conditions (4 or more); length of stay (months);age; gender; marital status (spouse/partner).b. Group, time and group by time effect in the mixed model for change over time, as well as separate time effects for each group.
disagreement. Both recommended and actual costsare reported here; the costs include environmentalassessment, making the changes and additionalfunds contributed by 8 of the PCE alone homesand 4 of the PCE+PCC homes. The planned totalcost of the recommended changes to PCE homes
was $139,644 ($13,964 per home). The total actualPCE costs equalled $91,982 ($9,198 per home).The recommended total cost of the interventionsin the PCE+PCC homes was $275,385 ($27,538per home) and the actual total cost was $228,570($22,857per home).
Person-centred residential care and environment for people with dementia 1155
29
39
49
59
69
79
89
99
109
FOLLOWUPPOSTPRE
Usual Care
PCC Only
PCE Only
PCC & PCE
Figure 2. Adjusted CMAI means scores pre/post/follow-up.
Discussion
The PerCEN study hypothesised that both PCCand PCE would improve resident quality of life,agitation, care interaction quality and emotionalresponses to care and that PCC+PCE wouldproduce even better outcomes, compared withnon-intervention groups. The small significantreduction in resident agitation with PCC andPCE interventions was paradoxically not seen inthe PCC+PCE intervention, even though residentquality of life improved to different degrees with allthree interventions. Despite these improvements,care interaction quality and a correspondingimprovement in the residents’ emotional responsesto care occurred only with PCC+PCE. It is possiblethat the study limitations had a bearing on theseparadoxical study findings, such as: an inability tomask intervention site staff and managers to theinterventions; the inability to control for facility-initiated improvements occurring in the non-intervention homes throughout the study; losinga substantial number of participating residents atfollow-up; and the inability to compare participantand non-participant scores because not all availableresidents/proxies gave consent to join the study.
There were also severe limitations to theextent to which the planned interventions couldbe implemented within the time frame of thestudy. The mean PCC dose (compliance with theintervention) scores were 54 (SD 20) out of apossible score of 100 at post and 59 (SD 17) atfollow-up, while for PCC+PCE homes these scoreswere 62 (SD 13) at post and 66 (SD 9) at follow-up. The PCE intervention was implemented by
only 47% of PCE alone homes at post and 54%at follow-up and by only 14% and 27% respectivelyfor PCC+PCE homes.
Although PCC training was standardised, PCCwas implemented to varying degrees in most PCCalone homes because some care managers restrictedthe staff’s opportunities to facilitate needed change.For example, in adequate time was allocated whenthe champions planned meetings with the staff toidentify how they could pay greater attention tothe residents’ preferred schedules and needs andto discuss these needed changes at staff handoversessions. On occasions the managers discounted thestaff’s agreed changes in care, offering argumentsthat essentially focused more on organisationalefficiency than on resident comfort and pleasure.Some of the champions also found it difficult toinfluence the dominance of task-oriented care thatwas occurring, especially when their managers didnot provide them with the authority to facilitatechanges to this culturally entrenched care practice.Where PCC was able to be implemented asplanned there was strong management supportfor the champions and encouragement of flexiblework practices and staff involvement in decisionsregarding resident care.
In some homes staff did not make the bestuse of the environment changes, such as enablingresidents to freely explore a newly constructedgarden, or moving furniture to allow small groupsof residents to interact and engage with sharedinterests. Managers were not always willing to makethe recommended PCE changes because of theperceived negative impact on revenue generation,wishing to adhere to corporate design and colour
1156 L. Chenoweth et al.
Figure 3. (Colour online) CMAI means changes per facility.
scheme requirements and holding alternative viewson features of the environment that would interestthe residents. Delays in gaining permission tocarry out the recommended PCE changes anddifficulties in getting tradesmen on-site within thetime limits imposed by the study design, reducedthe time in which the PCE interventions that wereimplemented could have an effect. To address theseconcerns a further follow-up analysis is plannedto measure the dose and duration effect in homeswhere PCE was implemented.
Another possible explanation for anomalies inresident agitation and quality of life scores isthat the changes in the EAT(environment) totalchange scores between pre-intervention and follow-up ranged from -8 to 29, suggesting that the physicalenvironment was subject to substantial change in allfacilities over the study period. As Table 4 shows
some of the largest changes occurred in PCC aloneand non-intervention groups, indicating that evenunder normal conditions the physical environmentcan change substantially over a 14 monthperiod. It is likely that these facility-initiatedchanges influenced the study outcomes, sincedifferences in structures and processes of care caninfluence quality of life outcomes (Brooker, 2004).These changes were unable to be controlled bythe researchers and were brought about by carestaff simply locking, or opening, a door to thegarden, making an existing kitchen accessible andincreasing, or decreasing, levels of auditory or visualstimulation in the home. Future investigation ofPCE in this setting will require making detailedobservations of how the care staff can manipulatethe environment to assist, or hinder, the resident’saccess and exposure to environmental changes.

Person-centred residential care and environment for people with dementia 1157
Figure 4. (Colour online) Adjusted mean change in CMAI and 95% confidence limits for each facility at Post (top panel) and Follow-up
(bottom panel) by PCC implementation (O = not implemented; > O implementation “dose” score) and randomisation group.
Table 4. Person centred care intervention costs
UNIT COST∗ UNITS USED T OTAL $AU............................................................................................................................................................................................................................................................................................................................
Training courseTrainer time Two trainers at HEW 6 and
Academic Grade E†Four courses x two trainers x 32 hours $4,805
Attendee time Range from $751-$1,871 per week ‡ Nineteen centres x five staff membersx 32 hours (assuming per weeksalaries based on 35 hours)
$124,578
Training materials $10 per attendee 82 training packs $820Ongoing supportSite visits Trainer at HEW 6 96 hours across 19 sites $4,311Telephone support Trainer at HEW 6 38 hours across 19 sites $1,706Total $136,220Average cost per site $7,169
∗All salary costs are assumed to include 28% for on-costs.†http://www.hru.uts.edu.au/conditions/pay/rates.html.‡http://www.health.nsw.gov.au/resources/jobs/conditions/awards/pdf/nurses.pdf.

1158 L. Chenoweth et al.
The lack of a strong association between PCEand quality of life (Smith et al., 2005) may havebeen due to reported difficulties in measurementof quality of life, especially by self-report (Ott andFogel, 1992; Beer et al., 2010). Other studies haveidentified that quality of life measurement andthe concepts that identify well-being in dementia(Kitwood and Bredin, 1992) are not clearlyarticulated or easily measured by proxies or bythe person themselves. Proxy ratings generallyunderestimate quality of life compared with self-rating (Hounsome et al., 2011). Measurement ofdepression in dementia was similarly difficult torate for residents and their proxies, who tendedto under-estimate the presence and degree ofdepression. This might explain why there were non-detectable changes in proxy-rated depression scoresfor the study sample as a whole.
Even though the homes randomised to PCEhad some room for improvement in relation tothe care environment and care services, baselineagitation (CMAI) (Cohen-Mansfield, 1999) scoreswere high in both the PCE and the PCCgroups, compared with the PCC+PCE group andthe non-intervention group. Contrary to studiesshowing reductions in agitation being associatedwith environmental improvements (Davis et al.,2009; Fleming and Purandare, 2010), the 27% ofresidents exposed to environmental improvementsin PCC+PCE homes had no significant improve-ments in their mean level of agitation. Nevertheless,there were significant reductions in agitation forresidents in some PCE only homes where 54% wereexposed to intervention. Differences in findingscannot be explained by difficulties in measuringagitation, as the CMAI (Cohen-Mansfield, 1999)has proven to be sensitive to change in many studies,including in our previous study (Chenoweth et al.,2009). An explanation for the anomaly in thesefindings could be the relationship between CMAIscores and the changes in the EAT (Fleming,2011) scores that occurred irrespective of the PCEintervention.
Despite these inconsistent findings and the studylimitations, the study had manystrengths. Thisis the first study to rigorously test the effect ofenvironmental alterations that were designed to therequirements of aged care homes and residentswith moderate to severe dementia. The follow-upperiod was long, the numbers of participants weresufficient to undertake longitudinal data analyses,data sets were detailed and complete, and outcomesincluded self-reported depression and quality oflife data. These data will add to the small butgrowing international repository of self-reports ofdepression and quality of life for people withadvanced dementia.
Conclusion
The PerCEN study showed reduced agitation inpeople with advanced dementia living in agedcare homes which instituted PCC and PCE,even though this improvement was not significantfor all residents exposed to PCE. There weresignificant and non-significant improvements inresident quality of life with PCC and PCErespectively. While the PCC+PCE interventionproduced significant improvements the quality ofcare interactions and resident care responses, therewere no corresponding significant improvementsin resident agitation and quality of life. Noneof the interventions improved resident depressionscores. These mixed findings suggest that thereis a need for future research to examine differentmethods for: assessing clinically-relevant qualityof life, well-being and depression in people withadvanced dementia living in aged care facilities;controlling facility-initiated changes during studytrials; implementing PCE in aged care homes;instructing care staff how to help people withdementia engage with PCE; and evaluating PCEbenefits for aged care residents and staff. Futureefforts to investigate the therapeutic effects of PCEand PCC+PCE in aged care homes should takeinto consideration the time and financial resourcesrequired to plan, implement and evaluate suchchanges.
Conflict of interest
None.
Description of authors’ roles
LC: Conceptualised the study design andmethodology with IF and RF; prepared andsubmitted the study grant application; obtainedfunding and research ethics approval for the study;provided oversight of the study; took responsibilityfor budget management and report submissions;provided leadership with JS-P for the PCC method;assisted J S-P and H-H J with designing theparticipant interview tools and PCC dose andduration scores; assisted with analysing the PCCdose and duration scores; and analysed the staffand other qualitative data; wrote the first draftand reviewed all subsequent drafts of the paper; andedited and submitted the final paper. IF:Conceptualised the study design and methodologywith RF and LC; contributed to the study grantapplication; provided leadership with RF for thePCE method; provided oversight for the PCE

Person-centred residential care and environment for people with dementia 1159
changes; assisted RF with designing the PCEdose and duration scores; analysed the PCE doseand duration data; and reviewed all drafts of thepaper. RF: Conceptualised the study design andmethodology with LC and IF; contributed to thestudy grant application; provided leadership withIF for the PCE method; assisted IF with designingthe PCE dose and duration scores; analysed thePCE dose and duration data; gave supervision in theEAT assessments and data analyses; and reviewedall drafts of the paper. MK: Gave expert advice onthe study design, measures, and statistical methods;contributed to the study grant application; providedexpert advice in data analyses and interpretationof the study results; and reviewed all drafts ofthe paper. JS-P: Provided leadership with LCfor the PCC method; assisted with designing theparticipant interview tools and the PCC doseand duration scores; assisted with analysing thePCC dose and duration scores and the qualitativedata; and reviewed all drafts of the paper. GL:Gave expert advice on the study design, measures,and statistical methods; undertook the first-levelstatistical tests on the data and assisted withinterpretation of the study results; and reviewedall drafts of the paper. PK: Provided expert adviceand conducted a range of the statistical tests withthe data; assisted with interpretation of the studyresults; and reviewed all drafts of the paper. Y-HJ: Assisted with designing the participant interviewtools and the PCC dose and duration scores;assisted with analysing the PCC dose and durationscores; provided leadership for and assisted withthe qualitative data analyses; and reviewed alldrafts of the paper. MH: Gave expert advice onthe study design and data required for the costanalysis; undertook the costs analysis; and reviewedall subsequent drafts of the paper. HB: Gave expertadvice on the study design, measures, and statisticalmethods; gave expert advice in data analyses andinterpretation of the study results; and reviewed alldrafts of the paper.
Acknowledgments
The authors acknowledge and appreciate theexpert advice of the Associate Investigatorsand their contribution to the study: ProfessorVictoria Traynor, University of Wollongong,Australia; Dr. Laurel Hixon, University of Oxford,United Kingdom; and Professor Shankar Sankarin,University of Technology, Sydney, Australia.
The willing participation of the 38 residentialaged care facilities executive, managers and staffis greatly appreciated, as is the generosity of theresidents and their associated families.
References
Alexopoulos, G., Abrams, R., Young, R. and Shamian,C. (1998). Cornell scale for depression in dementia.Biological Psychology, 23, 271–284.
Australian Institute of Health and Welfare. (2012)Dementia in Australia. Cat. No. AGE 70. 2012, Canberra:AIHW.
Beer, C. et al. (2010). Factors associated with self andinformant ratings of the quality of life of people withdementia living in care facilities: a cross sectional study.Plos One, 5, e15621–e15621.
Bicket, M. et al. (2010). The physical environment influencesneuropsychiatric symptoms and other outcomes in assistedliving residents. International Journal of Geriatric Psychiatry,25, 1044–1054.
Briller, S., Proffitt, M., Perez, K., Calkins, M. andMarsden, J. (2001). Maximizing cognitive and functionalabilities. In R. Nay and S. Garratt (eds.), Creating SuccessfulDementia Care Settings, Vol. 2. Sydney: Health ProfessionsPress.
Brooker, D. (2004). What is person-centred care indementia? Reviews in Clinical Gerontology, 13, 215–222.
Brooker, D., Woolley, R. and Lee, D. (2007). Enrichingopportunities for people living with dementia in nursinghomes: an evaluation of a multi-level activity-based modelof care. Aging and Mental Health, 11, 361–370.
Brooker, D., Argyle, E., Scally, A. J. and Clancy, D.(2011). The Enriched Opportunities Programme for peoplewith dementia: a cluster-randomised controlled trial in 10extra care housing schemes. Aging and Mental Health.Published on-line. doi:10.1080/13607863.2011.583628http://dx.doi.org/10.1080/13607863.2011.583628
Burke, C., Chenoweth, L. and Stein-Parbury, J.(2012).Person-Centred Environment and Care Tool(PCECAT). PhD thesis. Australia: University ofTechnology Sydney.
Chenoweth, L. et al. (2009). Caring for Aged Dementia CareResidents study (CADRES): a cluster-randomised trial ofPerson-Centred Care in dementia. Lancet Neurology, 8,317–325.
Chenoweth, L. et al. (2011) Person-Centred Dementia Careand Environment (PerCEN): Study protocol of a clusterrandomised controlled group trial of client and careoutcomes in the residential dementia care setting(ANZCTR 12608000095369). Worldviews onEvidence-Based Nursing, 8, 153–165.
Cohen-Mansfield, J. (1999). Measurement of inappropriatebehaviour associated with dementia. Journal of GerontologicNursing, 25, 42–51.
Cohen-Mansfield, J., Libin, A. and Marx, M. (2007).Non-pharmacological treatment of agitation: a controlledtrial of systematic individualised intervention. The Journalsof Gerontology, Series A: Biological Sciences and MedicalSciences, 62, 908–916.
Davis, S., Byers, S., Nay, R. and Koch, S. (2009).Guiding design of dementia friendly environments inresidential care settings. Dementia, 8, 185. Publishedon-line doi:10.1177/1471301209103250.
Day, K., Carreon, D. and Stump, C. (2000). Thetherapeutic design of environments for people withdementia: a review of the empirical research. TheGerontologist, 40, 397–416.

1160 L. Chenoweth et al.
Dean, R., Proudfoot, R., and Lindesay, J. (1993). Qualityof Interactions Schedule (QUIS). International Journal ofGeriatric Psychiatry, 8, 819–826.
Desborough, J. et al. (2011). Multi-professional clinicalmedication reviews in care homes for the elderly: studyprotocol for a randomised controlled trial with costeffectiveness analysis. Trials, 12, 218. doi:10.1186/1745-6215-12-218.
Edvardsson, D., Winblad, B. and Sandman, P. (2008).Person-centred care of people with severe Alzheimer’sdisease: current status and ways forward. The LancetNeurology, 7, 362–367.
Fleming, R. (2005). Emotional Responses in Care Assessment(ERiC). Sydney, Australia: The Hammond Care Group.
Fleming, R. (2011). An environmental audit tool suitable foruse in homelike facilities for people with dementia.Australasian Journal on Ageing 30, 108–112.
Fleming, R. and Purandare, N. (2010). Long-term care forpeople with dementia: environmental design guidelines.International Psychogeriatrics, 22, 1084–1096.
Hounsome, N., Orrell, M. and Edwards, R.T. (2011).EQ-5D as a quality of life measure in people with dementiaand their carers. Evidence and key issues. Values in Health,14, 390–399.
Jeon, Y-H., Luscombe, G., Chenoweth, L.,Stein-Parbury, J., Brodaty, H. and Haas, M. (2012).Staff Outcomes from the Caring for Aged Dementia CareREsident Study (CADRES): a cluster randomised trial.
International Journal of Nursing Studies, 49, 508–518.http://dx.doi.org/10.1016/j.ijnurstu.2011.10.020
Kitwood, T. and Bredin, K. (1992). Towards a theory ofdementia care: personhood and well-being. Ageing andSociety, 12, 269–287.
Murray, D.M. (1998). Design and Analysis ofGroup-Randomised Trials. Oxford: Oxford University Press.
Ott, B. and Fogel, B. (1992). Measurement of depression indementia: self vs clinician rating. International Journal ofGeriatric Psychiatry, 7, 899–904.
Reisberg, B., Ferris, S.H., de Leon, M.J. and Crook, T.(1982). The global deterioration scale for assessment ofprimary degenerative dementia. American Journal ofPsychiatry, 139, 1136–1139.
SAS Institute Inc. (2011). SAS/STAT R© 9.3 User’s Guide.Cary, NC: SAS Institute Inc.
Smith, S. C. et al. (2005). Measurement of health-relatedquality of life for people with dementia: development of anew instrument (DEMQOL) and an evaluation of currentmethodology. Health Technology Assessment, 9, 10,1–93.
Stein-Parbury, J., Chenoweth, L., Jeon, Y-H., Brodaty,H., Haas, M. and Norman, R. (2012). ImplementingPerson-Centred Care in residential dementia care. ClinicalGerontologist, 35, 404–424.
Surr, C. (2006). Preservation of self in people withdementia living in residential care: a socio-biographicalapproach. Social Science and Medicine, 62, 1720–1730.
Related Documents