PERCEIVED BARRIERS TO LIFESTYLE MODIFICATION, MOTIVATION, KNOWLEDGE AND SERVICE NEEDS OF DIABETIC ADULTS AND THEIR HEALTH CARE PROVIDERS IN CHENNAI, TAMIL NADU, INDIA BY SHARONA STALIN B.Sc Diet, PGDip Diet (UNP) Dissertation submitted in fulfilment of the academic requirements for the degree of MASTER OF SCIENCE IN DIETETICS Dietetics and Human Nutrition School of Agricultural, Earth and Environmental Sciences College of Agriculture, Engineering and Science University of KwaZulu-Natal Pietermaritzburg SOUTH AFRICA NOVEMBER 2017

Welcome message from author
This document is posted to help you gain knowledge. Please leave a comment to let me know what you think about it! Share it to your friends and learn new things together.
Transcript
PERCEIVED BARRIERS TO LIFESTYLE MODIFICATION, MOTIVATION,
KNOWLEDGE AND SERVICE NEEDS OF DIABETIC ADULTS AND THEIR
HEALTH CARE PROVIDERS IN CHENNAI, TAMIL NADU, INDIA
BY
SHARONA STALIN
B.Sc Diet, PGDip Diet (UNP)
Dissertation submitted in fulfilment of the academic requirements for the degree of
MASTER OF SCIENCE IN DIETETICS
Dietetics and Human Nutrition
School of Agricultural, Earth and Environmental Sciences
College of Agriculture, Engineering and Science
University of KwaZulu-Natal
Pietermaritzburg
SOUTH AFRICA
NOVEMBER 2017
ii
ABSTRACT
Introduction: Over 415 million people worldwide live with diabetes mellitus, of which 50%
live in five countries: China, India, the United States of America, Brazil and Indonesia. The
number of people with diabetes is predicted to rise to 552 million by 2030 and may affect up
to 79.4 million individuals in India. Diabetes mellitus is a chronic, non-communicable disease
resulting in increased blood glucose levels. Poor control of diabetes leads to the development
of complications that affect quality of life and health, and may even lead to death. Diabetics
face many barriers such as time constraints, lack of knowledge, fear or depression, lack of self-
motivation and lack of support from family and medical personnel. Barriers faced by health
care providers (HCPs) are inadequate knowledge on treatment and management of diabetes,
focusing on acute management rather than the preventive care, delay in clinical response to
poor control and competing care demands. Given the fact that a large percentage of the world’s
diabetics live in India, more research is needed to investigate the barriers that diabetics and
their HCPs face in this unique region.
Aim: This study aimed to evaluate the barriers to lifestyle modification, motivation, knowledge
and service needs of diabetic adults and their HCPs in Chennai, Tamil Nadu, India.
Location: The study was conducted in Apollo Specialty Hospital, Vanagaram, Chennai, India.
Objectives:
(i) To identify the barriers to lifestyle modification as perceived by South Indian Type 2
diabetic adults.
(ii) To identify the barriers to motivation, knowledge and service needs as perceived by South
Indian Type 2 diabetic adults.
(iii) To identify the challenges as perceived by HCPs in providing education, motivation and
services to their diabetic patients.
Method: A sample of 50 male and female adults with type 2 diabetes from a private specialty
hospital in Chennai were randomly selected to participate in this study. Participants had to be
iii
type 2 diabetic, aged between 18 to 70 years; diagnosed for more than one year; with not more
than two other co-morbidities, excluding pre-renal or renal failure; latest glycosylated
haemoglobin (HbA1c) available and previously been seen by a dietician. For HCPs (n=25)
comprising of nurses, doctors and dieticians, the inclusion criteria were that they had to have
been practicing for more than a year. Separate questionnaires were developed for the diabetic
patients and for the HCPs. The patient questionnaires were conducted in an interview format
and in the language (English or Tamil), preferred by the patients. The HCPs completed the
questionnaires on their own.
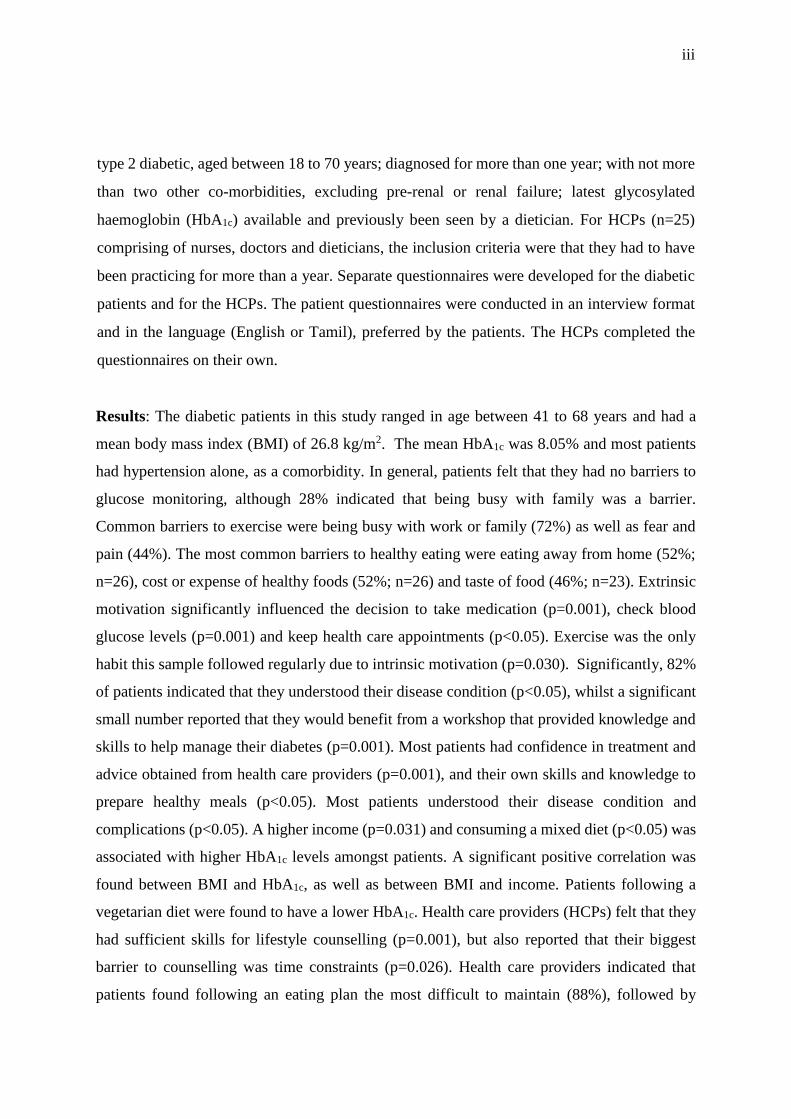
Results: The diabetic patients in this study ranged in age between 41 to 68 years and had a
mean body mass index (BMI) of 26.8 kg/m2. The mean HbA1c was 8.05% and most patients
had hypertension alone, as a comorbidity. In general, patients felt that they had no barriers to
glucose monitoring, although 28% indicated that being busy with family was a barrier.
Common barriers to exercise were being busy with work or family (72%) as well as fear and
pain (44%). The most common barriers to healthy eating were eating away from home (52%;
n=26), cost or expense of healthy foods (52%; n=26) and taste of food (46%; n=23). Extrinsic
motivation significantly influenced the decision to take medication (p=0.001), check blood
glucose levels (p=0.001) and keep health care appointments (p<0.05). Exercise was the only
habit this sample followed regularly due to intrinsic motivation (p=0.030). Significantly, 82%
of patients indicated that they understood their disease condition (p<0.05), whilst a significant
small number reported that they would benefit from a workshop that provided knowledge and
skills to help manage their diabetes (p=0.001). Most patients had confidence in treatment and
advice obtained from health care providers (p=0.001), and their own skills and knowledge to
prepare healthy meals (p<0.05). Most patients understood their disease condition and
complications (p<0.05). A higher income (p=0.031) and consuming a mixed diet (p<0.05) was
associated with higher HbA1c levels amongst patients. A significant positive correlation was
found between BMI and HbA1c, as well as between BMI and income. Patients following a
vegetarian diet were found to have a lower HbA1c. Health care providers (HCPs) felt that they
had sufficient skills for lifestyle counselling (p=0.001), but also reported that their biggest
barrier to counselling was time constraints (p=0.026). Health care providers indicated that
patients found following an eating plan the most difficult to maintain (88%), followed by
iv
exercise (48%). Health care providers all agreed that patients should be assigned responsibility
for self-care (p<0.05), even though healthcare providers indicated that important barriers to
lifestyle changes were unwillingness to change (p<0.05), insufficient knowledge on
complications (p=0.008) and lack of support from co-workers or bosses (p=0.005). There was
a significant positive correlation between the experience level of the healthcare providers and
the frequency with which they motivated and supported lifestyle changes (rho = 0.547, p
=0.005) and how confident they were that they had the knowledge or skills needed to teach
their patients (rho =0.406, p=0.004). The experience level of the HCPs and the frequency with
which they referred patients to other team members (rho = 0.767, p <0.05) and how confident
they were that they had the skills for lifestyle counselling (rho = 0.577, p =0.003), were also
significantly positively correlated.
Conclusion: For patients, being busy with family, work or other tasks was a common barrier
to glucose monitoring and exercise, while a diet plan was not commonly used to control blood
glucose levels. Overall, patients were satisfied with the services provided by their HCPs and
were keen to participate in online medical support from health care providers. According to
HCPs, patients found following an eating plan and exercise the most difficult to adhere to, while
glucose monitoring and taking medication were the least difficult to adhere to. All healthcare
providers agreed that patients should be assigned responsibility of self-care. According to
HCPs, unwillingness to change, insufficient knowledge on complications and lack of support
from co-workers or bosses, were the most important barriers to lifestyle counselling. Time
constraints also prevented HCPs from counselling their patients adequately. In general, the
more experienced HCPs were more likely to motivate and support lifestyle changes, more
confident in their knowledge or skills and more likely to refer patients to other health care team
members. It is evident that this sample need to place greater emphasis on dietary management
of diabetes. They could benefit from regular information updates on how to effectively manage
their diabetes.
v
PREFACE
The dissertation was written between June 2015 and November 2017 using data collected from
Chennai, India, under the supervision of Dr Kirthee Pillay.
Signed: _______________________ Date: 29/11/2017
Sharona Stalin (Candidate)
As supervisor of the candidate, I agree to the submission of this dissertation.
Signed: ______________________ Date: __________________
Dr Kirthee Pillay (Supervisor)

vi
DECLARATION
I, Sharona Stalin, declare that:
1. The entirety of the work contained in this dissertation is my original work, except where
otherwise stated.
2. This dissertation, or any part of it, has not been submitted for any degree or examination
at any other university.
3. Where other sources have been used they have not been copied and have been properly
acknowledged.
4. This dissertation does not contain text, graphics or tables copied and pasted from the
internet, unless specifically acknowledged, and the source being detailed in the
dissertation and in the relevant reference section.
Signed: __________________________ Date: 29/11/2017
Sharona Stalin (Candidate)
vii
ACKNOWLEDGEMENTS
I would like to express my deepest gratitude to the following individuals and organisations that
have supported me and made a contribution to the completion of this study:
Dr Kirthee Pillay, for her outstanding support and guidance throughout this research
project, which has played a major role in the completion of this study. Thank you for
your superb supervision, prudent advice and patience.
Dr C Paul Dilip Kumar, for approval to conduct the study at Apollo Speciality Hospital.
Dr Anita Rogers for her kind assistance and patience with the site and ethics approval.
Apollo Specialty Hospital staff, for your patience, assistance and understanding whilst
the study was being conducted.
Dr Jayshree Krishnan, Dr Akila Mani and Dr TK Shanmugaraj for their excellent
advice, support and time during this research project.
Dr Hilda and team from the ethics committee at Apollo Hospitals for your time and
practical advice.
Ramesh Kalundaivelu for his competent and speedy translation of the questionnaire.
Gill Hendry for her prompt and efficient statistical work.
My husband and daughter for their phenomenal support, encouragement and
understanding through this process.
Finally, my parents for their constant inspiration and faith in me.

viii
TABLE OF CONTENTS
CONTENTS PAGE
ABSTRACT ii
PREFACE v
DECLARATION vi
ACKNOWLEDGEMENTS vii
TABLE OF CONTENTS viii
LIST OF TABLES xii
LIST OF FIGURES xiii
LIST OF APPENDICES xiv
LIST OF ABBREVIATIONS xv
CHAPTER 1: INTRODUCTION, THE PROBLEM AND ITS SETTING 1-11
1.1 Importance of the study 1
1.2 Aim of the study 9
1.3 Research objectives 9
1.4 Hypotheses 9
1.5 Study parameters 10
1.6 Study assumptions 10
1.7 Definition of terms 10
1.8 Summary 11
CHAPTER 2: LITERATURE REVIEW 13-63
2.1 Definition and types of diabetes mellitus 13
2.2 Diagnosis of diabetes mellitus 14
2.3 Risk factors for diabetes mellitus 15
2.3.1 Genetic predisposition 15
2.3.2 Lifestyle 17
2.4 Complications and co-morbidities of diabetic mellitus 19
2.4.1 Complications of diabetes mellitus 19
2.4.2 Co-morbidities 24
ix
2.5 Management of diabetes mellitus 26
2.5.1 Medical therapy 26
2.5.2 Physical activity 29
2.5.3 Medical nutrition therapy 31
2.5.4 Psychological and social therapy 36
2.5.5 Self-management 37
2.6 Barriers to lifestyle changes 38
2.6.1 Time constraints 38
2.6.2 Lack of counselling or information 39
2.6.3 Lack of support from family, work and health care workers 40
2.6.4 Lack of motivation 41
2.6.5 Emotional wellbeing 43
2.7 Challenges faced by the diabetic living in India 44
2.7.1 Urbanisation 44
2.7.2 Food habits (traditional vs. western) 45
2.7.3 Physical activity 48
2.7.4 Social and socio-economic factors 49
2.7.5 Cultural factors and literacy levels 50
2.7.6 Religion 51
2.7.7 Indian women and diabetes 52
2.8 Change from disease treatment to patient treatment 53
2.8.1 Challenges of shifting to holistic care 54
2.8.2 Shift to personal care of patients 56
2.8.3 Frequency of follow up 57
2.8.4 Use of social media 60
2.9 Conclusion 62
CHAPTER 3: METHODOLOGY 64-71
3.1 Background information on the study site 64
3.2 Study design 67
3.3 Study population and sample selection 68
x
3.3.1 Study population 68
3.3.2 Sample selection 68
3.4 Study materials and methods 68
3.4.1 Questionnaires 68
3.5 Data collection 69
3.6 Pilot study 70
3.7 Reduction of bias 70
3.8 Data quality control 71
3.9 Statistical analysis 71
3.10 Ethical considerations 71
CHAPTER 4: RESULTS 72-103
4.1 Results of patient-orientated questionnaire 72
4.1.1 Demographic characteristics 72
4.1.2 Socio-economic characteristics 73
4.1.3 Household characteristics 74
4.1.4 Anthropometric characteristics 74
4.1.5 Diabetes duration and co-morbidities 75
4.1.6 Glycosylated haemoglobin values 76
4.1.7 Diet followed and meal preparation 78
4.1.8 Blood glucose monitoring 79
4.1.9 Physical activity 82
4.1.10 Eating habits and nutritional medical care 84
4.1.11 Medication and medical care 89
4.1.12 Motivation of patients 91
4.1.13 Service needs of patients 93
4.1.14 Knowledge and understanding of diabetes 94
4.1.15 Other significant findings 94
4.2 Health care provider-orientated questionnaire 95
4.2.1 Demographic characteristics 95
4.2.2 Medical care provided by health care providers 96
xi
4.2.3 Motivation and barriers to counselling 98
4.2.4 Other significant findings 101
4.3 Summary of findings 101
CHAPTER 5: DISCUSSION 103-114
5.1 Patient-orientated questionnaire 103
5.1.1 Demographic characteristics 103
5.1.2 Socio-economic characteristics 103
5.1.3 Household characteristics 104
5.1.4 Anthropometric characteristics 105
5.1.5 Diabetes duration and co-morbidities 105
5.1.6 Glycosylated haemoglobin values 105
5.1.7 Diet followed and meal preparation 106
5.1.8 Blood glucose monitoring 106
5.1.9 Physical activity 107
5.1.10 Eating habits and nutritional medical care 108
5.1.11 Medication and medical care 109
5.1.12 Motivation of patients 110
5.1.13 Service needs of patients 110
5.1.14 Knowledge and understanding of diabetes 111
5.2 Health care provider-orientated questionnaire 111
5.2.1 Demographic characteristics 111
5.2.2 Medical care provided by health care providers 111
5.2.3 Motivation and barriers to counselling 112
CHAPTER 6: CONCLUSION AND RECOMMENDATIONS 115-117
6.1 Conclusion 115
6.2 Study limitations 116
6.3 Recommendations 116
REFERENCES
APPENDICES
118-147
148-169
xii
LIST OF TABLES
Table 2.1 WHO recommendations for diagnostic criteria for diabetes mellitus and
intermediate hyperglycaemia
14
Table 2.2 Recommended targets for effective diabetic control in adults 27
Table 2.3 American Diabetes Association Position Statement on the nutrition therapy
guidelines (given as daily) for adults with diabetes
33
Table 2.4 Dietary guidelines for diabetes from the Indian Council of Medical
Research
34
Table 2.5 Diabetic dietary guidelines from the National Dietary Guidelines
Consensus Group in India
35
Table 2.6 Secular trends of nutrient consumption in India 47
Table 2.7 Services for diabetes management 58
Table 2.8 The frequency of monitoring for selected parameters in patients with
diabetes
59
Table 4.1 Demographic characteristics of patients 72
Table 4.2 Household characteristics 74
Table 4.3 Body mass index of patients 74
Table 4.4 Duration of diabetes amongst patients 75
Table 4.5 Co-morbidities of patients 76
Table 4.6 Glycosylated haemoglobin (HbA1c) values of patients 77
Table 4.7 Possible barriers to blood glucose monitoring by patients 81
Table 4.8 Duration of physical activity reported by patients per week 82
Table 4.9 Possible barriers to physical activity 83
Table 4.10 Dietary methods used to control blood glucose 84
Table 4.11 Possible barriers to following healthy eating and nutritional medical care 88
Table 4.12 Possible barriers to medication and medical care 90
Table 4.13 Motivation of patients 91
Table 4.14 Demographic characteristics of health care providers 95
Table 4.15 Medical care provided by health care providers 97
Table 4.16 Barriers to motivation and lifestyle counselling according to health care
providers
100
xiii
LIST OF FIGURES
Figure 2.1 Shift in the model of management of diabetes 38
Figure 3.1 Apollo Speciality Hospital, Vanagaram, Chennai, India 64
Figure 3.2 Location of Apollo Speciality Hospital, Vanagaram, Chennai, Tamil
Nadu
65
Figure 3.3 Map showing Tamil Nadu, India 67
Figure 4.1 Occupation of patients 73
Figure 4.2 Monthly income earned by patients 73
Figure 4.3 Body mass index ranges of patients 75
Figure 4.4 Glycosylated haemoglobin (HbA1c) values of patients 77
Figure 4.5 Types of diets consumed by patients 78
Figure 4.6 Person that prepares meals 78
Figure 4.7 Patients who had a working glucometer 79
Figure 4.8 Frequency with which patients with and without glucometers tested their
blood glucose levels
79
Figure 4.9 Medical facilities where patients without glucometers tested their blood
glucose levels
80
Figure 4.10 Patients able to purchase fruits and vegetables regularly 85
Figure 4.11 Patients that ate fruits and vegetables daily 85
Figure 4.12 Percentage of patients educated on a healthy diet 86
Figure 4.13 Patients that followed a diet plan to control their blood glucose levels 86
Figure 4.14 Type of meal plan followed 87
Figure 4.15 Types of motivation that influenced diabetic patients 91
Figure 4.16 Possible barriers to motivation 92
Figure 4.17 Service needs of patients 93
Figure 4.18 Knowledge and understanding of diabetes 94
Figure 4.19 Occupation of health care providers 96
Figure 4.20 Areas of lifestyle change that patients found difficult to adhere to 98
Figure 4.21 Groups of people patients complained that they had a lack of support from 99
xiv
LIST OF APPENDICES
APPENDIX A PATIENT-ORIENTATED DIABETES QUESTIONNAIRE IN ENGLISH 148
APPENDIX B PATIENT-ORIENTATED DIABETES QUESTIONNAIRE IN TAMIL 153
APPENDIX C HEALTH CARE PROVIDERS-ORIENTATED DIABETES
QUESTIONNAIRE
161
APPENDIX D INFORMED CONSENT DOCUMENT 163
APPENDIX E ETHICS APPROVAL FROM THE UNIVERSITY OF KWAZULU-
NATAL
167
APPENDIX F ETHICS APPROVAL FROM APOLLO HOSPITAL ETHICS
COMMITTEE
168
xv
LIST OF ABBREVIATIONS
ADA American diabetes association
BMI Body mass index
CBT Cognitive behavioural therapy
CKD Chronic kidney disease
CURES Chennai Urban Rural Epidemiology Study
CVD Cardiovascular disease
DAWN Diabetes Attitudes, Wishes and Needs
DFU Diabetic foot ulcer
DME Diabetic macular oedema
DM Diabetes mellitus
DN Diabetic nephropathy
DPN Diabetic peripheral neuropathy
DR Diabetic retinopathy
DSME Diabetes self-management education
DSMS Diabetes self-management support
EASD European Association for the Study of Diabetes
FBG Full blood glucose
FFA Free fatty acid
GFR Glomerular filtration rate
GI Glycaemic index
HbA1c Glycosylated haemoglobin
HCPs Health care providers
HD Healthy diet
HDL-C High-density lipoprotein cholesterol
HPA Healthy physical activity
HTN Hypertension
ICMR Indian Council of Medical Research
ICMR-INDIAB Indian Council of Medical Research-India Diabetes
IDDM Insulin dependent diabetes mellitus
xvi
IDF International Diabetes Federation
IFG Impaired fasting glucose
IGT Impaired glucose tolerance
LDL-C Low-density lipoprotein cholesterol
MNT Medical nutrition therapy
NABH National Accreditation Board of Hospitals
NFHS National Family Health Survey
NIDDM Non-insulin dependent diabetes mellitus
PAD Peripheral arterial disease
PHC Primary Health Centres
PPBG Post prandial blood glucose
PwC PricewaterhouseCoopers
QOL Quality of life
RSSDI Indian Research Society for the Study of Diabetes in India
SITE Screening India’s Twin Epidemic
SMBG Self-monitored blood glucose
T1DM Type 1 diabetes mellitus
T2DM Type 2 diabetes mellitus
TC Total cholesterol
UK United Kingdom
USA United States of America
USD United States Dollar
WHO World Health Organization
WHR Waist to Hip Ratio

1
CHAPTER 1: INTRODUCTION, THE PROBLEM AND ITS SETTING
1.1 Importance of the study
According to the International Diabetes Federation (IDF), 415 million people were living with
diabetes mellitus (DM) worldwide in 2015 [International Diabetes Federation (IDF) Diabetes
Atlas 2015, p13] and this is expected to rise to 552 million by 2030 (Whiting, Guariguata, Weil
& Shaw 2011). Diabetes mellitus accounted for approximately 5 million deaths (aged 20 to79
years) worldwide in 2015, of which 46.6% were under the age of sixty years (IDF Diabetes
Atlas 2015, p57). The World Health Organization (WHO) predicts that diabetes will be the
seventh leading cause of death worldwide by 2035 (Mathers & Loncar 2006). Fifty percent of
adults with diabetes in 2014 lived in five countries: China, India, the United States of America
(USA), Brazil and Indonesia. These countries also accounted for one half of the world’s adult
population in 2014 [NCD Risk Factor Collaboration (NCD-RisC 2016)]. It is predicted that by
2030, DM may affect up to 79.4 million individuals in India, 42.3 million in China and 30.3
million in the USA (Whiting et al 2011; Wild, Roglic, Green, Sicree & King 2004).
Between 1980 and 2014, the worldwide age-standardised adult diabetes prevalence increased
from 4.3% to 9.0% in men and from 5.0% to 7.9% in women (NCD-RisC 2016). Currently,
the greatest number of people with diabetes worldwide fall into the 40 to 59 year old age group,
and this is predicted to remain so in 2030, although there will be nearly as many people with
diabetes in the 60 to79 year old age-group (Whiting et al 2011). Globally, about 174.8 million
people were estimated to have undiagnosed DM in 2013 (Beagley, Guariguata, Weil & Motala
2014).
Diabetes mellitus is a chronic, non-communicable disease resulting in increased blood glucose
levels. In diabetes, there is a deficiency of insulin secretion by the pancreas or ineffectiveness
of secreted insulin, which can be inherited or acquired (IDF Diabetes Atlas 2015, p12). The
two main forms of diabetes are type 1 diabetes mellitus (T1DM) or insulin dependent diabetes
mellitus (IDDM) and type 2 diabetes mellitus (T2DM) or non-insulin dependent diabetes
mellitus (NIDDM). Type 1 diabetes mellitus is caused by an autoimmune reaction, in which
the body’s defence system attacks the insulin-producing beta cells in the pancreas. As a result,
the body can no longer produce the insulin it needs. The reason for this is not fully understood.
2
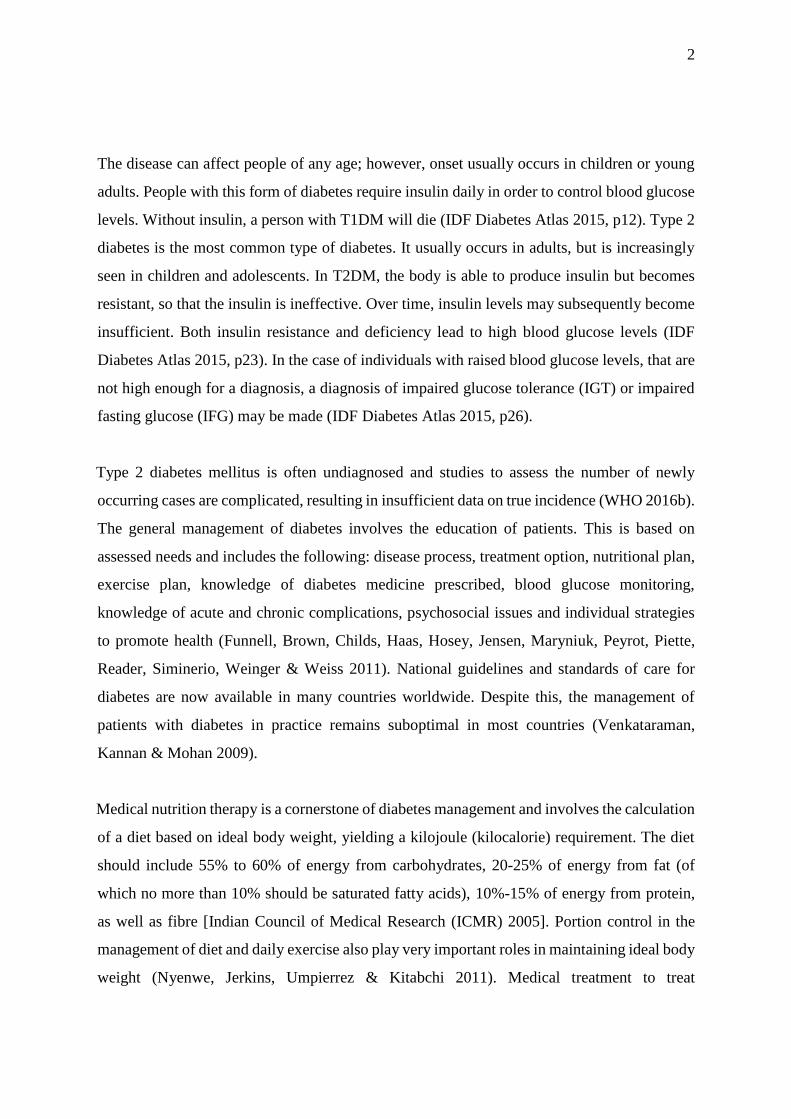
The disease can affect people of any age; however, onset usually occurs in children or young
adults. People with this form of diabetes require insulin daily in order to control blood glucose
levels. Without insulin, a person with T1DM will die (IDF Diabetes Atlas 2015, p12). Type 2
diabetes is the most common type of diabetes. It usually occurs in adults, but is increasingly
seen in children and adolescents. In T2DM, the body is able to produce insulin but becomes
resistant, so that the insulin is ineffective. Over time, insulin levels may subsequently become
insufficient. Both insulin resistance and deficiency lead to high blood glucose levels (IDF
Diabetes Atlas 2015, p23). In the case of individuals with raised blood glucose levels, that are
not high enough for a diagnosis, a diagnosis of impaired glucose tolerance (IGT) or impaired
fasting glucose (IFG) may be made (IDF Diabetes Atlas 2015, p26).
Type 2 diabetes mellitus is often undiagnosed and studies to assess the number of newly
occurring cases are complicated, resulting in insufficient data on true incidence (WHO 2016b).
The general management of diabetes involves the education of patients. This is based on
assessed needs and includes the following: disease process, treatment option, nutritional plan,
exercise plan, knowledge of diabetes medicine prescribed, blood glucose monitoring,
knowledge of acute and chronic complications, psychosocial issues and individual strategies
to promote health (Funnell, Brown, Childs, Haas, Hosey, Jensen, Maryniuk, Peyrot, Piette,
Reader, Siminerio, Weinger & Weiss 2011). National guidelines and standards of care for
diabetes are now available in many countries worldwide. Despite this, the management of
patients with diabetes in practice remains suboptimal in most countries (Venkataraman,
Kannan & Mohan 2009).
Medical nutrition therapy is a cornerstone of diabetes management and involves the calculation
of a diet based on ideal body weight, yielding a kilojoule (kilocalorie) requirement. The diet
should include 55% to 60% of energy from carbohydrates, 20-25% of energy from fat (of
which no more than 10% should be saturated fatty acids), 10%-15% of energy from protein,
as well as fibre [Indian Council of Medical Research (ICMR) 2005]. Portion control in the
management of diet and daily exercise also play very important roles in maintaining ideal body
weight (Nyenwe, Jerkins, Umpierrez & Kitabchi 2011). Medical treatment to treat
3
hyperglycaemia include oral hypoglycaemic agents (T2DM) or insulin (T1DM) (Nyenwe et al
2011).
Approximately 69.1 million from India were found to have diabetes in 2015, second only to
China (IDF Diabetes Atlas 2015, p17). According to the ICMR a lower proportion of the Indian
population was affected in the Northern India States (Chandigarh 0.12 million and Jharkhand
0.96 million), as compared to Maharashtra (North India) (9.2 million) and Tamil Nadu (South
India) (4.8 million) (Anjana, Ali, Pradeepa, Deepa, Datta, Unnikrishnan, Rema & Mohan
2011). Similarly, the National Urban Survey, conducted across the metropolitan cities of India
showed that 11.7% were affected in Kolkata (Eastern India) and 6.1% in Kashmir Valley
(Northern India) (Zargar, Khan, Masoodi, Laway, Wani, Bashir & Dar 2000). In New Delhi
(Northern India), approximately 11.6% were affected with 9.3% in West India (Mumbai),
13.5% in Chennai (South India), 16.6% in Hyderabad (South India) and 12.4% in Bangalore
(South India) (Ramachandran, Snehalatha, Kapur, Vijay, Mohan, Das, Rao, Yajnik, Prasanna
& Nair 2001). Population-based studies in the city of Chennai in South India over the last two
decades have shown an increase in the prevalence of diabetes from 8.3% in 1989, to 18.6 % in
2006 (Mohan, Sandeep, Deepa, Shah & Varghese 2007).
As evidence suggests, the prevalence of diabetes is swiftly increasing, especially in urban
India. This increase can be attributed to the predictable risk factors of urbanisation, unhealthy
eating habits, decrease in physical activity, inherent genetic attributes and differences in body
composition (Anjana et al 2011). The Asian-Indian phenotype1 and lifestyle changes
associated with urbanisation and sedentary lifestyles, have contributed to the rise in diabetes
in India (Mohan et al 2007). Diabetes control in India is not ideal with a mean glycosylated
haemoglobin (HbA1c) of 9.0%, which is at least 2.0% higher than that suggested by
international bodies (Joshi 2015). In an Indian study conducted in 2004, between 50-60% of
diabetics did not achieve the glycaemic target for HbA1c (Rao, Bhatnagar & Murphy 2011).
Comparatively, in the United Kingdom (UK), the prevalence of inadequate glycaemic control
1 Asian Indians have a small body size with thinner limbs, which is suggestive of a smaller muscle
mass. They are centrally obese, with a higher waist-to-hip ratio and higher subscapular-to-triceps
skinfold ratio; hereby termed thin-fat Indian.
4
(HbA1c of >7%) was 76% (Fox, Gerber, Bolinder, Chen & Kumar 2006) and 50% in the USA
(Resnick, Bardsley, Foster & Ratner 2006).
Poor control of diabetes leads to the development of complications that affect the quality of
life, health and may even lead to death. During the course of diabetes the heart, blood vessels,
eyes, kidneys and nerves are damaged and there is an increased risk for heart disease and
stroke. Owing to this damage a reduction in blood flow combined with nerve damage
(neuropathy) in the feet increases the risk for foot ulcers, infection and eventually the need for
limb amputation. Diabetic retinopathy is an important cause of blindness and occurs because
of long-term accumulated damage to the small blood vessels in the retina (WHO 2016b).
In India, neuropathy is the most common complication (24.6%) followed by cardiovascular
complications (23.6 %), renal complications (21.1%), retinopathy (16.6%) and foot ulcers
(5.5%) (Ramachandran et al 2001). These results compare closely with results from the South
Indian population (Kaveeshwar & Cornwall 2014). Poor glycaemic control, which has been
observed in the Indian diabetic population (Unnikrishnan, Rema, Pradeep, Deepa, Shanthirani,
Deepa & Mohan 2007), is responsible for the micro and macrovascular changes that are seen
in diabetes. In India, a considerable percentage of patients are unaware of the diabetes
condition (25%), risk factors (obesity and physical inactivity) and secondary complications of
diabetes (60%) (Mohan, Raj, Shanthirani, Datta, Unwin, Kapur & Mohan 2005). Further,
almost half of the patients are unaware that good glycaemic control would help to avoid
complications related to diabetes (Mehrotra, Bajaj, Kumar & Singh 2000). A study by
Mehrotra et al (2000), conducted in India, found that only 7.6% of patients were aware of
HbA1c testing for the diagnosis of diabetes, in the year 2000 (Mehrotra et al 2000) and 21.7%
in the year 2006 (Nagpal & Bhartia 2006). Only 10.3% of patients reported receiving diabetes
self-management education (Nagpal & Bhartia 2006) and 20-30% reported not being up-dated
on new information and developments on diabetes (Wangnoo, Maji, Das, Rao, Moses, Sethi,
Unnikrishnan, Kalra, Balaji, Bantwal, Kesavadev, Jain & Dharmalingam 2013).
In traditional societies like India, socio-cultural factors play an important role in determining
patient attitude to diabetes and its management (Osman & Curzio 2012). The therapeutic
5
modalities should consider the socio-cultural sensitivities of patients (fasting and other
religious requirements), which affect their ability to adhere to treatment recommendations
(Pathan, Sahay, Zargar, Raza, Khan, Ganie, Siddiqui, Amin, Ishtiaq & Kalraet 2012). A large
number of physicians practising in India find themselves unable to base their treatment
decisions on western guidelines, which do not cater to uniquely Indian concerns, including the
social and cultural concerns (Hasan, Zodpey & Saraf 2012). Another study from Kuwait
showed that doctors, nurses and dieticians needed to understand more about the social and
cultural habits of their patients, and consider the expected barriers to adherence to lifestyle
changes when giving advice (Serour, Alqhenaei, Al-Saqabi, Mustafa & Ben-Nakhi 2007).
Sachdeva, Khalique, Ansari, Khan, Mishra & Sharma (2015), described the need for a
multidisciplinary team with culturally apt interventions to manage diabetes. In the same study,
many patients responded that doctors had advised them to change their diet; however, they felt
this was difficult to do due to religious or cultural factors (Sachdeva et al 2015). It is also
important for health care providers (HCPs) to realise that there is no lone model of diabetes
care that fits all ethnic communities or all people within a community. A patient’s level of
ethnic affiliation and acculturation should also be assessed before counselling (Tripp-Reimer,
Choi, Skemp Kelley & Enslein 2001).
Besides the social and cultural concerns, there are many other barriers to the effective
management of diabetes in India. A study in Chennai, South India, by Kapur, Kapur,
Ramachandran, Mohan, Aravind, Badgandi & Srishyla (2007), showed that some diabetics
found that HCPs did not provide individualised dietary advice and self-management training.
Family support was lacking and the long duration of the disease often broke the patient’s
resolve. A study by Jayakumar (1997) conducted in Kerala, South India showed that common
diet sheets, physicians lack of knowledge and advice given on the first visit only and only if
blood sugar was not controlled, were insufficient to ensure lifestyle changes in diabetics
(Jayakumar 1997). A study in Bangladesh reported that patients’ poor attendance at clinics
was the strongest reason for non-adherence to lifestyle modification in diabetics (Mumu,
Saleh, Ara, Afnan & Ali 2014).
6
Studies conducted in other countries have reported similar findings. A Jamaican study found
that inadequate knowledge, low perception of risk and weak motivational factors were barriers
to lifestyle changes and glycaemic control among diabetics. The study further demonstrated
that the ’s primary source of information was their physician, thus indicating a change to a
collaborative approach (Wint, Duff, McFarlane-Anderson, O’ Connor, Bailey & Wright-
Pascoe 2006). In Hawaii, employed diabetics felt that there was a lack of understanding and
support from family members and co-workers. The study moreover explained that a barrier
related to co-ordinated services existed, where participants frequently discussed the need for a
collaborative approach to health care (Fukunaga, Uehara & Tom 2011).
The Diabetes Attitudes, Wishes and Needs (DAWN) (2005) study found that psychosocial
problems were common among diabetic patients worldwide, and that only 20% of Indian
diabetics were compliant with dietary advice (Peyrot, Rubin, Lauritzen, Snoek, Matthews &
Skovlund 2005). The subsequent DAWN-2 study (2013) showed that distress was reported in
40% of family members in India; although the largest proportion of family members (59.5%)
were more willing to be involved in care (Holt & Kalra 2013).
Exercise is known to help control blood sugar levels in diabetics (Adams 2013; Moreira,
Simões, Moraes, Motta, Campbell & Simões 2012); however, many diabetics cite a lack of
time (Fukunaga et al 2011) as the main reason for not exercising. It has been reported that
exercise is beneficial in decreasing body fat and improving lean mass in patients with type 2
DM (Sigal, Kenny, Boulé, Wells, Prud'homme, Fortier, Reid, Tulloch, Coyle, Phillips,
Jennings & Jaffey 2007; Boule´, Haddad, Kenny, Wells & Sigal 2001). According to The Joint
Position Statement of the American College of Sports Medicine and the American Diabetes
Association (ADA) (2010), both aerobic and resistance training improve insulin action, blood
glucose control, fat oxidation and storage in muscle (Colberg, Sigal, Fernhall, Regensteiner,
Blissmer, Rubin, Chasan-Taber, Albright & Braun 2010).
The DAWN-2 study conducted in 17 countries reported that 19.2% of people with diabetes
reported experiencing discrimination, intolerance and lack of support from their community
(Nicolucci, Kovacs Burns, Holt, Comaschi, Hermanns, Ishii, Kokoszka, Pouwer, Skovlund,
http://www.ncbi.nlm.nih.gov/pubmed/?term=Lauritzen%20T%5BAuthor%5D&cauthor=true&cauthor_uid=16176200
7
Stuckey, Tarkun, Vallis, Wens & Peyrot 2013). Additionally, 21.5% of family members
believed that people with diabetes experienced discrimination because of their diabetes
(Kovacs Burns, Nicolucci, Holt, Willaing, Hermanns, Kalra, Wens, Pouwer, Skovlund &
Peyrot & DAWN-2 Study Group 2013). Likewise, 32.8% of health-care professionals felt that
discrimination was an issue (Holt, Nicolucci, Kovacs Burns, Escalante, Forbes, Hermanns,
Kalra, Massi-Benedetti, Mayorov, Menéndez-Torre, Munro, Skovlund, Tarkun, Wens &
Peyrot 2013). The Indian diabetic faces above average rates of discrimination, with the rates
only higher in Turkey (Holt & Kalra 2013). Experiencing discrimination because of diabetes
is associated with diabetes-related distress for people with diabetes and is therefore an area of
concern (Holt & Kalra 2013).
In addition to countless physical complications, diabetes adversely affects the emotional health
and wellbeing of those with the condition. Clinical depression rates among those with diabetes
are estimated to be between 10% and 30% (Li, Ford, Strine & Mokdad 2008; Anderson,
Freedland, Clouse & Lustman 2001). A meta-analysis conducted by Anderson et al (2001)
showed that the presence of diabetes doubles the odds of co-morbid depression. Diabetics are
required to make significant lifestyle changes and self-management behaviours that impose a
significant burden on the patient, and may lead to depression (De Groot, Golden & Wagner
2016).
According to HCPs, reasons for suboptimal glycaemic control include patients’ resistance to
lifestyle change and starting insulin, noncompliance and psychosocial issues. Health care
providers cited the lack of time to deal with these complex patients and their multiple issues
as a key reason for prolonged suboptimal control (LeBlanc, Rosales, Kachroo, Mukherjee,
Funk, Schneider & Nichols 2014). Health care provider’s inadequate knowledge on treatment
and management of diabetes, focusing on acute management rather than preventive care,
delayed clinical response to poor control and competing care demands are a few of the
physician-related barriers to diabetes control in India (Venkataraman et al 2009).
Experts in diabetes education suggest that the greatest challenge to improving outcomes for
people with T2DM is more effective multi-component behaviour change strategies (Norris,
8
Zhang, Avenell, Gregg, Bowman, Serdula, Brown, Schmid & Lau 2004). “Typical”
approaches include scare tactics, advice-giving, badgering, and other highly directive styles
that are not conducive to behaviour change (Moran, Bekker & Latchford 2008). In contrast,
approaches that include patient empowerment, education, psychosocial understanding and,
more recently, brief behaviour change counselling, have shown promising results (Dellasega,
Gabbay, Durdock & Martinez-King 2010). A study in Israel reported that well informed and
motivated diabetic patients were more successful in obtaining and maintaining good control of
their risk factors, resulting in reduced cardiovascular risk and slower progression of
microvascular disease (Rachmani, Slavacheski, Berla, Frommer-Shapira & Ravid 2005).
Consequently, knowledge and motivation to make changes play a vital role in the treatment of
diabetes. Expanding on the former, motivation is described as two conflicting needs. Firstly,
clear information that propels that person to take action or secondly, the person making their
own choices (Borra, Kelly, Tuttle & Neville 2001). Centis, Trento, Dei Cas, Pontiroli, De Feo,
Bruno, Sasdelli, Arturi, Strollo, Kreutzenberg, Invitti, Di Bonito, Di Mauro, Pugliese, Molteni
& Marchesini (2014), in Italy, using the transtheoretical model showed that the phase of
change and motivation to embrace a healthier diet and intensify their physical activity, remains
problematic in a large percentage of individuals with T2DM. This was irrespective of age and
co-morbidities (Centis et al 2014). These phases are described as pre-contemplation (not
ready), contemplation (getting ready), preparation (ready), action and maintenance
(Prochaska, DiClemente & Norcross 1992). A study conducted in the Netherlands showed that
diabetic subjects receiving lifestyle-counselling interventions (based on the transtheoretical
model), supported the gap between motivation and action (Vermunt, Milder, Wielaard, Baan,
Schelfhout, Westert & van Oers 2013).
Although optimal management of diabetes is central to diabetes care, there are many barriers
faced by diabetic patients on a daily basis. These barriers range from time constraints, lack of
knowledge, fear or depression, lack of self-motivation and lack of support from family and
medical personnel. Given the fact that such a large percentage of the world’s diabetics live in
India, more research is needed to investigate the barriers that Indian diabetics face. Therefore,
9
this study aimed to evaluate the barriers to lifestyle modification, motivation, knowledge and
service needs of diabetic adults and their health care providers in Chennai, Tamil Nadu, India.
1.2 Aim of the study
This study aimed to evaluate the barriers to lifestyle modification, motivation, knowledge and
service needs of diabetic adults and their health care providers in Chennai, Tamil Nadu, India.
1.3 Research objectives
The objectives of this study were:
1.3.1 To identify the barriers to lifestyle modification as perceived by South Indian type 2
diabetic adults.
1.3.2 To identify the barriers to motivation, knowledge and service needs as perceived by
South Indian type 2 diabetic adults.
1.3.3 To identify the challenges as perceived by HCPs in providing education, motivation
and services to their diabetic patients.
1.4 Hypotheses
The following hypotheses were tested:
1.4.1 The perceived barriers to lifestyle modification include time constraints, lack of
motivation, lack of skills development, emotional wellbeing and lack of support from
HCPs and family.
1.4.2 The perceived barriers to motivation, knowledge and service needs include lack of
skills development, proper counselling, follow-up with HCPs and emotional
wellbeing.
1.4.3 The perceived barriers to knowledge include a lack of in depth counselling, written
information, understandable explanation on risks and complications of disease, lack of
follow-up with HCPs and a lack of holistic care, where all team members are involved.
1.4.4 The perceived barriers to services provided include time constraints, lack of manpower,
lack of a team approach, lack of knowledge and counselling skills.
10
1.5 Study parameters
1.5.1 For the purpose of this study, only the general in-patient department (Wards A, D, G)
at Apollo Specialty Hospital, Vanagaram was used as a study site.
1.5.2 Only adults with T2DM between the ages of 18 to 70 years and with not more than
two co-morbidities were included in the study.
1.5.3 In addition to the criteria mentioned in 1.5.2, only patients who were Tamil or English
speaking and who lived in Chennai, were included in the study.
1.5.4 Renal diabetics were excluded from the study, as these patients require specialised
management, which is different for patients with T2DM without renal involvement.
1.5.5 The collection of data was conducted between the months of January 2017 and March
2017.
1.5.6 The diagnosis of diabetes at Apollo Hospitals is as per WHO recommendations for
diagnostic criteria for diabetes mellitus, which is fasting glucose of >7mmol/l or
126mg/dL.
1.6 Study assumptions
The following assumptions were made:
1.6.1 All patients understood either English or Tamil, the languages in which the
questionnaires were formulated.
1.6.2 All participants, including both the patients and the HCPs, answered the questionnaire
honestly.
1.7 Definition of terms
Adult - “one who is fully developed and matured and who has attained the intellectual capacity
and the emotional and psychological stability of a mature person; a human male or female
after a specific age (as 18 or 21)” (Anderson, Keith, Novack & Elliot 2002, p48).
Barrier - “something non-physical that obstructs or separates, such as barriers to
communication or compliance” (Anderson et al 2002, p182).
Diabetes mellitus - “diabetes is a group of metabolic diseases characterised by
hyperglycaemia resulting from defects in insulin secretion, insulin action, or both. The chronic
11
hyperglycaemia of diabetes is associated with long-term damage, dysfunction, and failure of
different organs, especially the eyes, kidneys, nerves, heart, and blood vessels” (ADA 2003).
Health care providers - “any individual, institution, or agency that provides health services
to health care consumers” (Anderson et al 2002, p784).
Knowledge - “facts, information and skills acquired through experience or education; it can
also be regarded as the theoretical or practical understanding of a subject” (Stevenson 2010, p
671).
Motivation - “the processes that accounts for an individual’s intensity, direction and
persistence of effort toward attaining a goal” (Lambrou, Kontodimopoulos & Niakas 2010).
Perception- “a conscious recognition and interpretation of sensory stimuli that serve as a basis
for understanding, learning and knowing or for motivating a particular action or reaction”
(Anderson et al 2002, p1310).
1.8 Summary
Globally, the prevalence of diabetes has reached pandemic proportions. The prevalence of type
2 diabetes in adults living in India, particularly South India, has become alarming. Despite the
developments in pharmaceutical and diagnostic therapy, healthcare and advances in the array
of guidelines available, the control of diabetes worldwide, including India, remains
suboptimal. Inadequate management of diabetes leads to serious consequences for the
individual with diabetes and the increasing costs for the wider health economy. Barriers to
effective diabetes management include both patient- and health care provider-related issues.
Patient-related barriers include time constraints, lack of knowledge, weak motivational factors,
lack of family and medical support. Health care provider-barriers include sub-optimal
knowledge of guidelines, constraints of time and facilities and attitudinal issues. Health care
providers are not always aware of the most effective interventions and tend to spend more time
on acute management rather than chronic care. The complexity of T2DM as a disease and the
multiple interventions required, make HCPs wary of treating T2DM. This is especially since
disease prognosis remains unpredictable in spite of aggressive management. Although, various
studies have been done worldwide and within Chennai to address the barriers to lifestyle, none
have covered the perceptions of the HCPs and the barriers to motivation. Considering this,
there is a need to investigate the barriers to change from the perspective of the patient and

12
HCPs, this study aimed to evaluate the barriers to lifestyle modification, motivation,
knowledge and service needs of diabetic adults and their health care providers in Chennai,
Tamil Nadu, India. It is hoped that the results from this study would identify and improve the
understanding of these barriers and recommend ways of better managing and assisting the
diabetic patient.
13
CHAPTER 2: LITERATURE REVIEW
This chapter reviews the definition and types of diabetes mellitus as well as diagnosis, risk
factors, complications and co-morbidities. Management and the barriers faced by diabetics in
lifestyle modification, support, motivation and acquiring adequate, appropriate knowledge are
also reviewed. The difficulties faced by Indian diabetics in a developing country and the
change from disease treatment to patient treatment are also covered.
2.1 Definition and types of diabetes mellitus
Diabetes mellitus is a chronic, non-communicable disease resulting in increased blood glucose
levels. In diabetes, there is deficient insulin secretion by the pancreas or ineffectiveness of
secreted insulin which can be inherited or acquired (IDF Diabetes Atlas 2015, p12). There are
several forms of diabetes, such as:
a. Type 1 diabetes mellitus or insulin dependent diabetes mellitus (IDDM) is caused by
an autoimmune reaction, in which the body’s defence system attacks the insulin-producing
beta cells in the pancreas. As a result, the body can no longer produce the insulin it needs. The
reason for this is not fully understood and the disease can affect people of any age. However,
onset usually occurs in children or young adults. People with this form of diabetes require
insulin daily in order to control blood glucose levels. Without insulin, a person with type 1
diabetes mellitus will die (IDF Diabetes Atlas 2015, p12).
b. Type 2 diabetes mellitus or non-insulin dependent diabetes mellitus (NIDDM) (other
specific types include damage to the pancreas by specific causes such as toxins and infections).
Type 2 diabetes is the most common type of diabetes. It usually occurs in adults, but is
increasingly seen in children and adolescents. In T2DM, the body is able to produce insulin
but becomes resistant and the insulin is ineffective. Over time, insulin levels may subsequently
become insufficient. Both insulin resistance and deficiency lead to high blood glucose levels
(IDF Diabetes Atlas 2015, p23). In the case of individuals with raised blood glucose levels that
are not high enough for a diagnosis, a diagnosis of IGT or IFG may be made (IDF Diabetes
Atlas 2015, p26).
c. Impaired glucose tolerance (blood glucose ≥ 11.1mmol/l after 2 hr of 75g of glucose
intake) and impaired fasting glucose (blood glucose 6.1 to 6.9 mmol/l) (Kumar, Goel, Jain,
Khanna & Chaudhary 2013).
14
d. Gestational diabetes mellitus (GDM) occurs only during pregnancy. It can lead to
serious health risks for both the mother and child. Gestational diabetes mellitus is associated
with an increased risk of both mother and child developing T2DM later in life (IDF Diabetes
Atlas 2015, p26).
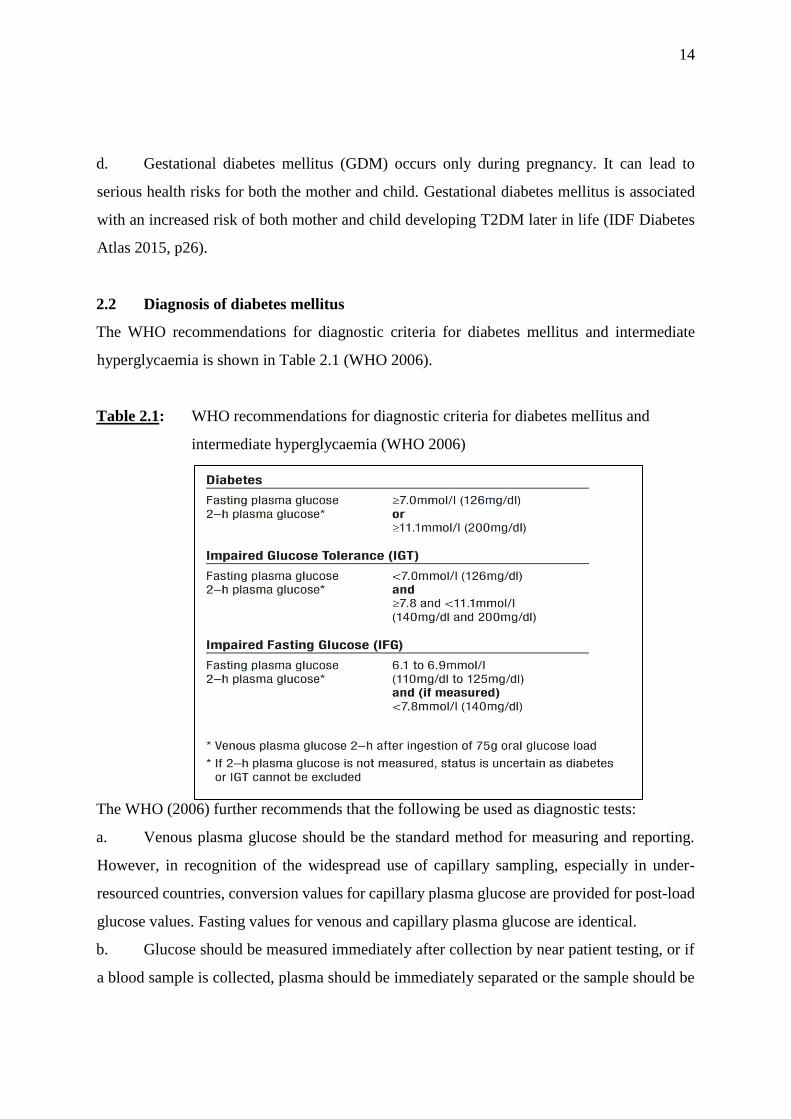
2.2 Diagnosis of diabetes mellitus
The WHO recommendations for diagnostic criteria for diabetes mellitus and intermediate
hyperglycaemia is shown in Table 2.1 (WHO 2006).
Table 2.1: WHO recommendations for diagnostic criteria for diabetes mellitus and
intermediate hyperglycaemia (WHO 2006)
The WHO (2006) further recommends that the following be used as diagnostic tests:
a. Venous plasma glucose should be the standard method for measuring and reporting.
However, in recognition of the widespread use of capillary sampling, especially in under-
resourced countries, conversion values for capillary plasma glucose are provided for post-load
glucose values. Fasting values for venous and capillary plasma glucose are identical.
b. Glucose should be measured immediately after collection by near patient testing, or if
a blood sample is collected, plasma should be immediately separated or the sample should be
15
collected into a container with glycolytic inhibitors and placed on ice-water until separated,
prior to analysis (WHO 2006).
Glycosylated haemoglobin (HbA1c) reflects the average blood glucose concentration over the
previous few weeks, rather than the blood glucose concentration at that moment (reflected by
the fasting and 2-hour blood glucose measurements mentioned earlier) (WHO 2011, p6). The
use of the HbA1c test for monitoring blood glucose levels was the result of reports from major
outcomes studies including, the Diabetes Control and Complications Trial Research Group,
the UK Prospective Diabetes Study, Action to Control Cardiovascular Risk in Diabetes Study
Group, Action in Diabetes and Vascular Disease, Preterax and Diamicron Modified Release
Controlled Evaluation and Veterans Affairs Diabetes Trial (IDF Clinical Guidelines Task
Force 2012). With the HbA1c, health care providers can observe the patient’s blood glucose
control to determine risk of complications. Further to this, the HbA1c test should only be
mandatory where it is affordable and or available (IDF Clinical Guidelines Task Force 2012).
2.3 Risk factors for diabetes mellitus
Aside from the common risk factors, such as urbanisation, industrialisation, globalisation and
aging, other factors place Indians more at risk of diabetes mellitus than other race groups. It
has been suggested that the higher percentage of body fat to lean body mass, central obesity,
obesity, intra-uterine period and rapid growth gain in infanthood, including genetic factors,
increases the risk (Tandon & Raizada 2014).
2.3.1 Genetic predisposition
Mohan et al (2007) examined a few studies that showed that Asian Indians (a citizen of Asian
descent with ancestors in India) were at increased risk of developing T2DM, compared to other
ethnic groups (Mohan et al 2007). Reasons for this remain unclear, although the “Asian Indian
phenotype” is considered to be a major contributing factor to the increased risk of diabetes
(Deepa, Farooq, Deepa, Manjula & Mohan 2006; Joshi 2003). According to the “Asian Indian
phenotype”, Asian Indians have a small body size, which has been termed thin-fat Indian.
Asian Indians have thinner limbs, which is suggestive of a smaller muscle mass. However,

16
despite their thinness, they are centrally obese, with a higher waist-to-hip ratio (WHR) and
higher subscapular-to-triceps skinfold ratio, than their British counterparts (Joshi 2015).
Asian Indians have a higher waist to hip ratio than other race groups; even though their body
mass index (BMI) is lower (Mohan et al 2007). This implies that they have greater abdominal
obesity. It has also been shown that the Indian Asian has more abdominal and visceral fat for
any given BMI (Raji, Seely, Arky & Simonson 2001). However, a later study conducted by
Szuszkiewicz-Garcia, Li, Grundy, Abate & Chandalia (2012), noted that Asian Indian women
did not have significant differences in visceral and abdominal fat, compared to Caucasian
women (Szuszkiewicz-Garcia et al 2012). Another study showed that for any given amount
of body fat, Asian Indian men had increased insulin resistance (Chandalia, Abate, Garg, Stray-
Gundersen & Grundy 1999).
The “thin-fat Indian baby” as observed by Yajnik, Fall, Coyaji, Hirve, Rao & Barker (2003)
and Yajnik, Lubree, Rege, Naik, Deshpande, Deshpande, Joglekar & Yudkin (2002), suggests
that Indian neonates are born smaller but are relatively fatter compared to Caucasian babies
(Yajnik et al 2003;Yajnik et al 2002). Further to this, Krishnaveni, Hill, Veena, Leary, Saperia,
Chachyamma, Karat & Fall (2005), showed that the “thin-fat phenotype” in neonates continues
in childhood and could be the initial cause of the diabetogenic adult phenotype. According to
the “thin-fat phenotype”, Indian babies are lighter, with small abdominal and arm
circumferences, but show relative sparing of subscapular skinfold thickness. This phenotype
is described as muscle-thin but adipose (‘thin-fat’) body composition (Krishnaveni et al 2005).
This suggests that Asian Indians are more prone to diabetes and metabolic abnormalities
(Krishnaveni et al 2005).
While some genes seem to confer increased susceptibility to diabetes in Asian Indians (Abate,
Chandalia, Satija, Adams-Huet, Grundy, Sandeep, Radha, Deepa & Mohan 2005;
Vimaleswaran, Radha, Ghosh, Majumder, Deepa, Babu, Rao & Mohan 2005), some
protective genes in Europeans do not appear to protect Indians (Radha, Vimaleswaran, Babu,
Abate, Chandalia, Sathija, Grundy, Ghosh, Majumder, Deepa, Rao & Mohan 2006).
17
2.3.2 Lifestyle
2.3.2.1 Fast food culture
It is useful to understand how diets have changed across the low- and medium-income world
to converge on what is often termed the “Western diet.” This is broadly defined by high intake
of refined carbohydrates, added sugars, fats and animal-source foods (Popkin, Adair & Ng
2012). Fast foods and snack foods are generally high in fat and commonly contain trans-fatty
acids, both of which contribute to insulin resistance (Odegaard & Pereira 2006). Data available
from low- and middle-income countries document this trend in all urban areas and increasingly
in rural areas. Diets rich in legumes, vegetables, and grains are disappearing in all regions and
countries worldwide. Some major global developments in technology have been behind this
shift (Popkin et al 2012).
Popkin et al (2012) also observed that refined oils have become more abundant and affordable
over the past decades. Shetty (2002), observed that city dwellers in India appeared to consume
a higher percentage of energy from fat (32%), as compared to rural areas (17%) (Shetty 2002).
Colles, Singh, Kohli & Mithal (2013) found an inconsistency between the level of education
and socio-economic advantage related to healthy eating food choices. Colles et al (2013) found
that younger people purchased fast or take away foods more frequently, mostly due to taste, as
a determinant of their food choice. This suggests that the younger generation are eating more
processed, high fat and sugary foods (Colles et al 2013).
2.3.2.2 Sedentary lifestyle
Exercise has been shown to be beneficial in decreasing body fat and improving lean mass in
patients with T2DM (Sigal et al 2007; Boule´ et al 2001). Exercise also plays a major role in
the prevention and control of insulin resistance, T2DM and diabetes-related health
complications. Both aerobic and resistance training can improve insulin action as well as the
management of blood glucose levels, lipids, high blood pressure, cardiovascular risk and
quality of life (Sanz, Gautier & Hanaire 2010; Roumen, Corpeleijn, Feskens, Mensink, Saris
& Blaak 2008; Sigal et al 2007; Simmons, Harding, Jakes, Welch, Wareham & Griffin 2006;
Boule´ et al 2001; Pan, Li, Hu, Wang, Yang, An, Hu, Lin, Xiao, Cao, Liu, Jiang, Jiang, Wang,
18
Zheng, Zhang, Bennett & Howard 1997). Regular training with varying types of exercise
should be undertaken regularly to have continued benefits (Colberg et al 2010).
According to The Joint Position Statement of the American College of Sports Medicine and
the American Diabetes Association (2010), both aerobic and resistance training improve
insulin action, blood glucose control, fat oxidation and storage in muscle. Resistance exercise
also enhances skeletal muscle mass (Colberg et al 2010). Further to this, the paper states that
achieving the recommended levels of physical activity may help to achieve weight loss.
However, up to 60 minutes of exercise on a daily basis may be required when relying on
exercise alone, for weight loss (Colberg et al 2010).
Van Dijk, Tummers, Stehouwer, Hartgens & van Loon (2012), showed that frequent short
spells of exercise were equally effective in improving glycaemic control as less frequent
exercise spells, of longer duration. Hereby, the total amount of exercise accomplished seems
to be of greater importance with respect to glycaemic control (Van Dijk et al 2012). It has been
noted that quality of life (QOL) and depression rates are also related to physical activity. The
Joint Position Statement of The American College of Sports Medicine and the American
Diabetes Association (2010), mentions that increased physical activity and physical fitness can
reduce symptoms of depression and improve health-related QOL in those with T2DM (Colberg
et al 2010).
Colberg et al (2010) suggests that people with T2DM should do moderate to vigorous aerobic
exercise for at least 150 minutes/week over a period of at least three days during the week,
with no more than two consecutive days between bouts of aerobic activity (Colberg et al 2010).
In addition to aerobic training, type 2 diabetics should also undertake moderate to vigorous
resistance training at least 2-3 days/week (Colberg et al 2010). The Position Statement from
Exercise and Sport Science Australia recommends that individuals with T2DM should accrue
a minimum of 210 minutes of moderate intensity or 125 minutes of vigorous intensity exercise
each week, using a combination of both aerobic and resistance training (Hordern, Dunstan,
Prins, Baker, Singh & Coombes 2012). If possible, the total amount of exercise should consist
of some aerobic and some resistance training. However, if only one type can be done, then
19
either type alone will also be effective. In older adults with multiple chronic diseases, the risks
associated with exercise are considered less than those of inactivity. As a result, exercise
training should be an essential component of any treatment plan for all patients at risk of or
with T2DM (Hordern et al 2012).
2.4 Complications and co-morbidities of diabetes mellitus
2.4.1 Complications of diabetes mellitus
Because the average gap between onset and detection of diabetes is between 4 to 7 years, the
degenerative changes secondary to aging and prolonged hyperglycaemia can damage tissues,
leading to microvascular and macrovascular complications (Harris, Klein, Welborn &
Knuiman 1992). The macrovascular complications include coronary artery disease, peripheral
arterial disease and stroke. The microvascular complications include retinopathy, diabetic
nephropathy and peripheral neuropathy (Kulshrestha, Seth, Tripathi, Seth & Kumar 2015).
2.4.1.1 Cardiovascular disease
According to the WHO, cardiovascular diseases (CVDs) are a group of disorders of the heart
and blood vessels. It includes coronary heart disease (disease of the blood vessels supplying
the heart muscle), cerebrovascular disease (disease of the blood vessels supplying the brain),
peripheral arterial disease (disease of blood vessels supplying the arms and leg), rheumatic
heart disease (damage to the heart muscle and heart valves from rheumatic fever, caused by
streptococcal bacteria), congenital heart disease (malformations of heart structure existing at
birth), deep vein thrombosis and pulmonary embolism (blood clots in the leg veins, which can
dislodge and move to the heart and lungs) (WHO 2017b).
In Chennai, the Chennai Urban Rural Epidemiology Study (CURES) (2006) reported the
prevalence of coronary artery disease to be 21.4% [Mohan, Deepa, Rani, Premalatha &
Chennai Urban Population Study (CUPS No.5) 2001]. According to the A1chieve study, 23.6
% of Indian diabetics had cardiovascular complications (Mohan, Shah & Saboo 2013). The
Indian Council of Medical Research India Diabetes Study (ICMR-INDIAB) (2014), reported
that of the four regions of Tamil Nadu, Maharashtra, Jharkand and Chandigarh, Tamil Nadu
(South India) had the highest cholesterol to high-density lipoprotein cholesterol (HDL-C) ratio,
20
mean cholesterol and low-density lipoprotein cholesterol (LDL-C) levels (Joshi, Anjana,
Deepa, Pradeepa, Bhansali, Dhandania, Joshi, Unnikrishnan, Nirmal, Subashini, Madhu, Rao,
Das, Kaur, Shukla & Mohan 2014).
Corroborating the Asian Indian phenotype (increased plasma insulin levels, insulin resistance,
increased waist circumference, excess visceral fat and low adiponectin levels), Deepa et al
(2006), showed a high prevalence of low HDL-C levels in Indian type 2 diabetics (Deepa,
Sandeep & Mohan 2006, p145). A study conducted in South India by Velmurugan, Deepa,
Ravikumar, Lawrence, Anshoo, Senthilvelmurugan, Enas & Mohan (2003), using 587 type 2
diabetics at a Chennai hospital with a mean age of 55 ± 10 years, showed that lipoprotein (a)
had a strong association with intimal medial thickness of carotid arteries in type 2 diabetic
subjects (Velmurugan et al 2003). According to Yadav, Tiwari & Dhanaraj (2008), the
prevalence of macrovascular disease was higher in Asians, compared to Europeans (Yadav et
al 2008). Further to this, Asian patients were found to have more macro and microvascular
complications at diagnosis of diabetes, compared to European patients. In addition, the history
of ischemic disease was more prevalent in Asians and Americans compared to Europeans
(Yadav et al 2008).
Sasisekhar, Alekhya, Jagadeesh & Sudha (2012) showed that 28.18% of their South Indian
study group had cardiovascular disease, which made it the second most common cause of
deaths in one district in Andra Pradesh, India (Sasisekhar et al 2012). This study showed
similar rates of cardiovascular disease as in the CURES from 2006. The authors attributed this
to several contributory factors like coronary atherosclerosis, chronic hyperglycaemia,
glycosylation of myocardial proteins and microvascular disease, which are intrinsically
associated with diabetes mellitus (Sasisekhar et al 2012; Mohan et al 2001).
2.4.1.2 Retinopathy
Diabetic retinopathy (DR) and diabetic macular oedema (DME) are common microvascular
complications affecting the eye, in diabetic patients. These complications could lead to a
sudden and incapacitating impact on visual acuity, eventually causing blindness. In advanced
stages of DR, there is growth of abnormal retinal blood vessels, secondary to ischemia. These
21
blood vessels grow in an attempt to supply oxygenated blood to the hypoxic retina. At any
time during the progression of DR, patients with diabetes can also develop DME, which
involves retinal thickening in the macular area. Diabetic macular oedema occurs after
breakdown of the blood-retinal barrier because of leakage of dilated hyperpermeable
capillaries and micro aneurysms (Ciulla, Amador & Zinman 2003).
Diabetic retinopathy is a major cause of vision loss in patients with diabetes. The longer
patients have diabetes, the higher the prevalence of DR. The Chennai Urban Rural
Epidemiology Study (CURES) reported that the prevalence of DR in the urban diabetic
Chennai population was 17.6% (Rema, Premkumar, Anitha, Deepa, Pradeepa & Mohan 2005).
In 2012, the prevalence of DR in 35 studies across the USA, Australia, Europe and Asia was
34.6% [Yau, Rogers, Kawasaki, Lamoureux, Kowalski, Bek, Chen, Dekker, Fletcher,
Grauslund, Haffner, Hamman, Ikram, Kayama, Klein, Klein, Krishnaiah, Mayurasakorn,
O’Hare, Orchard, Porta, Rema, Roy, Sharma, Shaw, Taylor, Tielsch, Varma, Wang, Wang,
West, Xu, Yasuda, Zhang, Mitchell, Wong & the Meta-Analysis for Eye Disease (META-
EYE) Study Group 2012]. The prevalence of DR in the urban diabetic Chennai population was
still lower than worldwide rates.
2.4.1.3 Microvascular disease
a. Neuropathy
A group of nerve disorders known as diabetic neuropathies occurs as a result of constant high
blood sugar levels. Patients are unable to perceive sensations like heat, cold and pain in
extremities because of nerve damage. Due to the lack of these sensations, the patient may not
be aware of a sore or an ulcer in the foot. Along with delayed or non-healing of ulcers due to
diabetes, many patients lose their limbs (D’Souza, Kulkarni, Bhaskaran, Ahmed, Naimish,
Prakash, Tabreez, Dahiya, Thapar, Mithra, Kumar, Holla, Darshan & Kumar 2015). One of the
most chronic and debilitating complication of diabetes is diabetic peripheral neuropathy (DPN)
(Bansal, Gudala, Muthyala, Esam, Nayakallu & Bhansali 2014). A challenge with the
development of DPN is that the changes are subtle and occur as people age. As a result, the
signs of nerve damage are missed or ignored and are blamed on aging (D’Souza et al 2015).
22
Bansal et al (2014) reported that 29.2% of North Indian type 2 diabetic patients had DPN
(Bansal et al 2014). This is similar to CURES, which found the prevalence of diabetic
neuropathy to be 26.1% amongst diabetic subjects in Chennai (Pradeepa, Rema, Vignesh,
Deepa, Deepa & Mohan 2008). However, a study with 1401 type 2 diabetics in Chennai found
a prevalence of diabetic neuropathy of 19.8% (Rani, Raman, Rachapalli, Pal, Kulothungan &
Sharma 2010). Foot infection is a common complication and a leading cause of hospital
admission among diabetic patients in India (Viswanathan & Kumpatla 2009). Recurrence of
foot infection is commonly seen and is mainly due to the presence of neuropathy and peripheral
vascular disease (Vijay, Narasimham, Seena, Snehalatha & Ramachandran 2000).
Approximately 40 to 72% of lower extremity amputations related to diabetes were found in 31
centre across India (Viswanathan & Kumpatla 2009). Morbach, Lutale, Viswanathan,
Möllenberg, Ochs, Rajashekar, Ramachandran & Abbas (2004), found that although peripheral
vascular disease (PVD) was more common in Germany than Tanzania and Chennai; the
amputation rate was higher among Indians, due to progressive infection (Tanzania vs.
Germany vs. India: 12% vs. 48% vs. 13%, respectively) (Morbach et al 2004).
b. Foot ulcers
Patients with diabetes are prone to developing diabetic foot ulcer (DFU). Diabetic foot ulcer is
a common complication of DM with an increasing trend over the past few decades
(Yazdanpanah, Nasiri & Adarvishi 2015). Several risk factors for diabetic foot ulcers have
been identified. These include peripheral neuropathy, vascular disease, limited joint mobility,
foot deformities, abnormal foot pressures, minor trauma, a history of ulceration or amputation,
and impaired visual acuity. Diabetic neuropathy, peripheral vascular disease, foot deformity
and previous diabetic foot ulceration or lower extremity amputation and being diagnosed with
DM for more than 10 years, are additional risk factors. A previous diagnosis of acute
myocardial infarction and stroke, interdigital mycosis and calluses, gender (male), older
patients and high BMI are also known risk factors. Co-morbidities such as retinopathy,
elevated HbA1C, high plantar pressure, infections, inappropriate foot self-care habits and
peripheral arterial disease also increase risk for developing DFU (Yazdanpanah et al 2015;
Bortoletto, de Andrade, Matsuo, Haddad, González & Silva 2014; Waaijman, de Haart, Arts,
Wever, Verlouw & Nollet 2014; Monteiro-Soares, Boyko, Ribeiro, Ribeiro & Dinis-Ribeiro
23
2012; Frykberg, Zgonis, Armstrong, Driver, Giurini, Kravitz, Landsman, Lavery, Moore,
Schuberth, Wukich, Andersen & Vanore 2006).
Foot ulceration in patients with diabetic peripheral neuropathy can be caused by foot
deformities and gait instability, due to increased plantar pressure (Fernando, Crowther, Pappas,
Lazzarini, Cunningham, Sangla, Buttner & Golledge 2014; Bacarin, Sacco & Hennig 2009).
According to Viswanathan & Kumpatla (2009), a foot ulcer can also develop due to a
combination of peripheral vascular disease, peripheral neuropathy, infection and poor foot care
(Viswanathan & Kumpatla 2009). Many foot complications associated with diabetes in rural
India are neuropathic and infective, rather than vascular in origin, as in developed countries
(Aleem 2003). A multicentre study covering 31 centres across India with 1985 type 2 diabetic
subjects, showed that a total of 1295 (65%) patients had undergone amputations, both major
and minor. The prevalence of neuropathy was high (82%) and 35% had peripheral vascular
disease (Viswanathan & Kumpatla 2009). In the A1chieve study (2013), conducted on 20 000
type 2 Indian diabetics, the reported prevalence of foot ulcers was 5.1% (Mohan et al 2013).
2.4.1.4 Nephropathy
Diabetic nephropathy (DN) or diabetic kidney disease is a syndrome characterised by the
presence of extreme quantities of urine albumin excretion, diabetic glomerular lesions and loss
of glomerular filtration rate (GFR) in diabetics (Lim 2014). The pathophysiological
mechanisms of diabetic nephropathy are not completely understood. It may be due to the
glycosylation of circulating and intrarenal proteins, hypertension, and abnormal intrarenal
haemodynamics (Evans & Capell 2000). Poor metabolic control is critical in the cause of
diabetic nephropathy. Nephropathy is uncommon in patients with glycosylated haemoglobin
(HbA1c) consistently less than 7.58% (Evans & Capell 2000).
Diabetic nephropathy can be diagnosed early by elevated urine albumin and monitoring the
decline of the GFR. However, not all patients with chronic kidney disease have elevated urine
albumin at the onset. Therefore, both the blood and urine should be screened (Hahr & Molitch
2015). Chronic kidney disease (CKD) is increasing among Indian patients, as shown in a
narrative review by Sequira, Prabhu, Mayya, Nagaraju, Devi, Nayak & George (2016). This
24
increased prevalence is largely due to diabetes and hypertension (Sequira et al 2016). The
CURES (2005) study reported that the prevalence of microalbuminuria and nephropathy was
26.9% and 2.2%, respectively (Unnikrishnan et al 2007). The prevalence of renal
complications amongst Indian diabetics in the A1chieve study was 21.1% (Mohan et al 2013).
2.4.2 Co-morbidities
2.4.2.1 Hypertension
Over one billion people are estimated to have hypertension, worldwide (Chobanian, Bakris,
Black, Cushman, Green, Izzo, Jones, Materson, Oparil, Wright, Roccella, the National Heart,
Lung and Blood Institute Joint National Committee on Prevention, Detection, Evaluation and
Treatment of High Blood Pressure & the National High Blood Pressure Education Program
Coordinating Committee 2003). The high prevalence of hypertension (HTN) makes it a
significant factor for mortality and morbidity (Mohan et al 2013). A strong link has been found
between changing lifestyle factors and an increase in both diabetes and hypertension (Mohan
et al 2013).
Diabetes and hypertension coexist in 40%-60% of patients with T2DM in the USA, making
hypertension a common co-morbid condition in diabetics (Arauz-Pacheco, Parrott & Raskin
2002; Sowers, Epstein & Frohlich 2001). As both diabetes and hypertension affect the same
target organs, people with co-existing DM and HTN are at increased risk of developing
atherosclerosis, retinopathy, renal failure, non-traumatic amputations and CVD (Stamler,
Vaccaro, Neaton & Wentworth 1993). The Systolic Hypertension in the Elderly Program and
the Systolic Hypertension in Europe Study found that those with coexisting DM had an
approximate doubling in cardiovascular morbidity and mortality (Tuomilehto, Rastenyte,
Birkenhäger, Thijs, Antikainen, Bulpitt, Fletcher, Forette, Goldhaber, Palatini, Sarti & Fagard
1999; Curb, Pressel, Cutler, Savage, Applegate, Black, Camel, Davis, Frost, Gonzalez,
Guthrie, Oberman, Rutan & Stamler 1996).
In India, about 50% of diabetic individuals have HTN (Mohan et al 2013). The Screening
India’s Twin Epidemic (SITE) cross-sectional study conducted in 10 Indian states established

25
that diabetes and hypertension were coexistent in 20.6% of patients. This shows an extensive
strain of the rise of DM and HTN in India (Joshi, Vadivale, Dalal & Das 2011).
2.4.2.2 Dyslipidaemia
Dyslipidaemia is defined as elevated total or LDL-C levels or low levels of HDL-C (Fodor
2011). It is the key independent modifiable risk factor for CVD (Haffner 1999; Grundy 1997).
The Indian Council of Medical Research-India Diabetes (ICMR-INDIAB) study (2015),
showed the presence of abnormalities in at least one lipid parameter in 76.9% of the general
population in Tamil Nadu; translating into 35.9 million individuals. In the same study, Tamil
Nadu also had the highest cholesterol to HDL-C ratio (42.3%) (Pradeepa, Anjana, Joshi,
Bhansali, Deepa, Joshi, Dhandania, Madhu, Rao, Geetha, Subashini, Unnikrishnan, Shukla,
Kaur, Mohan & Das 2015). Further to this, HDL-C levels were the most common lipid
abnormality, thus illustrating the Asian Indian phenotype (Joshi et al 2014). A meta-analysis
of randomised controlled trials showed that effective treatment of dyslipidaemia reduces
morbidity and mortality (Costa, Borges, David & Carneiro 2006).
2.4.2.3 Obesity
Obesity is defined as a condition of abnormal or excessive fat accumulation in adipose tissue,
to the extent that health is impaired. The amount of excess fat and its distribution in the body,
either around the waist and trunk (abdominal, central or android obesity) or peripherally around
the body (gynoid obesity), have important health implications (Ofei 2005). Although under
nutrition was well-known to exist in India, it is now overweight and obesity that are being
reported more frequently. Excess body fat, abdominal adiposity, increased subcutaneous and
intra-abdominal fat and deposition of fat in ectopic sites (such as liver, muscle, and others),
are common among Indians. Obesity is a known predictor for the extensively prevalent
metabolic syndrome and T2DM in India (Kalra & Unnikrishnan 2012).
The ICMR-INDIAB (2015) reported on the prevalence of obesity (generalised and abdominal)
in urban and rural states of India. The highest prevalence of both types of obesity (generalised
obesity and abdominal obesity) was found in Chandigarh, followed by Tamil Nadu (South
India), Maharashtra and Jharkhand (Pradeepa et al 2015). The CURES conducted in Chennai,
26
Tamil Nadu reported age-standardised prevalence of generalised obesity to be 45.9%, while
that of abdominal obesity was 46.6% (Deepa et al 2006).
The prevalence of obesity in India is on the rise due to an increased energy intake. This is due
to increased purchasing power and availability of high fat, energy-dense foods, along with a
reduction in energy expenditure from urbanisation and mechanisation (Misra & Shrivastava
2013; Misra, Sharma, Gulati, Joshi, Sharma, Ghafoorunissa, Ibrahim, Joshi, Laxmaiah,
Kurpad, Raj, Mohan, Chandalia, Krishnaswamy, Boindala, Gopalan, Bhattiprolu, Modi,
Vikram, Makkar, Mathur, Dey, Vasudevan, Gupta, Puri, Joshi, Khanna, Mathur,
Krishnaswamy, Madan, Karmarkar, Seth, Passi, Chadha, Bhardwaj & National Dietary
Guidelines Consensus Group 2011). Along with the increase in overweight and obesity, the
escalation in metabolic syndrome and T2DM in India has reached epidemic proportions (Gulati
& Misra 2014). The ICMR-INDIAB (2015) study found that the increase in obesity prevalence
was not restricted to urban areas, but was also noted in rural areas of India. This suggests a
further rise in obesity prevalence due to urbanisation (Pradeepa et al 2015).
2.5 Management of diabetes mellitus
Medical therapy, physical activity, medical nutrition therapy, psychological and social therapy
and self-management form part of the management of diabetes mellitus. This is discussed
further in this section.
2.5.1 Medical therapy
Historically, the management of high blood sugar levels (hyperglycaemia) has been the focus
of treatment for T2DM. Research and therapy has also focused on other corresponding
features, such as dyslipidaemia, hypertension, hypercoagulability, obesity and insulin
resistance (Nathan, Buse, Davidson, Ferrannini, Holman, Sherwin & Zinman 2009). The ADA
Position Statement (2011) goal of lowering HbA1c to below or around 7%, has been shown to
reduce microvascular and neuropathic complications associated with diabetes. If implemented
soon after the diagnosis of diabetes, it is associated with a long-term reduction in
macrovascular disease. Therefore, a reasonable HbA1c goal for many non-pregnant diabetic
adults is 7% (ADA 2011). This goal was reconfirmed in the ADA Position Statement of 2017
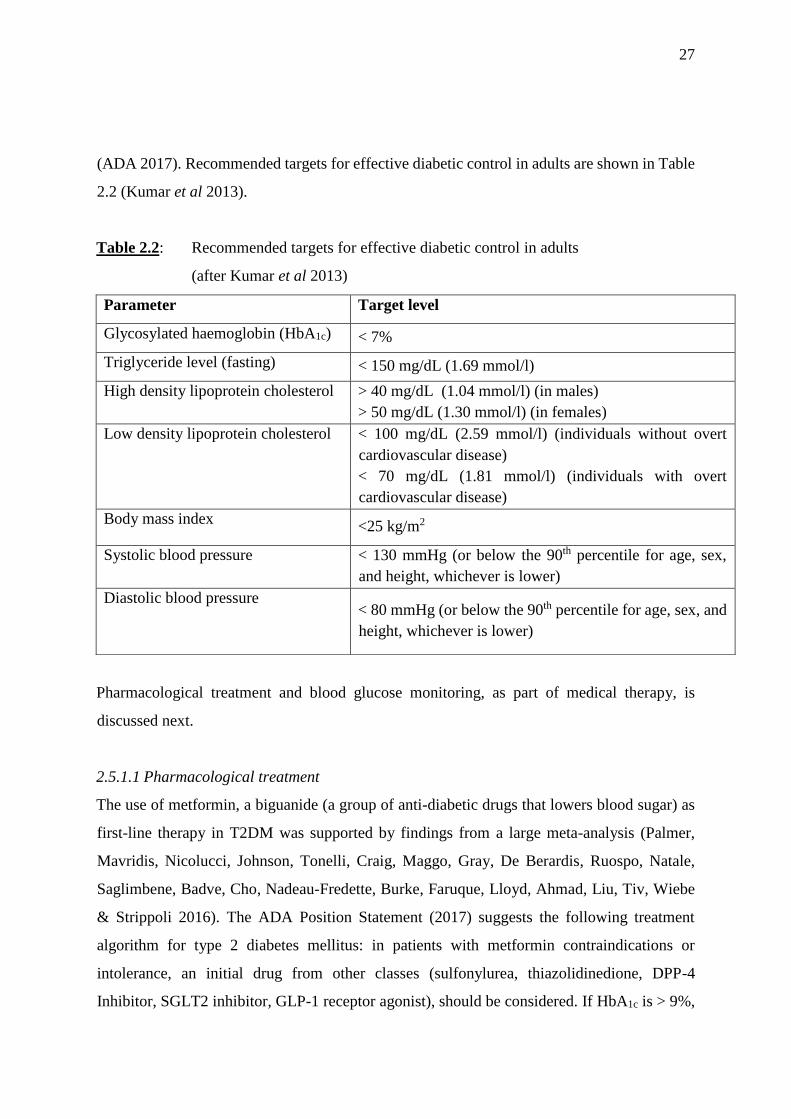
27
(ADA 2017). Recommended targets for effective diabetic control in adults are shown in Table
2.2 (Kumar et al 2013).
Table 2.2: Recommended targets for effective diabetic control in adults
(after Kumar et al 2013)
Pharmacological treatment and blood glucose monitoring, as part of medical therapy, is
discussed next.
2.5.1.1 Pharmacological treatment
The use of metformin, a biguanide (a group of anti-diabetic drugs that lowers blood sugar) as
first-line therapy in T2DM was supported by findings from a large meta-analysis (Palmer,
Mavridis, Nicolucci, Johnson, Tonelli, Craig, Maggo, Gray, De Berardis, Ruospo, Natale,
Saglimbene, Badve, Cho, Nadeau-Fredette, Burke, Faruque, Lloyd, Ahmad, Liu, Tiv, Wiebe
& Strippoli 2016). The ADA Position Statement (2017) suggests the following treatment
algorithm for type 2 diabetes mellitus: in patients with metformin contraindications or
intolerance, an initial drug from other classes (sulfonylurea, thiazolidinedione, DPP-4
Inhibitor, SGLT2 inhibitor, GLP-1 receptor agonist), should be considered. If HbA1c is > 9%,
Parameter Target level
Glycosylated haemoglobin (HbA1c) < 7%
Triglyceride level (fasting) < 150 mg/dL (1.69 mmol/l)
High density lipoprotein cholesterol > 40 mg/dL (1.04 mmol/l) (in males)
> 50 mg/dL (1.30 mmol/l) (in females)
Low density lipoprotein cholesterol < 100 mg/dL (2.59 mmol/l) (individuals without overt
cardiovascular disease)
< 70 mg/dL (1.81 mmol/l) (individuals with overt
cardiovascular disease)
Body mass index <25 kg/m2
Systolic blood pressure < 130 mmHg (or below the 90th percentile for age, sex,
and height, whichever is lower)
Diastolic blood pressure < 80 mmHg (or below the 90th percentile for age, sex, and
height, whichever is lower)
28
(75 mmol/ml), dual combination therapy (combining drugs) should be considered to achieve
the target HbA1c level quicker (ADA 2017).
When these combination methods are ineffective and hyperglycaemia is severe, insulin should
be considered as part of any combination regimen. Severe hyperglycaemia is seen when
symptoms of any catabolic features (weight loss and ketosis) are present. Thereafter,
combination insulin injectable therapy should be considered when blood glucose is >300
mg/dL (16.7 mmol/L) or HbA1c is >10%, or if the patient has symptoms of hyperglycaemia
(i.e., polyuria or polydipsia) (ADA 2017).
2.5.1.2 Blood glucose monitoring
Blood glucose monitoring has developed from doubtful methods like urine testing to
colorimetric blood glucose strips. Later, glucose sensors and manually calibrated glucometers
were used. In the present modern era, auto-calibrated accurate glucometers with biosensors for
self-monitored blood glucose (SMBG) are available. Estimation of HbA1c remains the gold
standard for glucose monitoring (Khadilkar, Bandgar, Shivane, Lila & Shah 2013).
Glycosylated haemoglobin reflects average blood glucose levels over approximately three
months and has a strong predictive value for diabetes complications (ADA 2017). The
frequency of HbA1c testing should depend on the clinical situation, the treatment regimen and
the clinician’s judgment. The use of point-of-care HbA1c testing may provide an opportunity
for more timely treatment changes during encounters between patients and HCPs. Patients with
T2DM with stable glycaemia well within target, may only require HbA1c testing twice a year
(ADA 2017).
Two studies from the Indian subcontinent have shown racial and ethnic differences in HbA1c
levels. Kumar, Bhansali, Ravikiran, Bhansali, Dutta, Thakur, Sachdeva, Bhadada & Walia
(2010), in a regional study from North India, showed that use of the ADA cut-offs for HbA1c
in the Indian population, resulted in 38% of the patients being underdiagnosed for diabetes.
Kumar et al (2010) proposed an HbA1c cut-off of 6.1% for the Indian population, which was
also validated in a similar study from South India (Mohan, Vijayachandrika, Gokulakrishnan,
Anjana, Ganesan, Weber & Narayan 2010).
29
Self-monitoring of blood glucose (SMBG) is the easiest and the most widely used method of
short-term glucose monitoring, worldwide. Finger stick glucose testing using a glucometer is
the prototype of SMBG. These points of care devices have transformed the concept of glucose
monitoring at home (Khadilkar et al 2013). However, there is contradictory evidence on the
clinical benefits of SMBG for patients with T2DM, who are not on insulin therapy. Positive
effects include decreased hospital admissions and morbidity (Burge 2001). Negative results
include no improvement in glycaemic control because the glycaemic control is not constant
(Farmer, Wade, French, Simon, Yudkin, Gray, Craven, Goyde, Holman, Mant, Kinmonth, Neil
& DiGEM Trial Group 2009). A nocebo effect has also been described by a few studies, which
showed that SMBG in patients with T2DM resulted in increased anxiety and depression
(Fisher, Polonsky, Parkin, Jelsovsky, Amstutz & Wagner 2011). There is also uncertainty
about the optimal frequency and timing of self-monitoring (Hawkins 2010).
Although SMBG is an important monitoring tool to help patients reach their ideal HbA1c levels,
a Chennai-based study found that there was inadequate training and knowledge of SBMG in
75.8% of patients (Krishnan & Thirunavukkarasu 2016). In India, health systems have not been
able to effectively manage diabetes and this is reflected in the number of people with diabetes
(50-60%), who do not achieve the glycaemic target of HbA1c < 7% (Wangnoo et al 2013).
2.5.2 Physical activity
Aerobic exercise is defined as any physical exercise that requires additional effort by the heart
and lungs to meet the skeletal muscles increased demand for oxygen. Aerobic exercise
increases the breathing rate and ultimately raises the heart and lung efficiency. Prolonged
aerobic exercise (at least 20 minutes three times per week) is recommended for the
maintenance of a healthy cardiovascular system. Examples of aerobic exercise include
running, jogging, swimming and vigorous dancing or cycling (Anderson et al 2002, p50).
The ADA Position Statement on Physical Activity and Diabetes (2004) describes the effect of
exercise on insulin. According to this position statement, during the course of physical activity,
whole-body oxygen consumption may increase by as much as 20-fold and larger escalations
may occur in the working muscles. As a result, skeletal muscles use its own stores of glycogen
30
and triglycerides as well as free fatty acids (FFAs) derived from the breakdown of adipose
tissue triglycerides and glucose released from the liver, to meet its energy needs under these
circumstances (ADA 2004).
In type 1 diabetics, an unnecessary release of counter insulin hormones during physical activity
may escalate already high levels of glucose and ketone bodies, and may cause diabetic
ketoacidosis. Consequently, insulin increases due to exogenous insulin administration can
diminish or even thwart the raised deployment of glucose and other substrates caused by
physical activity, and hypoglycaemia may occur. Similarly, these fears exist in patients with
type 2 diabetes on insulin or sulfonylurea therapy. Generally, hypoglycaemia during physical
activity tends to be less problematic in this group. Undeniably, physical activity may improve
insulin sensitivity and reduce blood glucose levels into the normal range for type 2 diabetics
(ADA 2004).
According to the American College of Sports Medicine and the American Diabetes
Association, persons with type 2 diabetes should undertake at least 150 minutes/week (2.5
hours/week) of moderate to vigorous aerobic exercise, spread out during at least three days
during the week, with no more than two consecutive days between bouts of aerobic activity
(Colberg et al 2010). Van Dijk et al (2012) concluded that a short 30-minute session of
moderate-intensity endurance-type exercise substantially reduces the prevalence of
hyperglycaemia, throughout the subsequent day in type 2 diabetic patients. Hereby, frequent
short spells of exercise are equally effective in improving glycaemic control as less frequent
exercise spells of a longer duration. Therefore, the total amount of work done seems to be of
key importance with respect to glycaemic control (Van Dijk et al 2012).
Evidence from 12 randomised control tests using 864 patients, suggests that yoga can
significantly decrease full blood glucose (FBG), post prandial blood glucose (PPBG), HbA1c,
total cholesterol (TC) and LDL-C levels and increase HDL-C levels (Cui, Yan, Yan, Pan, Le
& Guo 2017). In the Indian subcontinent, 1292 subjects with diagnosed T2DM and pre-
diabetes were recruited from different states of India (Karnataka, Maharashtra, Gujarat,
Rajasthan, and Tamil Nadu), for a yoga-based lifestyle intervention, introduced through 10-
31
day non-residential camps. A statistically significant decrease in baseline values for FBG,
PPBG, HbA1c, TC and LDL-C levels and post intervention assessments (first day and tenth
day respectively), and increased HDL-C were noted (Cui et al 2017). According to Colberg et
al (2010), both aerobic and resistance training improve insulin action, at least acutely, and can
assist with the management of blood glucose levels, lipids, blood pressure, cardiovascular
disease risk, mortality and quality of life; however, exercise must be undertaken regularly to
have continued benefits (Colberg et al 2010).
2.5.3 Medical nutrition therapy
For persons with diabetes, the most perplexing part of the treatment plan is determining what
to eat. Most medical nutrition therapy guidelines prescribe to the ADA position; that is there
is no “one-size-fits-all” eating pattern for people with diabetes. The ADA and European
Association for the Study of Diabetes (EASD) also recognise the vital role of nutrition therapy
in overall diabetes management. It is recommended that each person with diabetes should
practice self-management and be engaged in education and treatment planning with the health
care provider. It is also suggested that a personalised eating plan be developed along with
encouraging the consumption of healthy foods that are consistent with the prevailing
population-wide dietary recommendations. The eating plan should also be in line with an
individual’s preferences and culture (Inzucchi, Bergenstal, Buse, Diamant, Ferrannini, Nauck,
Peters, Tsapas, Wender & Matthews 2012).
The ADA Position Statement (2017) states that, “all individuals with diabetes should receive
individualized medical nutrition therapy (MNT), preferably provided by a registered dietician
who is knowledgeable and skilled in providing diabetes-specific MNT.” Medical nutrition
therapy delivered by a registered dietician is associated with HbA1c decreases of 0.5–2% for
people with type 2 diabetes (Coppell, Kataoka, Williams, Chisholm, Vorgers & Mann 2010;
Wolf, Conaway, Crowther, Hazen, Nadler, Oneida & Bovbjerg 2004; Ziemer, Berkowitz,
Panayioto, El-Kebbi, Musey, Anderson, Wanko, Fowke, Brazier, Dunbar, Slocum, Bacha,
Gallina, Cook & Phillips 2003; King, Peacock & Donnelly 1999).
32
Nutrition therapy guidelines for adult diabetics from the ADA (2017) is shown in Table 2.3. It
outlines the quantity and frequency of the intake of all macronutrients, sodium,
supplementation and sugar. Table 2.4 shows the dietary guidelines for diabetes from the ICMR
(2005) and Table 2.5 shows diabetic dietary guidelines from the National Dietary Guidelines
Consensus Group in India (Misra et al 2011).
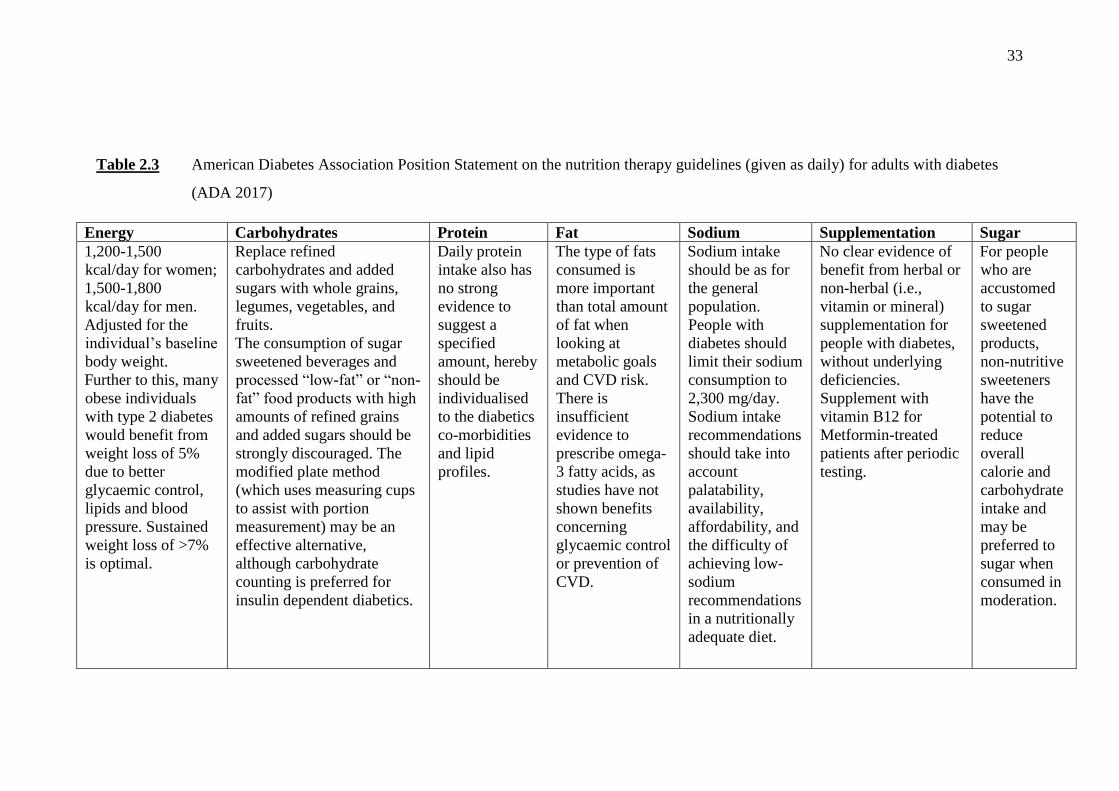
33
Table 2.3 American Diabetes Association Position Statement on the nutrition therapy guidelines (given as daily) for adults with diabetes
(ADA 2017)
Energy Carbohydrates Protein Fat Sodium Supplementation Sugar
1,200-1,500
kcal/day for women;
1,500-1,800
kcal/day for men.
Adjusted for the
individual’s baseline
body weight.
Further to this, many
obese individuals
with type 2 diabetes
would benefit from
weight loss of 5%
due to better
glycaemic control,
lipids and blood
pressure. Sustained
weight loss of >7%
is optimal.
Replace refined
carbohydrates and added
sugars with whole grains,
legumes, vegetables, and
fruits.
The consumption of sugar
sweetened beverages and
processed “low-fat” or “non-
fat” food products with high
amounts of refined grains
and added sugars should be
strongly discouraged. The
modified plate method
(which uses measuring cups
to assist with portion
measurement) may be an
effective alternative,
although carbohydrate
counting is preferred for
insulin dependent diabetics.
Daily protein
intake also has
no strong
evidence to
suggest a
specified
amount, hereby
should be
individualised
to the diabetics
co-morbidities
and lipid
profiles.
The type of fats
consumed is
more important
than total amount
of fat when
looking at
metabolic goals
and CVD risk.
There is
insufficient
evidence to
prescribe omega-
3 fatty acids, as
studies have not
shown benefits
concerning
glycaemic control
or prevention of
CVD.
Sodium intake
should be as for
the general
population.
People with
diabetes should
limit their sodium
consumption to
2,300 mg/day.
Sodium intake
recommendations
should take into
account
palatability,
availability,
affordability, and
the difficulty of
achieving low-
sodium
recommendations
in a nutritionally
adequate diet.
No clear evidence of
benefit from herbal or
non-herbal (i.e.,
vitamin or mineral)
supplementation for
people with diabetes,
without underlying
deficiencies.
Supplement with
vitamin B12 for
Metformin-treated
patients after periodic
testing.
For people
who are
accustomed
to sugar
sweetened
products,
non-nutritive
sweeteners
have the
potential to
reduce
overall
calorie and
carbohydrate
intake and
may be
preferred to
sugar when
consumed in
moderation.
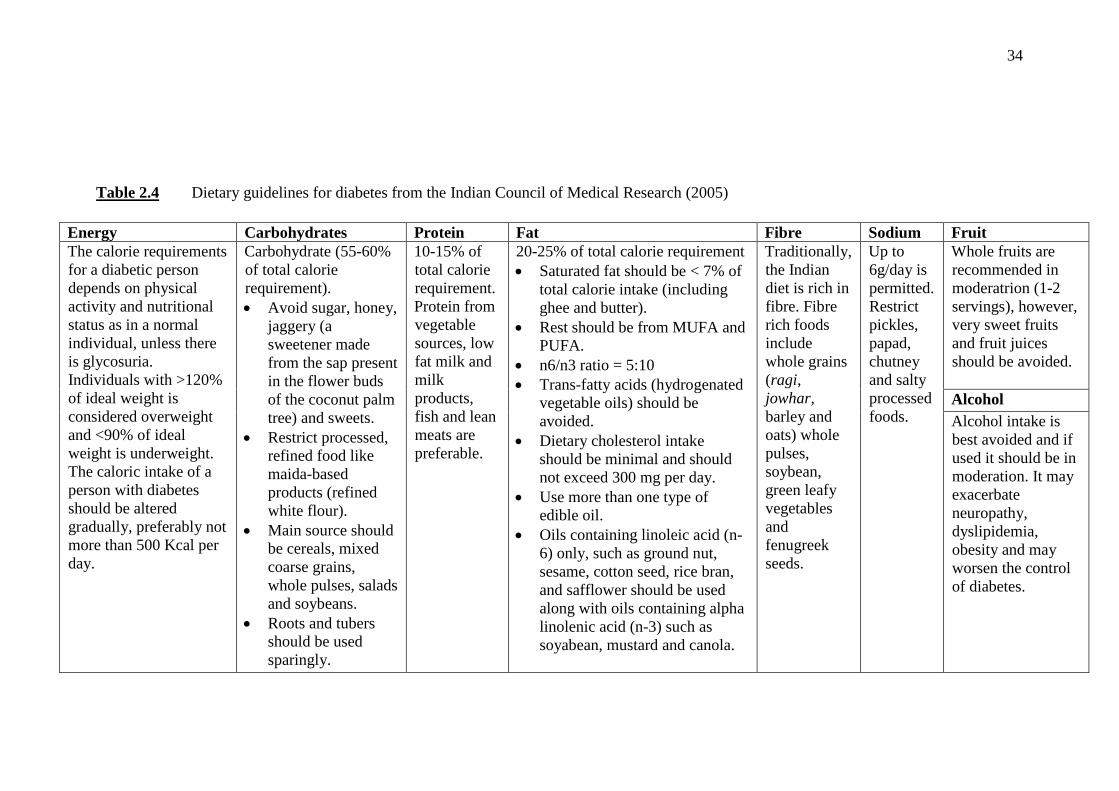
34
Table 2.4 Dietary guidelines for diabetes from the Indian Council of Medical Research (2005)
Energy Carbohydrates Protein Fat Fibre Sodium Fruit
The calorie requirements
for a diabetic person
depends on physical
activity and nutritional
status as in a normal
individual, unless there
is glycosuria.
Individuals with >120%
of ideal weight is
considered overweight
and <90% of ideal
weight is underweight.
The caloric intake of a
person with diabetes
should be altered
gradually, preferably not
more than 500 Kcal per
day.
Carbohydrate (55-60%
of total calorie
requirement).
Avoid sugar, honey,
jaggery (a
sweetener made
from the sap present
in the flower buds
of the coconut palm
tree) and sweets.
Restrict processed,
refined food like
maida-based
products (refined
white flour).
Main source should
be cereals, mixed
coarse grains,
whole pulses, salads
and soybeans.
Roots and tubers
should be used
sparingly.
10-15% of
total calorie
requirement.
Protein from
vegetable
sources, low
fat milk and
milk
products,
fish and lean
meats are
preferable.
20-25% of total calorie requirement
Saturated fat should be < 7% of
total calorie intake (including
ghee and butter).
Rest should be from MUFA and
PUFA.
n6/n3 ratio = 5:10
Trans-fatty acids (hydrogenated
vegetable oils) should be
avoided.
Dietary cholesterol intake
should be minimal and should
not exceed 300 mg per day.
Use more than one type of
edible oil.
Oils containing linoleic acid (n-
6) only, such as ground nut,
sesame, cotton seed, rice bran,
and safflower should be used
along with oils containing alpha
linolenic acid (n-3) such as
soyabean, mustard and canola.
Traditionally,
the Indian
diet is rich in
fibre. Fibre
rich foods
include
whole grains
(ragi,
jowhar,
barley and
oats) whole
pulses,
soybean,
green leafy
vegetables
and
fenugreek
seeds.
Up to
6g/day is
permitted.
Restrict
pickles,
papad,
chutney
and salty
processed
foods.
Whole fruits are
recommended in
moderatrion (1-2
servings), however,
very sweet fruits
and fruit juices
should be avoided.
Alcohol
Alcohol intake is
best avoided and if
used it should be in
moderation. It may
exacerbate
neuropathy,
dyslipidemia,
obesity and may
worsen the control
of diabetes.
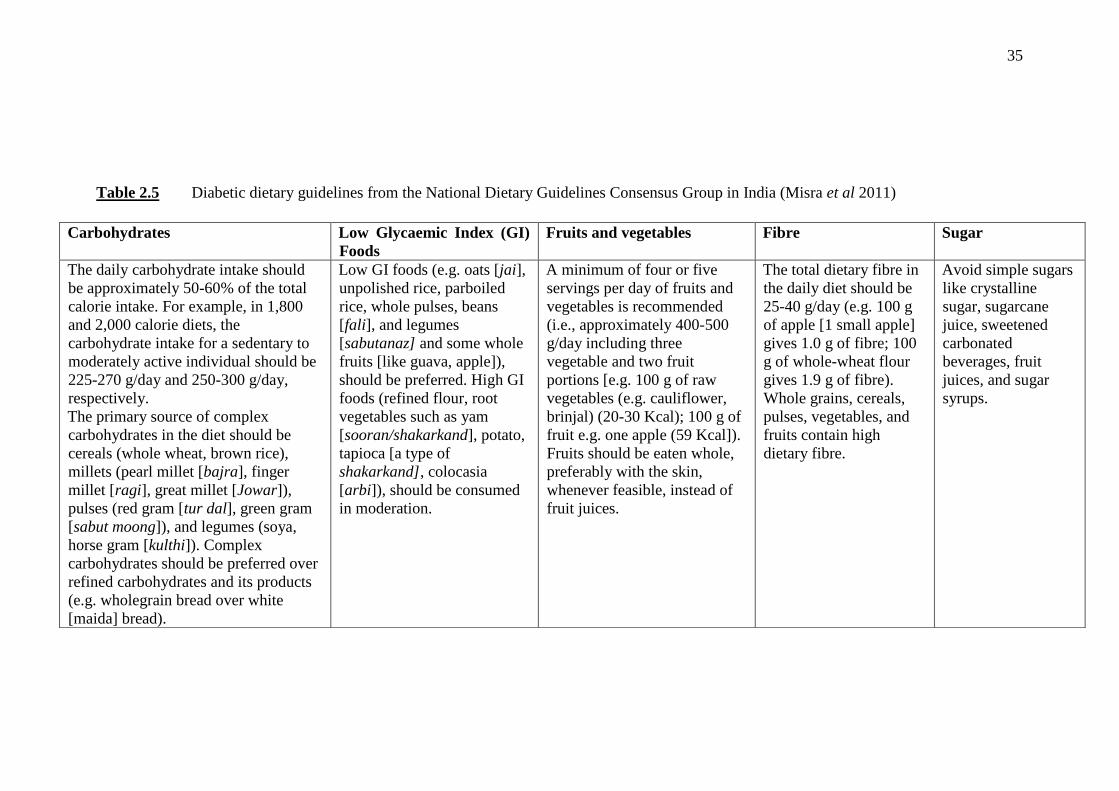
35
Table 2.5 Diabetic dietary guidelines from the National Dietary Guidelines Consensus Group in India (Misra et al 2011)
Carbohydrates Low Glycaemic Index (GI)
Foods
Fruits and vegetables Fibre Sugar
The daily carbohydrate intake should
be approximately 50-60% of the total
calorie intake. For example, in 1,800
and 2,000 calorie diets, the
carbohydrate intake for a sedentary to
moderately active individual should be
225-270 g/day and 250-300 g/day,
respectively.
The primary source of complex
carbohydrates in the diet should be
cereals (whole wheat, brown rice),
millets (pearl millet [bajra], finger
millet [ragi], great millet [Jowar]),
pulses (red gram [tur dal], green gram
[sabut moong]), and legumes (soya,
horse gram [kulthi]). Complex
carbohydrates should be preferred over
refined carbohydrates and its products
(e.g. wholegrain bread over white
[maida] bread).
Low GI foods (e.g. oats [jai],
unpolished rice, parboiled
rice, whole pulses, beans
[fali], and legumes
[sabutanaz] and some whole
fruits [like guava, apple]),
should be preferred. High GI
foods (refined flour, root
vegetables such as yam
[sooran/shakarkand], potato,
tapioca [a type of
shakarkand], colocasia
[arbi]), should be consumed
in moderation.
A minimum of four or five
servings per day of fruits and
vegetables is recommended
(i.e., approximately 400-500
g/day including three
vegetable and two fruit
portions [e.g. 100 g of raw
vegetables (e.g. cauliflower,
brinjal) (20-30 Kcal); 100 g of
fruit e.g. one apple (59 Kcal]).
Fruits should be eaten whole,
preferably with the skin,
whenever feasible, instead of
fruit juices.
The total dietary fibre in
the daily diet should be
25-40 g/day (e.g. 100 g
of apple [1 small apple]
gives 1.0 g of fibre; 100
g of whole-wheat flour
gives 1.9 g of fibre).
Whole grains, cereals,
pulses, vegetables, and
fruits contain high
dietary fibre.
Avoid simple sugars
like crystalline
sugar, sugarcane
juice, sweetened
carbonated
beverages, fruit
juices, and sugar
syrups.
36
2.5.4 Psychological and social therapy
Thomas Willis, who claimed that diabetes was caused by “extreme sorrow”, first noted the
importance of emotional issues in diabetes over 300 years ago, in 1674. It has been emphasised
that there is more to diabetes than just glucose control, and emotions play an important role in
diabetes (Kalra, Sridhar, Balhara, Sahay, Bantwal, Baruah, John, Unnikrishnan, Madhu,
Verma, Sreedevi, Shukla & Kumar 2013). Both type 1 and type 2 diabetes mellitus are
emotionally and cognitively demanding diseases that place patients at risk for a variety of
psychological conditions. The burden of depression and other psychological conditions has
increased globally and there is an acute need to better understand and intervene on the interplay
between psychological conditions and diabetes (De Groot et al 2016).
Depression and diabetes may be associated with behavioural or biological pathways. Adverse
health behaviours linked with depression, such as a sedentary lifestyle, poor diet, smoking and
non-adherence to treatment recommendations and self-care may influence diabetes and its
complications. Biological pathways include hormonal abnormalities, alterations in glucose
transport function and increased immuno-inflammatory activation (Kalra et al 2013). In the
cross-sectional DAWN study conducted in 2004 in over 13 countries, researchers found that
psychosocial problems were common among diabetic patients globally (Peyrot et al 2005). In
the DAWN-2 study the number of Indian participants with depression was below average,
while the number with high diabetes distress was higher than average. Indian diabetics scored
third highest on the WHO-5 psychological well being scale, after Mexico and Denmark (Holt
& Kalra 2013).
Interestingly, even though India has 69.2 million diabetics, diabetic Indian family members
have the lowest prevalence of likely depression and third best pyschological well-being. This
could be because India has the largest proportion of family members (59.5%) willing to be
more involved in diabetes care and second highest (57.5%) willing to be involved in helping
people with diabetes deal with their feelings about diabetes (Nicolucci et al 2013). Indian
diabetic psychosocial problems differ greatly from those encountered in western culture. A
few of the important factors that effects diabetes management, in India, include economic and
cultural factors as well as traditional medicine (Kalra et al 2013).
37
2.5.5 Self-management
According to the ADA Position Statement on diabetes management (2017), lifestyle
management is an essential aspect of diabetes care and includes diabetes self-management
education (DSME), diabetes self-management support (DSMS), nutrition therapy, physical
activity, smoking cessation counselling and psychosocial care. Patients, health and home care
providers should focus together on how to optimise lifestyle from the time of the first medical
assessment and throughout all the ensuing medical evaluations and follow-ups, to improve
diabetes care (ADA 2017). Funnel et al (2011) describes DSME as the ongoing process of
facilitating the knowledge, skill, and ability necessary for diabetes self-care. This process
incorporates the needs, goals and life experiences of the person with diabetes and is guided by
evidence-based standards (Funnel et al 2011)
A systematic review of the literature from 1980 to 2001, found eight publications that tested
the effects of modification of provider-patient interaction and provider consulting style on
patient diabetes self-care and diabetes outcomes, in general practice or hospital outpatient
settings. The review found that patient behaviour focused interventions showed good efficacy
and efficiency and improved patient self-care and diabetes outcomes. Patient-centred was more
difficult to sustain, required intensive support and was not very effective in improving patient
self-care and health outcomes, when executed alone (Van Dam, van der Horst, van den Borne,
Ryckman & Crebolder 2003).
Despite the advances in diabetes management, the self-management activities of diabetes
remain intricate, with difficulties experienced in incorporating treatment recommendations
into the current lifestyles of diabetics (Odegard & Capoccia 2007). According to Kadirvelu,
Sadasivan & Shu Hui Ng (2012), the empowerment approach to diabetes care recognises the
patient as the source of control. This means that the patient has the responsibility for decision-
making and action in their day-to-day management of the condition. This would call for a
change in the management approach from a physician-centred model to a proactive patient-
centred model, as shown in Figure 2.1. This implies that patients need to adopt behaviours that
help them engage in the process of actively self-managing their diabetes (Kadirvelu et al 2012).
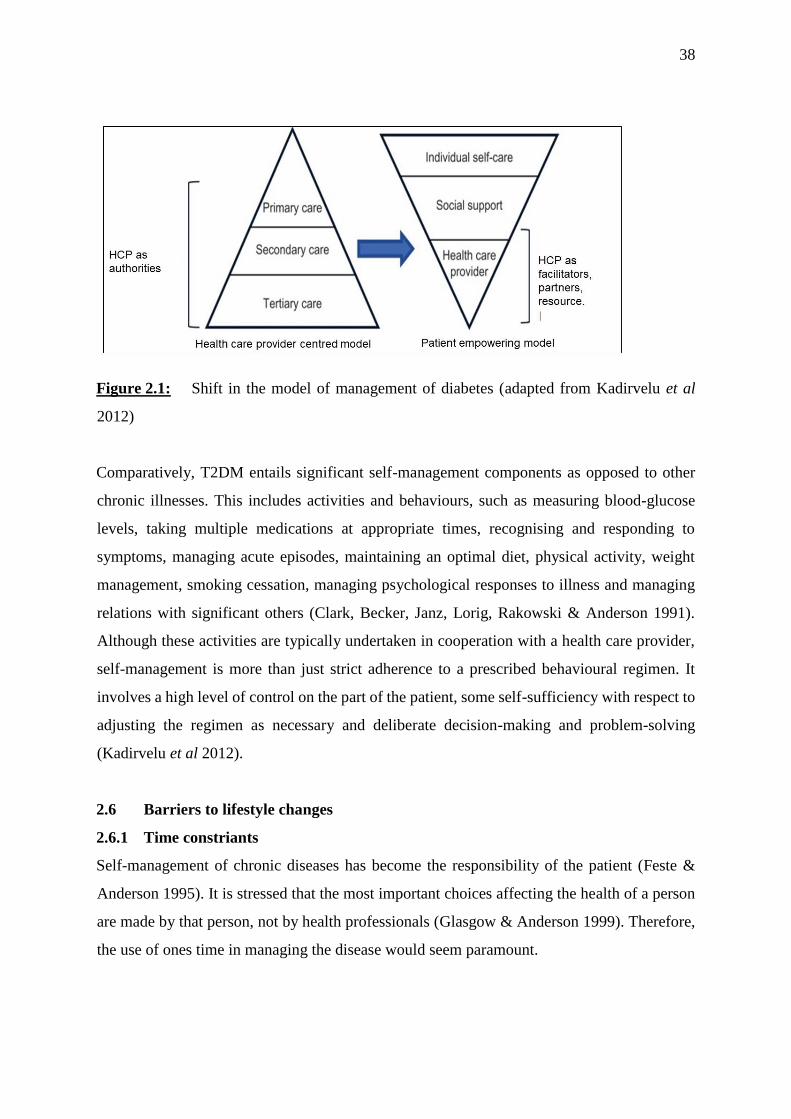
38
Figure 2.1: Shift in the model of management of diabetes (adapted from Kadirvelu et al
2012)
Comparatively, T2DM entails significant self-management components as opposed to other
chronic illnesses. This includes activities and behaviours, such as measuring blood-glucose
levels, taking multiple medications at appropriate times, recognising and responding to
symptoms, managing acute episodes, maintaining an optimal diet, physical activity, weight
management, smoking cessation, managing psychological responses to illness and managing
relations with significant others (Clark, Becker, Janz, Lorig, Rakowski & Anderson 1991).
Although these activities are typically undertaken in cooperation with a health care provider,
self-management is more than just strict adherence to a prescribed behavioural regimen. It
involves a high level of control on the part of the patient, some self-sufficiency with respect to
adjusting the regimen as necessary and deliberate decision-making and problem-solving
(Kadirvelu et al 2012).
2.6 Barriers to lifestyle changes
2.6.1 Time constriants
Self-management of chronic diseases has become the responsibility of the patient (Feste &
Anderson 1995). It is stressed that the most important choices affecting the health of a person
are made by that person, not by health professionals (Glasgow & Anderson 1999). Therefore,
the use of ones time in managing the disease would seem paramount.
39
A review article by Yuncken (2014), found that both practitioners and patients alike cited
inadequate time for appointments and assessments, as one of the barriers to lifestyle changes
(Yuncken 2014). In a study conducted in Portland, USA, LeBlanc et al (2014), found that the
most common care setting issue was a lack of provider time to care for complex patients
(LeBlanc et al 2014). Kapur et al (2008), reported that 30% of physicians found time for one
on one discussions with patients and the maximum time spent on one patient was only ten
minutes (Kapur et al 2008).
AlQuaiz & Tayel (2009) showed that a lack of time was reported by more than two thirds
(67.6%) of the study group, as a barrier to following a healthy diet. Further to this, age was
inversely associated with a lack of time, wherein the younger age group reported a lack of time,
more frequently (AlQuaiz & Tayel 2009). A lack of time was the most frequently (24%)
mentioned barrier to adherence to a healthy diet in a European study (Lappalainen, Saba, Holm,
Mykkanen, Gibney & Moles 1997).
In a study conducted in over 27 centres in the USA, 50% of the 1076 patients mentioned that
the most common barrier to physical activity was time management (Venditti, Wylie-Rosett,
Delahanty, Mele, Hoskin & Edelstein 2014). In a study conducted in Hawaii, participants
acknowledged limited time as a barrier to diabetes management. Participants mostly reported
time limitations and balancing family and work responsibilities as their barriers to lifestyle
changes. Patients also indicated that they had limited time to exercise (Fukunaga et al 2011).
Currently, there seems to be no other studies in India exploring the effect of time contraints on
patients, however, it is assumed that this would also be a barrier as it affects diabetics globally.
2.6.2 Lack of counselling or information
Diabetics generally have a poor knowledge of diabetes care and there is usually no consistency
in the way information is delivered to them (Wint et al 2006). Patients’ lack of knowledge
about diabetes can hinder their ability to manage their disease. Several studies have
investigated the awareness levels of diabetes among both patients and HCPs. The CURES
study in urban Chennai, Tamil Nadu reported that nearly 25% of the population was unaware
of diabetes, and only 22.2% of the population and 41% of known diabetic subjects felt that
diabetes could be prevented (Mohan et al 2005). Futher to this, the knowledge of risk factors
of diabetes was even lower, with only 11.9% of study subjects reporting obesity and physical
40
inactivity as risk factors; 23% knew that diabetes could lead to foot problems; and only 5.8%
knew it could cause a heart attack (Mohan et al 2005). Another population-based study in
Chennai, Tamil Nadu reported that only 41% of adult Indians over 20 years old were aware of
the risks associated with diabetes and almost all diabetic patients (92.3%) sought the help of a
general practitioner for treatment, instead of a diabetic specialist (Murugesan, Snehalatha,
Shobhana, Roglic & Ramachandran 2007).
In Jamaica, a lack of education was one of the factors contributing to poor control of DM
(Wilks, Sargeant, Gulliford, Reid & Forrester 2001). Another study in Jamaica found that the
main source of information was the physician (62.4%) and knowledge scores were inversely
associated with age, but positively associated with time since diagnosis. Forty seven percent
of patients did not know the meaning of the word “diabetes” and 18% believed that diabetes
was curable. Seventy one percent (94 out of 133 patients) reported the need for more education
(Wint et al 2006). A case-control study in Italy found that patients who did not receive any
form of educational intervention, had a fourfold increased risk of developing complications,
analysed by multivariate logistic regression analysis (Nicolucci, Cavaliere, Scorpiglione,
Carinci, Capani, Tognoni & Benedetti 1996). Patient education is a fundamental prerequisite
for diabetes self-management (Assal, Jacquemet & Morel 1997; Anderson, Funnell, Butler,
Arnold, Fitzgerald & Feste 1995). It is important that both physicians and diabetes educators
provide unequivocal and consistent information, with a view to modifying patient perceptions,
attitudes and behaviour (Van den Arend, Stolk, Krans, Grobbee & Schrijvers 2000).
2.6.3 Lack of support from family, work and health care workers
For many diabetics, the day-to-day management of their condition can be overwhelming (Clark
2008). Studies have shown that subjects diagnosed with diabetes experience psychosocial
challenges that can have significant effects on their lives (Peyrot & Rubin 1997). While social
support is mostly a positive resource, clinicians need to be aware of potential negative effects
that may inhibit self-care behaviour and undermine self-management goals (Gallant 2007). In
most instances, support from family and friends is freely given, but there is a tendency for this
to be provided principally during the acute stages of a disease, i.e., when the disease is initially
diagnosed, when there is poor progression of diabetes, or when the person is terminally ill.
41
However, this tends to reduce when the disease continues over an extended period. A
qualitative study indicated that patients may feel criticised, nagged or guilty about receiving
help from family members (Carter-Edwards, Skelly, Cagle & Appel 2004). Poorly executed
family support, where they do not undertake illness-care tasks on the patient’s behalf, can lead
to worse patient outcomes (Franks, Stephens, Rook, Franklin, Keteyian & Artinian 2006;
Beanlands, Horsburgh, Fox, Howe, Locking-Cusolito, Pare & Thrasher 2005). Family barriers
to self-care could particularly affect younger, more functional patients, who are often trying to
juggle multiple active family roles themselves (e.g. parent, child, and spouse) (Samuel-Hodge,
Headen, Skelly, Ingram, Keyserling, Jackson, Ammerman & Elasy 2000).
The DAWN study investigated the quality-of-life, psychological well-being, likelihood of
depression and diabetes distress in family members living with people with diabetes. The study
found that 6.9-13.6% of family members reported a “poor” or “very poor” quality-of-life, while
8.0-16.2% reported a WHO-5 score of ≤ 28, indicative of likely depression. Indian family
members had the lowest prevalence of likely depression and scored third best in terms of
psychological well-being (Kovacs Burns et al 2013).
An evaluation of social support in 249 diabetics with a disease duration of around five years,
found that more than 60% of spouses of patients believed that the disease could be managed
effectively. However, 65% of spouses felt that the problem of diabetes was minor and required
minimal support. More than 60% of children felt that their parents were normal (Sridhar &
Madhu 2002). Family members, peers and HCPs are important sources of interpersonal
influence that can either increase or decrease the commitment to, and engagement in health
promoting behaviour (Pender 2001, pp 59-78).
2.6.4. Lack of motivation
Motivation can be defined as the processes that accounts for an individual’s intensity, direction
and persistence of effort toward attaining a goal (Robbins 1996, p210). According to Borra et
al (2001), consumers are motivated by two potentially conflicting needs, clear information that
propels them to take action and for the power to make their own choices. In most cases
motivation stems from a need which must be fulfilled, and this in turn leads to a specific
42
behaviour. Fulfilment of needs results in some type of reward, which can be either intrinsic or
extrinsic. The former is derived from within the individual, e.g. taking pride and feeling good
about accomplishing a goal, whereas the latter relates to rewards given by another person
(Buchbinder & Shanks 2007, pp 49-71).
The trans-theoretical model of Prochaska, Redding & Evers (2002, pp 1102-1114), provides a
cognitive measure of motivation to change. This model integrates key constructs into a
comprehensive theory of change that can be applied to a variety of behaviours, populations
and settings. It consists of a five-option forced-choice question, with response options
reflecting five dimensions: (a) pre-contemplation, (b) contemplation; (c) preparation (d)
action; (e) maintenance (Prochaska et al 2002). Centis et al (2014), studied 1353 Italian
outpatients with T2DM attending 14 tertiary centres. Patients completed a validated
questionnaire, consisting of two corresponding sets of instruments to define the stage of change
for healthy diet (HD) and healthy physical activity (HPA), respectively (Centis et al 2014).
The stage of change favouring progress to healthier behaviours was more common with regard
to HD than to HPA, with higher scores in action and maintenance. Differences were observed
in relation to gender (males scored higher in maintenance than females in both HD and HPA),
age (younger were more willing to change or take action) and duration of disease (longer
duration of disease was less likely to change their diet or physical activity). Further to this,
resistance to change toward HD was associated with a higher BMI, while resistance to improve
HPA increased with BMI and decreased with education level (Centis et al 2014).
Wint et al (2006) found that even though many subjects were aware of the complications of
DM, few were motivated to make lifestyle changes by the perceived risk or by the actual
experience of complications. However, some were motivated by a desire to follow their
doctors’ orders (Wint et al 2006). This study found weak motivational factors in diabetics
(Wint et al 2006). In the study by Fukunaga et al (2011), participants mentioned that they
needed social and motivational support, such as frequent support groups or a diabetes “buddy”
(Fukunaga et al 2011).
43
The Impact of Managed Pharmaceutical Care on Resource Utilization and Outcomes in
Veterans Affairs Medical Centers Control Program study in India, showed that even among
patients whose HbA1c values were measured, 53% were not given glycaemic targets. The study
also reported the relaxation of targets as the duration of diabetes increased (Sharma, Seshiah,
Sahay, Das, Rao, Shah, Akhtar & Shetty 2012). The majority of doctors recognised difficulty
in long-term maintenance of HbA1c targets. This may be one of the contributing factors to the
lack of motivation to achieve good glycaemic control by diabetic patients (Joshi 2015).
Interestingly, Tripp-Reimer et al (2001) reported that issues of motivational strategies were
also significant. The use of spiritual and gospel songs as motivation for exercise had positive
results in African-Americans with diabetes (Tripp-Reimer et al 2001). Kalra et al (2017) have
suggested the following national recommendations for India:
a) Physicians should receive formal training in interventions involving motivational
interviewing.
b) Patients should be motivated to initiate or intensify insulin using motivational
approaches.
c) Long-term motivational therapy with suitable follow-up is needed with cognitive
behavioural therapy (CBT), to improve HbA1c levels in poorly controlled patients
(Kalra et al 2017).
2.6.5 Emotional wellbeing
“Emotional well-being encompasses how you feel about yourself, your ability to successfully
manage your feelings as you deal with life's challenges and the quality of your relationships”
(Federal Occupational Health Agency 2017). Emotional balance can contribute greatly to
overall mental and physical health (Federal Occupational Health Agency 2017). The DAWN-
2 study, which surveyed adults with diabetes, adult family members and HCPs, showed that
diabetes remained a major physical and psychological burden for many individuals with
diabetes, in all 17 countries surveyed (Holt & Kalra 2013). Poor emotional well-being is a
good predictor of depression, which affects one-third of patients with T2DM (Krieger,
Zimmermann, Huffziger, Ubl, Diener, Kuehner & Grosse Holtforth 2014; Roy & Lloyd 2012;
De Wit, Pouwer, Gemke, Delemarre-van de Waal & Snoek 2007). Diabetes has been found to
44
have a negative impact on all domains (areas or fields) 5.1.1investigated, including emotional
well-being (46.2%) (Holt & Kalra 2013).
Many health-care professionals felt that people with diabetes needed to improve various self-
management activities, such as dealing with emotions associated with diabetes (63.2%) (Holt
et al 2013). Family members reported that diabetes had a significant negative impact on
emotional well-being (44.6%) (Kovacs Burns et al 2013). Lower scores for emotional well-
being were found in Dutch diabetic patients that were female, unemployed or incapacitated,
with high levels of education, using antidepressants or with macrovascular complications or
diabetic peripheral neuropathy (Hendriks, van Soldt, van Vugt, Groenier, Roelofsen, Maas,
Bilo, Kleefstra & van Hateren 2017). There was a positive, non-clinically relevant relationship
between physical activity and emotional well-being in both men and women (Hendriks et al
2017). In another study in the USA, factors like patient's emotional well-being were associated
with adherence to diabetes medication (Rubin 2005). In some countries, up to a third of health-
care professionals received no formal training in diabetes. Training was mainly deficient in the
psychological aspects, as only 20% of patients had training in this area, while 58% wanted
more training in this area (Holt & Kalra 2013). Psychological support is essential to establish
emotional well-being in diabetics. It should be assessed and provided from the onset of
diagnosis, rather than later (Sridhar 2012, pp 20-36).
2.7 Challenges faced by the diabetic living in India
2.7.1 Urbanisation
According to Goryakin, Rocco & Suhrcke (2017) urbanisation is the process of the population
shifting from rural to urban areas within countries (Goryakin et al 2017). Rapid urbanisation,
which is altering the physical and social habitat of cities, is considered as one of the most
important global health issues of the twenty-first century (WHO/UN-HABITAT 2010, p8).
Results gathered from 173 countries over 28 years, specify that urbanisation appears to have
contributed to an increase in average BMI and cholesterol levels. People living in the least
urbanised countries are also expected to have an up to 2.3kg/m2 lower BMI than those in the
most urbanised ones. Moreover, the least urbanised countries are expected to have a lower
prevalence of diabetes among women. This association is also much stronger in the low and
45
middle-income countries, and is likely to be mediated by energy intake-related variables, such
as calorie and fat supply per capita (Goryakin et al 2017).
The projected increase in diabetes prevalence to 10.1% in 2035 in the South East Asia region
is a consequence of ongoing large-scale urbanisation and increasing life expectancy (Whiting
et al 2011). In India, the proportion of the population aged over 50 years is expected to increase
from 27% to 35% between 2013 and 2035 (IDF Diabetes Atlas 2014). The increasing
prevalence of diabetes in South East Asia can be attributed to a multitude of interrelated
factors, including rapid industrialisation and urbanisation and the ensuing changes in lifestyle
factors (Ramachandran & Snehalatha 2010; Chan, Malik, Jia, Kadowaki, Yajnik, Yoon & Hu
2009). The Asian Indian phenotype and lifestyle changes associated with urbanisation and
sedentary lifestyles have contributed to the rise of diabetes in India (Mohan et al 2007).
Pradeepa & Mohan (2017) reported that rapid socioeconomic transition with urbanisation and
industrialisation are the main causes for the global diabetes epidemic (Pradeepa & Mohan
2017). Misra, Pandey, Devi, Sharma, Vikram & Khanna (2001), reported that migration from
rural areas to urban slums in metropolitan cities in India have contributed to obesity, glucose
intolerance and dyslipidaemia (Misra et al 2001).
Epidemiological studies conducted in India, showed that not only was the prevalence of
diabetes high in urban India, but was also increasing (Ramachandran et al 2001;
Ramachandran, Snehalatha, Latha, Vijay, Viswanathan 1997; Ramachandran, Snehalatha,
Dharmaraj & Viswanathan 1992). Urbanisation has brought several changes in the lifestyles
of people living in urban areas in India and it is associated with a greater prevalence of diabetes
and coronary risk factors (Yadav & Krishnan 2008; Gupta, Rastogi, Sarna & Sharma 2007).
Chowdhary & Lasker (2002) found that the prevalence of central obesity in North India
increased with the level of urbanisation in both men and women, by 8.7% and 34.5%,
respectively (Yadav & Krishnan 2008).
2.7.2 Food habits (traditional vs. western)
Dietary habits and practices are influenced by culture and religion as well as economic
conditions. Oil and sugar are considered an integral part of the daily diet in Indian families.
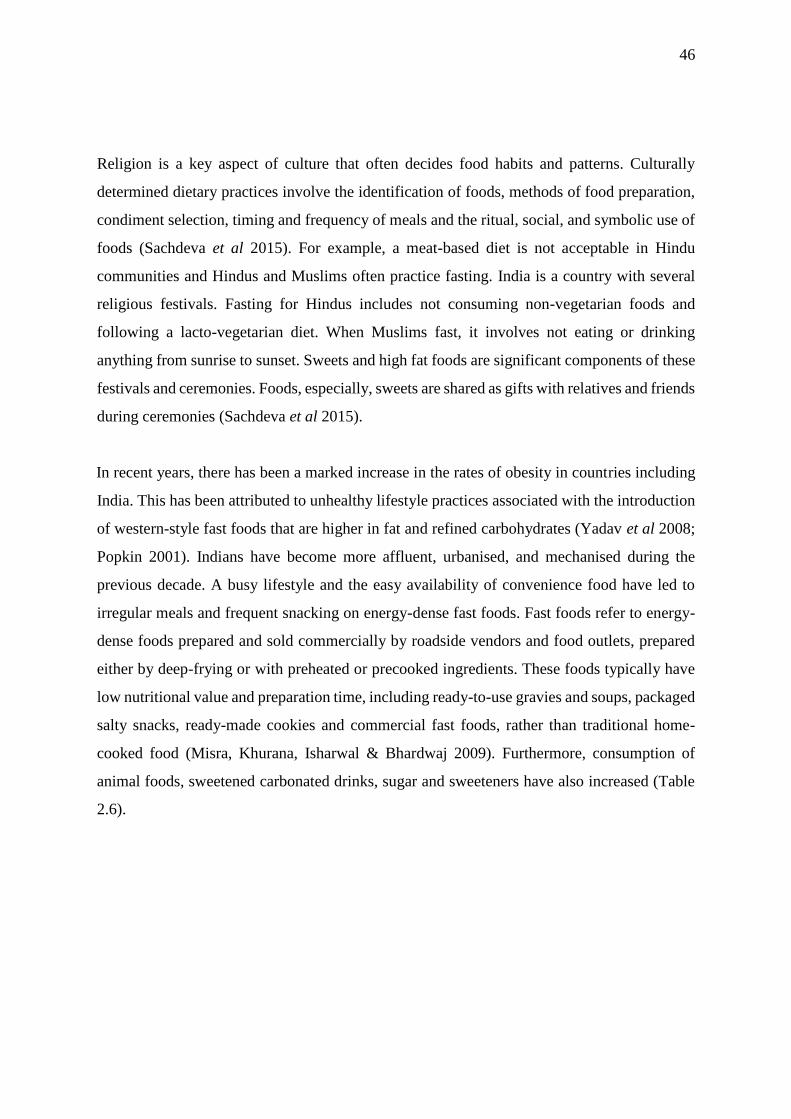
46
Religion is a key aspect of culture that often decides food habits and patterns. Culturally
determined dietary practices involve the identification of foods, methods of food preparation,
condiment selection, timing and frequency of meals and the ritual, social, and symbolic use of
foods (Sachdeva et al 2015). For example, a meat-based diet is not acceptable in Hindu
communities and Hindus and Muslims often practice fasting. India is a country with several
religious festivals. Fasting for Hindus includes not consuming non-vegetarian foods and
following a lacto-vegetarian diet. When Muslims fast, it involves not eating or drinking
anything from sunrise to sunset. Sweets and high fat foods are significant components of these
festivals and ceremonies. Foods, especially, sweets are shared as gifts with relatives and friends
during ceremonies (Sachdeva et al 2015).
In recent years, there has been a marked increase in the rates of obesity in countries including
India. This has been attributed to unhealthy lifestyle practices associated with the introduction
of western-style fast foods that are higher in fat and refined carbohydrates (Yadav et al 2008;
Popkin 2001). Indians have become more affluent, urbanised, and mechanised during the
previous decade. A busy lifestyle and the easy availability of convenience food have led to
irregular meals and frequent snacking on energy-dense fast foods. Fast foods refer to energy-
dense foods prepared and sold commercially by roadside vendors and food outlets, prepared
either by deep-frying or with preheated or precooked ingredients. These foods typically have
low nutritional value and preparation time, including ready-to-use gravies and soups, packaged
salty snacks, ready-made cookies and commercial fast foods, rather than traditional home-
cooked food (Misra, Khurana, Isharwal & Bhardwaj 2009). Furthermore, consumption of
animal foods, sweetened carbonated drinks, sugar and sweeteners have also increased (Table
2.6).
47
Table 2.6: Secular trends of nutrient consumption in India (Misra et al 2011)
(All variables expressed in the unit calories/capita/day)
Average values (calories/capita/day)
Product 1979-1981 1989-1991 1999-2001
Total animal product 120 163 196
Animal fat 23 28 47
Eggs 3 5 6
Seafood 5 7 8
Meat 16 20 22
Milk-excluding butter 71 102 111
Total vegetable product 1963 2202 2296
Alcoholic beverages 5 8 11
Cereals 1368 1508 1470
Fruits 31 34 51
Oil crops 25 37 43
Pulses 120 133 109
Rice (milled) 670 779 751
Starchy roots 41 40 49
Sugar and sweeteners 193 221 247
Sugar crops 8 9 11
Vegetable oils 127 158 239
Vegetable 32 35 45
Wheat 390 461 493
Grand total 2083 2365 2492
There have been major increases in the production of beef, pork, dairy products, eggs, and
poultry across low-and middle-income countries (Du, Mroz, Zhai & Popkin 2004; Popkin &
Du 2003). Most of the global increases in animal-source foods have been in low- and middle-
income countries. For example, India has had a major increase in the consumption of dairy
products and China in pork and eggs (Popkin et al 2012).
Vaz, Yusuf Bharathi, Kurpad & Swaminathan (2008), reported that besides rural-urban
differences in dietary patterns in India, there have been improvements in socioeconomic status
(Vaz et al 2008). These include an increased intake of legumes, vegetables, milk and in the
case of non-vegetarians, foods of animal origin. Other changes include substitution of coarse
grain with the more prestigious and often highly polished cereals such as rice. There has also
been a reduction in the overall cereal intake, although this continues to be high by western
48
standards. A progressive increase in the intake of edible fat, sugar and sweets and overall
energy, has led to an increase in obesity (Vaz et al 2008).
The challenge for India, as in other countries, is to counteract the inevitable degenerative phase
of the nutrition transition. Efforts are needed to improve nutritional knowledge and practice
among health professionals, as well as the public. In order to facilitate healthy nutritional
practices there is a need for initiatives that link enhanced agricultural produce to effective food
storage, and delivery systems that ensure a more equitable distribution of healthy food at
affordable prices (Vaz et al 2008).
2.7.3 Physical activity
Physical activity in any domain (recreation, transportation, household chores, and/or
occupation) is beneficial for health and recommended by the WHO (WHO 2016a). Although
India has traditionally been associated with under nutrition; overweight, obesity, and their
consequences are now becoming increasingly common. Indians exhibit unique features of
obesity with excess body fat, abdominal adiposity, increased subcutaneous and intra-
abdominal fat and deposition of fat in ectopic sites (such as liver, muscle, and others). Obesity
is a major driver for the widely prevalent metabolic syndrome and T2DM. Although this
phenomenon is a global one, India is unique in that it has to grapple with both over- and under-
nutrition at the same time (Kalra & Unnikrishnan 2012).
The prevalence of overweight and obesity are more than three times higher in urban areas,
compared to rural areas. This may be due to reduced levels of physical activity in the urban
areas. According to the National Family Health Survey (NFHS), overweight and obesity are
both higher for women than men across the city of Chennai, state of Tamil Nadu and nationally
[National Family Health Survey (NFHS-4) 2016b]. A higher prevalence of obesity seen in the
urban areas in developing countries including India is associated with the change from rural to
urban lifestyles, causing decreased levels of physical activity and increased energy intake
(Ramachandran & Snehalatha 2010).
49
Physical inactivity has been shown to explain, at least in part, the diabetes epidemic (Mohan,
Gokulakrishnan, Deepa, Shanthirani & Datta 2005). A study to determine the prevalence of
overweight, obesity, under-nutrition, and physical activity status in five urban Indian cities
(Moradabad, Trivandrum, Calcutta, Nagpur and Bombay), found that obesity, overweight,
central obesity and sedentary behaviour coexisted with under-nutrition and have become a
public health problem in all five cities (Singh & Pella 2007). The prevalence of obesity and
sedentary behaviour was significantly greater in Trivandrum, Calcutta and Bombay, compared
with Moradabad and Nagpur. Sedentary behaviour was significantly associated with obesity
compared with non-obese subjects in both sexes, which may be due to greater economic
development in metropolitan cities (Singh & Pella 2007). In Chennai, India, urban participants
were found to lead a predominantly sedentary lifestyle (75% of the participants were physically
inactive) (Mohan, Radhika, Sathya, Tamil, Ganesan & Sudha 2009).
With an increasing number of diabetes deaths worldwide since 1990, (Global Burden of
Disease 2013, Mortality and Causes of Death Collaborators 2015), greater attention and
investments in interventions to promote physical activity in the public is required. More studies
using a detailed quantification of total physical activity will help to find a more precise estimate
for different levels of physical activity (Kyu, Bachman, Alexander, Mumford, Afshin, Estep,
Veerman, Delwiche, Iannarone, Moyer, Cercy, Vos, Murray & Forouzanfar 2016)
2.7.4 Social and socio-economic factors
Social factors currently play a small role in the treatment plan for diabetes. Nonetheless, social
factors have an important role in acceptance, adherence to treatment and overall outcome of
diabetes management. Moreover, social bonds, especially family bonds, are known to
influence outcomes of diabetes management, which holds the key to avoiding negative
progression of the disease (Chesla, Fisher, Mullan, Skaff, Gardiner, Chun & Kanter 2004). The
practical and emotional strains arising out of this affect diabetes management and family
beliefs. Hereby, improving family support is required to help improve patient morale.
However, unresolved family conflicts about diabetes are associated with more depressive
symptoms and lower quality of life (Wen, Parchman & Shepherd 2004).

50
The influence of social class or socioeconomic status on the incidence and management of
diabetes is observed globally, as well as in India. In India, the prevalence of diabetes is
reportedly higher in the highest socioeconomic groups and dwindles with decreasing
socioeconomic status (Safraj, Anish, Vijayakumar, Kutty & Soman 2012). While diabetes was
once considered a disease of affluence, in the last decade its prevalence rates in the middle and
lower income groups in India have shown a trend toward convergence (Deepa, Anjana,
Manjula, Narayan & Mohan 2011). Families with higher average family income and education
profile are known to spend more on diabetes care (Kumar, Nagpal & Bhartia 2008).
In the poorest countries, people with diabetes and their families bear almost the whole cost of
medical care. In India, individuals with limited financial resources continue to spend a major
proportion of their income on diabetes management (Ramachandran, Shobhana, Snehalatha,
Augustine, Murugesan, Viswanathan, Kapur & Williams 2007). In India, 25% of the
population live under the poverty line, 41.6% of the population live under 1.25 USD (united
states dollar) a day and the economic burden of diabetes has a major impact on diabetes care
(Ramachandran et al 2007). The direct medical cost to identify one subject with glucose
intolerance is 115 USD (Ramachandran et al 2007). The cost of insulin amounts to 350 USD
per year, while medication for non-insulin-requiring patients costs about 70 USD per year
(Ramachandran 2007). Out-of-pocket expenditure for hospital treatment for diabetes in India
claims 17% of the annual household expenditure in poor households. The majority of these
expenses are financed through borrowing (Rao et al 2011). Out-of-pocket expenditure
constitutes about 62% of all health expenses, a major drawback in a country like India, where
a large segment of the population is poor (World Bank Data 2016). Poor households can spend
up to 25% of their annual household income on diabetes care (IDF Clinical Guidelines Task
Force 2012).
2.7.5 Cultural factors and literacy levels
Health behaviours are guided by continuous interactions of intrapersonal factors with the
cultural environment (Samuel-Hodge et al 2000). Widespread cultural practices and attitudes
that impede appropriate health-related behaviour make diabetes management in India
challenging. The low rate of literacy contributes to poor diabetes care. Lower levels of literacy
51
in the country are associated with lower awareness of diabetes and its complications (Mehrotra
et al 2000) and are reported to be significantly associated with higher HbA1c levels (Nagpal &
Bhartia 2006). Another example where cultural practices affect diabetes management is the
relative difference in diabetes control between genders. It has been reported that there is
significantly lesser awareness of diabetes and poorer rates of compliance to therapy among
housewives (Lahiri, Haldar, Chowdhury, Sarkar, Bhadury & Datta 2011). This study reported
that all patients who were non-complaint due to financial constraints were women. This is
despite the fact that women are known to have a higher rate of diabetes prevalence compared
to men (Lahiri et al 2011). This shows the effect of the low literacy rates of women as
compared to men in India, because of the culure in India of women not being as important to
educte as men. Hereby this leads women to not having good paying jobs and ultimately cannot
pay for their own medical treatment. Also, due to the fact the women do not work or earn very
little, the burden falls to the male of the family which leads to resources being depleted. In
India, it is reported that cost-effective focus for overall diabetes care is placed on the nuclear
family as a unit (Sridhar 2007), which occupies 60% of the total household units [National
Family Health Survey (NFHS-3) 2007] with a mean number of 4.8 persons per house (rural
areas - 4.9 persons, urban areas - 4.6 persons) (NFHS-3 2007). Therefore low literacy due to
cultural effects directly influences cost of medical care in a family.
2.7.6 Religion
It is important for health care providers to acknowledge and consider cultural differences in
the form of language, educational backgrounds, religion, health attributions, beliefs and
practices toward illness (Vaughn, Jacquez & Baker 2009). Because of the vast diversity of
cultural and religious health attributions, beliefs and practices, it is important to prioritise such
factors in diabetes care and education (Vaughn et al 2009). In chronic conditions like diabetes,
religious or spiritual beliefs become increasingly important; firstly, because they provide social
and emotional support and, secondly, because they aid in coping with the stress of the disease
(Wangnoo et al 2013).
Hindus observe fasting and go on a strenuous pilgrimage like Amarnathji, which is a difficult
pilgrimage Hindus take to a shrine near Amarnath, India, which houses an ice Shiva Lingam.
52
The shrine is located in a cave at 3,888m and is only accessible by foot. This is undertaken as
part of their religious traditions during various times of the year (Ganie, Koul, Razv, Laway &
Zargar 2012). Jains (those who follow the ancient Indian religion of Jainism), have varying
fasts, one of which is not eating from dusk to dawn, irrespective of the duration of this period
(Julka, Sachan, Bajaj, Sahay, Chawla, Agrawal, Saboo, Unnikrishnan, Baruah, Parmar & Kalra
2017). The National Family Health Survey (NFHS-3) (2007), reported that Christians are more
likely than any other religious group to eat chicken, meat, fish or eggs at least once a week.
Jains and Sikhs (those who follow the religion of Sikhism, founded in Northern India), rarely
eat chicken, meat, fish or eggs, but they are more likely than any other religious group, to
consume milk or curd. Jains are also more likely than any other religious group to eat fruit at
least once a week (NFHS-3 2007).
People with diabetes are advised to follow their physician's advice in observing fasts or going
on pilgrimages, to avoid any glycaemic emergencies (Ganie et al 2012). People with diabetes,
who wish to fast, have been stratified based on the severity of disease, and specific rules and
recommendations have been issued (Jaleel, Raza, Fathima & Jaleel 2011). People with diabetes
who are categorised in the “observe fasting” group are further advised to follow the
recommended strategies to ensure safety before, during and after the month of Ramadan
(month of fasting for Muslims) (Jaleel et al 2011).
2.7.7 Indian women and diabetes
Women are often viewed as the custodian of family values and culture. This responsibility to
maintain cultural practices and pass them on to younger generations can make it difficult for
women with diabetes to make lifestyle changes, leading to poor health outcomes (Black 2002).
Approximately three quarters of women in Indore City, India found it difficult to follow care
advice by doctors and self-medication was very common among women (Sushama & Nandita
2012; Black 2002). As mentioned earlier, the prevalence of overweight and obesity is higher
among women than men in India, including the city of Chennai, state of Tamil Nadu (NHS-4
2016b).
53
Gender discrimination toward healthcare, including diabetes, is observed worldwide. In India,
higher outpatient attendance for T1DM is recorded for men than for women (<30 years age)
(Kalra, Kalra & Kumar 2009a). Interestingly, half of these young women who are at a
marriageable age often stop their follow-up visits at clinics due to perceived social stigma,
often leading to medical consequences, including diabetic ketoacidosis (Kalra et al 2009a).
Women also show poorer compliance to therapy due to greater economic dependence on
family members (Lahiri et al 2011). Differences in functional limitations between adults with
and without diabetes are more evident in women than they are in men, due to their strong
association with biological and behavioural factors (Chiu & Wray 2011).
In India, parents usually get their daughters married without disclosing that they have diabetes.
This eventually leads to grave consequences. Another aspect of gender discrimination in
diabetes care comes from the role of parents in the management of children with T1DM, where
mothers often share a disproportionate burden of diabetes care in the child. If fathers do not
share the responsibility, they feel out of touch with the complexities of management.
Therefore, it is important to ensure distribution of responsibility between the parents (Sridhar
1996). On the dietary side, mean consumption values for cereals, pulses and legumes, dairy
products, tubers, fruit and vegetables (this includes fruit, leafy vegetables, other vegetables and
roots), meat and poultry, visible fats and oils and sugars were significantly higher in Indian
men than women, whereas eggs were higher in women (Radhika et al 2009). This suggests
that women may have higher risk for poor dietary intake and possible nutrient deficiencies.
2.8 Change from disease treatment to patient treatment
Patient-centred care has become a recognised part of medical practice. Client-centred (patient-
centered) care has become popular through institutes like the Picker Institute and Institute of
Medicine (Kalra et al 2013). Recent guidelines on the managing of diabetes care have
additionally reinforced the need for patient-centeredness, using the term “patient-centered
approach” in their terminology (Inzucchi et al 2012). This is defined as an approach to
“providing care that is respectful of and responsive to individual patient preferences, needs and
values and ensuring that patient values guide all clinical decisions” (Inzucchi et al 2012). With
this approach, health care providers need to familiarise themselves with patient’s needs and
54
ideas, as well as providing recognition and encouragement, in keeping with the individual
patient's perspective. Prueksaritanond, Tubtimtes, Asavanich & Tiewtranon (2004) found that
a patient-centred approach had a favourable effect on improving the health status of type 2
diabetics in terms of biological (glycaemic control) and behavioural indicators (eating,
exercise, compliance and symptoms of diabetes). Specialists also saw the need for and
significance of therapeutic patient education, through a patient-centred approach in diabetes
management (Kalra, Baruah, Ganapathy, Ganie, Sahay & Unnikrishnan 2009b).
2.8.1 Challenges of shifting to holistic care
Successful diabetes management has remained elusive, even with a wide variety of therapeutic
options now accessible to clinical practitioners (Peyrot et al 2005). A purely pharmacological
approach to successfully managing diabetes is insufficient. Factors beyond pharmacological
interventions, which focus on patient’s need, resources, values and strategies are needed.
Therefore, employing approaches such as motivational interviewing, cognitive behaviour
therapy and behaviour change counselling may help to change patient behaviour (Kalra et al
2009b).
Lifestyle changes represent the first step in management and a team approach is often
necessary. Even patients with good glucose control should have access to formal diabetes
education, to train them in the use of technical aids and increase their knowledge of the disease.
Diabetics should be accompanied through the different stages of disease acceptance, which
form the basis for current and future treatment adherence (Assal et al 1997). In India, there is
a wide disparity in the healthcare facilities available in rural and urban areas, due to the
unbalanced healthcare system. Institutions run by the state (where medical care is free or
offered at subsidised rates), private institutions (where patients have to pay for services) and a
large number of medical practitioners, share healthcare delivery. People do not have any
restrictions in utilising any of the available medical facilities and they can access any level of
care, depending on their economic feasibility, proximity and knowledge about the facility.
Individuals, who can afford it, are able to attend the private centres for their diabetes care
(Ramachandran 2007).
55
Although India has several institutions offering high quality healthcare, these facilities are
limited in their ability to maintain healthcare standards because of poor maintenance and state
of infrastructure in many parts of the country. Most public health facilities are disorganised,
inadequately managed, staffed, and have badly maintained medical equipment. The number of
public health facilities is also inadequate. For example, India needs 74,150 community health
centres per million people, but has less than half that number. In addition, at least 11 Indian
states do not have laboratories for testing drugs and more than half of the existing laboratories
are not properly equipped or staffed (Viswanathan & Rao 2013).
The principal responsibility for public health funding lies with the state governments, which
provide approximately 80% of public funding. The central government contributes another
15%, mostly through national health programs [PricewaterhouseCoopers (PwC) 2007, p5].
With a 22% shortage of primary health centres (PHCs) and a 32% shortage of community
health centres (CHCs), it is estimated that 50% of beneficiaries travel more than 100 km to
access quality care (PwC 2017). India has only 1.1 beds per 1,000 people, compared to the
world average of 2.7 and 70% of India’s healthcare infrastructure is in the top 20 cities (PwC
2017).
As a way forward, many hospitals are obtaining National Accreditation Board of Hospitals
(NABH) accreditation to improve the quality and standards of care. So far, 157 hospitals
achieved this in 2016, many of which are in the private sector (PWC 2017). Problems such as
lack of appropriate infrastructure and health personnel, poor updating of knowledge about
diabetes among general practitioners, poor access to diabetes drugs and healthcare facilities,
economic disparities in the healthcare system and the socioeconomic burden on the patient are
the main obstacles in diabetes care (Viswanathan & Rao 2013).
Effective management of diabetes offers only part of the solution for the problem of diabetes.
This means that other aspects of care, important from the perspective of diabetes control, may
be difficult to provide within the health system itself. Aspects related to diet and the amount
of physical activity undertaken is influenced by interplay of various sectoral policies and
forces. In India, several rural areas still face the problem of under nutrition and are unable to
access better food products. Restrictive dietary advice for diabetic patients in such areas
56
becomes difficult, which means that national or state policies for food procurement, pricing
and marketing have to be implemented to ensure sustained availability of inexpensive and
accessible dietary substitutes (Viswanathan & Rao 2013).
It has been shown that various factors like inadequate knowledge of guidelines, primary focus
on acute management rather than the preventive care, competing care demands, delayed
clinical response to poor control, time constraints, inadequate resources and attitudinal issues
are some of the physician-related issues in diabetes control in India (Venkataraman et al 2009).
Therefore, the health system in India has to strengthen the standard of diabetes care at all levels,
along with nationally accepted management protocols and regulatory frameworks, which can
help to tackle this challenge (Viswanathan & Rao 2013).
2.8.2 Shift to personal care of patients
Several authors have demonstrated that support from health care practitioners is integral to
people learning how to self-manage diabetes (Gleeson-Kreig 2008; Rosland, Kieffer, Israel,
Cofield, Palmisano, Sinco, Spencer & Heisler 2008; Tang, Brown, Funnell & Anderson 2008).
For instance, a survey in the USA found that more than 40% of participants identified their
physician as having provided the greatest social support in managing their diabetes (Tang et al
2008). A central theme for social support is empowerment, which refers to providing people
with chronic disease and their caregivers, with the maximum amount of control over their own
lives. This can enhance subjective quality of life for persons with chronic disease (Rosenfield
1992).
Health care practitioners can promote self-management in their diabetic patients by carrying
out patient-centred activities. For patients who rely primarily on their physician for support,
effective patient-physician communication may be particularly important, with evidence to
show that patients practiced better self-management when their providers had superior
communication skills (Heisler, Bouknight, Hayward, Smith & Kerr 2002). Health care
professionals need to pay attention to various aspects like style and content of verbal
interaction, verifying patient understanding, determining perceptions of key messages, and
57
other strategies in fostering behaviour change (Gensichen, Von Korff, Rutter, Seelig, Ludman,
Lin, Ciechanowski, Young, Wagner & Katon 2009).
To ensure that patients recognise the importance of self-management and become fully
engaged in it, there should be negotiation of goals to help HCPs and patients achieve a balance
between accepting medical care and desiring to live a normal life. Interestingly, Indian HCPs
strongly felt that diabetes should be given higher priority (78.6%); this proportion was higher
than that for any other country (Holt & Kalra 2013). It has been suggested that every patient
should have a specifically designed, individualised group-based support, since each person
may present with a unique set of needs, risks and limitations (Oftedal, Karlsen & Bru 2010).
Such a personalised strategy is based on the premise that different patients with chronic disease
may respond to similar treatments in different ways. If all patients were to be treated using a
broad-brush approach, this would be at the expense of disregarding their individual
sociocultural differences and characteristics. This has enormous potential to add value to the
management of patients with chronic disease by providing targeted treatments, improving
quality of life and being more cost-effective (Oftedal et al 2010).
Major members of the health care team, including nurses, pharmacists, dieticians, and
behavioural specialists such as psychologists, should preferably work together for the complete
assessment of each diabetic patient, on an individual basis. Hereby, with this, start the most
appropriate therapy to accomplish the best health care aim. Therefore, HCPs have to consider
a patient-centred approach to effect positive health-behaviour change and to establish a co-
operative relationship with the diabetic patient (Kadirvelu et al 2012). A system of
collaborative care should be instituted, where patients are motivated to be able to carry out
optimal self-care. This implies co-management care, where a care plan includes goals
developed through negotiation and agreement among patients, health care providers, family,
carers and other supports. Health care providers also provide ongoing support to work towards
optimal patient self-care behaviours in time. The prerequisites of this empowerment approach
are cooperation and respect, where patients are fully responsible for self-management of their
diabetes and in control of decision-making, with an adult-to-adult relationship between health
care practitioners and patients (Kadirvelu et al 2012).
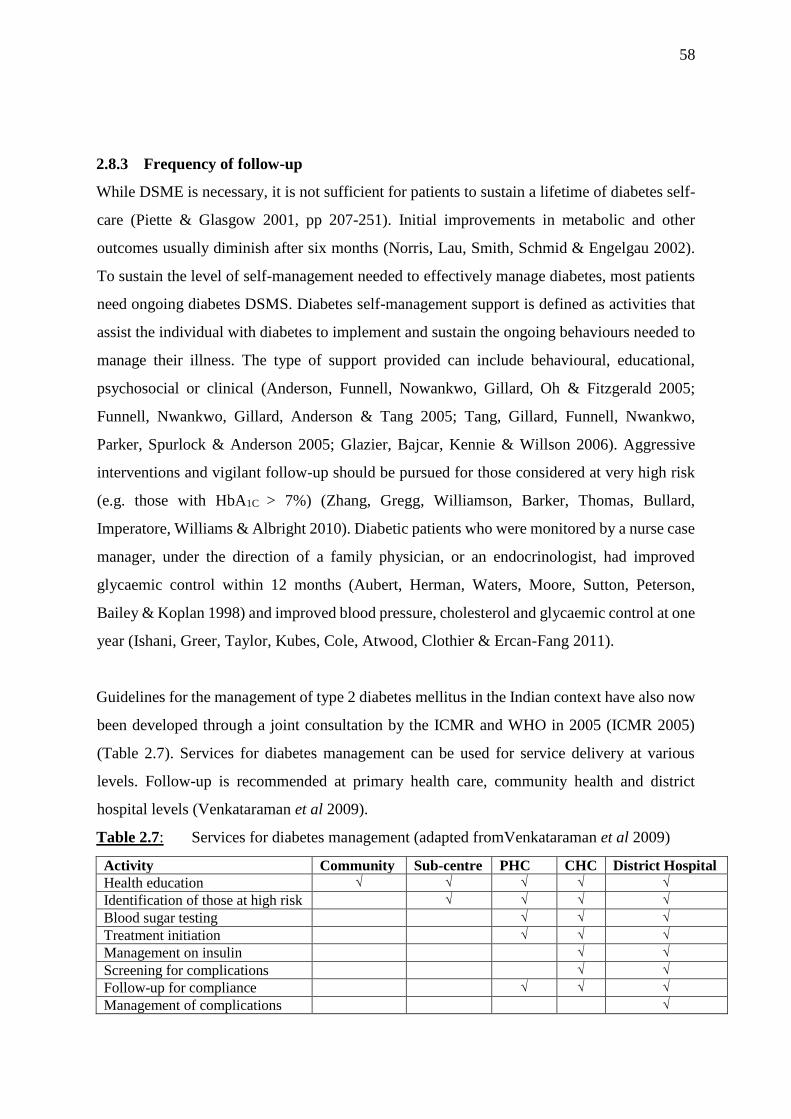
58
2.8.3 Frequency of follow-up
While DSME is necessary, it is not sufficient for patients to sustain a lifetime of diabetes self-
care (Piette & Glasgow 2001, pp 207-251). Initial improvements in metabolic and other
outcomes usually diminish after six months (Norris, Lau, Smith, Schmid & Engelgau 2002).
To sustain the level of self-management needed to effectively manage diabetes, most patients
need ongoing diabetes DSMS. Diabetes self-management support is defined as activities that
assist the individual with diabetes to implement and sustain the ongoing behaviours needed to
manage their illness. The type of support provided can include behavioural, educational,
psychosocial or clinical (Anderson, Funnell, Nowankwo, Gillard, Oh & Fitzgerald 2005;
Funnell, Nwankwo, Gillard, Anderson & Tang 2005; Tang, Gillard, Funnell, Nwankwo,
Parker, Spurlock & Anderson 2005; Glazier, Bajcar, Kennie & Willson 2006). Aggressive
interventions and vigilant follow-up should be pursued for those considered at very high risk
(e.g. those with HbA1C > 7%) (Zhang, Gregg, Williamson, Barker, Thomas, Bullard,
Imperatore, Williams & Albright 2010). Diabetic patients who were monitored by a nurse case
manager, under the direction of a family physician, or an endocrinologist, had improved
glycaemic control within 12 months (Aubert, Herman, Waters, Moore, Sutton, Peterson,
Bailey & Koplan 1998) and improved blood pressure, cholesterol and glycaemic control at one
year (Ishani, Greer, Taylor, Kubes, Cole, Atwood, Clothier & Ercan-Fang 2011).
Guidelines for the management of type 2 diabetes mellitus in the Indian context have also now
been developed through a joint consultation by the ICMR and WHO in 2005 (ICMR 2005)
(Table 2.7). Services for diabetes management can be used for service delivery at various
levels. Follow-up is recommended at primary health care, community health and district
hospital levels (Venkataraman et al 2009).
Table 2.7: Services for diabetes management (adapted fromVenkataraman et al 2009)
Activity Community Sub-centre PHC CHC District Hospital
Health education √ √ √ √ √
Identification of those at high risk √ √ √ √
Blood sugar testing √ √ √
Treatment initiation √ √ √
Management on insulin √ √
Screening for complications √ √
Follow-up for compliance √ √ √
Management of complications √
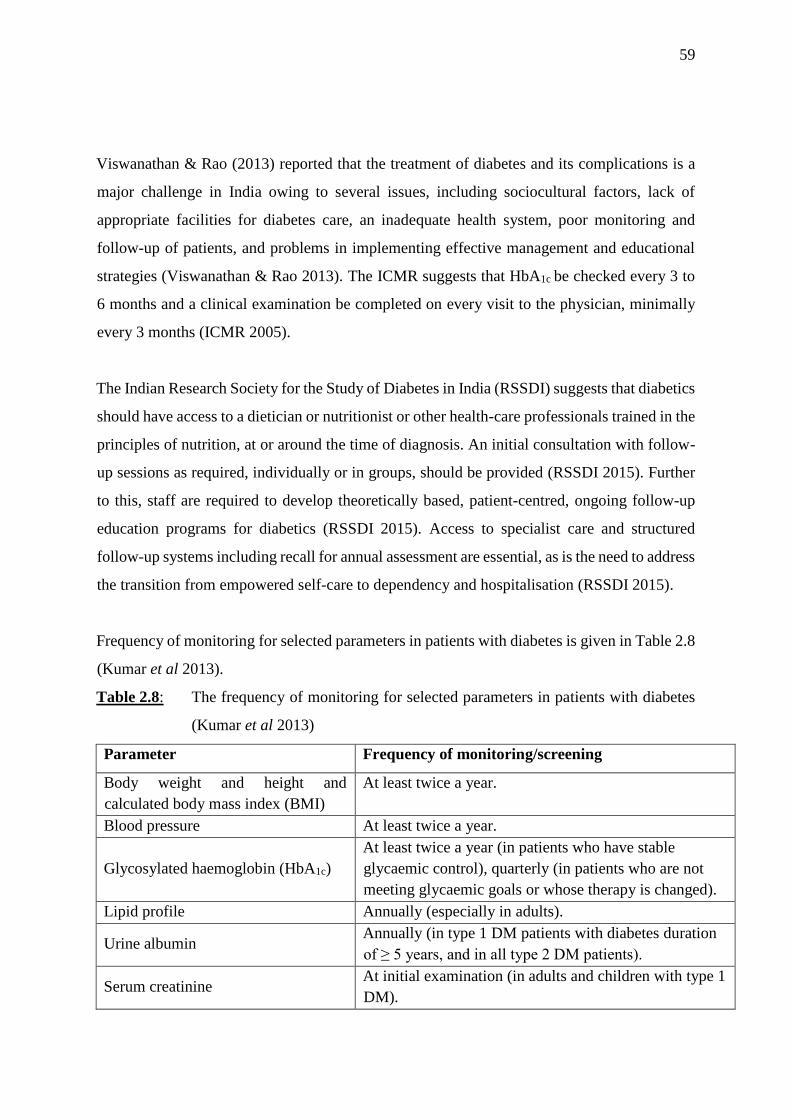
59
Viswanathan & Rao (2013) reported that the treatment of diabetes and its complications is a
major challenge in India owing to several issues, including sociocultural factors, lack of
appropriate facilities for diabetes care, an inadequate health system, poor monitoring and
follow-up of patients, and problems in implementing effective management and educational
strategies (Viswanathan & Rao 2013). The ICMR suggests that HbA1c be checked every 3 to
6 months and a clinical examination be completed on every visit to the physician, minimally
every 3 months (ICMR 2005).
The Indian Research Society for the Study of Diabetes in India (RSSDI) suggests that diabetics
should have access to a dietician or nutritionist or other health-care professionals trained in the
principles of nutrition, at or around the time of diagnosis. An initial consultation with follow-
up sessions as required, individually or in groups, should be provided (RSSDI 2015). Further
to this, staff are required to develop theoretically based, patient-centred, ongoing follow-up
education programs for diabetics (RSSDI 2015). Access to specialist care and structured
follow-up systems including recall for annual assessment are essential, as is the need to address
the transition from empowered self-care to dependency and hospitalisation (RSSDI 2015).
Frequency of monitoring for selected parameters in patients with diabetes is given in Table 2.8
(Kumar et al 2013).
Table 2.8: The frequency of monitoring for selected parameters in patients with diabetes
(Kumar et al 2013)
Parameter Frequency of monitoring/screening
Body weight and height and
calculated body mass index (BMI)
At least twice a year.
Blood pressure At least twice a year.
Glycosylated haemoglobin (HbA1c)
At least twice a year (in patients who have stable
glycaemic control), quarterly (in patients who are not
meeting glycaemic goals or whose therapy is changed).
Lipid profile Annually (especially in adults).
Urine albumin Annually (in type 1 DM patients with diabetes duration
of ≥ 5 years, and in all type 2 DM patients).
Serum creatinine At initial examination (in adults and children with type 1
DM).
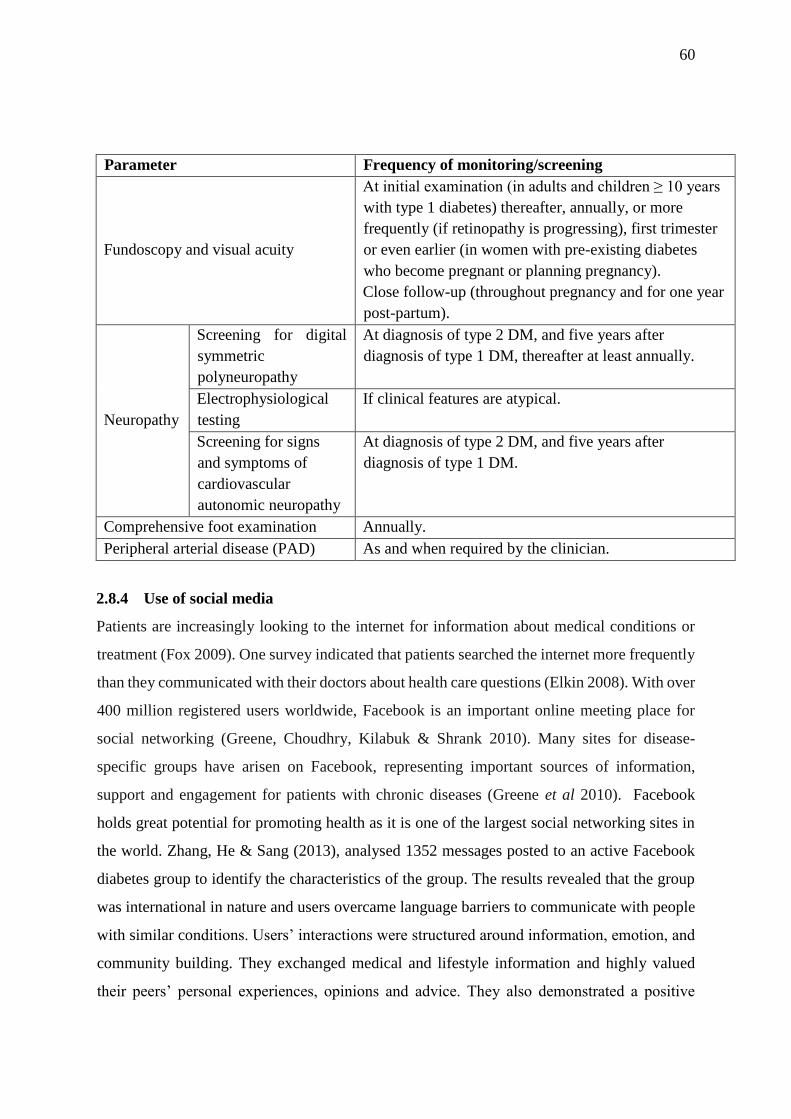
60
Parameter Frequency of monitoring/screening
Fundoscopy and visual acuity
At initial examination (in adults and children ≥ 10 years
with type 1 diabetes) thereafter, annually, or more
frequently (if retinopathy is progressing), first trimester
or even earlier (in women with pre-existing diabetes
who become pregnant or planning pregnancy).
Close follow-up (throughout pregnancy and for one year
post-partum).
Neuropathy
Screening for digital
symmetric
polyneuropathy
At diagnosis of type 2 DM, and five years after
diagnosis of type 1 DM, thereafter at least annually.
Electrophysiological
testing
If clinical features are atypical.
Screening for signs
and symptoms of
cardiovascular
autonomic neuropathy
At diagnosis of type 2 DM, and five years after
diagnosis of type 1 DM.
Comprehensive foot examination Annually.
Peripheral arterial disease (PAD) As and when required by the clinician.
2.8.4 Use of social media
Patients are increasingly looking to the internet for information about medical conditions or
treatment (Fox 2009). One survey indicated that patients searched the internet more frequently
than they communicated with their doctors about health care questions (Elkin 2008). With over
400 million registered users worldwide, Facebook is an important online meeting place for
social networking (Greene, Choudhry, Kilabuk & Shrank 2010). Many sites for disease-
specific groups have arisen on Facebook, representing important sources of information,
support and engagement for patients with chronic diseases (Greene et al 2010). Facebook
holds great potential for promoting health as it is one of the largest social networking sites in
the world. Zhang, He & Sang (2013), analysed 1352 messages posted to an active Facebook
diabetes group to identify the characteristics of the group. The results revealed that the group
was international in nature and users overcame language barriers to communicate with people
with similar conditions. Users’ interactions were structured around information, emotion, and
community building. They exchanged medical and lifestyle information and highly valued
their peers’ personal experiences, opinions and advice. They also demonstrated a positive
61
attitude toward the reality of living with diabetes and generously provided encouragement and
affirmation to one another (Zhang et al 2013). Facebook provides a forum for reporting
personal experiences, asking questions and receiving direct feedback for people living with
diabetes. However, promotional activity and personal data collection are also common, with
no accountability or checks for authenticity (Greene et al 2010).
mHealth is defined by the WHO (WHO Library Cataloguing-in-Publication Data 2011, p6), as
follows: “mHealth is a component of eHealth. To date, no standardized definition of mHealth
has been established. The Global Observatory for eHealth (GOe) defined mHealth or mobile
health as medical and public health practice supported by mobile devices, such as mobile
phones, patient monitoring devices, personal digital assistants (PDAs) and other wireless
devices. mHealth involves the use and capitalisation on a mobile phone’s core utility of voice
and short messaging service (SMS) as well as more complex functionalities and applications
including general packet radio service (GPRS), third and fourth generation mobile
telecommunications (3G and 4G systems), global positioning system (GPS) and Bluetooth
technology.” mHealth interventions offer the potential to overcome many of the traditional
barriers by offering convenience and care in a natural environment and minimising the barriers
of distance, time and cost. For the clinician, mHealth interventions offer the ability to evaluate
a prescribed course of action, monitor adverse events and identify areas for improvement
(Hamine, Gerth-Guyette, Faulx, Green & Ginsburg 2015; De Jongh, Gurol-Urganci,
Vodopivec-Jamsek, Car & Atun 2012).
Mobile phones (i.e., mobile phones with advanced computing and internet access) and tablet
computers (i.e., general-purpose computers contained in a single panel and usually operated
through a touch screen) have become the most popular and widespread types of mobile devices
(European Commission 2015). In India, 61.8 % of women in urban areas and 36.9% of women
in rural areas own mobile phones (NFHS-4 2016a ) and close to 66% of British adults claim
to own a mobile phone (Ofcom 2015a) and over half own a tablet (Ofcom 2015b). In the United
States, a report by the Pew Research Center found that 64% of all adults now own a mobile
phone (Smith & Page 2015) and 34% of American adults own a tablet computer (Zickuhr
62
2013). This suggests that mobile phones are widely used and social media may have a more
important role to play in managing diabetes.
Evidence indicates that there is the potential for applications (apps) to be used in improving
symptom management through self-management interventions. The use of applications in
mHealth have the potential to improve health outcomes among those living with chronic
diseases through enhanced symptom control (Whitehead & Seaton 2016). Petrovski, Zivkovic
& Stratrova (2015) conducted a study to evaluate results from social media (Skype and
Facebook) and CareLink software as tools to improve diabetes control in patients with type 1
diabetes, using insulin pumps with glucose sensors for one year. Petrovski et al (2015) found
that social media allowed patients to gain diabetes knowledge and information and interact in
their daily insulin adjustments. Moreover, it could help patients cope better with their daily life
(Petrovski et al 2015).
The world is experiencing an extraordinary phenomenon: the exponential growth of mobile
communications not only in developed countries but also in the developing world, where such
technology is bypassing conventional telephony systems and allowing people to communicate
across vast geographical distances, which until now, were inaccessible. The International
Telecommunications Union (ITU) estimates that by the end of 2010, 77% of the world’s
population had a subscription to a mobile phone and over 85% were covered by a mobile phone
network (Geneva International Telecommunications Union 2010).
If implemented strategically and systematically, mHealth can revolutionise health outcomes,
providing virtually anyone with a mobile phone, with medical expertise and knowledge in real-
time. This is a benefit, particularly to those marginalised or living in remote areas, who would
otherwise not have access to this information or care (WHO Library Cataloguing-in-
Publication Data 2011, p77).
2.9 Conclusion
Diabetes management remains a challenge for developed and developing countries alike. The
implementation of evidence-based guidelines and restructuring of clinical care organisation
63
has yielded gains in some countries. In India, as in other countries, the health system has
traditionally been designed to cater for acute illness and maternal and child health concerns.
The need for long-term care for non-communicable diseases is a relatively new health concern,
and personnel and infrastructure are not yet geared to face this task. Consequently, many health
systems are exploring different models of care and advocating approaches that place more
emphasis on a patient-centred approach. It is evident that social support has much unrealised
potential as both an effective and cost-effective means to manage the epidemic of T2DM.
While health practitioners need to be aware of the barriers to social support, it is clear that the
way forward is a collaborative model involving health care providers, patients, and their social
support network. To empower patients to easily access and adapt this information in their
everyday life, certified paramedical staff for diabetes education are needed. The central role of
families in creating the immediate context of patient care in India must also be recognised in
diabetes education. India will also need to plan for the care of the sizeable number of people
with diabetes, in order to prevent and decrease morbidity due to complications. A health system
strengthening approach with standards of care at all levels, nationally accepted management
protocols and regulatory framework can help in tackling this challenge.
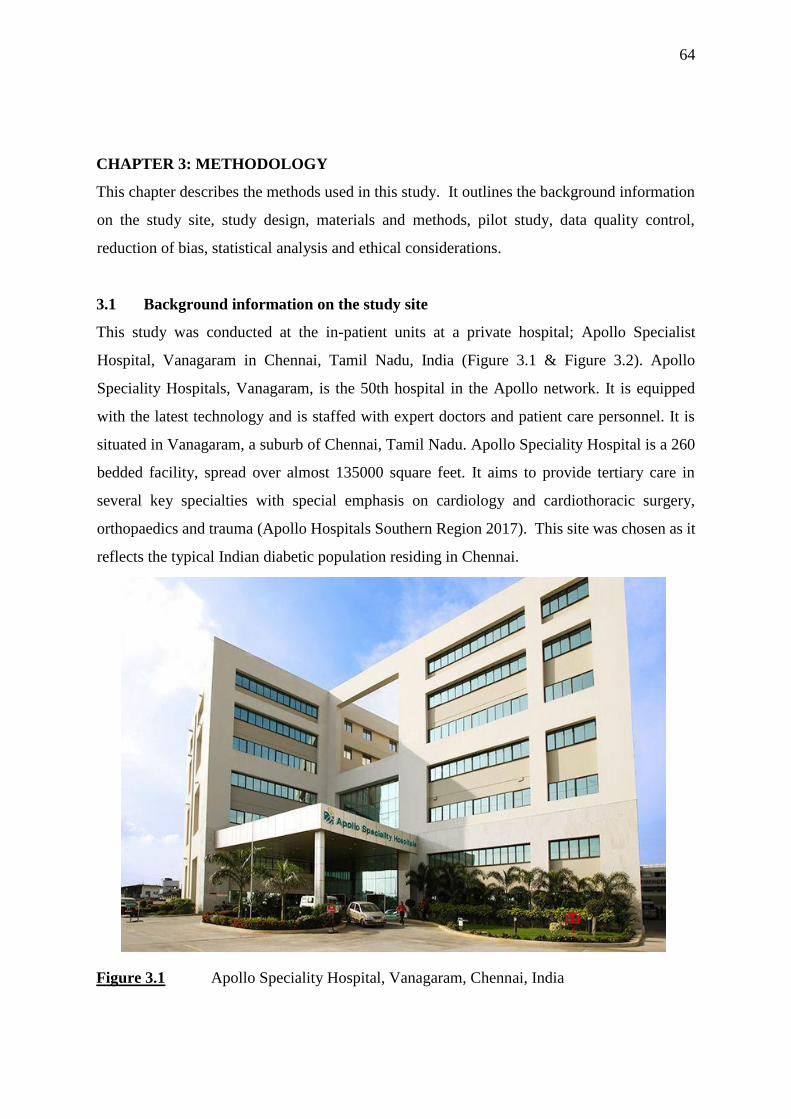
64
CHAPTER 3: METHODOLOGY
This chapter describes the methods used in this study. It outlines the background information
on the study site, study design, materials and methods, pilot study, data quality control,
reduction of bias, statistical analysis and ethical considerations.
3.1 Background information on the study site
This study was conducted at the in-patient units at a private hospital; Apollo Specialist
Hospital, Vanagaram in Chennai, Tamil Nadu, India (Figure 3.1 & Figure 3.2). Apollo
Speciality Hospitals, Vanagaram, is the 50th hospital in the Apollo network. It is equipped
with the latest technology and is staffed with expert doctors and patient care personnel. It is
situated in Vanagaram, a suburb of Chennai, Tamil Nadu. Apollo Speciality Hospital is a 260
bedded facility, spread over almost 135000 square feet. It aims to provide tertiary care in
several key specialties with special emphasis on cardiology and cardiothoracic surgery,
orthopaedics and trauma (Apollo Hospitals Southern Region 2017). This site was chosen as it
reflects the typical Indian diabetic population residing in Chennai.
Figure 3.1 Apollo Speciality Hospital, Vanagaram, Chennai, India
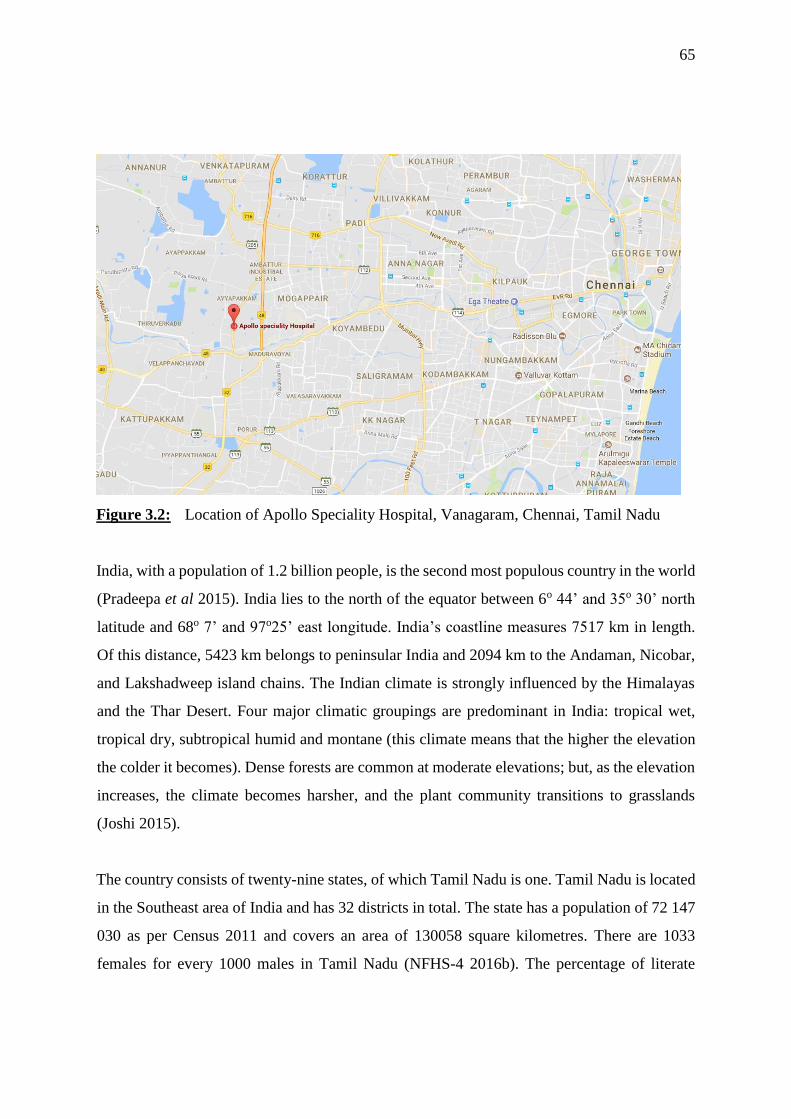
65
Figure 3.2: Location of Apollo Speciality Hospital, Vanagaram, Chennai, Tamil Nadu
India, with a population of 1.2 billion people, is the second most populous country in the world
(Pradeepa et al 2015). India lies to the north of the equator between 6o 44’ and 35o 30’ north
latitude and 68o 7’ and 97o25’ east longitude. India’s coastline measures 7517 km in length.
Of this distance, 5423 km belongs to peninsular India and 2094 km to the Andaman, Nicobar,
and Lakshadweep island chains. The Indian climate is strongly influenced by the Himalayas
and the Thar Desert. Four major climatic groupings are predominant in India: tropical wet,
tropical dry, subtropical humid and montane (this climate means that the higher the elevation
the colder it becomes). Dense forests are common at moderate elevations; but, as the elevation
increases, the climate becomes harsher, and the plant community transitions to grasslands
(Joshi 2015).
The country consists of twenty-nine states, of which Tamil Nadu is one. Tamil Nadu is located
in the Southeast area of India and has 32 districts in total. The state has a population of 72 147
030 as per Census 2011 and covers an area of 130058 square kilometres. There are 1033
females for every 1000 males in Tamil Nadu (NFHS-4 2016b). The percentage of literate
66
women is 79.4% compared to 89.1% men (NFHS-4 2016b). The infant mortality rate is 21 per
1000 live births as compared to the country’s rate of 41 per 1000 live births (NFHS-4 2016a).
The capital of Tamil Nadu is Chennai, with an area of 178 square kilometres and a population
of 4 646 732 (4.64 million in Census 2011) (8.6 million estimated by 2017). The gender ratio
is 989 females per 1000 males with a literacy ratio of 90.2% (male 93.7%; female 86.6%)
(Government of Tamil Nadu 2017). According to the Planning Commission’s (Government of
India) 2013 report, the state line of poverty for Tamil Nadu was 937 Indian Rupees (14 USD)
monthly per capita, and 11.2% (8.2 million) people live below this poverty line (Government
of India, Press Information Bureau 2013).
In Tamil Nadu, 23.8 % of children under 5 years of age were underweight. Adult females and
males with a BMI of less than 18kg/m2 were 14.6% and 12.4%, respectively (NFHS-4 2016b).
Nationally, 35.7% of children under the age of 5 years were underweight and adult females
and males with a BMI of less than 18 kg/m2 were 22.9% and 20.2%, respectively (NFHS-4
2016a). In Tamil Nadu, 30% of women (15 to 49 years) were overweight or obese (BMI ≥ 25.0
kg/m2) while 28.2% of men (15 to 49 years) were overweight or obese (NFHS-4 2016b).
According to the same survey in Tamil Nadu, 3.9 % of women (between 15 to 49 years) had
high blood sugar levels (> 9 mmol/l), while 5.6% of males of the same age group had high
blood sugar levels (NFHS-4 2016b). According to the ICMR, 18.6% of people in Chennai,
capital of Tamil Nadu were diabetic in 2006 (Mohan et al 2007) and 4.8 million were diabetic
in Tamil Nadu (South India) in 2011 (Anjana et al 2011). Approximately 0.5% of women (15
to 49 years) and 1.2% of men (15 to 49 years) had very high blood pressure (systolic
>160mm/Hg and diastolic >110mm/Hg) (NFHS-4 2016b).
Figure 3.3 shows the location of Chennai in relation to the state of Tamil Nadu.
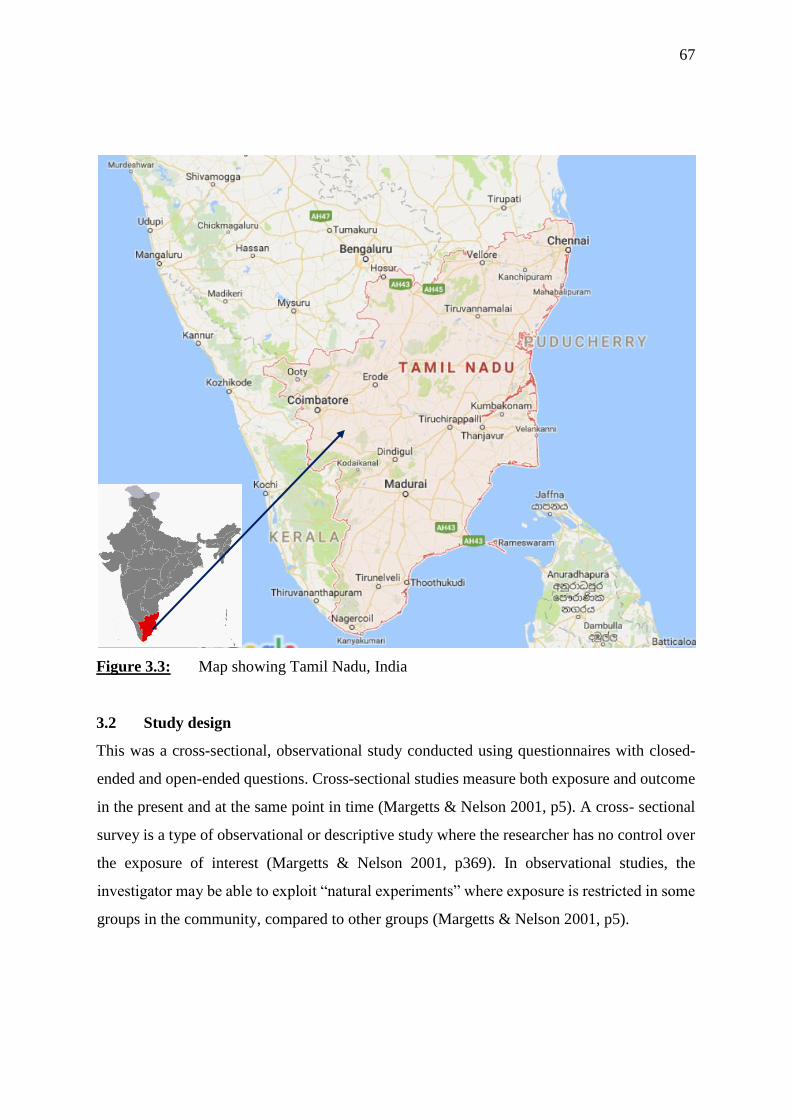
67
Figure 3.3: Map showing Tamil Nadu, India
3.2 Study design
This was a cross-sectional, observational study conducted using questionnaires with closed-
ended and open-ended questions. Cross-sectional studies measure both exposure and outcome
in the present and at the same point in time (Margetts & Nelson 2001, p5). A cross- sectional
survey is a type of observational or descriptive study where the researcher has no control over
the exposure of interest (Margetts & Nelson 2001, p369). In observational studies, the
investigator may be able to exploit “natural experiments” where exposure is restricted in some
groups in the community, compared to other groups (Margetts & Nelson 2001, p5).
68
3.3 Study population and sample selection
3.3.1 Study population
This study was conducted on in-patients of Apollo Speciality Hospital, Vanagaram. The
medical, general and surgical in-patient wards with diabetic adult patients were used. Type 2
diabetic adults between 18 to 70 years old; with no more than two co-morbidities; diagnosed
for at least one year and previously seen by a dietitian were invited to participate in the study.
The health care providers used had one year or more of experience. All subjects were of Indian
origin living in Chennai, Tamil Nadu. Type 2 diabetes was chosen for this study, as this
condition is more prevalent and problematic in this community than other types of diabetes.
T2DM adults were chosen as receiving ethical approval for them to partake in a study is more
likely in private institutions.
3.3.2 Sample selection
Systemic sampling was used in this study. “Systemic sampling is a version of simple random
sampling which avoids the need for a sampling frame at the outset, and so simplifies the
randomization procedure. Like simple random sampling, it ensures the same sampling fraction
for each sampling unit, but in practice only the first unit sampled is randomly selected.”
(Margetts & Nelson 2001, p66). The renal, cardiac and intensive care units were excluded as
per inclusion criteria for subjects. The outpatient department was excluded as per request of
the hospital administration due to this department being a high “traffic” area and to avoid
patients becoming impatient and irritable. Patients with renal failure or co-morbidity were not
included. The maximum sample size allowed in the study was 50, as stipulated by the hospital
management. The health care providers sample size was limited to 25, as specified by the
hospital management.
Inpatients medical records were checked for above criteria (3.3.1) and those meeting them were
asked to participate in the study.
3.4 Study materials and methods
3.4.1 Questionnaires
Two questionnaires were developed for use in this study. One was developed to be answered
by Type 2 diabetic patients in English (Appendix A). This questionnaire was translated into

69
Tamil (vernacular language in Chennai) (Appendix B), for those who wished to answer in
Tamil. The other questionnaire was designed to be answered by HCPs (Appendix C). The
patient questionnaire was designed to be answered through an interview with the researcher,
while the health care professionals’ questionnaire was self-administered. The patient
questionnaire was developed with input from the research supervisor and Consultant
Diabetologists. The researcher also developed the questionnaire by drawing on experience
gained from working in a Chennai private hospital. The questionnaire was validated (face
validity and content validity) by three Consultant Diabetologists, not involved in development
of the questionnaire.
3.4.1.1 Patient questionnaire
The patient questionnaire was divided into the following five sections: demographic
characteristics of the patient, barriers to lifestyle modification, motivation, service needs and
knowledge of the diabetic patient. The barriers to lifestyle modification section was further
subdivided to include the specific lifestyle changes and their barriers; such as eating habits and
nutritional medical care. The researcher conducted all interviews with the patients that agreed
to participate.
3.4.1.2 Health provider questionnaire
The health provider questionnaire was divided into the following three sections: demographic
characteristics of the healthcare professional, medical care and motivation and barriers in
counselling. The health care providers completed the questionnaire on their own.
3.5 Data collection
Patients who met the inclusion criteria in the various in-patient wards were invited to
participate in the study. The researcher explained the aims and objectives of the study. The
researcher explained the informed consent form (Appendix D) to patients who were willing to
participate in the study. After consent was obtained, a time was set up to interview the patient
according to the patient’s convenience. The interviews were conducted by the researcher at the
patient’s bedside with at least one family member present during the interview, in line with a
requirement from the NABH. In general, most of the interviews were conducted in the private
70
rooms of the patients or in six-bedded general wards. The bilingual researcher conducted all
interviews in the language (English or Tamil) preferred by the patient. The HCPs with over
one year of experience were randomly selected and invited to participate. Once they agreed to
participate, they signed the consent forms. The HCPs completed the questionnaire in their own
time and returned them to the researcher
3.6 Pilot study
A pilot study was conducted in the general in-patient department of Apollo Speciality
Hospitals, Vanagaram. This site was chosen as it reflects the typical Indian diabetic population
residing in Chennai. Five adult diabetic patients who met the inclusion criteria participated in
the study. The unique hospital identification number of the pilot study patients were kept with
the researcher for the main study, so as not to use the same patients in the main study. The
inclusion criteria were type 2 diabetics, diagnosed for at least one year; aged between 18 to 70
years; no more than two co-morbidities, excluding renal complications; latest HbA1c available
and had seen a dietician previously. The researcher went through medical records of the
inpatients and those who fulfilled the above criteria were included. The researcher explained
the study to the patients who met the inclusion criteria. Those who agreed to participate were
interviewed according to their convenience. Three healthcare providers who met the inclusion
criteria agreed to participate in the study. The inclusion criterion was that the healthcare
provider should have been practising for more than one year. The objectives of the pilot study
were to assess whether the wording in the questionnaire was clear and unambiguous, to
determine the appropriateness and usefulness of all questions and to identify any repeated or
futile questions. The pilot study also aimed to approximate the time taken to complete the
questionnaire.
3.7 Reduction of bias
In order to reduce bias, the researcher ensured that there was no discussion between patients
while the interview was being conducted. Further to this, no two patients from the same 6-
bedded ward were interviewed during the same duration of stay in hospital. Although family
members were present, patients answered the questions on their own. Patients were encouraged
to be honest when completing the questionnaire and were assured that their responses would
71
remain anonymous and confidential. The researcher ensured that patients only participated
once, as the patient’s unique hospital identification number was noted for the researcher to
crosscheck before recruiting patients. The researcher requested the HCPs not to discuss their
answers with other health care providers and to keep all information disclosed confidential.
3.8 Data quality control
The researcher captured the data, which was crosschecked for possible errors. Responses were
coded and the codes were entered onto the Microsoft Excel spreadsheet. Questionnaires were
numbered for cross reference purposes. Errors were corrected before statistical analysis was
conducted.
3.9 Statistical analysis
Data was captured onto Microsoft Excel spread-sheets and transferred to a statistical package,
Statistical Package for Social Sciences (SPSS 22). The data was analysed by a statistician,
using appropriate statistical techniques such as descriptive statistics, chi-square goodness-of-
fit test, Spearman’s/Pearson correlation, one sample t-test, Binomial test, Kruskal Wallis test
and independent samples t-test. A p-value of <0.05 was regarded as being statistically
significant.
3.10 Ethical considerations
Ethical approval was obtained from the University of KwaZulu-Natal, Humanities and Social
Science Ethics Committee (HSS/0101/016M) (Appendix E). Apollo Hospitals: Institutional
Ethics Committee-Clinical Studies issued a supporting letter for the research to be conducted
(Appendix F). Each participant was required to read and sign a consent form before
participating in the study (Appendix D).
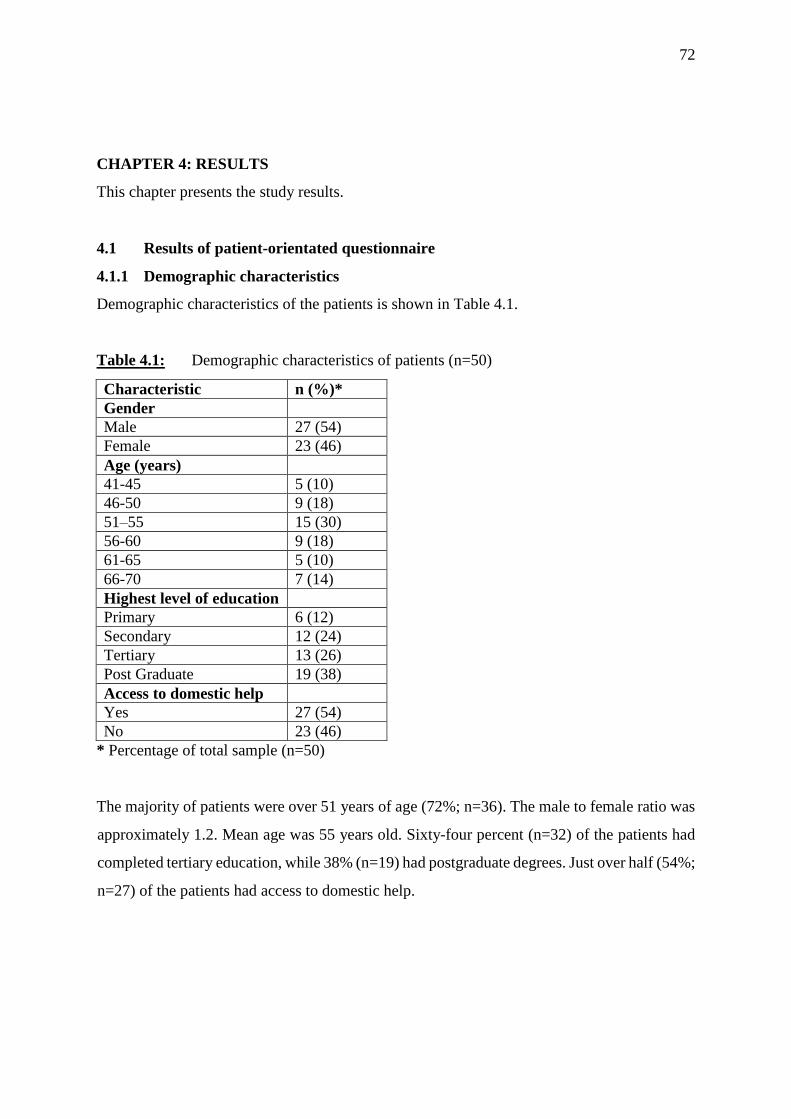
72
CHAPTER 4: RESULTS
This chapter presents the study results.
4.1 Results of patient-orientated questionnaire
4.1.1 Demographic characteristics
Demographic characteristics of the patients is shown in Table 4.1.
Table 4.1: Demographic characteristics of patients (n=50)
Characteristic n (%)*
Gender
Male 27 (54)
Female 23 (46)
Age (years)
41-45 5 (10)
46-50 9 (18)
51–55 15 (30)
56-60 9 (18)
61-65 5 (10)
66-70 7 (14)
Highest level of education
Primary 6 (12)
Secondary 12 (24)
Tertiary 13 (26)
Post Graduate 19 (38)
Access to domestic help
Yes 27 (54)
No 23 (46)
* Percentage of total sample (n=50)
The majority of patients were over 51 years of age (72%; n=36). The male to female ratio was
approximately 1.2. Mean age was 55 years old. Sixty-four percent (n=32) of the patients had
completed tertiary education, while 38% (n=19) had postgraduate degrees. Just over half (54%;
n=27) of the patients had access to domestic help.
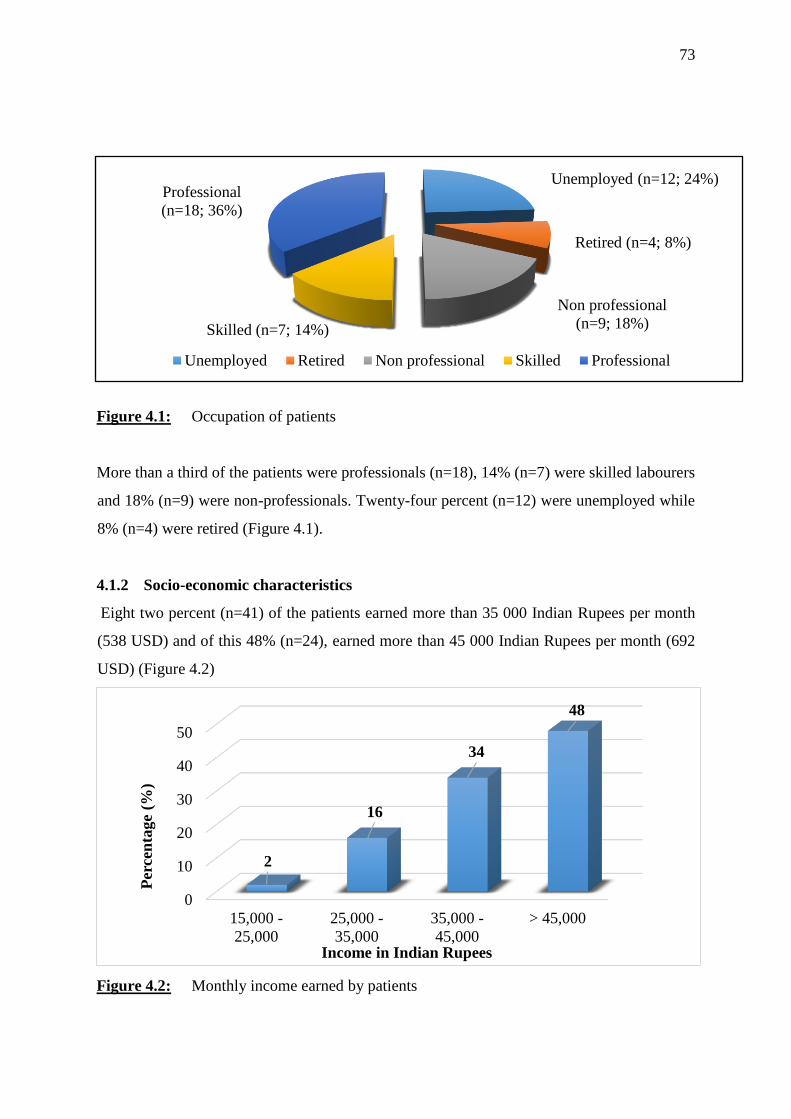
73
Figure 4.1: Occupation of patients
More than a third of the patients were professionals (n=18), 14% (n=7) were skilled labourers
and 18% (n=9) were non-professionals. Twenty-four percent (n=12) were unemployed while
8% (n=4) were retired (Figure 4.1).
4.1.2 Socio-economic characteristics
Eight two percent (n=41) of the patients earned more than 35 000 Indian Rupees per month
(538 USD) and of this 48% (n=24), earned more than 45 000 Indian Rupees per month (692
USD) (Figure 4.2)
Figure 4.2: Monthly income earned by patients
0
10
20
30
40
50
15,000 -
25,000
25,000 -
35,000
35,000 -
45,000
> 45,000
2
16
34
48
Per
cen
tage
(%)
Income in Indian Rupees
Unemployed (n=12; 24%)
Retired (n=4; 8%)
Non professional
(n=9; 18%)Skilled (n=7; 14%)
Professional
(n=18; 36%)
Unemployed Retired Non professional Skilled Professional
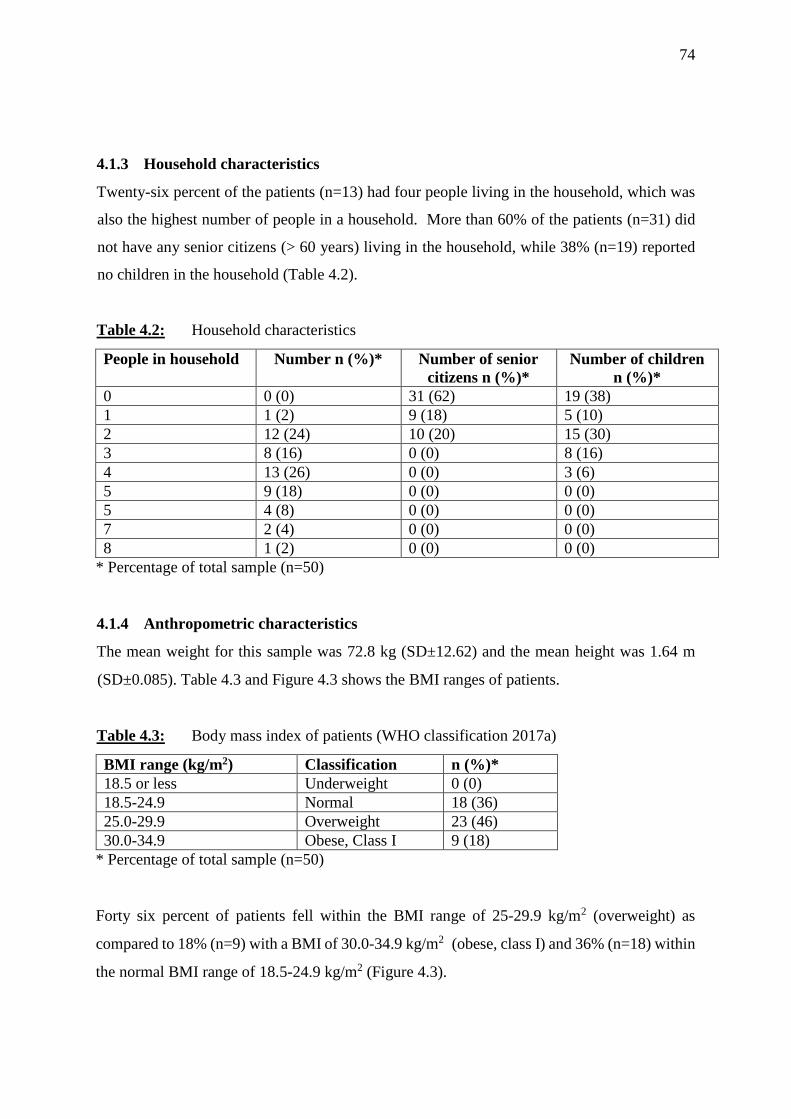
74
4.1.3 Household characteristics
Twenty-six percent of the patients (n=13) had four people living in the household, which was
also the highest number of people in a household. More than 60% of the patients (n=31) did
not have any senior citizens (> 60 years) living in the household, while 38% (n=19) reported
no children in the household (Table 4.2).
Table 4.2: Household characteristics
People in household Number n (%)* Number of senior
citizens n (%)*
Number of children
n (%)*
0 0 (0) 31 (62) 19 (38)
1 1 (2) 9 (18) 5 (10)
2 12 (24) 10 (20) 15 (30)
3 8 (16) 0 (0) 8 (16)
4 13 (26) 0 (0) 3 (6)
5 9 (18) 0 (0) 0 (0)
5 4 (8) 0 (0) 0 (0)
7 2 (4) 0 (0) 0 (0)
8 1 (2) 0 (0) 0 (0)
* Percentage of total sample (n=50)
4.1.4 Anthropometric characteristics
The mean weight for this sample was 72.8 kg (SD±12.62) and the mean height was 1.64 m
(SD±0.085). Table 4.3 and Figure 4.3 shows the BMI ranges of patients.
Table 4.3: Body mass index of patients (WHO classification 2017a)
BMI range (kg/m2) Classification n (%)*
18.5 or less Underweight 0 (0)
18.5-24.9 Normal 18 (36)
25.0-29.9 Overweight 23 (46)
30.0-34.9 Obese, Class I 9 (18)
* Percentage of total sample (n=50)
Forty six percent of patients fell within the BMI range of 25-29.9 kg/m2 (overweight) as
compared to 18% (n=9) with a BMI of 30.0-34.9 kg/m2 (obese, class I) and 36% (n=18) within
the normal BMI range of 18.5-24.9 kg/m2 (Figure 4.3).
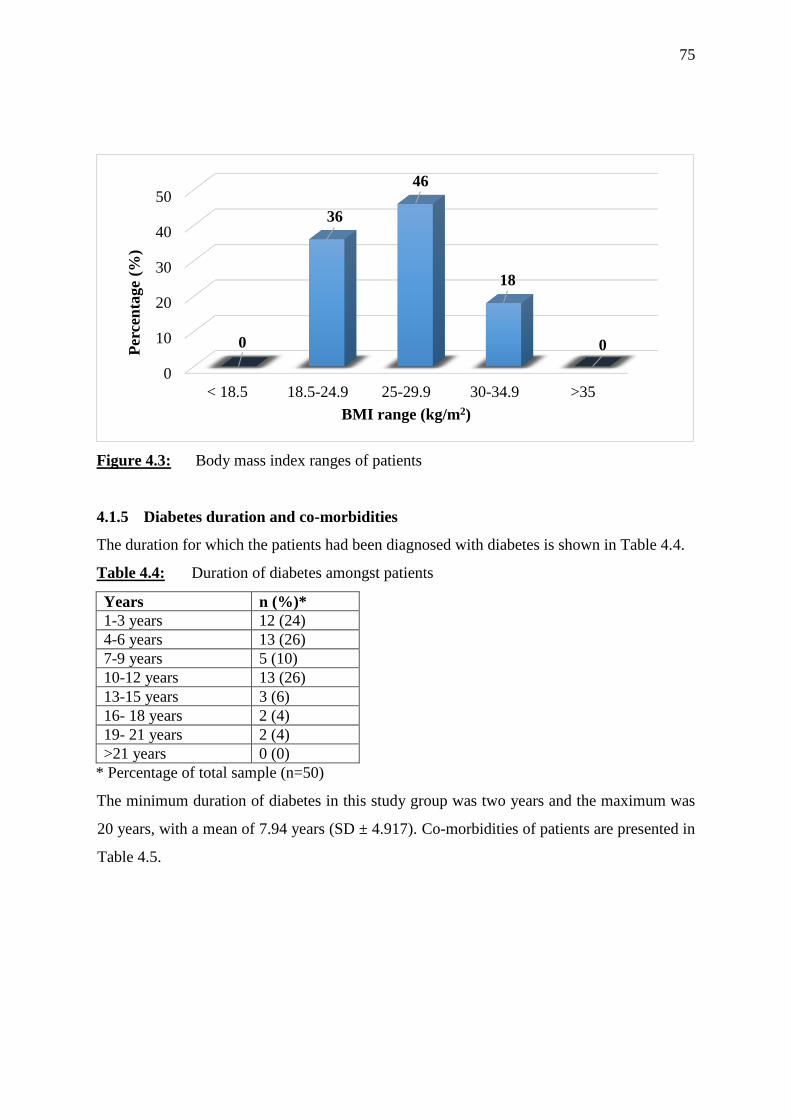
75
Figure 4.3: Body mass index ranges of patients
4.1.5 Diabetes duration and co-morbidities
The duration for which the patients had been diagnosed with diabetes is shown in Table 4.4.
Table 4.4: Duration of diabetes amongst patients
Years n (%)*
1-3 years 12 (24)
4-6 years 13 (26)
7-9 years 5 (10)
10-12 years 13 (26)
13-15 years 3 (6)
16- 18 years 2 (4)
19- 21 years 2 (4)
>21 years 0 (0)
* Percentage of total sample (n=50)
The minimum duration of diabetes in this study group was two years and the maximum was
20 years, with a mean of 7.94 years (SD ± 4.917). Co-morbidities of patients are presented in
Table 4.5.
0
10
20
30
40
50
< 18.5 18.5-24.9 25-29.9 30-34.9 >35
0
36
46
18
0Per
cen
tage
(%)
BMI range (kg/m2)
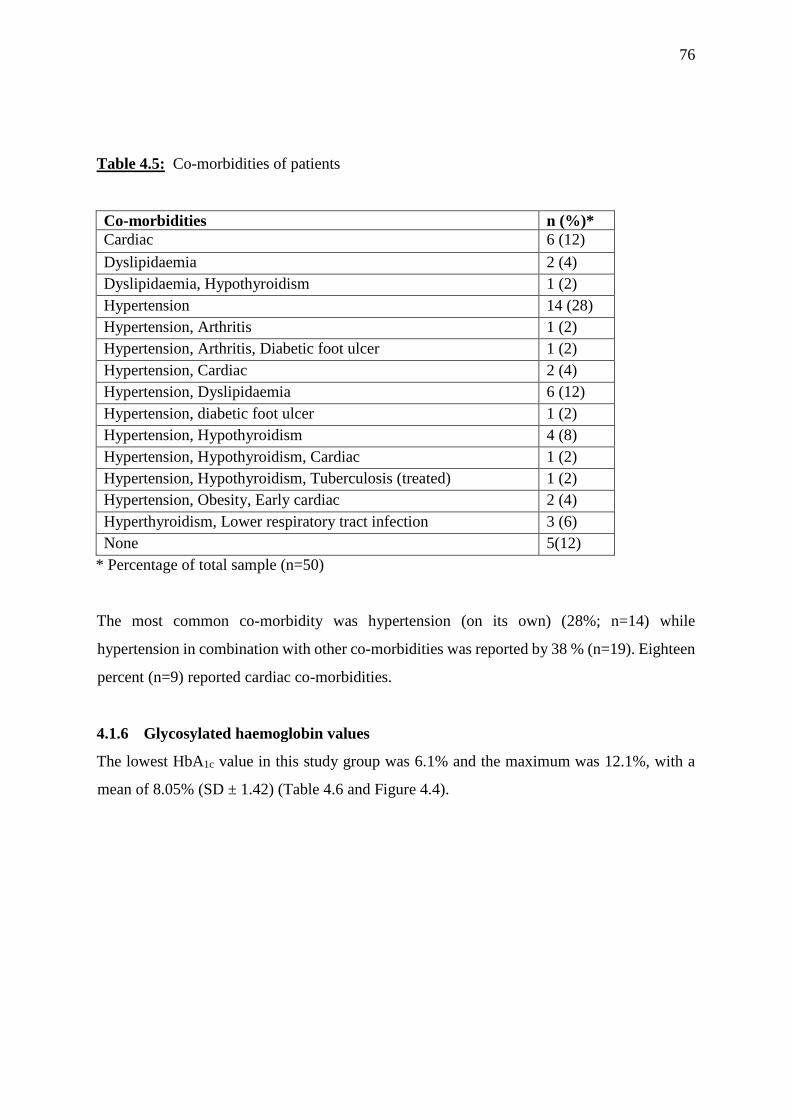
76
Table 4.5: Co-morbidities of patients
Co-morbidities n (%)*
Cardiac 6 (12)
Dyslipidaemia 2 (4)
Dyslipidaemia, Hypothyroidism 1 (2)
Hypertension 14 (28)
Hypertension, Arthritis 1 (2)
Hypertension, Arthritis, Diabetic foot ulcer 1 (2)
Hypertension, Cardiac 2 (4)
Hypertension, Dyslipidaemia 6 (12)
Hypertension, diabetic foot ulcer 1 (2)
Hypertension, Hypothyroidism 4 (8)
Hypertension, Hypothyroidism, Cardiac 1 (2)
Hypertension, Hypothyroidism, Tuberculosis (treated) 1 (2)
Hypertension, Obesity, Early cardiac 2 (4)
Hyperthyroidism, Lower respiratory tract infection 3 (6)
None 5(12)
* Percentage of total sample (n=50)
The most common co-morbidity was hypertension (on its own) (28%; n=14) while
hypertension in combination with other co-morbidities was reported by 38 % (n=19). Eighteen
percent (n=9) reported cardiac co-morbidities.
4.1.6 Glycosylated haemoglobin values
The lowest HbA1c value in this study group was 6.1% and the maximum was 12.1%, with a
mean of 8.05% (SD ± 1.42) (Table 4.6 and Figure 4.4).
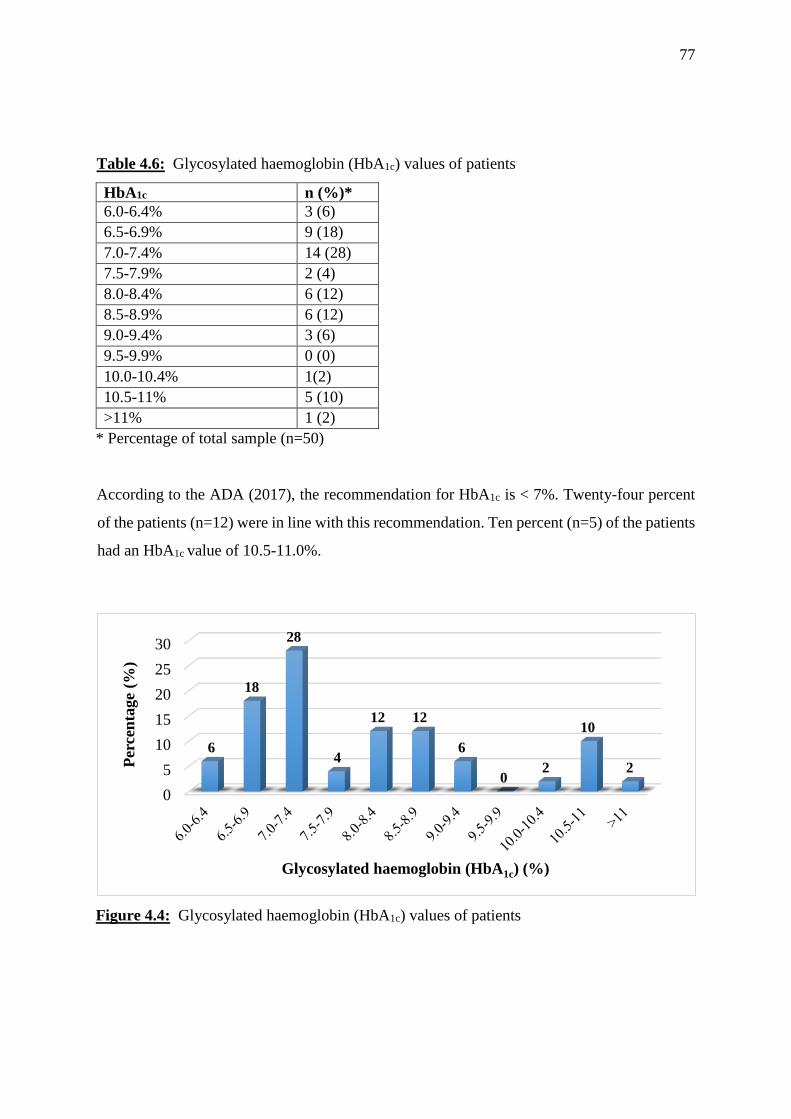
77
Table 4.6: Glycosylated haemoglobin (HbA1c) values of patients
HbA1c n (%)*
6.0-6.4% 3 (6)
6.5-6.9% 9 (18)
7.0-7.4% 14 (28)
7.5-7.9% 2 (4)
8.0-8.4% 6 (12)
8.5-8.9% 6 (12)
9.0-9.4% 3 (6)
9.5-9.9% 0 (0)
10.0-10.4% 1(2)
10.5-11% 5 (10)
>11% 1 (2)
* Percentage of total sample (n=50)
According to the ADA (2017), the recommendation for HbA1c is < 7%. Twenty-four percent
of the patients (n=12) were in line with this recommendation. Ten percent (n=5) of the patients
had an HbA1c value of 10.5-11.0%.
Figure 4.4: Glycosylated haemoglobin (HbA1c) values of patients
0
5
10
15
20
25
30
6
18
28
4
12 12
6
02
10
2Per
cen
tage
(%)
Glycosylated haemoglobin (HbA1c) (%)

78
4.1.7 Diet followed and meal preparation
The type of diets consumed by patients is shown in Figure 4.5
Figure 4.5: Types of diets consumed by patients
A mixed diet (including meat and vegetables) was followed by 80% (n=40) of the patients,
while 20% (n=10) followed a vegetarian diet (specifically lacto-vegetarian diet). About half of
the patients (n=25) reported that their wives were responsible for preparing their meals, while
42% (n=21) prepared their own meals and 4% (n=2) had meals prepared by their mother and
daughter (Figure 4.6).
Figure 4.6: Person that prepares meals
Vegetarian diet
(20%)
Mixed diet
(80%)
Vegetarian diet Mixed diet
0
5
10
15
20
25
30
35
40
45
50
Wife Mother Own Daughter
50
4
42
4
Per
cen
tage
(%)
Person that prepares meals
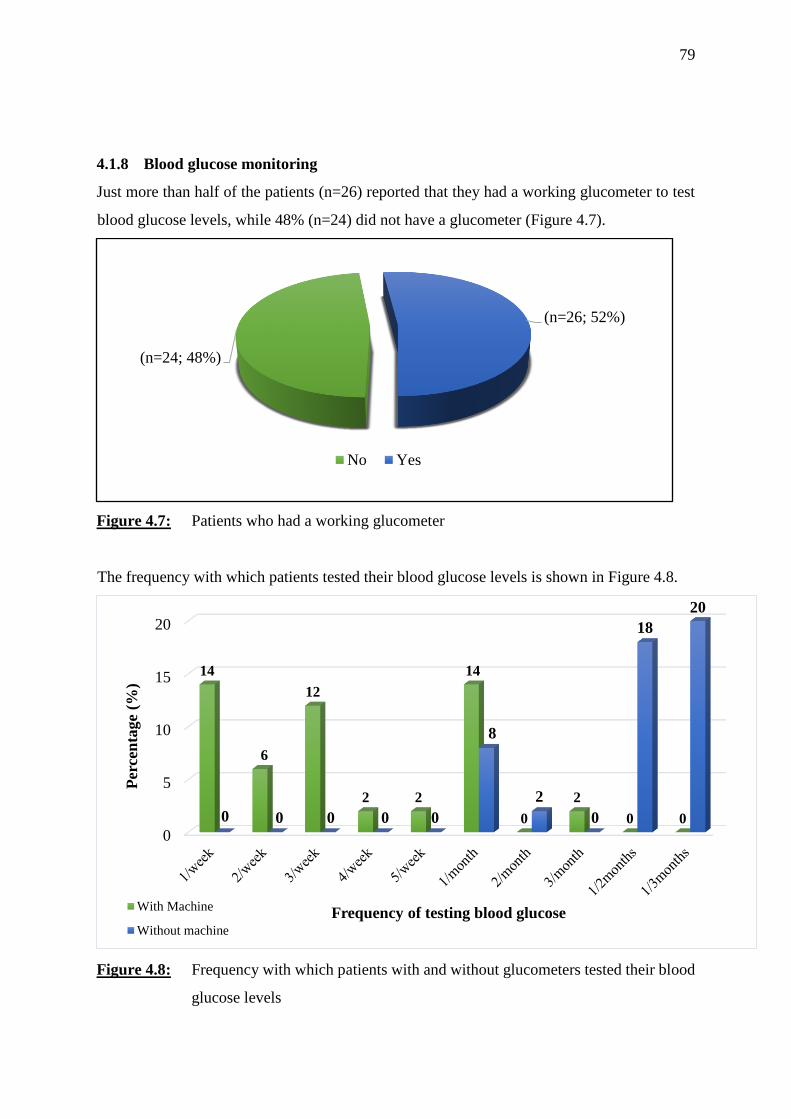
79
4.1.8 Blood glucose monitoring
Just more than half of the patients (n=26) reported that they had a working glucometer to test
blood glucose levels, while 48% (n=24) did not have a glucometer (Figure 4.7).
Figure 4.7: Patients who had a working glucometer
The frequency with which patients tested their blood glucose levels is shown in Figure 4.8.
Figure 4.8: Frequency with which patients with and without glucometers tested their blood
glucose levels
(n=24; 48%)
(n=26; 52%)
No Yes
0
5
10
15
20
14
6
12
2 2
14
0
2
0 00 0 0 0 0
8
2
0
18
20
Per
cen
tage
(%)
Frequency of testing blood glucoseWith Machine
Without machine
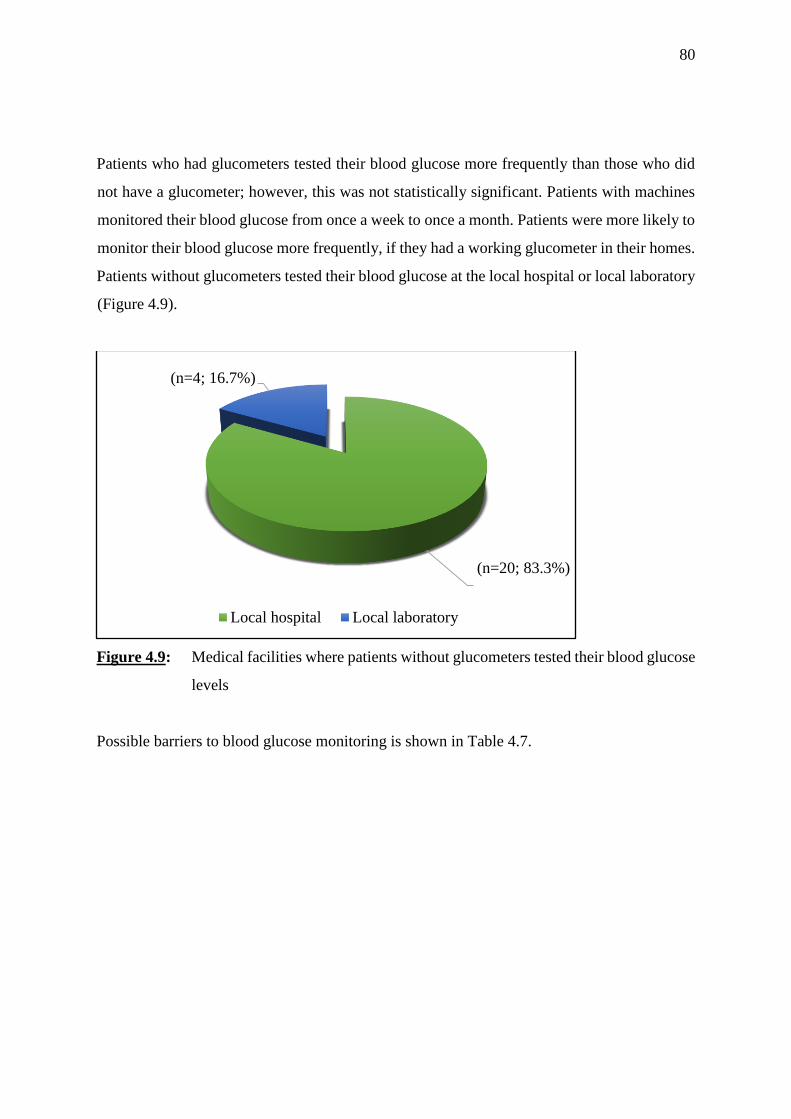
80
Patients who had glucometers tested their blood glucose more frequently than those who did
not have a glucometer; however, this was not statistically significant. Patients with machines
monitored their blood glucose from once a week to once a month. Patients were more likely to
monitor their blood glucose more frequently, if they had a working glucometer in their homes.
Patients without glucometers tested their blood glucose at the local hospital or local laboratory
(Figure 4.9).
Figure 4.9: Medical facilities where patients without glucometers tested their blood glucose
levels
Possible barriers to blood glucose monitoring is shown in Table 4.7.
(n=20; 83.3%)
(n=4; 16.7%)
Local hospital Local laboratory
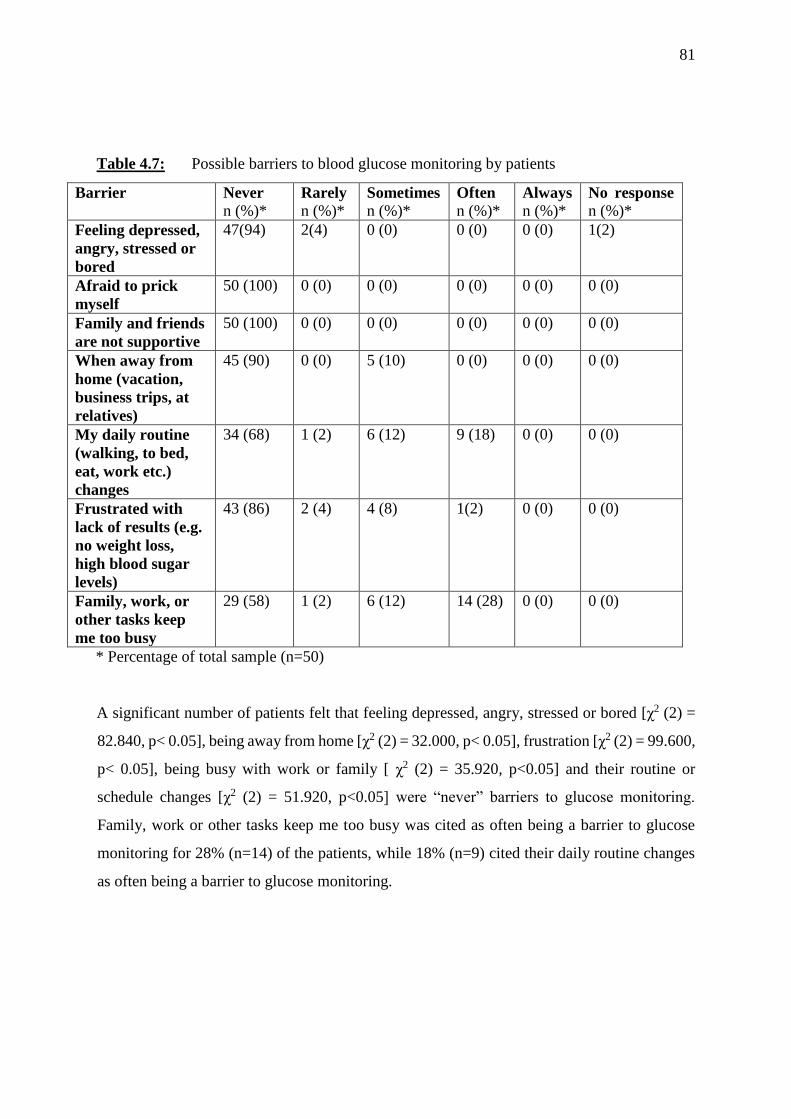
81
Table 4.7: Possible barriers to blood glucose monitoring by patients
Barrier Never
n (%)* Rarely
n (%)*
Sometimes
n (%)*
Often
n (%)*
Always
n (%)*
No response
n (%)*
Feeling depressed,
angry, stressed or
bored
47(94) 2(4) 0 (0) 0 (0) 0 (0) 1(2)
Afraid to prick
myself
50 (100) 0 (0) 0 (0) 0 (0) 0 (0) 0 (0)
Family and friends
are not supportive
50 (100) 0 (0) 0 (0) 0 (0) 0 (0) 0 (0)
When away from
home (vacation,
business trips, at
relatives)
45 (90) 0 (0) 5 (10) 0 (0) 0 (0) 0 (0)
My daily routine
(walking, to bed,
eat, work etc.)
changes
34 (68) 1 (2) 6 (12) 9 (18) 0 (0) 0 (0)
Frustrated with
lack of results (e.g.
no weight loss,
high blood sugar
levels)
43 (86) 2 (4) 4 (8) 1(2) 0 (0) 0 (0)
Family, work, or
other tasks keep
me too busy
29 (58) 1 (2) 6 (12) 14 (28) 0 (0) 0 (0)
* Percentage of total sample (n=50)
A significant number of patients felt that feeling depressed, angry, stressed or bored [χ2 (2) =
82.840, p< 0.05], being away from home [χ2 (2) = 32.000, p< 0.05], frustration [χ2 (2) = 99.600,
p< 0.05], being busy with work or family [ χ2 (2) = 35.920, p<0.05] and their routine or
schedule changes [χ2 (2) = 51.920, p<0.05] were “never” barriers to glucose monitoring.
Family, work or other tasks keep me too busy was cited as often being a barrier to glucose
monitoring for 28% (n=14) of the patients, while 18% (n=9) cited their daily routine changes
as often being a barrier to glucose monitoring.
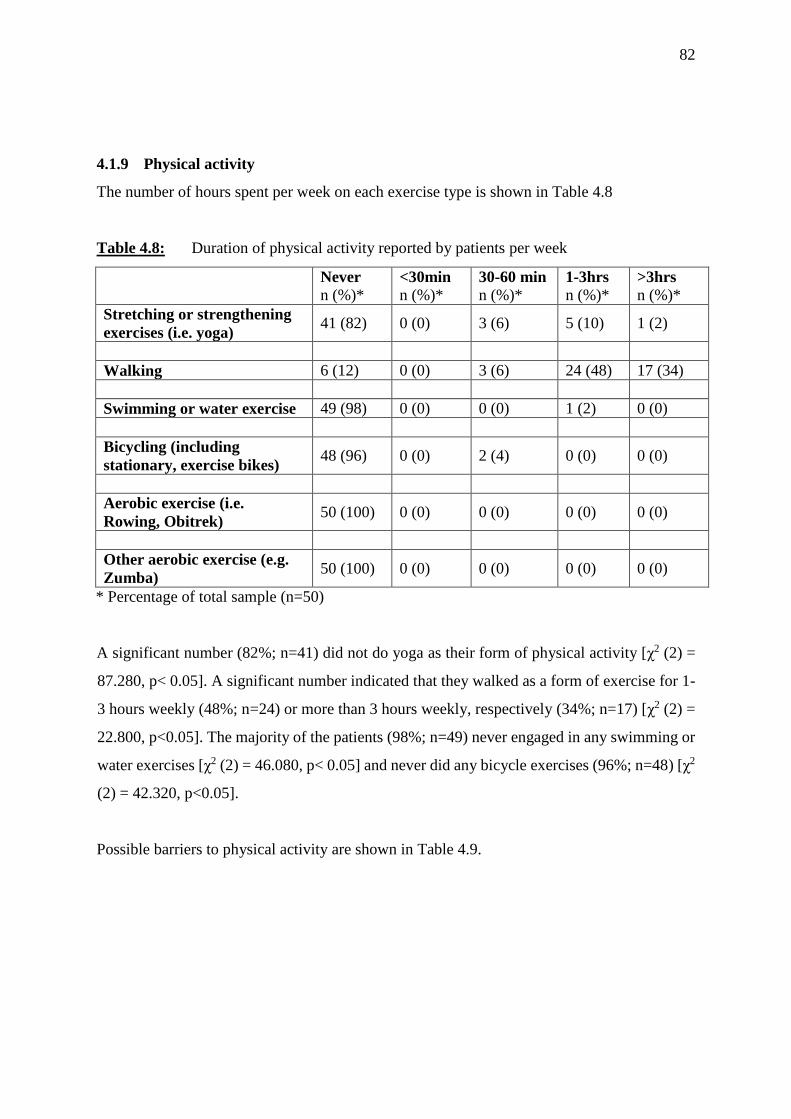
82
4.1.9 Physical activity
The number of hours spent per week on each exercise type is shown in Table 4.8
Table 4.8: Duration of physical activity reported by patients per week
Never
n (%)* <30min
n (%)*
30-60 min
n (%)*
1-3hrs
n (%)*
>3hrs
n (%)*
Stretching or strengthening
exercises (i.e. yoga) 41 (82) 0 (0) 3 (6) 5 (10) 1 (2)
Walking 6 (12) 0 (0) 3 (6) 24 (48) 17 (34)
Swimming or water exercise 49 (98) 0 (0) 0 (0) 1 (2) 0 (0)
Bicycling (including
stationary, exercise bikes) 48 (96) 0 (0) 2 (4) 0 (0) 0 (0)
Aerobic exercise (i.e.
Rowing, Obitrek) 50 (100) 0 (0) 0 (0) 0 (0) 0 (0)
Other aerobic exercise (e.g.
Zumba) 50 (100) 0 (0) 0 (0) 0 (0) 0 (0)
* Percentage of total sample (n=50)
A significant number (82%; n=41) did not do yoga as their form of physical activity [χ2 (2) =
87.280, p< 0.05]. A significant number indicated that they walked as a form of exercise for 1-
3 hours weekly (48%; n=24) or more than 3 hours weekly, respectively (34%; n=17) [χ2 (2) =
22.800, p<0.05]. The majority of the patients (98%; n=49) never engaged in any swimming or
water exercises [χ2 (2) = 46.080, p< 0.05] and never did any bicycle exercises (96%; n=48) [χ2
(2) = 42.320, p<0.05].
Possible barriers to physical activity are shown in Table 4.9.

83
Table 4.9: Possible barriers to physical activity
Barriers Never
n (%)*
Rarely
n (%)*
Sometimes
n (%)*
Often
n (%)*
Always
n (%)*
No response
n (%)*
Feeling depressed,
angry, stressed or
bored
42 (84) 0 (0) 8 (16) 0 (0) 0 (0) 0 (0)
Exercise and
physical activity
cause pain and
discomfort for me
17 (34) 11 (22) 18 (36) 4 (8) 0 (0) 0 (0)
Family and
friends are not
supportive
48 (96) 1 (2) 1 (2) 0 (0) 0 (0) 0 (0)
When away from
home (vacation,
business trips, at
relatives)
47 (94) 0 (0) 3 (6) 0 (0) 0 (0) 0 (0)
My daily routine
(walking, to bed,
eat, work etc.)
changes
30 (60) 2 (4) 11 (22) 2 (4) 5 (10) 0 (0)
Frustrated with
lack of results
(e.g. No weight
loss, high blood
sugar level)
44 (88) 3 (6) 3 (6) 0 (0) 0 (0) 0 (0)
Family, work, or
other tasks keep
me to busy
26 (52) 2 (4) 6 (12) 16 (32) 0 (0) 0 (0)
* Percentage of total sample (n=50)
A significant number of patients felt that feeling depressed, angry, stressed or bored
[χ2 (2) = 23.120, p<0.05], being away from home [χ2 (2) = 38.720, p<0.05], frustration [, χ2 (2)
= 67.240, p<0.05], their routine or schedule changes [χ2 (2) = 55.400, p<0.05] and support
from family [χ2 (2) = 88.360, p<0.05] were “never” barriers to physical activity.
Family, work or other tasks keep me too busy was cited as often being a barrier to physical
activity for 32% (n=16) of the patients, while 8% (n=4) cited fear or pain from exercise as
often being a barrier to physical activity.
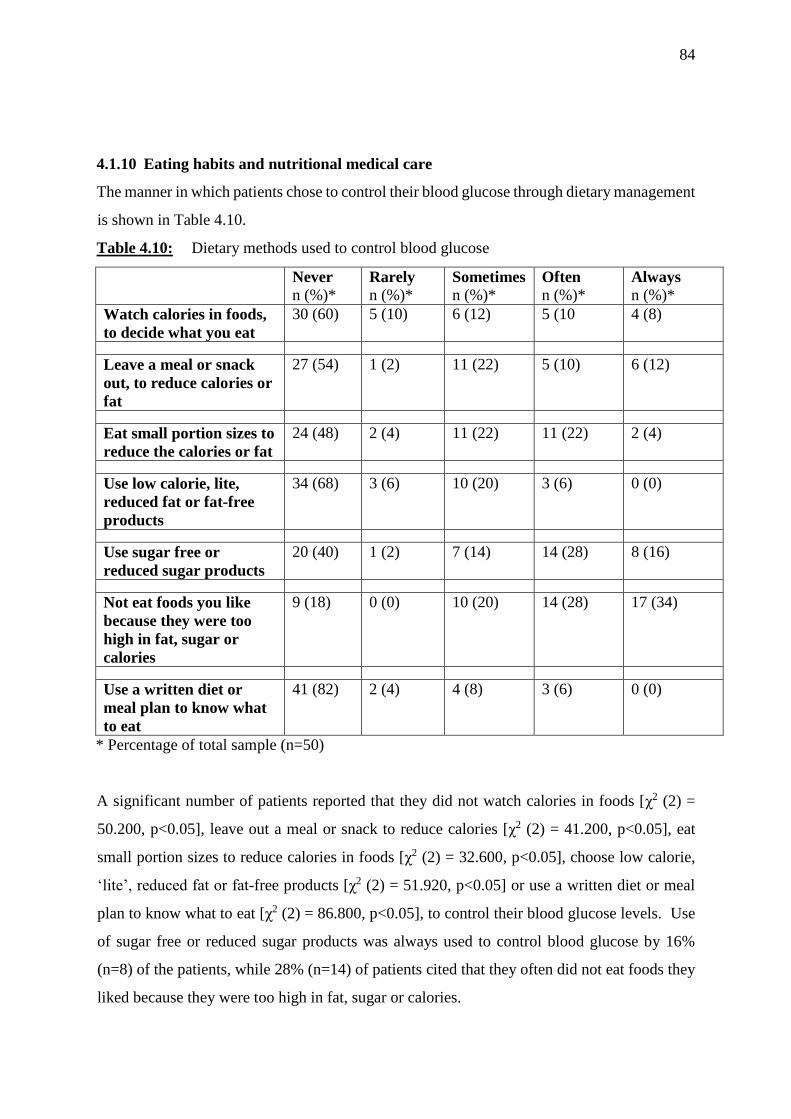
84
4.1.10 Eating habits and nutritional medical care
The manner in which patients chose to control their blood glucose through dietary management
is shown in Table 4.10.
Table 4.10: Dietary methods used to control blood glucose
Never
n (%)* Rarely
n (%)*
Sometimes
n (%)*
Often
n (%)*
Always
n (%)*
Watch calories in foods,
to decide what you eat
30 (60) 5 (10) 6 (12) 5 (10 4 (8)
Leave a meal or snack
out, to reduce calories or
fat
27 (54) 1 (2) 11 (22) 5 (10) 6 (12)
Eat small portion sizes to
reduce the calories or fat
24 (48) 2 (4) 11 (22) 11 (22) 2 (4)
Use low calorie, lite,
reduced fat or fat-free
products
34 (68) 3 (6) 10 (20) 3 (6) 0 (0)
Use sugar free or
reduced sugar products
20 (40) 1 (2) 7 (14) 14 (28) 8 (16)
Not eat foods you like
because they were too
high in fat, sugar or
calories
9 (18) 0 (0) 10 (20) 14 (28) 17 (34)
Use a written diet or
meal plan to know what
to eat
41 (82) 2 (4) 4 (8) 3 (6) 0 (0)
* Percentage of total sample (n=50)
A significant number of patients reported that they did not watch calories in foods [χ2 (2) =
50.200, p<0.05], leave out a meal or snack to reduce calories [χ2 (2) = 41.200, p<0.05], eat
small portion sizes to reduce calories in foods [χ2 (2) = 32.600, p<0.05], choose low calorie,
‘lite’, reduced fat or fat-free products [χ2 (2) = 51.920, p<0.05] or use a written diet or meal
plan to know what to eat [χ2 (2) = 86.800, p<0.05], to control their blood glucose levels. Use
of sugar free or reduced sugar products was always used to control blood glucose by 16%
(n=8) of the patients, while 28% (n=14) of patients cited that they often did not eat foods they
liked because they were too high in fat, sugar or calories.
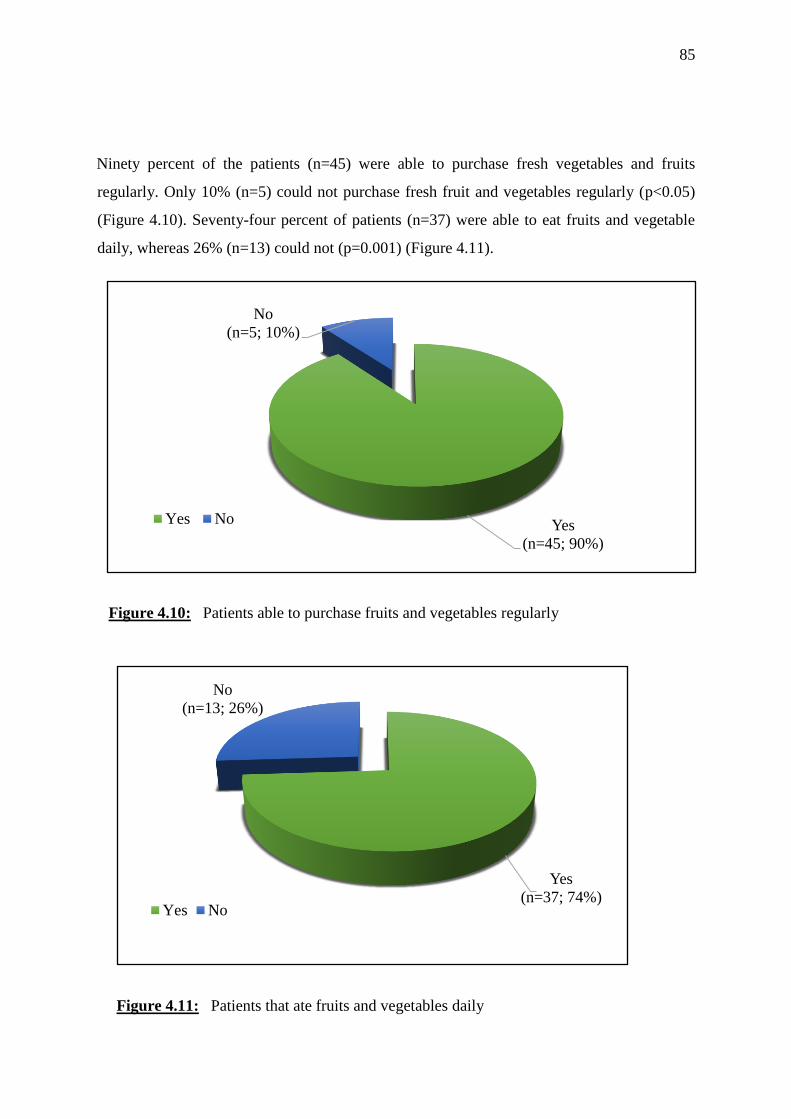
85
Ninety percent of the patients (n=45) were able to purchase fresh vegetables and fruits
regularly. Only 10% (n=5) could not purchase fresh fruit and vegetables regularly (p<0.05)
(Figure 4.10). Seventy-four percent of patients (n=37) were able to eat fruits and vegetable
daily, whereas 26% (n=13) could not (p=0.001) (Figure 4.11).
Figure 4.10: Patients able to purchase fruits and vegetables regularly
Figure 4.11: Patients that ate fruits and vegetables daily
Yes
(n=45; 90%)
No
(n=5; 10%)
Yes No
Yes
(n=37; 74%)
No
(n=13; 26%)
Yes No
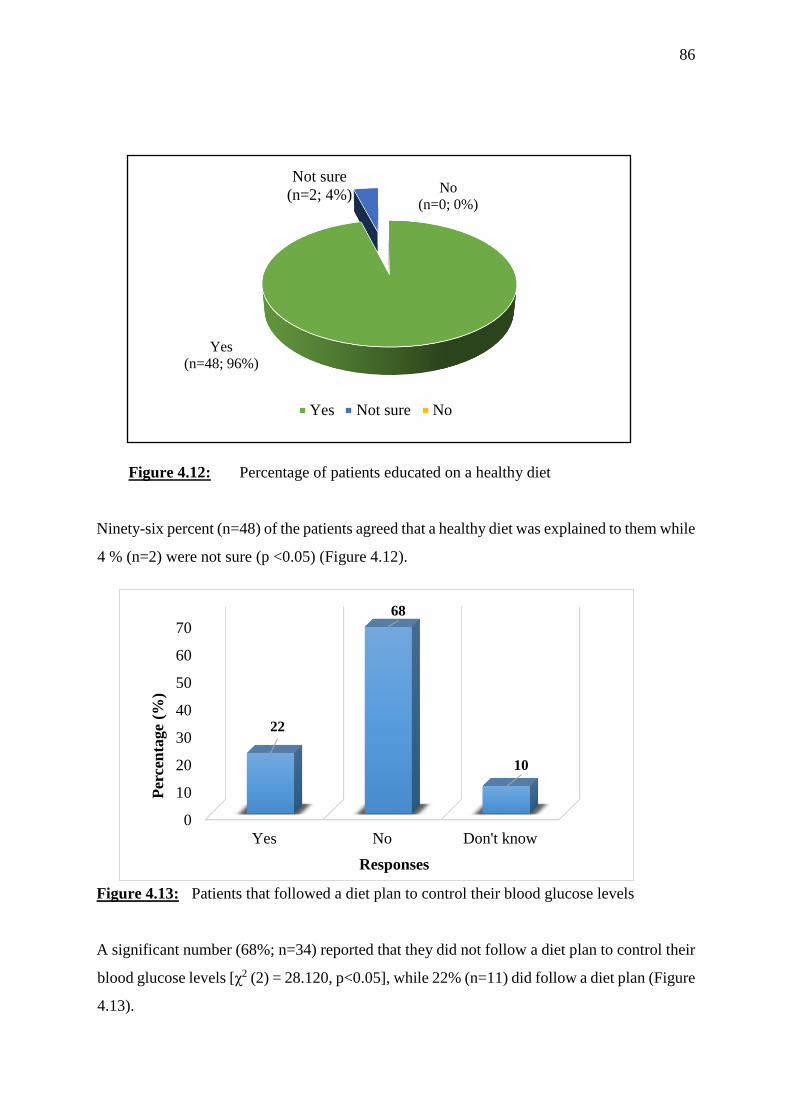
86
Figure 4.12: Percentage of patients educated on a healthy diet
Ninety-six percent (n=48) of the patients agreed that a healthy diet was explained to them while
4 % (n=2) were not sure (p <0.05) (Figure 4.12).
Figure 4.13: Patients that followed a diet plan to control their blood glucose levels
A significant number (68%; n=34) reported that they did not follow a diet plan to control their
blood glucose levels [χ2 (2) = 28.120, p<0.05], while 22% (n=11) did follow a diet plan (Figure
4.13).
Yes
(n=48; 96%)
Not sure
(n=2; 4%)No
(n=0; 0%)
Yes Not sure No
0
10
20
30
40
50
60
70
Yes No Don't know
22
68
10
Per
cen
tage
(%)
Responses
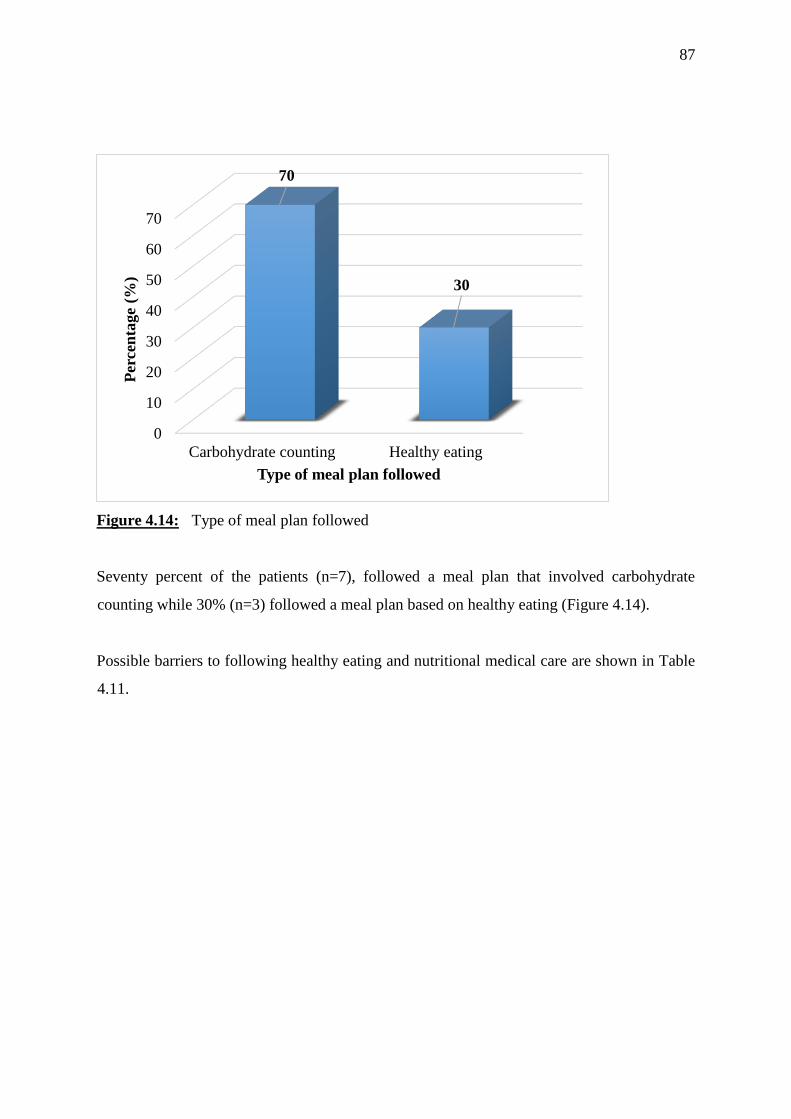
87
Figure 4.14: Type of meal plan followed
Seventy percent of the patients (n=7), followed a meal plan that involved carbohydrate
counting while 30% (n=3) followed a meal plan based on healthy eating (Figure 4.14).
Possible barriers to following healthy eating and nutritional medical care are shown in Table
4.11.
0
10
20
30
40
50
60
70
Carbohydrate counting Healthy eating
70
30
Per
cen
tage
(%)
Type of meal plan followed
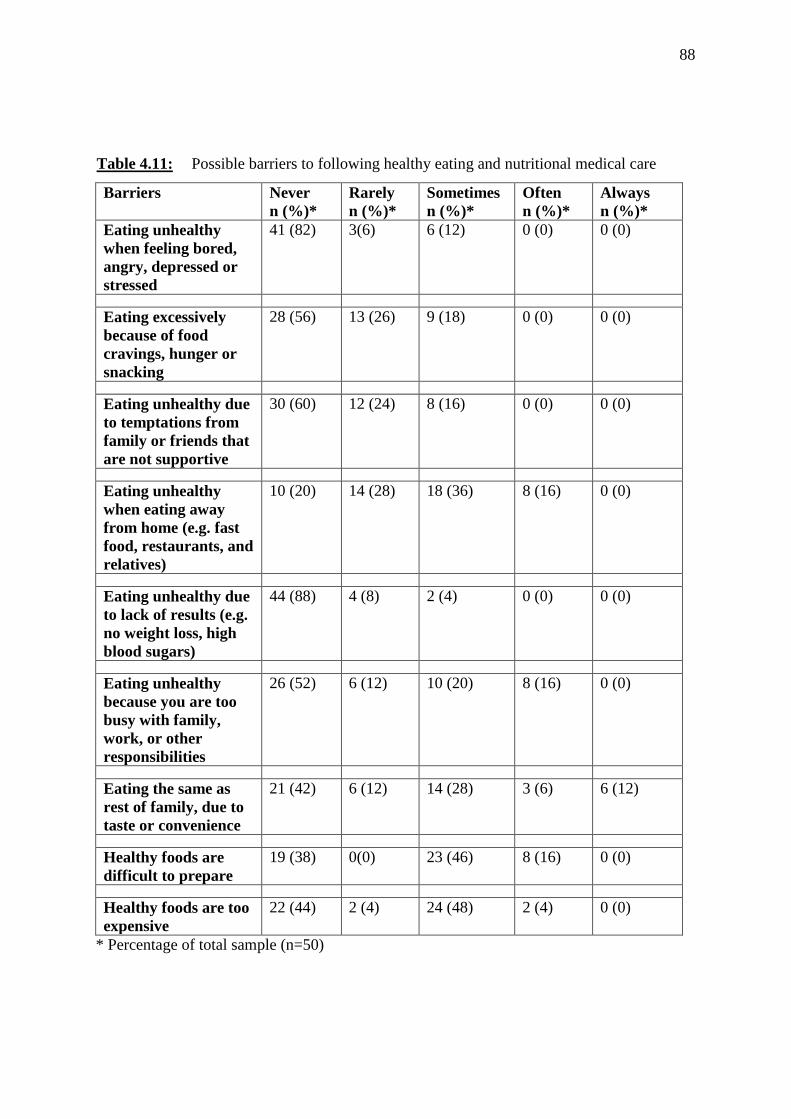
88
Table 4.11: Possible barriers to following healthy eating and nutritional medical care
Barriers Never
n (%)*
Rarely
n (%)*
Sometimes
n (%)*
Often
n (%)*
Always
n (%)*
Eating unhealthy
when feeling bored,
angry, depressed or
stressed
41 (82) 3(6) 6 (12) 0 (0) 0 (0)
Eating excessively
because of food
cravings, hunger or
snacking
28 (56) 13 (26) 9 (18) 0 (0) 0 (0)
Eating unhealthy due
to temptations from
family or friends that
are not supportive
30 (60) 12 (24) 8 (16) 0 (0) 0 (0)
Eating unhealthy
when eating away
from home (e.g. fast
food, restaurants, and
relatives)
10 (20) 14 (28) 18 (36) 8 (16) 0 (0)
Eating unhealthy due
to lack of results (e.g.
no weight loss, high
blood sugars)
44 (88) 4 (8) 2 (4) 0 (0) 0 (0)
Eating unhealthy
because you are too
busy with family,
work, or other
responsibilities
26 (52) 6 (12) 10 (20) 8 (16) 0 (0)
Eating the same as
rest of family, due to
taste or convenience
21 (42) 6 (12) 14 (28) 3 (6) 6 (12)
Healthy foods are
difficult to prepare
19 (38) 0(0) 23 (46) 8 (16) 0 (0)
Healthy foods are too
expensive
22 (44) 2 (4) 24 (48) 2 (4) 0 (0)
* Percentage of total sample (n=50)
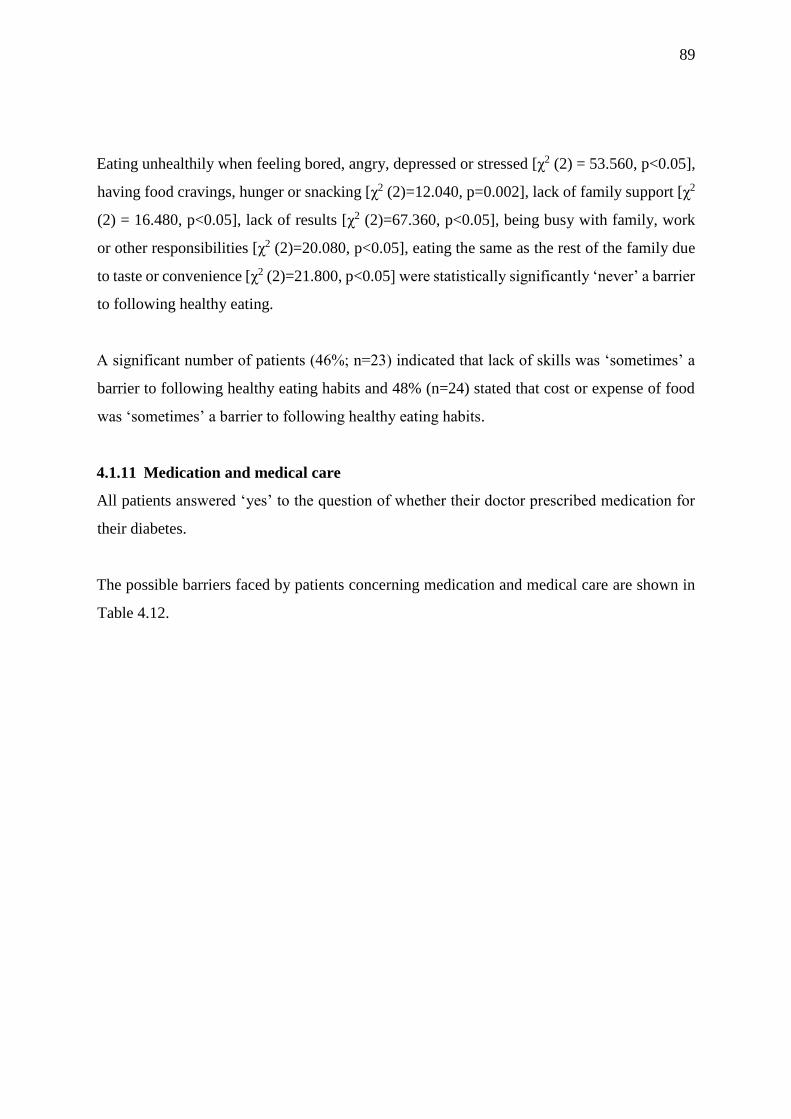
89
Eating unhealthily when feeling bored, angry, depressed or stressed [χ2 (2) = 53.560, p<0.05],
having food cravings, hunger or snacking [χ2 (2)=12.040, p=0.002], lack of family support [χ2
(2) = 16.480, p<0.05], lack of results [χ2 (2)=67.360, p<0.05], being busy with family, work
or other responsibilities [χ2 (2)=20.080, p<0.05], eating the same as the rest of the family due
to taste or convenience [χ2 (2)=21.800, p<0.05] were statistically significantly ‘never’ a barrier
to following healthy eating.
A significant number of patients (46%; n=23) indicated that lack of skills was ‘sometimes’ a
barrier to following healthy eating habits and 48% (n=24) stated that cost or expense of food
was ‘sometimes’ a barrier to following healthy eating habits.
4.1.11 Medication and medical care
All patients answered ‘yes’ to the question of whether their doctor prescribed medication for
their diabetes.
The possible barriers faced by patients concerning medication and medical care are shown in
Table 4.12.
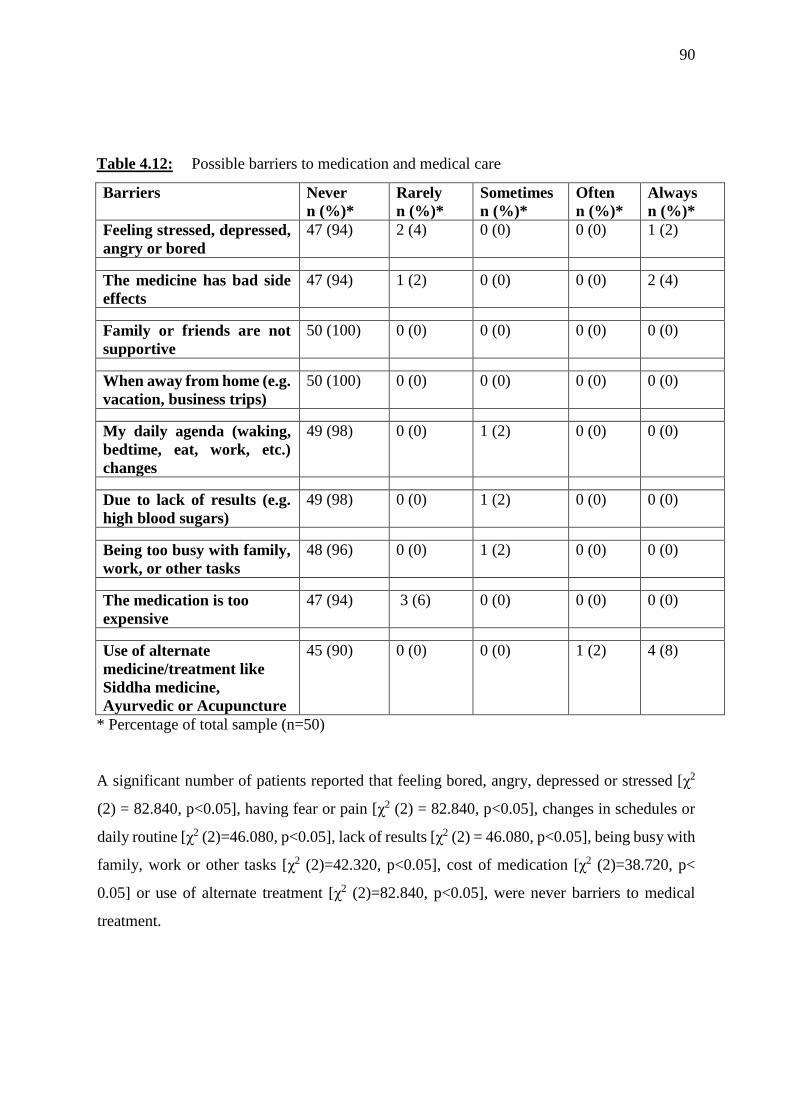
90
Table 4.12: Possible barriers to medication and medical care
Barriers Never
n (%)*
Rarely
n (%)*
Sometimes
n (%)*
Often
n (%)*
Always
n (%)*
Feeling stressed, depressed,
angry or bored
47 (94) 2 (4) 0 (0) 0 (0) 1 (2)
The medicine has bad side
effects
47 (94) 1 (2) 0 (0) 0 (0) 2 (4)
Family or friends are not
supportive
50 (100) 0 (0) 0 (0) 0 (0) 0 (0)
When away from home (e.g.
vacation, business trips)
50 (100) 0 (0) 0 (0) 0 (0) 0 (0)
My daily agenda (waking,
bedtime, eat, work, etc.)
changes
49 (98) 0 (0) 1 (2) 0 (0) 0 (0)
Due to lack of results (e.g.
high blood sugars)
49 (98) 0 (0) 1 (2) 0 (0) 0 (0)
Being too busy with family,
work, or other tasks
48 (96) 0 (0) 1 (2) 0 (0) 0 (0)
The medication is too
expensive
47 (94) 3 (6) 0 (0) 0 (0) 0 (0)
Use of alternate
medicine/treatment like
Siddha medicine,
Ayurvedic or Acupuncture
45 (90) 0 (0) 0 (0) 1 (2) 4 (8)
* Percentage of total sample (n=50)
A significant number of patients reported that feeling bored, angry, depressed or stressed [χ2
(2) = 82.840, p<0.05], having fear or pain [χ2 (2) = 82.840, p<0.05], changes in schedules or
daily routine [χ2 (2)=46.080, p<0.05], lack of results [χ2 (2) = 46.080, p<0.05], being busy with
family, work or other tasks [χ2 (2)=42.320, p<0.05], cost of medication [χ2 (2)=38.720, p<
0.05] or use of alternate treatment [χ2 (2)=82.840, p<0.05], were never barriers to medical
treatment.
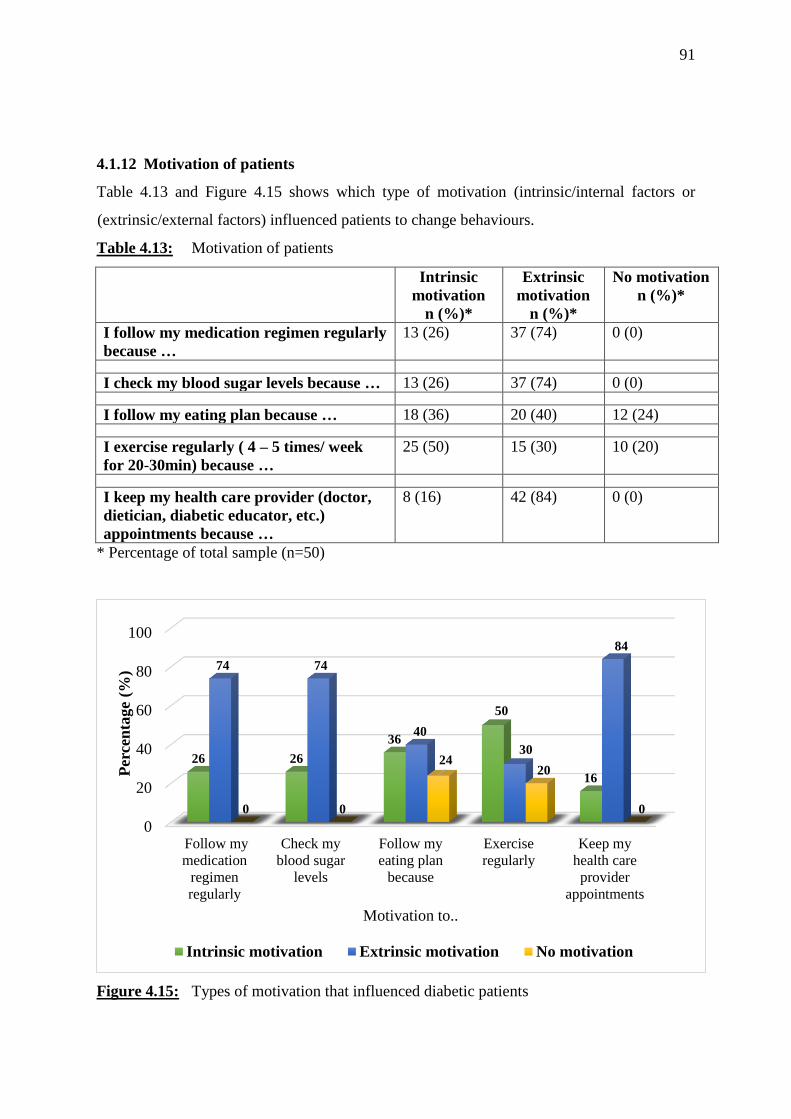
91
4.1.12 Motivation of patients
Table 4.13 and Figure 4.15 shows which type of motivation (intrinsic/internal factors or
(extrinsic/external factors) influenced patients to change behaviours.
Table 4.13: Motivation of patients
Intrinsic
motivation
n (%)*
Extrinsic
motivation
n (%)*
No motivation
n (%)*
I follow my medication regimen regularly
because …
13 (26) 37 (74) 0 (0)
I check my blood sugar levels because … 13 (26) 37 (74) 0 (0)
I follow my eating plan because … 18 (36) 20 (40) 12 (24)
I exercise regularly ( 4 – 5 times/ week
for 20-30min) because …
25 (50) 15 (30) 10 (20)
I keep my health care provider (doctor,
dietician, diabetic educator, etc.)
appointments because …
8 (16) 42 (84) 0 (0)
* Percentage of total sample (n=50)
Figure 4.15: Types of motivation that influenced diabetic patients
0
20
40
60
80
100
Follow my
medication
regimen
regularly
Check my
blood sugar
levels
Follow my
eating plan
because
Exercise
regularly
Keep my
health care
provider
appointments
26 26
36
50
16
74 74
40
30
84
0 0
2420
0
Per
cen
tage
(%)
Motivation to..
Intrinsic motivation Extrinsic motivation No motivation
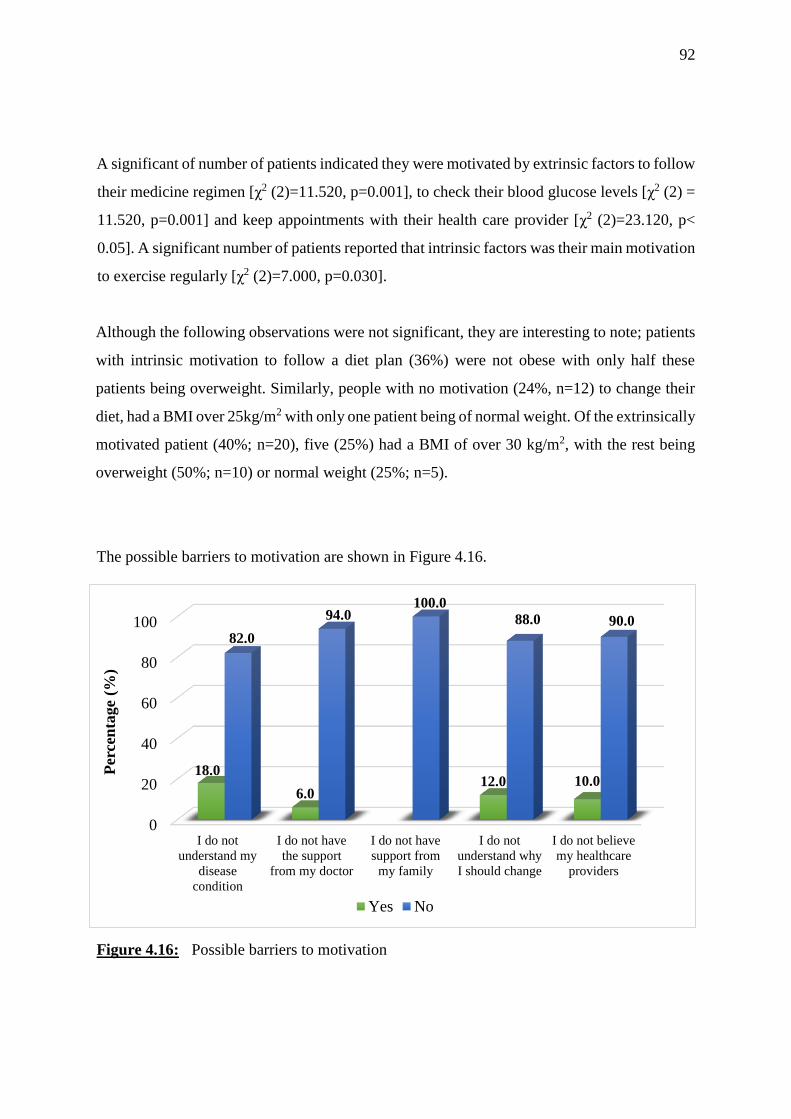
92
A significant of number of patients indicated they were motivated by extrinsic factors to follow
their medicine regimen [χ2 (2)=11.520, p=0.001], to check their blood glucose levels [χ2 (2) =
11.520, p=0.001] and keep appointments with their health care provider [χ2 (2)=23.120, p<
0.05]. A significant number of patients reported that intrinsic factors was their main motivation
to exercise regularly [χ2 (2)=7.000, p=0.030].
Although the following observations were not significant, they are interesting to note; patients
with intrinsic motivation to follow a diet plan (36%) were not obese with only half these
patients being overweight. Similarly, people with no motivation (24%, n=12) to change their
diet, had a BMI over 25kg/m2 with only one patient being of normal weight. Of the extrinsically
motivated patient (40%; n=20), five (25%) had a BMI of over 30 kg/m2, with the rest being
overweight (50%; n=10) or normal weight (25%; n=5).
The possible barriers to motivation are shown in Figure 4.16.
Figure 4.16: Possible barriers to motivation
0
20
40
60
80
100
I do not
understand my
disease
condition
I do not have
the support
from my doctor
I do not have
support from
my family
I do not
understand why
I should change
I do not believe
my healthcare
providers
18.0
6.012.0 10.0
82.0
94.0100.0
88.0 90.0
Per
cen
tage
(%)
Yes No
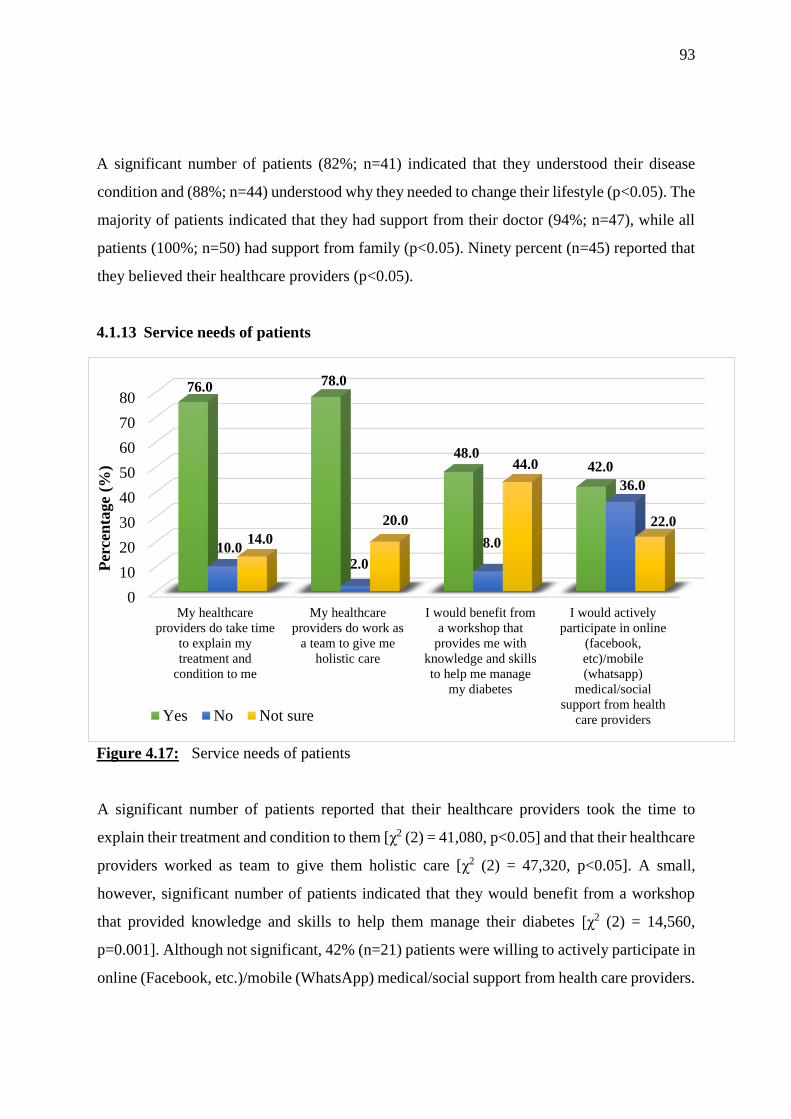
93
A significant number of patients (82%; n=41) indicated that they understood their disease
condition and (88%; n=44) understood why they needed to change their lifestyle (p<0.05). The
majority of patients indicated that they had support from their doctor (94%; n=47), while all
patients (100%; n=50) had support from family (p<0.05). Ninety percent (n=45) reported that
they believed their healthcare providers (p<0.05).
4.1.13 Service needs of patients
Figure 4.17: Service needs of patients
A significant number of patients reported that their healthcare providers took the time to
explain their treatment and condition to them [χ2 (2) = 41,080, p<0.05] and that their healthcare
providers worked as team to give them holistic care [χ2 (2) = 47,320, p<0.05]. A small,
however, significant number of patients indicated that they would benefit from a workshop
that provided knowledge and skills to help them manage their diabetes [χ2 (2) = 14,560,
p=0.001]. Although not significant, 42% (n=21) patients were willing to actively participate in
online (Facebook, etc.)/mobile (WhatsApp) medical/social support from health care providers.
0
10
20
30
40
50
60
70
80
My healthcare
providers do take time
to explain my
treatment and
condition to me
My healthcare
providers do work as
a team to give me
holistic care
I would benefit from
a workshop that
provides me with
knowledge and skills
to help me manage
my diabetes
I would actively
participate in online
(facebook,
etc)/mobile
(whatsapp)
medical/social
support from health
care providers
76.0 78.0
48.042.0
10.02.0
8.0
36.0
14.0
20.0
44.0
22.0
Per
cen
tage
(%)
Yes No Not sure
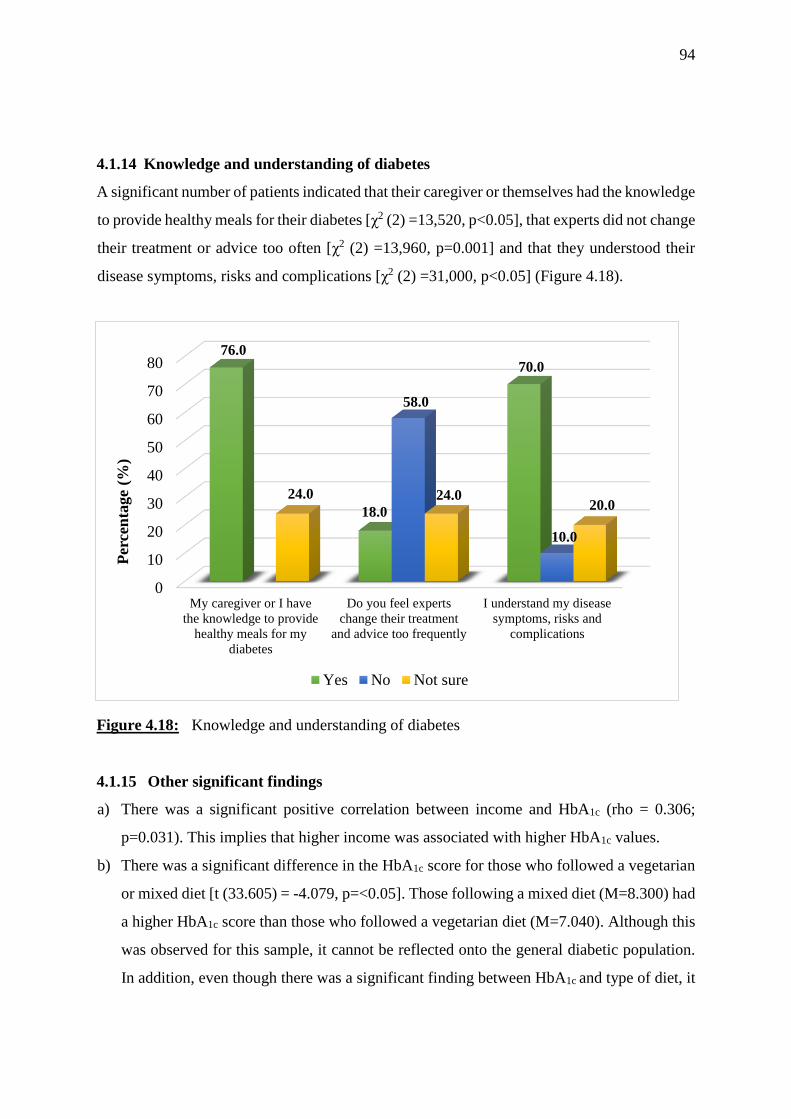
94
4.1.14 Knowledge and understanding of diabetes
A significant number of patients indicated that their caregiver or themselves had the knowledge
to provide healthy meals for their diabetes [χ2 (2) =13,520, p<0.05], that experts did not change
their treatment or advice too often [χ2 (2) =13,960, p=0.001] and that they understood their
disease symptoms, risks and complications [χ2 (2) =31,000, p<0.05] (Figure 4.18).
Figure 4.18: Knowledge and understanding of diabetes
4.1.15 Other significant findings
a) There was a significant positive correlation between income and HbA1c (rho = 0.306;
p=0.031). This implies that higher income was associated with higher HbA1c values.
b) There was a significant difference in the HbA1c score for those who followed a vegetarian
or mixed diet [t (33.605) = -4.079, p=<0.05]. Those following a mixed diet (M=8.300) had
a higher HbA1c score than those who followed a vegetarian diet (M=7.040). Although this
was observed for this sample, it cannot be reflected onto the general diabetic population.
In addition, even though there was a significant finding between HbA1c and type of diet, it
0
10
20
30
40
50
60
70
80
My caregiver or I have
the knowledge to provide
healthy meals for my
diabetes
Do you feel experts
change their treatment
and advice too frequently
I understand my disease
symptoms, risks and
complications
76.0
18.0
70.0
58.0
10.0
24.0 24.020.0
Per
cen
tage
(%)
Yes No Not sure
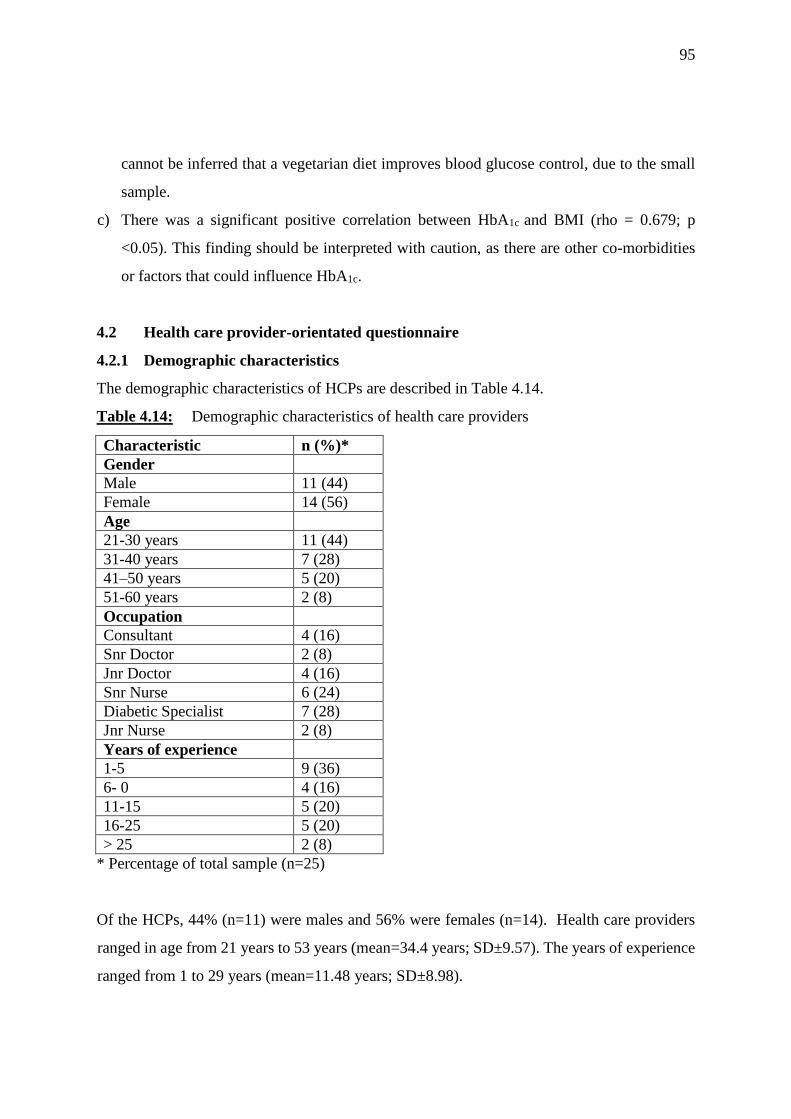
95
cannot be inferred that a vegetarian diet improves blood glucose control, due to the small
sample.
c) There was a significant positive correlation between HbA1c and BMI (rho = 0.679; p
<0.05). This finding should be interpreted with caution, as there are other co-morbidities
or factors that could influence HbA1c.
4.2 Health care provider-orientated questionnaire
4.2.1 Demographic characteristics
The demographic characteristics of HCPs are described in Table 4.14.
Table 4.14: Demographic characteristics of health care providers
Characteristic n (%)*
Gender
Male 11 (44)
Female 14 (56)
Age
21-30 years 11 (44)
31-40 years 7 (28)
41–50 years 5 (20)
51-60 years 2 (8)
Occupation
Consultant 4 (16)
Snr Doctor 2 (8)
Jnr Doctor 4 (16)
Snr Nurse 6 (24)
Diabetic Specialist 7 (28)
Jnr Nurse 2 (8)
Years of experience
1-5 9 (36)
6- 0 4 (16)
11-15 5 (20)
16-25 5 (20)
> 25 2 (8)
* Percentage of total sample (n=25)
Of the HCPs, 44% (n=11) were males and 56% were females (n=14). Health care providers
ranged in age from 21 years to 53 years (mean=34.4 years; SD±9.57). The years of experience
ranged from 1 to 29 years (mean=11.48 years; SD±8.98).

96
Figure 4.19 shows the occupation of the different healthcare providers that participated in the
study.
Figure 4.19: Occupation of health care providers
4.2.2 Medical care provided by healthcare providers
The responses on medical care provided by health care providers are shown in Table 4.15.
Consultant
( n=4; 16%)
Senior doctor
(n=2; 8%)
Junior doctor
(n=4; 16%)
Senior nurse
(n=6; 24%)
Diabetic educator,
(n=7; 16%)
Junior Nurse (n=2; 8%)
Dietician (n=3; 12%)
Consultant Senior doctor Junior doctor Senior nurse
Diabetic Educator Junior nurse Dietician
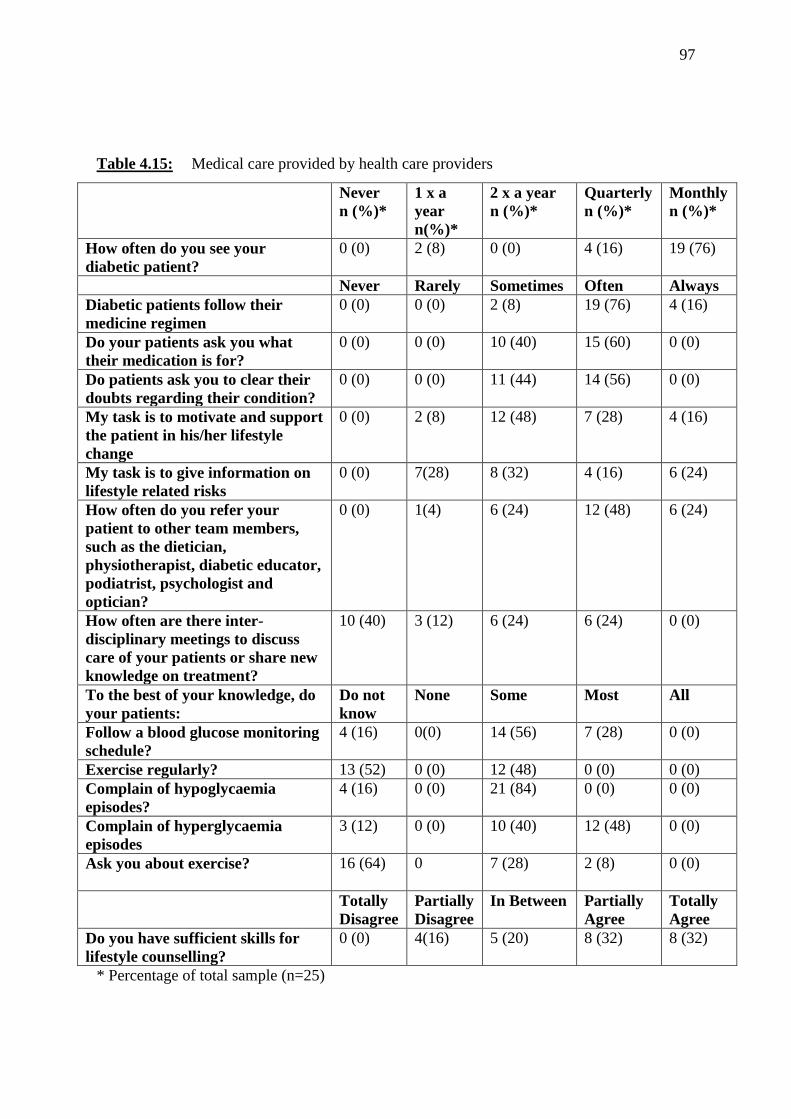
97
Table 4.15: Medical care provided by health care providers
Never
n (%)*
1 x a
year
n(%)*
2 x a year
n (%)*
Quarterly
n (%)*
Monthly
n (%)*
How often do you see your
diabetic patient?
0 (0) 2 (8) 0 (0) 4 (16) 19 (76)
Never Rarely Sometimes Often Always
Diabetic patients follow their
medicine regimen
0 (0) 0 (0) 2 (8) 19 (76) 4 (16)
Do your patients ask you what
their medication is for?
0 (0) 0 (0) 10 (40) 15 (60) 0 (0)
Do patients ask you to clear their
doubts regarding their condition?
0 (0) 0 (0) 11 (44) 14 (56) 0 (0)
My task is to motivate and support
the patient in his/her lifestyle
change
0 (0) 2 (8) 12 (48) 7 (28) 4 (16)
My task is to give information on
lifestyle related risks
0 (0) 7(28) 8 (32) 4 (16) 6 (24)
How often do you refer your
patient to other team members,
such as the dietician,
physiotherapist, diabetic educator,
podiatrist, psychologist and
optician?
0 (0) 1(4) 6 (24) 12 (48) 6 (24)
How often are there inter-
disciplinary meetings to discuss
care of your patients or share new
knowledge on treatment?
10 (40) 3 (12) 6 (24) 6 (24) 0 (0)
To the best of your knowledge, do
your patients:
Do not
know
None Some Most
All
Follow a blood glucose monitoring
schedule?
4 (16) 0(0) 14 (56) 7 (28) 0 (0)
Exercise regularly? 13 (52) 0 (0) 12 (48) 0 (0) 0 (0)
Complain of hypoglycaemia
episodes?
4 (16) 0 (0) 21 (84) 0 (0) 0 (0)
Complain of hyperglycaemia
episodes
3 (12) 0 (0) 10 (40) 12 (48) 0 (0)
Ask you about exercise?
16 (64) 0 7 (28) 2 (8) 0 (0)
Totally
Disagree
Partially
Disagree
In Between Partially
Agree
Totally
Agree
Do you have sufficient skills for
lifestyle counselling?
0 (0) 4(16) 5 (20) 8 (32) 8 (32)
* Percentage of total sample (n=25)
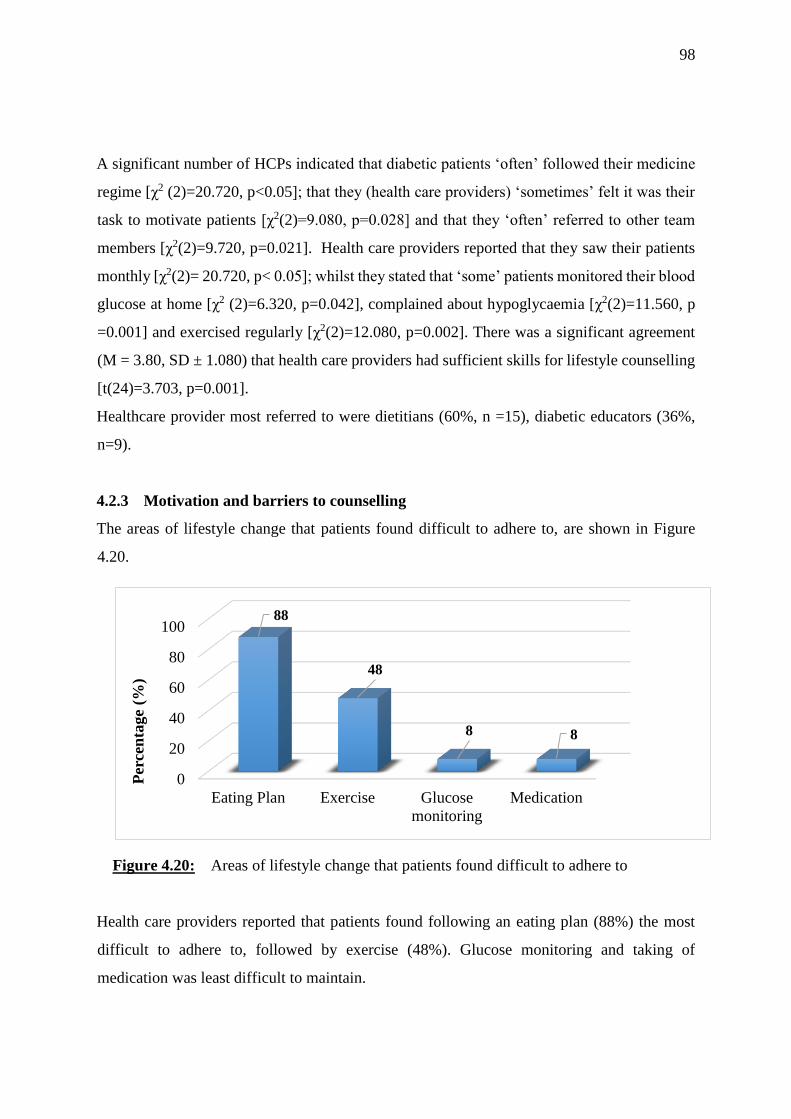
98
A significant number of HCPs indicated that diabetic patients ‘often’ followed their medicine
regime [χ2 (2)=20.720, p<0.05]; that they (health care providers) ‘sometimes’ felt it was their
task to motivate patients [χ2(2)=9.080, p=0.028] and that they ‘often’ referred to other team
members [χ2(2)=9.720, p=0.021]. Health care providers reported that they saw their patients
monthly [χ2(2)= 20.720, p< 0.05]; whilst they stated that ‘some’ patients monitored their blood
glucose at home [χ2 (2)=6.320, p=0.042], complained about hypoglycaemia [χ2(2)=11.560, p
=0.001] and exercised regularly [χ2(2)=12.080, p=0.002]. There was a significant agreement
(M = 3.80, SD ± 1.080) that health care providers had sufficient skills for lifestyle counselling
[t(24)=3.703, p=0.001].
Healthcare provider most referred to were dietitians (60%, n =15), diabetic educators (36%,
n=9).
4.2.3 Motivation and barriers to counselling
The areas of lifestyle change that patients found difficult to adhere to, are shown in Figure
4.20.
Figure 4.20: Areas of lifestyle change that patients found difficult to adhere to
Health care providers reported that patients found following an eating plan (88%) the most
difficult to adhere to, followed by exercise (48%). Glucose monitoring and taking of
medication was least difficult to maintain.
0
20
40
60
80
100
Eating Plan Exercise Glucose
monitoring
Medication
88
48
8 8
Per
cen
tage
(%)
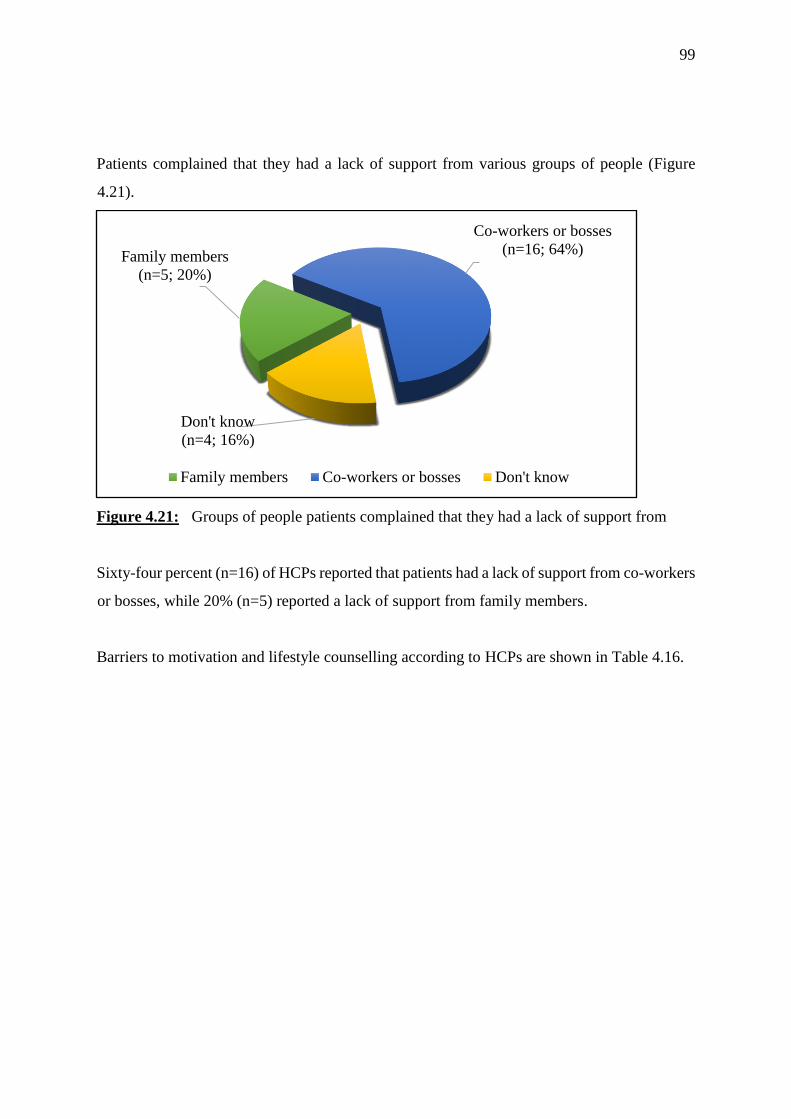
99
Patients complained that they had a lack of support from various groups of people (Figure
4.21).
Figure 4.21: Groups of people patients complained that they had a lack of support from
Sixty-four percent (n=16) of HCPs reported that patients had a lack of support from co-workers
or bosses, while 20% (n=5) reported a lack of support from family members.
Barriers to motivation and lifestyle counselling according to HCPs are shown in Table 4.16.
Family members
(n=5; 20%)
Co-workers or bosses
(n=16; 64%)
Don't know
(n=4; 16%)
Family members Co-workers or bosses Don't know
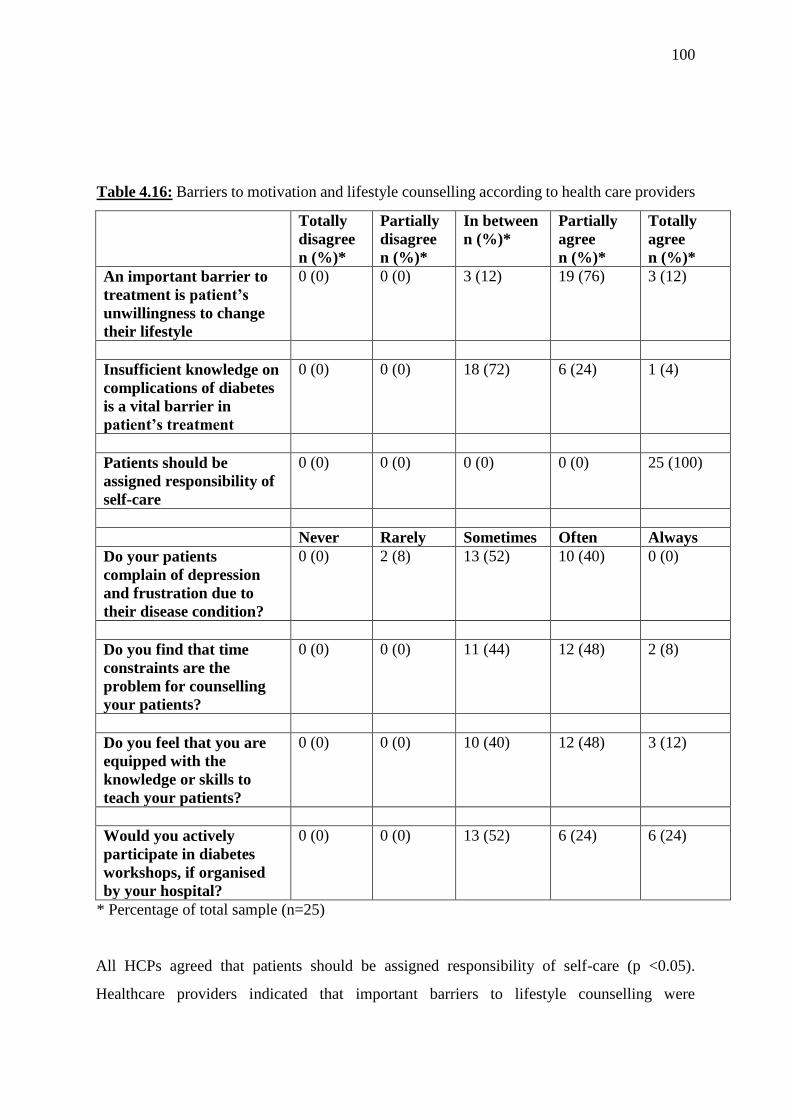
100
Table 4.16: Barriers to motivation and lifestyle counselling according to health care providers
Totally
disagree
n (%)*
Partially
disagree
n (%)*
In between
n (%)*
Partially
agree
n (%)*
Totally
agree
n (%)*
An important barrier to
treatment is patient’s
unwillingness to change
their lifestyle
0 (0) 0 (0) 3 (12) 19 (76) 3 (12)
Insufficient knowledge on
complications of diabetes
is a vital barrier in
patient’s treatment
0 (0) 0 (0) 18 (72) 6 (24) 1 (4)
Patients should be
assigned responsibility of
self-care
0 (0) 0 (0) 0 (0) 0 (0) 25 (100)
Never Rarely Sometimes Often Always
Do your patients
complain of depression
and frustration due to
their disease condition?
0 (0) 2 (8) 13 (52) 10 (40) 0 (0)
Do you find that time
constraints are the
problem for counselling
your patients?
0 (0) 0 (0) 11 (44) 12 (48) 2 (8)
Do you feel that you are
equipped with the
knowledge or skills to
teach your patients?
0 (0) 0 (0) 10 (40) 12 (48) 3 (12)
Would you actively
participate in diabetes
workshops, if organised
by your hospital?
0 (0) 0 (0) 13 (52) 6 (24) 6 (24)
* Percentage of total sample (n=25)
All HCPs agreed that patients should be assigned responsibility of self-care (p <0.05).
Healthcare providers indicated that important barriers to lifestyle counselling were
101
unwillingness to change [t (24)=10.000, p<0.05], insufficient knowledge on complications [t
(24) = 2.874, p=0.008] and lack of support from co-workers or bosses [χ2 (2)=10.640, p<0.05].
A significant number of patients indicated to health care providers that they ‘sometimes’ and
‘often’ felt depressed and frustrated [χ2 (2)=7.760, p=0.021] with their disease condition.
Healthcare providers indicated that they ‘sometimes’ and ‘often’ [χ2 (2)=7.280, p=0.026] felt
that time constraints prevented them from counselling their patients adequately.
4.2.4 Other significant findings
a. There was a significant positive correlation between the experience level of the HCPs and
the frequency with which they motivated and supported lifestyle changes (rho = 0.547, p
= 0.005). The more experience a healthcare provider had, the more likely they were to
motivate and support lifestyle changes.
b. There was a significant positive correlation between experience of healthcare providers
and how confident they were that they had the knowledge or skills needed, to teach their
patients (rho = 0.406, p = 0.004). The more experience a healthcare provider had, the more
confident they were that they had the knowledge or skills needed to teach their patients.
c. There was a strong significant positive correlation between the experience of healthcare
providers and the frequency with which they referred patients to other team members (rho
= 0.767, p < 0.0005). The more experience a healthcare provider had, the more likely they
were to refer their patients to other team members.
d. There was a significant positive correlation between experience of healthcare providers
and how confident they were that they had the skills for lifestyle counselling (rho = 0.577,
p = 0.003). The more experience a healthcare provider had, the more confident they were,
that they had the skills needed to counsel patients on lifestyle changes.
4.3 Summary of findings
The diabetic patients in this study ranged in age from 41 to 68 years, with a mean weight,
height and BMI of 72 kg, 1.64 m and 26.8 kg/m2, respectively. The ratio of male to female was
1.2. Most patients had hypertension alone as a comorbidity and the mean HbA1c was 8.05%.
Most patients consumed a mixed diet (80%) and 42% of patients prepared their own meals.
Fifty four percent of patients had domestic help, 48% had an income greater than 45 000 Indian

102
Rupees (692 USD) per month, and 38% held postgraduate degrees. Patients reported no
significant barriers to glucose monitoring, although 28% indicated that being busy with family
was a barrier. Most patients (88%; n=44) did some amount of walking weekly, with 34%
completing more than 3 hours per week, whilst yoga was the next most common exercise
(18%). Common barriers to exercise were fear and pain (44%) and being busy with work or
family (72%). Most patients avoided foods high in fat, sugar or calories (82%; n=41), used
sugar free or reduced sugar products (58%; n=29) and ate small portion sizes to reduce their
calorie intake (52%; n=26). The most common barriers to not eating healthily were eating away
from home (52%; n=26), cost or expense of healthy foods (52%; n=26) and taste of food (46%;
n=23). Extrinsic motivation significantly influenced the decision to follow medication
(p=0.001), check blood glucose levels (p=0.001) and keep health care appointments
(p<0.0005). Exercise was the only habit this population followed regularly due to intrinsic
motivation (p=0.030). Significantly, 82% of patients indicated that they understood their
disease condition (p<0.0005), whilst a significant small number reported that they would
benefit from a workshop that provided knowledge and skills to help manage diabetes
(p=0.001). Most patients had confidence in treatment and advice obtained from health care
providers (p=.001) and their own skills and knowledge to prepare healthy meals (p<0.0005).
Most patients understood their disease condition and complications (p<0.0005). A higher
income (p=0.031) and consuming a mixed diet (p<0.0005) was associated with higher HbA1c
levels amongst patients. Health care providers felt that they had sufficient skills for lifestyle
counselling (p=0.001), but also reported that their biggest barrier to counselling was time
constraints (p=0.026). Health care providers indicated that patients found following an eating
plan (88%) the most difficult to maintain, followed by exercise (48%). Healthcare providers
all agreed that patients should be assigned responsibility for self-care (p<0.0005), even though
healthcare providers indicated that important barriers to lifestyle changes were unwillingness
to change (p <0.0005), insufficient knowledge on complications (p =.008) and lack of support
from co-workers or bosses (p=0.005).
CHAPTER 5: DISCUSSION
103
This study aimed to evaluate the barriers to lifestyle modification, motivation, knowledge and
service needs of diabetic adults and their health care providers in Chennai, Tamil Nadu, India.
This chapter discusses the results presented in Chapter 4.
5.1 Patient-orientated questionnaire
5.1.1 Demographic characteristics
All study participants were of Indian origin and living in Tamil Nadu, India. The sample
interviewed at Apollo Speciality Hospital in Vanagaram represents Chennai’s middle to higher
socio-economic group. Although, there were patients from poorer backgrounds, they were able
to receive treatment from a private hospital, due to medical aid benefits from their employers.
The sample comprised of 50 patients with 54% male (n=27) and 46% female (n=23), with a
male to female ratio of 1.2. This is similar to the Tamil Nadu sex ratio of 1.02 for urban areas
(NFHS-4 2016b) and with the sex ratio from the CURES dietary profile of diabetics in Chennai
of 0.82 (Radhika et al 2010). The minimum age was 41 years and maximum was 68 years with
a mean of 55 years (SD±7.18). This is consistent with findings from Kapur et al (2008), which
reported a mean age of 53 years (SD±10.2) and Ramachandran et al (2007) (mean=56.2 years
and SD±10.5). Sixty-four percent (n=32) of the patients had completed tertiary education, with
38% (n=19) being postgraduate degree holders. Kapur et al (2008) (Chennai) reported that
48% (n=154) of their subjects had a college education. The possible reason for the current
study population having a higher education level, could be that this study is more recent. In
the current study, 64% of the diabetics had completed tertiary education. This was higher than
findings from Kapur et al (2008) and Ramachandran et al (2007) who both reported that 45%
of diabetics had a college or tertiary education. This could be a reflection of the strides India
has made in higher education over the last decade. The results of this study are on par with the
statistics from the state survey which indicated that 58.6% of women had 10 or more years of
schooling in urban areas of Tamil Nadu (NFHS-4 2016b), increasing from 31.8% in 2005.
5.1.2 Socio-economic characteristics
A high percentage (82%) of people in this sample earned more than 35 000 Indian Rupees per
month (538 USD); this was much higher than that observed by Ramachandran et al (2007) of
approximately 8 300 Indian Rupees per month (128 USD) for urban families. This is possibly
104
due to inflation and the improvement of the economy in India. The facility used in this study
was a private specialist hospital, so it is expected that the patients using the facility would earn
a higher salary. According to Kumar et al (2008), families with a higher average family
income and education profile are known to spend more on diabetes care. This trend was
observed in the current study, as those earning a higher salary had opted to use a private
hospital, instead of a government hospital.
All 12 (24%) unemployed patients were women and were housewives. Of the 12, 8% (n=4)
had tertiary education and a monthly household income of greater than 35 000 Indian Rupees
(538 USD); except for one patient who was a widow living on her own, being supported by
her son. Interestingly, this patient was one out of three other senior citizens in this category
who were unemployed, but had domestic help. This further reflects the social-economic
wellness of the Indian middle class families in this sample. Thirty six percent of patients (n=18)
were professionals, all of whom earned more than 45 000 Indian Rupees (692 USD) per month.
This amount was more than double that reported by Ramachandran et al (2007). This is
consistent with the original premise that diabetes was a disease of the wealthy, which may
show how India’s fast progressing economy has led to an increase in chronic diseases of
lifestyle, such as diabetes. This is likely due to the rapid introduction of western fast foods,
higher in fat and refined carbohydrates, into the Indian diet (Yadav et al 2008a; Popkin 2001)
and sedentary lifestyles (Kalra & Unnikrishnan 2012; Mohan et al 2009).
5.1.3 Household characteristics
The percentage of people that lived in a nuclear family was 62%, as compared to Kapur et al
(2008) who found that 59% of diabetics lived in a nuclear family. This finding seems to be
representative of the ‘modern’ middle-class India, as the country was traditionally known to
have more joint families than nuclear (a couple and their dependent children, regarded as a
basic social unit) families. Fifty four percent of households had domestic help in this sample,
again indicating an increase in the socio-economic status of middle-class India. In this sample,
50% (n=25) of the patient’s wives did the cooking, 42% (n=21) of patients cooked for
themselves or their daughters or mothers cooked for them (4% respectively). Colles et al
(2013) observed a similar trend, as 57% of patient’s wives did the cooking. Interestingly, no
105
male patient cooked for himself in this sample, which is indicative of Indian culture and gender
roles that exist within this community. In the Indian community, women are still expected to
do the cooking, even if they have careers.
5.1.4 Anthropometric characteristics
The mean weight of this sample was 72.8 kg (SD±12.62) and the mean height was 1.64 m
(SD±0.085). Mohan et al (2013), who reported a mean weight of 69.1 kg (SD±10.2), noted
similar findings. In the current study, 46% were overweight, as compared to 40.8% (in
Chennai), reported by Ramachandran, Mary, Yamuna, Murugesan & Snehalatha (2008). This
increase over an eight year period could be due to continuing urbanisation and change of eating
habits from traditional to western (fast foods). The mean BMI reported in this study was 26.8
kg/m2 (SD±3.098), which was similar to the mean BMI of 26.3 kg/m2 (SD±3.7), observed in
the A1chieve study (Mohan et al 2013). Body mass index was positively associated with HbA1c
in this sample. A similar positive correlation was found in Najran, Saudi Arabia (Babikr,
Alshahrani, Hamid, Abdelraheem & Shalayel 2016). This suggests that achieving and
maintaining a normal body weight may improve glucose control. However, no other Indian
studies have reported this positive correlation.
5.1.5 Diabetes duration and co-morbidities
The most common co-morbidity was HTN (64%, n=32), while 12% (n=6) reported cardiac co-
morbidities. This was consistent with Mohan et al (2013) who reported that 50% of diabetic
individuals had HTN. The mean duration of diabetes in the current study was 7.94 years (SD
± 4.917), while Kapur et al (2007) reported, a mean duration of 8.9 years (SD ± 6.5) and
Ramachandran et al (2007) reported 10.4 years (SD ± 7.1). This difference could possibly be
due to the difference in study population and sample size.
5.1.6 Glycosylated haemoglobin values
The mean HbA1c in this study sample was 8.05% (SD ± 1.42). Colles et al (2013) observed
similar results of 8.2% ± 1.7. The current study did not find any significant relationship
between duration of diabetes and HbA1c. However, the A1chieve study (Mohan et al 2013) did
report that blood glucose control (mean HbA1c = 9.2%) was worse in patients with a longer
106
duration of diabetes (9.9 ± 5.5 years). In this study, the small sample size could explain the
lack of significant findings between blood glucose control and diabetes duration. There was a
positive association between HbA1c and income, with a higher HbA1c reported in patients with
higher income. This was in contrast to studies conducted in the Netherlands and Sweden, which
found that patients with lower HbA1c at diagnosis had a higher income (Elissen, Hertroijs,
Schaper, Bosma, Dagnelie, Henry, van der Kallen, Koster, Schram, Stehouwer, Schouten,
Berendschot & Ruwaard 2017; Martinell, Pingel, Hallqvist, Dorkhan, Groop, Rosengren,
Storm & Stålhammar 2017). This could possibly be because India is an emerging economy
while the Netherlands and Sweden have more established economies. People living in India
are only now attaining jobs, lifestyles and income that western countries have experienced for
decades. This trend may change in a few years in India, as it did in the west.
5.1.7 Diet followed and meal preparation
Twenty percent (n=10) of patients were lacto-vegetarians while 80% followed a mixed diet.
Contrastingly, in New Delhi, India, Apollo Specialist Hospital reported that 60.1% of their
subjects were vegetarian (Colles et al 2013). In the current study, those following a mixed diet
had higher HbA1c scores than those who followed a vegetarian diet. However, this observation
cannot be applied to the diabetes community in general, as the sample size was too small.
Yokoyama, Barnard, Levin & Watanabe (2015) in their meta-analysis found that a vegetarian
diet significantly reduced HbA1c by 0.4 percentage points in patients with T2DM. Kahleova &
Pelikanova (2015) found that vegetarian diets were healthy, nutritionally adequate, effective
for weight and glycaemic control and likely to reduce diabetes complications. It has also been
found that the Indian lacto-vegetarian diet had beneficial effects on diabetes incidence,
irrespective of high body weight and sedentary lifestyle (Praharaj, Goenka, Dixit, Gupta, Kar
& Negi 2017).
5.1.8 Blood glucose monitoring
Fifty-two percent (n=26) of patients had glucometers and tested their blood glucose more
frequently than those who did not have a glucometer; however, this was not statistically
significant. This was consistent with Krishanan & Thirunavukkarasu (2016), who reported that
59.4% (n=91) of their subjects had glucometers. Patients were more likely to monitor their
107
blood glucose more frequently if they had a functioning glucometer in their home. There is
some evidence on the use of glucometers for SMBG levels. Positive effects include decreased
hospital admissions and morbidity (Burge 2001), while negative results included no
improvement in glycaemic control, as there was no consistency with glycaemic control
(Farmer et al 2009). A detrimental effect has also been shown (Fisher et al 2011), where
SMBG in patients led to increased anxiety and depression.
The most common barriers to blood glucose monitoring was being too busy or changes in daily
routine. Pain or fear was not significant as none reported this as a barrier, which was in contrast
to the findings of Burge (2001), where 26% of patients indicated that finger pain was a main
barrier to regular blood glucose monitoring (Chudyk, Shapiro, Russell-Minda & Petrella 2011;
Burge 2001). According to Chudyk et al (2011), subjects felt that blood glucose monitoring
was time-consuming. This was in line with the current study as 28% (n=14) reported that they
were too busy to test their blood glucose levels. The fact that pain was not cited as a barrier in
the current study could be because pain associated with finger pricking has decreased, due to
the advancement from self-pricking lancets to automated pricking lancets. Further to this, none
of the patients in the present study was on insulin, which may require finger pricking at least
three times a day.
5.1.9 Physical activity
The most common form of exercise done by patients was walking, with most walking for more
than one to three hours a week. This is in line with the American College of Sports Medicine
and the ADA (Colberg et al 2010), which states that type 2 diabetics should do moderate to
vigorous aerobic exercise for at least 150 minutes/week, over a period of at least three days
during the week. Thirty-six percent (n=16) of patients from this study indicated that being busy
with family work or other tasks, was a barrier to exercise. This was consistent with findings
from Fukunaga et al (2011), who reported that most of their Hawaiian subjects mentioned that
time limitations and balancing family and work responsibilities were barriers to exercise
(Fukunaga et al 2011).
5.1.10 Eating habits and nutritional medical care
108
Even though all patients were seen by a dietician and had diet plans, 82% (n=41) did not follow
a written diet plan. Only eight patients (16%) indicated that they controlled their blood glucose
levels by using sugar free or reduced sugar products. Twenty-eight percent of patients did not
eat food they liked often because they were unhealthy foods. This is in line with findings of
Kapur et al (2008), who reported that 34% (n=115) of diabetic subjects did not follow a diet.
Seventy-four percent of patients ate fruits and vegetables daily, even though 90% of the sample
were able to purchase fruits and vegetables regularly. None out of the 13 patients that did not
eat vegetables daily lived in an area in Chennai where fruits and vegetables were not available
daily. The remaining four appeared to have lifestyles that were too busy to eat healthily or
were living alone in the city. In the CURES study (2010), 90.9% of subjects had a very low
consumption of fruit and vegetables (Radhika et al 2010). Colles et al (2013) observed that
62.8% of their subjects ate less than four fruits and vegetables daily. The current study did not
indicate the number of portions of fruit and vegetables eaten daily, as compared to Colles et al
(2013). However, there seems to have been an improvement in fruit and vegetable
consumption in the current study, compared to Rajasekharan, Kulkarni, Unnikrishnan, Kumar,
Holla & Thapar (2015), which reported that 26.2% (76 out of 290) of participants consumed
fruits/vegetables on all days of the week. This could be due to the fact that the facility used
was a private-public partnership district hospital or the socio-economic status of their subjects,
since it was reported that 55% of subjects were of a lower socio-economic status and only 44%
were from middle to upper socio-economic backgrounds (Mangalore, India) (Rajasekharan et
al 2015).
In the current study, 68% (n=34) did not follow a diet plan to control their blood glucose, whilst
22% (n=11) did follow a diet plan. Kapur et al (2008) also found similar results in that only
28% followed their diet for the full duration to control their blood glucose. Kapur et al (2008)
indicated that younger males with a higher socioeconomic status and the less health conscious,
were least likely to follow diets. In the current study, none of the aforementioned demographic
or socioeconomic characteristics were applicable.
In the current study, the most cited barriers to eating healthily were lack of skills (46%) and
cost or expense of food (48%). Fukunaga et al (2011) also reported that the most common

109
barrier to healthy eating was the cost of healthy foods. It is interesting to note that cost was
cited as a barrier in the current study, even though the sample had a middle to high income.
The possible reasons for this is that in India and especially in Chennai, organic foods have
made a huge impact on the market. Many diabetic patients feel that healthy eating should
include organic produce; however, organic foods are expensive. Further to this, cold pressed
oils and A2 milk (milk from a specific breed of cow in Tamil Nadu, considered healthy) are
readily available, but expensive, especially for larger families.
In the current study, patients sometimes or often complained of a lack of skills to deal with
lifestyle changes, because of the lack of practical advice given by HCPs. Although not asked
in the questionnaire, a spouse of one of the study participants mentioned that her husband
worked night shifts and no one had advised them on how to manage his diet around this.
Another patient felt she did not to know how to cook healthier meals, such as using less oil
when cooking. Kapur et al (2008) found that subjects given advice by healthcare providers
regarding healthy options, cooking methods and practical tips to deal with day-to-day lifestyle
issues, were more likely to follow a diet plan.
5.1.11 Medication and medical care
In this study, the diabetic patients did not report any significant barriers to taking medication.
Family support and regular reminders to take medication by their family could explain this
finding. It has been reported that the Indian diabetic has far more family support compared to
their western counterparts (Sridhar & Madhu 2002). Ten percent (n=5) of patients used
Ayurvedic/Siddha powders (traditional Indian herbal therapies) in combination with their
allopathic medication to treat their diabetes and co-morbidities. Kalra et al (2013) reported that
some patients (14%) still utilised the traditional forms of medicine due to cost, effectiveness
and availability. Health care providers should be sensitive and aware of the beliefs of patients
and provide practical and comprehensive advice to patients who want to use traditional forms
of medicine.
5.1.12 Motivation of patients
110
In this study, external (extrinsic) motives compelled patients to take their medication, check
blood glucose levels and keep appointments with HCPs, whereas internal (intrinsic) cues
helped patients to exercise. There was no significant motivation for maintaining or not
maintaining healthy eating, although 40% (n=20) and 36% (n=18) indicated extrinsic and
intrinsic motivation, respectively. Wint et al (2006) found that some were motivated by a desire
to follow their doctors’ orders (extrinsic motivation).
In this study, the most common barrier to motivation itself, was that patients did not understand
their disease condition (18 %), did not know why they needed to change (12%), did not believe
their healthcare providers (10%) and had a lack of support from their doctors (6%). Centis et
al (2014) reported that resistance to change towards a healthy diet was associated with a higher
BMI. A similar finding was noted in the current study as patients with intrinsic motivation to
follow a diet plan (36%) were either a normal weight or overweight, according to BMI, with
none obese. Patients with no motivation were all either overweight or obese. This suggests that
diabetic patients who are intrinsically motivated to follow a diet are less likely to be overweight
or obese. Internal cues to change may also be more beneficial in maintaining lifestyle changes.
5.1.13 Service needs of patients
This sample was satisfied with the care provide to them by HCPs and felt that they worked as
a team to provide them with holistic care. This was in contrast to the findings of Wint et al
(2006), where patients relied mainly on physicians as their primary source of information. The
differences found in this study could be due to this study being more recent and that the facility
used, Apollo Speciality Hospital, was accredited by the NABH in India, which emphasises
teamwork and the holistic care of patients.
Interestingly a small, however, significant number of patients indicated that they would benefit
from a workshop that provided knowledge and skills to help them manage their diabetes. This
is promising for health care providers, as healthcare providers could use these workshops to
provide more detailed, practical counselling to patients without the worry of time constraints.
Some patients were willing to actively participate in online medical/social support from HCPs
such as Facebook and WhatsApp. This is also encouraging for HCPs as they could instantly be

111
in touch with patients to provide support and the latest information on management of their
disease. In addition, more patients, even in rural areas could be assisted sooner instead of later,
by the instant messaging available with mobile social applications.
5.1.14 Knowledge and understanding of diabetes
Seventy-six percent of patients reported that they or their caregivers had the knowledge to
provide healthy meals and 70% understood their disease symptoms, risks and complications.
This is indicative of the change in counselling skills and knowledge acquired by healthcare
providers over the past decade. This was consistent with Sridhar & Madhu (2002), who
reported that more than 85% (n=193) of spouses had good knowledge about the disease.
However, in the study by Wint et al (2006), 80% of subjects reported inadequate knowledge
as a barrier to change, while the CURES study also found similar low rates of knowledge
(Mohan et al 2005). Dinesh, Kulkarni & Gangadhar (2016), observed that those subjects that
visited private medical facilities for their treatment were more knowledgeable than those who
visited government facilities.
5.2 Health care provider-orientated questionnaire
5.2.1 Demographic characteristics
The mean age of the healthcare professionals in this study was 34.4 years, while the mean years
of experience was 11.5 years. This could be due to the high turnover of doctors, as many young
HCPs move on from this hospital after they have gained sufficient training and experience.
Many nurses move on after a 2-year period to the Middle East while other healthcare providers
venture into private practice or return to their hometown hospitals. This is a trend for most of
the hospitals in India with only the highest paid consultants remaining in these hospitals.
5.2.2 Medical care provided by health care providers
Seventy-six percent of HCPs in the current study indicated that patients often followed their
medicine regime. However, LeBlanc et al (2014) found that poor adherence to the medication
regime was one of the main barriers to glycaemic control. Some healthcare providers (84%)
reported that patients complained about hypoglycaemia (p=0.001); whereas in the DAWN-2
study, 61.3% of patients worried about the risk of hypoglycaemic events (Holt & Kalra 2013).
112
Hypoglycaemia is a worrying aspect for the patient and their families due the associated
symptoms and complications. This was also noted in the current study and in the DAWN-2
study (Holt & Kalra 2013).
Accumulatively, 92% of HCPs reported that it was their task to motivate patients. Similarly,
98% of physicians and 100% of nurses felt it was their task to motivate patients from a study
in Finland (Jallinoja, Absetz, Kuronen, Nissinen, Talja, Uutela & Patja 2007). This study
group reported that 48% of healthcare providers would refer to other healthcare providers
often. The most likely healthcare providers were dieticians (60%, n=15), followed by diabetic
educators (36%). This is in keeping with the recommendation by RSSDI (2015) that all
diabetics should have access to a dietician or a health care professional educated in nutrition.
As in this study, at NABH accredited facilities, all diabetics are seen by dieticians on every
admission and documented.
In the current study, healthcare providers (64%) felt that they had sufficient skills for lifestyle
counselling (p=0.001). However, in the DAWN-2 study, 56% and 50.1% of healthcare
providers felt that they needed more education on effective communication and motivation and
self-management education to support long-term behaviour change, respectively (Holt et al
2013).This study compares better to DAWN-2, possibly due to that the present healthcare
providers were already educated on the above.
5.2.3 Motivation and barriers to counselling
Health care providers reported that patients found following an eating plan (88%) the most
difficult to adhere to, followed by exercise (48%). The DAWN-2 study found similar trends
with Indian HCPs feeling that eating healthy (93.2%) and physical exercise (94.6%) needed
more self-management from patients (Holt & Kalra 2013). In the current study, glucose
monitoring and taking of medication was least difficult to maintain, whilst in the DAWN-2
study, 58.4% and 54.5% of HCPs felt that subjects needed more self-management in taking
medications and testing blood sugar levels, respectively (Holt & Kalra 2013). In the current
study, 64% (n=16) of HCPs reported that patients had a lack of support from co-workers or
113
bosses. Fukunaga et al (2011) similarly reported that subjects had a lack of understanding and
support from co-workers. Discrimination in India was higher compared to the world average
(27.2% vs. 17.6%) (Holt & Kalra 2013), which is a concern since discrimination due to
diabetes is linked with diabetes-related distress for diabetics (Holt & Kalra 2013).
In the current study, all healthcare providers agreed that patients should be assigned
responsibility of self-care (p<0.05). The DAWN-2 study reported a similar finding, where
HCPs agreed that diabetes self-management was suboptimal and needed improving. However,
there may be differences between healthcare professionals and diabetics in their perceptions
of how to encourage self-management. The DAWN-2 study noted that HCPs felt that patients
needed to improve various self-management activities, including eating healthy, being
physically active, dealing with emotions associated with diabetes, testing blood glucose and
taking medications as recommended. However, HCPs seemed to want to shift complete care
onto patients, instead of being involved with their patients to help them lead a full and active
life, to encourage and console them and help them understand the consequences of not meeting
treatment goals (Holt & Kalra 2013). Healthcare providers who participated in this study
indicated that the important barrier to lifestyle adaptions were unwillingness to change
(p<0.05) , and less so for insufficient knowledge on complications (p=0.008). Fukunaga et al
(2011), Kapur et al (2008), Jallinoja et al (2007) and Wint et al (2006) reported similar
findings. Therefore, approaches such as motivational interviewing, cognitive behaviour
therapy and behaviour change counselling (Kalra et al 2009b), should be adopted by HCPs
and all health institutions, private or public.
Fifty-two percent and 40% of health care providers in the current study indicated that patients
‘sometimes’ and ‘often’ felt depressed and frustrated with their disease condition, respectively.
Holt et al (2013), Fukunaga et al (2011) and Wint et al (2006) reported similar findings, where
HCPs reported that patients complained about being depressed about their disease condition.
Health care professionals recognised the need for resources to provide more person-centred
diabetes care with over half requesting availability of psychological support and care (63%)
(DAWN-2) (Holt & Kalra 2013). Although the finding was not significant, the HCPs in this
114
study reported that they would participate in workshops on diabetes management, with 48%
indicating that they would often and always participate.
Health care providers in the current study reported that time constraints was an obstacle to
counselling their patients adequately (p=0.026). This was also reported by Yuncken (2014),
where practitioners had insufficient time to adequately assess patients with diabetes. Kapur et
al (2008), reported that only 30% of physicians found time for one on one discussions with
patients and the maximum time spent on one patient, was only ten minutes (Kapur et al 2008).
In the current study, the more experience a healthcare provider had, the more likely they were
to motivate and support lifestyle changes among patients. However, Jallinoja et al (2007),
found that nurses with less experience felt they had sufficient skills to counsel patients,
compared to their older counterparts. The researcher postulated that this could be due to the
change of curriculum at nursing colleges (Jallinoja et al 2007). The reason for this finding in
the current study could be the same (48% felt they were equipped with the knowledge or skills
to teach their patients), since it was a more recent study and in-house and college training has
improved in India, especially in NABH accredited facilities. The more experience a healthcare
provider had, the more likely they were to refer their patients to other team members (p<0.05).
However, no other studies reported the same. It is likely that the more experienced HCPs had
experienced the benefit of teamwork in successfully managing the diabetic patient.
115
CHAPTER 6: CONCLUSION AND RECOMMENDATIONS
This chapter presents the conclusions, study limitations and recommendations.
The objectives of this study were:
To identify the barriers to lifestyle modification as perceived by South Indian diabetic
adults.
To identify the barriers to motivation, knowledge and service needs as perceived by
South Indian diabetic adults.
To identify the challenges as perceived by HCPs in providing education, motivation
and services to their diabetic patients.
6.1. Conclusion
For the diabetic patients in this study, being busy with family, work or other tasks was a
common barrier to glucose monitoring and exercise, while a diet plan was not commonly used
to control blood glucose levels. Many patients did not follow the diets prescribed by their
dieticians, possibly due to lack of preparation skills or cost of healthy foods. Barriers to
medications and medical treatment were boredom, depression, stress, fear of pain, changes in
routines, being busy and cost of medication. Having a glucometer meant that patients were
more likely to test their blood glucose levels more frequently. Walking was a popular exercise
among the sample, while water and bicycle exercises were not popular. There was evidence of
both overweight and poor glycaemic control in the sample, suggesting that more focused
interventions are needed to control weight and improve glycaemic control. Overall, patients
were satisfied with the services provided by their HCPs, however, patients were keen to make
use of online medical/social support from health care providers. It is evident that this sample
need to place greater emphasis on dietary management of diabetes and that they could benefit
from regular information updates on how to effectively manage their diabetes. Health care
providers should consider individualising dietary education and giving guidelines that are more
practical to deal with day-to-day lifestyle issues. In order to encourage the diabetic to make
lifestyle changes, there needs to be an improvement in knowledge on complications and
improved support from co-workers and bosses. Health care providers cited time constraints as
a barrier to counselling their patients adequately. In general, the more experienced HCPs were
more likely to motivate and support lifestyle changes, more confident in their knowledge or

116
skills and more likely to refer patients to other health care team members. External cues for
motivation was common in this sample, with the only internal motivation cue being for
exercise. The most common barriers to motivation were not understanding their disease
condition and not knowing why they needed to change. All healthcare providers agreed that
patients should be assigned the full responsibility of self-care, which showed their lack in
understanding of the concept of self-care management and their roles as HCPs in it; which is
to still actively guide, support and encourage their patients.
6.2 Study limitations
6.2.1 The sample size was small and systemically sampled which prevents generalised
conclusions from being made.
6.2.2 The study relied on the honesty of the patients. However, it is possible that some
patients were not completely honest in their reporting.
6.2.3 Since the study population were inpatients and seen during the course of their
admission, there could have been changes to their medical treatment or counselling by
the time of discharge. Hereby, they could possibly have had fewer or more barriers to
lifestyle changes by discharge.
6.2.4 As this study was conducted in a private hospital, the findings are limited to diabetic
patients treated privately and type 2 diabetics on medication.
6.3 Recommendations
6.3.1 As a developing country, India has a shortage of medical doctors and allied medical
staff to treat its huge population; hereby quality counselling of diabetic patients is
limited. To overcome this, lifestyle counsellors should be trained to offer the necessary
counselling to diabetic patients and their family members. This would also benefit a
resource-constrained country such as India, where there is a shortage of diabetic
healthcare providers.
117
6.3.2 The nutritional curriculum at medical colleges should be restructured to include more
traditionally/culturally acceptable dietary advice. Further to this, South India is unique
in its climate, people and landscapes as compared to other western cities. Moreover,
given the individualised needs of diabetics, the use of a “one-size fits all” concept in
dietary management is limiting and needs to be reconsidered.
6.3.3 Social support from family and co-workers has an unrealised potential as both an
effective and cost-effective method for self-management of T2DM. Educating family
and co-workers on diabetes and how to support their diabetic family member or co-
worker, may also improve the overall management of diabetes.
6.3.4 Future studies should include patients treated in public hospitals, to determine if the
barriers to lifestyle modification, motivation, knowledge and service needs differ for
diabetic patients treated in a public hospital.
6.3.5 Health care providers should consider the use of on-line support systems to provide
medical and social support to diabetics, given the widespread availability and use of
mobile phones.

118
REFERENCES
Abate N, Chandalia M, Satija P, Adams-Huet B, Grundy SM, Sandeep S, Radha V, Deepa R,
Mohan V (2005). ENPP1/PC-1 K121Q polymorphism and genetic susceptibility to
type 2 diabetes. Diabetes 54(4):1207-1213.
Adams OP (2013). The impact of brief high-intensity exercise on blood glucose levels.
Diabetes, Metabolic Syndrome and Obesity: Targets and Therapy 6:113-122.
Aleem MA (2003). Factors that precipitate development of diabetic foot ulcers in rural India.
Lancet 362:1858.
AlQuaiz AM, Tayel SA (2009). Barriers to a healthy lifestyle among patients attending
primary care clinics at a university hospital in Riyadh. Annuals of Saudi Medicine
29 (1): 30-35.
American Diabetes Association (ADA) (2004). Physical Activity/Exercise and Diabetes.
Diabetes Care 27 (1): S58-S62.
American Diabetes Association (ADA) (2003). Report of the Expert Committee on the
Diagnosis and Classification of Diabetes Mellitus. Diabetes Care 26 (1):S5-S20.
American Diabetes Association (ADA) (2011). Standards of Medical Care in Diabetes-2011.
Diabetes Care 34(1):S11-S61.
American Diabetes Association (ADA) (2017). Standards of Medical Care in Diabetes-2017.
Diabetes Care 40 (1): S1-S132.
Anderson RJ, Freedland KE, Clouse RE, Lustman PJ (2001). The prevalence of comorbid
depression in adults with diabetes: a meta-analysis. Diabetes Care 24:1069-1078.
Anderson RM, Funnell MM, Butler PM, Arnold MS, Fitzgerald JT, Feste CC (1995).
Patient empowerment. Results of a randomized controlled trial. Diabetes Care 18
(7):943-949.
Anderson RM, Funnell MM, Nowankwo R, Gillard ML, Oh M, Fitzgerald JT (2005).
Evaluating a problem based empowerment program for African Americans with
diabetes: results of a randomized controlled trial. Ethnicity and Disease 15:671-678.
Anderson DM, Keith J, Novack PD, Elliot MA (2002). Mosby’s Medical, Nursing and
Allied Health Dictionary, 6th ed. United Kingdom: Mosby.
119
Anjana RM, Ali MK, Pradeepa R, Deepa M, Datta M, Unnikrishnan R, Rema M, Mohan V
(2011). The need for obtaining accurate nationwide estimates of diabetes prevalence
in India - rationale for a national study on diabetes. Indian Journal of Medical
Research 133:369-380.
Apollo Hospitals Southern Region (2017). Apollo Speciality Hospitals, Vanagaram.
http://chennai.apollohospitals.com/hospitals/vanagaram (accessed on 25 August
2017).
Arauz-Pacheco C, Parrott MA, Raskin P (2002). The treatment of hypertension in adult
patients with diabetes. Diabetes Care 25(1):134-47.
Assal JP, Jacquemet S, Morel Y (1997). The added value of therapy in diabetes: the
education of patients for self-management of their disease. Metabolism 46 (12):S61-
S64.
Aubert RE, Herman WH, Waters J, Moore W, Sutton D, Peterson BL, Bailey CM, Koplan JP
(1998). Nurse case management to improve glycemic control in diabetic patients in a
health maintenance organization. A randomized, controlled trial. Annals of Internal
Medicine 29(8):605-612.
Babikr WG, Alshahrani ASA, Hamid HGM, Abdelraheem AHMK, Shalayel MHF (2016).
The correlation of HbA1c with body mass index and HDL-cholesterol in type 2
diabetic patients. Biomedical Research 27(4):1280-1283.
Bacarin TA, Sacco ICN, Hennig EM (2009). Plantar Pressure Distribution Patterns During
Gait in Diabetic Neuropathy Patients with a History of Foot Ulcers. Clinics
64(2):113-120.
Bansal D, Gudala K, Muthyala H, Esam HP, Nayakallu R, Bhansali A (2014). Prevalence
and risk factors of development of peripheral diabetic neuropathy in type 2 diabetes
mellitus in a tertiary care setting. Journal of Diabetes Investigations 5: 714-721.
Beagley J, Guariguata L, Weil C, Motala AA (2014). Global estimates of undiagnosed
diabetes in adults. Diabetes Research and Clinical Practice 103:150-160.
Beanlands H, Horsburgh ME, Fox S, Howe A, Locking-Cusolito H, Pare K, Thrasher C
(2005). Caregiving by family and friends of adults receiving dialysis. Nephrology
Nursing Journal 32:621-631.
120
Black SA (2002). Diabetes, diversity, and disparity: What do we do with the evidence?
American Journal of Public Health 92:543-548.
Borra S, Kelly L, Tuttle M, Neville K (2001). Developing actionable dietary guidance
messages: dietary fat as a case study. Journal of the American Dietetic Association
101:678-684.
Bortoletto MS, de Andrade SM, Matsuo T, Haddad Mdo C, González AD, Silva AM
(2014). Risk factors for foot ulcers-a cross sectional survey from a primary care
setting in Brazil. Primary Care Diabetes 8(1):71-76.
Boule´ NG, Haddad E, Kenny GP, Wells GA, Sigal RJ (2001). Effects of exercise on
glycemic control and body mass in type 2 diabetes mellitus: a meta-analysis of
controlled clinical trials. Journal of the American Medical Association 286:1218-
1227.
Buchbinder S, Shanks N (2007). Introduction to Health Care Management.
Massachusetts: Jones and Bartlett.
Burge MR (2001). Lack of compliance with home blood glucose monitoring predicts
hospitalization in diabetes. Diabetes Care 24:1502-1503.
Carter-Edwards L, Skelly AH, Cagle CS, Appel SJ (2004). “They care but don’t
understand”: family support of African American women with type 2 diabetes.
Diabetes Education 30:493-501.
Centis E, Trento M, Dei Cas A, Pontiroli AE, De Feo P, Bruno A, Sasdelli AS, Arturi F,
Strollo F, Vigili de’ Kreutzenberg S, Invitti C, Di Bonito P, Di Mauro M, Pugliese G,
Molteni A, Marchesini G (2014). Stage of change and motivation to healthy diet and
habitual physical activity in type 2 diabetes. Acta Diabetologia 51:559-566.
Chan JC, Malik V, Jia W, Kadowaki T, Yajnik CS, Yoon KH, Hu FB (2009). Diabetes in
Asia: epidemiology, risk factors, and pathophysiology. Journal of the American
Medical Association 301:2129-2140.
Chandalia M, Abate N, Garg A, Stray-Gundersen J, Grundy SM (1999). Relationship
between Generalized and Upper Body Obesity to Insulin Resistance in Asian Indian
Men. Journal of Clinical Endocrinology & Metabolism 84(7):2329-2335.
121
Chesla CA, Fisher L, Mullan JT, Skaff MM, Gardiner P, Chun K, Kanter R (2004). Family
and disease management in African-American patients with type 2 diabetes. Diabetes
Care 27:2850-2855.
Chiu CJ, Wray LA (2011). Gender differences in functional limitations in adults living with
type 2 diabetes: Biobehavioral and psychosocial mediators. Annals of Behavioural
Medicine 41:71-82.
Chobanian AV, Bakris GL, Black HR, Cushman WC, Green LA, Izzo JL Jr, Jones DW,
Materson BJ, Oparil S, Wright JT Jr, Roccella EJ; National Heart, Lung, and Blood
Institute Joint National Committee on Prevention, Detection, Evaluation, and
Treatment of High Blood Pressure; National High Blood Pressure Education Program
Coordinating Committee (2003). The Seventh Report of the Joint National Committee
on Prevention, Detection, Evaluation, and Treatment of High Blood Pressure: the JNC
7 report. Journal of the American Medical Association 89(19):2560-2572.
Chowdhary TA, Lasker SS (2002). Complications and cardiovascular risk factors in South
Asians and Europeans with early-onset type 2 diabetes. Quarterly Journal of
Medicine 95:241-246.
Chudyk A, Shapiro S, Russell-Minda E, Petrella R (2011). Self-Monitoring Technologies for
Type 2 Diabetes and the Prevention of Cardiovascular Complications: Perspectives
from End Users. Journal of Diabetes Science and Technology 5(2):394-401.
Ciulla TA, Amador AG, Zinman B (2003). Diabetic retinopathy and diabetic macular edema:
pathophysiology, screening, and novel therapies. Diabetes Care 26(9):2653-2664.
Clark M (2008). Diabetes self-management education: a review of published studies.
Primary Care in Diabetes 3:113-120.
Clark NM, Becker MH, Janz NK, Lorig K, Rakowski W, Anderson L (1991). Self-
management of chronic disease by older adults. Journal of Aging and Health 3:3-
27.
Colberg SR, Sigal RJ, Fernhall B, Regensteiner JG, Blissmer BJ, Rubin RR, Chasan-Taber L,
Albright AL, Braun B (2010). Exercise and Type 2 Diabetes: The American College
of Sports Medicine and the American Diabetes Association: Joint Position Statement.
Diabetes Care 33(12):e147-e167.
122
Colles SL, Singh S, Kohli C, Mithal A (2013). Dietary beliefs and eating patterns influence
metabolic health in type 2 diabetes: A clinic-based study in urban North India. Indian
Journal of Endocrinology and Metabolism 17(6):1066-1072.
Coppell KJ, Kataoka M, Williams SM, Chisholm AW, Vorgers SM, Mann J (2010).
Nutritional intervention in patients with type 2 diabetes who are hyperglycaemic
despite optimised drug treatment-Lifestyle Over and Above Drugs in Diabetes
(LOADD) study: randomised controlled trial. British Medical Journal 341:1-7.
Costa J, Borges M, David C, Carneiro AV (2006). Efficacy of lipid lowering drug
treatment for diabetic and non-diabetic patients: meta-analysis of randomised
controlled trials. British Medical Journal 332(7550):1115-1124.
Cui J, Yan J, Yan L, Pan L, Le J, Guo Y (2017). Effects of yoga in adults with type 2
diabetes mellitus: A meta-analysis. Diabetes Investigations 8: 201-209.
Curb JD, Pressel SL, Cutler JA, Savage PJ, Applegate WB, Black H, Camel G, Davis BR,
Frost PH, Gonzalez N, Guthrie G, Oberman A, Rutan GH, Stamler J (1996). Effect of
diuretic-based antihypertensive treatment on cardiovascular disease risk in older
diabetic patients with isolated systolic hypertension. Systolic Hypertension in the
Elderly Program Cooperative Research Group. Journal of the American Medical
Association 276(23):1886-1889.
Deepa M, Anjana RM, Manjula D, Narayan KM, Mohan V (2011). Convergence of
prevalence rates of diabetes and cardio metabolic risk factors in middle and low
income groups in urban India: 10 year follow-up of the Chennai Urban Population
Study. Journal of Diabetes Science and Technology 5:918-927.
Deepa M, Farooq S, Deepa R, Manjula D, Mohan V (2006). Prevalence and significance of
generalized and central body obesity in an urban Asian Indian population in Chennai,
India (CURES: 47). European Journal of Clinical Nutrition 63:259-267.
Deepa R, Sandeep S, Mohan V (2006). Abdominal obesity, visceral fat, and type 2 diabetes-
“Asian Indian Phenotype”. In: Mohan V, Gundu Rao, eds. Type 2 diabetes in South
Asians; Epidemiology, Risk factors and Prevention. New Delhi: Jaypee Medical
Publishers.
De Groot M, Golden SH, Wagner J (2016). Psychological Conditions in Adults With
Diabetes. American Psychologist 71(7):552-562.
123
De Jongh T, Gurol-Urganci I, Vodopivec-Jamsek V, Car J, Atun R (2012). Mobile phone
messaging for facilitating self-management of long-term illnesses. Cochrane
Database Systemic Reviews 12:1-50.
Dellasega C, Gabbay R, Durdock K, Martinez-King N (2010). Motivational interviewing to
change type 2 diabetes self-care behaviours. Journal of Diabetes Nursing 14
(3):112-118.
De Wit M, Pouwer F, Gemke RJ, Delemarre-van de Waal HA, Snoek F (2007). Validation of
the WHO-5 well-being index in adolescents with type 1 diabetes. Diabetes Care
30:2003-2006.
Dinesh PV, Kulkarni AG, Gangadhar NK (2016). Knowledge and self-care practices
regarding diabetes among patients with Type 2 diabetes in Rural Sullia, Karnataka: A
community-based, cross-sectional study. Journal of Family Medicine and Primary
Care 5(4):847-852.
D’Souza M, Kulkarni V, Bhaskaran U, Ahmed H, Naimish H, Prakash A, Tabreez S, Dahiya
B, Thapar R, Mithra P, Kumar N, Holla R, Darshan BB, Kumar A (2015). Diabetic
Peripheral Neuropathy and its Determinants among Patients Attending a Tertiary
Health Care Centre in Mangalore, India. Journal of Public Health Research
4(2):450.
Du S, Mroz TA, Zhai F, Popkin BM (2004). Rapid income growth adversely affects diet
quality in China-particularly for the poor! Social Science & Medicine 59:1505-1515.
Elkin N (2008). How America searches: Health and Wellness January iCrossing.
http://www.icrossing.com/articles/How%20America%20Searches%20%20Health%2
0and%20Wellness.pdf. (accessed on 27 June 2017).
Elissen AMJ, Hertroijs DFL, Schaper NC, Bosma H, Dagnelie PC, Henry RM, van der
Kallen CJ, Koster A, Schram MT, Stehouwer CDA, Schouten JSAG, Berendschot
TTJM, Ruwaard D (2017). Differences in biopsychosocial profiles of diabetes
patients by level of glycaemic control and health- related quality of life: The
Maastricht Study. PLoSONE 12(7): e0182053
European Commission (2015). Green Paper on Mobile Health ("mHealth") Brussels: The
Commission.
Evans TC, Capell P (2000). Diabetic Nephropathy. Clinical Diabetes 18(1):1-14.
124
Farmer AJ, Wade AN, French DP, Simon J, Yudkin P, Gray A, Craven A, Goyder L,
Holman RR, Mant D, Kinmonth AL, Neil HA, DiGEM Trial Group (2009). DiGEM
Trial Group. Blood glucose self-monitoring in type 2 diabetes: A randomised
controlled trial. Health Technology Assessment 13(15): iii-iv, ix-xi, 1-50.
Federal Occupational Health Agency (2017).https://foh.psc.gov/calendar/august.html.
(accessed on 02/07/2017).
Fernando ME, Crowther RG, Pappas E, Lazzarini PA, Cunningham M, Sangla KS, Buttner
P, Golledge J (2014). Plantar Pressure in Diabetic Peripheral Neuropathy Patients
with Active Foot Ulceration, Previous Ulceration and No History of Ulceration: A
Meta-Analysis of Observational Studies. PLOS ONE 9(6):1-10.
Feste C, Anderson RM (1995). Empowerment: From philosophy to practice. Patient
Education & Counselling 26:/139-144.
Fisher L, Polonsky W, Parkin CG, Jelsovsky Z, Amstutz L, Wagner RS (2011). The impact
of blood glucose monitoring on depression and distress in insulin-naïve patients with
type 2 diabetes. Current Medical Research and Opinion 27 (3):39-46.
Fodor G (2011). Primary Prevention of CVD: Treating Dyslipidemia. American Family
Physician 83(10): 1207-1208.
Fox KM, Gerber RA, Bolinder B, Chen J, Kumar S (2006). Prevalence of inadequate control
among patients with type 2 diabetes in the United Kingdom general practice database:
a series of retrospective analyses of data from 998 through 2002. Clinical
Therapeutics 28:388-394.
Fox SJS (2009). The social life of health information: Americans’ pursuit of health takes
place within a widening network of both online and offline sources.
http://www.pewinternet.org/Reports/2009/8-The-Social-Life-of-Health-
Information.aspx. (accessed on 20 June 2017).
Franks MM, Stephens MA, Rook KS, Franklin BA, Keteyian SJ, Artinian NT (2006).
Spouses' provision of health-related support and control to patients participating in
cardiac rehabilitation. Journal of Family Psychology 20(2): 311-318.
125
Frykberg RG, Zgonis T, Armstrong DG, Driver VR, Giurini JM, Kravitz SR, Landsman AS,
Lavery LA, Moore C, Schuberth JM, Wukich DK, Andersen C, Vanore JV (2006).
Diabetic foot disorders. A clinical practice guideline (2006 revision). Journal of
Joint and Foot Ankle Surgery 45 (5 Suppl):S1-S66.
Fukunaga LM, Uehara DL, Tom T (2011). Perceptions of Diabetes, Barriers to Disease
Management, and Service Needs: A Focus Group Study of Working Adults With
Diabetes in Hawaii. Preventing Chronic Disease: Public Health Research,
Practice and Policy 8 (2):1-8.
Funnel MM, Brown TL, Childs BP, Haas LB, Hosey GM, Jensen B, Mayniuk M, Peyrot M,
Piette JD, Reader D, Siminerio LM, Weinger K, Weiss MA (2011). National
Standards for Diabetes Self-Management Education. Diabetes Care 23(1): S89-S96.
Funnell MM, Nwankwo R, Gillard ML, Anderson RM, Tang TS (2005). Implementing an
empowerment-based diabetes self-management education program. Diabetes
Education 31:53-61.
Gallant M (2007).Help or hindrance? How family and friends influence chronic illness self-
management among older adults (report). Research on Aging 29:375-377.
Ganie MA, Koul S, Razvi HA, Laway BA, Zargar AH (2012). Hyperglycemic emergencies
in Indian patients with diabetes mellitus on pilgrimage to Amarnathji yatra. Indian
Journal of Endocrinology and Metabolism 16:S87-S90.
Global Burden of Disease (GBD) (2013), Mortality and Causes of Death Collaborators
(2015). Global, regional, and national age-sex specific all-cause and cause-specific
mortality for 240 causes of death, 1990-2013: a systematic analysis for the Global
Burden of Disease Study 2013. Lancet 385 (9963):117-171.
Geneva International Telecommunications Union (2010). The world in 2010: ICT facts and
figures. http://www.itu.int/ITU-/ict/material/FactsFigures2010.pdf (accessed 30 June
2017).
Gensichen J, Von Korff M, Rutter CM, Seelig MD, Ludman EJ, Lin EH, Ciechanowski P,
Young BA, Wagner EH, Katon WJ (2009). Physician support for diabetes patients
and clinical outcomes. BMC Public Health 9:367-730.
126
Glasgow R, Anderson RM (1999). In diabetes care: Moving from compliance to adherence
is not enough. Diabetes Care 22:/2090-2092.
Glazier RH, Bajcar J, Kennie NR, Willson K (2006). A systematic review of interventions to
improve diabetes care in socially disadvantaged populations. Diabetes Care 26:1675-
1688.
Gleeson-Kreig J (2008). Social support and physical activity in type 2 diabetes: a social-
Ecologic approach. Diabetes Education 34:1037-1044.
Goryakin Y, Rocco L, Suhrcke M (2017). The contribution of urbanization to non-
communicable diseases: Evidence from 173 countries from 1980 to 2008. Economics
& Human Biology 26:151-163.
Government of India, Press Information Bureau (2013). Poverty Estimates for 2011-2013.
New Delhi: 22 July, 2013.
https://www.google.co.in/url?sa=t&rct=j&q=&esrc=s&source=web&cd=1&cad=rja&
uact=8&ved=0ahUKEwjk0ofS1sfVAhXE6Y8KHSYmDM8QFgglMAA&url=http%3
A%2F%2Fplanningcommission.nic.in%2Fnews%2Fpre_pov2307.pdf&usg=AFQjCN
Eu12HXZ (accessed 10 August 2017).
Government of Tamil Nadu (2017).
http://www.tn.gov.in/district_view, (accessed 02 August 2017).
Greene JA, Choudhry NK, Kilabuk E, Shrank WH (2010). Online Social Networking by
Patients with Diabetes: A Qualitative Evaluation of Communication with Facebook.
Journal of General Internal Medicine 26(3):287-292.
Grundy SM (1997). Small LDL, Atherogenic Dyslipidemia, and the Metabolic Syndrome
Circulation 95(1):1-4.
Gulati S, Misra A (2014). Sugar Intake, Obesity, and Diabetes in India. Nutrients 6:
5955-5974.
Gupta R, Rastogi P, Sarna M, Sharma SK (2007). Body-mass index, waist-size, waist-hip
ratio and cardiovascular risk factors in urban subjects. The Journal of the
Association of Physicians of India 55:621-627.
Haffner SM (1999). Diabetes, hyperlipidemia, and coronary artery disease. American
Journal of Cardiology 83(9):17-21.
127
Hahr AJ, Molitch ME (2015). Management of diabetes mellitus in patients with chronic
kidney disease. Clinical Diabetes and Endocrinology 1(2):1-9.
Hamine S, Gerth-Guyette E, Faulx D, Green BB, Ginsburg AS (2015). Impact of mHealth
chronic disease management on treatment adherence and patient outcomes: a
systematic review. Journal of Medical Internet Research 17(2):1-25.
Harris MI, Klein R, Welborn TA, Knuiman MW (1992). Onset of NIDDM occurs at least 4-
7 yr before clinical diagnosis. Diabetes Care 15(7):815-819.
Hasan H, Zodpey S, Saraf A (2012). Diabetologist's perspective on practice of evidence
based diabetes management in India. Diabetes Research and Clinical Practice
95:189-193.
Hawkins JS (2010). Glucose monitoring during pregnancy. Current Diabetes
Reports 10:229-234.
Heisler M, Bouknight RR, Hayward RA, Smith DM, Kerr EA (2002). The relative
importance of physician communication, participatory decision making, and patient
understanding in diabetes self-management. Journal of General Internal Medicine
17:243-252.
Hendriks SH, van Soldt EGW, van Vugt M, Groenier KH, Roelofsen Y, Maas AHEM, Bilo
HJG, Kleefstra N, van Hateren KJJ (2017). Lifestyle and emotional well-being in men
and women with type 2 diabetes (e-VitaDM-4; ZODIAC-48). European Journal of
General Practice 23(1):83-90.
Holt RI, Kalra S (2013). A new DAWN: Improving the psychosocial management of
diabetes. Indian Journal of Endocrinology and Metabolism 17: S95-S99.
Holt RI, Nicolucci A, Kovacs Burns K, Escalante M, Forbes A, Hermanns N, Kalra S, Massi-
Benedetti M, Mayorov A, Menéndez-Torre E, Munro N, Skovlund SE, Tarkun I,
Wens J, Peyrot M (2013). Diabetes attitudes, wishes and needs second study
(DAWN2™): Cross-national comparisons on barriers and resources for optimal care-
healthcare professional perspective. Diabetic Medicine 30:789-798.
Hordern MD, Dunstan DW, Prins JB, Baker MK, Singh MA, Coombes JS (2012). Exercise
prescription for patients with type 2 diabetes and pre-diabetes: a Position Statement
from Exercise and Sport Science Australia. Journal of Science & Medical Sport
15(1):25-31.
128
Indian Council of Medical Research (ICMR) (2005). ICMR Guidelines for Management of
Type 2 Diabetes-New Delhi. http://icmr.nic.in/guidelines_diabetes/section6.pdf.
(accessed 28 June 2017)
Indian Research Society for the Study of Diabetes in India (RSSDI) (2005). Clinical Practice
Recommendations for Management of Type 2 diabetes
Mellitus.www.rssdi.in/new/pdf/First_draft_RSSDI_guidelines_2015_Sep_4th_2015.p
df. (accessed on 26 June 2017).
International Diabetes Federation (IDF): Clinical Guidelines Task Force (2012). Global
Guideline for Type 2 Diabetes. International Diabetes Federation.
International Diabetes Federation (IDF) Diabetes Atlas (2014). International Diabetes
Federation, 6thed.
International Diabetes Federation (IDF) Diabetes Atlas (2015). International Diabetes
Federation, 7thed.
Inzucchi SE, Bergenstal RM, Buse JB, Diamant M, Ferrannini E, Nauck M, Peters AL,
Tsapas A, Wender R, Matthews DR (2012). Management of hyperglycaemia in type 2
diabetes: a patient-centered approach. Position statement of the American Diabetes
Association (ADA) and the European Association for the Study of Diabetes (EASD).
Diabetologia 55(6):1577-1596.
Ishani A, Greer N, Taylor BC, Kubes L, Cole P, Atwood M, Clothier B, Ercan-Fang N
(2011). Effect of nurse case management compared with usual care on controlling
cardiovascular risk factors in patients with diabetes: a randomized controlled trial.
Diabetes Care 34(8):1689-1694.
Jayakumar RV (1997). Nutritional Guidelines in Diabetes- Limitations and Barriers,
Proceedings of the 6th Novo Nordisk Diabetes Update 35-37.
Jaleel MA, Raza SA, Fathima FN, Jaleel BN (2011). Ramadan and diabetes: As-Saum (The
fasting). Indian Journal of Endocrinology and Metabolism 15:268-273.
Jallinoja P, Absetz P, Kuronen R, Nissinen A, Talja M, Uutela A, Patja K (2007). The
dilemma of patient responsibility for lifestyle change: Perceptions among primary
care physicians and nurses. Scandinavian Journal of Primary Health Care
25(4):244-249.
129
Joshi SR (2003). Metabolic syndrome - Emerging clusters of the Indian phenotype. The
Journal of the Association of Physicians of India 51:445-446.
Joshi SR (2015). Diabetes Care in India. Annals of Global Health 81(6):830-838.
Joshi SR, Anjana RM, Deepa M, Pradeepa R, Bhansali A, Dhandania VK, Joshi PP,
Unnikrishnan R, Nirmal E, Subashini R, Madhu SR, Rao PV, Das AK, Kaur T,
Shukla DK, Mohan V (2014). Prevalence of Dyslipidemia in Urban and Rural India:
The ICMR–INDIAB Study. PLoS ONE 9(5):1-9.
Joshi SR, Vadivale M, Dalal JJ, Das AK (2011). The Screening India’s Twin Epidemic:
Study design and methodology (SITE-1). Indian Journal of Endocrinology and
Metabolism 15 (Suppl 4):S389-S394.
Julka S, Sachan A, Bajaj S, Sahay R, Chawla R, Agrawal N, Saboo B, Unnikrishnan AG,
Baruah MP, Parmar G, Kalra S (2017). Glycemic management during Jain fasts.
Indian Journal of Endocrinology and Metabolism 21(1): 238-241.
Kadirvlu A, Sadasivan S, Hui Ng S (2012). Social support in type II diabetes care: a case of
too little, too late. Diabetes, Metabolic Syndrome and Obesity 5: 407-417.
Kahleova H, Pelikanova T (2015) Vegetarian Diets in the Prevention and Treatment of
Type 2 Diabetes, Journal of the American College of Nutrition 34(5): 448-458.
Kalra S, Baruah M, Ganapathy M, Ganie A, Sahay R, Unnikrishnan A (2009b). Patient
centred approach to diabetes management: The dawn philosophy. The Internet
Journal of Family Practice 8(1):1-4.
Kalra B, Kalra S, Kumar A (2009a). Social stigma and discrimination: A care crisis for
young women with diabetes in India. Diabetes Voice 54:37-39.
Kalra S, Sridhar GR, Balhara YPS, Sahay RK, Bantwal G, Baruah MP, John M,
Unnikrishnan AG, Madhu K, Verma K, Sreedevi A, Shukla R, Prasanna Kumar KM
(2013). National recommendations: Psychosocial management of diabetes in India.
Indian Journal of Endocrinology and Metabolism 17(3): 376-395.
Kalra S, Unnikrishnan AG (2012). Obesity in India: The weight of the nation. Journal of
Medical Nutrition and Nutraceuticals 1:37-41.
Kapur K, Kapur A, Ramachandran S, Mohan V, Aravind SR, Badgandi, Srishyla MV
(2007). Barriers to Changing Dietary Behavior. Journal of the Association of
Physicians of India 56:27-32.
130
Kaveeshwar SA, Cornwall J (2014). The current state of diabetes mellitus in India.
American Medical Journal 7(1): 45-48.
Khadilkar KS, Bandgar T, Shivane V, Lila A, Shah N (2013). Current concepts in blood
glucose monitoring. Indian Journal of Endocrinology and Metabolism 17(3):S643-
S649.
King P, Peacock I, Donnelly R (1999). The UK Prospective Diabetes Study (UKPDS):
clinical and therapeutic implications for type 2 diabetes. Journal of Clinical
Pharmacology 48: 643-648.
Kovacs Burns K, Nicolucci A, Holt RI, Willaing I, Hermanns N, Kalra S, Wens J, Pouwer F,
Skovlund SE, Peyrot M, DAWN2 Study Group (2013). Diabetes attitudes, wishes and
needs second study (DAWN2™): Cross-national benchmarking indicators for family
members living with people with diabetes. Diabetic Medicine 30:778-788.
Krieger T, Zimmermann J, Huffziger S, Ubl B, Diener C, Kuehner C, Grosse Holtforth M
(2014). Measuring depression with a well-being index: further evidence for the
validity of the WHO well-being index (WHO-5) as a measure of the severity of
depression. Journal of Affective Disorders 156:240-244.
Krishnan V, Thirunavukkarasu J (2016). Assessment of Knowledge of Self Blood Glucose
Monitoring and Extent of Self Titration of Anti Diabetic Drugs. Journal of Clinical
and Diagnostic Research 10(3): FC09-FC11.
Krishnaveni GV, Hill JC, Veena SR, Leary SD, Saperia J, Chachyamma KJ, Karat SC and
Fall CHD (2005). Truncal Adiposity is Present at Birth and in Early Childhood in
South Indian Children. Indian Pediatrics 42: 527-538.
Kulshrestha M, Seth S, Tripathi A, Seth A, Kumar A (2015). Prevalence of Complications
and Clinical Audit of Management of Type 2 Diabetes Mellitus: A Prospective
Hospital Based Study. Journal of Clinical and Diagnostic Research 9 (11):25-28.
Kumar A, Goel MK, Jain RB, Khanna P, Chaudhary V (2013). India towards diabetes
control: Key Issues. Australian Medical Journal 6(10):524-531.
Kumar A, Nagpal J, Bhartia A (2008). Direct cost of ambulatory care of type 2 diabetes in
the middle and high income group populace of Delhi: The DEDICOM survey. The
Journal of the Association of Physicians of India 56:667-674.
131
Kumar PR, Bhansali A, Ravikiran M, Bhansali S, Dutta P, Thakur JS, Sachdeva N, Bhadada
SK, Walia R (2010). Utility of glycated haemoglobin in diagnosing type 2 diabetes
mellitus: A community-based study. Journal Clinical Endocrinology and
Metabolism 95:2832-2835.
Kyu HH, Bachman VF, Alexander L T, Mumford JE, Afshin A, Estep K, Veerman JL,
Delwiche K, Iannarone ML, Moyer ML, Cercy K, Vos T, Murray CJ, Forouzanfar
MH (2016). Physical activity and risk of breast cancer, colon cancer, diabetes,
ischemic heart disease, and ischemic stroke events: systematic review and dose-
response meta-analysis for the Global Burden of Disease Study 2013. The British
Medical Journal 354:1-27.
Lahiri SK, Haldar D, Chowdhury SP, Sarkar GN, Bhadury S, Datta UK (2011). Junctures to
the therapeutic goal of diabetes mellitus: Experience in a tertiary care hospital of
Kolkata. Journal of Midlife Health 2:31-36.
Lambrou P, Kontodimopoulos N, Niakas D (2010). Motivation and job satisfaction among
medical and nursing staff in a Cyprus public general hospital. Human Resources for
Health 8(26):1-9. doi: 10.1186/1478-4491-8-26.
Lappalainen R, Saba A, Holm L, Mykkanen H, Gibney MJ, Moles A (1997). Difficulties in
trying to eat healthier: descriptive analysis of perceived barriers for healthy eating.
European Journal of Clinical Nutrition 51(2):S36-40.
LeBlanc ES, Rosales AG, Kachroo S, Mukherjee J, Funk KL, Schneider JL, Nichols GA,
(2014). Provider beliefs about diabetes treatment have little impact on glycemic
control of their patients with diabetes. BMJ Open Diabetes Research and Care 3:1-
7.
Li C, Ford ES, Strine TW, Mokdad AH (2008). Prevalence of depression among U.S. adults
with diabetes: findings from the 2006 behavioral risk factor surveillance system.
Diabetes Care 31: 105-107.
Lim AK (2014). Dibetic nephropathy-complications and treatment. International
Journal of Nephrology and Renovascular Disease 7:361-381.
Mathers CD, Loncar D (2006). Projections of global mortality and burden of disease from
2002 to 2030. PLoS Medicine 3(11):e442. doi:10.1371/journal.pmed.0030442
https://www.ncbi.nlm.nih.gov/pubmed/?term=Veerman%20JL%5BAuthor%5D&cauthor=true&cauthor_uid=27510511
132
Margetts BM, Nelson M (2001). Design Concepts in Nutitional Epidemiology, 2nd ed.
London: Oxford University Press.
Martinell M, Pingel R, Hallqvist J, Dorkhan M, Groop L,Rosengren A,Storm, Stålhammar
J (2017). Education, immigration and income as risk factors for haemoglobin A1c
>70 mmol/mol when diagnosed with type 2 diabetes or latent autoimmune diabetes in
adult: a population-based cohort study. BMJ Open Diabetic Research and Care
doi: 10.1136/ bmjdrc-2016-000346.
Mehrotra R, Bajaj S, Kumar D, Singh KJ (2000). Influence of education and occupation on
knowledge about diabetes control. The National Medical Journal of India 13:293-
296.
Misra A, Khurana L, Isharwal S, Bhardwaj S (2009). South Asian diets and insulin
resistance. British Journal of Nutrition 101:465-473.
Misra A, Pandey RM, Devi JR, Sharma R, Vikram NK, Khanna N (2001). High prevalence
of diabetes, obesity and dyslipidaemia in urban slum population in northern India.
International Journal of Obesity and Related Metabolic Disorders 25: 1722-1729.
Misra A, Sharma R, Gulati S, Joshi SR, Sharma V, Ghafoorunissa, Ibrahim A, Joshi S,
Laxmaiah A, Kurpad A, Raj RK, Mohan V, Chandalia H, Krishnaswamy K, Boindala
S, Gopalan S, Bhattiprolu SK, Modi S, Vikram NK, Makkar BM, Mathur M, Dey S,
Vasudevan S, Gupta SP, Puri S, Joshi P, Khanna K, Mathur P, Krishnaswamy S,
Madan J, Karmarkar M, Seth V, Passi SJ, Chadha D, Bhardwaj S, National Dietary
Guidelines Consensus Group (2011). Consensus dietary guidelines for healthy living
and prevention of obesity, the metabolic syndrome, diabetes, and related disorders in
Asian Indians. Diabetes Technology and Therapeutics 13(6):683-694.
Misra A, Shrivastava U (2013). Obesity and Dyslipidemia in South Asians. Nutrients
5:2708-2733.
Mohan V, Deepa R, Rani SS, Premalatha G, Chennai Urban Population Study (CUPS No.5).
(2001). Prevalence of coronary artery disease and its relationship to lipids in a
selected population in South India: The Chennai Urban Population Study (CUPS No.
5). Journal of the American College of Cardiology 38(3):682-687.
https://www.ncbi.nlm.nih.gov/pubmed/?term=Laxmaiah%20A%5BAuthor%5D&cauthor=true&cauthor_uid=21488798
https://www.ncbi.nlm.nih.gov/pubmed/?term=Boindala%20S%5BAuthor%5D&cauthor=true&cauthor_uid=21488798
https://www.ncbi.nlm.nih.gov/pubmed/?term=Boindala%20S%5BAuthor%5D&cauthor=true&cauthor_uid=21488798
133
Mohan V, Gokulakrishnan K, Deepa R, Shanthirani CS, Datta M (2005). Association of
physical inactivity with components of metabolic syndrome and coronary artery
disease - the Chennai Urban Population Study (CUPS no. 15). Diabetic Medicine
22:1206-1211.
Mohan V, Radhika G, Sathya RM, Tamil SR, Ganesan A, Sudha V (2009). Dietary
carbohydrates, glycaemic load, food groups and newly detected type 2 diabetes
among urban Asian Indian population in Chennai, India (Chennai Urban Rural
Epidemiology Study 59). British Journal of Nutrition 102:1498-1506.
Mohan D, Raj D, Shanthirani CS, Datta M, Unwin NC, Kapur A, Mohan V (2005).
Awareness and knowledge of diabetes in Chennai-the Chennai Urban Rural
Epidemiology Study [CURES-9]. The Journal of the Association of Physicians of
India 53: 283-287.
Mohan V, Sandeep S, Deepa R, Shah B, Varghese C (2007). Epidemiology of type 2
diabetes: Indian scenario. Indian Journal of Medical Research 125: 217-230.
Mohan V, Shah S, Saboo B (2013). Current Glycemic Status and Diabetes Related
Complications Among Type 2 Diabetes Patients in India: Data from the A1chieve
Study. The Journal of the Association of Physicians of India 61:12-15.
Mohan V, Vijayachandrika V, Gokulakrishnan K, Anjana RM, Ganesan A, Weber MB,
Narayan KMV (2010). A1C cut points to define various glucose intolerance groups in
Asian Indians. Diabetes Care 33:515-519.
Monteiro-Soares M, Boyko EJ, Ribeiro J, Ribeiro I, Dinis-Ribeiro M (2012). Predictive
factors for diabetic foot ulceration: a systematic review. Diabetes/metabolism
Research and Reviews 7:574-600.
Moran J, Bekker H, Latchford G (2008). Everyday use of patient-centred, motivational
techniques in routine consultations between doctors and patients with diabetes.
Patient Education and Counselling 73: 224-231.
Morbach S, Lutale JK, Viswanathan V, Möllenberg J, Ochs HR, Rajashekar S,
Ramachandran A, Abbas ZG (2004). Regional differences in risk factors and clinical
presentation of diabetic foot lesions. Diabetic Medicine 21(1):91-95.
134
Moreira SR, Simões GC, Moraes JF, Motta DF, Campbell CS, Simões HG (2012). Blood
glucose control for individuals with type-2 diabetes: acute effects of resistance
exercise of lower cardiovascular-metabolic stress. Journal of Strength &
Conditioning Research 26(10):2806-2811.
Mumu SJ, Saleh F, Ara F, Afnan F, Ali L (2014). Non-adherence to Life-style Modification
and its Factors Among Type 2 Diabetic Patients. Indian Journal of Public Health 58
(1): 40-44.
Murugesan N, Snehalatha C, Shobhana R, Roglic G, Ramachandran A (2007). Awareness,
about diabetes and its complications in the general and diabetic population in a city in
southern India. Diabetes Research and Clinical Practice 77: 433-437.
Nagpal J, Bhartia A (2006). Quality of diabetes care in the middle- and high-income group
populace: The Delhi Diabetes Community (DEDICOM) survey. Diabetes Care
29:2341-2348.
Nathan DM, Buse JB, Davidson MB, Ferrannini E, Holman RR, Sherwin R, Zinman B
(2009). Medical Management of Hyperglycemia in Type 2 Diabetes: A Consensus
Algorithm for the Initiation and Adjustment of Therapy: A consensus statement of the
American Diabetes Association and the European Association for the Study of
Diabetes. Diabetes Care 32(1):193-203.
National Family Health Survey (NFHS-3), 2005-06 (2007). International Institute for
Population Sciences and Macro International (2007): India, vol. I. Mumbai: IIPS.
National Family Health Survey (NFHS-4), 2015-16 (2016a). International Institute for
Population Sciences and Macro International: India, vol. I. Mumbai: IIPS.
National Family Health Survey (NFHS-4), 2015-16 (2016b). State Fact Sheet Tamil Nadu
International Institute for Population Sciences and Macro International: India,
vol. I. Mumbai: IIPS.
NCD Risk Factor Collaboration (NCD-RisC) (2016). Worldwide trends in diabetes since
1980: a pooled analysis of 751 population-based studies with 4.4 million participants.
Lancet 387:1513-1530.
135
Nicolucci A, Cavaliere D, Scorpiglione N, Carinci F, Capani F, Tognoni G, Benedetti MM
(1996). A comprehensive assessment of the avoidability of long-term complications
of diabetes. A case-control study. SID-AMD Italian Study Group for the
Implementation of the St. Vincent Declaration. Diabetes Care 19(9):927-933.
Nicolucci A, Kovacs Burns K, Holt RI, Comaschi M, Hermanns N, Ishii H, Kokoszka A,
Pouwer F, Skovlund SE, Stuckey H, Tarkun I, Vallis M, Wens J, Peyrot M (2013).
Diabetes attitudes, wishes and needs second study (DAWN2™): Cross-national
benchmarking of diabetes-related psychosocial outcomes for people with diabetes.
Diabetic Medicine 30:767-777.
Norris SL, Zhang X, Avenell A, Gregg E, Bowman B, Serdula M, Brown TJ, Schmid CH,
Lau J (2004). Long-term effectiveness of lifestyle and behavioral weight loss
interventions in adults with type 2 diabetes: a meta-analysis. American Journal of
Medicine 117: 762-774.
Norris SL, Lau J, Smith SJ, Schmid CH, Engelgau MM (2002). Self-management education
for adults with type 2 diabetes: a meta-analysis on the effect on glycemic control.
Diabetes Care 25:1159-1171.
Nyenwe EB, Jerkins TB, Umpierrez GE, Kitabchi AE (2011). Management of type 2
diabetes: evolving strategies for the treatment of patients with type 2 diabetes.
Metabolism 60(1): 1-23.
Odegaard AO, Pereira MA (2006). Trans Fatty Acids, Insulin Resistance, and Type 2
Diabetes. Nutrition Reviews 64(8):364-367.
Odegard PS, Capoccia K (2007). Medication taking and diabetes: a systematic review of
the literature. Diabetes Education 33:1014-1029.
Ofcom (2015a). Smartphones Are More Popular Than Laptops Among DE Households.
London, UK: https://www.ofcom.org.uk/about-ofcom/latest/media/media-
releases/2015/cmr-uk-2015 (accessed on 28 June 2017).
Ofcom (2015b). Among Internet Users in Our European Comparator Countries, Personal Use
of Tablets Was Highest in Spain and Italy. London, UK:
https://www.ofcom.org.uk/about-ofcom/latest/media/media-releases/2015/five-years-
of-tablets (accessed on 28 June 2017).
136
Ofei F (2005). Obesity-A Preventable Disease. Ghana Medical Journal 39(3):98-101.
Oftedal B, Karlsen B, Bru E (2010). Perceived support from healthcare practitioners among
adults with type 2 diabetes. Journal of Advanced Nursing 66:1500-1509.
Osman A, Curzio J (2012). South Asian cultural concepts in diabetes. Nursing Times
108(28):30-32.
Palmer SC, Mavridis D, Nicolucci A, Johnson DW, Tonelli M, Craig JC, Maggo J, Gray V,
De Berardis G, Ruospo M, Natale P, Saglimbene V, Badve SV, Cho Y, Nadeau-
Fredette AC, Burke M, Faruque L, Lloyd A, Ahmad N, Liu Y, Tiv S, Wiebe N,
Strippoli GF (2016). Comparison of Clinical Outcomes and Adverse Events
Associated With Glucose-Lowering Drugs in Patients with Type 2 Diabetes: A Meta-
analysis. The Journal of the American Medical Association 316(3):313-324.
Pan XR, Li GW, Hu YH, Wang JX, Yang WY, An ZX, Hu ZX, Lin J, Xiao JZ, Cao HB, Liu
PA, Jiang XG, Jiang YY, Wang JP, Zheng H, Zhang H, Bennett PH, Howard BV
(1997). Effects of diet and exercise in preventing NIDDM in people with impaired
glucose tolerance. The Da Qing IGT and Diabetes Study. Diabetes Care (4):537-544.
Pathan MF, Sahay RK, Zargar AH, Raza SA, Khan AK, Ganie MA, Siddiqui NI, Amin F,
Ishtiaq O, Kalraet S (2012). South Asian consensus guideline: Use of insulin in
diabetes during Ramadan. Indian Journal of Endocrinology and Metabolism
16:499-502.
Pender NJ (2001). The Health Promotion Model, 4thed. In: Pender NJ, Murdaugh CL,
Parsons MA, Eds. Health Promotion in Nursing Practice. New Jersey: Prentice
Hall.
Petrovski G, Zivkovic M, Stratrova SS (2015). Social Media and Diabetes: Can Facebook
and Skype Improve Glucose Control in Patients With Type 1 Diabetes on Pump
Therapy? One Year Experience. Diabetes Care 38:51-52.
Peyrot M, Rubin RR (1997). Levels and risks of depression and anxiety symptomatology
among diabetic adults. Diabetes Care 20:585-595.
Peyrot M, Rubin RR, Lauritzen T, Snoek FJ, Matthews DR, Skovlund SE (2005).
Psychosocial problems and barriers to improved diabetes management: results of the
Cross-National Diabetes Attitudes, Wishes and Needs (DAWN) Study. Diabetic
Medicine 22(10):1379-1385.
https://www.ncbi.nlm.nih.gov/pubmed/?term=Mavridis%20D%5BAuthor%5D&cauthor=true&cauthor_uid=27434443
https://www.ncbi.nlm.nih.gov/pubmed/?term=Johnson%20DW%5BAuthor%5D&cauthor=true&cauthor_uid=27434443
http://www.ncbi.nlm.nih.gov/pubmed/?term=Lauritzen%20T%5BAuthor%5D&cauthor=true&cauthor_uid=16176200
http://www.ncbi.nlm.nih.gov/pubmed/?term=Matthews%20DR%5BAuthor%5D&cauthor=true&cauthor_uid=16176200
137
Piette JD, Glasgow R (2001). Strategies for improving behavioral health outcomes among
patients with diabetes: self-management, education. In: Gerstein HC, Haynes RB, eds.
Evidence-Based Diabetes Care. Ontario: BC Decker Publishers.
Popkin B (2001).The nutrition transition and obesity in the developing world. Journal of
Nutrition 131(3):871S-873S.
Popkin BM, Adair LS, Ng SW (2012). NOW AND THEN: The Global Nutrition
Transition: The Pandemic of Obesity in Developing Countries. Nutrition Reviews
70(1): 3-21.
Popkin BM, Du S (2003). Dynamics of the nutrition transition toward the animal foods sector
in China and its implications: a worried perspective. Journal of Nutrition 33:3898S-
3906S.
Pradeepa R, Anjana RM, Joshi SR, Bhansali A, Deepa M, Joshi PP, Dhandania VK, Madhu
SR, Rao PV, Geetha L, Subashini R, Unnikrishnan R, Shukla DK, Kaur T, Mohan V,
Das AK (2015). Prevalence of generalized & abdominal obesity in urban & rural
India- the ICMR-INDIAB study (Phase-I) [ICMR-INDIAB-3]. Indian Journal of
Medical Research 142:139-150.
Pradeepa R, Mohan V (2017). Prevalence of type 2 diabetes and its complications in India
and economic costs to the nation. European Journal of Clinical Nutrition.
http://dx.doi.org/10.1038/ejcn.2017.40
Pradeepa R, Rema M, Vignesh J, Deepa M, Deepa R, Mohan V (2008). Prevalence and
risk factors for diabetic neuropathy in an urban south Indian population: the Chennai
Urban Rural Epidemiology Study (CURES-55). Diabetic Medicine 25(4):407-412.
Prochaska JO, DiClemente CC, Norcross JC (1992). In search of how people change.
Applications to addictive behaviors. American Psychologist 47:1102-1114.
Prochaska JO, Redding CA, Evers KE (2002). The trans-theoretical model and stages of
change. In: Glanz K, Rimer BK, Lewis FM, eds. Health behavior and health
education: theory, research, and practice. San Francisco: Jossey-Bass.
Praharaj AB, Goenka RK, Dixit S, Gupta MK, Kar SK, Negi S (2017). Lacto-Vegetarian
Diet and Correlation of Fasting Blood Sugar with Lipids in Population Practicing
Sedentary Lifestyle. Ecology of Food and Nutrition 56(5):351-363.
138
Prueksaritanond S, Tubtimtes S, Asavanich K, Tiewtranon V (2004). Type 2 diabetic patient-
centered care. Journal of the Medical Association of Thailand 87:345-352.
PricewaterhouseCoopers (PwC) (2007). Healthcare in India. Emerging market report.
Delaware. PriceWaterhouseCoopers.
PricewaterhouseCoopers (PwC) (2017). Funding Indian healthcare Catalysing the next wave
of growth. (2017). http://www.pwc.in/publications/2017/funding-indian-healthcare-
catalysing-the-next-wave-of-growth.html. (accessed on 24 June 2017).
Rachmani R, Slavacheski I, Berla M, Frommer-Shapira R, Ravid M (2005). Treatment
of High-Risk Patients with Diabetes: Motivation and Teaching Intervention: A
Randomized, Prospective 8 Year Follow-Up Study. Journal of American Society of
Nephrology 16: S22-S26.
Radha V, Vimaleswaran KS, Babu HNS, Abate N, Chandalia M, Sathija P, Grundy SM,
Ghosh S, Majumder PP, Deepa R Rao SM, Mohan V (2006). Role of genetic
polymorphism peroxisome proliferator- activated receptor g2- Pro12Ala on ethnic
susceptibility to diabetes in South-Asian and Caucasian subjects. Diabetes Care
29:1046-1051.
Rajasekharan D, Kulkarni V, Unnikrishnan B, Kumar N, Holla R, Thapar R (2015). Self-care
activities among patients with diabetes attending a tertiary care hospital in Mangalore
Karnataka. Indian Annals of Medicine and Health Science Research 5:59-64.
Raji A, Seely EW, Arky RA, Simonson DC (2001). Body Fat Distribution and Insulin
Resistance in Healthy Asian Indians and Caucasians. The Journal of Clinical
Endocrinology & Metabolism 86(11):5366-5371.
Ramachandran A (2007). Socio-economic burden of diabetes in India. The Journal of the
Associations of Physicians of India 55:9-12.
Ramachandran A, Shobhana R, Snehalatha C, Augustine C, Murugesan N, Viswanathan V,
Kapur A, Williams R (2007). Increasing expenditure on health care incurred by
diabetic subjects in a developing country. Diabetes Care 30:252-256.
Ramachandran A, Mary S, Yamuna A, Murugesan N, Snehalatha C (2008). High Prevalence
of Diabetes and Cardiovascular Risk Factors Associated With Urbanization in India.
Diabetes Care 31(5):893-8.
139
Ramachandran A, Snehalatha C (2010). Rising burden of obesity in Asia. Journal of
Obesity 2010: 1-8.
Ramachandran A, Snehalatha C, Dharmaraj D, Viswanathan M (1992). Prevalence of
glucose intolerance in Asian Indians: urban rural difference and significance of upper
body adiposity. Diabetes Care 15:1348-1355.
Ramachandran A, Snehalatha C, Kapur A, Vijay V, Mohan V, Das AK, Rao PV, Yajnik CS,
Prasanna KS, Nair JD (2001). High prevalence of diabetes and impaired glucose
tolerance in India: National Urban Diabetes Survey. Diabetologia 44:1094-1101.
Ramachandran A, Snehalatha C, Latha E, Vijay V, Viswanathan M(1997). Rising
prevalence of NIDDM in urban population in India. Diabetologia 40:232-237.
Rani PK, Raman R, Rachapalli SR, Pal SS, Kulothungan V, Sharma T (2010). Prevalence
and risk factors for severity of diabetic neuropathy in type 2 diabetes mellitus. Indian
Journal of Medical Sciences 64(2):51-57.
Rao KD, Bhatnagar A, Murphy A (2011). Socio-economic inequalities in the financing of
cardiovascular and diabetes inpatient treatment in India. Indian Journal of Medical
Research 133:57-63.
Rema M, Premkumar S, Anitha B, Deepa R, Pradeepa R, Mohan V (2005). Prevalence of
diabetic retinopathy in urban India: the Chennai Urban Rural Epidemiology Study
(CURES) eye study. Investigative Ophthalmology and Visual Science 46(7):2328-
2333.
Resnick HE, Bardsley J, Foster JL, Ratner RE (2006). Achievement of American Diabetes
Association clinical practice recommendations among US adults with diabetes 1999-
2002. Diabetes Care 29:531-537.
Robbins SP (1996). Organizational Behaviour, 7thed.New Jersey: Prentice Hall.
Rosland AM, Kieffer E, Israel B, Cofield M, Palmisano G, Sinco B, Spencer M, Heisler M
(2008). When is social support important? The association of family support and
professional support with specific diabetes self-management behaviors. Journal of
General Internal Medicine 23:1992-1999.
Rosenfield S (1992). Factors contributing to the subjective quality of life of the chronic
mentally ill. Journal of Health and Social Behaviour 33:299-315.
140
Roumen C, Corpeleijn E, Feskens EJ, Mensink M, Saris WH, Blaak EE (2008). Impact of
3 year lifestyle intervention on postprandial glucose metabolism: the SLIM study.
Diabetic Medicine 25(5):597-605.
Roy T, Lloyd CE (2012). Epidemiology of depression and diabetes: a systematic review.
Journal of Affective Disorders 142:S8-S21.
Rubin RR (2005). Adherence to pharmacologic therapy in patients with type 2 diabetes
mellitus. American Journal of Medicine 118 (5A):S27-S34.
Sachdeva S, Khalique N, Ansari MA, Khan Z, Mishra SK, Sharma G (2015). Cultural
determinants: Addressing barriers to holistic diabetes care. Journal of Social Health
and Diabetes 3(1): 33-38.
Safraj S, Anish TS, Vijayakumar K, Kutty VR, Soman CR (2012). Socioeconomic position
and prevalence of self-reported diabetes in rural Kerala, India: Results from the
PROLIFE study. Asia Pacific Journal of Public Health 24:480-486.
Samuel-Hodge CD, Headen SW, Skelly AH, Ingram AF, Keyserling TC, Jackson EJ,
Ammerman AS, Elasy TA (2000). Influences on day-to-day self-management of type
2 diabetes among African-American women: spirituality, the multi-caregiver role, and
other social context factors. Diabetes Care 23:928-933.
Sanz C, Gautier JF, Hanaire H (2010). Physical exercise for the prevention and treatment
of type 2 diabetes. Diabetes & Metabolism 36(5):346-351.
Sasisekhar TVD, Alekhya Y, Jagadeesh CH, Sudha A (2012). Diabetic complications
leading to mortality. Indian Journal of Research and Reports in Medical Sciences
2(3):24-27.
Sequira L, Prabhu R, Mayya SS, Nagaraju SP, Devi ES, Nayak BS, George A (2016).
Status of Chronic Kidney Disease (CKD) in India- A narrative review. International
Education & Research Journal 2(1): 121-124.
Serour M, Alqhenaei H, Al-Saqabi S, Mustafa AR, Ben-Nakhi A (2007). Cultural factors and
patients adherence to lifestyle measures. British Journal of General Practice 57:
291-295.
141
Sharma SK, Seshiah V, Sahay BK, Das AK, Rao PV, Shah S, Akhtar S, Shetty R (2012).
Baseline characteristics of the IMPROVE control study population: A study to
evaluate the effectiveness of a standardized healthcare professionals training program.
Indian Journal of Endocrinology and Metabolism 16:S471-S473.
Shetty PS (2002). Nutrition transition in India. Public Health Nutrition 5:175-182.
Sigal RJ, Kenny GP, Boulé NG, Wells GA, Prud'homme D, Fortier M, Reid RD, Tulloch H,
Coyle D, Phillips P, Jennings A, Jaffey J (2007). Effects of Aerobic Training,
Resistance Training, or Both on Glycemic Control in Type 2 Diabetes: A
Randomized Trial. Annals of Internal Medicine 147:357-369.
Simmons RK, Harding AH, Jakes RW, Welch A, Wareham NJ, Griffin SJ (2006). How
much might achievement of diabetes prevention behaviour goals reduce the incidence
of diabetes if implemented at the population level? Diabetologia 49(5):905-911.
Singh RB, Pella D (2007). Prevalence of obesity, physical inactivity and under-nutrition, a
triple burden of diseases during transition in a developing economy. The Five City
Study Group. Acta Cardiologia 62:119-127.
Smith A, Page D (2015). U.S. Smartphone Use in 2015. Washington, DC: Pew Internet &
American Life Project; 2015. Apr 01, [2016-0419].
http://www.pewinternet.org/files/2015/03/PI_Smartphones_0401151.pdf
(accessed on 28 June 2017).
Sowers JR, Epstein M, Frohlich ED (2001). Diabetes, Hypertension, and
Cardiovascular Disease: An Update. Hypertension 37:1053-1059.
Sridhar GR (1996). Gender differences in childhood diabetes. International Journal of
Diabetes in Developing Countries 16:108-113.
Sridhar GR (2007). Psychiatric co-morbidity and diabetes. Indian Journal of Medical
Research 125:311-120.
Sridhar GR (2012). Dealing with depression in metabolic disorders. Depression in medically-
ill patients. In: Desai NG, editor. ECAB Clinical Update: Psychiatry. New Delhi:
Elsevier.
Sridhar GR, Madhu K (2002). Psychosocial and cultural issues in diabetes mellitus. Current
Science 83(12): 1556-1564.
142
Stamler J, Vaccaro O, Neaton JD, Wentworth D (1993). Diabetes, other risk factors, and
12-yr cardiovascular mortality for men screened in the Multiple Risk Factor
Intervention Trial. Diabetes Care 16(2):434-444.
Stevenson A (2010). Oxford Dictionary of English, 3rded. New York: Oxford University
Press.
Sushama S, Nandita T (2012). Study on self-medication and self-diet management by women
of Indore city, India. Research Journal of Recent Sciences 1:354-356.
Szuszkiewicz-Garcia M, Li R, Grundy SM, Abate N, Chandalia M (2012). Fat
Distribution and Insulin Resistance in Young Adult Non-obese Asian Indian Women.
Metabolic Syndrome and Related Disorders 10(5):326-330.
Tandon N, Raizada N (2014). The burden of diabetes in India. Diapedia
1105045828 rev. no. 8. http://doi.org/10.14496/dia.1105045828.8 (accessed on 10
June 2017).
Tang TS, Brown MB, Funnell MM, Anderson RM (2008). Social support, quality of life, and
self-care behaviors among African Americans with type 2 diabetes. Diabetes
Education 34:266-276.
Tang TS, Gillard ML, Funnell MM, Nwankwo R, Parker E, Spurlock D, Anderson RM
(2005). Developing a new generation of ongoing diabetes self-management support
interventions (DSMS): a preliminary report. Diabetes Education31:91-97.
Tripp-Reimer T, Choi E, Skemp Kelley L, Enslein JC (2001). Cultural Barriers to Care:
Inverting the Problem. Diabetes Spectrum 14(1):13-22.
Tuomilehto J, Rastenyte D, Birkenhäger WH, Thijs L, Antikainen R, Bulpitt CJ, Fletcher AE,
Forette F, Goldhaber A, Palatini P, Sarti C, Fagard R (1999). Effects of calcium-
channel blockade in older patients with diabetes and systolic hypertension. Systolic
Hypertension in Europe Trial Investigators. New England Journal of Medicine
340(9):677-684.
Unnikrishnan RI, Rema M, Pradeep R, Deepa M, Shanthirani CS, Deepa R, Mohan V
(2007). Prevalence and risk factor of diabetic nephropathy in an urban south Indian
population; The Chennai urban rural Epidemiology study (CurES-45). Diabetes Care
30:2019-2024.
143
Van Dam HA, van der Horst F, Van den Borne B, Ryckman R, Crebolder H (2003).
Provider-patient interaction in diabetes care: effects on patient self-care and
outcomes. A systematic review. Patient Education and Counselling 51:17-28.
Van den Arend IJ, Stolk RP, Krans HM, Grobbee DE, Schrijvers AJ (2000). Management of
type 2 diabetes: a challenge for patient and physician. Patient Education and
Counselling 40(2):187-194.
Van Dijk JW, Tummers K, Stehouwer CDA, Hartgens F, van Loon LJC (2012). Exercise
Therapy in Type 2 Diabetes: Is daily exercise required to optimize glycemic control?
Diabetes Care 35(5):948-954.
Vaughn LM, Jacquez F, Baker RC (2009). Cultural health attributions, beliefs, and practices:
Effects on healthcare and medical education. Open Medical Education Journal
2:64-74.
Vaz M, Yusuf S, Bharathi AV, Kurpad AV, Swaminathan S (2008). The nutrition transition
in India. South African Journal of Clinical Nutrition 18(2):198-201.
Velmurugan K, Deepa R, Ravikumar R, Lawrence JB, Anshoo H, Senthilvelmurugan M,
Enas EA, Mohan V (2003). Relationship of lipoprotein (a) with intimal medial
thickness of the carotid artery in Type 2 diabetic patients in south India. Diabetic
Medicine 20: 455-461.
Venditti EM, Wylie-Rosett J, Delahanty LM, Mele L, Hoskin MA, Edelstein SL (2014).
Short and long-term lifestyle coaching approaches used to address diverse participant
barriers to weight loss and physical activity adherence. International Journal of
Behavioral Nutrition and Physical Activity 11(16):1-12.
Venkataraman K, Kannan AT, Mohan V (2009). Challenges in diabetes management with
particular reference to India. International Journal of Diabetes in Developing
Countries 29:103-109.
Vermunt PWA, Milder, IEJ, Wielaard F, Baan CA, Schelfhout JDM, Westert GP, van Oers
H (2013). Behavior change in a lifestyle intervention for type 2 diabetes prevention in
Dutch primary care: opportunities for intervention content. BMC Family Practice
14:78-85.
Vijay V, Narasimham DV, Seena R, Snehalatha C, Ramachandran A (2000). Clinical
144
profile of diabetic foot infections in south India-a retrospective study. Diabetic
Medicine 17(3):215-218.
Vimaleswaran KS, Radha V, Ghosh S, Majumder PP, Deepa R, Babu HN, Rao MR, Mohan
V (2005). Peroxisome proliferator-activated receptor-gamma co-activator-1alpha
(PGC-1alpha) gene polymorphisms and their relationship to Type 2 diabetes in Asian
Indians. Diabetic Medicine 22(11):1516-1521.
Viswanathan V, Kumpatla S (2009). Pattern and causes of amputation in diabetic
Patients-a multicentric study from India. The Journal of the Associations of
Physicians of India 59:148-151.
Viswanathan V, Rao VN (2013). Problems associated with diabetes care in India. Diabetes
Management 3(1):31-40.
Waaijman R, de Haart M, Arts ML, Wever D, Verlouw AJ, Nollet F (2014). Risk factors
for plantar foot ulcer recurrence in neuropathic diabetic patients. Diabetes Care
37(6):1697-1705.
Wangnoo SK, Maji D, Das AK, Rao PV, Moses A, Sethi B, Unnikrishnan AG, Kalra S,
Balaji V, Bantwal G, Kesavadev J, Jain SM, Dharmalingam M (2013). Barriers and
solutions to diabetes management: An Indian perspective. Indian Journal of
Endocrinology and Metabolism 17(4):594-601.
Wen LK, Parchman ML, Shepherd MD (2004). Family support and diet barriers among older
Hispanic adults with type 2 diabetes. Family Medicine 36:423-430.
Whitehead L, Seaton P (2016). The Effectiveness of Self-Management Mobile Phone and
Tablet Apps in Long-term Condition Management: A Systematic Review. Journal of
Medical Internet Research 18(5):1-16.
Whiting DR, Guariguata L, Weil C, Shaw J (2011). IDF Diabetes Atlas: Global estimates of
the prevalence of diabetes for 2011 and 2030. Diabetes Research and Clinical
Practice 94: 311-321.
WHO/UN-HABITAT (2010). Hidden cities. Unmasking and overcoming health
inequities in urban settings. Geneva. World Health Organization.
Wild S, Roglic G, Green A, Sicree R, King H (2004). Global prevalence of diabetes-
estimates for the year 2000 and projections for 2030. Diabetes Care 27(3):1047-
1053.
145
Wilks RJ, Sargeant LA, Gulliford MC, Reid ME, Forrester TE (2001). Management of
diabetes mellitus in three settings in Jamaica. Pan American Journal of Public
Health 9: 65-71.
Wint YB, Duff EM, McFarlane-Anderson N, O’Connor A, Bailey EY, Wright-Pascoe RA
(2006). Knowledge, Motivation and Barriers to Diabetes Control in Adults in
Jamaica. West Indian Medicine Journal 55(5): 330-332.
Wolf AM, Conaway MR, Crowther JQ, Hazen KY, L Nadler J, Oneida B, Bovbjerg VE
(2004). Translating lifestyle intervention to practice in obese patients with type 2
diabetes: Improving Control with Activity and Nutrition (ICAN) study. Diabetes
Care 27(7):1570-1576.
World Bank Data (2016). The World Bank website.
https://data.worldbank.org/indicator/SH.XPD.OOPC.TO.ZS?locations=IN (accessed
on 8 August 2017).
World Health Organization (WHO) (2006). Definition and diagnosis of diabetes mellitus
and intermediate hyperglycemia. WHO Library Cataloguing-in-Publication Data.
http://www.who.int/diabetes/publications/Definition%20and%20diagnosis%20of%20
diabetes_new.pdf. (accessed on 25 June 2017).
World Health Organization (WHO) (2016a). Global recommendations on physical activity
for health. Geneva: WHO.
http://www.who.int/dietphysicalactivity/factsheet_recommendations/en/ (accessed on
27 June 2017).
World Health Organization (WHO) (2016b). Global Report on Diabetes. WHO Library
Cataloguing-in-Publication Data. http://www.who.int/diabetes/global-report/en/
(accessed on 29 June 2017).
World Health Organization (WHO) (2011). Use of glycated haemoglobin (HbA1c) in the
diagnosis of diabetes mellitus. Geneva: WHO.
World Health Organization Library Cataloguing-in-Publication Data (2011). mHealth: New
horizons for health through mobile technologies: second global survey on
eHealth. Geneva: WHO.
146
World Health Organization (WHO) (2017a). BMI classification.
http://apps.who.int/bmi/index.jsp?introPage=intro_3.html (accessed on 18 November
2017).
World Health Organization (WHO) (2017b). Fact Sheet: Cardiovascular disease.
http://www.who.int/mediacentre/factsheets/fs317/en/(accessed on 8 August 2017).
Yadav K, Krishnan A (2008). National Prevalence of Obesity: Changing patterns of diet,
physical activity and obesity among urban, rural and slum populations in north India.
Obesity Reviews 9(5):400-408.
Yadav R, Tiwari P, Dhanaraj E (2008). Risk factors and complications of type 2 diabetes in
Asians. Current Research & Information on Pharmaceutical Sciences 9(2):8-12.
Yajnik CS, Fall CHD, Coyaji KJ, Hirve SS, Rao S, Barker DJP (2003). Neonatal
anthropometry: the thin-fat Indian baby; the Pune Maternal Nutrition Study.
International Journal of Obesity 27: 173-180.
Yajnik CS, Lubree HG, Rege SS, Naik SS, Deshpande JA, Deshpande SS, Joglekar CV,
Yudkin JS (2002). Adiposity and hyperinsulinemia in Indians are present at birth.
Journal of Clinical Endocrinology and Metabolism 87:1-6.
Yau JWY, Rogers SL, Kawasaki R, Lamoureux EL, Kowalski JW, Bek T, Chen S, Dekker
JM, Fletcher A, Grauslund J, Haffner S, Hamman RF, Ikram MK, Kayama T, Klein
BEK, Klein R, Krishnaiah S, Mayurasakorn K, O’Hare JP, Orchard TJ, Porta M,
Rema M, Roy MS, Sharma T, Shaw J, Taylor H, Tielsch JM, Varma R, Wang JJ,
Wang N, West S, Xu L, Yasuda M, Zhang X, Mitchell P, Wong TY, the Meta-
Analysis for Eye Disease (META-EYE) Study Group (2012). Global Prevalence and
Major Risk Factors of Diabetic Retinopathy. Diabetes Care 35(3):556-564.
Yazdanpanah L, Nasiri M, Adarvishi S (2015). Literature review on the management of
diabetic foot ulcer. World Journal of Diabetes 6(1): 37-53.
Yokoyama Y, Barnard ND, Levin SM and Watanabe M (2015). Vegetarian diets and
glycaemic control in diabetes: a systemic review and meta-analysis. Cardiovascular
Diagnosis and Therapy 4(5):373-382.
Yuncken J (2014). Barriers to implementing change within diabetes care. Wound Practice
and Research 22(1):50-55.
Zargar AH, Khan AK, Masoodi SR, Laway BA, Wani AI, Bashir MI, Dar FA (2000).
147
Prevalence of type 2 diabetes mellitus and impaired glucose tolerance in the Kashmir
Valley of the Indian subcontinent. Diabetes Research and Clinical Practice
47(2):135-146.
Zhang X, Gregg EW, Williamson DF, Barker LE, Thomas W, Bullard KM, Imperatore G,
Williams DE, Albright AL (2010). A1C level and future risk of diabetes: a systematic
review. Diabetes Care 33:1665-1673.
Zhang Y, He D, Sang Y (2013). Facebook as a Platform for Health Information and
Communication: A Case Study of a Diabetes Group. Journal of Medical Systems
37: 9942.
Zickuhr K (2013). Tablet ownership 2013. Washington, DC: Pew Internet & American Life
Project; 2013. Jun 10, [2016-04-19]. http://www.pewinternet.org/files/old-
media//Files/Reports/2013/PIP_Tablet%20ownership%202013.pdf website (accessed
on 31 June 2017).
Ziemer DC, Berkowitz KJ, Panayioto RM, El-Kebbi IM, Musey VC, Anderson LA, Wanko
NS, Fowke ML, Brazier CW, Dunbar VG, Slocum W, Bacha GM, Gallina DL, Cook
CB, Phillips LS (2003). A simple meal plan emphasizing healthy food choices is as
effective as an exchange-based meal plan for urban African Americans with type 2
diabetes. Diabetes Care 26(6):1719-1724.
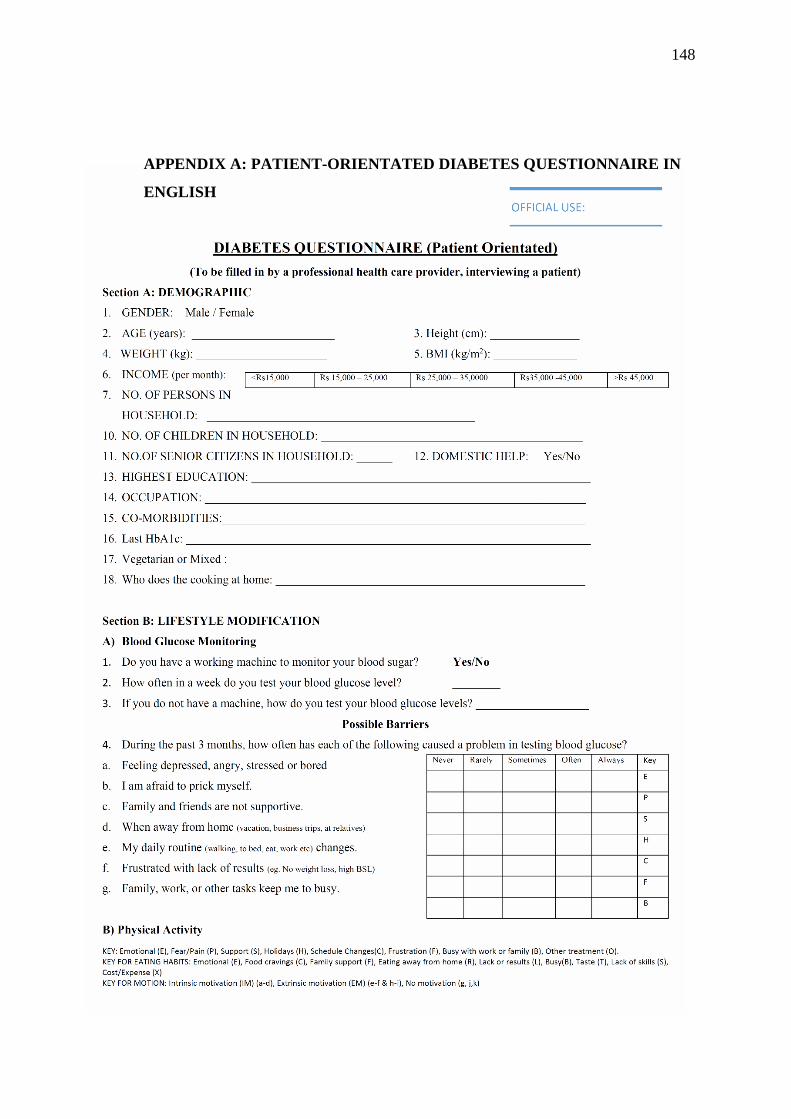
148
APPENDIX A: PATIENT-ORIENTATED DIABETES QUESTIONNAIRE IN
ENGLISH
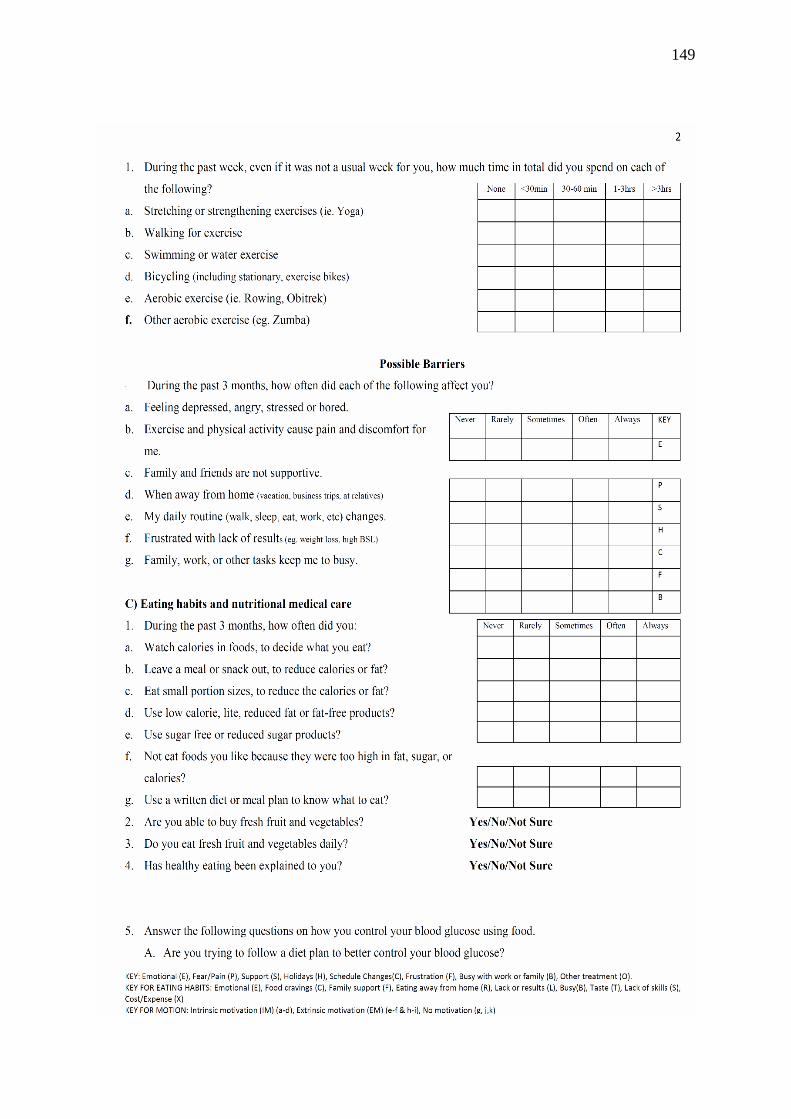
149
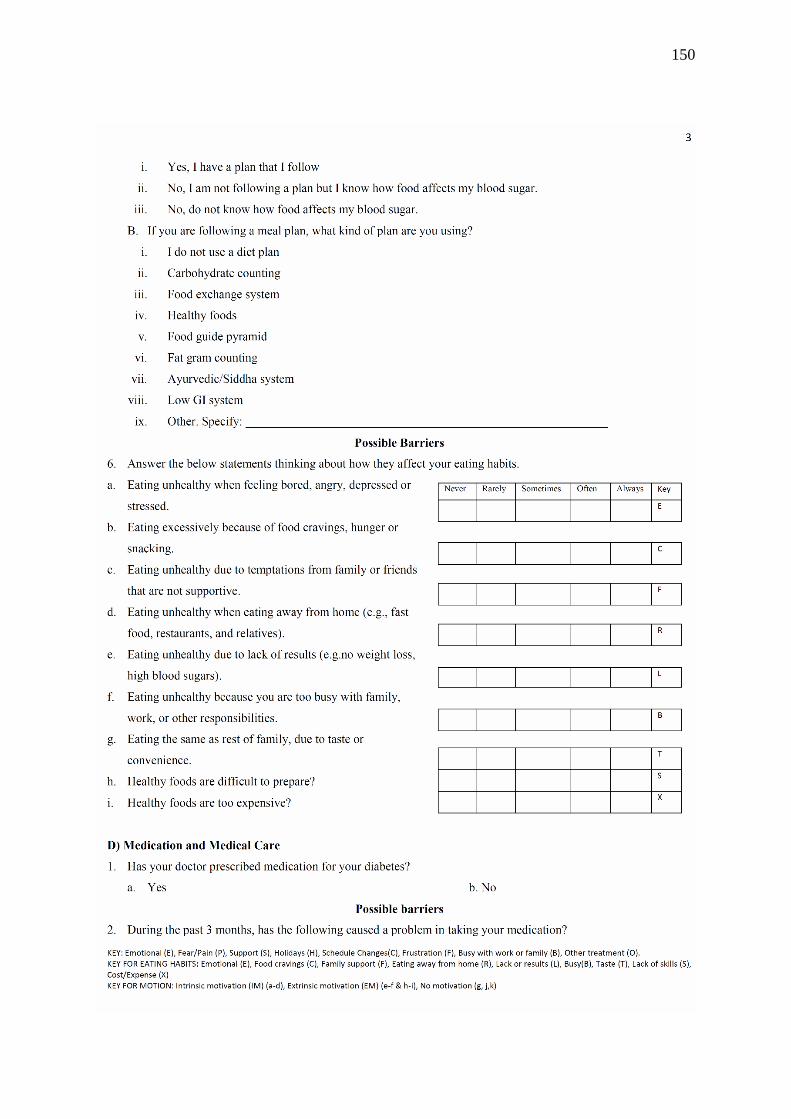
150
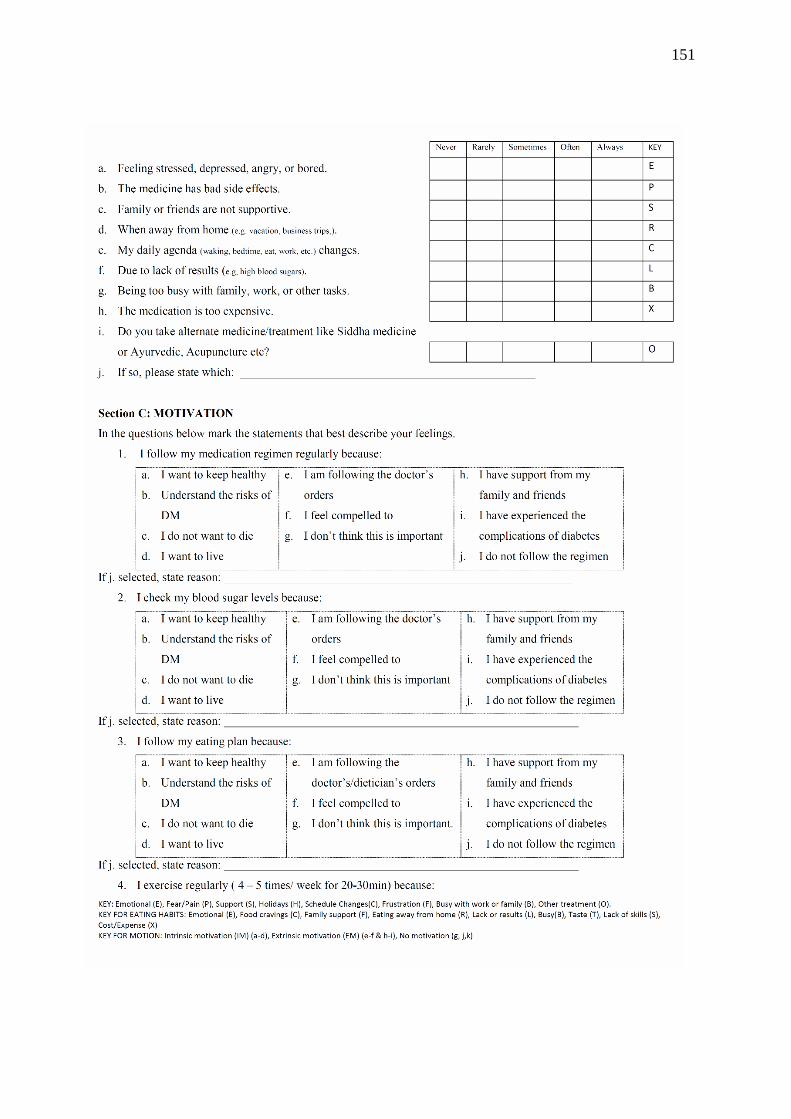
151
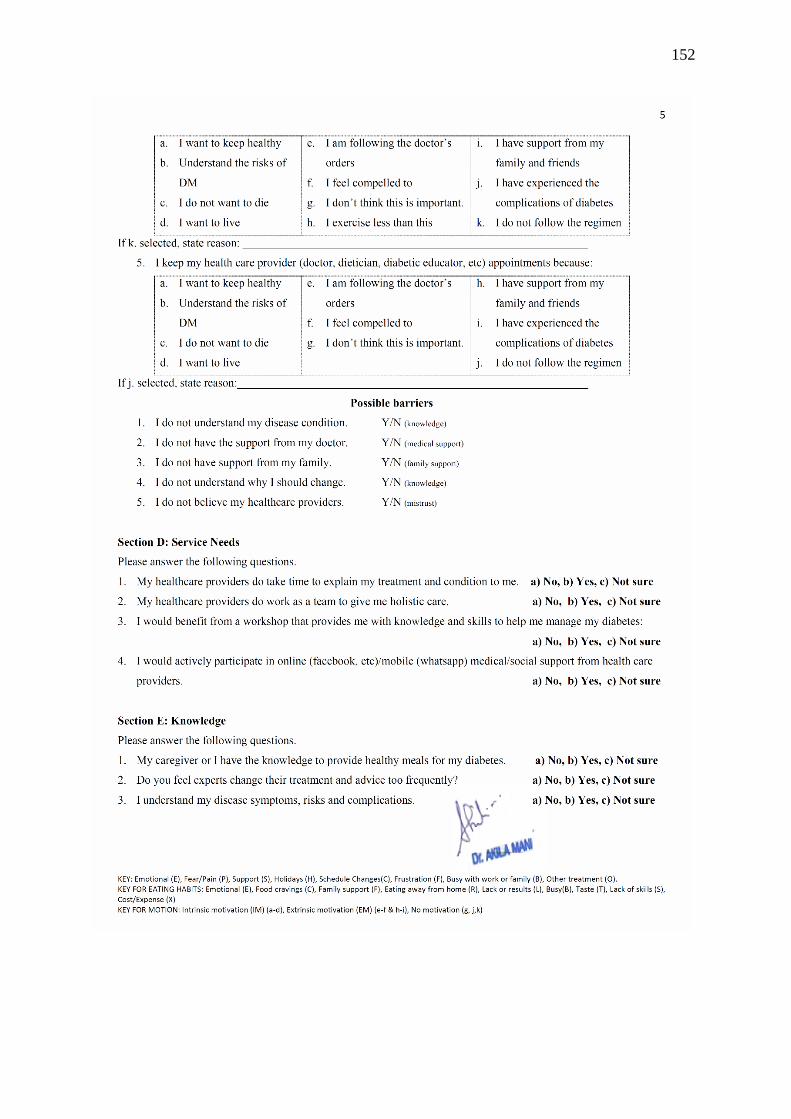
152
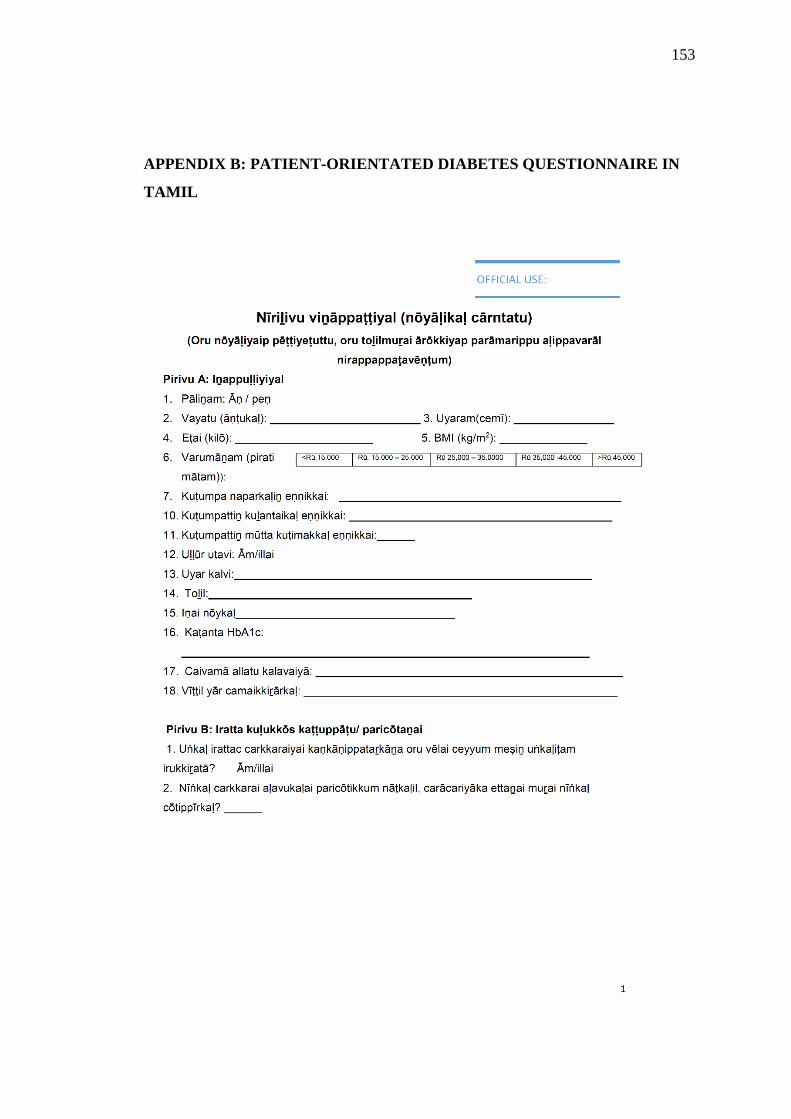
153
APPENDIX B: PATIENT-ORIENTATED DIABETES QUESTIONNAIRE IN
TAMIL

154
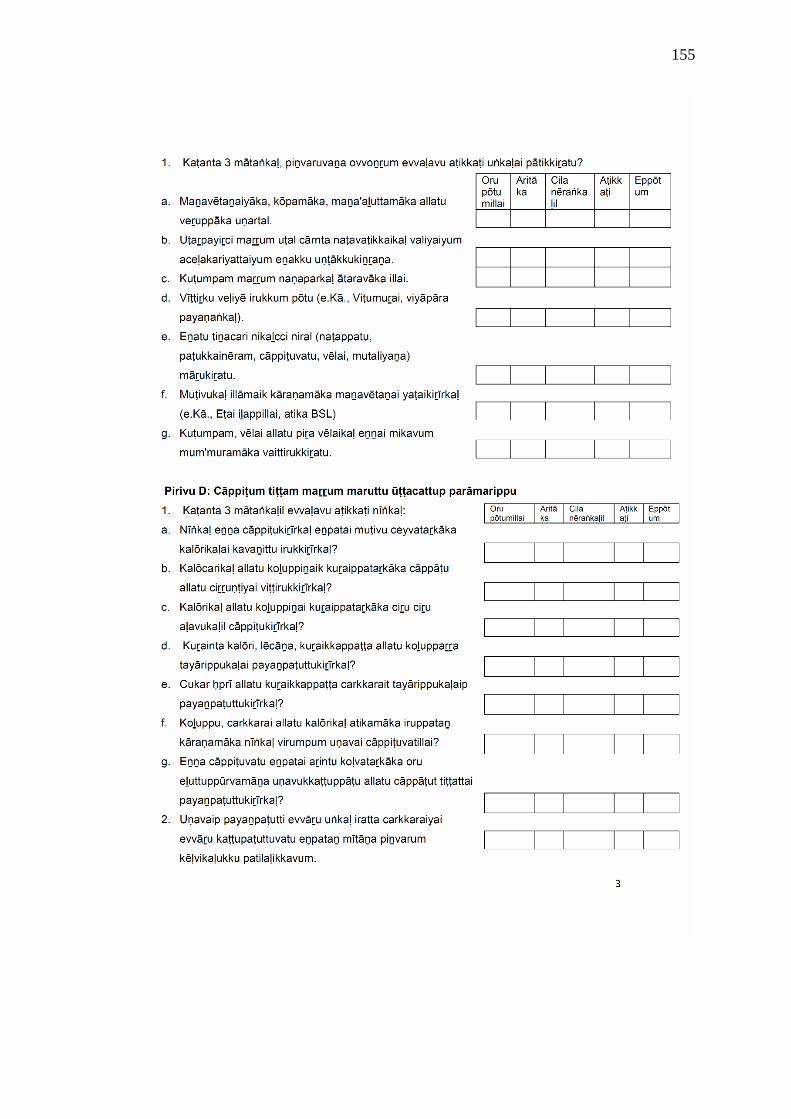
155
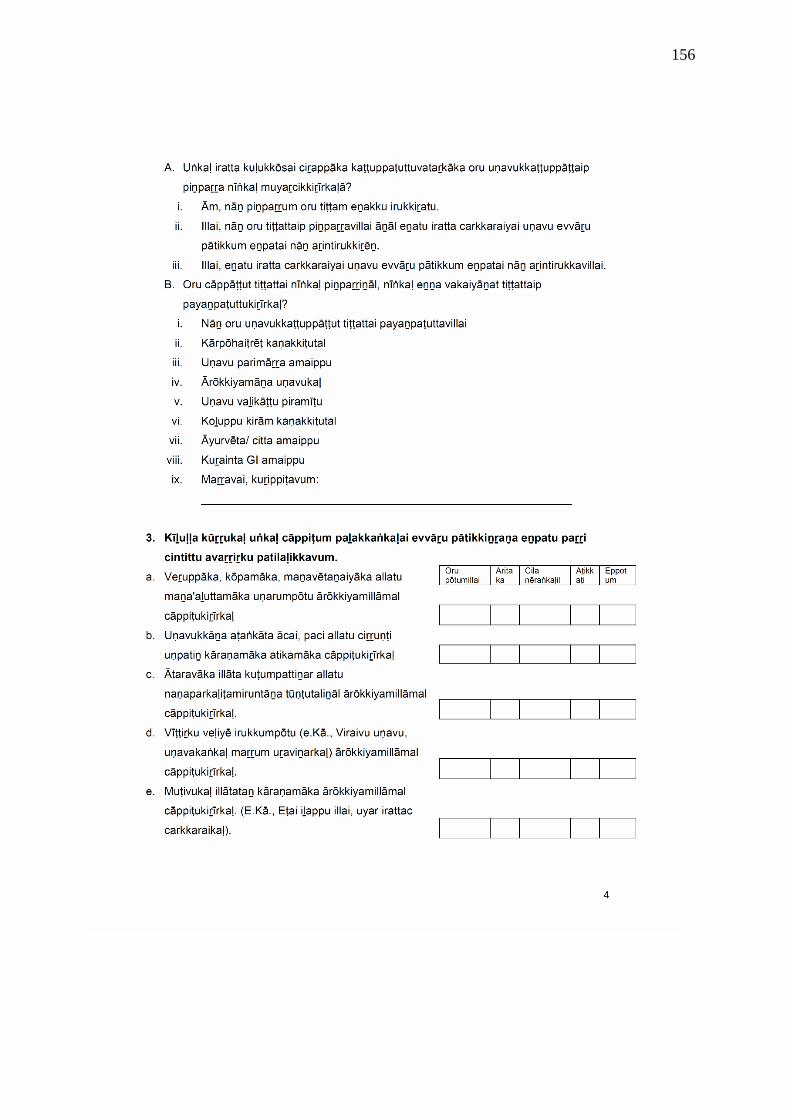
156
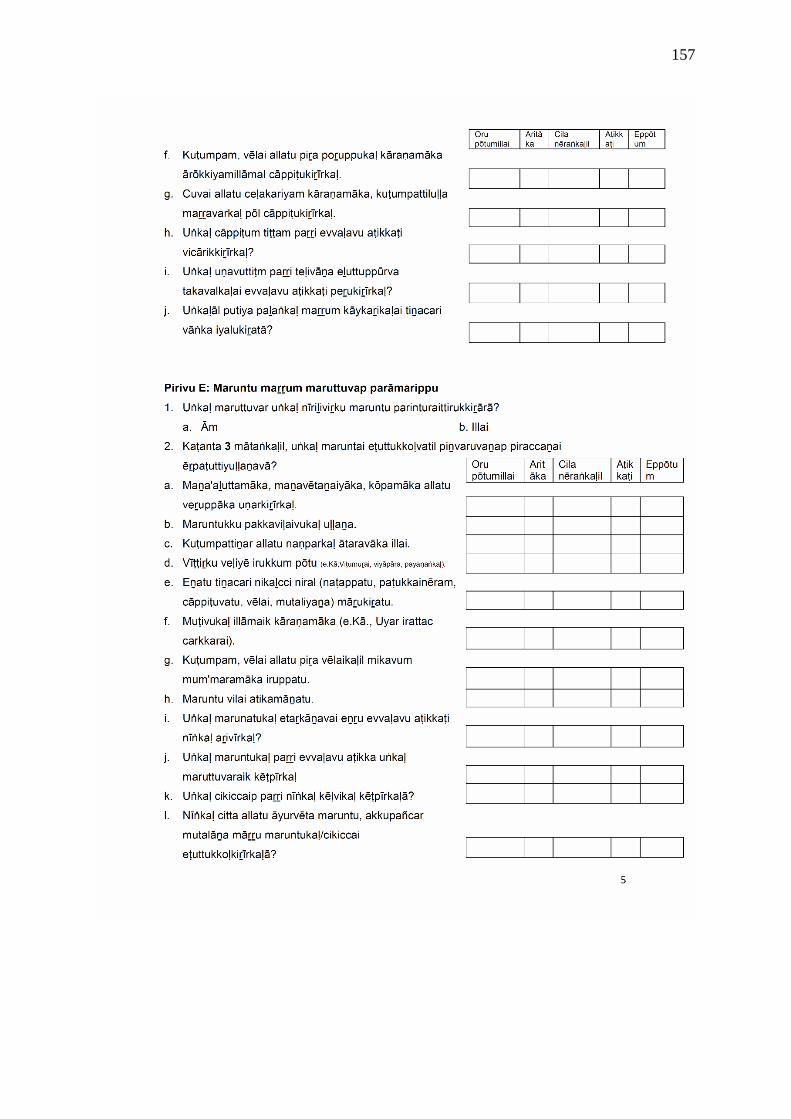
157
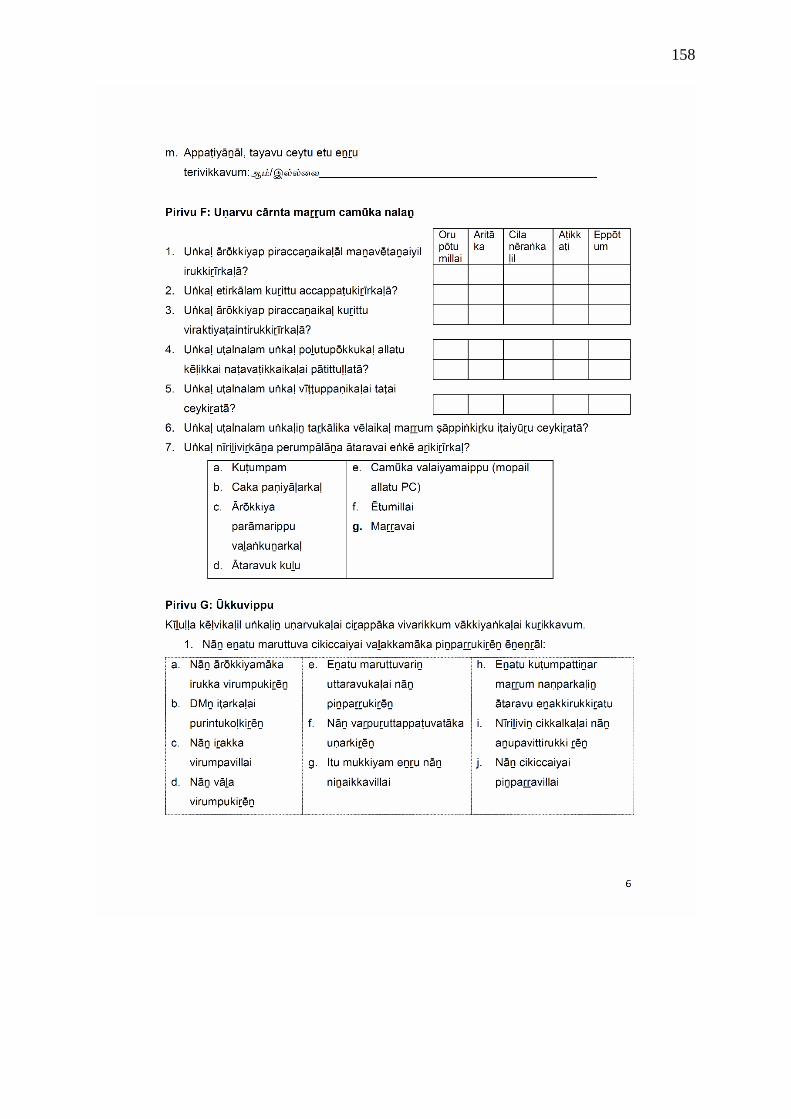
158
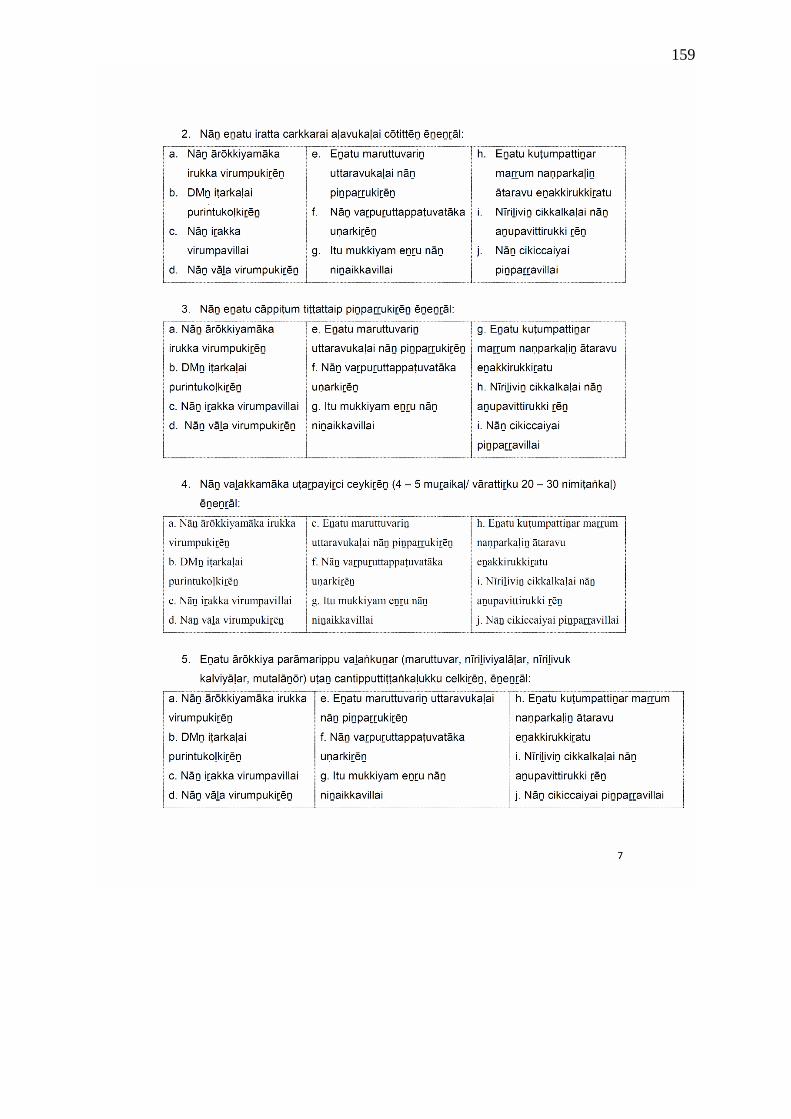
159
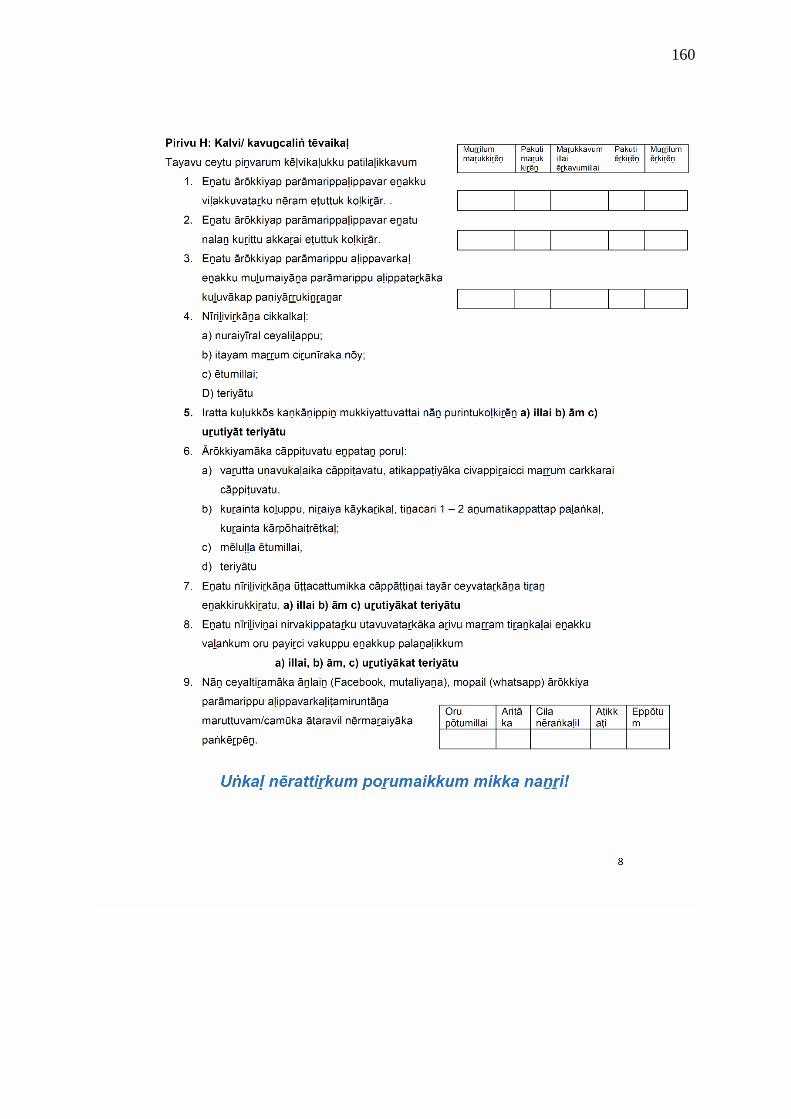
160
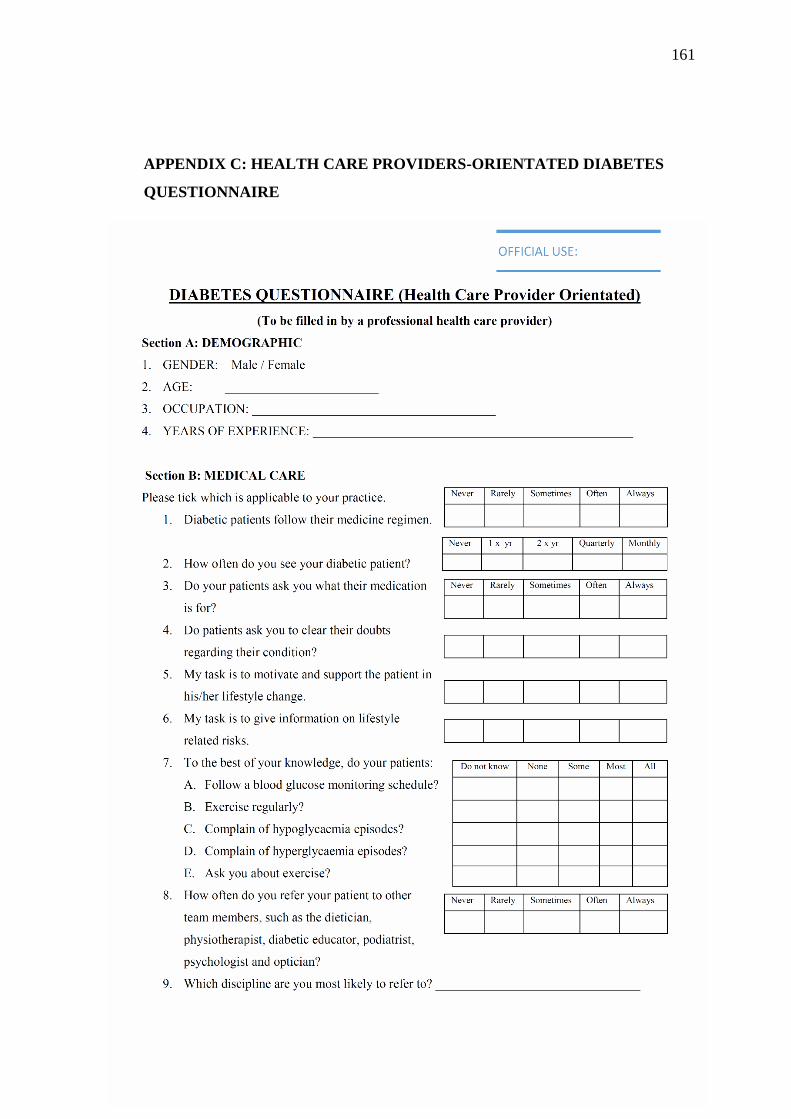
161
APPENDIX C: HEALTH CARE PROVIDERS-ORIENTATED DIABETES
QUESTIONNAIRE

162
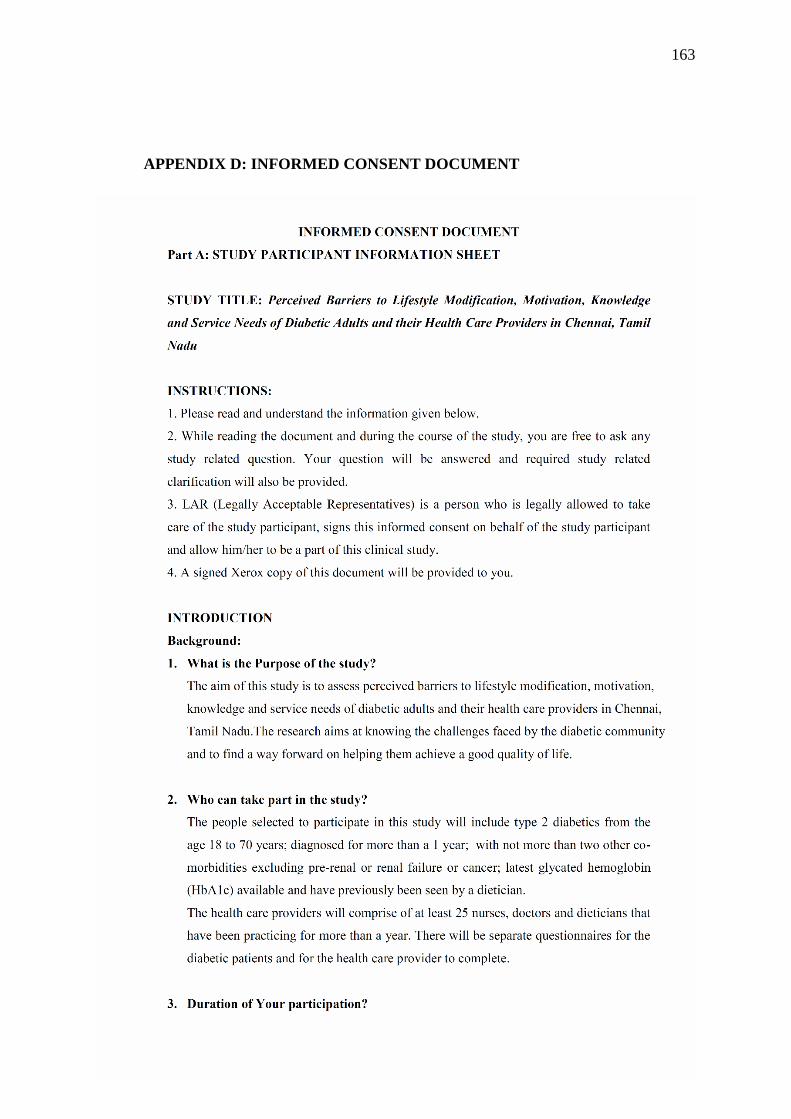
163
APPENDIX D: INFORMED CONSENT DOCUMENT
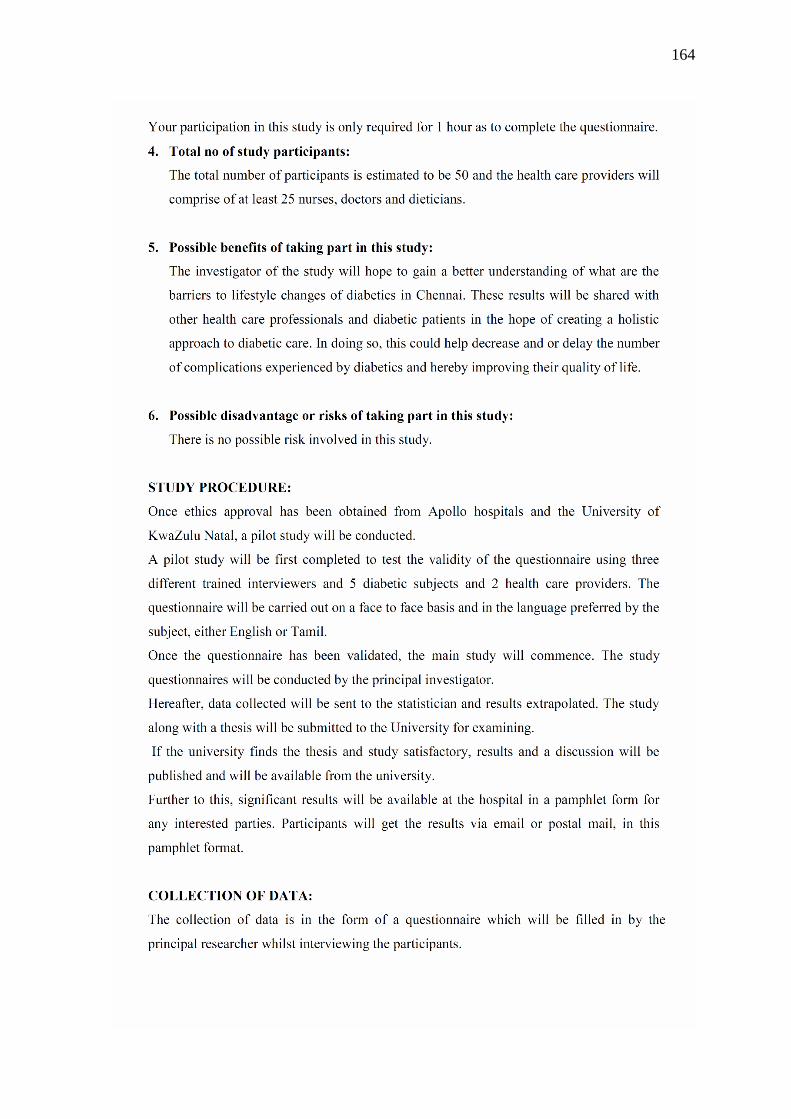
164
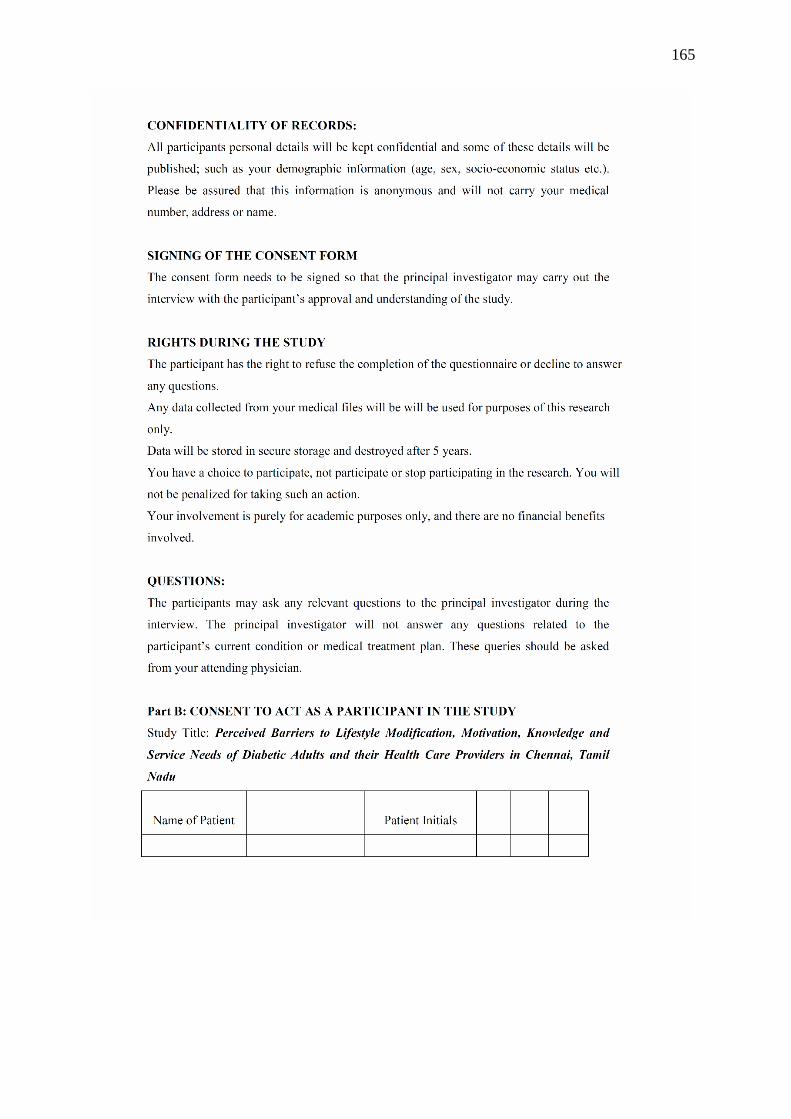
165
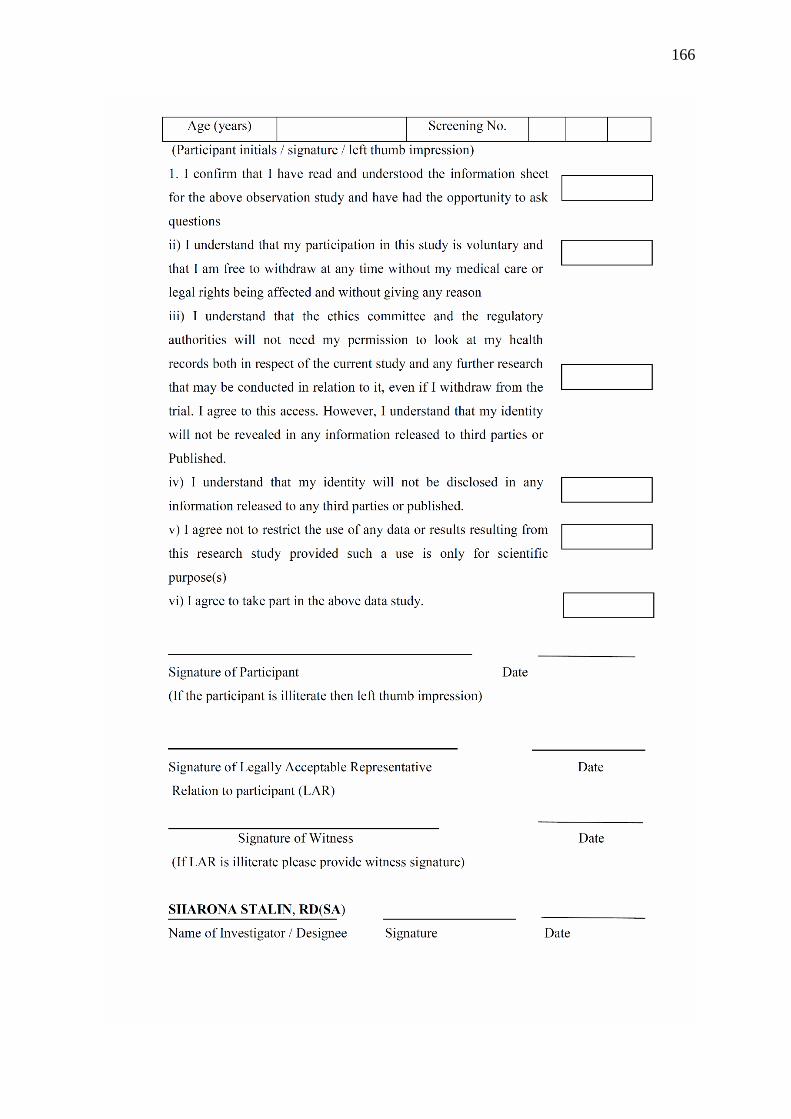
166
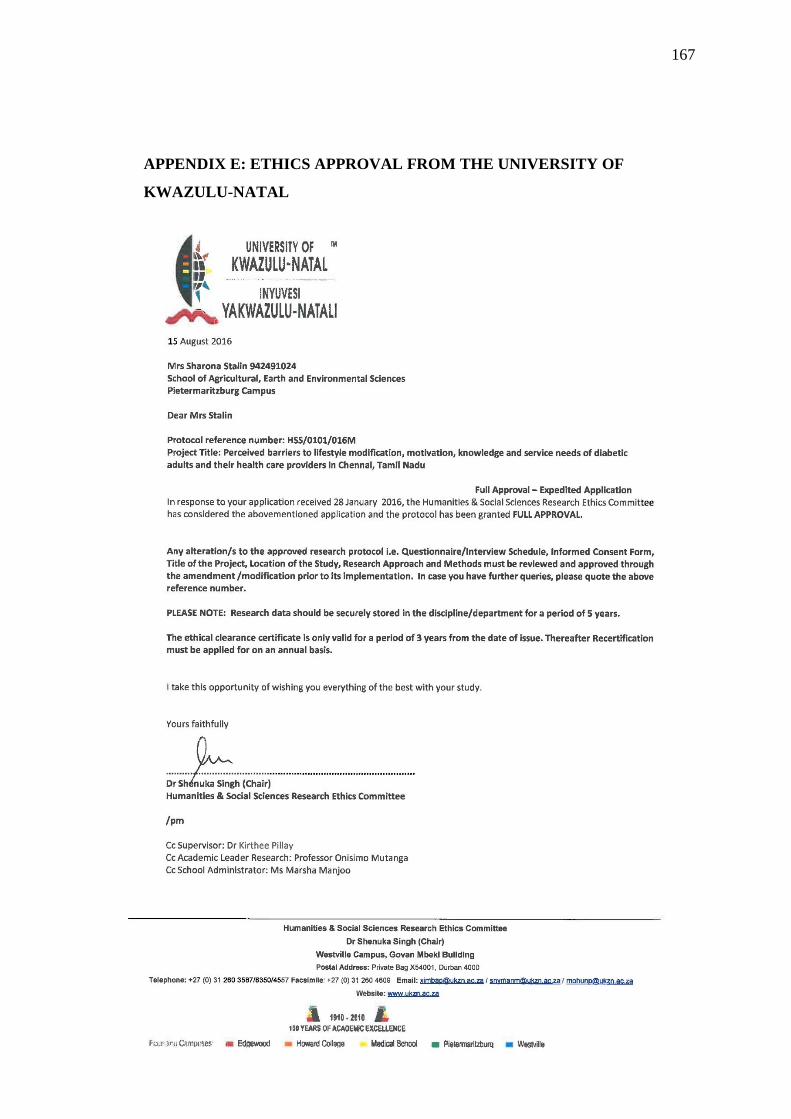
167
APPENDIX E: ETHICS APPROVAL FROM THE UNIVERSITY OF
KWAZULU-NATAL
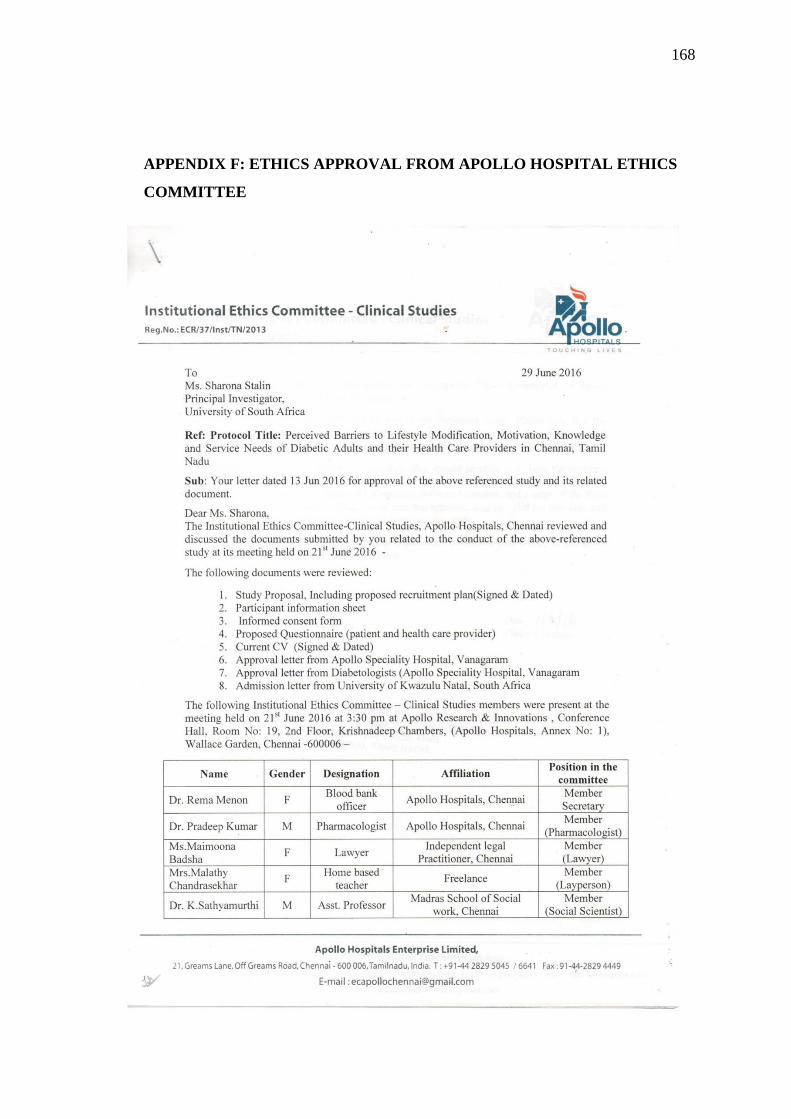
168
APPENDIX F: ETHICS APPROVAL FROM APOLLO HOSPITAL ETHICS
COMMITTEE
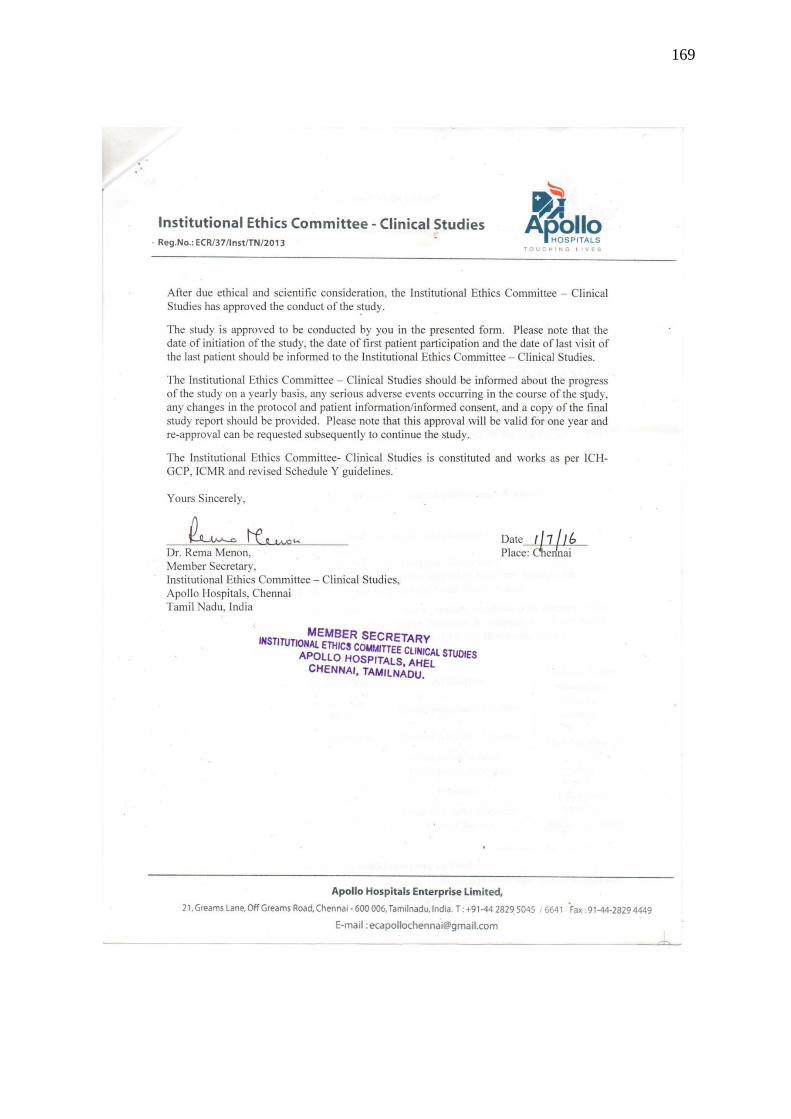
169
Related Documents