©2021. Sadikin, et.al. Open access under CC BY – SA license. Received: 26-09-2021. Accepted: 26-11-2021. Published online: 27-11-2021. doi: 10.20473/amnt. V5i2SP.2021. 38-44. Joinly Published by IAGIKMI & Universitas Airlangga Sadikin, et.al. Amerta Nutr (2021).supl.38-44. 38 DOI: 10.20473/amnt.v5i2SP.2021. 38-44. Perbedaan Proporsi Tingkat Literasi Gizi pada Mahasiswa S1 Reguler Universitas Indonesia Tahun 2021 Nutrition Literacy Proportion Differences among Regular Undergraduate Students in University of Indonesia Year 2021 Deasy Andesbrenta Sadikin* 1 , Asih Setiarini 2 , Ahmad Syafiq 3 ABSTRAK Latar Belakang: Literasi gizi adalah kemampuan sejauh mana individu dapat memperoleh, memproses, memahami, dan menggunakan informasi gizi dan diet, serta mengakses layanan yang dibutuhkan untuk membuat keputusan gizi yang baik. Rendahnya literasi gizi dapat berdampak pada pola makan yang buruk dan berujung pada kejadian penyakit tidak menular terkait gizi. Mahasiswa rentan mengembangkan kebiasaan makan yang buruk apabila tidak didukung dengan literasi gizi yang baik. Tujuan: Penelitian ini mengukur perbedaan proporsi literasi gizi pada mahasiswa S1 reguler aktif di Universitas Indonesia berdasarkan rumpun ilmu, jenis kelamin, tingkat pendidikan ayah, tingkat pendidikan ibu, uang saku, dan penggunaan media. Metode: Desain penelitian yang digunakan adalah cross-sectional dengan metode kuota sampling untuk mendapatkan 130 sampel dari mahasiswa Rumpun Ilmu Kesehatan dan 130 sampel dari mahasiswa Rumpun Ilmu Non-Kesehatan. Hasil: Penelitian ini menunjukkan bahwa mayoritas mahasiswa Universitas Indonesia memiliki tingkat literasi gizi yang adekuat (62.7%). Hasil analisis bivariat juga menunjukkan adanya perbedaan signifikan pada proporsi tingkat literasi gizi total berdasarkan rumpun ilmu (OR = 6.7, p-value < 0.01), jenis kelamin (OR = 6.7, p-value < 0.01), dan penggunaan media (OR = 4.36, p-value < 0.01). Selain faktor-faktor tersebut, ditemukan juga perbedaan proporsi antara tingkat literasi gizi interaktif berdasarkan tingkat pendidikan ibu (p-value < 0.05). Kesimpulan: Mahasiswa dari Rumpun Ilmu Non-kesehatan berisiko memiliki tingkat literasi gizi lebih rendah dibandingkan dengan mahasiswa dari Rumpun Ilmu Kesehatan. Terdapat perbedaan proporsi tingkat literasi gizi berdasarkan rumpun ilmu, jenis kelamin, tingkat pendidikan ibu, dan penggunaan media. Kata Kunci: Literasi Gizi, Rumpun Ilmu Kesehatan, Mahasiswa, Jenis Kelamin, Tingkat Pendidikan Orang Tua, Penggunaan Media ABSTRACT Background: Nutrition literacy is the ability to obtain, process, understand, and use nutritional and dietary information, as well as access to the services needed to make good nutritional decisions. Low nutritional literacy can lead to poor diet and lead to the incidence of non-communicable diseases related to nutrition. College students are prone to develop poor eating habits if not supported by good nutrition literacy. Objectives: This study measured the difference in the proportion of nutritional literacy in regular active undergraduate students at the Universitas Indonesia based on cluster of science, gender, paternal and maternal education level, pocket money, and media use. Methods: The study design used is a cross-sectional design with a quota sampling method to get 130 samples of students from the Health Science Cluster and 130 samples of students from the Non-Health Science Cluster. Results: This study showed the majority of the Universitas Indonesia students have an adequate level of nutrition literacy. The bivariate analysis revealed a significant difference in proportion to total nutrition literacy levels based on clusters of science, gender, and media use. In addition to these variables, there was a proportional difference in interactive nutrition literacy based on mother education level. Conclusions: Students from the non-health science cluster are at risk of having a lower level of nutrition literacy compared to students from the health science cluster. There are differences in the proportion of nutritional literacy levels based on cluster of science, gender, maternal education level, and media use. Keywords: Nutrition literacy, Health Sciences Cluster, College Students, Gender, Parental Education Level, Media Use, Pocket Money. RESEARCH STUDY Open Access

Welcome message from author
This document is posted to help you gain knowledge. Please leave a comment to let me know what you think about it! Share it to your friends and learn new things together.
Transcript
©2021. Sadikin, et.al. Open access under CC BY – SA license. Received: 26-09-2021. Accepted: 26-11-2021. Published online: 27-11-2021. doi: 10.20473/amnt. V5i2SP.2021. 38-44. Joinly Published by IAGIKMI & Universitas Airlangga
Sadikin, et.al. Amerta Nutr (2021).supl.38-44. 38
DOI: 10.20473/amnt.v5i2SP.2021. 38-44.
Perbedaan Proporsi Tingkat Literasi Gizi pada Mahasiswa S1 Reguler Universitas Indonesia Tahun 2021
Nutrition Literacy Proportion Differences among Regular Undergraduate
Students in University of Indonesia Year 2021
Deasy Andesbrenta Sadikin*1, Asih Setiarini2, Ahmad Syafiq3
ABSTRAK
Latar Belakang: Literasi gizi adalah kemampuan sejauh mana individu dapat memperoleh, memproses, memahami, dan menggunakan informasi gizi dan diet, serta mengakses layanan yang dibutuhkan untuk membuat keputusan gizi yang baik. Rendahnya literasi gizi dapat berdampak pada pola makan yang buruk dan berujung pada kejadian penyakit tidak menular terkait gizi. Mahasiswa rentan mengembangkan kebiasaan makan yang buruk apabila tidak didukung dengan literasi gizi yang baik. Tujuan: Penelitian ini mengukur perbedaan proporsi literasi gizi pada mahasiswa S1 reguler aktif di Universitas Indonesia berdasarkan rumpun ilmu, jenis kelamin, tingkat pendidikan ayah, tingkat pendidikan ibu, uang saku, dan penggunaan media. Metode: Desain penelitian yang digunakan adalah cross-sectional dengan metode kuota sampling untuk mendapatkan 130 sampel dari mahasiswa Rumpun Ilmu Kesehatan dan 130 sampel dari mahasiswa Rumpun Ilmu Non-Kesehatan. Hasil: Penelitian ini menunjukkan bahwa mayoritas mahasiswa Universitas Indonesia memiliki tingkat literasi gizi yang adekuat (62.7%). Hasil analisis bivariat juga menunjukkan adanya perbedaan signifikan pada proporsi tingkat literasi gizi total berdasarkan rumpun ilmu (OR = 6.7, p-value < 0.01), jenis kelamin (OR = 6.7, p-value < 0.01), dan penggunaan media (OR = 4.36, p-value < 0.01). Selain faktor-faktor tersebut, ditemukan juga perbedaan proporsi antara tingkat literasi gizi interaktif berdasarkan tingkat pendidikan ibu (p-value < 0.05). Kesimpulan: Mahasiswa dari Rumpun Ilmu Non-kesehatan berisiko memiliki tingkat literasi gizi lebih rendah dibandingkan dengan mahasiswa dari Rumpun Ilmu Kesehatan. Terdapat perbedaan proporsi tingkat literasi gizi berdasarkan rumpun ilmu, jenis kelamin, tingkat pendidikan ibu, dan penggunaan media. Kata Kunci: Literasi Gizi, Rumpun Ilmu Kesehatan, Mahasiswa, Jenis Kelamin, Tingkat Pendidikan Orang Tua, Penggunaan Media
ABSTRACT
Background: Nutrition literacy is the ability to obtain, process, understand, and use nutritional and dietary information, as well as access to the services needed to make good nutritional decisions. Low nutritional literacy can lead to poor diet and lead to the incidence of non-communicable diseases related to nutrition. College students are prone to develop poor eating habits if not supported by good nutrition literacy. Objectives: This study measured the difference in the proportion of nutritional literacy in regular active undergraduate students at the Universitas Indonesia based on cluster of science, gender, paternal and maternal education level, pocket money, and media use. Methods: The study design used is a cross-sectional design with a quota sampling method to get 130 samples of students from the Health Science Cluster and 130 samples of students from the Non-Health Science Cluster. Results: This study showed the majority of the Universitas Indonesia students have an adequate level of nutrition literacy. The bivariate analysis revealed a significant difference in proportion to total nutrition literacy levels based on clusters of science, gender, and media use. In addition to these variables, there was a proportional difference in interactive nutrition literacy based on mother education level. Conclusions: Students from the non-health science cluster are at risk of having a lower level of nutrition literacy compared to students from the health science cluster. There are differences in the proportion of nutritional literacy levels based on cluster of science, gender, maternal education level, and media use.
Keywords: Nutrition literacy, Health Sciences Cluster, College Students, Gender, Parental Education Level, Media Use, Pocket Money.
RESEARCH STUDY Open Access
©2021. Sadikin, et.al. Open access under CC BY – SA license. Received: 26-09-2021. Accepted: 26-11-2021. Published online: 27-11-2021. doi: 10.20473/amnt. V5i2SP.2021. 38-44. Joinly Published by IAGIKMI & Universitas Airlangga
Sadikin, et.al. Amerta Nutr (2021).supl.38-44. 39
DOI: 10.20473/amnt.v5i2SP.2021. 38-44.
*Correspondent: [email protected] Deasy Andesbrenta Sadikin Universitas Indonesia, Depok, West Java Published by Universitas Airlangga and IAGIKMI INTRODUCTION
Health problems related to nutrition such as obesity, diabetes mellitus, hypertension, and coronary heart disease in recent years tend to increase. Refer to Riskesdas data issued by the Ministry of Health of the Republic of Indonesia in 2018, there was an increase in the proportion of overweight and obesity in adults aged over 18 years old. The proportion of adults with obesity in Indonesia increased from 10.5% in 2007 to 14.8% in 2013 and into 21.8% in 2018. In the same period between 2013 to 2018, there was an increase of 4% in the proportion of patients with diabetes mellitus, 8.3% in patients with hypertension, and 1% in patients with coronary heart disease [1, 2]. An unhealthy diet is an important behavioral risk factor that can be modified to prevent non-communicable diseases [3-5]. The times that are considered appropriate for changing an individual's diet are adolescence and young adulthood. This can be because adolescence is the most appropriate time to develop positive health behaviors that can be sustained throughout life, but at the same time, it is also a very vulnerable time to develop diseases that can be seen in adulthood [6]. Young adulthood is also important because young adults are considered vulnerable to obesity during the transition from childhood or adolescence to adulthood [7]. In these times also nutrition literacy owned by individuals plays a role in the formation of healthy eating behaviors [8].
Nutrition literacy is a significant factor that influences a person's healthy eating habits. Low nutrition literacy can lead to health problems because nutrition is a major fundamental factor in the development and treatment of non-communicable diseases such as diabetes, bad health status, and hypertension. In addition, nutrition literacy also affects the quality of a person's diet. Low nutrition literacy can have an impact on poor dietary quality [9-12]. The study of Taylor et al showed that the group with a good level of nutrition literacy generally consumed more red vegetables and legumes, fresh fruits, as well as sources of unsaturated oil, while the group with the low level of nutritional literacy significantly more eating fried and high cholesterol foods, processed meats, beverages containing additives, and other sources of saturated fat. The type of consumption chosen by this group with low nutrition literacy is associated with a diet of poor quality[13].
Nutrition literacy can be defined as the extent to which individuals can obtain, process, understand, and use nutritional and dietary information, as well as access the services needed to make a good nutritional decision [14-18]. Until now the level of nutrition literacy still refers to Nutbeam's tripartite model that considers three levels of literacy, namely functional, interactive, and critical.
Functional includes declarative and procedural knowledge to obtain information and awareness about facts and processes. Interactive literacy considers interactions between individuals and opportunities to exchange, share, and discuss information and participation in joint movements; While the critical level focuses on critical analysis of information and understanding of the impact of food on the environmental and socioeconomic fields [19]. Nutrition literacy reflects the technical, cultural, and ethical aspects of food that are more than just a source of caloric fulfillment. Nutrition literacy also affects humans at various age levels. Research has revealed that nutritional literacy plays an important role in shaping eating behaviors from childhood and enabling them to make healthy food choices that can be sustained later in life[20]. On the other hand, low levels of nutrition literacy in school-age children are associated with malnutrition, inhibition of food diversity, and appear to be a barrier to assessing information when choosing foods, understanding food labels, and implementing dietary recommendations. Therefore, improving nutrition literacy is important to promote a healthy diet that will later reduce the burden of diseases related to nutrition in the long term [20, 21].
Collage students fall into the transitional age group between adolescents and young adults. Individuals in this age are experiencing the development of self-identity, exploring new ideologies and behaviors to express their individuality, and changing interpersonal influences [22]. At the same time, college students are also in the transition to independent living and have more opportunities to make their own decisions regarding eating habits than when they were underage [23]. This results in the possibility of them developing poor eating habits, obesity, and obesity-related diseases. There has not been much research related to nutrition literacy in college students in Indonesia and abroad. Liao et al's research on nutrition literacy in college students in Taiwan showed that the average value of personal assessment of nutrition literacy was 2.8 with a variation of 0.46 from the largest value of 4 [24]. In Indonesia, research on college students was conducted by Jusephina in Depok who found that 44.9% of students had inadequate nutrition literacy [25], while research on students in Bogor by Fauzia showed that 56.2% of college students had poor nutrition literacy [26]. There needs to be additional data to better describe the condition of nutrition literacy in college students, especially in Indonesia.
Factors that affect the level of nutrition literacy include the cluster of science they studied, gender, parental education level, pocket money, and media use
©2021. Sadikin, et.al. Open access under CC BY – SA license. Received: 26-09-2021. Accepted: 26-11-2021. Published online: 27-11-2021. doi: 10.20473/amnt. V5i2SP.2021. 38-44. Joinly Published by IAGIKMI & Universitas Airlangga
Sadikin, et.al. Amerta Nutr (2021).supl.38-44. 39
DOI: 10.20473/amnt.v5i2SP.2021. 38-44.
[8, 27, 28]. Students from the non-health sciences cluster have a 4.6 times greater risk of having inadequate nutrition literacy than students from the health sciences cluster [25]. Generally, females have a higher level of nutrition literacy than males, and they eat more in accordance with dietary recommendations and are more knowledgeable about health issues [27]. Higher parental education allows families to have greater access to healthy food and health services, raise household incomes, and improve nutrition literacy and health [29]; but low socioeconomic conditions are also related to lower dietary quality [13]. Meanwhile, the media is frequently cited as a source of knowledge for adolescents and is linked to their health habits [30].
Previous research in 2018 conducted on first-year students at the University of Indonesia showed that as many as 44.9% of students had inadequate levels of nutrition literacy [25]. Research related to nutrition literacy in University of Indonesia students was conducted again to see the proportion of nutrition literacy of regular students of the University of Indonesia and find out other factors related to nutrition literacy in students. Therefore, this study aims to find out the difference in the proportion of nutrition literacy based on cluster of science, gender, paternal education level, maternal education level, pocket money, and media use in regular undergraduate students at the University of Indonesia.
This research is expected to give information about students' nutrition literacy levels and can be a reference and basis for compiling nutrition-related intervention and education program materials aimed at adolescent and young adult groups, as well as support for other researchers to conduct further research on nutrition literacy. METHODS
This research was conducted using a cross-sectional research design with a quantitative approach. The design of this study studied the relationship between independent variables (risk factors) and dependent variables (impacts) simultaneously at a time [31]. The independent variables measured in the study were gender, cluster of science, parental education, pocket money, and media use; while the dependent variable measured is nutrition literacy. The study was conducted online at the University of Indonesia, Depok, West Java, from April to June 2021. This research sample is some active students from regular undergraduate programs in 14 different faculties at the University of Indonesia. The sampling technique used is a quota sampling technique. The selection of sampling techniques aims so that the sample can be divided proportionally in each category. The study divided the sample quota equally into groups of health sciences cluster and non-health science cluster.
The inclusion criteria used in the taking of research subjects are: (1) Active students from regular undergraduate programs at the University of Indonesia in the 2020/2021 period; (2) Students who have electronic devices and/or internet facilities to access questionnaire links. The exclusion criteria used are students who do not complete all parts of the questionnaire.
Based on the results of calculations of samples size using the hypothesis test formula for two proportions obtained the minimum number of samples needed based on the previous research is 59 people. Because the study was conducted to assess the difference of two proportions, the minimum sample number should be multiplied by two, which then obtained the number of 118 people. Anticipation of participants who drop out or the existence of error data is done by adding subjects 10% of the total sample so that the minimum number of samples that must be studied is rounded to 130 people. Related to the division of sample quotas based on health and non-health sciences cluster, the minimum sample number is divided equally between the two groups of science cluster. The expected sample target is 130 students from the health sciences cluster and 130 students from the non-health sciences cluster.
The data collected in this study is in primary data obtained by filling out online questionnaires independently by student respondents through the Qualtrics Survey website. The research instrument used consists of an informed consent sheet; IR questionnaire related to respondents' identity, questionnaire A Nutrition Literacy, and questionnaire B Media Use. The nutrition literacy questionnaire used is a modified questionnaire from the Nutrition Literacy Assessment Instrument (NLAI) and Nutrition Literacy Assessment for Adolescents (NLAA) that has been adapted to the Indonesian population.
The collected data is then processed and analyzed using data processing software for statistical analysis. Data analysis consists of univariate and bivariate analysis. This analysis was conducted on all the variables of the study, namely nutrition literacy, gender, cluster of science, parental education level, pocket money, and media use. Bivariate analysis is done using a different proportion test or also known as the chi-square test on dependent variables with all independent variables. In addition to the chi-square test, correlation tests were conducted on three domains of nutrition literacy to determine whether or not the number of nutritional literacy answers was accumulated to form the Total Nutrition Literacy variable. Correlation tests were also conducted on food-specific pocket money and pocket money data to determine the relationship between total pocket money data and food-specific pocket money data.

©2021. Sadikin, et.al. Open access under CC BY – SA license. Received: 26-09-2021. Accepted: 26-11-2021. Published online: 27-11-2021. doi: 10.20473/amnt. V5i2SP.2021. 38-44. Joinly Published by IAGIKMI & Universitas Airlangga
Sadikin, et.al. Amerta Nutr (2021).supl.38-44. 38
DOI: 10.20473/amnt.v5i2SP.2021. 38-44.
RESULTS AND DISCUSSION
Tabel 1. Frequency Distribution of Total Nutrition Literacy Level, Functional Nutrition Literacy Level, Interactive Nutrition Literacy Level, and Critical Nutrition Literacy Level of Regular Undergraduate Students at the University of Indonesia in 2021
(n=260)
Nutrition Literacy Level Total (n) Percentage (%)
Total Nutrition Literacy Inadequate Nutrition Literacy 97 37.3 Adequate Nutrition Literacy 163 62.7
Functional Nutrition Literacy (FNL) Low FNL 66 25.4 Good FNL 194 74.6
Interactive Nutrition Literacy (INL) Low INL 110 42.3 Good INL 150 57.7
Critical Nutrition Literacy (CNL) Low CNL 130 50 Good CNL 130 50
Based on Table 1, it can be seen that respondents
with adequate nutrition literacy levels are higher compared to respondents with inadequate levels of nutrition literacy. A total of 62.7% of respondents has an adequate level of Total Nutrition Literacy, while only 37.3% of respondents have an inadequate level of Total Nutrition Literacy. In addition, it is also known that the number of respondents with good FNL (74.6%) is more than respondents who have low FNL (25.4%). The number of respondents with good INL (57.7%) is more than respondents with low INL (42.3%), and the number of respondents with a good CNL level (50%) is balanced or has the same number of respondents with low CNL levels
(50%). The Functional Nutrition Literacy (FNL) domain
consists of 5 subdomains, namely (1) Balanced nutrition; (2) Food group; (3) Food packaging label; (4) The type, source, and function of nutrients; and (5) Nutrition and reproductive health. Descriptive tests are conducted on all five subdomains of functional nutrition literacy to determine the minimum value, maximum value, and average value of correct answers from the entire subdomain. The results of the descriptive analysis of correct answers from the domain of functional nutrition literacy can be seen in Table 2.
Table 2. Descriptive Analysis of Total Correct Answers Subdomain Functional Nutrition Literacy in Regular Undergraduate Student Respondents at the University of Indonesia in 2021
No. Subdomains in LGF Number of Questions.
Mean ± SD Min-Max
1 Balanced Nutrition 12 10.26 ± 1.58 1 – 12 2 Food Group 20 16.44 ± 2.16 2 – 20 3 Food Packaging Label 6 3.53 ± 1.06 0 – 6 4 The Type, Source, and Function of Nutrients 26 15.92 ± 4.25 0 – 26 5 Nutrition and Reproductive Health 14 10.83 ± 2.99 0 – 14
The first subdomain related to Balanced Nutrition
consists of 12 questions. Each question is given with 5 answer choices consisting of 4 possible answer choices and 1 'don't know' option. The highest percentage of correct answers in the balanced nutrition subdomain is found in question number 12, which is 99.2%. This question relates to knowledge about the benefits of monitoring normal weight. In addition to having the highest percentage of correct answers, this question also has the lowest rate of incorrect answers and 'Do not Know' answers, 0.4% each. The lowest percentage of correct answers lies in question number 1, which is 37.7%. This question is related to knowledge about the number of principles of Balanced Nutrition Guidelines. Question number 1 also has the highest number of 'Do not Know'
answers, which is 43.5%. Most of the questions in the Balanced Nutrition subdomain have the correct answer percentage above 60%, except for question number 1.
The second subdomain is the Food Group subdomain which consists of 20 questions. The questions given are the names of food ingredients, while the answer choices given are six names of food ingredients groups consisting of Staple Food, Side Dishes, Vegetables, Fruits, Milk and Dairy Product, and Oils and Fats. Respondents were asked to group these foodstuffs into their food ingredient groups. The results show that the highest percentage of correct answers in the Food Group subdomain lies in question number 6, which is 99.6%. This question is related to beef food ingredients as part of the group of side dishes. The highest percentage of incorrect
©2021. Sadikin, et.al. Open access under CC BY – SA license. Received: 26-09-2021. Accepted: 26-11-2021. Published online: 27-11-2021. doi: 10.20473/amnt. V5i2SP.2021. 38-44. Joinly Published by IAGIKMI & Universitas Airlangga
Sadikin, et.al. Amerta Nutr (2021).supl.38-44. 39
DOI: 10.20473/amnt.v5i2SP.2021. 38-44.
answers was discovered in question number 7, which is 36.2%. This question is related to butter that belongs to the oil and fat food ingredients group. The oil and fat food group becomes the group of food ingredients with the most incorrect answers, characterized by two foodstuffs in this group, butter and margarine, having the percentage of wrong answers consecutively by 36.2% and 22.3%.
The third subdomain is the Food Packaging Label subdomain which consists of 6 questions. Each question gets five answer choices consisting of 4 possible correct choices and 1 'Do not know' option. The results show that question number 6 regarding the suitability of chips for consumption if the respondents were asked to increase fiber intake has the highest number of correct answers, which is 85.8%. Meanwhile, question number 3, regarding the percentage of daily fat intake obtained from 1 package of chips if fat intake is limited to 60 grams per day, has the highest number of incorrect answers, which is 86.5%.
The next subdomain is Types, Sources, and Functions of Nutrients consisting of 26 multiple-choice questions. In each question, the respondent gets five answer choices consisting of 4 possible correct choices and 1 'Do not know' option. The statistics suggest that questions number 2 and 25 had the largest percentage of incorrect answers, with 66.9% and 66.9%, respectively. Question number 2 is related to the recommended daily portion of staple foods according to the Balanced Nutrition Guidelines, while question number 25 is related to the recommended frequency of consumption of staple foods. The question with the highest number of correct answers is in question number 4 regarding examples of carbohydrate sources, which is 97.7%. The highest number of 'Do not Know' answers are found in question number 18 regarding the portion of the fruit that should
be consumed at every meal in the form of a plate, according to Balanced Nutrition Guideline in "Piring Makanku" (My Plate). The majority of questions that refer to respondents' knowledge of the recommendations in the Balanced Nutrition Guideline have correct answers less than 50%.
The fifth subdomain is the Nutrition and Reproductive Health subdomain, which consists of 14 questions in the form of multiple choices The answer choice given is 5 choices consisting of 4 answer choices that may be correct (there is only 1 correct answer from 4 choices given) and 1 'Don't know’ option. The results show that question number 13 regarding examples of calcium-sourced foods has the highest correct answers, which is 91.5%. The most incorrect answers are in question number 3 regarding what increase in accumulation in young men occurs during the peak of growth, which is 25.4%, while the most do not know answers are owned by question number 2 regarding body composition that affects the process of secondary sexual development in an adolescent girl, which is 20.8%. Question number 2 also has the least number of correct answers, which is 57.3%.
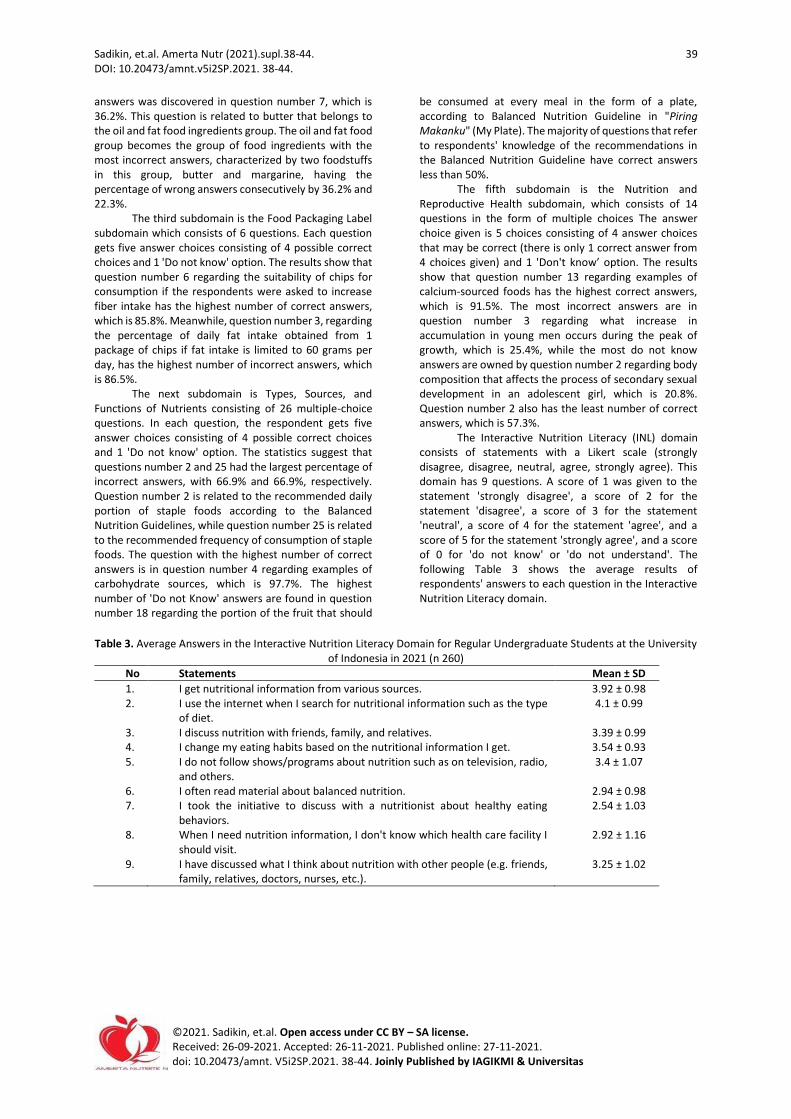
The Interactive Nutrition Literacy (INL) domain consists of statements with a Likert scale (strongly disagree, disagree, neutral, agree, strongly agree). This domain has 9 questions. A score of 1 was given to the statement 'strongly disagree', a score of 2 for the statement 'disagree', a score of 3 for the statement 'neutral', a score of 4 for the statement 'agree', and a score of 5 for the statement 'strongly agree', and a score of 0 for 'do not know' or 'do not understand'. The following Table 3 shows the average results of respondents' answers to each question in the Interactive Nutrition Literacy domain.
Table 3. Average Answers in the Interactive Nutrition Literacy Domain for Regular Undergraduate Students at the University of Indonesia in 2021 (n 260)
No Statements Mean ± SD
1. I get nutritional information from various sources. 3.92 ± 0.98 2. I use the internet when I search for nutritional information such as the type
of diet. 4.1 ± 0.99
3. I discuss nutrition with friends, family, and relatives. 3.39 ± 0.99 4. I change my eating habits based on the nutritional information I get. 3.54 ± 0.93 5. I do not follow shows/programs about nutrition such as on television, radio,
and others. 3.4 ± 1.07
6. I often read material about balanced nutrition. 2.94 ± 0.98 7. I took the initiative to discuss with a nutritionist about healthy eating
behaviors. 2.54 ± 1.03
8. When I need nutrition information, I don't know which health care facility I should visit.
2.92 ± 1.16
9. I have discussed what I think about nutrition with other people (e.g. friends, family, relatives, doctors, nurses, etc.).
3.25 ± 1.02

©2021. Sadikin, et.al. Open access under CC BY – SA license. Received: 26-09-2021. Accepted: 26-11-2021. Published online: 27-11-2021. doi: 10.20473/amnt. V5i2SP.2021. 38-44. Joinly Published by IAGIKMI & Universitas Airlangga
Sadikin, et.al. Amerta Nutr (2021).supl.38-44. 38
DOI: 10.20473/amnt.v5i2SP.2021. 38-44.
Based on Table 3, the statement in the domain of interactive nutrition literacy that has the highest average is statement number 2, which reads 'I use the internet when I search for nutritional information such as type of diet'. This shows that the average respondent agrees with this statement. The lowest average statement is statement number 7, which reads 'I take the initiative to discuss with a nutritionist about healthy eating behaviors'. This shows that the average respondent does not agree with the statement, or it can be concluded that the average respondent does not take the initiative to discuss healthy eating behavior with a
nutritionist. The Critical Nutrition Literacy (CNL) domain
consists of 11 questions in the form of a Likert scale. Respondents could choose the answer according to the suitability of the respondent's condition with the statement given. The answer choices consist of 6 choices, namely 'Strongly Disagree', 'Disagree', 'Neutral', 'Agree', 'Strongly Agree', and 'Don't Know/Don't Understand'. The answer scoring in the LGK domain is the same as the answer scoring in the LGI domain. The average respondents' answers to each question in the Critical Nutrition Literacy domain can be seen in Table 4.
Table 4. Average Answers on Critical Nutrition Literacy Domain in Regular Undergraduate Students at the University of Indonesia in 2021 (n 260)
No Statements Mean ± SD
1. I have been involved in organizations that aim to improve the quality of nutrition in Indonesia.
2.22 ± 0.99
2. I desire to take active action in promoting healthy eating behaviors on campus.
3.28 ± 1.03
3. I hope the faculty can provide healthy food. 4.21 ± 0.87 4. I try to influence others (such as family and friends) to eat healthy foods. 3.74 ± 0.95 5. In my opinion, it is important for the faculty canteen to select healthy food. 4.2 ± 0.86 6. I tend to be affected by the nutritional information I read in newspapers,
magazines, etc.. 3.28 ± 0.92
7. I tend to be affected by the nutritional information I get from family or friends.
3.3 ± 0.93
8. I believe in the different types of diets I read about in newspapers, magazines, and so on.
2.94 ± 0.88
9. I believe that the presentation of the results of scientific research on nutrition, diet, and food is the correct information.
4.02 ± 0.9
10. I find it difficult to distinguish nutritional information sourced from scientific research and those that are not.
2.85 ± 1.11
11. When I read nutrition information, it is important to me that the information is based on scientific evidence.
4.15 ± 0.9
Based on Table 4, it can be seen that the
question with the highest average is in number 3, which reads 'I hope the faculty can provide healthy food', while the question with the lowest average is in number 1, which reads 'I have been involved in an organization that aims to improve the quality of nutrition in Indonesia'. This indicates that the typical responder expects faculty to provide nutritious meals and that the average respondent
is not active in groups aimed at improving Indonesia's nutrition quality.
The independent variables studied are the family of science, gender, paternal education level, maternal education level, pocket money, and media use. The frequency distribution of each independent variable can be seen in Table 5.
©2021. Sadikin, et.al. Open access under CC BY – SA license. Received: 26-09-2021. Accepted: 26-11-2021. Published online: 27-11-2021. doi: 10.20473/amnt. V5i2SP.2021. 38-44. Joinly Published by IAGIKMI & Universitas Airlangga
Sadikin, et.al. Amerta Nutr (2021).supl.38-44. 38
DOI: 10.20473/amnt.v5i2SP.2021. 38-44.
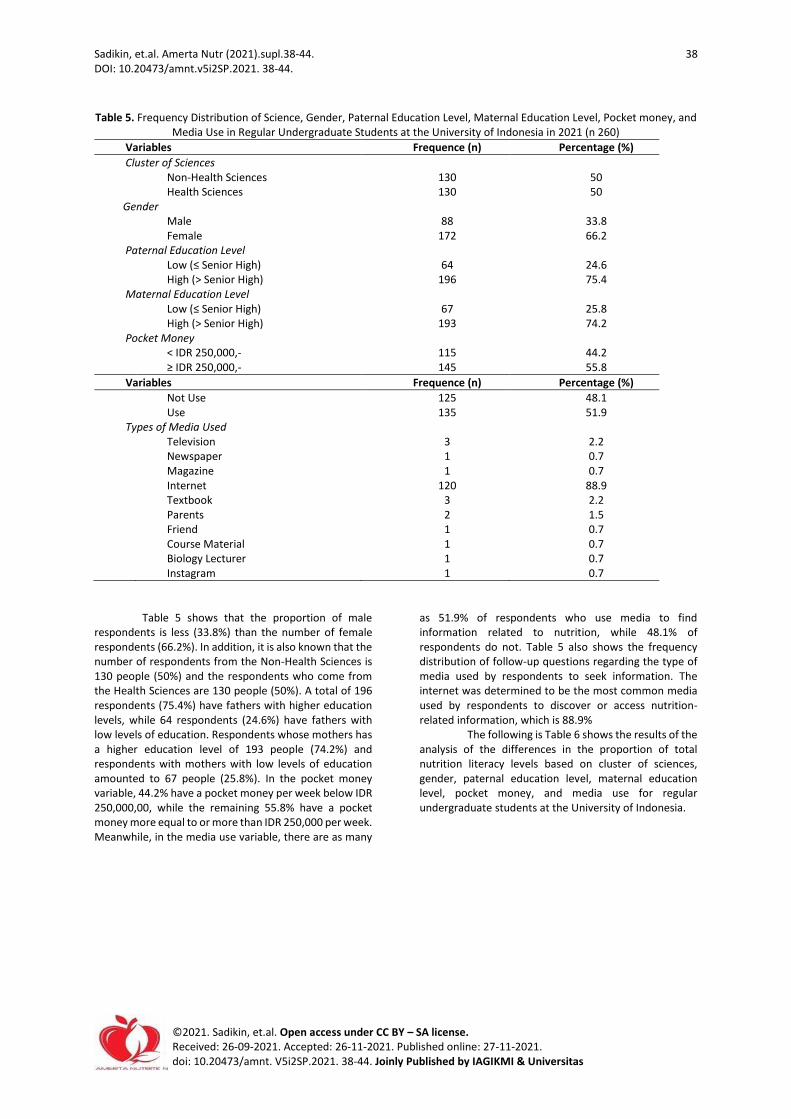
Table 5. Frequency Distribution of Science, Gender, Paternal Education Level, Maternal Education Level, Pocket money, and Media Use in Regular Undergraduate Students at the University of Indonesia in 2021 (n 260)
Variables Frequence (n) Percentage (%)
Cluster of Sciences Non-Health Sciences 130 50 Health Sciences 130 50 Gender Male 88 33.8 Female 172 66.2 Paternal Education Level Low (≤ Senior High) 64 24.6 High (> Senior High) 196 75.4 Maternal Education Level Low (≤ Senior High) 67 25.8 High (> Senior High) 193 74.2 Pocket Money < IDR 250,000,- 115 44.2 ≥ IDR 250,000,- 145 55.8
Variables Frequence (n) Percentage (%)
Not Use 125 48.1 Use 135 51.9 Types of Media Used Television 3 2.2 Newspaper 1 0.7 Magazine 1 0.7 Internet 120 88.9 Textbook 3 2.2 Parents 2 1.5 Friend 1 0.7 Course Material 1 0.7 Biology Lecturer 1 0.7 Instagram 1 0.7
Table 5 shows that the proportion of male respondents is less (33.8%) than the number of female respondents (66.2%). In addition, it is also known that the number of respondents from the Non-Health Sciences is 130 people (50%) and the respondents who come from the Health Sciences are 130 people (50%). A total of 196 respondents (75.4%) have fathers with higher education levels, while 64 respondents (24.6%) have fathers with low levels of education. Respondents whose mothers has a higher education level of 193 people (74.2%) and respondents with mothers with low levels of education amounted to 67 people (25.8%). In the pocket money variable, 44.2% have a pocket money per week below IDR 250,000,00, while the remaining 55.8% have a pocket money more equal to or more than IDR 250,000 per week. Meanwhile, in the media use variable, there are as many
as 51.9% of respondents who use media to find information related to nutrition, while 48.1% of respondents do not. Table 5 also shows the frequency distribution of follow-up questions regarding the type of media used by respondents to seek information. The internet was determined to be the most common media used by respondents to discover or access nutrition-related information, which is 88.9%
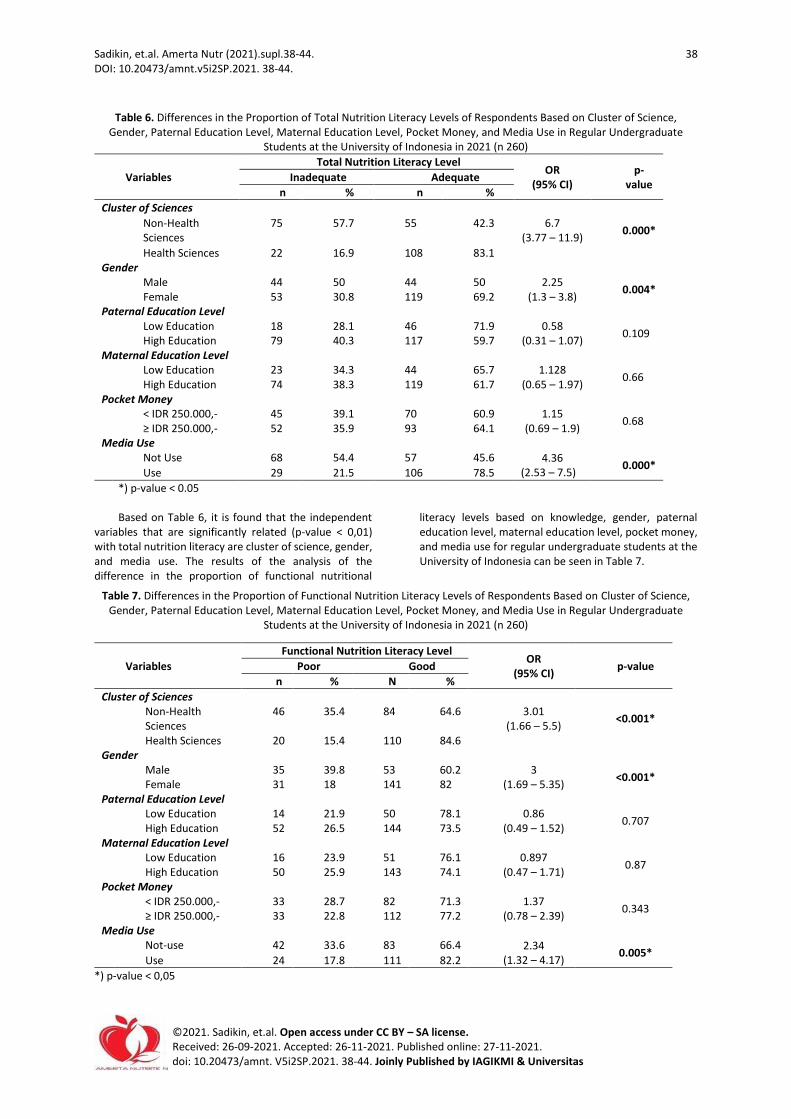
The following is Table 6 shows the results of the analysis of the differences in the proportion of total nutrition literacy levels based on cluster of sciences, gender, paternal education level, maternal education level, pocket money, and media use for regular undergraduate students at the University of Indonesia.
©2021. Sadikin, et.al. Open access under CC BY – SA license. Received: 26-09-2021. Accepted: 26-11-2021. Published online: 27-11-2021. doi: 10.20473/amnt. V5i2SP.2021. 38-44. Joinly Published by IAGIKMI & Universitas Airlangga
Sadikin, et.al. Amerta Nutr (2021).supl.38-44. 38
DOI: 10.20473/amnt.v5i2SP.2021. 38-44.
Table 6. Differences in the Proportion of Total Nutrition Literacy Levels of Respondents Based on Cluster of Science, Gender, Paternal Education Level, Maternal Education Level, Pocket Money, and Media Use in Regular Undergraduate
Students at the University of Indonesia in 2021 (n 260)
Variables
Total Nutrition Literacy Level OR
(95% CI) p-
value Inadequate Adequate
n % n %
Cluster of Sciences
6.7 (3.77 – 11.9)
0.000* Non-Health
Sciences 75 57.7 55 42.3
Health Sciences 22 16.9 108 83.1 Gender
Male 44 50 44 50 2.25 (1.3 – 3.8)
0.004* Female 53 30.8 119 69.2
Paternal Education Level Low Education 18 28.1 46 71.9 0.58
(0.31 – 1.07) 0.109
High Education 79 40.3 117 59.7 Maternal Education Level
Low Education 23 34.3 44 65.7 1.128 (0.65 – 1.97)
0.66 High Education 74 38.3 119 61.7
Pocket Money < IDR 250.000,- 45 39.1 70 60.9 1.15
(0.69 – 1.9) 0.68
≥ IDR 250.000,- 52 35.9 93 64.1 Media Use
Not Use 68 54.4 57 45.6 4.36 (2.53 – 7.5)
0.000* Use 29 21.5 106 78.5
*) p-value < 0.05
Based on Table 6, it is found that the independent variables that are significantly related (p-value < 0,01) with total nutrition literacy are cluster of science, gender, and media use. The results of the analysis of the difference in the proportion of functional nutritional
literacy levels based on knowledge, gender, paternal education level, maternal education level, pocket money, and media use for regular undergraduate students at the University of Indonesia can be seen in Table 7.
Table 7. Differences in the Proportion of Functional Nutrition Literacy Levels of Respondents Based on Cluster of Science, Gender, Paternal Education Level, Maternal Education Level, Pocket Money, and Media Use in Regular Undergraduate
Students at the University of Indonesia in 2021 (n 260)
Variables
Functional Nutrition Literacy Level OR
(95% CI) p-value Poor Good
n % N %
Cluster of Sciences Non-Health
Sciences 46 35.4 84 64.6 3.01
(1.66 – 5.5) <0.001*
Health Sciences 20 15.4 110 84.6 Gender
Male 35 39.8 53 60.2 3 (1.69 – 5.35)
<0.001* Female 31 18 141 82
Paternal Education Level Low Education 14 21.9 50 78.1 0.86
(0.49 – 1.52) 0.707
High Education 52 26.5 144 73.5 Maternal Education Level
Low Education 16 23.9 51 76.1 0.897 (0.47 – 1.71)
0.87 High Education 50 25.9 143 74.1
Pocket Money < IDR 250.000,- 33 28.7 82 71.3 1.37
(0.78 – 2.39) 0.343
≥ IDR 250.000,- 33 22.8 112 77.2 Media Use
Not-use 42 33.6 83 66.4 2.34 (1.32 – 4.17)
0.005* Use 24 17.8 111 82.2
*) p-value < 0,05

©2021. Sadikin, et.al. Open access under CC BY – SA license. Received: 26-09-2021. Accepted: 26-11-2021. Published online: 27-11-2021. doi: 10.20473/amnt. V5i2SP.2021. 38-44. Joinly Published by IAGIKMI & Universitas Airlangga
Sadikin, et.al. Amerta Nutr (2021).supl.38-44. 39
DOI: 10.20473/amnt.v5i2SP.2021. 38-44.
Based on Table 7, it is found that the independent variables that are significantly related (p-value < 0.01) with functional nutrition literacy are health science and non-health sciences, gender, and media use. The results of the analysis of the difference in the proportion of interactive nutrition literacy levels based on science,
gender, paternal education level, maternal education level, pocket money, and media use for regular undergraduate students at the University of Indonesia can be seen in Table 8.
Table 8. Differences in the Proportion of Interactive Nutrition Literacy Levels of Respondents Based on Cluster of Science, Gender, Paternal Education Level, Maternal Education Level, Pocket Money, and Media Use in Regular Undergraduate
Students at the University of Indonesia in 2021 (n 260)
Variables
Interactive Nutrition Literacy Level OR
(95% CI) p-value Poor Good
n % n %
Cluster of Sciences
2.3 (1.39 – 3.8)
0.02* Non-Health
Sciences 68 52.3 62 47.7
Health Sciences 42 32.3 88 67.7 Gender
Male 42 47.7 46 52.3 1.096 (0.66 – 1.83)
0.257 Female 68 39.5 104 60.5
Paternal Education Level Low Education 28 43.8 36 56.2 1.08
(0.61 – 1.91) 0.902
High Education 82 41.8 114 58.2 Maternal Education Level
Low Education 37 55.2 30 44.8 2.03 (1.07 – 3.32)
0,019* High Education 73 37.8 120 62.2
Pocket Money < IDR 250.000,- 53 46.1 62 53.9 1.32
(0.8 – 2.17) 0.331
≥ IDR 250.000,- 57 39.3 88 60.7 Media Use
Not Use 78 62.4 47 37.6 5.34 (3.12 – 9.14)
<0.001* Use 32 23.7 103 76.3
*) p-value < 0.05
Based on Table 8, there are significantly related independent variables (p-value < 0.05) with interactive nutrition literacy are cluster of science, maternal education level, and media use. The results of the analysis of differences in the proportion of critical nutrition
literacy levels based on the cluster of science, gender, paternal education level, maternal education level, pocket money, and media use in regular undergraduate students at the University of Indonesia can be seen in Table 9.
©2021. Sadikin, et.al. Open access under CC BY – SA license. Received: 26-09-2021. Accepted: 26-11-2021. Published online: 27-11-2021. doi: 10.20473/amnt. V5i2SP.2021. 38-44. Joinly Published by IAGIKMI & Universitas Airlangga
Sadikin, et.al. Amerta Nutr (2021).supl.38-44. 38
DOI: 10.20473/amnt.v5i2SP.2021. 38-44.
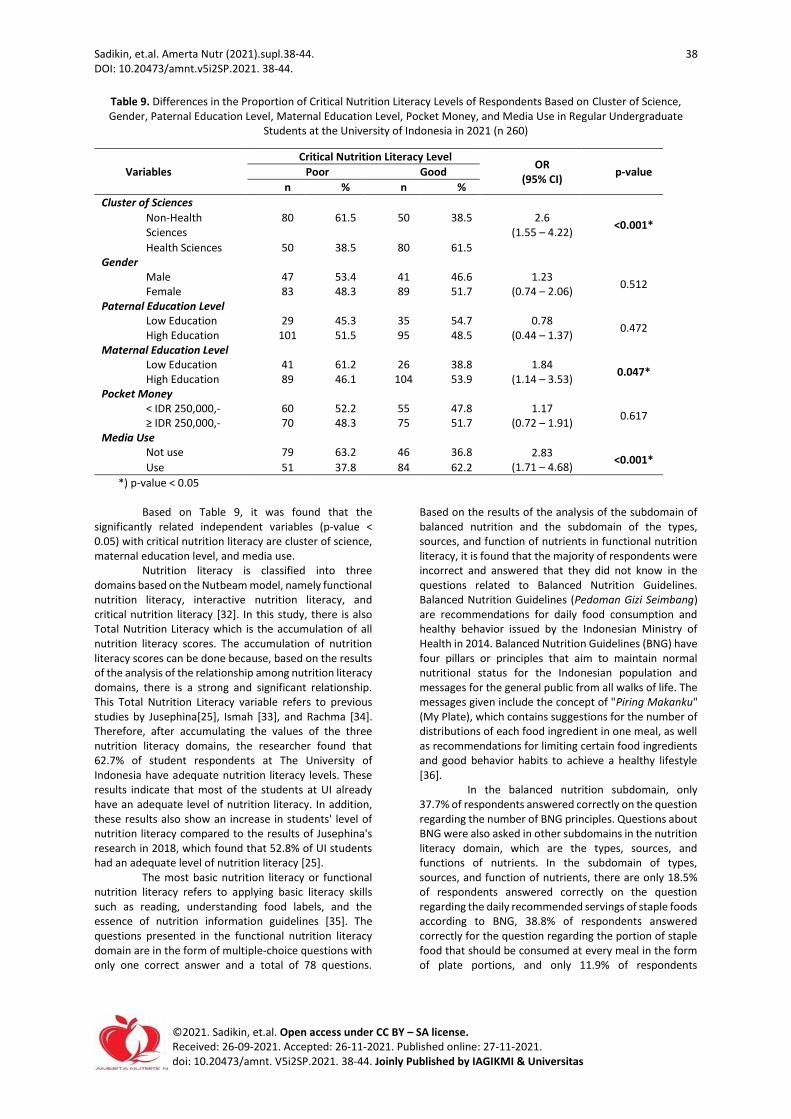
Table 9. Differences in the Proportion of Critical Nutrition Literacy Levels of Respondents Based on Cluster of Science, Gender, Paternal Education Level, Maternal Education Level, Pocket Money, and Media Use in Regular Undergraduate
Students at the University of Indonesia in 2021 (n 260)
Variables
Critical Nutrition Literacy Level OR
(95% CI) p-value Poor Good
n % n %
Cluster of Sciences
2.6 (1.55 – 4.22)
<0.001* Non-Health
Sciences 80 61.5 50 38.5
Health Sciences 50 38.5 80 61.5 Gender
Male 47 53.4 41 46.6 1.23 (0.74 – 2.06)
0.512 Female 83 48.3 89 51.7
Paternal Education Level Low Education 29 45.3 35 54.7 0.78
(0.44 – 1.37) 0.472
High Education 101 51.5 95 48.5 Maternal Education Level
Low Education 41 61.2 26 38.8 1.84 (1.14 – 3.53)
0.047* High Education 89 46.1 104 53.9
Pocket Money < IDR 250,000,- 60 52.2 55 47.8 1.17
(0.72 – 1.91) 0.617
≥ IDR 250,000,- 70 48.3 75 51.7 Media Use
Not use 79 63.2 46 36.8 2.83 (1.71 – 4.68)
<0.001* Use 51 37.8 84 62.2
*) p-value < 0.05
Based on Table 9, it was found that the significantly related independent variables (p-value < 0.05) with critical nutrition literacy are cluster of science, maternal education level, and media use.
Nutrition literacy is classified into three domains based on the Nutbeam model, namely functional nutrition literacy, interactive nutrition literacy, and critical nutrition literacy [32]. In this study, there is also Total Nutrition Literacy which is the accumulation of all nutrition literacy scores. The accumulation of nutrition literacy scores can be done because, based on the results of the analysis of the relationship among nutrition literacy domains, there is a strong and significant relationship. This Total Nutrition Literacy variable refers to previous studies by Jusephina[25], Ismah [33], and Rachma [34]. Therefore, after accumulating the values of the three nutrition literacy domains, the researcher found that 62.7% of student respondents at The University of Indonesia have adequate nutrition literacy levels. These results indicate that most of the students at UI already have an adequate level of nutrition literacy. In addition, these results also show an increase in students' level of nutrition literacy compared to the results of Jusephina's research in 2018, which found that 52.8% of UI students had an adequate level of nutrition literacy [25].
The most basic nutrition literacy or functional nutrition literacy refers to applying basic literacy skills such as reading, understanding food labels, and the essence of nutrition information guidelines [35]. The questions presented in the functional nutrition literacy domain are in the form of multiple-choice questions with only one correct answer and a total of 78 questions.
Based on the results of the analysis of the subdomain of balanced nutrition and the subdomain of the types, sources, and function of nutrients in functional nutrition literacy, it is found that the majority of respondents were incorrect and answered that they did not know in the questions related to Balanced Nutrition Guidelines. Balanced Nutrition Guidelines (Pedoman Gizi Seimbang) are recommendations for daily food consumption and healthy behavior issued by the Indonesian Ministry of Health in 2014. Balanced Nutrition Guidelines (BNG) have four pillars or principles that aim to maintain normal nutritional status for the Indonesian population and messages for the general public from all walks of life. The messages given include the concept of "Piring Makanku" (My Plate), which contains suggestions for the number of distributions of each food ingredient in one meal, as well as recommendations for limiting certain food ingredients and good behavior habits to achieve a healthy lifestyle [36].
In the balanced nutrition subdomain, only 37.7% of respondents answered correctly on the question regarding the number of BNG principles. Questions about BNG were also asked in other subdomains in the nutrition literacy domain, which are the types, sources, and functions of nutrients. In the subdomain of types, sources, and function of nutrients, there are only 18.5% of respondents answered correctly on the question regarding the daily recommended servings of staple foods according to BNG, 38.8% of respondents answered correctly for the question regarding the portion of staple food that should be consumed at every meal in the form of plate portions, and only 11.9% of respondents
©2021. Sadikin, et.al. Open access under CC BY – SA license. Received: 26-09-2021. Accepted: 26-11-2021. Published online: 27-11-2021. doi: 10.20473/amnt. V5i2SP.2021. 38-44. Joinly Published by IAGIKMI & Universitas Airlangga
Sadikin, et.al. Amerta Nutr (2021).supl.38-44. 39
DOI: 10.20473/amnt.v5i2SP.2021. 38-44.
answered correctly on the question recommended servings of animal/vegetable side dishes. Other questions related to recommendations for animal/vegetable side dishes, portions of vegetables and fruits, as well as the correct questions in the My Plate recommendation, only have several correct answers of less than 50% each. From the data findings above, it can be concluded that there are still many students who do not know and understand the Guidelines for Balanced Nutrition or the concept of "Balanced Nutrition".
In the food group subdomain, the percentage of correct answers in the staple food group consisting of noodles and rice are 79.2% and 98.5%, respectively. This minimum score is in noodle ingredients, where many respondents mistakenly classified noodles into the side dishes along with oil and fat groups. The percentage of correct answers in the side dishes group ranges from 80% to 99.6%. The minimum number of side dishes was obtained from tofu. Most of the respondents' incorrect answers were caused by the respondents grouping tofu into the milk and dairy products group, the vegetable group, and the staple food group. In the vegetable food group, the percentage of correct answers ranges from 95% to 98.8%, with the highest number belonging to cauliflower. The fruit group has a range of correct answers between 95.4% to 98.5%, with the highest number of correct answers in mango. The milk and dairy products group has a range of correct answers between 95.4% to 97.7%, with the highest number of correct answers in yogurt. The last group of foodstuffs, which is the oil and fat group, has the percentages of correct answers of 63.8% and 77.7%, respectively, which are the number of correct answers for butter and margarine. In butter and margarine, the majority of respondents with incorrect answers were due to the respondents incorrectly entering butter and margarine into the milk and dairy group. The findings of the data above can indicate a lack of knowledge regarding food sources of fat, which can have an impact on unwittingly excess fat intake. Research by Lestari in 2020 [37] found a significant relationship between nutritional knowledge and fat intake, where knowledge related to fat sources would affect food choices and impact nutritional intake consumed by adolescents.
In the food packaging label subdomain, the percentage of correct answers ranges from 13.5% to 85.8%. The lowest number of correct answers is found in number 2 regarding the number of chips that may be consumed if limiting sodium consumption to < 500 mg and number 3 regarding the percentage of daily fat intake obtained from 1 package of chips if fat intake is limited to 60 grams per day. The percentage of correct answers in numbers 2 and 3 are 22.7% and 13.5%, respectively. These two questions have something in common: the implied meaning of food packaging labels that are not written directly. In consequence, to answer these two questions, one must understand the meaning of food packaging labels well. The other four questions in the food packaging label subdomain are more directed to the numbers written on the food packaging label and have a
percentage of correct answers above 70%. These results also show that respondents have good knowledge of food packaging labels but do not understand the meaning behind them, especially on how to apply them to personal diets.
The last subdomain, the nutrition and reproductive health subdomain, has a percentage of correct answers of 57.3% to 91.5%. The question with the least number of correct answers is question number 2 regarding body composition that affects the process of secondary sexual development in adolescent girls. The question with the second-lowest number of correct answers is the question regarding the recommended maximum breakfast time for adolescents, which is 58.1%. The average of respondents could answer 10 to 11 questions out of a total of 14 questions in this subdomain correctly.
Students' functional nutrition literacy level was obtained by adding up the total correct answers to all questions in the functional nutrition literacy domain. The average respondents could answer 57 questions out of a total of 78 questions correctly. The description of the frequency distribution of functional nutrition literacy levels shows that as many as 25.4% (66 people) of respondents have a low FNL level and as many as 74.6% (194 people) of respondents have a good FNL level. These findings are in line with Jusephina's research on nutrition literacy of UI students in 2018, which found that most UI students already had a good level of functional nutrition literacy, which was 56.6% [25]. Thus, the results of this study indicate an increase in the FNL of the University of Indonesia students from 2018 by 18%.
Interactive nutrition literacy is defined as cognitive ability and interpersonal skills to discuss nutritional issues with professional nutritionists. Meanwhile, critical nutrition literacy means the ability to analyze nutrition information and advice critically and have a desire to participate in actions to address nutritional problems from a wider personal, social, and community perspective [35]. Interactive nutrition literacy level and critical nutrition literacy level were measured using statements on a Likert scale. The answer choices included 'Strongly disagree', 'Disagree', 'Neutral', 'Agree', 'Strongly Agree', and 'Do not Know/Do not Understand'. The disadvantage of using the Likert scale model was that respondents were prone to misunderstandings in choosing answers and had the opportunity to only choose positive answers [38]. Therefore, it was used cut-off in the form of mean value to analyze the level of interactive and critical nutrition literacy. The use of the mean/median value as a cut-off was also recommended in a previous study by Jusephina as a researcher who modified the nutrition literacy questionnaire for students [25].
Based on the analysis of answers to the interactive nutrition literacy statements, the statement with the highest average is the statement that reads 'I use the internet when I search for information such as type of diet'. The statement has a mean value of 4.1, which indicates that most respondents agree with this statement. This statement is in line with the results of the
©2021. Sadikin, et.al. Open access under CC BY – SA license. Received: 26-09-2021. Accepted: 26-11-2021. Published online: 27-11-2021. doi: 10.20473/amnt. V5i2SP.2021. 38-44. Joinly Published by IAGIKMI & Universitas Airlangga
Sadikin, et.al. Amerta Nutr (2021).supl.38-44. 40
DOI: 10.20473/amnt.v5i2SP.2021. 38-44.
frequency distribution of the types of media used by respondents on the variable of media use. There are 120 respondents (88.9%) out of 135 respondents who use the media chose the internet as the medium used to find information related to nutrition. In addition, it is found that the average answer to the statement, which reads 'I often read material about balanced nutrition' is 2.94, indicating that most of the respondents do not agree with the statement. This follows the findings in the functional nutrition literacy domain that most respondents do not understand the Guidelines for Balanced Nutrition. Therefore, many answers were incorrect, and answered did not understand the questions related to BNG.
Another statement in the interactive nutrition literacy domain which the average indicates disagreement is in statement number 7, which reads 'I take the initiative to discuss with nutritionists about healthy eating behavior' and number 8, which reads 'When I need nutrition information, I do not know the health care facilities that I must visit'. The lack of initiative to discuss with nutritionists could be caused by the impact of technological developments and easy internet access to find various information related to diet. This is consistent with Farmer's findings that adolescents prefer to search for health-related information online because it was more convenient, did not have to include names, thereby reducing fear of the stigma that might arise, was inexpensive, and could open up social networking opportunities [39]. Meanwhile, statement number 8 indicates that most respondents knew what health service facilities they should go to if they needed information related to nutrition but chose to look for other alternatives to find information related to nutrition.
In the domain of critical nutrition literacy, it is known that most of the respondents show a positive attitude towards the behavior of analyzing nutrition information obtained from various sources of information. Statements number 2 and number 4, which read 'I am willing to take active action in promoting healthy eating behavior on campus' and 'I am trying to influence other people (such as family and friends) to eat healthy food' indicate that most respondents already have the will to promote healthy food and act in a social context to influence people around them to improve their nutritional quality. However, the smallest average value is found in the first statement regarding involvement in organizations that aim to improve nutritional quality in Indonesia. This finding also shows that the majority of respondents lack the will to participate in actions to address nutrition problems from the perspective of the wider community.
In the answers to the critical nutrition literacy domain, it is also found that most of the respondents demanded the faculty to provide healthy food and most of the respondents agreed that it was important for the faculty canteen to select healthy food. These results indicate that the majority of respondents are aware of the importance of consuming healthy food and the desire to influence the surrounding environment to promote healthy food consumption.
The results of this study are in accordance with the nutrition literacy model developed by Nutbeam and Velardo, in which nutrition literacy consists of the lowest stage, namely functional nutrition literacy, then increased to interactive nutrition literacy, then to critical nutrition literacy. The complexity of understanding nutrition will increase at each stage of nutrition literacy [32]. This is indicated by the percentage of good FNL reaching 74.6% and then getting smaller in the percentage of good INL and good CNL which are 57.7% and 50%, respectively. Good functional nutrition literacy becomes the basis for having good interactive nutrition literacy skills. Then, the ability of a good level of functional nutrition literacy and interactive nutrition literacy will be the capital for someone to have an excellent critical nutrition literacy level. The research results on the three domains above describe the shape of an inverted pyramid, where the most stable nutrition literacy (functional nutrition literacy) gets the highest percentage and successively decreases the percentage in interactive nutrition literacy and critical nutrition literacy domains.
Nevertheless, this study has not analyzed the combination of functional nutrition literacy levels, interactive nutrition literacy levels, and critical nutrition literacy levels, so it cannot be known whether all respondents with good critical nutrition literacy levels also have good interactive nutrition literacy levels and functional nutrition literacy levels. It is supposed that a respondent with an excellent critical nutrition literacy level is not supported by a good functional nutrition literacy level. In that case, this can have an impact on providing incorrect nutrition information to the surrounding environment and a good interactive nutrition literacy level but not supported by an adequate functional nutrition literacy level. The provision or dissemination of incorrect nutrition information can lead to public confusion and inappropriate nutritional behavior. Ideally, someone with a good critical nutrition literacy level also has a good interactive and functional nutrition literacy level. This combination will have an impact on the provision and dissemination of appropriate nutrition information and can increase awareness regarding nutrition in the surrounding environment.
The results of the bivariate test show that there is a significant relationship between health sciences and non-health sciences and the level of nutrition literacy. This significant relationship was found in the level of total nutrition literacy as well as in the three domains of nutrition literacy, namely the level of functional nutrition literacy, interactive nutrition literacy level, and critical nutrition literacy level. The high level of nutrition literacy in health science students is caused by higher exposure to nutrition and health information than non-health science students. This information exposure can come from the courses taken by students and the campus environment. Makiabadi's research also found that individuals from groups with health education backgrounds were more disclosed to health information and were more adept at health promotion than individuals with non-health education backgrounds [40]. The results of this study are
©2021. Sadikin, et.al. Open access under CC BY – SA license. Received: 26-09-2021. Accepted: 26-11-2021. Published online: 27-11-2021. doi: 10.20473/amnt. V5i2SP.2021. 38-44. Joinly Published by IAGIKMI & Universitas Airlangga
Sadikin, et.al. Amerta Nutr (2021).supl.38-44. 41
DOI: 10.20473/amnt.v5i2SP.2021. 38-44.
also in line with Jusephina's findings [25] that the number of the University of Indonesia students from the health sciences cluster who have an adequate level of nutrition literacy is more than the number of students from the non-health sciences cluster who have an adequate nutrition literacy level.
A significant relationship was also found between gender and the level of nutrition literacy. From the results of the bivariate analysis, it is found that there is a significant relationship between gender and the level of total nutrition literacy and the level of functional nutrition literacy, but there is no significant relationship between gender and the level of interactive nutrition literacy and the level of critical nutrition literacy. These results are supported by research by El-Ahmady and El-Wakeel, which found that female students were more likely to read articles related to nutrition and were significantly interested in nutrition topics compared to male students [41]. Research by Koca and Arkan in 2020 also found that women emphasized healthy food and efforts to be healthy than men. Women have tendencies to choose foods according to their nutritional content and health benefits [6]. The level of nutrition literacy in women which was higher than the level of nutrition literacy in men can also be found in Michou's study [28] in 2019 on the Greek population.
The results of the analysis of the relationship between the level of interactive nutrition literacy and gender show that there is no mutual influence between the interactive level of nutrition literacy and gender. Therefore, gender does not affect the ability to interact with counselors or the ability to seek information and discuss nutrition-related information. Meanwhile, although the analysis of the relationship between the level of critical nutrition literacy and gender shows a positive relationship (risk factor) between the level of critical nutrition literacy and gender, there is no statistically significant relationship between the level of critical nutrition literacy and gender. These results indicate that gender differences are not significantly associated with analyzing information and participating in actions to address nutritional problems. Thus, the results of this study conclude that gender differences affect knowledge and understanding related to nutrition but do not guarantee a person has constructive nutritional behavior for the surrounding environment.
This study did not find a significant relationship between the paternal education level and nutrition literacy level, but there is a significant relationship between the maternal education level with interactive nutrition literacy level and critical nutrition literacy level. A mother's education level is more related to nutrition literacy than a father's level of education, which can be caused because mothers with higher education have better knowledge about health and nutrition [42]. Mothers in the family also play a role as providers of health and nutrition in the household and the mother's education is also related to the nutritional status of children in the family [43]. Mothers also tend to pay more attention to details regarding family health and nutrition
than fathers [44]. The absence of a significant relationship between the level of the father's education and the level of nutrition literacy can also be influenced by the parenting methods applied and the extent of the involvement of the father figure in the family. The role of fathers in providing information, interacting with children, and contributing to aspects of nutrition in the family may affect the level of nutrition literacy of children. Therefore, further research is needed with more detailed questions related to fathers' involvement in shaping nutrition literacy for their children.
The statistical test results of the maternal education level on the nutrition literacy level of the respondents in this study indicate that the high level of mothers' education does not guarantee that their children have good knowledge and understanding of nutrition. However, the high level of mothers' education can encourage their children to have constructive nutritional behavior for the surrounding environment. The difference between the results of the relationship between the level of functional nutrition literacy, interactive nutrition literacy, and critical nutrition literacy on maternal education level can also be caused by the use of a Likert scale in the interactive nutrition literacy domain and the critical nutrition literacy domain. The Likert scale makes respondents tend to choose answers with a positive nature so that the results do not reflect the actual conditions.
Economic conditions play a role in shaping the level of nutrition literacy because the better a person's economic condition is, the better that person can access healthier food [13]. Families with high incomes can have purchasing sources and access to nutritious and healthy food, thus having a good impact on family consumption patterns [45]. People with high economic levels are also more concerned with fulfilling nutrition for their families compared to people with lower-middle economic levels [9, 13]. Although in Taylor's research [13] and Carbonneau's research [9] was found that family economic conditions also played a role in shaping the level of nutritional literacy, this relationship was not found in the pocket money received by students. This result can be caused by the COVID-19 pandemic which affects the family's economic conditions and causes the amount of pocket money given to children is not as much as in normal conditions. In addition, the existence of distance learning from home and travel restrictions regulated by the government in several places have caused some respondents not to receive pocket money, or the pocket money given is not as much as usual. Another cause can come from differences in variables that represent the economic condition of the family, which in previous studies the socioeconomic conditions of the family were reflected in the income variable.
The results of the correlation test between the total pocket money and the food allowance show a positive and strong relationship. These results indicate that an increase in pocket money will be followed by an increase in the allocation of the food allowance. However, in the absence of a significant relationship between
©2021. Sadikin, et.al. Open access under CC BY – SA license. Received: 26-09-2021. Accepted: 26-11-2021. Published online: 27-11-2021. doi: 10.20473/amnt. V5i2SP.2021. 38-44. Joinly Published by IAGIKMI & Universitas Airlangga
Sadikin, et.al. Amerta Nutr (2021).supl.38-44. 42
DOI: 10.20473/amnt.v5i2SP.2021. 38-44.
pocket money and the level of nutrition literacy, it can be suspected that the food allowance also does not have a significant relationship with the level of nutrition literacy.
This study found a significant relationship between media use with each level of total nutrition literacy, functional nutrition literacy level, interactive nutrition literacy level, and critical nutrition literacy level. These findings follow the average statements in the interactive nutrition literacy domain regarding respondents seeking information related to the diet through the internet and respondents being easily influenced and believing information received from newspapers, magazines, and other sources, indicating a tendency to agree with these statements. The search for health-related information is one of the most widely used activities on the internet, which has also been mentioned in Eysenbach's research. However, although some people already know the sources of information, not all of them have reliable sites about nutrition information. Knowledge related to these trusted sites also depends on the experience and literacy skills of the person [46]. A study by Farmer also found that adolescents generally prefer to seek health-related information on their own rather than coming directly to health workers. This behavior is established, one of which is influenced by the mental condition of adolescents who prefer to seek information anonymously to avoid stigma against themselves [39]. Nevertheless, health-related content that promotes a healthy lifestyle and ideal body shape has emerged on social media so that teenagers can associate an ideal body shape with a healthy lifestyle. The abundance of nutrition-related information on social media can also have a good impact on nutrition and health literacy because food content can introduce young girls to new foods and encourage them to reflect on the composition of their daily diet, and can even change eating habits [47].
The higher percentage of good functional nutrition literacy in respondents who use media is in line with Velardo's nutrition literacy model [32], which requires the ability to understand nutrition-related information. By searching for information related to nutrition, a person will read more and better understand the nutritional information obtained. The high percentage of good interactive and critical nutrition literacy levels in respondents who use the media also show the tendency of respondents who seek information related to nutrition to have constructive nutritional behavior for the surrounding environment. This result is also in line with the research of Eysenbach [46], Aihara [14], and Zoellner [18]. CONCLUSION
This study showed that students from the non-health sciences cluster have a 6.7 times more risk of inadequate nutrition literacy level than students from the health sciences cluster. There was significant relationship between cluster of sciences, gender, and media use with total nutrition literacyThere was no significant association between paternal education levels and pocket money and
nutritional literacy levels. The results of this multivariate analysis were expected to see the number of individuals who have all three domains of good nutrition literacy level or only have one or two of the three domains of good nutrition literacy level. ACKNOWLEDGEMENT
Thanks to Universitas Indonesia, Depok, West Java which support this research. CONFLICT OF INTEREST AND FUNDING DISCLOSURE
The author declares that authors have no conflict of interest and have received no funding for this article. REFERENCES 1. Kementerian Kesehatan RI, Riset Kesehatan
Dasar (Riskesdas) 2018. 2018, Badan Penelitian dan Pengembangan Kesehatan Kementerian Kesehatan Republik Indonesia: Jakarta.
2. Kementerian Kesehatan RI, Info Datin Situasi Kesehatan Jantung. 2014, Pusat Data dan Informasi Kementerian Kesehatan RI: Jakarta.
3. Fatimah, R.N., Diabetes Melitus Tipe 2. J MAJORITY, 2015. 4(5).
4. Toharin, S.N.R., W.H. Cahyati, and I. Zainafree, Hubungan Modifikasi Gaya Hidup dan Kepatuhan Konsumsi Obat Antidiabetik dengan Kada Gula Darah Pada Penderita Diabetes Melitus Tipe 2 di RS Qim Batang Tahun 2013. Unnes Journal of Public Health, 2015. 4(2).
5. Warganegara, E. and N.N. Nur, Faktor Risiko Perilaku Penyakit Tidak Menular. Majority, 2016. 5(2).
6. Koca, B. and G. Arkan, The relationship between adolescents' nutrition literacy and food habits, and affecting factors. Public Health Nutr, 2020: p. 1-12.
7. Olatona, F.A., et al., Dietary habits and metabolic risk factors for non-communicable diseases in a university undergraduate population. J Health Popul Nutr, 2018. 37(1): p. 21.
8. D'Amato-Kubiet, L., Nutrition Literacy And Demographic Variables As Predictors Of Adolescent Weight Status In A Florida County, in Theses and Dissertations, 2004-2019. 2013, University of Central Florida: Florifa.
9. Carbonneau, E., et al., Associations Between Nutrition Knowledge and Overall Diet Quality: The Moderating Role of Sociodemographic Characteristics-Results From the PREDISE Study. Am J Health Promot, 2020. 35(1): p. 38-47.
10. Gibbs, H.D., et al., The Nutrition Literacy Assessment Instrument is a Valid and Reliable Measure of Nutrition Literacy in Adults with Chronic Disease. J Nutr Educ Behav, 2018. 50(3): p. 247-257 e1.
11. Patel, P., et al., Use of nutrition literacy scale in elderly minority population. The Journal of

©2021. Sadikin, et.al. Open access under CC BY – SA license. Received: 26-09-2021. Accepted: 26-11-2021. Published online: 27-11-2021. doi: 10.20473/amnt. V5i2SP.2021. 38-44. Joinly Published by IAGIKMI & Universitas Airlangga
Sadikin, et.al. Amerta Nutr (2021).supl.38-44. 43
DOI: 10.20473/amnt.v5i2SP.2021. 38-44.
Nutrition, Health & Aging, 2013. 17(10): p. 894 - 897.
12. Syafei, A. and L.u. Badriyah, Literasi Gizi (Nutrition Literacy) dan Hubungannya dengan Asupan Makan dan Status Gizi Remaja. Jurnal Ilmu Kesehatan Masyarakat, 2019. 8(04): p. 182-190.
13. Taylor, M.K., et al., Nutrition literacy predicts adherence to healthy/unhealthy diet patterns in adults with a nutrition-related chronic condition. Public Health Nutr, 2019. 22(12): p. 2157-2169.
14. Aihara, Y. and J. Minai, Barriers and catalysts of nutrition literacy among elderly Japanese people. Health Promot Int, 2011. 26(4): p. 421-31.
15. Gibbs, H.D. and K. Chapman-Novakofski, Exploring nutrition literacy: attention to assessment and the skills clients need. Health, 2012. 4(3): p. 120 - 124.
16. Silk, K.J., et al., Increasing nutrition literacy: testing the effectiveness of print, web site, and game modalities. J Nutr Educ Behav, 2008. 40(1): p. 3-10.
17. Watson, W.L., et al., How well do Australian shoppers understand energy terms on food labels? Public health nutrition, 2013. 16(3): p. 409-417.
18. Zoellner, J., et al., Nutrition Literacy Status and Preferred Nutrition Communication Channels Among Adults in the Lower Mississippi Delta. Preventing Chronic Disease, 2009. 6(4).
19. Vettori, V., et al., Towards the Implementation of a Conceptual Framework of Food and Nutrition Literacy: Providing Healthy Eating for the Population. Int J Environ Res Public Health, 2019. 16(24).
20. Doustmohammadian, A., et al., Low food and nutrition literacy (FNLIT): a barrier to dietary diversity and nutrient adequacy in school age children. BMC Res Notes, 2020. 13(1): p. 286.
21. Khorramrouz, F., et al., Relationship between household food insecurity and food and nutrition literacy among children of 9-12 years of age: a cross-sectional study in a city of Iran. BMC Res Notes, 2020. 13(1): p. 433.
22. Nelson, M.C., et al., Emerging Adulthood and College-aged Youth: An Overlooked Age for Weight-related Behavior Change. Obesity, 2008. 16(10): p. 2205-2211.
23. Dawson, K.A., et al., Examining gender differences in the health behaviors of Canadian University Students. The Journal of The Royal Society for the Promotion of Health, 2007. 127(1): p. 38-44.
24. Liao, L.-L., I.J. Lai, and L.-C. Chang, Nutrition literacy is associated with healthy-eating behaviour among college students in Taiwan. Health Education Journal, 2019. 78(7): p. 756-769.
25. Jusephina, Perbedaan Proporsi Tingkat Literasi Gizi Berdasarkan Jenis Kelamin, Rumpun Ilmu Kesehatan dan Non Kesehatan, dan Uang Saku pada Mahasiswa S1 Reguler Aktif Angkatan 2017 di Universitas Indonesia Tahun 2018. 2018, Universitas Indonesia.
26. Fauzia, N.S., Hubungan Antara Literasi Gizi dengan Status Gizi Mahasiswa Kesehatan Yayasan Annisa Jaya Bogor Tahun 2018. 2018, Universitas Indonesia: Depok.
27. Bari, N.N., NUTRITION LITERACY STATUS OF ADOLESCENT STUDENTS IN KAMPALA DISTRICT, UGANDA, in Departement of Health, Nutrition and Management. 2012, Oslo And Akershus University College of Applied Sciences: Norway.
28. Michou, M., et al., Sex and age in relation to health and nutrition literacy levels in a sample of Greek adults. International Journal of Health Promotion and Education, 2019. 58(5): p. 229-241.
29. Dammann, K.W. and C. Smith, Factors affecting low-income women's food choices and the perceived impact of dietary intake and socioeconomic status on their health and weight. J Nutr Educ Behav, 2009. 41(4): p. 242-53.
30. Manganello, J.A., Health literacy and adolescents: a framework and agenda for future research. Health Educ Res, 2008. 23(5): p. 840-7.
31. Hastono, S.P., Analisis Data. 2006, Depok: Raja Grafindo Persada.
32. Velardo, S., The Nuances of Health Literacy, Nutrition Literacy, and Food Literacy. J Nutr Educ Behav, 2015. 47(4): p. 385-9 e1.
33. Ismah, A.A., Hubungan Antara Tingkat Literasi Gizi dan Faktor Lainnya dengan Status Anemia pada Siswi SMAN 34 Jakarta Tahun 2019, in Departmen of Nutrition. 2019, Universitas Indonesia: Depok.
34. Rachma, A., Perbedaan Proporsi Asupan Kalsium Remaja Berdasarkan Literasi Gizi dan Faktor Lainnya Pada Siswa-Siswi SMAN 34 Jakarta Tahun 2019, in Department of Nutrition. 2019, Universitas Indonesia: Depok.
35. Guttersrud, Ø., J.Ø. Dalane, and S. Pettersen, Improving measurement in nutrition literacy research using Rasch modelling: examining construct validity of stage-specific ‘critical
nutrition literacy’ scales. Public Health Nutrition, 2014. 17(4): p. 877-883.
36. Kementerian Kesehatan RI, Peraturan Menteri Kesehatan Republik Indonesia Nomor 41 Tahun 2014 tentang Pedoman Gizi Seimbang. 2014, Kementerian Kesehatan RI: Jakarta.
37. Lestari, P., Hubungan Pengetahuan Gizi dan Asupan Makanan dengan Status Gizi Siswi MTS Darul Ulum. Sport and Nutrition Journal, 2020. 2(2): p. 73 - 80.

©2021. Sadikin, et.al. Open access under CC BY – SA license. Received: 26-09-2021. Accepted: 26-11-2021. Published online: 27-11-2021. doi: 10.20473/amnt. V5i2SP.2021. 38-44. Joinly Published by IAGIKMI & Universitas Airlangga
Sadikin, et.al. Amerta Nutr (2021).supl.38-44. 44
DOI: 10.20473/amnt.v5i2SP.2021. 38-44.
38. Theophania, J., Perbedaan Proporsi Tingkat Literasi Gizi Berdasarkan Tingkat Pendidikan, Tingkat Pendapatan Keluarga, Usia, dan Paritas pada Ibu Balita di Jakarta Timur Tahun 2018. 2018, Universitas Indonesia: Depok.
39. Farmer, L.S.J., Issues in Teen Technology Use to Find Health Information. The Journal of Research on Libraries and Young Adults, 2013. 4.
40. Makiabadi, E., et al., Enhancing Nutrition-Related Literacy, Knowledge and Behavior among University Students: A Randomized Controlled Trial. International Journal of Nutrition Science, 2019. 4(3): p. 122-129.
41. El-Ahmady, S. and L. El-Wakeel, The Effects of Nutrition Awareness and Knowledge on Health Habits and Performance Among Pharmacy Students in Egypt. J Community Health, 2017. 42(2): p. 213-220.
42. Natarajan, V.D.P.R., Does Maternal Education Really Improve Child Health. IOSR Journal of
Dental and Medical Sciences (IOSR-JDMS), 2013. 4(4): p. 7-9.
43. Kunwar, R.P., P.B, Impact of Education of Parents on Nutritional Status of Primary School Children. Med J Armed Forces India, 2002. 58(1): p. 38-43.
44. Alderman, H. and D.D. Headey, How Important is Parental Education for Child Nutrition. World Development, 2017. 94: p. 448-464.
45. Damman, K.W.S., Chery, Factors affecting low-income women's food choices and the perceived impact of dietary intake and socioeconomic status on their health and weight. J Nutr Educ Behav, 2009. 41(4).
46. Eysenbach, G., Credibility of Health Information and Digital Media: New Perspectives and Implications for Youth. Digital Media, Youth, and Credibility, 2008: p. 123 - 154.
47. Bright, L.F., S.B. Kleiser, and S. Grau, L, Too much Facebook? An exploratory examination of social media fatigue. Computers in Human Behavior, 2015. 44: p. 148 - 155.
Related Documents