LCP ACCOUNTING FOR PENSIONS 2015 2015 sees yet more changes in the UK pensions landscape. With new reporting and governance requirements on the horizon, our 22nd annual survey looks at how FTSE 100 companies manage their pension risks.

Welcome message from author
This document is posted to help you gain knowledge. Please leave a comment to let me know what you think about it! Share it to your friends and learn new things together.
Transcript
LCP ACCOUNTING FOR PENSIONS 2015
2015 sees yet more changes in the UK pensions landscape. With new reporting and governance requirements on the horizon, our 22nd annual survey looks at how FTSE 100 companies manage their pension risks.

2
For further information please contact Bob Scott, Nick Bunch or the partner
who normally advises you.
This report may be reproduced in whole or in part, without permission,
provided prominent acknowledgement of the source is given. The report
is not intended to be an exhaustive analysis of IAS19. Although every
effort is made to ensure that the information in this report is accurate,
Lane Clark & Peacock LLP accepts no responsibility whatsoever for any
errors, or the actions of third parties. Information and conclusions are
based on what an informed reader may draw from each company’s
annual report and accounts. None of the companies have been contacted
to provide additional explanation or further details.
View a full list of our services at www.lcp.uk.com
© Lane Clark & Peacock LLP August 2015
We would like to thank those from LCP who have made this report possible:
Catriona Armstrong
Nick Bunch
Richard Chini
Emma Colpus
Jeremy Dell
Peter Fitchett
Linda Gilhooly
Tricia Gulliver
Sam Jenkins
Claire Jones
Geraint Jones
Andrew Keenan
Stuart Levy
Sarah Lossin
Dorothy Mendoza
Martin Mercer
Paul Meredith
Chris Mitcheson
Holly Moffat
David Poynton
Charlotte Quarmby
Robin Rangeley
Max Root
Bob Scott
Joanne Stewart
Laura Strachan
Sam Tomes
Alex Waite
Shaun Wood
Chris Wragg
22
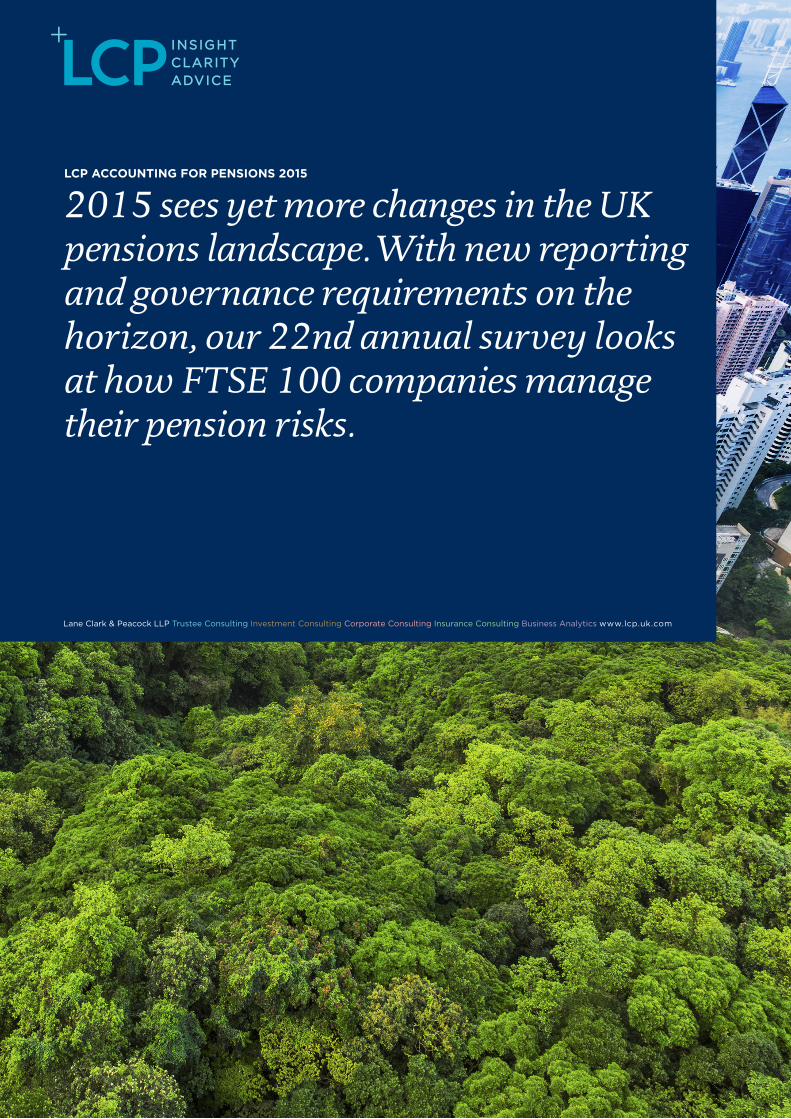
LCP Accounting for Pensions 2015
p5 1. Executive Summary
p8 2. Analysis of FTSE 100 accounting disclosuresp10 2.1 Introduction
p10 2.2 The FTSE 100 accounting deficit
p14 2.3 How have companies been managing their
pension commitments?
p18 2.4 Analysis of pension disclosures
p36 Appendix 1 - FTSE 100 accounting disclosure listing
p40 Appendix 2 - FTSE 100 accounting risk measures
3

Although FTSE100 companies have reduced their overall pension contributions again, many still have big schemes with big deficits.
Bob ScottPARTNER, LCP
Welcome to our 22nd annual survey of FTSE 100 companies’ pension disclosures.
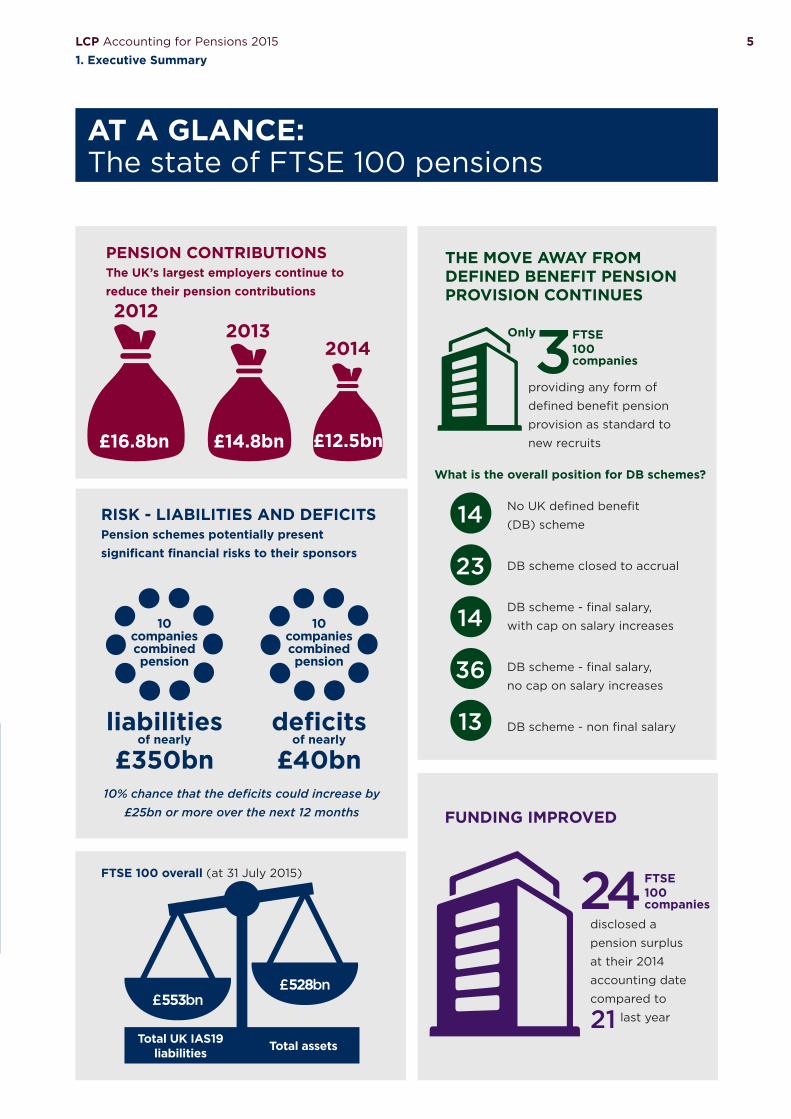
AT A GLANCE: The state of FTSE 100 pensions
THE MOVE AWAY FROM DEFINED BENEFIT PENSION PROVISION CONTINUES
PENSION CONTRIBUTIONS The UK’s largest employers continue to reduce their pension contributions
£12.5bn
20142013
£14.8bn
2012
£16.8bn
RISK - LIABILITIES AND DEFICITSPension schemes potentially present significant financial risks to their sponsors
10% chance that the deficits could increase by £25bn or more over the next 12 months
£553bn£528bn
liabilities of nearly
£350bn
10 companiescombined pension
deficits of nearly
£40bn
10 companiescombined pension
disclosed a
pension surplus
at their 2014
accounting date
compared to
21 last year
FUNDING IMPROVED
24 FTSE 100 companies
FTSE 100 companies
providing any form of
defined benefit pension
provision as standard to
new recruits
3 Only
What is the overall position for DB schemes?
No UK defined benefit
(DB) scheme
DB scheme closed to accrual
DB scheme - final salary,
with cap on salary increases
DB scheme - final salary,
no cap on salary increases
DB scheme - non final salary
14
23
14
36
13
Total UK IAS19 liabilities Total assets
FTSE 100 overall (at 31 July 2015)
5LCP Accounting for Pensions 2015
1. Executive Summary
6 LCP Accounting for Pensions 2015
1. Executive Summary
Contributions down again � The UK’s largest employers continue to reduce their pension
contributions. Total contributions to defined benefit schemes were
£12.5 billion in 2014, compared to £14.8 billion in 2013 and £16.8 billion in
2012.
Pensions: a potential risk for some � Yet those pension schemes potentially present significant financial risks
to their sponsors. Our research shows that:
– 10 companies had combined pension liabilities of nearly £350 billion;
– 10 companies had combined pension deficits of nearly £40 billion; and
– there is a 10% chance that those deficits could increase by at least a
further £25 billion over the next 12 months.
� From October, new reporting rules will require companies not only to
disclose their principal risks but to indicate which of those risks could
potentially stop them trading and then to identify the steps they have
taken to mitigate those risks.
Net deficit slightly lower � We estimate that the FTSE 100 as a whole had an overall (net) IAS19
deficit in respect of UK pensions of £25 billion at 31 July 2015, with total
IAS19 liabilities of £553 billion against assets of £528 billion.
A number of companies that paid large contributions in previous years have reverted to more "normal" levels.

7LCP Accounting for Pensions 2015
1. Executive Summary
Liabilities rise to record levels � Recent falls in corporate bond yields have caused reported liability
values to rise to record levels - for example, in its December 2014
accounts Royal Dutch Shell reported pension liabilities of more than
$100 billion and the accounting liabilities of BT Group’s main pension
scheme were over £50 billion at the end of March 2015.
Defined benefits - the end of the road � With almost all new FTSE 100 employees now being auto-enrolled into
defined contribution pension schemes, the move away from defined
benefit pension provision has continued. This will accelerate when
contracting out ceases in April 2016.
� Tesco currently provides new joiners with access to a career average
revalued earnings (CARE) scheme but has recently announced plans to
close this to new joiners and to future accrual, which would leave only
3 companies providing new employees with defined benefit pensions as
standard.
� A number of other FTSE 100 companies, including Anglo American
and Standard Life announced that they would be closing their defined
benefit schemes to existing members, leaving a dwindling number
of companies with an ever reducing number of employees accruing
additional pension on a defined benefit basis.
Exe
cuti
ve S
umm
ary
What steps are companies taking to address pension risk?Pension risk may well be one of the main risks for FTSE 100 companies with legacy
defined benefit pension schemes.
See pages 14 - 17

8
Contentp8 2. Analysis of FTSE 100 accounting disclosuresp10 2.1 Introductionp10 2.2 The FTSE 100 accounting deficitp14 2.3 How have companies been managing their pension commitments?p18 2.4 Analysis of pension disclosures
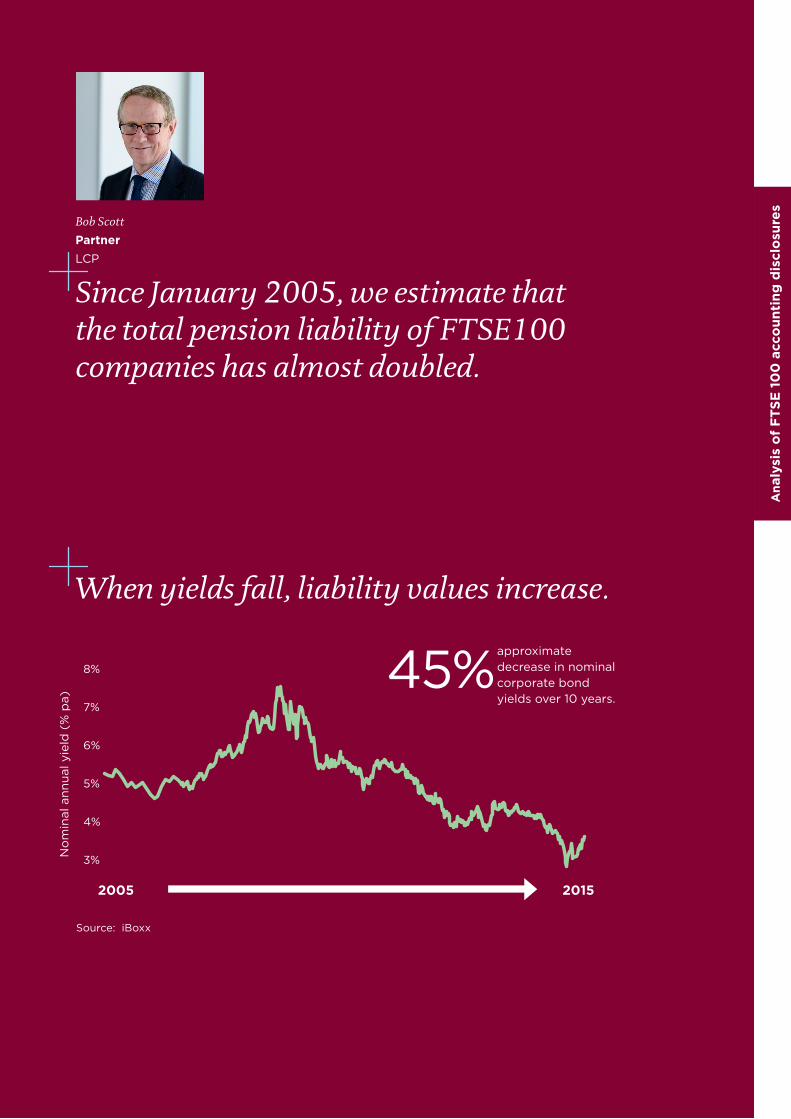
Since January 2005, we estimate that the total pension liability of FTSE100 companies has almost doubled.
Bob Scott
Partner LCP
Ana
lysi
s o
f FT
SE 1
00
acc
oun
ting
dis
clo
sure
s
When yields fall, liability values increase.
2%
3%
4%
5%
6%
7%
8%
December2004
December2005
December2006
December2007
December2008
December2009
December2010
December2011
December2012
December2013
December2014
No
min
al a
nnua
l yie
ld (
% p
a)
UK AA rated corporate bond yields
Source: iBoxx
2005 2015
Source: iBoxx
45%approximate decrease in nominal corporate bond yields over 10 years.
No
min
al a
nnua
l yie
ld (
% p
a)

LCP Accounting for Pensions 2015
2. Analysis of FTSE 100 accounting disclosures10
2. Analysis of pension disclosures
2.1. IntroductionWe have analysed the defined benefit pension disclosures for 87
FTSE 100 companies reporting in 2014. 12 of the FTSE 100 have been
excluded as they do not sponsor a material defined benefit pension
scheme and Dixons Carphone has also been excluded as no post-merger
accounts are available for 2014. A full list and summary details of the
87 companies’ key pension disclosures are set out in appendix 1.
The information and conclusions of this report are based solely on detailed
analysis of the information that companies have disclosed in their annual
report and accounts and other publicly available information. We do
not approach companies or their advisers for additional information or
explanation.
We have concentrated on the financial position of the defined benefit
pension schemes in which the companies’ employees and former
employees participate. Some companies offer post-retirement healthcare,
which we have excluded from our analysis, where possible. Overseas
pension arrangements have been included, except where otherwise
indicated.
All of the companies analysed have reported under international
accounting standards (IAS19 for pension costs) as required under
EU regulations.
2.2. The FTSE 100 accounting deficitWe estimate that the combined FTSE 100 pension deficit in respect of
UK liabilities was £25 billion at the end of July 2015, reflecting total IAS19
liabilities of £553 billion against assets of £528 billion.
Since January 2005, we estimate that the total pension liability of
FTSE 100 companies has almost doubled. We have included a list of the
ten companies with the largest disclosed pension liabilities in appendix 2.
£25 billionThe estimated UK pension
deficit for FTSE 100
companies under IAS19.

11LCP Accounting for Pensions 2015
2. Analysis of FTSE 100 accounting disclosures
Ana
lysi
s o
f FT
SE 1
00
acc
oun
ting
dis
clo
sure
s
Over the last 5 years the total deficit has fluctuated between £10bn and nearly £60bn.
A combination of strong investment returns, payment of deficit
contributions and low levels of inflation has offset the impact of significant
falls in bond yields, which have led to a material increase in reported
liability values.
Overall, the total deficit has reduced by £12 billion from the position at
30 June 2014. However, the change in deficit or surplus for a particular
company’s pension scheme depends heavily on its investment strategy
and, in particular, on the extent to which it has been hedged against
changes in long-term interest rates.
-70
-60
-50
-40
-30
-20
-10
0
10 Jun
2010
Dec
20
10
Jun
2011
Dec
20
11
Jun
2012
Dec
20
12
Jun
2013
Dec
20
13
Jun
2014
Dec
20
14
Jun
2015
£ b
illio
n
Estimated IAS19 position for UK schemes of FTSE 100 companies
The chart below shows how the accounting deficit has developed over
the past five years. Our figures include unfunded pension promises but
exclude, where possible, the overseas pension schemes sponsored by
FTSE 100 companies and any employee benefits other than pensions.
LCP Accounting for Pensions 2015
2. Analysis of FTSE 100 accounting disclosures12
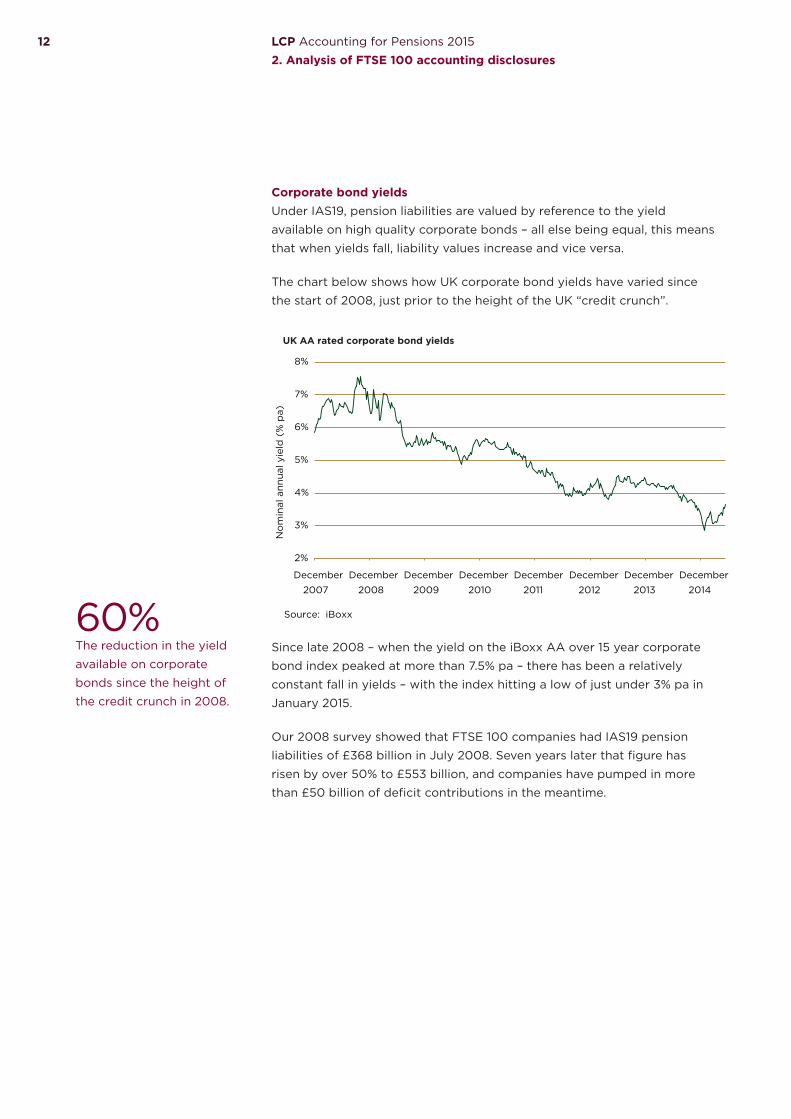
Corporate bond yieldsUnder IAS19, pension liabilities are valued by reference to the yield
available on high quality corporate bonds – all else being equal, this means
that when yields fall, liability values increase and vice versa.
The chart below shows how UK corporate bond yields have varied since
the start of 2008, just prior to the height of the UK “credit crunch”.
2%
3%
4%
5%
6%
7%
8%
December
2007
December
2008
December
2009
December
2010
December
2011
December
2012
December
2013
December
2014
No
min
al a
nnua
l yie
ld (
% p
a)
UK AA rated corporate bond yields
Source: iBoxx
Since late 2008 – when the yield on the iBoxx AA over 15 year corporate
bond index peaked at more than 7.5% pa – there has been a relatively
constant fall in yields – with the index hitting a low of just under 3% pa in
January 2015.
Our 2008 survey showed that FTSE 100 companies had IAS19 pension
liabilities of £368 billion in July 2008. Seven years later that figure has
risen by over 50% to £553 billion, and companies have pumped in more
than £50 billion of deficit contributions in the meantime.
60%The reduction in the yield
available on corporate
bonds since the height of
the credit crunch in 2008.

13LCP Accounting for Pensions 2015
2. Analysis of FTSE 100 accounting disclosures
Ana
lysi
s o
f FT
SE 1
00
acc
oun
ting
dis
clo
sure
s
Pension risk – the viability statementThe increase in the size of reported liabilities illustrates the potentially
material level of pension risk being run by a number of FTSE 100
companies. Our research shows that:
� 10 companies reported combined pension liabilities of nearly
£350 billion;
� 10 companies reported combined pension deficits of nearly £40 billion;
and
� there is a 10% chance that those deficits could increase by at least a
further £25 billion over the next 12 months due to financial factors alone.
Under current accounting standards, companies are already required to
disclose details of the risks associated with their pension schemes in their
accounts. However, from October 2015, additional reporting requirements
will come into force under an updated version of the UK corporate
governance code.
This will require the directors of most listed companies to confirm that
they have carried out a robust assessment of the main risks facing their
business, including those that would threaten its solvency. Furthermore,
there is a new requirement to include a “viability statement” in the annual
accounts, confirming whether the directors expect the company will be
able to continue in operation, taking into account its current position and
principal risks.
Pension risk may well be one of the main risks for FTSE 100 companies
with legacy defined benefit pension schemes. The new requirement may
therefore increase the level of disclosure required in relation to this.
Based on the information in existing accounting disclosures,
BAE Systems, BT Group, International Airlines Group, Sainsbury’s and
RSA Insurance Group are companies that may be running significant levels
of pension risk relative to the size of their business.
Pension risk may well be one of the main risks for FTSE 100 companies with legacy defined benefit pension schemes.
LCP Accounting for Pensions 2015
2. Analysis of FTSE 100 accounting disclosures14
2.3. How have companies been managing their pension commitments?
Reductions in defined benefit pension provisionNone of the FTSE 100 companies we have analysed provide traditional
final salary pensions to new employees and there are only 4 FTSE 100
companies providing any form of defined benefit pension provision
as standard to new recruits. These are Diageo, Johnson Matthey and
Morrisons, which provide cash balance schemes, and Tesco, which
provides a career average revalued earnings (“CARE”) scheme. In its 2015
accounts Tesco reported that it was in consultation to close this CARE
scheme to both new entrants and future accrual.
A number of other companies stated that they had either closed their
defined benefit pension scheme to future accrual during the last year, or
had plans to do so in the near future:
� Anglo American announced that its only remaining UK plan with
continuing accrual will close on 30 September 2015.
� Hammerson closed its pension scheme to accrual in July 2014 and as a
result disclosed a £3 million gain in its 2014 accounts.
� Morrisons reported that it was consulting on the closure of its 2 historic
CARE schemes to future accrual.
� Standard Life announced that it will close its pension plan to accrual
from April 2016, replacing it with an enhanced defined contribution
pension plan.
In addition, HSBC, Severn Trent and Weir Group have all previously
reported that they have reached agreement to close their pension
schemes to future accrual during 2015.
The move away from defined benefit pension provision continues apace.

15LCP Accounting for Pensions 2015
2. Analysis of FTSE 100 accounting disclosures
Ana
lysi
s o
f FT
SE 1
00
acc
oun
ting
dis
clo
sure
s
With the move towards defined contribution pension provision firmly
established, other changes have been made in recent years that reduce
the employer cost of the remaining defined benefit pensions still being
built up. For example, in its March 2015 accounts, Babcock disclosed that it
had capped pensionable salaries and increased employee contributions to
one of its three main pension schemes, with similar changes expected to
come into effect in its other two main schemes from June 2015.
The chart below shows the numbers of companies providing continuing
defined benefit pension provision, after allowing for the changes listed
above. These changes will leave only 36 FTSE 100 companies providing
traditional final salary pensions to any of their employees.
No UK defined benefit (DB) scheme14
23
14
36
13
DB scheme closed to accrual
DB scheme - final salary, with cap on salary increases
DB scheme - final salary, no cap on salary increases
DB scheme - non final salary
With the ability to contract out of the state pension system coming to
an end in April 2016, we are likely to see an acceleration in the number
of companies closing their pension schemes to future accrual, in order
to mitigate the increase in national insurance cost that arises when the
current rebate most receive disappears.
36FTSE 100 companies
providing traditional final
salary pension accrual to
any employees.

LCP Accounting for Pensions 2015
2. Analysis of FTSE 100 accounting disclosures16
Liability management exercisesMany companies are naturally now placing increased focus on managing
their legacy pension arrangements and removing risk from their balance
sheet. One popular way of achieving this is to carry out a pension increase
exchange (“PIE”) exercise, where members of the pension scheme are
given the option to exchange some or all of the future increases on
their pension in return for a higher current level of pension. This reduces
inflation risk and can result in a cost saving, if members accept a deal
which is less than fair value.
Several FTSE 100 companies carried out liability management exercises
during 2014:
� BAE Systems reported that it carried out a PIE exercise in its main
scheme in May 2014, with 38% of pensioners opting to exchange future
increases on part of their pensions for higher non-increasing pensions.
� Centrica offered pensioners the option to receive a higher pension in
return for giving up certain future increases linked to RPI, which gave
rise to a past service credit of £10 million.
� GKN reported that it had commenced a PIE exercise to mitigate inflation
risk, which would conclude in early 2015.
� Taylor Wimpey has completed a flexible retirement offer for deferred
members, which allowed participants to realise part of their pension at
an earlier date than previously anticipated. This has resulted in
£25 million of pension liability being transferred out of its pension
schemes.
� On the back of a PIE exercise for pensioners which resulted in a 28%
take up rate, TUI Travel has introduced pension increase exchange as a
standard retirement option for active and deferred members, with a
£28 million past service credit arising on the basis of expected future
take up rates.
Liability management exercises can be a “win-win” for companies and members.
17LCP Accounting for Pensions 2015
2. Analysis of FTSE 100 accounting disclosures
Ana
lysi
s o
f FT
SE 1
00
acc
oun
ting
dis
clo
sure
s
Pension freedoms and flexibilitiesIt is too early for companies to have reported in their accounts on the
impact of the 2014 budget changes. However, since April 2015, defined
contribution schemes have become more attractive as individuals can
access their pension savings with much greater flexibility than previously.
This gives rise to opportunities for companies to manage their defined
benefit liabilities by giving members the opportunity to access those
flexibilities. This could be via partial transfer values at retirement; full
commutation of smaller pensions; or simply by offering to pay for members
to take financial advice on their options.
De-risking of investment strategiesAs pension schemes mature and the time horizon for payment of benefits
decreases, companies and pension scheme trustees have typically looked
to reduce the investment risks posed by the pension scheme.
This is of increasing importance as schemes close to future accrual and
ongoing contributions reduce because pensions and other benefits then
need to be paid out of investment income or by realising assets.
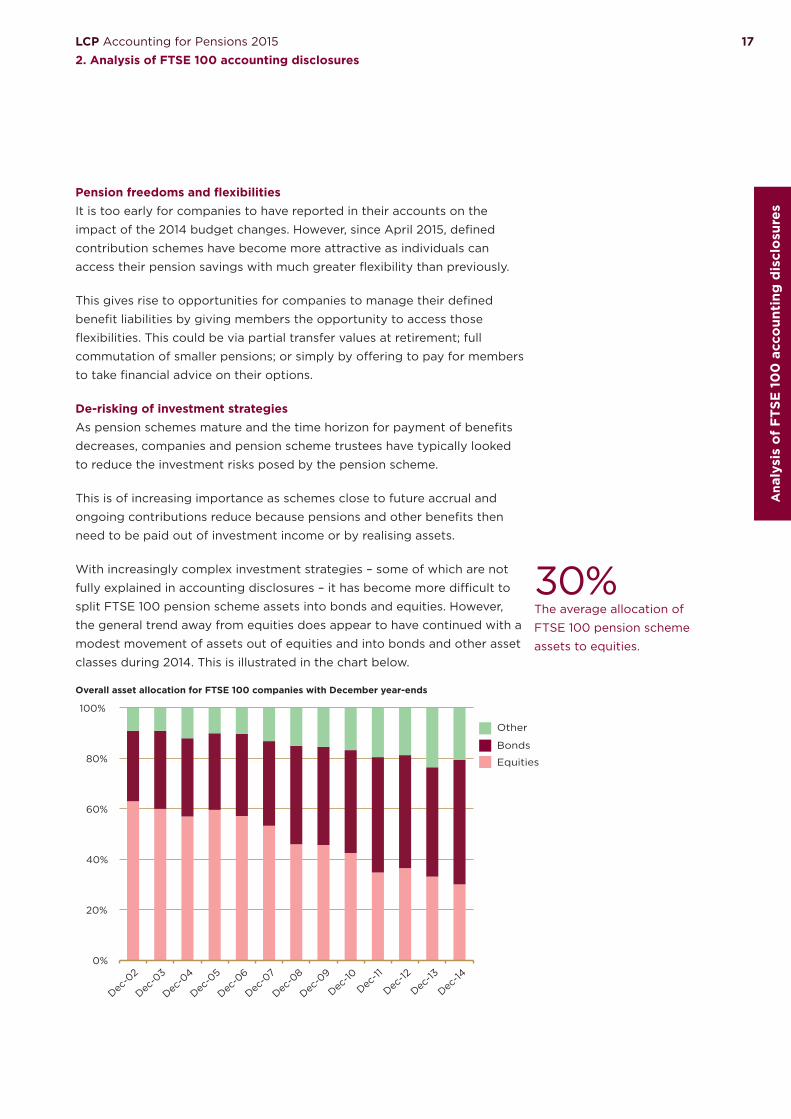
With increasingly complex investment strategies – some of which are not
fully explained in accounting disclosures – it has become more difficult to
split FTSE 100 pension scheme assets into bonds and equities. However,
the general trend away from equities does appear to have continued with a
modest movement of assets out of equities and into bonds and other asset
classes during 2014. This is illustrated in the chart below.
Equities
Bonds
Other
Dec-0
2
Dec-0
3
Dec-0
4
Dec-0
5
Dec-0
6
Dec-0
7
Dec-0
8
Dec-0
9
Dec-10
Dec-11
Dec-12
Dec-13
Dec-14
0%
20%
40%
60%
80%
100%
30%The average allocation of
FTSE 100 pension scheme
assets to equities.
Overall asset allocation for FTSE 100 companies with December year-ends
LCP Accounting for Pensions 2015
2. Analysis of FTSE 100 accounting disclosures18
2.4. Analysis of pension disclosuresThe average pensions note runs to just over five pages, with most
companies also having several paragraphs of pension commentary in the
main body of their reports. The longest disclosure was produced by BP,
which covered 10 pages of its 2014 report.
Funding levelsIAS19 takes a snapshot of the accounting surplus or deficit at the
company’s year-end and in most cases this is the number that appears on
the balance sheet.
However, in some cases, complex rules under IAS19 can result in a
restriction on the asset recognised on the balance sheet where a pension
scheme is in surplus, or a higher liability being recognised as a result of
the funding agreements in place with the pension scheme trustees. 18
companies were affected by this issue in 2014 and in some cases the
amounts involved were material – for example, Scottish & Southern Energy and Standard Life added £201 million and £414 million to their
balance sheets respectively.
Recently proposed changes to the IAS19 accounting standard may mean
that these adjustments are more common in future. However, the impact
will depend on the precise wording of each company’s pension scheme
rules.
Of the 87 FTSE 100 companies we analysed, 24 disclosed pension assets
equal to or in excess of accounting liabilities, which compares to 21 of
these companies last year. This general improvement was despite the large
fall in corporate bond yields, and arose due to strong investment returns
over 2014 for schemes that had significant levels of hedging against falls
in interest rates, either through investment in government and corporate
bonds, or as a result of holding interest rate swaps.
Royal Mail disclosed the highest 2014 funding level – 183% as at
31 March 2014. 38 companies reported being less than 90% funded on an
accounting basis at their 2014 year-end. This is the same number as in
2013.
24FTSE 100 companies
disclosed a pension surplus at
their 2014 accounting date.
19LCP Accounting for Pensions 2015
2. Analysis of FTSE 100 accounting disclosures
Ana
lysi
s o
f FT
SE 1
00
acc
oun
ting
dis
clo
sure
s
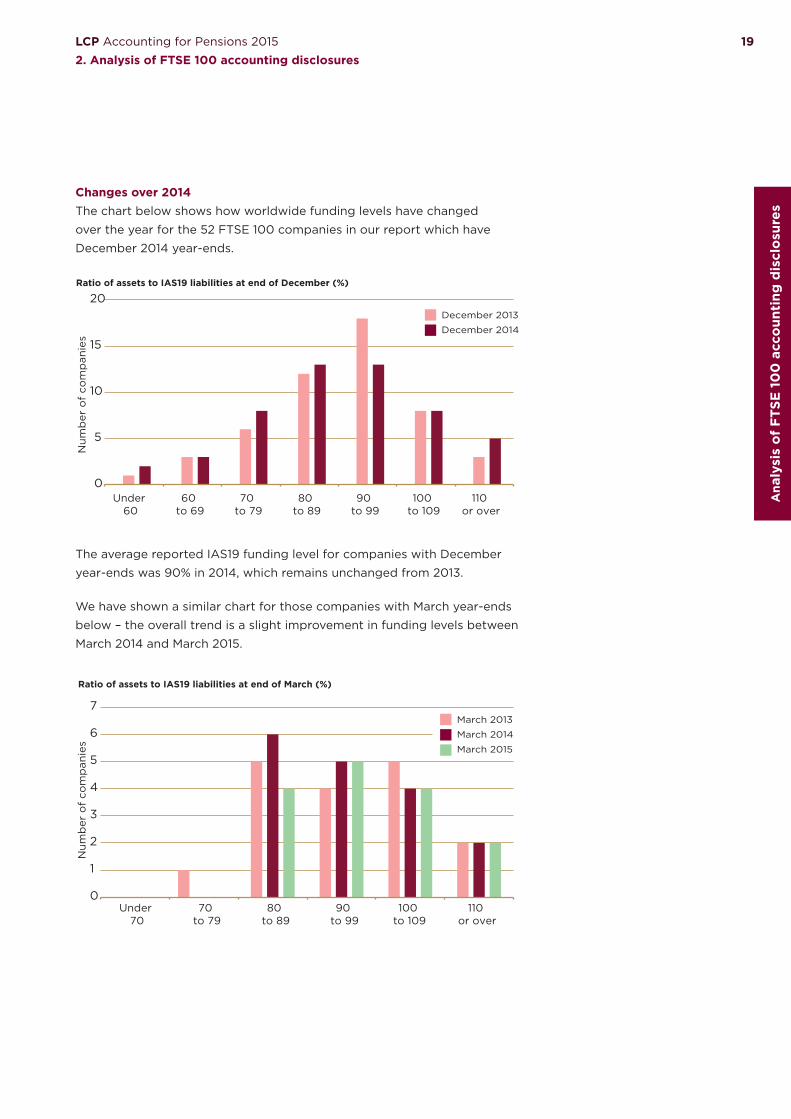
Changes over 2014The chart below shows how worldwide funding levels have changed
over the year for the 52 FTSE 100 companies in our report which have
December 2014 year-ends.
Ratio of assets to IAS19 liabilities at end of December (%)
December 2013
December 2014
0
5
10
15
20
Under 60
60 to 69
70 to 79
80 to 89
90 to 99
100 to 109
110 or over
Num
ber
of
com
pan
ies
The average reported IAS19 funding level for companies with December
year-ends was 90% in 2014, which remains unchanged from 2013.
We have shown a similar chart for those companies with March year-ends
below – the overall trend is a slight improvement in funding levels between
March 2014 and March 2015.
March 2013
March 2014
March 2015
Ratio of assets to IAS19 liabilities at end of March (%)
0
1
2
3
4
5
6
7
Under 70
70 to 79
80 to 89
90 to 99
100 to 109
110 or over
Num
ber
of
com
pan
ies
LCP Accounting for Pensions 2015
2. Analysis of FTSE 100 accounting disclosures20
The average reported IAS19 funding level for these companies was 103%
at March 2015 compared with 101% in 2014 and 97% in 2013. Notably,
Royal Mail was 193% funded on an IAS19 basis at 31 March 2015 – the 10%
increase compared to 31 March 2014 being in part due to an investment
strategy that hedges liabilities – including those expected to accrue over
the period until 2017 – against falls in interest rates.
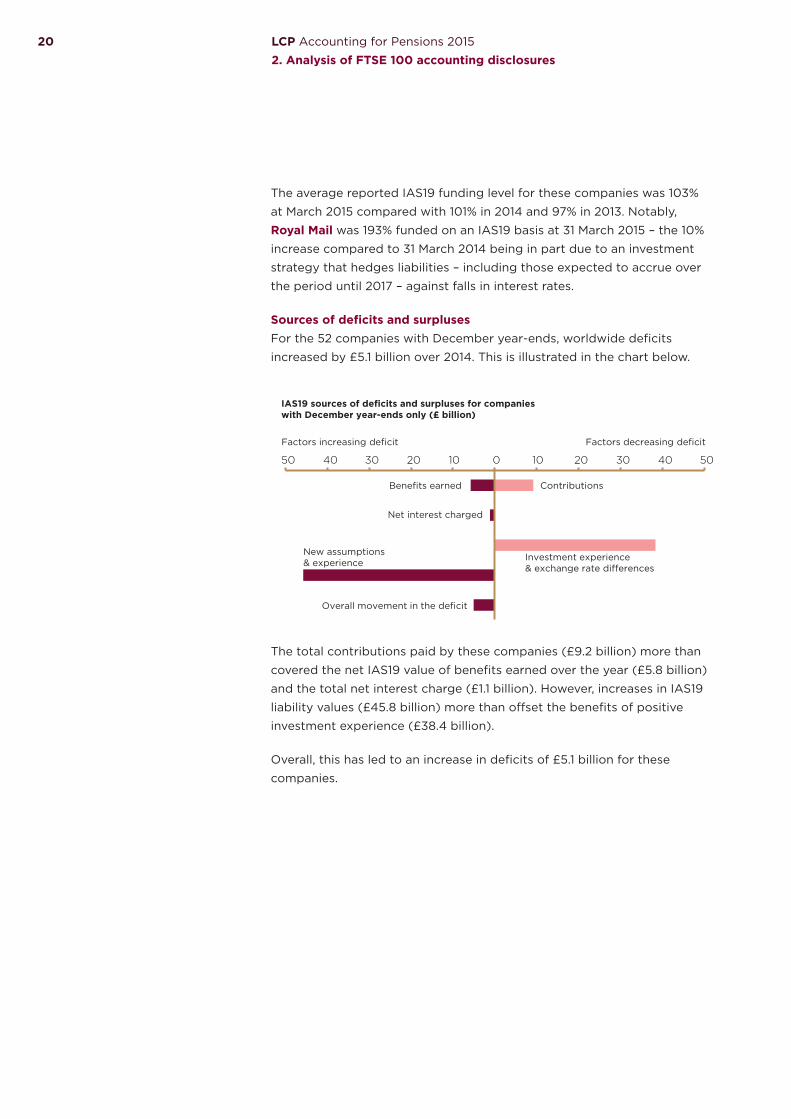
Sources of deficits and surplusesFor the 52 companies with December year-ends, worldwide deficits
increased by £5.1 billion over 2014. This is illustrated in the chart below.
IAS19 sources of deficits and surpluses for companies with December year-ends only (£ billion)
Benefits earned
Net interest charged
Investment experience & exchange rate dierences
New assumptions & experience
Overall movement in the deficit
50 40 30 20 10 0 10 20 30 40 50
Factors increasing deficit Factors decreasing deficit
Contributions
The total contributions paid by these companies (£9.2 billion) more than
covered the net IAS19 value of benefits earned over the year (£5.8 billion)
and the total net interest charge (£1.1 billion). However, increases in IAS19
liability values (£45.8 billion) more than offset the benefits of positive
investment experience (£38.4 billion).
Overall, this has led to an increase in deficits of £5.1 billion for these
companies.
21LCP Accounting for Pensions 2015
2. Analysis of FTSE 100 accounting disclosures
Ana
lysi
s o
f FT
SE 1
00
acc
oun
ting
dis
clo
sure
s
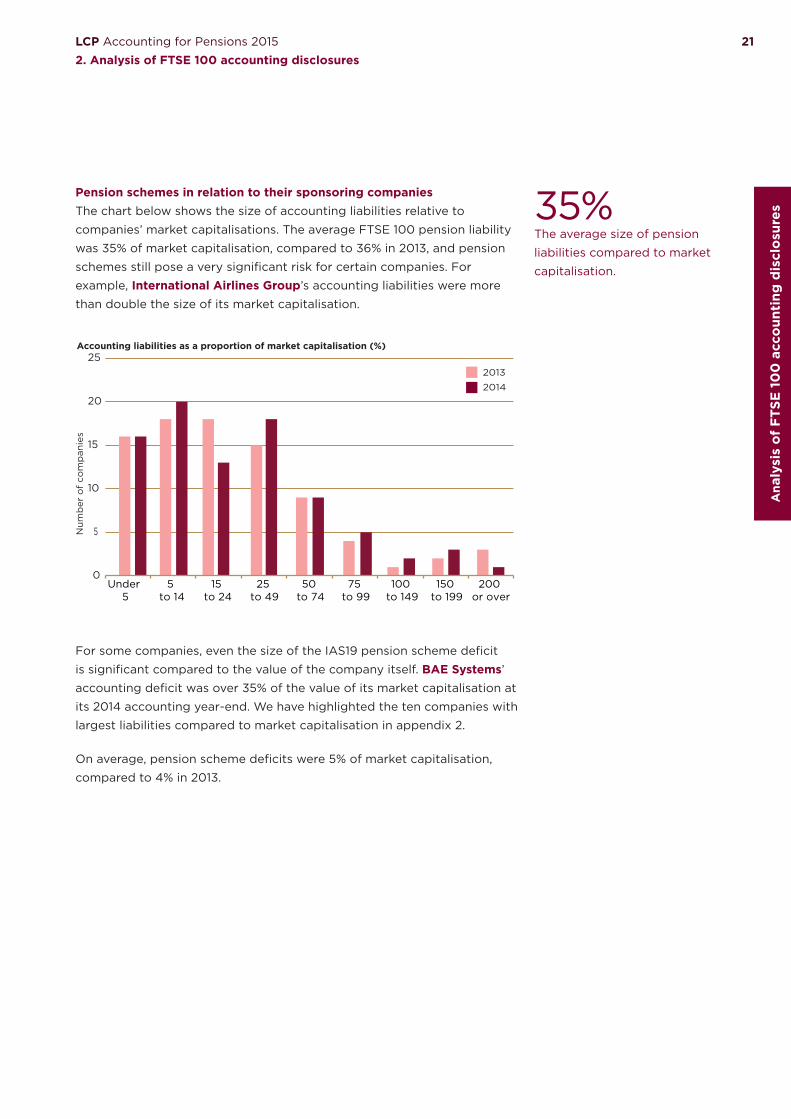
Pension schemes in relation to their sponsoring companiesThe chart below shows the size of accounting liabilities relative to
companies’ market capitalisations. The average FTSE 100 pension liability
was 35% of market capitalisation, compared to 36% in 2013, and pension
schemes still pose a very significant risk for certain companies. For
example, International Airlines Group’s accounting liabilities were more
than double the size of its market capitalisation.
Accounting liabilities as a proportion of market capitalisation (%)
0
5
10
15
20
25
Under 5
5 to 14
15 to 24
25 to 49
50 to 74
75 to 99
100 to 149
150 to 199
200 or over
Num
ber
of
com
pan
ies
2013
2014
For some companies, even the size of the IAS19 pension scheme deficit
is significant compared to the value of the company itself. BAE Systems’
accounting deficit was over 35% of the value of its market capitalisation at
its 2014 accounting year-end. We have highlighted the ten companies with
largest liabilities compared to market capitalisation in appendix 2.
On average, pension scheme deficits were 5% of market capitalisation,
compared to 4% in 2013.
35%The average size of pension
liabilities compared to market
capitalisation.

LCP Accounting for Pensions 2015
2. Analysis of FTSE 100 accounting disclosures22
Pension scheme contributionsFTSE 100 companies paid contributions totalling £12.5 billion into their
defined benefit pension schemes in 2014 of which we estimate just over
half – £7.1 billion – went towards the cost of additional benefit accrual for
current employees.
Whilst this is a significant amount to have been paid, it is a noticeable
reduction from the £14.8 billion of contributions paid in 2013, £16.8 billion
paid in 2012 and £16.9 billion paid in 2011. The fall mainly reflects large
one-off contributions made by a small number of companies to their
pension schemes in previous years. For example, Diageo made a one-off
contribution to its UK pension plan of £400 million in 2013 which was
not repeated in 2014 and the 2012 figures include a £2 billion special
contribution made by BT Group.
The chart below shows how company payments, including those to
defined contribution pension schemes, have changed since 2007.
Employer contributions to pension schemes
Deficit contributions (DB schemes)
Employer service cost (DB schemes)
Employer DC costs
0
5
10
15
20
25
2007 2008 2009 2010 2011 2012 2013 2014
£ b
illio
n
£2.3 bnThe reduction in employer
contributions to defined
benefit pension schemes
this year.
23LCP Accounting for Pensions 2015
2. Analysis of FTSE 100 accounting disclosures
Ana
lysi
s o
f FT
SE 1
00
acc
oun
ting
dis
clo
sure
s
The ten companies that paid the highest contributions to their defined
benefit pension schemes are shown in appendix 2. RBS and
Royal Dutch Shell were the only companies to pay more than £1 billion
over their 2014 accounting year. Royal Dutch Shell was the only company
to pay more than £1 billion in 2013.
Most companies pay contributions at a rate greater than the IAS19 value of
benefits earned over the year. If the IAS19 assumptions were borne out in
reality, this excess would reduce the IAS19 deficit.
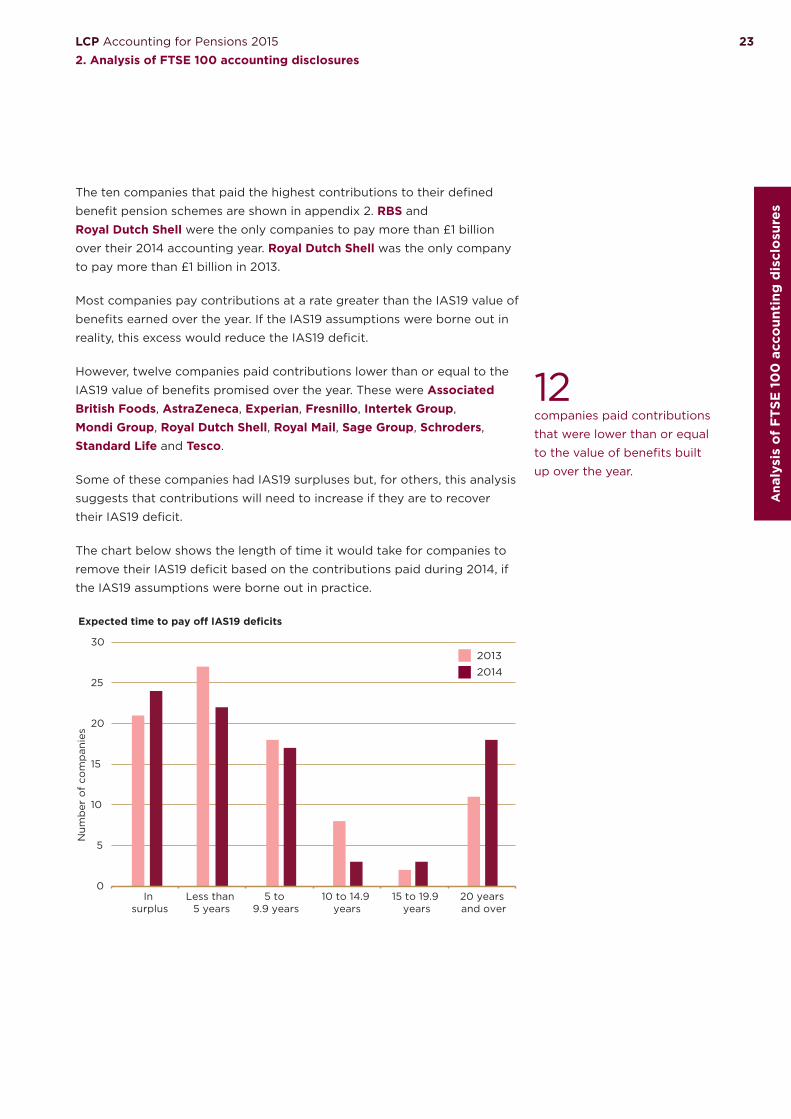
However, twelve companies paid contributions lower than or equal to the
IAS19 value of benefits promised over the year. These were Associated British Foods, AstraZeneca, Experian, Fresnillo, Intertek Group, Mondi Group, Royal Dutch Shell, Royal Mail, Sage Group, Schroders, Standard Life and Tesco.
Some of these companies had IAS19 surpluses but, for others, this analysis
suggests that contributions will need to increase if they are to recover
their IAS19 deficit.
The chart below shows the length of time it would take for companies to
remove their IAS19 deficit based on the contributions paid during 2014, if
the IAS19 assumptions were borne out in practice.
Expected time to pay o� IAS19 deficits
2013
2014
0
5
10
15
20
25
30
In surplus
Less than 5 years
5 to 9.9 years
10 to 14.9 years
15 to 19.9 years
20 years and over
Num
ber
of
com
pan
ies
12companies paid contributions
that were lower than or equal
to the value of benefits built
up over the year.
LCP Accounting for Pensions 2015
2. Analysis of FTSE 100 accounting disclosures24
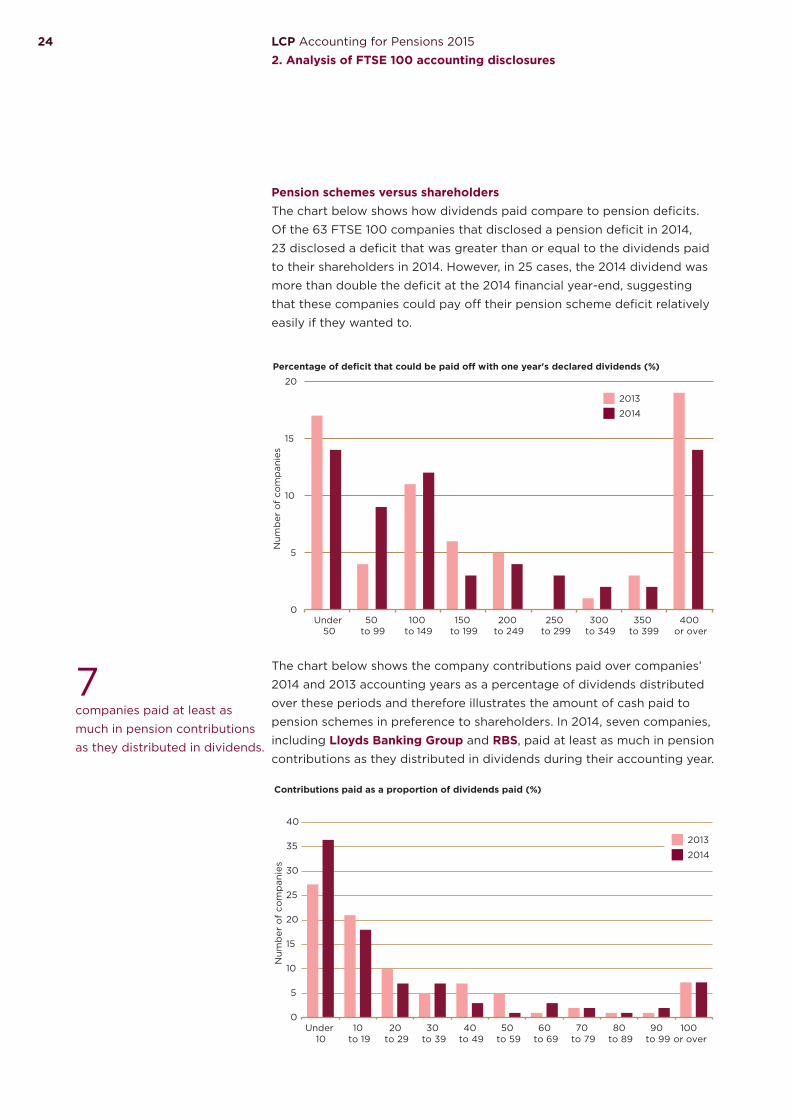
Pension schemes versus shareholdersThe chart below shows how dividends paid compare to pension deficits.
Of the 63 FTSE 100 companies that disclosed a pension deficit in 2014,
23 disclosed a deficit that was greater than or equal to the dividends paid
to their shareholders in 2014. However, in 25 cases, the 2014 dividend was
more than double the deficit at the 2014 financial year-end, suggesting
that these companies could pay off their pension scheme deficit relatively
easily if they wanted to.
Percentage of deficit that could be paid o� with one year's declared dividends (%)
0
5
10
15
20
Under 50
50 to 99
100 to 149
150 to 199
200 to 249
250 to 299
300 to 349
350 to 399
400 or over
Num
ber
of
com
pan
ies
2014
2013
The chart below shows the company contributions paid over companies’
2014 and 2013 accounting years as a percentage of dividends distributed
over these periods and therefore illustrates the amount of cash paid to
pension schemes in preference to shareholders. In 2014, seven companies,
including Lloyds Banking Group and RBS, paid at least as much in pension
contributions as they distributed in dividends during their accounting year.
Contributions paid as a proportion of dividends paid (%)
0
5
10
15
20
25
30
35
40
Under 10
10 to 19
20 to 29
30 to 39
40 to 49
50 to 59
60 to 69
70 to 79
80 to 89
90 to 99
100 or over
Num
ber
of
com
pan
ies
2014
2013
7companies paid at least as
much in pension contributions
as they distributed in dividends.

25LCP Accounting for Pensions 2015
2. Analysis of FTSE 100 accounting disclosures
Ana
lysi
s o
f FT
SE 1
00
acc
oun
ting
dis
clo
sure
s
Key assumptionsWe consider below the various assumptions used to place an IAS19 value
on pension benefits. Where a company operates pension schemes in more
than one country, we have considered the assumptions used for the UK if
separately given. Where a company has disclosed a range of assumptions,
we have taken the mid-point.
Life expectancyUnder the IAS19 standard, companies are required to disclose any
“significant actuarial assumptions”, and we would generally expect
this to include mortality. 78 of 87 companies have provided sufficient
information in their 2014 accounts for us to derive basic mortality statistics
– specifically a male life expectancy at age 65 in the UK. This compares
to 74 out of 89 in 2013. Of the remaining 9, eight provided either non-UK
life expectancies, a range of life expectancies, or a narrative description of
their mortality assumptions. Coca Cola HBC was the only company that
did not disclose any information about the mortality assumption used.
The following charts show the range of life expectancies assumed under
IAS19 by FTSE 100 companies for males aged 65 on the balance sheet
date.
Life expectancy assumptions reported in 2014UK males aged 65 on the accounting date
2013
2014
0
5
10
15
20
25
30
35
85.9 or less 86 to 86.9 87 to 87.9 88 to 88.9 89 to 89.9 90 or above
Num
ber
of
com
pan
ies
LCP Accounting for Pensions 2015
2. Analysis of FTSE 100 accounting disclosures26
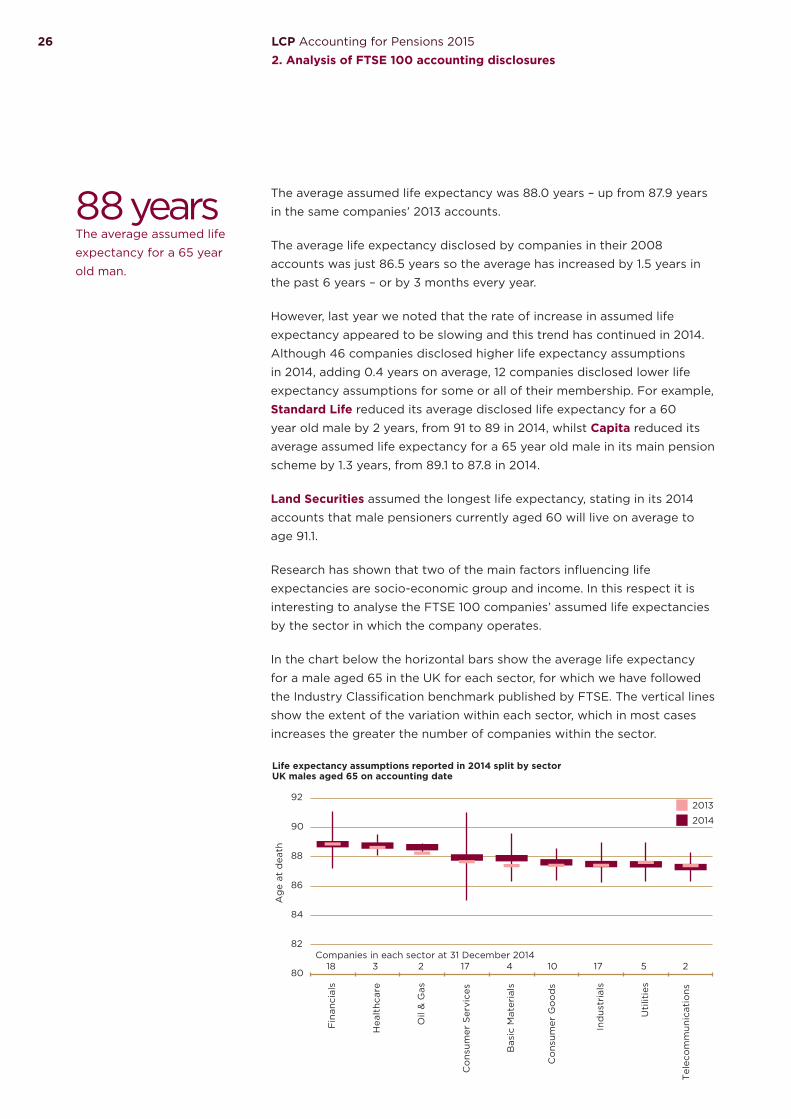
The average assumed life expectancy was 88.0 years – up from 87.9 years
in the same companies’ 2013 accounts.
The average life expectancy disclosed by companies in their 2008
accounts was just 86.5 years so the average has increased by 1.5 years in
the past 6 years – or by 3 months every year.
However, last year we noted that the rate of increase in assumed life
expectancy appeared to be slowing and this trend has continued in 2014.
Although 46 companies disclosed higher life expectancy assumptions
in 2014, adding 0.4 years on average, 12 companies disclosed lower life
expectancy assumptions for some or all of their membership. For example,
Standard Life reduced its average disclosed life expectancy for a 60
year old male by 2 years, from 91 to 89 in 2014, whilst Capita reduced its
average assumed life expectancy for a 65 year old male in its main pension
scheme by 1.3 years, from 89.1 to 87.8 in 2014.
Land Securities assumed the longest life expectancy, stating in its 2014
accounts that male pensioners currently aged 60 will live on average to
age 91.1.
Research has shown that two of the main factors influencing life
expectancies are socio-economic group and income. In this respect it is
interesting to analyse the FTSE 100 companies’ assumed life expectancies
by the sector in which the company operates.
In the chart below the horizontal bars show the average life expectancy
for a male aged 65 in the UK for each sector, for which we have followed
the Industry Classification benchmark published by FTSE. The vertical lines
show the extent of the variation within each sector, which in most cases
increases the greater the number of companies within the sector.
Life expectancy assumptions reported in 2014 split by sectorUK males aged 65 on accounting date
2014
2013
80
82
84
86
88
90
92
Fin
anci
als
Hea
lthc
are
Oil
& G
as
Co
nsum
er S
ervi
ces
Bas
ic M
ater
ials
Co
nsum
er G
oo
ds
Ind
ustr
ials
Uti
litie
s
Tel
eco
mm
unic
atio
ns
Ag
e at
dea
th
18 23 17 2104 17Companies in each sector at 31 December 2014
5
88 yearsThe average assumed life
expectancy for a 65 year
old man.
27LCP Accounting for Pensions 2015
2. Analysis of FTSE 100 accounting disclosures
Ana
lysi
s o
f FT
SE 1
00
acc
oun
ting
dis
clo
sure
s
This chart shows that the highest average assumed life expectancies are
found in the financials and healthcare sectors, as last year. The lowest
average assumed life expectancy is found in the telecommunications
sector.
The biggest change was in the basic materials sector, where the average
assumed life expectancy increased from 87.4 to 87.9.
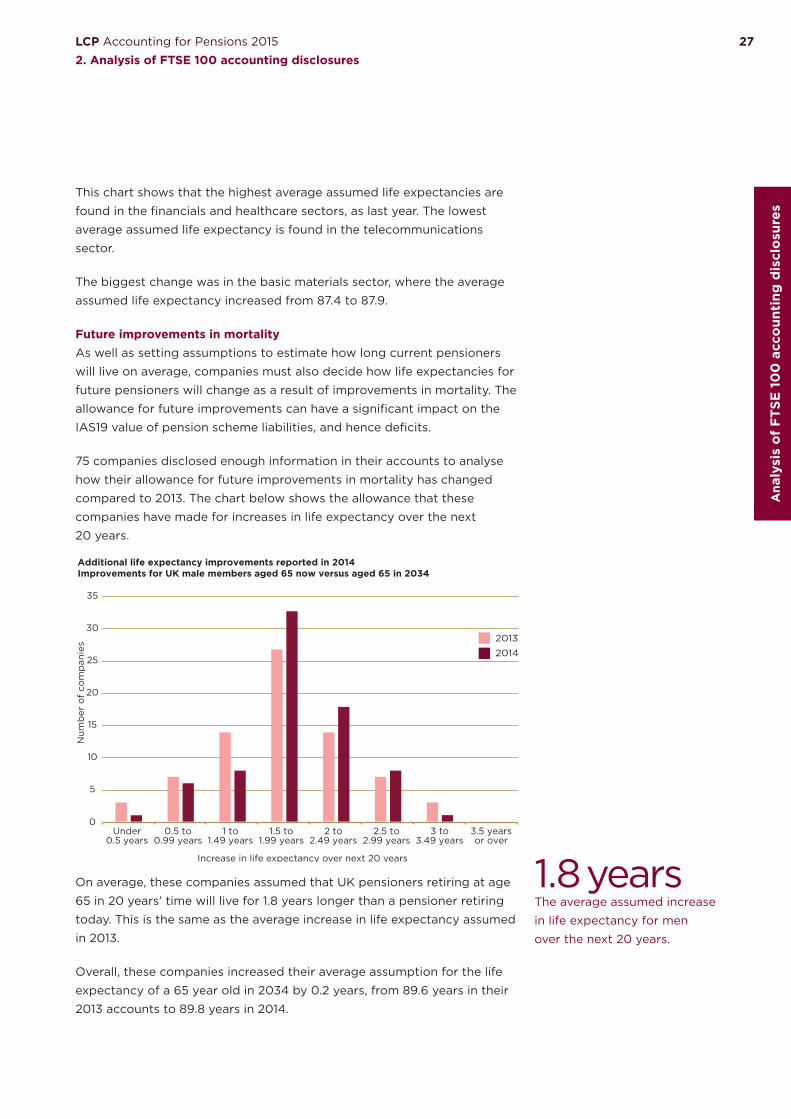
Future improvements in mortalityAs well as setting assumptions to estimate how long current pensioners
will live on average, companies must also decide how life expectancies for
future pensioners will change as a result of improvements in mortality. The
allowance for future improvements can have a significant impact on the
IAS19 value of pension scheme liabilities, and hence deficits.
75 companies disclosed enough information in their accounts to analyse
how their allowance for future improvements in mortality has changed
compared to 2013. The chart below shows the allowance that these
companies have made for increases in life expectancy over the next
20 years.
0
5
10
15
20
25
30
35
Num
ber
of
com
pan
ies
Additional life expectancy improvements reported in 2014Improvements for UK male members aged 65 now versus aged 65 in 2034
Increase in life expectancy over next 20 years
Under0.5 years
0.5 to0.99 years
1 to1.49 years
1.5 to1.99 years
2 to2.49 years
2.5 to2.99 years
3 to3.49 years
3.5 yearsor over
2013
2014
On average, these companies assumed that UK pensioners retiring at age
65 in 20 years’ time will live for 1.8 years longer than a pensioner retiring
today. This is the same as the average increase in life expectancy assumed
in 2013.
Overall, these companies increased their average assumption for the life
expectancy of a 65 year old in 2034 by 0.2 years, from 89.6 years in their
2013 accounts to 89.8 years in 2014.
1.8 yearsThe average assumed increase
in life expectancy for men
over the next 20 years.
LCP Accounting for Pensions 2015
2. Analysis of FTSE 100 accounting disclosures28
Discount rates and inflationThe discount rate is used to calculate a present value of the projected
pension benefits. A lower discount rate means a higher IAS19 value of
pension liabilities and vice versa.
The typical FTSE 100 company has pension liabilities that are linked to
price inflation. A decrease in the price inflation assumption will lead to a
lower level of projected benefit payments, and hence a lower IAS19 value
being placed on those benefits, all other things being equal.
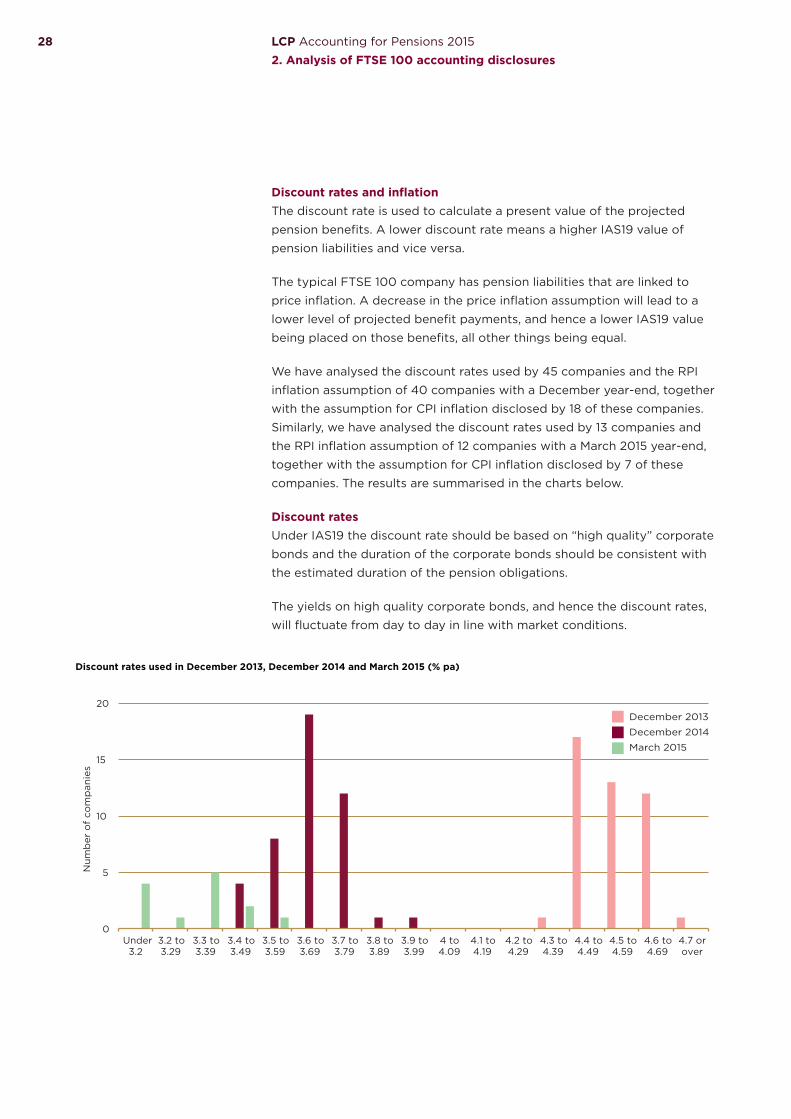
We have analysed the discount rates used by 45 companies and the RPI
inflation assumption of 40 companies with a December year-end, together
with the assumption for CPI inflation disclosed by 18 of these companies.
Similarly, we have analysed the discount rates used by 13 companies and
the RPI inflation assumption of 12 companies with a March 2015 year-end,
together with the assumption for CPI inflation disclosed by 7 of these
companies. The results are summarised in the charts below.
Discount ratesUnder IAS19 the discount rate should be based on “high quality” corporate
bonds and the duration of the corporate bonds should be consistent with
the estimated duration of the pension obligations.
The yields on high quality corporate bonds, and hence the discount rates,
will fluctuate from day to day in line with market conditions.
December 2013
December 2014
March 2015
Discount rates used in December 2013, December 2014 and March 2015 (% pa)
0
5
10
15
20
Under3.2
3.2 to3.29
3.3 to3.39
3.4 to3.49
3.5 to3.59
3.6 to3.69
3.7 to3.79
3.8 to3.89
3.9 to3.99
4 to4.09
4.1 to4.19
4.2 to4.29
4.3 to4.39
4.4 to4.49
4.5 to4.59
4.6 to4.69
4.7 orover
Num
ber
of
com
pan
ies
29LCP Accounting for Pensions 2015
2. Analysis of FTSE 100 accounting disclosures
Ana
lysi
s o
f FT
SE 1
00
acc
oun
ting
dis
clo
sure
s
The average discount rate decreased significantly over the year to
December 2014, from 4.5% pa in December 2013 to 3.6% pa in
December 2014. The average discount rate used by FTSE 100 companies
with a March 2015 year-end was even lower at 3.3% pa. The spread of
discount rates used by FTSE 100 companies with a December 2014
year-end has increased compared to December 2013, with a 0.5% spread
of rates compared to a 0.35% spread last year. Centrica disclosed the
highest discount rate for a FTSE 100 company with a December year-end
in their 2014 accounts (3.9% pa in 2014 compared to 4.6% pa in 2013).
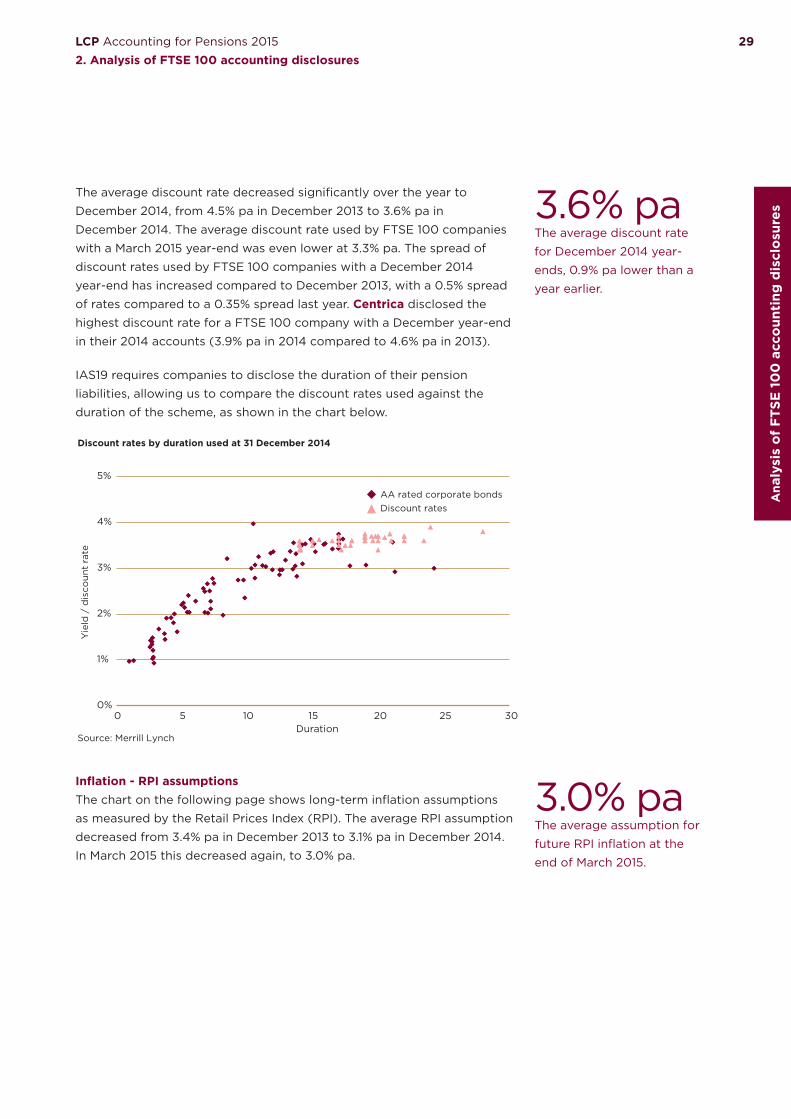
IAS19 requires companies to disclose the duration of their pension
liabilities, allowing us to compare the discount rates used against the
duration of the scheme, as shown in the chart below.
AA rated corporate bondsDiscount rates
Discount rates by duration used at 31 December 2014
Source: Merrill Lynch
0%
1%
2%
3%
4%
5%
0 5 10 15 20 25 30
Yie
ld /
dis
coun
t ra
te
Duration
Inflation - RPI assumptionsThe chart on the following page shows long-term inflation assumptions
as measured by the Retail Prices Index (RPI). The average RPI assumption
decreased from 3.4% pa in December 2013 to 3.1% pa in December 2014.
In March 2015 this decreased again, to 3.0% pa.
3.6% paThe average discount rate
for December 2014 year-
ends, 0.9% pa lower than a
year earlier.
3.0% paThe average assumption for
future RPI inflation at the
end of March 2015.

LCP Accounting for Pensions 2015
2. Analysis of FTSE 100 accounting disclosures30
0
5
10
15
20
25
30
Under 2.9 2.9 to 3.09 3.1 to 3.29 3.3 to 3.49 3.5 to 3.69 3.7 or over
Num
ber
of
com
pan
ies
RPI inflation used in December 2013, December 2014 and March 2015 (% pa)
December 2013
December 2014
March 2015
For December 2014 year-ends, the highest RPI inflation assumption was
3.35% pa, adopted by Standard Life. At the other extreme RELX Group
and Unilever, who both reported at the same date, adopted an assumption
of 2.9% pa. In general, the December 2014 RPI inflation assumptions had a
similar spread to those used in 2013, but were lower.
The Bank of England publishes statistics for future price inflation implied
by gilt spot rates. These showed that long-term RPI inflation implied by
20 year gilt spot rates was around 3.3% pa at the end of December 2014.
This suggests that, in order to justify an assumption much lower than
this for future RPI inflation, companies may be allowing for a significant
“inflation risk premium”. This represents the theoretical return that
investors are willing to forgo when investing in index-linked gilts, in return
for the inflation protection that these assets provide.
In practice, it is the discount rate net of assumed future price inflation
which is the key assumption.
The chart below shows the difference between the discount rate and
the assumption for RPI inflation (the net discount rate) for companies
reporting as at 31 December 2013, 31 December 2014 and 31 March 2015.
It shows that the net discount rate has reduced since December 2013,
from an average of 1.1% pa to 0.5% pa at 31 December 2014. Notably, two
companies were using negative net discount rates at 31 March 2015. These
were British Land and Land Securities, adopting net discount rates of
-0.2% pa and -0.1% pa respectively.
31LCP Accounting for Pensions 2015
2. Analysis of FTSE 100 accounting disclosures
Ana
lysi
s o
f FT
SE 1
00
acc
oun
ting
dis
clo
sure
s
0
5
10
15
20
Under 0
0 to 0.19
0.2 to 0.39
0.4 to 0.59
0.6 to 0.79
0.8 to 0.99
1 to 1.19
1.2 or over
Num
ber
of
com
pan
ies
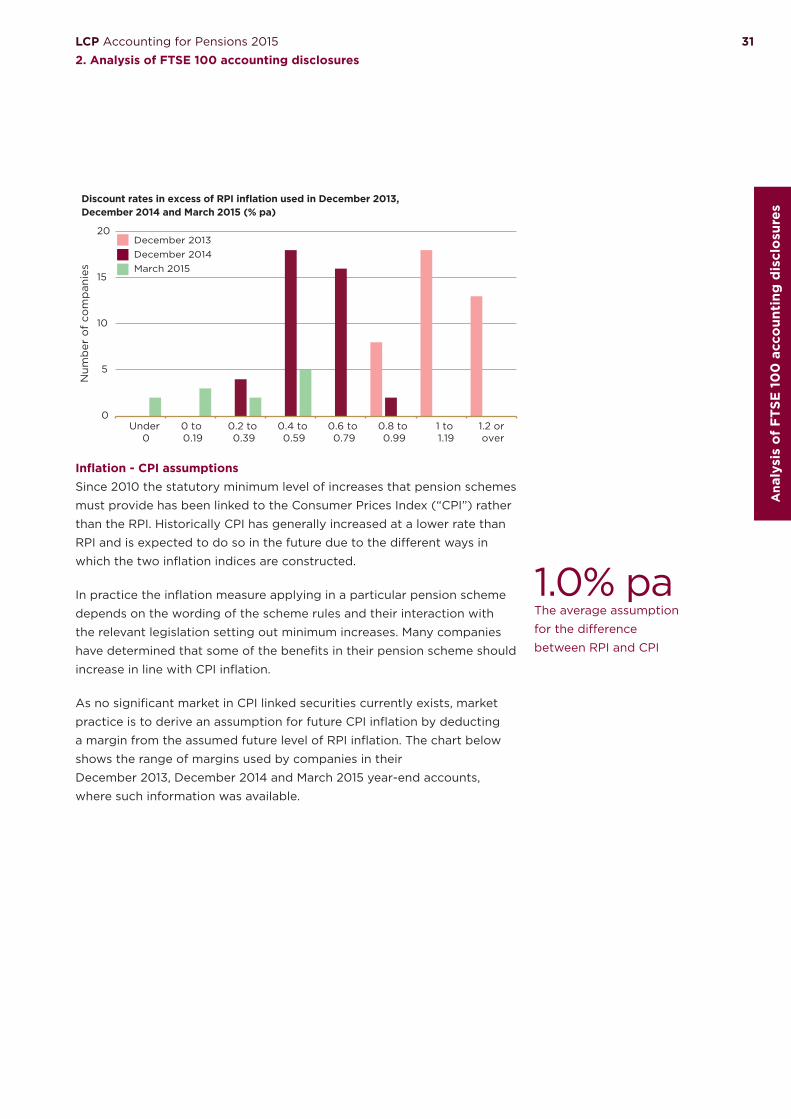
Discount rates in excess of RPI inflation used in December 2013, December 2014 and March 2015 (% pa)
December 2013December 2014March 2015
Inflation - CPI assumptionsSince 2010 the statutory minimum level of increases that pension schemes
must provide has been linked to the Consumer Prices Index (“CPI”) rather
than the RPI. Historically CPI has generally increased at a lower rate than
RPI and is expected to do so in the future due to the different ways in
which the two inflation indices are constructed.
In practice the inflation measure applying in a particular pension scheme
depends on the wording of the scheme rules and their interaction with
the relevant legislation setting out minimum increases. Many companies
have determined that some of the benefits in their pension scheme should
increase in line with CPI inflation.
As no significant market in CPI linked securities currently exists, market
practice is to derive an assumption for future CPI inflation by deducting
a margin from the assumed future level of RPI inflation. The chart below
shows the range of margins used by companies in their
December 2013, December 2014 and March 2015 year-end accounts,
where such information was available.
1.0% paThe average assumption
for the difference
between RPI and CPI

LCP Accounting for Pensions 2015
2. Analysis of FTSE 100 accounting disclosures32
0
5
10
15
Under 0.8 0.8 to 0.89 0.9 to 0.99 1 to 1.09 1.1 or over
Num
ber
of
com
pan
ies
Di�erence in RPI and CPI inflation assumptions used in December 2013, December 2014and March 2015 (% pa)
December 2013
December 2014
March 2015
At 31 December 2014 the average margin was 1.0% pa compared to
0.9% pa at 31 December 2013. At 31 December 2014, Aviva, Persimmon,
Schroders and Rolls-Royce Holdings used a long-term CPI inflation
assumption of 1.1% pa below their RPI inflation assumption, the largest
margin at that date.
Increases in pensionable payFor schemes that still relate benefits to pay close to retirement, the
assumed rate of growth in pensionable pay affects the disclosed IAS19
liability and the cost of benefits being earned. A lower assumption
produces a lower projected pension and hence lower pension liabilities as
well as a lower charge to operating income.
The average assumption for increases in pensionable pay (in excess of
the RPI inflation assumption) was 0.1% in 2014. In recent years a number
of companies have introduced caps on or even frozen increases in
pensionable salary and as a result disclosed a salary increase assumption
lower than RPI inflation. The average assumption has dropped from
0.5% pa in 2013 and from 1.5% pa 10 years ago.
0.1% paThe average assumption for
real increases in pensionable
pay, down from 1.5% pa 10
years ago.

33LCP Accounting for Pensions 2015
2. Analysis of FTSE 100 accounting disclosures
Ana
lysi
s o
f FT
SE 1
00
acc
oun
ting
dis
clo
sure
s
Pensionable pay growth rates used in excess of RPI inflation (% pa)
2013
2014
0
5
10
15
20
25
30
Under -1.5
-1.5 to -0.76
-0.75 to -0.01
0 to 0.74
0.75 to 1.49
1.5 to 2.24
2.25 or over
Num
ber
of
com
pan
ies
As the number of active members in final salary pension schemes has
reduced, the assumption for salary growth has become less significant.

34
Contentp36 Appendix 1 - FTSE 100 accounting disclosure listing
p40 Appendix 2 - FTSE 100 accounting risk measures
24 FTSE 100 companies disclosed a pension surplus in 2014, compared to 21 companies in 2013
Nick Bunch
Partner LCP
Ap
pen
dic
es

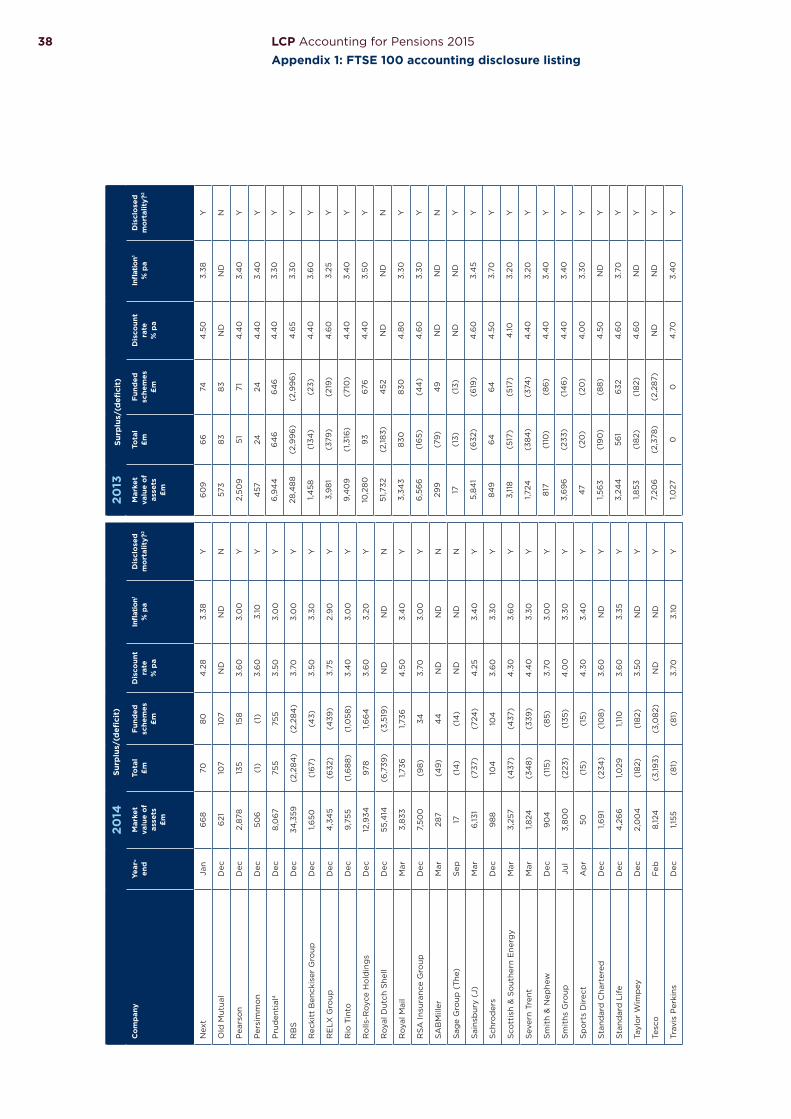
Thi
s ta
ble
sho
ws
the
key
dis
clo
sure
s m
ade
by
the
com
pan
ies
in t
he F
TS
E 1
00
as
at 3
1 D
ecem
ber
20
14 t
hat
rep
ort
ed IA
S19
fig
ures
in t
heir
20
14 a
cco
unts
. The
so
urce
of
the
dat
a is
eac
h co
mp
any’
s an
nual
rep
ort
and
acc
oun
ts f
or
the
acco
unti
ng p
erio
d e
ndin
g in
20
14. T
he m
arke
t va
lue
of
asse
ts a
nd s
urp
lus/
(defi
cit)
fig
ures
exc
lud
e p
ost
ret
irem
ent
med
ical
ben
efits
whe
re p
oss
ible
and
rel
ate
to t
he w
orl
dw
ide
po
siti
on
of
each
co
mp
any,
no
t ju
st t
he U
K s
chem
es. F
igur
es s
how
n ar
e b
efo
re d
efer
red
tax
and
bef
ore
any
bal
ance
shee
t as
set
limit
s ha
ve b
een
app
lied
. All
fig
ures
are
ro
und
ed t
o t
he n
eare
st m
illio
n p
oun
ds.
The
dis
coun
t ra
te a
nd p
rice
infl
atio
n as
sum
pti
ons
ref
er t
o t
hose
dis
clo
sed
fo
r th
e
com
pan
ies’
mai
n U
K s
chem
es w
here
ava
ilab
le. “
ND
” m
eans
no
UK
sp
ecifi
c fi
gur
es w
ere
dis
clo
sed
.
2014
Surp
lus/
(defi
cit)
Co
mp
any
Year
-en
dM
arke
t va
lue
of
asse
ts
£m
Tota
l£m
Fund
ed
sche
mes
£m
Dis
coun
t ra
te%
pa
Infla
tion1
% p
aD
iscl
ose
d
mo
rtal
ity?
2
3i G
roup
Mar
89
919
719
74
.50
3.4
0Y
Ab
erd
een
Ass
et M
anag
emen
tS
ep19
2(4
)(4
)4
.00
3.20
Y
Ag
gre
koD
ec9
1(7
)(7
)3.
80
3.30
Y
Ang
lo A
mer
ican
Dec
3,6
01
(159
)(1
9)
3.6
03.
10Y
Ash
tead
Gro
upA
pr
84
66
4.3
03.
50Y
Ass
oci
ated
Bri
tish
Fo
od
sS
ep3,
48
5(3
1)4
64
.103.
40
Y
Ast
raZ
enec
aD
ec6
,778
(1,8
70)
(1,4
93)
3.50
3.10
Y
Avi
vaD
ec15
,474
2,30
42,
424
3.70
3.10
Y
Bab
cock
Inte
rnat
iona
l Gro
upM
ar3,
220
(26
8)
(26
8)
4.5
03.
30Y
BA
E S
yste
ms3
Dec
23,6
75(5
,38
7)(5
,20
8)
3.6
03.
20Y
Bar
clay
sD
ec28
,874
(1,3
29)
(1,0
43)
3.6
73.
05
Y
Bar
ratt
Dev
elo
pm
ents
Jun
330
33
4.3
03.
30Y
BG
Gro
upD
ec1,2
85
(16
5)(1
17)
3.70
3.10
Y
BH
P B
illit
on
Jun
778
(48
)13
4.10
3.10
Y
BP
Dec
28,14
1(5
,50
7)(8
83)
3.6
03.
00
Y
Bri
tish
Am
eric
an T
ob
acco
Dec
6,2
53(6
28)
(34
1)3.
40
3.0
0Y
Bri
tish
Lan
d C
oM
ar13
16
64
.40
3.70
Y
BT
Gro
upM
ar4
0,11
3(7
,022
)(6
,953
)4
.25
3.25
Y
Bun
zlD
ec36
6(7
0)
(52)
ND
ND
Y
Cap
ita
Dec
94
0(1
93)
(19
3)3.
753.
00
Y
Car
niva
lN
ov37
47
73.
85
3.20
Y
Cen
tric
aD
ec6
,44
46
211
13.
90
3.0
0Y
Co
ca-C
ola
HB
CD
ec26
7(1
12)
(28
)N
DN
DN
Co
mp
ass
Gro
upS
ep2,
307
(176
)21
4.0
03.
20Y
CR
HD
ec1,5
94
(54
1)(4
95)
3.50
3.0
0Y
Dia
geo
Jun
7,4
80
(473
)(2
35)
4.2
03.
30Y
2013
Surp
lus/
(defi
cit)
Mar
ket
valu
e o
f as
sets
£m
Tota
l£m
Fund
ed
sche
mes
£m
Dis
coun
t ra
te%
pa
Infla
tion1
% p
aD
iscl
ose
d
mo
rtal
ity?
2
90
717
017
04
.40
3.30
Y
176
(4)
(4)
4.5
03.
40
Y
78(6
)(6
)4
.50
3.70
Y
3,18
9(2
15)
(85)
4.4
03.
40
Y
780
14
.20
3.4
0Y
3,23
3(3
)6
44
.70
3.50
Y
6,2
23(1
,34
7)(1
,031
)4
.50
3.50
Y
12,3
98
239
357
4.4
03.
40
Y
3,20
5(2
61)
(26
1)4
.40
2.8
0Y
21,3
74(3
,54
0)
(3,3
57)
4.5
03.
40
Y
25,7
43
(1,6
64
)(1
,36
6)
4.4
63.
42
Y
295
(13)
(13)
4.7
03.
40
Y
1,16
3(1
01)
(57)
4.5
03.
40
Y
1,24
8(4
0)
344
.50
3.6
0Y
26,0
83
(3,4
86
)58
14
.60
3.30
Y
5,76
7(3
77)
(138
)4
.40
3.4
0Y
120
11
4.10
3.20
Y
41,5
66
(5,8
56)
(5,7
84
)4
.20
3.30
Y
336
(45)
(30
)N
DN
DY
84
8(1
18)
(118
)4
.50
3.30
Y
329
(4)
(4)
4.4
03.
40
Y
5,6
83
40
82
4.6
03.
30Y
253
(91)
(10
)N
DN
DN
2,14
9(2
09
)(2
4)
4.4
03.
40
Y
1,929
(330
)(2
91)
4.6
03.
30Y
7,0
82
(536
)(2
97)
4.6
03.
30Y
LCP Accounting for Pensions 2015
Appendix 1: FTSE 100 accounting disclosure listing36

37LCP Accounting for Pensions 2015
Appendix 1: FTSE 100 accounting disclosure listing
2014
Surp
lus/
(defi
cit)
Co
mp
any
Year
-en
dM
arke
t va
lue
of
asse
ts
£m
Tota
l£m
Fund
ed
sche
mes
£m
Dis
coun
t ra
te%
pa
Infla
tion1
% p
aD
iscl
ose
d
mo
rtal
ity?
2
Dir
ect
Line
Insu
ranc
e G
roup
Dec
83
44
3.4
03.
10Y
Exp
eria
nM
ar6
65
144
54
.30
3.30
Y
Fre
snill
oD
ec13
(9)
(3)
ND
ND
N
Fri
end
s Li
feD
ec1,6
3859
593.
67
ND
Y
G4
SD
ec2,
04
0(3
19)
(26
4)
3.70
3.0
0Y
GK
ND
ec2,
627
(1,7
11)
(1,0
95)
3.53
3.0
8Y
Gla
xoS
mit
hKlin
eD
ec16
,112
(1,6
89
)(1
,238
)3.
60
3.0
0Y
Gle
nco
re X
stra
taD
ec2,
342
(68
6)
(68
6)
ND
ND
N
Ham
mer
son
Dec
62
(40
)(2
8)
3.6
03.
10N
HS
BC
Ho
ldin
gs
Dec
28,7
771,7
731,7
86
3.70
3.20
Y
Imp
eria
l To
bac
co G
roup
Sep
3,0
94
(474
)28
4.0
03.
20Y
Inte
rCo
ntin
enta
l Ho
tels
Gro
upD
ec11
2(7
1)(1
5)3.
703.
30Y
Inte
rnat
iona
l Air
lines
Gro
upD
ec21
,195
3811
53.
63
2.9
0Y
Inte
rtek
Gro
upD
ec12
0(2
5)(2
5)3.
60
ND
Y
ITV
Dec
3,34
1(3
46
)(2
98
)3.
60
3.0
3Y
John
son
Mat
they
Mar
1,456
(117
)(1
17)
4.6
03.
40
Y
Kin
gfi
sher
Feb
2,12
7(1
00
)(1
00
)4
.40
3.30
Y
Land
Sec
urit
ies
Gro
upM
ar19
62
24
.25
3.6
0Y
Leg
al &
Gen
eral
Gro
up4
Dec
1,910
(49
4)
(49
4)
3.6
03.
10Y
Lloy
ds
Ban
king
Gro
upD
ec38
,133
89
08
90
3.6
72.
95
Y
Lond
on
Sto
ck E
xcha
nge
Gro
up5
Mar
44
4(2
3)(2
3)4
.50
3.4
0Y
Lond
on
Sto
ck E
xcha
nge
Gro
up5
Dec
507
(24
)(2
4)
3.70
3.10
Y
Mar
ks &
Sp
ence
r G
roup
Mar
6,7
2920
020
14
.45
3.4
0Y
Meg
git
tD
ec76
1(2
71)
(254
)3.
60
3.10
Y
Mo
ndi G
roup
Dec
110
(14
8)
(36
)N
DN
DN
Mo
rris
on
(Wm
) S
uper
mar
kets
Feb
3,0
94
(11)
(11)
4.5
03.
50Y
Nat
iona
l Gri
dM
ar21
,638
(1,2
76)
(1,0
28)
4.3
03.
30Y
2013
Surp
lus/
(defi
cit)
Mar
ket
valu
e o
f as
sets
£m
Tota
l£m
Fund
ed
sche
mes
£m
Dis
coun
t ra
te%
pa
Infla
tion1
% p
aD
iscl
ose
d
mo
rtal
ity?
2
66
(2)
(2)
4.4
03.
50Y
654
2353
4.5
03.
40
Y
14(7
)(2
)N
DN
DN
1,410
(4)
(4)
4.4
1N
DY
1,66
0(5
04
)(4
72)
4.4
03.
40
Y
2,53
2(1
,271
)(7
63)
4.3
53.
28Y
15,2
25(6
13)
(20
7)4
.50
3.4
0Y
2,20
7(5
90
)(5
90
)N
DN
DN
58(3
3)(2
1)4
.60
3.4
0N
24,5
769
410
64
.45
3.6
0Y
2,9
24(6
21)
(16
2)4
.30
3.30
Y
44
5(9
1)(1
1)4
.60
3.6
0Y
19,10
9(3
)6
54
.55
3.28
Y
113
(13)
(13)
4.5
0N
DY
2,8
70(4
45)
(40
1)4
.53
3.38
Y
1,413
(19
5)(1
95)
4.5
03.
40
Y
2,0
87
00
4.6
03.
30Y
193
66
4.3
03.
50Y
1,64
6(4
64
)(4
64
)4
.40
3.50
Y
32,5
68
(78
7)(7
87)
4.6
03.
30Y
274
(26
)(2
6)
4.5
03.
40
Y
NA
NA
NA
NA
NA
NA
6,9
3024
824
94
.30
3.4
0Y
68
8(1
90
)(1
77)
4.6
03.
40
Y
100
(127
)(3
2)N
DN
DN
2,8
39(2
0)
(20
)4
.85
3.70
Y
21,7
70(1
,90
6)
(1,6
40
)4
.30
3.4
0Y
38 LCP Accounting for Pensions 2015
Appendix 1: FTSE 100 accounting disclosure listing
2014
Surp
lus/
(defi
cit)
Co
mp
any
Year
-en
dM
arke
t va
lue
of
asse
ts
£m
Tota
l£m
Fund
ed
sche
mes
£m
Dis
coun
t ra
te%
pa
Infla
tion1
% p
aD
iscl
ose
d
mo
rtal
ity?
2
Nex
tJa
n6
68
708
04
.28
3.38
Y
Old
Mut
ual
Dec
621
107
107
ND
ND
N
Pea
rso
nD
ec2,
878
135
158
3.6
03.
00
Y
Per
sim
mo
nD
ec50
6(1
)(1
)3.
60
3.10
Y
Pru
den
tial
4D
ec8
,06
775
575
53.
503.
00
Y
RB
SD
ec34
,359
(2,2
84
)(2
,28
4)
3.70
3.0
0Y
Rec
kitt
Ben
ckis
er G
roup
Dec
1,650
(16
7)(4
3)3.
503.
30Y
RE
LX G
roup
Dec
4,3
45
(632
)(4
39)
3.75
2.9
0Y
Rio
Tin
toD
ec9
,755
(1,6
88
)(1
,058
)3.
40
3.0
0Y
Ro
lls-R
oyce
Ho
ldin
gs
Dec
12,9
349
781,6
64
3.6
03.
20Y
Roy
al D
utch
She
llD
ec55
,414
(6,7
39)
(3,5
19)
ND
ND
N
Roy
al M
ail
Mar
3,8
331,7
361,7
364
.50
3.4
0Y
RS
A In
sura
nce
Gro
upD
ec7,
500
(98
)34
3.70
3.0
0Y
SA
BM
iller
Mar
287
(49
)4
4N
DN
DN
Sag
e G
roup
(T
he)
Sep
17(1
4)
(14
)N
DN
DN
Sai
nsb
ury
(J)
Mar
6,13
1(7
37)
(724
)4
.25
3.4
0Y
Sch
rod
ers
Dec
98
810
410
43.
60
3.30
Y
Sco
ttis
h &
So
uthe
rn E
nerg
yM
ar3,
257
(437
)(4
37)
4.3
03.
60
Y
Sev
ern
Tren
tM
ar1,8
24(3
48
)(3
39)
4.4
03.
30Y
Sm
ith
& N
ephe
wD
ec9
04
(115
)(8
5)3.
703.
00
Y
Sm
iths
Gro
upJu
l3,
80
0(2
23)
(135
)4
.00
3.30
Y
Sp
ort
s D
irec
tA
pr
50(1
5)(1
5)4
.30
3.4
0Y
Sta
ndar
d C
hart
ered
Dec
1,69
1(2
34)
(10
8)
3.6
0N
DY
Sta
ndar
d L
ife
Dec
4,2
66
1,029
1,110
3.6
03.
35Y
Tayl
or
Wim
pey
Dec
2,0
04
(18
2)(1
82)
3.50
ND
Y
Tesc
oF
eb8
,124
(3,19
3)(3
,08
2)N
DN
DY
Trav
is P
erki
nsD
ec1,1
55(8
1)(8
1)3.
703.
10Y
2013
Surp
lus/
(defi
cit)
Mar
ket
valu
e o
f as
sets
£m
Tota
l£m
Fund
ed
sche
mes
£m
Dis
coun
t ra
te%
pa
Infla
tion1
% p
aD
iscl
ose
d
mo
rtal
ity?
2
60
96
674
4.5
03.
38Y
573
83
83
ND
ND
N
2,50
951
714
.40
3.4
0Y
457
2424
4.4
03.
40
Y
6,9
44
64
66
46
4.4
03.
30Y
28,4
88
(2,9
96
)(2
,99
6)
4.6
53.
30Y
1,458
(134
)(2
3)4
.40
3.6
0Y
3,9
81
(379
)(2
19)
4.6
03.
25Y
9,4
09
(1,3
16)
(710
)4
.40
3.4
0Y
10,2
80
93
676
4.4
03.
50Y
51,7
32(2
,183)
452
ND
ND
N
3,34
38
308
304
.80
3.30
Y
6,5
66
(16
5)(4
4)
4.6
03.
30Y
299
(79
)4
9N
DN
DN
17(1
3)(1
3)N
DN
DY
5,8
41
(632
)(6
19)
4.6
03.
45
Y
84
96
46
44
.50
3.70
Y
3,11
8(5
17)
(517
)4
.103.
20Y
1,724
(38
4)
(374
)4
.40
3.20
Y
817
(110
)(8
6)
4.4
03.
40
Y
3,6
96
(233
)(1
46
)4
.40
3.4
0Y
47
(20
)(2
0)
4.0
03.
30Y
1,56
3(1
90
)(8
8)
4.5
0N
DY
3,24
456
16
324
.60
3.70
Y
1,853
(18
2)(1
82)
4.6
0N
DY
7,20
6(2
,378
)(2
,28
7)N
DN
DY
1,027
00
4.7
03.
40
Y
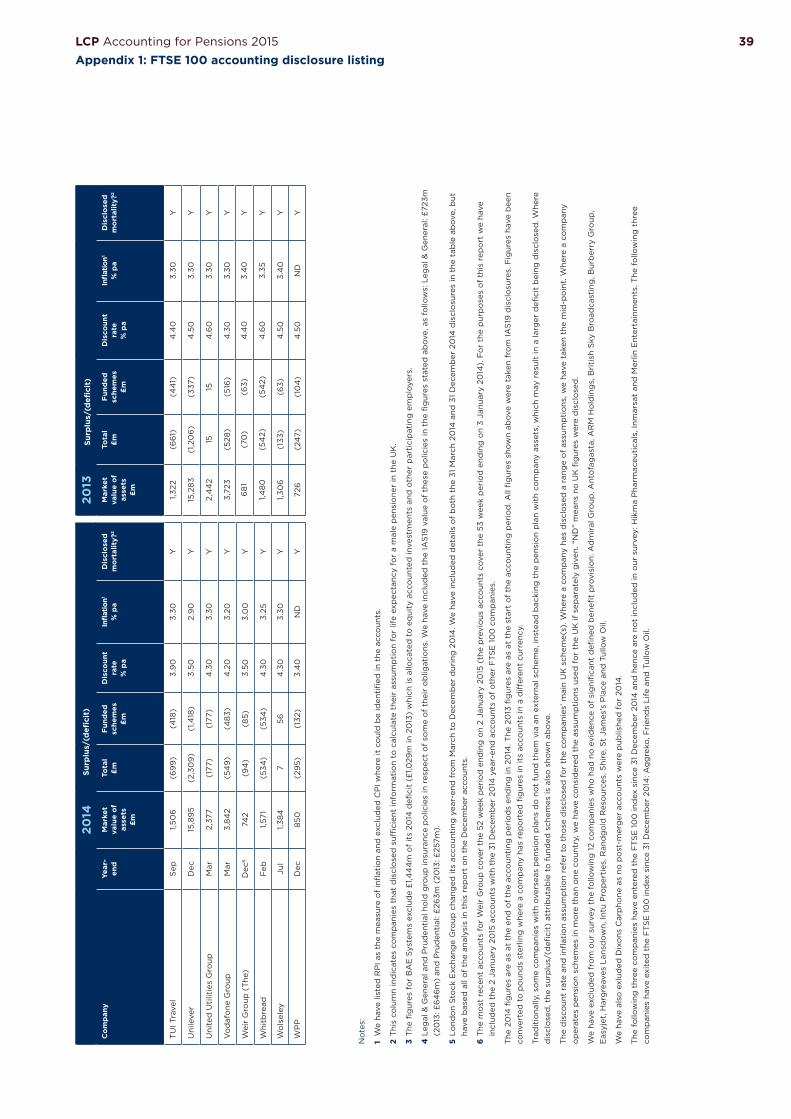
39
No
tes:
1 W
e ha
ve li
sted
RP
I as
the
mea
sure
of
infl
atio
n an
d e
xclu
ded
CP
I whe
re it
co
uld
be
iden
tifi
ed in
the
acc
oun
ts.
2 T
his
colu
mn
ind
icat
es c
om
pan
ies
that
dis
clo
sed
suffi
cien
t in
form
atio
n to
cal
cula
te t
heir
ass
ump
tio
n fo
r lif
e ex
pec
tanc
y fo
r a
mal
e p
ensi
one
r in
the
UK
.
3 T
he fi
gur
es f
or
BA
E S
yste
ms
excl
ude
£1,4
44
m o
f it
s 20
14 d
efici
t (£
1,029
m in
20
13)
whi
ch is
allo
cate
d t
o e
qui
ty a
cco
unte
d in
vest
men
ts a
nd o
ther
par
tici
pat
ing
em
plo
yers
.
4 L
egal
& G
ener
al a
nd P
rud
enti
al h
old
gro
up in
sura
nce
po
licie
s in
res
pec
t o
f so
me
of
thei
r o
blig
atio
ns. W
e ha
ve in
clud
ed t
he IA
S19
val
ue o
f th
ese
po
licie
s in
the
fig
ures
sta
ted
ab
ove,
as
follo
ws:
Leg
al &
Gen
eral
: £72
3m
(20
13: £
64
6m
) an
d P
rud
enti
al: £
263m
(20
13: £
257m
).
5 Lo
ndo
n S
tock
Exc
hang
e G
roup
cha
nged
its
acco
unti
ng y
ear-
end
fro
m M
arch
to
Dec
emb
er d
urin
g 2
014
. We
have
incl
uded
det
ails
of
bo
th t
he 3
1 M
arch
20
14 a
nd 3
1 D
ecem
ber
20
14 d
iscl
osu
res
in t
he t
able
ab
ove,
but
ha
ve b
ased
all
of
the
anal
ysis
in t
his
rep
ort
on
the
Dec
emb
er a
cco
unts
.
6 T
he m
ost
rec
ent
acco
unts
fo
r W
eir
Gro
up c
over
the
52
wee
k p
erio
d e
ndin
g o
n 2
Janu
ary
2015
(th
e p
revi
ous
acc
oun
ts c
over
the
53
wee
k p
erio
d e
ndin
g o
n 3
Janu
ary
2014
). F
or
the
pur
po
ses
of
this
rep
ort
we
have
in
clud
ed t
he 2
Jan
uary
20
15 a
cco
unts
wit
h th
e 31
Dec
emb
er 2
014
yea
r-en
d a
cco
unts
of
oth
er F
TS
E 1
00
co
mp
anie
s.
The
20
14 fi
gur
es a
re a
s at
the
end
of
the
acco
unti
ng p
erio
ds
end
ing
in 2
014
. The
20
13 fi
gur
es a
re a
s at
the
sta
rt o
f th
e ac
coun
ting
per
iod
. All
fig
ures
sho
wn
abov
e w
ere
take
n fr
om
IAS
19 d
iscl
osu
res.
Fig
ures
hav
e b
een
conv
erte
d t
o p
oun
ds
ster
ling
whe
re a
co
mp
any
has
rep
ort
ed fi
gur
es in
its
acco
unts
in a
diff
eren
t cu
rren
cy.
Trad
itio
nally
, so
me
com
pan
ies
wit
h ov
erse
as p
ensi
on
pla
ns d
o n
ot
fund
the
m v
ia a
n ex
tern
al s
chem
e, in
stea
d b
acki
ng t
he p
ensi
on
pla
n w
ith
com
pan
y as
sets
, whi
ch m
ay r
esul
t in
a la
rger
defi
cit
bei
ng d
iscl
ose
d. W
here
d
iscl
ose
d, t
he s
urp
lus/
(defi
cit)
att
rib
utab
le t
o f
und
ed s
chem
es is
als
o s
how
n ab
ove.
The
dis
coun
t ra
te a
nd in
flat
ion
assu
mp
tio
n re
fer
to t
hose
dis
clo
sed
fo
r th
e co
mp
anie
s’ m
ain
UK
sch
eme(
s). W
here
a c
om
pan
y ha
s d
iscl
ose
d a
ran
ge
of
assu
mp
tio
ns, w
e ha
ve t
aken
the
mid
-po
int.
Whe
re a
co
mp
any
op
erat
es p
ensi
on
sche
mes
in m
ore
tha
n o
ne c
oun
try,
we
have
co
nsid
ered
the
ass
ump
tio
ns u
sed
fo
r th
e U
K if
sep
arat
ely
giv
en. “
ND
” m
eans
no
UK
fig
ures
wer
e d
iscl
ose
d.
We
have
exc
lud
ed f
rom
our
sur
vey
the
follo
win
g 1
2 co
mp
anie
s w
ho h
ad n
o e
vid
ence
of
sig
nifi
cant
defi
ned
ben
efit
pro
visi
on:
Ad
mir
al G
roup
, Ant
ofa
gas
ta, A
RM
Ho
ldin
gs,
Bri
tish
Sky
Bro
adca
stin
g, B
urb
erry
Gro
up,
Eas
yjet
, Har
gre
aves
Lan
sdo
wn,
Intu
Pro
per
ties
, Ran
dg
old
Res
our
ces,
Shi
re, S
t Ja
mes
's P
lace
and
Tul
low
Oil.
We
have
als
o e
xlud
ed D
ixo
ns C
arp
hone
as
no p
ost
-mer
ger
acc
oun
ts w
ere
pub
lishe
d f
or
2014
.
The
fo
llow
ing
thr
ee c
om
pan
ies
have
ent
ered
the
FT
SE
10
0 in
dex
sin
ce 3
1 D
ecem
ber
20
14 a
nd h
ence
are
no
t in
clud
ed in
our
sur
vey:
Hik
ma
Pha
rmac
euti
cals
, Inm
arsa
t an
d M
erlin
Ent
erta
inm
ents
. The
fo
llow
ing
thr
ee
com
pan
ies
have
exi
ted
the
FT
SE
10
0 in
dex
sin
ce 3
1 D
ecem
ber
20
14: A
gg
reko
, Fri
end
s Li
fe a
nd T
ullo
w O
il.
2014
Surp
lus/
(defi
cit)
Co
mp
any
Year
-en
dM
arke
t va
lue
of
asse
ts
£m
Tota
l£m
Fund
ed
sche
mes
£m
Dis
coun
t ra
te%
pa
Infla
tion1
% p
aD
iscl
ose
d
mo
rtal
ity?
2
TU
I Tra
vel
Sep
1,50
6(6
99
)(4
18)
3.9
03.
30Y
Uni
leve
rD
ec15
,89
5(2
,30
9)
(1,4
18)
3.50
2.9
0Y
Uni
ted
Uti
litie
s G
roup
Mar
2,37
7(1
77)
(177
)4
.30
3.30
Y
Vo
daf
one
Gro
upM
ar3,
84
2(5
49
)(4
83)
4.2
03.
20Y
Wei
r G
roup
(T
he)
Dec
674
2(9
4)
(85)
3.50
3.0
0Y
Whi
tbre
adF
eb1,5
71(5
34)
(534
)4
.30
3.25
Y
Wo
lsel
eyJu
l1,3
84
756
4.3
03.
30Y
WP
PD
ec8
50(2
95)
(132
)3.
40
ND
Y
2013
Surp
lus/
(defi
cit)
Mar
ket
valu
e o
f as
sets
£m
Tota
l£m
Fund
ed
sche
mes
£m
Dis
coun
t ra
te%
pa
Infla
tion1
% p
aD
iscl
ose
d
mo
rtal
ity?
2
1,322
(66
1)(4
41)
4.4
03.
30Y
15,2
83
(1,2
06
)(3
37)
4.5
03.
30Y
2,4
42
1515
4.6
03.
30Y
3,72
3(5
28)
(516
)4
.30
3.30
Y
68
1(7
0)
(63)
4.4
03.
40
Y
1,48
0(5
42)
(54
2)4
.60
3.35
Y
1,30
6(1
33)
(63)
4.5
03.
40
Y
726
(24
7)(1
04
)4
.50
ND
Y
LCP Accounting for Pensions 2015
Appendix 1: FTSE 100 accounting disclosure listing

40
These tables show the key results of analysis of the disclosures made by the companies in the
FTSE 100 as at 31 December 2014 that were reported in their 2014 accounts.
The figures relate to the worldwide position of each company (not just the UK disclosure) but
exclude healthcare and defined contribution pension arrangements where possible. The source
of the data is each company's annual report and accounts for the accounting period ending in
2014. The surplus/(deficit) figures are before allowing for deferred tax and before any balance
sheet asset limit has been applied.
Traditionally, some companies with overseas pension schemes do not fund them via an external
scheme, instead backing the pension scheme with company assets, which may result in a larger
deficit being disclosed.
The source of market capitalisation figures is the FTSE All-Share Index Series reports as at the
companies' year-ends (where available).
All figures shown here have been calculated using unrounded numbers. Therefore, some metrics
shown may differ to those calculated using the rounded figures.
Largest liabilities
Company2014
Liabilities £m2013
Liabilities £mRoyal Dutch Shell 62,153 53,914
BT Group 47,135 47,422
Lloyds Banking Group 37,243 33,355
RBS 36,643 31,484
BP 33,648 29,569
BAE Systems¹ 30,506 25,943
Barclays 30,203 27,407
HSBC Holdings 27,004 24,483
National Grid 22,914 23,676
International Airlines Group 21,157 19,112
Largest deficits
Company2014
Deficit £m2013
Deficit £mBT Group 7,022 5,856
Royal Dutch Shell 6,739 2,183
BP 5,507 3,486
BAE Systems2 5,387 3,540
Tesco 3,193 2,378
Unilever 2,309 1,206
RBS 2,284 2,996
AstraZeneca 1,870 1,347
GKN 1,711 1,271
GlaxoSmithKline 1,689 613
LCP Accounting for Pensions 2015
Appendix 2: FTSE 100 accounting risk measures
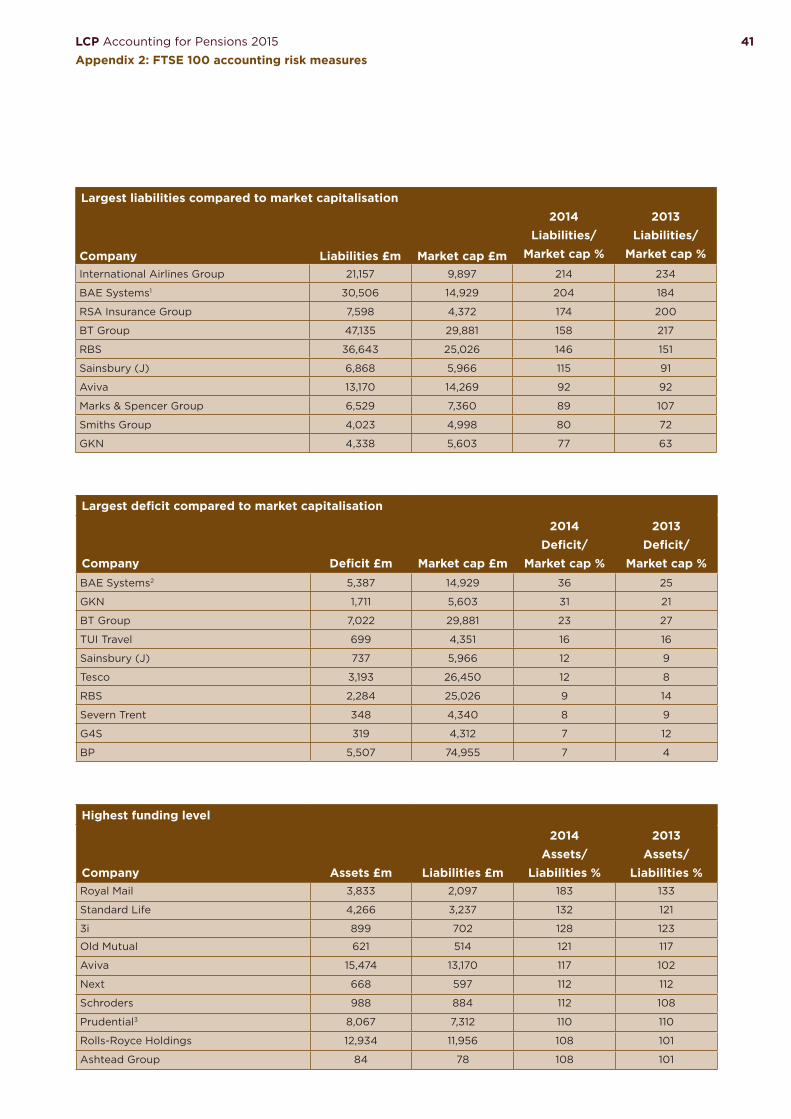
41
Largest liabilities compared to market capitalisation
Company Liabilities £m Market cap £m
2014Liabilities/
Market cap %
2013Liabilities/
Market cap %International Airlines Group 21,157 9,897 214 234
BAE Systems1 30,506 14,929 204 184
RSA Insurance Group 7,598 4,372 174 200
BT Group 47,135 29,881 158 217
RBS 36,643 25,026 146 151
Sainsbury (J) 6,868 5,966 115 91
Aviva 13,170 14,269 92 92
Marks & Spencer Group 6,529 7,360 89 107
Smiths Group 4,023 4,998 80 72
GKN 4,338 5,603 77 63
Largest deficit compared to market capitalisation
Company Deficit £m Market cap £m
2014Deficit/
Market cap %
2013Deficit/
Market cap %BAE Systems2 5,387 14,929 36 25
GKN 1,711 5,603 31 21
BT Group 7,022 29,881 23 27
TUI Travel 699 4,351 16 16
Sainsbury (J) 737 5,966 12 9
Tesco 3,193 26,450 12 8
RBS 2,284 25,026 9 14
Severn Trent 348 4,340 8 9
G4S 319 4,312 7 12
BP 5,507 74,955 7 4
Highest funding level
Company Assets £m Liabilities £m
2014Assets/
Liabilities %
2013Assets/
Liabilities %Royal Mail 3,833 2,097 183 133
Standard Life 4,266 3,237 132 121
3i 899 702 128 123
Old Mutual 621 514 121 117
Aviva 15,474 13,170 117 102
Next 668 597 112 112
Schroders 988 884 112 108
Prudential3 8,067 7,312 110 110
Rolls-Royce Holdings 12,934 11,956 108 101
Ashtead Group 84 78 108 101
LCP Accounting for Pensions 2015
Appendix 2: FTSE 100 accounting risk measures
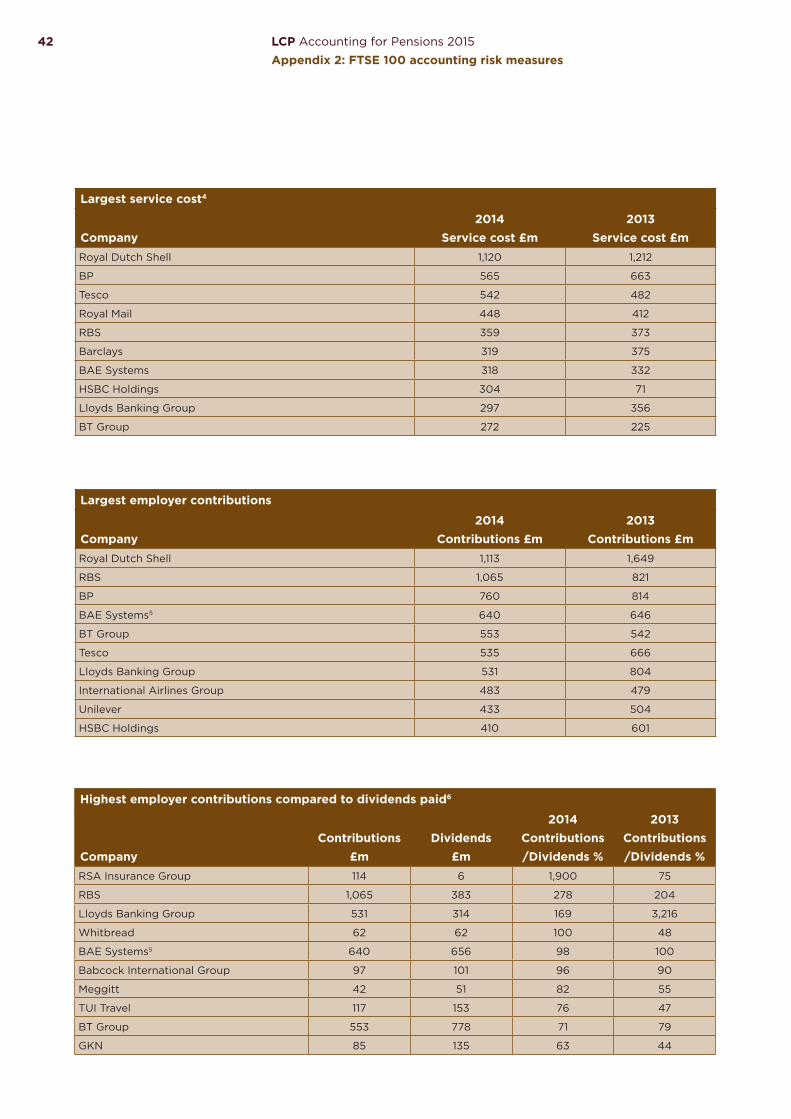
Highest employer contributions compared to dividends paid6
CompanyContributions
£mDividends
£m
2014Contributions /Dividends %
2013Contributions /Dividends %
RSA Insurance Group 114 6 1,900 75
RBS 1,065 383 278 204
Lloyds Banking Group 531 314 169 3,216
Whitbread 62 62 100 48
BAE Systems5 640 656 98 100
Babcock International Group 97 101 96 90
Meggitt 42 51 82 55
TUI Travel 117 153 76 47
BT Group 553 778 71 79
GKN 85 135 63 44
42 LCP Accounting for Pensions 2015
Appendix 2: FTSE 100 accounting risk measures
Largest service cost4
Company2014
Service cost £m2013
Service cost £mRoyal Dutch Shell 1,120 1,212
BP 565 663
Tesco 542 482
Royal Mail 448 412
RBS 359 373
Barclays 319 375
BAE Systems 318 332
HSBC Holdings 304 71
Lloyds Banking Group 297 356
BT Group 272 225
Largest employer contributions
Company2014
Contributions £m2013
Contributions £mRoyal Dutch Shell 1,113 1,649
RBS 1,065 821
BP 760 814
BAE Systems5 640 646
BT Group 553 542
Tesco 535 666
Lloyds Banking Group 531 804
International Airlines Group 483 479
Unilever 433 504
HSBC Holdings 410 601

Largest employer contributions compared to service cost4
CompanyContributions
£mService cost
£m
2014Contributions less service
cost £m
2013Contributions less service
cost £mRBS 1,065 359 706 448
Aviva 391 0 391 145
BAE Systems5 640 318 322 314
International Airlines Group 483 164 318 449
BT Group 553 272 281 317
National Grid 409 150 259 289
Sainsbury (J) 127 -124 251 78
Lloyds Banking Group 531 297 234 448
Unilever 433 209 224 324
Imperial Tobacco Group 116 -72 188 48
Highest equity allocation
Company
2014Equity allocation %
2013Equity allocation %
Ashtead Group 70 67
Whitbread 60 59
Wolseley 59 66
Tesco 54 56
GlaxoSmithKline 53 53
BP 53 66
Travis Perkins 52 55
Next 51 49
Barratt Developments 48 47
Royal Dutch Shell 48 45
43LCP Accounting for Pensions 2015
Appendix 2: FTSE 100 accounting risk measures
1 The figures for BAE Systems include all liabilities of the multi-employer plans that the group participates in.
2 The figures for BAE Systems exclude £1,444m of its 2014 deficit (£1,029m in 2013) which is allocated to equity accounted investments
and other participating employers.
3 Prudential holds group insurance policies in respect of some of its obligations. We have included the value of these policies in the asset
figure stated above, which was £263m for 2014 (2013: £257m).
4 The service cost (representing the value of benefits earned over the accounting period) includes any curtailments and the value of any
past service benefits awarded to members during the year.
5 The figures for BAE Systems do not include contributions by the employer in respect of employee salary sacrifice arrangements.
6 International Airlines Group, Royal Mail and Sports Direct did not pay a dividend during their 2013 or 2014 accounting years, but contributed
£483m (2013: £503m), £407m (2013: £435m) and £3m (2013: £3m) to their pension schemes respectively.

LCP Accounting for Pensions 2015
Bob Scott
+44 (0)20 7439 2266
Nick Bunch
+44 (0)20 7439 2266
UK
c0
815
/08
15
All rights to this document are reserved to Lane Clark & Peacock LLP (“LCP”). This document may be reproduced in whole or in part, provided prominent acknowledgement of the source is given.
We accept no liability to anyone to whom this document has been provided (with or without our consent). Lane Clark & Peacock LLP is a limited liability partnership registered in England and Wales
with registered number OC301436. LCP is a registered trademark in the UK (Regd. TM No 2315442) and in the EU (Regd. TM No 002935583). All partners are members of Lane Clark & Peacock LLP.
A list of members’ names is available for inspection at 95 Wigmore Street, London W1U 1DQ, the firm’s principal place of business and registered office. The firm is regulated by the Institute and
Faculty of Actuaries in respect of a range of investment business activities. The firm is not authorised under the Financial Services and Markets Act 2000 but we are able in certain circumstances
to offer a limited range of investment services to clients because we are licensed by the Institute and Faculty of Actuaries. We can provide these investment services if they are an incidental part of
the professional services we have been engaged to provide. Lane Clark & Peacock UAE operates under legal name “Lane Clark & Peacock Belgium – Abu Dhabi, Foreign Branch of Belgium”. © Lane
Clark & Peacock LLP 2015.
Lane Clark & Peacock LLP
London, UK
Tel: +44 (0)20 7439 2266
Lane Clark & Peacock LLP
Winchester, UK
Tel: +44 (0)1962 870060
Lane Clark & Peacock Belgium CVBA
Brussels, Belgium
Tel: +32 (0)2 761 45 45
Lane Clark & Peacock Ireland Limited
Dublin, Ireland
Tel: +353 (0)1 614 43 93
Lane Clark & Peacock UAE
Abu Dhabi, UAE
Tel: +971 (0)2 658 7671
Lane Clark & Peacock Netherlands B.V.
Utrecht, Netherlands
Tel: +31 (0)30 256 76 30
LCP is a firm of financial, actuarial and business consultants, specialising in the areas of pensions, investment,
insurance and business analytics.
Related Documents