The Myth of the Missing White Voters: Pennsylvania – Tombstone State for The Theory February 3, 2014 By Steven M. Kamp 1 Did Mitt Romney lose because white voters stayed home? Not in Pennsylvania, even though the rightwing psepho- commentariat thinks so now that Real Clear Politics Senior Elections Analyst Sean Trende 2 has created The Missing White 1 Sacramento attorney Steven M. Kamp, a graduate of Yale Law School (1981) and the University of California at Los Angeles (1978), and a veteran of Democratic campaigns in multiple states back to 1972, is nearing completion of The New Democratic Majority, a book analyzing American voting patterns between 1788 and 2012 for President, Congress, Governors, state downballot offices, state legislatures and ballot propositions. Mr. Kamp can be reached at [email protected] Mr. Kamp has written the California election law manual for the California Democratic Party since 1988 and similar manuals for Nevada and Kentucky in 2008-2012. The author thanks Patrick Reddy, Scott Rafferty, Harold Kwalwasser, and James Shoch for their editorial assistance. Maps and election return data used with permission of David Leip and the U.S. Election Atlas website, "Dave Leip's Atlas of U.S. Presidential Elections" http://uselectionatlas.org 2 The author sent an essentially identical October 21 version of this article to Mr. Trende via read-receipt electronic mail message on October 23, 2013, but as of December 6, 2013, has not received a response. In a September 4, 2013 electronic mail message, Mr. Trende promised to respond to the author regarding the Ohio article in this series, but “not for several weeks.” As of December 6, 2013, no response has been received. This article is one in an Electoral College Junket series, starting with Ohio, followed by Virginia, Pennsylvania, New Hampshire, Maine’s Second Congressional District, Iowa, Wisconsin, Minnesota, Michigan, New 1

Welcome message from author
This document is posted to help you gain knowledge. Please leave a comment to let me know what you think about it! Share it to your friends and learn new things together.
Transcript
The Myth of the Missing White Voters:
Pennsylvania – Tombstone State for The Theory
February 3, 2014
By Steven M. Kamp1
Did Mitt Romney lose because white voters stayed home?
Not in Pennsylvania, even though the rightwing psepho-
commentariat thinks so now that Real Clear Politics Senior
Elections Analyst Sean Trende2 has created The Missing White1 Sacramento attorney Steven M. Kamp, a graduate of Yale Law School (1981) and the University of California at Los Angeles (1978), and a veteran of Democratic campaigns in multiple states back to 1972, is nearing completion of The New Democratic Majority, a book analyzing American voting patterns between 1788 and 2012 for President, Congress, Governors, state downballot offices, state legislatures and ballot propositions. Mr. Kamp can be reached at [email protected]
Mr. Kamp has written the California election law manual for the California Democratic Party since 1988 and similar manuals for Nevada and Kentucky in 2008-2012.
The author thanks Patrick Reddy, Scott Rafferty, Harold Kwalwasser, and James Shoch for their editorial assistance.
Maps and election return data used with permission of David Leip and theU.S. Election Atlas website, "Dave Leip's Atlas of U.S. Presidential Elections"http://uselectionatlas.org
2 The author sent an essentially identical October 21 version of this article to Mr. Trende via read-receipt electronic mail message on October 23, 2013, but as of December 6, 2013, has not received a response. In a September 4, 2013 electronic mail message, Mr. Trende promised to respond to the author regarding the Ohio article in this series, but “not for several weeks.” As of December 6, 2013, no response has been received.
This article is one in an Electoral College Junket series, starting withOhio, followed by Virginia, Pennsylvania, New Hampshire, Maine’s Second Congressional District, Iowa, Wisconsin, Minnesota, Michigan, New
1
Voter Theory. The Theory has spawned a debate that even
became a cover story in The Week.3 Trouble is, the Theory is
not based on actual registered voters and actual voting, but
rather on a Census estimate that has both overestimated and
underestimated actual registration and voting, both
nationally and in Ohio, Virginia, and Pennsylvania, three
states essential to Republican White House hopes in 2016 and
2020. This author has already explained why the Missing
White Voter Theory will not flip the static-population state
of Ohio and the Dynamic Dominion of Virginia into the
Republican column.4 This article will now explain why the
Missing White Voter Theory will not flip the commonwealth or
Keystone State of Pennsylvania – instead, Pennsylvania is
the Tombstone State for The Theory.
One reason: the President Obama 2012 margin in
Pennsylvania is 309,840, and the increase in the number of
actual registered nonvoters in the entire Commonwealth of
Pennsylvania between 2004 and 2012 is 114,138 – 61,232 in
the 43 Rural Pennsylvania counties and 52,906 in the 24
Mexico, Nevada, Colorado, Florida, North Carolina, Georgia, Arizona, Indiana and Missouri. 3 July 26, 2013, page 16, “Talking Points -- Immigration: Can the GOP win as the White Party?”, and front cover. 4 “The Myth of the Missing White Voters: In Ohio, Not Registered and Not Voting –While Columbus Rocks for the Democrats.”
“The Myth of the Missing White Voters: Virginia Is For Lovers, Not Missing White Voters”
2
Metropolitan Pennsylvania counties.5 In other words, 100
percent of the registered nonvoter increase between 2004 and
2012 in all of Pennsylvania could turn out in 2016 and vote
Republican, and the Democrat is still ahead by 195,702.
Reason two: the 55 percent turnout rate used by Sean
Trende applied to the 2012 Rural Pennsylvania registered
2012 nonvoter number of 759,964 adds at most only 417,980
new actual voters in Rural Pennsylvania -- the 2016
Republican nominee would need a 100 percent turnout of
voters who have sat out most previous elections and net 87
percent of them to trump the Obama 2012 margin of 309,840, by
all of 7,826 raw votes, and would fall short of the 2008
Obama margin of 620,478 by 202,498 even if the Republican
won 100 percent.
5 It might be 156,445, based on the “Voter Turnout – Presidential Elections” chart on the Pennsylvania Department of State website (www.dos.state.pa.us), as adjusted to reflect 2012 write-in votes onthe David Leip U.S. Election Atlas website counted by the counties but not by the state:
2004 Registered: 8,366,6632004 Pres. Vote: 5,769,5902004 Registered nonvoters: 2,597,073
2012 Registered: 8,508,0152012 Pres. Vote: 5,754,857 (Penna. DOS website 5,753,670 plus 1,187 write-ins).2012 Registered nonvoters: 2,753,158
Registered nonvoter increase from 2004 to 2012: 156,085. This number misses the 2012 Obama margin of 309,840 by 153,755.
3
Reason three: commonwealth-wide, between 2004 and 2012
the Democratic Presidential raw vote number in Pennsylvania
increased by 52,179, whereas the Republican number fell by
113,413, -- from a President Bush the Younger raw number that
was already 144,248 behind John Kerry, in the closest
Republican Presidential performance in Pennsylvania since
1988, the last time a Republican Presidential candidate
carried Pennsylvania. Moreover, the 2004 Pennsylvania
Republican raw number of 2,793,847 is the highest Republican
Presidential raw number in Pennsylvania history, ahead of
its’ nearest competitor, President Nixon 1972 (2,714,521) by
79,326, and achieved from a total vote that was well ahead
of 1972 – 5,769,590 versus 4,592,105. As a result, between
2004 and 2012, the Democratic margin from John Kerry to
President Obama rose by 165,592, even after the margin in
2012 fell from the 2008 post-1964 record number of 620,478
by 310,638. This eight-year Democratic margin gain of
165,592 exceeds any actual registered “missing white voter”
number from Rural Pennsylvania. If these trends hold up in
2016 and 2020, Pennsylvania will serve as the Keystone
Commonwealth of the Democratic Blue Wall of 257 electoral
votes6, insuring Democrats will win the Electoral College by
adding the 13 electoral votes from Virginia, or 18 from
6 20 from Pennsylvania, 226 from the other John Kerry 2004 jurisdictions, 6 from Iowa and 5 from New Mexico.
4
Ohio, or 29 from Florida, or 15 from the combination of
Colorado and Nevada.
Reason four: in the partisan-registration Commonwealth
of Pennsylvania, there are three times as many 2012
registered nonvoting Democrats as there are 2012 registered
nonvoting Republicans. If there are missing voters in
Pennsylvania, they are more likely to be registered
nonvoting Democrats in Philadelphia or Allegheny County.
Thus, because The Missing White Voter Theory does not
work in Pennsylvania – the largest Blue Wall state seriously
targeted by Republican campaigns in 2000, 2004, 2008 and
2012 -- it does not matter in 2016 or 20207 -- except as a
secret Democratic black propaganda effort to divert
Republican resources (and this author knows nothing).
The Missing White Voter Theory: It Started With Non-Final Ohio Returns
That Did Not Include Provisional Ballots
Two days after Election Night, Real Clear Politics Senior
Elections Analyst Sean Trende, extrapolating from non-final
Ohio numbers8, opined that Romney lost the national popular 7 In the next articles in this “Electoral College Junket” series, the author will analyze New Hampshire, Iowa, Wisconsin, Minnesota, Michigan,New Mexico, Nevada, Colorado and Florida, then North Carolina, Georgia, Arizona, Missouri and Montana.
8 That did not include the 173,765 ultimately counted provisional ballots. Under Ohio law, absentees are counted first, followed by the machine ballots, but the counting of the provisionals does not begin
5
vote because (nationwide) 6.5 million Caucasian Republican
eligible voters “stayed home,” including allegedly enough
rural 2004 or 2008 Republican voters to give Ohio to Obama.9
The Trende theory began in Ohio, and likely ends in
Pennsylvania somewhere on Interstate 80 between West
Middlesex and East Stroudsburg. Caucasian turnout may have
been down, but not in the magnitude Trende claims – and not
by enough to alter the Pennsylvania result, and with
Pennsylvania, followed by Virginia, went any Republican
hopes for the Electoral College. The “Missing White Voter”
route has become the proverbial yellow- or red-bricked road
for the rightwing commentariat and blogosphere. However,
The Missing White Voter Theory is more of a long dead end
road rather than a through street to victory for the
Republicans, because:
It is not based on actual registered voters or actual
voting, but on a post-election Census survey that in
2004, 2008 and 2012, did not come close to matching the
actual registered or voting population, nationally, in
Pennsylvania, or in the swing states of Ohio or
Virginia.
In Pennsylvania – along with New Hampshire, the easiest
Blue Wall state for Republicans to win -- even using
until ten days after Election Day.
9 Sean Trende, Real Clear Politics, November 8, 2012, “The Case of the Missing White Voters.”
6
the Trende linchpin Census survey estimates of the
unregistered and registered nonvoters, Republican
cannot defeat the 2008 Obama margin and can top the
2012 margin except with 100 percent turnout and a
Republican percentage of 66 percent throughout the
commonwealth. At the 55 percent turnout rate used by
Trende, 2008 cannot be topped, and 2012 is topped only
at 79 percent Republican.
In the 2004, 2008 and 2012 Presidential year elections,
between 2.5 and 2.7 million actual registered
Pennsylvania voters stayed home, and it is highly
unlikely that Caucasian solidarity appeals will
stimulate a sufficiently large Republican turnout from
this constituency that has regularly registered and failed to
vote.
Between 2004 and 2012, the number of actual registered
nonvoters in the entire commonwealth of Pennsylvania
rose by only 114,138, a number that underperforms both
Obama margins – against 2012 by 195,702, and against
2008 by a whopping 506,340.
The number of actual registered 2012 nonvoters in the 43
Rural Pennsylvania counties is 759,964, and applying
the 55 percent nonvoter turnout rate used by Trende to
this number results in a number (417,980) that facially
underperforms the Obama 2008 margin of 620,478 and
7
overperforms the augmented Obama 2012 margin of 309,840
only at a Republican percentage of 87 percent.10
Of the 759,964 actual registered 2012 nonvoters in the
43 Rural Pennsylvania counties, 698,732 did not vote in
the 2004 Bush election, meaning that between 2004 and 2012,
the registered nonvoter population in Rural
Pennsylvania increased by only 61,232. In other words, 91.94
percent of the actual “missing” registered Rural Pennsylvania nonvoters in
2012 were missing in 2004 as well.
If the reach of The Theory is expanded to the
unregistered population, the Census estimates show that
the commonwealth-wide gap between the 2012 Census-
estimated citizen-eligible population and the actual
2012 total registration is only 944,000, which defeats
the 2008 Obama margin only at 100 percent turnout that
breaks 82 percent Republican, and defeats 2012 only at
100 percent turnout that breaks 66 percent Republican.
At the 55 percent turnout rate used by Trende, only
519,200 new voters are turned out, which falls short of
the 2008 Obama margin and defeats 2012 only at 79
percent Republican. In addition, these voters have to
be registered first, if they even exist.
The total number of actual net lost Republican votes
between 2004 and 2012 in the 43 Rural Pennsylvania 10 55 % of 2012 nonvoting 759,964 = 417,980. 2% Other = 8,359. 11% Dem. = 45,977. 87% Rep. = 363,642 minus 45,977 = net Rep. + 317,665trumps Obama 2012 309,840 by a raw 7,825.
8
counties is a gross net 40,319, offset by the
Democratic loss of a net 6,025, which works out to a
Republican margin loss of 34,294, which is less than 12
percent of the 2012 Obama margin of 309,840.
Between 2004 and 2012 in Rural Pennsylvania, Democrats
actually lost fewer net raw votes than the Republicans
– 6,025 versus 40,319.
The number of 2012 actual registered nonvoters in the 24
Metropolitan Pennsylvania counties is much larger
(1,993,493) and in these dynamic and diverse population
areas (Philadelphia, the Philadelphia Suburban Quartet,
Eastern Pennsylvania, Democratic Western Pennsylvania),
even with an offset from the five Republican suburban
Pittsburgh counties, Democrats between 2004 and 2012
gained 58,204 raw votes, whereas Republicans lost 73,994
raw votes; not surprisingly, in the 24 Metropolitan
Pennsylvania counties, the highest Romney percentage is
the 59.68% in rural-exurban Wayne County (Honesdale) on
the New York border, which produced a margin of 4,500,
and the highest large-population county Romney
percentages are the plurality percentages in the one
Philadelphia suburban county carried by Romney [Chester
County (49.43%)] and in Berks County (Reading, 49.23%).
These three, plus the Romney majority wins of
Schuylkill (Pottsville), Carbon (Jim Thorpe) and Pike
(Milford), produced a combined Romney margin of 18,952,
9
less than four percent of the Obama margin from
Philadelphia (492,339), and well below the Obama
margins from suburban Montgomery County (58,975) or
Delaware County (60,939). It is highly unlikely that
the nonvoting 1,993,493 is a pool of 2016 Republican
votes.
Before diving deeper into actual Pennsylvania
registration and voting statistics, let’s discuss The
Missing White Voter Theory. The Missing White Voter Theory
has been grasped by Republicans to avoid facing the
implications of what actually happened in 2008 and 2012:
back-to-back popular vote and Electoral College majorities
by a Democrat from a national total vote that was 6.921
million larger than the total vote in the 2004 reelection of
President Bush the Younger, and that flipped a net seven
states and 115 electoral votes between 2004 and 2012.
Moreover, the Democratic President was reelected amid the
worst Democratic incumbent economic environment since Jimmy
Carter in 1980, the outgoing Woodrow Wilson administration
in 1920, and the second Grover Cleveland administration in
1896, with numbers that caused two economic determinist
modelers to predict only 46 or 49 percent for Obama11, an
11 The Professor Ray C. Fair Model in Fair, Predicting Presidential Elections (Stanford University Press, 2002), and available for 2004-2008-2012 at www.fairmodel.yale.edu, and the Professor Douglas Hibbs Bread and Peace Model, available at www.douglas-hibbs.com
10
economic determinist electoral vote model to predict Romney
with 33012, Almanac of American Politics founder Michael Barone to
intone Romney 315 because of “fundamentals” -- and don’t
forget Peggy Noonan and her vibrating Northwest D.C. yard
signs. Horror of horrors, 2008 may have been a realigning
election, and 2012 a confirming election . . . for the
Democrats.
President Obama’s reelection triggered a rampage of
rage on the Republican right, but the one rational response
came from Almanac of American Politics 2014 co-author Sean Trende,
whose review of non-final Ohio returns two days after the
election started him on the road to a 2013 conclusion that
6.5 million eligible Caucasian voters skipped the election.
The Missing White Voter Theory is based on the contrast
between Census estimates of eligible Non-Hispanic White (NHW)
registration and turnout for 2008 and 2012 and the Census
estimate of the actual 2012 vote – based on the Census estimates
and using a 55 percent turnout rate for nonvoting eligibles.
Sean Trende did not distinguish between unregistered and
registered nonvoters; instead, he conflated and continues to
conflate the two categories.13
12 Created by two University of Colorado professors who shall remain nameless, and who looked only at state-level economic data and ignored electoral history and everything else. The predicted Romney 330 included Minnesota.
13 In contrast, The Emerging Republican Majority author Kevin Phillips in 1972 debunked the McGovern “youth vote” theory with a three-step sequential analysis of registration, turnout and percentage breakdown:
11
. Mr. Trende concluded that a national 6.5 million
eligible Caucasian voters did not vote in 2012, and
Republican opponents of immigration reform and minority
outreach14 seized upon The Theory as justification for
doubling down on the Republican obstructionism displayed in
the 2011 Debt Ceiling and 2013 Fiscal Cliff debacles and
again on display in the Republican Government Shutdown
Temper Tantrum of Twenty-Thirteen.15 The Trende series was
(according to Trende) purposely vague on policy, but
appeared to urge Republican “libertarian populist” appeals
to downscale Caucasian voters turned off by the Bain Capital
persona and reality of Mitt Romney, although in this
author’s opinion, any actual proposals will amount to little“Some 70 to 80 percent of the 18-24 year-olds will register. Of these, 70 to 80 per cent will actually vote. Thus, 49 per cent to 64 percent of those eligible will actually make it to the polls. Assume 60 percent (the national average) – or 15 million votes. Of these, McGovern will get 55 to 65 percent (8.25 to 9.75 million) and Richard Nixon will get 35-45 percent (5.25 to 6.75 million). By these calculations, then, the McGovern youth lead will range from 1.5 million to a very improbable 4.5 million”
which Phillips predicted (correctly) would be swamped by George Wallace voters and 1968 Humphrey voters switching to Nixon.
New York Times Magazine, August 6, 1972, “Why Nixon Will Win” (Kevin Phillips), pages 33-34.
14 Note that Sean Trende does not oppose either immigration reform or Republican minority outreach; see his June 21, 2013 and subsequent Real Clear Politics articles.
15 Which Sean Trende does not favor. In multiple Tweets available at “Sean Trende Twitter”, Mr. Trende expressly states the government shutdown plan had “no upside” for the Republicans, but he also stated that he did not see it having a major negative electoral impact on Republicans in the House or Senate.
12
more than faux-populist flapdoodle. The electoral role model
for The Missing White Voter Theory appears to be Minnesota
Governor Tim Pawlenty, who before becoming a financial
services lobbyist was twice elected Governor of Minnesota –
but with percentages of 44.37 and 46.69 in three-way
engagements where the Jesse Ventura Independence Party
achieved 16.18 and 6.43 percentage points -- but where the
Democrats were held to 36.46 and 45.73. Pennsylvania 2010
Republican Governor Tom Corbett might also serve as a role
model – too bad he made Jerry Sandusky his role model.
Pennsylvania 1994 Class I U.S. Senator Rick Santorum likely
sees himself as a role model, except that he lost big in
2006. Pennsylvania 2010 Class III U.S. Senator Pat Toomey
probably sees himself as a role model, except that in his
one successful statewide race, he received fewer raw votes
than John Kerry in 2004 Pennsylvania, and in 2016, Admiral
Joe Sestak is waiting aboard the Philadelphia ready to launch a
Presidential year Democratic raw vote margin airdrop that
likely will pass 500,000 and increase the Philadelphia
Democratic raw margin from an off-year 289,985 to a Bob
Casey 480,525, a Barack Obama 492,339, or perhaps even
500,000 – all more than enough to swamp the 80,229 Toomey
commonwealth margin from 2010.
Now for some actual voting numbers. Between 2004 and
2012, the Republican national raw vote fell by a net
13
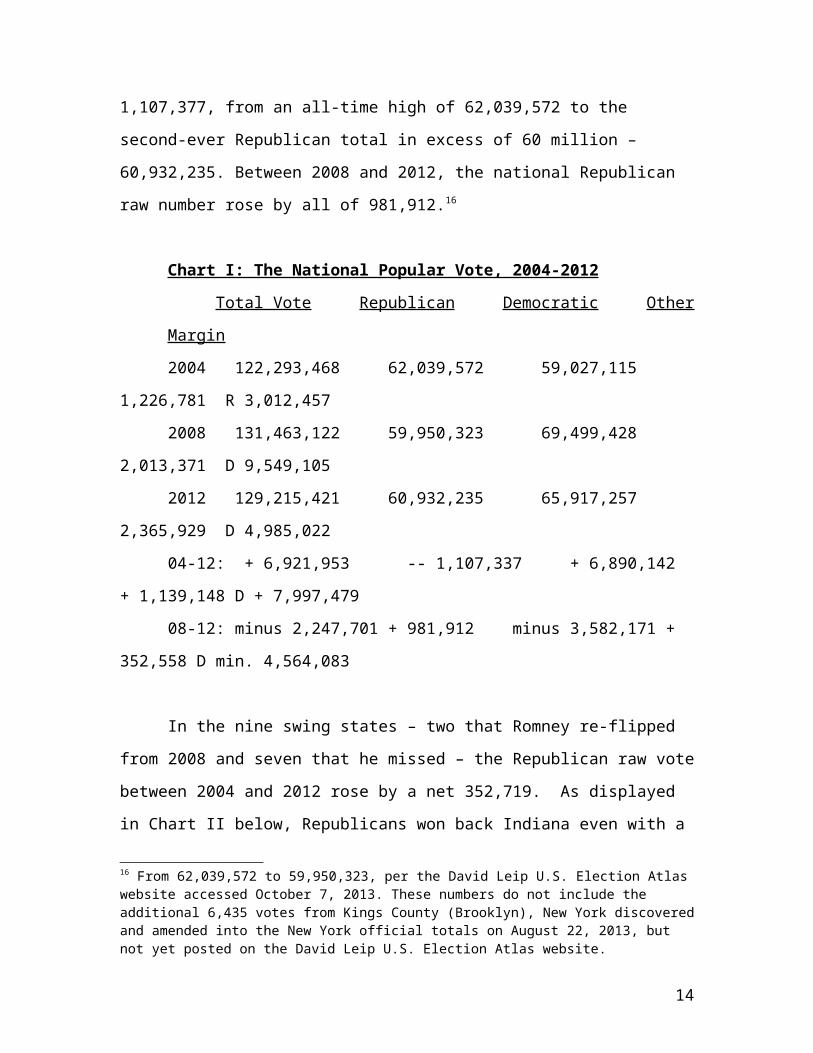
1,107,377, from an all-time high of 62,039,572 to the
second-ever Republican total in excess of 60 million –
60,932,235. Between 2008 and 2012, the national Republican
raw number rose by all of 981,912.16
Chart I: The National Popular Vote, 2004-2012
Total Vote Republican Democratic Other
Margin
2004 122,293,468 62,039,572 59,027,115
1,226,781 R 3,012,457
2008 131,463,122 59,950,323 69,499,428
2,013,371 D 9,549,105
2012 129,215,421 60,932,235 65,917,257
2,365,929 D 4,985,022
04-12: + 6,921,953 -- 1,107,337 + 6,890,142
+ 1,139,148 D + 7,997,479
08-12: minus 2,247,701 + 981,912 minus 3,582,171 +
352,558 D min. 4,564,083
In the nine swing states – two that Romney re-flipped
from 2008 and seven that he missed – the Republican raw vote
between 2004 and 2012 rose by a net 352,719. As displayed
in Chart II below, Republicans won back Indiana even with a
16 From 62,039,572 to 59,950,323, per the David Leip U.S. Election Atlaswebsite accessed October 7, 2013. These numbers do not include the additional 6,435 votes from Kings County (Brooklyn), New York discoveredand amended into the New York official totals on August 22, 2013, but not yet posted on the David Leip U.S. Election Atlas website.
14
vote drop of 58,895 and a Democratic gain of 183,876,
because the Republican base from the Nixon-Bush era was
large enough that it held the Democratic 2008 margin to
28,391, and Democrats in 2012 crashed by 221,152. Same story
in North Carolina: Democratic increase more than double the
Republican increase, but a high enough Bush 2004 number to
hold the 2008 Democratic margin to 14,177. Different story
in New Mexico: Republicans won the state by only 5,988 in
2004, and subsequently lost 41,142 as Democrats gained
44,393. Even worse story in Iowa: Republicans won the state
by only 10,059, then lost 21,340 while Democrats gained
80,646. Horrible story in Ohio: Republicans won the state by
118,601, then lost 198,331 as Democrats gained 86,542. In
Florida, Virginia, Colorado and Nevada, Republicans added a
collective 433,352, but Democrats added a whopping 1,626,849
-- four times the Republican addition. In Virginia,
Democrats added 517,078, more than five times the 105,563
added by the Republicans. Pennsylvania is not on this list
because the last time a Republican carried the Keystone
State for President was in 1988, when Vice President Bush
the Elder achieved 50.70% and a 2.32 percentage point margin
over Mike Dukakis.
Chart II: Swing States 2004 – 2012
State, R 2004 R. 2004-2012 Dem. 2004-2012
2012 Result
15
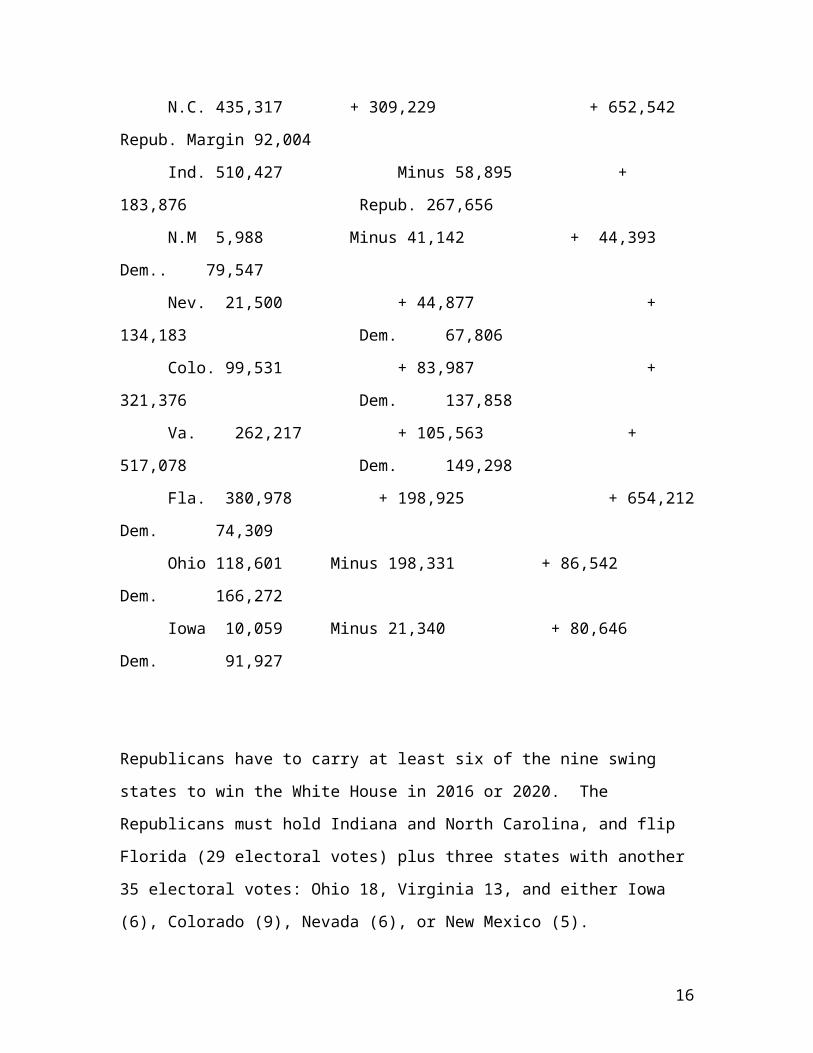
N.C. 435,317 + 309,229 + 652,542
Repub. Margin 92,004
Ind. 510,427 Minus 58,895 +
183,876 Repub. 267,656
N.M 5,988 Minus 41,142 + 44,393
Dem.. 79,547
Nev. 21,500 + 44,877 +
134,183 Dem. 67,806
Colo. 99,531 + 83,987 +
321,376 Dem. 137,858
Va. 262,217 + 105,563 +
517,078 Dem. 149,298
Fla. 380,978 + 198,925 + 654,212
Dem. 74,309
Ohio 118,601 Minus 198,331 + 86,542
Dem. 166,272
Iowa 10,059 Minus 21,340 + 80,646
Dem. 91,927
Republicans have to carry at least six of the nine swing
states to win the White House in 2016 or 2020. The
Republicans must hold Indiana and North Carolina, and flip
Florida (29 electoral votes) plus three states with another
35 electoral votes: Ohio 18, Virginia 13, and either Iowa
(6), Colorado (9), Nevada (6), or New Mexico (5).
16
Alternatively, Republicans must dislodge the equivalent from
the Blue Wall Kerry-Obama states17 that have 246 current
electoral votes; Republicans will talk about flipping New
Hampshire (4), Pennsylvania (20), Wisconsin (10), Michigan
(16), New Jersey (14) and even Minnesota (10), even though
the last year in which any of these states gave a majority
to a non-incumbent Republican was 1988 New Hampshire,
Pennsylvania, Michigan and New Jersey; 1960 Wisconsin, and
1952 Minnesota. However, if Republicans flip Pennsylvania’s
20 electoral votes, the Democratic Blue Wall number drops
from 257 to 237, meaning Democrats need 33 more to win
instead of 13 – meaning Virginia’s 13 is not enough, but
must be added to Florida (29) or a combination netting 20
from Ohio (18) plus Colorado (9) or Nevada (6).18 Just as
the Confederate strategy for winning the military Civil War
of 1861-1865 was taking Gettysburg and Pennsylvania to untie
the United States, the Twenty-first Century Southern
Republican strategy for winning the 2016-2020 et seq.
Electoral College likely involves taking Pennsylvania --
either to crack the Blue Wall or make The Missing White
Voter Theory the Pickett’s Charge of 2016 and 2020.
Pennsylvania 2004-2012: The Perennial Missed Republican Target State
17 Ron Brownstein, National Journal, January 17, 2009, “Dems Find Electoral Safety Behind A Wall Of Blue”
18 Or if Republican 2012 states start moving -- plus North Carolina (15), Georgia (16) or Arizona (11).
17
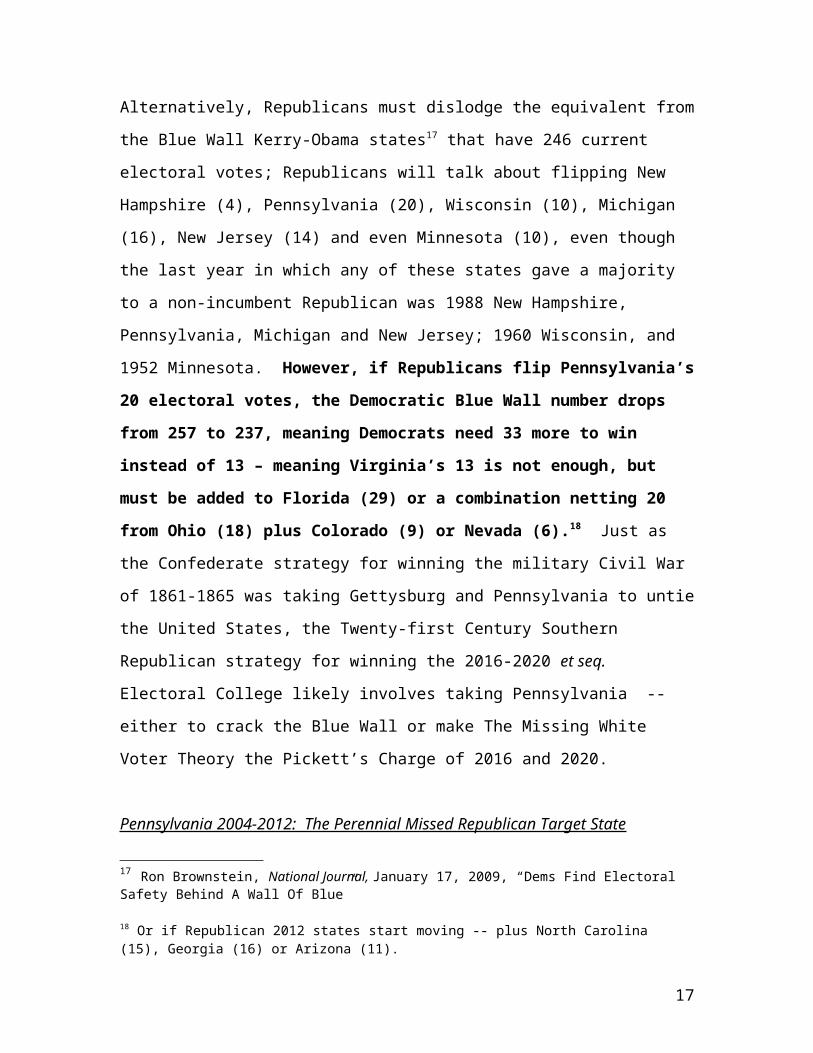
Thus, in addition to Ohio and Virginia, another testing
ground for The Missing White Voter Theory should be actual
registration and voting data from Pennsylvania for the
presidential elections of 2004, 2008 and 2012, with the
focus on the trend between 2004 and 2012.
Chart III: Pennsylvania, 1960 – 2012
Total Pres. Vote Winner All-Vote %, Raw Margin
Non-Phil. Margin
1960: 5,006,541 Dem. Kennedy
51.06% 116,326 R 215,218
1964: 4,822,690 Dem. Pres. LBJ
64.92% 1,457,297 D 1,026,385
1968: 4,747,928 Dem. HHH
47.59% 169,388 (Wal.378,582) R 102,227
1972: 4,592,105 Rep. Pres. Nixon
59.11% 917,570 R 829,930
1976: 4,620,787 Dem. Carter
50.40% 123,073 R 132,506
1980: 4,561,501 Rep. Reagan
49.59% 324,332 (Clark 33,263, Anderson 292,921)
R 147,187
1984: 4,844,903 Rep. Pres. Reagan
53.34% 356,192 R 122,001
1988: 4,536,251 Rep. Bush Elder
50.70% 105,143 R 125,370
18
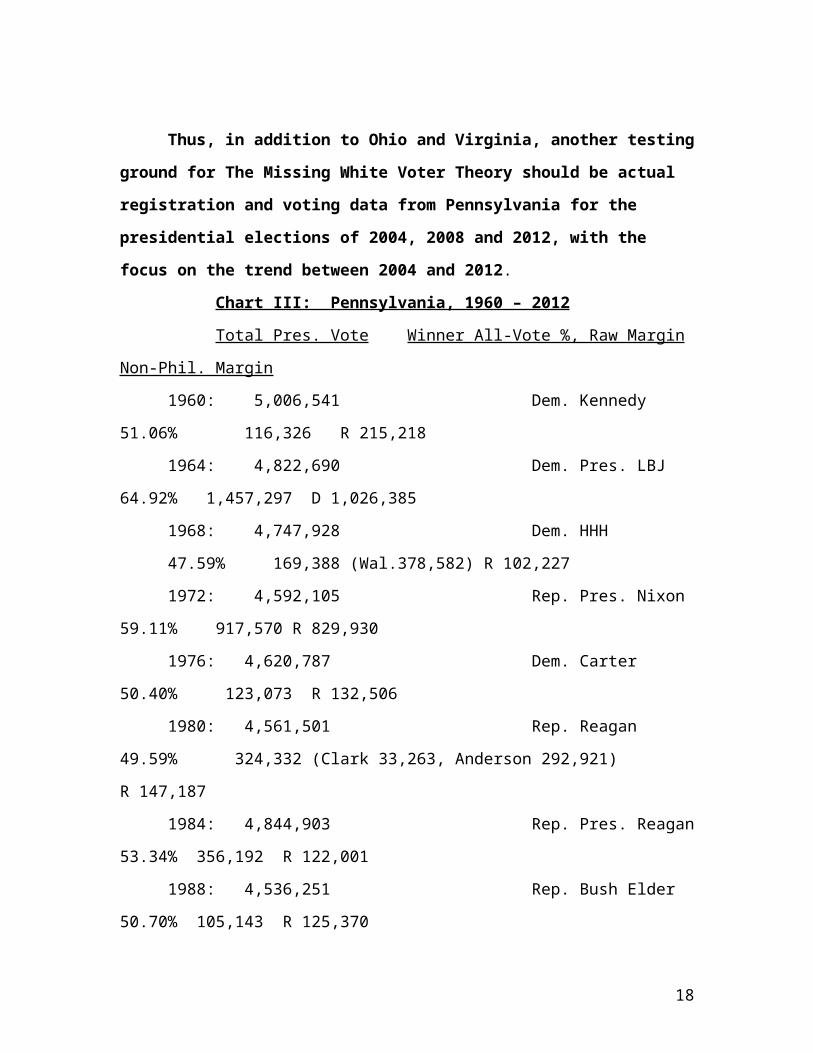
1992: 4,959,810 Dem. Clinton
45.15% 447,323 (Perot 902,667)
D 145,747
1996: 4,506,118 Dem. Pres.
Clinton: 49.17% 414,650 D 87,007
2000: 4,913,119 Dem. Gore:
50.60% 204,840 R 143,383
2004: 5,769,590 Dem. Kerry:
50.92% 144,248 R 267,858
2008: 6,015,476 Dem. Obama
54.47% 620,478 D 141,719
2012: 5,754,857 Dem. Pres. Obama
51.96% 309,840 R 182,499
As can be seen, between 1960 and 2012, Republicans have won
the combined margin from the 66 non-Philadelphia counties in
all elections except the 1964 LBJ landslide, the 1992-1996
Ross Perot elections, and the 2008 Obama election. However,
Republicans have lost Pennsylvania in 1960, 1968, 1976,
2000, 2004 and 2012 because of the Democratic margin in
Philadelphia -- and between 2004 and 2012, a decline of
85,359 in the Republican non-Philadelphia margin. As can be
seen, the 1960 JFK Philadelphia margin of 331,544 (which
broke the FDR 1936 record) has been eclipsed by Gore
(348,223), Kerry (412,106), and both Obama campaigns closing
in on 500,000 – even though the all-time record 1960 total
19
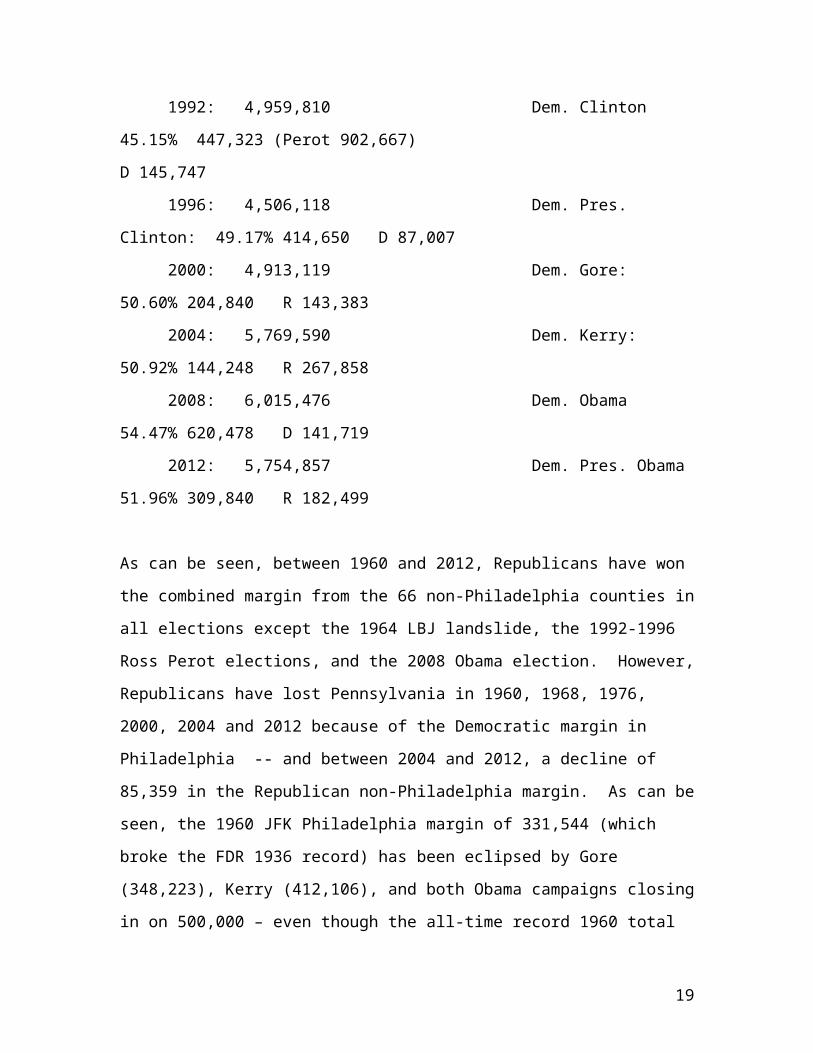
Philadelphia vote of 915,277 has fallen to a 2008 number of
718,025 and a 2012 number of 690,776. Simple reason:
Republicans are leaving the Philadelphia they ran between
1860 and 1951, to the point that Mitt Romney underperforms
Barry Goldwater, 13.97% versus 26.24%.
Chart IV: The Philadelphia Democratic Margin and Total Vote,
1960 – 2012
Dem. Margin
Total Vote
1960: 331,544
915,277
1964: 430,912
913,472
1968: 271,615 (Wallace 63,506)
850,117
1972: 87,640
783,970
1976: 255,579
746,197
1980: 177,145 (Anderson 42,967)
718,100
1984: 234,191
772,102
1988: 230,513
674,977
20
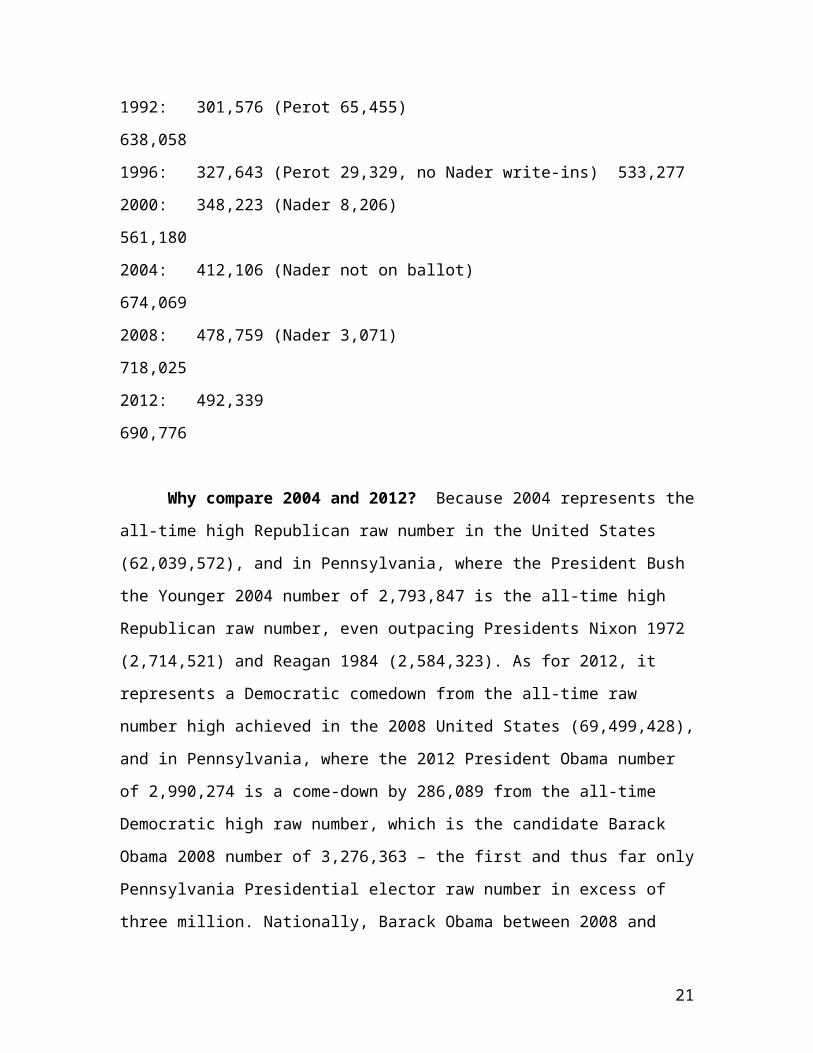
1992: 301,576 (Perot 65,455)
638,058
1996: 327,643 (Perot 29,329, no Nader write-ins) 533,277
2000: 348,223 (Nader 8,206)
561,180
2004: 412,106 (Nader not on ballot)
674,069
2008: 478,759 (Nader 3,071)
718,025
2012: 492,339
690,776
Why compare 2004 and 2012? Because 2004 represents the
all-time high Republican raw number in the United States
(62,039,572), and in Pennsylvania, where the President Bush
the Younger 2004 number of 2,793,847 is the all-time high
Republican raw number, even outpacing Presidents Nixon 1972
(2,714,521) and Reagan 1984 (2,584,323). As for 2012, it
represents a Democratic comedown from the all-time raw
number high achieved in the 2008 United States (69,499,428),
and in Pennsylvania, where the 2012 President Obama number
of 2,990,274 is a come-down by 286,089 from the all-time
Democratic high raw number, which is the candidate Barack
Obama 2008 number of 3,276,363 – the first and thus far only
Pennsylvania Presidential elector raw number in excess of
three million. Nationally, Barack Obama between 2008 and
21
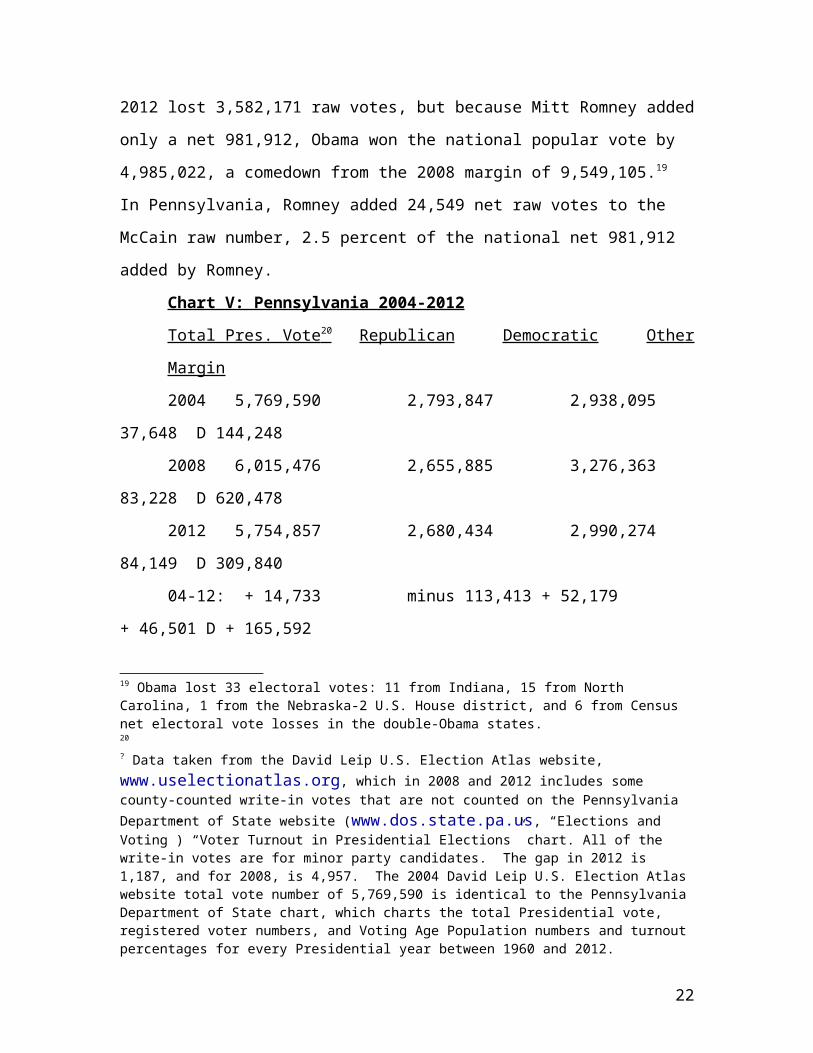
2012 lost 3,582,171 raw votes, but because Mitt Romney added
only a net 981,912, Obama won the national popular vote by
4,985,022, a comedown from the 2008 margin of 9,549,105.19
In Pennsylvania, Romney added 24,549 net raw votes to the
McCain raw number, 2.5 percent of the national net 981,912
added by Romney.
Chart V: Pennsylvania 2004-2012
Total Pres. Vote 20 Republican Democratic Other
Margin
2004 5,769,590 2,793,847 2,938,095
37,648 D 144,248
2008 6,015,476 2,655,885 3,276,363
83,228 D 620,478
2012 5,754,857 2,680,434 2,990,274
84,149 D 309,840
04-12: + 14,733 minus 113,413 + 52,179
+ 46,501 D + 165,592
19 Obama lost 33 electoral votes: 11 from Indiana, 15 from North Carolina, 1 from the Nebraska-2 U.S. House district, and 6 from Census net electoral vote losses in the double-Obama states.20
? Data taken from the David Leip U.S. Election Atlas website, www.uselectionatlas.org, which in 2008 and 2012 includes some county-counted write-in votes that are not counted on the Pennsylvania Department of State website (www.dos.state.pa.us, “Elections and Voting”) “Voter Turnout in Presidential Elections” chart. All of the write-in votes are for minor party candidates. The gap in 2012 is 1,187, and for 2008, is 4,957. The 2004 David Leip U.S. Election Atlas website total vote number of 5,769,590 is identical to the Pennsylvania Department of State chart, which charts the total Presidential vote, registered voter numbers, and Voting Age Population numbers and turnout percentages for every Presidential year between 1960 and 2012.
22
08-12: minus 260,619 + 24,549 min. 286,089 +
921 D min. 310,638
Pennsylvania does not have a sufficiently large pool of
“missing white voters” to flip the commonwealth, even though
according to the 2012 exit polls in 31 states, the
Pennsylvania electorate Caucasian percentage was 78 percent.
According to the 2010 Census website, the total Pennsylvania
population of 12,702,379 is 78.8% Non Hispanic White, 11.4%
African-American, 6.1% Hispanic, and 3.1% Asian/Pacific
Islander American. Thus, Pennsylvania is more like Ohio (79%
Caucasian per the exit poll) than Virginia (70% Caucasian).
However, Democratic raw vote margins among the Caucasian and
non-Caucasian voters in Metropolitan Pennsylvania are
soaring, whereas Republican margins in Rural Pennsylvania
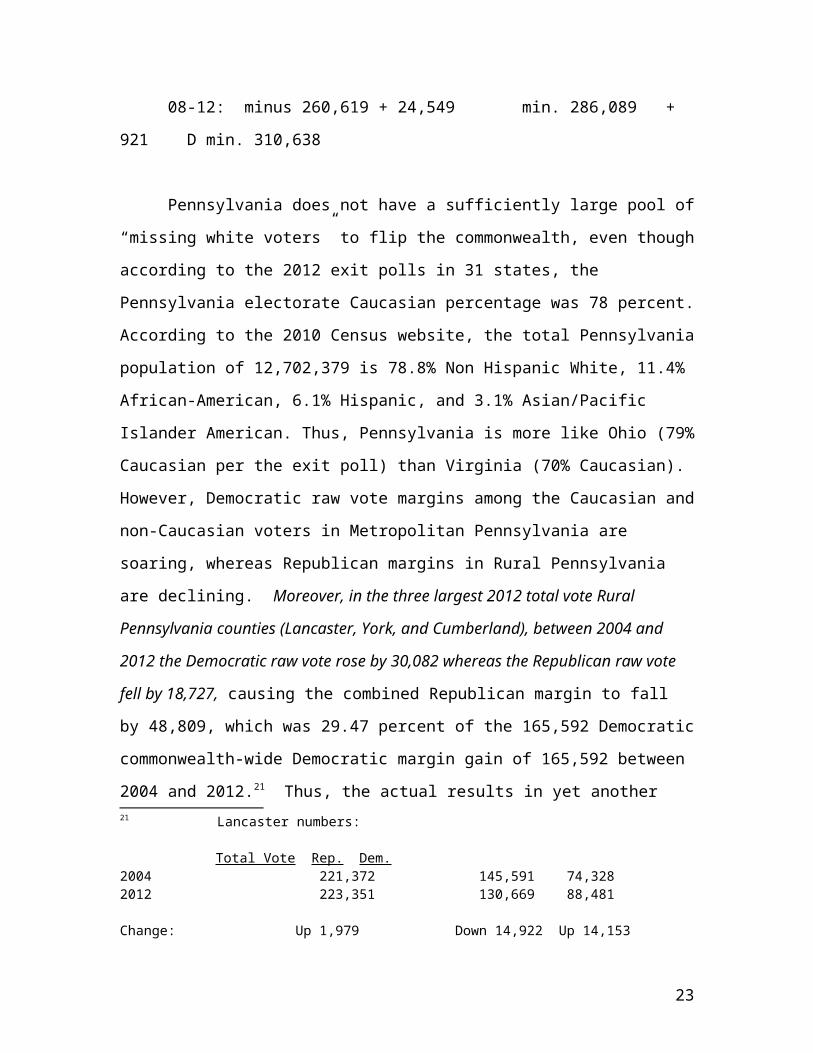
are declining. Moreover, in the three largest 2012 total vote Rural
Pennsylvania counties (Lancaster, York, and Cumberland), between 2004 and
2012 the Democratic raw vote rose by 30,082 whereas the Republican raw vote
fell by 18,727, causing the combined Republican margin to fall
by 48,809, which was 29.47 percent of the 165,592 Democratic
commonwealth-wide Democratic margin gain of 165,592 between
2004 and 2012.21 Thus, the actual results in yet another 21 Lancaster numbers:
Total Vote Rep. Dem.2004 221,372 145,591 74,3282012 223,351 130,669 88,481
Change: Up 1,979 Down 14,922 Up 14,153
23
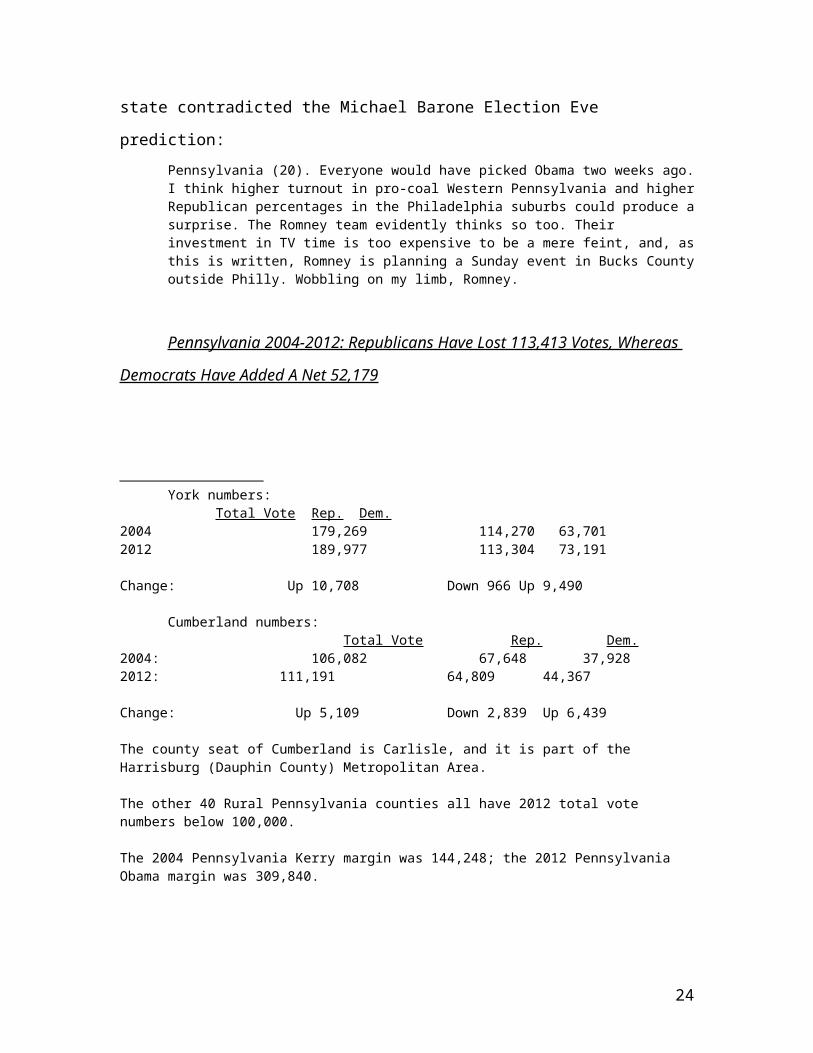
state contradicted the Michael Barone Election Eve
prediction:Pennsylvania (20). Everyone would have picked Obama two weeks ago.I think higher turnout in pro-coal Western Pennsylvania and higherRepublican percentages in the Philadelphia suburbs could produce asurprise. The Romney team evidently thinks so too. Their investment in TV time is too expensive to be a mere feint, and, asthis is written, Romney is planning a Sunday event in Bucks Countyoutside Philly. Wobbling on my limb, Romney.
Pennsylvania 2004-2012: Republicans Have Lost 113,413 Votes, Whereas
Democrats Have Added A Net 52,179
York numbers:Total Vote Rep. Dem.
2004 179,269 114,270 63,7012012 189,977 113,304 73,191
Change: Up 10,708 Down 966 Up 9,490
Cumberland numbers: Total Vote Rep. Dem. 2004: 106,082 67,648 37,9282012: 111,191 64,809 44,367
Change: Up 5,109 Down 2,839 Up 6,439
The county seat of Cumberland is Carlisle, and it is part of the Harrisburg (Dauphin County) Metropolitan Area.
The other 40 Rural Pennsylvania counties all have 2012 total vote numbers below 100,000.
The 2004 Pennsylvania Kerry margin was 144,248; the 2012 Pennsylvania Obama margin was 309,840.
24
The Republicans have lost 113,413 votes in Pennsylvania
between 2004 and 2012, whereas Democrats have added a net
52,179 to the 2004 John Kerry number of 2,793,847, which was
a 452,128 increase from the Gore number of 2,485,967. In
contrast, in 2004 the Bush campaign led by Ken Mehlman added
512,720 to the candidate Bush number of 2,281,127, but in
the next eight years, lost 137,992 in 2008, and in 2012,
gained only 14,549. Democrats came out of 2004 ahead by
144,248 (the smallest Democratic raw margin since JFK 1960),
and in 2008 added 338,268 to create the highest post-1964
and highest ever non-incumbent Democratic raw margin of
620,478 -- meaning that in 2012, Obama could lose 286,089
and still come out ahead by 309,840 and 5.38 percentage
points (national plus 1.53). When the Pennsylvania polls
closed on Election Night 2012 at 2000 hours Eastern Standard
Time the Keystone Commonwealth of the Blue Wall portion of
the Electoral College outcome was all over but the counting
– as long as New Hampshire, Iowa and New Mexico held firm,
the Blue Wall 257 was in place, meaning Democrats could
close the sale in Virginia (13), or Ohio (18), or Florida
(29), or Colorado-Nevada (9 plus 6). When John Kerry and
Barack Obama won Pennsylvania in 2004, 2008 and 2012, they
made history by achieving the fourth, fifth and sixth
straight Democratic Presidential wins in Pennsylvania –
Roosevelt and Truman achieved only three (1936, 1940 and
1944) because one of the six 1932 Herbert Hoover states was
25
Pennsylvania, and in 1948, Thomas Dewey achieved a
commonwealth-wide 50.93% by keeping the Philadelphia
Democratic margin down to an unbelievably low 6,737 (this is
not a misprint).22 In fact, the six successive Democratic
wins between 1992 and 2012 is the longest one-party
Pennsylvania Presidential string since the 1860 – 1932
Republican string of 72 years of 13 Republican wins from
Lincoln through Taft, followed by a Theodore Roosevelt Bull
Moose win in 1912 and five more Republican wins between
Charles Evans Hughes (1916) and Herbert Hoover (1932).
Historical note: in this period, the Pennsylvania Republican
base was in Philadelphia and the Democratic base was in
rural counties such as Columbia. In the closest-margin
Pennsylvania election of the 1860-1932 Republican Era –
1876, when Rutherford Hayes carried Pennsylvania by 17,980
or 2.37 percentage points -- the Philadelphia Republican
margin was 15,719, and the Allegheny Republican margin was
9,481, whereas the largest Democratic county was Berks
22 Democrats won three in a row in 1960-1964-1968, 1936-1940-1944, and 1828-1832-1836; two in a row in 1852-1856; and single wins in 1844 (James K. Polk) and 1976 (Jimmy Carter). Whig candidates won in 1840 and1848. Jeffersonian Democratic-Republicans won all six elections between1800 and 1820. Andrew Jackson won in 1824. In 1796, Thomas Jefferson carried Pennsylvania by a raw 121 according to Michael Dubin who notes the missing Greene County returns that cost Jefferson two of the 15 electors (United States Presidential Elections 1788-1860: The Official Results, page 8).
As for 1948 Philadelphia, Kevin Phillips in The Emerging Republican Majority (page 66) describes it as a “last hurrah” for the Philadelphia branch ofthe 1860-1934 Pennsylvania Republican Machine, which held City Hall through 1951.
26
(Reading) by 7,592, joined by 29 rural counties including
Columbia, a county that was Democratic all but once from
1836 through 1944, but starting in 1948, Republican in every
year except 1964, 1976 (Carter 50.37%) and 1996 (Clinton
41.13%); in 2012, Romney scored 55.13%.23
The Missing White Voter Theory says Rural Pennsylvania
stayed home. In his initial November 8, 2012, article, Mr.
Trende argued that Republican Ohio turnout rose in the
white-collar suburbia around Columbus and Cincinnati, but
fell in blue-collar or rural Ohio because these voters were
turned off by both President Obama and Mitt “47 percent”
Romney. Trende stated as follows on November 8, 2012:
We can see that the counties clustered around Columbus in the center of the state turned out in full force, as did the suburban counties near Cincinnati in the southwest. These heavily Republican counties are the growing areas of the state, filled with white-collar workers.
Where things drop off are in the rural portions of Ohio, especially in the southeast. These represent areas still hard-hit by the recession. Unemployment is high there, and the area has seen almost no growth in recent years.
My sense is these voters were unhappy with Obama. But his negativead campaign relentlessly emphasizing Romney’s wealth and tenure atBain Capital may have turned them off to the Republican nominee aswell. The Romney campaign exacerbated this through the challenger’s failure to articulate a clear, positive agenda to address these voters’ fears, and self-inflicted wounds like the “47 percent” gaffe. Given a choice between two unpalatable options, these voters simply stayed home.
23 David Leip U.S. Election Atlas website, www.uselectionatlas.org, and Walter Dean Burnham, Presidential Ballots 1836-1892, pages 704-721. The oneColumbia County Republican win in the 1860-1944 period was Herbert Hoover in 1928.
27
While these comments misstate the actual Ohio results that
would not be certified for another 28 days, they might apply
to Pennsylvania, because of the 67 Pennsylvania counties,
the Appalachian Regional Commission defines 52 as
Appalachian, including 40 of the 43 counties of Rural
Pennsylvania24, a subset that includes 8 of the 11
Republican small-city counties in the famous Pennsylvania
“T.”25 In addition to the Scots-Irish concentrations in
counties like Juniata and Snyder, Rural Pennsylvania also
includes the northern tier counties between Susquehanna,
Bradford, Tioga and Warren that include the U.S. House
district that elected anti-slavery Democrat David Wilmot of
Wilmot Proviso fame – the 1846 legislation that began
cracking the North-South Whig and Jacksonian coalitions into
Republican Northern and Democratic Southern coalitions.
Rural Pennsylvania consists of 43 counties in the
central Pennsylvania “T” – 11 Republican-lean small-city
metropolitan or micropolitan counties between Lancaster and 24 Plus the Eastern Pennsylvania counties of Lackawanna, Luzerne, Monroe, Pike, Carbon, Schuylkill and Wayne; the Democratic Western Pennsylvania counties of Allegheny, Erie and Centre; and all five suburban Pittsburgh Republican counties (Armstrong, Butler, Fayette, Washington, Westmoreland). See www.wikipedia.org, “List of Appalachian Regional Commission counties.” 25
? All of the 43 except the high-vote counties of Lancaster and York, andAdams (Gettysburg), but including Lycoming (Williamsport), Lebanon, Blair (Altoona), Clearfield, Cumberland (Carlisle), Franklin (Chambersburg), Northumberland (Sunbury) and Warren. As discussed infra, Lancaster and York are becoming Philadelphia-Baltimore-Washington exurbs, where between 2004 and 2012, Republican raw numbers and margins fell.
28
Warren, 9 formerly Democratic counties such as Cambria
(Johnstown); and 23 small rural counties. Republicans lead
in 2012 party registration26 in 38 of these 43 counties: all
except the “formerly Democratic” counties of Beaver (Beaver
Falls), Cambria (Johnstown), Elk (Ridgway), Mercer, and
Columbia (Bloomsburg).
In 36 of these 43 Rural Pennsylvania counties, the 2012
Census estimate Non-Hispanic White (NHW) population
percentages range between 97.9 (Elk) and 90.2 (Beaver). In
six, the NHW percentage is in the eighty percent band:
Cumberland, Franklin, Lancaster, Lebanon, Union, and York,
and in Forest County, it is 79.6 percent. Forest County
(Tionesta) in the north-central rural area is the location
of as State Correctional Institution and is 19.0% African-
American and 5.7 percent Hispanic, but the 2012 total vote
was all of 2,324. In much larger Lancaster County (2012
total vote 223,351), the Hispanic percentage is 9.3 and the
African-American percentage is 4.5; in York, it is 6.1 and
6.2. As discussed infra, in the three largest total vote Rural
Pennsylvania counties, Democrats gained votes between 2004
and 2012, likely from these little-noted demographic
changes. 26 Unlike Ohio and Virginia, but like California, Pennsylvania voters can register by party. Unlike post-2010 California, however, Pennsylvania has a closed primary system, meaning party registration determines whether and in which primary one can vote. Commonwealth-wide, of the 8,508,015 registered voters as of November 2012, only 1,110,554 registered outside the two major parties, with Democrats registering 4,266,317 and Republicans 3,131,144. These statistics come from the Pennsylvania Department of State website, www.dos.state.pa.us
29
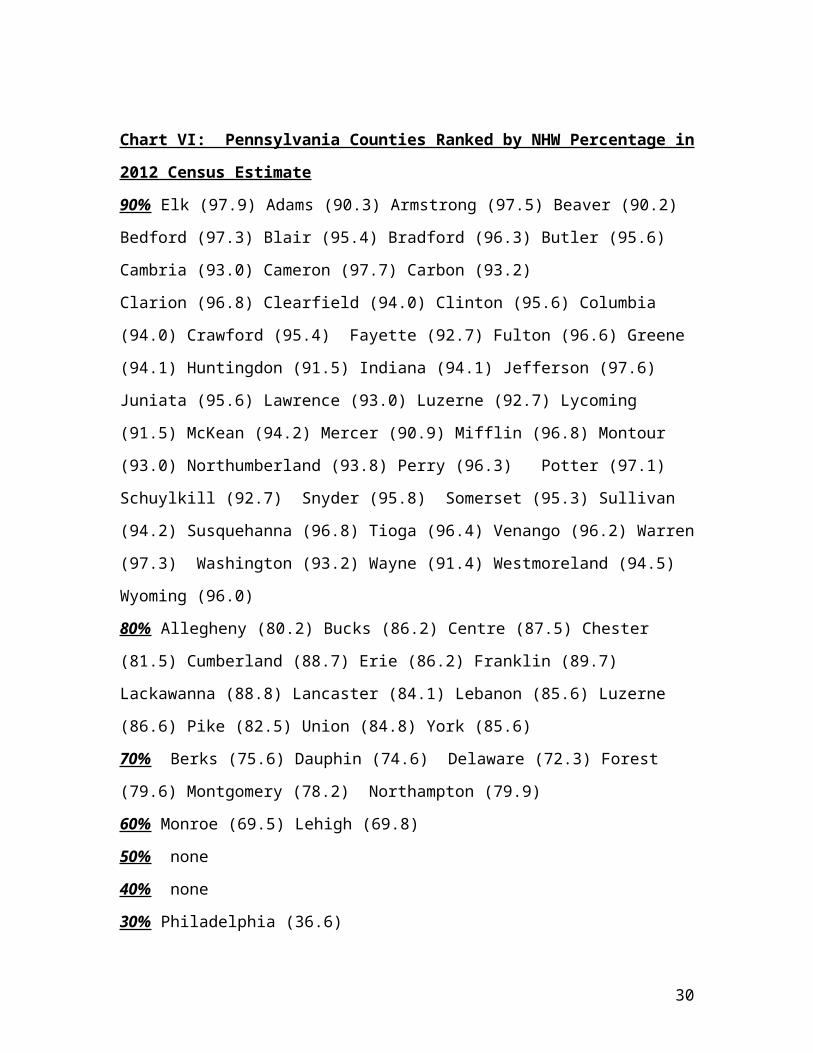
Chart VI: Pennsylvania Counties Ranked by NHW Percentage in
2012 Census Estimate
90% Elk (97.9) Adams (90.3) Armstrong (97.5) Beaver (90.2)
Bedford (97.3) Blair (95.4) Bradford (96.3) Butler (95.6)
Cambria (93.0) Cameron (97.7) Carbon (93.2)
Clarion (96.8) Clearfield (94.0) Clinton (95.6) Columbia
(94.0) Crawford (95.4) Fayette (92.7) Fulton (96.6) Greene
(94.1) Huntingdon (91.5) Indiana (94.1) Jefferson (97.6)
Juniata (95.6) Lawrence (93.0) Luzerne (92.7) Lycoming
(91.5) McKean (94.2) Mercer (90.9) Mifflin (96.8) Montour
(93.0) Northumberland (93.8) Perry (96.3) Potter (97.1)
Schuylkill (92.7) Snyder (95.8) Somerset (95.3) Sullivan
(94.2) Susquehanna (96.8) Tioga (96.4) Venango (96.2) Warren
(97.3) Washington (93.2) Wayne (91.4) Westmoreland (94.5)
Wyoming (96.0)
80% Allegheny (80.2) Bucks (86.2) Centre (87.5) Chester
(81.5) Cumberland (88.7) Erie (86.2) Franklin (89.7)
Lackawanna (88.8) Lancaster (84.1) Lebanon (85.6) Luzerne
(86.6) Pike (82.5) Union (84.8) York (85.6)
70% Berks (75.6) Dauphin (74.6) Delaware (72.3) Forest
(79.6) Montgomery (78.2) Northampton (79.9)
60% Monroe (69.5) Lehigh (69.8)
50% none
40% none
30% Philadelphia (36.6)
30
The Missing White Voter Theory Is Missing Actual Registrations and Actual
Voters
The Missing White Voter Theory has no actual voters.
Even though the final certified Ohio 2012 returns turned out
to be at variance with his November 8, 2012 article, Mr.
Trende in a subsequent four-part Real Clear Politics series27,
expanded his argument nationwide, arguing that “[t]he most
salient demographic change from 2008 to 2012 was the drop in
white voters” and claiming that a national 6.5 million
Caucasian eligible voters stayed home in 2012. Mr. Trende
stated in his 2013 articles that even if the missing 6.5
million broke 70-30 for Romney, by itself this group it
would not have won the 2012 election for the Republicans,
but in 2016 and in future elections Republican appeals that
turn them out, combined with reduced African-American
turnout, would carry the day for the GOP – because according
to Trende, it is fine that the Nineteenth Century anti-
slavery party has become the Twenty-first Century equivalent
27 Real Clear Politics, June 21, 2013, “The Case of the Missing White Voters, Revisited”; June 25, 2013, “Does GOP Have to Pass Immigration Reform”; June 28, 2013, “The GOP and Hispanics: What the Future Holds”; July 2, 2013, “Demographics and the GOP, Part IV.” The July 2 article is a replyto critics Karl Rove, Jonathan Chait, and the concerned multitudes who expressed concern that GOP emphasis on running up Caucasian percentages would lead to unhealthy racial polarization.
31
of the 1868 Democratic “White Man’s Party”28 since “from a
purely electoral perspective, that’s not a terrible thing to
be.”29 By author Kamp’s calculations, since the Obama 2012
national popular vote margin was 4,985,022, if Romney won 90
percent of the “missing” 6.500 million, he would have won
the rounded national popular vote by 345,000 -- 66.782
million versus 66.437 million30, or a two-party vote
percentage of 50.13 percent.
With respect to the outcome-determinative Electoral
College, Mr. Trende (whose initial November 8, 2012 article
was premised on Ohio) never posted in the text of any
article actual raw numbers of registered nonvoting “missing white
voters” in any state, although he does include charts based
on estimated national vote ethnic percentages (but not showing
any state breakdowns) showing Republicans using a “racial
polarization scenario” and a Caucasian 63% Republican
28 Statement of the 1868 Democratic nominee, New York Governor Horatio Seymour, quoted by Ed Kilgore, “Doubling Down on the White Man’s Party”,June 26, 2013, The Washington Monthly Political Animal blog, www.washingtonmonthly.com29 Trende stated as follows in his June 25, 2013 article: “Democrats liked to mock the GOP as the “Party of White People” after the 2012 elections. But from a purely electoral perspective, that’s not a terrible thing to be.”
30 Assuming the added 6.500 million divides 2 percent for “others” (130,000), 8 percent for Obama (plus 520,000 on top of actual 65,917,257 = 66,437,257) and 90 percent for Romney (plus 5.850 million on top of actual 60,932,235 = 66,782,235). Actual vote figures from theDavid Leip U.S. Election Atlas website, www.uselectionatlas.org, accessed September 15, 2013.
32
percentage winning between 296 and 329 electoral votes in
every election through 2036, and an exact 270 in 2040; in
his fourth article, Trende stated that the GOP Caucasian
percentage is “capped” at 70 percent.31
The numbers used in The Missing White Voter Theory do
not represent actual registered voters or voting voters in
any state. Rather, as Trende expressly states, he is using
only Census estimates of 2008 and 2012 turnout to which Trende adds
2008 exit poll ethnic percentages32:
Using the most commonly accepted exit-poll numbers about the 2008 electorate*, we can roughly calculate the number of voters of eachracial group who cast ballots that year. Using census estimates, we can also conclude that all of these categories should have increased naturally from 2008 to 2012, due to population growth.
From mid-2008 to mid-2012, the census estimates that the number ofwhites of voting age increased by 3 million. If we assume that these “new” voters would vote at a 55 percent rate, we calculate that the total number of white votes cast should have increased byabout 1.6 million between 2008 and 2012.
***
Now, the raw exit-poll data haven’t come out yet, so we can’t calculate the 2012 data to tenths: The white vote for 2012 could have been anywhere between 71.5 percent of the vote or 72.4 percent (with 26,000 respondents, analysis to tenths is very
31 Trende stated on July 2, 2013: “Whatever the cause, the trend is real, and it’s not just due to Obama (in fact, the [Alan Abramowitz TimeFor A Change] model predicts the white vote in 2012 within two points). Now, the Democrats clearly have some sort of floor with whites -- it’s why I cap the Republican share of the white vote at 70 percent even in the “polarization” scenario. I just don’t think we’re at that floor yet.”
32 In 2012, exit polls were conducted in only 31 states. The quoted language comes from the Trende June 21, 2013 article under Point 1.
33
meaningful). So the final answer is that there were 6.1 million fewer white voters in 2012 than we’d have expected, give or take amillion.**
The Current Population Survey data roughly confirm this. As I noted earlier, if you correct the CPS data to account for over-response bias, it shows there were likely 5 million fewer whites in 2012 than in 2008. When you account for expected growth, we’d find 6.5 million fewer whites than a population projection would anticipate.
The Census Current Population Survey Is Not The Best Evidence -- It
Overstated the 2012 National Popular Vote by 3.7 Million, and Understated
Pennsylvania Actual Registration and Voting in 2004, 2008, and 2012
The Census Survey used for the Missing White Voter
Theory produces numbers too far from the actual results to
be useful. The Trende series inspired a cacophony of calumny
(and some informed commentary), but one salient point never
emerged: the Census survey data is not the equivalent of
state or county-level numbers of actual 2012 registered voters who
“stayed home” rather than voting for Romney.33 These
numbers cannot be found in the Census data, because the
Census states that its’ eligibility, registration and voting
numbers are derived from self-reporting by a sample of
roughly 50,000 respondents to the Current Population Survey
(CPS) as to their citizen 18-plus status, voter
33 Pennsylvania is still one of the minority of 19 jurisdictions that donot offer no-excuses early voting or mail ballots.
34
registration34, and whether they voted. This is a
commendably large sample, but in 2012 it overstated the
national total vote as 132.948 million, when the actual
total vote for President was 129,215,421.
In Pennsylvania, the CPS for 2012 reports 9.452 million
citizen-eligible, 6.795 million registered, and 5.824
million voting. The Census CPS Voting Age population number
is listed on the Pennsylvania Department of State website
“Voter Registration Statistics” report for the commonwealth-
wide Presidential elections between 1960 and 2012; in
contrast, the California Secretary of State refuses to use
the Census 23.419 million citizen-eligible number for
California, but instead adjusts it upward to 23,802,577
based on data from the California Departments of Finance and
Corrections.35
The Census citizen-eligible number is only a secondary
source to determine the potential for expanding the
electorate. Instead, one assigned to develop a 2016
Republican strategy for flipping Pennsylvania would first go
to the state-level and county-level registered voter and actual
voting numbers, augmented by voter file data as to the number
of and type of elections in which each registered voter has
34 Not required in the Nineteenth Century, but now a requirement in every state except North Dakota.35
? California Secretary of State website, www.sos.ca.gov, “Elections”,“Prior Elections”, “Statewide Elections”, “November 6, 2012 General Election”, “Registration Statistics”, “15-day Report of Registration.”
35
participated (“flags” in the typical precinct walk sheet or
its’ Smartphone equivalent). Registered voters need only be
persuaded and turned out, whereas the unregistered first
need a registration drive.36 The Census estimates for
Pennsylvania registered voters and actual voting for 2004,
2008 and 2012 differ substantially from the actual
registration and voting statistics on the Pennsylvania
Department of State website:
For 2004, the Census estimates rounded 6.481
million registered and 5.845 million voting, but
the actual numbers are 8,366,663 registered and
5,769,590 voting for President;
For 2008, the Census estimates 6.451 million
registered and 5.747 million voting, but the
actual numbers are 8,755,588 registered and
6,010,519 votes counted by the state, plus 4,957
county-counted write-ins;
And for 2012, the Census estimates 6.795 million
registered and 5.824 million voting, but the
actual numbers are 8,508,015 total registered and
36 Trende could have done a national version of this for D.C. and the 49states other than North Dakota that require voter registration. Had he done so, he would have presented the entire universe of registered voters and registered nonvoters in the United States broken down to the county or Alaska election district level in each state. North Dakota could have simply been placed in a separate chart.
36
5,753,670 votes counted by the state, plus 1,187
county-counted write-ins.37
Every state except no-registration North Dakota reports per-
election voter registration on its’ election officer
website, and every state reports the total vote;
Pennsylvania on its’ Department of State website charts both
back to 1960, has election results back to 200038, and has
voter registration data back to 1998. In addition, there is
a fine website created by Wilkes University and Dr. Harold
Cox known as the Pennsylvania Election Statistics Project39,
which has county-level data and maps for Presidential
elections back to 1796, U.S. Senate selections and elections
back to 1788, U.S. House elections for 1788 through 2004,
and gubernatorial elections back to 1790, and last but not
least, Pennsylvania state legislature directories back to
1682 – but as yet no “row offices” such as Attorney General
and Auditor General. The David Leip U.S. Election Atlas
website in a single screen charts Pennsylvania state-level
37 Unlike many other states, the Pennsylvania Department of State website does not list a voting number reflecting persons who signed in to vote and voted for any office. Instead, it simply uses the vote castfor President, but not including write-ins counted by the counties. Thus, it is impossible to determine how many voted but skipped the Presidential engagement.38
? At the Pennsylvania Department of State website portal “View Election Returns” or at www.electionreturns.state.pa.us 39
? http://staffweb.wilkes.edu/harold.cox/
37
total vote and Presidential partisan numbers all the way
back to 1856, with county-level numbers back to 1888, and
has per-election screen state-level data back to 1824; it
also has U.S. Senate county-level returns back to 1956, plus
1914 and 1926, gubernatorial returns for 1986-2010 and many
of the gubernatorial races between 1860 and 1966 (but still
no row offices). Congressional election returns scholar
Michael Dubin has published county-level Presidential
returns for Pennsylvania for the period from 1788 through
1860.40 There is also a fine book-length state-level
realignment study of Pennsylvania between 1960 and 2008 that
concludes Pennsylvania has realigned Democratic.41 These
sources provide actual registration and voting data, not estimates, and should
be looked to first in the search for the actual 6.5 million missing white voters.
The Missing White Voter Theory Census Estimate Predicate Appears To
Assume a Highly Improbable 55 Percent Turnout of 832,000 Unregistered, Which
Cannot Defeat The Obama 2008 Margin And Defeats 2012 Only At 79 Percent
Republican
40 United States Presidential Elections 1788-1860: The Official Results (McFarland and Company, 2002). County-level results from 1836 through 1892 are collected by Walter Dean Burnham in Presidential Ballots 1836-1892; from 1896-1944 by Edgar Eugene Robinson in The Presidential Vote 1896-1932, and They Voted for Roosevelt. The Richard Scammon America At the Polls books have county-level Pennsylvania returns back to 1920.
41 Renee M. Lamis, The Realignment of Pennsylvania Politics Since 1960: Two-Party Com[petition in a Battleground State (Pennsylvania State University Press, University Park, Pa., 2009). The book has a foreword by James L. Sundquist (at page xxiv) that describes the book as “demolishing” the David Mayhew conclusion that “the realignment genre…has ceased to be relevant.”
38
If the unregistered are the target group, Republicans
will need 100 percent turnout, not the 55 percent used in
The Missing White Voter Theory article series. The only
reason to look at the Census estimates: they provide the
only statistics available for the citizen-eligible
population and ethnic/gender breakdowns of the CPS
respondents.42 The citizen-eligible population includes
unregistered eligibles, registered nonvoters, and registered
actual voters. The gap between the Census 9.452 million
“citizen-eligible” survey response estimate and actual total
registration for 2012 Pennsylvania (rounded 8.508 million)
is a rounded 944,000. If these 944,000 exist, and:
if the 2016 Republican nominee found, registered,
persuaded and delivered 100 percent of all of
these 944,000 unregistered 2012 nonvoters at 66
percent Republican, 32% Democratic, 2% Other43;
and assuming no other changes anywhere else
(highly unlikely);
42 ? Another source for ethnic/racial breakdowns is the American National Election Study (ANES), as analyzed by Alan Abramowitz and Ruy Teixera onJuly 30, 2013, “The Missing White Voters: Round Two of the Debate.”
43 The 2012 Pennsylvania “other” percentage was 1.46%. In post-1928 years other than 1948 (Strom Thurmond), 1968 (George Wallace), 1980 (John Anderson), 1992-1996 (Ross Perot) and 2000 (Ralph Nader), the non-major collective percentage in Pennsylvania has never exceeded 3.84% (1932) or 2.28% (1936).
39
the Republican column amount goes up by 623,040,
thus topping by 11,120 the augmented 2012 Obama
Pennsylvania margin of 309,840, but not the 2008
margin of 620,478, which can only be topped at 82
percent Republican.44
However, if the turnout is the 55 percent used in the Missing White Voter
articles45, only 519,200 are added, which even at 100 percent Republican falls
short of the Obama 2008 Pennsylvania margin, and defeats the 2012 margin
only at 79 percent Republican.46 Democrats if they hold Florida plus
any one of New Hampshire, Virginia, Ohio, Colorado or
Nevada47 could still hold the White House without
Pennsylvania, but because The Missing White Voter Theory is
unlikely to flip Pennsylvania, Democrats will likely not
enjoy the irony of Republicans trying to win the election 44 The calculation assumes the 944,000 break Republican 66% = 623,040 new Republicans, offset by Democratic 32% = 302,080 = net Republican gain of 320,960, which defeats the Obama 2012 margin (309,840) by a raw 11,120, but not Obama 2008 (620,478)
For the 2008 margin: 944,000 times Republican 82% = 774,080 new Republicans, offset by Democratic 16% = 151,040 = net Republican gain of623,040, which defeats the Obama 2008 margin (620,478) by a raw 2,562.
45 In his June 21, 2013 article, Trende stated under point 1: “If we assume that these “new” voters would vote at a 55 percent rate . . .”
46 This calculation assumes the 519,200 break Republican 79% = 410,168 new Republicans, offset by Democratic 19% = 98,648 = net Republican gainof 311,520, which defeats Obama 2012 (309,840) by a raw 1,680.
47 The 226 electoral votes from the 2004 Kerry states other than Pennsylvania plus Iowa (6) and New Mexico (5), plus Florida (29) and anyone of New Hampshire (4), Ohio (18), Colorado (9) or Nevada (6), or loseFlorida (29) and New Hampshire (4), and hold all of Ohio, Colorado, and Nevada (237 plus 33 = 270).
40
among the unregistered and alienated whom Republican
Governors and legislatures across the country in 2013 have
been trying to keep from voting, even if the 2016 Republican
nominee runs a registration drive trumpeting “White People
Wake Up” – the 1950 election eve segregationist slogan in
the 1950 North Carolina U.S. Senate Democratic primary.48
When reading the Missing White Voter Theory analysis,
keep in mind that the “missing white voter” group in
Pennsylvania necessarily includes an estimated 944,000 or 519,200 who did
not even bother to register to vote, as do the 2012 Census CPS
estimates of Pennsylvania Non-Hispanic White (NHW)
populations of 7.901 million eligible, 5.779 million
registered and 4.937 million voting – all three are
estimates, and the full-population Pennsylvania Department
of State numbers for actual registered and actual voting are so
far removed from the CPS estimates for Pennsylvania as to
render the latter useless for evaluating the universe of
registered “missing voters.” In any event, the Republican
task will be easier if the Pennsylvania State Senate,
Republican-controlled since 1980, the Republican-controlled
Pennsylvania House, and Republican Governor Tom Corbett move
the registration deadline from Election Day minus 30 to the
Election Day minus 22 used in Virginia, or Election Day
48 Samuel Lubell, The Future of American Politics (3d. ed. 1965), pages 106-113 (“Who Beat Frank Graham?”).
41
minus 1549, or even to the Election Day Registration used in
Idaho, Iowa, Maine, Minnesota, Montana, New
Hampshire, Wisconsin, Wyoming, and D.C.
Another Census Estimate Element of the Missing White Voter Theory Adds
Only 457,600 New Voters, Less Than The Obama 2008 Margin And Defeats The
2012 Margin Only At 83 Percent
Another estimate relied upon by The Missing White Voter
Theory is the gap between Census Non-Hispanic White (NHW)
estimated registered versus the estimated NHW voting, which
in Pennsylvania is 832,000. The Missing White Voter Theory
is premised on a 2008-2012 growth in the national eligible
NHW population offset against a national decline in NHW
registration and voting. Although the CPS has state-level
estimates, the Missing White Voter Theory articles do not
mention any of them. Here are the CPS estimates for
Pennsylvania:
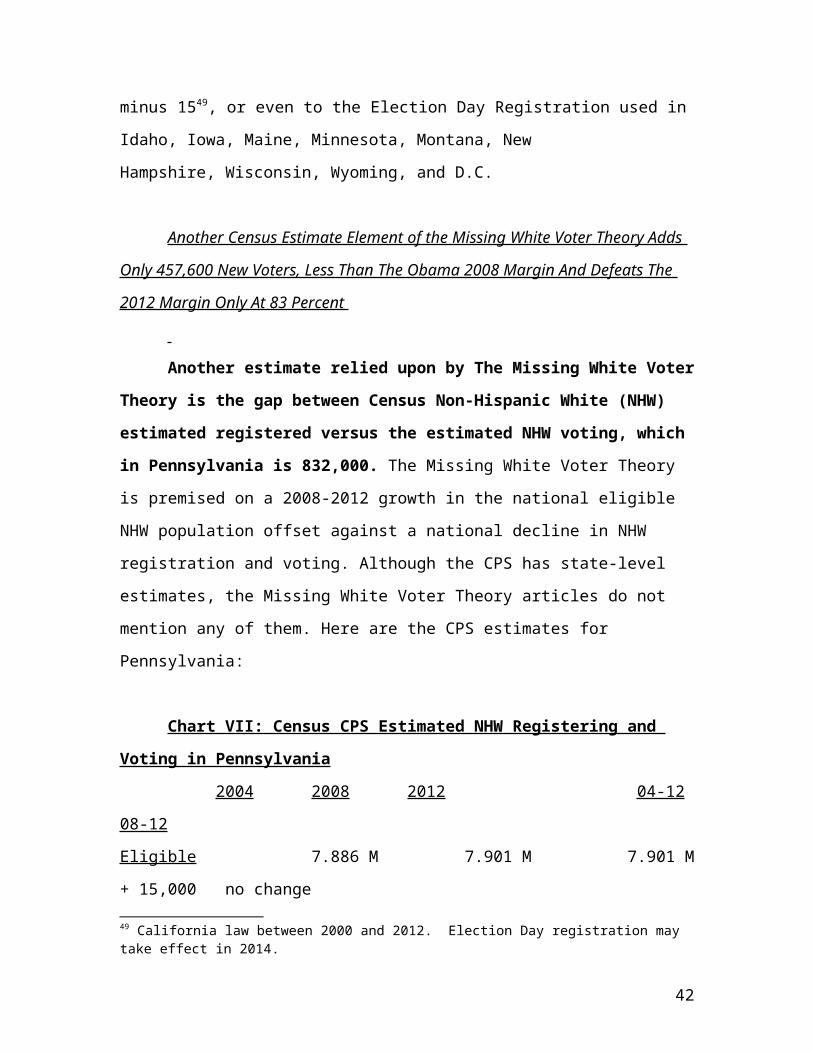
Chart VII: Census CPS Estimated NHW Registering and
Voting in Pennsylvania
2004 2008 2012 04-12
08-12
Eligible 7.886 M 7.901 M 7.901 M
+ 15,000 no change
49 California law between 2000 and 2012. Election Day registration may take effect in 2014.
42
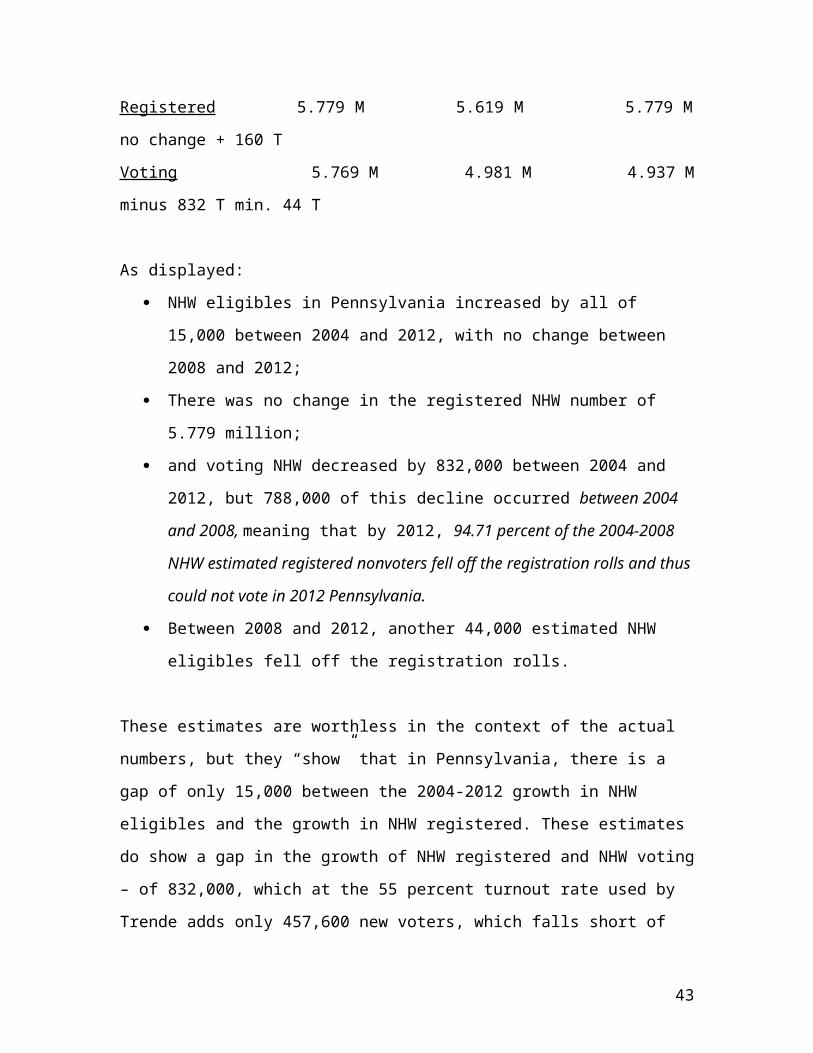
Registered 5.779 M 5.619 M 5.779 M
no change + 160 T
Voting 5.769 M 4.981 M 4.937 M
minus 832 T min. 44 T
As displayed:
NHW eligibles in Pennsylvania increased by all of
15,000 between 2004 and 2012, with no change between
2008 and 2012;
There was no change in the registered NHW number of
5.779 million;
and voting NHW decreased by 832,000 between 2004 and
2012, but 788,000 of this decline occurred between 2004
and 2008, meaning that by 2012, 94.71 percent of the 2004-2008
NHW estimated registered nonvoters fell off the registration rolls and thus
could not vote in 2012 Pennsylvania.
Between 2008 and 2012, another 44,000 estimated NHW
eligibles fell off the registration rolls.
These estimates are worthless in the context of the actual
numbers, but they “show” that in Pennsylvania, there is a
gap of only 15,000 between the 2004-2012 growth in NHW
eligibles and the growth in NHW registered. These estimates
do show a gap in the growth of NHW registered and NHW voting
– of 832,000, which at the 55 percent turnout rate used by
Trende adds only 457,600 new voters, which falls short of
43
the Obama 2008 margin by 162,878, and defeats the 2012
margin of 309,840 only at 83 percent Republican.50 At an
improbable 100 percent turnout, the Republican would need 68
percent.51 Moreover, 94.71 percent of this falloff occurred between 2004 and
2008, with the estimated persons exiting the Pennsylvania electorate after 2008.
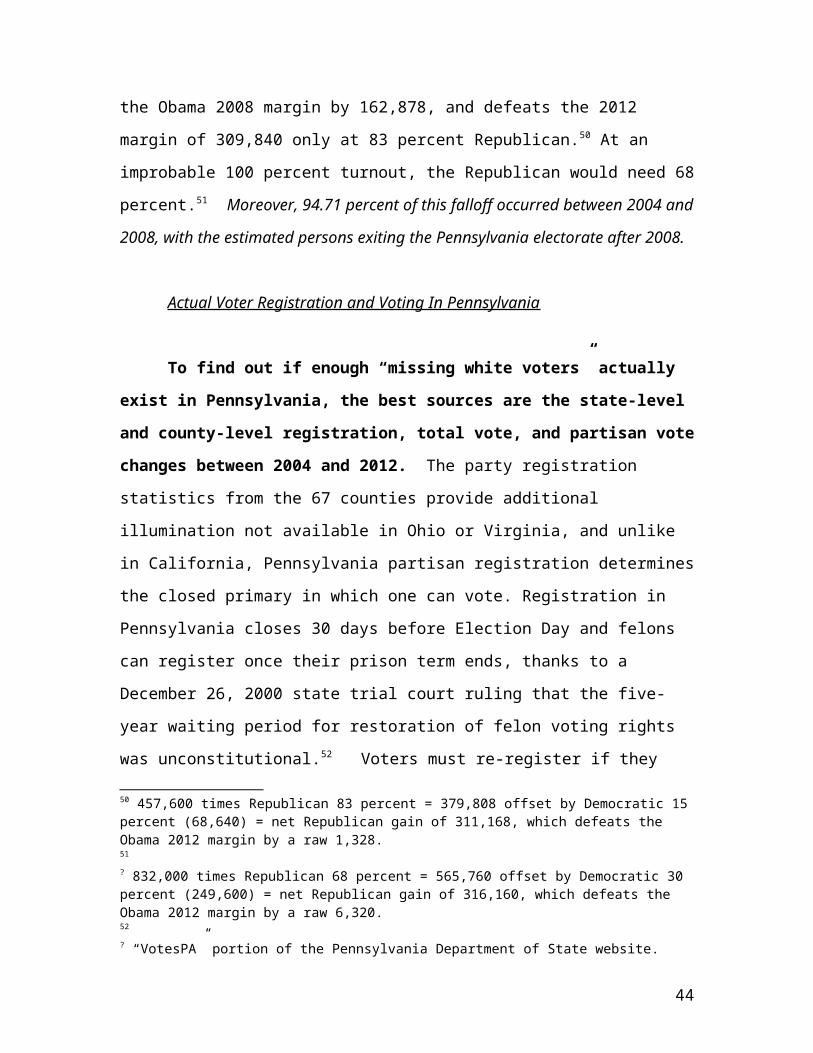
Actual Voter Registration and Voting In Pennsylvania
To find out if enough “missing white voters” actually
exist in Pennsylvania, the best sources are the state-level
and county-level registration, total vote, and partisan vote
changes between 2004 and 2012. The party registration
statistics from the 67 counties provide additional
illumination not available in Ohio or Virginia, and unlike
in California, Pennsylvania partisan registration determines
the closed primary in which one can vote. Registration in
Pennsylvania closes 30 days before Election Day and felons
can register once their prison term ends, thanks to a
December 26, 2000 state trial court ruling that the five-
year waiting period for restoration of felon voting rights
was unconstitutional.52 Voters must re-register if they
50 457,600 times Republican 83 percent = 379,808 offset by Democratic 15percent (68,640) = net Republican gain of 311,168, which defeats the Obama 2012 margin by a raw 1,328.51
? 832,000 times Republican 68 percent = 565,760 offset by Democratic 30 percent (249,600) = net Republican gain of 316,160, which defeats the Obama 2012 margin by a raw 6,320. 52
? “VotesPA” portion of the Pennsylvania Department of State website.
44
change their address anywhere, and if they move 29 or fewer
days before Election Day, they must go back to their old
precinct to vote, even if the new Erie resident’s old
precinct is in Easton on the New Jersey border.53
Pennsylvania is in the minority of 19 states that have
neither early voting nor no-excuses mail ballots, meaning
voters are susceptible to last-minute fusillades of
falsehoods lit by secret money, not to mention “poll
position” voter suppression operations.54 The Absentee
Ballot Application on the Pennsylvania Department of State
“votespa” portal requires voters to list a specific reason,
although one of the eligible reasons is a vacation on
Election Day.55 Pennsylvania also has a strict voter ID law
that the double-Republican legislature enacted with the
express intent of enabling “Governor Romney to carry the
53 “VotesPA” portion of the Pennsylvania Department of State website.
54 The easiest way to avoid Republican polling place intimidation is to vote by mail.
55 From the “votespa” portal on the Pennsylvania Department of State website:
An individual who, because of the elector's duties, occupation or business (including leaves of absence for teaching, vacations and sabbatical leaves), expects on Election Day to be absent from his/hermunicipality of residence during the entire period the polls are openfor voting and the spouse and dependents of such electors who are residing with or accompanying the elector and for that reason also expect to be absent from his/her municipality during the entire period the polls are open for voting (7 a.m. to 8 p.m.).
45
State [sic] of Pennsylvania” but the law was judicially
enjoined for both the 2012 and 2013 elections in the
Harrisburg commonwealth court trial.56
Pennsylvania’s 67 Counties: 43Rural, 24 Metropolitan
Pennsylvania has 67 counties, including Philadelphia
which is a unitary city and county. This article and
accompanying Charts XIV through XIX divide them as 43 in
Rural Pennsylvania and 24 in Metropolitan Pennsylvania.
Metropolitan Pennsylvania consists of:
the 5 Metro Philadelphia counties (Philadelphia
and the suburban quartet of Bucks, Chester,
Delaware and Montgomery);
the ten Eastern Pennsylvania counties from Berks
(Reading) through Wayne (including Lehigh,
Northampton, Monroe, Lackawanna and Luzerne)57;
56 Applewhite et al. v. Commonwealth of Pennsylvania, Commonwealth Court, Dauphin County, Docket No. 330 MD 2012. A complete collection of documents may be found on the American Civil Liberties Union of Pennsylvania website, www.aclupa.org 57 Plus Pike, Carbon and Schuylkill.
46
the four Western Pennsylvania Democratic counties
(Allegheny (Pittsburgh), Dauphin (Harrisburg),
Centre (Penn State) and Erie);
and the five Republican suburban Pittsburgh
counties (Armstrong, Butler, Fayette, Washington,
and Westmoreland).
Rural Pennsylvania consists of 11 Republican majority
registration small city counties, 23 small rural counties in
the “T” and nine formerly Democratic voting western
Pennsylvania counties:
Republican Small-City Pennsylvania 11: Adams
(Gettysburg), Clearfield Cumberland, Lancaster,
York, Blair (Altoona), Lebanon, Lycoming
(Williamsport), Franklin (Chambersburg),
Northumberland, and Warren;
Formerly Democratic Western Pennsylvania 9 (Elk,
Cambria (Johnstown), Greene, Beaver, Mercer,
Clinton, Indiana, Lawrence, Columbia); and,
Rural Pennsylvania “T”: remaining 23 counties
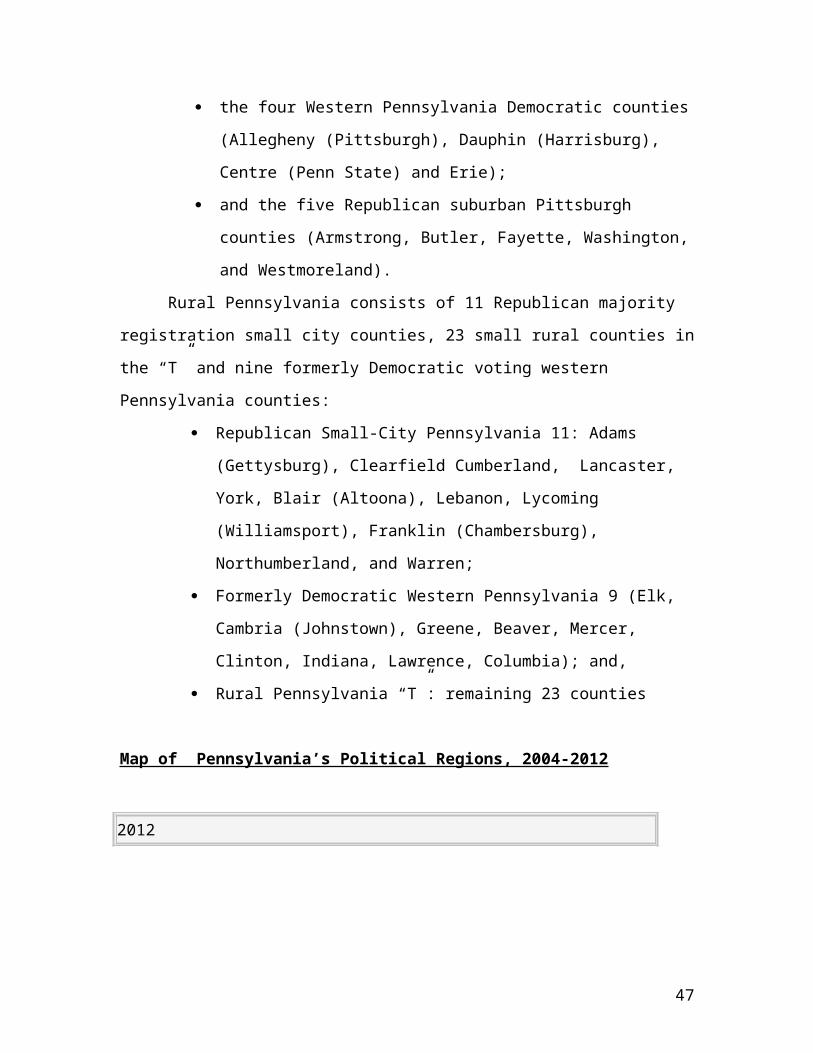
Map of Pennsylvania’s Political Regions, 2004-2012
2012
47
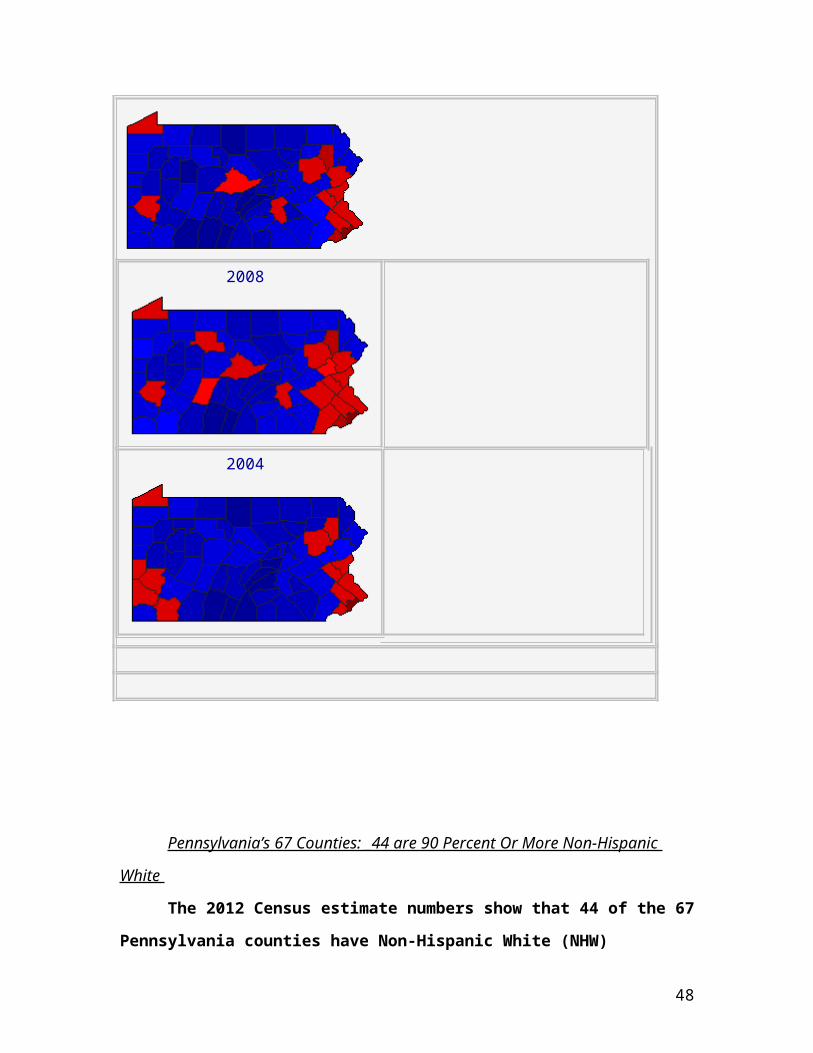
2008
2004
Pennsylvania’s 67 Counties: _44 are 90 Percent Or More Non-Hispanic
White
The 2012 Census estimate numbers show that 44 of the 67
Pennsylvania counties have Non-Hispanic White (NHW)
48
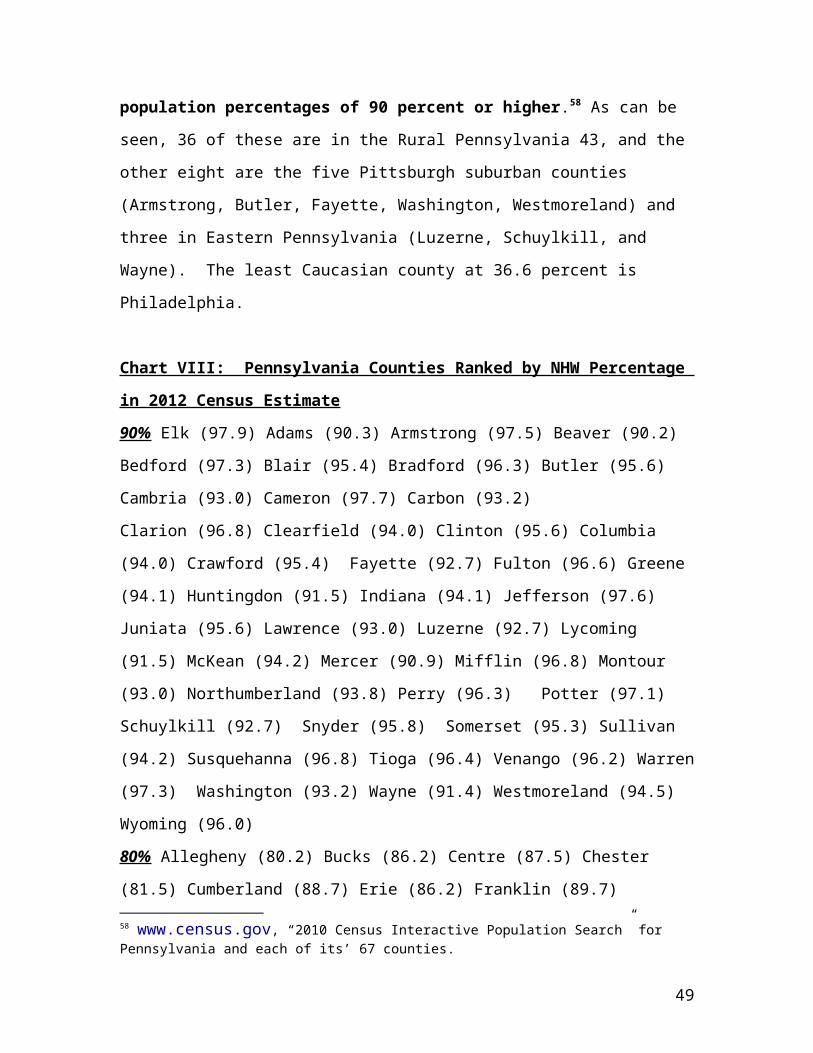
population percentages of 90 percent or higher.58 As can be
seen, 36 of these are in the Rural Pennsylvania 43, and the
other eight are the five Pittsburgh suburban counties
(Armstrong, Butler, Fayette, Washington, Westmoreland) and
three in Eastern Pennsylvania (Luzerne, Schuylkill, and
Wayne). The least Caucasian county at 36.6 percent is
Philadelphia.
Chart VIII: Pennsylvania Counties Ranked by NHW Percentage
in 2012 Census Estimate
90% Elk (97.9) Adams (90.3) Armstrong (97.5) Beaver (90.2)
Bedford (97.3) Blair (95.4) Bradford (96.3) Butler (95.6)
Cambria (93.0) Cameron (97.7) Carbon (93.2)
Clarion (96.8) Clearfield (94.0) Clinton (95.6) Columbia
(94.0) Crawford (95.4) Fayette (92.7) Fulton (96.6) Greene
(94.1) Huntingdon (91.5) Indiana (94.1) Jefferson (97.6)
Juniata (95.6) Lawrence (93.0) Luzerne (92.7) Lycoming
(91.5) McKean (94.2) Mercer (90.9) Mifflin (96.8) Montour
(93.0) Northumberland (93.8) Perry (96.3) Potter (97.1)
Schuylkill (92.7) Snyder (95.8) Somerset (95.3) Sullivan
(94.2) Susquehanna (96.8) Tioga (96.4) Venango (96.2) Warren
(97.3) Washington (93.2) Wayne (91.4) Westmoreland (94.5)
Wyoming (96.0)
80% Allegheny (80.2) Bucks (86.2) Centre (87.5) Chester
(81.5) Cumberland (88.7) Erie (86.2) Franklin (89.7)
58 www.census.gov, “2010 Census Interactive Population Search” for Pennsylvania and each of its’ 67 counties.
49
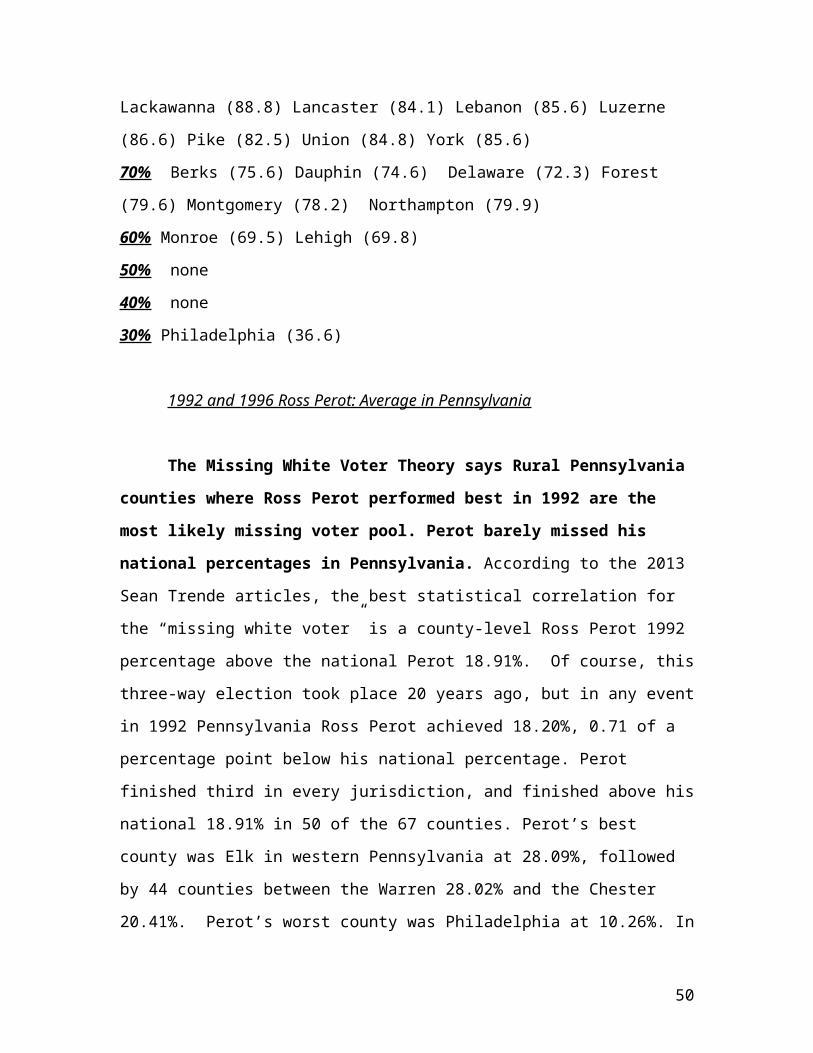
Lackawanna (88.8) Lancaster (84.1) Lebanon (85.6) Luzerne
(86.6) Pike (82.5) Union (84.8) York (85.6)
70% Berks (75.6) Dauphin (74.6) Delaware (72.3) Forest
(79.6) Montgomery (78.2) Northampton (79.9)
60% Monroe (69.5) Lehigh (69.8)
50% none
40% none
30% Philadelphia (36.6)
1992 and 1996 Ross Perot: Average in Pennsylvania
The Missing White Voter Theory says Rural Pennsylvania
counties where Ross Perot performed best in 1992 are the
most likely missing voter pool. Perot barely missed his
national percentages in Pennsylvania. According to the 2013
Sean Trende articles, the best statistical correlation for
the “missing white voter” is a county-level Ross Perot 1992
percentage above the national Perot 18.91%. Of course, this
three-way election took place 20 years ago, but in any event
in 1992 Pennsylvania Ross Perot achieved 18.20%, 0.71 of a
percentage point below his national percentage. Perot
finished third in every jurisdiction, and finished above his
national 18.91% in 50 of the 67 counties. Perot’s best
county was Elk in western Pennsylvania at 28.09%, followed
by 44 counties between the Warren 28.02% and the Chester
20.41%. Perot’s worst county was Philadelphia at 10.26%. In
50
the 1996 Perot encore run59, Perot achieved a national 8.40
percent and a Pennsylvania 9.56% percent, and performed
above 9 percent in 59 of the 67 counties.
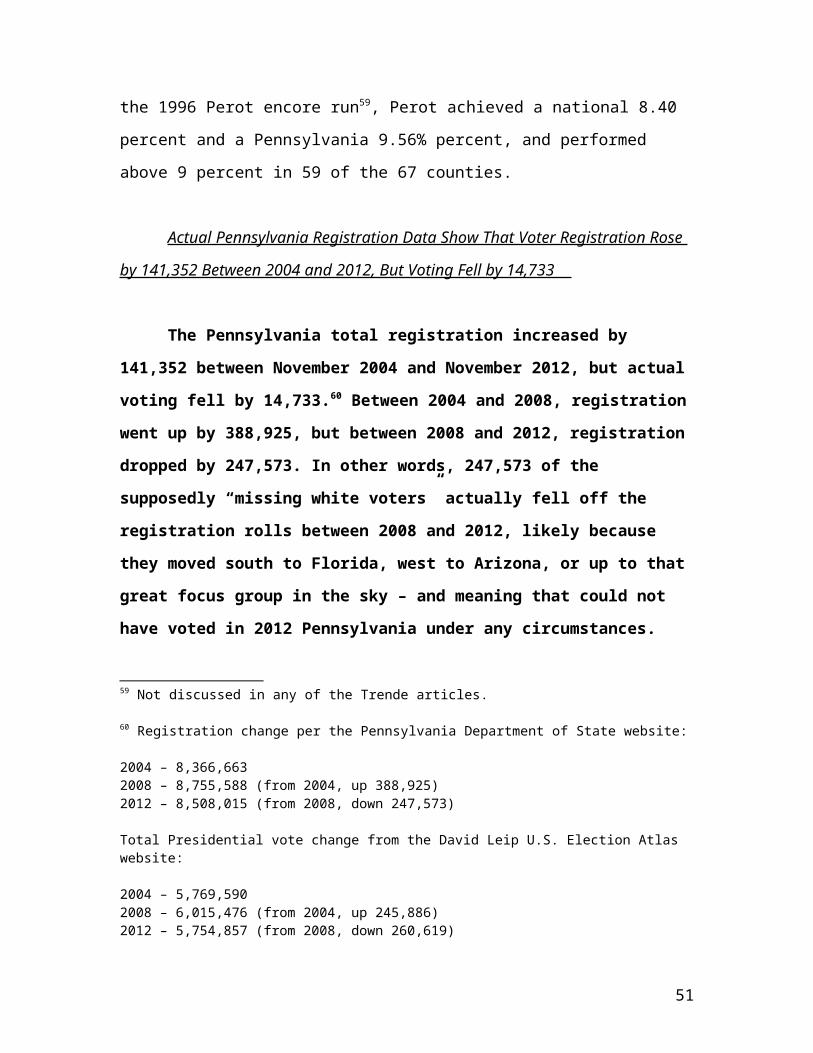
Actual Pennsylvania Registration Data Show That Voter Registration Rose
by 141,352 Between 2004 and 2012, But Voting Fell by 14,733
The Pennsylvania total registration increased by
141,352 between November 2004 and November 2012, but actual
voting fell by 14,733.60 Between 2004 and 2008, registration
went up by 388,925, but between 2008 and 2012, registration
dropped by 247,573. In other words, 247,573 of the
supposedly “missing white voters” actually fell off the
registration rolls between 2008 and 2012, likely because
they moved south to Florida, west to Arizona, or up to that
great focus group in the sky – and meaning that could not
have voted in 2012 Pennsylvania under any circumstances.
59 Not discussed in any of the Trende articles.
60 Registration change per the Pennsylvania Department of State website:
2004 – 8,366,6632008 – 8,755,588 (from 2004, up 388,925)2012 – 8,508,015 (from 2008, down 247,573)
Total Presidential vote change from the David Leip U.S. Election Atlas website:
2004 – 5,769,5902008 – 6,015,476 (from 2004, up 245,886)2012 – 5,754,857 (from 2008, down 260,619)
51
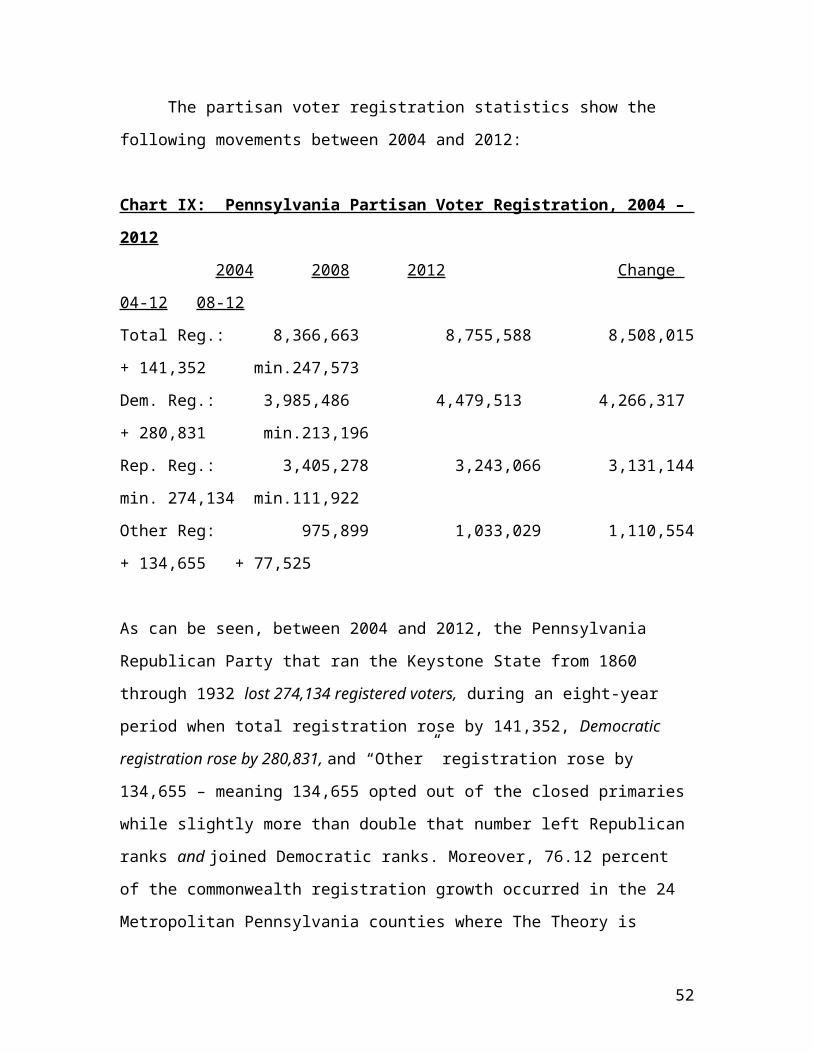
The partisan voter registration statistics show the
following movements between 2004 and 2012:
Chart IX: Pennsylvania Partisan Voter Registration, 2004 –
2012
2004 2008 2012 Change
04-12 08-12
Total Reg.: 8,366,663 8,755,588 8,508,015
+ 141,352 min.247,573
Dem. Reg.: 3,985,486 4,479,513 4,266,317
+ 280,831 min.213,196
Rep. Reg.: 3,405,278 3,243,066 3,131,144
min. 274,134 min.111,922
Other Reg: 975,899 1,033,029 1,110,554
+ 134,655 + 77,525
As can be seen, between 2004 and 2012, the Pennsylvania
Republican Party that ran the Keystone State from 1860
through 1932 lost 274,134 registered voters, during an eight-year
period when total registration rose by 141,352, Democratic
registration rose by 280,831, and “Other” registration rose by
134,655 – meaning 134,655 opted out of the closed primaries
while slightly more than double that number left Republican
ranks and joined Democratic ranks. Moreover, 76.12 percent
of the commonwealth registration growth occurred in the 24
Metropolitan Pennsylvania counties where The Theory is
52
irrelevant – between 2004 and 2012, registration in the 43
Rural Pennsylvania counties rose by only 33,748, whereas in
the 24 Metropolitan Pennsylvania counties, registration rose
by 107,604.
Pennsylvania Voting 2004 To 2012: Total Vote Down 14,733, Democrats
Up 245,359, Republicans Down 113,413
Between 2004 and 2012, the Pennsylvania total
Presidential vote fell by 14,733, but the Republican vote
fell by 113,413 – and the Democratic vote rose by 245,359.
The total Presidential vote between 2004 and 2012 fell by 27,484
in Rural Pennsylvania, but rose by 54,698 in Metropolitan
Pennsylvania. The Republican vote for President fell by 40,319
in Rural Pennsylvania and fell by 73,094 in Metropolitan
Pennsylvania -- in contrast, the Democratic vote fell by
only 6,025 in Rural Pennsylvania, but gained a whopping
251,384 in Metropolitan Pennsylvania.
Unlike Ohio and Virginia, the Pennsylvania Department
of State website does not have separate breakouts for
absentee and provisional ballots. According to the U.S.
Election Assistance Commission (EAC) report for the 2012
election61, Pennsylvania counties received 248,651
absentee/mail ballots for counting, and 246,716 were
61 Available on the EAC website, www.eac.gov.
53
counted, which is 4.28 percent of the total Pennsylvania
vote for President. On the provisional ballot front, the
EAC report states 49,000 were submitted, and 28,742 were
fully or partially counted.62
On the partisan vote for President front:
The Republican raw vote between 2004 and 2008 fell
by 137,962, whereas the Democratic number rose by
338,268.
Between 2008 and 2012, the Republican raw vote
went up by all of 24,549.
Between 2008 and 2012, the Democratic raw vote for
President fell by 286,089, 46.10 percent of the
2008 Obama margin of 620,478.
The total vote for “other” Presidential candidates
rose from 37,648 in 2004 (when Ralph Nader was
only a write-in, and 21,193 went to the
Libertarian or Constitution tickets) to 83,228 in
2008 (Nader on-ballot 11,483) and then rose again
to 84,149 in 2012. In 2004, 21,185 went to the
Libertarian candidate, 6,319 to the Constitution
Party, 6,318 to the Green Party, and 4,656 to
Nader write-ins. In 2008, Nader-Gonzalez won
42,917 and the Libertarian 19,912. In 2012, the
Libertarian ticket achieved 49,991 and the Green
ticket 23,341.
62 17,221 full, 11,521 partial.
54
Thus, in Pennsylvania between 2004 and 2012:
Total registration increased by 141,352,
starting with a 388,925 gain in 2008, yet
followed by a crash of 247,573 in 2012.
Republican registration fell by 273,840 –
238,699 in Metropolitan Pennsylvania and 35,141
in Rural Pennsylvania.
The total Presidential vote fell by 14,733.
The Democratic raw vote for President rose by
52,179 and the Republican fell by 113,413.
The Republican commonwealth-wide lost vote
number of 113,413 is 41.41 percent of the
Republican registration decrease between 2004
and 2012.
If in 2016 the 2012 Democratic number remains static,
Republicans need another 310,000 votes to win Pennsylvania
by a record close raw margin of 160. This could come from
flipping 155,000 Democratic votes, or under The Missing
White Voter Theory, from a Rural Pennsylvania electorate of
310,000 that “stayed home” in 2012 rather than choose
between Mitt “47 percent” Romney and President Obama.
Trouble is, the registered nonvoter increase in Rural
Pennsylvania between 2004 and 2012 is only 61,232. While
759,964 registered voters in Rural Pennsylvania did not vote
55

in 2012, 91.94 percent or 698,732 did not vote in 2004
either.
At the 55 percent turnout rate used by Sean Trende in
his articles, 417,980 of the 759,964 registered 2012
nonvoters might turn out, and the 2016 Republican nominee
will need 87 percent to defeat the 2012 Obama margin, and
mathematically cannot defeat the 2008 Obama margin of
620,478:
417,980 x .02% Other (8,359), 11% Democratic (45,977), and 87% Republican
(363,642) minus Dem. added 45,977 = 317,665, defeating the 2012 Obama
margin by 7,825 raw votes.
At a 40 percent turnout rate, The Theory mathematically
cannot defeat the 2012 Obama margin: 759,964 x .40 =
303,985, underperforming Obama 309,840
At improbably higher turnout rates above 55 percent:
65% of 2012 nonvoting 759,964 = 493,976. 2% Other =
9,879. 17% Dem = 83,975, 81% Rep. = 400,120 minus
83,975 = 316,145 beats Obama 2012 by 6,305
70% of 2012 nonvoting 759,964 = 531,974. 2% Other =
10,639. 19% Dem = 101,075. 79% Rep. = 420,259 minus
101,075 = 319,184, beats Obama 2012 by 9,344
Beats 2008 Obama margin of 620,478 only at 90 percent
turnout = 683,967. 2% other = 13,679. 3% Dem. = 20,519.
56
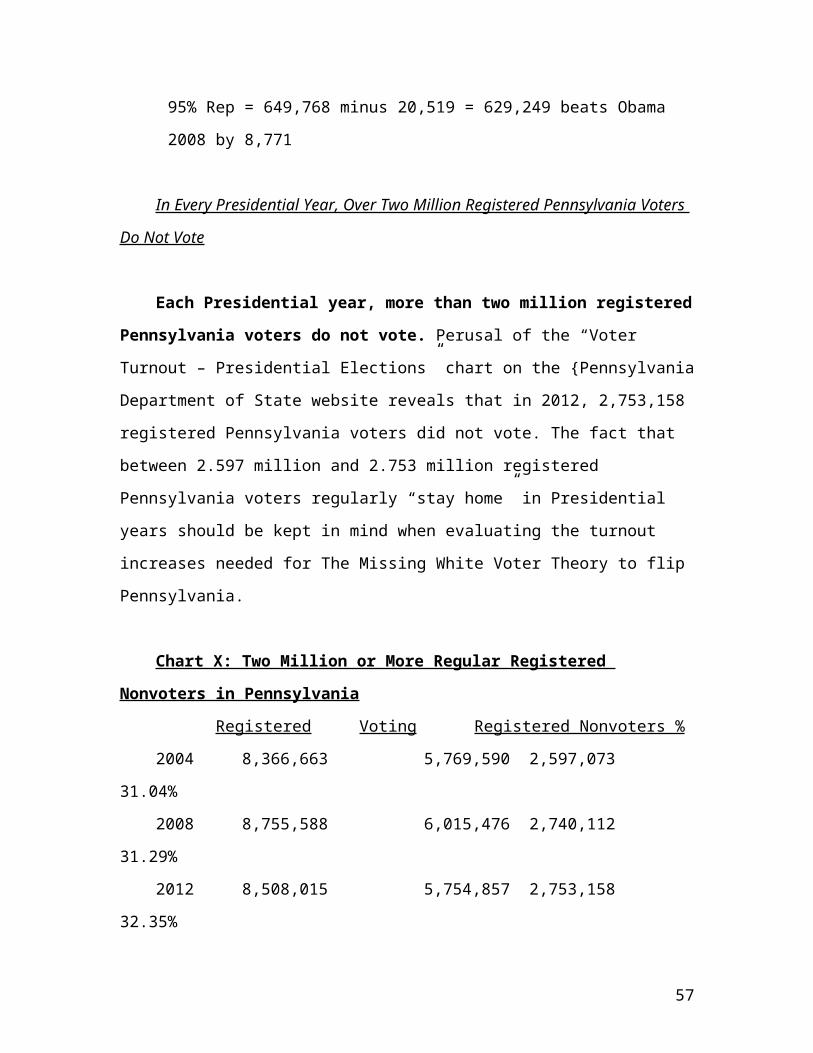
95% Rep = 649,768 minus 20,519 = 629,249 beats Obama
2008 by 8,771
In Every Presidential Year, Over Two Million Registered Pennsylvania Voters
Do Not Vote
Each Presidential year, more than two million registered
Pennsylvania voters do not vote. Perusal of the “Voter
Turnout – Presidential Elections” chart on the {Pennsylvania
Department of State website reveals that in 2012, 2,753,158
registered Pennsylvania voters did not vote. The fact that
between 2.597 million and 2.753 million registered
Pennsylvania voters regularly “stay home” in Presidential
years should be kept in mind when evaluating the turnout
increases needed for The Missing White Voter Theory to flip
Pennsylvania.
Chart X: Two Million or More Regular Registered
Nonvoters in Pennsylvania
Registered Voting Registered Nonvoters %
2004 8,366,663 5,769,590 2,597,073
31.04%
2008 8,755,588 6,015,476 2,740,112
31.29%
2012 8,508,015 5,754,857 2,753,158
32.35%
57
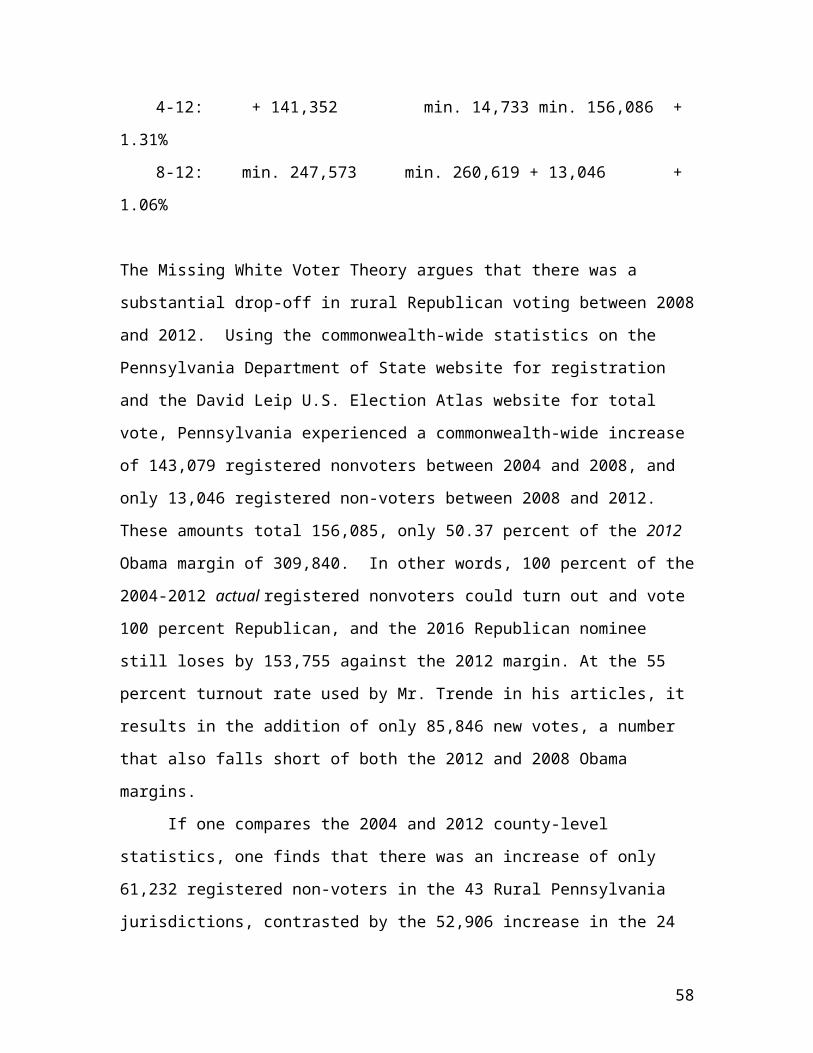
4-12: + 141,352 min. 14,733 min. 156,086 +
1.31%
8-12: min. 247,573 min. 260,619 + 13,046 +
1.06%
The Missing White Voter Theory argues that there was a
substantial drop-off in rural Republican voting between 2008
and 2012. Using the commonwealth-wide statistics on the
Pennsylvania Department of State website for registration
and the David Leip U.S. Election Atlas website for total
vote, Pennsylvania experienced a commonwealth-wide increase
of 143,079 registered nonvoters between 2004 and 2008, and
only 13,046 registered non-voters between 2008 and 2012.
These amounts total 156,085, only 50.37 percent of the 2012
Obama margin of 309,840. In other words, 100 percent of the
2004-2012 actual registered nonvoters could turn out and vote
100 percent Republican, and the 2016 Republican nominee
still loses by 153,755 against the 2012 margin. At the 55
percent turnout rate used by Mr. Trende in his articles, it
results in the addition of only 85,846 new votes, a number
that also falls short of both the 2012 and 2008 Obama
margins.
If one compares the 2004 and 2012 county-level
statistics, one finds that there was an increase of only
61,232 registered non-voters in the 43 Rural Pennsylvania
jurisdictions, contrasted by the 52,906 increase in the 24
58
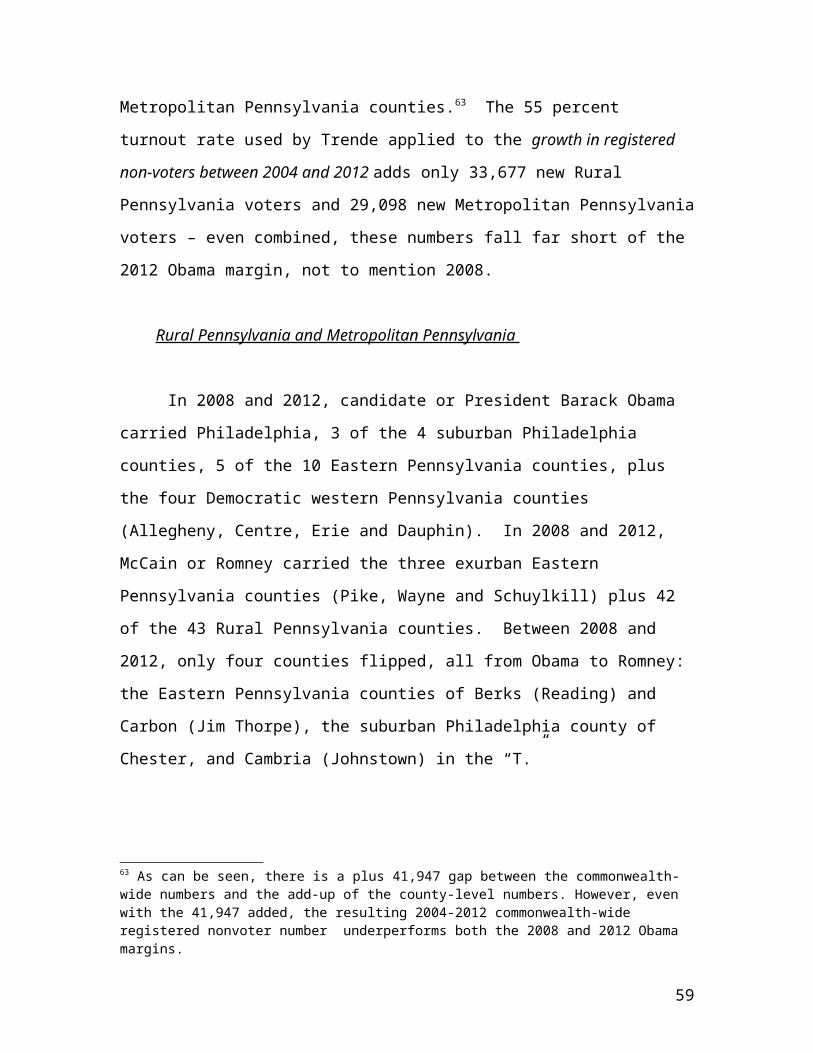
Metropolitan Pennsylvania counties.63 The 55 percent
turnout rate used by Trende applied to the growth in registered
non-voters between 2004 and 2012 adds only 33,677 new Rural
Pennsylvania voters and 29,098 new Metropolitan Pennsylvania
voters – even combined, these numbers fall far short of the
2012 Obama margin, not to mention 2008.
Rural Pennsylvania and Metropolitan Pennsylvania
In 2008 and 2012, candidate or President Barack Obama
carried Philadelphia, 3 of the 4 suburban Philadelphia
counties, 5 of the 10 Eastern Pennsylvania counties, plus
the four Democratic western Pennsylvania counties
(Allegheny, Centre, Erie and Dauphin). In 2008 and 2012,
McCain or Romney carried the three exurban Eastern
Pennsylvania counties (Pike, Wayne and Schuylkill) plus 42
of the 43 Rural Pennsylvania counties. Between 2008 and
2012, only four counties flipped, all from Obama to Romney:
the Eastern Pennsylvania counties of Berks (Reading) and
Carbon (Jim Thorpe), the suburban Philadelphia county of
Chester, and Cambria (Johnstown) in the “T.”
63 As can be seen, there is a plus 41,947 gap between the commonwealth-wide numbers and the add-up of the county-level numbers. However, even with the 41,947 added, the resulting 2004-2012 commonwealth-wide registered nonvoter number underperforms both the 2008 and 2012 Obama margins.
59
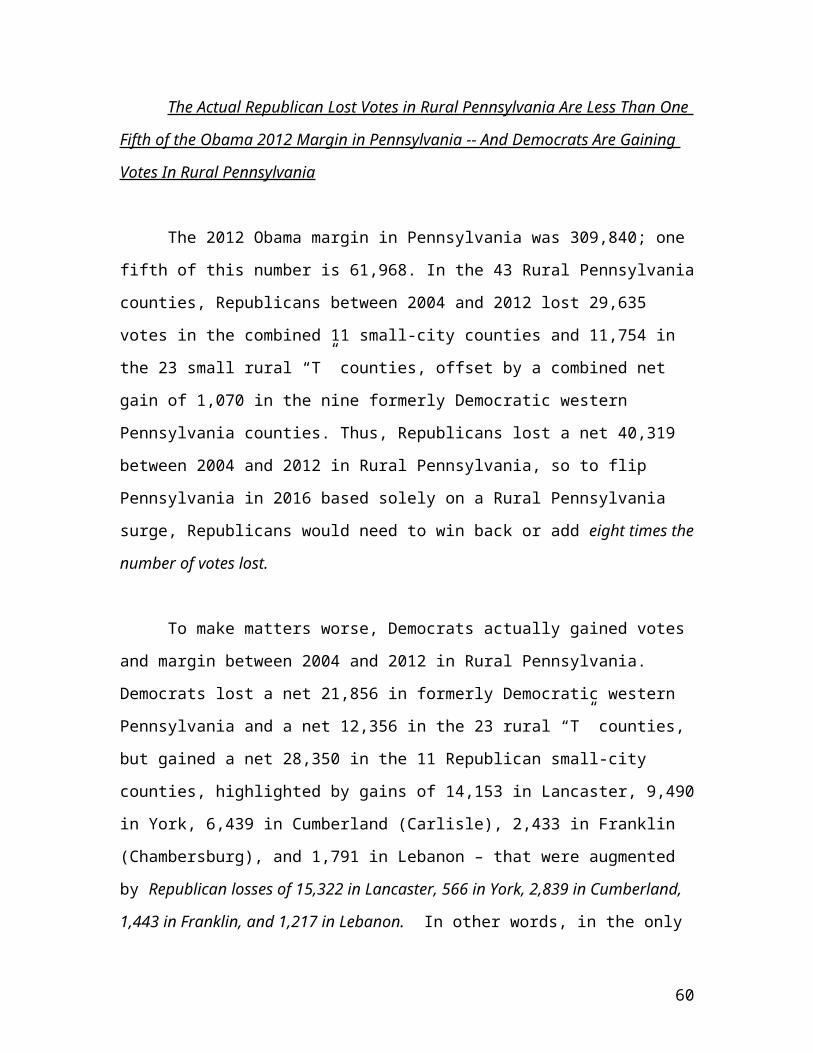
The Actual Republican Lost Votes in Rural Pennsylvania Are Less Than One
Fifth of the Obama 2012 Margin in Pennsylvania -- And Democrats Are Gaining
Votes In Rural Pennsylvania
The 2012 Obama margin in Pennsylvania was 309,840; one
fifth of this number is 61,968. In the 43 Rural Pennsylvania
counties, Republicans between 2004 and 2012 lost 29,635
votes in the combined 11 small-city counties and 11,754 in
the 23 small rural “T” counties, offset by a combined net
gain of 1,070 in the nine formerly Democratic western
Pennsylvania counties. Thus, Republicans lost a net 40,319
between 2004 and 2012 in Rural Pennsylvania, so to flip
Pennsylvania in 2016 based solely on a Rural Pennsylvania
surge, Republicans would need to win back or add eight times the
number of votes lost.
To make matters worse, Democrats actually gained votes
and margin between 2004 and 2012 in Rural Pennsylvania.
Democrats lost a net 21,856 in formerly Democratic western
Pennsylvania and a net 12,356 in the 23 rural “T” counties,
but gained a net 28,350 in the 11 Republican small-city
counties, highlighted by gains of 14,153 in Lancaster, 9,490
in York, 6,439 in Cumberland (Carlisle), 2,433 in Franklin
(Chambersburg), and 1,791 in Lebanon – that were augmented
by Republican losses of 15,322 in Lancaster, 566 in York, 2,839 in Cumberland,
1,443 in Franklin, and 1,217 in Lebanon. In other words, in the only
60
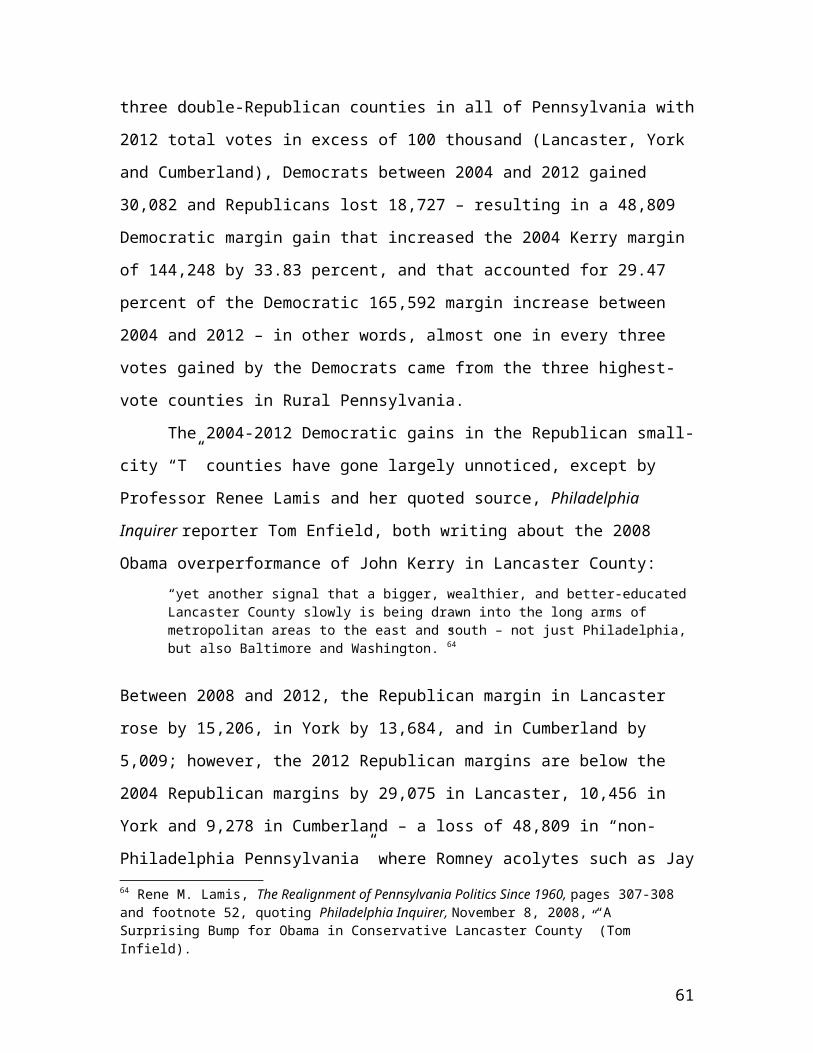
three double-Republican counties in all of Pennsylvania with
2012 total votes in excess of 100 thousand (Lancaster, York
and Cumberland), Democrats between 2004 and 2012 gained
30,082 and Republicans lost 18,727 – resulting in a 48,809
Democratic margin gain that increased the 2004 Kerry margin
of 144,248 by 33.83 percent, and that accounted for 29.47
percent of the Democratic 165,592 margin increase between
2004 and 2012 – in other words, almost one in every three
votes gained by the Democrats came from the three highest-
vote counties in Rural Pennsylvania.
The 2004-2012 Democratic gains in the Republican small-
city “T” counties have gone largely unnoticed, except by
Professor Renee Lamis and her quoted source, Philadelphia
Inquirer reporter Tom Enfield, both writing about the 2008
Obama overperformance of John Kerry in Lancaster County: “yet another signal that a bigger, wealthier, and better-educated Lancaster County slowly is being drawn into the long arms of metropolitan areas to the east and south – not just Philadelphia, but also Baltimore and Washington.”64
Between 2008 and 2012, the Republican margin in Lancaster
rose by 15,206, in York by 13,684, and in Cumberland by
5,009; however, the 2012 Republican margins are below the
2004 Republican margins by 29,075 in Lancaster, 10,456 in
York and 9,278 in Cumberland – a loss of 48,809 in “non-
Philadelphia Pennsylvania” where Romney acolytes such as Jay64 Rene M. Lamis, The Realignment of Pennsylvania Politics Since 1960, pages 307-308 and footnote 52, quoting Philadelphia Inquirer, November 8, 2008, “A Surprising Bump for Obama in Conservative Lancaster County” (Tom Infield).
61
Cost believed the vote would flip Pennsylvania in 201265; in
his Election Eve article, Cost screamed “[d]rive up
[Republican] turnout in the exurban counties of Lancaster and
York while mitigating losses in the interior suburban
counties.” Trouble is, between 2004 and 2012, Democrats
added 23,643 in these two counties whereas Republicans lost
65
? In 2012, Republican acolyte Jay Cost, writing a series of “Romney willwin” columns in The Weekly Standard, in the final column two days before the election (on November 4) argued that the Romney last-week Pennsylvania push was “reasonable” because Democratic support in the Philadelphia suburbs was “hyped” and between 1988 and 2008, was more than offset by Republican gains in Lancaster and York. Cost did not mention Adams (Gettysburg), but should have, since Republican percentages in this quintessential Civil War county are still above 60 percent.
However, between 2004 and 2012, the Republican margin in Lancaster-York-Adams fell by 42,341, whereas the Democratic margin in the Philadelphia suburban quartet rose by 36,203, and in Philadelphia, by 80,233.
Responding to the 1988-2012 comparison used by Cost, the author notes that between 1988 and 2012, the Republican margin in Lancaster-York-Adams fell from 100,065 to 93,974 (minus 6,091), and in the Philadelphiasuburban quartet, went from Bush 205,732 to Obama 123,327, a Republican margin loss of 329,059; the Democratic Philadelphia margin more than doubled, from 230,513 to 492,339 (plus 261,826). These Democratic gainsin Metro Philadelphia (total 590,805) and a 6,091 Republican loss in Lancaster-York-Adams occurred as the commonwealth-wide total vote rose from 4,536,251 to 5,754,560 (plus 1,218,309), meaning the net Democraticgain (596,896) was 48.99 percent of the commonwealth total vote increasebetween 1988 and 2012.
In his Weekly Standard article, Cost compares only Lancaster and York to the Philadelphia suburbs. The author’s inclusion of adjacent Adams (Gettysburg) with Lancaster and York helps Cost, because the quintessential Civil War Republican county of Adams gave Bush the Elder 64.92% and Romney 2012 a percentage of 63.03%. In contrast, in Lancaster, the Republican percentage fell from 70.77% to 58.50%, and in York, fell from 65.16% to 59.64%.
62
15,888, and in Cumberland (Carlisle), Democrats added 6,439
and Republicans lost 2,839 – another 9,278 in Democratic
margin gain; in Lebanon, Democrats added 1,791 and
Republicans lost 1,217 (Democrats plus 3,008), and in Adams
(Gettysburg), Republicans lost 1,480 and Democrats lost
1,327 (Republican net margin loss of 153). Instead of
looking for nonexistent Missing White Voters in Rural
Pennsylvania, Republicans need to craft a strategy for
winning back the actual voters who spurred the Democratic
raw vote gains in the three “T” counties with total votes in
excess of 100,000.
In Metropolitan Pennsylvania, There Are 1.993 Million Registered 2012
Nonvoters In 24 Counties That Added A Net 58,204 Democratic Votes Between
2004 and 2012
The Metropolitan Pennsylvania registered nonvoter
population is much higher (1,993,493 in 2012), but these
Pennsylvanians live in the five Metro Philadelphia counties,
the ten Eastern Pennsylvania counties, the four Democratic
western Pennsylvania counties, and even in the five Romney-
carried suburban Pittsburgh counties – a 24-county
collection where Democrats gained a net 58,204 and
Republicans lost 73,094, increasing the commonwealth
Democratic margin by 131,298.
63
Is there an undiscovered missing Caucasian Republican
electorate in the 24 Metropolitan Pennsylvania counties? Not
according to the Missing White Voter Theory -- which
predicts these voters exist in Rural Pennsylvania, not
Metropolitan Pennsylvania. However, it deserves review,
because as displayed below in Chart XV (Metropolitan
Pennsylvania registration and voting), the total number of
2012 registered nonvoters in Metropolitan Pennsylvania is
1,993,493, which superficially seems like a large pool where
only 16 percent (318,958) need to be found, persuaded and
turned out – at an improbable 100 percent Republican share.
If 100 percent of the 1,993,493 remain on the rolls in 2016,
turn out, and break 60 percent Republican, 38 percent
Democratic, 2 percent Others, here is what happens:
2016 New Voters
Dem. 2008: 620,478 Dem. Margin + 757,527 new D =
1,378,005
Dem.2012: 309,840 + 757,527 new
D = 1,067,367
Republican New Voters: + 1,196,095 = R 128,728 margin
win against the 2012 Obama margin, but 181,910 loss against
2008 Obama margin.
If the Republican gets 65 percent and the Democrat 33
percent, the 2008 Democratic margin goes up by 657,852 (to
64

1,278,330) and the Republican adds 1,295,770, which defeats
the 2008 Obama margin by all of 17,440.
As can be seen, the Republican missing voters trump
either Obama margin, – by 17,440 against the 2008 margin,
and by 128,728 against the 2012 margin, but only after
creating a Pennsylvania total vote:
increased by nearly two million -- 1,993,493 to
8,008,969 or 7,748,350;
increased in percentage terms above 2008 or 2012
numbers by 33.13 or 34.64 percentage points,
double the 17.43 percent total vote increase
between 2000 and 2004 (the Ken Mehlman surge of
856,471), and well above the 22.64 percent
Eisenhower surge between 1948 and 1952 (up
845,821);
and in raw number terms but not percentage terms,
well above even the highest-ever total vote surge
in Pennsylvania history – the 1932 to 1936
increase of 1,279,249 – a whopping 44.74
percentage gain over the 1932 total, in the
quadrennium when the Pennsylvania Republican
Machine collapsed, or the 1,005,760 gain between
1924 and 1928, an even more whopping 46.89
65
percent gain driven by the opportunity to vote
for or against Al Smith.
Thus, there is no post-1936 Pennsylvania historical
precedent for the turnout surge required by the Missing
White Voter Theory – not even in The Missing White Voter
Theory articles, which use a 55 percent turnout rate for the
“missing voters.” Fifty-five percent of 1,993,493 is
1,096,421, and to defeat the 2008 Obama margin, the 2016
Republican ticket will need 79 percent; to top only the 2012
margin, he or (not likely) she will need 64 percent.66
Trouble is, of the 24 Metropolitan Pennsylvania
jurisdictions, only three gave Mitt Romney percentages in
excess of 60 percent: the Pittsburgh suburban counties of
Armstrong (67.77%), Butler (66.62%), and Westmoreland
(61.29%). However, the total number of 2012 registered
nonvoters in these counties is 12,426 in Armstrong, 33,063
in Butler, and 68,434 in Westmoreland – a total of 113,923,
which at 55 percent turnout adds only 62,657 new voters,
66 For 2008:
1,096,421 x 79 percent (Republican plus 866,172) offset by Democratic 19percent (plus 208,319) = Republican net gain of 657,853, topping the Obama 2008 margin by a raw 37,375.
For 2012:
1,096,421 x 64 percent (Republican plus 701,709) offset by Democratic 34percent (plus 372,783) = Republican net gain of 328,925, topping the Obama 2012 margin by a raw 19,085.
66
barely one fifth of the 2012 Obama margin. The highest
Metropolitan Pennsylvania Romney percentage east of
Pittsburgh suburbia is the 59.68% in Wayne County in Eastern
Pennsylvania, where the 2012 registered nonvoter number is
10,970. In other words, the linchpin of The Theory is
registered non-voter turnout or total vote increases that
has never occurred in the history of Pennsylvania.
Democratic Vote Gains and Republican Vote Losses in Metropolitan
Pennsylvania, 2004-2012
A close analysis of actual registration and actual
voting in the 24 Metropolitan Pennsylvania jurisdictions
between 2004 and 2012 shows that Democrats are gaining
enough new votes in Metropolitan Pennsylvania to the point
that a 100 percent registered nonvoter turnout in the 43
Rural Pennsylvania jurisdictions would not matter. In
analyzing these numbers, one should also look at the Jay
Cost “Morning Jay” column in The Weekly Standard of November 4,
2012, where two days before the election Jay Cost screamed
that President Obama would lose Pennsylvania because the
Philadelphia Democratic margin would not stay at or exceed
the 2008 number of 470,000, and that “non-Philadelphia
Pennsylvania” had been trending Republican since 1988. Cost
argued: “The political story of Pennsylvania comes down to a
battle between Philadelphia County and the rest of the
state.” Cost urged time travel back to 2004 (where Bush
67
still lost), plus an increase from the 2004 Bush margin in
suburban Chester county, a flip of Bucks County, keeping the
Allegheny County Democratic margin down to 10-12 percentage
points, winning all the McCain counties with larger margins,
improve on Bush 2004 numbers in Erie, Lackawanna (Scranton),
Luzerne (Wilkes-Barre) and Lehigh (Allentown), and “drive up
turnout in the exurban counties of Lancaster and York.”
Every actual 2012 vote movement went against the Jay Cost
arguments:
The actual Obama 2008 Philadelphia margin was
478,759, and in 2012, it went up to 492,339 even
though the Democratic raw vote fell by 7,174 –
because the Republican raw vote fell by 20,954,
pushing the Republican raw vote number below
100,000 for the first time since 1880 and the
party-split elections of 1912 (Taft) and 1996
(Perot). As displayed in Chart XIX (party
registration in Metropolitan Pennsylvania),
between 2004 and 2012 Republican registration in
Philadelphia fell by 42,863, whereas Democratic
registration rose by 60,111.
Chester County was the only suburban Philadelphia
county to flip from Obama 2008 to Romney 2012, but
the margin shift was only 23,941, with the county
flipping from Obama 23,412 to Romney by 529 –
which was 9,799 below the Bush 2004 margin.
68
Bucks County remained Democratic, albeit with a
margin drop from 2008 by 24,841 that kept the
county Democratic by 3,942, below the 2004 Kerry
number of 8,969.
In Delaware County, the Obama margin fell by only
2,658, and the resulting 2012 margin of 63,597 was
21,421 above the Kerry margin.
In Montgomery County, the Obama margin fell by
28,866, but the resulting 58,975 was 12,668 above
the Kerry margin.
In Lackawanna (Scranton), the Obama margin fell by
only 1,279, and the resulting 26,753 was almost
double the Kerry margin of 14,807.
In Luzerne (Wilkes-Barre), the Obama margin fell
by 5,383, but the resulting 5,982 was still above
the Kerry margin of 4,620.
In Lehigh (Allentown), the Obama margin fell by
12,298, but the resulting 11,409 was triple the
Kerry margin of 3,780.
In Erie, the Obama margin fell by 6,413, but the
resulting 19,011 was nearly double the Kerry
margin of 10,549.
In Allegheny County (Pittsburgh), the 2012 Obama
margin was 14.53 percentage points.
The 2012 Greater Philadelphia results are the Pennsylvania version of the Sean Trende March 18, 2011 Real Clear Politics
69
article: “Obama Should Use "Colorado Strategy" to Win Ohio”,in which Trende urged Democrats to focus on white-collar voters with college degrees, who are even more prominent insuburban Philadelphia than in Columbus, Ohio.
As can be seen, the Democratic margins from the 15
Greater Philadelphia counties and the four Democratic
Western Pennsylvania counties created a margin wall that
could not be overcome in the 5 suburban Pittsburgh or the 43
Republican “T” counties:
Pennsylvania 2012: President Obama’s and Mitt Romney’s
margins
Metropolitan Pennsylvania
Philadelphia: Obama 492,339
Suburban Philadelphia: Bucks-Delaware-Montgomery Obama
123,856, minus Chester Romney 529 = Obama 123,327
Eastern Pennsylvania: Lackawanna-Luzerne-Lehigh-
Monroe-Northampton Obama 58,658, minus Berks-Carbon-Pike-
Schuylkill-Wayne Romney 18,423 = Obama 40,235
Total Greater Philadelphia Margin: Dem. 655,901 out of
total vote of 2,679,368
Allegheny (Pittsburgh): Obama 90,648
Dauphin (Harrisburg): Obama 7,515
Centre (Penn State): Obama 175
Erie: Obama 19,011 = total
Obama 117,349 out of total vote of 937,128
70
Total 19-county Democratic margin: 773,250 out of a total
vote of 3,616,496
Remaining 48-county total vote: 2,138,361
Pittsburgh 5 suburban counties: Romney total 99,450 margin
out of total vote of 432,619
Rural Pennsylvania “T” 43 counties: total vote 1,705,742 –
Romney margin 363,960
To overcome the 2012 Obama commonwealth margin of
309,840 exclusively from Rural Pennsylvania, Republicans
would need to nearly double their 2012 “T” margin of 363,960
to 674,000, which would enable them to win Pennsylvania by
all of 200 votes. This requires adding 310,040 in margin --
either from 310,040 “missing white voters” or 155,020
switched Obama 2012 voters. There are 759,964 registered
2012 nonvoters in the 43 Rural Pennsylvania counties, but
698,732 or 91.94% went missing in 2004 as well, and the
increase was only 61,232. Moreover, in 2004, President Bush
the Elder won the “T” by 398,254 – 34,294 below the 2012
Romney margin. Far from gaining margin in the “T” sufficient
to overcome the Democratic Metropolitan Pennsylvania
margins, Republicans have been on the decline. In contrast,
between 2004 and 2012, the Democratic margin from the 24
Metropolitan counties rose by 131,298, from 542,502 to
673,800 – even though these numbers include a Democratic
71
loss of 49,995 in margin from the five suburban Pittsburgh
counties.67
The Greater Philadelphia Democratic 159,083 margin gainbetween 2004 and 2012 was recognized by the 2011 tri-Republican redistricters of the Pennsylvania U.S. House districts, who dumped as many Democrats as possible into thePhiladelphia districts 1 and 2 (Robert Brady and Chaka Fatah), Montgomery County district 13 (Allyson Schwartz), and Lackawanna-Luzerne district 17 (Matt Cartwright) so theycould nest still-Republican or marginal Berks County with Chester and Delaware counties for district 6 (Jim Gerlach) and district 7 (Pat Meehan); Bucks and part of Montgomery for district 8 (Mike Fitzpatrick); and Lebanon County with Berks and Dauphin (Harrisburg) for district 15 (Charlie Dent).
The Missing White Voter Theory Registered Nonvoter Turnout Has Never
Occurred in Pennsylvania, And Republican Caucasian Solidarity Appeals Will Turn
Off Voters in Metropolitan Pennsylvania
Pennsylvania electoral history will be made if enough
of the current registered nonvoters (or unregistered
eligibles) will both turn out in 2016 and break Republican
at the percentage levels needed to flip the commonwealth.
67 Republican + 16,394, Democratic minus 33,601.
72
Most studies of nonvoters conclude that they are similar to
the voting population, or are more liberal on economic
issues (and perhaps conservative on social issues). If the
Republican nominee in 2016 relies on white resentment
appeals to this “hidden” nonvoting (or even nonregistered)
electorate, he or (not likely) she runs the risk of
alienating existing Republican voters in Metropolitan
Pennsylvania – as Sean Trende stated at the end of in his
July 2, 2013 article, “every action in politics tends to create
an opposite one.” Trende has repeatedly noted in his The Lost
Majority and elsewhere, that adding a new element to a
coalition frequently induces existing loyalists to “head for
the exits” (this happened to the Democratic Party in fits
and starts between the 1934 election of the first African-
American Democratic Congressmember in Illinois-1 and the
post-1964 departure of most Deep Southern Caucasians).
Thus, Trende’s own coalition analysis militates against the
idea that the Missing White Voters can flip any state. In
1964, Republican Deep South appeals to registered and
unregistered segregationists flipped the 1960 Kennedy states
of Georgia, Alabama, Louisiana, and South Carolina, plus
Mississippi, but cost the Republicans everything else.
Within 1960 Nixon states of Virginia, Florida, and
Tennessee, Republicans flipped 1960 Democratic counties full
of segregationists, but suffered decisive counterflips of
1960 Nixon counties in Northern Virginia and the
73
Shenandoahs; in 1964 Pennsylvania, Republicans lost margin
in every county from 1960, and carried only four counties.68
A 2016 Missing White Voter appeal will probably have the
same impact in Metropolitan Pennsylvania, not to mention
metropolitan areas in Ohio, Virginia, Florida, Colorado,
Iowa, Nevada and New Mexico.
Republicans Between 2004 and 2012 Lost 273,840 Registered Voters in
Pennsylvania While Democrats Gained A Net 248,103
Another illuminating statistic available in
Pennsylvania is the partisan voter registration trend. The
Pennsylvania partisan voter registration statistics
displayed in Charts XVIII (rural Pennsylvania) and XIX
(metropolitan Pennsylvania) below show Republicans lost
273,840 registered voters between 2004 and 2012 – minus
35,141 in Rural Pennsylvania, and minus 238,699 in
Metropolitan Pennsylvania, where Democrats gained 251,384,
more than enough to offset their Rural Pennsylvania loss of
3,281.
In the search for new registrants in the 11 Republican
small-city counties in the “T”, Democrats outregistered
Republicans – Democrats up 52,004, Republicans down 17,225.
Democrats outregistered Republicans in 8 of the 11 counties
– all except Clearfield, Franklin and Northumberland. In
Lancaster, Democrats added 17,884 and Republicans lost 17,799;
68 Wayne, Lebanon, Snyder and Union.
74
in York, Democrats gained 12,140 and Republicans lost 695;
in Cumberland (Carlisle), Democrats added 9,835 and
Republicans lost 548. In Blair (Altoona), which between 1836
and 2012 supported a Democratic Presidential candidate only
in 1936 and 1964, Democrats outregistered Republicans 2,558
to 153. In the nine formerly Democratic Western
Pennsylvania counties, Democrats lost 49,986, but
Republicans added only 3,410. In the 23 small rural
counties, Democrats lost 5,299, but Republicans lost 14,506.
Moving to the 24 Metropolitan Pennsylvania counties:
In Philadelphia, Democrats up 60,111, Republicans
down 42,863;
In the Philadelphia Suburban Quartet, Democrats up
127,760, Republicans down 141,248;
In the 10 Eastern Pennsylvania counties, Democrats
up 67,478, Republicans down 34,306;
In the 4 Democratic Western Pennsylvania counties,
Democrats up 29,800, Republicans down 30,468;
In the five Pittsburgh suburban counties (all
carried by Romney), Democrats lost 20,547, but
Republicans added only 1,305.
The Missing Voters In Pennsylvania Are Registered Nonvoting
Democrats – Such as the 267,338 in Philadelphia
75
In his pre-election mis-prediction, Romney acolyte Jay
Cost argued that Democrats have “maxed out” in Philadelphia
because the Obama 2008 percentage was 85 percent. Actually,
it was 83.00 percent, and in 2012, went up to 85.24 percent.
The margin went up by 13,580, mostly because the Republican
raw vote went down by 20,754. However, the 2012 Obama
Philadelphia raw number of 588,806 underperformed 2008 by
7,174, and it underperformed the Philadelphia November 2012
Democratic registration of 856,144 – meaning there are
267,338 “missing” registered Democrats in Philadelphia for
the 2016 campaign to turn out. If 55 percent of them voted,
it would add 147,035 to the Democratic column – just enough
to cancel the 2012 Republican margins from the six large
Romney counties, and push the commonwealth Democratic margin
from 309,840 to 456,875.
Indeed, comparing the November 2012 registration totals
on the Pennsylvania Department of State website with the
voting raw numbers on the David Leip U.S. Election Atlas
website shows that commonwealth-wide, the Romney raw number
of 2,680,434 was only 450,710 behind the Republican
registration of 3,131,144, whereas the Obama 2012 number of
2,990,274 was 1,276,043 behind the Democratic registration
of 4,266,317. If the 2016 Democratic campaign turns out 55
percent of 1,276,043 (701,823) and these new voters break 60
percent Democratic, 38 percent Republican, Democrats add a
net 154,401; in contrast, Republicans turning out 55 percent
76
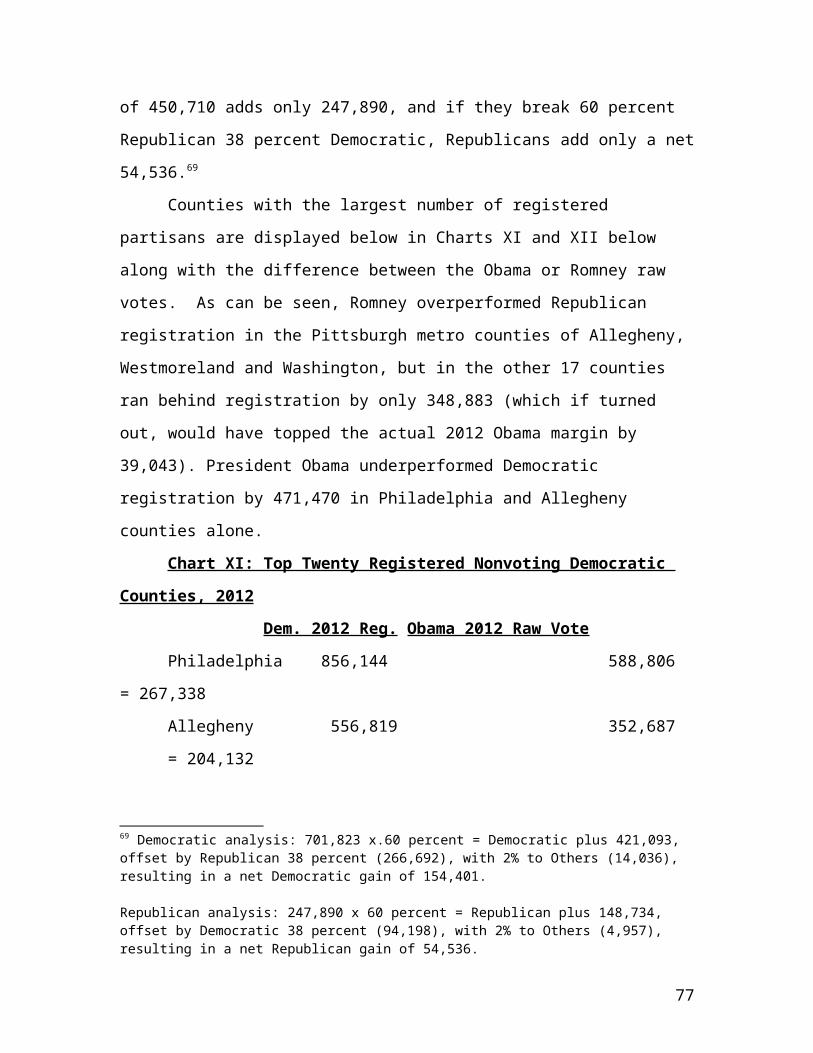
of 450,710 adds only 247,890, and if they break 60 percent
Republican 38 percent Democratic, Republicans add only a net
54,536.69
Counties with the largest number of registered
partisans are displayed below in Charts XI and XII below
along with the difference between the Obama or Romney raw
votes. As can be seen, Romney overperformed Republican
registration in the Pittsburgh metro counties of Allegheny,
Westmoreland and Washington, but in the other 17 counties
ran behind registration by only 348,883 (which if turned
out, would have topped the actual 2012 Obama margin by
39,043). President Obama underperformed Democratic
registration by 471,470 in Philadelphia and Allegheny
counties alone.
Chart XI: Top Twenty Registered Nonvoting Democratic
Counties, 2012
Dem. 2012 Reg. Obama 2012 Raw Vote
Philadelphia 856,144 588,806
= 267,338
Allegheny 556,819 352,687
= 204,132
69 Democratic analysis: 701,823 x.60 percent = Democratic plus 421,093, offset by Republican 38 percent (266,692), with 2% to Others (14,036), resulting in a net Democratic gain of 154,401.
Republican analysis: 247,890 x 60 percent = Republican plus 148,734, offset by Democratic 38 percent (94,198), with 2% to Others (4,957), resulting in a net Republican gain of 54,536.
77
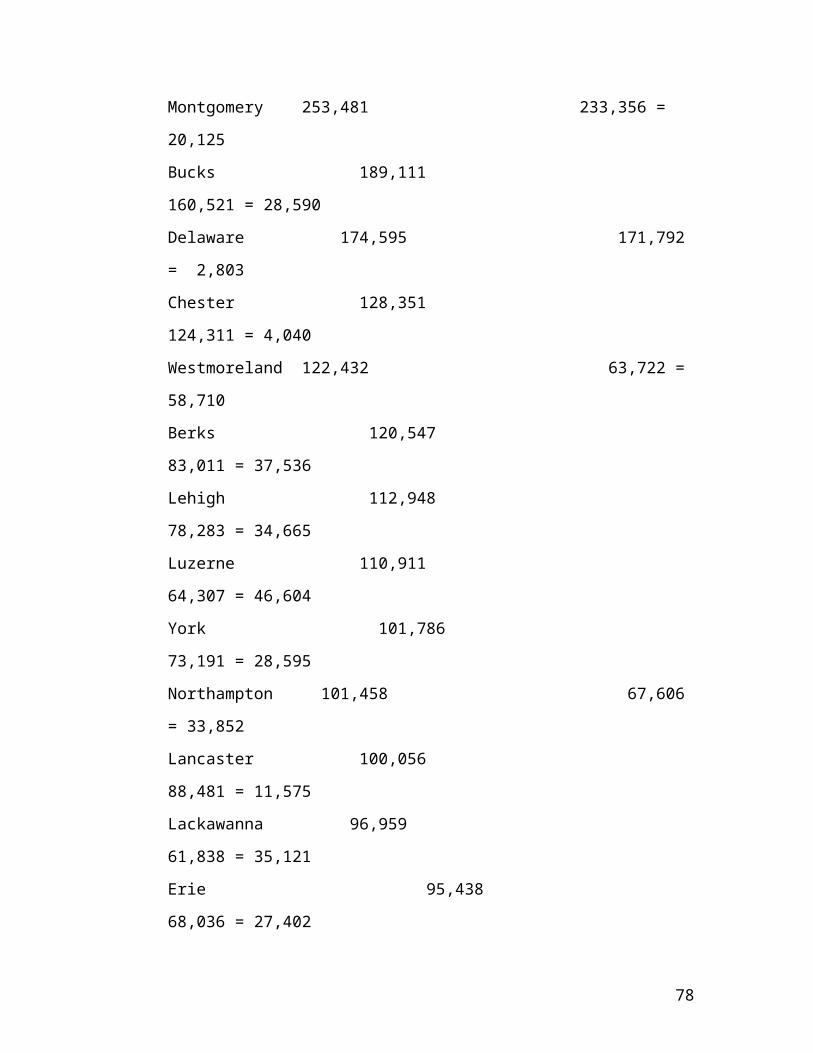
Montgomery 253,481 233,356 =
20,125
Bucks 189,111
160,521 = 28,590
Delaware 174,595 171,792
= 2,803
Chester 128,351
124,311 = 4,040
Westmoreland 122,432 63,722 =
58,710
Berks 120,547
83,011 = 37,536
Lehigh 112,948
78,283 = 34,665
Luzerne 110,911
64,307 = 46,604
York 101,786
73,191 = 28,595
Northampton 101,458 67,606
= 33,852
Lancaster 100,056
88,481 = 11,575
Lackawanna 96,959
61,838 = 35,121
Erie 95,438
68,036 = 27,402
78
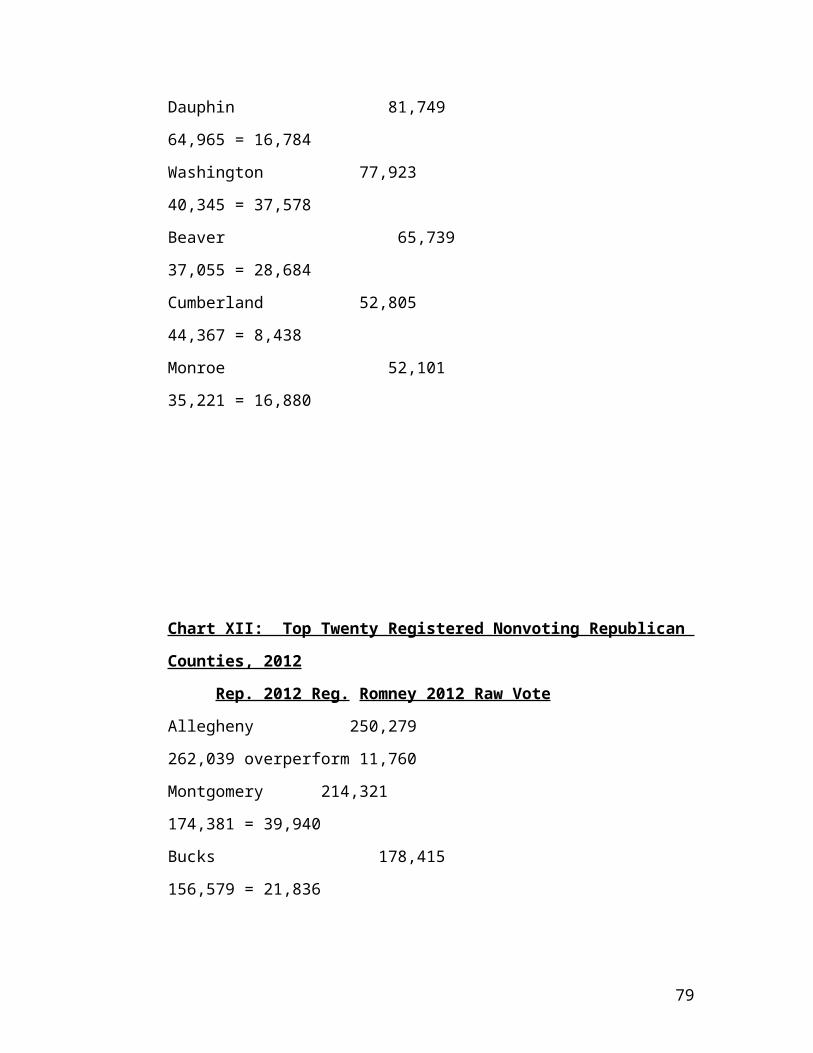
Dauphin 81,749
64,965 = 16,784
Washington 77,923
40,345 = 37,578
Beaver 65,739
37,055 = 28,684
Cumberland 52,805
44,367 = 8,438
Monroe 52,101
35,221 = 16,880
Chart XII: Top Twenty Registered Nonvoting Republican
Counties, 2012
Rep. 2012 Reg. Romney 2012 Raw Vote
Allegheny 250,279
262,039 overperform 11,760
Montgomery 214,321
174,381 = 39,940
Bucks 178,415
156,579 = 21,836
79
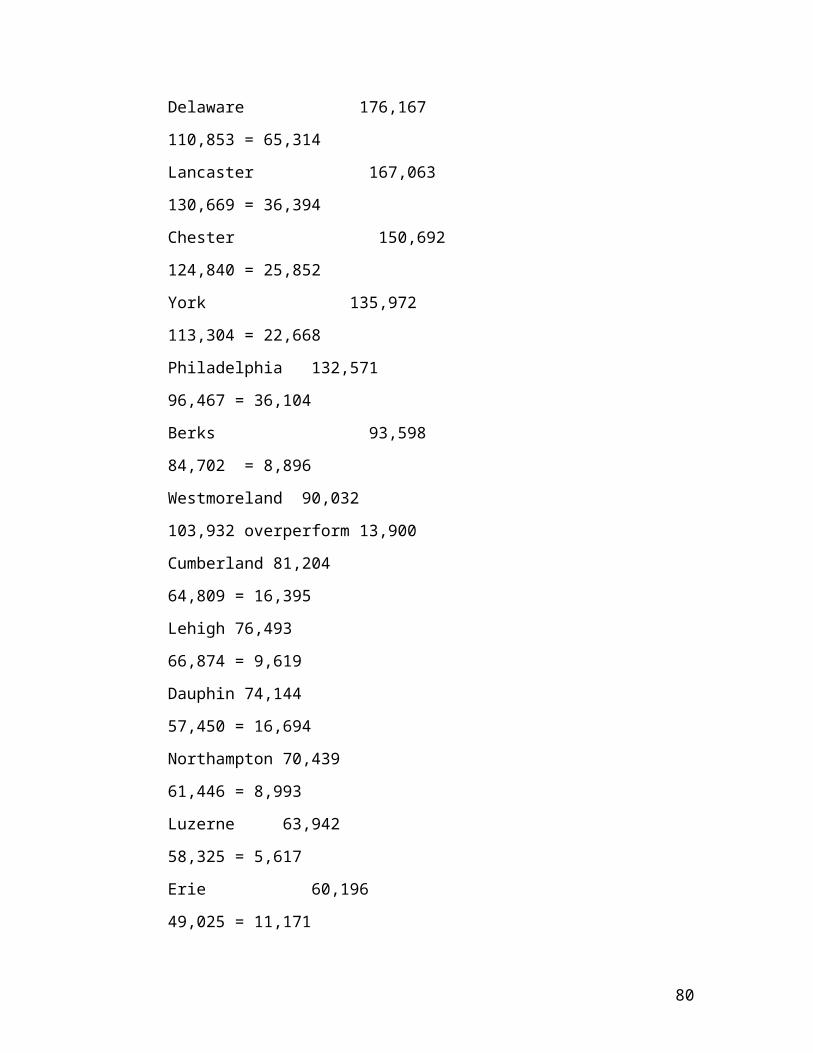
Delaware 176,167
110,853 = 65,314
Lancaster 167,063
130,669 = 36,394
Chester 150,692
124,840 = 25,852
York 135,972
113,304 = 22,668
Philadelphia 132,571
96,467 = 36,104
Berks 93,598
84,702 = 8,896
Westmoreland 90,032
103,932 overperform 13,900
Cumberland 81,204
64,809 = 16,395
Lehigh 76,493
66,874 = 9,619
Dauphin 74,144
57,450 = 16,694
Northampton 70,439
61,446 = 8,993
Luzerne 63,942
58,325 = 5,617
Erie 60,196
49,025 = 11,171
80
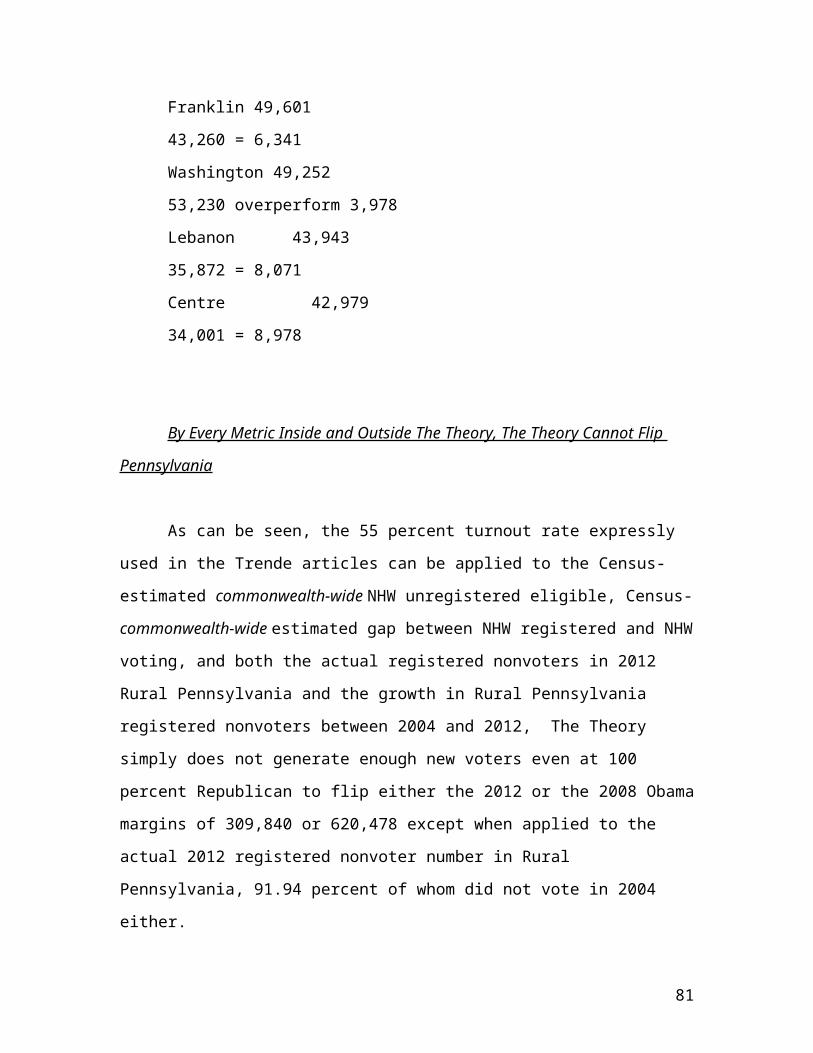
Franklin 49,601
43,260 = 6,341
Washington 49,252
53,230 overperform 3,978
Lebanon 43,943
35,872 = 8,071
Centre 42,979
34,001 = 8,978
By Every Metric Inside and Outside The Theory, The Theory Cannot Flip
Pennsylvania
As can be seen, the 55 percent turnout rate expressly
used in the Trende articles can be applied to the Census-
estimated commonwealth-wide NHW unregistered eligible, Census-
commonwealth-wide estimated gap between NHW registered and NHW
voting, and both the actual registered nonvoters in 2012
Rural Pennsylvania and the growth in Rural Pennsylvania
registered nonvoters between 2004 and 2012, The Theory
simply does not generate enough new voters even at 100
percent Republican to flip either the 2012 or the 2008 Obama
margins of 309,840 or 620,478 except when applied to the
actual 2012 registered nonvoter number in Rural
Pennsylvania, 91.94 percent of whom did not vote in 2004
either.
81
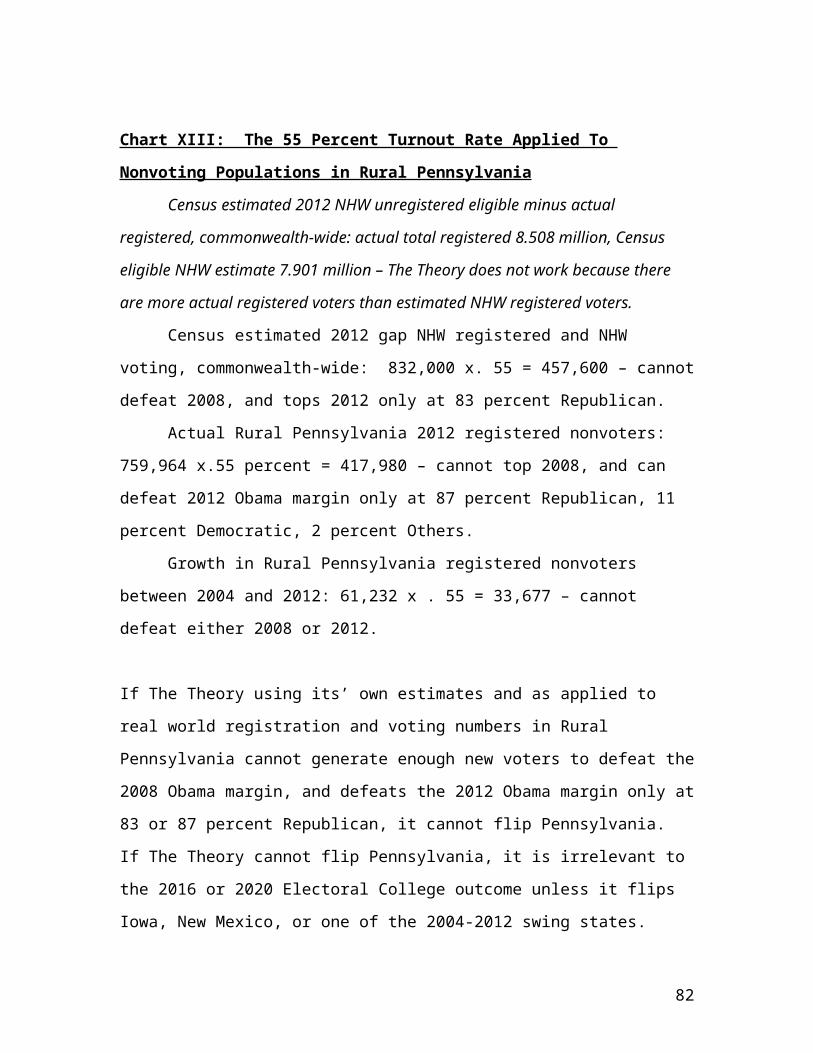
Chart XIII: The 55 Percent Turnout Rate Applied To
Nonvoting Populations in Rural Pennsylvania
Census estimated 2012 NHW unregistered eligible minus actual
registered, commonwealth-wide: actual total registered 8.508 million, Census
eligible NHW estimate 7.901 million – The Theory does not work because there
are more actual registered voters than estimated NHW registered voters.
Census estimated 2012 gap NHW registered and NHW
voting, commonwealth-wide: 832,000 x. 55 = 457,600 – cannot
defeat 2008, and tops 2012 only at 83 percent Republican.
Actual Rural Pennsylvania 2012 registered nonvoters:
759,964 x.55 percent = 417,980 – cannot top 2008, and can
defeat 2012 Obama margin only at 87 percent Republican, 11
percent Democratic, 2 percent Others.
Growth in Rural Pennsylvania registered nonvoters
between 2004 and 2012: 61,232 x . 55 = 33,677 – cannot
defeat either 2008 or 2012.
If The Theory using its’ own estimates and as applied to
real world registration and voting numbers in Rural
Pennsylvania cannot generate enough new voters to defeat the
2008 Obama margin, and defeats the 2012 Obama margin only at
83 or 87 percent Republican, it cannot flip Pennsylvania.
If The Theory cannot flip Pennsylvania, it is irrelevant to
the 2016 or 2020 Electoral College outcome unless it flips
Iowa, New Mexico, or one of the 2004-2012 swing states.
82
Strategy for Republicans: Eliminate the Gender and Nonwhite Gaps
Instead of chasing unregistered or registered nonvoting
Missing White Voters, Republicans would be better off trying
to switch 160,000 suburban-exurban voters in the Greater
Philadelphia counties of Chester, Bucks, Delaware,
Montgomery, Berks, Carbon, Lehigh, Northampton, Monroe,
Pike, Schuylkill, Wayne, Lackawanna and Luzerne. Between
2004 and 2012, Democrats moved 78,850 in margin from these
15 counties, so Republicans will need to do more than break
even – they will need to actually flip these counties to the
point that the 2016 Republican nominee wins them by 80,000,
and hope that Democrats do not increase their Philadelphia
margin above the 2012 record number of 492,339 by
registering and turning out any (much less 80,000 to
100,000) of the 856,144 registered Democrats in Philadelphia
not included in the 2012 Obama raw number of 588,806 –
which is 267,338 “missing voters.” Thus, Republicans will
need to win back their 2004-2012 losses in all of the 11 “T”
small-city counties (totaling 29,635), not to mention
converting back the Democratic gains totaling 34,306 in
Lancaster, York, Cumberland, Franklin and Lebanon counties –
or in what was once the 12th small-city Republican county in
83
the “T” – Dauphin (Harrisburg), where Democrats have gained
9,666 and Republicans have lost 7,846.
. Republicans will also need to reduce the Democratic
margin in Allegheny County (where Democrats are down by
16,225 from 2004), except that Republicans have also lost
9,886 here as well. Republicans will look at increasing
their numbers in the five Pittsburgh suburban counties, but
Democrats have already lost 49,995 in margin, and the Romney
percentages are over 60 percent in Westmoreland, Armstrong
and Butler counties.
Republicans are no longer able to generate big margins
from high-vote jurisdictions in Pennsylvania. The only 2012
jurisdictions with 100,000 or more total Presidential votes
carried by Mitt Romney are Berks (Reading), Chester,
Lancaster, York, Cumberland (Carlisle), and Westmoreland --
and in these locales with a combined 2012 total vote of
1,117,343, the combined Romney margins totaled 145,173, less
than one third of the Obama margin from Philadelphia.
Moreover, in 2004, the combined Republican margin in these
counties was 195,006, meaning Republicans between 2004 and
2012 lost 49,833 in margin from their six big county wins
while Democrats were increasing their Philadelphia margin by
80,233.
To flip Pennsylvania, Republicans will need to
eliminate the gender gap and aim for 50 percent of the
Hispanic vote that is growing presence in Monroe, Lehigh
84
Berks, Lancaster, York and Cumberland counties. If
Republican strategists instead wish to double down on the
unregistered, nonvoting angry white male population, be my
guest as Democrats on January 20, 2017 celebrate a third
consecutive White House inauguration (the first since 1949)
-- just don’t bet on the Missing White Voter Theory to
obtain any inaugural tickets, especially to the Pennsylvania
Inaugural Ball
Next stop on our Electoral College Junket: New
Hampshire.
85
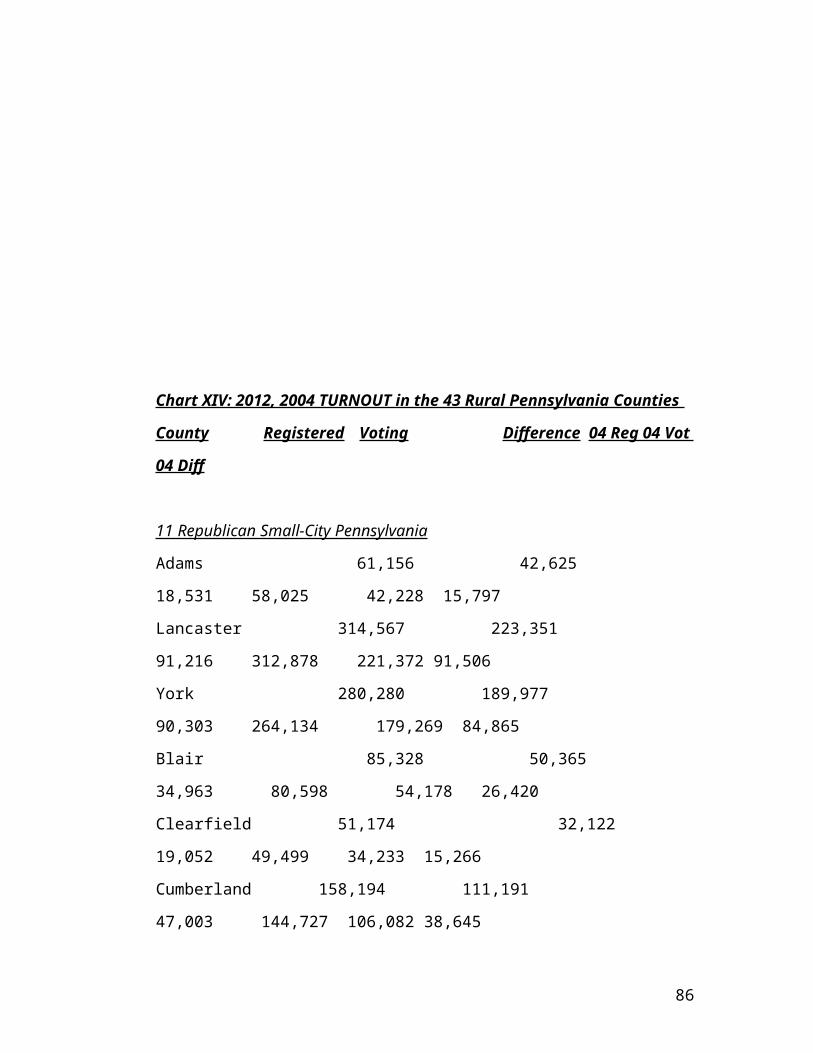
Chart XIV: 2012, 2004 TURNOUT in the 43 Rural Pennsylvania Counties
County Registered Voting Difference 04 Reg 04 Vot
04 Diff
11 Republican Small-City Pennsylvania
Adams 61,156 42,625
18,531 58,025 42,228 15,797
Lancaster 314,567 223,351
91,216 312,878 221,372 91,506
York 280,280 189,977
90,303 264,134 179,269 84,865
Blair 85,328 50,365
34,963 80,598 54,178 26,420
Clearfield 51,174 32,122
19,052 49,499 34,233 15,266
Cumberland 158,194 111,191
47,003 144,727 106,082 38,645
86
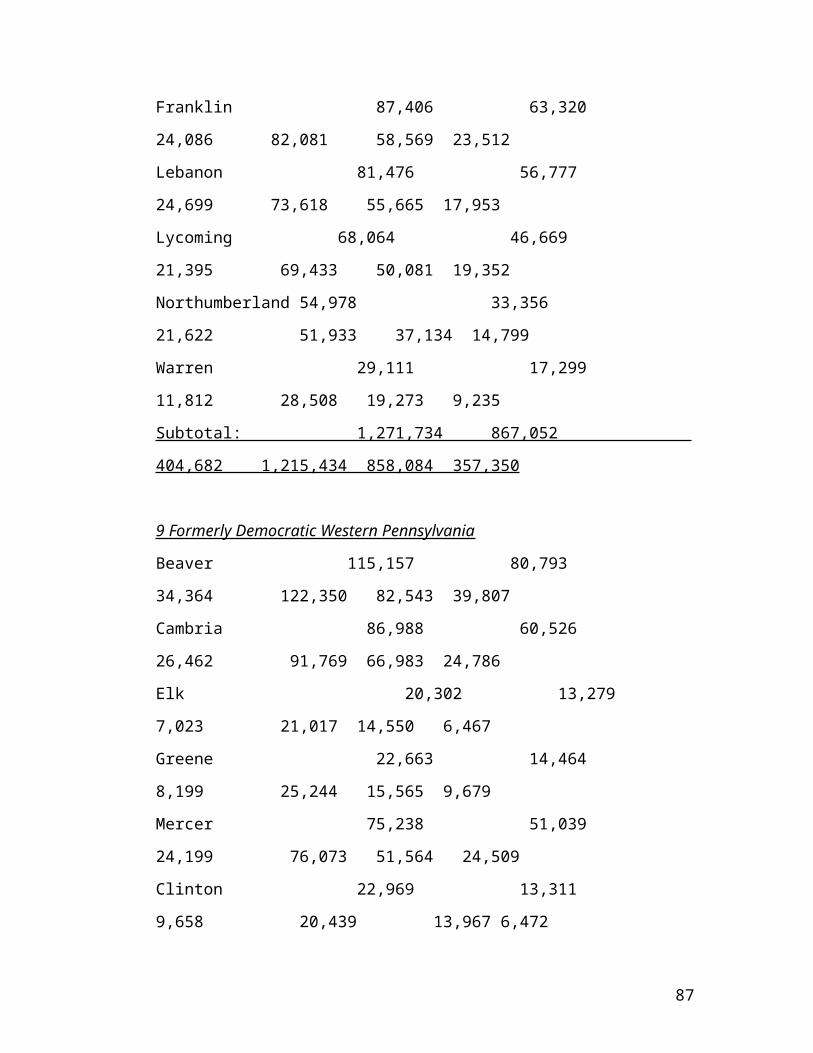
Franklin 87,406 63,320
24,086 82,081 58,569 23,512
Lebanon 81,476 56,777
24,699 73,618 55,665 17,953
Lycoming 68,064 46,669
21,395 69,433 50,081 19,352
Northumberland 54,978 33,356
21,622 51,933 37,134 14,799
Warren 29,111 17,299
11,812 28,508 19,273 9,235
Subtotal: 1,271,734 867,052
404,682 1,215,434 858,084 357,350
9 Formerly Democratic Western Pennsylvania
Beaver 115,157 80,793
34,364 122,350 82,543 39,807
Cambria 86,988 60,526
26,462 91,769 66,983 24,786
Elk 20,302 13,279
7,023 21,017 14,550 6,467
Greene 22,663 14,464
8,199 25,244 15,565 9,679
Mercer 75,238 51,039
24,199 76,073 51,564 24,509
Clinton 22,969 13,311
9,658 20,439 13,967 6,472
87
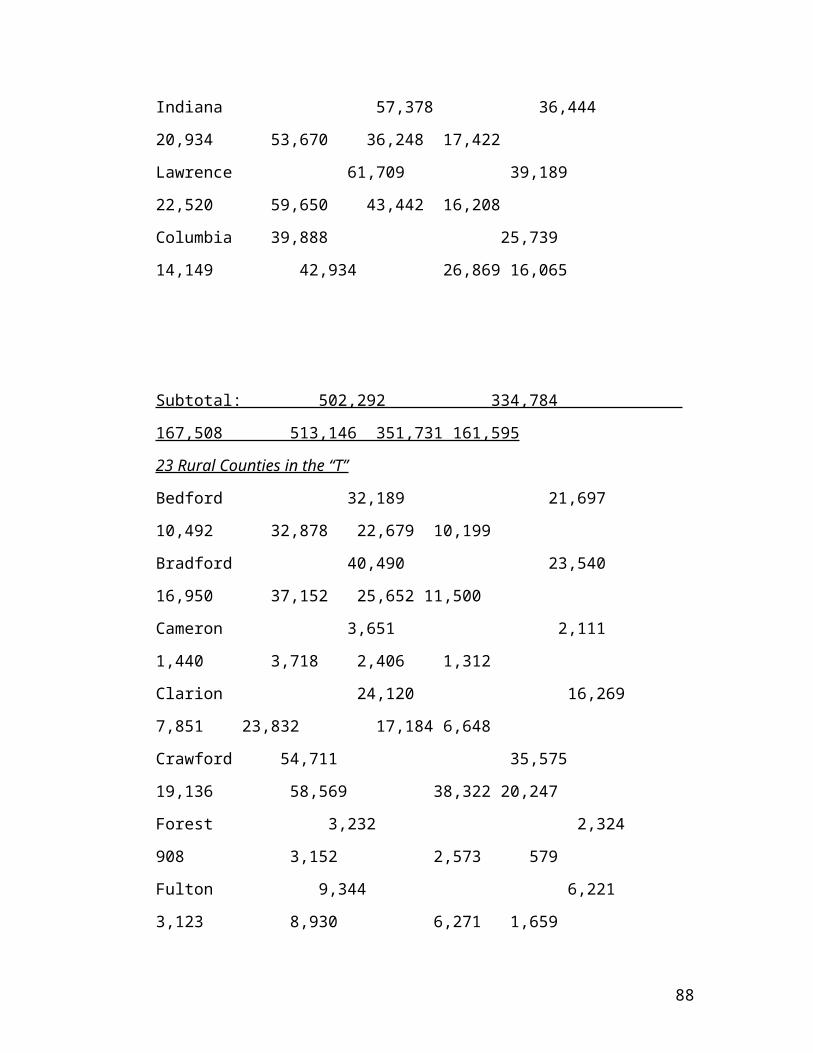
Indiana 57,378 36,444
20,934 53,670 36,248 17,422
Lawrence 61,709 39,189
22,520 59,650 43,442 16,208
Columbia 39,888 25,739
14,149 42,934 26,869 16,065
Subtotal: 502,292 334,784
167,508 513,146 351,731 161,595
23 Rural Counties in the “T”
Bedford 32,189 21,697
10,492 32,878 22,679 10,199
Bradford 40,490 23,540
16,950 37,152 25,652 11,500
Cameron 3,651 2,111
1,440 3,718 2,406 1,312
Clarion 24,120 16,269
7,851 23,832 17,184 6,648
Crawford 54,711 35,575
19,136 58,569 38,322 20,247
Forest 3,232 2,324
908 3,152 2,573 579
Fulton 9,344 6,221
3,123 8,930 6,271 1,659
88
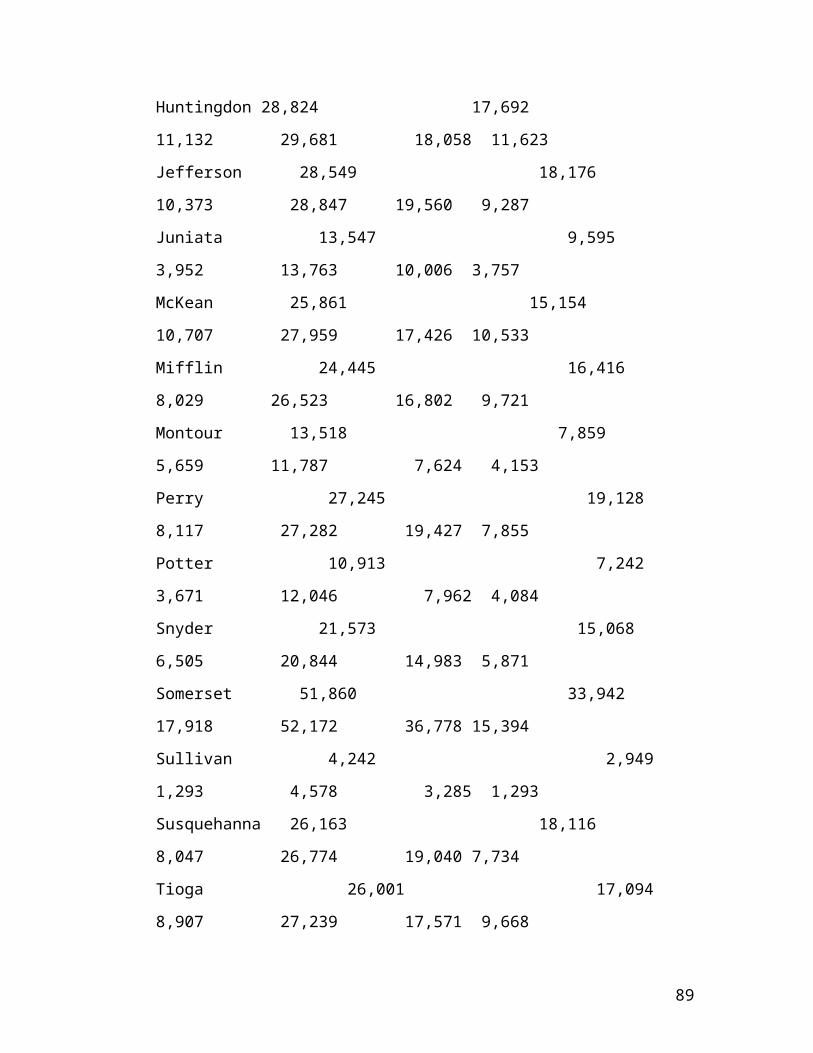
Huntingdon 28,824 17,692
11,132 29,681 18,058 11,623
Jefferson 28,549 18,176
10,373 28,847 19,560 9,287
Juniata 13,547 9,595
3,952 13,763 10,006 3,757
McKean 25,861 15,154
10,707 27,959 17,426 10,533
Mifflin 24,445 16,416
8,029 26,523 16,802 9,721
Montour 13,518 7,859
5,659 11,787 7,624 4,153
Perry 27,245 19,128
8,117 27,282 19,427 7,855
Potter 10,913 7,242
3,671 12,046 7,962 4,084
Snyder 21,573 15,068
6,505 20,844 14,983 5,871
Somerset 51,860 33,942
17,918 52,172 36,778 15,394
Sullivan 4,242 2,949
1,293 4,578 3,285 1,293
Susquehanna 26,163 18,116
8,047 26,774 19,040 7,734
Tioga 26,001 17,094
8,907 27,239 17,571 9,668
89
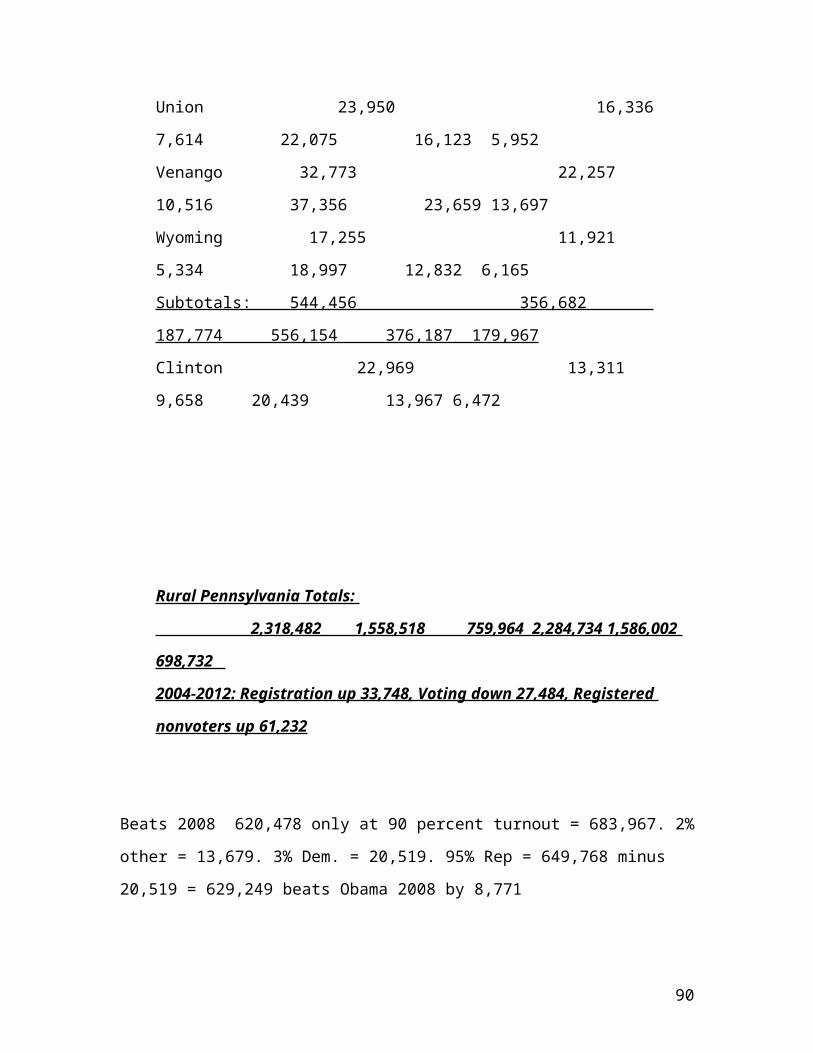
Union 23,950 16,336
7,614 22,075 16,123 5,952
Venango 32,773 22,257
10,516 37,356 23,659 13,697
Wyoming 17,255 11,921
5,334 18,997 12,832 6,165
Subtotals: 544,456 356,682
187,774 556,154 376,187 179,967
Clinton 22,969 13,311
9,658 20,439 13,967 6,472
Rural Pennsylvania Totals:
2,318,482 1,558,518 759,964 2,284,734 1,586,002
698,732
2004-2012: Registration up 33,748, Voting down 27,484, Registered
nonvoters up 61,232
Beats 2008 620,478 only at 90 percent turnout = 683,967. 2%
other = 13,679. 3% Dem. = 20,519. 95% Rep = 649,768 minus
20,519 = 629,249 beats Obama 2008 by 8,771
90
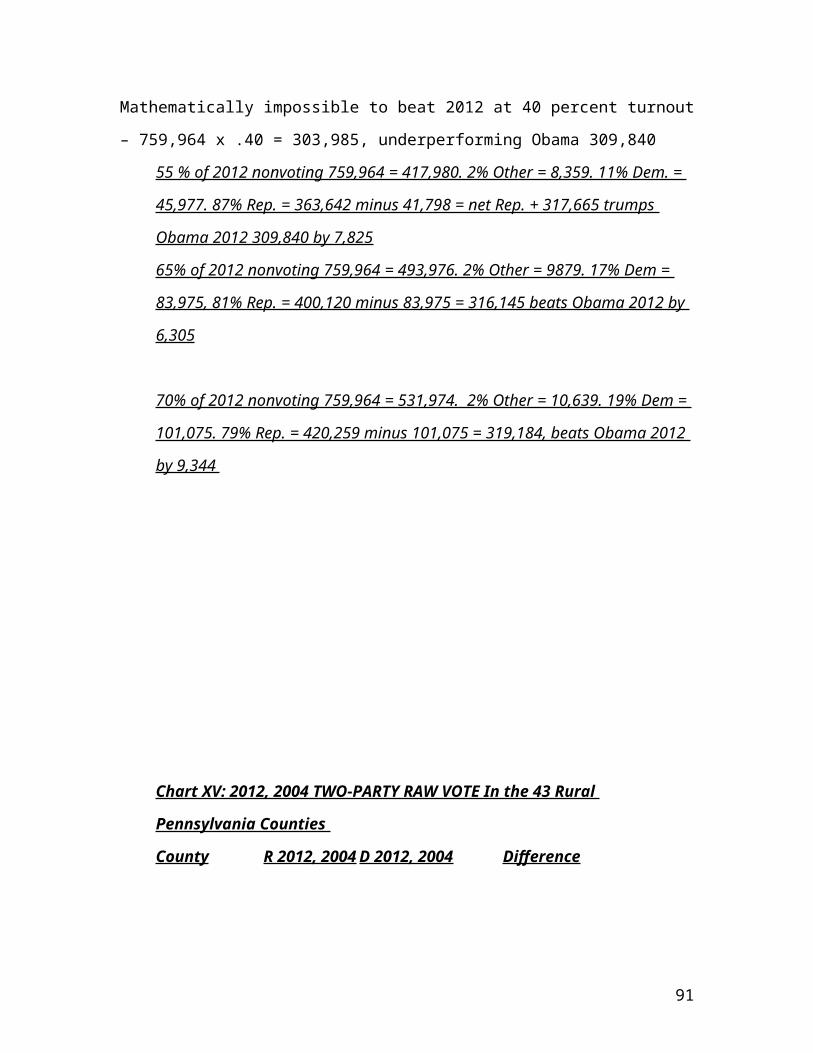
Mathematically impossible to beat 2012 at 40 percent turnout
– 759,964 x .40 = 303,985, underperforming Obama 309,840
55 % of 2012 nonvoting 759,964 = 417,980. 2% Other = 8,359. 11% Dem. =
45,977. 87% Rep. = 363,642 minus 41,798 = net Rep. + 317,665 trumps
Obama 2012 309,840 by 7,825
65% of 2012 nonvoting 759,964 = 493,976. 2% Other = 9879. 17% Dem =
83,975, 81% Rep. = 400,120 minus 83,975 = 316,145 beats Obama 2012 by
6,305
70% of 2012 nonvoting 759,964 = 531,974. 2% Other = 10,639. 19% Dem =
101,075. 79% Rep. = 420,259 minus 101,075 = 319,184, beats Obama 2012
by 9,344
Chart XV: 2012, 2004 TWO-PARTY RAW VOTE In the 43 Rural
Pennsylvania Counties
County R 2012, 2004 D 2012, 2004 Difference
91
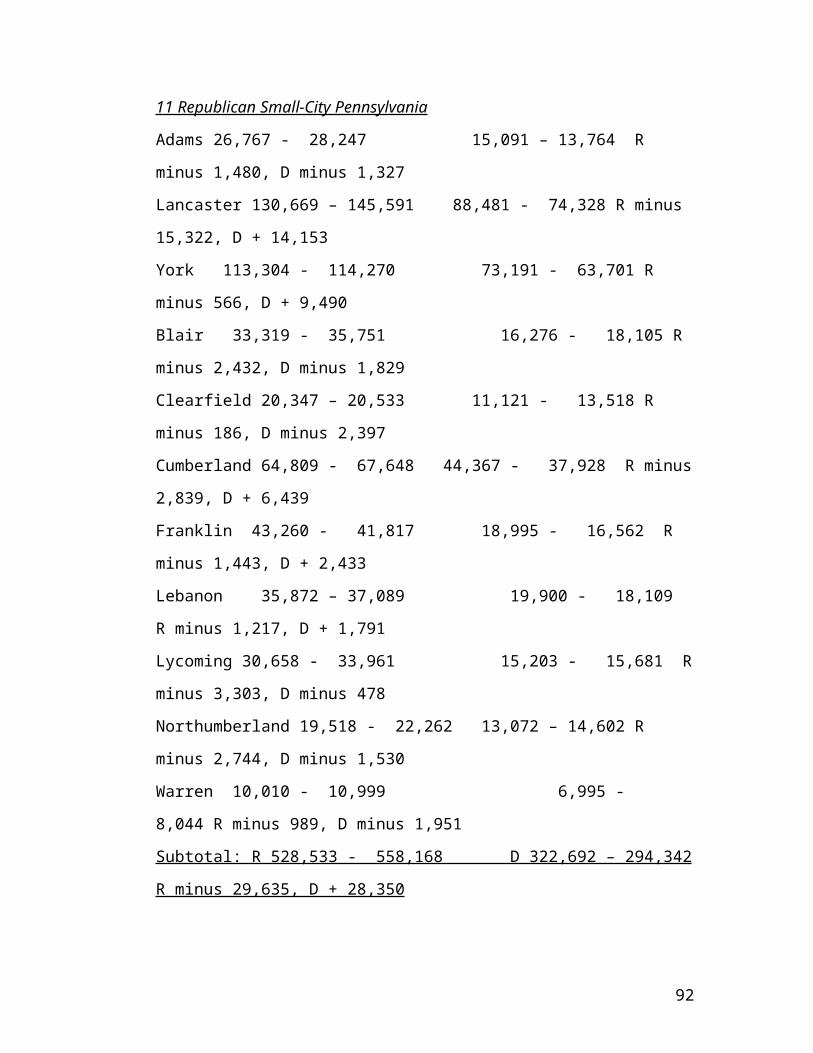
11 Republican Small-City Pennsylvania
Adams 26,767 - 28,247 15,091 – 13,764 R
minus 1,480, D minus 1,327
Lancaster 130,669 – 145,591 88,481 - 74,328 R minus
15,322, D + 14,153
York 113,304 - 114,270 73,191 - 63,701 R
minus 566, D + 9,490
Blair 33,319 - 35,751 16,276 - 18,105 R
minus 2,432, D minus 1,829
Clearfield 20,347 – 20,533 11,121 - 13,518 R
minus 186, D minus 2,397
Cumberland 64,809 - 67,648 44,367 - 37,928 R minus
2,839, D + 6,439
Franklin 43,260 - 41,817 18,995 - 16,562 R
minus 1,443, D + 2,433
Lebanon 35,872 – 37,089 19,900 - 18,109
R minus 1,217, D + 1,791
Lycoming 30,658 - 33,961 15,203 - 15,681 R
minus 3,303, D minus 478
Northumberland 19,518 - 22,262 13,072 – 14,602 R
minus 2,744, D minus 1,530
Warren 10,010 - 10,999 6,995 -
8,044 R minus 989, D minus 1,951
Subtotal: R 528,533 - 558,168 D 322,692 – 294,342
R minus 29,635, D + 28,350
92
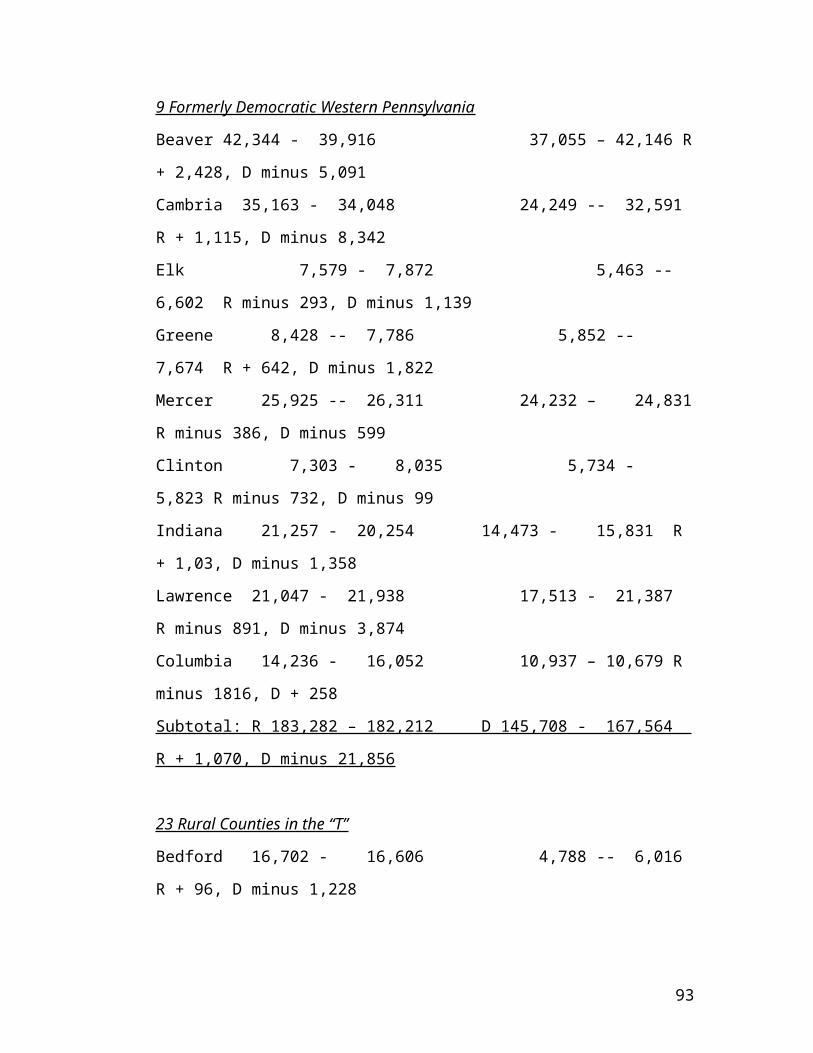
9 Formerly Democratic Western Pennsylvania
Beaver 42,344 - 39,916 37,055 – 42,146 R
+ 2,428, D minus 5,091
Cambria 35,163 - 34,048 24,249 -- 32,591
R + 1,115, D minus 8,342
Elk 7,579 - 7,872 5,463 --
6,602 R minus 293, D minus 1,139
Greene 8,428 -- 7,786 5,852 --
7,674 R + 642, D minus 1,822
Mercer 25,925 -- 26,311 24,232 – 24,831
R minus 386, D minus 599
Clinton 7,303 - 8,035 5,734 -
5,823 R minus 732, D minus 99
Indiana 21,257 - 20,254 14,473 - 15,831 R
+ 1,03, D minus 1,358
Lawrence 21,047 - 21,938 17,513 - 21,387
R minus 891, D minus 3,874
Columbia 14,236 - 16,052 10,937 – 10,679 R
minus 1816, D + 258
Subtotal: R 183,282 – 182,212 D 145,708 - 167,564
R + 1,070, D minus 21,856
23 Rural Counties in the “T”
Bedford 16,702 - 16,606 4,788 -- 6,016
R + 96, D minus 1,228
93
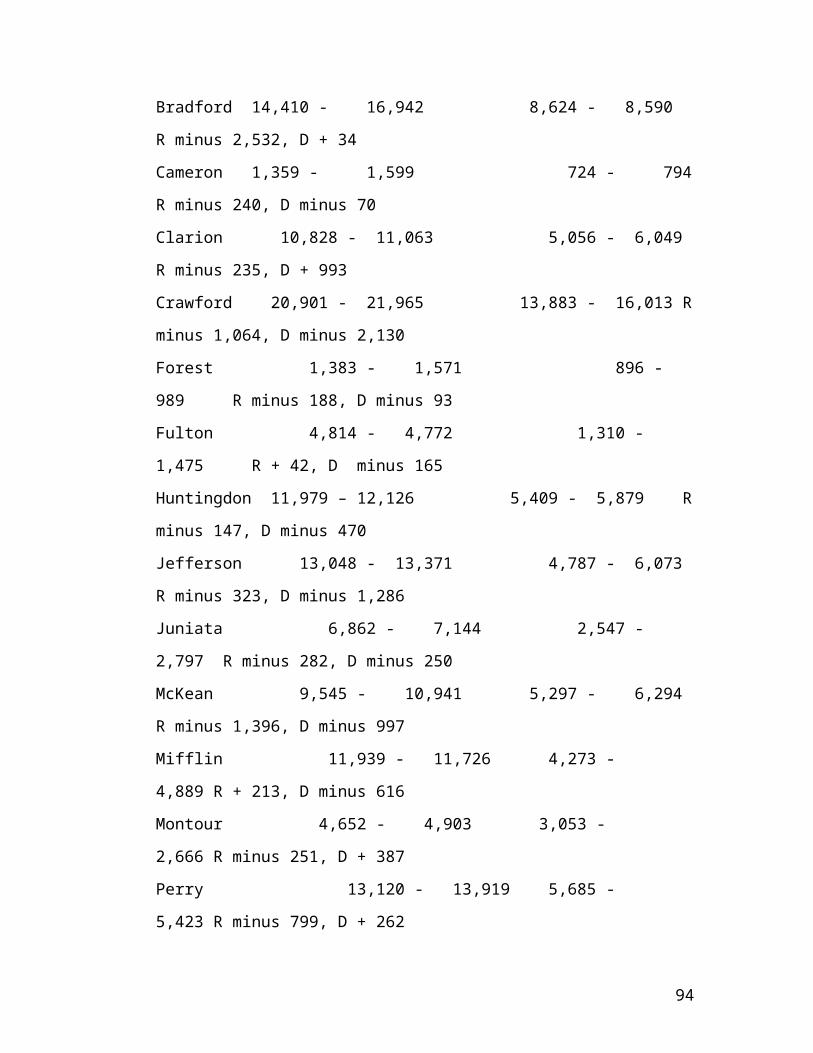
Bradford 14,410 - 16,942 8,624 - 8,590
R minus 2,532, D + 34
Cameron 1,359 - 1,599 724 - 794
R minus 240, D minus 70
Clarion 10,828 - 11,063 5,056 - 6,049
R minus 235, D + 993
Crawford 20,901 - 21,965 13,883 - 16,013 R
minus 1,064, D minus 2,130
Forest 1,383 - 1,571 896 -
989 R minus 188, D minus 93
Fulton 4,814 - 4,772 1,310 -
1,475 R + 42, D minus 165
Huntingdon 11,979 – 12,126 5,409 - 5,879 R
minus 147, D minus 470
Jefferson 13,048 - 13,371 4,787 - 6,073
R minus 323, D minus 1,286
Juniata 6,862 - 7,144 2,547 -
2,797 R minus 282, D minus 250
McKean 9,545 - 10,941 5,297 - 6,294
R minus 1,396, D minus 997
Mifflin 11,939 - 11,726 4,273 -
4,889 R + 213, D minus 616
Montour 4,652 - 4,903 3,053 -
2,666 R minus 251, D + 387
Perry 13,120 - 13,919 5,685 -
5,423 R minus 799, D + 262
94
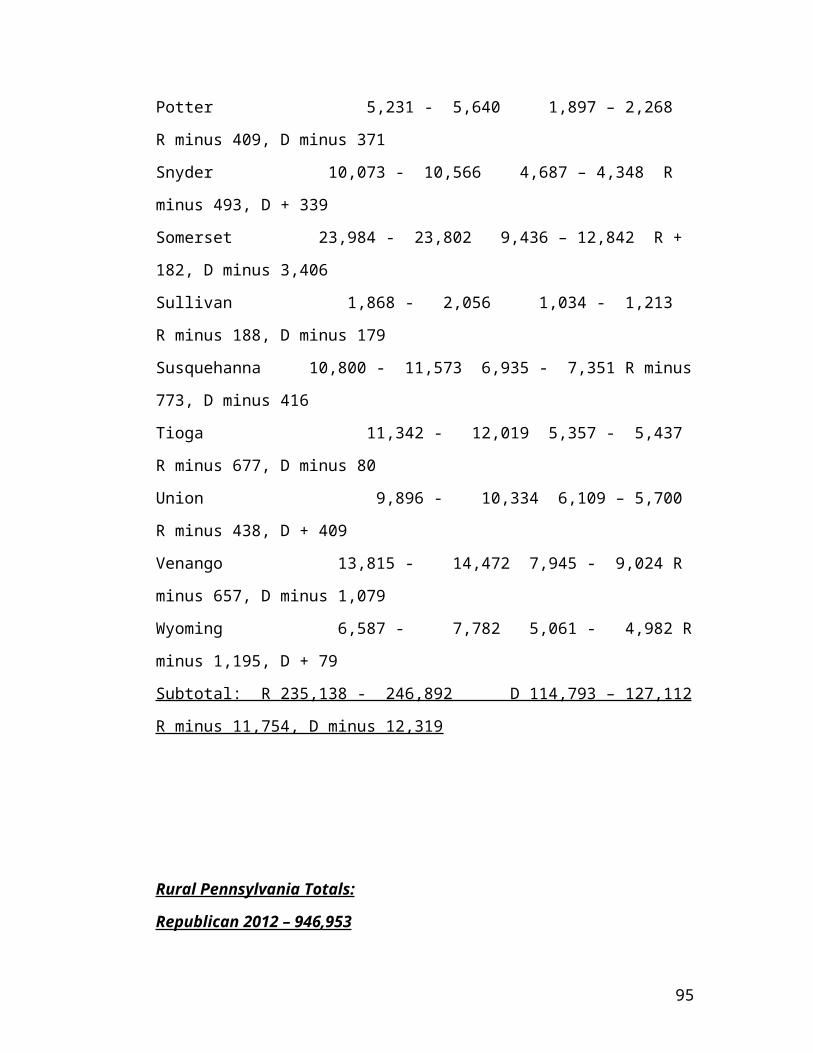
Potter 5,231 - 5,640 1,897 – 2,268
R minus 409, D minus 371
Snyder 10,073 - 10,566 4,687 – 4,348 R
minus 493, D + 339
Somerset 23,984 - 23,802 9,436 – 12,842 R +
182, D minus 3,406
Sullivan 1,868 - 2,056 1,034 - 1,213
R minus 188, D minus 179
Susquehanna 10,800 - 11,573 6,935 - 7,351 R minus
773, D minus 416
Tioga 11,342 - 12,019 5,357 - 5,437
R minus 677, D minus 80
Union 9,896 - 10,334 6,109 – 5,700
R minus 438, D + 409
Venango 13,815 - 14,472 7,945 - 9,024 R
minus 657, D minus 1,079
Wyoming 6,587 - 7,782 5,061 - 4,982 R
minus 1,195, D + 79
Subtotal: R 235,138 - 246,892 D 114,793 – 127,112
R minus 11,754, D minus 12,319
Rural Pennsylvania Totals:
Republican 2012 – 946,953
95
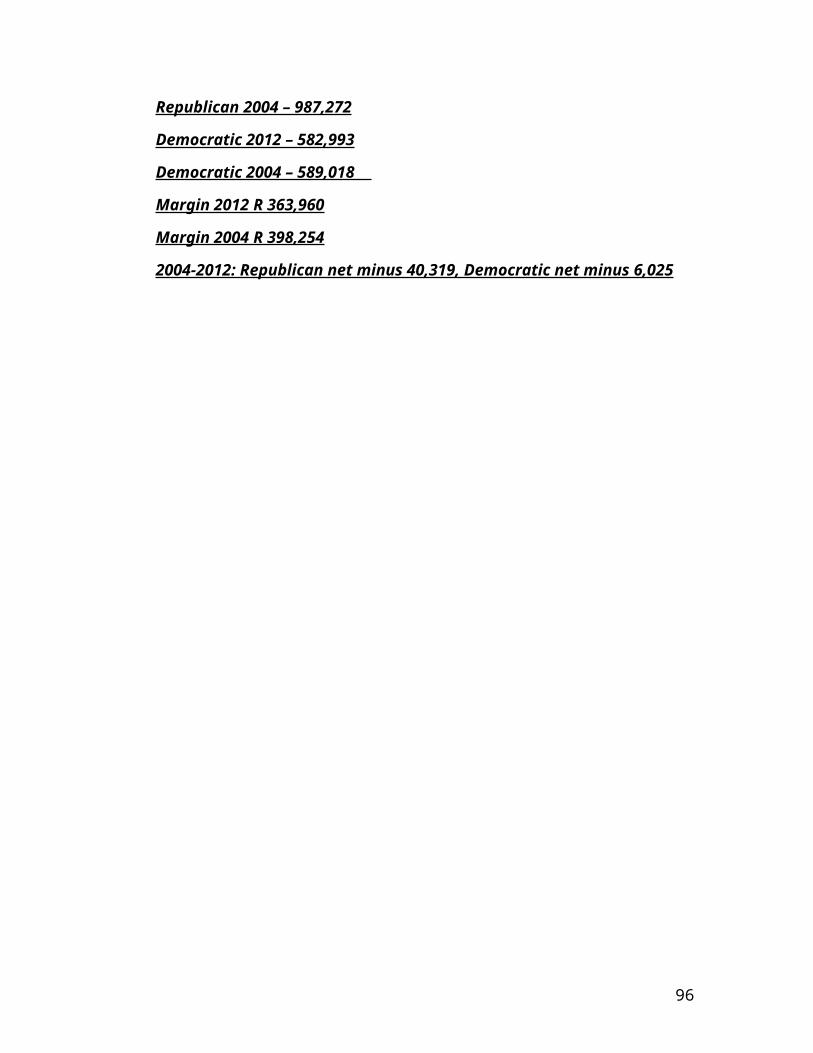
Republican 2004 – 987,272
Democratic 2012 – 582,993
Democratic 2004 – 589,018
Margin 2012 R 363,960
Margin 2004 R 398,254
2004-2012: Republican net minus 40,319, Democratic net minus 6,025
96
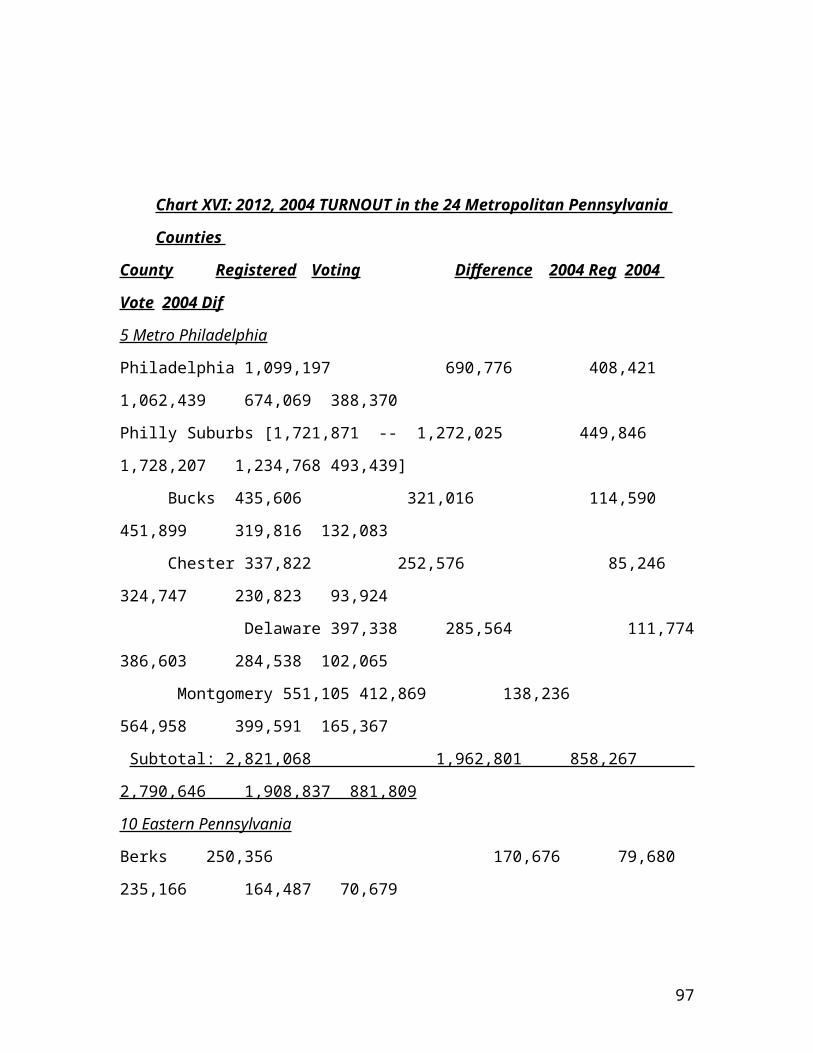
Chart XVI: 2012, 2004 TURNOUT in the 24 Metropolitan Pennsylvania
Counties
County Registered Voting Difference 2004 Reg 2004
Vote 2004 Dif
5 Metro Philadelphia
Philadelphia 1,099,197 690,776 408,421
1,062,439 674,069 388,370
Philly Suburbs [1,721,871 -- 1,272,025 449,846
1,728,207 1,234,768 493,439]
Bucks 435,606 321,016 114,590
451,899 319,816 132,083
Chester 337,822 252,576 85,246
324,747 230,823 93,924
Delaware 397,338 285,564 111,774
386,603 284,538 102,065
Montgomery 551,105 412,869 138,236
564,958 399,591 165,367
Subtotal: 2,821,068 1,962,801 858,267
2,790,646 1,908,837 881,809
10 Eastern Pennsylvania
Berks 250,356 170,676 79,680
235,166 164,487 70,679
97
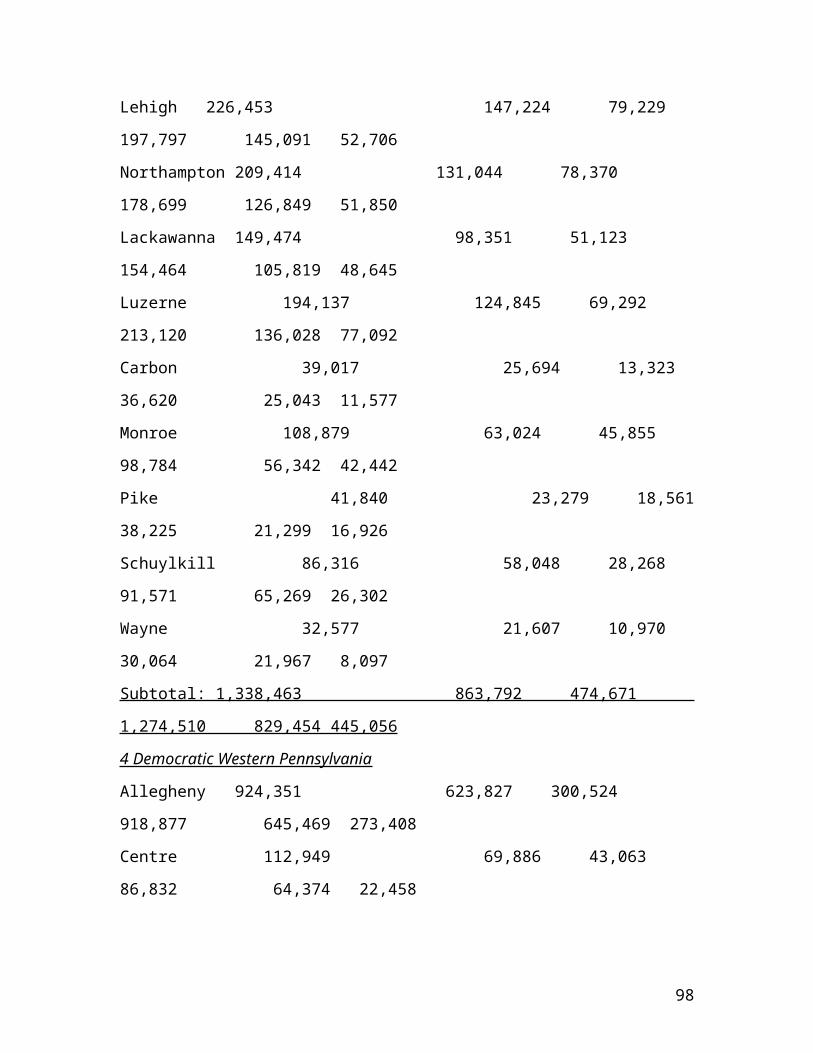
Lehigh 226,453 147,224 79,229
197,797 145,091 52,706
Northampton 209,414 131,044 78,370
178,699 126,849 51,850
Lackawanna 149,474 98,351 51,123
154,464 105,819 48,645
Luzerne 194,137 124,845 69,292
213,120 136,028 77,092
Carbon 39,017 25,694 13,323
36,620 25,043 11,577
Monroe 108,879 63,024 45,855
98,784 56,342 42,442
Pike 41,840 23,279 18,561
38,225 21,299 16,926
Schuylkill 86,316 58,048 28,268
91,571 65,269 26,302
Wayne 32,577 21,607 10,970
30,064 21,967 8,097
Subtotal: 1,338,463 863,792 474,671
1,274,510 829,454 445,056
4 Democratic Western Pennsylvania
Allegheny 924,351 623,827 300,524
918,877 645,469 273,408
Centre 112,949 69,886 43,063
86,832 64,374 22,458
98
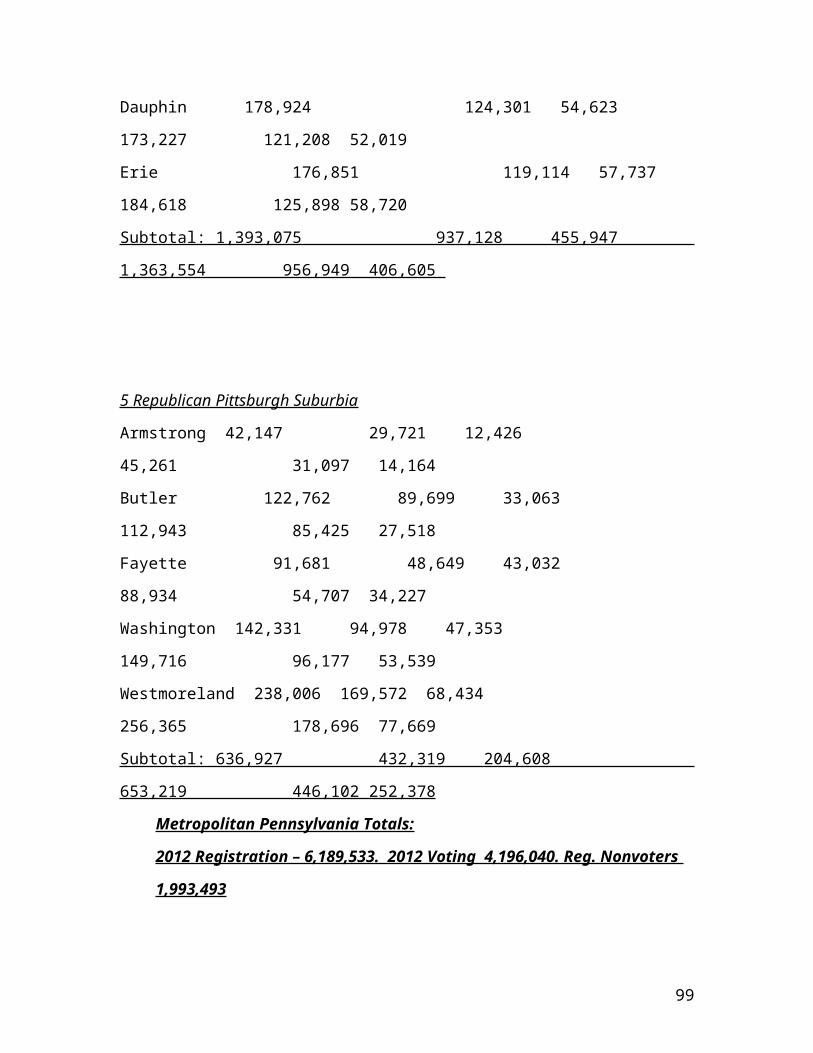
Dauphin 178,924 124,301 54,623
173,227 121,208 52,019
Erie 176,851 119,114 57,737
184,618 125,898 58,720
Subtotal: 1,393,075 937,128 455,947
1,363,554 956,949 406,605
5 Republican Pittsburgh Suburbia
Armstrong 42,147 29,721 12,426
45,261 31,097 14,164
Butler 122,762 89,699 33,063
112,943 85,425 27,518
Fayette 91,681 48,649 43,032
88,934 54,707 34,227
Washington 142,331 94,978 47,353
149,716 96,177 53,539
Westmoreland 238,006 169,572 68,434
256,365 178,696 77,669
Subtotal: 636,927 432,319 204,608
653,219 446,102 252,378
Metropolitan Pennsylvania Totals:
2012 Registration – 6,189,533. 2012 Voting 4,196,040. Reg. Nonvoters
1,993,493
99
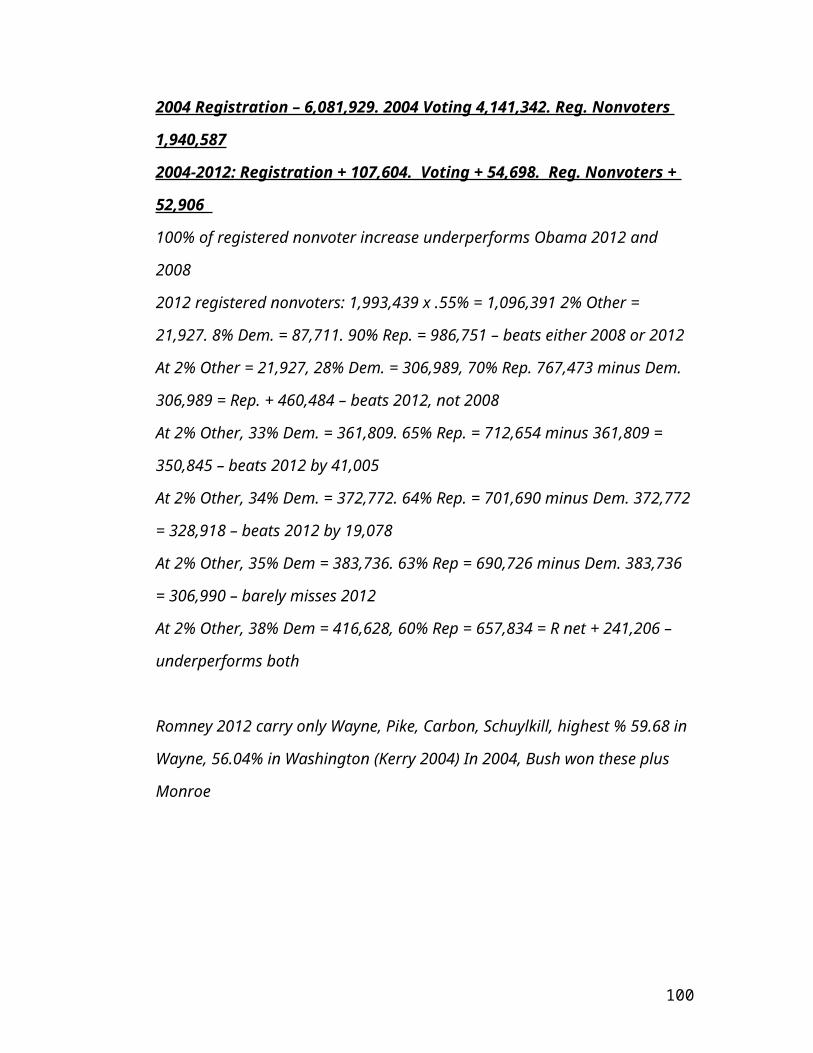
2004 Registration – 6,081,929. 2004 Voting 4,141,342. Reg. Nonvoters
1,940,587
2004-2012: Registration + 107,604. Voting + 54,698. Reg. Nonvoters +
52,906
100% of registered nonvoter increase underperforms Obama 2012 and
2008
2012 registered nonvoters: 1,993,439 x .55% = 1,096,391 2% Other =
21,927. 8% Dem. = 87,711. 90% Rep. = 986,751 – beats either 2008 or 2012
At 2% Other = 21,927, 28% Dem. = 306,989, 70% Rep. 767,473 minus Dem.
306,989 = Rep. + 460,484 – beats 2012, not 2008
At 2% Other, 33% Dem. = 361,809. 65% Rep. = 712,654 minus 361,809 =
350,845 – beats 2012 by 41,005
At 2% Other, 34% Dem. = 372,772. 64% Rep. = 701,690 minus Dem. 372,772
= 328,918 – beats 2012 by 19,078
At 2% Other, 35% Dem = 383,736. 63% Rep = 690,726 minus Dem. 383,736
= 306,990 – barely misses 2012
At 2% Other, 38% Dem = 416,628, 60% Rep = 657,834 = R net + 241,206 –
underperforms both
Romney 2012 carry only Wayne, Pike, Carbon, Schuylkill, highest % 59.68 in
Wayne, 56.04% in Washington (Kerry 2004) In 2004, Bush won these plus
Monroe
100
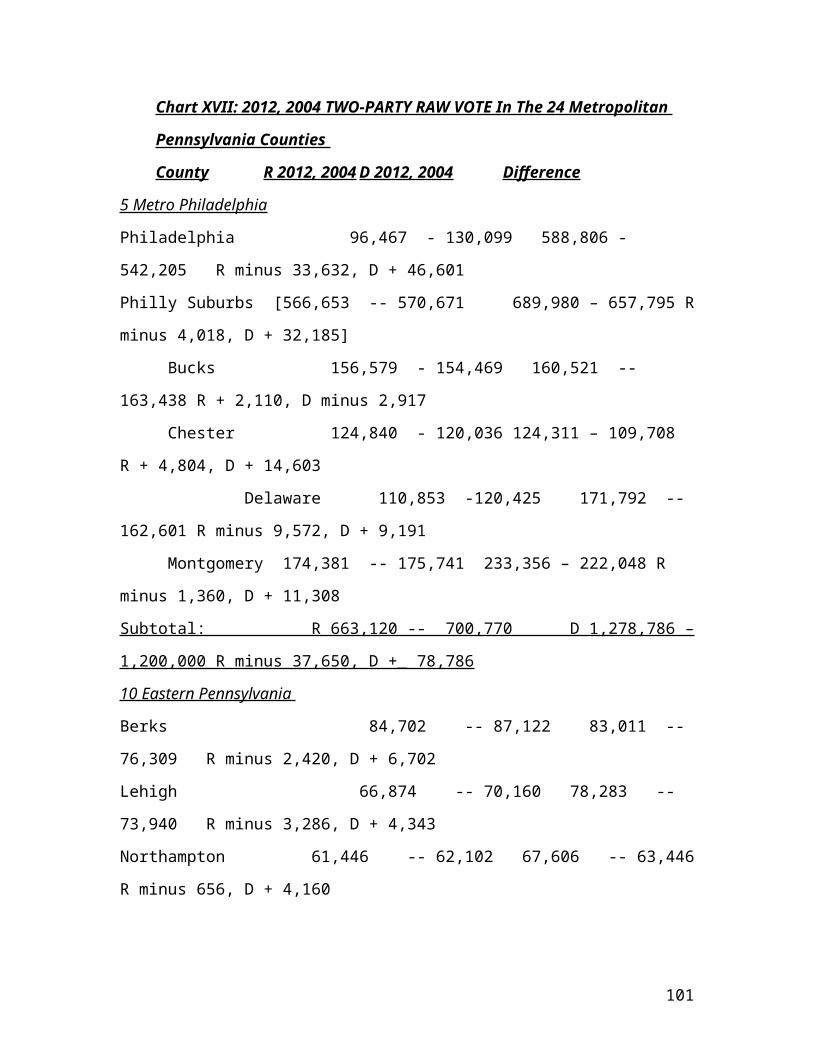
Chart XVII: 2012, 2004 TWO-PARTY RAW VOTE In The 24 Metropolitan
Pennsylvania Counties
County R 2012, 2004 D 2012, 2004 Difference
5 Metro Philadelphia
Philadelphia 96,467 - 130,099 588,806 -
542,205 R minus 33,632, D + 46,601
Philly Suburbs [566,653 -- 570,671 689,980 – 657,795 R
minus 4,018, D + 32,185]
Bucks 156,579 - 154,469 160,521 --
163,438 R + 2,110, D minus 2,917
Chester 124,840 - 120,036 124,311 – 109,708
R + 4,804, D + 14,603
Delaware 110,853 -120,425 171,792 --
162,601 R minus 9,572, D + 9,191
Montgomery 174,381 -- 175,741 233,356 – 222,048 R
minus 1,360, D + 11,308
Subtotal: R 663,120 -- 700,770 D 1,278,786 –
1,200,000 R minus 37,650, D +_ 78,786
10 Eastern Pennsylvania
Berks 84,702 -- 87,122 83,011 --
76,309 R minus 2,420, D + 6,702
Lehigh 66,874 -- 70,160 78,283 --
73,940 R minus 3,286, D + 4,343
Northampton 61,446 -- 62,102 67,606 -- 63,446
R minus 656, D + 4,160
101
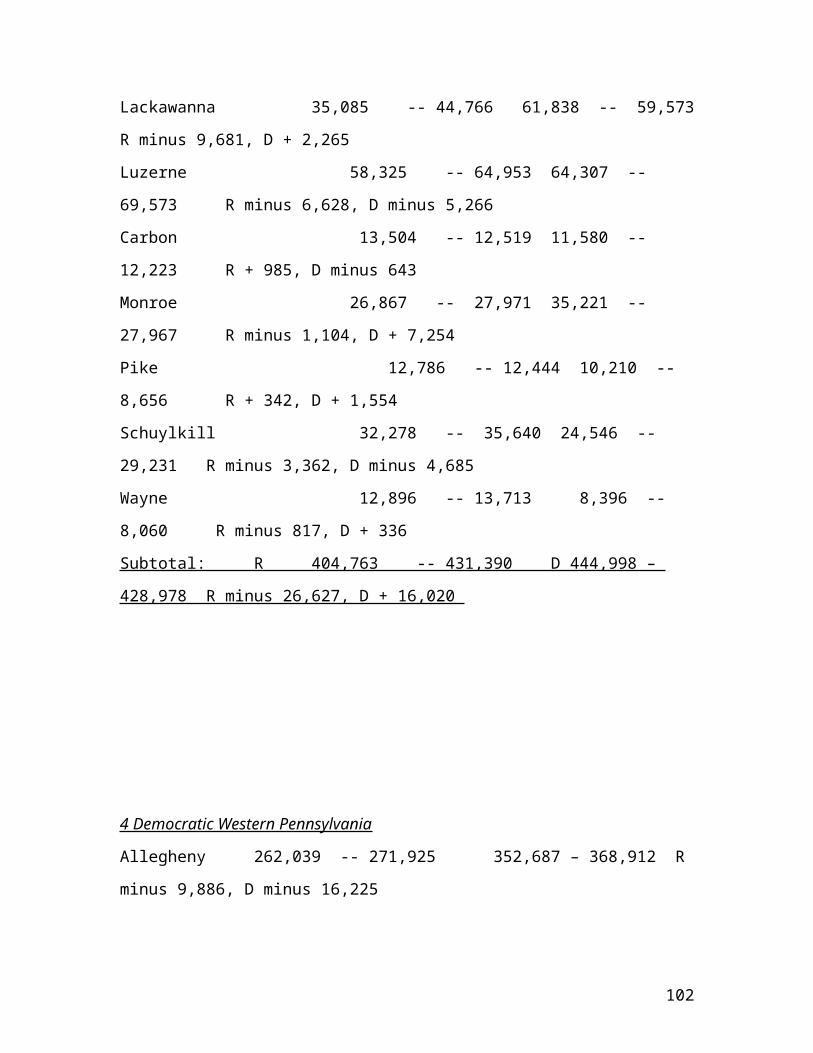
Lackawanna 35,085 -- 44,766 61,838 -- 59,573
R minus 9,681, D + 2,265
Luzerne 58,325 -- 64,953 64,307 --
69,573 R minus 6,628, D minus 5,266
Carbon 13,504 -- 12,519 11,580 --
12,223 R + 985, D minus 643
Monroe 26,867 -- 27,971 35,221 --
27,967 R minus 1,104, D + 7,254
Pike 12,786 -- 12,444 10,210 --
8,656 R + 342, D + 1,554
Schuylkill 32,278 -- 35,640 24,546 --
29,231 R minus 3,362, D minus 4,685
Wayne 12,896 -- 13,713 8,396 --
8,060 R minus 817, D + 336
Subtotal: R 404,763 -- 431,390 D 444,998 –
428,978 R minus 26,627, D + 16,020
4 Democratic Western Pennsylvania
Allegheny 262,039 -- 271,925 352,687 – 368,912 R
minus 9,886, D minus 16,225
102
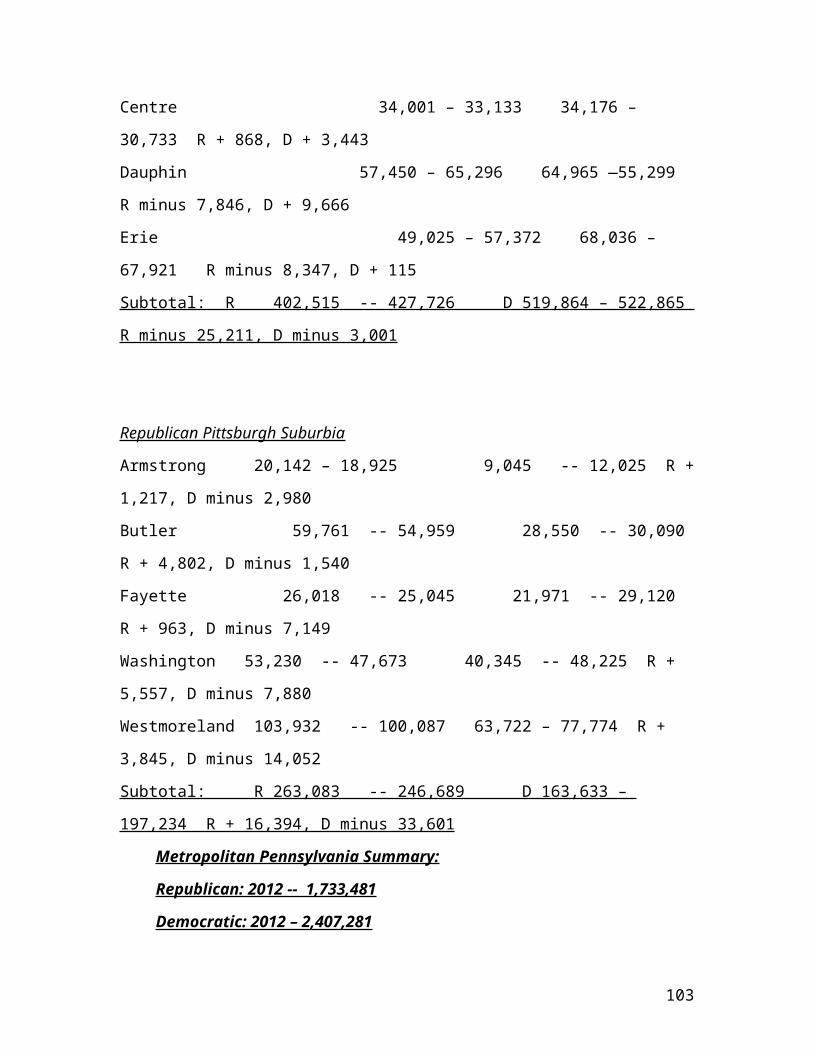
Centre 34,001 – 33,133 34,176 –
30,733 R + 868, D + 3,443
Dauphin 57,450 – 65,296 64,965 —55,299
R minus 7,846, D + 9,666
Erie 49,025 – 57,372 68,036 –
67,921 R minus 8,347, D + 115
Subtotal: R 402,515 -- 427,726 D 519,864 – 522,865
R minus 25,211, D minus 3,001
Republican Pittsburgh Suburbia
Armstrong 20,142 – 18,925 9,045 -- 12,025 R +
1,217, D minus 2,980
Butler 59,761 -- 54,959 28,550 -- 30,090
R + 4,802, D minus 1,540
Fayette 26,018 -- 25,045 21,971 -- 29,120
R + 963, D minus 7,149
Washington 53,230 -- 47,673 40,345 -- 48,225 R +
5,557, D minus 7,880
Westmoreland 103,932 -- 100,087 63,722 – 77,774 R +
3,845, D minus 14,052
Subtotal: R 263,083 -- 246,689 D 163,633 –
197,234 R + 16,394, D minus 33,601
Metropolitan Pennsylvania Summary:
Republican: 2012 -- 1,733,481
Democratic: 2012 – 2,407,281
103
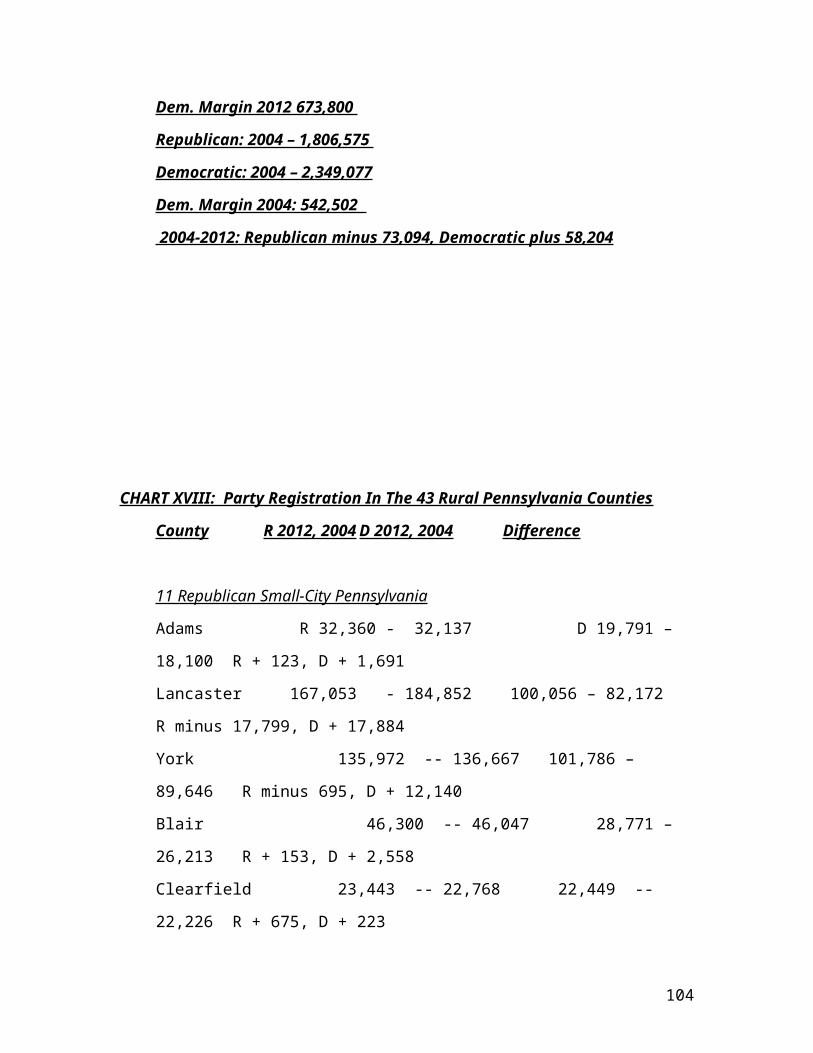
Dem. Margin 2012 673,800
Republican: 2004 – 1,806,575
Democratic: 2004 – 2,349,077
Dem. Margin 2004: 542,502
2004-2012: Republican minus 73,094, Democratic plus 58,204
CHART XVIII: Party Registration In The 43 Rural Pennsylvania Counties
County R 2012, 2004 D 2012, 2004 Difference
11 Republican Small-City Pennsylvania
Adams R 32,360 - 32,137 D 19,791 –
18,100 R + 123, D + 1,691
Lancaster 167,053 - 184,852 100,056 – 82,172
R minus 17,799, D + 17,884
York 135,972 -- 136,667 101,786 –
89,646 R minus 695, D + 12,140
Blair 46,300 -- 46,047 28,771 –
26,213 R + 153, D + 2,558
Clearfield 23,443 -- 22,768 22,449 --
22,226 R + 675, D + 223
104
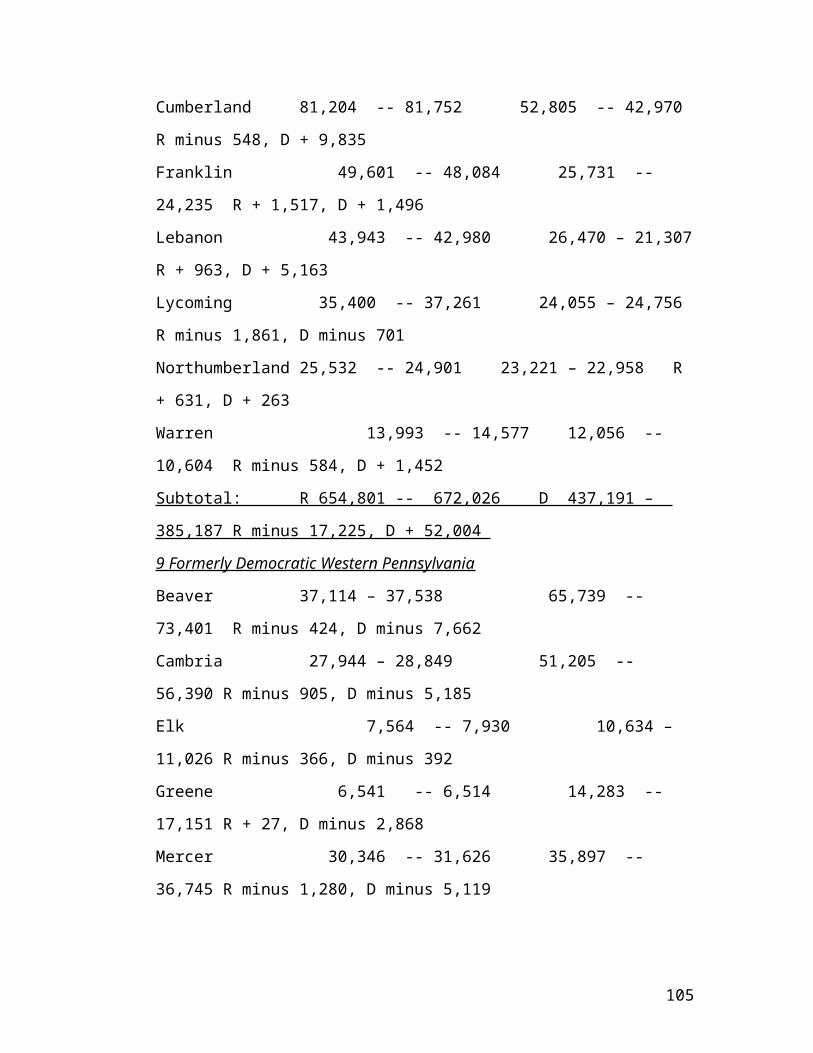
Cumberland 81,204 -- 81,752 52,805 -- 42,970
R minus 548, D + 9,835
Franklin 49,601 -- 48,084 25,731 --
24,235 R + 1,517, D + 1,496
Lebanon 43,943 -- 42,980 26,470 – 21,307
R + 963, D + 5,163
Lycoming 35,400 -- 37,261 24,055 – 24,756
R minus 1,861, D minus 701
Northumberland 25,532 -- 24,901 23,221 – 22,958 R
+ 631, D + 263
Warren 13,993 -- 14,577 12,056 --
10,604 R minus 584, D + 1,452
Subtotal: R 654,801 -- 672,026 D 437,191 –
385,187 R minus 17,225, D + 52,004
9 Formerly Democratic Western Pennsylvania
Beaver 37,114 – 37,538 65,739 --
73,401 R minus 424, D minus 7,662
Cambria 27,944 – 28,849 51,205 --
56,390 R minus 905, D minus 5,185
Elk 7,564 -- 7,930 10,634 –
11,026 R minus 366, D minus 392
Greene 6,541 -- 6,514 14,283 --
17,151 R + 27, D minus 2,868
Mercer 30,346 -- 31,626 35,897 --
36,745 R minus 1,280, D minus 5,119
105
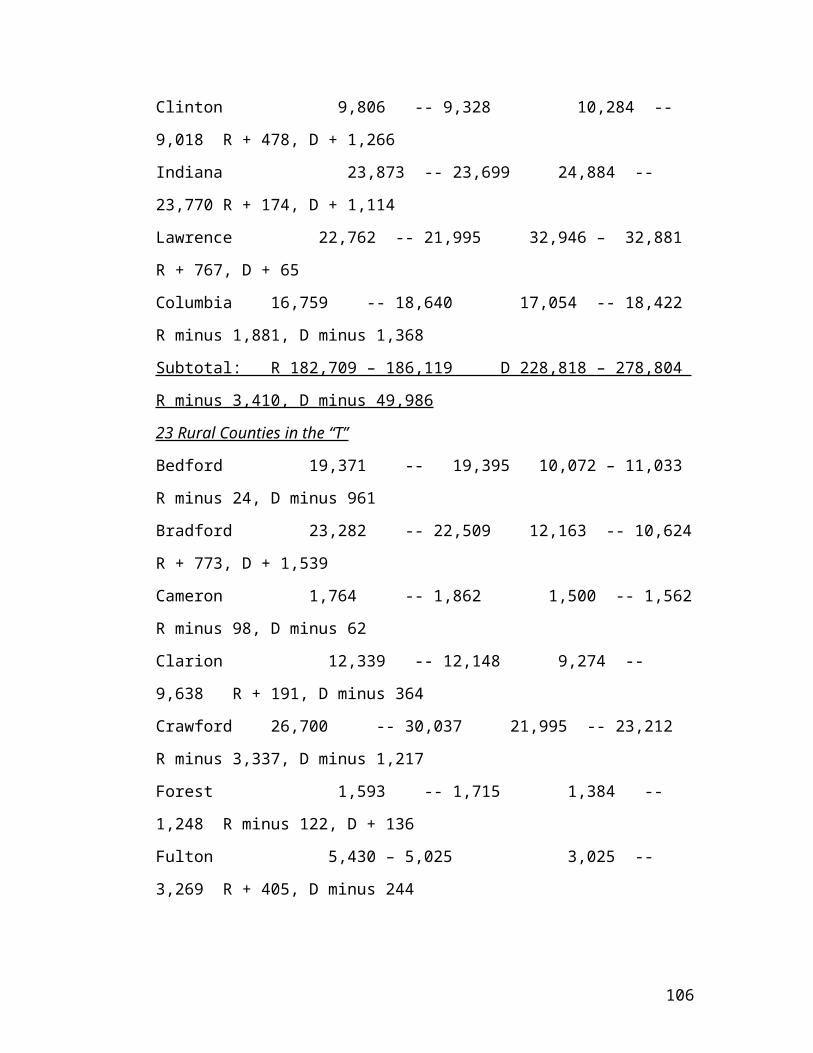
Clinton 9,806 -- 9,328 10,284 --
9,018 R + 478, D + 1,266
Indiana 23,873 -- 23,699 24,884 --
23,770 R + 174, D + 1,114
Lawrence 22,762 -- 21,995 32,946 – 32,881
R + 767, D + 65
Columbia 16,759 -- 18,640 17,054 -- 18,422
R minus 1,881, D minus 1,368
Subtotal: R 182,709 – 186,119 D 228,818 – 278,804
R minus 3,410, D minus 49,986
23 Rural Counties in the “T”
Bedford 19,371 -- 19,395 10,072 – 11,033
R minus 24, D minus 961
Bradford 23,282 -- 22,509 12,163 -- 10,624
R + 773, D + 1,539
Cameron 1,764 -- 1,862 1,500 -- 1,562
R minus 98, D minus 62
Clarion 12,339 -- 12,148 9,274 --
9,638 R + 191, D minus 364
Crawford 26,700 -- 30,037 21,995 -- 23,212
R minus 3,337, D minus 1,217
Forest 1,593 -- 1,715 1,384 --
1,248 R minus 122, D + 136
Fulton 5,430 – 5,025 3,025 --
3,269 R + 405, D minus 244
106
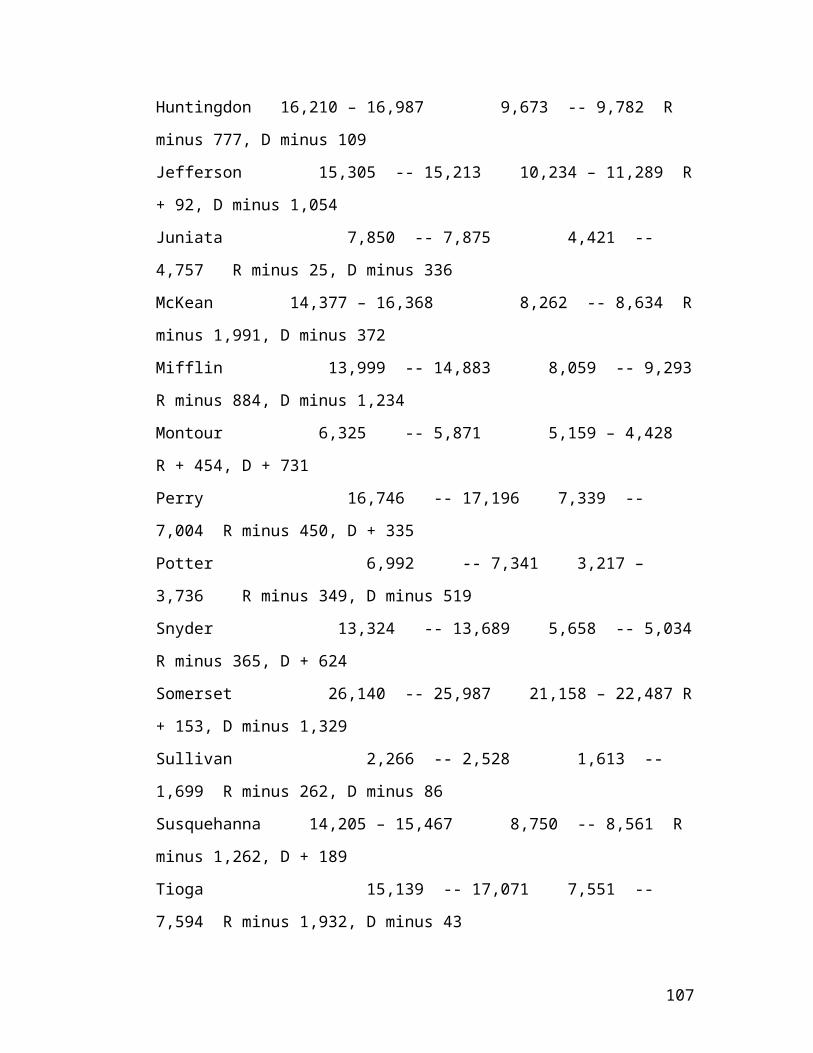
Huntingdon 16,210 – 16,987 9,673 -- 9,782 R
minus 777, D minus 109
Jefferson 15,305 -- 15,213 10,234 – 11,289 R
+ 92, D minus 1,054
Juniata 7,850 -- 7,875 4,421 --
4,757 R minus 25, D minus 336
McKean 14,377 – 16,368 8,262 -- 8,634 R
minus 1,991, D minus 372
Mifflin 13,999 -- 14,883 8,059 -- 9,293
R minus 884, D minus 1,234
Montour 6,325 -- 5,871 5,159 – 4,428
R + 454, D + 731
Perry 16,746 -- 17,196 7,339 --
7,004 R minus 450, D + 335
Potter 6,992 -- 7,341 3,217 –
3,736 R minus 349, D minus 519
Snyder 13,324 -- 13,689 5,658 -- 5,034
R minus 365, D + 624
Somerset 26,140 -- 25,987 21,158 – 22,487 R
+ 153, D minus 1,329
Sullivan 2,266 -- 2,528 1,613 --
1,699 R minus 262, D minus 86
Susquehanna 14,205 – 15,467 8,750 -- 8,561 R
minus 1,262, D + 189
Tioga 15,139 -- 17,071 7,551 --
7,594 R minus 1,932, D minus 43
107
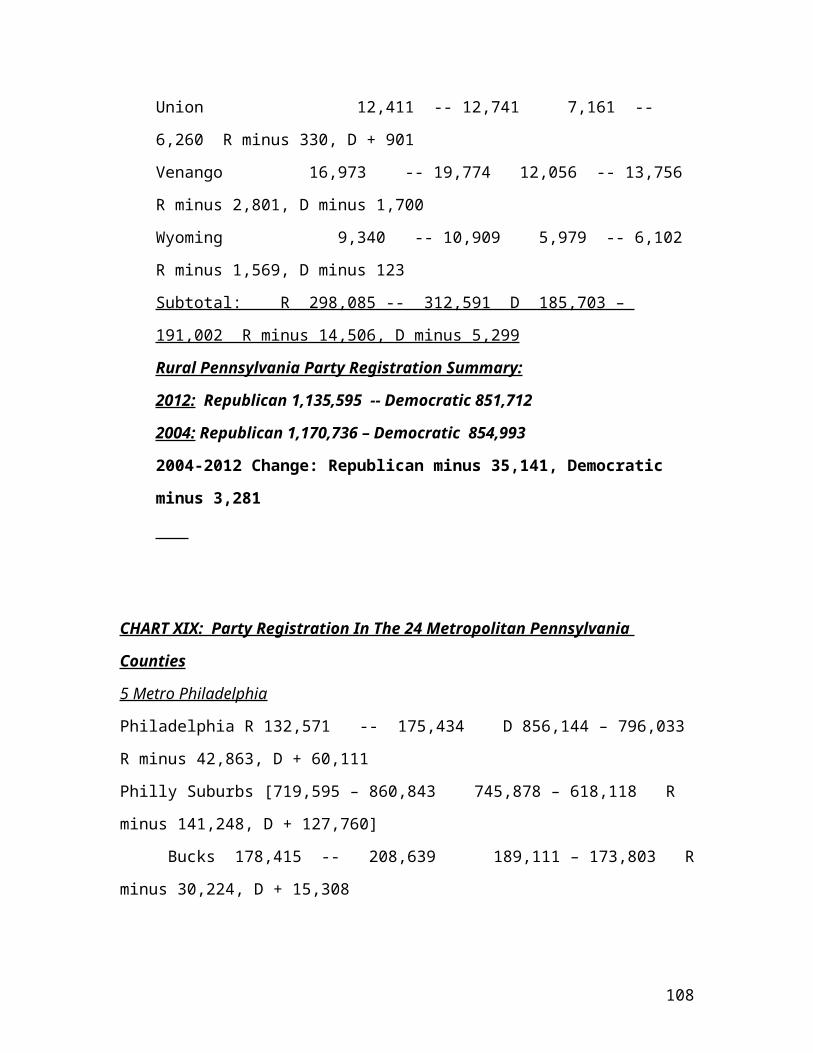
Union 12,411 -- 12,741 7,161 --
6,260 R minus 330, D + 901
Venango 16,973 -- 19,774 12,056 -- 13,756
R minus 2,801, D minus 1,700
Wyoming 9,340 -- 10,909 5,979 -- 6,102
R minus 1,569, D minus 123
Subtotal: R 298,085 -- 312,591 D 185,703 –
191,002 R minus 14,506, D minus 5,299
Rural Pennsylvania Party Registration Summary:
2012: Republican 1,135,595 -- Democratic 851,712
2004: Republican 1,170,736 – Democratic 854,993
2004-2012 Change: Republican minus 35,141, Democratic
minus 3,281
CHART XIX: Party Registration In The 24 Metropolitan Pennsylvania
Counties
5 Metro Philadelphia
Philadelphia R 132,571 -- 175,434 D 856,144 – 796,033
R minus 42,863, D + 60,111
Philly Suburbs [719,595 – 860,843 745,878 – 618,118 R
minus 141,248, D + 127,760]
Bucks 178,415 -- 208,639 189,111 – 173,803 R
minus 30,224, D + 15,308
108
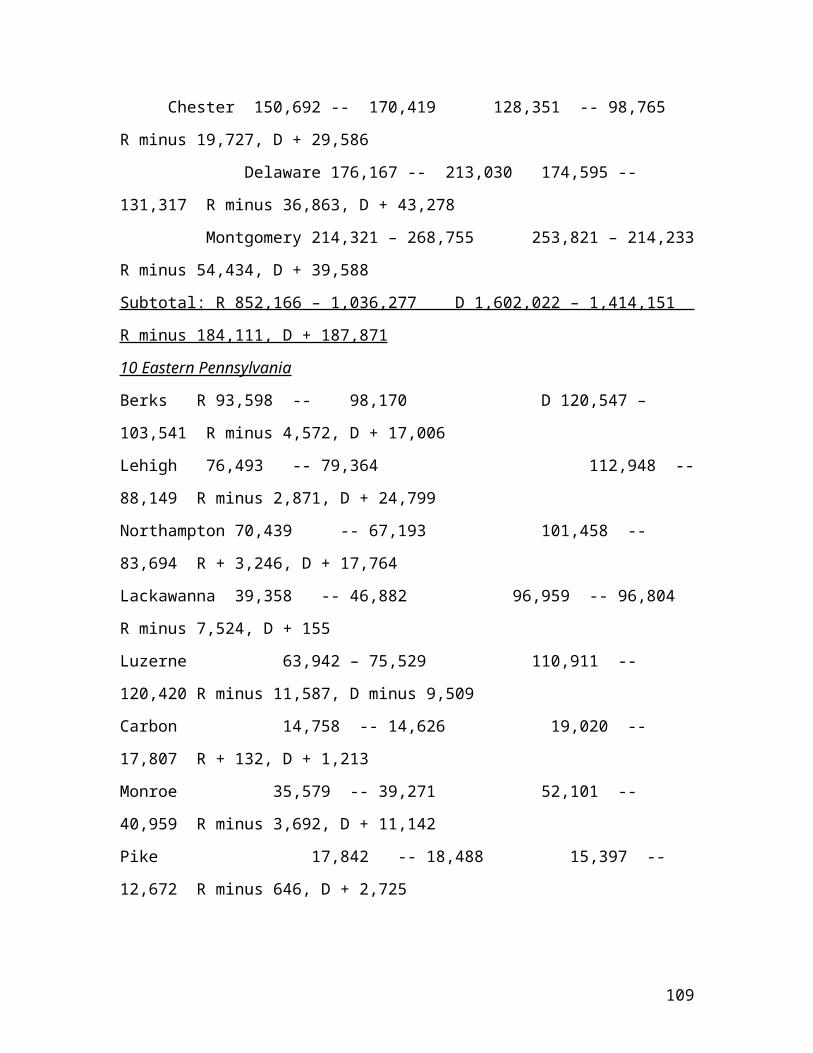
Chester 150,692 -- 170,419 128,351 -- 98,765
R minus 19,727, D + 29,586
Delaware 176,167 -- 213,030 174,595 --
131,317 R minus 36,863, D + 43,278
Montgomery 214,321 – 268,755 253,821 – 214,233
R minus 54,434, D + 39,588
Subtotal: R 852,166 – 1,036,277 D 1,602,022 – 1,414,151
R minus 184,111, D + 187,871
10 Eastern Pennsylvania
Berks R 93,598 -- 98,170 D 120,547 –
103,541 R minus 4,572, D + 17,006
Lehigh 76,493 -- 79,364 112,948 --
88,149 R minus 2,871, D + 24,799
Northampton 70,439 -- 67,193 101,458 --
83,694 R + 3,246, D + 17,764
Lackawanna 39,358 -- 46,882 96,959 -- 96,804
R minus 7,524, D + 155
Luzerne 63,942 – 75,529 110,911 --
120,420 R minus 11,587, D minus 9,509
Carbon 14,758 -- 14,626 19,020 --
17,807 R + 132, D + 1,213
Monroe 35,579 -- 39,271 52,101 --
40,959 R minus 3,692, D + 11,142
Pike 17,842 -- 18,488 15,397 --
12,672 R minus 646, D + 2,725
109
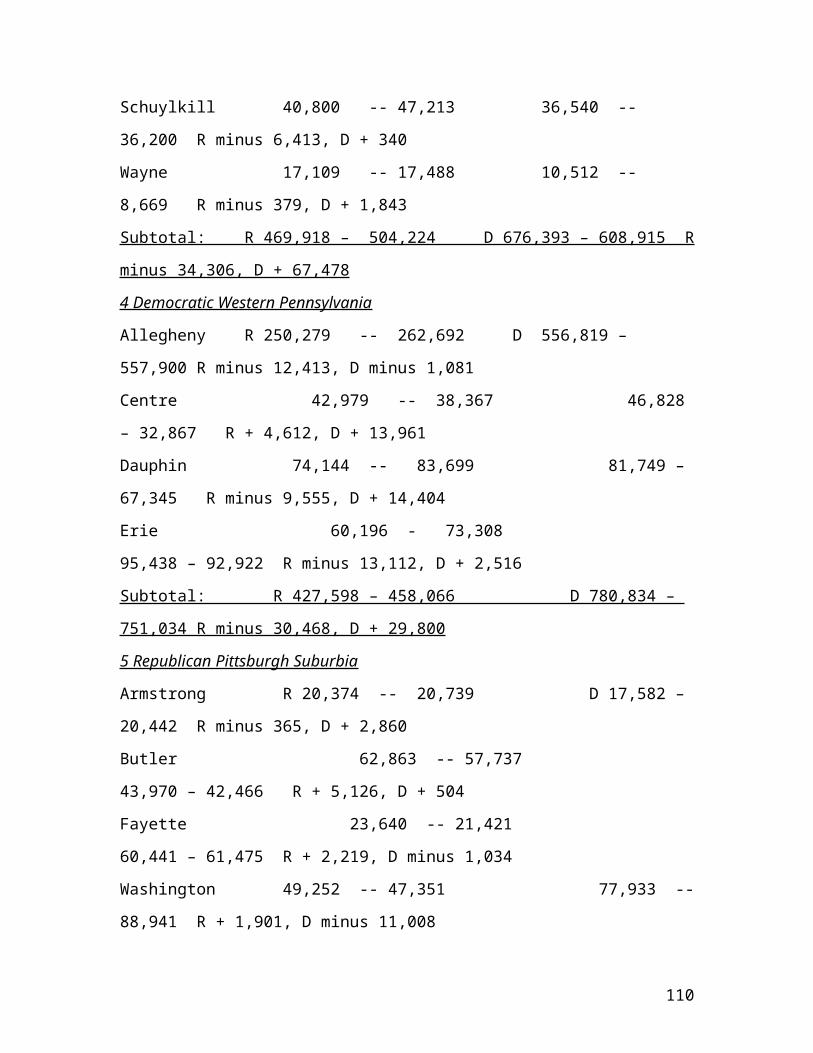
Schuylkill 40,800 -- 47,213 36,540 --
36,200 R minus 6,413, D + 340
Wayne 17,109 -- 17,488 10,512 --
8,669 R minus 379, D + 1,843
Subtotal: R 469,918 – 504,224 D 676,393 – 608,915 R
minus 34,306, D + 67,478
4 Democratic Western Pennsylvania
Allegheny R 250,279 -- 262,692 D 556,819 –
557,900 R minus 12,413, D minus 1,081
Centre 42,979 -- 38,367 46,828
– 32,867 R + 4,612, D + 13,961
Dauphin 74,144 -- 83,699 81,749 –
67,345 R minus 9,555, D + 14,404
Erie 60,196 - 73,308
95,438 – 92,922 R minus 13,112, D + 2,516
Subtotal: R 427,598 – 458,066 D 780,834 –
751,034 R minus 30,468, D + 29,800
5 Republican Pittsburgh Suburbia
Armstrong R 20,374 -- 20,739 D 17,582 –
20,442 R minus 365, D + 2,860
Butler 62,863 -- 57,737
43,970 – 42,466 R + 5,126, D + 504
Fayette 23,640 -- 21,421
60,441 – 61,475 R + 2,219, D minus 1,034
Washington 49,252 -- 47,351 77,933 --
88,941 R + 1,901, D minus 11,008
110
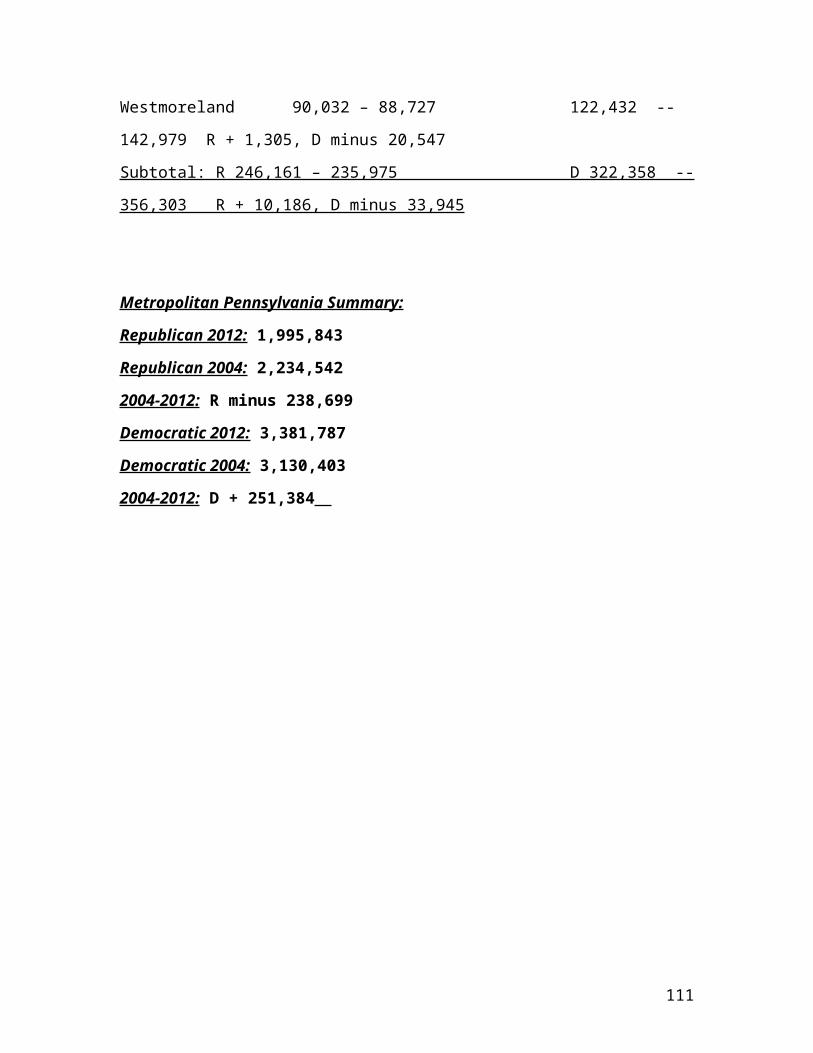
Westmoreland 90,032 – 88,727 122,432 --
142,979 R + 1,305, D minus 20,547
Subtotal: R 246,161 – 235,975 D 322,358 --
356,303 R + 10,186, D minus 33,945
Metropolitan Pennsylvania Summary:
Republican 2012: 1,995,843
Republican 2004: 2,234,542
2004-2012: R minus 238,699
Democratic 2012: 3,381,787
Democratic 2004: 3,130,403
2004-2012: D + 251,384
111
Related Documents

![Welcome! [gotombstone.org]gotombstone.org/free/nugget1.pdf · The Tombstone Nugget is published by the City of Tombstone, International Tourism Department, P.O. Box 1220, Tombstone](https://static.cupdf.com/doc/110x72/5fd4238e9c712976db423b23/welcome-the-tombstone-nugget-is-published-by-the-city-of-tombstone-international.jpg)