PEM Fuel Cell Material Research PEM Fuel Cell Material Research Michael Fowler, P.Eng., CEA Chemical Engineering University of Waterloo 200 University Ave West Waterloo, Ontario, Canada, N2L 3G1 519-888-4567 ext 3415 [email protected]

Welcome message from author
This document is posted to help you gain knowledge. Please leave a comment to let me know what you think about it! Share it to your friends and learn new things together.
Transcript
PEM Fuel Cell Material ResearchPEM Fuel Cell Material Research
Michael Fowler, P.Eng., CEAChemical EngineeringUniversity of Waterloo
200 University Ave WestWaterloo, Ontario, Canada, N2L 3G1
519-888-4567 ext [email protected]

Areas of InterestAreas of InterestMichael Fowler – Assistant Profession in Chemical Engineering at University of Waterloo (since 2004)Currently supervising (or co-supervising) 7 Graduate students Principal Areas of Interest– Reliability of Fuel Cell Materials (MEAs), Stacks
and Systems– Membrane Electrode Accessibly Degradation
Studies– Conductive Polymers for Bi-polar Plates– Hydrogen Energy System Design and Modeling
Fuel Cell Testing Facilities
•6 Fuel Cell Test Stations For Research on PEMFC •One bench for System testing (2 @ 1.2 kW Nexa, on 1.5 kW Anuvu)•65 kW bench system for ChallengeX

Fuel Cell System Models
Reliability Modeling
Reliability Model of a Fuel Cell Stack and Hydrogen Power System
Identify the Failure Modes (Material Degradation and Failure)
Identify the Causes of MaterialDegradationand Failure
Recommendations for Improved Designs, Materials and Operation Strategies
Membrane Electrode Degradation Membrane Electrode Degradation (MEA)(MEA)
To understand the degradation of fuel cell materialsTo understand how operational conditions impact the mechanism and rate of degradationTo understand the 2-D distribution of the above over the active area of the MEAWhat is done in the Lab:– Performance Assessment– Diagnostics– Forensics

Current Work Current Work –– Performance Performance Assessment Assessment In-situ
– Durability, OCV Testing, Hydration Cycling
Current Work Current Work –– Performance Performance Assessment Assessment
Ex-Situ– Fenton’s/Perox 80 Tests– Hydration cycling– Creep

Current Work Current Work -- DiagnosticsDiagnostics
The main cell diagnostics are– CV, Crossover current, AC impedance,
Fluoride release rate,
Ex-situ testing also includes– Mass, FTIR, DMTA, Tensile testing
Current Work Current Work -- ForensicsForensics
Forensic work is necessary when trying to understand the impact of degradation– e.g. SEM, Cryo-microtome, Crossover
mapping, Catalyst removal

ModelingModeling
FEM stress modeling 2-D degradation model with OH radical and mechanical degradation.

Forensics: Forensics: -- Membrane Electrode AssemblyMembrane Electrode Assembly
Pinholes and GDL Degradation
Contamination, Polymer degradation And Erosion
Delamination

Gas Diffusion Layer (GDL)Gas Diffusion Layer (GDL)
Standard Performance Diagnostics
In-SituTestsLiquid Water Diagnostics
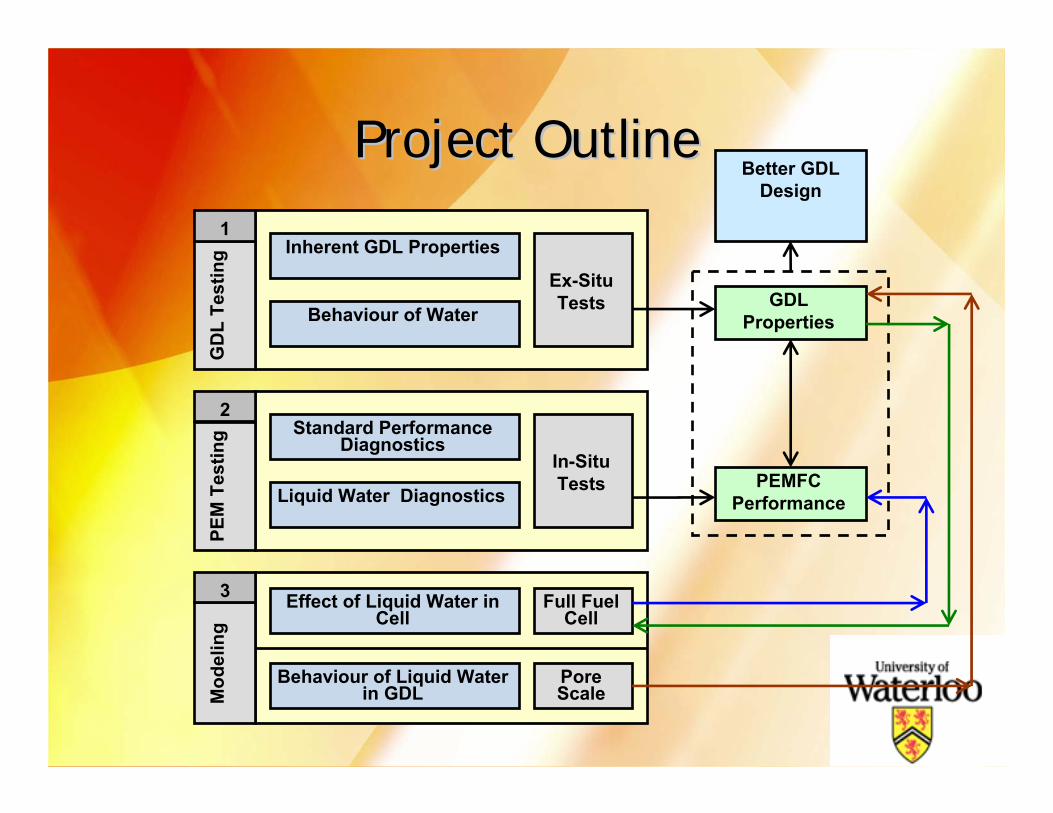
Project OutlineProject Outline
Full Fuel Cell
Pore Scale
Inherent GDL Properties
Behaviour of Water
Ex-SituTests
PEMFCPerformance
GDLProperties
Better GDL Design
GD
L Te
stin
gPE
M T
estin
gM
odel
ing
1
2
3 Effect of Liquid Water in Cell
Behaviour of Liquid Water in GDL

Degradation of Gas Diffusion LayerDegradation of Gas Diffusion LayerGDL Properties GDL Performance
•Capillary Pressure Curves
•Hydrophilic Pore Fraction
•Distribution of PTFE
•Gas and Liquid Permeability
•Thru Plane
•In Plane
•Relative Permeability
•Compression Effects
•Young’s Modulus
•Permeability
•Porosity
•In Situ Saturation Tests
•Current Interrupt, Water Collection, etc.
•Mass Transfer Tests
•Limiting Current, AC Impedance.
PEMFC Model
•Model water transport at the cell scale
•Use appropriate models and well known parameters

Hydrophobic GDLHydrophobic GDL
Water Flow
Conventional Wisdom:
PTFE treatment confines water to a subset of pores, assuring open pores for gas transport
Gas Flow
Hydrophilic Pores:
Pores into which water spontaneously imbibes.
Saturation:
Fraction of pores filled by waterGDL
Nafion Membrane
Catalyst Layer
Hydrophobic Pore
Hydrophilic Pore
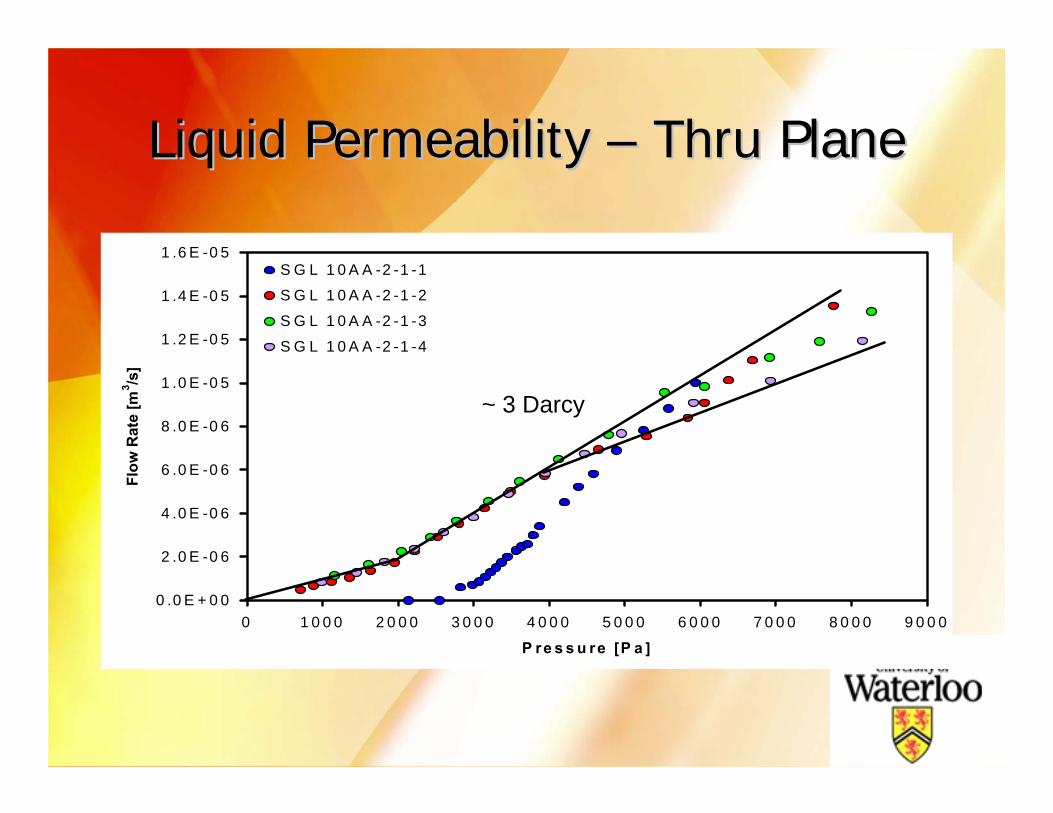
Liquid Permeability Liquid Permeability –– Thru PlaneThru Plane
0 .0 E + 0 0
2 .0 E -0 6
4 .0 E -0 6
6 .0 E -0 6
8 .0 E -0 6
1 .0 E -0 5
1 .2 E -0 5
1 .4 E -0 5
1 .6 E -0 5
0 1 0 0 0 2 0 0 0 3 0 0 0 4 0 0 0 5 0 0 0 6 0 0 0 7 0 0 0 8 0 0 0 9 0 0 0
P re s s u re [P a ]
Flow
Rat
e [m
3 /s]
S G L 1 0 A A -2 -1 -1
S G L 1 0 A A -2 -1 -2
S G L 1 0 A A -2 -1 -3
S G L 1 0 A A -2 -1 -4
~ 3 Darcy

Mass transfer inMass transfer in--plane and throughplane and through--plane plane in GDLin GDL
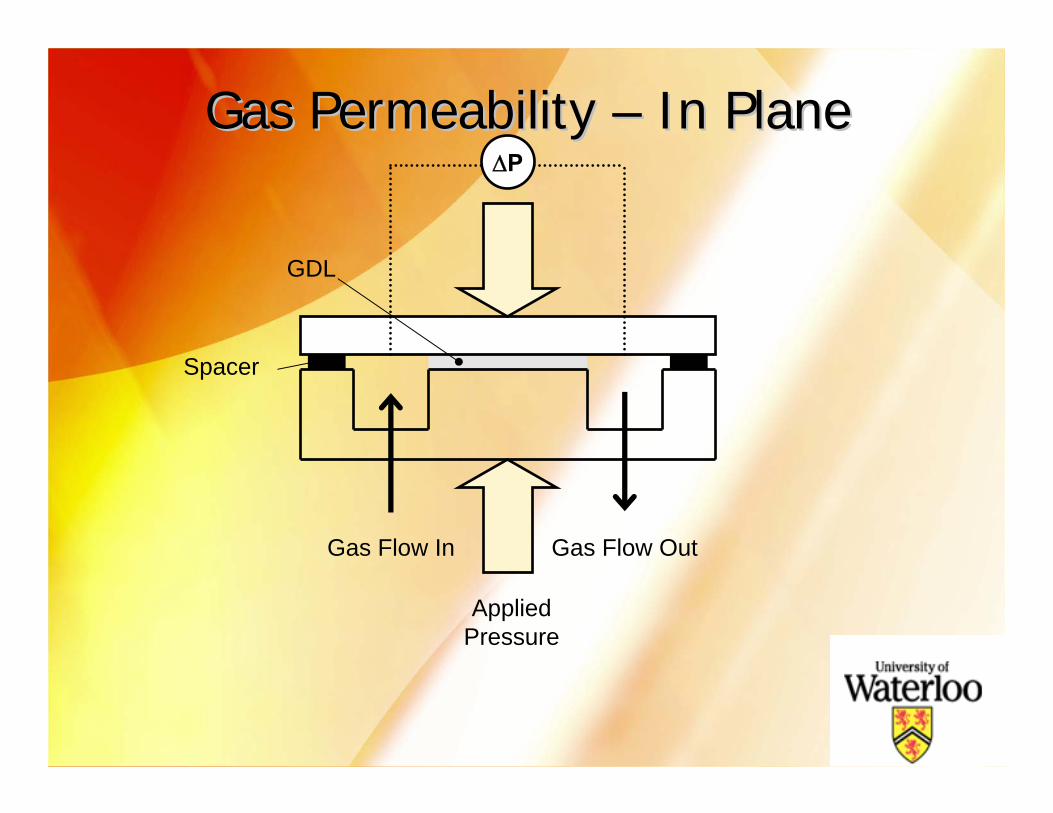
Gas Permeability Gas Permeability –– In PlaneIn PlaneΔP
Gas Flow In Gas Flow Out
Applied Pressure
Spacer
GDL
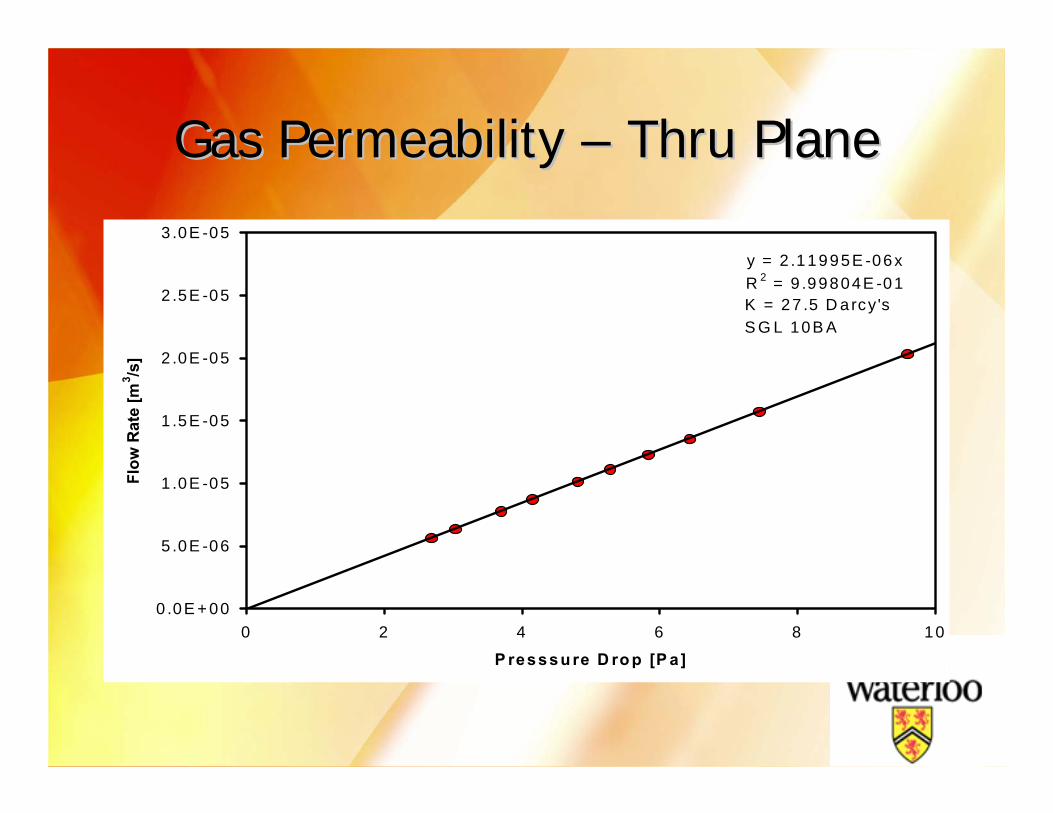
Gas Permeability Gas Permeability –– Thru PlaneThru Plane
y = 2 .11995E -06xR 2 = 9 .99804E -01
0 .0E + 00
5 .0E -06
1 .0E -05
1 .5E -05
2 .0E -05
2 .5E -05
3 .0E -05
0 2 4 6 8 10
P resssu re D ro p [P a ]
Flow
Rat
e [m
3 /s]
K = 27 .5 D a rcy'sS G L 10B A
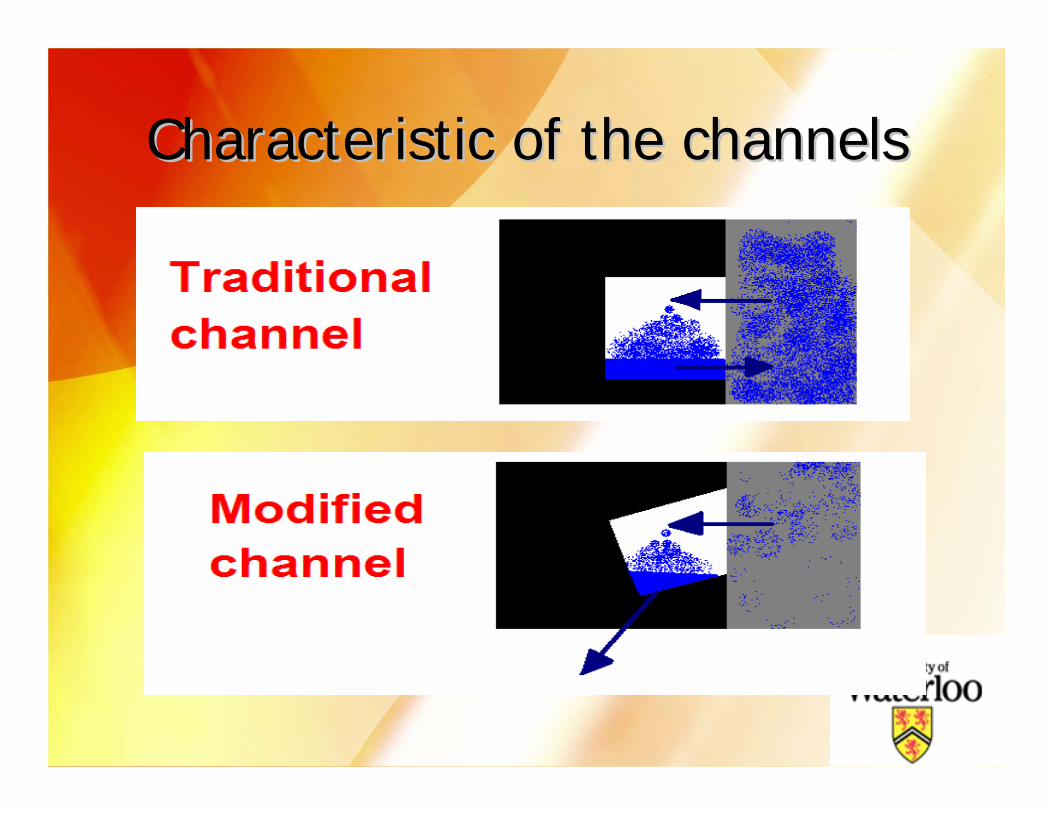
Characteristic of the channelsCharacteristic of the channels

Other MEA InitiativesOther MEA Initiatives
Innovative Catalysis Distribution in the ElectrodeLow Cost Conductive Polymers

F ill H o p p e r
R e s in H o p p e r
E x tru d e r P e l le t iz e r In je c t io n M o ld in g M a c h in e
M ix in g
M ix in g P ro c e s s M o ld in g P ro c e s sV irg in C o m p o n e n ts
P o ly p ro p y le n e
C a rb o n F ib e rV u lc a n B la c kA c e ty le n e B la c k
F i l l H o p p e r
R e s in H o p p e r
E x tru d e r P e l le t iz e r In je c t io n M o ld in g M a c h in e
M ix in g
M ix in g P ro c e s s M o ld in g P ro c e s sV irg in C o m p o n e n ts
P o ly p ro p y le n e
C a rb o n F ib e rV u lc a n B la c kA c e ty le n e B la c k
Conductive PolymersBiBi--Polar Plate DevelopmentPolar Plate Development
Solid Modeling of a Fuel Cell Plate
Injection Moldable Bi-Polar Plate
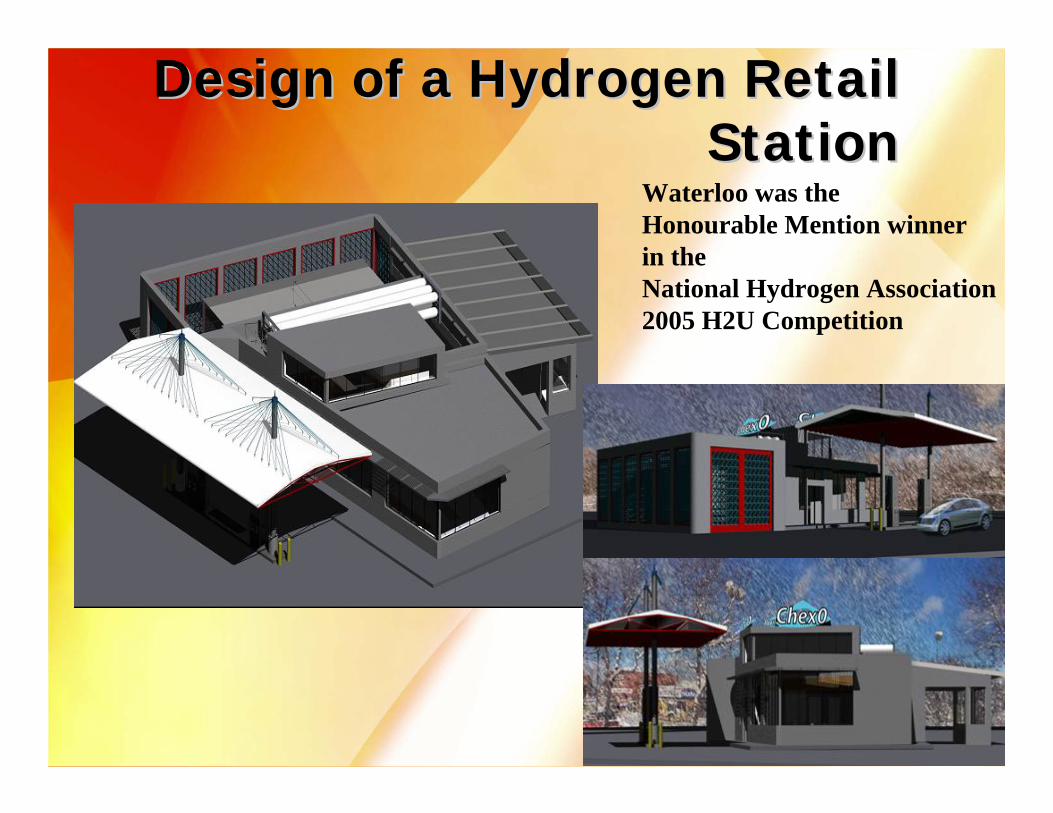
Design of a Hydrogen Retail Design of a Hydrogen Retail StationStation
Waterloo was the Honourable Mention winner in the National Hydrogen Association 2005 H2U Competition
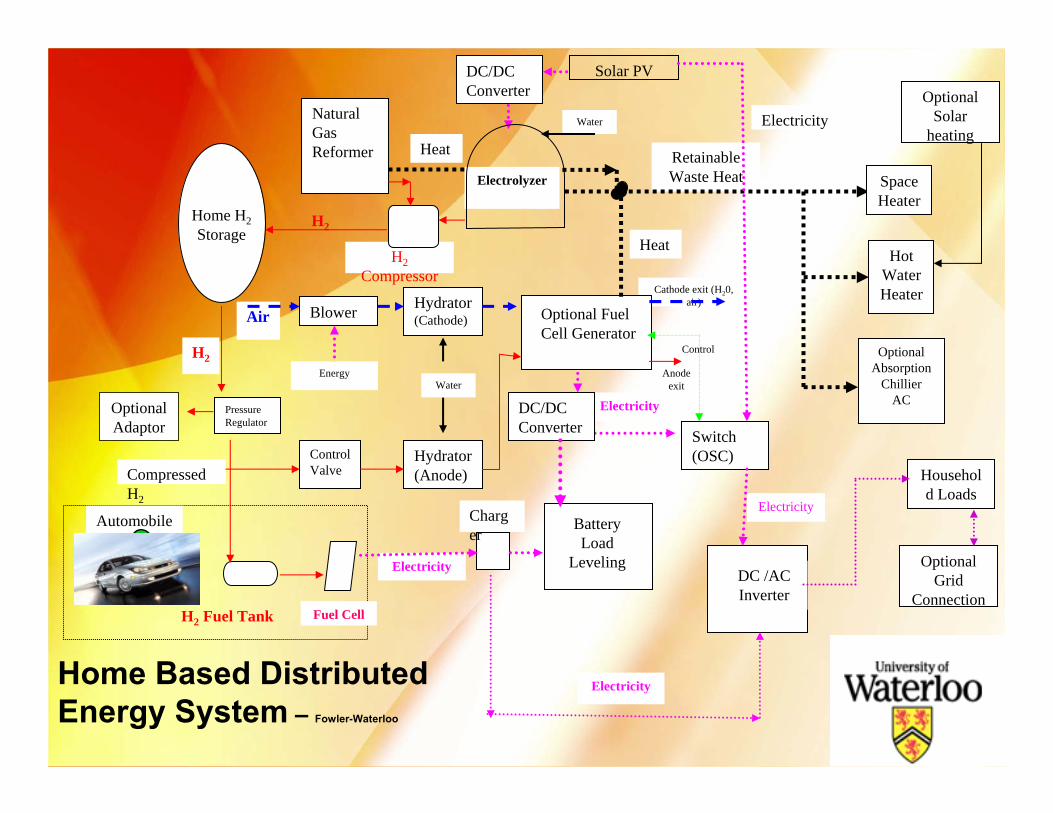
Home Based Distributed Energy System – Fowler-Waterloo
ControlH2
Electrolyzer
Electricity
Water
Anode exit
Cathode exit (H20, air)
Home H2Storage
H2Compressor
Solar PV
H2 Fuel Tank Fuel Cell
Automobile
Compressed H2
Charger
Battery Load
LevelingDC /AC Inverter
Optional Fuel Cell Generator
Electricity
Electricity
Retainable Waste Heat Space
Heater
Hot Water Heater
Optional Absorption
Chillier AC
Household Loads
Optional Grid
Connection
Optional Solar
heating
Optional Adaptor Switch
(OSC)
DC/DC Converter
DC/DC Converter
Hydrator (Anode)
Hydrator (Cathode)Blower
Heat
ControlValve
Air
Electricity
Electricity
EnergyWater
PressureRegulator
Natural Gas Reformer Heat
H2
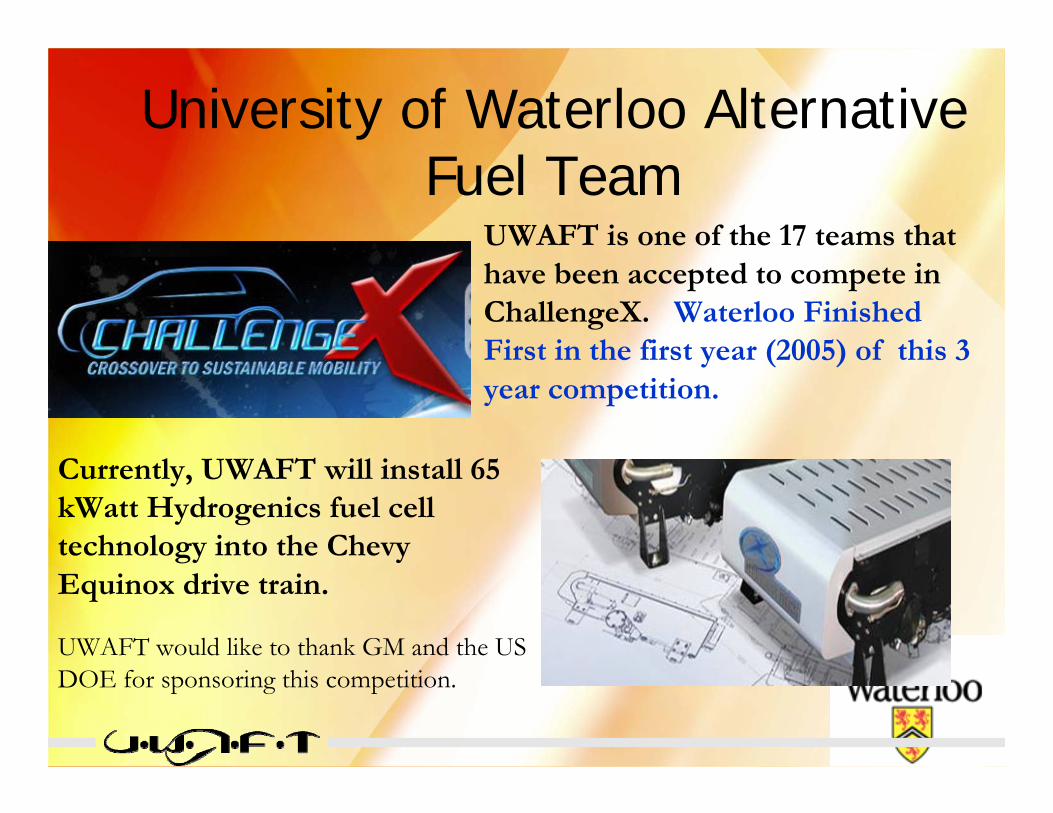
University of Waterloo Alternative Fuel Team
UWAFT is one of the 17 teams that have been accepted to compete in ChallengeX. Waterloo Finished First in the first year (2005) of this 3 year competition.
Currently, UWAFT will install 65 kWatt Hydrogenics fuel cell technology into the Chevy Equinox drive train.
UWAFT would like to thank GM and the US DOE for sponsoring this competition.


QuestionsQuestions
Michael Fowler, P.Eng., CEAChemical EngineeringUniversity of Waterloo
200 University Ave WestWaterloo, Ontario, Canada, N2L 3G1
519-888-4567 ext [email protected]

GDL ResearchGDL Research

In-SituTests
Objectives Objectives
Fuel CellModel
Pore ScaleModel
Ex-SituTests
GDLProperties
PEMFCPerformance
Better GDLs
Understand Fundamental Physics
Understand Complex Interactions
Explore Fundamental
Physics
Provide Model
Validation Identify Important Relationships
Provide Model Parameters
Improve PEM fuel cell performance through focused study of the Gas Diffusion Layer
1. Understand the behaviour of liquid water in the GDL
2. Elucidate the effects of liquid water in the GDL on fundamental mass transport properties
3. Develop a PEMFC model to effectively account for liquid water effects
4. Relate the performance of PEMFCs to fundamental GDL properties

Standard Performance Diagnostics
In-SituTestsLiquid Water Diagnostics
Project OutlineProject Outline
Full Fuel Cell
Pore Scale
Inherent GDL Properties
Behaviour of Water
Ex-SituTests
PEMFCPerformance
GDLProperties
Better GDL Design
GD
L Te
stin
gPE
M T
estin
gM
odel
ing
1
2
3 Effect of Liquid Water in Cell
Behaviour of Liquid Water in GDL

Background: Water in the GDLBackground: Water in the GDL
0
0.2
0.4
0.6
0.8
1
Effe
ctiv
e D
iffus
ivity
Fac
tor (
f)
Open AirDry GDL (70% Porosity)Slightly Wet GDL (10%)Very Wet GDL (50%)
(DAB)eff = f (ε,s) x DAB
Water Flow
Gas Transport
GDLNafion
Membrane
Catalyst Layer
Hydrophobic Pore
Hydrophilic Pore
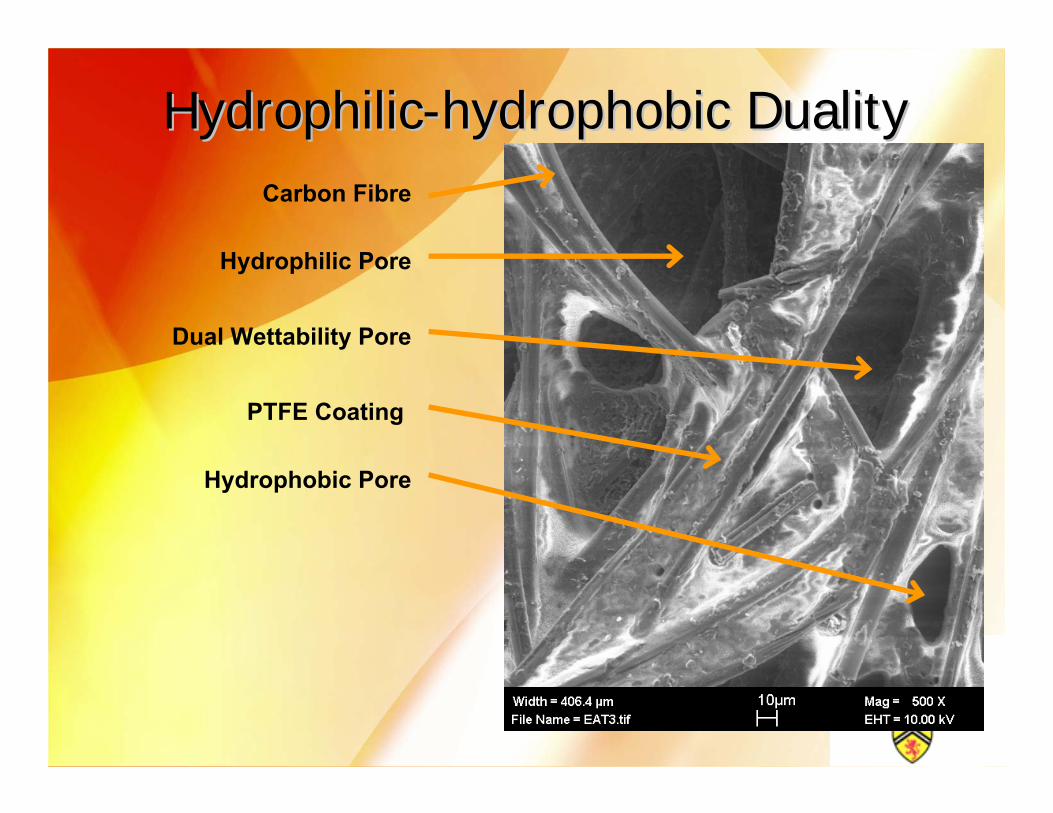
HydrophilicHydrophilic--hydrophobic Dualityhydrophobic DualityCarbon Fibre
Hydrophilic Pore
Dual Wettability Pore
Hydrophobic Pore
PTFE Coating
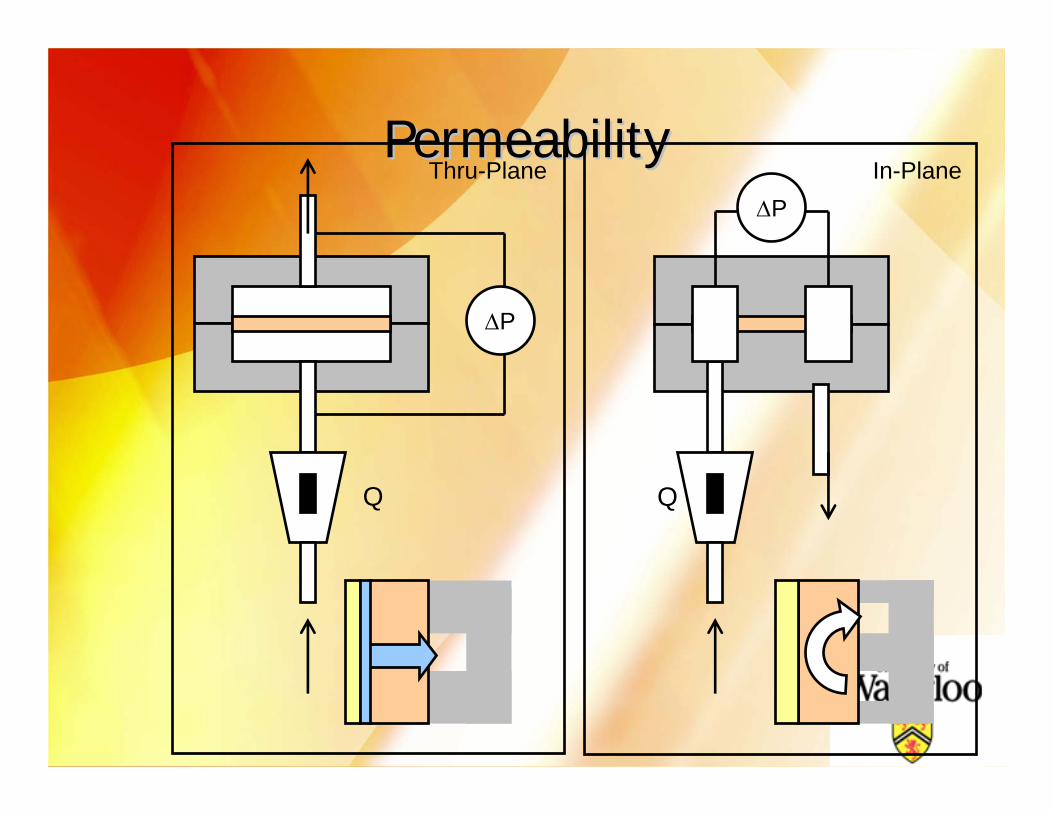
PermeabilityPermeability
ΔP
Q
ΔP
Q
Thru-Plane In-Plane
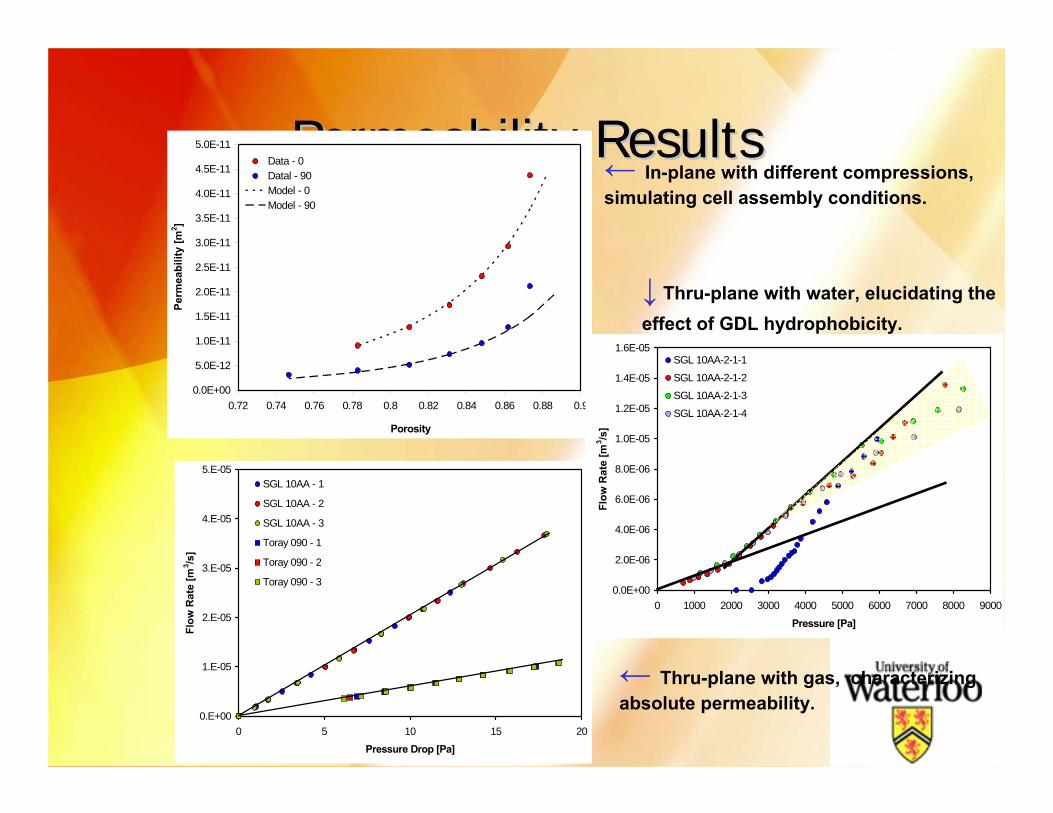
Permeability ResultsPermeability Results
0.E+00
1.E-05
2.E-05
3.E-05
4.E-05
5.E-05
0 5 10 15 20
Pressure Drop [Pa]
Flow
Rat
e [m
3 /s]
SGL 10AA - 1
SGL 10AA - 2
SGL 10AA - 3
Toray 090 - 1
Toray 090 - 2
Toray 090 - 3
0.0E+00
5.0E-12
1.0E-11
1.5E-11
2.0E-11
2.5E-11
3.0E-11
3.5E-11
4.0E-11
4.5E-11
5.0E-11
0.72 0.74 0.76 0.78 0.8 0.82 0.84 0.86 0.88 0.9
Porosity
Perm
eabi
lity
[m2 ]
Data - 0Datal - 90Model - 0Model - 90
0.0E+00
2.0E-06
4.0E-06
6.0E-06
8.0E-06
1.0E-05
1.2E-05
1.4E-05
1.6E-05
0 1000 2000 3000 4000 5000 6000 7000 8000 9000
Pressure [Pa]
Flow
Rat
e [m
3 /s]
SGL 10AA-2-1-1
SGL 10AA-2-1-2
SGL 10AA-2-1-3
SGL 10AA-2-1-4
← In-plane with different compressions, simulating cell assembly conditions.
↓ Thru-plane with water, elucidating the effect of GDL hydrophobicity.
← Thru-plane with gas, characterizing absolute permeability.
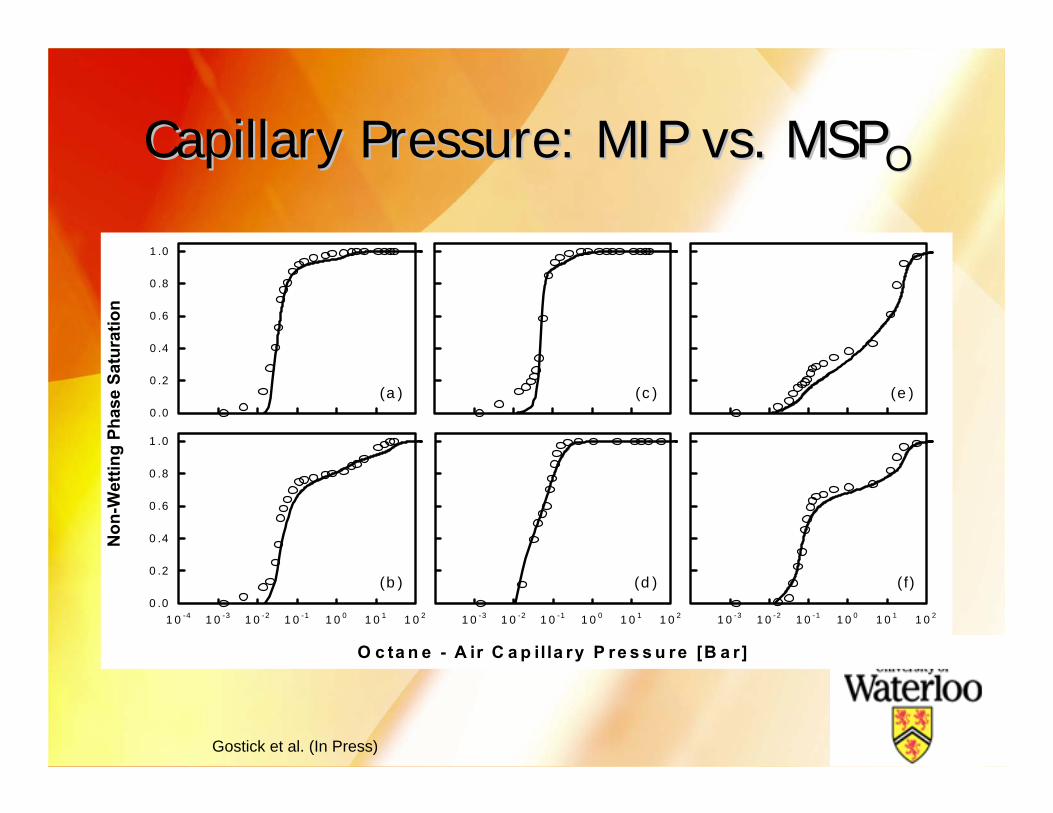
Capillary Pressure: MIP vs. MSPCapillary Pressure: MIP vs. MSPOO
0 .0
0 .2
0 .4
0 .6
0 .8
1 .0
1 .0
0 .8
0 .6
0 .4
0 .2
0 .01 0 21 0 11 0 01 0 -11 0 -21 0 -31 0 -4 1 0 -3 1 0 -2 1 0 -1 1 0 0 1 0 1 1 0 2 1 0 21 0 11 0 01 0 -11 0 -21 0 -3
O c ta n e - A ir C a p illa ry P re s s u re [B a r]
Non
-Wet
ting
Phas
e Sa
tura
tion
(a )
(b )
(c )
(d )
(e )
( f)
Gostick et al. (In Press)

Capillary Pressure: MSPCapillary Pressure: MSPWW vs. MSPvs. MSPOO
0 .0
0 .2
0 .4
0 .6
0 .8
1 .0
1 .0
0 .8
0 .6
0 .4
0 .2
0 .01 0 21 0 11 0 01 0 -11 0 -21 0 -31 0 -4 1 0 21 0 11 0 01 0 -11 0 -21 0 -3 1 0 21 0 11 0 01 0 -11 0 -21 0 -3
W a te r - A ir C a p illa ry P re s s u re [B a r ]
Non
-Wet
ting
Phas
e Sa
tura
tion
(b )
(a ) (c )
(d )
(e )
( f)
Gostick et al. (In Press)

Capillary Pressure: Model FitsCapillary Pressure: Model Fits
1 0 -2 1 0 -1 1 0 0 1 0 10 .0
0 .2
0 .4
0 .6
0 .8
1 .0
1 0 11 0 01 0 -11 0 -2 1 0 -2 1 0 -1 1 0 0 1 0 1
Non
-Wet
ting
Phas
e Sa
tura
tion
W a te r - A ir C a p illa ry P re s s u re [B a r ]
(a ) (b ) (c )
van Genuchten model Brooks-Corey modelGostick et al. (In Press)
E-Tek Cloth ‘A’ Toray 090 SGL 10BA

Capillary Pressure: Microporous LayerCapillary Pressure: Microporous Layer
0 .0 0 0
0 .0 0 5
0 .0 1 0
0 .0 1 5
0 .0 2 0
0 .0 0 0
0 .0 0 5
0 .0 1 0
0 .0 1 5
0 .0 2 0
2 3 4 5P o re R a d iu s ( lo g 1 0 r ) [n m ]
1 0 11 0 01 0 -11 0 -21 0 -31 0 -40 .0
0 .1
0 .2
0 .3
0 .4
0 .5
0 .6
0 .7
0 .8
0 .9
1 .0
Non
-Wet
ting
Phas
e Sa
tura
tion
1 0 B A
1 0 B B
A ir -W a te r C a p illa ry P re s s u re [B a r]
Pore
Vol
ume
[cc/
cc]
(a )
(b )
(c )
Gostick et al. (In Press)

Capillary Pressure: Microporous LayerCapillary Pressure: Microporous Layer
10110010-110-210-30.0
0.1
0.2
0.3
0.4
0.5
0.6
0.7
0.8
0.9
1.0
Air-Water Capillary Pressure [Bar]
Non
-wet
ting
Phas
e Sa
tura
tion
SGL 10BBSGL 10BASGL10BASGL10BA + MPLMPL
Gostick et al. (In Press)

Polarization Losses: ContributionsPolarization Losses: Contributions
0
0.2
0.4
0.6
0.8
1
1.2
1.4
1.6
1.8
0 0.5 1 1.5 2
Current Density [A/cm2]
Ove
rpot
entia
l [V]
Open Circuit VoltageActivationActivation and OhmicActivation, Ohmic and Concentration
0
0.5
1
1.5
2
2.5
0 0.5 1 1.5 2
Current Density [A/cm2]
Pow
er D
ensi
ty [W
/cm
2 ]
Open Circuit Voltage
Activation
Activation and Ohmic
Activation, Ohmic and Concentration
VCELL = ER – VACT – ViR – VCONC
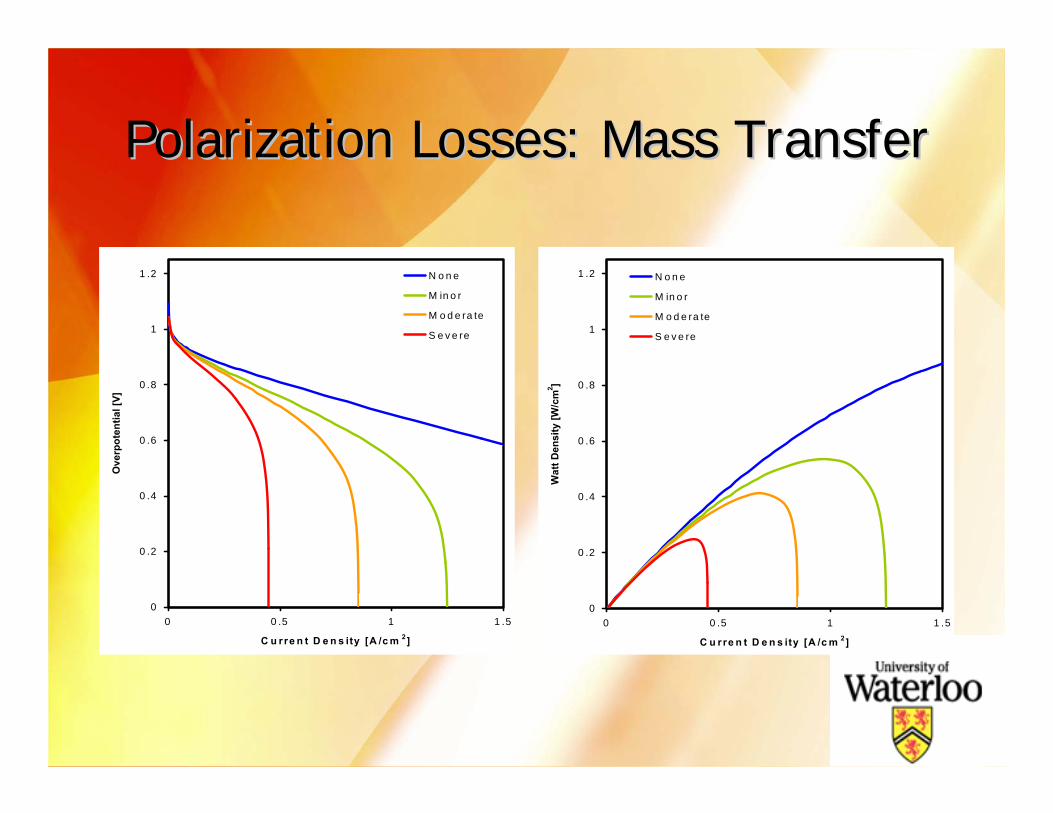
Polarization Losses: Mass TransferPolarization Losses: Mass Transfer
0
0 .2
0 .4
0 .6
0 .8
1
1 .2
0 0 .5 1 1 .5
C u rre n t D e n s ity [A /c m 2]
Ove
rpot
entia
l [V]
N o n e
M in o r
M o d e ra te
S e v e re
0
0 .2
0 .4
0 .6
0 .8
1
1 .2
0 0 .5 1 1 .5
C u rre n t D e n s ity [A /c m 2]
Wat
t Den
sity
[W/c
m2 ]
N o n e
M in o r
M o d e ra te
S e v e re

FEM Lab Model: 2D UFT FEM Lab Model: 2D UFT No under-land compression.

FEM Lab Model: 2D UFTFEM Lab Model: 2D UFTWith under-land compression. Reduced mean pore size and reduced permeability

MEA Degradation ResearchMEA Degradation Research

DEGRADATION FAILURE MODES DEGRADATION FAILURE MODES (leading to degradation of performance or (leading to degradation of performance or durabilitydurability))
• Kinetic or activation loss in the anode or cathode catalyst –Loss of Apparent Catalytic Activity
• Ohmic or resistive increases in the membrane or other components –Loss of Conductivity
• Decrease in the mass transfer rate of in the reactants flow channel or electrode –Loss of Mass Transfer Rate of
Reactants
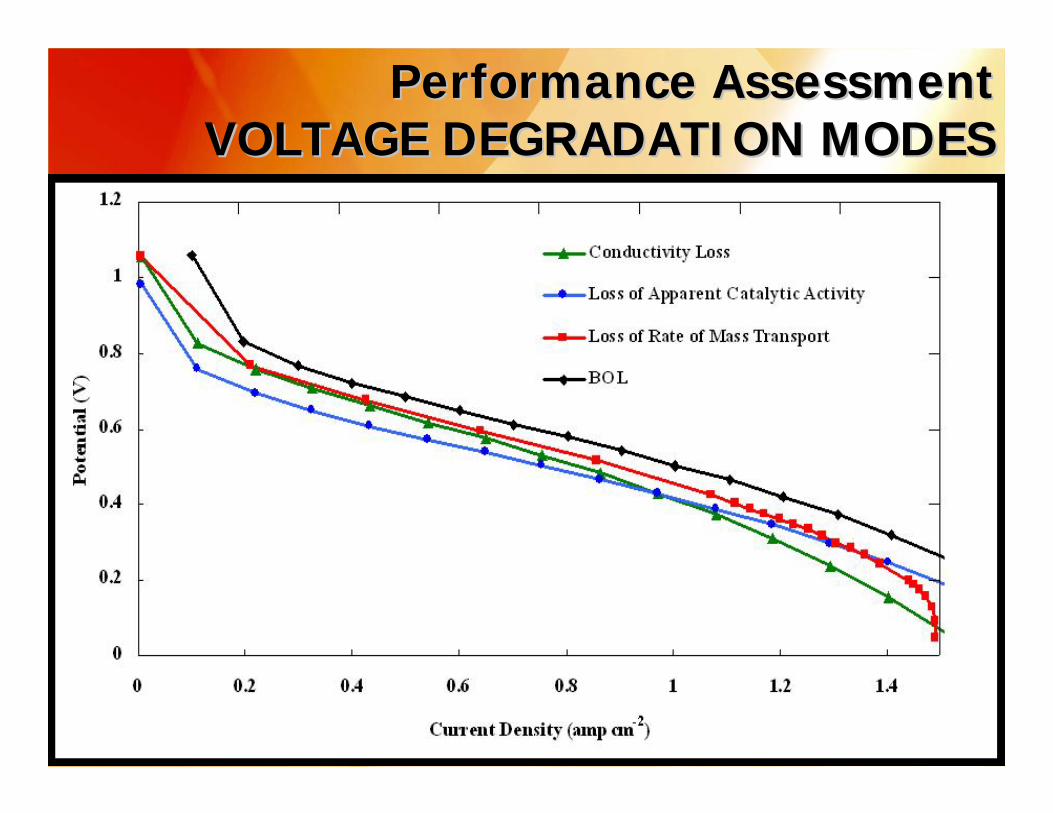
Performance Assessment Performance Assessment VOLTAGE DEGRADATION MODESVOLTAGE DEGRADATION MODES
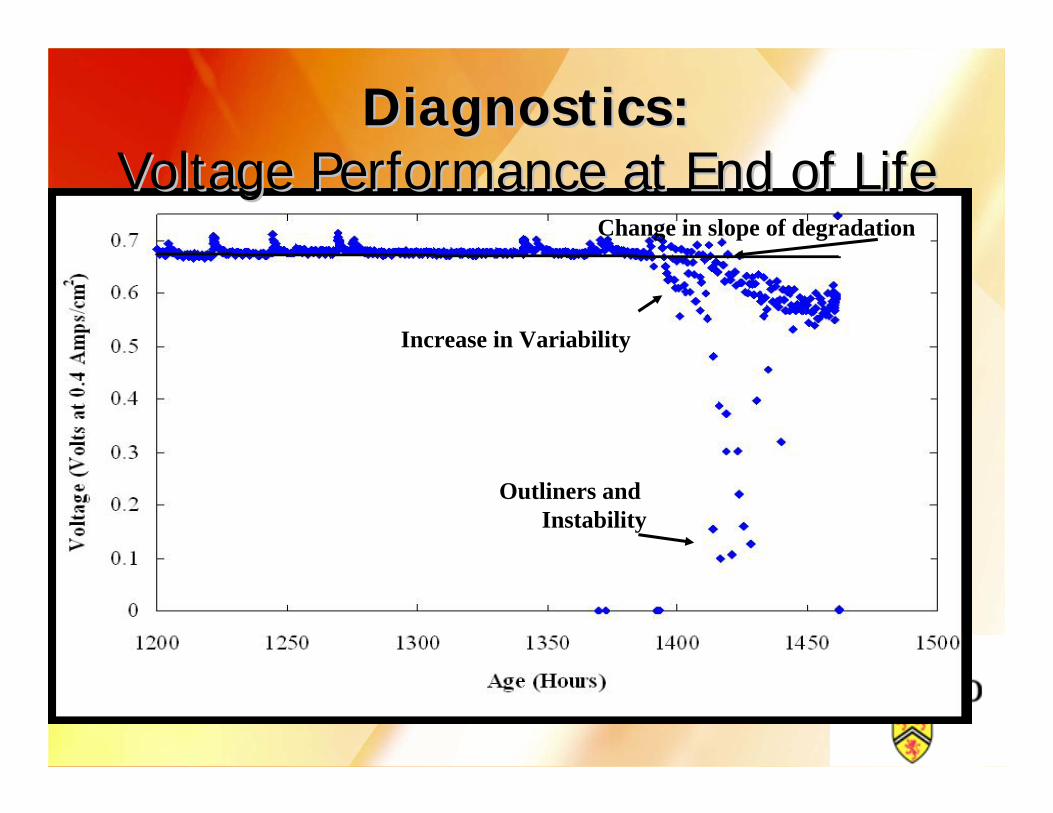
Diagnostics:Diagnostics:Voltage Performance at End of LifeVoltage Performance at End of Life
Outliners and Instability
Change in slope of degradation
Increase in Variability

Objectives of the overall researchObjectives of the overall research
To understand the mechanisms and factors leading to failureTo understand how manufacturing and operational conditions influence the dominant degradation modeTo design better membranes and control strategies to mitigate material limitations.

Reliability JargonReliability JargonDurability - ability to resist permanent change in performance over time, i.e. degradation or irreversible degradation. This phenomena is related to ageing. Reliability - The ability of an item to perform the required function, under stated conditions, for a period of time. Combination of degradation, and failure modes that lead to catastrophic failure.Stability - recoverable function of efficiency, voltage or current density decay or reversible degradation.

Degradation CategoriesDegradation CategoriesFactors influencing operational reliability
Inherent reliability
MaterialProperties Defects Assembly Maintenance Operation
Thermal Chemical Mechanical
Degradation Mechanism
Stability Power Lifetime
Performance Impact
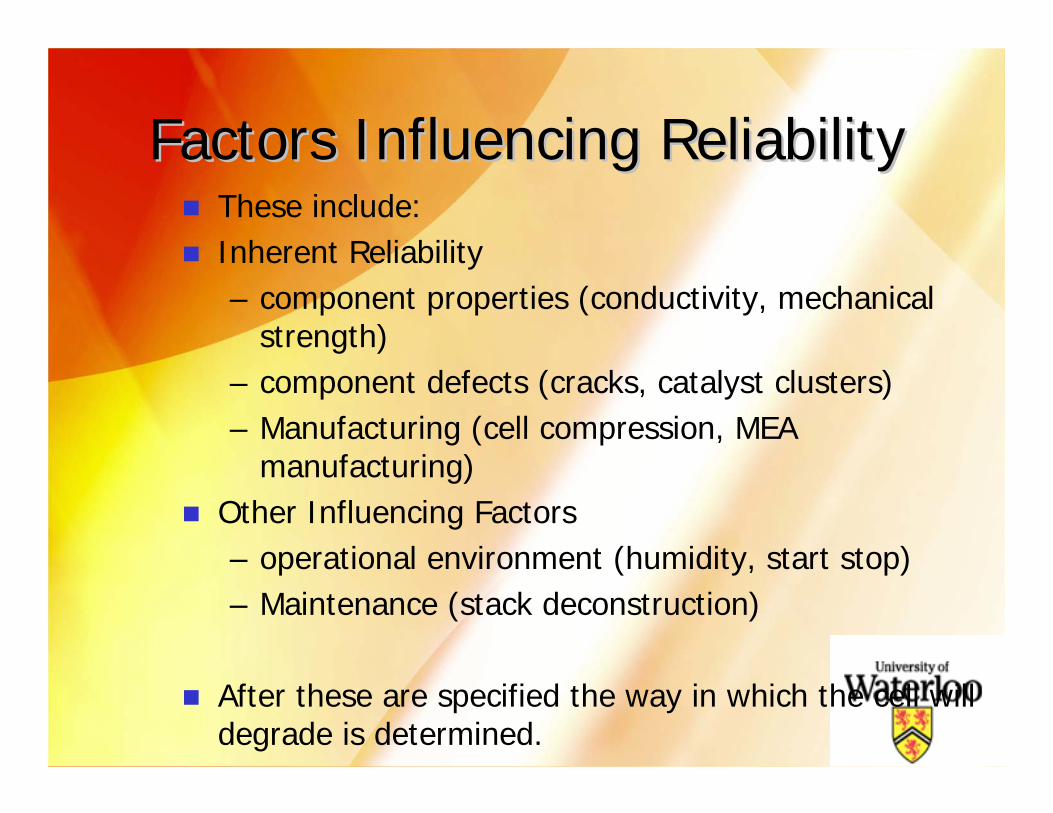
Factors Influencing ReliabilityFactors Influencing ReliabilityThese include: Inherent Reliability– component properties (conductivity, mechanical
strength) – component defects (cracks, catalyst clusters) – Manufacturing (cell compression, MEA
manufacturing)Other Influencing Factors– operational environment (humidity, start stop)– Maintenance (stack deconstruction)
After these are specified the way in which the cell will degrade is determined.
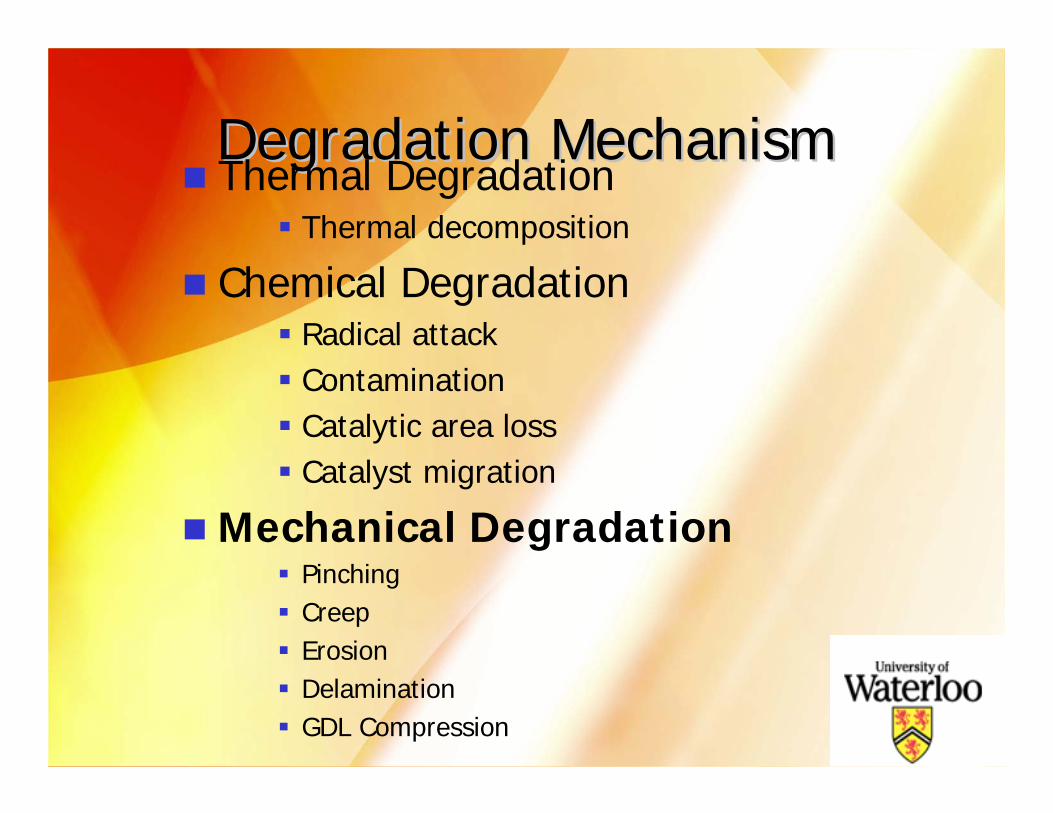
Degradation MechanismDegradation MechanismThermal Degradation
Thermal decomposition
Chemical Degradation Radical attack ContaminationCatalytic area lossCatalyst migration
Mechanical DegradationPinching Creep Erosion DelaminationGDL Compression
Performance ImpactPerformance ImpactUltimately what we want out of a fuel cell is POWER!In general the impact of the degradation mechanism can be categorized into three impacts– Catalytic area loss– Conductivity loss– Mass transport ability loss
The importance of one degradation mode over another is based on how much it impacts performance and lifetimeVoltage, Current, powerStability, catastrophic failureLifetime
Reliability testing Reliability testing Durability testing at Waterloo consists of three main steps:Performance Evaluation
Polarization curves, voltage, current, power, efficiency (and degradation of these), lifetime Performance data is not enough
DiagnosticsCyclic voltametry, crossover, impedance, fluoride release rate, HELIOX tests, current decay, current interrupt
ForensicsElectron microscopy, pinhole mapping, infrared spectroscopy, mechanical property analysis, de-catalyzation

MEA Features in New MembranesMEA Features in New MembranesManufacturing plays a crucial role in durabilityInherent reliabilityHere is where defects and morphology can be controlled
CrackingDelaminationThickness variationsGDL MP layer morphologyNafion clustersPlatinum clustersMacroscopic orientation

CrackingCracking
Causes and Impacts of Causes and Impacts of CrackingCracking
Impacts– Location for defect propagation to
a pinhole– Areas of catalytic inactivity– Increased resistance in the catalyst
layer– Flooded areas– Areas for catalyst erosion

DelaminationDelamination

Causes and Impacts of Causes and Impacts of DelaminationDelamination
Impacts– Vulnerable location for further delamination– Increased resistance between the layers– Flooded areas– Imbalance in current and ion flow on the
membrane

Thickness VariationsThickness Variations
Causes and Impacts of Thickness Causes and Impacts of Thickness VariationsVariations
Impacts– Crossover– Mechanical weak spot– Shorting– Pinholes

Fresh
GDL DegradationGDL Degradation
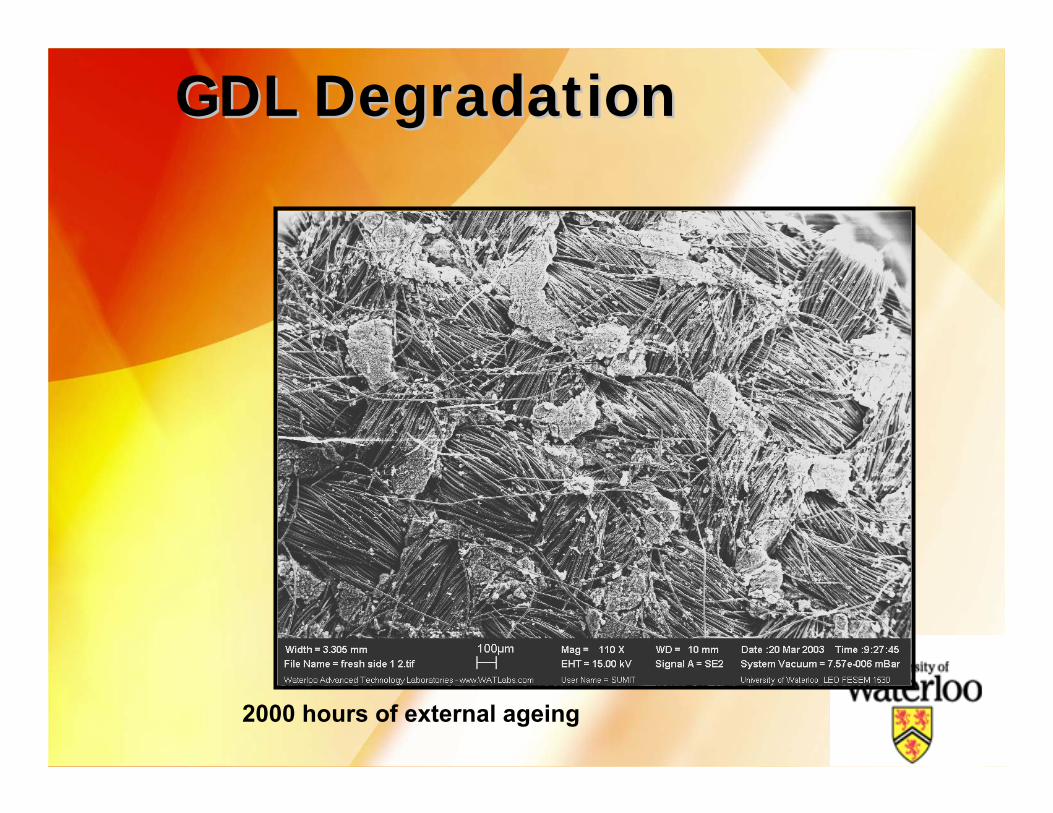
2000 hours of external ageing
GDL DegradationGDL Degradation

GDL DegradationGDL Degradation
Morphology impacts degradation The manufacturers have control over morphologyImpacts– Loss of PTFE = more water
accumulation– Increased flooding

Nafion Clusters
NafionNafion ClustersClusters

Cluster IdentificationCluster IdentificationBackscattered electron detectorBright spots were shown to be platinum clusters
200nm

Causes and Impacts of ClustersCauses and Impacts of Clusters
Impacts– Increased resistance to ion transport– Reduction of active catalyst area– Hot spots/cold spots
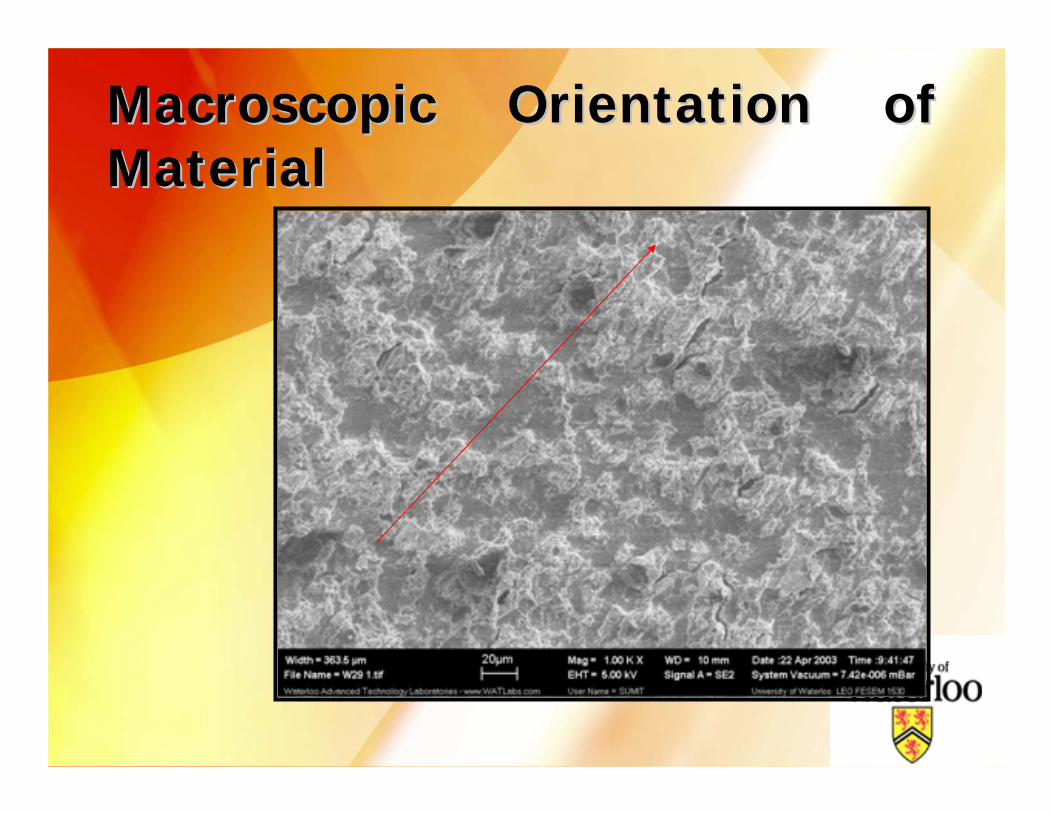
Macroscopic Orientation of Macroscopic Orientation of MaterialMaterial

Causes and Impacts of Causes and Impacts of OrientationOrientation
Impacts– Contact resistance variation– Mechanical Stress variations– Less control over morphology
ConclusionsConclusionsThere are many different morphological features in an MEAThese are created largely during the manufacturing process Some of these features will have a clear impact on the performance and reliability of the fuel cellSince they are created at the manufacturing level, thus there is the potential to control them

Future WorkFuture WorkShowing links between morphological features and degradationExamining pin hole formation and the role of mechanical stressEstablishing links between operating conditions and the mechanism of degradation and failureDesigning better membranes and control strategies
Related Documents