Peluso, S., Douglas, A., Hill, A., De Angelis, C., Moore, B. L., Grimes, G., Petrovich, G., Essafi, A., & Hill, R. E. (2017). Fibroblast growth factors (FGFs) prime the limb specific Shh enhancer for chromatin changes that balance histone acetylation mediated by E26 transformation-specific (ETS) factors. eLife, 6, [e28590]. https://doi.org/10.7554/eLife.28590 Publisher's PDF, also known as Version of record License (if available): CC BY Link to published version (if available): 10.7554/eLife.28590 Link to publication record in Explore Bristol Research PDF-document This is the final published version of the article (version of record). It first appeared online via eLife at https://elifesciences.org/articles/28590 . Please refer to any applicable terms of use of the publisher. University of Bristol - Explore Bristol Research General rights This document is made available in accordance with publisher policies. Please cite only the published version using the reference above. Full terms of use are available: http://www.bristol.ac.uk/red/research-policy/pure/user-guides/ebr-terms/

Welcome message from author
This document is posted to help you gain knowledge. Please leave a comment to let me know what you think about it! Share it to your friends and learn new things together.
Transcript
Peluso, S., Douglas, A., Hill, A., De Angelis, C., Moore, B. L., Grimes,G., Petrovich, G., Essafi, A., & Hill, R. E. (2017). Fibroblast growthfactors (FGFs) prime the limb specific Shh enhancer for chromatinchanges that balance histone acetylation mediated by E26transformation-specific (ETS) factors. eLife, 6, [e28590].https://doi.org/10.7554/eLife.28590
Publisher's PDF, also known as Version of recordLicense (if available):CC BYLink to published version (if available):10.7554/eLife.28590
Link to publication record in Explore Bristol ResearchPDF-document
This is the final published version of the article (version of record). It first appeared online via eLife athttps://elifesciences.org/articles/28590 . Please refer to any applicable terms of use of the publisher.
University of Bristol - Explore Bristol ResearchGeneral rights
This document is made available in accordance with publisher policies. Please cite only thepublished version using the reference above. Full terms of use are available:http://www.bristol.ac.uk/red/research-policy/pure/user-guides/ebr-terms/
*For correspondence:Bob.hill@
igmm.ed.ac.uk
Competing interests: The
authors declare that no
competing interests exist.
Funding: See page 19
Received: 12 May 2017
Accepted: 25 September 2017
Published: 26 September 2017
Reviewing editor: Lee
Niswander, University of
Colorado Anschutz Medical
Campus, United States
Copyright Peluso et al. This
article is distributed under the
terms of the Creative Commons
Attribution License, which
permits unrestricted use and
redistribution provided that the
original author and source are
credited.
Fibroblast growth factors (FGFs) primethe limb specific Shh enhancer forchromatin changes that balance histoneacetylation mediated by E26transformation-specific (ETS) factorsSilvia Peluso1, Adam Douglas1, Alison Hill1, Carlo De Angelis1, Benjamin L Moore1,Graeme Grimes1, Giulia Petrovich1, Abdelkader Essafi2, Robert E Hill1*
1MRC Human Genetics Unit, Institute of Genetics and Molecular Medicine,University of Edinburgh, Edinburgh, United Kingdom; 2School of Cellular andMolecular Medicine, Faculty of Biomedical Sciences, University of Bristol, Bristol,United Kingdom
Abstract Sonic hedgehog (Shh) expression in the limb bud organizing centre called the zone of
polarizing activity is regulated by the ZRS enhancer. Here, we examine in mouse and in a mouse
limb-derived cell line the dynamic events that activate and restrict the spatial activity of the ZRS.
Fibroblast growth factor (FGF) signalling in the distal limb primes the ZRS at early embryonic
stages maintaining a poised, but inactive state broadly across the distal limb mesenchyme. The E26
transformation-specific transcription factor, ETV4, which is induced by FGF signalling and acts as a
repressor of ZRS activity, interacts with the histone deacetylase HDAC2 and ensures that the
poised ZRS remains transcriptionally inactive. Conversely, GABPa, an activator of the ZRS, recruits
p300, which is associated with histone acetylation (H3K27ac) indicative of an active enhancer.
Hence, the primed but inactive state of the ZRS is induced by FGF signalling and in combination
with balanced histone modification events establishes the restricted, active enhancer responsible
for patterning the limb bud during development.
DOI: https://doi.org/10.7554/eLife.28590.001
IntroductionSpatial specific gene expression is fundamental to controlling cell identity in embryonic tissue. Early
in the mesenchyme of the developing mammalian limb bud there are no observable morphological
differences or histological boundaries; nevertheless, the limb bud is initially polarized along the ante-
rior-posterior axis (Tickle, 2015) establishing a specialized compartment of cells at the posterior
margin called the zone of polarizing activity (ZPA). The function of the ZPA is the expression of Shh,
which operates as a morphogen and a mitogen to coordinate digit formation by integrating growth
with digit specification during limb development (Towers et al., 2008; Zhu et al., 2008). A highly
conserved ~780 bp enhancer called the ZRS controls the spatiotemporal expression of the Shh gene
in the ZPA of both the fore and hind limbs (Lettice et al., 2002; 2003; Sagai et al., 2005). The ZRS
lies in an intron of the ubiquitously expressed Lmbr1 gene at a distance of 1 Mb from the Shh gene
in human. Well over 20 different point mutations occurring in the ZRS are associated with the misre-
gulation of Shh and consequently, to limb skeletal defects. These include preaxial polydactyly type 2
(PPD2), triphalangeal thumb polysyndactyly, syndactyly type IV, and Werner’s mesomelic syndrome,
collectively referred to as ZRS-associated syndromes (Lettice et al., 2003, Lettice et al., 2008;
Peluso et al. eLife 2017;6:e28590. DOI: https://doi.org/10.7554/eLife.28590 1 of 22
RESEARCH ARTICLE
Farooq et al., 2010; Furniss et al., 2008; Gurnett et al., 2007; Semerci et al., 2009;
Wieczorek et al., 2010).
The regulatory mechanisms that direct gene expression to embryonic compartments are not well
established in mammalian development; therefore, to understand the events that occur, it is crucial
to investigate the activation of spatiotemporal specific enhancers during this process. We previously
showed that members of the E26 transformation-specific (ETS) transcription factor family (Shar-
rocks, 2001) are involved in the spatial pattern of Shh expression (Lettice et al., 2012). Occupancy
at multiple ETS sites, which bind the factors GABPa and ETS1, regulates the position of the Shh
expression boundary in the limb, thus defining the ZPA. In contrast, binding sites for ETV4 and ETV5
in the ZRS, when occupied, repress ectopic Shh expression outside the ZPA. A single base pair
change is able to subvert this normal developmental process to give rise to skeletal abnormalities.
For example, two different human PPD2 point mutations generate additional ETS binding sites,
thereby, de-repressing expression of Shh in the anterior limb bud. The balance between binding of
the activators and repressors is crucial for normal Shh expression and the mutations that disrupt this
balance result in skeletal defects.
Analysis of developmental gene regulation must also take into account the mechanisms of long-
range enhancer/promoter interactions. Previously, we showed that the ZRS contains two domains
with distinct activities; one domain, the 5’ end of the ZRS (472 bp), directs the spatiotemporal activ-
ity and the second domain, the 3’ half (308 bp), is required to mediate activity over long genomic
distances (Lettice et al., 2014). Additionally higher-order chromatin conformational changes that
occur in the Shh locus play a role in gene expression. Elevated frequencies of Shh/ZRS co-localization
were observed only in the Shh expressing regions of the limb bud (Amano et al., 2009), in a confor-
mation consistent with enhancer-promoter loop formation (Williamson et al., 2016). However, the
eLife digest As an animal embryo develops, specific genes need to be switched on and off at
the right time and place to ensure that the embryo’s tissues and organs form properly. Proteins
called transcription factors control the activity of individual genes by binding to regions of DNA
known as enhancers. Changes in the way DNA is packaged inside cells can affect the ability of
transcription factors to access the enhancers, and therefore also influence when particular genes are
switched on or off.
Sonic hedgehog (or Shh for short) is a gene that helps to control various aspects of development
including the formation of the limbs and brain. The limb forms from a structure in the embryo
referred to as the limb bud. An enhancer called ZRS regulates the precise position within the limb
bud where the Shh gene is active in a region designated as the “zone of polarizing activity”. Yet, it
was not known how the enhancer is controlled to ensure this pattern is achieved. Peluso et al.
investigated the events that lead to ZRS becoming active in mice embryos.
The experiments show that the ZRS enhancer exists in three different states in cells across the
limb bud: poised, active and inactive. The enhancer is poised in a broad region of the limb bud in
cells that are potentially able to switch on the Shh gene. Proteins called fibroblast growth factors
drive the enhancer to enter this poised state by altering the way the DNA containing the enhancer is
packaged in the cell. Specific transcription factors are able to bind to the poised enhancer and it is
the balance between these different transcription factors that activates the enhancer in the zone of
polarizing activity. Furthermore in the region of the limb bud where the fibroblast growth factors are
not present the ZRS is inactive.
These findings show that fibroblast growth factors, in combination with other changes to the ZRS
enhancer, restrict the area in which the enhancer is active to a particular region of the limb bud.
Differences in enhancer elements are known to underlie a range of inherited characteristics and may
influence whether an individual develops many common diseases. In the future, investigating how
cells control the activity of enhancers may provide clues to identifying new targets for drugs to treat
some of these diseases.
DOI: https://doi.org/10.7554/eLife.28590.002
Peluso et al. eLife 2017;6:e28590. DOI: https://doi.org/10.7554/eLife.28590 2 of 22
Research article Developmental Biology and Stem Cells Genes and Chromosomes
domain between Shh and ZRS is highly compacted in all tissues and developmental stages analysed
independent of Shh expression.
Here, we investigate the stepwise events that mediate the spatiotemporal activation of an
enhancer during development. We demonstrate that even though the activity of the ZRS is restricted
to the ZPA, it retains features of a poised enhancer along the full distal portion of the limb bud com-
posed of the mesenchymal cells of the progress zone; whereas, H3K27ac is enriched just in the dis-
tal-posterior limb region. We show that fibroblast growth factor (FGF) signalling plays a key role in
priming the ZRS as indicated by an increase in H3K4me1 at the enhancer. In addition, we show the
mechanism of acetylation/deacetylation that GABPa, an activator, and ETV4, a repressor, employ to
restrict and promote ZRS activation in the distal limb bud.
Results
Modifications of chromatin at the ZRS differ in different regions of thelimb budIn order to characterize specific features of the Shh limb enhancer, the ZRS, in different regions of
the developing limb, we microdissected the limb bud at embryonic day 11.5 (E11.5) into several
defined segments. Firstly, we examined the distal region which contained the specialized epithelial
structure called the AER (apical ectodermal ridge), the mesenchyme of both the progress zone and
the ZPA and, in addition, the proximal region which contained the shank of the limb bud
(Figure 1A). Chromatin immunoprecipitation analysed by quantitative PCR (ChIP-qPCR) was per-
formed on the dissected limb tissue for the two modified histones, H3K4me1 and H3K27ac
(Figure 1B). Previous studies demonstrated that these modifications are markers for enhancer activ-
ity. H3K4me1 is a predictive chromatin signature for both poised and active enhancers in the human
genome (Heintzman et al., 2007), but in association with H3K27ac, these mark active regulatory ele-
ments (Rada-Iglesias et al., 2012; Cotney et al., 2012). We found specific enrichment of H3K4me1
at the ZRS in the distal region of the dissected E11.5 limb buds, which was appreciably lower in the
proximal region of the limb buds. Further dissections of the distal limb bud into anterior and poste-
rior halves enabled us to discern more precisely the location of the H3K4me1 at the ZRS (Figure 1B).
Even though Shh was not expressed in the anterior region of the limb bud, the H3K4me1 mark was
enriched in both dissected halves suggesting that the ZRS was poised across the distal compartment
of the limb.
H3K27ac, in contrast, was differentially enriched in the distal mesenchyme which was greater in
the posterior portion of the limb bud. To investigate acetylation of histone H3 across the large 770
bp enhancer, two sets of PCR primers were used to amplify each end of the ZRS. The ZRS encom-
passes two distinct regulatory activities; one residing in the 5’ half driving spatiotemporal expression
and one residing in the 3’ half mediating long-range activation of the Shh gene (Lettice et al., 2014)
(Figure 1C). Analysis of each half of the enhancer after ChIP identified differential acetylation of H3
across the ZRS. PCR primers complementary to the 5’ spatiotemporal half (5’ST primers) of the ZRS
showed an increase in H3 acetylation compared to the 3’ long-range (3’LR primers) end. H3K27ac
was associated with the 5’ end of the ZRS and was enriched in the distal region of the limb bud.
H3K27ac was, therefore, associated with the distal, posterior quadrant of the limb bud consistent
with the presence of the ZPA where the Shh gene is transcriptionally active (Figure 1A). Hence, in
the case of the ZRS, the enhancer is poised throughout the posterior distal mesenchyme; further
events occur to activate the enhancer for productive transcription in the ZPA.
We next assessed the chromatin state of the ZRS in the distal region of the limb bud using ChIP
coupled with microarray called ChIP-on-chip. The ChIP analysis using antibodies to H3K4me1 and
H3K27ac highlighted the specificity of the histone modifications over the ZRS (Figure 1D). The pat-
tern of the H3K4me1 covered the extent of the ZRS; whereas, the pattern of H3K27ac, as predicted
by the PCR primers, was not centred over the ZRS but was skewed toward the 5’ side. Thus, the ZRS
exists in differential chromatin states in the limb depending on position and gene activity.
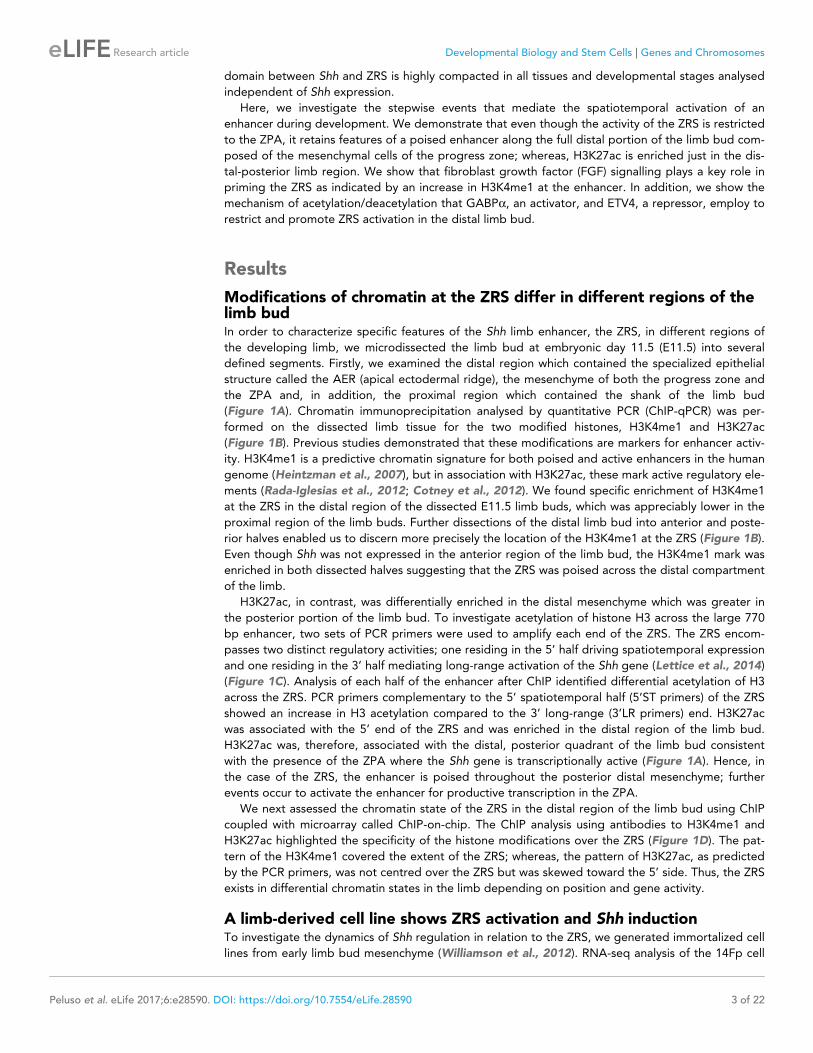
A limb-derived cell line shows ZRS activation and Shh inductionTo investigate the dynamics of Shh regulation in relation to the ZRS, we generated immortalized cell
lines from early limb bud mesenchyme (Williamson et al., 2012). RNA-seq analysis of the 14Fp cell
Peluso et al. eLife 2017;6:e28590. DOI: https://doi.org/10.7554/eLife.28590 3 of 22
Research article Developmental Biology and Stem Cells Genes and Chromosomes

Figure 1. H3K4me1 and H3K27ac distribution over the ZRS in embryonic day 11.5 (E11.5) limb buds. (A) Representation of an E11.5 mouse limb bud.
The apical ectodermal ridge (orange), the ZPA (yellow) and FGF10 (cyan) are responsible for the anterior/posterior limb patterning and for directing the
proliferation of the distal portion of the limb. The limb buds were dissected into anterior-posterior or distal-proximal regions. (B) Chromatin from E11.5
dissected limb buds tissue was enriched by chromatin immunoprecipitation (ChIP) for H3K4me1 and H3K27ac histone modifications. DNA was
quantified by quantitative PCR. Means of fold enrichment over nonspecific IgG recoveries and ±SEM from two independent experiments are plotted.
(C) Schematic of the ZRS (dark blue box) lying in intron 5 of Lmbr1 (blue box), 800 kb away from Shh gene. Within the ZRS (dark blue box) five ETS
binding sites (light blue) and two ETV binding sites (orange) are highlighted. The primers used to evaluate the ChIP experiments are localized over the
long-range activity and the spatiotemporal activity sequences, both indicated with a blue line (complete list of oligos in Supplementary file 1). (D)
ChIP-on-chip analysis of distal mesenchyme from two biological replicates of E11.5 limb buds using antibodies to two different histone modifications
(H3K4me1 and H3K27ac). Data for two different genomic regions, the fifth intron of Lmbr1 gene and the Shh gene, are shown. The y axis is the log2 for
each ChIP/input DNA and the x axis represents a segment of DNA. The DNA region containing the ZRS is highlighted by the grey shading. As controls,
the whole of the Shh coding region plus promoter (Shh) is shown.
DOI: https://doi.org/10.7554/eLife.28590.003
Peluso et al. eLife 2017;6:e28590. DOI: https://doi.org/10.7554/eLife.28590 4 of 22
Research article Developmental Biology and Stem Cells Genes and Chromosomes

line (cells derived from the distal/posterior part of the limb at E 11.5) shows that many of the key
genes found in the posterior limb bud are expressed with a notable exception being Shh (Figure 2—
figure supplement 1A). We performed ChIP-on-chip using antibodies against H3K4me1 and
H3K27ac which revealed that, H3K4me1 marked the full extent of the ZRS in the cell line; whereas,
H3K27ac was not enriched, demonstrating that the ZRS resides in a poised state reflecting the origin
of the cell line from the distal mesenchyme of the limb bud (Figure 2A and Figure 2—figure supple-
ment 1A).
The poised state of the ZRS in the cells indicated that Shh inactivation was due to the lack of spe-
cific factors that are responsible for fully activating the ZRS. Previous attempts to activate Shh
expression in limb bud-derived cells using cocktails of known developmental activators such as FGFs
and retinoic acid or transfection with HoxD genes have shown that Shh is refractory to activation
(Kimura and Ide, 1998). Our attempts with known Shh activators confirmed these observations (Fig-
ure 2—figure supplement 2A); however, the drug trichostatin A (TSA), a histone deacetylase
(HDAC) inhibitor, stimulated expression (Figure 2—figure supplement 2B–C). Shh expression was
detectable within 6 hr of treatment (Figure 2B) reaching a maximum at ~24 hr. To further investigate
Shh activation in the cell line, we carried out a TSA time course to assay H3K27ac enrichment at the
ZRS. H3K27ac enrichment was observed over both the ZRS and the Shh promoter at 16 hr of treat-
ment, reaching a maximum at 24 hr (Figure 2C), accordingly, with the Shh expression time course
(Figure 2B). The fold enrichment of H3K27ac in the limb buds (Figure 1B) and cell lines (Figure 2C)
seemed dramatically different; therefore, enrichment of H3K27ac was directly compared between
the limbs buds and the cells in the same experiment showing that the magnitude of enrichment is
comparable (Figure 2—figure supplement 3A). In the cell lines, the correlation between Shh induc-
tion of expression and recruitment of H3K27ac suggests that the ZRS is involved in the activation of
the transcriptional process. In addition H3K27ac was more highly associated with the region involved
in the spatiotemporal activity of the ZRS (as shown using the 5’ST primers). Two control mouse cell
lines were used to investigate the specificity of Shh activation in the 14Fp cells. Firstly, the mouse ES
cell line, E14, which in response to retinoic acid induces Shh expression, and secondly, an immortal-
ized mesenchymal cell line from the embryonic mandible at E11.5, called the MD cell line, were
used. In both cell lines, the histone mark, H3K4me1, was not enriched over the ZRS, and TSA treat-
ment did not lead to Shh induction after 24 hr of treatment (Figure 2—figure supplement 3B–C).
Extragenic transcription sites correlate with active regulatory elements and in accord are occu-
pied by RNA Pol II (De Santa et al., 2010; Kim et al., 2010). Genome-wide studies highlighted Pol
II occupancy and the synthesis of noncoding transcripts at active enhancer sites, the roles of which,
so far, remain unclear. In order to confirm the limb specific enhancer activation, Pol II ChIP-qPCR
was carried out in limb cells after TSA treatment. In the untreated 14Fp cell line, even though the
enhancer is in a poised state, Pol II was not appreciably enriched at the Shh promoter nor at the ZRS
(Figure 2D). After activation with TSA, Pol II was detected at both sites confirming the association of
Pol II recruitment to the enhancer and the promoter, further suggesting that TSA mediated Shh acti-
vation in 14Fp involves the ZRS. Thus, this cell line derived from early limb bud mesenchyme showed
that the ZRS could be induced to undergo modifications consistent with enhancer activation and
concomitantly, Shh expression was activated. To further establish the role for ZRS in the activation of
Shh expression in the cell line, the interaction of the ZRS with its target promoter was analysed.
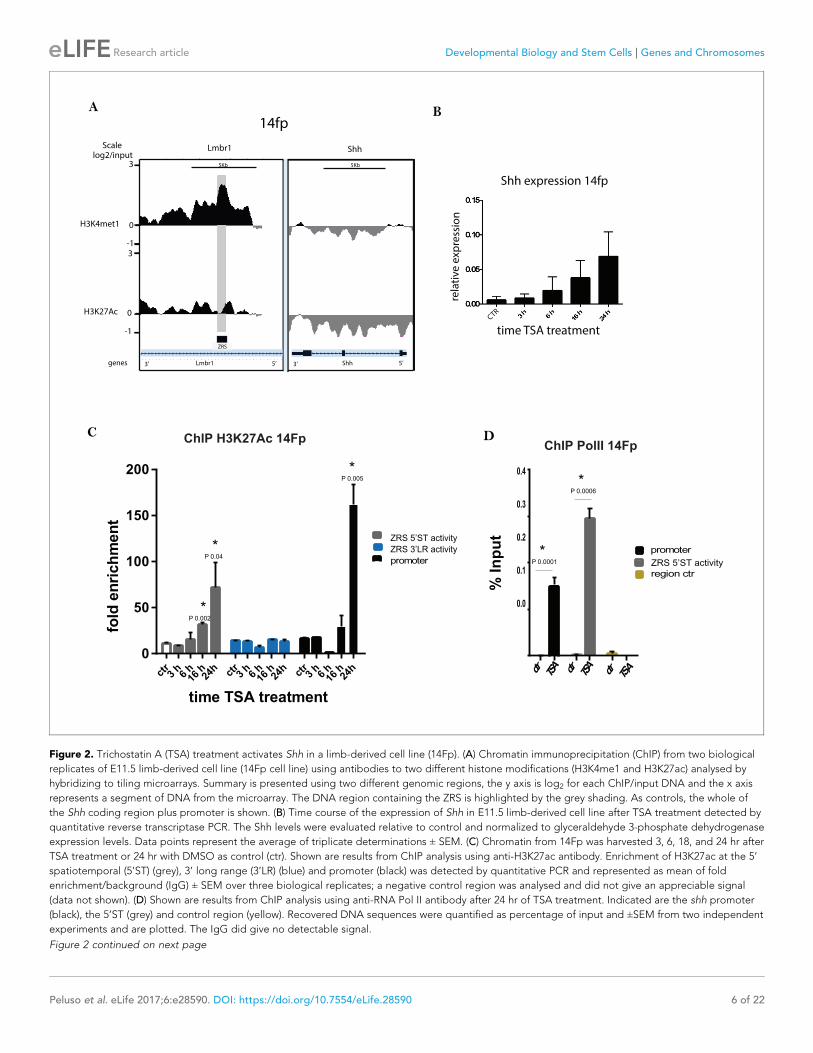
Promoter-enhancer contacts are established during Shh gene activationShh gene activation is linked to an increase in the level of the H3K27ac histone mark over the ZRS. In
order to investigate the reorganization of chromatin structure after TSA treatment and to confirm
the involvement of the ZRS in Shh activation induced by TSA, circularized chromosome conformation
capture (4C-seq) (Stadhouders et al., 2013) analysis was carried out at 18 and 24 hr after TSA treat-
ment (Figure 2—figure supplement 3D–F). Evidence of increased co-localization of the ZRS and the
Shh gene in the expressing region of the limb bud was demonstrated previously by FISH and 3C
analysis (Amano et al., 2009, Williamson et al., 2016). 4C-seq analysis in the 14Fp cell line
(Figure 3A) showed marked and highly significant ZRS–Shh interactions in the TSA treated cells. The
interaction between the Shh gene and the ZRS was confirmed by 3C-qPCR (Figure 3—figure sup-
plement 1E).
The fragment containing the promoter site of Shh co-localizes with the ZRS and was detected at
18 and at 24 hr after TSA treatment (TSA minus: q < 1.5�10�5; TSA18hr: q-value <5�10�10; TSA+24hr:
Peluso et al. eLife 2017;6:e28590. DOI: https://doi.org/10.7554/eLife.28590 5 of 22
Research article Developmental Biology and Stem Cells Genes and Chromosomes
ctr3
h6
h16
h24
h ctr3
h6
h16
h24
h ctr3
h6
h16
h24
h
0
50
100
150
200
time TSA treatment
fold
en
rich
men
t
ZRS 5’ST activity
promoter
region ctr
ctr
TSA ct
rTSA
ctr
TSA
0.0
0.1
0.2
0.3
0.4
5Kb
ZRS
Scale log2/input
H3K4met1
H3K27Ac
3
-13
-1
genes Lmbr1
0
0
Shh
5Kb
5’5’3’ 3’
Lmbr1 Shh
% I
np
ut
AB
C D
*P 0.0001
*P 0.0006
*P 0.04
*P 0.002
*P 0.005
time TSA treatment
Shh expression 14fp
rela
tiv
e e
xpre
ssio
n
ZRS 5’ST activity
ZRS 3’LR activity
promoter
CTR
ChIP H3K27Ac 14FpChIP PolII 14Fp
14fp
Figure 2. Trichostatin A (TSA) treatment activates Shh in a limb-derived cell line (14Fp). (A) Chromatin immunoprecipitation (ChIP) from two biological
replicates of E11.5 limb-derived cell line (14Fp cell line) using antibodies to two different histone modifications (H3K4me1 and H3K27ac) analysed by
hybridizing to tiling microarrays. Summary is presented using two different genomic regions, the y axis is log2 for each ChIP/input DNA and the x axis
represents a segment of DNA from the microarray. The DNA region containing the ZRS is highlighted by the grey shading. As controls, the whole of
the Shh coding region plus promoter is shown. (B) Time course of the expression of Shh in E11.5 limb-derived cell line after TSA treatment detected by
quantitative reverse transcriptase PCR. The Shh levels were evaluated relative to control and normalized to glyceraldehyde 3-phosphate dehydrogenase
expression levels. Data points represent the average of triplicate determinations ± SEM. (C) Chromatin from 14Fp was harvested 3, 6, 18, and 24 hr after
TSA treatment or 24 hr with DMSO as control (ctr). Shown are results from ChIP analysis using anti-H3K27ac antibody. Enrichment of H3K27ac at the 5’
spatiotemporal (5’ST) (grey), 3’ long range (3’LR) (blue) and promoter (black) was detected by quantitative PCR and represented as mean of fold
enrichment/background (IgG) ± SEM over three biological replicates; a negative control region was analysed and did not give an appreciable signal
(data not shown). (D) Shown are results from ChIP analysis using anti-RNA Pol II antibody after 24 hr of TSA treatment. Indicated are the shh promoter
(black), the 5’ST (grey) and control region (yellow). Recovered DNA sequences were quantified as percentage of input and ±SEM from two independent
experiments and are plotted. The IgG did give no detectable signal.
Figure 2 continued on next page
Peluso et al. eLife 2017;6:e28590. DOI: https://doi.org/10.7554/eLife.28590 6 of 22
Research article Developmental Biology and Stem Cells Genes and Chromosomes

q < 7.8�10�35); whereas, significant contact in the fragment containing the promoter was undetect-
able in the untreated cells. Shh/ZRS proximity in the nucleus occurs regardless of whether the gene
or enhancer is active (Williamson et al., 2016); however, in TSA treated cells reorganization in chro-
matin structure occurs due to activation of the ZRS increasing interactions with the promoter.
FGF signalling is responsible for priming the ZRSAt an early stage of limb development, Fgf10 expression in the distal limb bud mesenchyme is
important for both limb bud outgrowth and induction of FGF signalling from the AER (Ohuchi et al.,
1997) which, in turn, maintains the cells of the progress zone. Subsequently, the FGFs function to
maintain Shh expression in the ZPA (Laufer et al., 1994; Niswander et al., 1994; Crossley et al.,
1996; Vogel et al., 1996; Ohuchi et al., 1997). We tested the hypothesis that localized FGF expres-
sion is correlated with the poised state of the ZRS. Firstly, the 14Fp cell line pre-treated with ninte-
danib (NIN), a potent broad spectrum inhibitor of FGFR1/2/3, VEGFR1/2/3, and PDGFRa/b
(Hilberg et al., 2008), showed a significant reduction in Shh after TSA treatment (Figure 4A). Previ-
ous studies show that an increase in AER-FGF levels leads to gradual repression of Grem1 in the dis-
tal mesenchyme as part of an inhibitory feedback loop (Fgf/Grem1 loop) (Verheyden and Sun,
2008) and promotes expression of Etv4 (Mao et al., 2009). Hence, as control for the efficiency of
the FGF inhibition, Grem1 and Etv4 levels were evaluated (Figure 4B) after 4 hr incubation with NIN
or after 4 hr NIN plus FGF8/10 incubation. Since NIN can also inhibit VEGF and PDGF receptors,
another FGFR inhibitor, BGJ398 (BGJ), was also tested for Grem1 and Etv4 expression. Increased
levels of Grem1 were observed after 4 hr of NIN and BGJ incubations while Etv4 levels were
reduced. The FGF8/10 treatment was sufficient to restore the original levels of both Grem1 and
Etv4. To investigate the action of FGF signalling at the ZRS, ChIP for H3K4me1 in the limb specific
cell line exposed to NIN was performed (Figure 4C). As control, a region of the first intron of
Rbm33, a neighbouring gene, which displays open chromatin coincident with a peak of H3K4me1
was examined. The H3K4me1 enrichment over the ZRS was dramatically reduced after inhibition of
FGF activity and TSA treatment did not rescue the presence of this histone modification; whereas,
Rbm33 intron 1 was not significantly affected. The same effect was caused by BGJ on H3K4me1
enrichment (Figure 4—figure supplement 1D–E), and no differences were observed in comparison
with NIN treatment. To assess whether the NIN or BGJ treatment would affect cell survival or cause
other abnormality trypan blue staining was performed and no alterations were observed after 4 hr
treatment (Figure 4—figure supplement 1A).
To determine if FGF plays a similar role in effecting the poised state of the ZRS in the embryo, we
developed a short-term organ culture approach (Havis et al., 2014). Distal tips of E11.5 limb buds
were dissected, maintained in media, and exposed to NIN for 4 hr to examine the state of endoge-
nous ZRS. In agreement with the cell line results, the distal tips lost ZRS enrichment of H3K4me1 and
higher levels of Grem1 expression were observed (Figure 4F–G). On the other hand, when proximal
dissections of E11.5 limb bud, where the enhancer is in an inactive state, are exposed to a combina-
tion of FGF8 and FGF10 the ZRS displays the poised state (Figure 4H, Figure 4—figure supple-
ment 1F) showing enrichment of H3K4me1. These data suggest that FGF signalling has a key role in
priming and maintaining the ZRS as a poised enhancer in the distal mesenchyme of the limb bud,
delineating the boundaries where Shh can be potentially expressed. Trypan blue staining was per-
formed on limb dissections by following a reported protocol with slight modifications
Figure 2 continued
DOI: https://doi.org/10.7554/eLife.28590.004
The following figure supplements are available for figure 2:
Figure supplement 1. RNA-seq analysis of the 14Fp cell line and of the distal limb bud.
DOI: https://doi.org/10.7554/eLife.28590.005
Figure supplement 2. Induction of Shh expression in the 14Fp cell line.
DOI: https://doi.org/10.7554/eLife.28590.006
Figure supplement 3. Specificity of Shh expression and efficiency of 4C library preparation after TSA induction in the 14Fp cell line.
DOI: https://doi.org/10.7554/eLife.28590.007
Peluso et al. eLife 2017;6:e28590. DOI: https://doi.org/10.7554/eLife.28590 7 of 22
Research article Developmental Biology and Stem Cells Genes and Chromosomes
(Siddique, 2012) (Figure 4—figure supplement 1B). No signs of increased cell death were
observed after 4 hr of NIN treatment.
GABPa activates Shh expressionThe 14Fp cells retain the expression of some of the ETS genes (Figure 2—figure supplement 1A)
which were shown to play a regulatory role at the ZRS (Lettice et al., 2012). One of these, GABPa,
interacts with the ZRS in the limb bud and activates Shh expression. In addition others have
10000
7500
5000
2500
0
SHH ZRS
28.0 28.5 29.0 29.5 30.0
Chr5 position (Mbp)
value
>.05
SHH ZRSZRSZRSZRSZRS
0
2000
4000
6000
8000
28.0 28.5 29.0 29.5 30.0
Chr5 position (Mbp)
Ctr
<.05
0
2000
4000
6000
8000
28.0 28.5 29.0 29.5 30.0
SHH ZRS
TSA 18h
TSA 24h
Dpp6Dpp6Dpp6Dpp6Dpp6
Paxip1Paxip1
Htr5a
Insig1En2Cnpy1
Cnpy1 Shh
AK162496
Rnf32Rnf32Rnf32Lmbr2Rnf32Lmbr2
Lmbr1Lmbr1Lmbr1
Lmbr1Nom1
Mnx1mKIAA0010
Ube3c
Ube3c
A B
No
rm
alise
d R
PM
s
No
rm
alise
d R
PM
s
1500
1000
500
0
SHH
28.70 28.75 28.80 28.85
Chr5 position (Mbp)
1500
SHH
1000
500
028.70 28.8528.75 28.80
Chr5 position (Mbp)
Norm
alis
ed R
PM
s
TSA 24h
Ctr
Figure 3. Trichostatin A (TSA) treatment induces a ZRS–SHH interaction. (A) The profile of 4C-seq at the ZRS locus in 14Fp cells. Control and TSA
treatment after 18 and 24 hr are shown. ZRS shown as the enhancer (anchor) bait fragment along an approximately 2 Mb region of chromosome 5
(UCSC genome browser view of chr5:28,000,000–30,000,000 (mm9)). The x axis represents the position on chromosome 5 and the y axis the normalized
reads as read per million sequences (RPMs). Only highly significant interactions are shown (false discovery rate [FDR] q-value <5!j105). The blue bar
represents the location of the ZRS (bait) and the red bar represents the Shh gene. Each rectangle is a restriction fragment, the dots coloured at the top
of each rectangle reflect the FDR q-value indicating the significance of the interaction (legend between A and B). (B) Focus on the Shh region (red bar
in the zoomed-in view) shows the number of interactions of the bait region with SHH in both untreated and TSA treated (after 24 hr) samples.
DOI: https://doi.org/10.7554/eLife.28590.008
The following figure supplement is available for figure 3:
Figure supplement 1. Chromatin conformation capture (3C) analysis in 14Fp cells induced to expression Shh.
DOI: https://doi.org/10.7554/eLife.28590.009
Peluso et al. eLife 2017;6:e28590. DOI: https://doi.org/10.7554/eLife.28590 8 of 22
Research article Developmental Biology and Stem Cells Genes and Chromosomes

0.0
0.2
0.4
0.6
0.8
1.0
rela
tive e
xp
ressio
n
- + - + NIN.
- - + + TSA
0
5
10
15
20
25
- - + TSA
- + + NIN.
Fo
ld e
nri
ch
me
nt
ChIP H3K4me1 14Fp
*P 0.04
A
C
D
B
Shh expression 14Fp Etv4, Grem1 expression 14Fp
0
200
400
600 * *
E
6
4
2
0
Fo
ld e
nri
ch
me
nt
- + NIN.
Rbm33
0
10
20
30
40
ZRS 3’ LR activity
Rbm33
*P 0.03
ChIP GABP 14Fpα
0
20
40
60
80
100
Fo
ld e
nri
ch
me
nt
ZRS 3’ LR activity
Rbm33
ChIP P300 14Fp
*P 0.04
- + - + NIN. - + - + NIN.
ChIP H3K4me1 distal limbsF
- - + - NIN.
0h 4h 4h 4h time
Distal Proximal
Fo
ld e
nri
ch
me
nt
Fo
ld e
nri
ch
me
nt
0
1
2
3
Grem1 expressiondistal limbs
rela
tive e
xp
ressio
n
4h 4h time
- + NIN.
G
0
50
100
150
200
fold
en
ric
hm
en
t
4h 4h time
- + FGF8/FGF10
H ChIP H3K4me1 proximal limbs
*P 0.06
ZRS 3’ LR activity ZRS 3’ LR activity
0
5
10
15
20
25ETV4
GREM1
rela
tive e
xp
ressio
n
- + - + - + - + NIN.
- - + - - - + - BGJ
- - - + - - - + FGF8/10
Figure 4. Fibroblast growth factors (FGFs) are crucial in priming Shh limb specific enhancer. (A) Quantitative reverse transcriptase (qRT)-PCR was used
to detect the expression levels of Shh in 14Fp cell line after trichostatin A (TSA) and nintedanib (NIN) treatment. The Shh levels were evaluated relative
to control and normalized to glyceraldehyde 3-phosphate dehydrogenase levels. Data points represent the mean of three biological replicates ± SEM.
(B) qRT-PCR to detect the expression of Grem1 (grey bars) and Etv4 (black bars) after 4 hr of NIN, with or without supplement of FGF8/10 for 6 hr. Also
Figure 4 continued on next page
Peluso et al. eLife 2017;6:e28590. DOI: https://doi.org/10.7554/eLife.28590 9 of 22
Research article Developmental Biology and Stem Cells Genes and Chromosomes

demonstrated (Kang et al., 2008) that GABPa recruits the co-activator histone acetyltransferase
(HAT) CBP/p300. Therefore, binding of GABPa to the ZRS and recruitment of p300 was examined in
the 14Fp cell line (Figure 5A). ChIP-on-chip analysis on untreated cells for both GABPa and p300
showed an overlapping peak of enrichment for both factors, suggesting a co-occupancy over the
ZRS. To further study the interaction between these factors, we performed co-immunoprecipitation
experiments on nuclear extracts from 14Fp cells transfected with GABPa tagged with three copies
of the flag epitope. Immunoprecipitation of endogenous p300 co-precipitates the flag-GABPa indi-
cating an association between these two factors (Figure 5B). Western blot for p300 normalized
against the histone H3 showed that p300 levels were not affected (Figure 5—figure supplement
1B). Based on the assumption that GABPa and p300 together have an important, yet undefined role
in the activation of the regulatory element, we next addressed whether the presence of GABPa/
p300 influenced ZRS activation. Shh expression was examined in cells induced with TSA after reduc-
tion of Gabpa expression. Gabpa small interfering RNA (siRNA) knockdown (Figure 5C) revealed
decreased Shh expression after TSA treatment (Figure 5D). Conversely, overexpression of Gabpa
using a doxycycline inducible vector leads to activation of Shh (Figure 5E, Figure 5—figure supple-
ment 1A). In addition, ChIP analysis for H3K27ac in cells overexpressing GABPa showed an appreci-
able enrichment over the ZRS; whereas, the transcription factor ETV4, a repressor (see below) which
restricts expression outside the ZPA, is displaced from the ZRS (Figure 5F). Under these conditions,
enrichment of GABPa and p300 over the ZRS is also observed (Figure 5G). These data suggest that
GABPa regulates Shh expression by modulating the acetylation status of H3K27 of the ZRS. Further-
more, FGF signalling plays a central role, since both GABPa and p300 are released from the ZRS
when FGF signalling is inhibited by NIN and the enhancer is no longer poised (Figure 4D–E). FGF,
therefore, mediates priming of the ZRS enabling the binding of GABPa which, in turn, recruits p300.
ETV4 carries out its repressive role via interacting with HDAC2ETV4/ETV5 binding represses Shh expression outside the ZPA in the limb bud (Lettice et al., 2012).
Since there is a close association between GABPa and p300, we investigated the possibility that the
repressive role of ETV4/ETV5 was related to HDAC activity. In order to investigate specific HDAC
candidates, RNA-seq data obtained from the cell line and the distal and proximal portions of the
limb bud showed nearly all the HDAC classes are represented in both 14Fp and in limb tissue
between the cells and the tissue, with the exception of HDAC9 (Figure 2—figure supplement 1B).
Most of the HDACs represented were subjected to ChIP in 14Fp (HDAC1, 2, 3, 4, 5, 6, 8, and 9) and
HDAC2 appeared significantly enriched over the ZRS (data not shown) and is one of the most abun-
dant Hdac in the RNA samples analysed (Figure 2—figure supplement 1B). To further examine the
role of HDACs in ZRS activity, Hdac2 and Hdac1 expression levels were reduced by specific siRNAs
in 14Fp cells (Figure 6A). Both are class I HDACs and often work in concert. Hdac1 downregulation
had no effect on Shh expression, while the reduction of Hdac2 levels (by siRNA) in 14Fp showed an
increase in Shh levels. Simultaneous reduction of both Hdac1 and Hdac2 did not have an additive
Figure 4 continued
shown is BGJ398 (BGJ) treatment. Data points represent the average of duplicate determinations ± SEM. (C) Chromatin from the 14Fp cell line was
harvested after TSA and NIN treatment and ChIP for H3K4me1 was carried out. DNA was quantified by q-PCR using the ZRS 3’ long range (3’LR) and
Rbm33 oligos. Data are represented as mean ± SEM of the fold enrichment over nonspecific IgG recoveries from two independent experiments. (D–E)
Chromatin immunoprecipitation (ChIP) analyses after NIN treatment where performed to further analyse the enrichment of the transcription factor
GABPa and P300 over the ZRS (black) and on a specific genomic control region, Rbm33 intron (grey). DNA was quantified by q-PCR. Mean (±SEM) of
the fold enrichment over nonspecific IgG recoveries from two independent experiments is plotted. (F) qRT-PCR to detect the expression of Grem1 in
the distal limb bud after 4 hr of NIN treatment. (G) ChIP of distal and proximal limb tissue from limb buds using an antibody against H3K4me1. Distal
limb tissue was treated for 4 hr with or without NIN. Proximal limb tissue was used as negative control. DNA was quantified by q-PCR and fold
enrichment over nonspecific IgG recoveries using the ZRS 3’LR oligos and ±SEM from two independent experiments were plotted. (H) H3K4me1 ChIP
of the proximal limb tissue at embryonic day 11.5 after 4 hr of exposure to FGF8 and FGF10. Fold enrichment over nonspecific IgG recoveries
and ±SEM from two independent experiments are plotted. DNA was quantified by q-PCR using the ZRS 3’LR oligos.
DOI: https://doi.org/10.7554/eLife.28590.010
The following figure supplement is available for figure 4:
Figure supplement 1. Analysis of 14Fp and limb bud cultures after treatment with the NIN and BJG inhibitors.
DOI: https://doi.org/10.7554/eLife.28590.011
Peluso et al. eLife 2017;6:e28590. DOI: https://doi.org/10.7554/eLife.28590 10 of 22
Research article Developmental Biology and Stem Cells Genes and Chromosomes
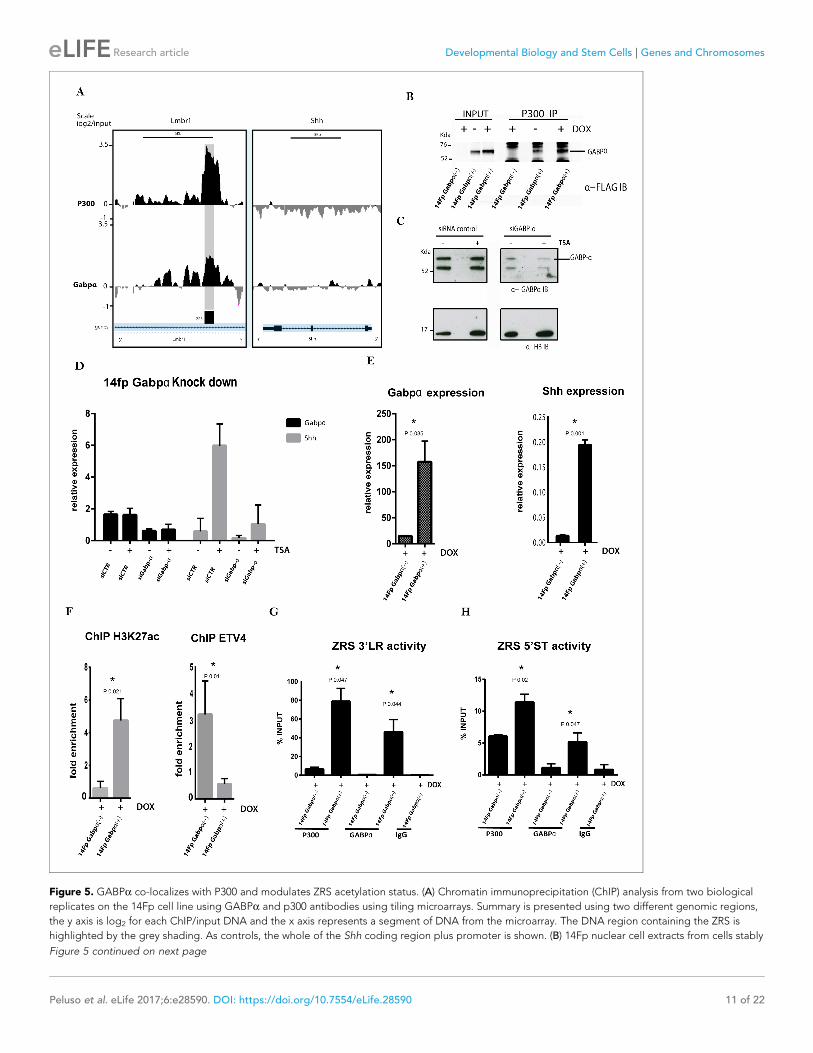
Figure 5. GABPa co-localizes with P300 and modulates ZRS acetylation status. (A) Chromatin immunoprecipitation (ChIP) analysis from two biological
replicates on the 14Fp cell line using GABPa and p300 antibodies using tiling microarrays. Summary is presented using two different genomic regions,
the y axis is log2 for each ChIP/input DNA and the x axis represents a segment of DNA from the microarray. The DNA region containing the ZRS is
highlighted by the grey shading. As controls, the whole of the Shh coding region plus promoter is shown. (B) 14Fp nuclear cell extracts from cells stably
Figure 5 continued on next page
Peluso et al. eLife 2017;6:e28590. DOI: https://doi.org/10.7554/eLife.28590 11 of 22
Research article Developmental Biology and Stem Cells Genes and Chromosomes
effect on the induction of Shh (Figure 6A). To investigate the relationship between the repressor
activity of the ETV genes and HDAC2, we performed ChIP-on-chip for these two factors to visualize
their distribution over the ZRS (Figure 6B). Since in the 14Fp cell line ETV5 expression is low
(approximately eightfold to tenfold lower than ETV4) (Figure 2—figure supplement 1A–B), deple-
tion of ETV5 activity was not necessary in this analysis. ETV4 exhibits two peaks encompassing the
ZRS which correspond to the two ETV4 binding sites (Lettice et al., 2012); interestingly, the HDAC2
peak overlapped one of these peaks located at the 3’ end which encodes the long-range activity of
the regulatory element (Lettice et al., 2014). We next tested if HDAC2 and ETV4 were able to phys-
ically interact; analysis showed that endogenous ETV4 co-immunoprecipitated with HDAC2
(Figure 6C). In addition, the negative role of ETV4 on Shh expression in 14Fp cells (Figure 6D) was
investigated. Etv4 levels were reduced with siRNA, resulting in a ~40% decrease in ETV4 and a sig-
nificant activation of Shh expression (Figure 6D). ChIP using anti-ETV4 and HDAC2 antibodies per-
formed on TSA treated cells showed that ETV4 together with HDAC2 are displaced from the ZRS
(Figure 6E), suggesting that ETV4 opposes GABPa activity by maintaining lower levels of H3K27ac.
Discussion
The distal limb bud is poised for expressionThe ZPA is the organizing centre of the early developing limb bud and the restricted expression of
Shh at this location along the posterior boundary is crucial for correct specification of digit identity
and number. Various regulatory inputs are essential to acquire this spatial specific pattern of
expression (Figure 7). We showed that an initial input is the event that primes the ZRS, such that the
enhancer is poised but transcriptionally inactive. The ZRS priming occurs in a broad region of the dis-
tal limb bud mesenchyme that includes tissue that will not express Shh in addition to the ZPA. Fur-
thermore, we undertook studies to identify the signalling pathway involved in the induction of ZRS
priming. Distal limb mesenchyme, referred to as the progress zone, is known to be under the influ-
ence of the FGFs produced in the AER (Laufer et al., 1994; Niswander et al., 1994;
Crossley et al., 1996; Vogel et al., 1996; Ohuchi et al., 1997) and we showed that FGFs can induce
ZRS priming in distal mesenchyme; whereas, inhibition of FGF signalling results in chromatin changes
and loss of H3K4me1 and loss of transcription factor binding suggesting that the ZRS is no longer
recognized as a poised enhancer and is in a ‘closed’ configuration. Thus, one role of FGF signalling
is the establishment and maintenance of ZRS priming. Activation of the ZRS, therefore, appears to
be a two-step process; ZRS priming occurring broadly in the distal mesenchyme which is a prerequi-
site for subsequent action by other signals in the posterior region containing the ZPA to activate the
ZRS.
Figure 5 continued
transfected with 3Xflag-Gabpa (Figure 5—figure supplement 1E) treated with or without doxycycline were analysed by immunoprecipitation with anti-
p300 antibody followed by Western blot analysis with anti-flag-tag antibody. As control the empty vector plus doxycycline was used. (C) Western blot
analysis with anti-GABPa of 14Fp nuclear cell extracts transiently transfected with Gabpa small interfering RNA (siRNA) (siGabp-a) or nonspecific siRNA
(siCTR) and trichostatin A (TSA) treated. (D) Quantitative reverse transcriptase (qRT)-PCR was used to detect the messenger RNA (mRNA) levels of Shh
(grey box) and Gabpa (black box) in 14Fp cells transfected with Gabpa siRNA or nonspecific siRNA. Eighteen hours after transfection, the cells were
treated with 1 mM TSA for 24 hr. Shh and Gabpa levels were evaluated relative to control and normalized to glyceraldehyde 3-phosphate
dehydrogenase levels from two biological replicates. (E) qRT-PCR to detect the mRNA levels of Shh (black box) and Gabpa (grey box) in 14Fp cells
stably transfected with 3Xflag-Gabpa vector and an empty vector as control. Data points represent the mean ± SEM of three biological replicate. (F)
Chromatin from 14Fp cells stably transfected with 3Xflag-Gabpa vector and an empty vector as control was analysed by ChIP for H3K27ac histone
modification and ETV4 enrichment. DNA was quantified by q-PCR using the ZRS 5’ spatiotemporal (5’ST) activity oligo set. Data are represented as
mean ± SEM of the fold enrichment over nonspecific IgG recoveries from two independent experiments. (G–H) Chromatin from 14Fp cells stably
transfected with 3Xflag-Gabpa vector and an empty vector as control was analysed by ChIP for GABPa and P300. DNA was quantified by q-PCR using
the ZRS 3’ long-range (3’LR) and 5’ST activity oligos sets. Average of percentage of input ±SEM from two independent experiments are plotted.
DOI: https://doi.org/10.7554/eLife.28590.012
The following figure supplement is available for figure 5:
Figure supplement 1. Analysis of 14Fp cells after mis-expression of of flag-tagged GABPa.
DOI: https://doi.org/10.7554/eLife.28590.013
Peluso et al. eLife 2017;6:e28590. DOI: https://doi.org/10.7554/eLife.28590 12 of 22
Research article Developmental Biology and Stem Cells Genes and Chromosomes

The poised state of the enhancer is notable in light of the response of the ZRS to the point muta-
tions that cause PPD2 and other associated skeletal abnormalities (Anderson et al., 2012). These
mutations cause misregulation of Shh expression in the developing limb bud such that Shh expres-
sion occurs at an ectopic anterior site in the distal mesenchyme in addition to the ZPA. Ectopic
siR
NA control
siR
NA H
DAC1
siR
NA H
DAC2
siR
NA H
DAC2/H
DAC1
0
1
2
3
4
5
A
5Kb
ZRS
4
-1
4
-1
genes Lmbr1
0
0
Shh
5Kb
5’5’3’ 3’
Lmbr1 Shh5Kb
B
0
2
4
6
8
0.0
0.5
1.0
1.5
D
0.0
0.5
1.0
1.5
TSA- - + +
E
*P 0.02
*P 0.04
% I
np
ut
HDAC2 IB
IP
ETV4
IP
IgGBeadsINPUT
HDAC2
74
52
Kda
C
Scale
log2/input
HDAC2
ETV4
siR
NA
Ctr
siR
NA
Etv
4
siR
NA
Ctr
siR
NA
Etv
4
HD
AC
2
ETV4
HD
AC
2
ETV4
Shh expression 14Fp ETV4 expression 14FpChIP ZRS 5’ST activity
rela
tive e
xp
ressio
n
rela
tive e
xp
ressio
n
rela
tive e
xp
ressio
n
Shh expression 14Fp
Figure 6. ETV4 acts as a repressor via interactions with HDAC2. (A) Quantitative reverse transcriptase (q RT)-PCR to detect the messenger RNA (mRNA)
levels of Shh (black box) in 14Fp cells transfected with HDAC1 and HDAC2 small interfering RNA (siRNA) either alone or combined and with nonspecific
siRNA as control. Data were collected after 18 hr of transfection. Shh levels were evaluated relative to control and normalized to glyceraldehyde 3-
phosphate dehydrogenase levels. Data points represent the average of triplicate determinations ± SEM. (B) ChIP from two biological replicates using
the 14Fp cell line and anti-ETV4 and HDAC2 antibodies analysed by hybridizing to tiling microarrays (Figure 5—figure supplement 1B). Summary is
presented using two different genomic regions, the y axis is log2 for each ChIP/input DNA and the x axis represents a segment of DNA from the
microarray. The DNA region containing the ZRS is highlighted by the grey shading. As controls, the whole of the Shh coding region plus promoter is
shown. (C) 14Fp nuclear cell extracts were analysed by immunoprecipitation with anti-ETV4 and IgG antibodies followed by Western blot analysis with
anti-HDAC2. (D) qRT-PCR to detect the mRNA levels of Shh (black box) and Etv4 (grey box) in 14Fp cells transiently transfected with ETV4 siRNA
(siRNA Etv4) or nonspecific siRNA (siRNA Ctr). Data points represent the average of triplicate determinations ± SEM. (E) Shown are results from
chromatin immunoprecipitation (ChIP) analysis using anti-HDAC2 and ETV4 antibody after 24 hr of trichostatin A (TSA) treatment. Recovered DNA
sequences were quantified by quantitative PCR using 5’ spatiotemporal (5’ST) oligo set. Average percentage of input and ±SEM from two independent
experiments are plotted. The IgG did not give detectable signal.
DOI: https://doi.org/10.7554/eLife.28590.014
Peluso et al. eLife 2017;6:e28590. DOI: https://doi.org/10.7554/eLife.28590 13 of 22
Research article Developmental Biology and Stem Cells Genes and Chromosomes

expression of all ZRS mutations examined, thus far, is restricted to the distal mesenchyme suggest-
ing that there is a requirement for the ZRS to be in a poised state in order to be activated and dem-
onstrates a mechanism for Shh ectopic activation restricted to the distal mesenchyme of the limb
bud.
Levels of GABPa and ETV4 regulate Shh expressionAttempts to understand how developmental enhancers operate over such large distances have led
to the general idea that chromatin looping assists the interactions of a long-range enhancer with its
target promoter (Sanyal et al., 2012). In the limb bud, 3C assay revealed a physical interaction
between the ZRS and the promoter (Amano et al., 2009). Here, we confirmed, that upon activation
of Shh expression in the limb-derived cell line, there is highly specific co-localization of the ZRS with
the Shh promoter fragment. Thus, the Shh limb regulator in the cell line exists in two states; one in
which the ZRS is poised reflecting its origin from the distal mesenchyme of the developing limb bud
and secondly, in an active state in which the ZRS and the promoter recruit Pol II and interact. Hence,
the cell line reveals the chromatin dynamics that occur during long-range activation.
GABPa/ETS1 and ETV4/ETV5 have antagonistic effects on Shh activity in the limb. Occupancy at
multiple GABPa/ETS1 sites in the ZRS regulates the position of the ZPA boundary, whereas ETV4/
ETV5 binding acts as repressors to restrict expression outside the ZPA. We have hypothesized that
the balance between these activator and repressor factors is responsible for regulating activity levels
FGFs
+activators+repressors
ZRS poised, SHH off ZRS active, SHH onZRS inactive, SHH off
HDAC2P300
P300
H3K4me1
H3K27Ac
ETV4
-repressors
Proximal mesenchyme
ZRSH3K4me1: Low
H3K27Ac: Absent
Distal mesenchymeZRS
H3K4me1: HighH3K27Ac: Absent
Zone of polarizing activity
ZRSH3K4me1: HighH3K27Ac: high
P300
Figure 7. Fibroblast growth factor (FGF) signalling is responsible for priming the ZRS for local chromatin changes mediated by E26 transformation-
specific factors. Summary model showing how FGF signalling in the distal mesenchyme regulates the ZRS poised state and that this allows the stepwise
recruitment of transcriptional regulators to the ZRS. FGF signalling has a dual fundamental role; firstly, as an activator it is responsible for priming and
maintaining the ZRS and secondly, as a repressor inducing the expression on ETV4 which restricts the expression of the ZRS. ETV4 (red oval) interacts
with HDAC2 (light blue rectangle) to maintain the inactivity of the poised ZRS enhancer throughout the distal mesenchyme, while GABPa (blue oval)
acts within the ZPA domain to recruit p300 (yellow rectangle), trigger H3K27 (orange circle) acetylation, and thereby activate Shh transcription.
DOI: https://doi.org/10.7554/eLife.28590.015
Peluso et al. eLife 2017;6:e28590. DOI: https://doi.org/10.7554/eLife.28590 14 of 22
Research article Developmental Biology and Stem Cells Genes and Chromosomes

in the developing limb bud (Lettice et al., 2012). Here, we showed that GABPa and ETV4 bind to
the ZRS in the cell lines similar to that in the limb bud. GABPa is associated with p300 HAT at the
ZRS in the cell lines. Previous reports demonstrated that GABPa physically interacts with p300 in
myeloid cells (Resendes and Rosmarin, 2006). Activation of AChR (nicotinic acetylcholine receptor)
gene in subsynaptic nuclei in adult skeletal muscle is mediated by GABPa, which recruits the HAT
p300 to the AChR e-subunit promoter (Ravel-Chapuis et al., 2007). Furthermore, the surface of the
GABPa OST domain binds to the CH1 and CH3 domains of the co-activator HAT CBP/p300
(Kang et al., 2008). Here, we showed in the limb-derived cells that a similar interaction of these two
factors occurs. In addition, overexpression of GABPa results in an increase in the levels of H3K27ac
at the ZRS. A correlation between Gabpa expression and the presence of ETV4 at the ZRS is also
observed; in that, expression of Gabpa results in a displacement of ETV4 at the enhancer. Thus
GABPa operates at the ZRS to increase levels of H3K27ac by recruiting p300 and decreasing levels
of the repressor ETV4.
ETV4 appears to operate in the opposite manner and is one of the dominant factors in maintain-
ing the ZRS in a poised state. Reduction of ETV4 levels is sufficient to activate Shh expression. ETV4
interacts with HDAC2 and we further showed the co-localization of HDAC2 and ETV4 at the ZRS in
the cell line. Similar to the downregulation of ETV4 the knockdown of HDAC2 induces Shh. Activa-
tion of Shh by TSA releases ETV4 and HDAC2 from the ZRS. Hence activation of the ZRS by both
the overexpression of GABPa and treatment with TSA is associated with loss of ETV4 binding which
acts directly on HDAC activity.
The FGFs play a central role in Shh expression by ensuring that the ZRS maintains its primed state
throughout the distal limb mesenchyme. This widespread priming, however, opens the ZRS for
potential ectopic activation as occurs in preaxial polydactyly and associated phenotypes
(Anderson et al., 2012). ETV4 is a repressor that restricts this activity and FGF signalling also indu-
ces the levels of ETV4 in the distal mesenchyme of the limb bud (Mao et al., 2009; Zhang et al.,
2009). The FGFs, therefore, operate by regulating two contrasting events; firstly, by effecting the
chromatin in the distal mesenchyme ensuring that the ZRS is maintained in a poised state and sec-
ondly, acting counter to enhancer activation by inducing the level of a repressor that ensures Shh
expression does not occur outside the region of the ZPA.
Materials and methods
Cell lines, Transfections, and TreatmentsThe 14Fp cell line was derived from the posterior third of distal forelimb buds from an Immorto-
mouse (H-2k-tsA58) (Jat et al., 1991). Cells are plated in DMEM (Invitrogen, Loughborough, UK)
with 10% Foetal Calf Serum (Sigma-Aldrich, Gillingham, UK), Penicillin/Streptomycin and 20 ng/ml
Interferon (Peprotech, London, UK). Cells are grown at 33˚C the permissive temperature for the tem-
perature-sensitive T antigen and were passaged as necessary but no later than passage 12. Cells bio-
logical replicates are intended as cells cultured separately and treated/analysed at a different
passage. Cellular identity was confirmed by RNA expression analysis of specific genes and immorto-
mouse markers and verified to be mycoplasma free. Knockdown of endogenous proteins was per-
formed in 14fp cells after siRNA transfection using Dharmafect one solution (Dharmacon). Briefly,
cells were seeded in six-well plates to 40% confluence and after 24 hr were transfected using 25 nM
of each siRNA pool and 10 ml of the transfection reagent. The transfection medium was replaced
after 12 hr and cells were grown for another 12 hr. Cells were collected 24 hr after the transfection
for analyses. siRNA pools were purchased from Thermo Fisher Scientific (Ambion): Gabpa (s66354,
s66355), Etv4 (s71463, s201776), Hdac2 (s67417, s67416), Hdac1 (s119557, s119558), and nontarget-
ing siRNAs (control) (D-001810-02). The siRNA were used separately. Unless otherwise specified, the
cells were treated with HDAC inhibitors TSA (1 mM) for 24 hr before cell harvest and NIN (100 nM)
and BGJ (2.5 mM) for 4 hr. Cell cultures were incubated, when necessary, with 500 ng/ml of FGF10
(R&D Systems, Abingdon, UK catalogue no. 345-FG) and 100 ng/ml of FGF8 (Abcam,
Cambridge, UK, ab205522) combination for 6 hr after NIN treatments.
Peluso et al. eLife 2017;6:e28590. DOI: https://doi.org/10.7554/eLife.28590 15 of 22
Research article Developmental Biology and Stem Cells Genes and Chromosomes
Mouse limb culturesLimb buds were dissected from E11.5 mouse embryos and cultured as described by Havis et al.
(2014) with the following modifications. Limb dissections obtained from different embryos were con-
sidered as biological replicates. Briefly distal dissections were treated with NIN (100 nM) for 4 hr.
Proximal dissections were incubated with 500 ng/ml of FGF10 (R and D Systems, catalogue no. 345-
FG) and 100 ng/ml of FGF8 (ABCAM, ab205522) combination for 6 hr. Inhibitors were diluted in
DMSO. Media with buffers only were used as controls. After treatments, explants were processed
for qRT-PCR or ChIP.
Trypan blue staining was performed on limb dissections by following a reported protocol with
slight modifications (Siddique, 2012). Total limb dissections were collected and treated 4 hr with
NIN or media alone. The limbs were then transferred to trypan blue stain and kept in shaking condi-
tion for 20 min. Eight limb dissections were directly stained after collection (T0). The samples were
washed thoroughly with PBS solution again for 15 more minutes and observed by microscope and
imaged to check for any cell damage.
ChIP and antibodiesCrosslinked ChIP was performed as described (Stock et al., 2007) from approximately 107 cells per
experiment. All antibodies used in this study have been previously reported as suitable for ChIP
and/or ChIP-seq, p300 (sc-585, Santa Cruz Biotechnology, Heidelberg, Germany), H3K4me1
(ab8895, Abcam), H3K27ac (s39133, Active Motif, La Hulpe, Belguim), HDAC2 (ab16032), GABPa
(sc-22810, Santa Cruz Biotechnology), with the exception at ETV4 (ABE635,
Millipore, Loughborough, UK). All statistical analyses were performed using a two-tailed Student’s t-
test.
3C and 4C3C was conducted according to the protocol described by Stadhouders et al., 2013 with minor
alterations. In brief cells were treated with 1 mM TSA for 18 and 24 hr or DMSO as a control and
fixed in 2% formaldehyde solution for 10 min. Glycine (0.125 M) was used to quench the reaction.
After a PBS wash and 15 min incubation in lysis buffer, the solution was spun down and nuclei stored
at �80˚C until needed. If more than 5 � 105 cells were used, pellets were made up in
1.2� restriction buffer and divided into four aliquots to reduce formation of aggregates. Primary
restriction enzyme digestion was conducted using 800 U HindIII-HF restriction enzyme (NEB) at 37˚Con each aliquot. Before ligation aliquots were combined and T4 DNA ligase (New England Biolabs,
Evry, France) added and incubated at 16˚C overnight. HindIII digested samples were analysed on a
0.6% agarose gel and appear as high molecular weight smear running from roughly 4 to 12 kb (Fig-
ure 2—figure supplement 3D, Figure 3—figure supplement 1A). 3C libraries were analysed on
0.6% agarose gel and appear as a high molecular weight band (around 12 kb) (Figure 2—figure
supplement 3E, Figure 3—figure supplement 1B). To this point the 3C libraries were analysed (see
below). In order to make 4C libraries a second restriction digest was performed using the four-cutter
MluCI (Roche, Burgess Hill, UK) at 37˚C overnight and second ligation with T4 DNA ligase
(New England Biolabs). MluCI digested samples were analysed on a 1.5% gel appearing as smear
between roughly 0.3 and 1 kb (Figure 2—figure supplement 3F). Finally, 4C libraries were purified
using QIA quick PCR purification kit (Qiagen, Germantown, MD, USA) to produce final purified 4C
libraries. After PCR amplification and purification (Table ST2), sequencing adaptors were ligated and
4C libraries sequenced using in-house Ion Proton sequencing.
Analysis of 4C librariesDe-multiplexed sequencing reads (fastq files) can be summarized: first we trimmed known bait
sequence using cutadapt (Martin, 2011) and selected only those reads where known viewpoint-
associated sequence was present. Reads were mapped to the mouse reference genome (build mm9)
using bowtie2 (Langmead and Salzberg, 2012) with the very-sensitive flag 3. Alignments were fil-
tered with a MAPping Quality (MAPQ) score >30 to select for high-confidence alignments using
SAMtools (Li et al., 2009). Contacts were then normalized using the r3cseq R package and assigned
false discovery rate q-values to interactions, with the aim of finding those significantly over-
Peluso et al. eLife 2017;6:e28590. DOI: https://doi.org/10.7554/eLife.28590 16 of 22
Research article Developmental Biology and Stem Cells Genes and Chromosomes
represented relative to expectation. The normalization procedure for 4C data is adapted from a pre-
vious method for normalizing deepCAGE data between samples (Balwierz et al., 2009).
Analysis of 3C librariesDigestion efficiency and sample purity was assessed as described previously (Hagege et al., 2007).
Primers were designed using Primer3 with an anchor primer in the fragment at the 5’ end of the ZRS
and in potential interacting fragments around the Shh promoter, gene body, 3’ end, and gene des-
ert. qPCR was carried out using the Roche LightCycler 480 SYBR Green I Master and Roche LightCy-
cler 480 probe Master on a Roche LC480 according to the instructions of the manufacturer (Roche).
Two PACs, RCPI21-542n10 (148 kb long covering Rnf32 to 5’ of LMBR1) and RCPI21-508F15 (203 kb
long covering Shh and 150 kb 5’) obtained from RPCI21 library (HGMP Resource Centre, Cam-
bridge, United Kingdom), were used as a PCR control template. The PAC clones were cut with Hin-
dIII and equimolar amounts re-ligated by T4 DNA ligase. All primer pairs were tested on a standard
curve of the BAC control library and yielded PCR efficiencies > 1.7. The presence of a single PCR
product was confirmed and melting curves analysed. Cycling conditions were: 95˚C for 5 min, 40
cycles of 95˚C for 15 s, 60˚C for 30 s, 72˚C for 30 s . qPCR data were normalized to ZRS 3’LR ChIP
oligos as a loading control. 3C oligos from Splinter et al. (2006) were used to control for interaction
frequencies between samples. ZRS 3’LR ChIP oligos cycling conditions were 95˚C for 5 min, 40 cycles
of 95˚C for 10 s, 60˚C for 30 s, 72˚C for 30 s. The cycling conditions for the interacting fragments
and the anchor were 95˚C for 5 min, 45 cycles of 95˚C for 15 s, 60˚C for 1 min, 72˚C for 1 s. Data
analysis was carried out according to Hagege et al. (2007) and is presented as relative crosslinking
frequency. The primers used for the chromatin conformation capture interaction studies are listed in
Table S2.
ChIP and tiling microarraysCells from dissected E11.5 limbs and 14fp were fixed with 1% formaldehyde (25˚C, 10 min) and
stopped with 0.125 M glycine. Crosslinked ChIP was performed as described (Stock et al., 2007). In
brief, the nuclei were sonicated using a Diagenode Bioruptor (Leige, full power 30 s on, 30 s off, in
an ice bath for 50 min) to produce fragments of <300 bp. Chromatin (350 mg) was incubated with 5
mg prebound (to Protein A or G magnetic beads, Invitrogen) IgG (Santa Cruz, sc-2025) or the previ-
ously mentioned antibodies, raised to in the presence of 50 mg of BSA, washed, and eluted. Reverse
crosslinked DNA was purified with Proteinase K (ThermoFisher Scientific) and QIAGEN PCR purifica-
tion kit. qPCR of the ChIP experiments was carried out using equal concentrations of input, IgG, and
Chip DNA using a Sybr Green (Roche) reaction. From each biological replicate three technical repli-
cates were analysed. Enrichment values for ChIP samples from limb bud sections extracts are pre-
sented either as percentage of input or as fold differences relative to IgG and normalized to input
with the formula 2([CtIgG-CtInput]�[CtAb-CtInput]) where Ct values are threshold cycles. All biologi-
cal replicates were carried out in duplicate unless stated. Primers used for ZRS and the controls are
shown in Table ST1. For the custom Nimblegen tiling arrays ChIP DNA and input DNA ChIP DNA
and input DNA were amplified (WGA2 kit, Sigma), labelled, and hybridized according to the manu-
facturer’s protocol to a 354,999 unique probe custom microarray containing specific tiled regions of
the mouse genome (Nimblegen, Roche). For the Agilent arrays a custom tiling array was designed
including some of the genes involved in limb development, including gene deserts associated with
such genes. GEO accession number for the ChIP data is GSE104074 and GSE104208.
Nimblegen arraysMicroarray data were analysed in R/Bioconductor (http://genomebiology.com/2004/5/10/R80) with
the Epigenome (PROT43) protocol (https://www.epigenesys.eu/images/stories/protocols/pdf/
20111025114444_p43.pdf) with the following parameters. The mean signal intensity of the two repli-
cate probes on each array was taken. Loess normalization was used within arrays to correct for the
dye bias, and scale normalization was used within the replicates group to control interarray variability
using the R package (Ritchie et al., 2015). The log2 enrichment for each ChIP group was calculated
by subtracting the mean of log2 input intensities from the mean of d enriched intensities and averag-
ing over the two biological replicates.
Peluso et al. eLife 2017;6:e28590. DOI: https://doi.org/10.7554/eLife.28590 17 of 22
Research article Developmental Biology and Stem Cells Genes and Chromosomes

Agilent arraysThe Median Signal was extracted from the scanned image files and processed using the R package
(Toedling et al., 2007). Probe intensities were transformed from raw values into background-cor-
rected normalized log ratios (ChIP/Input) using Ringo’s preprocess method (VSN normalization).
Smoothing over individual probe intensities was performed using a sliding window of 1000 bp along
the chromosome and replacing the intensity at the genomic position by the median over the intensi-
ties of those reporters inside the window.
Immunoprecipitation of FLAG fusion proteinsThe pSV40-Tet3G- pTRE3G-mCherry- Gabpa plasmid was generated using the In-Fusion cloning
technology (Clontech, St Germaine en Laye, France catalogue no. 639649). First, the pTRE3G-
mCherry vector (Clontech, catalogue nos. 631160 and 631175) was linearized using a unique restric-
tion site between the origin of replication and the Tet-responsive promoter (pTRE3G). Second, the
sequences encoding for SV40 promoter, Kanamycin/Neomycin resistance, internal ribosome entry
site IRES2, and Tet-ON 3G transactivator were inserted. Third, we removed the Ampicillin resistance
cassette. Lastly, the sequence of the self-cleaving peptide P2A was cloned between the mCherry
fluorescent marker and the 3xFLAG tagged Gabpa gene, in order to generate a bicistronic expres-
sion under the control of the TRE3G promoter and an empty control vector was also used. Overex-
pression analyses were performed in 14fp cells by transfecting plasmids using Lipofectamine LTX
with plus reagent (ThermoFisher Scientific) and following standard manufacturer’s protocol. Nuclear
extracts used in the immunoprecipitation were prepared from 14fp using a NE-PER nuclear and cyto-
plasmic extraction kit (ThermoFisher Scientific). The nuclear extract was incubated with anti-FLAG
M2 affinity gel (Sigma) for 3 hr at 4˚C. The beads were washed three times with washing buffer. The
immunoprecipitates were eluted with 1� SDS buffer, separated on a 4–20% Novex Tris-Glycine SDS-
PAGE gel (Invitrogen), transferred to a PVDF membrane (Millipore), incubated with anti-FLAG
(Sigma) or with anti-GABPa (Santa Cruz, sc-22810).
Gene expression analysis, RNA library Preparation, Sequencing, andAnalysisTotal RNA was prepared using Trizol reagent (Invitrogen) according to manufacturer’s protocol (for
limb buds, dissected anterior, posterior, distal, and proximal tissue was dissociated into single cell
suspensions in Trizol using a syringe fitted with a 25G (0.5 mm) needle (Sigma Aldrich, BD Micro-
lance), followed by acid phenol:chloroform:isopropyl alcohol extraction, and then digested with 2U
DNaseI (ThermoFisher Scientific, Ambion) for 30 min at 37˚C). RNA was reverse-transcribed to
complementary DNA (cDNA) using QuantiTect Reverse Transcription Kit (Qiagen). The quantitative
real-time PCRs were performed in a 7300 system (ThermoFisher Scientific, Applied Biosystems, Life
Technologies) by using LightCycler 480 SYBR Green I Master (Roche) and gene specific primer sets
for shh, Gabpa, and Etv4. The cycle threshold (CT) values from all quantitative real-time PCR experi-
ments were analysed using DDCT method. Data were normalized to GAPDH and expressed as fold
changes over that in control treatment group. From each biological replicate three technical repli-
cates were analysed. All statistical analyses were performed using a two-tailed Student’s t-test.
RNA sequencing was conducted by GATC Biotech (Konstantz, Germany). Samples were only sub-
mitted with an OD 260/280 ratio �1.8, a 260/230 ratio �1.7, and a RNA Integrity Number value �8
as detected by Agilent Technologies 2100 Bionalayser. The InView Transcriptome Explore service
provided by GATC was used to provide a randomly primed and amplified cDNA library with Illumina
adaptors ready for sequencing. Illumina sequencing was conducted producing 50 bp single end
reads and a guarantee of over 30 million reads per sample. All samples were analysed on the main
Galaxy server by first checking sequence quality by FastQC. Reads were then trimmed and any Illu-
mina sequencing adaptors removed as appropriate and aligned to the mouse genome (mm9, NCBI
37) using Tophat2 (Galaxy Tool Version 0.9). The results for each condition were fed into Cuffdiff
(Galaxy Tool Version 2.2.1.3) and visualized using the R Bioconductor package CummeRbund
(Release 3.2). This process was repeated using RNA isolated from both immortalized limb cell lines
and isolated limb tissue. Two biological replicates were analysed for each condition.
Peluso et al. eLife 2017;6:e28590. DOI: https://doi.org/10.7554/eLife.28590 18 of 22
Research article Developmental Biology and Stem Cells Genes and Chromosomes

AcknowledgementsWe thank the staff at the Evans Building and especially Anna Thornburn for expert technical assis-
tance. We also thank Prof. N Hastie and Prof. W Bickmore for critically reading the manuscript. This
work was supported by an MRC core grant. We also thank Dr. Laura Lettice who kindly provided us
the PAC vectors and the 3C libraries from anterior and posterior limb tissue.
Additional information
Funding
Funder Author
Medical Research Council Silvia PelusoAdam DouglasAlison HillCarlo De AngelisBenjamin L MooreGraeme GrimesGiulia PetrovichAbdelkader EssafiRobert E Hill
The funders had no role in study design, data collection and
interpretation, or the decision to submit the work for publication.
Author contributions
Silvia Peluso, Conceptualization, Data curation, Formal analysis, Validation, Investigation, Visualiza-
tion, Methodology, Writing—original draft, Project administration, Writing—review and editing,
Analysed and interpreted the data and prepared the manuscript. designed and performed the
majority of experiments; Adam Douglas, Data curation, Formal analysis, Validation, Methodology,
performed the 4C experiment; Alison Hill, Resources, Validation, Methodology, Contributed to pro-
duction of the experimental data; Carlo De Angelis, Resources, Validation, Methodology, contrib-
uted to production of the experimental data; Benjamin L Moore, Software, Visualization, Writing—
review and editing, analysed the 4C experiment; Graeme Grimes, Software, Validation, Writing—
review and editing, Analysed the the ChiP-chip data; Giulia Petrovich, Validation, Methodology,
Writing—review and editing, Generated the 3X flag vector; Abdelkader Essafi, Conceptualization,
Writing—review and editing, provided scientific support; Robert E Hill, Conceptualization, Supervi-
sion, Funding acquisition, Investigation, Writing—original draft, Project administration, Writing—
review and editing, analysed and interpreted the data, prepared the manuscript and supervised the
study
Author ORCIDs
Silvia Peluso, http://orcid.org/0000-0003-1803-5300
Benjamin L Moore, http://orcid.org/0000-0002-4074-1933
Robert E Hill, http://orcid.org/0000-0003-2848-1080
Ethics
Animal experimentation: Experiments using mice were conducted in accordance with the UK Ani-
mals (Scientific Procedures) Act 1986, with appropriate personal and project licences in place.
Decision letter and Author response
Decision letter https://doi.org/10.7554/eLife.28590.018
Author response https://doi.org/10.7554/eLife.28590.019
Peluso et al. eLife 2017;6:e28590. DOI: https://doi.org/10.7554/eLife.28590 19 of 22
Research article Developmental Biology and Stem Cells Genes and Chromosomes
Additional filesSupplementary files. Supplementary file 1. (A) List of oligos used for qRT-PCR, q-PCR and ChIP. (B) List of oligos used
for 3C and 4C analysis.
DOI: https://doi.org/10.7554/eLife.28590.016
. Transparent reporting form
DOI: https://doi.org/10.7554/eLife.28590.017
ReferencesAmano T, Sagai T, Tanabe H, Mizushina Y, Nakazawa H, Shiroishi T. 2009. Chromosomal dynamics at the Shhlocus: limb bud-specific differential regulation of competence and active transcription. Developmental Cell 16:47–57. DOI: https://doi.org/10.1016/j.devcel.2008.11.011, PMID: 19097946
Anderson E, Devenney PS, Hill RE, Lettice LA. 2014. Mapping the Shh long-range regulatory domain.Development 141:3934–3943. DOI: https://doi.org/10.1242/dev.108480, PMID: 25252942
Anderson E, Peluso S, Lettice LA, Hill RE. 2012. Human limb abnormalities caused by disruption of hedgehogsignaling. Trends in Genetics 28:364–373. DOI: https://doi.org/10.1016/j.tig.2012.03.012, PMID: 22534646
Balwierz PJ, Carninci P, Daub CO, Kawai J, Hayashizaki Y, Van Belle W, Beisel C, van Nimwegen E. 2009.Methods for analyzing deep sequencing expression data: constructing the human and mouse promoteromewith deepCAGE data. Genome Biology 10:R79. DOI: https://doi.org/10.1186/gb-2009-10-7-r79, PMID: 19624849
Cotney J, Leng J, Oh S, DeMare LE, Reilly SK, Gerstein MB, Noonan JP. 2012. Chromatin state signaturesassociated with tissue-specific gene expression and enhancer activity in the embryonic limb. Genome Research22:1069–1080. DOI: https://doi.org/10.1101/gr.129817.111, PMID: 22421546
Crossley PH, Minowada G, MacArthur CA, Martin GR. 1996. Roles for FGF8 in the induction, initiation, andmaintenance of chick limb development. Cell 84:127–136. DOI: https://doi.org/10.1016/S0092-8674(00)80999-X, PMID: 8548816
De Santa F, Barozzi I, Mietton F, Ghisletti S, Polletti S, Tusi BK, Muller H, Ragoussis J, Wei CL, Natoli G. 2010. Alarge fraction of extragenic RNA pol II transcription sites overlap enhancers. PLoS Biology 118:e1000384.DOI: https://doi.org/10.1371/journal.pbio.1000384, PMID: 20485488
Farooq M, Troelsen JT, Boyd M, Eiberg H, Hansen L, Hussain MS, Rehman S, Azhar A, Ali A, Bakhtiar SM,Tommerup N, Baig SM, Kjaer KW. 2010. Preaxial polydactyly/triphalangeal thumb is associated with changedtranscription factor-binding affinity in a family with a novel point mutation in the long-range cis-regulatoryelement ZRS. European Journal of Human Genetics 18:733–736. DOI: https://doi.org/10.1038/ejhg.2009.225,PMID: 20068592
Furniss D, Lettice LA, Taylor IB, Critchley PS, Giele H, Hill RE, Wilkie AO. 2008. A variant in the sonic hedgehogregulatory sequence (ZRS) is associated with triphalangeal thumb and deregulates expression in the developinglimb. Human Molecular Genetics 17:2417–2423. DOI: https://doi.org/10.1093/hmg/ddn141, PMID: 18463159
Gurnett CA, Bowcock AM, Dietz FR, Morcuende JA, Murray JC, Dobbs MB. 2007. Two novel point mutations inthe long-range SHH enhancer in three families with triphalangeal thumb and preaxial polydactyly. AmericanJournal of Medical Genetics Part A 143A:27–32. DOI: https://doi.org/10.1002/ajmg.a.31563, PMID: 17152067
Hagege H, Klous P, Braem C, Splinter E, Dekker J, Cathala G, de Laat W, Forne T. 2007. Quantitative analysis ofchromosome conformation capture assays (3C-qPCR). Nature Protocols 2:1722–1733. DOI: https://doi.org/10.1038/nprot.2007.243, PMID: 17641637
Havis E, Bonnin MA, Olivera-Martinez I, Nazaret N, Ruggiu M, Weibel J, Durand C, Guerquin MJ, Bonod-BidaudC, Ruggiero F, Schweitzer R, Duprez D. 2014. Transcriptomic analysis of mouse limb tendon cells duringdevelopment. Development 141:3683–3696. DOI: https://doi.org/10.1242/dev.108654, PMID: 25249460
Heintzman ND, Stuart RK, Hon G, Fu Y, Ching CW, Hawkins RD, Barrera LO, Van Calcar S, Qu C, Ching KA,Wang W, Weng Z, Green RD, Crawford GE, Ren B. 2007. Distinct and predictive chromatin signatures oftranscriptional promoters and enhancers in the human genome. Nature Genetics 39:311–318. DOI: https://doi.org/10.1038/ng1966, PMID: 17277777
Hilberg F, Roth GJ, Krssak M, Kautschitsch S, Sommergruber W, Tontsch-Grunt U, Garin-Chesa P, Bader G,Zoephel A, Quant J, Heckel A, Rettig WJ. 2008. BIBF 1120: triple angiokinase inhibitor with sustained receptorblockade and good antitumor efficacy. Cancer Research 68:4774–4782. DOI: https://doi.org/10.1158/0008-5472.CAN-07-6307, PMID: 18559524
Jat PS, Noble MD, Ataliotis P, Tanaka Y, Yannoutsos N, Larsen L, Kioussis D. 1991. Direct derivation ofconditionally immortal cell lines from an H-2Kb-tsA58 transgenic mouse. Proceedings of the National Academyof Sciences 88:5096–5100. DOI: https://doi.org/10.1073/pnas.88.12.5096
Kang HS, Nelson ML, Mackereth CD, Scharpf M, Graves BJ, McIntosh LP. 2008. Identification and structuralcharacterization of a CBP/p300-binding domain from the ETS family transcription factor GABP alpha. Journal ofMolecular Biology 377:636–646. DOI: https://doi.org/10.1016/j.jmb.2008.01.054, PMID: 18295234
Kim TK, Hemberg M, Gray JM, Costa AM, Bear DM, Wu J, Harmin DA, Laptewicz M, Barbara-Haley K, KuerstenS, Markenscoff-Papadimitriou E, Kuhl D, Bito H, Worley PF, Kreiman G, Greenberg ME. 2010. Widespread
Peluso et al. eLife 2017;6:e28590. DOI: https://doi.org/10.7554/eLife.28590 20 of 22
Research article Developmental Biology and Stem Cells Genes and Chromosomes
transcription at neuronal activity-regulated enhancers. Nature 465:182–187. DOI: https://doi.org/10.1038/nature09033, PMID: 20393465
Kimura J, Ide H. 1998. Shh, Bmp-2 and Hoxd-13 gene expression in chick limb bud cells in culture. Development,Growth and Differentiation 40:457–464. DOI: https://doi.org/10.1046/j.1440-169X.1998.t01-2-00011.x, PMID:9727360
Langmead B, Salzberg SL. 2012. Fast gapped-read alignment with Bowtie 2. Nature Methods 9:357–359.DOI: https://doi.org/10.1038/nmeth.1923, PMID: 22388286
Laufer E, Nelson CE, Johnson RL, Morgan BA, Tabin C. 1994. Sonic hedgehog and Fgf-4 act through a signalingcascade and feedback loop to integrate growth and patterning of the developing limb bud. Cell 79:993–1003.DOI: https://doi.org/10.1016/0092-8674(94)90030-2, PMID: 8001146
Lettice LA, Heaney SJ, Purdie LA, Li L, de Beer P, Oostra BA, Goode D, Elgar G, Hill RE, de Graaff E. 2003. Along-range Shh enhancer regulates expression in the developing limb and fin and is associated with preaxialpolydactyly. Human Molecular Genetics 12:1725–1735. DOI: https://doi.org/10.1093/hmg/ddg180, PMID: 12837695
Lettice LA, Hill AE, Devenney PS, Hill RE. 2008. Point mutations in a distant sonic hedgehog cis-regulatorgenerate a variable regulatory output responsible for preaxial polydactyly. Human Molecular Genetics 17:978–985. DOI: https://doi.org/10.1093/hmg/ddm370, PMID: 18156157
Lettice LA, Horikoshi T, Heaney SJ, van Baren MJ, van der Linde HC, Breedveld GJ, Joosse M, Akarsu N, OostraBA, Endo N, Shibata M, Suzuki M, Takahashi E, Shinka T, Nakahori Y, Ayusawa D, Nakabayashi K, Scherer SW,Heutink P, Hill RE, et al. 2002. Disruption of a long-range cis-acting regulator for Shh causes preaxialpolydactyly. PNAS 99:7548–7553. DOI: https://doi.org/10.1073/pnas.112212199, PMID: 12032320
Lettice LA, Williamson I, Devenney PS, Kilanowski F, Dorin J, Hill RE. 2014. Development of five digits iscontrolled by a bipartite long-range cis-regulator. Development 141:1715–1725. DOI: https://doi.org/10.1242/dev.095430, PMID: 24715461
Lettice LA, Williamson I, Wiltshire JH, Peluso S, Devenney PS, Hill AE, Essafi A, Hagman J, Mort R, Grimes G,DeAngelis CL, Hill RE. 2012. Opposing functions of the ETS factor family define Shh spatial expression in limbbuds and underlie polydactyly. Developmental Cell 22:459–467. DOI: https://doi.org/10.1016/j.devcel.2011.12.010, PMID: 22340503
Li H, Handsaker B, Wysoker A, Fennell T, Ruan J, Homer N, Marth G, Abecasis G, Durbin R, 1000 GenomeProject Data Processing Subgroup. 2009. The Sequence Alignment/Map format and SAMtools. Bioinformatics25:2078–2079. DOI: https://doi.org/10.1093/bioinformatics/btp352, PMID: 19505943
Ritchie ME, Phipson B, Wu D, Hu Y, Law CW, Shi W, Smyth GK. 2015. limma powers differential expressionanalyses for RNA-sequencing and microarray studies. Nucleic Acids Research 43:e47. DOI: https://doi.org/10.1093/nar/gkv007, PMID: 25605792
Mao J, McGlinn E, Huang P, Tabin CJ, McMahon AP. 2009. Fgf-dependent Etv4/5 activity is required forposterior restriction of Sonic Hedgehog and promoting outgrowth of the vertebrate limb. Developmental Cell16:600–606. DOI: https://doi.org/10.1016/j.devcel.2009.02.005, PMID: 19386268
Martin M. 2011. Cutadapt removes adapter sequences from high-throughput sequencing reads. EMBnet.journal17:10–12. DOI: https://doi.org/10.14806/ej.17.1.200
Niswander L, Jeffrey S, Martin GR, Tickle C. 1994. A positive feedback loop coordinates growth and patterningin the vertebrate limb. Nature 371:609–612. DOI: https://doi.org/10.1038/371609a0, PMID: 7935794
Ohuchi H, Nakagawa T, Yamamoto A, Araga A, Ohata T, Ishimaru Y, Yoshioka H, Kuwana T, Nohno T, YamasakiM, Itoh N, Noji S. 1997. The mesenchymal factor, FGF10, initiates and maintains the outgrowth of the chicklimb bud through interaction with FGF8, an apical ectodermal factor. Development 124:2235–2244. PMID: 9187149
Rada-Iglesias A, Bajpai R, Prescott S, Brugmann SA, Swigut T, Wysocka J. 2012. Epigenomic annotation ofenhancers predicts transcriptional regulators of human neural crest. Cell Stem Cell 11:633–648. DOI: https://doi.org/10.1016/j.stem.2012.07.006, PMID: 22981823
Ravel-Chapuis A, Vandromme M, Thomas JL, Schaeffer L. 2007. Postsynaptic chromatin is under neural control atthe neuromuscular junction. The EMBO Journal 26:1117–1128. DOI: https://doi.org/10.1038/sj.emboj.7601572,PMID: 17304221
Resendes KK, Rosmarin AG. 2006. GA-binding protein and p300 are essential components of a retinoic acid-induced enhanceosome in myeloid cells. Molecular and Cellular Biology 26:3060–3070. DOI: https://doi.org/10.1128/MCB.26.8.3060-3070.2006, PMID: 16581781
Sagai T, Hosoya M, Mizushina Y, Tamura M, Shiroishi T. 2005. Elimination of a long-range cis-regulatory modulecauses complete loss of limb-specific Shh expression and truncation of the mouse limb. Development 132:797–803. DOI: https://doi.org/10.1242/dev.01613, PMID: 15677727
Sanyal A, Lajoie BR, Jain G, Dekker J. 2012. The long-range interaction landscape of gene promoters. Nature489:109–113. DOI: https://doi.org/10.1038/nature11279, PMID: 22955621
Semerci CN, Demirkan F, Ozdemir M, Biskin E, Akin B, Bagci H, Akarsu NA. 2009. Homozygous feature ofisolated triphalangeal thumb-preaxial polydactyly linked to 7q36: no phenotypic difference betweenhomozygotes and heterozygotes. Clinical Genetics 76:85–90. DOI: https://doi.org/10.1111/j.1399-0004.2009.01192.x, PMID: 19519794
Sharrocks AD. 2001. The ETS-domain transcription factor family. Nature Reviews Molecular Cell Biology 2:827–837. DOI: https://doi.org/10.1038/35099076, PMID: 11715049
Peluso et al. eLife 2017;6:e28590. DOI: https://doi.org/10.7554/eLife.28590 21 of 22
Research article Developmental Biology and Stem Cells Genes and Chromosomes

Siddique YH. 2012. Protective role of curcumin against the toxic effects of cyclophosphamide in the third instarlarvae of transgenic Drosophila melanogaster (hsp70-lacZ)Bg9. Alternative Medicine Studies 2:2. DOI: https://doi.org/10.4081/ams.2012.e2
Splinter E, Heath H, Kooren J, Palstra RJ, Klous P, Grosveld F, Galjart N, de Laat W. 2006. CTCF mediates long-range chromatin looping and local histone modification in the beta-globin locus. Genes & Development 20:2349–2354. DOI: https://doi.org/10.1101/gad.399506, PMID: 16951251
Stadhouders R, Kolovos P, Brouwer R, Zuin J, van den Heuvel A, Kockx C, Palstra RJ, Wendt KS, Grosveld F, vanIjcken W, Soler E. 2013. Multiplexed chromosome conformation capture sequencing for rapid genome-scalehigh-resolution detection of long-range chromatin interactions. Nature Protocols 8:509–524. DOI: https://doi.org/10.1038/nprot.2013.018, PMID: 23411633
Stock JK, Giadrossi S, Casanova M, Brookes E, Vidal M, Koseki H, Brockdorff N, Fisher AG, Pombo A. 2007.Ring1-mediated ubiquitination of H2A restrains poised RNA polymerase II at bivalent genes in mouse ES cells.Nature Cell Biology 9:1428–1435. DOI: https://doi.org/10.1038/ncb1663, PMID: 18037880
Tickle C. 2015. How the embryo makes a limb: determination, polarity and identity. Journal of Anatomy 227:418–430. DOI: https://doi.org/10.1111/joa.12361, PMID: 26249743
Toedling J, Skylar O, Sklyar O, Krueger T, Fischer JJ, Sperling S, Huber W. 2007. Ringo–an R/Bioconductorpackage for analyzing ChIP-chip readouts. BMC Bioinformatics 8:221. DOI: https://doi.org/10.1186/1471-2105-8-221, PMID: 17594472
Towers M, Mahood R, Yin Y, Tickle C. 2008. Integration of growth and specification in chick wing digit-patterning. Nature 452:882–886. DOI: https://doi.org/10.1038/nature06718, PMID: 18354396
Verheyden JM, Sun X. 2008. An Fgf/Gremlin inhibitory feedback loop triggers termination of limb budoutgrowth. Nature 454:638–641. DOI: https://doi.org/10.1038/nature07085, PMID: 18594511
Vogel A, Rodriguez C, Izpisua-Belmonte JC. 1996. Involvement of FGF-8 in initiation, outgrowth and patterningof the vertebrate limb. Development 122:1737–1750. PMID: 8674413
Wieczorek D, Pawlik B, Li Y, Akarsu NA, Caliebe A, May KJ, Schweiger B, Vargas FR, Balci S, Gillessen-KaesbachG, Wollnik B. 2010. A specific mutation in the distant sonic hedgehog (SHH) cis-regulator (ZRS) causes Wernermesomelic syndrome (WMS) while complete ZRS duplications underlie Haas type polysyndactyly and preaxialpolydactyly (PPD) with or without triphalangeal thumb. Human Mutation 31:81–89. DOI: https://doi.org/10.1002/humu.21142, PMID: 19847792
Williamson I, Eskeland R, Lettice LA, Hill AE, Boyle S, Grimes GR, Hill RE, Bickmore WA. 2012. Anterior-posteriordifferences in HoxD chromatin topology in limb development. Development 139:3157–3167. DOI: https://doi.org/10.1242/dev.081174, PMID: 22872084
Williamson I, Lettice LA, Hill RE, Bickmore WA. 2016. Shh and ZRS enhancer colocalisation is specific to the zoneof polarising activity. Development 143:2994–3001. DOI: https://doi.org/10.1242/dev.139188, PMID: 27402708
Zhang Z, Verheyden JM, Hassell JA, Sun X. 2009. FGF-regulated Etv genes are essential for repressing Shhexpression in mouse limb buds. Developmental Cell 16:607–613. DOI: https://doi.org/10.1016/j.devcel.2009.02.008, PMID: 19386269
Zhu J, Nakamura E, Nguyen MT, Bao X, Akiyama H, Mackem S. 2008. Uncoupling sonic hedgehog control ofpattern and expansion of the developing limb bud. Developmental Cell 14:624–632. DOI: https://doi.org/10.1016/j.devcel.2008.01.008, PMID: 18410737
Peluso et al. eLife 2017;6:e28590. DOI: https://doi.org/10.7554/eLife.28590 22 of 22
Research article Developmental Biology and Stem Cells Genes and Chromosomes
Related Documents