Peer-to-peer lending and birth outcomes during national economic crises: Lessons from Indonesia. Joseph Kofi Acquah * November 1, 2015 * I am deeply indebted to Anna Aizer, Andrew Foster, Glenn Loury, Frank Sloan, Emily Oster, Jesse Shapiro and seminar participants at the Brown University economics department for their useful comments and suggestions. Address: Department of Economics, Brown University, 64 Waterman St., Providence, RI 02912. Contact: joseph [email protected] 1

Welcome message from author
This document is posted to help you gain knowledge. Please leave a comment to let me know what you think about it! Share it to your friends and learn new things together.
Transcript

Peer-to-peer lending and birth outcomes during national economic
crises: Lessons from Indonesia.
Joseph Kofi Acquah ∗
November 1, 2015
∗I am deeply indebted to Anna Aizer, Andrew Foster, Glenn Loury, Frank Sloan, Emily Oster, JesseShapiro and seminar participants at the Brown University economics department for their useful commentsand suggestions. Address: Department of Economics, Brown University, 64 Waterman St., Providence, RI02912. Contact: joseph [email protected]
1

2
Abstract
National economic crises increase the incidence of low birth weight rates due to credit
constraints that prevent households from effectively smoothing their food consumption. In non-
crises years, evidence shows that peer to peer banking (P2P) schemes extend credit to individuals
that face idiosyncratic income shocks. However, during crises years, there is limited evidence
on the credit extension capabilities of P2P schemes. In this study, I explore the credit extension
capabilities of rotating savings and credit institutions (ROSCAs) during the 1998 Indonesian
financial crises. This study argues that heterogeneity in income shocks and differences in the
marginal utility of consumption, facilitate transfers within P2P schemes during crises. Results
show that in the midst of the 1998 Indonesian financial crisis, ROSCAs modified their structures
to establish and facilitate borrowing within the scheme to members facing economic hardships.
Consequently, mothers that participated in ROSCAs during the crises were able to maintain food
consumption and observed 8.1 percentage points fewer low birth weight babies. Findings suggest
that encouraging mothers to actively participate in peer-to-peer banking schemes in non-crisis
years may provide additional lines of credit that protect food consumption and consequently
child health during crises years.

3
1 Introduction
As national economic crises become more frequent, understanding the capacity of institu-
tions to protect the most vulnerable members of society is a priority for policy makers. For
low-income households, national economic crises which result in large negative deviations
in GDP per capita reduce real household income and consequently food consumption (Al-
derman, 2011). Pregnant women in low-income households are especially vulnerable during
crises, since reductions in food consumption increase the probability of adverse birth out-
comes such as low birth weight. Estimates of increases in low birth weight during economic
crises, range from 1% (Argentina’s 2000 to 2002 economic crisis, (Cruces et al., 2010)) to
33% (Tanzania’s 2008 economic crisis, (Burlando, 2010)) . These statistics demonstrate that
national economic crises have a particularly strong impact on pregnant women.
Increases in low birth weight have long term implications on human capital accumulation
and long term economic growth (Bharadwaj et al., 2010). Using data from Norway’s birth
registry, Black and coauthors demonstrate that increasing birth weight by 10% increases the
probability of high school completion by 0.9% and later-life wages by 1% (Black et al., 2005).
Berhman confirms these findings using data from the Minnesota’s twins registry and shows
that reducing the birth weight gap among developed and developing countries can increase
per worker GDP in developing countries by as much as 9% (Behrman and Rosenzweig, 2004).
Thus, there are clear economic incentives for nations to devote resources to curtailing adverse
birth incomes during national economic crises.
Access to credit markets enable low-income households and pregnant women to smooth
their food consumption during crises (Skoufias, 2003). Unfortunately, among pregnant women
and the poor, collateral requirements at formal banks often exclude the most vulnerable mem-
bers within these groups from borrowing money during crises (Hoogeveen, 2002). Peer to peer
informal banks (P2P), which are increasingly common in the developing world, offer credit
by replacing collateral requirements with social sanctions as a means of enforcing repayment
(Bouman, 1995, 1977). These schemes offer an alternative for low-income households and

4
especially pregnant women to secure credit to smooth food consumption during economic
crises.
Economic models of ROSCA institutions suggests that P2P banking schemes work well
when income shocks are idiosyncratic but less so when income shocks are partially correlated
(Townsend, 1995; Dercon, 2002; Hoogeveen, 2002; Fang and Ke, 2006; Klonner, 2000). In
the case of a homogeneous population with identical preferences, the situation logic is fairly
clear: with uncorrelated income shocks, the supply for credit should outpace demand, and
thus borrowers are able to find peers willing to lend their savings at a reasonable interest rate.
On the other hand, if income shocks are perfectly correlated and aggregate in an economy
with homogeneous agents, lenders will be scarce since all agents in the economy will want to
borrow at the same interest rate. Townsend suggests that these assumptions are too strong
even when one considers a national economic crises (Townsend, 1995). In particular, since
individuals obtain their income from dissimilar sources, income shocks are still idiosyncratic
during national economic crises. In addition, even if income shocks were aggregate differences
in preferences suggest that at a reasonable price (ie interest rates) transfers may occur within
P2P schemes from agents with a low marginal utility of consumption to agents with a high
marginal utility of consumption.
This study provides empirical evidence on the capabilities of P2P banking schemes as
alternative sources of credit during times of national economic crisis, especially for vulnerable
populations, including pregnant women. The relevance of this study is that it is the first
paper to provide empirical evidence on (1), the credit extension capabilities of P2P banking
schemes during national economic crises and (2), the role that P2P banking schemes may
play in curtailing the link between economic crises and adverse birth outcomes.
The 1998 Indonesian financial crisis has features that make it desirable to explore the link
between ROSCA participation and the mitigation of adverse birth outcomes during national
economic crises. First, the sudden and unexpected nature of the 1998 Indonesian financial
crisis and the fact that all provinces in Indonesia were simultaneously impacted means that

5
it was unlikely that women made the decision to have a child or participate in a ROSCA or
immigrate in anticipation of the coming crisis (Iriana and Sjoholm, 2002; Levinsohn et al.,
2003; Sharma, 2001). Second, as in most national economic crises, income shocks differed
by economic sector and at different quantiles of the income distribution (Smith et al., 2002;
Wie, 2000)1 . Thus within a ROSCA, income shocks could be idiosyncratic and thus credit
extensions may have been viable. Third, the Indonesian family life survey (IFLS) was imple-
mented a few months before the onset of the crisis with two follow up surveys post crisis. The
panel feature and timing of the surveys allows this study to address endogenous sorting into
ROSCA by using a novel econometric technique (symmetric weighting difference in difference
method2) to control for differences in observables and time invariant unobservables between
ROSCA and non-ROSCA participants (Sylvain, 2014, 2015). The advantage of using this
method is that it allows for a Roy model where rational actors make optimizing decisions
on ROSCA participation (unobservables that may influence ROSCA participation that are
fixed over time are controlled for). Results from the 1998 Indonesian crisis demonstrates the
link between ROSCA participation and reductions in adverse birth outcomes for vulnerable
pregnant mothers. Study findings show that during the crisis, low birth weight increased by
4.2 percentage points with ROSCA participants experiencing 8.1 percentage points fewer low
birth weight births as compared to non-ROSCA participants. This study demonstrates that
the decrease in incidence of low birth weights for ROSCA participants is a result of ROSCAs
adapting to the crisis and facilitating borrowing within the schemes. Finally, this study
shows that loans obtained from ROSCAs were primarily used to stabilize food consumption
for low-income pregnant mothers, improving birth weights.
The organization of this paper is as follows: Section 2 develops a conceptual model which
predicts that individuals facing hardships and individuals with a high marginal utility of
consumption during crisis should be more likely to receive credit from their peers within
1The decline in wages for example for women from 1997 to 1998 at the 30th, 50th, and 90th quantile whencompared to the 10th quantile were 12.78%, 29.44% and 6.39% respectively (Smith et al., 2002)
2Analysis uses IPTW weights instead of 1 to 1 matching to minimize difference in observables and topreserve sample size.

6
a ROSCA. Section 3 reviews data and sample selection criteria. Section 4 discusses the
identification strategy in this study while section 5 examines background information and
provides sample summary statistics. Section 6 and 7 presents results and robustness checks
respectively, and Section 8 concludes the study.
2 Conceptual Framework
2.1 ROSCA loans in Indonesia
In Indonesia, bidding ROSCAs called the “Arisan call” were first documented in the
1980s (Williams and Johnston, 1983; Prabowo, 1989). The model in this paper focuses on
bidding within a ROSCA institution as a mechanism to secure funds within the organiza-
tion. However, in Indonesia, there are two additional ways in which one can borrow from
a ROSCA. In an Arisan, one member is typically assigned to be the head of the ROSCA.
The head of the group is in charge of ensuring that members pay on time and settles any
disputes within the group. To compensate the head of the group for his Arisan duties, the
head typically receives the common fund first and may initiate short term loans with this
fund throughout the life of the ROSCA (typically to prevent members from defaulting on
their Arisan payments (Bouman, 1995)). In addition, different Arisan variants have been
documented in Indonesia, including Arisans where a portion of the members’ contributions
are used to create an emergency loan fund from which members can borrow (Hospes, 1992).
Regardless of how members borrow from a ROSCA, differences in the elasticity of marginal
utility of consumption (MU), as indicated in the model below, should increase the interest
rate that borrowers are willing to accept on a loan. In negotiating over interest rates on
loans, individuals with higher elasticities of MU should bid higher and all else equal have a
higher probability of securing a loan. The model provided in this paper focuses on bidding
within a ROSCA simply to illustrate this characteristic.

7
2.2 The model
This section provides a simple conceptual framework to model the operation of a bidding
ROSCA. In doing so, it provides a structure that explains the insurance that ROSCA schemes
provide to pregnant women during economic crises. The model modifies the Fang and Ke
model of ROSCA institutions to allow for differences in the marginal utilities of consumption
across agents. (Fang and Ke, 2006). It assumes that social sanctions such as exclusion from
one’a social network, exclusion from future loans or benefits, threats of evil spells, and guilt
are used to ensure repayment as discussed in Hoogevean (Hoogeveen, 2002).
Here, there are two risk averse agents who live for two periods. In each period, an
individual receives risk free income y and income shock ε, where ε is independent across
agents and periods (idiosyncratic) and uniformly distributed with mean µ < 0. The mean
of ε is assumed to be negative since income shocks are generally negative during economic
crises. Each agent participates in a ROSCA institution with a fixed contribution of m in each
period. This implies that in a two-person ROSCA, the total common fund to be disbursed per
meeting is 2m. At each meeting, the ROSCA allocates the common fund through a bidding
process. In period 1, each agent observes her risk-free income and income shocks which are
private information. After observing risk-free total income in period 1, agents submit their
bids. The bid bi , is the amount that agent i is willing to pay to the other agent in order
to obtain the common fund in period 1. The person with the highest bid is allocated the
common fund but is no longer eligible to bid in the subsequent period. The agents make
consumption decisions in period 1 after the bidding process. We solve the model below in the
presence of credit markets that allow individuals to save and borrow from the formal market
system at interest rate r. Income shocks are assumed to occur with probability 1- p (p ≥ 0)
in the economy . The utility function of the two risk-averse agents are
8
u1(c) =1− exp(−λ1c)
λ1
(1)
u2(c) =1− exp(−λ2c)
λ2
(2)
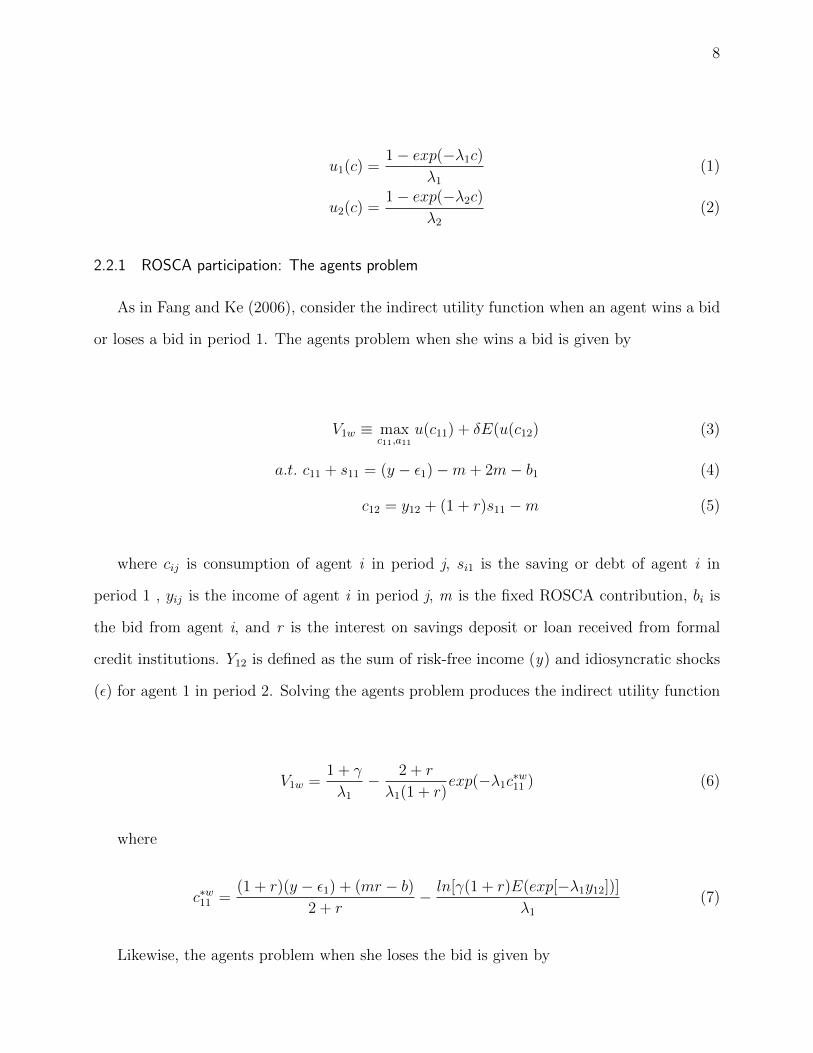
2.2.1 ROSCA participation: The agents problem
As in Fang and Ke (2006), consider the indirect utility function when an agent wins a bid
or loses a bid in period 1. The agents problem when she wins a bid is given by
V1w ≡ maxc11,a11
u(c11) + δE(u(c12) (3)
a.t. c11 + s11 = (y − ε1)−m+ 2m− b1 (4)
c12 = y12 + (1 + r)s11 −m (5)
where cij is consumption of agent i in period j, si1 is the saving or debt of agent i in
period 1 , yij is the income of agent i in period j, m is the fixed ROSCA contribution, bi is
the bid from agent i, and r is the interest on savings deposit or loan received from formal
credit institutions. Y12 is defined as the sum of risk-free income (y) and idiosyncratic shocks
(ε) for agent 1 in period 2. Solving the agents problem produces the indirect utility function
V1w =1 + γ
λ1
− 2 + r
λ1(1 + r)exp(−λ1c
∗w11 ) (6)
where
c∗w11 =(1 + r)(y − ε1) + (mr − b)
2 + r− ln[γ(1 + r)E(exp[−λ1y12])]
λ1
(7)
Likewise, the agents problem when she loses the bid is given by

9
V1l ≡ maxc11,a11
u(c11) + δE(u(c12) (8)
a.t. c11 + s11 = (y − ε1 − γi)−m (9)
c12 = y12 + (1 + r)s11 −m+ 2m+ b2 (10)
Solving for the indirect utility function results in
V1l =1 + γ
λ1
− 2 + r
λ1(1 + r)exp(−λ1c
∗l11) (11)
where
c∗l11 =(1 + r)(y − ε1)− (mr − b)
2 + r− ln[γ(1 + r)E(exp[−λ1y12])]
λ1
(12)
Analogous solutions exists for agent 2 with λ1 replaced with λ2.
2.2.2 Symmetric bayesian nash equilibrium under heterogeneous preferences
Let bi(ε1) > bj(ε2) if ε1 > ε2 for i 6= j. Consider the bidding strategy for agent 1, b1(ε) for
some realized income shock ε > 0. This section uses truth telling requirements to pin down
the equation for the Symmetric Bayesian Nash equilibrium. The expected utility of agent 1
for reporting ε̄1 6= ε1 is
U1(ε1, ε̄1) = pV1w + (1− p){Prob(0 < ε2 <= ε̄1)× V1w + Prob(ε2 > ε̄1)× E[V1l|ε2 > ε̄1]}
(13)
In words, when agent 1 submits ε̄1 he wins the ROSCA fund in the first period if agent
2 does not receive an income shock, which happens with probability p. However if agent 2

10
receives an income shock, which happens with probability 1-p , then agent 1 wins the ROSCA
fund if ε̄1 ≥ ε2 > 0 and loses the ROSCA fund in the first period if ε2 > ε̄1. Since V1l depends
on b2(ε2), agent 1 takes the expected value of his indirect utility function from losing on the
support [ε̄1, z] where z is the maximum income shock one can observe. Truth-telling requires
that
∂U(ε, ε̄)
∂ε̄
∣∣∣∣ε̄=ε
= 0 (14)
Solving the first order conditions, one can show as in Fang and Ke (2006 version: p. 26-27
: seminar publication at wisc.edu) that the Symmetric Bayesian Nash equilibrium bid for
agent 1 and 2 are
b1(ε, λ) = mr +2 + r
2λ1
ln{1− [1− exp(−2λ1mr
2 + r)][
p
p+ (1− p)F (ε)]2} (15)
b2(ε, λ) = mr +2 + r
2λ2
ln{1− [1− exp(−2λ2mr
2 + r)][
p
p+ (1− p)F (ε)]2} (16)
2.2.3 Comparative statics
It is interesting to note what happens to the equilibrium bid in a ROSCA when income
shocks rise (as they often do during an economic crisis). Taking the derivative of the equi-
librium bid with respect to ε for λ > 0, p > 0, r > 0,m > 0 one obtains
∂b(ε)
∂ε=
2 + r
2λ
({1− 1
e2λmr2+r
}[ p
p+ (1− p)F (ε)]2f(ε)
F [ε]2
)/A > 0 (17)

11
where A ≡ 1− [1− exp(−2λ2mr2+r
)][ pp+(1−p)F (ε)
]2 > 0 .
The positive partial derivative of the equilibrium bid with respect to ε suggest that during
an economic crisis, individuals who realize larger incomes shocks should bid higher within
a ROSCA and -all else being equal-, secure funds in the current period to smooth their
consumption.
Given income shocks that are aggregate (similar income shock realizations), it may also
be interesting to compare how the equilibrium bid changes with respect to the elasticity of
marginal utility of consumption (u′′(c)cu′(c)
).
Theorem 2.1. Let λ1λ2> lnA(λ1)
lnA(λ2)then b1(ε, λ1) > b2(ε, λ2) where A[λi] ≡ 1−[1−exp(−2λimr
2+r)][ p
p+(1−p)F (ε)]2
Proof. Since lnA(λ) < 0 for all λ > 0 we have from the hypothesis that lnA(λ1)λ1
> lnA(λ2)λ2
.
Multiplying both sides by 2+r2> 0 and adding mr > 0 to the left and right hand side of the
equation we have that mr + 2+r2λ1
lnA(λ1) > mr + 2+r2λ2
lnA(λ2) which implies that b1(ε, λ1) >
b2(ε, λ2)
With no loss of generality, consider 2 agents in a ROSCA with identical consumption
levels3 (c1 = c2 = c). The hypothesis in theorem 2.1 can then be rewritten as λ1clnA(λ1)
> λ2clnA(λ2)
.
The above theorem argues that in making a bid, an agent considers how the bid increases his
marginal utility of consumption (elasticity of marginal utility of consumption is λc) and the
price she has to incur for the bid (lnA(λ) 4). If the gain in marginal utility of consumption
for a bid relative to its price for agent 1 exceeds that of agent 2 then agent 1 will have the
highest bid. In an oral auction, all else equal, an agent with a high elasticity of marginal
utility of consumption (λc) will win the ROSCA fund in period 1 5.
3One can argue that individuals within a ROSCA are homogeneous and have similar consumption levels.4Note that as lnA(λ) decreases, the interest rates within a ROSCA approach those of the formal sector
which is given by mr5If consumption levels are not identical then one obtains ( c2c1 ) λ1c1
lnA(λ1)> λ2c2
lnA(λ2)which simply states that
if c1 < c2 it is more likely for agent 1 to have the highest bid since her gain in the marginal utility ofconsumption for a bid relative to its price is upweighted by the fraction c2
c1(The consumption level also
matters in determining who has the highest bid).

12
2.3 Implications of the model
The results above have implications for this study in understanding how ROSCAs allocate
the common fund during national economic crises. The model suggests that all else equal
agents with higher elasticities of marginal utilities of consumption (MU) are more likely to
secure the ROSCA fund even if income shocks are aggregate among members. The model
predicts that pregnant women who have a higher MU elasticity -either through a preference
change during pregnancy or an income shock from withdrawal from the labor market- should
bid higher than their peers to secure the pooled ROSCA contribution, which can then be
used to smooth their consumption. ROSCAs that facilitate borrowing within the scheme
therefore provide consumption protection for pregnant women since higher MU elasticities
during pregnancy can be revealed through a higher bidding price or interest rate. The
predictions of this model call for empirical analysis to determine if it holds true in an actual
case study.
3 Data and Sample Selection
3.1 Data
The data for this study comes from the Indonesia Family Life Survey (IFLS) which is a
representative longitudinal study of the Indonesian population 6. The survey has a wealth of
information on socioeconomic, demographic, and community characteristics. The waves of
the survey that are used in this study are IFLS 2, 3 and 4 which, were implemented in 1997,
2000, and 2007, respectively.
There are two main advantages of using this survey : first, the 1997 IFLS was initiated in
Indonesia from June to November 1997, before the sudden onset of the economic crisis. As a
result, this wave of the survey provides baseline information about individual and community
characteristics, as well as ROSCA participation leading up to the January 1998 crisis. Second,
6The survey with weights represents 83% of the Indonesian population

13
the IFLS is a longitudinal study with an impressively low attrition rate (an average attrition
of about 6% from 1993 to 2007). Consequently, this survey allows for one to assess the
dynamics of ROSCA institutions during the 1998 Indonesian financial crisis and plays an
essential role in explaining the empirical results found in this study.
3.2 Sample selection and outcomes
The sample for this study consists of women aged 15 years and over who completed the
1997 Indonesian Family Life Survey (IFLS2). Women without anthropometric information
were excluded from this study 7. In addition, to ensure data quality, women who gave birth
at locations where birth weight measurements were of low frequency (< 100) were excluded
from the analysis. The final sample consists of 3,800 births from 1995 to 2006. 8
The three main outcomes analyzed in this study are birth weight, food consumption
expenditure and ROSCA loans initiated during the 1998 Indonesian financial crisis. These
outcomes provide consistent evidence for the role of ROSCA institutions in preventing adverse
birth outcomes during the 1998 Indonesian financial crises.
4 Identification issues and strategy
There are two potential challenges to the identification of the causal impact of ROSCA
participation in mitigating adverse birth outcomes during the 1998 Indonesian financial crisis.
First, it could be argued that, in anticipation of the crisis, women may have delayed preg-
nancy. If so, then differences in birth outcomes observed during the crisis may be attributable
to changes in parent characteristics and not the causal impact of the 1998 Indonesian financial
crises. Since the onset and magnitude of the 1998 Indonesian financial crisis were unexpected
and unprecedented, this is unlikely to be the case. To test for endogenous fertility or sorting
7Birthweight, birth month and birth year.8Robustness checks show that including births in locations where measuring birth weight was not the
norm does not change the results of this study

14
into birth, one can search for significant deviations in mothers’ characteristics during the cri-
sis. Insignificant deviations in mothers’ characteristics provide evidence against endogenous
fertility. The econometric model below is estimated.
Yi = β0 + β1Y OB1998i + F (Y OBi, θ) + εi (18)
In equation 18, i denotes an individual, Y is the outcome of interest (mothers’ socioe-
conomic and household characteristics), Y OB1998 is a dummy for the cohorts born in 1998,
F (Y OB, θ) is a polynomial in year of birth that controls for cohort trends and, ε is the error
term. In equation 18, β1 is the coefficient of interest, since it estimates the deviation in the
outcome variable from trend in 1998 (crisis year). Estimates for B1 are relevant for assessing
deviations in parental characteristics and birth outcomes during the 1998 Indonesian financial
crisis.
The second challenge to the identification strategy is that people who participate in
ROSCAs may be fundamentally different than those who do not participate in a ROSCA. If
ROSCA participation is endogenous, this will bias results. To address endogeneity in ROSCA
participation, this study utilizes a symmetric weighting difference in difference method to
reduce differences in observables and to control for time invariant unobservables between
ROSCA and non-ROSCA participants (Sylvain, 2014, 2015) 9). This approach entails 4
steps as detailed below.
First, propensity scores for ROSCA participation are estimated for each individual in
the sample using the covariate balancing propensity score method (Imai et al., 2014). The
covariate balancing propensity score method models treatment assignment while optimizing
covariate balance using a general method of moments framework. The covariate balancing
propensity score method, as shown by Imai and Ratkovic, is robust to model misspecification,
9A symmetric weighting difference in difference (SWDID) method creates a synthetic sample where co-variates in the sample are independent of ROSCA participation. A symmetric matching difference in differ-ence(SMDID) method on the other hand , matches each treated individual to a set of controls. The SWDIDmethod is preferred in this study since all participants in the sample are used in the analysis while the SMDIDdiscards individuals for which a match from the control set cannot be found.
15
prevents adhoc searches and improves the poor empirical performance of propensity score
matching and weighting methods reported in the literature. The choice of variables used in
the propensity score are selected after a literature review of covariates that differ between
ROSCA and non-ROSCA participants (Varadharajan, 2004). The covariates identified are
age, household size, occupational choices (farmers or business owners), wealth, education,
location of households and baseline access to formal and informal financial schemes. These
covariates are used to predict the probability of ROSCA participation for all individuals in
the sample using the covariate balancing propensity score method.
Second, the propensity scores are used to weight the sample to ensure that the distribution
of covariates in the sample are independent of ROSCA participation (the treatment group).
To obtain average treatment effects on the treated, non-ROSCA participants received a weight
of p1−p where p is the estimated propensity score from the covariate balancing propensity
score method. ROSCA participants received a weight of 1. The weights for non-ROSCA
participants were normalized to sum to 1 to reduce the influence of propensity scores that
are outliers (Austin, 2011).
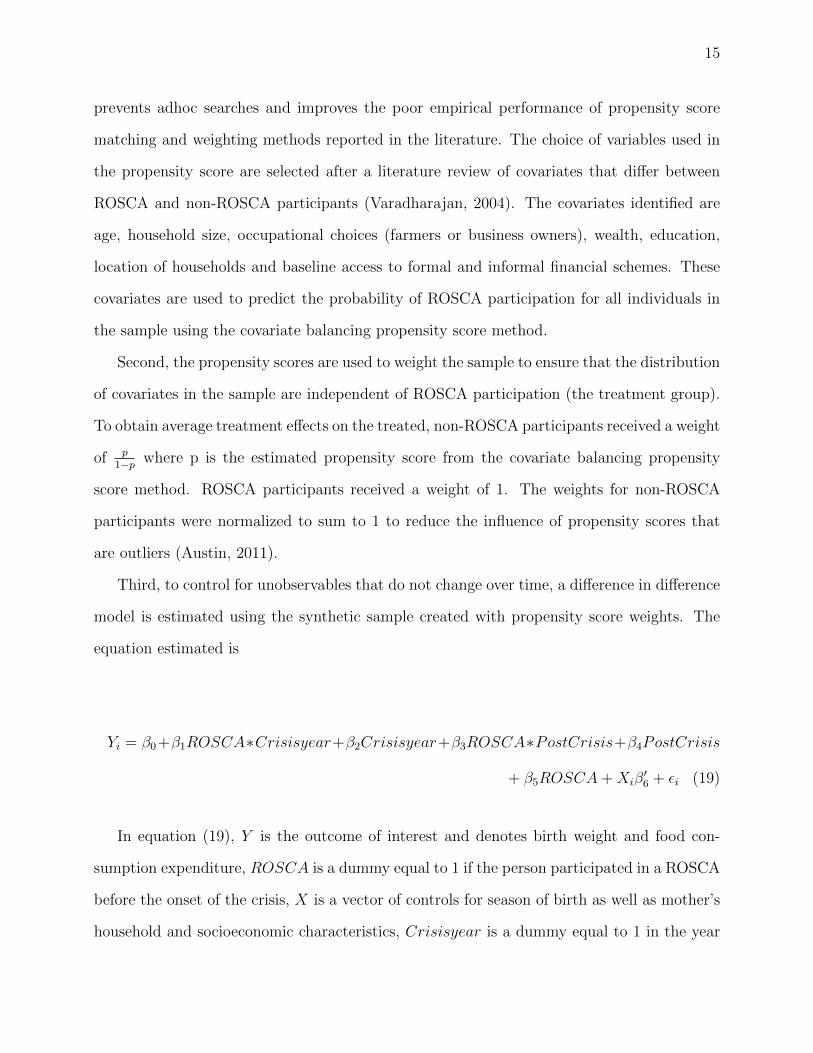
Third, to control for unobservables that do not change over time, a difference in difference
model is estimated using the synthetic sample created with propensity score weights. The
equation estimated is
Yi = β0+β1ROSCA∗Crisisyear+β2Crisisyear+β3ROSCA∗PostCrisis+β4PostCrisis
+ β5ROSCA+Xiβ′6 + εi (19)
In equation (19), Y is the outcome of interest and denotes birth weight and food con-
sumption expenditure, ROSCA is a dummy equal to 1 if the person participated in a ROSCA
before the onset of the crisis, X is a vector of controls for season of birth as well as mother’s
household and socioeconomic characteristics, Crisisyear is a dummy equal to 1 in the year

16
of the crisis (1998) , PostCrisis is a dummy equal to 1 in the year after the crisis (1999)
and ε is the error term. Observations are restricted to 24 months before and after the crisis.
Note that β1 is an intent to treat estimate since some ROSCA participants in 1997 may no
longer have been active in 1998. The intent to treat framework is suitable in this context,
since it minimizes endogenous sorting in and out of ROSCA during the crisis.
Finally, to account for unobservables that may impact the treatment and outcome vari-
able simultaneously, Rosenbaum bounds for B1 are calculated to determine how strongly an
unmeasured variable must influence the selection process to undermine the analysis (Becker
and Caliendo, 2007). Results from this exercise show that observables in the IFLS survey do
not have a strong enough effect on treatment to alter the implications/results of this study.
5 Sample summary and background
During the 1998 Indonesian financial crisis, the rupiah exchange rate fell dramatically,
causing inflation to rise to unprecedented levels. Figure 1 plots year over year data from the
St. Louis Federal Reserve on the Indonesian economy over time, based on data from the St.
Louis Federal Reserve. The trend line shows a sharp decline in the real broad exchange rate
from 104.68 to 51, and shows a 83.9% and 52.16% increase in the inflation rates of food and
non-food commodities, respectively. The relative increase in the prices of food suggests that,
as with other crises, expectant mothers’ food consumption may have been compromised.
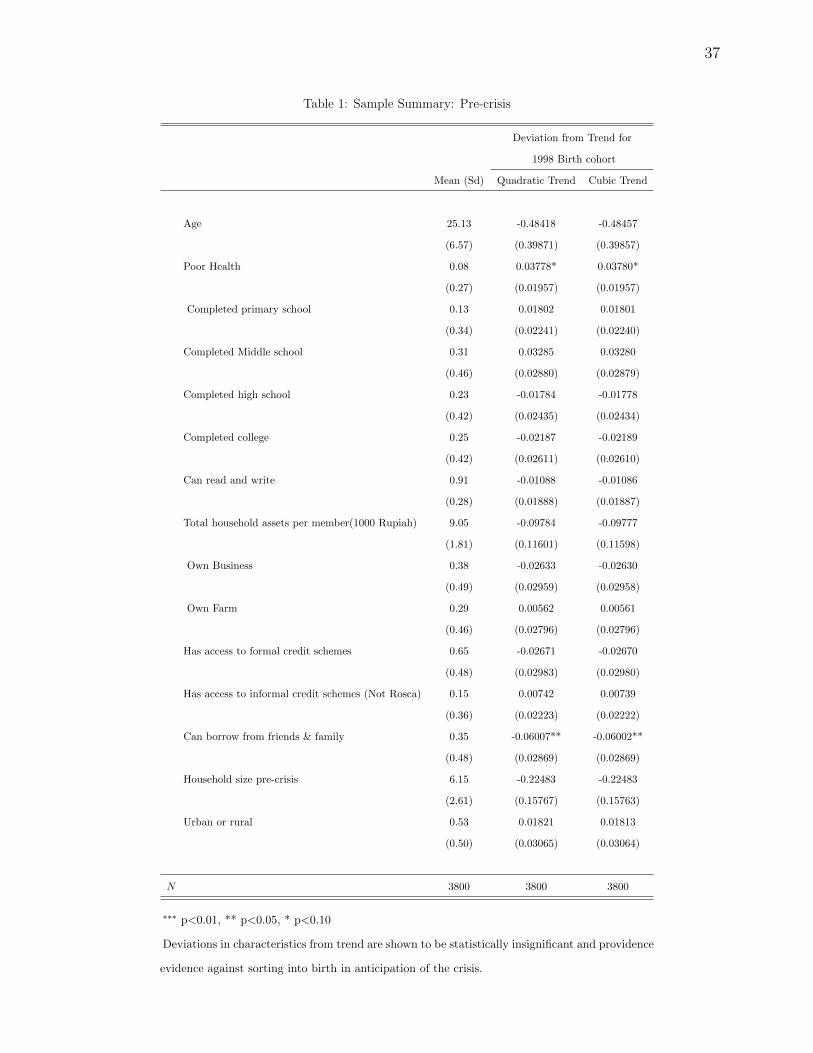
Summary statistics for the study sample are provided in Table 1. Women in the sample
are on average 25 years of age, with 8% in poor health and 91% confirming that they can
read and write. On average, each household has about 6 members with each member owning
assets worth 9,050 rupiah. Households in the sample have diverse occupations with 38%
owning a side business and 29% owning a farm. Among the sample group, 53% of households
are situated in an urban area. Finally, 65% of households have access to a formal credit
scheme, while 15% had access to an informal credit scheme. Social networks also proved
to be an important source of loans: 35% of women in the survey reported that they could
17
borrow funds from family or friends. Columns 2 and 3 of Table 1, tests for deviations in
mother and household characteristics for the 1998 birth cohort as detailed in Equation (18).
Results show that 13 out of 15 variables are statistically insignificant and with the existing
literature, provides additional evidence that the crisis was unexpected (Iriana and Sjoholm,
2002; Levinsohn et al., 2003; Sharma, 2001). These results provides direct evidence against
the hypothesis that women selectively sorted into child birth during the crisis. To assess
significant deviations in low birth weight, variables listed in table 1 are used as controls in
this study.
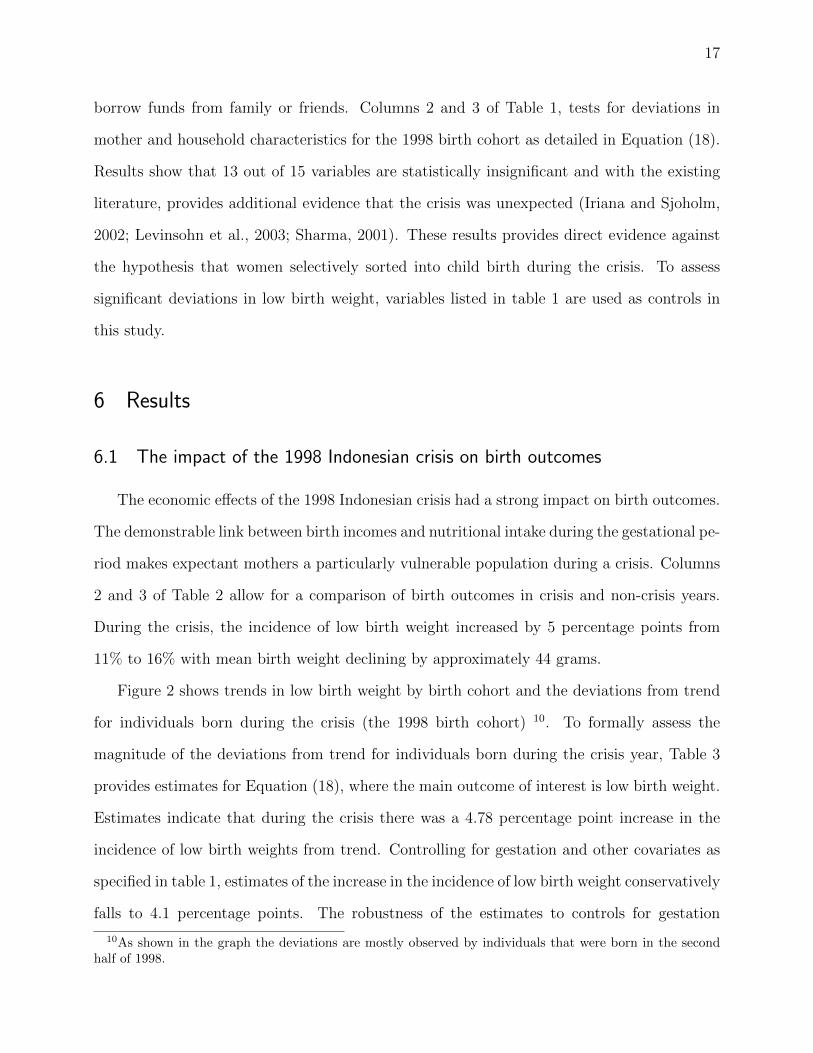
6 Results
6.1 The impact of the 1998 Indonesian crisis on birth outcomes
The economic effects of the 1998 Indonesian crisis had a strong impact on birth outcomes.
The demonstrable link between birth incomes and nutritional intake during the gestational pe-
riod makes expectant mothers a particularly vulnerable population during a crisis. Columns
2 and 3 of Table 2 allow for a comparison of birth outcomes in crisis and non-crisis years.
During the crisis, the incidence of low birth weight increased by 5 percentage points from
11% to 16% with mean birth weight declining by approximately 44 grams.
Figure 2 shows trends in low birth weight by birth cohort and the deviations from trend
for individuals born during the crisis (the 1998 birth cohort) 10. To formally assess the
magnitude of the deviations from trend for individuals born during the crisis year, Table 3
provides estimates for Equation (18), where the main outcome of interest is low birth weight.
Estimates indicate that during the crisis there was a 4.78 percentage point increase in the
incidence of low birth weights from trend. Controlling for gestation and other covariates as
specified in table 1, estimates of the increase in the incidence of low birth weight conservatively
falls to 4.1 percentage points. The robustness of the estimates to controls for gestation
10As shown in the graph the deviations are mostly observed by individuals that were born in the secondhalf of 1998.

18
suggest that regardless of gestational length fetal growth was restricted. Health studies
demonstrate that restrictions in fetal growth are related to the mother’s nutritional intake
during pregnancy (Kelly, 2011). Thus, the robustness of the estimates to gestational length
provides direct evidence that reductions in mothers’ food consumption is a major factor
explaining the increase in low birth weight during the crisis year.
Panel B of Table 3 provides a breakdown of the increase in the incidence of low birth
weight by time of year for individuals who were born in 1998. Columns 1 through 3 illustrate
that the greatest increase in low birth weight during the crisis were for individuals born in the
second half of 1998. This observation is attributable to the fact that individuals born during
the second half of 1998 were in their 2nd or 3rd trimester at the height of the Indonesia crisis.
During this period, a fetus is the most sensitive to nutritional intake. Reductions in mean
birth weight, unlike low birth weight, were statistically not significant, suggesting that the
greatest impact of the crisis was to increase the left tail of the birth weight distribution. In
particular, by shifting women whose children were on the margin of low birth weight (low
income mothers) into low birth weight 11.
To assess the role of prenatal investments in explaining the rise in adverse birth outcomes
during the crisis, deviations in prenatal care from trend for the 1998 birth cohort are estimated
in Table 4. These estimates show no significant reductions in prenatal care during the crisis.
This is likely due to the fact that prices at community clinics (puskesmas and pustu) remained
low during the crises (Strauss et al., 2004).
To summarize, for the 1998 birth cohort, the Indonesian financial crisis increased the
fraction of low birth weight babies by 4.1 percentage points. The primary cause of this
increase is shown to be mother’s food consumption, rather than prenatal care.
11Insignificant results on birth weight could simply reflect the fact that the sample is underpowered. Notethat birth weight consistently decreases during the crises.

19
6.2 Descriptive: Evolution of credit schemes within ROSCAs to protect food
consumption during the crisis
Pre-crisis, as shown in Table 5, 45% of women in the sample were participating in a
ROSCA and expected an average payout of $144.61 every 16 months. Members met on aver-
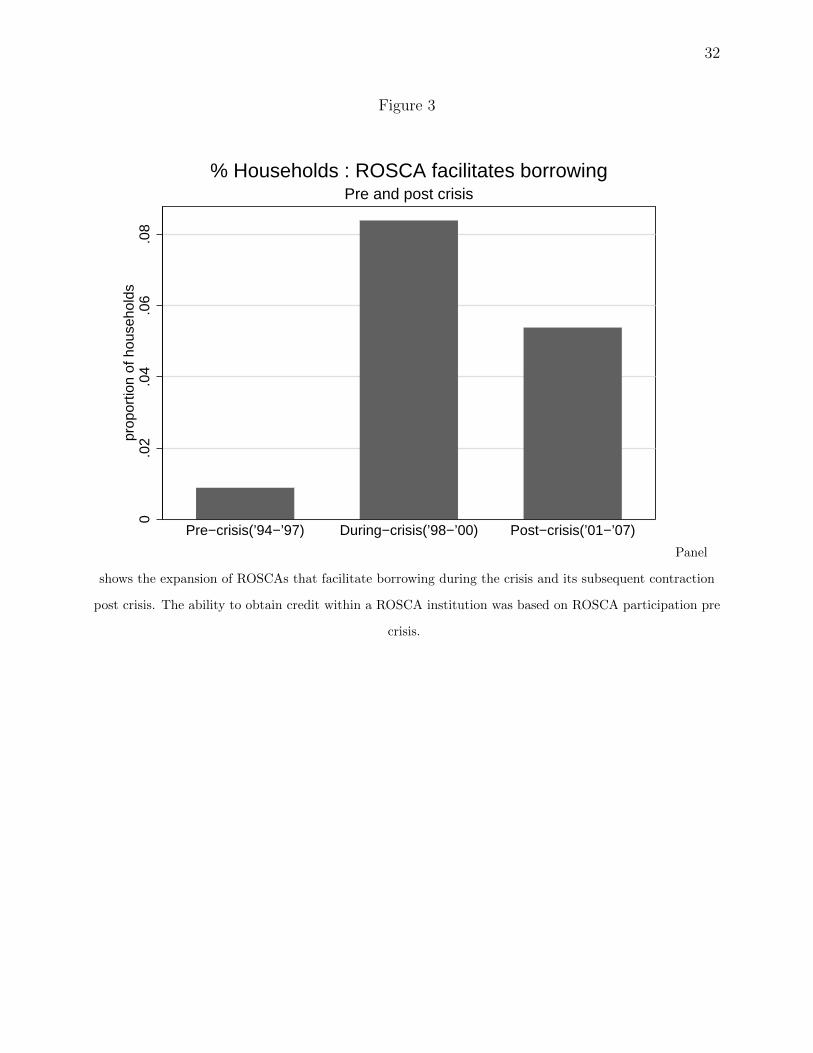
age every 3 weeks and paid $7.17 to the common fund at each meeting. Figure 3 shows that
ROSCAs modified their structures to establish and facilitate borrowing within the scheme to
members during the crisis. This result emphasizes that ROSCAs are dynamic and adaptable
institutions. Table 6 confirms the expansion of credit lines by ROSCAs during the financial
crisis based on the IFLS survey. Pre-crisis (1993 to 1997), only 1% of households reported
that they could borrow from a ROSCA. During the crisis (1997 to 2000), this number in-
creased to 8.4%. In the 12 months prior to the 2000 IFLS survey, the average amount loaned
to ROSCA participants was $49 for 5.8 months with a 3.2% monthly interest rate. Of the
ROSCA loans, 84% were of fixed length and 99% of the loans were made collateral-free.
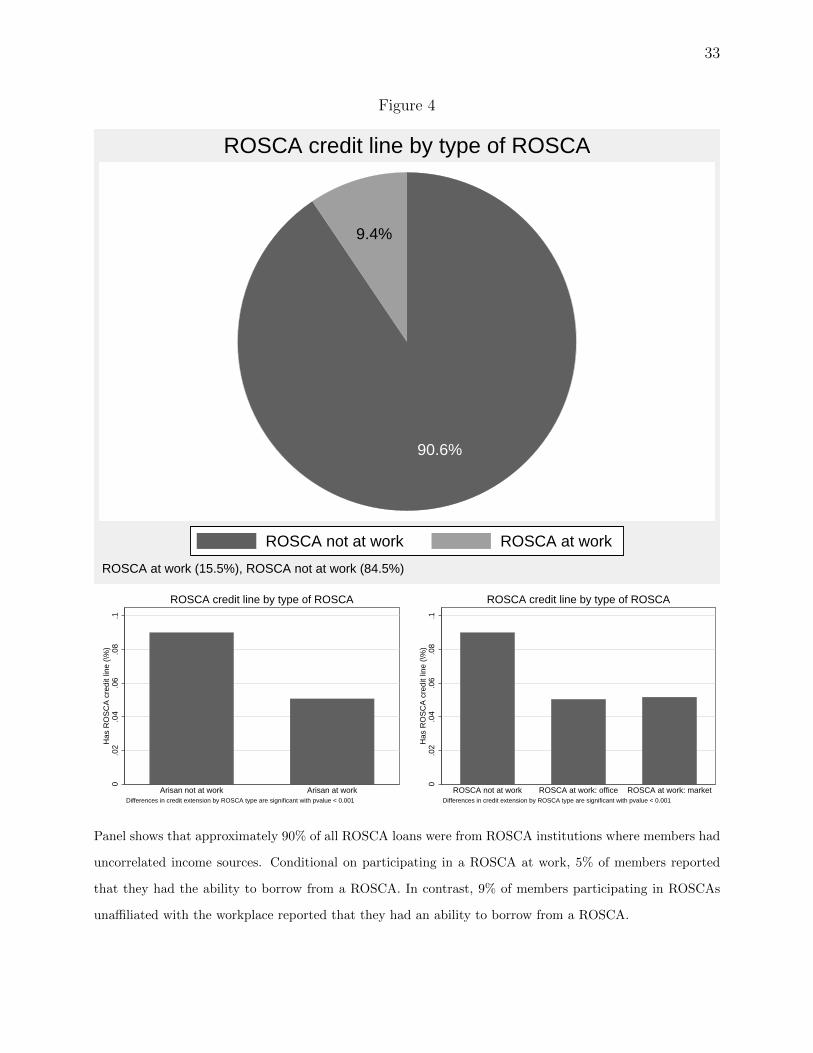
The large expansion of credit occurred within ROSCA institutions where members had
uncorrelated income sources (not an office/work ROSCA) as shown in figure 4. The panel
shows that approximately 90% of all ROSCA loans were from ROSCA institutions where
members had uncorrelated income sources. Conditional on participating in a ROSCA at
work, 5% of members reported that they had the ability to borrow from a ROSCA. In
contrast, 9% of members participating in ROSCAs unaffiliated with the workplace reported
that they had an ability to borrow from a ROSCA. These results indicate that participating
in a ROSCA where members have uncorrelated income sources and where income shocks
were likely to be idiosyncratic increased the odds of a ROSCA facilitating borrowing during
the crisis by a factor of 2.
Finally, ROSCA loans during the crisis played an important role in smoothing food con-
sumption. Existing literature indicate that ROSCA funds are used to purchase durables.
Hoever table 7 shows that 12 months preceding the 2000 IFLS survey approximately 45%
of ROSCA loans were used to purchase necessary groceries during the crisis. The next four

20
frequent categories were education at 16.6%, capital for other business at 9.96%, purchase of
household items at 6.64% and farm inputs at 4.56%. These top five categories represented
80% of survey responses and indicate a shift in the use of ROSCA funds during the crisis.
Information on the use of ROSCA loans were obtained from individuals who participated
in ROSCA and necessarily borrowed from it. This ignores in-kind food transfers that may
have also occurred within ROSCAs. To understand the overall impact of participating in a
ROSCA on food consumption via loans and in-kind transfers, table 8 provides difference in
differences estimates comparing real food expenditure per capita by ROSCA participation pre
and during crisis 12. Estimates show that pre-crisis (1993 to 1997) no differences in changes
in real food expenditures are observed for households that participated in ROSCAs in 1997 as
compared to households that did not. However, through the crisis (1997 to 2000), higher real
food expenditure per capita of 1102.6 Rupiah is observed for individuals that participated in
ROSCAs in 1997.
To summarize, ROSCAs adapted and facilitated borrowing during the crisis which was
used primarily to smooth food consumption. ROSCAs where members had uncorrelated
income sources were 2 times more likely to extend credit as compared to ROSCAs where
members had uncorrelated income sources. The next section investigates the advantages of
this protection in reducing adverse birth outcomes as proxied by low birth weight.
6.3 ROSCA participation and birth outcomes during crisis
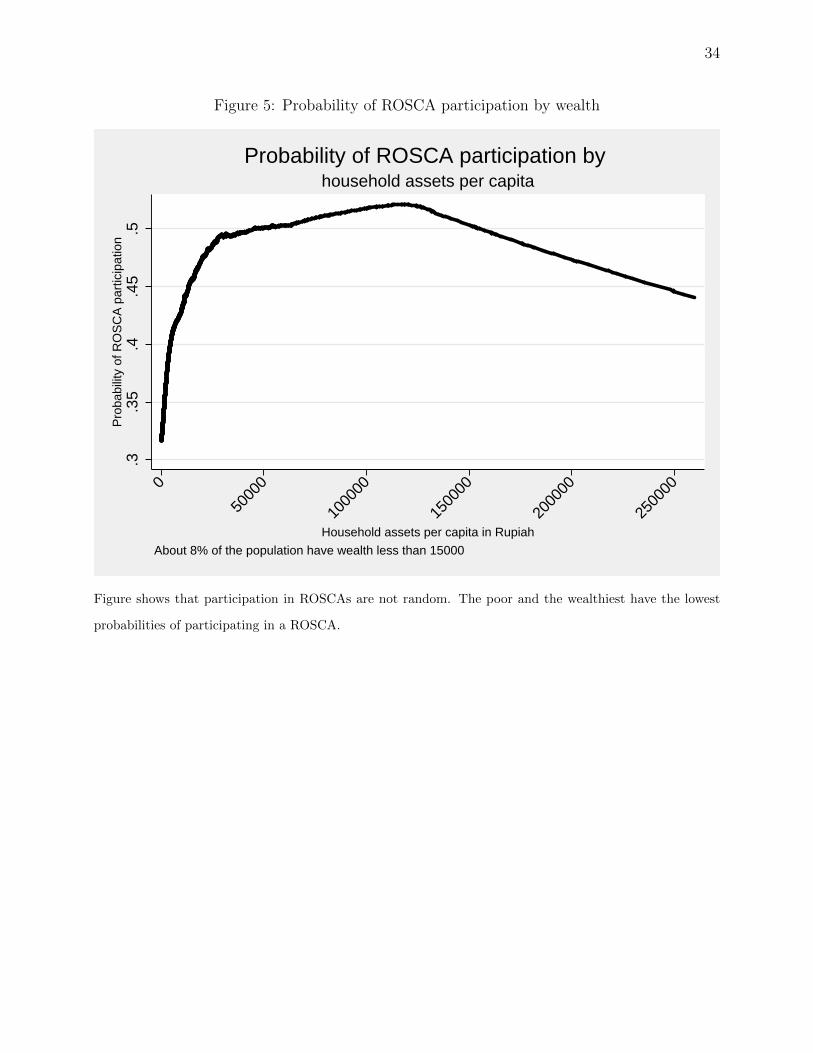
ROSCA participation is likely to be endogenous. Figure 5 shows that the extremely poor
and wealthy have lower probabilities of participating in a ROSCA. Thus, it is not possible
in this study to simply draw causal inference from a simple comparison of outcomes between
ROSCA and non-ROSCA participants. To address non-random sorting into ROSCA, propen-
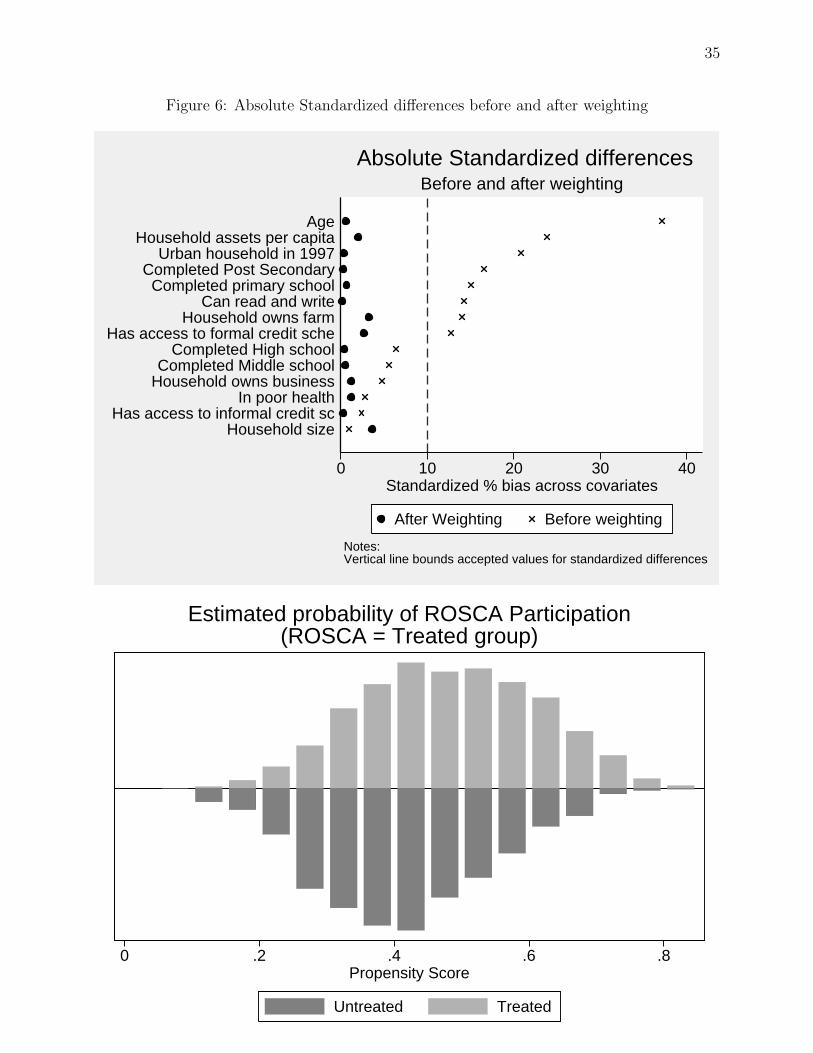
sity score weights are constructed (see Section 4 for details). Once the sample is weighted
with inverse probability weights, as shown in Figure 6, the differences in covariates between
12Real food expenditure was adjusted used CPI information at the province level. Adjusting for real foodexpenditure using average levels of prices in a province circumvents the problems of endogenous prices.
21
ROSCA and non-ROSCA participants are no longer significant (standardized differences are
below the 10% threshold). Table 9 provides further information on the weighted sample
by providing the means and standardized differences before and after inverse probability
weighting.
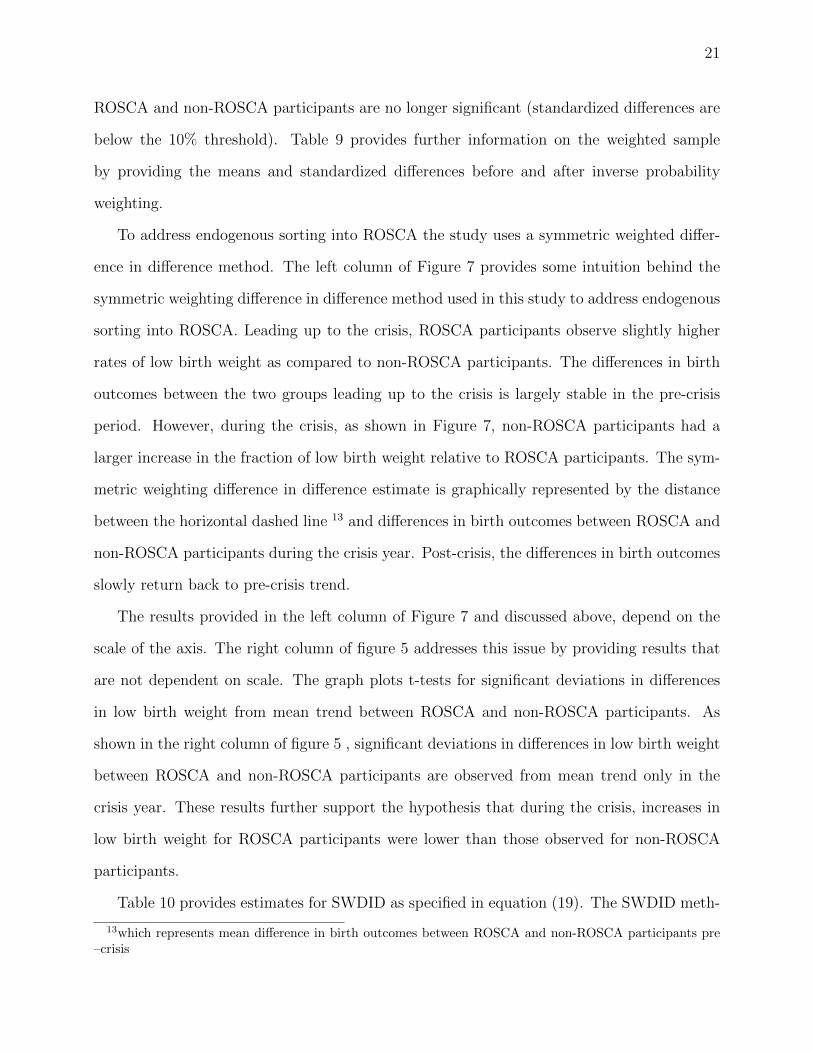
To address endogenous sorting into ROSCA the study uses a symmetric weighted differ-
ence in difference method. The left column of Figure 7 provides some intuition behind the
symmetric weighting difference in difference method used in this study to address endogenous
sorting into ROSCA. Leading up to the crisis, ROSCA participants observe slightly higher
rates of low birth weight as compared to non-ROSCA participants. The differences in birth
outcomes between the two groups leading up to the crisis is largely stable in the pre-crisis
period. However, during the crisis, as shown in Figure 7, non-ROSCA participants had a
larger increase in the fraction of low birth weight relative to ROSCA participants. The sym-
metric weighting difference in difference estimate is graphically represented by the distance
between the horizontal dashed line 13 and differences in birth outcomes between ROSCA and
non-ROSCA participants during the crisis year. Post-crisis, the differences in birth outcomes
slowly return back to pre-crisis trend.
The results provided in the left column of Figure 7 and discussed above, depend on the
scale of the axis. The right column of figure 5 addresses this issue by providing results that
are not dependent on scale. The graph plots t-tests for significant deviations in differences
in low birth weight from mean trend between ROSCA and non-ROSCA participants. As
shown in the right column of figure 5 , significant deviations in differences in low birth weight
between ROSCA and non-ROSCA participants are observed from mean trend only in the
crisis year. These results further support the hypothesis that during the crisis, increases in
low birth weight for ROSCA participants were lower than those observed for non-ROSCA
participants.
Table 10 provides estimates for SWDID as specified in equation (19). The SWDID meth-
13which represents mean difference in birth outcomes between ROSCA and non-ROSCA participants pre–crisis

22
ods is applied 12 and 24 months before and after the crisis. The most conservative estimates
show that ROSCA participants had 8.1 percentage points fewer low birth weight babies as
compared to non-ROSCA participants. The estimates are robust to controls for gestation
and suggest that reductions in food consumption during the crisis year are likely to be a
major factor explaining the differences in birth outcomes between ROSCA and non-ROSCA
participants. It is important to note that the estimates above do not imply that ROSCA
participants were totally insulated from the crisis. In general, estimates suggest that the
crisis increased the rates of low birth weight for ROSCA participants by 1 percentage point
during the crisis year. Rather, this study emphasizes that this small increase in incidences
of low birth weights is smaller for ROSCA participants than for non-ROSCA participants,
illuminating the comparative benefits of alternative lending for expectant mothers without
access to credit from financial institutions.
7 Robustness checks
So far, the results of this study have focused entirely on outcomes in the year 1998.
Replicating the analysis of this study using non-crisis years did not yield significant deviations
in low birth weight from trend. The fact that low birth weight did not increase in 1999 may
be surprising. As shown in Strauss (20004), this can be explained by household adjustments
which largely mitigated the effects of the crisis in the medium term (Strauss et al., 2004).
Propensity scores in this study were estimated using the covariate balancing propensity
score model, since this method is robust to model misspecification (Imai , 2014). The final
robustness check replicates the main results in this study by using a simple logit model to
estimate the propensity of ROSCA participation while ensuring that mean propensity scores
and covariates among treated groups are balanced within sample blocks 14(Garrido et al.,
2014). Results are similar across methods.
To ensure data quality, women who gave birth in locations where birth weight measure-
14Using the 10% acceptable threshold for standardized differences as measure of balance
23
ments were of low frequency (< 100) were excluded from the analysis. Including these women,
the analysis was repeated, which resulted in similar estimates with larger standard errors.
Finally, Rosenbaum bounds for B1 were calculated to determine how strongly an un-
measured variable must influence the selection process to undermine the implications of the
analysis. The calculated bounds show that the study is insensitive to an omitted variable
that would increase the the odds of ROSCA participation by 30%. Using a hypothetical
individual with mean set of covariates across treatment and controls none of the observables
in the dataset satisfied this criteria (for an individual with mean levels of covariates, age
increases the odds of ROSCA participation by the largest amount which is 13%) , confirming
the robustness of the study estimates.
8 Discussion and conclusion
This study determines that ROSCA participants had 8.1 percentage points fewer low
birth weights as compared to non-ROSCA participants during the 1998 Indonesian financial
crisis. The lower rates of low birth weight amongst ROSCA participants are related to the
expansion of ROSCA loans during the crisis. ROSCA loans helped members to maintain
food consumption, as evidenced by the fact that 45% of ROSCA loans were used to purchase
groceries. This paper argues that if pregnancy increases the elasticity of the marginal utility
of consumption, then pregnant women should be more likely to secure ROSCA funds, since
they are willing to incur higher interest rates to borrow funds from ROSCA institutions in
order to maintain consumption. The lower incidence of low birth weight among ROSCA
participants as compared to non-ROSCA participants provides empirical evidence for this
hypothesis.
Economists have verified that adverse birth outcomes rise during national economic crises
(Alderman, 2011). Understanding the capacity of institutions to protect birth outcomes
during national economic crises has been and continues to be a priority for policy makers
(Skoufias, 2003). In the US, Medicaid, Food stamps and Supplemental Feeding Programs
24
for Women, Infants, and Children (WIC) have been shown to protect birth outcomes for the
most vulnerable members during national economic crises (Almond and Currie, 2011). On
the other hand, in developing countries, there is limited empirical evidence on the types of
institutions that can protect birth outcomes during periods of crisis. This paper is the first to
confirm that credit extensions from ROSCA institutions, which are ubiquitous in developing
countries, can help pregnant women maintain their food consumption and thus protect birth
outcomes during national economic crises.
Peer to peer banking schemes during national economic crises face an enforcement prob-
lem, since borrowers are more likely to default on their credit payments. Demanding collateral
alleviates the enforcement problem, however this requirement often excludes individuals in
greatest need of loans. As a type of P2P banking scheme, ROSCAs are of particular interest
since they rely on social sanctions, rather than collateral to prevent payment defaults. Dur-
ing the 1998 Indonesian financial crisis, the fact that 99% of ROSCA loans were issued free
of collateral suggests that such schemes can be an alternative source of credit to individuals
who are credit constrained during economic crises as a result of collateral requirements. In
addition, the fact that ROSCA participation in Indonesia was immutable during the crisis
emphasizes the ability of social capital to not only sustain these schemes during national
economic crisis but also to facilitate credit extensions 15.
Existing studies demonstrate the sustainability of some informal insurance arrangements
through credit extensions, when income shocks are correlated as in economic crisis. For
instance, Platteau and Abraham, document regular credit transactions among fisherman in
a South Indian village to insure themselves from low proceed realizations, which are often
partially correlated (Platteau and Abraham, 1987). In South Africa, Carter and Maluccio
show that communities with larger social capital are better able to sustain informal insurance
arrangements and offer credit extensions when income shocks are partially correlated at the
community level (Carter and Maluccio, 2003). The findings of the present study confirm
15Repayment of ROSCA loans are similar to those from formal banks and emphasizes the viability andpotential of using social sanctions to expand credit lines within peer to peer banking schemes

25
these local and regional findings at a national level, showing that ROSCAs have the capacity
to provide informal insurance during national economic crises.
Existing economics literature provides four main reasons for the formation of a ROSCA.
The reasons are to finance the purchase of indivisible durable goods (Besley at al. , 1993) , to
commit to save (Dagnelie and Lemay-Boucher, 2012, Ambec and Triech, 2007, Aliber,2001,
Gugerty, 2007), to protect savings against claims from kin (Dupas and Robinson, 2009, An-
derson and Baland, 2002), and as an insurance mechanism for unexpected events (Calomris
and Rajaraman, 1998, Fang and Ke, 2006, Klonner, 200). The expansion of credit lines
during the 1998 Indonesian financial crisis observed during the study confirms informal risk
arrangements within ROSCAs which are not easily observable in non-crisis years and empha-
sizes the importance of recognizing these institutions as flexible entities that serve multiple
roles.
To generalize the study findings, it will be important for future research to elucidate the
level of social capital required for P2P banking schemes to be sustainable during national
economic crises. The ability to replicate the success of ROSCA institutions during the 1998
Indonesian crisis in other countries, where social capital may be depleted, will require a
detailed model on how the design of such institutions can minimize its reliance on social
capital. The presence of ROSCAs globally, indicates that policies to bolster these institutions
in collaboration with other government programs 16 may be a powerful and cost effective way
of protecting pregnant women in developing countries during national economic crises.
16Other government programs are still needed since the absolute poor are still excluded from participatingin ROSCA institutions due to regular fixed payments required for membership

26
References
Alderman, Harold, “No Small Matter: Human Development Perspectives,” World Bank
Publications, 2011.
Almond, Douglas and Janet Currie, “Killing me softly: The fetal origins hypothesis,”
The journal of economic perspectives: a journal of the American Economic Association,
2011, 25 (3), 153.
Austin, Peter C., “An introduction to propensity score methods for reducing the effects
of confounding in observational studies,” Multivariate behavioral research, 2011, 46 (3),
399–424.
Becker, Sascha O and Marco Caliendo, “Mhbounds-sensitivity analysis for average
treatment effects,” 2007.
Behrman, Jere R and Mark R Rosenzweig, “Returns to birthweight,” Review of Eco-
nomics and statistics, 2004, 86 (2), 586–601.
Bharadwaj, Prashant, Juan Eberhard, and Christopher Neilson, “Do initial endow-
ments matter only initially? the persistent effect of birth weight on school achievement,”
Department of Economics, UCSD, 2010.
Black, Sandra E, Paul J Devereux, and Kjell Salvanes, “From the cradle to the labor
market? The effect of birth weight on adult outcomes,” Technical Report, National Bureau
of Economic Research 2005.
Bouman, Frits JA, “Rotating and accumulating savings and credit associations: A devel-
opment perspective,” World development, 1995, 23 (3), 371–384.
Bouman, Fritz JA, “INDIGENOUS SAVINGS AND CREDIT SOCIETIES IN THE
THIRD WORLD. A MESSAGE/UN ENSEIGNEMENT: LES SOCIETES INDIGENES
D’EPARGNE ET DE CREDIT,” Savings and development, 1977, pp. 181–219.

27
Burlando, Alfredo, “When the Lights Go Out: Permanent Health Effects of Transitory
Shocks,” Unpublished paper, Boston University, Boston, 2010.
Carter, Michael R and John A Maluccio, “Social capital and coping with economic
shocks: an analysis of stunting of South African children,” World Development, 2003, 31
(7), 1147–1163.
Cruces, Guillermo, Pablo Gluzmann, and Luis Felipe Lopez-Calva, “Permanent
effects of economic crises on household welfare: Evidence and projections from Argentina’s
downturns,” 2010.
Dercon, Stefan, “Income risk, coping strategies, and safety nets,” The World Bank Research
Observer, 2002, 17 (2), 141–166.
Fang, Hamming and Rongzhu Ke, “The Insurance Role of ROSCA in the Presence
of Credits Markets: Theory and Evidence,” unpublished paper. Department of Economic,
Yale University, 2006.
Garrido, Melissa M., Amy S. Kelley, Julia Paris, Katherine Roza, Diane E. Meier,
R. Sean Morrison, and Melissa D. Aldridge, “Methods for constructing and assessing
propensity scores,” Health services research, 2014, 49 (5), 1701–1720.
Hoogeveen, J. G. M., “Income risk, consumption security and the poor,” Oxford Devel-
opment Studies, 2002, 30 (1), 105–121.
Hospes, Otto, “PEOPLE THAT COUNT: THE FORGOTTEN FACES OF RO-
TATING SAVINGS AND CREDIT ASSOCIATIONS IN INDONESIA/LES GENS
QUI COMPTENT: LES FACES OUBLIEES DES ASSOCIATIONS ROTATOIRES
D’EPARGNE ET DE CREDIT EN INDONESIE,” Savings and Development, 1992,
pp. 371–401.
Iriana, Reiny and Fredrik Sjoholm, “Indonesia’s economic crisis: contagion and funda-
mentals,” The Developing Economies, 2002, 40 (2), 135–151.

28
Kelly, Elaine, “The scourge of asian flu in utero exposure to pandemic influenza and the
development of a cohort of british children,” Journal of Human Resources, 2011, 46 (4),
669–694.
Klonner, Stefan, “Rotating Savings and Credit Associations as Insurance,” Sudasien In-
stitut der University Heldeberg, Working paper, 2000.
Levinsohn, James A., Steven T. Berry, and Jed Friedman, “Impacts of the Indonesian
economic crisis. Price changes and the poor,” in “Managing currency crises in emerging
markets,” University of Chicago Press, 2003, pp. 393–428.
Platteau, Jean-Philippe and Anita Abraham, “An inquiry into quasi-credit contracts:
The role of reciprocal credit and interlinked deals in small-scale fishing communities,” The
Journal of Development Studies, 1987, 23 (4), 461–490.
Prabowo, Dibyo, “The Role of Informal Financial Intermediation in the Mobilization of
Household Savings and Allocations in Indonesia,” in “in” Seminar on Informal Financial
Markets in Development 1989.
Sharma, Shalendra D., “The Indonesian financial crisis: From banking crisis to financial
sector reforms, 1997-2000,” Indonesia, 2001, pp. 79–110.
Skoufias, Emmanuel, “Economic crises and natural disasters: Coping strategies and policy
implications,” World Development, 2003, 31 (7), 1087–1102.
Smith, James P., Duncan Thomas, Elizabeth Frankenberg, Kathleen Beegle, and
Graciela Teruel, “Wages, employment and economic shocks: Evidence from Indonesia,”
Journal of Population Economics, 2002, 15 (1), 161–193.
Strauss, John, Kathleen Beegle, Agus Dwiyanto, Yulia Herawati, Daan Patti-
nasarany, Elan Satriawan, Bondan Sikoki, and Firman Witoelar, Indonesian liv-
ing standards: before and after the financial crisis., Institute of Southeast Asian Studies,
2004.

29
Sylvain, Chabe-Farret, “Analysis of the bias of Matching and Difference-in-Difference
under alternative earnings and selection processes,” Journal of Econometrics, 2015, 185
(1), 110–123.
Sylvain, Chabe-Ferret, “why does difference in difference matching work,” Toulouse School
of Economics and Inra, Lerna, 2014.
Townsend, Robert M., “Consumption insurance: An evaluation of risk-bearing systems
in low-income economies,” The Journal of Economic Perspectives, 1995, pp. 83–102.
Varadharajan, Sowmya, “Explaining Participation in Rotating Savings and Credit Asso-
ciations (RoSCAs): Evidence from Indonesia,” Mimeograph, 2004.
Wie, THEE, “The impact of the economic crisis on Indonesia’s manufacturing sector,” The
Developing Economies, 2000, 38 (4), 420–453.
Williams, Glen and Mary Johnston, “The Arisan: A Tool for Economic and Social
Development?,” Prisma, 1983, 29, 66–73.

30
Figure 1: Features of the Economic Crisis in Indonesia40
6080
100
120
Rea
l Effe
ctiv
e B
road
Exc
hang
e R
ate
1994
1995
1996
1997
1998
1999
2000
2001
2002
2003
2004
2005
2006
2007
2008
Year
Real effective exchange rates are calculated as weighted averages of bilateral exchange rates−adjusted by relative consumer prices.
Real Broad Exchange Rate by Year
12
34
56
Inde
x
1990m1 1992m1 1994m1 1996m1 1998m1 2000m1 2002m1 2004m1 2006m1 2008m1 2010m1Month
Indonesia exchange rate plummeted in July 2007
Exchange rate by month
020
4060
8010
0In
flatio
n (%
)
1990
1992
1994
1996
1998
2000
2002
2004
2006
2008
Year
Inflation : (all commodities) Inflation:(food)
Inflation (Yearly basis)
050
100
150
Infla
tion
1990m1 1992m1 1994m1 1996m1 1998m1 2000m1 2002m1 2004m1 2006m1 2008m1 2010m1Month of birth
Inflation Inflation : food
Increases in the cost of living spiked after january 1998
Inflation by month (yearly basis)
Figure shows unusual deviations in exchange rates and inflation during the 1998 Indonesian financial crisis.
Vertical line denotes the year in which the Indonesian crisis occured

31
Figure 2: Trends in birth outcomes
.05
.1.1
5.2
.25
% L
ow b
irth
wei
ght (
< 2
500g
)
1995
h1
1996
h1
1997
h1
1998
h1
1999
h1
2000
h1
2001
h1
2002
h1
2003
h1
2004
h1
2005
h1
2006
h1
Year of birth by half year
Notes:Vertical lines 2nd half of 1998
Mean Trends by Year of Birth by Half Year% Low birth weight (< 2500g)
Figure shows an increase in low birth weight for cohorts born during the 1998 Indonesian financial crisis.
32
Figure 3
0.0
2.0
4.0
6.0
8pr
opor
tion
of h
ouse
hold
s
Pre−crisis(’94−’97) During−crisis(’98−’00) Post−crisis(’01−’07)
Pre and post crisis% Households : ROSCA facilitates borrowing
Panel
shows the expansion of ROSCAs that facilitate borrowing during the crisis and its subsequent contraction
post crisis. The ability to obtain credit within a ROSCA institution was based on ROSCA participation pre
crisis.
33
Figure 4
90.6%
9.4%
ROSCA not at work ROSCA at work
ROSCA at work (15.5%), ROSCA not at work (84.5%)
ROSCA credit line by type of ROSCA
0.0
2.0
4.0
6.0
8.1
Has
RO
SC
A c
redi
t lin
e (\
%)
Arisan not at work Arisan at workDifferences in credit extension by ROSCA type are significant with pvalue < 0.001
ROSCA credit line by type of ROSCA
0.0
2.0
4.0
6.0
8.1
Has
RO
SC
A c
redi
t lin
e (\
%)
ROSCA not at work ROSCA at work: office ROSCA at work: marketDifferences in credit extension by ROSCA type are significant with pvalue < 0.001
ROSCA credit line by type of ROSCA
Panel shows that approximately 90% of all ROSCA loans were from ROSCA institutions where members had
uncorrelated income sources. Conditional on participating in a ROSCA at work, 5% of members reported
that they had the ability to borrow from a ROSCA. In contrast, 9% of members participating in ROSCAs
unaffiliated with the workplace reported that they had an ability to borrow from a ROSCA.
34
Figure 5: Probability of ROSCA participation by wealth
.3.3
5.4
.45
.5P
roba
bilit
y of
RO
SC
A p
artic
ipat
ion
0
5000
0
1000
00
1500
00
2000
00
2500
00
Household assets per capita in Rupiah
About 8% of the population have wealth less than 15000
household assets per capitaProbability of ROSCA participation by
Figure shows that participation in ROSCAs are not random. The poor and the wealthiest have the lowest
probabilities of participating in a ROSCA.
35
Figure 6: Absolute Standardized differences before and after weighting
0 10 20 30 40Standardized % bias across covariates
Household sizeHas access to informal credit sc
In poor healthHousehold owns businessCompleted Middle school
Completed High schoolHas access to formal credit sche
Household owns farmCan read and write
Completed primary schoolCompleted Post Secondary
Urban household in 1997Household assets per capita
Age
Notes:Vertical line bounds accepted values for standardized differences
Before and after weighting Absolute Standardized differences
After Weighting Before weighting
0 .2 .4 .6 .8Propensity Score
Untreated Treated
Estimated probability of ROSCA Participation(ROSCA = Treated group)
Figure shows standardized differences in covariates before and after weighting between ROSCA and non-
ROSCA participants. After inverse probability weighting no significant differences exist across covariates

36
Figure 7: Difference in Birth outcomes : ROSCA versus Non-ROSCA participants−.
10
.1.2
.3.4
.5
% L
ow b
irth
wei
ght (
< 2
500g
)
1997
h1
1997
h2
1998
h1
1998
h2
1999
h1
1999
h2
2000
h1
Year of birth
Year before and after the crisis
(Non−Rosca − ROSCA participants)Dashed vertical line denotes the crisis yearGraphs adjusts for seasonalitySample weighted with propensity scores
between ROSCA and Non−ROSCA participantsDifferences in % Low birth weight (< 2500g)
01
23
45
% L
ow b
irth
wei
ght (
< 2
500g
)
1997
h1
1997
h2
1998
h1
1998
h2
1999
h1
1999
h2
2000
h1
Year of birth
A Year before and after the crisis
(Non−Rosca − ROSCA participants)Dashed vertical line denotes the crisis yearGraphs adjusts for seasonalitySample weighted with propensity scores
T−test : between ROSCA and Non−ROSCA participantsTest for stable differences for % Low birth weight (< 2500g)
Figure shows that leading up to the crisis the mean difference in the fraction of low birth weights between
ROSCA and non ROSCA participants were similar. During the crisis however, Non-ROSCA participants
had a larger increase in the fraction of low birth weight relative to ROSCA participants
37
Table 1: Sample Summary: Pre-crisis
Deviation from Trend for
1998 Birth cohort
Mean (Sd) Quadratic Trend Cubic Trend
Age 25.13 -0.48418 -0.48457
(6.57) (0.39871) (0.39857)
Poor Health 0.08 0.03778* 0.03780*
(0.27) (0.01957) (0.01957)
Completed primary school 0.13 0.01802 0.01801
(0.34) (0.02241) (0.02240)
Completed Middle school 0.31 0.03285 0.03280
(0.46) (0.02880) (0.02879)
Completed high school 0.23 -0.01784 -0.01778
(0.42) (0.02435) (0.02434)
Completed college 0.25 -0.02187 -0.02189
(0.42) (0.02611) (0.02610)
Can read and write 0.91 -0.01088 -0.01086
(0.28) (0.01888) (0.01887)
Total household assets per member(1000 Rupiah) 9.05 -0.09784 -0.09777
(1.81) (0.11601) (0.11598)
Own Business 0.38 -0.02633 -0.02630
(0.49) (0.02959) (0.02958)
Own Farm 0.29 0.00562 0.00561
(0.46) (0.02796) (0.02796)
Has access to formal credit schemes 0.65 -0.02671 -0.02670
(0.48) (0.02983) (0.02980)
Has access to informal credit schemes (Not Rosca) 0.15 0.00742 0.00739
(0.36) (0.02223) (0.02222)
Can borrow from friends & family 0.35 -0.06007** -0.06002**
(0.48) (0.02869) (0.02869)
Household size pre-crisis 6.15 -0.22483 -0.22483
(2.61) (0.15767) (0.15763)
Urban or rural 0.53 0.01821 0.01813
(0.50) (0.03065) (0.03064)
N 3800 3800 3800
∗∗∗ p<0.01, ** p<0.05, * p<0.10
Deviations in characteristics from trend are shown to be statistically insignificant and providence
evidence against sorting into birth in anticipation of the crisis.

38
Table 2: Birth outcomes: Crisis and non-crisis years
Mean (Standard Deviation)
Birth Cohorts (N= 3800)
Full Sample 1998 Surrounding
Birth outcomes: Mean(sd)
Mean birth weight(grams) 3207.48 3167.3 3211.1
(542.80) (533.99) (543.51)
% Low birth weight(< 2500 grams) 11.4% 16%** 11%
(31.7%) (36.7%) (31.2%)
∗∗∗ p<0.01, ** p<0.05, * p<0.10,
Surrounding years are from 1995 to 2006 excluding the year 1998.
During the crisis, the fraction of low birth weight increased by 5 percentage
points from 11% to 16% with mean birth weight declining by approximately
44 grams. The fact that low birth weight is significant and mean birth weight
is not, suggests that much of the leftward shift in birth weight are for women
with births on the margin of low birth weight.

39
Tab
le3:
Dev
iati
ons
ofB
irth
wei
ght
from
Coh
ort
Tre
nd
for
indiv
idual
sB
orn
Duri
ng
the
1998
Indon
esia
nF
inan
cial
Cri
sis
Low
Bir
thW
eight
Bir
thW
eight
PanelA.Full
sample
Bor
n19
980.0
478**
0.0
407*
0.0
413**
-28.4
9-1
9.9
0-2
5.6
2
(0.0
220)
(0.0
221)
(0.0
208)
(32.6
9)
(32.6
5)
(30.7
6)
PanelB.ByBirth
timin
g
Fir
sth
alf
0.0
0616
-0.0
0310
0.0
0532
-4.9
08
1.0
24
-13.6
5
(0.0
279)
(0.0
283)
(0.0
272)
(41.9
8)
(42.4
4)
(41.1
2)
Sec
ond
hal
f0.0
834***
0.0
778**
0.0
718**
-48.5
8-3
7.6
6-3
5.8
0
(0.0
314)
(0.0
314)
(0.0
291)
(45.9
3)
(45.5
8)
(41.9
9)
Con
trol
sfo
rG
esta
tion
No
No
Yes
No
Yes
Yes
Oth
erC
ontr
ols
No
Yes
Yes
No
No
Yes
N3800
3800
3800
3800
3800
3800
Nu
mb
ers
abov
esh
owa
4.1
per
centa
ge
poin
tin
crea
sein
low
bir
thw
eight
for
coh
orts
born
du
rin
gth
efi
nan
cial
cris
is.
Ch
ild
ren
wh
ow
ere
born
inth
ese
con
dh
alf
of
1998
wer
eth
e
wor
staff
ecte
dfr
omth
ecr
isis
sin
ceth
eyfa
ced
the
gre
ate
stn
etin
crea
sein
pri
ces
wh
ile
in
ute
ro(s
eeap
pen
dix
).
∗∗∗
p<
0.01
,**
p<
0.0
5,
*p<
0.1
0,

40
Tab
le4:
Dev
iati
ons
ofP
renat
alC
are
from
Coh
ort
Tre
nd
for
indiv
idual
sB
orn
Duri
ng
the
1998
Indon
esia
nF
inan
cial
Cri
sis
Du
rin
gP
regn
an
cy1st
trim
este
r2n
dtr
imes
ter
3rd
trim
este
r
PanelA.Full
sample
Bor
n19
98-0
.00139
-0.0
0105
-0.1
39
-0.1
39
-0.0
502
-0.0
519
0.0
343
0.0
333
(0.0
0966)
(0.0
0940)
(0.0
903)
(0.0
902)
(0.0
985)
(0.0
983)
(0.1
66)
(0.1
60)
PanelB.ByBirth
timin
g
Bor
n19
98F
irst
hal
f-0
.00361
-0.0
0283
-0.1
48
-0.1
40
-0.1
53
-0.1
60
0.1
37
0.1
31
(0.0
142)
(0.0
138)
(0.1
16)
(0.1
16)
(0.1
22)
(0.1
20)
(0.2
39)
(0.2
33)
Bor
n19
98S
econ
dh
alf
0.0
00499
0.0
00455
-0.1
32
-0.1
38
0.0
374
0.0
396
-0.0
530
-0.0
489
(0.0
123)
(0.0
121)
(0.1
25)
(0.1
24)
(0.1
41)
(0.1
41)
(0.2
13)
(0.2
03)
N3800
3800
3708
3708
3701
3701
3693
3693
Con
trol
sN
oY
esN
oY
esN
oY
esN
oY
es
For
pre
nat
alca
re,
nu
mb
ers
ab
ove
show
no
dev
iati
on
from
coh
ort
tren
d.
∗∗∗
p<
0.01
,**
p<
0.05
,*
p<
0.1
0,

41
Table 5: Characteristics of ROSCA pre-crisis: sample values
Median Mean Standard deviation
Panel A: ROSCA participation pre and post crisis:
ROSCA participation (Pre-crisis: 1997) - 45% 50%
ROSCA participation (Post-crisis: 2000) - 49% 50%
Panel B : ROSCA attributes pre-crisis(1997):
ROSCA Meeting intervals by weeks 2.71 3.09 2.89
ROSCA payments per month (1997 $) 3.33 7.17 13.10
ROSCA: Months to receive lump sum 11.77 16.40 13.54
ROSCA lump sum payments, previous year ($) 51.56 144.61 1099.91
Observations 2,920 2,920 2,920Payments to ROSCA are about 8-9% of monthly income
Table above provides basic characteristics of ROSCA institutions in Indonesia. In 1997, 45% ofwomen were participating in a ROSCA , met every 3 weeks with a median payment to the schemeof 3.33$. On average women received a median payout of around 51$ from the ROSCA institutionevery 12 months. Payments into ROSCA at each meeting represents 8-10% of monthly income.

42
Tab
le6:
Char
acte
rist
ics
ofR
OSC
Alo
ans
pre
and
pos
tcr
isis
Du
rin
gC
risi
s(1
998-2
000)
Pre
Cri
sis(
1993-1
997)
ROSCA
asa
lineofcredit:
Hou
seh
old
s:R
OS
CA
faci
lita
tes
bor
row
ing
8.3
8%
***
0.8
8%
(27.7
1%
)(9
.33%
)
AttributesofROSCA
loans:
Previous12
months(IFLS
2000)
Hou
seh
old
s:b
orro
wed
from
aR
OS
CA
1.8
4%
***
0.4
4%
(13.4
5%
)(6
.61%
)
Fra
ctio
nco
llat
eral
free
99%
-(1
0%
)
Am
ount
loan
ed($
US
D)
49.1
269.0
4(1
01.6
9)
(114.6
2)
Fra
ctio
nfi
xed
len
gth
loan
0.8
40.9
1(0
.36)
(0.2
9)
Loa
nd
ura
tion
inm
onth
s5.7
67.4
5(6
.21)
(7.0
5)
Inte
rest
inm
onth
s3.2
32.6
1(6
.46)
(2.2
5)
Ob
serv
atio
ns
:F
ull
sam
ple
7510
7111
∗∗∗
p<
0.01
,**
p<
0.05
,*
p<
0.10
Tab
leab
ove
show
sra
tes
ofb
orro
win
gfr
omR
OS
CA
sch
emes
pre
cris
isan
dd
uri
ng
the
cris
is.
Nu
mb
ers
show
anex
pan
sion
oflo
ans
thro
ugh
the
cris
isan
dsh
ows
key
attr
ibu
tes
ofth
elo
ans
offer
ed.
Mos
tlo
ans
offer
edw
ere
mad
eco
llat
eral
free
du
rin
gth
ecr
isis
.

43
Table 7: Top 10 uses of funds after borrowing from a ROSCAPrevious 12 months (IFLS 2000)
ROSCA funds use Percent frequency Cumulative Frequency
Necessary groceries 44.81 44.81
Education 16.60 61.41
Capital for other business 9.96 71.37
Purchase of household items 6.64 78.01
Farm inputs 4.56 82.57
Social ceremony 4.15 86.72
Other, specify 3.32 90.04
Home improvement 2.90 92.95
Death 1.66 94.61
Marriage 1.66 96.27
Observations 241 241
Greatest use of ROSCA funds for borrowers during the crisis was for
consumption loans. 44.81% of loans were used for necessary groceries.

44
Table 8: Difference in Difference Estimates (DID) : Participation in ROSCA and foodconsumption per capita
Food consumption per capita
DID estimates 1997,2000 1993,1996
Has ROSCA * Post 1112.5* 1102.6* -3971.7 -3593.1
(658.0) (665.6) (3068.4) (3057.8)
Post -2358.2*** -2339.6*** -4329.8** -4738.8**
(611.3) (619.7) (2119.2) (2109.2)
Has ROSCA 477.1 465.4 3709.9 3237.3
(663.7) (579.6) (3166.2) (3246.6)
Constant 13681.6*** 14019.3*** 15414.2*** 16342.5***
(574.1) (601.8) (2057.4) (2300.9)
Observations 13713 13713 13286 13286
Controls No Yes No Yes
∗∗∗ p<0.01, ** p<0.05, * p<0.10,
Numbers show above that ROSCA households had larger increases in
food consumption capita relative to non-ROSCA households through
the crisis. Before the crisis however, changes in food consumption be-
tween ROSCA and non ROSCA participants were similar.

45
Tab
le9:
Cov
aria
teB
alan
ceac
ross
Tre
atm
ent
and
Com
par
ison
Gro
ups
bef
ore
and
afte
rW
eigh
ting
onth
eP
rop
ensi
tySco
re
Ori
gin
al
Sam
ple
Wei
ghte
dS
am
ple
RO
SC
AN
on
-RO
SC
AS
tan
dard
ized
RO
SC
AN
on
-RO
SC
AS
tan
dard
ized
(n=
1886
)(n
=2273
)D
iffer
ence
(%)
(n=
1886
)(n
=2273
)D
iffer
ence
(%)
Age
24.0
526.4
40.3
7**
26.4
43
26.4
87
0.0
07
Inp
oor
hea
lth
0.0
80.0
80.0
30.0
85
0.0
87
0.0
07
Com
ple
ted
pri
mar
ysc
hool
0.1
60.1
10.1
5**
0.1
06
0.1
15
0.0
29
Com
ple
ted
Mid
dle
sch
ool
0.3
20.2
90.0
60.2
93
0.2
98
0.0
11
Com
ple
ted
Hig
hsc
hool
0.2
50.2
20.0
60.2
19
0.2
22
0.0
07
Com
ple
ted
Pos
tS
econ
dar
y0.2
10.2
90.1
7**
0.2
86
0.2
80
0.0
13
Can
read
and
wri
te0.8
90.9
30.1
4**
0.9
34
0.9
30
0.0
16
Urb
anh
ouse
hol
din
1997
0.4
80.5
80.2
1**
0.5
80
0.5
82
0.0
04
Hou
seh
old
size
6.1
66.1
30.0
16.1
34
6.0
25
0.0
42
Hou
seh
old
asse
tsp
erca
pit
a8.8
69.2
90.2
4**
9.2
85
9.2
85
0.0
00
Hou
seh
old
owns
bu
sin
ess
0.3
70.3
90.0
50.3
95
0.3
96
0.0
02
Hou
seh
old
owns
farm
0.3
20.2
60.1
4**
0.2
59
0.2
68
0.0
20
Has
acce
ssto
form
alcr
edit
sch
emes
0.6
20.6
80.1
3**
0.6
82
0.6
80
0.0
04
Has
acce
ssto
info
rmal
cred
itsc
hem
es0.1
50.1
60.0
20.1
58
0.1
58
0.0
00
Has
acce
ssto
cred
itfr
omfa
mil
yan
dfr
ien
ds
0.3
40.3
70.0
70.3
73
0.3
56
0.0
35
∗∗st
and
ard
ize
diff≥
0.20
,∗
stan
dar
diz
edd
iff≥
0.1
0&<
0.2
0
Tab
lesh
ows
bal
ance
inch
arac
teri
stic
saft
erin
ver
sep
rob
ab
ilit
yw
eighti
ng.

46
Table 10: Low birth weight during the 1998 crisis by ROSCA participation
Weighted Symmetric DID
± 1 crisis year ± 2 crisis year
Crisis year * Rosca member -0.104** -0.107** -0.0846* -0.0811*
(0.0498) (0.0468) (0.0478) (0.0448)
Crisis year 0.116** 0.118** 0.0937** 0.0905**
(0.0398) (0.0373) (0.0421) (0.0394)
ROSCA member 0.0106 0.0303 -0.0108 0.00467
(0.0220) (0.0210) (0.0160) (0.0151)
Constant 0.120*** 0.0918** 0.134*** 0.110***
(0.0274) (0.0280) (0.0248) (0.0233)
Overall impact of Crisis year 0.0618** 0.0626** 0.0491* 0.0480*
Observations 1088 1088 1810 1810
Gestation No Yes No Yes
∗∗∗ p<0.01, ** p<0.05, * p<0.10,
DID ≡ Diifference in differences.
Estimates control for seasonality with dummies for quarter of birth
Related Documents