PEER-REVIEWED ARTICLE bioresources.com Yuan et al. (2019). “Methane from corn stover,” BioResources 14(1), 1347-1363. 1347 A Combined Process for Efficient Biomethane Production from Corn Straw and Cattle Manure: Optimizing C/N Ratio of Mixed Hydrolysates Ye Yuan, a,b,c,d Aiqin Bian, a,e Lulu Zhang, c Tianming Chen, a,b Mei Pan, a,b Lei He, a Aijie Wang, a,d and Cheng Ding a,b,e, * A novel combined process, consisting of thermal-alkali pretreatment, enzymatic hydrolysis, and anaerobic digestion (AD) was utilized to methanize corn straw (CS) and cattle manure (CM) efficiently. This study aimed to identify the carbon/nitrogen (C/N) ratio of the mixed hydrolysates of CS and CM that maximized methane production in an AD reactor. Additionally, pretreatment conditions for CS and CM were evaluated. The optimum condition of pH 10 was 80 °C and 3 h of thermal-alkali pretreatment to produce 42% of hydrolysis efficiency, while a further enzymatic process increased the efficiency to 72%. The C/N ratio was optimized during the co-digestion of the mixed hydrolysates, and better performances were obtained with a C/N ratio of 11 to 30 having specific methane production from 180 to 280 mL/g CODadded. The maximum methane production reached to 280 mL/g CODadded at the C/N ratio of 20. Approximately 75% of the total organic matter from the liquid fractions of mixed hydrolysates was converted to methane. Trace elements in CM hydrolysates may also promote the methane yield. This community structure change was proposed to be an internal response for different C/N ratio adaptation. An inappropriate C/N ratio may cause accumulation of free ammonia or volatile fatty acids, which would inhibit methanogens, but not affect the acidogens. Keywords: Thermal-alkali pretreatment; Enzymatic hydrolysis; Mixed hydrolysates; C/N ratio optimization; Anaerobic digestion Contact information: a: School of Environmental Science and Engineering, Yancheng Institute of Technology, Yancheng 224003, China; b: Key Laboratory for Advanced Technology in Environmental Protection of Jiangsu Province, Yancheng Institute of Technology, Yancheng 224051, China; c: Jiangsu Keyida Environmental Science and Technology Co. LTD., Yancheng 224007, China; d: Key Laboratory of Environmental Biotechnology, Research Center for Eco-Environmental Sciences, Chinese Academy of Sciences, Beijing 100085, China; e: School of Environmental Science and Engineering, Jiangsu University, Zhenjiang 212013, China; *Corresponding author: [email protected] INTRODUCTION In recent years, renewable energy recovery from organic waste has received considerable attention because of the growing demand of energy and increasing pollution (Ding et al. 2012; Zhang et al. 2016a; Tsapekos et al. 2017). Methane is a promising alternative energy carrier due to its high-energy yield (39829 KJ/m 3 ) (Song and Zhang 2015). Methane is generated using the anaerobic digestion (AD) of crop residues and livestock manure, which contain a tremendous potential of energy; both lignocellulosic agricultural residues and nutrient-rich cattle manure are abundantly available (Zhai et al. 2015; Awais et al. 2018). China is a large agricultural country and has the world’s largest straw residues. The straw yield is over 800 million tons per year. Corn straw (CS) is one

Welcome message from author
This document is posted to help you gain knowledge. Please leave a comment to let me know what you think about it! Share it to your friends and learn new things together.
Transcript
PEER-REVIEWED ARTICLE bioresources.com
Yuan et al. (2019). “Methane from corn stover,” BioResources 14(1), 1347-1363. 1347
A Combined Process for Efficient Biomethane Production from Corn Straw and Cattle Manure: Optimizing C/N Ratio of Mixed Hydrolysates
Ye Yuan,a,b,c,d Aiqin Bian,a,e Lulu Zhang,c Tianming Chen,a,b Mei Pan,a,b Lei He,a
Aijie Wang,a,d and Cheng Ding a,b,e,*
A novel combined process, consisting of thermal-alkali pretreatment, enzymatic hydrolysis, and anaerobic digestion (AD) was utilized to methanize corn straw (CS) and cattle manure (CM) efficiently. This study aimed to identify the carbon/nitrogen (C/N) ratio of the mixed hydrolysates of CS and CM that maximized methane production in an AD reactor. Additionally, pretreatment conditions for CS and CM were evaluated. The optimum condition of pH 10 was 80 °C and 3 h of thermal-alkali pretreatment to produce 42% of hydrolysis efficiency, while a further enzymatic process increased the efficiency to 72%. The C/N ratio was optimized during the co-digestion of the mixed hydrolysates, and better performances were obtained with a C/N ratio of 11 to 30 having specific methane production from 180 to 280 mL/g CODadded. The maximum methane production reached to 280 mL/g CODadded at the C/N ratio of 20. Approximately 75% of the total organic matter from the liquid fractions of mixed hydrolysates was converted to methane. Trace elements in CM hydrolysates may also promote the methane yield. This community structure change was proposed to be an internal response for different C/N ratio adaptation. An inappropriate C/N ratio may cause accumulation of free ammonia or volatile fatty acids, which would inhibit methanogens, but not affect the acidogens.
Keywords: Thermal-alkali pretreatment; Enzymatic hydrolysis; Mixed hydrolysates; C/N ratio
optimization; Anaerobic digestion
Contact information: a: School of Environmental Science and Engineering, Yancheng Institute of
Technology, Yancheng 224003, China; b: Key Laboratory for Advanced Technology in Environmental
Protection of Jiangsu Province, Yancheng Institute of Technology, Yancheng 224051, China; c: Jiangsu
Keyida Environmental Science and Technology Co. LTD., Yancheng 224007, China; d: Key Laboratory of
Environmental Biotechnology, Research Center for Eco-Environmental Sciences, Chinese Academy of
Sciences, Beijing 100085, China; e: School of Environmental Science and Engineering, Jiangsu University,
Zhenjiang 212013, China; *Corresponding author: [email protected]
INTRODUCTION
In recent years, renewable energy recovery from organic waste has received
considerable attention because of the growing demand of energy and increasing pollution
(Ding et al. 2012; Zhang et al. 2016a; Tsapekos et al. 2017). Methane is a promising
alternative energy carrier due to its high-energy yield (39829 KJ/m3) (Song and Zhang
2015). Methane is generated using the anaerobic digestion (AD) of crop residues and
livestock manure, which contain a tremendous potential of energy; both lignocellulosic
agricultural residues and nutrient-rich cattle manure are abundantly available (Zhai et al.
2015; Awais et al. 2018). China is a large agricultural country and has the world’s largest
straw residues. The straw yield is over 800 million tons per year. Corn straw (CS) is one
PEER-REVIEWED ARTICLE bioresources.com
Yuan et al. (2019). “Methane from corn stover,” BioResources 14(1), 1347-1363. 1348
of the major straw residues in China and contributes about 35% of the total amount (Li et
al. 2014; Wei et al. 2015). Although traditionally CS has been treated by various methods
such as energy production, animal feed, and return to agriculture soils, the utilization rate
of CS is still less than 50% to 60% (Yuan et al. 2015; Tsapekos et al. 2017). The yield of
cattle manure (CM) from livestock farms is over 382 million tons per year, which accounts
for about a third of the total yield of livestock manure (Li et al. 2014). However, the
improper disposal (such as burning) of CM wastes the resource and pollutes the
environment (Fu et al. 2015). These wastes have great potential for producing renewable
energy and could play an increasingly important role in replacing limited fossil fuels.
The AD process for biogas production offers a potential means of converting
agricultural biomass into a renewable energy source, which meets the growing energy
needs and reduces environmental concerns (Zhang et al. 2015; Mehryar et al. 2017; Awais
et al. 2018). However, there are quite a few problems inherent in the AD of agricultural
biomass, such as poor utilization of substrate and low digestion efficiency. The complex
and recalcitrant structure of lignocellulosic materials are difficult to be directly utilized by
fermentative bacteria during the hydrolysis process (Khatri et al. 2015; Wang et al. 2015).
The hydrolysis reaction is being seen as a rate-limiting process in the AD of lignocellulosic
materials (Fu et al. 2015). Pretreatments such as thermal-alkali, anaerobic/aerobic
composting, steam-explosion, and mechanical methods have been investigated by
researchers to promote hydrolysis (Odnell et al. 2016; Yang et al. 2017). Among these
pretreatments, thermal-alkali pretreatment increases methane production of the straw
residues efficiently. Thermal-alkali pretreatment opens the chemical bonds between lignin
and the other carbohydrate fractions (such as cellulose, hemicellulose, and protein) in raw
materials (Krishania et al. 2013). Furthermore, mechanical pretreatment is an efficient way
to increase the surface area and decreases the crystallinity of lignocellulose, which can
accelerate the hydrolysis (Kalamaras and Kotsopoulos 2014).
After pretreatment, the remaining organic solids can be accessed by specific
hydrolytic enzymes, producing large amounts of saccharides and other compounds from
cellulose and protein into liquid hydrolysates (Wang et al. 2015; Zhang et al. 2016a). For
example, Nkemka and Murto (2013) conducted the AD of liquid hydrolysates from crop
stalk after pre-hydrolysis in an anaerobic reactor, which is usually used for organic
wastewater treatment. Most studies pay more attention to applying enzymatic hydrolysis
to crops for bioethanol production (Abada et al. 2018; Awais et al. 2018; Shokrkar et al.
2018). However, the application of enzymatic hydrolysis to agricultural lignocellulosic
wastes and animal manure for biogas production is rarely reported. A combined process of
enzymatic hydrolysis with AD will have a better future for obtaining bioenergy from these
bio-wastes.
The nutrient and composition of fermentation substrates is vital to achieve an
effective and steady biogas production (Risberg et al. 2013). Generally, the proper
carbon/nitrogen (C/N) ratio for the AD of bio-wastes should be 20 to 30 (Krishania et al.
2013; Hassan et al. 2017). The AD of high-N substrates, such as livestock and poultry
manure, usually results in ammonia accumulation and nutrition imbalance (Zhang et al.
2015). In contrast, the AD of high-C substrates, such as crop straw, eventually causes
volatile acid accumulation and inhibits the activity of methanogens, which decreases the
digestion efficiency (Zhang et al. 2015). Compared to adding N-containing chemicals, such
as ammonium salt, co-digestion with livestock manure is regarded as a useful way for
regulating nutrition (Li et al. 2015). In fact, high solid co-digestion has been extensively
applied in recent years. Biogas production from the co-digestion of crop straw with
PEER-REVIEWED ARTICLE bioresources.com
Yuan et al. (2019). “Methane from corn stover,” BioResources 14(1), 1347-1363. 1349
livestock manure is increased more than that from the mono-digestion (Zhou et al. 2012;
Song and Zhang 2015). However, the research on effect of the C/N ratio on the co-digestion
of pre-hydrolyzed crop straw and animal manure has not been reported to the best of our
knowledge.
The aim of this study was to identify the C/N ratio of mixed hydrolysates that
maximizes methane production in a combined process. Additionally, the pre-treatment
conditions for CS and CM were also examined. Firstly, the two-step pretreatment
(consisting of thermal-alkali pretreatment and enzymatic hydrolysis) was applied on CS
and CM, respectively. Secondly, the mixed substrates were prepared with certain
proportions of liquid CS and CM hydrolysates and then fed into an expanded granular
sludge blanket (EGSB) reactor for producing methane. Process evaluation parameters such
as chemical oxygen demand (COD) yield after pre-hydrolysis, COD removal efficiency,
volatile fatty acids (VFAs), ammonia, nutrients, and methane production were investigated
in the anaerobic digestion period. The impact of different C/N ratios of mixed hydrolysates
on microbial communities and dominant species were analyzed during the EGSB reactor
operation.
EXPERIMENTAL
Raw Materials Raw CS was obtained from a corn field using a maize harvester. Raw CS was dried
by oven-drying at 105 °C until at a constant weight. After that, the CS was chopped into
about 2-mm-long pieces. These chopped pieces were further ground to less than 1 mm in
size and stored in a refrigerator at 4 °C for later use. The mechanical pretreatment can
increase the surface area in contact with NaOH alkali during the thermal-alkali
pretreatment. Raw CM was collected from a livestock farm in Yancheng, Jiangsu province,
China. The CM was filtered using 5 mm stainless steel mesh (Dongmai: mesh-number-4
Nanjiang, China) to remove large particles (such as wood, undigested debris and other
garbage ) and stored in plastic bucket at -18 °C before being used.
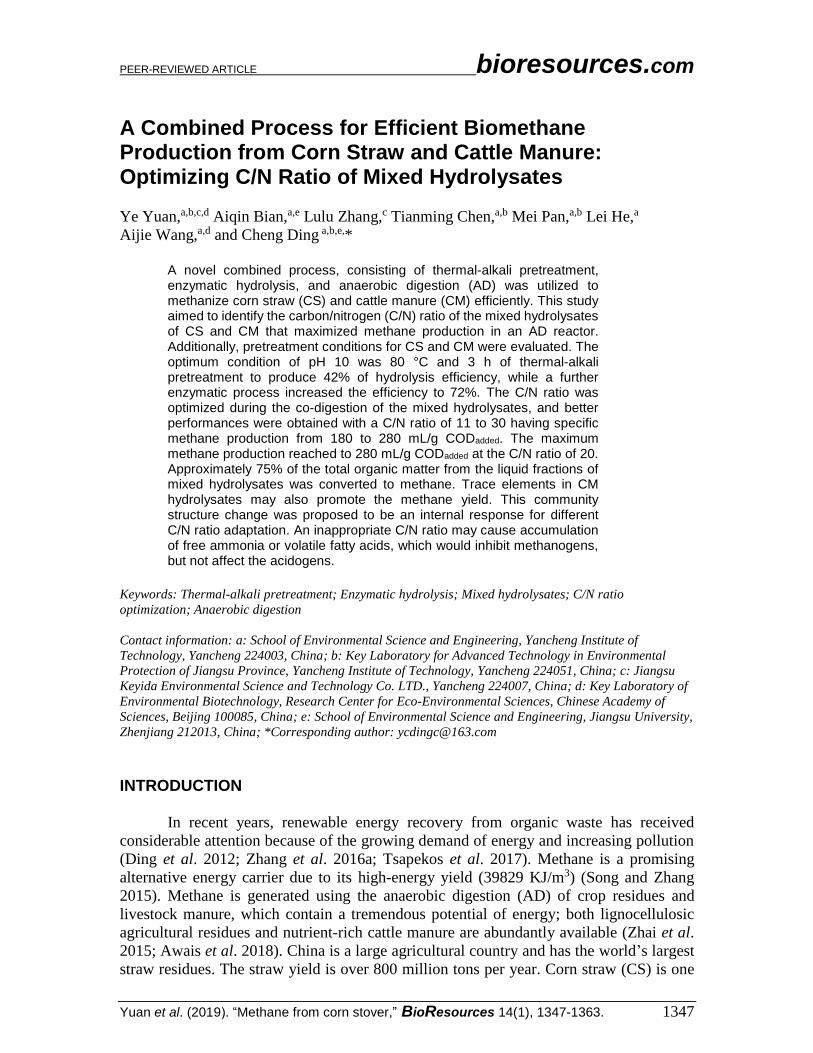
Thermal-alkali Pretreatment A thermal-alkali pretreatment with NaOH was performed to the CS and CM
respectively in order to break down the structure of the raw materials and to increase the
solubilization of lignocelluloses, hemicellulose, and protein. Four different pH values (8,
9, 10, and 11) were used in this process. First, 10 kg of raw CS and 10 kg of raw CM were
taken into a stainless-steel tank with a working volume of 50 L, respectively. Then, 10 L
of water was added to each stainless-steel tank followed by stirring the mixer at a constant
speed of 40 rpm. Then, NaOH was added to the stainless-steel tanks and in the amount of
4.3×10⁻⁵, 4.2×10⁻⁴, 2.2×10⁻³, 8.7×10⁻² g and 1.1×10⁻⁵, 3.9×10⁻⁴, 2.1×10⁻³, 8.5×10⁻² g based
on the biomass solids (per kg of raw CS and raw CM) to achieve four different pH,
respectively. The reactor was equipped with heating systems and the temperatures were
kept at the 60 °C for 4 h, 70 °C for 3 h, 80 °C for 3 h, and 90 °C for 2 h (Fig. 1).
Enzymatic Hydrolysis Raw CS contains higher cellulose and hemicellulose and lower protein, whereas
raw CM contains higher protein and cellulose and lower hemicellulose (Li et al. 2015;
Wang et al. 2015).
PEER-REVIEWED ARTICLE bioresources.com
Yuan et al. (2019). “Methane from corn stover,” BioResources 14(1), 1347-1363. 1350
Fig. 1. Scheme of solubilization yields of raw CS and CM hydrolysis process
Alkali applications can break down the structure of cellulose and crude protein and
hydrolyze hemicellulose (Ramos-Suárez et al. 2017). Two kinds of enzymes (Cellucast®
and Alcalase® provided by Novozymes (China) Biotechnology Co., Ltd, Tianjin) were
used for the enzymatic hydrolysis after thermal-alkali pretreatment (Fig. 1). The optimum
experiment conditions of Cellucast® and Alcalase® were pH (5.5 to 6.5), temperature (50
to 60 °C), time (4 h), and pH (8.5 to 9.5), temperature (55 to 80 °C), time (18 h),
respectively.
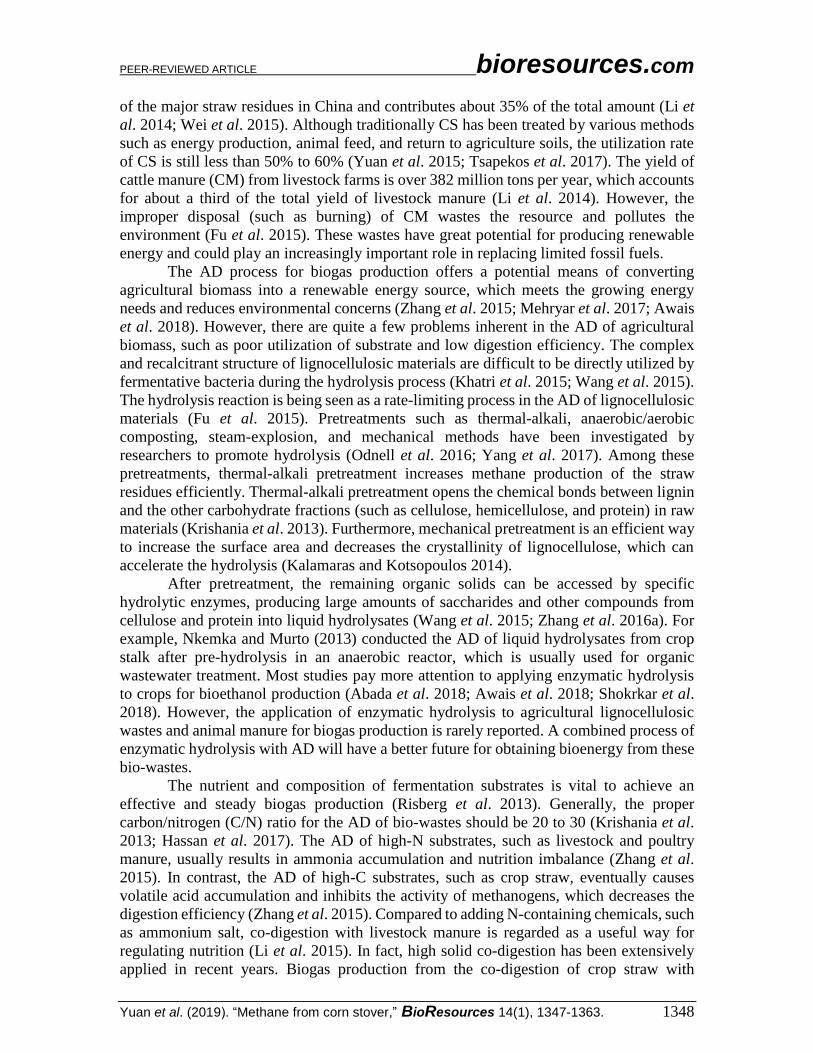
Table 1. Characterization of Raw CS/CM and CS/CM Hydrolysates
Parameters (g/kg) Raw CS Raw CM CS Hydrolysates CM Hydrolysates
Total Solids (TS) 251.2 ± 8.5 322.3 ± 10.8 85.4 ± 5.4 102.2 ± 6.8
volatile Solids (VS) 227.4 ± 4.5 258.4 ± 8.4 76.3 ± 4.3 63.2 ± 4.4
Cellulose 54.6 ± 5.2 62.6 ± 4.2 11.6 ± 5.2 15.2 ± 7.6
Hemicellulose 61.7 ± 4.4 73.3 ± 6.3 15.6 ± 6.9 17.4 ± 5.8
Lignin 35.3 ± 3.2 45.4 ± 4.7 N.D.a N.D.
Glucose N.D. N.D. 4.6 ± 1.1 0.9 ± 0.1
Xylose N.D. N.D. 6.0 ± 1.3 0.8 ± 0.2
Arabinose N.D. N.D. 3.0 ± 0.8 0.5 ± 0.1
Total Carbohydrates 2.3 ± 6.3 15.3 ± 2.2 84.4 ± 6.3 67.4 ± 5.7
Total Organic Carbon (TOC)
N.A.b N.A 53.4 ± 4.1 39.8 ± 3.8
Total Nitrogen (TN) 9.2 ± 2.7 N.A. 1.3 ± 0.2 5.3 ± 0.7
Organic Nitrogen (ON) N.A. N.A. N.A. 1.2 ± 0.6
Ammonia Nitrogen (AN) 0.1 ± 0.1 1.5 ± 0.7 0.2 ± 0.1 1.6 ± 0.8
Free AN (FAN) N.D. 0.2 ± 0.1 N.D. 0.1 ± 0.1
Protein 37.4 ± 4.6 78.5 ± 7.2 N.A. 7.5 ± 2.2
Total Phosphorus (TP) 1.2 ± 0.7 N.A. 0.5 ± 0.3 0.8 ± 0.4
a: Not detectable; b: Data not available.
PEER-REVIEWED ARTICLE bioresources.com
Yuan et al. (2019). “Methane from corn stover,” BioResources 14(1), 1347-1363. 1351
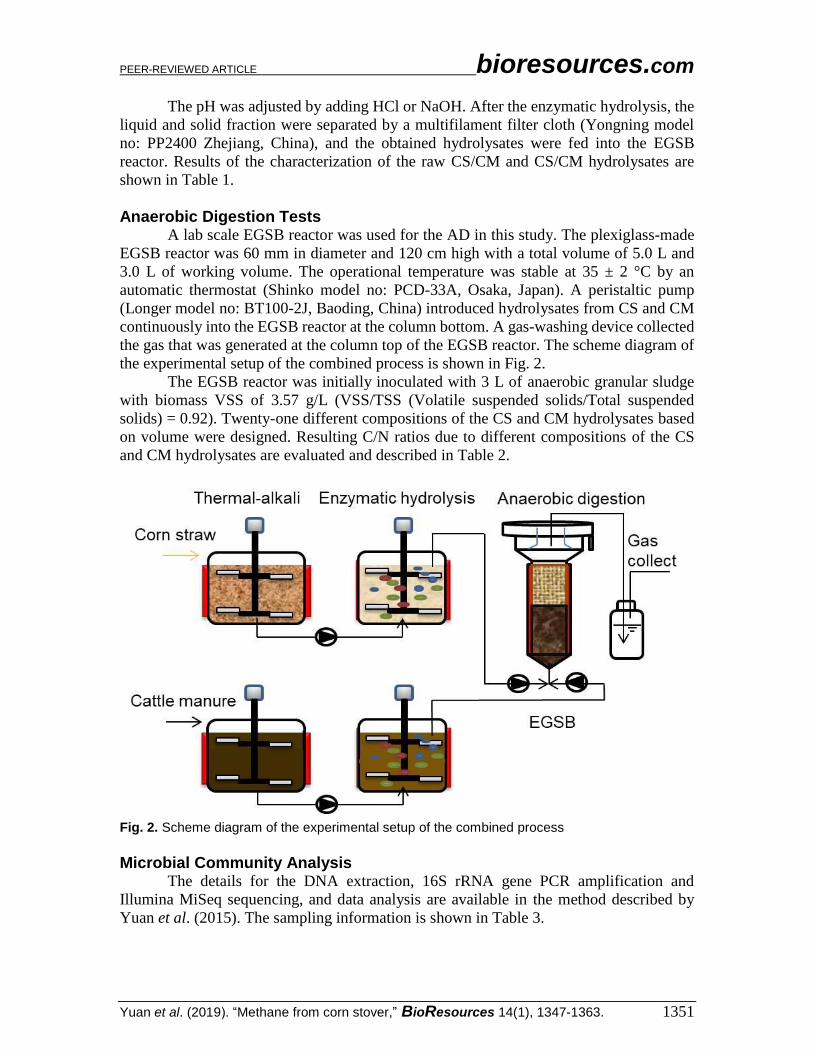
The pH was adjusted by adding HCl or NaOH. After the enzymatic hydrolysis, the
liquid and solid fraction were separated by a multifilament filter cloth (Yongning model
no: PP2400 Zhejiang, China), and the obtained hydrolysates were fed into the EGSB
reactor. Results of the characterization of the raw CS/CM and CS/CM hydrolysates are
shown in Table 1.
Anaerobic Digestion Tests A lab scale EGSB reactor was used for the AD in this study. The plexiglass-made
EGSB reactor was 60 mm in diameter and 120 cm high with a total volume of 5.0 L and
3.0 L of working volume. The operational temperature was stable at 35 ± 2 °C by an
automatic thermostat (Shinko model no: PCD-33A, Osaka, Japan). A peristaltic pump
(Longer model no: BT100-2J, Baoding, China) introduced hydrolysates from CS and CM
continuously into the EGSB reactor at the column bottom. A gas-washing device collected
the gas that was generated at the column top of the EGSB reactor. The scheme diagram of
the experimental setup of the combined process is shown in Fig. 2.
The EGSB reactor was initially inoculated with 3 L of anaerobic granular sludge
with biomass VSS of 3.57 g/L (VSS/TSS (Volatile suspended solids/Total suspended
solids) = 0.92). Twenty-one different compositions of the CS and CM hydrolysates based
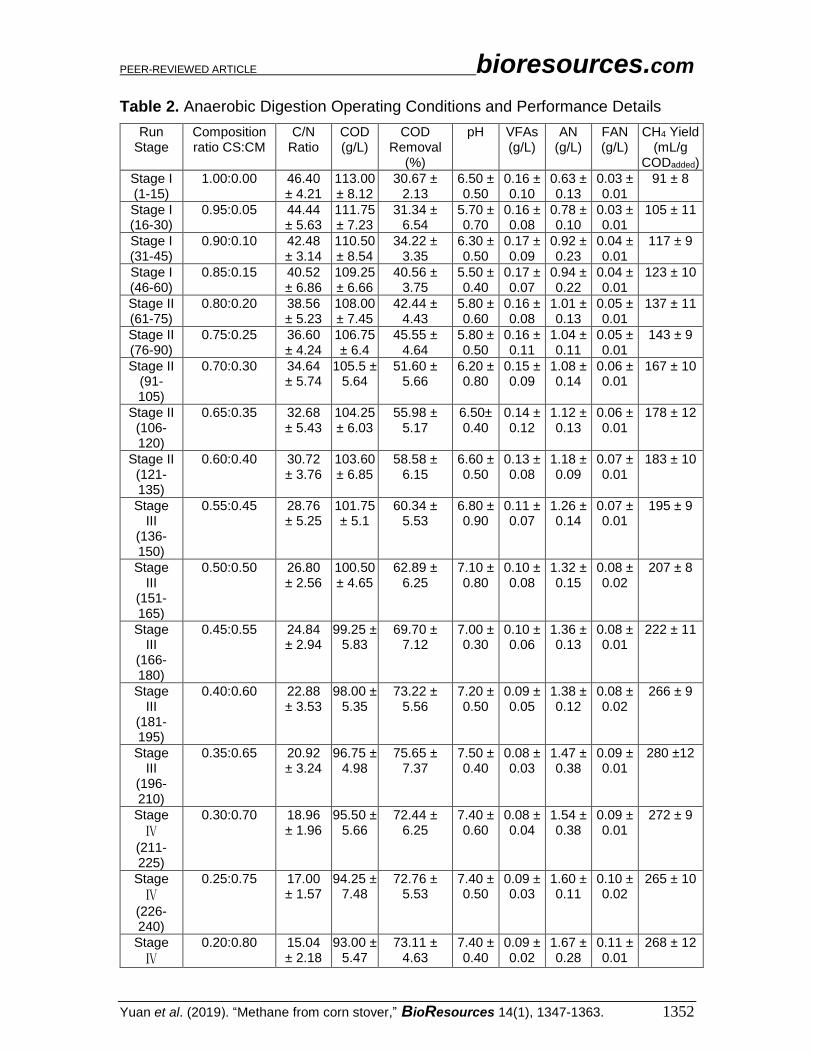
on volume were designed. Resulting C/N ratios due to different compositions of the CS
and CM hydrolysates are evaluated and described in Table 2.
Fig. 2. Scheme diagram of the experimental setup of the combined process
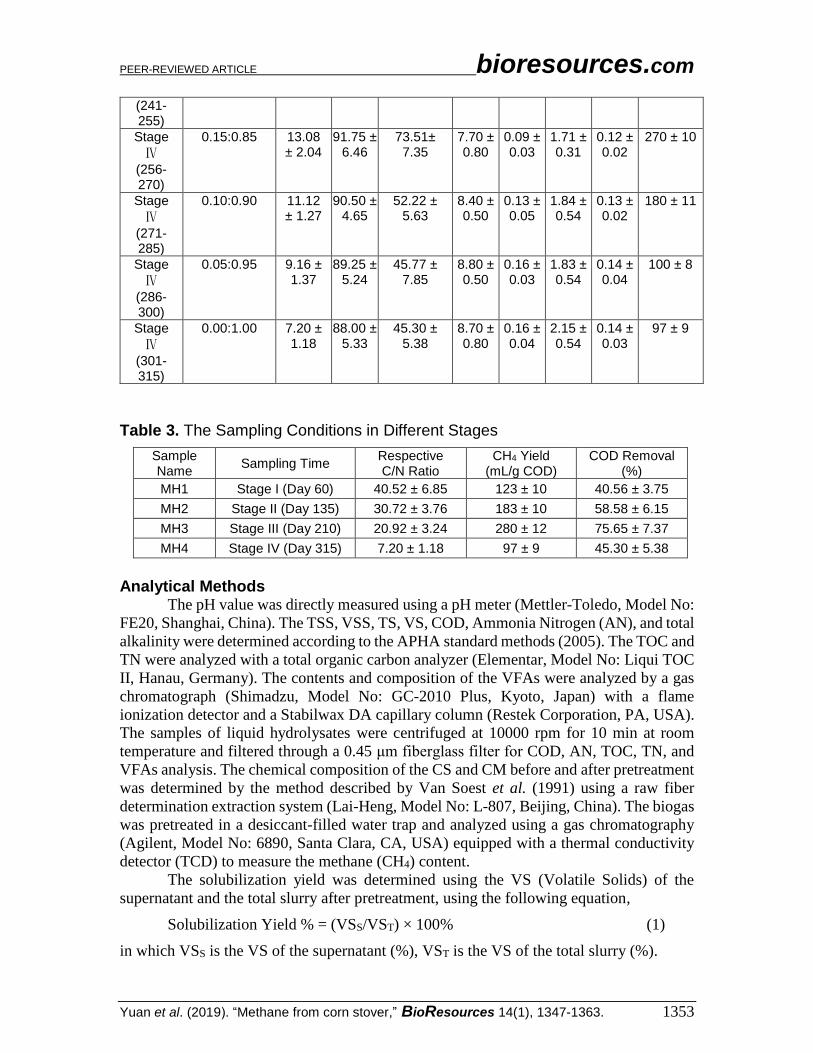
Microbial Community Analysis The details for the DNA extraction, 16S rRNA gene PCR amplification and
Illumina MiSeq sequencing, and data analysis are available in the method described by
Yuan et al. (2015). The sampling information is shown in Table 3.
PEER-REVIEWED ARTICLE bioresources.com
Yuan et al. (2019). “Methane from corn stover,” BioResources 14(1), 1347-1363. 1352
Table 2. Anaerobic Digestion Operating Conditions and Performance Details
Run Stage
Composition ratio CS:CM
C/N Ratio
COD (g/L)
COD Removal
(%)
pH VFAs (g/L)
AN (g/L)
FAN (g/L)
CH4 Yield (mL/g
CODadded)
Stage I (1-15)
1.00:0.00 46.40 ± 4.21
113.00 ± 8.12
30.67 ± 2.13
6.50 ± 0.50
0.16 ± 0.10
0.63 ± 0.13
0.03 ± 0.01
91 ± 8
Stage I (16-30)
0.95:0.05 44.44 ± 5.63
111.75 ± 7.23
31.34 ± 6.54
5.70 ± 0.70
0.16 ± 0.08
0.78 ± 0.10
0.03 ± 0.01
105 ± 11
Stage I (31-45)
0.90:0.10 42.48 ± 3.14
110.50 ± 8.54
34.22 ± 3.35
6.30 ± 0.50
0.17 ± 0.09
0.92 ± 0.23
0.04 ± 0.01
117 ± 9
Stage I (46-60)
0.85:0.15 40.52 ± 6.86
109.25 ± 6.66
40.56 ± 3.75
5.50 ± 0.40
0.17 ± 0.07
0.94 ± 0.22
0.04 ± 0.01
123 ± 10
Stage II (61-75)
0.80:0.20 38.56 ± 5.23
108.00 ± 7.45
42.44 ± 4.43
5.80 ± 0.60
0.16 ± 0.08
1.01 ± 0.13
0.05 ± 0.01
137 ± 11
Stage II (76-90)
0.75:0.25 36.60 ± 4.24
106.75 ± 6.4
45.55 ± 4.64
5.80 ± 0.50
0.16 ± 0.11
1.04 ± 0.11
0.05 ± 0.01
143 ± 9
Stage II (91-105)
0.70:0.30 34.64 ± 5.74
105.5 ± 5.64
51.60 ± 5.66
6.20 ± 0.80
0.15 ± 0.09
1.08 ± 0.14
0.06 ± 0.01
167 ± 10
Stage II (106-120)
0.65:0.35 32.68 ± 5.43
104.25 ± 6.03
55.98 ± 5.17
6.50± 0.40
0.14 ± 0.12
1.12 ± 0.13
0.06 ± 0.01
178 ± 12
Stage II (121-135)
0.60:0.40 30.72 ± 3.76
103.60 ± 6.85
58.58 ± 6.15
6.60 ± 0.50
0.13 ± 0.08
1.18 ± 0.09
0.07 ± 0.01
183 ± 10
Stage III
(136-150)
0.55:0.45 28.76 ± 5.25
101.75 ± 5.1
60.34 ± 5.53
6.80 ± 0.90
0.11 ± 0.07
1.26 ± 0.14
0.07 ± 0.01
195 ± 9
Stage III
(151-165)
0.50:0.50 26.80 ± 2.56
100.50 ± 4.65
62.89 ± 6.25
7.10 ± 0.80
0.10 ± 0.08
1.32 ± 0.15
0.08 ± 0.02
207 ± 8
Stage III
(166-180)
0.45:0.55 24.84 ± 2.94
99.25 ± 5.83
69.70 ± 7.12
7.00 ± 0.30
0.10 ± 0.06
1.36 ± 0.13
0.08 ± 0.01
222 ± 11
Stage III
(181-195)
0.40:0.60 22.88 ± 3.53
98.00 ± 5.35
73.22 ± 5.56
7.20 ± 0.50
0.09 ± 0.05
1.38 ± 0.12
0.08 ± 0.02
266 ± 9
Stage III
(196-210)
0.35:0.65 20.92 ± 3.24
96.75 ± 4.98
75.65 ± 7.37
7.50 ± 0.40
0.08 ± 0.03
1.47 ± 0.38
0.09 ± 0.01
280 ±12
Stage
Ⅳ
(211-225)
0.30:0.70 18.96 ± 1.96
95.50 ± 5.66
72.44 ± 6.25
7.40 ± 0.60
0.08 ± 0.04
1.54 ± 0.38
0.09 ± 0.01
272 ± 9
Stage
Ⅳ
(226-240)
0.25:0.75 17.00 ± 1.57
94.25 ± 7.48
72.76 ± 5.53
7.40 ± 0.50
0.09 ± 0.03
1.60 ± 0.11
0.10 ± 0.02
265 ± 10
Stage
Ⅳ
0.20:0.80 15.04 ± 2.18
93.00 ± 5.47
73.11 ± 4.63
7.40 ± 0.40
0.09 ± 0.02
1.67 ± 0.28
0.11 ± 0.01
268 ± 12
PEER-REVIEWED ARTICLE bioresources.com
Yuan et al. (2019). “Methane from corn stover,” BioResources 14(1), 1347-1363. 1353
(241-255)
Stage
Ⅳ
(256-270)
0.15:0.85 13.08 ± 2.04
91.75 ± 6.46
73.51± 7.35
7.70 ± 0.80
0.09 ± 0.03
1.71 ± 0.31
0.12 ± 0.02
270 ± 10
Stage
Ⅳ
(271-285)
0.10:0.90 11.12 ± 1.27
90.50 ± 4.65
52.22 ± 5.63
8.40 ± 0.50
0.13 ± 0.05
1.84 ± 0.54
0.13 ± 0.02
180 ± 11
Stage
Ⅳ
(286-300)
0.05:0.95 9.16 ± 1.37
89.25 ± 5.24
45.77 ± 7.85
8.80 ± 0.50
0.16 ± 0.03
1.83 ± 0.54
0.14 ± 0.04
100 ± 8
Stage
Ⅳ
(301-315)
0.00:1.00 7.20 ± 1.18
88.00 ± 5.33
45.30 ± 5.38
8.70 ± 0.80
0.16 ± 0.04
2.15 ± 0.54
0.14 ± 0.03
97 ± 9
Table 3. The Sampling Conditions in Different Stages
Sample Name
Sampling Time Respective C/N Ratio
CH4 Yield (mL/g COD)
COD Removal (%)
MH1 Stage I (Day 60) 40.52 ± 6.85 123 ± 10 40.56 ± 3.75
MH2 Stage II (Day 135) 30.72 ± 3.76 183 ± 10 58.58 ± 6.15
MH3 Stage III (Day 210) 20.92 ± 3.24 280 ± 12 75.65 ± 7.37
MH4 Stage IV (Day 315) 7.20 ± 1.18 97 ± 9 45.30 ± 5.38
Analytical Methods The pH value was directly measured using a pH meter (Mettler-Toledo, Model No:
FE20, Shanghai, China). The TSS, VSS, TS, VS, COD, Ammonia Nitrogen (AN), and total
alkalinity were determined according to the APHA standard methods (2005). The TOC and
TN were analyzed with a total organic carbon analyzer (Elementar, Model No: Liqui TOC
II, Hanau, Germany). The contents and composition of the VFAs were analyzed by a gas
chromatograph (Shimadzu, Model No: GC-2010 Plus, Kyoto, Japan) with a flame
ionization detector and a Stabilwax DA capillary column (Restek Corporation, PA, USA).
The samples of liquid hydrolysates were centrifuged at 10000 rpm for 10 min at room
temperature and filtered through a 0.45 μm fiberglass filter for COD, AN, TOC, TN, and
VFAs analysis. The chemical composition of the CS and CM before and after pretreatment
was determined by the method described by Van Soest et al. (1991) using a raw fiber
determination extraction system (Lai-Heng, Model No: L-807, Beijing, China). The biogas
was pretreated in a desiccant-filled water trap and analyzed using a gas chromatography
(Agilent, Model No: 6890, Santa Clara, CA, USA) equipped with a thermal conductivity
detector (TCD) to measure the methane (CH4) content.
The solubilization yield was determined using the VS (Volatile Solids) of the
supernatant and the total slurry after pretreatment, using the following equation,
Solubilization Yield % = (VSS/VST) × 100% (1)
in which VSS is the VS of the supernatant (%), VST is the VS of the total slurry (%).
PEER-REVIEWED ARTICLE bioresources.com
Yuan et al. (2019). “Methane from corn stover,” BioResources 14(1), 1347-1363. 1354
RESULTS AND DISCUSSION
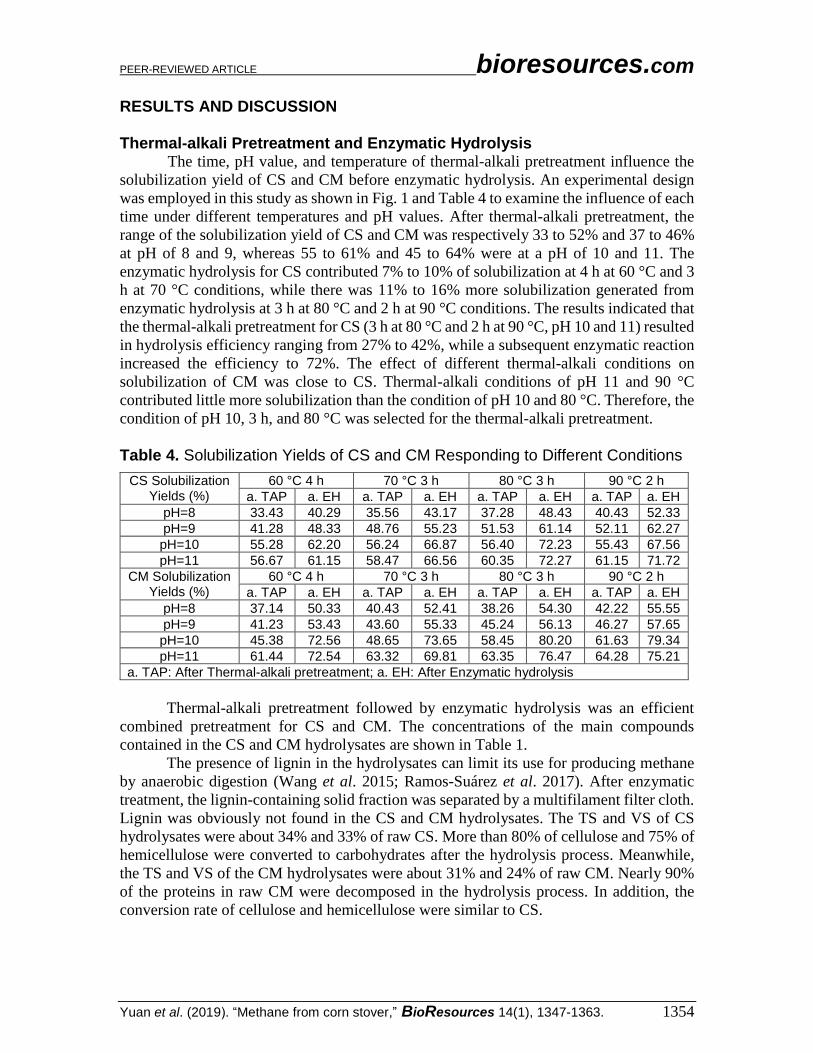
Thermal-alkali Pretreatment and Enzymatic Hydrolysis The time, pH value, and temperature of thermal-alkali pretreatment influence the
solubilization yield of CS and CM before enzymatic hydrolysis. An experimental design
was employed in this study as shown in Fig. 1 and Table 4 to examine the influence of each
time under different temperatures and pH values. After thermal-alkali pretreatment, the
range of the solubilization yield of CS and CM was respectively 33 to 52% and 37 to 46%
at pH of 8 and 9, whereas 55 to 61% and 45 to 64% were at a pH of 10 and 11. The
enzymatic hydrolysis for CS contributed 7% to 10% of solubilization at 4 h at 60 °C and 3
h at 70 °C conditions, while there was 11% to 16% more solubilization generated from
enzymatic hydrolysis at 3 h at 80 °C and 2 h at 90 °C conditions. The results indicated that
the thermal-alkali pretreatment for CS (3 h at 80 °C and 2 h at 90 °C, pH 10 and 11) resulted
in hydrolysis efficiency ranging from 27% to 42%, while a subsequent enzymatic reaction
increased the efficiency to 72%. The effect of different thermal-alkali conditions on
solubilization of CM was close to CS. Thermal-alkali conditions of pH 11 and 90 °C
contributed little more solubilization than the condition of pH 10 and 80 °C. Therefore, the
condition of pH 10, 3 h, and 80 °C was selected for the thermal-alkali pretreatment.
Table 4. Solubilization Yields of CS and CM Responding to Different Conditions
CS Solubilization Yields (%)
60 °C 4 h 70 °C 3 h 80 °C 3 h 90 °C 2 h
a. TAP a. EH a. TAP a. EH a. TAP a. EH a. TAP a. EH
pH=8 33.43 40.29 35.56 43.17 37.28 48.43 40.43 52.33
pH=9 41.28 48.33 48.76 55.23 51.53 61.14 52.11 62.27
pH=10 55.28 62.20 56.24 66.87 56.40 72.23 55.43 67.56
pH=11 56.67 61.15 58.47 66.56 60.35 72.27 61.15 71.72
CM Solubilization Yields (%)
60 °C 4 h 70 °C 3 h 80 °C 3 h 90 °C 2 h
a. TAP a. EH a. TAP a. EH a. TAP a. EH a. TAP a. EH
pH=8 37.14 50.33 40.43 52.41 38.26 54.30 42.22 55.55
pH=9 41.23 53.43 43.60 55.33 45.24 56.13 46.27 57.65
pH=10 45.38 72.56 48.65 73.65 58.45 80.20 61.63 79.34
pH=11 61.44 72.54 63.32 69.81 63.35 76.47 64.28 75.21
a. TAP: After Thermal-alkali pretreatment; a. EH: After Enzymatic hydrolysis
Thermal-alkali pretreatment followed by enzymatic hydrolysis was an efficient
combined pretreatment for CS and CM. The concentrations of the main compounds
contained in the CS and CM hydrolysates are shown in Table 1.
The presence of lignin in the hydrolysates can limit its use for producing methane
by anaerobic digestion (Wang et al. 2015; Ramos-Suárez et al. 2017). After enzymatic
treatment, the lignin-containing solid fraction was separated by a multifilament filter cloth.
Lignin was obviously not found in the CS and CM hydrolysates. The TS and VS of CS
hydrolysates were about 34% and 33% of raw CS. More than 80% of cellulose and 75% of
hemicellulose were converted to carbohydrates after the hydrolysis process. Meanwhile,
the TS and VS of the CM hydrolysates were about 31% and 24% of raw CM. Nearly 90%
of the proteins in raw CM were decomposed in the hydrolysis process. In addition, the
conversion rate of cellulose and hemicellulose were similar to CS.
PEER-REVIEWED ARTICLE bioresources.com
Yuan et al. (2019). “Methane from corn stover,” BioResources 14(1), 1347-1363. 1355
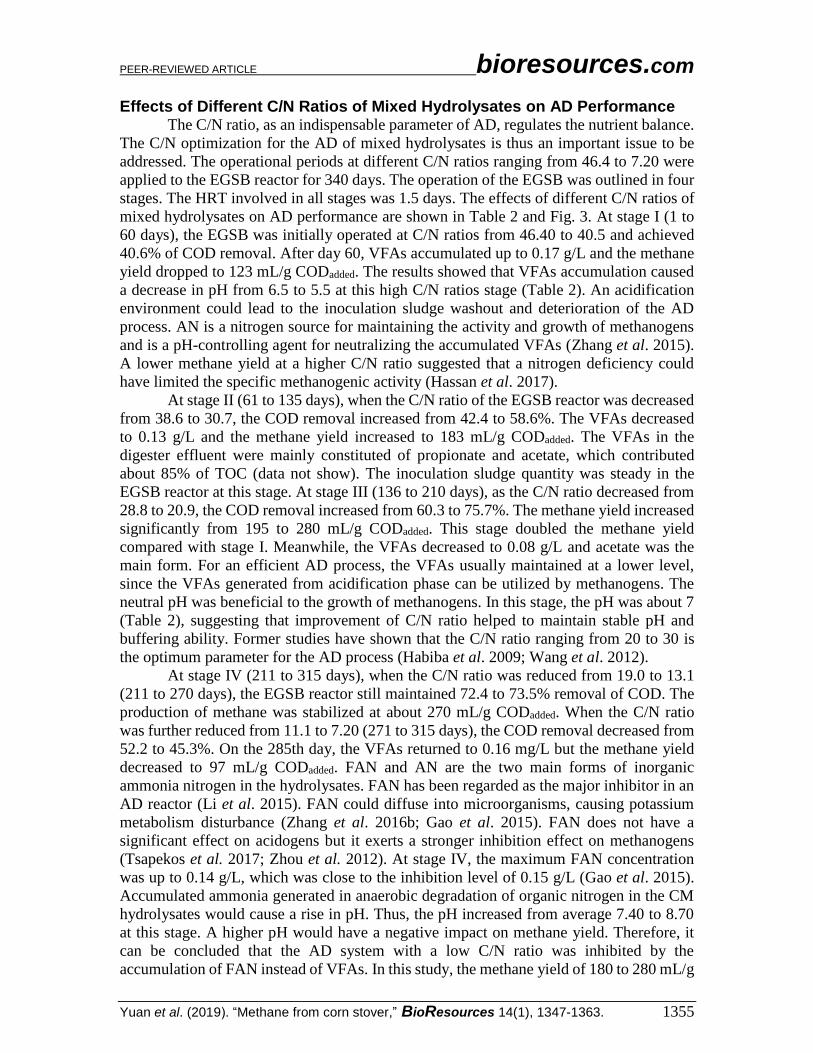
Effects of Different C/N Ratios of Mixed Hydrolysates on AD Performance The C/N ratio, as an indispensable parameter of AD, regulates the nutrient balance.
The C/N optimization for the AD of mixed hydrolysates is thus an important issue to be
addressed. The operational periods at different C/N ratios ranging from 46.4 to 7.20 were
applied to the EGSB reactor for 340 days. The operation of the EGSB was outlined in four
stages. The HRT involved in all stages was 1.5 days. The effects of different C/N ratios of
mixed hydrolysates on AD performance are shown in Table 2 and Fig. 3. At stage I (1 to
60 days), the EGSB was initially operated at C/N ratios from 46.40 to 40.5 and achieved
40.6% of COD removal. After day 60, VFAs accumulated up to 0.17 g/L and the methane
yield dropped to 123 mL/g CODadded. The results showed that VFAs accumulation caused
a decrease in pH from 6.5 to 5.5 at this high C/N ratios stage (Table 2). An acidification
environment could lead to the inoculation sludge washout and deterioration of the AD
process. AN is a nitrogen source for maintaining the activity and growth of methanogens
and is a pH-controlling agent for neutralizing the accumulated VFAs (Zhang et al. 2015).
A lower methane yield at a higher C/N ratio suggested that a nitrogen deficiency could
have limited the specific methanogenic activity (Hassan et al. 2017).
At stage II (61 to 135 days), when the C/N ratio of the EGSB reactor was decreased
from 38.6 to 30.7, the COD removal increased from 42.4 to 58.6%. The VFAs decreased
to 0.13 g/L and the methane yield increased to 183 mL/g CODadded. The VFAs in the
digester effluent were mainly constituted of propionate and acetate, which contributed
about 85% of TOC (data not show). The inoculation sludge quantity was steady in the
EGSB reactor at this stage. At stage III (136 to 210 days), as the C/N ratio decreased from
28.8 to 20.9, the COD removal increased from 60.3 to 75.7%. The methane yield increased
significantly from 195 to 280 mL/g CODadded. This stage doubled the methane yield
compared with stage I. Meanwhile, the VFAs decreased to 0.08 g/L and acetate was the
main form. For an efficient AD process, the VFAs usually maintained at a lower level,
since the VFAs generated from acidification phase can be utilized by methanogens. The
neutral pH was beneficial to the growth of methanogens. In this stage, the pH was about 7
(Table 2), suggesting that improvement of C/N ratio helped to maintain stable pH and
buffering ability. Former studies have shown that the C/N ratio ranging from 20 to 30 is
the optimum parameter for the AD process (Habiba et al. 2009; Wang et al. 2012).
At stage IV (211 to 315 days), when the C/N ratio was reduced from 19.0 to 13.1
(211 to 270 days), the EGSB reactor still maintained 72.4 to 73.5% removal of COD. The
production of methane was stabilized at about 270 mL/g CODadded. When the C/N ratio
was further reduced from 11.1 to 7.20 (271 to 315 days), the COD removal decreased from
52.2 to 45.3%. On the 285th day, the VFAs returned to 0.16 mg/L but the methane yield
decreased to 97 mL/g CODadded. FAN and AN are the two main forms of inorganic
ammonia nitrogen in the hydrolysates. FAN has been regarded as the major inhibitor in an
AD reactor (Li et al. 2015). FAN could diffuse into microorganisms, causing potassium
metabolism disturbance (Zhang et al. 2016b; Gao et al. 2015). FAN does not have a
significant effect on acidogens but it exerts a stronger inhibition effect on methanogens
(Tsapekos et al. 2017; Zhou et al. 2012). At stage IV, the maximum FAN concentration
was up to 0.14 g/L, which was close to the inhibition level of 0.15 g/L (Gao et al. 2015).
Accumulated ammonia generated in anaerobic degradation of organic nitrogen in the CM
hydrolysates would cause a rise in pH. Thus, the pH increased from average 7.40 to 8.70
at this stage. A higher pH would have a negative impact on methane yield. Therefore, it
can be concluded that the AD system with a low C/N ratio was inhibited by the
accumulation of FAN instead of VFAs. In this study, the methane yield of 180 to 280 mL/g
PEER-REVIEWED ARTICLE bioresources.com
Yuan et al. (2019). “Methane from corn stover,” BioResources 14(1), 1347-1363. 1356
CODadded is observed within the C/N range of 11 to 30, which is wider than that of 20 to
30 in previous studies (Habiba et al. 2009; Wang et al. 2012; Krishania et al. 2013; Hassan
et al. 2017). The maximum methane production reached to 280 mL/g CODadded at the C/N
ratio of 20.
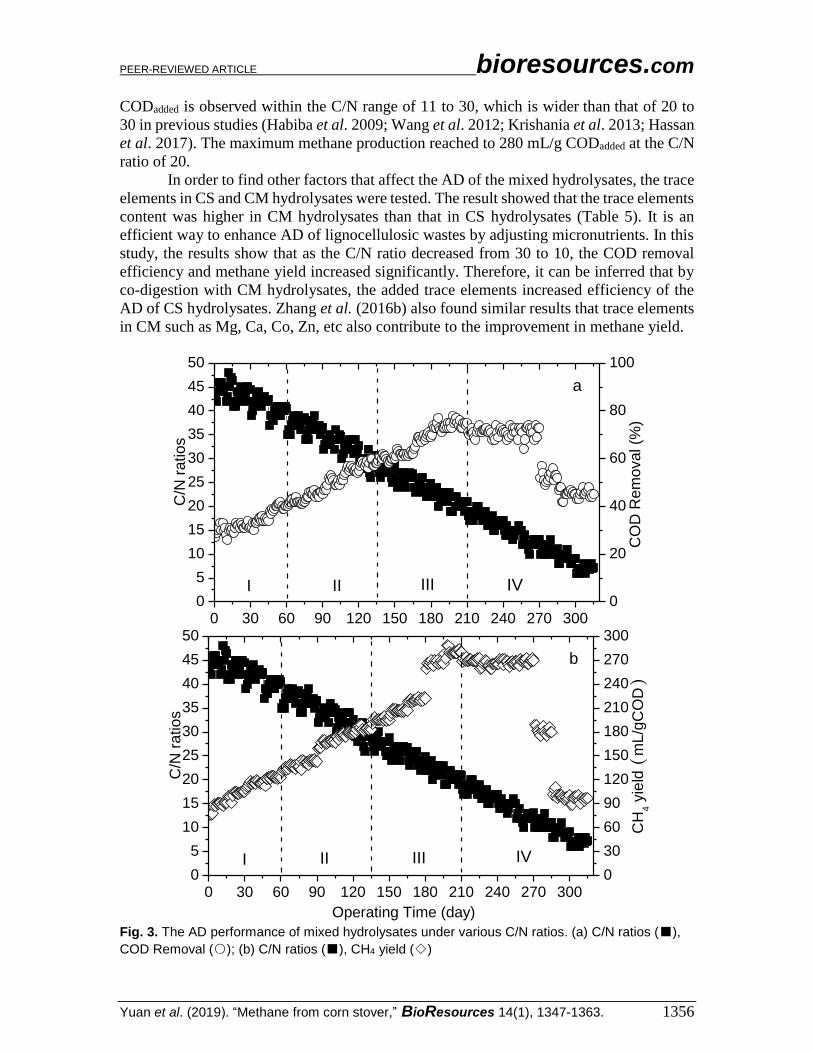
In order to find other factors that affect the AD of the mixed hydrolysates, the trace
elements in CS and CM hydrolysates were tested. The result showed that the trace elements
content was higher in CM hydrolysates than that in CS hydrolysates (Table 5). It is an
efficient way to enhance AD of lignocellulosic wastes by adjusting micronutrients. In this
study, the results show that as the C/N ratio decreased from 30 to 10, the COD removal
efficiency and methane yield increased significantly. Therefore, it can be inferred that by
co-digestion with CM hydrolysates, the added trace elements increased efficiency of the
AD of CS hydrolysates. Zhang et al. (2016b) also found similar results that trace elements
in CM such as Mg, Ca, Co, Zn, etc also contribute to the improvement in methane yield.
0 30 60 90 120 150 180 210 240 270 3000
5
10
15
20
25
30
35
40
45
50
Operating Time (day)C
OD
Rem
oval (%
)
C/N
ratios
0
20
40
60
80
100
IV
a
IIIIII
0 30 60 90 120 150 180 210 240 270 3000
5
10
15
20
25
30
35
40
45
50C
H4 y
ield
(m
L/g
CO
D)
Operating Time (day)
C/N
ra
tio
s
0
30
60
90
120
150
180
210
240
270
300
IV
b
IIIIII
Fig. 3. The AD performance of mixed hydrolysates under various C/N ratios. (a) C/N ratios (■),
COD Removal (○); (b) C/N ratios (■), CH4 yield (◇)
PEER-REVIEWED ARTICLE bioresources.com
Yuan et al. (2019). “Methane from corn stover,” BioResources 14(1), 1347-1363. 1357
Table 5. Trace Elements in CS/CM Hydrolysates and Mixed Hydrolysates in different stages
Elements CSH CMH CCH
Stage I (90th day)
in Stage II (135th day)
in Stage III (210th day)
In Stage Ⅳ
(300th day)
Na 0.11 ± 0.03
0.31 ± 0.08
0.14 ± 0.02 0.19 ± 0.07 0.24 ± 0.09 0.30 ± 0.11
K 7.67 ± 1.18
14.20 ± 2.11
8.65 ± 1.13 10.28 ± 1.86 11.91 ± 2.16 13.87 ± 2.67
Mg 2.13 ± 0.55
8.21 ± 1.78
3.04 ± 0.59 4.56 ± 0.88 6.08 ± 1.12 7.91± 1.33
Ca 4.17 ± 0.35
27.7 ± 5.32
7.70 ± 1.23 13.58 ± 2.45 19.46 ± 3.78 26.52 ± 4.15
Mn 0.77 ± 0.12
3.58 ± 0.89
1.19 ± 0.12 1.89 ± 0.14 2.60 ± 0.56 3.44 ± 1.01
Fe 0.78 ± 0.14
2.98 ± 0.87
1.11 ± 0.12 1.66 ± 0.09 2.21 ± 0.75 2.87 ± 0.98
Co 0.83 ± 0.14
0.43 ± 0.08
0.77 ± 0.06 0.67 ± 0.14 0.57 ± 0.06 0.45 ± 0.07
Zn 28.4 ± 0.94
69.2 ± 5.44
34.52 ± 5.18 44.72 ± 4.42 54.92 ± 5.14 67.16 ± 5.18
CSH: CS Hydrolysates; CMH: CM Hydrolysates; CCH: CS and CM Hydrolysates; The unit for Ca, Mg, K, Na and Fe was g/kg TS. The unit for Zn, Co and Mn was mg/kg TS.
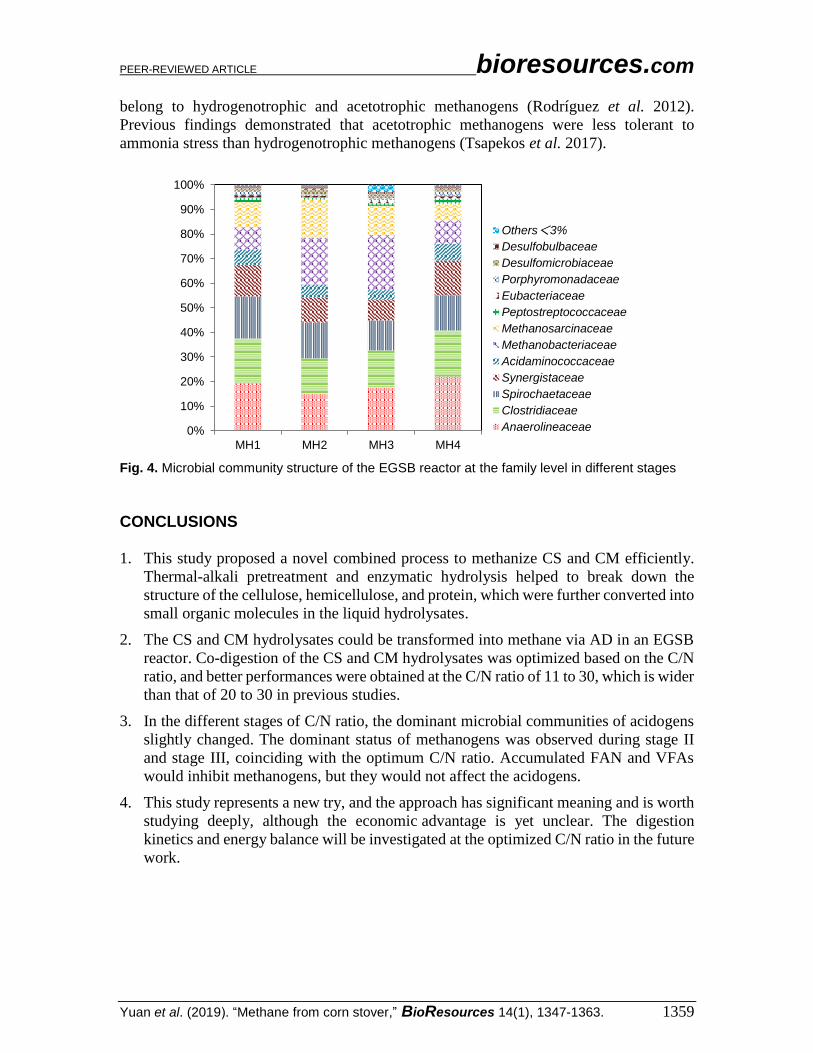
Microbial Community Structure and Dominant Species Analysis
Anaerobic digestion and C/N optimization is a complex process. It is related to a
certain C/N ratio and to the substrates utilizing the character of the microbial communities.
This change in community structure can reflect an internal response for different C/N ratio
adaptation. Each of the samples, MH1 (sample name), MH2, MH3, and MH4, were
collected in the EGSB reactor in stage I (Day 60), stage II (Day 135), stage III (Day 210),
and stage IV (Day 315), respectively (Table 3). The sequence numbers in the four samples
of MH1, MH2, MH3, and MH4 were 19456, 20187, 22470, and 20527, respectively. The
relative operational taxonomic units (OTUs) number comparison of the four samples were
MH1 > MH2 > MH3 > MH4. To examine the dynamic response of the microbial
communities at the four different stages, the classified OTUs were analyzed at the family
level (Fig. 4). Meanwhile, to identify the function of the dominant species, the classified
OTUs were analyzed at the genus level (Table 6).
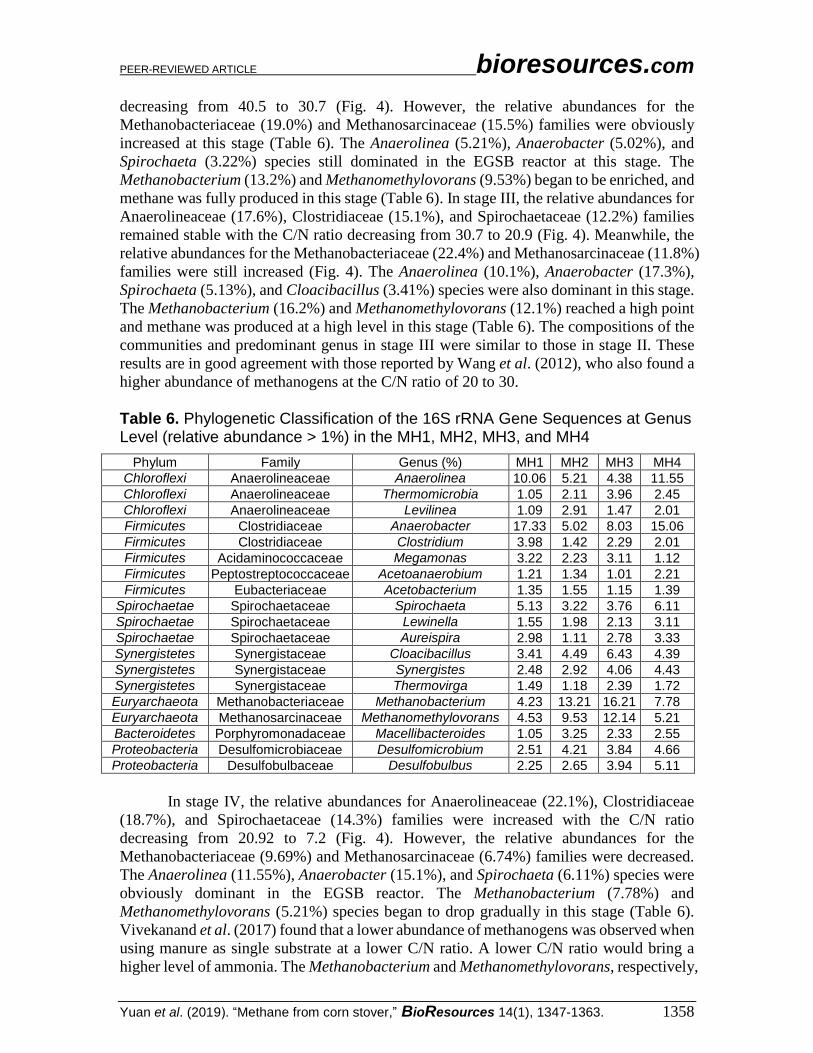
In stage I, sample MH1 was collected at a higher C/N ratio of 40.5. The results
showed the relatively high abundances for Anaerolineaceae (19.31%), Clostridiaceae
(18.2%), and Spirochaetaceae (17.1%) families in the EGSB reactor (Fig. 4). The
Anaerolinea (10.1%), Anaerobacter (17.3%), and Spirochaeta (5.13%) species as
acidogens were enriched in the EGSB reactor and capable of converting complex organic
carbon sources (i.e. hemicellulose and xylose) into VFAs (i.e. acetate and propionate)
(Yamada and Sekiguchi 2009; Yuan et al. 2014) (Table 6). Accumulated VFAs generated
by the acidogens would inhibit the methanogens. The Methanobacterium (4.23%) and
Methanomethylovorans (4.53%) species only showed relatively lower abundance (Table
6). Sun et al. (2010) found that when the C/N ratio was higher than 40, acidogens was
dominant, and the methane production had a certain influence.
In stage II, the relative abundances for Anaerolineaceae (15.9%), Clostridiaceae
(14.5%), and Spirochaetaceae (14.6%) families were decreased with the C/N ratio
PEER-REVIEWED ARTICLE bioresources.com
Yuan et al. (2019). “Methane from corn stover,” BioResources 14(1), 1347-1363. 1358
decreasing from 40.5 to 30.7 (Fig. 4). However, the relative abundances for the
Methanobacteriaceae (19.0%) and Methanosarcinaceae (15.5%) families were obviously
increased at this stage (Table 6). The Anaerolinea (5.21%), Anaerobacter (5.02%), and
Spirochaeta (3.22%) species still dominated in the EGSB reactor at this stage. The
Methanobacterium (13.2%) and Methanomethylovorans (9.53%) began to be enriched, and
methane was fully produced in this stage (Table 6). In stage III, the relative abundances for
Anaerolineaceae (17.6%), Clostridiaceae (15.1%), and Spirochaetaceae (12.2%) families
remained stable with the C/N ratio decreasing from 30.7 to 20.9 (Fig. 4). Meanwhile, the
relative abundances for the Methanobacteriaceae (22.4%) and Methanosarcinaceae (11.8%)
families were still increased (Fig. 4). The Anaerolinea (10.1%), Anaerobacter (17.3%),
Spirochaeta (5.13%), and Cloacibacillus (3.41%) species were also dominant in this stage.
The Methanobacterium (16.2%) and Methanomethylovorans (12.1%) reached a high point
and methane was produced at a high level in this stage (Table 6). The compositions of the
communities and predominant genus in stage III were similar to those in stage II. These
results are in good agreement with those reported by Wang et al. (2012), who also found a
higher abundance of methanogens at the C/N ratio of 20 to 30.
Table 6. Phylogenetic Classification of the 16S rRNA Gene Sequences at Genus Level (relative abundance > 1%) in the MH1, MH2, MH3, and MH4
Phylum Family Genus (%) MH1 MH2 MH3 MH4
Chloroflexi Anaerolineaceae Anaerolinea 10.06 5.21 4.38 11.55
Chloroflexi Anaerolineaceae Thermomicrobia 1.05 2.11 3.96 2.45
Chloroflexi Anaerolineaceae Levilinea 1.09 2.91 1.47 2.01
Firmicutes Clostridiaceae Anaerobacter 17.33 5.02 8.03 15.06
Firmicutes Clostridiaceae Clostridium 3.98 1.42 2.29 2.01
Firmicutes Acidaminococcaceae Megamonas 3.22 2.23 3.11 1.12
Firmicutes Peptostreptococcaceae Acetoanaerobium 1.21 1.34 1.01 2.21
Firmicutes Eubacteriaceae Acetobacterium 1.35 1.55 1.15 1.39
Spirochaetae Spirochaetaceae Spirochaeta 5.13 3.22 3.76 6.11
Spirochaetae Spirochaetaceae Lewinella 1.55 1.98 2.13 3.11
Spirochaetae Spirochaetaceae Aureispira 2.98 1.11 2.78 3.33
Synergistetes Synergistaceae Cloacibacillus 3.41 4.49 6.43 4.39
Synergistetes Synergistaceae Synergistes 2.48 2.92 4.06 4.43
Synergistetes Synergistaceae Thermovirga 1.49 1.18 2.39 1.72
Euryarchaeota Methanobacteriaceae Methanobacterium 4.23 13.21 16.21 7.78
Euryarchaeota Methanosarcinaceae Methanomethylovorans 4.53 9.53 12.14 5.21
Bacteroidetes Porphyromonadaceae Macellibacteroides 1.05 3.25 2.33 2.55
Proteobacteria Desulfomicrobiaceae Desulfomicrobium 2.51 4.21 3.84 4.66
Proteobacteria Desulfobulbaceae Desulfobulbus 2.25 2.65 3.94 5.11
In stage IV, the relative abundances for Anaerolineaceae (22.1%), Clostridiaceae
(18.7%), and Spirochaetaceae (14.3%) families were increased with the C/N ratio
decreasing from 20.92 to 7.2 (Fig. 4). However, the relative abundances for the
Methanobacteriaceae (9.69%) and Methanosarcinaceae (6.74%) families were decreased.
The Anaerolinea (11.55%), Anaerobacter (15.1%), and Spirochaeta (6.11%) species were
obviously dominant in the EGSB reactor. The Methanobacterium (7.78%) and
Methanomethylovorans (5.21%) species began to drop gradually in this stage (Table 6).
Vivekanand et al. (2017) found that a lower abundance of methanogens was observed when
using manure as single substrate at a lower C/N ratio. A lower C/N ratio would bring a
higher level of ammonia. The Methanobacterium and Methanomethylovorans, respectively,
PEER-REVIEWED ARTICLE bioresources.com
Yuan et al. (2019). “Methane from corn stover,” BioResources 14(1), 1347-1363. 1359
belong to hydrogenotrophic and acetotrophic methanogens (Rodríguez et al. 2012).
Previous findings demonstrated that acetotrophic methanogens were less tolerant to
ammonia stress than hydrogenotrophic methanogens (Tsapekos et al. 2017).
Fig. 4. Microbial community structure of the EGSB reactor at the family level in different stages
CONCLUSIONS
1. This study proposed a novel combined process to methanize CS and CM efficiently.
Thermal-alkali pretreatment and enzymatic hydrolysis helped to break down the
structure of the cellulose, hemicellulose, and protein, which were further converted into
small organic molecules in the liquid hydrolysates.
2. The CS and CM hydrolysates could be transformed into methane via AD in an EGSB
reactor. Co-digestion of the CS and CM hydrolysates was optimized based on the C/N
ratio, and better performances were obtained at the C/N ratio of 11 to 30, which is wider
than that of 20 to 30 in previous studies.
3. In the different stages of C/N ratio, the dominant microbial communities of acidogens
slightly changed. The dominant status of methanogens was observed during stage II
and stage III, coinciding with the optimum C/N ratio. Accumulated FAN and VFAs
would inhibit methanogens, but they would not affect the acidogens.
4. This study represents a new try, and the approach has significant meaning and is worth
studying deeply, although the economic advantage is yet unclear. The digestion
kinetics and energy balance will be investigated at the optimized C/N ratio in the future
work.
0%
10%
20%
30%
40%
50%
60%
70%
80%
90%
100%
MH1 MH2 MH3 MH4
Others<3%
Desulfobulbaceae
Desulfomicrobiaceae
Porphyromonadaceae
Eubacteriaceae
Peptostreptococcaceae
Methanosarcinaceae
Methanobacteriaceae
Acidaminococcaceae
Synergistaceae
Spirochaetaceae
Clostridiaceae
Anaerolineaceae
PEER-REVIEWED ARTICLE bioresources.com
Yuan et al. (2019). “Methane from corn stover,” BioResources 14(1), 1347-1363. 1360
ACKNOWLEDGMENTS
The authors are grateful for the financial support from the Special Guidance Funds
for Agricultural Science and Technology Innovation of Yancheng City (Grant No.
yk2016030), from the Postgraduate Research and Practice Innovation Program of Jiangsu
Province (Grant No. SJCX17-YG02), from the National Natural Science Foundation of
China (NSFC, Grant No. 51608467), from the Open Project of Key Laboratory of
Environmental Biotechnology, CAS (Grant No. kf2016005), from the Open Project of
State Key Laboratory of Urban Water Resource and Environment (Grant No. QA201716),
and from the Joint Open Fund of Jiangsu Collaborative Innovation Center for Ecological
Building Material and Environmental Protection Equipment and Key Laboratory for
Advanced Technology in Environmental Protection of Jiangsu Province.
REFERENCES CITED
Abada, E. A., Masrahi, Y., Abboud, M. A., Alnashiri, H. M., and El-Gayar, K. E. (2018).
“Bioethanol production with cellulase enzyme from Bacillus cereus isolated from
sesame seed residue from the Jazan region,” BioResources 13(2), DOI:
10.15376/biores.13.2.3832-3845
American Public Health Association (APHA) (2005). Standard Methods for the
Examination of Water and Wastewater (21st Ed.), Washington, DC, USA.
Awais, M., Gulfraz, M., Asad, M. J., Kabir, F., Khan, K. S., and Naqvi, S. M. Z. A.
(2018). “Mesophilic anaerobic co-digestion of cattle manure with Malus domestica
and Dalbergia sissoo during biomethane potential assays,” BioResources 13(2),
3144-3156. DOI: 10.15376/biores.13.2.3144-3156
Ding, S., Liu, Y., Zeng, Y., Himmel, M. E., Baker, J. O., and Bayer, E. A. (2012). “How
does plant cell wall nanoscale architecture correlate with enzymatic digestibility,”
Science 338(6110), 1055-1060. DOI: 10.1126/science.1227491
Fu, S., Fei, W., Yuan, X., Yang, Z., Luo, S., Wang, C., and Guo, R. (2015). “The
thermophilic (55 °C) microaerobic pretreatment of corn straw for anaerobic
digestion,” Bioresource Technol. 175(7), 203-208. DOI:
10.1016/j.biortech.2014.10.072
Gao, S., Zhao, M., Chen, Y., Yu, M., and Ruan, W. (2015). “Tolerance response to in situ
ammonia stress in a pilot-scale anaerobic digestion reactor for alleviating ammonia
inhibition,” Bioresource Technol. 198, 203-208. DOI: 10.1016/j.biortech.2015.09.044
Habiba, L., Hassib, B., and Moktar, H. (2009). “Improvement of activated sludge
stabilization and filterability during anaerobic digestion by fruit and vegetable waste
addition,” Bioresource Technol. 99(4), 1555-1560. DOI:
10.1016/j.biortech.2008.09.019
Hassan, M., Ding, W., Umar, M., Hei, K., Bi, J., and Shi, Z. (2017). “Methane
enhancement and asynchronism minimization through co-digestion of goose manure
and NaOH solubilized corn stover with waste activated sludge,” Energy 118, 1256-
1263. DOI: 10.1016/j.energy.2016.11.007
Kalamaras, S. D., and Kotsopoulos, T. A. (2014). “Anaerobic co-digestion of cattle
manure and alternative crops for the substitution of maize in South Europe,”
Bioresource Technol. 172, 68-75. DOI: 10.1016/j.biortech.2014.09.005
Khatri, S., Wu, S., Kizito, S., Zhang, W., Li, J., and Dong, R. (2015). “Synergistic effect
PEER-REVIEWED ARTICLE bioresources.com
Yuan et al. (2019). “Methane from corn stover,” BioResources 14(1), 1347-1363. 1361
of alkaline pretreatment and Fe dosing on batch anaerobic digestion of maize straw,”
Appl. Energ. 158(3), 55-64. DOI: 10.1016/j.apenergy.2015.08.045
Krishania, M., Vijay, V. K., and Chandra, R. (2013). “Methane fermentation and kinetics
of wheat straw pretreated substrates co-digested with cattle manure in batch assay,”
Energy 57(8), 359-367. DOI: 10.1016/j.energy.2013.05.028
Li, D., Liu, S., Mi, L., Li, Z., Yuan, Y., Yan, Z., and Liu, X. (2015). “Effects of feedstock
ratio and organic loading rate on the anaerobic mesophilic co-digestion of rice straw
and cow manure,” Bioresource Technol. 189, 319-326. DOI:
10.1016/j.biortech.2015.04.033
Li, J., Wei, L., Duan, Q., Hu, G., and Zhang, G. (2014). “Semi-continuous anaerobic co-
digestion of dairy manure with three crop residues for biogas production,”
Bioresource Technol. 156(2), 307-313. DOI: 10.1016/j.biortech.2014.01.064
Mehryar, E., Ding, W., Hemmat, A., Talha, Z., Hassan, M., Mamat, T., and Hei, K.
(2017). “Anaerobic co-digestion of oil refinery wastewater with bagasse; Evaluating
and modeling by neural network algorithms and mathematical equations,”
BioResources 12(4), 7325-7340. DOI: 10.15376/biores.12.4.7325-7340
Nkemka, V. N., and Murto, M. (2013). “Biogas production from wheat straw in batch
and UASB reactors: The roles of pretreatment and seaweed hydrolysate as a co-
substrate,” Bioresource Technol. 128(1), 164-172. DOI:
10.1016/j.biortech.2012.10.117
Odnell, A., Recktenwald, M., Stensén, K., Jonsson, B. H., and Karlsson, M. (2016).
“Activity, life time and effect of hydrolytic enzymes for enhanced biogas production
from sludge anaerobic digestion,” Water Res. 103, 462-471. DOI:
10.1016/j.watres.2016.07.064
Ramos-Suárez, J. L., Gómez, D., Regueiro, L., Baeza, A., and Hansen, F. (2017).
“Alkaline and oxidative pretreatments for the anaerobic digestion of cow manure and
maize straw: Factors influencing the process and preliminary economic viability of an
industrial application,” Bioresource Technol. 241, 10-20. DOI:
10.1016/j.biortech.2017.05.054
Risberg, K., Sun, L., Levén, L., Horn, S. J., and Schnürer, A. (2013). “Biogas production
from wheat straw and manure--Impact of pretreatment and process operating
parameters,” Bioresource Technol. 149(3), 232-237. DOI:
10.1016/j.biortech.2013.09.054
Rodríguez, E., Lopes, A., Fdz-Polanco, M., Stams, A. J., and García-Encina, P. A.
(2012). “Molecular analysis of the biomass of a fluidized bed reactor treating
synthetic vinasse at anaerobic and micro-aerobic conditions,” Appl. Microbiol.
Biotechnol. 93(5), 2181-2191. DOI: 10.1007/s00253-011-3529-3
Shokrkar, H., Ebrahimi, S., and Zamani, M. (2018). “Enzymatic hydrolysis of microalgal
cellulose for bioethanol production, modeling and sensitivity analysis,” Fuel 228, 30-
38. DOI: 10.1016/j.fuel.2018.04.143
Song, Z., and Zhang, C. (2015). “Anaerobic codigestion of pretreated wheat straw with
cattle manure and analysis of the microbial community,” Bioresource Technol. 186,
128-135. DOI: 10.1016/j.biortech.2015.03.028
Sun, S., Pellicer, I. N. C., Merkey, B., Qi, Z., Xia, S., Yang, D., Sun, J., and Smets, B. F.
(2010). “Effective biological nitrogen removal treatment processes for domestic
wastewaters with low C/N ratios: A review,” Environ. Eng. Sci. 27(2), 111-126. DOI:
10.1089/ees.2009.0100
Tsapekos, P., Kougias, P. G., Treu, L., Campanaro, S., and Angelidaki, I. (2017).
PEER-REVIEWED ARTICLE bioresources.com
Yuan et al. (2019). “Methane from corn stover,” BioResources 14(1), 1347-1363. 1362
“Process performance and comparative metagenomic analysis during co-digestion of
manure and lignocellulosic biomass for biogas production,” Appl. Energ. 185, 126-
135. DOI: 10.1016/j.apenergy.2016.10.081
Van Soest, P. J., Robertson, J. B., and Lewis, B. A. (1991). “Carbohydrate methodology,
metabolism, and nutritional implications in dairy cattle: Methods for dietary fiber,
neutral detergent fiber, and nonstarch polysaccharides in relation to animal nutrition,”
J. Dairy Sci. 74 (10), 3583-3597. DOI: 10.3168/jds.S0022-0302(91)78551-2
Vivekanand, V., Mulat, D. G., Eijsink, V. G. H., and Horn, S. J. (2017). “Synergistic
effects of anaerobic co-digestion of whey, manure and fish ensilage,” Bioresource
Technol. 249(4), 35-41. DOI: 10.1016/j.biortech.2017.09.169
Wang, H., Tao, Y., Temudo, M., Schooneveld, M., Bijl, H., Ren, N., Wolf, M., Heine, C.,
Foerste, A., Pelenc, V., Kloek, J., Lier, J. B. V., and Kreuk, M. D. (2015). “An
integrated approach for efficient biomethane production from solid bio-wastes in a
compact system,” Biotechnol. Biofuels 8(1), 1-14. DOI: 10.1186/s13068-015-0237-8
Wang, X., Yang, G., Feng, Y., Ren, G., and Han, X. (2012). “Optimizing feeding
composition and carbon-nitrogen ratios for improved methane yield during anaerobic
co-digestion of dairy, chicken manure and wheat straw,” Bioresource Technol.
120(8), 78-83. DOI: 10.1016/j.biortech.2012.06.058
Wei, Y., Li, X., Yu, L., Zou, D., and Yuan, H. (2015). “Mesophilic anaerobic co-
digestion of cattle manure and corn stover with biological and chemical
pretreatment,” Bioresource Technol. 198(1), 431-436. DOI:
10.1016/j.biortech.2015.09.035
Yamada, T., and Sekiguchi, Y. (2009). “Cultivation of uncultured Chloroflexi subphyla:
Significance and ecophysiology of formerly uncultured Chloroflexi 'subphylum I'
with natural and biotechnological relevance,” Microbes. Environ. 24(3), 205-216.
DOI: 10.1264/jsme2.ME09151S
Yang, Q., Wang, H., Larson, R. A., and Runge, T. (2017). “Comparative study of
chemical pretreatments of dairy manure for enhanced biomethane production,”
BioResources 12(4), 7363-7375. DOI: 10.15376/biores.12.4.7363-7375
Yuan, Y., Chen, C., Liang, B., Huang, C., Zhao, Y., Xu, X., Tan, W., Zhou, X., Gao, S.,
Sun, D., Lee, D., Zhou, J., and Wang, A. (2014). “Fine-tuning key parameters of an
integrated reactor system for the simultaneous removal of cod, sulfate, and
ammonium and elemental sulfur reclamation,” J. Hazard. Mater. 269(4), 56-67. DOI:
10.1016/j.jhazmat.2013.12.014
Yuan, H., Li, R., Zhang, Y., Li, X., Liu, C., Ying, M., Lin, M., and Yang, Z. (2015).
“Anaerobic digestion of ammonia-pretreated corn stover,” Biosyst. Eng. 129, 142-
148. DOI: 10.1016/j.biosystemseng.2014.09.010
Zhai, N., Zhang, T., Yin, D., Yang, G., Wang, X., Ren, G., and Feng, Y. (2015). “Effect
of initial pH on anaerobic co-digestion of kitchen waste and cow manure,” Waste
Manage. 38(1), 126-131. DOI: 10.1016/j.wasman.2014.12.027
Zhang, T., Mao, C., Zhai, N., Wang, X., and Yang, G. (2015). “Influence of initial pH on
thermophilic anaerobic co-digestion of swine manure and maize stalk,” Waste
Manage. 35(7), 119-126. DOI: 10.1016/j.wasman.2014.09.004
Zhang, C., Pei, H., Wang, S., Cui, Z., and Liu, P. (2016a). “Enhanced enzymatic
hydrolysis of poplar after combined dilute NaOH and fenton pretreatment,”
BioResources 11(3), 7522-7536. DOI: 10.15376/biores.11.3.7522-7536
Zhang, Z., Zhang, G., Li, W., Li, C., and Xu, G. (2016b). “Enhanced biogas production
from sorghum stem by co-digestion with cow manure,” Int. J. Hydrogen Energ. 41,
PEER-REVIEWED ARTICLE bioresources.com
Yuan et al. (2019). “Methane from corn stover,” BioResources 14(1), 1347-1363. 1363
9153-9158. DOI: 10.1016/j.ijhydene.2016.02.042
Zhou, S., Zhang, Y., and Dong, Y. (2012). “Pretreatment for biogas production by
anaerobic fermentation of mixed corn stover and cow dung,” Energy 46(1), 644-648.
DOI: 10.1016/j.energy.2012.07.017
Article submitted: August 16, 2018; Peer review completed: October 11, 2018; Revised
version received and accepted: December 20, 2018; Published: January 7, 2019.
DOI: 10.15376/biores.14.1.1347-1363
Related Documents