1 Peer Monitoring and Enforcement: Long Term Evidence from Microcredit Lending Groups with and without Group Liability * Xavier Giné World Bank Dean S. Karlan Yale University, Innovations for Poverty Action, and Jameel Poverty Action Lab January, 2008 ABSTRACT The group liability contract feature is often named as key to the growth in lending markets for the poor. Group liability purports to improve repayment rates by providing incentives for peers to screen, monitor and enforce each other’s loans. However, group liability may create excessive pressure and discourage good clients from borrowing, jeopardizing both growth and sustainability. A Philippine bank removed group liability from randomly selected group-screened lending groups. After three years, we find no increase in default and larger groups, thus showing that banks can do just as well as peers at monitoring and enforcing loans and generating high repayment rates. JEL: C93, D71, D82, D91, G21, O12, O16, O17 Keywords: microfinance, group lending, group liability, joint liability, social capital, micro- enterprises, informal economies, access to finance * Contact information: [email protected], [email protected]. We are grateful to the World Bank Research Committee, the National Science Foundation CAREER SES-0547898, and the Bill and Melinda Gates Foundation through the Financial Access Initiative for funding this research. We thank Tessa Bold, Jim Engle-Warwick, Karla Hoff, Kate Johnson, Jonathan Morduch, Mark Schreiner, Chris Udry, Bruce Wydick, Dean Yang, and seminar and several conference participants for comments on this project. We thank John Owens and the USAID/Philippines Microenterprise Access to Banking Services Program team for helping us coordinate the project and the Office of Population Studies at University of San Carlos for collaborating on the field work. We also thank Tomoko Harigaya and Melissa Scudo for superb research assistance. We thank Omar Andaya, Gerald Guillen, Zaldy Mantilla, Monette Perez, and the field staff of Green Bank for implementing the experimental protocols.

Welcome message from author
This document is posted to help you gain knowledge. Please leave a comment to let me know what you think about it! Share it to your friends and learn new things together.
Transcript
1
Peer Monitoring and Enforcement:
Long Term Evidence from Microcredit Lending Groups with
and without Group Liability*
Xavier Giné World Bank
Dean S. Karlan Yale University,
Innovations for Poverty Action, and Jameel Poverty Action Lab
January, 2008
ABSTRACT The group liability contract feature is often named as key to the growth in lending markets for the poor. Group liability purports to improve repayment rates by providing incentives for peers to screen, monitor and enforce each other’s loans. However, group liability may create excessive pressure and discourage good clients from borrowing, jeopardizing both growth and sustainability. A Philippine bank removed group liability from randomly selected group-screened lending groups. After three years, we find no increase in default and larger groups, thus showing that banks can do just as well as peers at monitoring and enforcing loans and generating high repayment rates. JEL: C93, D71, D82, D91, G21, O12, O16, O17 Keywords: microfinance, group lending, group liability, joint liability, social capital, micro-enterprises, informal economies, access to finance
*Contact information: [email protected], [email protected]. We are grateful to the World Bank Research Committee, the National Science Foundation CAREER SES-0547898, and the Bill and Melinda Gates Foundation through the Financial Access Initiative for funding this research. We thank Tessa Bold, Jim Engle-Warwick, Karla Hoff, Kate Johnson, Jonathan Morduch, Mark Schreiner, Chris Udry, Bruce Wydick, Dean Yang, and seminar and several conference participants for comments on this project. We thank John Owens and the USAID/Philippines Microenterprise Access to Banking Services Program team for helping us coordinate the project and the Office of Population Studies at University of San Carlos for collaborating on the field work. We also thank Tomoko Harigaya and Melissa Scudo for superb research assistance. We thank Omar Andaya, Gerald Guillen, Zaldy Mantilla, Monette Perez, and the field staff of Green Bank for implementing the experimental protocols.
2
I. Introduction
Group liability is often cited as a key innovation responsible for the expansion of access to
credit for the poor in developing countries (Morduch 1999; Armendariz de Aghion and Morduch
2005; Microcredit Summit Campaign 2005). This contract feature purports to solve a credit market
failure by mitigating adverse selection and moral hazard problems. Under group liability, clients
have an incentive to screen other clients so that only trustworthy individuals are allowed into the
program. In addition, clients will make sure that funds are invested properly and effort exerted.
Finally, enforcement is enhanced because clients face peer pressure, not just legal pressure, to
repay their loans. Thus, by effectively shifting the responsibility of certain tasks from the lender to
the clients, group liability claims to overcome information asymmetries typically found in credit
markets, especially for households without collateral.
Group liability could also be seen as a tax, effectively increasing the net interest rate on
borrowers. Little is known about sensitivity to interest rates at the household level (Attanasio,
Goldberg and Kyriazidou 2000; Karlan and Zinman 2007a). Measuring the elasticity of demand
with respect to group versus individual liability is important both in order to understand the net
“demand” effect of this important loan characteristic, but also for forming credit market policy to
help deepen the quantity and quality of access to finance for the poor.
The basic empirical question of the relative merits of group versus individual liability has
remained unanswered for many reasons of endogeneity. Merely comparing performance of one
product versus another, within or across lenders, fails to establish a causal relationship between the
contract terms and outcomes such as repayment, selection, or welfare, due to countless unobserved
characteristics that drive individual selection into one contract or the other, as well as institutional
choices on what to offer, and how. Lenders typically chose the credit contract based on the context

3
in which they operate. Morduch (1999) and Armendariz de Aghion and Morduch (2005) point out
in their microfinance reviews that the performance of group liability contracts in developing
countries indeed has been very diverse.1 Thus far, however, since most claims are supported with
anecdotes, we still lack good evidence on the relative importance of group liability vis a vis the
other mechanisms, such as dynamic incentives, regular public repayments, etc. found in “group
lending” schemes. Quoting Armendariz de Aghion and Morduch (2005),
“The best evidence would come from well-designed, deliberate experiments in which loan contracts are varied but everything else is kept the same.” This is precisely the goal of the paper. We use a randomized control trial conducted by the
Green Bank of Caraga in the Philippines to evaluate the efficacy of group liability relative to
individual liability on the monitoring and enforcement of loans. Half of Green Bank’s existing
group-lending centers in Leyte, an island in central Philippines, were randomly converted to
individual liability. Note that this implies that the “baseline” clients, those already receiving loans
at the time of the conversion, were already screened using group liability. We then examine
whether, after the peer screening, group liability has any additional effect on the mitigation of
moral hazard through improved monitoring or enforcement.
The separation of adverse selection from moral hazard is one of the most difficult empirical
challenges when studying information asymmetries in credit markets.2 The “surprise” factor of this
design, created by generating a sample of borrowers that select under one contract regime but then
monitors and enforces repayment under another, allows for a cleaner test of theory than offering
one method to some individuals and another method to other individuals. This is useful both
academically and practically in the design of products. However, it also limits the immediate
1 See also Adams and Ladman (1979) and Desai (1983). On anecdotal evidence on the limits to joint liability, see Matin (1997), Woolcock (1999) Montgomery (1996) and Rahman (1999). 2 See Karlan and Zinman (2007b) for an interest rate experiment which also separately identifies adverse selection and moral hazard in a South Africa credit market.

4
policy prescriptions since the treatment conducted here is not a viable long-term product for a
lender (one cannot perpetually “surprise” borrowers). Individuals selected under group liability
may be different (e.g., safer) than those selected under individual liability. Although we focus on
baseline (“surprise”) clients, we also present results from new members, that is, those that joined
the program after the removal of the joint liability clause. This allows us to answer some (more
limited) questions on selection as well, and we discuss this more in the conclusion.
After following participants in the study for three years, we find no change in repayment for
those centers converted to individual liability. In earlier work, with one-year results, we also found
no change in repayment (Giné and Karlan 2006). We also find higher client growth in converted
centers, and evidence that it is because new clients are more likely to remain in the program
(whereas the “baseline” clients, who have larger loans, are more likely to leave under the individual
liability structure). In auxiliary data collected on internal procedures, we find direct evidence that
individual liability leads to less monitoring of each other’s loan (although as noted, this lowered
monitoring does not lead to higher default). Lastly, we find that those with weaker social networks
prior to the conversion are more likely to experience default problems after conversion to
individual liability, relative to those who remain under group liability. In sum, as conversions from
group to individual liability become more commonplace in the microfinance community, we take
an important step towards understanding whether and how such conversions work.
The rest of the paper is organized as follows. Section II provides both the background for
this paper, including a discussion of the importance of these issues in the microfinance industry as
well as the relevant theoretical academic literature. Section III presents the experimental design
and the administrative and survey data we collected. Section IV presents the empirical strategy and
primary results on the impact of group versus individual lending on center and individual
5
performance. Then, section V presents results from three surveys conducted one year after the
initial conversion in order to learn more about the mechanism through which changes did or did not
occur. Section VI concludes.
II. Background
Microfinance Trends
In recent years, some micro-lenders, such as the Association for Social Advancement
(ASA) in Bangladesh, have expanded rapidly using individual liability loans but still maintaining
group meetings for the purpose of coordinating transactions. Others, like BancoSol in Bolivia,
have converted a large share of its group liability portfolio into individual liability lending. Even
the Grameen Bank in Bangladesh, whose founder Mr. Yunus won the 2006 Nobel Peace Prize, has
recently relaxed the group liability clause in the Grameen II program by allowing defaulters to
renegotiate their loans without invoking group pressure. Many of these groups (e.g., ASA) have
made this shift while still keeping the “group” intact. Thus, while liability is individualized, the
group process helps lenders lower their transaction costs (by consolidating and simplifying loan
disbursal and collection logistics) while possibly maintaining some but not all of the peer
screening, monitoring or enforcement elements due to reputation and shame. The shift to
individual liability is not merely the Grameen Bank and a few other large, well-known lenders, but
many lenders around the world are following the lead of the large, well-known lenders. Many
policymakers have been advising lenders who seek to expand more rapidly (such as the Green
Bank of Caraga, with whom we conducted this field experiment) to engage in individual liability
rather than group liability.
6
This shift from group liability to individual liability loans has accelerated as the
microfinance community learns about some of the pitfalls of group liability lending. First, clients
dislike the tension caused by group liability. Excessive tension among members is not only
responsible for voluntary dropouts but worse still, can also harm social capital among members,
which is particularly important for the existence of safety nets. Second, bad clients can “free ride”
off of good clients causing default rates to rise. In other words, a client does not repay the loan
because she believes that another client will pay it for her, and the bank is near indifferent because
it still gets its money back. Third, group liability is more costly for clients that are good risks
because they are often required to repay the loans of their peers. This may lead to higher dropout
and more difficulty in attracting new clients. Finally, as groups mature, clients typically diverge in
their demand for credit. Heterogeneity in loan sizes can result in tension within the group as clients
with smaller loans are reluctant to serve as a guarantor for those with larger loans. In sum, while
repayment may improve under group liability, the client base may be smaller, so it remains unclear
whether group liability improves the lender’s overall profitability and the poor’s access to financial
markets.
Throughout this paper we maintain an important distinction between “group liability” and
“group lending.” “Group liability” refers to the terms of the actual contract, whereby individuals
are both borrowers and simultaneously guarantors of other clients’ loans. “Group lending” merely
means there is some group aspect to the process or program, perhaps only logistical, like the
sharing of a common meeting time and place to make payments. The heart of this paper is testing
whether the removal of group liability from a “merely logistical” group lending program leads to
higher or lower repayment rates, client retention and to changes in group cohesion.
7
Theoretical Background
The theoretical literature on joint liability builds on an earlier contract theory literature from
the early 1990s that studies when a principal should contract with a group of agents to encourage
side-contracts between them as opposed to contracting individually with each agent.3
In a survey article, Ghatak and Guinnane (1999) summarize the literature on joint liability
by identifying four channels through which this contract feature can help institutions improve
repayment: (i) adverse selection: ascertaining the riskiness of borrowers (Ghatak (1999; 2000),
N’Guessan and Laffont (2000), and Sadoulet (2000)) or by the insurance effect that results from
diversification even if borrowers do not know each other well (Armendariz de Aghion and Gollier
(2000)), (ii) ex-ante moral hazard: ensuring that the funds will be used properly (Stiglitz (1990)
and Laffont and Rey (2000)), (iii) monitoring: ensuring that the borrower tells the truth in case of
default about her ability to pay, (iv) voluntary default, or ex-post moral hazard: enforcing
repayment if the borrower is reluctant to pay (Besley and Coate (1995)). Group liability contracts
in theory can lead to higher repayment because borrowers have better information about each
other’s types, can better monitor each other’s investment, and may be able to impose powerful non-
pecuniary social sanctions at low cost.
However, there are other theories that suggest that group liability may instead jeopardize
repayment. For example, Besley and Coate (1995) point out that borrowers who would repay
under individual liability may not do so under group liability. This situation may arise if members
realize that they cannot repay as a group. In this situation, since no further loans will be granted (if
rules are adhered to), members that could otherwise repay decide to default because the incentive
of future credit is not longer present. This model also demonstrates that social collateral can help
3 Examples of this literature include, but are not limited to Holmstrom and Milgrom (1990), Varian (1990) and Arnott and Stiglitz (1991).
8
make joint liability work better than individual liability (baring the strategic default situation
mentioned above). However, Sadoulet (2000) argues that “social collateral” induced by group
liability is not sufficient to ensure high repayment rates. Chowdhury (2005) develops a model that
abstracts from adverse selection but shows that joint liability alone cannot mitigate an ex-ante
moral hazard problem. In his model, either sequential lending as introduced by the Grameen Bank,
where borrowers in a group do not all get the loan at the same time but sequentially, or monitoring
by the lender combined with joint liability, makes group-lending contracts feasible. Despite being
less efficient than peer monitoring, if monitoring by the lender is not too costly, then contracts that
stipulate only monitoring by the lender may also be feasible, such as the individual liability
contract of Green Bank of Caraga in the Philippines studied here (and put forward by ASA in
Bangladesh, as discussed earlier), which keeps the group “logistical” aspects of the program but
removes the joint liability.
Even if joint liability does not jeopardize repayment, theory also suggests it may do no
better than individual liability. Rai and Sjostrom (2004) show that both individual and group
liability alone can be dominated by a contract that elicits truthful revelation about the success of the
peers’ project. In their setup, high repayment is triggered by the ability of banks to impose non-
pecuniary punishments to members according to their reports about their success and that of others.
More importantly, if borrowers can write contracts with one another (i.e., side-contract), the
effectiveness of group liability contracts will be limited.
Despite being the focus of much of the theoretical literature on group liability, repayment is
only one outcome of interest to the lender, because its ability to retain good borrowers and attract
9
new ones is equally important to assess the overall profitability. Indeed, an institution with perfect
repayment may be more profitable with lower repayment but a larger client base.4
III. Experimental Design and Data Collected
A. Experimental Design
The Green Bank of Caraga, a for-profit, regulated rural bank operating in central
Philippines, conducted a field experiment in which they removed the group liability component of
their Grameen-style5 group liability program, called BULAK.6 Typically a center starts with 15-30
individuals residing in the same barangay (community). Centers grow in size as demand increases,
without predetermined maximum sizes. Within each center, members divide into groups of five.
Under the normal group liability system, those in the group of five are the first layer of liability for
any default. Only if those five fail to pay the arrearage of an individual is the center as a whole
responsible for an individual.7 New members joining an existing center are also assigned into
groups after mutual agreement is reached. If at one point in time there are enough new members to
form a new group of five, they may do so. Across the central Philippines, Green Bank has over
12,000 clients in over 400 BULAK centers in 27 branches. This study was conducted on the island
of Leyte, and all 169 centers on the island were included in the sample frame.
4 In related papers, Madajewicz (2005) and Conning (2005) study when monitoring is best done by the lender
and when it is best left to the peers. They both find that wealthier clients prefer individual liability loans. We cannot test the validity of this prediction because in this field experiment, loans are not backed by any form of physical collateral, so comparable (and relatively poor) borrowers are subject to one or the other form of liability. 5 This is a Grameen “style” program since the bank conducts some basic credit evaluation, and does not rely entirely on peer selection. The bank’s evaluation steps include essentially two components: physically visiting the business or home to verify the presence of the enterprise and its size, and an assessment of the repayment capacity of borrowers based on the client-reported cash-flows of their enterprise. 6 Bulak means flower in Tagalog, but is also the acronym for Bangong Ug Lihok Alang sa Kalambuan, which means “Strive for Progress.” 7 Although many institutions that have this two-tier structure on paper do not enforce it in practice, Green Bank does enforce it. The payment of all members in a group is collected by the credit officer from group officials at the meetings. In addition, group members sign as co-makers for the rest of group members, thereby becoming the first to be liable if another group member is in default.

10
All loans under the BULAK program are given to micro-entrepreneurial women for their
business expansion. The initial loan is between 1,000 - 5,000 pesos (roughly $18 - $90).8 The
increase in loan size depends on repayment of their last loan, attendance at meetings, business
growth, and contribution to their personal savings. The interest rate is 2.5 percent per month,
calculated over the original balance of the loan. The client has between 8-25 weeks to repay the
loan, but payments must be made on a weekly basis during the center meeting.
As part of the BULAK program, clients are also required to make mandatory savings
deposits at each meeting. At loan disbursal, each member deposits 100 pesos plus two percent of
the loan amount into savings. In addition, each member must pay an additional ten percent of their
weekly due amount (principal plus interest) into their individual savings account. Member savings
may be used to repay debts and also act as collateral, although in this last case there are no fixed
rules. Finally, 10 pesos ($0.18) per meeting are required for the group and center collective
savings account. The center savings cover mostly the construction of the center meeting building
(a small house or hut in the village) and other center activities, or as a last resort to repay member
loans if the center is being dissolved and default remains.9 The group savings is held as collateral
to cover arrearage within each group.
In the experiment, the Green Bank randomly converted existing centers with group liability
loans to individual liability loans. All other aspects of the program remain the same (including
attendance at center meetings and weekly payment made in groups).10 Hence, the only two features
that changed are the group liability and the savings rules.11 By removing the group liability, no
8 Based on exchange rate of 56 Philippine Pesos = 1 US Dollar. 9 In our observation, this never occurred. 10 It is useful to note that although the choice was effectively voluntary (a group could, if they wanted, complain about the switch and remain with group liability), not a single group complained. Quite to the contrary, researchers typically observed groups clapping when the announcement was made. 11 All other loan terms remained the same in both treatment and control groups, including the dynamic incentives, the interest rates, the lack of collateral, the length of the loan, the frequency of the payment, etc.
11
member is held liable for another member’s default. Thus, members are no longer forced to
contribute towards the repayment of other members in default and they are no longer required to
sign as co-maker of loans for other group members. If Green Bank had enforced a stricter group
liability rule, the change to individual liability would also have entailed the issuing of new loans
when other clients were in default. In practice, however, loans were already being issued to clients
in good standing even when other individuals were in default.
It is important to note that although this change removed the group liability rules, it did not
remove all social influences on repayment. Group payments were still done at the weekly meeting.
Although after the conversion group meetings did not include a discussion or review of who was in
default, the fact that all were at the meeting provided ample opportunity for people to learn of each
other’s status. Thus, many clients may still repay not out of social pressure, but rather out of
concern for their social reputation. One’s reputation is important, for instance, in order to secure
informal loans in the future from their peers, outside the scope of the lending program.
The second component of the treatment involved the savings policy. The group and center
savings were dissolved and shifted into individual savings accounts. The total required savings
deposits remained the same.12 With the conversion of group and center savings into individual
savings, there no longer were funds set aside to pay for center activities. Thus, all center activities
in treatment groups were to be paid for out of individual accounts on a per-activity basis.
Critical to the design is the fact that treatment centers were converted from existing centers,
and not newly created. By comparing the repayment behavior of existing clients in group-liability
centers and converted centers, we are able to isolate the impact of group liability on employing peer
pressure to mitigate moral hazard.
12 The new Personal Savings quota will be the previous amount of Personal Savings (based on the loan amount), plus P20, the amount previously given for Center and Group savings.
12
Our sample includes 169 BULAK centers in Leyte, handled by 11 credit officers in 6
branches. Among these, 161 had been created before August 2004, when the experiment started.
Green Bank’s main competitors are NGOs (such as TSKI) which mostly offer group-liability loans
and cooperatives (such as OCCCI) which offer individual liability loans. At the time of the first
conversion, about 28 percent of the existing centers were located in barangays with no other
competitor, 53 percent of the centers were in barangays with at least one NGO and 47 percent of
the barangays with Green Bank presence had at least one individual liability lender.13
Figure 1 shows the timeline of the experiment and data collected. In August 2004, we
implemented the first wave of conversions in 11 randomly selected centers (one center per field
officer). Three months later, in November 2004, we randomly selected 24 more centers to be
converted to individual-liability (wave two). In the sample frame for this randomization, we
included 8 additional centers formed after August 2004. Finally, nine months after wave one, in
May 2005 we randomly selected 45 more centers from the 125 remaining (wave three). As of May
2007, 34 months after the start of the experiment, the final month for which we have administrative
data, there are 56 converted centers and 50 original (group-liability) centers (26 converted and 37
original centers were dissolved in the past three years). Conversions were done in the three waves
because of operational and repayment concerns. In particular, Green Bank wanted to assess early
results to ensure default did not rise substantially before converting all centers randomly assigned
to treatment.14 We stratified the randomization by the 11 credit officers in order to ensure a fair
implementation across credit officers in terms of potential workload and risk and also orthogonality
with respect to credit officer characteristics. In addition, we periodically checked with credit
13 We run separate regressions for barangays with individual liability lenders and barangays with group liability lenders. The results do not differ significantly from those of Table 5 using all barangays and thus are not reported. 14 Note that increased default is not necessarily bad for the bank, since the bank cares about profits not merely default.
13
officers and conducted surprise visits to center meetings and clients’ homes to confirm that
converted centers had individual liability and that control centers had group liability.
B. Data Collected
We use data from five sources. First and most importantly, we use the Green Bank’s full
administrative data on repayment and savings, loan sizes and client retention rates for all 3,272
clients who were active members of the 161 centers at the time of the first randomization in August
2004, as well as the eight new centers opened after August 2004. We have data from one year prior
to the first wave of the experiment and 24 months after the last wave of experiment, thus enabling
us to incorporate center-level fixed effects in our analysis with pre and post observations. Second,
we use data from an activity-based costing exercise that credit officers conducted, where for a
given week, they had to keep a log of how they allocated their time across the different tasks they
typically perform (e.g., attending meetings, assessing new clients, enforcing repayments, etc).
Third and fourth, we use a baseline and follow-up social network survey, conducted in November
2004 and January 2006.15 Fifth, we use a survey of clients conducted in November 2005 (about
one year after the start of the experiment) designed to understand the observed differences between
converted and control centers. In this survey, we employed stratified random sampling from 1)
baseline clients, 2) new clients who joined the program over the three months prior to the survey,
and 3) clients who dropped out within the three months prior to the survey.
Table 1 presents summary statistics and some orthogonality checks that show that the
randomization yielded observably similar treatment and control groups, when looking at the pooled
treatment group. This holds when we examine group-level measures (Panel A) as well as
individual level measures (Panel B).
15 Note the social network baseline was conducted after the after the first wave of conversions but before the second and third waves, hence the social network analysis will not include the first wave of the sample frame.

14
IV. Empirical Strategy and Primary Results
We test several hypotheses that emerged above in the discussion of the relative merits of
group versus individual liability. The first analysis uses the individual loan-borrower as the unit of
observation, and examines the impact on key variables that affect bank profitability, such as
repayment, savings deposits held at the Green Bank by borrowers, and loan size (Table 2), and
client retention and success attracting new clients (Table 3). Then we analyze the same outcomes
at the center level (Table 4). Next we will examine the costs to the bank from making this
conversion (Table 5). Then we analyze the mechanisms through which activities changed within
the bank; this provides evidence of the experimental design being implemented as instructed, and
also evidence of specific peer screening, monitoring and enforcement activities (Tables 6 and 7).
Last, we examine the social network data, examining heterogeneous treatment effects on default
(Table 8) as well as impacts on social networks themselves (Table 9).
Throughout the analysis, we define a “treated” loan to be one that matures after the
conversion from group to individual liability. In other words, we consider loans that have any
exposure to individual liability as treated cycles.16
Table 2 Panel A presents the primary results. The specifications use individual level data,
with standard errors clustered at the center level. The sample frame includes only clients that were
borrowers at the time of the initial randomization. This allows us to focus analytically on the ex-
post changes in behavior generated by group versus individual liability, holding constant a sample
frame of individuals screened under a group liability regime.
16 Alternatively, the treated cycle could be defined as all loans released after the conversion. Results are robust to this alternative definition of treated cycle.
15
Specifically, we estimate a difference-in-difference (using pre-post and treatment-control
data) model using OLS:
yigt = α + βTgt + δt + θg + εigt,
where the subscript i refers to the individual, g the group, and t the time period, T is an indicator
variable if center g is under an individual liability regime at time t, δt are time fixed effects and θg
are center fixed effects. Thus, β is the coefficient of interest.
Table 2 (Panel A, Columns 1, 2, 3 and 4) shows that the conversion to individual liability
had no adverse effect on client repayment for the baseline clients. Given that the default rate is
very low, the impact of conversion can be seen as a one-sided test, where at best there is no
increase in default. Not only is the point estimate close to zero, but most economically significant
effects can be ruled out: the 95 percent confidence bound on proportion of loan balances in default
at the time of maturity (Column 3) is a mere -0.128 ± 0.239% and the 95 percent confidence bound
on the likelihood of any default 30 days after maturity (Column 4) is 0.001% +/- 0.004%. Thus, we
do not find strong enough evidence to support the “social collateral” story of Besley and Coate
(1995) that predicts higher repayment for group liability loans on average.17 However, as noted
elsewhere, the “conversion” to individual liability does not remove all “social collateral” since
repayment is still public, and someone may repay in order to protect their reputation in the
community.
Table 2 Panel B shows similar results for the new clients. Thus in this sample frame,
selection is confounded with monitoring and enforcement. Yet even here, those selected under
individual liability and given individual liability loans are also no more likely to default than those
selected under group liability and given group liability loans. The 95% confidence banks also
17 Below, we will examine heterogeneous treatment effects (Table 9) where we will find evidence that default increases for those with lower baseline measures of social collateral.
16
allow us to rule out economically large effects, although they are slightly larger than those for the
baseline clients in Panel A.
Table 2 Column 5 and 6 shows savings behavior and loan balances for both baseline and
new clients. We find a reduction in savings, though statistically insignificant, and a reduction in
loan size for all clients. One may have expected higher savings in individual liability since the
savings deposits were not held as collateral for other people’s loans, the expected return on savings
is higher under individual liability (assuming there is some default in expectation under group
liability).18 Greater reduction in loan sizes on new clients under individual liability could be due to
several mechanisms: an indication of the selection of new entrants (poorer individuals were
screened out under group liability, and are now able to join), and/or more restrictive lending by
credit officers in individual liability than in group liability centers with respect to approved loan
sizes. In qualitative interviews, credit officers deny that they restrict loan sizes of clients under
individual liability centers. However, we do not have quantitative data to provide strong evidence
to support one or the other of these mechanisms.
Of course, the conversion to individual liability does imply both a reduction in peer
pressure and a potential increase in bank pressure to repay (see Chowdhury, 2005). The empirical
analysis addressed above concludes that the net effect is nil. To confirm that in fact the conversion
was adhered to and group liability was not imposed in the treatment centers, we ask current
members the reason why others dropped out. Appendix Table 1 shows these results. Under
individual liability, individuals are less likely to be forced out of the center in net (Column 1), but
importantly Column 2 shows that individuals are less likely to be forced out by their peers and
more likely by the credit officer.
18 This assumes the substitution effect is larger than any income effect in terms of the elasticity of savings with respect to return.

17
Table 3 uses a Cox proportional hazard model to estimate the likelihood of dropout in each
given time period. While for baseline clients we find clients are slightly more likely to stop
borrowing as a result of conversion to individual liability (but this is true only for those with above
median loan sizes), for new clients we find the opposite, that those with above median loan sizes
are less likely to stop borrowing. Dropout as an outcome variable is naturally ambiguous: from a
borrower’s perspective this could be a sign of success, that the loan successfully addressed their
cash needs in the enterprise or their personal life and they no longer need credit. Or, alternatively,
and specially for new clients, dropout could be a sign that once in the program, the client learned
that it was not well suited to them, that it caused issues in their personal life, social life, or business
to have the debt burden.
Table 4 examines the main outcomes at the center level. We estimate the following
specifications using OLS:
(1) ygt = α + βTgt + δt + θg + εgt,
where ygt is either the proportion of missed weeks, center size, retention rate,19 new accounts,
number of dropouts or center dissolution for center g at time t, δt is an indicator variable equal to
one for time period t (time fixed effect), θg is a center fixed effect, and Tgt is an indicator variable
equal to one if group g at time t had been converted to individual liability. The time fixed effects
refer to three-month time periods (since individuals within centers do not get issued loans at the
same time). The coefficient of interest is β. We test whether the liability rule matters by
examining whether the coefficient β is significantly different from zero. Note that here, since the
unit of observation is the center (at a certain point in time), we use information from all clients who
belonged at each point to the center between August 2004 and January 2006.
19 The retention rate between t and t+1 is defined as the percentage of clients at t that are still clients at t+1.

18
As with the individual-loan specifications in Table 2, we also find no change in default at
the center level (and with the sample frame effectively combining baseline and new clients). We
also find that individual liability is much better at attracting new clients (Panel B, Column 3),
leading to larger centers (Column 1) and that individual liability makes existing centers 13.70%
points less likely to be dissolved (Column 6). This final result is the largest, and has important
practical implications, since dissolution of groups after two to three years is a commonly cited
concern among microfinance institutions.
V. Additional Results on Specific Mechanisms
We now turn to three sets of auxiliary data collected after the first year of the experiment. 20
First, we examine the results of the activity-based costing exercise completed by the credit officers
in order to measure the change in their allocation of their time across centers. Second, we examine
the results of a client follow-up survey conducted in November 2005 (over one year after the initial
conversion) on clients in both the treatment and control groups. This survey includes several
questions intended to tell us more about three possible mechanisms that could be influenced by the
liability structure: center activities, selection and the flow of information (monitoring). The survey
was conducted during center meetings and was administered to a sample of active members,
including individuals who were members at the time of the conversion as well as new clients who
entered afterwards.21 Third, we use social network data collected before the intervention and again
one year later to examine the impact on social networks, as well as heterogeneous treatment effects
for groups with different preexisting levels of social networks.
20 These results were also reported in an unpublished working paper (Giné and Karlan 2006), but are being combined into this paper in order to provide the richer context and understanding of mechanisms that are behind the results. 21 Since meeting attendance is compulsory, we should not be concerned with having a bias sample of survey respondents. In any event, we compared past repayment between respondents and non-respondents in converted and control centers and found no statistical differences across samples (largest t-stat is 0.82).
19
A. Lender Costs: Activity-Based Costing Exercise
It is important from a sustainability perspective to examine the complete impact on the
lender of such a change from group to individual liability. If the lender spends more money on
credit officer labor in order to screen, monitor and enforce loans then this is a necessary component
of the analysis. In order to evaluate to what extent this was true, we conducted an activity-based
costing exercise in which each credit officer kept a detailed diary of all activities for one week in
the month of August 2005. We then attributed their activities to either repayment (preparing for
center meetings plus collection and processing of repayments outside of the meetings), center
meeting, monitoring, enforcement and/or re-loan activities. Table 5 reports these results. We find
no statistically significant differences in the way credit officers allocated their time, and
furthermore the point estimates are actually the opposite of what one may have expected on
enforcement. On approval and processing of new loans (Column 7), credit officers do spend more
time under individual liability, although again this result is not statistically significant.
B. Center Activities
The client follow-up survey asked questions about center penalties for missing meetings, leaving
early and missing payments as well as various activities such as anniversary, Christmas and snacks
during the meeting. Table 6 reports changes in penalties (columns 1 and 2) and activities between
treatment and control centers. We find that treatment centers impose lower penalties, possibly
because meetings run smoother now that there is less need to enforce peer pressure among clients.
However, the conversion to individual liability may have resulted in lower center cohesion as
evidenced by the lower probability of social events (not significant) and the lower amount spent
(significant for Christmas parties).

20
C. Selection and Monitoring
Four sets of analysis provide insight into the changes in the selection of clients and
monitoring resulting from the change in liability. We asked each member how well they knew the
new members that had joined the center since intervention began. Table 7 Columns 1 and 2 show
these results. We find that the prior members are more likely to know new members well under
individual liability than under group liability. This is striking, given the typical assumption that
group lending programs encourage peers to screen each other. However, this is consistent with
evidence that the depth of family relations within a group is correlated with default (Ahlin and
Townsend 2007). Under individual liability, peers no longer fear the acrimony of having to punish
someone close to them if there is default, and hence are more willing to invite in their closest
friends and family. New members, on the other hand, are less likely to know the other new
members. Since new members are typically not the ones who bring in new members, this indicates
that groups are making fewer group decisions on whom to admit and instead individuals are
inviting their close friends or family. Thus prior members are closer to the new members, and new
members are more distant to the other new members. This is also consistent with the fact that new
members in treatment centers are less concerned with screening and learning about other new
clients.
Second, we examine how well individuals know the “type” of the other members in the
group. We report these results in Table 7 Columns 3-12. We asked each individual five questions:
(1) What is the business of person X? (Columns 3 and 4), (2) What is the required installment
amount for person X? (Columns 5 and 6), (3) How many weekly installments did person X miss
over the past three months? (Columns 7 and 8), (4) Did person X miss any payments over the past
three months? (Columns 9 and 10), and (5) Do you think person X will miss some payments over
21
the next three months? (Columns 11 and 12). We do not find any change in ability to report the
peers’ businesses, but we do find lower levels of ability to report who has missed payments (hence
suggestive evidence of reduced monitoring, although also explained by simply not having to
participate in repaying that person’s missed payments) and lower levels of ability to predict who
will or will not default. Again, this is evidence of lower monitoring, since it implies individuals are
less informed about the status of each other’s business and lives and, hence, their ability to repay
their loans.
The third result on selection looks at the distribution of ability to pay (rather than observed
repayment) among existing clients and new clients in treatment and control centers. We asked how
many times in the last 3 months they had difficulty in repaying the loan, regardless of whether or
not they ended up completely repaying the loan installment. We believe that this measure (rather
than observed default) captures the combination of “type” (selection) and ex-ante moral hazard
(effort) that is generated from group versus individual liability because being in default is only
observed when the member does not have enough cash and other members fail to contribute toward
the installment. Since side contributions are compulsory in control centers but only voluntary in
treatment centers, differences in default rate would come from not only different ability to repay
but also different contribution levels from fellow group members.
In a world where creditworthiness is verifiable through a costly screening process, there are
two groups of borrowers that would join only individual liability centers. On one end of the
creditworthiness distribution, bad risks would be screened out and rejected from group liability
centers, but could be allowed into individual liability centers because current borrowers lack the
incentive to screen (and the lender may be unable to screen as effectively as the peers). On the
other end of the distribution, good risks may have little to gain and much to lose from the implicit
22
risk-sharing agreement imposed by group liability. They decide not to join group liability centers
because they fear being forced to help other members repay more frequently than they will receive
help. Yet, they join individual liability centers because repayment only depends on their
performance. The left panel of Figure 2 plots the distribution of the number of times new clients
had difficulty making their payments, while the right panel plots the same distributions for baseline
clients (those borrowing at the time of conversion, hence screened under group liability).
Interestingly, the distributions of baseline clients in treatment and control centers look alike, but the
distribution of new clients in treatment centers is more concentrated around zero than that for
control centers. This suggests that good risks were reluctant to join group liability centers but do so
after these centers are converted to individual liability. We do not find evidence of bad risks also
joining individual liability centers. A Kolmogorov-Smirnov test of equal distributions between
treatment and control centers is rejected at 10 percent for new clients but not for baseline clients.
The fourth and last result on selection focuses on the interaction between demand and the
competitive setting. Did individuals increase or decrease their borrowing with other lenders after
the Green Bank converted to individual liability? The results are reported in Table 8, where it is
clear that the answer depends entirely on whether the other lender is a group or an individual
liability lender. If we restrict the analysis to barangays in which the competition is engaged in
group lending, then we find that baseline Green Bank clients are more likely to borrow from them
after their group is switched to individual liability. This indicates perhaps that some individuals
among baseline clients prefer group liability (perhaps for the risk-sharing component of group
liability) and hence when the group liability is removed they remain with the Green Bank but also
then seek a loan from a separate group liability program. On the other hand, when the competition
only offers individual liability, we see a reduction in the likelihood that baseline clients seek a loan
23
(although this result is only significant in the tobit specification on loan size, and has a p-value of
0.17 for the probit specification). This indicates, again, that baseline clients prefer one or the other
type of liability: when the Green Bank switches to individual liability, individuals who prefer it are
more satisfied, and individuals who prefer group liability seek supplementary loans from other
group lending programs. Results are less conclusive for the new clients, perhaps due to the lower
sample size.
D. Heterogeneous Treatment Effects
Theoretically, the shift to individual liability may have worked better or worse in groups
with different levels of preexisting social networks. If social collateral keeps repayment high, then
“releasing” the collateral by converting to individual liability (and replacing the social collateral
with bank pressure and mere public disclosure of default, but not group liability) may lead
individuals with higher social capital to have lower repayment rates. On the other hand, if
individuals have higher social capital because of their stronger and more trustworthy characters,
then the shift to individual liability should be less likely to influence their decision to repay (since
they are a “trustworthy” type, perhaps irrespective of whether social collateral is at stake or not).
We test the net effect of these possible mechanisms in Table 9 by interacting treatment with
one of various social network measures. The social network data were collected during the center
meetings in all centers in between the first and second wave of the randomization (for this reason,
the first wave centers are removed from this analysis, since their “baseline” occurred after the
treatment began). The survey procedure was simple: in public, in the meeting, a surveyor asked an
individual to stand up and then asked all other members in the group to raise their hand if their
answer to a specific question about their relationship with this person was “yes.” This method
prevents one from asking highly personal questions (e.g., “Would you lend to X if they asked
24
you?”) but does allow for higher precision on questions which are of public knowledge (since one
has the attention of everyone in the group to facilitate answering the questions). We categorize the
social network questions as either “knowledge” or “trust”. “Knowledge” includes: family, friend
since childhood, buys products or services, or visits once a week for social purposes. “Trust”
includes has given a loan to the other person outside of the Green Bank program, voluntarily
helped them pay their Green Bank loan, or turns to this person for advice or help.
We then examine the primary repayment measure: percentage of loan past due at the time of
maturity. We find that default is lower for those with stronger social networks relative to those
with weaker social networks. This is true both for “knowledge” measures of social capital
(Column 5) and the pooled aggregate index (Column 10), but not for the “trust” measures (Column
9).
These results may be an indication that those identified as having stronger “trust” social
networks are in fact a more trustworthy “type,” hence the shift to individual liability has no adverse
effect on their likelihood of repaying. In other words, being “trustworthy” is a personal
characteristic that determines ones social networks and also leads to higher repayment of loans.
This is consistent with results from Karlan (2005), in which trustworthy behavior in a lab
experiment in the field predicted repayment of loans one year later to a microcredit organization in
Peru. An alternative hypothesis is that those with stronger social networks must repay their loan in
both setups in order to protect their social networks. Those with weaker social networks have less
to lose from the “shame” of being seen in default (less social collateral, in the model of Besley and
Coate (1995)), and hence the shift to individual liability generates higher default. Of course, we
cannot say conclusively why this result is heterogeneous, but it does suggest that the existing
literature on the link between social capital and repayment within group lending is an important
25
literature, and that more needs to be learned about the circumstances under which social capital
helps versus hurts both the repayment and growth in lending programs.
E. Changes in Social Networks
Next, we examine the results of the follow-up social network survey. In Table 10 we show
these results. As we have both baseline and follow-up data on social networks, we are able to
employ a difference-in-difference empirical specification. We find only one social network
channel to have changed: likelihood to help another person with a side-loan in order to help her
make her loan payment. Social networks should change under individual liability for many
reasons. First, with fewer incentives to monitor, the quantity of interaction may fall. On the other
hand, the quality of the interaction may increase since they no longer have to pressure each other to
repay. From selection, as found earlier, we find groups more connected because individuals are
inviting closer friends and family to join the center. However, in net, we find no significant
impacts on social networks, barring the reduction in likelihood to make side-loans to each other.
VI. Conclusion
The choice of group or individual liability is perhaps one of the most basic questions
lenders make in the design of loan products in credit markets for the poor. Despite the importance
of this decision, past empirical research on group and individual liability has not provided
policymakers and institutions the clean evidence needed to determine the relative merits of the two
methodologies. In this study, we use a randomized controlled trial to evaluate the impact of group
liability on the performance of clients and the profitability for the lending institution. Naturally,
these are from one lender in one region of the Philippines, but this is a transition we are witnessing
around the world; thus this is not a highly unusual lender for wanting to make this conversion. As
with all empirical research, many questions persist as to whether these findings will hold in other

26
countries, in other cultures and with other lenders. Although this decision by the bank to shift from
group to individual liability is not unusual, we still must ask whether the culture or macroeconomic
conditions, for instance at the time of this study, led to similar outcomes for both individual and
group borrowers, and whether under different external conditions differences in repayment would
arise. Social science, just like physical sciences, needs replication in order to solve these issues.
The results are striking, however, in two respects. First, we find that individual liability
compared to group liability leads to no change in repayment but did lead to larger lending groups,
hence further outreach and use of credit. Second, we do find statistically significant evidence of
some of the mechanisms discussed in the group liability literature, such as screening and
monitoring, but we simply do not find that it adds up in an economically meaningful way to higher
default.
One could argue that the results lend support to the screening story of Ghatak (2000)
because the main subjects of the paper are borrowers who selected into the program under joint
liability, and thus would tend to be safer. The finding that after the removal of group liability
monitoring goes down but repayment improves, suggests, at the very least, that peer monitoring or
peer pressure are unnecessary. However, the lack of default for new members too suggests that the
answer is not that simple, that even new clients brought into centers built under group liability
repay their loans. This could be a result of group liability creating well-functioning groups, and
even new members adhere to the practices and policies of the pre-existing members.
The larger new centers, combined with the lack of increased default, suggests that the
screening process has changed without worsening repayment. The findings seem consistent with
the model of Chowdhury (2005), where the removal of group liability has probably resulted in an

27
increased monitoring and screening done by credit officers, although we did not find an increase in
their workload.
Our findings are also consistent with the work of Greif (1994) in a rather different context.
He suggests that collectivist societies, like joint liability institutions in our setting, are based on the
ability to impose social sanctions to players that deviate from the agreed norms of conduct. But
this requires a level of trust and knowledge among players that may hinder expansion of the set of
players thus leaving efficient trades unrealized. A more individualistic society requires fewer
exchanges of information among players and is thus able to grow faster. It does necessitate,
however, well-functioning formal institutions to enforce contracts. In our context, shifting some of
the burden from clients to credit officers strikes this balance successfully. The institutional
enforcement is sufficient to recover loans without group liability, and the individual liability allows
for more growth and outreach for the lender.
As mentioned, the cleanest analysis is on a sample of individuals who joined a group
liability program. This has the advantage of allowing us to isolate moral hazard effects, but has the
disadvantage of restricting our ability to predict whether peer screening, without monitoring and
enforcement, is an effective tool for mitigating adverse selection. Furthermore, we cannot assess
whether centers must achieve a certain age before the group liability can be successfully removed.
Thus, while we contribute to understanding how such conversions work, and this allows us to test
particular theories more precisely, a next step is imperative: to know whether groups can be
sustainable if begun under individual liability.
In sum, the recent trend of microfinance institutions expanding their individual lending
products (or in some cases, shifting from group liability to individual liability) may help deepen
outreach and provide more flexible microfinance products for the poor. Our findings suggest that

28
the innovators finding methods of lending individually (and more flexibly) to the poor may be
moving in the right direction. Certainly, as with all empirical research (experimental or non-
experimental), replication is imperative for both policy and theory in order to learn when these
findings hold and when they do not.

29
References
Adams, D. W. and J. R. Ladman (1979). "Lending to rural poor through informal groups: A
promising financial innovation?" Savings and Development 2(3): 85-94. Ahlin, C. and R. Townsend (2007). "Using Repayment Data to Test Across Models of Joint
Liability Lending." Economic Journal forthcoming. Armendariz de Aghion, B. and C. Gollier (2000). "Peer Group Formation in an Adverse Selection
Model." The Economic Journal 110(465): 632-643. Armendariz de Aghion, B. and J. Morduch (2005). The Economics of Microfinance, MIT Press. Arnott, R. and J. E. Stiglitz (1991). "Moral Hazard and Non-Market Institutions: Dysfunctional
Crowding Out or Peer Monitoring." American Economic Review 81: 179-190. Attanasio, O., P. Goldberg and E. Kyriazidou (2000). "Credit Constraints in the Market for
Consumer Durables: Evidence from Micro Data on Car Loans." NBER Working Paper 7694.
Besley, T. J. and S. Coate (1995). "Group Lending, Repayment Incentives and Social Collateral." Journal of Development Economics 46(1): 1-18.
Chowdhury, P. R. (2005). "Group-lending: Sequential financing, lender monitoring and joint liability." Journal of Development Economics 77: 415-439.
Conning, J. (2005). "Monitoring by Delegates or by Peers? Joint Liability Loans Under Moral Hazard." Working Paper.
Desai, B. M. (1983). Group lending in rural areas. Rural financial markets in developing countries: Their use and abuse. J. D. von Pischke, D. W. Adams and G. Donald. Baltimore, Md., U.S.A., Johns Hopkins University Press: 284-288.
Ghatak, M. (1999). "Group lending, local information and peer selection." Journal of Development Economics 60(1): 27-50.
Ghatak, M. (2000). "Screening by the Company You Keep: Joint Liability Lending and the Peer Selection Effect." Economic Journal 110(465).
Ghatak, M. and T. Guinnane (1999). "The Economics of Lending with Joint Liability: A Review of Theory and Practice." Journal of Development Economics 60 nl (October 1999): 195-228.
Giné, X. and D. Karlan (2006). "Group versus Individual Liability: Evidence from a Field Experiment in the Philippines." Yale University Economic Growth Center working paper 940.
Greif, A. (1994). "Cultural Beliefs and the Organization of Society: A Historical and Theoretical Reflection on Collectivist and Individualist Societies." Journal of Political Economy 102(5): 912-950.
Holmstrom, B. and P. Milgrom (1990). "Regulating Trade Among Agents." Journal of Institutional and Theoretical Economics 146(1): 85-105.
Karlan, D. (2005). "Using Experimental Economics to Measure Social Capital and Predict Financial Decisions." American Economic Review 95(5): 1688-1699.
Karlan, D. and J. Zinman (2007a). "Credit Elasticities in Less Developed Economies: Implications for Microfinance." American Economic Review forthcoming.
Karlan, D. and J. Zinman (2007b). "Observing Unobservables: Identifying Information Asymmetries with a Consumer Credit Field Experiment." working paper.
30
Laffont, J. J. and P. Rey (2000). "Collusion and Group Lending with Moral Hazqard." Working Paper.
Madajewicz, M. (2005). "Capital for the Poor: The Effect of Wealth on the Optimal Credit Contract." Columbia University Working paper.
Matin, I. (1997). "Repayment performance of Grameen Bank borrowers: The 'unzipped' state." Savings and Development 4.
Microcredit Summit Campaign (2005). "State of the Microcredit Summit Campaign Report 2005." http://www.microcreditsummit.org/pubs/reports/socr02_en.pdf.
Montgomery, R. (1996). "Disciplining or protecting the poor? Avoiding the social costs of peer pressure in micro-credit schemes." Journal of International Development 8(2): 289-306.
Morduch, J. (1999). "The Microfinance Promise." Journal of Economic Literature 37(4): 1569-1614.
N'Guessan, T. and J. J. Laffont (2000). "Group Lending with Adverse Selection." European Economic Review 44: 773-784.
Rahman, A. (1999). "Microcredit Initiatives for Equitable and Sustainable Development Who Pays?" World Development 27(1).
Rai, A. and T. Sjostrom (2004). "Is Grameen Lending Efficient? Repayment Incentives and Insurance in Village Economies." Review of Economic Studies 71(1): 217-234.
Sadoulet, L. (2000). The Role of Mutual Insurance in Group Lending., ECARES/Free University of Brussels.
Stiglitz, J. (1990). "Peer Monitoring and Credit Markets." World Bank Economic Review 4(3): 351-366.
Varian, H. (1990). "Monitoring Agents With Other Agents." Journal of Institutional and Theoretical Economics 146(1): 153-74.
Woolcock, M. (1999). "Learning from failures in microfinance: What unsuccessful cases tell us about how group-based programs work." The American Journal of Economics and Sociology 58: 17-42.
Figure 1: Experimental Design
August 2004
November 2004
May 2005
May 2007
Wave 1
11 Centers Converted
Wave 2
24 Centers Converted
Wave 3
45 Centers Converted
8 New centersopened
Total 169 Centers
80 Treatment
89 Control
Follow-up Social Network
Survey
Baseline Social Network
Survey
Administrative Data Begin
Follow-up Mechanism
Survey
November2005
August 2003
January 2006
Final Administrative
Data (34 months)

Figure 2: Kernel Density: Number of weeks that clients had difficulty repaying 3 months prior to the November Survey, Center average
The left panel shows the kernel densities of the center average of the number of weeks in difficulty repaying over the three months prior of the survey in November 2005 for treatment centers (red) and control centers (blue). The right panel plots the same distribution for baseline clients. The sample includes clients who attended the center meeting when the survey was conducted.
0.5
11
.5D
ensi
ty
0 .5 1 1.5 2Number of times clients had difficulty repaying, center average
0.5
11
.5D
ensi
ty
0 1 2 3Number of times clients had difficulty repaying, center average
New Clients Baseline Clients
Kolmogorov-Smirnov Test
New Clients Baseline clients P-value 0.109 0.556 (corrected value) 0.076 0.494
Wave 1 Wave 2 Wave 3(1) (2) (3) (4) (5) (6) (7) (8)
A. Center Performance, pre-intervention (Aug 2004)Total number of active accounts 20.224 20.262 20.182 0.964 20.727 18.666 20.756 0.914
(0.884) (1.245) (1.263) (2.649) (2.684) (1.663)Number of new clients 3.159 3.641 2.644 0.190 2.800 1.350 3.209 0.274 (May-Aug 2004) (0.380) (0.594) (0.460) (1.459) (0.509) (0.655)Number of dropout clients 1.603 1.551 1.658 0.802 1.000 0.700 2.256 0.124 (May-Aug 2004) (0.211) (0.212) (0.374) (0.298) (0.179) (0.612)Retention 0.904 0.900 0.909 0.685 0.944 0.949 0.883 0.282 (May-Aug 2004) (0.012) (0.017) (0.016) (0.019) (0.017) (0.024)Proportion of missed weeks over cycle 0.060 0.054 0.068 0.332 0.113 0.054 0.063 0.264 (May-Aug 2004) (0.007) (0.009) (0.011) (0.049) (0.016) (0.013)Pastdue (maturity) / Scheduled total amortization due (in 100s) 0.092 0.000 0.193 0.258 0.005 0.329 0.000 0.397
(0.085) (0.000) (0.178) (0.005) (0.304) (0.000)Pastdue (30d) / Scheduled total amortization due (in 100s) 0.001 0.000 0.001 0.298 0.005 0.000 0.000 0.082
(0.001) (0.000) (0.001) (0.005) (0.000) (0.000)Pastdue (90d) / Scheduled total amortization due (in 100s) 0.000 0.000 0.000 -- 0.000 0.000 0.000 --
(0.000) (0.000) (0.000) (0.000) (0.000) (0.000)Total loan amount 122,922.4 124,142.9 121,590.9 0.853 110,636.4 108,500.0 130,377.8 0.771
(6868.4) (10580.5) (8616.4) (17828.1) (15613.8) (12075.5)Average Loan size 6,033.2 5,996.1 6,073.7 0.806 5,196.8 6,030.0 6,308.5 0.425
(157.5) (220.6) (226.2) (473.2) (410.0) (312.4)
Number of active centers, August 2004 161 85 76 11 21 44Number of centers in the sample 169 88 81 11 24 46
B. Individual-level Performance, pre-intervention (Aug 2004)Proportion of missed weeks over cycle 0.062 0.059 0.065 0.324 0.083 0.065 0.059 0.185
(0.003) (0.004) (0.005) (0.016) (0.008) (0.005)Indicator for having at least one missed week 0.483 0.467 0.501 0.190 0.343 0.557 0.537 0.000
(0.013) (0.018) (0.019) (0.040) (0.045) (0.024)Proportion of past due balance, at maturity date 0.080 0.040 0.125 0.439 0.000 0.062 0.184 0.674
(0.055) (0.022) (0.115) (0.000) (0.055) (0.184)Past due balance, 30 days past maturity date (binary) 0.001 0.000 0.001 0.286 0.000 0.008 0.000 0.010
(0.001) (0.000) (0.001) (0.000) (0.008) (0.000)Total excess savings 319,924.5 286,583.4 357,940.0 0.625 223,869.7 216,725.5 441,811.5 0.740
(72780.0) (82775.0) (123967.1) (74987.2) (57842.1) (197449.3)Loan amount 6,107.2 6,143.6 6,069.1 0.570 5,558.4 5,772.7 6,368.7 0.003
(65.5) (93.1) (92.2) (180.3) (193.7) (125.5)
Number of active clients, August 2004 3,285 1,708 1577 298 394 885
p-value on F-test for
(5), (6) and (7)
Standard errors in parentheses. In Panel A, the number of active centers is less than 169 in August 2004 because there are 8 centers that started after the first conversion and added to the sample. T-statistics reported in column (4) is the probability of (column (2) - column (3)) being zero. F-statistics in Column (8) is from a regression of the outcome variable of interest on a set of indicator variables for each of the treatment waves. The exchange rate at the time of the experiment was 52 pesos = US$1.
All
Table 1: Summary Statistics
Control Treatment
p-value on t-test of
difference: (2) - (3)Treatment
Dep
ende
nt V
aria
ble:
Pro
port
ion
of
mis
sed
wee
ks
Indi
cato
r fo
r ha
ving
at l
east
on
e m
isse
d w
eek
Pro
port
ion
of
past
due
bal
ance
, at
mat
urity
dat
e
Past
due
bal
ance
, 30
day
s pa
st
mat
urity
dat
e (b
inar
y)T
otal
exc
ess
savi
ngs
Loa
n Si
ze
(1)
(2)
(3)
(4)
(5)
(6)
Pane
l A: B
asel
ine
clie
nts
Tre
atm
ent
-0.0
10-0
.023
-0.1
280.
001
-242
.696
-643
.713
**(0
.016
)(0
.041
)(0
.122
)(0
.002
)(1
65.2
22)
(322
.439
)
Obs
erva
tions
1433
314
333
1433
314
333
1433
214
333
R-s
quar
ed0.
180.
200.
060.
030.
310.
26M
ean
of d
epen
dent
var
iabl
e0.
075
0.07
50.
220
0.00
268
44.5
9968
44.4
01Pa
nel B
: N
ew c
lient
sT
reat
men
t0.
000
-0.0
10-0
.001
-0.0
01-3
42.8
42-7
35.8
26**
*(0
.010
)(0
.036
)(0
.002
)(0
.003
)(2
55.2
35)
(215
.034
)
Obs
erva
tions
6049
6049
6049
6049
6046
6049
R-s
quar
ed0.
020.
050.
010.
010.
040.
05M
ean
of d
epen
dent
var
iabl
e0.
069
0.38
50.
008
0.00
652
84.8
1652
84.3
45
Tab
le 2
: L
oan-
leve
l Im
pact
on
Def
ault
, Sav
ings
, and
Loa
n Si
ze b
y C
onve
rsio
n W
aves
OL
S
Rob
ust
stan
dard
erro
rscl
uste
red
byle
ndin
gce
nter
sin
pare
nthe
ses,
*si
gnif
ican
tat
10%
;**
sign
ific
ant
at5%
;**
*si
gnif
ican
tat
1%.
Tre
atm
ent
vari
able
equa
lson
eif
the
loan
cycl
een
dsaf
ter
the
conv
ersi
onin
trea
tmen
tcen
ters
;zer
oot
herw
ise.
All
regr
essi
ons
use
fixe
def
fect
sfo
rea
chle
ndin
gce
nter
and
mon
thof
the
mat
urity
date
.T
hesa
mpl
efr
ame
for
Pane
lAis
base
line
clie
nts,
i.e.,
thos
ew
how
ere
activ
eat
the
firs
tcon
vers
ion
inA
ugus
t20
04;
the
sam
ple
fram
efo
rPa
nelB
isne
wcl
ient
s,i.e
.,th
ose
who
join
edth
epr
ogra
maf
ter
Aug
ust2
004
inth
eco
ntro
lgro
upor
afte
rth
eco
nver
sion
inea
chof
the
trea
tmen
tgr
oups
.Pr
opor
tion
ofm
isse
dw
eeks
isca
lcul
ated
byth
enu
mbe
rof
wee
ksin
whi
chth
ecl
ient
did
not
mak
eth
efu
llin
stal
lmen
tdiv
ided
byth
enu
mbe
rof
inst
allm
ents
.Tot
alex
cess
savi
ngs
isde
fine
dby
the
exce
sss
amou
ntof
savi
ngs
that
the
clie
ntde
posi
tbey
ond
the
requ
ired
savi
ngs
amou
ntov
era
loan
cycl
e(t
heva
lue
take
sze
roif
the
tota
lde
posi
tdo
esno
tre
ach
the
requ
ired
savi
ngs
amou
nt).
The
num
ber
ofob
serv
atio
ns in
Col
(5)
is s
mal
ler
beca
use
ther
e ar
e 5
acco
unts
for
whi
ch th
e sa
ving
s da
ta in
MIS
can
not b
e m
atch
ed w
ith th
e lo
an d
ata.
Sample Frame: All Loan size above median Loan size below median(1) (2) (3)
Panel A: Baseline clientsTreatment 1.121* 1.248*** 0.832
(0.071) (0.087) (0.113)
Observations 8310 5461 2849Panel B: New clients
Treatment 0.857*** 0.711*** 0.977(0.042) (0.051) (0.063)
Observations 7157 3643 3514
* significant at 10%; ** significant at 5%; *** significant at 1%. The model estimated is the Cox proportionalhazard. Reported are hazard ratios and standard errors in parentheses, calculated assuming within-centerclustering. Lower hazard ratio (<1) indicates that clients in Treatment centers stay longer in the program and thatconversion into individual-liability is associated with lower likelihood of dropping out. Columns (2) & (3) haveunequal sample sizes because 19% of the sample is at the median loan size, and these observations are arbitrarilyincluded in column (2).
Table 3: Impact on DropoutCox proportional hazard model, failure = dropout
Dependent Variable: Binary variable equal to one if the client has dropped outSample frame: All clients
(1)
(2)
(3)
(4)
(5)
(6)
Pane
l A: C
ente
r pe
rfor
man
ce
Dep
ende
nt v
aria
ble:
Pro
port
ion
of
mis
sed
wee
ks
Past
due
(at
mat
urity
) /
Sche
dule
d to
tal
amor
tizat
ion
due
Past
due
(30d
) /
Sche
dule
d to
tal
amor
tizat
ion
due
Past
due
(90d
) /
Sche
dule
d to
tal
amor
tizat
ion
due
Tot
al lo
an a
mou
ntA
vera
ge lo
an
amou
nt
Spec
ific
atio
n:O
LS
OL
SO
LS
OL
SO
LS
OL
ST
reat
men
t-0
.013
-0.4
87-0
.379
-0.3
308,
194.
497*
-156
.631
(0.0
08)
(0.3
47)
(0.3
44)
(0.3
45)
(4,5
52.8
22)
(166
.569
)M
ean
of d
epen
dent
var
iabl
e0.
070.
350.
280.
2198
387.
2354
18.5
8O
bser
vatio
ns19
0719
4119
4119
4125
0725
07N
umbe
r of
cen
ters
169
169
169
169
169
169
R-s
quar
ed0.
050.
010.
010.
010.
220.
20Pa
nel B
: Ent
ry a
nd d
ropo
ut d
ecis
ions
Dep
ende
nt v
aria
ble:
Act
ive
acco
unts
Ret
entio
n ra
teN
ew a
ccou
nts
Num
ber
of
drop
outs
Spec
ific
atio
n:O
LS
OL
SO
LS
OL
SO
LS
Prob
itT
reat
men
t2.
974*
**0.
032*
1.48
7***
0.19
7-0
.013
-0.1
37*
(0.6
08)
(0.0
17)
(0.3
99)
(0.2
75)
(0.0
16)
(0.0
78)
Mea
n of
dep
ende
nt v
aria
ble
15.3
60.
802.
513.
160.
030.
37O
bser
vatio
ns25
0720
1720
1720
1720
1716
9N
umbe
r of
cen
ters
169
169
169
169
169
R-s
quar
ed0.
250.
290.
070.
190.
07
Rob
usts
tand
ard
erro
rsin
pare
nthe
ses,
*si
gnif
ican
tat1
0%;*
*si
gnif
ican
tat5
%;*
**si
gnif
ican
tat1
%.
"Tre
atm
ent"
isan
indi
cato
rva
riab
leeq
ualt
oon
eif
the
cent
erha
sbe
enco
nver
ted
for
agi
ven
obse
rvat
ion.
All
regr
essi
ons
exce
ptPa
nel
B,
Col
umn
6us
efi
xed
effe
cts
for
lend
ing
cent
ers
and
mat
urity
mon
ths,
and
ever
yce
nter
has
anob
serv
atio
non
each
outc
ome
for
ever
yth
ree
mon
thbe
twee
nA
ugus
t20
03an
dM
ay20
07.
Pane
lB
,C
olum
n6
uses
fixe
def
fect
sfo
rcr
edit
offi
cers
and
repo
rts
the
mar
gina
lef
fect
sfo
rth
eco
effi
cien
ton
trea
tmen
t.T
otal
loan
amou
ntis
the
aggr
egat
edlo
anam
ount
disb
urse
din
ace
nter
,and
aver
age
loan
amou
ntis
the
aver
age
loan
size
per
clie
nt.B
oth
num
bers
are
inpe
sos
(1U
S$
=42
peso
s).P
anel
A,C
olum
ns2-
4ex
clud
esce
nter
sth
atha
dbe
endi
ssol
ved
inth
epr
evio
ustim
epe
riod
s;T
hesa
mpl
efo
rPa
nel
A,C
olum
n1
isac
tive
cent
ers
inw
hich
ther
e ar
e m
atur
ed a
ccou
ts in
eac
h tim
e pe
riod
.
Tab
le 4
: C
ente
r-le
vel P
erfo
rman
ceO
LS,
Pro
bit
Dis
solv
ed c
ente
r
Tot
al T
ime
Tim
e on
re
paym
ent
activ
ities
Tim
e on
cen
ter
mee
ting
Tim
e on
loan
m
onito
ring
Tim
e on
loan
en
forc
emen
t
Tim
e on
fo
llow
ing
up
with
del
inqu
ent
clie
nts
Tim
e on
rel
oan
(1)
(2)
(3)
(4)
(5)
(6)
(7)
Tre
atm
ent
-0.0
26-0
.004
-0.0
35-0
.079
-0.1
28-0
.072
0.19
1(0
.261
)(0
.142
)(0
.071
)(0
.062
)(0
.084
)(0
.069
)(0
.154
)O
bser
vatio
ns14
614
614
614
614
614
614
6R
-squ
ared
0.34
0.24
0.13
0.09
0.08
0.07
0.11
Mea
n of
dep
ende
nt v
aria
ble
2.95
1.94
0.66
0.17
0.20
0.16
0.49
Tab
le 5
: A
ctiv
ity-
Bas
ed C
osti
ng A
naly
sis:
Tim
e Sp
ent
on D
iffe
rent
Act
ivit
ies
by C
ente
r
Rob
ust
stan
dard
erro
rsin
pare
thes
es.
*si
gnif
ican
tat
10%
;**
sign
ific
ant
at5%
;**
*si
gnif
ican
tat
1%.
All
regr
essi
ons
use
fixe
def
fect
for
cred
itof
fice
rs.
Eac
hce
llre
port
sth
eav
erag
etim
ein
hour
ssp
ent
onin
dica
ted
activ
itype
rce
nter
ina
give
nw
eek
inJa
nuar
y20
06.
Rep
aym
ent
incl
udes
prep
arin
gfo
rce
nter
mee
tings
,tr
avel
time,
and
hand
ling
the
colle
ctio
n;ce
nter
mee
ting
indi
cate
sth
etim
esp
ent
onth
eac
tual
mee
ting.
Mon
itori
ngin
volv
esm
akin
gre
port
s,an
swer
ing
clie
nts'
ques
tions
;enf
orce
men
tinc
lude
slo
anut
iliza
tion
chec
kan
dfo
llow
ing
upw
ithde
linqu
entc
lient
s.R
eloa
nin
clud
esco
nduc
ting
cred
itev
alua
tion,
filli
ng/r
evie
win
gof
loan
for
ms,
and
rel
easi
ng th
e lo
an.
OL
S
Tot
al p
enal
ties
Tot
al e
nfor
ced
pena
lties
No
activ
ityL
ikel
ihoo
d of
ha
ving
a p
arty
Am
ount
spe
nt,
cond
ition
al o
n ha
ving
a p
arty
Lik
elih
ood
of
havi
ng a
par
ty
Am
ount
spe
nt,
cond
ition
al o
n ha
ving
a p
arty
OL
SO
LS
Prob
itPr
obit
OL
SPr
obit
OL
S(1
)(2
)(3
)(4
)(5
)(6
)(7
)T
reat
men
t-1
0.09
5*-9
.548
*-0
.004
-0.0
66-5
82.5
18-0
.002
-695
.057
*(5
.583
)(5
.613
)(0
.059
)(0
.096
)(8
71.2
33)
(0.0
76)
(396
.256
)
Mea
n of
dep
ende
nt v
aria
ble
47.8
547
.58
0.12
0.46
2047
.93
0.76
1218
.34
Stan
dard
err
or o
f de
pend
ent v
aria
ble
2.94
2.96
0.03
0.04
438.
300.
0419
8.92
Obs
erva
tions
131
131
113
131
6013
199
R-s
quar
ed0.
190.
200.
300.
14
Tab
le 6
: C
ente
r ac
tivi
ties
Ann
iver
sary
Chr
istm
as p
artie
s
Stan
dard
err
ors
in p
aren
thes
es. *
sig
nifi
cant
at 1
0%; *
* si
gnif
ican
t at 5
%; *
** s
igni
fica
nt a
t 1%
. Pen
altie
s in
clud
e no
t atte
ndin
g, le
avin
g ea
rly
from
, bei
ng la
te to
the
mee
ting,
an
d m
issi
ng p
aym
ents
. A
ll re
gres
sion
s us
e fi
xed
effe
ct f
or c
redi
t off
icer
s.
Sam
ple
fram
ewor
k: W
ave
2 an
d 3
Cen
ters
Onl
y (b
ecau
se d
ata
colle
cted
dur
ing
soci
al n
etw
ork
surv
ey)
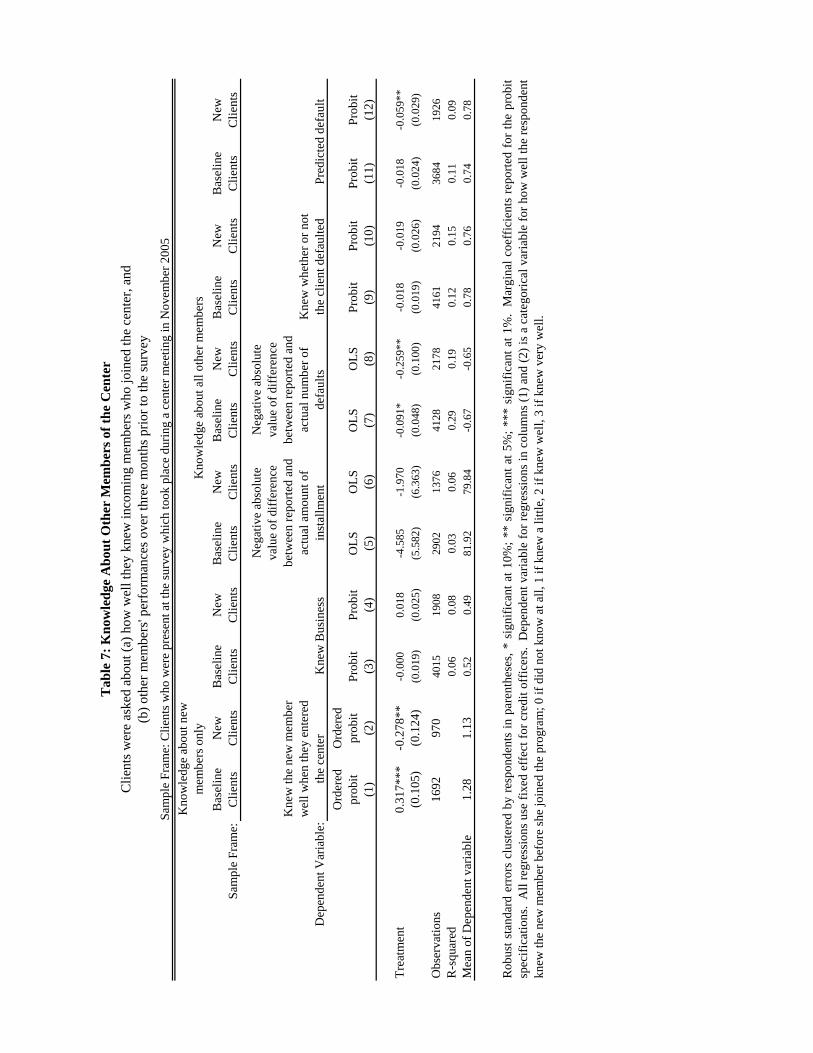
Sam
ple
Fram
e:B
asel
ine
Cli
ents
New
C
lien
tsB
asel
ine
Cli
ents
New
C
lien
tsB
asel
ine
Cli
ents
New
C
lien
tsB
asel
ine
Cli
ents
New
C
lien
tsB
asel
ine
Cli
ents
New
C
lien
tsB
asel
ine
Cli
ents
New
C
lien
ts
Dep
ende
nt V
aria
ble:
Ord
ered
pr
obit
Ord
ered
pr
obit
Prob
itPr
obit
OL
SO
LS
OL
SO
LS
Prob
itPr
obit
Prob
itPr
obit
(1)
(2)
(3)
(4)
(5)
(6)
(7)
(8)
(9)
(10)
(11)
(12)
Tre
atm
ent
0.31
7***
-0.2
78**
-0.0
000.
018
-4.5
85-1
.970
-0.0
91*
-0.2
59**
-0.0
18-0
.019
-0.0
18-0
.059
**(0
.105
)(0
.124
)(0
.019
)(0
.025
)(5
.582
)(6
.363
)(0
.048
)(0
.100
)(0
.019
)(0
.026
)(0
.024
)(0
.029
)
Obs
erva
tion
s16
9297
040
1519
0829
0213
7641
2821
7841
6121
9436
8419
26R
-squ
ared
0.06
0.08
0.03
0.06
0.29
0.19
0.12
0.15
0.11
0.09
Mea
n of
Dep
ende
nt v
aria
ble
1.28
1.13
0.52
0.49
81.9
279
.84
-0.6
7-0
.65
0.78
0.76
0.74
0.78
Clie
nts
wer
e as
ked
abou
t (a)
how
wel
l the
y kn
ew in
com
ing
mem
bers
who
join
ed th
e ce
nter
, and
(b
) ot
her
mem
bers
' per
form
ance
s ov
er th
ree
mon
ths
prio
r to
the
surv
ey
Kno
wle
dge
abou
t all
oth
er m
embe
rsK
now
ledg
e ab
out n
ew
mem
bers
onl
y
Rob
ust
stan
dard
erro
rscl
uste
red
byre
spon
dent
sin
pare
nthe
ses,
*si
gnif
ican
tat
10%
;**
sign
ific
ant
at5%
;**
*si
gnif
ican
tat
1%.
Mar
gina
lco
effi
cien
tsre
port
edfo
rth
epr
obit
spec
ific
atio
ns.
All
regr
essi
ons
use
fixe
def
fect
for
cred
itof
fice
rs.
Dep
ende
ntva
riab
lefo
rre
gres
sion
sin
colu
mns
(1)
and
(2)
isa
cate
gori
calv
aria
ble
for
how
wel
lthe
resp
onde
ntkn
ew th
e ne
w m
embe
r be
fore
she
join
ed th
e pr
ogra
m; 0
if d
id n
ot k
now
at a
ll, 1
if k
new
a li
ttle
, 2 if
kne
w w
ell,
3 if
kne
w v
ery
wel
l.
Pred
icte
d de
faul
t
Tab
le 7
: K
now
ledg
e A
bout
Oth
er M
embe
rs o
f th
e C
ente
r
Sam
ple
Fram
e: C
lien
ts w
ho w
ere
pres
ent a
t the
sur
vey
whi
ch to
ok p
lace
dur
ing
a ce
nter
mee
ting
in N
ovem
ber
2005
Kne
w w
heth
er o
r no
t th
e cl
ient
def
ault
edK
new
Bus
ines
s
Neg
ativ
e ab
solu
te
valu
e of
dif
fere
nce
betw
een
repo
rted
and
ac
tual
am
ount
of
inst
allm
ent
Neg
ativ
e ab
solu
te
valu
e of
dif
fere
nce
betw
een
repo
rted
and
ac
tual
num
ber
of
defa
ults
Kne
w th
e ne
w m
embe
r w
ell w
hen
they
ent
ered
th
e ce
nter

Bas
elin
e C
lient
sN
ew C
lient
sB
asel
ine
Clie
nts
New
Clie
nts
Bas
elin
e C
lient
sN
ew C
lient
sB
asel
ine
Clie
nts
New
Clie
nts
Dep
ende
nt V
aria
ble:
Prob
itPr
obit
Tob
itT
obit
Prob
itPr
obit
Tob
itT
obit
(1)
(2)
(3)
(4)
(5)
(6)
(7)
(8)
Tre
atm
ent
0.06
2*-0
.021
5,03
9.82
5***
-449
.429
-0.0
49-0
.028
-8,7
03.4
39*
-5,8
87.8
0(0
.034
)(0
.051
)(1
,907
.141
)(1
629.
29)
(0.0
35)
(0.0
29)
(4,8
56.9
00)
(434
0.99
)
Obs
erva
tion
s47
426
947
426
947
625
747
625
7R
-squ
ared
0.07
0.14
0.07
0.10
0.09
Mea
n of
dep
ende
nt v
aria
ble
0.11
0.16
653.
3891
2.64
0.10
0.06
1303
.361
464.
98
Rob
ust
stan
dard
erro
rscl
uste
red
byle
ndin
gce
nter
inpa
rent
hese
s,*
sign
ific
ant
at10
%;
**si
gnif
ican
tat
5%;
***
sign
ific
ant
at1%
.M
argi
nal
effe
cts
repo
rted
for
the
prob
itsp
ecif
icat
ions
.A
llre
gres
sion
sha
vefi
xed
effe
ctfo
rcr
edit
offi
cers
.D
epen
dent
vari
able
for
colu
mns
(1)-
(2)
are
bina
ryva
riab
leeq
ual
toon
eif
the
clie
ntcu
rren
tly
has
loan
s fr
om N
GO
s; th
at o
f co
lum
ns (
3)-(
4) a
re b
inar
y va
riab
le e
qual
to o
ne if
the
clie
nt c
urre
ntly
has
loan
s fr
om C
OO
Ps.
Tab
le 8
: C
urre
nt B
orro
win
g fr
om O
ther
Len
ders
Sam
ple
Fram
e: C
lient
s w
ho w
ere
pres
ent a
t the
sur
vey
whi
ch to
ok p
lace
dur
ing
a ce
nter
mee
ting
in N
ovem
ber
2005
Has
loan
fro
m c
ompe
titor
Has
loan
fro
m c
ompe
titor
Loa
n si
ze f
rom
com
petit
orL
oan
size
fro
m c
ompe
titor
Bar
anga
ys w
ith C
oops
off
erin
g in
divi
dual
-lia
bilit
y lo
ans
only
Bar
anga
ys w
ith N
GO
s of
feri
ng g
roup
-lia
bilit
y lo
ans
only
Sam
ple
Fram
e:

Fam
ilyFr
iend
sB
uy
prod
ucts
Vis
it on
ce a
w
eek
Giv
en lo
anV
olun
tary
he
lpG
o fo
r ad
vice
(1)
(2)
(3)
(4)
(5)
(6)
(7)
(8)
(9)
(10)
Tre
atm
ent
0.32
60.
086
0.62
1**
0.18
80.
860*
*0.
346
0.27
70.
096
0.11
60.
871*
*(0
.294
)(0
.366
)(0
.295
)(0
.344
)(0
.384
)(0
.307
)(0
.282
)(0
.412
)(0
.429
)(0
.405
)S
ocia
l net
wor
k m
easu
re0.
123
-0.0
070.
218
-0.4
340.
331
0.09
91.
850
-0.4
16-0
.143
0.27
7(0
.541
)(0
.568
)(0
.271
)(0
.402
)(0
.255
)(0
.583
)(1
.357
)(0
.377
)(0
.452
)(0
.246
)T
reat
men
t x S
ocia
l net
wor
k m
easu
re-0
.929
2.15
9-0
.980
**0.
196
-1.1
97**
-2.0
77-2
.566
1.45
80.
976
-1.1
70**
(0.9
69)
(2.2
58)
(0.3
99)
(0.7
22)
(0.4
93)
(1.5
75)
(2.1
61)
(2.7
81)
(2.2
47)
(0.5
05)
Obs
erva
tions
4224
4224
4224
4224
4224
4224
4224
4224
4224
4224
Num
ber
of c
ente
r fi
xed
effe
cts
154
154
154
154
154
154
154
154
154
154
R-s
quar
ed0.
020.
020.
020.
020.
020.
020.
020.
020.
020.
02M
ean
of s
ocia
l net
wor
k m
easu
re0.
111
0.04
60.
291
0.13
20.
411
0.36
30.
015
0.07
20.
093
0.41
9S
tand
ard
erro
r of
soc
ial c
apita
l mea
sure
(0.0
03)
(0.0
02)
(0.0
06)
(0.0
04)
(0.0
06)
(0.0
06)
(0.0
01)
(0.0
03)
(0.0
03)
(0.0
06)
Soc
ial n
etw
ork
vari
able
s ar
e de
fine
d as
bel
ow:
1 2F
rien
ds: H
ave
know
n th
is p
erso
n si
nce
eith
er o
ne w
as a
chi
ld (
non-
fam
ily m
embe
rs/r
elat
ive)
3B
ough
t pro
duct
s: H
ave
boug
ht p
rodu
cts
or s
ervi
ces
from
this
per
son
4V
isit
once
a w
eek:
Vis
it th
is p
erso
n ho
use
for
soci
al p
urpo
ses
at le
ast o
nce
a w
eek.
5
Kno
wle
dge
inde
x: A
ggre
gate
of
1 th
roug
h 4
6G
iven
loan
: Hav
e gi
ven
this
per
son
a lo
an o
utsi
de o
f B
ulak
.7
Vol
unta
rily
hel
ped:
Hav
e vo
lunt
arily
hel
ped
this
per
son
repa
y lo
ans
in B
ulak
. 8
Go
for
advi
ce: T
urn
to th
is p
erso
n fo
r ad
vise
or
help
for
any
type
of
life
prob
lem
; hea
lth, f
inan
cial
, or
emot
iona
l. 9
Tru
st: A
ggre
gate
of
6 th
roug
h 8
#A
ll: A
ggre
gate
of
1thr
ough
4, a
nd 6
thro
ugh
8.
Dep
ende
nt v
aria
ble:
Pro
port
ion
of p
ast d
ue b
alan
ce a
t the
mat
urity
dat
eO
LS
Tab
le 9
: Im
pact
of
Soci
al N
etw
ork
on D
efau
lt
Kno
wle
dge
Rob
usts
tand
ard
erro
rscl
uste
red
byle
ndin
gce
nter
sin
pare
nthe
ses.
*si
gnif
ican
tat1
0%;*
*si
gnif
ican
tat5
%;*
**si
gnif
ican
tat1
%.
All
regr
essi
ons
use
fixe
def
fect
for
time
and
cent
ers.
Soc
ial
netw
ork
vari
able
isde
fine
dby
the
num
ber
ofin
degr
eelin
ksov
erm
axim
umnu
mbe
rof
links
poss
ible
.T
his
mea
sure
repo
rts
how
pres
tigio
usis
the
mem
ber
inre
latio
nto
the
grou
psi
zefr
oma
degr
ee p
ersp
ectiv
e (t
he m
embe
r ha
s m
ore
pres
tige
if h
e/sh
e re
ceiv
es m
any
links
). S
ee b
elow
for
the
defi
nitio
n of
soc
ial n
etw
ork
indi
ces
Fam
ily: H
ave
know
n th
is p
erso
n si
nce
eith
er o
ne w
as a
chi
ld (
gran
dpar
ents
, par
ents
, sib
lings
, spo
uses
, chi
ldre
n, g
rand
child
ren,
and
cou
sins
).
Sam
ple
Fra
me:
Clie
nts
who
wer
e pr
esen
t at t
he m
eetin
g du
ring
the
base
line
soci
al n
etw
ork
base
line
surv
ey
Kno
wle
dge
inde
x
Tru
st
Tru
st in
dex
All
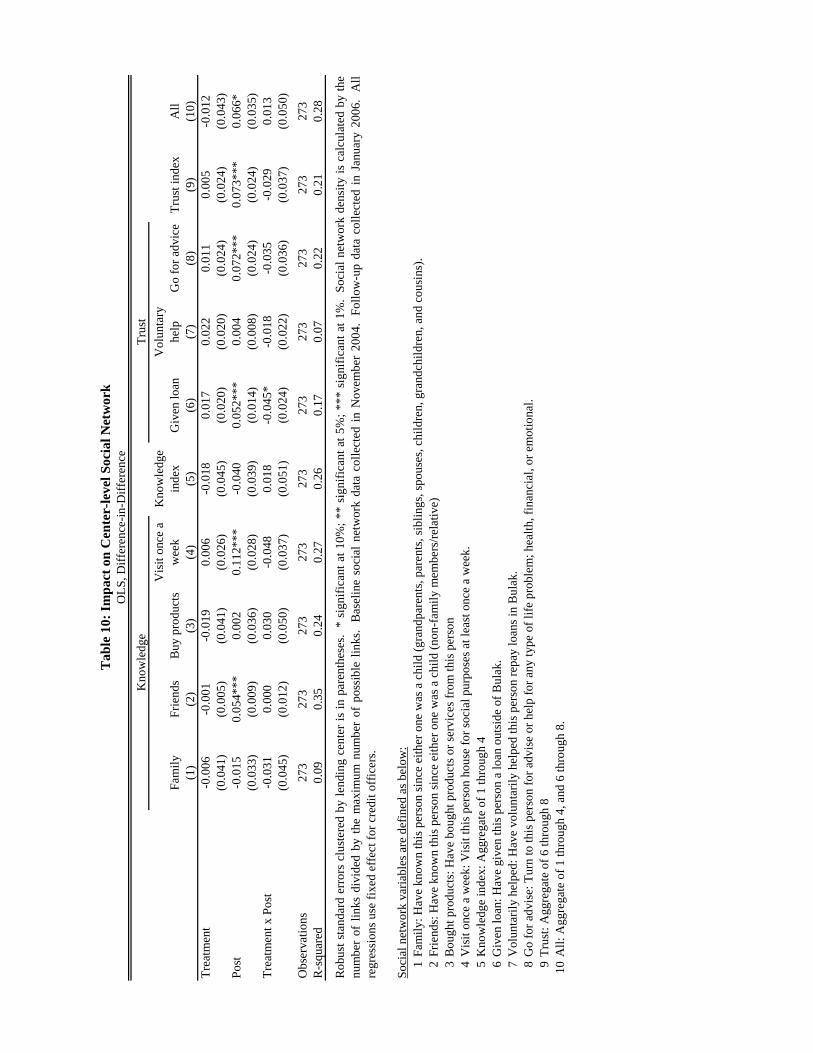
Fam
ily
Frie
nds
Buy
pro
duct
sV
isit
once
a
wee
kG
iven
loan
Vol
unta
ry
help
Go
for
advi
ce(1
)(2
)(3
)(4
)(5
)(6
)(7
)(8
)(9
)(1
0)T
reat
men
t-0
.006
-0.0
01-0
.019
0.00
6-0
.018
0.01
70.
022
0.01
10.
005
-0.0
12(0
.041
)(0
.005
)(0
.041
)(0
.026
)(0
.045
)(0
.020
)(0
.020
)(0
.024
)(0
.024
)(0
.043
)P
ost
-0.0
150.
054*
**0.
002
0.11
2***
-0.0
400.
052*
**0.
004
0.07
2***
0.07
3***
0.06
6*(0
.033
)(0
.009
)(0
.036
)(0
.028
)(0
.039
)(0
.014
)(0
.008
)(0
.024
)(0
.024
)(0
.035
)T
reat
men
t x P
ost
-0.0
310.
000
0.03
0-0
.048
0.01
8-0
.045
*-0
.018
-0.0
35-0
.029
0.01
3(0
.045
)(0
.012
)(0
.050
)(0
.037
)(0
.051
)(0
.024
)(0
.022
)(0
.036
)(0
.037
)(0
.050
)
Obs
erva
tion
s27
327
327
327
327
327
327
327
327
327
3R
-squ
ared
0.09
0.35
0.24
0.27
0.26
0.17
0.07
0.22
0.21
0.28
Soci
al n
etw
ork
vari
able
s ar
e de
fine
d as
bel
ow:
1 2Fr
iend
s: H
ave
know
n th
is p
erso
n si
nce
eith
er o
ne w
as a
chi
ld (
non-
fam
ily
mem
bers
/rel
ativ
e)3
Bou
ght p
rodu
cts:
Hav
e bo
ught
pro
duct
s or
ser
vice
s fr
om th
is p
erso
n4
Vis
it o
nce
a w
eek:
Vis
it th
is p
erso
n ho
use
for
soci
al p
urpo
ses
at le
ast o
nce
a w
eek.
5
Kno
wle
dge
inde
x: A
ggre
gate
of
1 th
roug
h 4
6G
iven
loan
: Hav
e gi
ven
this
per
son
a lo
an o
utsi
de o
f B
ulak
.7
Vol
unta
rily
hel
ped:
Hav
e vo
lunt
aril
y he
lped
this
per
son
repa
y lo
ans
in B
ulak
. 8
Go
for
advi
se: T
urn
to th
is p
erso
n fo
r ad
vise
or
help
for
any
type
of
life
pro
blem
; hea
lth,
fin
anci
al, o
r em
otio
nal.
9T
rust
: Agg
rega
te o
f 6
thro
ugh
810
All
: Agg
rega
te o
f 1
thro
ugh
4, a
nd 6
thro
ugh
8.
Tab
le 1
0: I
mpa
ct o
n C
ente
r-le
vel S
ocia
l Net
wor
kO
LS,
Dif
fere
nce-
in-D
iffe
renc
e
Rob
ust
stan
dard
erro
rscl
uste
red
byle
ndin
gce
nter
isin
pare
nthe
ses.
*si
gnif
ican
tat
10%
;**
sign
ific
ant
at5%
;**
*si
gnif
ican
tat
1%.
Soci
alne
twor
kde
nsity
isca
lcul
ated
byth
enu
mbe
rof
link
sdi
vide
dby
the
max
imum
num
ber
ofpo
ssib
leli
nks.
Bas
elin
eso
cial
netw
ork
data
coll
ecte
din
Nov
embe
r20
04.
Foll
ow-u
pda
taco
llec
ted
inJa
nuar
y20
06.
All
regr
essi
ons
use
fixe
d ef
fect
for
cre
dit o
ffic
ers.
Fam
ily:
Hav
e kn
own
this
per
son
sinc
e ei
ther
one
was
a c
hild
(gr
andp
aren
ts, p
aren
ts, s
ibli
ngs,
spo
uses
, chi
ldre
n, g
rand
chil
dren
, and
cou
sins
).
Kno
wle
dge
Tru
st
Tru
st in
dex
All
Kno
wle
dge
inde
x

Forced OutForced Out by Center or
Credit OfficerProbit Multinomial Logit
(1) (2)Dependent Variable: Forced Out
Treatment -0.089***(0.006)
Dependent Variable: Forced Out by Center MembersTreatment -0.521***
(0.032)
Dependent Variable: Forced Out by Credit Officer Treatment 0.621***
(0.060)
Observations 550 550R-squared 0.007 0.016
Appendix Table 1: Reasons for Dropout
Robust standard errors clustered by respondents in parentheses, * significant at 10%; ** significant at 5%; ***significant at 1%. Marginal coefficients reported for the probit specifications. The omitted variable for themultinomial-logit model in column (2) is voluntary dropout. "Forced out" and "Forced out by center members"include those clients who "voluntarily" dropped out because she was embarrassed for her bad performance.Dependent variable in column 1 is a categorical variable which equals to one if any respondent reported that theclient was forced out by center members or by credit officers, and zero otherwise. Dependent variable in column2 is a categorical variable which equals to one if any respondent reported that the client was forced out by centermembers, equals to two if anyone reported that the client was forced out by credit officer, and zero otherwise.
Sample Frame Restricted to clients who dropped out from the program within the three months prior to the follow-up survey.
Related Documents